BENCHMARKING FOR THE FUTURE by Robert Benjamin Ceyanes A Thesis submitted in Partial Fulfillment of the Requirements for the Degree Quantitative Educational Research and Assessment Major Subject: Mathematics West Texas A&M University Canyon, Tx May 2015

Welcome message from author
This document is posted to help you gain knowledge. Please leave a comment to let me know what you think about it! Share it to your friends and learn new things together.
Transcript

BENCHMARKING FOR THE FUTURE
by
Robert Benjamin Ceyanes
A Thesis submitted in Partial Fulfillment
of the Requirements for the Degree
Quantitative Educational Research and Assessment
Major Subject: Mathematics
West Texas A&M University
Canyon, Tx
May 2015

ii
Approved:
_________________________ _________________________
Thesis Committee Chairman Date
_________________________ _________________________
Thesis Committee Member Date
_________________________ _________________________
Department Head Date
_________________________ ________________________
Graduate School Dean Date

iii
ABSTRACT
This paper examines the benchmarking system currently in place for education in the
United States of America and attempts to correct the disconnect educators and
researchers feel toward the process. Studies and administrators claim that benchmarks
are necessary to identify students at risk. Studies also show that teachers disagree. This
study attempts to use statistical methods to allow educators to better utilize the
benchmark data. The research identifies several limitations to current benchmark
analyses and suggests recommendations to enhance them. The data indicates that a single
multiple choice test is not an accurate measure of student knowledge. More information
is needed to better predict student success on state mandated examinations.

iv
ACKNOWLEDGEMENTS
The author would like to thank Pam Lockwood, Kristina Gill, and Daniel Seth for their
contributions to this work. The author also expresses his unyielding love for his wife,
Elena Ceyanes, and two daughters, Sara Moore and Allison Ceyanes. Without their
support and encouragement this work would never have been completed.

v
TABLE OF CONTENTS
Chapter Page
I. INTRODUCTION……………………………………………………………. 1
II. REVIEW OF THE LITERATURE………….………………………………... 5
III. METHODOLOGY..…………………………………………………….……. 9
IV. SELECTION OF SUBJECTS……………….………………………………... 18
Applying Methods for Exam Selection……………………………. ……... 19
Resulting Population and Variables…….…………………………….......... 23
V. THE TRADITIONAL MODEL…….………………………………………… 26
VI. MODEL CONSTRUCTION………………………………………………….. 32
Conclusions ………………………………………………………………... 39
VII. TESTING THE STUDY MODEL WITH A SECOND COHORT….….......... 41
Conclusions………………………………………………………………… 48
VIII. THE FUTURE OF BENCHMARKS………………………………………… 50
Discussion………………………………………………………………….. 50
Challenges to the Methodology……………………………………………. 53
Limitations of the Study…………..……………………………………….. 54
Conclusions………………………………………………………………… 55

vi
LIST OF TABLES
Table Page
1. Evaluating Test Questions……………………………………………………… 21
2. Cutoff Scores…………………………………………………………………… 29
3. Original Model Question Analysis……………………………………………... 34
4. Reduced Model Question Analysis……………………………………………... 35
5. Coefficient Analysis……………………………………………………………..36
6. Model Comparison………………………………………………………………37
7. Model Comparison by Predictions………………………………………………39
8. Results…………………………………………………………………………... 43
9. Coefficient Analysis for Year 2 Best Fit Model………... ………………………44
10. Year 2 Best Fit Model Analysis ………………………………………………. 45
11. Cohort 2 Model Comparison….…………..…………………………………... 46
12. Cohort 2 Model Comparison by Predictions.….……………………………… 46
13. Question Comparison by Cohort……………………………..………………... 48

1
CHAPTER 1
INTRODUCTION
The “No Child Left Behind” Act became law in 2001. Since that time educators have
worked diligently to effectively assess ongoing strategies to best educate all students.
Considering the diverse levels of education that can be present in a classroom of students
these goals are a challenge to achieve. The mainstreaming of students with disabilities as
well as the introduction of state mandated assessments designed to close achievement
gaps have enhanced the challenges to raise as many students as possible to the test level.
Educators have worked hard to respond to the resulting pressure. The U.S. teacher often
experiences the strain of the urgency created by the public and subsequently politicians in
charge of educational policy (Strauss, 2014). Administrators and teachers bear the burden
of blame when a school system is deemed failing by the state. The typical state school
system feels pressure as the state mandated testing window approaches. Strauss (2014)
suggests that the “morale in the teaching profession is at a 20-year low.” The
consequences of the testing are such that all campus personnel become involved in
preparation for the state assessment to avoid the failing identification by the state. One of
the responsibilities assigned to the classroom teacher is to identify students who may
need additional assistance outside of the classroom to successfully pass the state

2
assessment. Fluctuating state curriculum guidelines for essential knowledge and skills
create a challenge in the development of “benchmark” examinations helpful in
identifying students in need of assistance to meet the required standards. In Texas, a link
to the “Subject Area Review” can be found at www. tea.texas.gov/curriculum/teks. State
committees continuously review and update these guidelines for different grade levels.
As a result, the author of this study, as an experienced teacher, has had to turn to the
internet to acquire benchmark examinations from school districts in other states, despite
slightly differing curriculum standards. The result can be ineffective or irrelevant
assessment questions on an administered benchmark examination impacting the
identification of challenged students. In other situations the administered benchmark
may be well developed and provide useful information but not be fully utilized by the
classroom teacher as a means of identifying deficient students (Bancroft, 2010). As the
intended identifier for students in need of remediation, a benchmark examination
provides segments of scores into which the instructor can categorize each student’s
performance. Inherent in this process is a struggle to select cutoff percentage scores that
will provide the administration with a suggested list of students needing intervention.
Corporations world-wide currently and successfully use statistical and data mining
strategies to predict customer buying habits using data obtained from surveys and logs of
internet usage. One article in The New York Times quotes a Target employee’s
“hypothetical example. A fictional Target shopper, named Jenny Ward, is 23, lives in
Atlanta and in March bought cocoa-butter lotion, a purse large enough to double as a
diaper bag, zinc and magnesium supplements and a bright blue rug. Based on the

3
company’s statistical analysis there is an 87% chance that she is pregnant and that her
delivery date is sometime in late August” (Duhigg, 2012, para. 49). The article recounts
how the Target marketing team knew before the girls’ father that she was pregnant.
If a business can use statistics to identify pregnant young women from a shopping list,
can educators use the same techniques to identify students who are in danger of failing
mandated state-wide examinations of required knowledge and skills? The research
presented here will develop a logistic regression model to identify students for
intervention purposes. Educational systems focus on currently developing more precise
examinations; however, a more effective strategy may be stronger analysis of the
currently used assessment tools. Targeting students for remediation utilizing a
percentage score on a single examination is unlikely to be an optimal strategy. This is
especially true given the impact of a limitless number of demographic and socio-
economic variables over an ever shifting foundation of knowledge.
In this research, cohort groups of students in mathematics are administered the same unit
and benchmark examinations throughout the academic year. Student responses to each
administered question are considered the predictive variables. The response variable is
whether or not a student passes the state examination on the first attempt. A predictive
logistic regression model is developed to identify which questions from the administered
examinations are relevant in a model to predict student success on a mandatory state
assessment examination. This model is then tested for its predictive ability on a second
year cohort of students. The developed model will be compared to the traditional
percentage score only model currently in use to assess the feasibility of this method. The

4
model will be deemed successful if it predicts student failure while identifying a set of
questions and concepts key to student success. The expected outcome of a successful
model is the reduction of class instructional time and the number of personnel dedicated
to identification and remediation of at risk students.

5
CHAPTER 2
REVIEW OF THE LITERATURE
Standardized testing has been a hot topic since the No Child Left Behind Act (NCLB) of
2001 (Public Law 107-110, 2002). This law compels state-mandated testing throughout
the country. Based on this testing, schools receive ratings and the associated negative
stigma attached to a below standard rating. In response to the pressure politicians have
placed on the school systems, educational administrations have implemented various
techniques to avoid a failing label. One of these techniques is to use multiple
benchmarks to gauge student progress and place students into interventions where
necessary.
Standardized testing and the benchmark testing engendered by them are no strangers to
criticism. The introduction of Common Core State Standards Initiative (CCSSI) in 2009
heightened the associated concerns. Of the forty-five states that originally participated in
CCSSI, at least 8 have filed for repeals or conducted votes on the matter (Parker, 2013).
A current look at the website corestandards.org officially indicates that Texas, Virginia,
Alaska, Nebraska, Minnesota, Indiana, Oklahoma, and South Carolina are
nonparticipants in CCSSI. Organizations such as fairtesting.org have started grass roots
initiatives to campaign against the use of standardized exams. In addition to the political

6
battles raging in town halls and state capitals across the nation, there is evidence that the
scope of the problem is not limited to the United States. One study examines comparable
issues between the United States and Namibia (Zeichner & Ndimande, 2008). Another
study investigates the effects of nationally-mandated educational standards to England
(Berliner, 2011).
Although few studies and scholarly publications have focused on the criticisms, there is
no shortage of strong opinions. Though politicians who fight against the CCSSI focus on
the constitutionality of the federal government dictating educational goals to states and
the lack of public input allowed into the standards, the teachers and parents focus on the
exams themselves. Valerie Strauss (2014) summarizes various issues in her article: “11
Problems Created by the Standardized Testing Obsession.” Leading her list of concerns
are instructional time lost, teaching to the test, test anxiety, narrowing the curriculum, and
the issues associated with multiple choice tests (Strauss, 2014). The opinions are so
strong that studies and surveys have been conducted on changing attitudes and the
intensity of those attitudes against the CCSSI (Johnson J. , 2013: Aydeniz & Southerland,
2012: Barksdale-Ladd & Thomas, 2000). Berliner (2011) focuses on the issue of the
narrowed curriculum. He laments that “most notable is the clear evidence that a great
deal of the curriculum deemed desirable for our schools by a broad spectrum of citizens
is instead curtailed in high stakes environments.” Further he argues that “the test
themselves are also not demanding of higher cognitive processes” (p. 299). With the
focus on high-stakes standardized testing the effectiveness of the school systems’

7
response through use of multiple benchmarks to identify interventions and direct
curriculum does not seem to be adequately addressed.
Several studies did investigate this issue somewhat from 2001 – 2007, although most of
the studies focused on fluency tests and reading (Good, Simmons, & Kame'enui, 2001:
Stage & Jacobsen, 2001: Silbertglitt & Hintze, 2007). One study focused on math
curriculum based measures (CBM) noted that “fewer studies have examined the relation
between statewide achievement tests and math, especially math concepts and
applications” (Keller-Margulis, Shapiro, & Hintze, 2008, p. 377). Keller-Margulis,
Shapiro and Hintze (2008) demonstrated a positive correlation between curriculum based
measures and student success on state-mandated assessments 1 and 2 years later.
However, the authors did not address the issue of identifying student success for the
current school year. One current study on the use of a math CBM to predict current year
success used a measure of computational ability instead of problem based or standard
based benchmarks (Shapiro, Keller, & Lutz, 2006).
In the face of this finding comes another study with opposite findings. Bancroft (2010)
uses interviews with teachers and administrators to evaluate the productiveness of using
benchmarks to improve scores on state assessments. This study concludes that “teachers
viewed the benchmark tests as an interruption to their classroom instruction and as an
inadequate means of measuring their students’ progress.” Further he argues that
“ultimately, even the administration found the tests an inadequate assessment for their
purposes” (Bancroft, 2010, p. 1). These views coincide with the observation that “an
assessment anchored by benchmarks, in either sense of the word, should not be expected

8
to yield a predictable curve of results … it is possible that very few products or
performances - or even none at all – will match the benchmark performance” (Wiggins &
McTighe, 2005, p. 338).
It is instructive to consider the disparity between conclusions of statistical studies and
observations of teachers and administrators. Statistical evaluations of benchmarks
produce a positive correlation to performances on future state-mandated tests while
experienced teachers, administrators, and instructional methods experts claim they do
not. An explanation may lie in the limitations found in the Keller-Margulis, Shapiro and
Hintze (2008) study, in which the authors acknowledge that “the use of ROC curves,
although offering a high degree of flexibility to the researcher also provide complete
control of the levels of diagnostic accuracy desired and introduces some level of
subjectivity into the selection of these cut scores” (p. 387). Indeed, both studies that
identified statistical correlations between benchmark scores and future state-mandated
assessment success adjusted the cut scores to determine the optimal statistical results.
The disconnect between statistical findings and implementation is implied by these ideas.
In particular, teachers are not afforded the opportunity to know in advance what these
optimal cut scores should be while researchers looking in hindsight may be able to
manipulate the situation to bolster their claims.

9
CHAPTER 3
METHODOLOGY
The study is comprised of four distinct segments. 1.) As seen in Table 1 (page 21) where
only a portion of the testing is observed, cohorts of students preparing for a state
mandated end of year examination will take numerous unit and benchmark tests
throughout the year in preparation. This research will identify a single examination that
provides the best list of questions to predict the student outcome on the high stakes state
examination. 2.) A logistic regression model will then be developed from a single
student cohort to predict the student outcome on the state examination with question data
provided from the selected test. 3.) The logistic regression model developed will then be
tested on data from a second cohort of students. The results of the Study Model are
compared to the traditional method of using percentile based scores from the test to
designate students for intervention. 4.) Conclusions will then be drawn from the
comparative results. Various strategies are employed for each segment of this study. An
overview of these methodologies is summarized in the remainder of this chapter.
School districts seek to identify students early in the academic year in need of additional
assistance in order to successfully complete a high stakes state examination. Identifying
a single examination that provides the greatest information on student outcomes would be

10
ideal, rather than attempting to combine information from numerous tests. However, the
test selected will need to provide the most complete information regarding a student’s
knowledge and likelihood to successfully pass a state examination. Several options are
available to investigate which examinations provide the best predictor questions. Two
competing options are 1.) a question by question investigation, utilizing a two-sample z
test for the difference between two proportions; and 2.) a question by question
examination of information gain provided by the question.
Generally preferred by statisticians, the two-sample z test determines if there exists for
each question a statistically significant difference in the proportion of successes and
failures. Proportions that are meaningful to compare in this setting are considering only
the students who answered the predictor examination question correctly, the proportion of
students who successfully passed the state examination versus the proportion who did not
pass. This two-sample z test compares the proportion of students where the question
accurately predicted a passing score on the state-wide examination versus the proportion
where the question missed indicates failures on the examination. The assumptions for the
two-sample z test are that data is from a random sample, is normally distributed, and the
observations are independent. Using a two-sample z test for the difference between two
proportions, with a pooled estimator for the proportion Pc, presumption of equal
variances, has the form
(1)
.

11
A z statistic of 1.65 or higher will correspond to a p-value of .05. This value has been the
hallmark value of significance for over 90 years since R. A. Fisher first employed the
method. Although, Valen Johnson from Texas A&M disputes this value in favor of a
stronger (lower) p-value in his recent paper “Revised Standards for Statistical Evidence”
(Johnson V. E., 2013). However, when multiple tests are run, a stronger p-value is
consistently recommended. The Bonferroni correction is widely used to adjust for
multiple tests. This method which simply divides the relative p-score by the number of
tests conducted was first advocated statistically by Olive Jean Dunn in 1961 (Dunn,
1961). Using a range of Z statistics helps to categorize the significance levels of
questions on multiple tests. Tests can then be evaluated by how many questions they
possess with z statistic of over 1.65 or any other determined score a researcher believes
will help distinguish one test from another.
Entropy is another method to consider for distinguishing tests with stronger predictor
questions. This procedure generally favored by computer scientists and data miners,
determines information gain from each of the considered predictor variables. First
introduced by Claude E. Shannon, the father of information theory, in a landmark paper
published in 1948 by The Bell System Technical Journal, entropy uses logarithms to rate
how much information is gained from the variable (Shannon, 1948). Shannon,
influenced by Alan Turing and George Boole, discovered while working in
communications, that Boolean logic, specifically a base 2 logarithm can be used to
separate a signal from the underlying noise. The mathematics behind the algorithm forms
the basis for information theory. How much of the information received is the actual

12
message and how much is noise can be applied to any information gained. If you have a
piece of information (a predictor variable), information entropy separates out how often
that information points to the outcome (the message) and separates out the false positives
(the noise). Shannon explains “The logarithmic measure is more convenient for various
reasons:
1. It is practically more useful. Parameters of engineering importance … tend to vary
linearly with the logarithm of the number of possibilities…
2. It is nearer to our intuitive feeling as to the proper measure…
3. It is mathematically more suitable. Many of the limiting operations are simple in
terms of the logarithm …” (Shannon, 1948, p. 379).
Another advantage to use of logarithms is the property that transforms complex
operations into addition and subtraction. Thus, each new piece of information (predictor
variable) adds information into the system. The first step is to find the entropy weight
when the predictor points true with
(2)
Next, find the entropy weight when the predictor points false
(3)
The results from equations (2) and (3) are used to provide a total weighted entropy,

13
(4)
3.
Next we find the possible information gain for the entire system from
(5)
.
The final step is to subtract the total weighted entropy, equation (4), from the total
information gained, equation (5) to find the information gained by the single question.
(Shannon, 1948, pp. 11-12)
The two-sample Z test and the information entropy method often, but not always, provide
the same results. This is an example of two distinct disciplines, statistics and computer
science, examining the same problem, yet formulating two completely different
approaches that largely determine at the same result. This is a nice example of the beauty
and elegance of mathematics. The information from both of these methods will assist
this study in determining which of the many cohort examinations are likely to provide
meaningful data, thus simulating an unbiased experiment. This methodology will drive
the selection of the examination which will be used to construct a predictive logistic
regression model.
Following determination of the examination that provides the best student information,
the work moves to the development of a predictive logistic regression model for the
examination results of a selected student cohort. The set of initial predictive variables for
this model are identified for the previously selected examination. The outcome variable

14
for the model will be the student result, pass or fail, on a state mandated high stakes
examination. The specific score a student earns on a state mandated test is irrelevant to
the scope of this research. The outcome variable takes on only one of two values – pass
or fail. Logistic models evaluate discrete binary outcomes from continuous or discrete
predictor variables. This characteristic is the primary reason this methodology was
selected.
The logistic regression model is based on the logit function and its inverse
(6)
.
The model presumes that the logit of the probability distribution function of a binary
outcome variable Y can be estimated by a linear function of its predictor variables:
(7)
,
where is the vector of predictor variables (Hosmer & Lemeshow,
2000).
The predictor variables are assumed to be independent in this model. The logistic model
development for this research was completed with the software platform R and its use of
the generalized linear model package under the binary family logit subcommand. This
program uses iterations of the log likelihood function to estimate the coefficients for the
linear function of the predictor variables based on values of the outcome and predictor
variables found in the data. The program outputs values of the coefficients, the standard

15
deviation of these coefficients, the z score and the p-value associated with significance of
the predictive variable.
Initially, a univariate logistic regression model for the outcome is completed for each
predictor variable. This helps to eliminate predictor variables with low association to the
outcome, as indicated with a high p-value or low level of statistical significance. A
logistic regression model is then developed with all the variables determined to have a
good association with the outcome variable from the univariate analysis. A three step
systematic elimination of predictor variables is then conducted to determine the set of
variables present in the final model. The procedure removes the variable with the largest
p-value, and model formed again with this variable eliminated. The residuals or errors
reported by the program and the coefficients on the remaining variables are then
examined. The residuals should follow a chi-squared probability function with one
degree of freedom for each variable removed from the model. The coefficients on the
remaining variables should not change by more than 25% from their values in the
previous model. If a deviation is observed from either of these stipulations, the
eliminated variable should be returned to the model. The procedure is repeated until the
remaining variables are significant to a p-value of less than 0.05 or one of the other
conditions is true. The predictive variables that remain after this process is complete and
the resulting model that is developed form the Study Model.
Once the logistic model to predict student performance on a high stakes state-wide
examination is developed, this Study Model will be used to predict student scores on the
state-wide examination for a 2nd cohort of students. The SAS System and its

16
Classification procedure will be utilized to calculate these predictions on student
performance (Hosmer & Lemeshow, 2000, p. 162). The SAS Classification procedure
runs a developed statistical model and compares the predicted outcome against the actual
results to determine if the model makes accurate predictions for the outcome variable
using all available cutoff scores. Various models can be compared with the SAS
Classification procedure to determine which model makes the most accurate predictions.
Additional methodology is also used to assess the fit of the developed logistic regression
models. The Akaike Information Criteria (AIC) value for comparing the models results is
an output of the R generalize linear regression package. This statistic developed by
Akaike and Sugiura was introduced for comparing linear regression models in 1978
(Sugiura, 1978) . The AIC statistic is a balance between improving goodness of fit and
including too many variables. The statistic rewards a model for fitting the data well, but
also penalizes it for including too many parameters. The lower the value of the AIC
statistic, the better the model conservatively fits the data. Another diagnostic for
comparing binary outcome models advocated by Spackman is the Receiver Operation
Characteristic (ROC) curve. The ROC curve visually displays the true positive rate of the
model, termed sensitivity, to the false positive rate of the model, 1 – specificity. Points
above the diagonal of the ROC plot indicate a good classification by the developed
model. Points below the diagonal indicate poor classifications by the model (Spackman,
1989). R squared statistics in general select the best fit model by examining the portion
of the variance in the outcome variable explained by the model; therefore the higher the
value, the better the model fits the data (Starnes, Yates, & Moore, 2012). Allison

17
recommends the use “all of these GOF tests” (Goodness of Fit) that can be applied using
his recommended algorithm provided in “Measures of Fit for Logistic Regression”
(Allison, 2014). Since there is a lack of consensus of agreement in the literature
regarding the best measures of Goodness of Fit, each of these methods will be applied
and examined for the developed logistic regression model.
Each question on the selected examination becomes a possible candidate to be a
predictive variable. The predictive variables are coded in the database with a 0 for an
incorrect response and a 1 for a correct response. The freeware software program R is
used to construct the logistic regression model. The R database recognizes the outcome
variable as a factor with only two possibilities. All other information needs to be deleted
leaving no identification marks. Students who miss either the predictive test or the state
assessment are left out of the study.

18
CHAPTER 4
SELECTION OF SUBJECTS
The original study population is a convenience sample of students at an independent
school district in the Texas Panhandle region. The available data to the researcher
includes both freshman and sophomore high school cohorts and 4th grade students at the
elementary level. The participating curriculum directors agreed to give the same
benchmark to those grade levels for two consecutive years. Under the belief that this
strategy will be successful for any age group whose cohorts operate within similar
environments, the three classes were subjected to the treatment with the hopes that at
least one environment will provide a suitable research setting and subsequent data for
analysis. This tactic proves to be invaluable as examined later in the chapter.
The four elementary schools in the study ISD are feeders to the Junior High school,
which is the sole feeder to the High school. Of the four elementary schools, three are
designated Title 1 by the federal government. A Title 1 school is a school who qualifies
to receive federal funds because they are deemed higher than average poverty by their
participation in the free and reduced lunch program. The High school also qualifies for
Title 1 designation by virtue of the Junior High status; although the school recently opted
out of this designation due to lack of free and reduced lunch participation. The Junior

19
High has a 58% free and reduced lunch rate for the student population. The district
demographics show a population of 55% White, 39% Hispanic, 4% Black, 1% American
Indian, and 0 % Asian (Greatschools.org).
Applying Methods for Exam Selection
Although this research utilizes a convenience sample, the model mitigates the lurking
variables by using successive cohort groups who are administered the same examinations
and are instructed in the same environment. The available data on the High school
population includes four examinations from Algebra I and five examinations from
Geometry administered at the study ISD. The elementary level population of fourth
graders has data available on five mathematics tests from fourth grade administered at the
ISD. All the tests are administered during the 2012-2013 and 2013-2014 school years.
The outcome variable of this study is the binary student outcome, success or failure, on
the State of Texas Assessments of Academic Readiness (STAAR) or the End of Course
(EOC) mathematics test for each student. The predictive variables are the questions on
the benchmark or unit examinations. The premise of this research is that the questions
administered on the benchmark or unit examinations can predict student outcome on the
STAAR or EOC. Should the hypothesis prove to be true, these examinations
administered earlier in the academic year will allow schools ample opportunity to select
students for intervention and intervene in a timely manner.
The data is originally recorded in an excel spreadsheet. The data is then used to evaluate
the question data provided by each examination in order to determine the optimal

20
examination instrument. The methodology for determining the optimal testing
instrument was previously discussed in Chapter 3. Initially a two sample proportion Z-
test is utilized to examine all questions on each testing instrument. For each examination
question, students who successfully answered the question and successfully passed the
state examination, comparing the proportion of these students who then are compared to
those that successfully answered the question but did not pass the state examination.
Therefore, the calculated Z-scores effectively rate each question for its ability to predict
whether a student passes the EOC administered in April 2013. Table 1 below displays
the outcomes of the two-sample z-score analysis. Included are, in the last three columns,
the number of questions on each exam with Z-scores above 1.65, 3.0, and 3.5,
respectively. Henceforth in this document, the fourth grade state mandated examination
will be referred to as the STAAR and the Geometry and Algebra I state mandated
examinations as the Geometry and Algebra EOCs. This terminology is consistent with
that used by the State of Texas educational system. Appendix 1 contains the data
spreadsheets for reference. Closer examination of the set of predictor test questions
versus the STAAR/EOC student outcome data indicate that the standard significance
level of 0.05 with an associated Z-score of 1.65 does not supply the predictive power
needed for the research goal. Ideally, each included math question should have some
significance in relation to whether a student passes the STAAR/EOC; however, the
research goal is to identify exam questions which indicate strongly which students will
pass the STAAR/EOC. A Z-score of over 3.5 provides a much better predictor variable.
Additional evidence for favoring a 3.5 Z-score comes from utilizing the Bonferroni

21
Table 1 : Evaluating Test Questions
Algebra I Pass, fail,
absent, total
% of
Students
Question
Incorrect
Number of
questions
% of
questions
Z score
above 1.65
% of
questions
Z score
above 3.0
% of
questions
Z score
above 3.5
Unit 1 test 121, 27
13, 148
18.2% 6 84.3%
(5/6)
16.6%
(1/6)
0%
(0/6)
Unit 3 test 113,24
12,137
17.5% 22 0%
(0/22)
0%
(0/7)
0%
(0/7)
Unit 4 test 38,14
7,152
26.9% 9 11.1%
(1/7)
0%
(0/7)
0%
(0/7)
Semester
test
124,22
12,146
15.1% 30 30%
(9/30)
3%
(1/30)
0%
(0/30)
Geometry
Pass, fail,
absent, total
% of
Students
Question
Incorrect
Number of
questions
% of
questions
Z score
above 1.65
% of
questions
Z score
above 3.0
% of
questions
Z score
above 3.5
Unit 1 test 153,16
36,169
9.5% 15 0%
(0/15)
0%
(0/15)
0%
(0/15)
Unit 2 test 142, 17
20,159
10.7% 30 70%
(21/30)
33%
(20/30)
17%
(5/30)
Unit 4 test 119,12
19,131
9.2% 16 50%
(8/16)
6%
(1/16)
6%
(1/16)
Unit 5 test 80,8 8,88
9.1% 12 58% (7/12)
25% (3/12)
17% (2/12)
Semester
test
164,22
23,186
11.8% 35 60%
(21/35)
17%
(6/35)
11%
(4/35)
4th Grade Pass, fail,
absent, total
% of
Students
Question
Incorrect
Number of
questions
% of
questions
Z score
above 1.65
% of
questions
Z score
above 3.0
% of
questions
Z score
above 3.5
Unit 1 test 177,79
19,256
30.9% 35 82.9%
(29/35)
62.9%
(22/35)
54.3%
(19/35)
2nd 6 wks
test
175, 84
19,259
32.4% 20 65%
(13/20)
45%
(9/20)
40%
(8/20)
Unit 6 test
89,48
11,137
35% 14 14.3%
(2/14)
0%
(0/14)
0%
(0/14)
Unit 7 test 89,49
9,138
35.5% 27 25.9%
(7/27)
3.7%
(1/27)
0%
(0/27)
Feb
Benchmark
174,85
5,259
32.8% 48 67%
(32/48)
33%
(16/48)
31.2%
(15/48)

22
correction. There are a total of 319 examination questions. The Bonferroni correction in
this case would justify a significance level of 0.05/319 = .000157.
The information gain found through Shannon’s entropy process is included in the full
examination question summary table found in Appendix 1. The study herein chooses to
use the two-sample z-statistic to categorize questions and rank the tests for two reasons.
The thesis audience (non-engineering and science experts) will more likely recognize the
z-statistic over the more technical information gain statistic. In addition, information
gain from entropy did not add any new information to the selection process. Indeed,
investigation of the entropy collaborates the results. A personal motivation for
incorporating the separate methods is to celebrate the beauty of two separate disciplines
that resolve the same problem with very similar results. Questions that have an
information gain lower than 0.01 are generally not significant at the 1.65 z-statistic level.
The questions containing an information gain between 0.01 and 0.026 typically have a z-
value between 1.65 and 3.0, while those questions with a higher than 0.033 information
gained correspond to questions with a z-value greater than 3.5. Although the scale slides
slightly with the number of questions in the corresponding tests, the rankings have few
exceptions. This is nothing short of remarkable.
The Table 1 summary statistics of examination data suggest the elimination of several
examinations from consideration while also indicating sources of bias in the study. All
four of the Algebra examinations appear dramatically subpar when compared to the
Geometry and 4th grade examinations, suggesting further investigation into the reasons
for the difference. The administration of the Algebra I examinations excluded a

23
subpopulation of the Algebra I cohort. The students deemed likely to fail the Algebra I
EOC, based on their academic performance the previous year, were enrolled in a
foundations class. These students were not administered the same examinations as the
remainder of the Algebra I cohort. This strategy led to a significant bias in the results. A
similar concern was identified in the Geometry student cohort. The examination results
omit a subpopulation of honors students who did not participate in the unit examinations.
The fourth grade examinations labeled Unit 6 Test and Unit 7 Test exhibited similar
patterns of lack of significance. Upon investigation it was found that two of the schools
in the lower income part of the district did not record their results for these exams.
Resulting Population and Variables
The preliminary analysis of the 4th grade data reveals three exams with significant
questions. The 4th grade and Geometry data reveal examinations with questions
providing quality information gain, giving us the ability to rule out that this modeling
approach will only work for a certain grade level or a particular school. High school and
Elementary can both benefit from the process. A preliminary conclusion that results from
the analysis in this study follows: in order for this methodology to provide accurate
predictions of student STAAR/EOC results based on benchmark or unit examinations, all
students must take the unit and benchmark examinations and have their results included
in the data.
In this research setting the study ISD committed to requiring all students enrolled in 4th
grade mathematics, Geometry, and Algebra I to complete the same unit and benchmark

24
examinations. However, as the study was conducted, subpopulation groups were exempt
from the examinations providing the data. The researcher has observed this practice as a
classroom teacher. The administration then unknowing uses incomplete results to form
judgments regarding which students need remediation, based on what seems to be solid
rational. Higher level students obviously will not need the interventions and the low level
students obviously will. However, removal of the top and bottom deciles the population
studied removes crucial data from the model. The model is now unable to identify the
critical questions that the top decile of student understands that the lower does not. In
summary, the research to this point seems to indicate that questions can be used as
predictors for STAAR/EOC success in different age groups in different settings.
However meaningful predictions require the condition that no sub-groups in the cohort
are exempt from providing data to the study.
Further investigation based on the two-sample Z-score analysis of all examinations reveal
the only tests administered to the full grade level cohort are: the Geometry semester test,
Fourth Grade Unit One test, Fourth Grade 2nd Six Weeks test, and the Fourth Grade
February benchmark. However, legislative changes during the conduct of this research
further limited the diversity of the study population. The Texas Legislature decided to
eliminate the EOC test in Geometry as a requirement for high school graduation in 2013.
The third phase of this study will be to test of the developed logistic regression model on
a second cohort of students. Students taking the EOC in Geometry the following year
would know it was no longer a requirement for graduation, leading to an uncontrollable
confounding variable. In addition, communication with the elementary math

25
coordinators at the study ISD indicated the second six weeks test would not be
administered to fourth graders in the second year cohort. The Fourth Grade Unit One
examination, mislabeled by the testing coordinator, was actually a fall benchmark given
the week before Thanksgiving. This examination was administered on both years, at the
same point in the semester. All of the questions on the examination except questions #4
and #20 were the same with no changes. The Fourth Grade Fall Benchmark examination
included 34 questions and was indicated by the two-sample z-score and information gain
strategies as the highest ranked examination administered to the initial study cohorts.
With many of the possible external variables held constant by the educational
environment, this examination is an optimal choice for the study.

26
CHAPTER 5
THE TRADITIONAL MODEL
Traditional models for identifying students at risk of not successfully completing state
mandated standardized examinations rely upon school districts administering benchmark
examinations throughout the academic year. The goal of benchmark examinations is to
identify at risk students by setting a cutoff examination score. All students scoring at or
below the cutoff benchmark score are classified as at risk for failing the statewide
examination. This method of identifying at risk students has limitations. How do school
districts determine the cutoff score on the benchmark? The problem goes beyond the
state of Texas as other states such as Florida and North Carolina are adopting new
programs to use instead of Benchmark examinations (Parker, 2013). Recently, many of
the states who have adopted the Common Core standards are choosing against the use of
the benchmarks provided, as these states face the first round of Common Core testing
scheduled for the 2014-2015 school year (Parker, 2013). A percentage score of 70 is
typically used as a cutoff score on benchmark and standardized exams. The Texas
Education Agency (TEA) determines passing level on the statewide assessment based on
a scaled student score. The State of Texas does not publish the method used to determine
these scaled scores. In the past, when new state standards and assessments are
implemented, the passing scores are gradually increased over a few years. With the

27
current edition of standardized testing (grade-level STAAR and EOC), the passing
scores were to go through three phases starting in consecutive years. There has been
much political strife as parents and school districts question the rigor and validity of the
state assessments being implemented. In the 2014-2015 school year, this resulted in the
TEA continuing to use the phase one standards for a fourth consecutive year. In addition,
each grade level STAAR or EOC is evaluated at a different level. For example, Phase
one for Algebra I is equivalent to approximately 37 percent or 20 out of 54 questions
correct necessary to pass. Meanwhile in fourth grade, the standard stands at
approximately 60 percent, or 29 out of 48 questions correct required to earn a passing
score. Justification provided by the TEA states that, “the final recommended standards
are the values that resulted from meetings with hundreds of Texas educators … During
the process of making these recommendations, Texas educators considered empirical data
related to STAAR and other tests, as well as the goal of preparing students for success
beyond high school” (Texas Education Agency, 2013).
This lack of consistency and seeming randomness of scaled scores creates a dilemma for
many teachers. As they choose benchmark cutoff scores, they must factor in which
students they perceive, based on their own assessment, need interventions, while
excluding those that they perceive do not. This decided modification is the only option
other than the 70% standard that this experienced teacher was able to see.
Table 2 below shows results from the research setting ISD using the traditional
benchmark testing method with a set percent score as the cutoff. All teachers are
expected to identify struggling students with the preferred 70% cutoff score, but no

28
stringent across the board system was implemented. Since a standardized score and/or
method was not used, there is likely a variance between each teacher’s preferred cutoff
score or use of a cutoff score at all. This fact illustrates a complication to the evaluation
of the benchmark process. Ethics prevents requiring the teachers to not perform any
interventions for the study cohorts. These interventions continue throughout the process
of this research and undoubtedly present a lurking variable that cannot ethically be
eliminated by this study. By comparing models under the same conditions with different
cohorts we mitigate this conflict, but do not completely eliminate it.
Sub-tables in Table 2 were constructed with specified cut-scores to evaluate the
traditional model under various cut-score conditions. Simple predict and table commands
in the R program calculates the results displayed in the table. The highlighted numbers on
the chart are the number of failures correctly identified and the total number of students
needed to be assigned to remediation based on this process. In order to identify 75 out of
the 79 failing students, a cutoff score of 70% would need to be utilized, assigning 173 out
of the 256 students (67.6%) to remediation. The cut-score of 65 improves the number of
affected students at a cost of correctly identifying only 66 out of 79 failures (83.5%)
while assigning to remediation 120 of the 256 students (46.9%). As the cut-score drops
to 60, 55, and 50, the number of students assigned to remediation enters acceptable
levels, but at a cost of only correctly identifying 76.0%, 65.8%, and 43.0%, of students at
risk of not successfully completing state-wide examinations, respectively. An additional
limitation and challenge of the traditional method of identifying at risk students is the
cost of remediation to the school district. A usual rate for tutoring is $30 an hour which

29
Table 2 : Cutoff Scores
EOC result Failed
Benchmark at 50%
Passed
Benchmark at 50%
Total EOC Results
Failed 34 45 79
Passed 11 166 177
Total
Intervention?
45
Yes
211
No
256
EOC result Failed
Benchmark at 55%
Passed
Benchmark at 55%
Total EOC Results
Failed 52 27 79
Passed 25 152 177
Total
Intervention?
77
Yes
179
No
256
EOC result Failed
Benchmark at 60%
Passed
Benchmark at 60%
Total EOC Results
Failed 60 19 79
Passed 43 134 177
Total
Intervention?
103
Yes
153
No
256
EOC result Failed
Benchmark at 65%
Passed
Benchmark at 65%
Total EOC Results
Failed 66 13 79
Passed 54 123 177
Total
Intervention?
120
Yes
136
No
256
EOC result Failed
Benchmark at 70%
Passed
Benchmark at 70%
Total EOC Results
Failed 75 4 79
Passed 98 79 177
Total
Intervention?
173
Yes
83
No
256
may be a concern for school districts in less fortunate populations. Limited school
funding and the unknown factor of how many students will require remediation make it
difficult for school districts to allocate resources. A school district would need to

30
determine, prior to the academic year, the number of students the budget can afford to
serve as well as allocate an individual instructor either during normal hours or after
school. The impact is a limit on the number of students recommended to remediation.
There are philosophies concerning which students are recommended to remediation and
which students are not. A “bubble kid” philosophy states that the limited available
resources should be allocated to students that have the best chance to pass the exam. A
new cut-score is selected to identify those students that fall into the “bubble kids” group.
The students who score below the upper “passing” score, but above the lower “bubble”
score should have a better chance to pass the exam than those below the “bubble score”.
The formerly mentioned bias created by the ISD instructors selecting individual cut-off
scores for remediation identification or hand selecting students can be exasperated by the
“bubble kid” theology. For example, consider a hypothetical case where a uniform
system was in place with the above data. Of the 173 students that did not earn a percent
score of 70 on the benchmark, 77 learners who scored lower than a 55 will not be
classified as “bubble kids” and will be left off the intervention rosters. The final number
for intervention becomes a manageable 96 spread among the 4 elementary schools.
Another philosophy is one where the school district remediates until the resources are
expended. The district looks at the resources it possesses, and provides assistance to as
many students as it has resources working from the bottom up. Once the resources are
exhausted, the remaining students are left out of the intervention process. By using the
traditional cut-score model, a school district limits itself to two unattractive choices. If a

31
school system only has resources to service 40% of the students in special interventions,
the choice in this set of data is to set a cut score of 60 and miss 24.1% (19 out of 79) of
the failures, or to use a bubble group scheme where two cutoff scores are employed. One
cutoff score decides who needs intervention, and one decides who is beyond help and not
worth expending resources. The “bubble” group scenario most likely utilized by the
study ISD shows that 23 of the 96 students with the interventions failed anyway, and 25
of the 77 students denied interventions passed regardless of the omission. This type of
inconsistency fuels the motivation for this study. This research seeks to develop a model
that will accurately identify students in need of remediation so that institutional resources
are not expended on those who do not need the remediation.

32
CHAPTER 6
MODEL CONSTRUCTION
Logistic regression will be used in this chapter to develop a statistical model that predicts
a student successfully passing the STAAR Examination in 4th grade mathematics. The
outcome variable of this model is whether or not a student in the course passes the
STAAR. This is a binary random variable, a value of 0 indicating a student did not pass
and a value of 1 indicating a student passing the STAAR. Logistic regression is the
appropriate model for a binary outcome variable.
The predictor variables for this model are questions from the Unit 1 benchmark
examination identified in Chapter 4 as the optimal examination after applying data
mining techniques to all administered examinations. Each will be binary in nature coded
as 0 if a student incorrectly answered the question and 1 if the student answered the
question correctly. The goal of this research is to find the model that correctly predicts
failures on the STAAR examination while limiting the number of incorrectly predicted
student failures. As expressed in Chapter 4, the Fourth Grade Unit 1 Benchmark test
provides the study with the best predictive questions. Weaknesses of the traditional
model for identifying students at risk for failing a state-mandated test were indicated in
Chapter 5 with the example analysis results from this model displayed in Table 2. A

33
new model is sought using statistical tools that will more accurately predict student
failure.
Chapter 4 discussed the challenges to the new study methodology. One such challenge
was changes made to the administered examinations from one year to the next based on
curriculum changes or determination by classroom teachers that a question was not
effective. Questions 4 and 20 are removed from the list of available predictors provided
by the Unit 1 Benchmark examination because these two questions were changed from
Year 1 to Year 2. Ambiguity in the questions informed the decision by the classroom
instructors to alter these questions. A model for the first year could still be crafted, but it
will be invalidated for the Year 2 cohort group if these two questions are included. For
the questions remaining on the Unit 1 Benchmark, consistent from Year 1 to Year 2 a
univariate test is performed.
The univariate analysis of each predictor question indicates the questions’ relationship to
the outcome variable of the study. The results of this univariate analysis for all predictive
questions considered are shown in Appendix 3. Question 15 and question 12 are the
first prediction questions to be removed from consideration based on the univariate
analysis results. Most of the questions exhibit a p-value below 0.000001, a few scored
between 0.01 and 0.20, and questions 15 and 12 are the exceptions with p-values of 0.848
and 0.309 respectively. Table 3 below represents the output from the summary procedure
in the R programming language after running a generalized linear model (glm) with the
logistics model selection using the remaining questions on the 2013 cohort group.

34
The model development then continues through a step wise procedure removing the
predictor question with the highest p-score (lowest correlation) and rerunning the general
Table 3 : Original Model Question Analysis
Coefficients: Question
Estimate Standard error
Z value P-value
Intercept -6.19517 1.50810 -4.108 .0000399
Question 1 0.33691 0.51553 0.654 0.51553
Question 2 1.36876 0.45553 3.005 0.00266 Question 3 -0.66586 0.46787 -1.423 0.15469
Question 5 0.77830 0.45978 1.693 0.09050
Question 6 0.53330 0.51288 1.040 0.29842
Question 7 0.81595 0.43164 1.890 0.05871 Question 8 0.41816 0.45407 0.921 0.35710
Question 9 -0.44505 0.46578 -0.955 0.33933
Question 10 0.53407 0.52842 1.011 0.31216 Question 11 0.39487 0.72159 0.547 0.58423
Question 13 0.73939 0.41725 1.772 0.07638
Question 14 0.53074 0.43271 1.227 0.21999
Question 16 -0.26947 0.70497 -0.382 0.70228 Question 17 0.99605 0413306. 2.411 0.01589
Question 18 0.92953 0.63650 1.460 0.14419
Question 19 -0.16957 0.50644 -0.335 0.73775 Question 21 0.49989 0.67029 0.746 0.45580
Question 22 0.83416 0.92232 0.904 0.36577
Question 23 -0.01251 0.497300 -0.025 0..97993 Question 24 0.41606 0.53550 0.777 0.43719
Question 25 0.65679 0.44154 1.488 0.13688
Question 26 0.32520 0.52733 0.617 0.53744
Question 27 -0.62367 0.43928 -1.420 0.15568 Question 28 0.61859 0.45549 1.358 0.17444
Question 29 0.31114 0.44030 0.707 0.47978
Question 30 -0.36460 0.42700 -0.854 0.39318 Question 31 1.46355 0.49931 2.931 0.00338
Question 32 0.27667 0.50917 0.543 0.58686
Question 33 -0.37208 0.42063 -0.885 0.37638 Question 34 -0.16839 0.44725 -0.377 0.70654
Null deviance Df Residual
deviance
Df AIC
316.40 255 183.74 225 245.74
* Chi squared p-value for 183.27 with 224 degrees of freedom is .02035031

35
linear model and the corresponding summary procedure. The reduced model is then
checked for significance by subtracting the new residual deviance from the residual
deviance of the previous model and running a new chi-squared test with degree of
freedom equal to one. If the corresponding p-value is greater than .20, indicating the
reduced model did not eliminate any valuable information, the procedure continues. The
model coefficients are next considered against the Full Model to ensure that the predictor
coefficients do not change by more than around twenty five percent. The process is
repeated moving on to consideration of the predictive question with the next highest p-
score. Following questions are removed in order until the process reaches one of three
concluding states. The process terminates when the remaining questions exhibiting a p-
value of less than 0.05. Other states of termination are when the chi-square test of fit or
coefficient change conditions are violated. The order of question removal is as follows:
23, 19, 34, 16, 11, 32, 29, 9, 1, 24, 26, 21, 33, 22, 30, 8, 10, 3, 6, 27, 25, 18, 7, and 5.
Table 4 : Study Model Question Analysis
Coefficients:
Question
Estimate Standard
Error
Z-score P-value
Intercept -3.8871 0.6898 -5.635 1.75 e-08
Question 2 1.3557 0.3768 3.598 0.000321
Question 13 0.8240 0.3692 2.232 0.025609 Question 14 0.6677 0.3769 1.771 0.076522
Question 17 0.9116 0.3703 2.462 0.013819
Question 28 0.7095 0.3927 1.807 0.070817 Question 31 1.2740 0.3975 3.205 0.001349
Question 5 0.6804 0.4048 1.681 0.092755
Question 7 0.6733 0.3869 1.749 0.080308 Question 18 0.8673 0.5429 1.598 0.110132
Null deviance Df Residual
deviance
Df AIC
316.40 255 198.98 246 218.98
* Chi squared p-value for 198.98 with 246 degrees of freedom is .01248981

36
Questions 2, 13, 14, 17, 28, 31, 5, 7 and 18 remain as predictive variables to produce the
results displayed in Table 4. Obvious from the p-values displayed in Table 4, the
predictive variable selection method did not conclude with all the p-values under the
target 0.05. The procedure finished with the violation of the coefficient change
condition. Table 5 illustrates a violation of a 30.38% change in predictive variable 14 at
the removal of question 18. The marked change over 25% causes the process to end..
Table 5 : Coefficient analysis
Question
Original Study Model Study Model
without
question18 (% difference)
Study Model
without
questions 18
& 7 (% difference)
Reduced
Model (% difference)
2 1.3688 1.3557 (0.96%)
1.3506 (1.33%)
1.2703 (7.20%)
1.4022 (2.44%)
13 0.7394 0.8240 (11.44)
0.8735 (18.14%)
0.8631 (16.73%)
0.9731 (31.6%)
14 0.5307 0.6677 (25.8%)
0.6919 (30.38%)
0.8703 (64.00%)
0.8914 (67.97%)
17 0.9961 0.9116 (8.48%)
0.9397 (5.66%)
0.8846 (11.19%)
0.9222 (7.42%)
28 0.6186 0.7095 (14.69%)
0.7241 (17.05%)
0.9054 (46.36%)
1.0045 (62.38%)
31 1.4636 1.2740 (11.59%)
1.2713 (13.14%)
1.2940 (11.59%)
1.2779 (12.68%)
5 0.7783 0.6804 (12.58%)
0.7358 (5.46%)
0.7680 (1.32%)
7 0.8160 0.6766 (17.08%)
0.6917 (15.23%)
18
0.9295 0.8673 (6.69%)
Throughout the process the coefficients and Akaike Information Criteria (AIC) scores
monitored lead to the following observations. The removal of questions 29 and 10 cause
questions 9 and 3 respectively to break the 25% change in coefficient barrier, but only

37
just before the latter questions are removed due to high p-values. The removal of
questions 26 and 6 cause the coefficient of question 14 to slide slightly over 25% (25.8%
and 26.65% respectively). In both instances, when the removal of the next question with
the highest p-value occurs, the violating coefficients return to levels below 25%.
Question 6 is returned to the Study Model for reconsideration due to its interaction with
the coefficient on question 14.
Table 6 displays some of the descriptive statistics for measuring the fit of logistic models
and compares them for six competing models. The Score Only Model corresponds to
using the total score received on the benchmark as the predictive variable with no
question predictive variables. The Study Model column displays statistics for the model
Table 6 : Model Comparison
Score
Only Model
Study
Model
without
question
18
Study
Model
Study
Model
with
25
Study
Model
with 6
All
Residual (DF)
205.41 (227)
201.58 (247)
198.98 (246)
197.43 (245)
197.74 (245)
183.74 (225)
Chi-square
test of fit
.1069
.2131
.2655
.7605
P value 0.1549 0.0156 0.0125 .0114 .01312 0.0215
R2
values***
.5705 .5260 .6223 .5980 .4768 .1598
AIC 263.41 219.58 218.98 219.43 219.74 247.27
ROC .8418 .8806 .8815 .8863 .8839 .8992 * R2 scores are the average of the Osius, McCullagh, IM, and RSS tests reported by SAS in
Appendix 3.

38
with predictor questions 2, 13, 14, 17, 28, 31, 5, 7, and 18. The All column uses all the
questions except for 4, 20, 15, and 12. The output procedures in R and SAS can be found
in Appendix 3.
The model p-value and AIC model scores illustrate that the Study Model is the best
model available. The AIC compares two different models, the lowest value being the
better model of those under consideration. But it does not identify the quality of the
models. They might in fact both be bad models. The fact that the Study Model also has a
strong p-value score validates the model. Table 7 displays that the Study Model
correctly predicts the highest number of students in comparison to the remaining models
under consideration. The predictive ability of these models displayed in Table 7 results
from classification tables generated from the SAS logistic program. The classification
tables follow the advice of Homer and Lemeshow that although logistic theory dictates
that a zero outcome should follow a model’s result of less than .51, using different cutoff
points has certain advantages (Hosmer & Lemeshow, 2000). By optimizing the cutoff
point to provide the model a balance of sensitivity and specificity, the results created
containing a higher percentage of positive predictions to false positive errors - a result
beneficial to the task of intervention identification. These tables are found at the end of
Appendix 3. The chart reports the correct model cutoff percentage for three hypothetical
levels of determination. An administrator wishing to correctly identify either 75%, 80%,
or 85% of the failures on the statewide assessment using the Study Model will need to
use a cutoff percentage for the model at 0.67, 0.76, or 0.82 respectively. The resulting
identification of 60, 65, and 70 students meets or surpasses the goals of 60, 64, and 68

39
students of the 79 total failures. The specificity of the procedure is measured by the
number of students pulled for intervention with the lower number the most desirable.
The Study Model example provided pulls the 60, 65, and 70 failures at the cost of pulling
a total of 95, 114, and 134 students respectively. In the second subsection of the table,
the administrator planning for a set number of
Table 7 : Model Comparison by Predictions
Predictions*
Score
Only
Model
Study
Model
without
question
18
Study
Model
Study
Model
with
question
25
All
Study
Model
with
question
6
Pred 85%:68
(Cutoff %)
68/137
(.78)
69/134
(.84)
70/134
(.82)
68/130
(.83)
68/159
(.86)
68/127
(.80)
Pred 80%:64
(Cutoff %)
66/120
(.73)
65/118
(.78)
65/114
(.76)
64/108
(.74)
64/126
(.82)
64/106
(.74)
Pred 75%:60
(Cutoff %)
60/103
(.67)
60/96
(.68)
60/95
(.67)
60/93
(.67)
60/107
(.75)
61/97
(.67)
Student tot**
Pred 55%:141
(Cutoff %)
68/137
(.78)
69/134
(.84)
70/134
(.85)
68/131
(.84)
68/139
(.86)
70/141
(.86)
Pred 50%
:128
(Cutoff %)
66/120
(.73)
67/125
(.83)
68/124
(.83)
66/121
(.82)
64/126
(.82)
68/127
(.80)
Pred 45%
:116
(Cutoff %)
60/103
(.67)
63/113
(.77)
65/114
(.76)
66/112
(.78)
61/114
(.77)
66/116
(.77)
* The Predictions tables determine the results of the model given you want to be sure to get a
certain number of failures – 85% of the 79 failures is 68 the least number to identify in that row
**The Student tot tables determine the results of the model given you only have resources to pull a
certain number of the total students – 55% of the 255 is 141, the most number to pull for
intervention in that row
interventions is taken into consideration. From this viewpoint, a total amount of
interventions drive the cutoff percentages. The administrator with the resources to help
the three hypothetical values of 45%, 50%, or 55% of the students in the cohort should

40
use the model percentage values of 0.76, 0.83, and 0.85 respectively if the Study Model is
employed. The goals along with the number of successful predictions are also reported.
Conclusions
The results listed in Table 6 and 7 suggest the selection of the model that includes
questions 2, 13, 14, 17, 28, 31, 5, 7, and 18. This study will refer to this model as the
“Study Model” henceforth. Although adding questions 25 or 6 does reduce the change in
the question 14 coefficient, they fail the Chi squared test of fit test along with sporting a
lower R square value and a larger AIC value. Table 7 confirms the decision to leave
these two questions out of the model as they successfully predict less students for
interventions (the intended goal). Taking question 18 out of the Study Model not only
violates the change in coefficient condition, but the statistics show its inferiority in each
of the test of fit categories.
The Study Model on paper greatly improves on the Score Only Model. The residual
squared errors drop 6.43 while actually increasing the degrees of freedom by 19. The
Study Model outperforms the Score Only Model in every measure, including (the most
important) prediction measure. Correctly predicting 0 – 2 more failures while pulling 3 –
8 less students gives the study model an advantage over the Score Only Model. The
Score Only Model is an improvement over the traditional model, previously discussed, in
that the traditional model uses cut scores determined without statistics while the Score
Only Model uses the total score of the previous year to make future predictions. With the
Study Model out predicting the Score Only Model on Cohort 1, the study continues with
the hope of improving the prediction power for a second cohort of students.

41
CHAPTER 7
TESTING THE STUDY MODEL WITH A SECOND COHORT
The primary goal of this research is to implement the developed Study Model to predict
future student failure of the STAAR examination. Whether the statistical patterns
identified in the Study Model from a single year of data hold for the following year is
important. It is valuable to make accurate predictions from the patterns. The crucial
question is if the model effectively predicts student outcomes before they have completed
the state-wide assessment so that any necessary interventions may be prescribed in
advance?
Businesses that use statistics to predict behavior rarely use one simple data collection to
make their forecast. They often use demographics, past histories, and any information
that can be correlated to their outcome. In this chapter evidence is provided to determine
if a single test, without all the other information, may be used to make accurate
predictions?
The four elementary schools used to devise the Study Model administered the same
Benchmark test the next year. Questions 4 and 20 were removed from both the Study
Model and the Year 2 Best Fit Model due to inconsistencies in utilization between the
two years. Appropriate reporting of the Benchmark scores were also found to be

42
inconsistent across the faculty. Unfortunately, difficulties arose in reporting scores of
five teachers in two different schools. This resulted in the loss of around 90 student
scores. However, the students were randomly assigned to teachers and therefore no
detectable skewing of the data presents itself. Students absent on the day of the STAAR
examination further contribute to a loss of data, as do students absent from the
benchmark. Ultimately 143 subjects had complete data in the second year compared to
256 in the first year. Thirty nine of these subjects failed the STAAR examination.
The results from the benchmark were entered into the Score Only Model and the Study
Model to determine which of the models lead to a more precise forecast. The role of a
school administrator leads to consideration of two comparative viewpoints. Viewpoint
“A” uses the idea that administrators want to assist 85% of the students at risk of failing.
Table 7 found in Chapter 5 provides the researcher with the appropriate values to use to
make predictions. When creating our model with the first cohort, the logistic procedure
in SAS determines the classification table located in Appendix 3. As reported in Table 7,
the probability value on this table that accurately predicts 85% of the failures is 0.78 for
the Score Only Model and 0.82 for the Study Model. These values are used to make
predictions for the second cohort since at these values that the models reach the 85%
threshold. Viewpoint “B” uses the idea that the school can only provide assistance to
45% of the students and want to select the model that will assist as many students as
possible under this restriction. Under this viewpoint consulting Table 7 to identify where
the probability found in the classification table for the two models reaches the appropriate
threshold is unnecessary. Unlike viewpoint A where the number of future failures is

43
unknown, forty five percent of the total students is computable. The second cohort has
143 students, so in viewpoint B the school will intervene with no more than 64 students.
Seen from the classification table SAS generates in Appendix 4 the threshold will be met
at probability level of .82 for both models.
Table 8 below compares the results for viewpoints A and B. For viewpoint A the Score
Only Model correctly identifies 34 out of the 39 failures while the Study Model only
identifies 30 of them. Although the probability level changes slightly for the Score Only
Model, there is no difference in the result for viewpoint B.
Table 8 : Results
Score Only Model
(Correct/pulled) % correctly identified
Study Model
(Correct/pulled) % correctly identified
Difference
Viewpoint
A
.78 (34/61) 87.2%
.82 (30/63) 76.9%
-4
Viewpoint
B
.82 (34/61) 87.2%
.82 (30/63) 76.9%
-4
The Score Only Model outperforms the Study Model in the second cohort group. To
determine whether the Score Only Model outperforms the Study Model created by the
cohort 1 data, or if it betters all possible models in this second year, the cohort 2 data is
analyzed to create new models. The Year 2 Best Fit Model is constructed in a manner
similar to the development of the Study Model devised for Year 1. When the univariate
tests are run on cohort 2, questions 4,5,10,12,15,16,20,21,23,32 fail at the .20 level. This
model then deletes questions with the highest p-value one by one, while continuing the
same residual, p-value, and coefficient checks as administered when creating the Study

44
Model in Chapter 6. The order of question deletion through this process is 6, 25, 31, 30,
19, 7, 28, 14, 29, and 8. When question 29 is removed, the coefficient for question 8 falls
outside parameters, but the AIC continues to fall from 105.0 to 104.77 and the residuals
hold well with a G-score of .1831 (1.772 with df=1). As documented in Table 9, when
Table 9 : Coefficient Analysis for Year 2 Best Fit Model
Question
Full
Model
Year 2 Best
Fit Model (% change)
Without
#8 (% change)
Without
#27 (% change)
Without
#8, & #27 (% change)
1 5.83567 4.8053 (17.66%)
4.2509 (27.16%)
4.7454 (18.68%)
4.2292 (27.53%)
2 1.47224 1.2384 (15.88%)
1.3024 (11.54%)
1.1191 (23.99%)
1.2256 (16.75%)
3 1.89754 1.6097 (15.17%)
1.4108 (25.65%)
1.5643 (17.56%)
1.3712 (27.74%)
9
1.76690 1.3881 (21.44%)
1.3851 (21.61%)
1.4274 (19.21%)
1.4130 (20.03%)
11 3.70767 3.1648 (14.64%)
2.9389 (20.73%)
3.6557 (1.40%)
3.5206 (5.05%)
13 2.41663 2.3259 (3.75%)
2.2806 (5.63%)
2.1588 (10.67%)
2.1230 (12.15%)
17 2.25126 2.1474 (4.61%)
2.4754 (9.96%)
1.6321 (27.50%)
1.9751 (12.27%)
18 2.23382 2.3160 (3.68%)
2.1832 (2.26%)
2.4280 (8.69%)
2.3660 (5.92%)
22
-7.01003 -6.3374 (9.60%)
-6.3806 (8.98%)
-5.9356 (15.36%)
-6.0846 (13.20%)
24
2.54192 2.0372 (19.86%)
1.6241 (36.11%)
1.9877 (21.74%)
1.5541 (38.86%)
26
2.30948 2.0064 (13.12%)
1.7559 (23.97%)
2.3380 (1.23%)
2.0816 (9.87%)
33
-3.09795 -2.7823 (10.19%)
-2.6622 (14.07%)
-2.5085 (19.03%)
-2.4382 (21.30%)
34
2.35655 2.0894 (11.34%)
2.1864 (7.22%)
2.0604 (12.57%)
2.1866 (7.21%)
27
1.23633 1.0360 (16.20%)
1.0991 (11.10%)
8
1.68614 1.0483 (37.83%)
1.1186 (33.66%)

45
question 8 is deleted from the model, 3 coefficients have a percent change that exceeds
the 25% barrier. If question 8 is retained and question 27 removed, the coefficient for
question 8 closes on the original value, but it does not remedy the situation. With a
slightly better AIC and p-value, the decision is made to keep both 8 and 27 in the new
model. Table 9 shows the relevant coefficient changes. The new model (Year 2 Best Fit
Model) utilizes questions 1, 2, 3, 8, 9, 11, 13, 17, 18, 22, 24, 26, 27, 33, and 34. Recall
the Study Model developed in Chapter 6 and tested here was based on questions 2, 13,
14, 17, 28, 31, 5, 7, and 18.
Table 10 : Year 2 Best Fit Model
Coefficients:
Question
Estimate Standard
Error
Z-score P-value
Intercept -9.9052 2.8226 -3.509 4.49 e-4
Question 1 4.8053 1.4103 3.407 6.56 e-4 Question 2 1.2384 0.6828 1.814 0.0697
Question 3 1.6097 0.7264 2.216 0.0267
Question 8 1.0483 0.7841 1.337 0.1812 Question 9 1.3881 0.6705 2.070 0.0384
Question 11 3.1648 1.5601 2.029 0.0425
Question 13 2.3259 0.8914 2.609 0.0091 Question 17 2.1474 0.9042 2.375 0.0176
Question 18 -2.3160 0.9358 2.475 0.0133
Question 22 -6.3374 2.4027 -2.638 0.0085
Question 24 2.0372 1.0396 1.960 0.0501 Question 26 2.0064 0.8927 2.247 0.0246
Question 27 1.0360 0.7471 1.387 0.1655
Question 33 -2.7823 1.0388 -2.731 0.0063 Question 34 2.0894 0.7598 2.750 0.0060
Null deviance Df Residual
deviance
Df AIC
167.582 142 72.771 127 104.77
The Year 2 Best Fit Model not surprisingly outperforms the Score Only Model for Year 2
as seen in Table 11. The residuals are lower, driving the lower p-value. The lower AIC

46
value is complemented by the higher ROC score. All of these indicators point to the
Year 2 Best Fit Model as superior to the Score Only Model for Year 2. Recall the
Table 11 : Cohort 2 Model Comparison
Score Only
Model Year 2
Study
Model
Year 2 Best
Fit Model
Residual DF
101.84 (121)
119.00 (133)
72.771 (127)
P value .1038 .1979 2.94 e-5
AIC 145.84 139.00 104.77
ROC .8656 .8550 .9477
observations from Table 8 that the Score Only Model makes better predictions than the
Study Model. The summary data of Table 11 provides statistical evidence that the Score
Only Model is preferred. With a higher p-value and lower ROC score, the Study Model’s
only advantage is in the lower AIC score. Table 12 observes that the Study Model
Table 12 : Cohort 2 Model Comparison by Predictions
Predictions*
Score
Intercept Only
Study
Model
Year 2 Best
Fit Model
Pred 85% 34 (.78) 34/61 (.90) 36/94 (.92) 34/71
Pred 80% 32 (.71) 33/55 (.88) 33/85 (.83) 32/53
Pred 75% 30 (.64) 30/45 (.82) 30/63 (.76) 30/48
Student tot**
Pred 55% 78 (.84) 35/71 (.87) 31/74 (.96) 35/76
Pred 50% 71 (.84) 35/71 (.84) 31/67 (.92) 34/71
Pred 45% 64 (.78) 34/61 (.82) 30/63 (.89) 32/63 * The Predictions tables determine the results of the model given you want to be sure to get a
certain number of failures – 85% of the 39 failures is 34 the least number to identify in that row
**The Student tot tables determine the results of the model given you only have resources to pull a
certain number of the total students – 55% of the 143 is 78, the most number to pull for
intervention in that row

47
continues to lag behind the other two models. Just as the case in Table 7, Table 12 seeks
to find the balance or sensitivity and specificity by using various cutoff percentages
found in parenthesis. The number of correctly identified students failing the state
assessment and the number of total students pulled for interventions are listed for each of
the same hypothetical goals from Table 7. The goals being the identical, it is noteworthy
that although the Year 2 Best Fit Model statistically outshines the Score Only Model, the
Score Only Model maintains an advantage when making predictions. The surprising
result is that comparatively few of the questions in the Year 2 constructed model are the
same as the Study Model. The Year 2 Best Fit Model utilizes questions 1, 2, 3, 8, 9, 11,
13, 17, 18, 22, 24, 26, 27, 33 and 34 whereas the Study Model from Year 1 utilizes
questions 2, 13, 14, 17, 28, 31, 5, 7, and 18. Only 4 questions overlap in the 20 questions
utilized by both models. Table 13 presents the comparative p-values for each question
for cohort 1 and cohort 2. The univariate columns record the result of running the
generalized linear model logistically for each question by itself on its ability to predict
EOC success. The “All questions” columns refer to the p-value on the question variable
when it was included in the Full Model with all qualified questions included, for cohort 1
and cohort 2, respectively. The average distance between the two years in the all
questions column is .328864. Questions 2, 17 and 31 are particularly troublesome. Of
the 12 questions with a p-value of under 0.15 in the cohort 2 analysis with all questions
included, 6 of them have a p-value of over .40 with cohort 1. Questions 23, 24, 26, and
34 give pause in this direction. The result is a seemingly lurking variable or
uninvestigated interaction.

48
Table 13 : Question Comparison by Cohort
Coefficients:
Question
Cohort 1
Univariate
p-value
Cohort 2
Univariate
p-value
Cohort 1
All questions
P-value
Cohort 2
All questions
P-value
Difference
Univariate/
All questions
Question 1 .0000839 .000604 .52260 .00642 .00052/.51618 Question 2 1.66 e-10 .00152 .00273 .34419 .00152/.34146
Question 3 .000161 .0163 .15101 .07973 .01614/.07128
Question 5 1.39 e-6 .35705 .08952 .41397 .35705/.32445
Question 6 .0571 .1383 .30024 .51729 .0812/.21705
Question 7 7.96 e-6 .00249 .62417 .30275 .00248/.32142
Question 8 .00313 .00151 .38351 .13862 .00162/.24489
Question 9 .000583 .0000829 .33986 .01514 .0005/.32472
Question 10 3.68 e-6 .318 .30405 .34225 .318/.0382
Question 11 .0000125 .00354 .54761 .40033 .00353/.14728
Question 12 .309 .5197 .49718 .05737 .2107/.43981
Question 13 1.82 e-7 .00594 .09145 .24611 .00594/.15466
Question 14 1.93 e-8 .00579 .19738 .03537 .00579/.16201 Question 15 .848 .360978 .95509 .64761 .48702/.30748
Question 16 .00441 .521 .72545 .68865 .51659/.0368
Question 17 .000268 .000378 .01978 .35866 .00011/.33888
Question 18 .000348 .00293 .14604 .03446 .00258/.11158
Question 19 .00212 .0606 .69646 .12240 .05848/.57406
Question 21 .0122 .352 .47833 .35983 .3398/.1185
Question 22 .000787 .166 .34617 .45718 .16521/.11101
Question 23 2.44 e-6 .7842 .99162 .15727 .78420/.83435
Question 24 .00473 .0107 .44344 .01618 .00597/.42726
Question 25 3.37 e-6 8.86 e-6 .12270 .19126 5 e-6/.06856
Question 26 .0000661 .000293 .51954 .00878 .00023/.51076 Question 27 .180335 .00827 .19672 .76749 .17207/.57077
Question 28 1.3 e-8 .0000329 .18997 .40055 .00003/.21058
Question 29 .00165 .00222 .41569 .17809 .00057/.2376
Question 30 .196591 .09621 .44103 .81095 .10038/.36992
Question 31 1.32 e-9 .00277 .00455 .97281 .00277/.96826
Question 32 .0247 .572109 .58761 .38394 .54741/.20367
Question 33 .110755 .1225 .38895 .05971 .01175/.32924
Question 34 .00313 8.59 e-5 .69838 .02420 .00304/.67418
Univariate Average
Difference
All questions Average
Difference
.131355 .328864
Conclusion
The Study Model when applied to Year 2 did not improve on the Score Only Model as
anticipated. But the point remains that just because the Study Model does not improve on
the Score Only Model in Year 2, a model that does improve on the Score Only Model

49
does exist for cohort 2. The breakdown does not reside in the question type regression
model. The failure comes from the identification of significant questions beforehand.
The fact that the Score Only Model out predicts the fitted model on STAAR results
brings the experiment to a halt; however, interesting results were found.
The logistic regression models presented in this chapter for the year 2 data indicate that
logistic models of good fit can be developed to model the student outcome on the
STAAR examination. However, the questions identified as statistically significant in the
Year 1 and Year 2 models of best fit presented are considerably different. This finding
presents an added complexity. Both groups of students completed the same examination,
and yet completely different questions are found to be significant in each group. The
conclusion of this research is therefore that Benchmark examinations cannot accurately
and consistently predict student performance on an end of year examination by
themselves.

50
CHAPTER 8
THE FUTURE OF BENCHMARKS
This research looked for evidence to determine if benchmark examination questions
could accurately predict whether or not a student successfully makes a passing score on a
statewide assessment. After examination of the convenience samples of high school
freshman, sophomores and fourth graders from a Texas panhandle region school district,
the study population of two cohort groups of 4th grade students was selected. The
students attended the 4th grade in the back to back school years of 2012-2013 and 2013-
2014. A logistic regression model was developed from the Year 1 data on cohort 1. The
Year 2 data received an analysis based on this model and it is compared to the model
based entirely on scores. Further examination of the year 2 data provides background to
research by developing a logistic regression model on the cohort 2 data. A question by
question comparison between the two cohort groups concludes the research.
Discussion
The outcome of the study is problematic for the state of Texas school system where the
benchmark system is so prevalent that a law (HB 5 of the 2013 Texas legislation session)
was passed to limit the number of benchmarks a school can give each year to two. The
Texas American Federation of Teachers questions “whether school districts will comply

51
with the letter and spirit of this new law or will try to play games to evade it – for
instance, by relabeling their test prep tests as something other than “benchmark” tests”
(Texas AFT, 2013, para. 4). The question no longer seems to be whether schools use
benchmarks as much as how many benchmarks do they use? With this practice so
commonplace that it attracts the attention of lawmakers, what is the impact of the
discovery that benchmarks cannot accurately predict the STAAR results? One fact
finding group estimates that students spend 7-9 days in actual benchmark testing (Owen,
2012). This number can be easily doubled if the teacher performs a review before and a
review after the test. The use of benchmarks seemingly results in less actual days of
instruction and more hours of interventions that focus on the wrong students. Districts
that pay up to $30 an hour for teachers and staff to conduct these interventions may be
able to save these funds and apply them towards an intervention strategy that has better
success. This study sheds light on a practice exploding in popularity.
A big question that surrounds this research is why. It only makes sense that a benchmark
designed to test the same information as the STAAR would be able to predict the
outcome. Many issues come into play. One such issue is the apparent overuse of
benchmarks. Children are smart. It does not take them very long to figure out which
examinations really count, and which are for practice. A large portion of fourth graders
still want to please their teacher, but another subpopulation of students will only try when
it really counts.
Another factor is instruction. While this study pointed out that the instruction does not
change substantially in a single year, over time instructional holes can deviate results

52
from a baseline. Mathematics is a subject that builds on itself. A cohort that experiences
a substandard teacher will be behind the next year. Several bad (or several good)
instructional years can change a group of students knowledge of mathematics as a whole
in comparison to other cohorts.
People have good days, and people have bad days. Students are no different. A
difficulty in making predictions derives from the snapshot nature of testing. A
benchmark is given on a certain day, and the STAAR is given on a certain day. It is
unreasonable to believe that each student will be in the same emotional state on both
days. Whether the student is just not feeling themselves that day, or whether they are
going through a major life changing event, some days are just better than others. Take
for example the child who finds out his parents are getting divorce just before the
STAAR or the benchmark. There is no doubt that these kinds of things do happen, and
they do change the results.
Another concern for the students who are close to the passing score is the kind of test that
is administered. With the pass or fail mentality of this test, a multiple choice test can
literally come down to luck. True, it is statistically improbable that a student can reach a
passing score completely by luck. But there is something to be said for the students who
misses or passes by a couple of questions. These two groups of students may simply be
separated by whether they guess right or wrong on several crucial items. There is no way
to predict which student will guess right, and which will guess wrong. A deeper look at
the data brings us to a final troubling thought. The Score Only Model out predicts the
Study Model. The Score Only Model grades students on the mathematical information

53
the student possesses in whole. The Study Model uses specific questions which in turn
are pointed at specific mathematical skills. The results of this study indicate that the
STAAR favors the student with general mathematic knowledge rather than the students
with specific knowledge of certain skills. Using a multiple choice snapshot examination
to determine knowledge acquired over years of instruction contains many drawbacks,
very few of which the work is able to address
Challenges to the Methodology
Tracking students creates difficulties for this methodology. In the case of this research,
the freshman Algebra I teachers prevent the students with the lowest previous state
examination scores from participating in the same benchmark as the remainder of the
cohort. The geometry students with the highest previous state examination score did not
participate in the same benchmark as the rest of the cohort. Both extremes produce
undesirable results. When the higher student group is removed, valuable data about what
the students should know to pass the state examination disappears resulting in a
benchmark that contains very few statistically significant questions to build a prediction
model. Only when school districts are willing to administer the same benchmark exam to
the entire cohort will the information needed to build predictive models exist. This is a
hard sell for some teachers. Although a school district may declare officially that using
benchmarks to evaluate teachers performance and practices is not condoned, it has been
known to happen. These methods of evaluation build barriers to process.

54
Another limitation comes from the outside. Politicians still struggle with the
implementation of the state assessment. Resistance from teachers and parents produce a
system that is instable at the least, and may be described as chaotic. Changing standards,
graduation requirements, and passing percentage levels form a few of these challenges.
This study was impacted by the change of requirement for a passing Geometry EOC
score in order to graduate high school. Cohort 1 is under the impression that they must
pass the Geometry EOC to graduate. Cohort 2 is told that they do not need to pass, and
eventually the EOC test is not administered. As long as the fluctuation between the
requirements, the standards, and the percentage levels continue, finding cohorts under the
same conditions remains difficult.
Collecting data remains another issue. Whenever a computer is involved, there is the
possibility of technological barriers. There is also the human element. Teachers who
fear judgment from their posted scores may conveniently forget to run the scores, while
others may even go as far as tampering with scores, having the students correct the tests
prior to entering the scores into the computer for example. In this study, the scores from
90 students were lost in what appears to be honest technological errors.
Limitations of the Study
Despite the careful design of this project, there are limitations to this study. The
population of students is a single rural school district in the Texas Panhandle. Additional
studies on various populations are needed to make larger inferences more stable.
Analysis of different courses and grade levels were originally planned; however,

55
inconsistency in data for all students in these populations, required the study be limited to
a single course and grade, namely fourth grade mathematics. A single year of student
benchmark data was used to develop the model for both Year 1 and Year 2. Using more
than one year of previous data along with various other known demographic indicators
may have impacted the study. Due to the educational process and ethical responsibilities,
the school district continued to remediate students they felt were at risk in preparation for
the STAAR examination while this study was underway. This remediation may have
impacted the student outcome variable. Fluidity at the teaching positions makes it
impossible to ascertain whether the two cohort groups received the same level of
education. Foundational skills in earlier grade levels may have been better developed in
one group over the other. This would create gaps that influence the performance of each
cohort.
Conclusion
The results of this study support that it is unlikely to be able to predict a student outcome
on a statewide assessment based on student benchmark examination scores using a single
year of data. Using the analogy of businesses that use data mining techniques to analyze
the shopping habits of their customers, a synonymous business analysis would depend on
a single shopping experience alone to make decisions regarding marketing. Several
shopping experiences, demographics, and numerous other data points are taken into
consideration when companies make marketing decisions. In our example of the
pregnant girl in Chapter 1, surely Target would not determine a 75 year old male was

56
pregnant given the same shopping occurrence. However, in education, the system limits
itself to benchmark testing results alone.
This study provides evidence for the inadequacy of this benchmark system alone in
determining student outcome on state-wide 4th Grade Mathematics STAAR
examinations. In order to identify 85% of students who need remediation, between
49.7% and 67.6% of population students must be targeted for remediation. To be certain
those students are identified, a benchmark score of over 70% (refer Table 2 and
Appendix 4) must be used as the cutoff value to identify this target population. The
resulting environment is one where school systems are forced to give up on some
students and concentrate on those “bubble kids” who school districts feel are the most
likely to be successful under remediation, due to the financial investment. In Year 1, of
students who scored below the 50 percentile mark, therefore being identified by the study
school district as not a good risk, received no intervention, 24.4% (11/45) passed the
STAAR. A similar result of 25% (2/8) passed the STAAR in the second cohort.
In summary, this study identifies four concerns to using benchmarks as identifiers of
students in danger of failing a state-wide examination. First, for accurate predictions, the
entire cohort must take the same benchmark test. Failure to do so removes valuable
information from the data and skews the results. Second, the “bubble kid” model leaves
out students who have the opportunity to pass. With 25% of both cohorts passing even
without interventions, the students who fall in this group may have a better chance of
passing than teachers give them credit. Third, more information is needed. Information
from prior testing, demographics, gender, economic status, and other types of evaluations

57
must be factored into the equation. A single test on a single day does not paint a true
picture of a students’ mathematical knowledge. Fourth, with the Score Only Model out
predicting the question based model, the current STAAR test in Texas may measure a
student’s mathematical general knowledge rather than targeting specific knowledge base.
Further study should be conducted which includes variables such as past test experience,
gender, race, age in days compared to the mean for that grade, economic status, English
as a second language status, and many other factors that have been predicted to influence
end of course grades. All of these factors should be utilized in a further study to confirm
or deny the profitability of administering benchmark examinations and determining
student remediation based on these scores. This kind of study across many grade levels
and districts would prove beneficial to the understanding of how to correctly identify at
risk students.

58
REFERENCES
Allison, P. D. (2014). Paper 1485-2014. Retrieved April 22, 2014, from SAS Global
Forum: http://support.sas.com/resources/papers/proceedings14/1485-2014.pdf
Aydeniz, M., & Southerland, S. A. (2012). A National Survey of Middle and High
School Science Teachers' Responses to Standardized Testing; Is Science Being Devalued
in Schools? Journal of Science Teacher Education , 233-257.
Bancroft, K. (2010). Implementing the mandate: the limitations of benchmark tests.
Educational Assessment, Evaluation and Accountability , 53-72.
Barksdale-Ladd, M. A., & Thomas, K. F. (2000). What's at Stake in High-Stakes Testing:
Teachers and Parents Speak Out. Journal of Teacher Education , 384-397.
Berliner, D. (2011). Rational Responses to High Stakes Testing: the Case of Curriculum
Narrowing and the Harm that Follows. Cambridge Journal of Education , 287-302.
Duhigg, C. (2012, February 16). How Companies Learn Your Secrets. Retrieved 12 19,
2014, from The New York Times: NTTimes.com
Dunn, O. J. (1961). Multiple Comparisons Among Means. Journal of the American
Statistical Association , 56 (No. 293), 52-64.
Good, R. H., Simmons, D. C., & Kame'enui, E. J. (2001). The importance and decisino-
making utility of a continuum of fluency-based indicators of foundational reading skills
for third-grade high-stakes outcome. Scientific Studies of Reading , 257-288.
Greatschools.org. (n.d.). Retrieved 4 3, 2015, from Greatschools.org:
http://www.greatschools.org/texas/pampa/5284-Pampa-High-School/details/#Students
Hosmer, D. W., & Lemeshow, S. (2000). Applied Logistic Regression. John Wiley and
Sons Inc.
Johnson, J. (2013). The Human Factor. Educational Leadership , 16-21.

59
Johnson, V. E. (2013, November 26). Revised Standards for Statisical Evidence.
Retrieved April 24, 2015, from Proceedings of the National Academy of Sciences of the
United States of America: www.pnas.org/content/110/48/19313.full.
Keller-Margulis, M. A., Shapiro, E. S., & Hintze, J. M. (2008). Long-Term Diagnostic
Accuracy of Curriculum-Based Measure in Reading and MAthematics. School
Psychology Review , 374-390.
Owen, S. (2012, August 29). PolitiFact Check. Retrieved April 18, 2015, from
http://www.politifact.com/texas/statements/2012/aug/29/ted-lyon/ted-lyon-says-most-
texas-schools-spend-45-days-man/
Parker, S. (2013, May 28). Common Core Standards : Why States Are Now Saying 'No
Thank You'. Retrieved April 25, 2015, from
www.takepart.com/article/2013/05/28/common-core-standards-why-states-are-now-
saying-no-thank-you
Public Law 107-110. (2002, January 8). Retrieved April 24, 2015, from
www2.ed.gov/policy/elsed/leg/esea02/107-110.pdf
Shannon, C. E. (1948). A Mathematical Theory of Communication. The Bell System
Technical Journal , 27 (No. 3), 379-423.
Shapiro, E. S., Keller, M. A., & Lutz, J. G. (2006). Curriculum-Based Measures and
Performance on State Assessment and Standardized Tests. Journal of Psychoeducational
Assessment , 19-35.
Silbertglitt, B., & Hintze, J. (2007). How much growth can we expect? A conditional
analysis of R-CBM growth rates by level of performance. Exceptional Children , 71-84.
Spackman, K. A. (1989). Signal Detection Theory: Valuagble Tools for Evaluating
Inductive Learning. In Machine Learning Proceedings (pp. 160-163). Morgan Kaugmann
Publishers.
Stage, S. A., & Jacobsen, M. D. (2001). Predicting student success on a state-mandated
performance-based assessment using oral reading fluency. School Psychology Review ,
407-419.
Starnes, D. S., Yates, D. S., & Moore, D. S. (2012). The Practice of Statistics for AP* 4th
ed. New York, New York: W. H. Freeman and Company.

60
Strauss, V. (2014, April 22). 11 Problems Created by the Standardized Testing
Obsession. Retrieved April 24, 2015, from The Washington Post:
www.washingtonpost.com/blogs/answer-sheet/wp/2014/04/22/11-problems-created-by-
the-standarized-testing-obssession/
Sugiura, N. (1978). Further Analysis of the Data by Akaike's Information Criterion and
the Finite Corrections. Communications in Statistics , a(7), 13-26.Texas AFT. (2013,
December 11). New Limit on Benchmark Testing: Will Districts Honor or Evade It?
Retrieved 4 18, 2015, from www.texasaft.org/new-limit-on-benchmark-testing-will-
districts-honor-or-evade-it/
Texas Education Agency. (2013, July). State of Texas Assessments of Academic
Readiness (STAAR) Progress Measure Questions and Answers. Retrieved March 2, 2015,
from http://www.psptexas.net/docs/STAAR-ProMeasureQA.pdf.
Wiggins, G., & McTighe, J. (2005). Understanding by Design. Alexandria: Association
for Supervision and Curriculum Development.
Zeichner, K., & Ndimande, B. (2008). Contradictions and Tensions in the Place of
Teachers in Educational Reform: Reflections on Teacher Preparation in the USA and
Namibia. Teachers and Teaching: Theory and Practice , 331-343

61
APPENDIX 1
CHAPTER 4 DATA
Algebra Unit 1 test
# total count y y passed y fail count n n passed n fail info gain* z-score**
1 148 105 91 14 43 30 13 0.026582672 2.4168625
2 148 0 0 0 148 121 27 #DIV/0! #DIV/0!
3 148 87 79 8 61 42 19 0.056150377 3.4037501
4 148 0 0 0 148 121 27 #DIV/0! #DIV/0!
5 148 62 54 8 86 67 19 0.010258563 1.4282601
6 148 88 77 11 60 44 16 0.022990327 2.1909927
7 148 66 59 7 82 62 20 0.023726791 2.1583219
8 148 27.001 27 0.001 121 94 27 0.059117455 2.7141728

62
Algebra Unit 3 test
# total count y y passed y fail count n n passed n fail info gain Z-score
1 137 69 60 9 67 52 15 0.021330903 1.42903
2 137 0 0 0 0 0 0 #DIV/0! #DIV/0!
3 137 69 60 9 67 52 15 0.021330903 1.42903
4 137 50 40 10 86 72 14 0.012057718 -0.54968
5 137 86 73 13 50 39 11 0.015804942 1.01273
6 137 106 90 16 30 22 8 0.021003651 1.454623
7 137 86 71 15 50 41 9 0.010527702 0.082113
8 137 0 0 0 137 113 24 #DIV/0! #DIV/0!
9 137 0 0 0 137 113 24 #DIV/0! #DIV/0!
10 137 0 0 0 137 113 24 #DIV/0! #DIV/0!
11 137 47 37 10 89 75 14 0.013846619 -0.80827
12 137 0 0 0 137 113 24 #DIV/0! #DIV/0!
13 137 73 63 10 63 49 14 0.019382127 1.299485
14 137 67 55 12 69 57 12 0.010525283 -0.07941
15 137 0 0 0 137 113 24 #DIV/0! #DIV/0!
16 137 40 32 8 96 80 16 0.01160756 -0.46562
17 137 81 64 17 55 48 7 0.018857156 -1.23808

63
Algebra Unit 4 test
# total count y y passed y fail count n n passed n fail info gain z-score
1 52 43 32 11 9 6 3 0.003045226 0.476773
2 52 23 18 5 29 20 9 0.007912586 0.750541
3 52 0 0 0 52 38 14 #DIV/0! #DIV/0!
4 52 0 0 0 52 38 14 #DIV/0! #DIV/0!
5 52 0 0 0 52 38 14 #DIV/0! #DIV/0!
6 52 9 5 4 43 33 10 0.02180517 -1.30318
7 52 0 0 0 52 38 14 #DIV/0! #DIV/0!
8 52 0 0 0 52 38 14 #DIV/0! #DIV/0!
9 52 34 29 5 18 9 9 0.100307763 2.729756
10 52 0 0 0 52 38 14 #DIV/0! #DIV/0!
11 52 0 0 0 52 38 14 #DIV/0! #DIV/0!
12 52 0 0 0 52 38 14 #DIV/0! #DIV/0!
13 52 0 0 0 52 38 14 #DIV/0! #DIV/0!
14 52 18 14 4 34 24 10 0.004377196 0.556061
15 52 0 0 0 52 38 14 #DIV/0! #DIV/0!
16 52 22 17 5 30 21 9 0.004787252 0.584138
17 52 19 13 6 33 25 8 0.00451766 -0.57434
18 52 26 19 7 26 19 7 0 0
19 52 12 10 2 40 28 12 0.012437421 0.913283
20 52 20 14 6 32 24 8 0.002152557 -0.39546

64
Algebra Semester test
# total count y y passed y fail count n n passed n fail info gain z-score
1 146 103 92 11 43 32 11 0.024128797 2.294274
2 146 92 80 12 54 44 10 0.003856111 0.892755
3 146 77 68 9 69 56 13 0.007193058 1.206057
4 146 71 65 6 75 59 16 0.024196733 2.174796
5 146 105 91 14 41 33 8 0.004167281 0.937884
6 146 98 87 11 48 37 11 0.016165322 1.855168
7 146 72 65 7 74 59 15 0.016007462 1.781183
8 146 99 86 13 47 38 9 0.004312478 0.949611
9 146 89 82 7 57 42 15 0.044677951 3.040169
10 146 85 78 7 61 46 15 0.036393197 2.72443
11 146 72 62 10 75 63 12 -0.00097135 0.358633
12 146 70 60 10 76 64 12 0.000318575 0.25374
13 146 65 60 5 81 64 17 0.026128315 2.231789
14 146 62 54 8 84 70 14 0.001975465 0.628311
15 146 48 42 6 98 82 16 0.001870917 0.607146
16 146 54 44 10 92 80 12 0.003856111 -0.89276
17 146 135 117 18 11 7 4 0.016476033 2.053133
18 146 82 70 12 64 54 10 0.000135962 0.166058
19 146 53 45 8 93 79 14 2.14543E-07 -0.00659
20 146 8 6 2 138 118 20 0.002810885 -0.80766
21 146 120 102 18 26 22 4 1.21498E-05 0.0497
22 146 93 81 12 53 43 10 0.004527806 0.968773
23 146 89 77 12 57 47 10 0.002182274 0.669097
24 146 48 39 9 98 85 13 0.003635207 -0.87024
25 146 113 101 12 33 23 10 0.033571469 2.7807
26 146 66 55 11 80 69 11 0.001183256 -0.4903
27 146 96 82 14 50 42 8 0.00025276 0.227061
28 146 83 75 8 63 49 14 0.021745155 2.105091
29 146 118 102 16 28 22 6 0.005023187 1.046424
30 146 66 55 11 80 69 11 0.001183256 -0.4903

65
Geometry Unit 1 Test
# total count y y passed y fail count n n passed n fail info gain z-score
1 169 65 57 8 104 96 8 0.004140693 -0.99705
2 169 48 44 4 121 109 12 0.000439442 0.317185
3 169 42 42 0 127 111 16 #NUM! 2.417578
4 169 121 114 7 48 39 9 0.025849649 2.596087
5 169 107 101 6 62 52 10 0.020724421 2.251673
6 169 29 25 4 140 128 12 0.002977327 -0.8742
7 169 92 86 6 77 67 10 0.008720839 1.429762
10 169 105 95 10 64 58 6 4.38998E-06 -0.03205
12 169 42 36 6 127 117 10 0.005958734 -1.23037
13 169 60 56 4 109 97 12 0.003820882 0.922714
14 169 65 60 5 104 93 11 0.001699643 0.623159
15 169 63 57 6 106 96 10 1.58737E-06 -0.01929
16 169 132 123 9 37 30 7 0.01819703 2.221965
20 169 33 23 10 136 130 6 0.06915461 -4.5574
22 169 75 69 6 94 84 10 0.00146413 0.582044

66
Geometry Unit 2 Test
# total count y y passed y fail count n n passed n fail info gain z-score
1 159 107 101 6 52 41 11 0.037359198 2.976134
2 159 126 116 10 33 26 7 0.018887722 2.196983
3 159 114 104 10 45 38 7 0.006618373 1.246954
4 159 65 55 10 10 5 5 0.174450239 1.761599
5 159 113 107 6 46 35 11 0.048168263 3.442217
6 159 93 85 8 66 57 9 0.004578206 1.01222
7 159 104 97 7 55 45 10 0.021211422 2.222661
8 159 125 119 6 34 23 11 0.077920881 4.609909
9 159 130 120 10 29 22 7 0.025240871 2.591498
10 159 97 92 5 67 50 17 -0.03248473 3.763859
11 159 124 115 9 35 27 8 0.027011484 2.637386
12 159 112 106 6 47 36 11 0.046216317 3.360436
13 159 103 92 11 34 28 6 0.029253461 0.966271
14 159 47 46 1 67 53 14 0.135033848 3.147828
15 159 61 58 3 98 84 14 0.017335258 1.858831
16 159 94 89 5 65 53 12 0.031203903 2.636482
17 159 104 99 5 55 43 12 0.046803749 3.301754
18 159 83 77 6 76 65 11 0.009979001 1.476727
19 159 121 112 9 38 30 8 0.02234923 2.369298
20 159 83 81 2 76 61 15 0.062470777 3.531866
21 159 89 86 3 70 56 14 0.05368456 3.368571
22 159 26 26 0 45 34 11 0.263457402 3.572252
23 159 35 31 4 124 111 13 0.000114124 -0.15972
24 159 129 123 6 30 19 11 0.091483186 5.111469
25 159 106 99 7 53 43 10 0.023676312 2.359165
26 159 69 63 6 90 79 11 0.002347808 0.713228
27 159 91 84 7 68 58 10 0.008987244 1.415939
28 159 55 51 4 104 91 13 0.004941111 1.014619
29 159 100 90 10 59 52 7 0.000605542 0.367533
30 159 65 60 5 94 82 12 0.00486831 1.01782
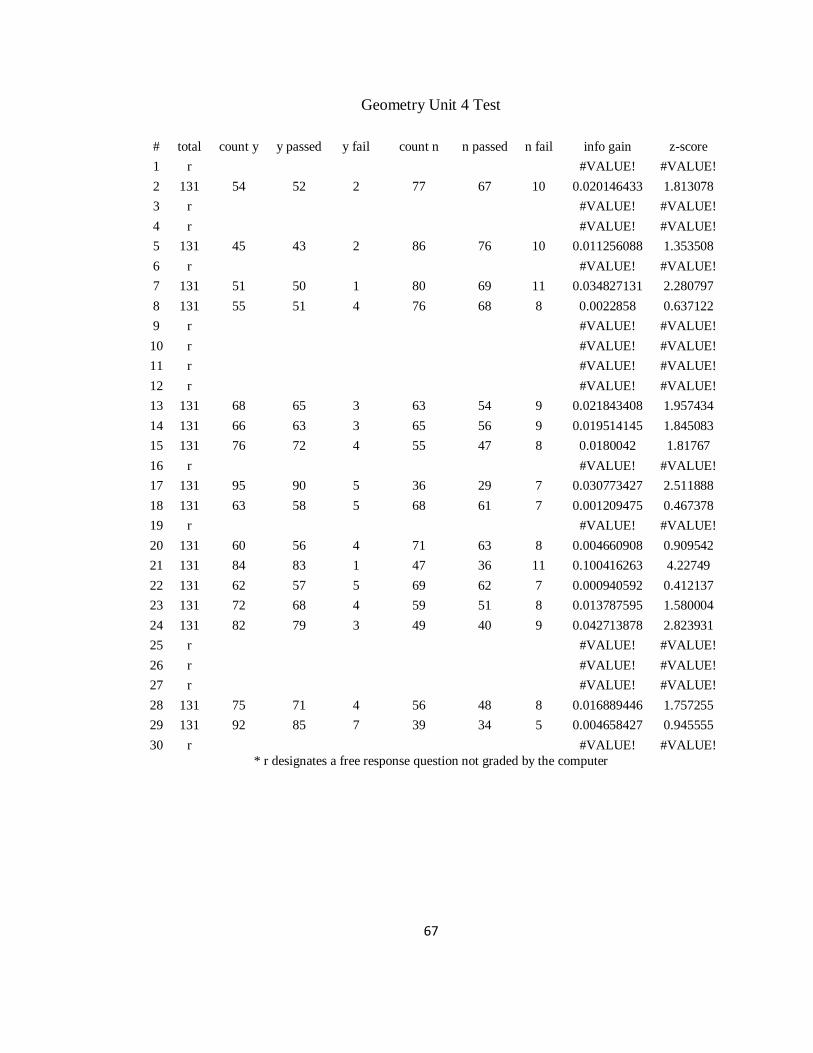
67
Geometry Unit 4 Test
# total count y y passed y fail count n n passed n fail info gain z-score
1 r
#VALUE! #VALUE!
2 131 54 52 2 77 67 10 0.020146433 1.813078
3 r
#VALUE! #VALUE!
4 r
#VALUE! #VALUE!
5 131 45 43 2 86 76 10 0.011256088 1.353508
6 r
#VALUE! #VALUE!
7 131 51 50 1 80 69 11 0.034827131 2.280797
8 131 55 51 4 76 68 8 0.0022858 0.637122
9 r
#VALUE! #VALUE!
10 r
#VALUE! #VALUE!
11 r
#VALUE! #VALUE!
12 r
#VALUE! #VALUE!
13 131 68 65 3 63 54 9 0.021843408 1.957434
14 131 66 63 3 65 56 9 0.019514145 1.845083
15 131 76 72 4 55 47 8 0.0180042 1.81767
16 r
#VALUE! #VALUE!
17 131 95 90 5 36 29 7 0.030773427 2.511888
18 131 63 58 5 68 61 7 0.001209475 0.467378
19 r
#VALUE! #VALUE!
20 131 60 56 4 71 63 8 0.004660908 0.909542
21 131 84 83 1 47 36 11 0.100416263 4.22749
22 131 62 57 5 69 62 7 0.000940592 0.412137
23 131 72 68 4 59 51 8 0.013787595 1.580004
24 131 82 79 3 49 40 9 0.042713878 2.823931
25 r
#VALUE! #VALUE!
26 r
#VALUE! #VALUE!
27 r
#VALUE! #VALUE!
28 131 75 71 4 56 48 8 0.016889446 1.757255
29 131 92 85 7 39 34 5 0.004658427 0.945555
30 r
#VALUE! #VALUE!
* r designates a free response question not graded by the computer

68
Geometry Unit 5 Test
# total count y y passed y fail count n n passed n fail info gain z-score
1 88 54 49 5 34 31 3 3.94215E-05 -0.06923
2 88 20 19 1 68 61 7 0.004849824 0.72396
3 88 61 57 4 27 23 4 0.011766483 1.242635
4 r
#VALUE! #VALUE
5 88 55 54 1 33 26 7 0.077986215 3.063767
6 r
#VALUE! #VALUE
7 r
#VALUE! #VALUE
8 88 33 33 0 55 47 8 #NUM! 2.297825
9 88 63 59 4 25 21 4 0.015060235 1.420217
10 88 62 61 1 26 19 7 0.107286542 3.768157
11 88 42 39 3 46 41 5 0.003061362 0.607408
12 88 58.001 58 0 30 22 8 0.154082342 4.124279
13 r
#VALUE! #VALUE
14 r
#VALUE! #VALUE
15 r
#VALUE! #VALUE
16 88 41 40 1 47 40 7 0.038138167 2.027317
17 88 48 47 1 40 33 7 0.055711107 2.504912
18 88 68 64 4 20 16 4 0.026019315 1.930559

69
Geometry Semester Test
# total count y y passed y fail count n n passed n fail info gain z-score
1 186 185 163 22 1.0001 1 0 0.000971269 -0.36698
2 186 129 117 12 57 47 10 0.009417457 1.604588
3 186 99 91 8 87 73 14 0.011099994 1.688088
4 186 171 155 16 15 9 6 0.033977195 3.523725
5 186 109 96 13 77 68 9 9.53811E-06 -0.04957
6 186 108 103 5 78 61 17 0.050157698 3.57711
7 186 95 87 8 91 77 14 0.008459872 1.470067
8 186 13 11 2 173 153 20 0.000611637 -0.41174
9 186 167 151 16 19 13 6 0.023456354 2.813478
10 186 138 126 12 48 38 10 0.017635948 2.242947
11 186 84 77 7 102 87 15 0.007144932 1.339295
12 186 100 94 6 86 70 16 0.027871316 2.654014
13 186 164 149 15 22 15 7 0.028525817 3.092027
14 186 148 134 14 38 30 8 0.013348436 1.974005
15 186 128 120 8 58 44 14 0.043652948 3.49947
16 186 137 124 13 49 40 9 0.009778733 1.651624
17 186 132 121 11 54 43 11 0.018994072 2.30742
18 186 60 56 4 126 108 18 0.009597765 1.504128
19 186 159 142 17 27 22 5 0.004705685 1.164346
20 186 109 100 9 77 64 13 0.012276988 1.794333
21 186 126 115 11 60 49 11 0.013152915 1.895828
22 186 166 149 17 20 15 5 0.01181927 1.930858
23 186 165 148 17 21 16 5 0.010490807 1.805167
24 186 127 121 6 59 43 16 0.069463605 4.401364
25 186 78 73 5 108 91 17 0.015652178 1.944404
26 186 153 139 14 33 25 8 0.01948576 2.434868
27 186 151 138 13 35 26 9 0.02600184 2.823379
28 186 175 158 17 11 6 5 0.032932603 3.560379
29 186 161 144 17 34 29 5 -0.00681012 0.77251
30 186 128 115 13 58 49 9 0.004095679 1.048787
31 186 165 146 19 21 18 3 0.000506608 0.370291
32 186 95 89 6 91 75 16 0.022598772 2.378481
33 186 137 123 14 49 41 8 0.004721624 1.136184
34 186 144 131 13 42 33 9 0.016502382 2.18967
35 186 77 70 7 109 94 15 0.003757345 0.971518

70
Fourth Grade Unit 1 (Benchmark)
# total count y y passed y fail count n n passed n fail info gain z-score
1 256 212 158 54 44 19 25 0.044020788 4.096405
2 256 170 141 29 86 36 50 0.124407069 6.720962
3 256 149 117 32 107 60 47 0.041225959 3.835275
4 256 148 116 32 108 61 47 0.03935406 3.745805
5 256 115 98 17 141 79 62 0.075055958 5.029188
6 256 209 150 59 47 27 20 0.009963562 1.920843
7 256 145 117 28 111 60 51 0.059038662 4.572227
8 256 110 87 23 146 90 56 0.025890031 2.99168
9 256 175 133 42 81 44 37 0.033359395 3.492375
10 256 216 161 55 40 16 24 0.049194593 4.343719
11 256 230 170 60 26 7 19 0.062238267 4.916721
12 256 228 160 68 28 17 11 0.002839305 1.022846
13 256 171 137 34 85 40 45 0.079682711 5.392693
14 256 167 136 31 89 41 48 0.093863713 5.834512
15 256 95 65 30 161 112 49 0.000103116 -0.19146
16 256 234 168 66 22 9 13 0.023190152 2.998456
17 256 135 107 28 121 70 51 0.038941368 3.702166
18 256 229 167 62 27 10 17 0.037579867 3.818365
19 256 205 151 54 51 26 25 0.026245718 3.13754
20 256 137 112 25 119 65 54 0.062732103 4.687087
21 256 232 166 66 24 11 13 0.017540896 2.596649
22 256 242 174 68 14 3 11 0.04060759 3.975065
23 256 193 149 44 63 28 35 0.06376656 4.887437
24 256 211 154 57 45 23 22 0.022105856 2.88409
25 256 138 113 25 118 64 54 0.065029048 4.773586
26 256 79 69 10 177 108 69 0.055444466 4.211972
27 256 123 90 33 133 87 46 0.005097692 1.342465
28 256 136 116 20 120 61 59 0.102846076 5.956691
29 256 169 128 41 87 49 38 0.02793785 3.185832
30 256 106 78 28 150 99 51 0.00476592 1.294102
31 256 198 157 41 58 20 38 0.111853622 6.497451
32 256 66 53 13 190 124 66 0.015501624 2.278834
33 256 113 84 29 143 93 50 0.007281273 1.599822
34 256 110 87 23 146 90 56 0.025890031 2.99168

71
Fourth Grade Second Six Weeks Test
# total count y y passed y fail count n n passed n fail info gain z-score
1 256 236 164 72 23 11 12 -0.0051401 0.417527
2 256 217 157 60 42 18 24 0.019984711 2.622461
3 256 191 144 47 68 31 37 0.037936519 3.71229
4 256 113 65 48 146 110 36 0.008936562 -3.57751
5 256 6 3 3 253 172 81 -0.01472107 -1.02712
6 256 207 157 50 52 18 34 0.068708516 4.773444
7 256 170 133 37 89 42 47 0.053875014 4.429165
8 256 170 135 35 89 40 49 0.070467089 5.002115
9 256 194 142 52 65 33 32 0.013274824 2.484749
10 256 106 80 26 153 95 58 -0.00231115 1.843505
11 256 44 21 23 215 154 61 0.008389194 -3.37911
12 256 144 116 28 115 59 56 0.053915565 4.483377
13 256 153 127 26 106 48 58 0.098277224 5.853765
14 256 98 74 24 161 101 60 -0.00392323 1.737621
15 256 165 138 27 94 37 57 0.133170771 6.761163
16 256 150 115 35 109 60 49 0.020777252 3.101124
17 256 195 140 55 64 35 29 0.000526335 1.643817
18 256 206 147 59 53 28 25 0.000838345 1.559865
19 256 243 169 74 16 6 10 0.001293685 0.609068
20 256 164 132 32 95 43 52 0.077815836 5.247781
Fourth Grade Unit 6 Test
# total count y y passed y fail count n n passed n fail info gain z-score
1 137 131 87 44 6 2 4 0.013684724 -2.36325
2 137 80 53 27 57 36 21 0.000734702 -0.6348
3 137 124 85 39 13 4 9 0.036818265 -0.33906
4 137 95 72 23 42 17 25 0.082175938 1.853634
5 137 72 57 15 65 32 33 0.072018304 1.956048
6 137 119 82 37 18 7 11 0.030979761 -0.11108
7 137 57 41 16 80 48 32 0.011100539 0.436428
8 137 83 59 24 54 30 24 0.018106422 0.446699
9 137 44 30 14 93 59 34 0.001565858 -0.12225
10 137 126 81 45 11 8 3 0.001730138 -3.04586
11 137 106 76 30 31 13 18 0.047341908 0.87665
12 137 80 58 22 57 31 26 0.025144914 0.73775
13 137 75 53 22 62 36 26 0.012455178 0.31113
14 137 73 49 24 64 40 24 0.001684915 -0.39938

72
Fourth Grade Unit 7 Test
# total count y y passed y fail count n n passed n fail info gain z-score
1 138 132 88 44 6 1 5 0.03188502 -2.16672
2 138 105 72 33 33 17 16 0.016239177 -0.18958
3 138 57 44 13 81 45 36 0.036841545 1.261296
4 138 114 79 35 24 10 14 0.033134712 0.064144
5 138 100 71 29 38 18 20 0.034196805 0.563215
6 138 69 61 8 69 28 41 0.192604999 3.59726
7 138 122 84 38 16 5 11 0.043512025 -0.14858
8 138 75 60 15 63 29 34 0.091719279 2.212402
9 138 77 47 30 61 42 19 0.004769018 -1.69963
10 138 108 70 38 30 19 11 0.000117221 -1.53256
11 138 113 77 36 25 12 13 0.01828855 -0.3966
12 138 127 85 42 11 4 7 0.020475798 -1.4031
13 138 96 67 29 42 22 20 0.019833823 0.183789
14 138 110 76 34 28 13 15 0.025254449 -0.0184
15 138 90 69 21 48 20 28 0.086533998 1.924271
16 138 124 81 43 14 8 6 0.001876925 -2.12171
17 138 79 64 15 59 25 34 0.116769555 2.565143
18 138 107 75 32 31 14 17 0.032967414 0.330542
19 138 73 59 14 65 30 35 0.096483688 2.311503
20 138 88 63 25 50 26 24 0.027594913 0.606976
21 138 78 56 22 60 33 27 0.021788755 0.565083
22 138 95 69 26 43 20 23 0.045143168 0.968881
23 138 118 76 42 20 13 7 1.37621E-05 -2.14703
24 138 96 73 23 42 16 26 0.094145913 1.94816
25 138 29 21 8 109 68 41 0.005417017 0.315248
26 138 52 43 9 86 46 40 0.067053379 1.967635
27 138 23 20 3 115 69 46 0.036286401 1.487721
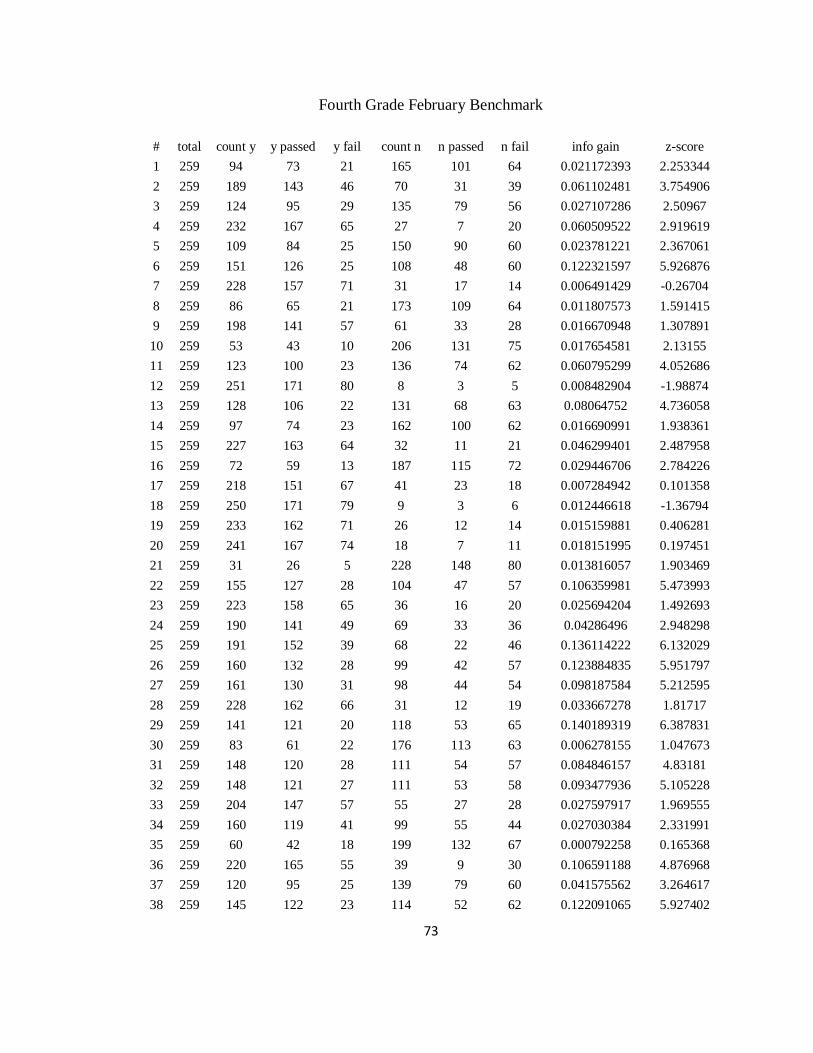
73
Fourth Grade February Benchmark
# total count y y passed y fail count n n passed n fail info gain z-score
1 259 94 73 21 165 101 64 0.021172393 2.253344
2 259 189 143 46 70 31 39 0.061102481 3.754906
3 259 124 95 29 135 79 56 0.027107286 2.50967
4 259 232 167 65 27 7 20 0.060509522 2.919619
5 259 109 84 25 150 90 60 0.023781221 2.367061
6 259 151 126 25 108 48 60 0.122321597 5.926876
7 259 228 157 71 31 17 14 0.006491429 -0.26704
8 259 86 65 21 173 109 64 0.011807573 1.591415
9 259 198 141 57 61 33 28 0.016670948 1.307891
10 259 53 43 10 206 131 75 0.017654581 2.13155
11 259 123 100 23 136 74 62 0.060795299 4.052686
12 259 251 171 80 8 3 5 0.008482904 -1.98874
13 259 128 106 22 131 68 63 0.08064752 4.736058
14 259 97 74 23 162 100 62 0.016690991 1.938361
15 259 227 163 64 32 11 21 0.046299401 2.487958
16 259 72 59 13 187 115 72 0.029446706 2.784226
17 259 218 151 67 41 23 18 0.007284942 0.101358
18 259 250 171 79 9 3 6 0.012446618 -1.36794
19 259 233 162 71 26 12 14 0.015159881 0.406281
20 259 241 167 74 18 7 11 0.018151995 0.197451
21 259 31 26 5 228 148 80 0.013816057 1.903469
22 259 155 127 28 104 47 57 0.106359981 5.473993
23 259 223 158 65 36 16 20 0.025694204 1.492693
24 259 190 141 49 69 33 36 0.04286496 2.948298
25 259 191 152 39 68 22 46 0.136114222 6.132029
26 259 160 132 28 99 42 57 0.123884835 5.951797
27 259 161 130 31 98 44 54 0.098187584 5.212595
28 259 228 162 66 31 12 19 0.033667278 1.81717
29 259 141 121 20 118 53 65 0.140189319 6.387831
30 259 83 61 22 176 113 63 0.006278155 1.047673
31 259 148 120 28 111 54 57 0.084846157 4.83181
32 259 148 121 27 111 53 58 0.093477936 5.105228
33 259 204 147 57 55 27 28 0.027597917 1.969555
34 259 160 119 41 99 55 44 0.027030384 2.331991
35 259 60 42 18 199 132 67 0.000792258 0.165368
36 259 220 165 55 39 9 30 0.106591188 4.876968
37 259 120 95 25 139 79 60 0.041575562 3.264617
38 259 145 122 23 114 52 62 0.122091065 5.927402

74
39 259 108 91 17 151 83 68 0.07230853 4.4808
40 259 242 166 76 17 8 9 0.008724087 -0.72138
41 259 114 70 44 145 104 41 0.008559206 -2.40418
42 259 147 107 40 112 67 45 0.013447178 1.464814
43 259 172 137 35 87 37 50 0.098560663 5.179038
44 259 231 164 67 28 10 18 0.036553737 1.867245
45 259 191 141 50 68 33 35 0.039019425 2.749503
46 259 56 43 13 203 131 72 0.008710409 1.407175
47 259 232 163 69 27 11 16 0.024841775 1.148476
48 259 137 111 26 122 63 59 0.071578251 4.412278

75
APPENDIX 2
CHAPTER 5 DATA
> table(totunit1c$Passed,totunit1c$cutoff50)
f p
a 0 0
f 34 45
p 11 166
> table(totunit1c$Passed,totunit1c$cutoff55)
f p a 0 0
f 52 27
p 25 152
> table(totunit1c$Passed,totunit1c$cutoff60)
f p
a 0 0
f 60 19
p 43 134
> table(totunit1c$Passed,totunit1c$cutoff65)
f p
a 0 0
f 66 13
p 54 123
> table(totunit1c$Passed,totunit1c$cutoff70)
f p
a 0 0
f 75 4
p 98 79

76
APPENDIX 3
CHAPTER 6 DATA
Univariate Testing for each question on cohort one
> q1lm <- glm(Passed~X1,data=totunit1c,family=binomial(logit)) > summary(q1lm)
Call:
glm(formula = Passed ~ X1, family = binomial(logit), data = totunit1c)
Deviance Residuals:
Min 1Q Median 3Q Max
-1.6539 -1.0633 0.7668 0.7668 1.2960
Coefficients:
Estimate Std. Error z value Pr(>|z|) (Intercept) -0.2744 0.3044 -0.902 0.367
X11 1.3480 0.3428 3.933 8.39e-05 ***
---
Signif. codes: 0 ‘***’ 0.001 ‘**’ 0.01 ‘*’ 0.05 ‘.’ 0.1 ‘ ’ 1
(Dispersion parameter for binomial family taken to be 1)
Null deviance: 316.40 on 255 degrees of freedom
Residual deviance: 300.78 on 254 degrees of freedom
AIC: 304.78
Number of Fisher Scoring iterations: 4
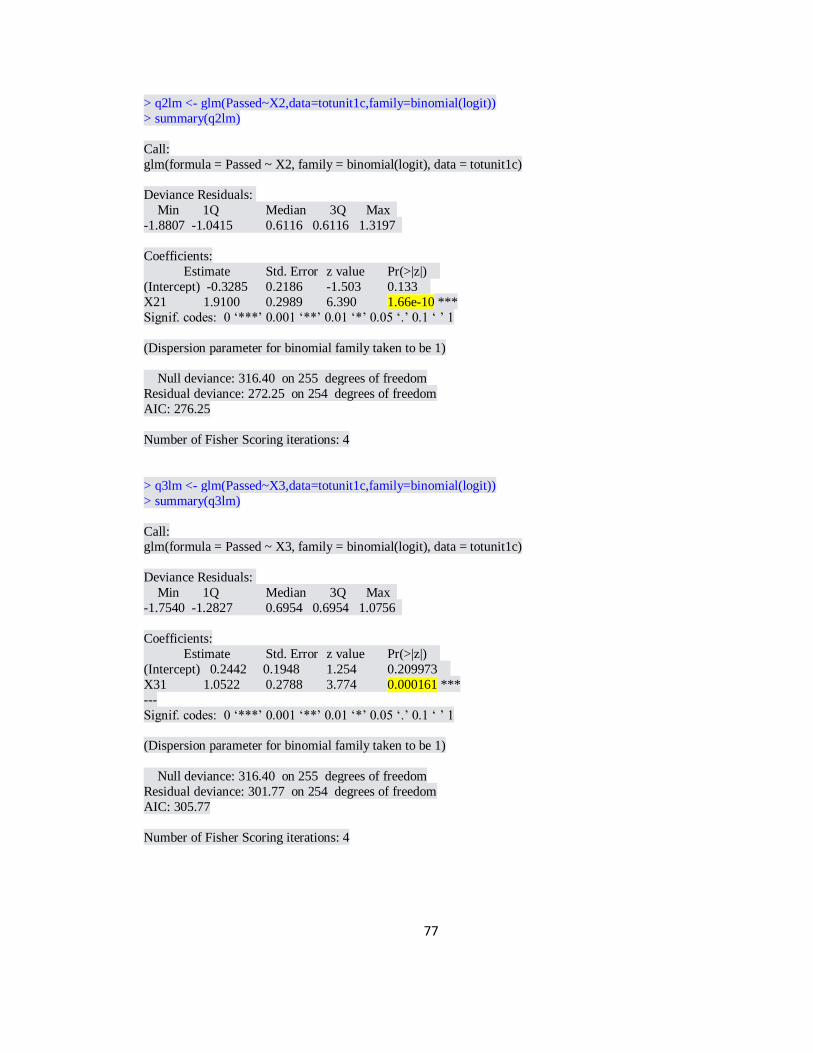
77
> q2lm <- glm(Passed~X2,data=totunit1c,family=binomial(logit))
> summary(q2lm)
Call:
glm(formula = Passed ~ X2, family = binomial(logit), data = totunit1c)
Deviance Residuals:
Min 1Q Median 3Q Max
-1.8807 -1.0415 0.6116 0.6116 1.3197
Coefficients:
Estimate Std. Error z value Pr(>|z|)
(Intercept) -0.3285 0.2186 -1.503 0.133
X21 1.9100 0.2989 6.390 1.66e-10 ***
Signif. codes: 0 ‘***’ 0.001 ‘**’ 0.01 ‘*’ 0.05 ‘.’ 0.1 ‘ ’ 1
(Dispersion parameter for binomial family taken to be 1)
Null deviance: 316.40 on 255 degrees of freedom
Residual deviance: 272.25 on 254 degrees of freedom
AIC: 276.25
Number of Fisher Scoring iterations: 4
> q3lm <- glm(Passed~X3,data=totunit1c,family=binomial(logit))
> summary(q3lm)
Call: glm(formula = Passed ~ X3, family = binomial(logit), data = totunit1c)
Deviance Residuals:
Min 1Q Median 3Q Max
-1.7540 -1.2827 0.6954 0.6954 1.0756
Coefficients:
Estimate Std. Error z value Pr(>|z|)
(Intercept) 0.2442 0.1948 1.254 0.209973
X31 1.0522 0.2788 3.774 0.000161 ***
---
Signif. codes: 0 ‘***’ 0.001 ‘**’ 0.01 ‘*’ 0.05 ‘.’ 0.1 ‘ ’ 1
(Dispersion parameter for binomial family taken to be 1)
Null deviance: 316.40 on 255 degrees of freedom
Residual deviance: 301.77 on 254 degrees of freedom
AIC: 305.77
Number of Fisher Scoring iterations: 4

78
> q4lm <- glm(Passed~X4,data=totunit1c,family=binomial(logit))
> summary(q4lm)
Call:
glm(formula = Passed ~ X4, family = binomial(logit), data = totunit1c)
Deviance Residuals:
Min 1Q Median 3Q Max
-1.750 -1.290 0.698 0.698 1.069
Coefficients:
Estimate Std. Error z value Pr(>|z|)
(Intercept) 0.2607 0.1941 1.343 0.179161
X41 1.0271 0.2785 3.689 0.000226 ***
---
Signif. codes: 0 ‘***’ 0.001 ‘**’ 0.01 ‘*’ 0.05 ‘.’ 0.1 ‘ ’ 1
(Dispersion parameter for binomial family taken to be 1)
Null deviance: 316.40 on 255 degrees of freedom
Residual deviance: 302.43 on 254 degrees of freedom
AIC: 306.43
Number of Fisher Scoring iterations: 4
> q5lm <- glm(Passed~X5,data=totunit1c,family=binomial(logit))
> summary(q5lm)
Call:
glm(formula = Passed ~ X5, family = binomial(logit), data = totunit1c)
Deviance Residuals:
Min 1Q Median 3Q Max
-1.9554 -1.2819 0.5656 1.0764 1.0764
Coefficients:
Estimate Std. Error z value Pr(>|z|)
(Intercept) 0.2423 0.1697 1.428 0.153
X51 1.5094 0.3128 4.826 1.39e-06 ***
--- Signif. codes: 0 ‘***’ 0.001 ‘**’ 0.01 ‘*’ 0.05 ‘.’ 0.1 ‘ ’ 1
(Dispersion parameter for binomial family taken to be 1)
Null deviance: 316.40 on 255 degrees of freedom
Residual deviance: 289.76 on 254 degrees of freedom
AIC: 293.76
Number of Fisher Scoring iterations: 4

79
> q6lm <- glm(Passed~X6,data=totunit1c,family=binomial(logit))
> summary(q6lm)
Call:
glm(formula = Passed ~ X6, family = binomial(logit), data = totunit1c)
Deviance Residuals:
Min 1Q Median 3Q Max
-1.5905 -1.3072 0.8145 0.8145 1.0529
Coefficients:
Estimate Std. Error z value Pr(>|z|)
(Intercept) 0.3001 0.2950 1.017 0.3090
X61 0.6330 0.3326 1.903 0.0571 .
---
Signif. codes: 0 ‘***’ 0.001 ‘**’ 0.01 ‘*’ 0.05 ‘.’ 0.1 ‘ ’ 1
(Dispersion parameter for binomial family taken to be 1)
Null deviance: 316.40 on 255 degrees of freedom
Residual deviance: 312.87 on 254 degrees of freedom
AIC: 316.87
Number of Fisher Scoring iterations: 4
> q7lm <- glm(Passed~X7,data=totunit1c,family=binomial(logit))
> summary(q7lm)
Call:
glm(formula = Passed ~ X7, family = binomial(logit), data = totunit1c)
Deviance Residuals:
Min 1Q Median 3Q Max
-1.8136 -1.2472 0.6551 0.6551 1.1092
Coefficients:
Estimate Std. Error z value Pr(>|z|)
(Intercept) 0.1625 0.1905 0.853 0.393
X71 1.2675 0.2838 4.466 7.96e-06 ***
--- Signif. codes: 0 ‘***’ 0.001 ‘**’ 0.01 ‘*’ 0.05 ‘.’ 0.1 ‘ ’ 1
(Dispersion parameter for binomial family taken to be 1)
Null deviance: 316.40 on 255 degrees of freedom
Residual deviance: 295.45 on 254 degrees of freedom
AIC: 299.45
Number of Fisher Scoring iterations: 4
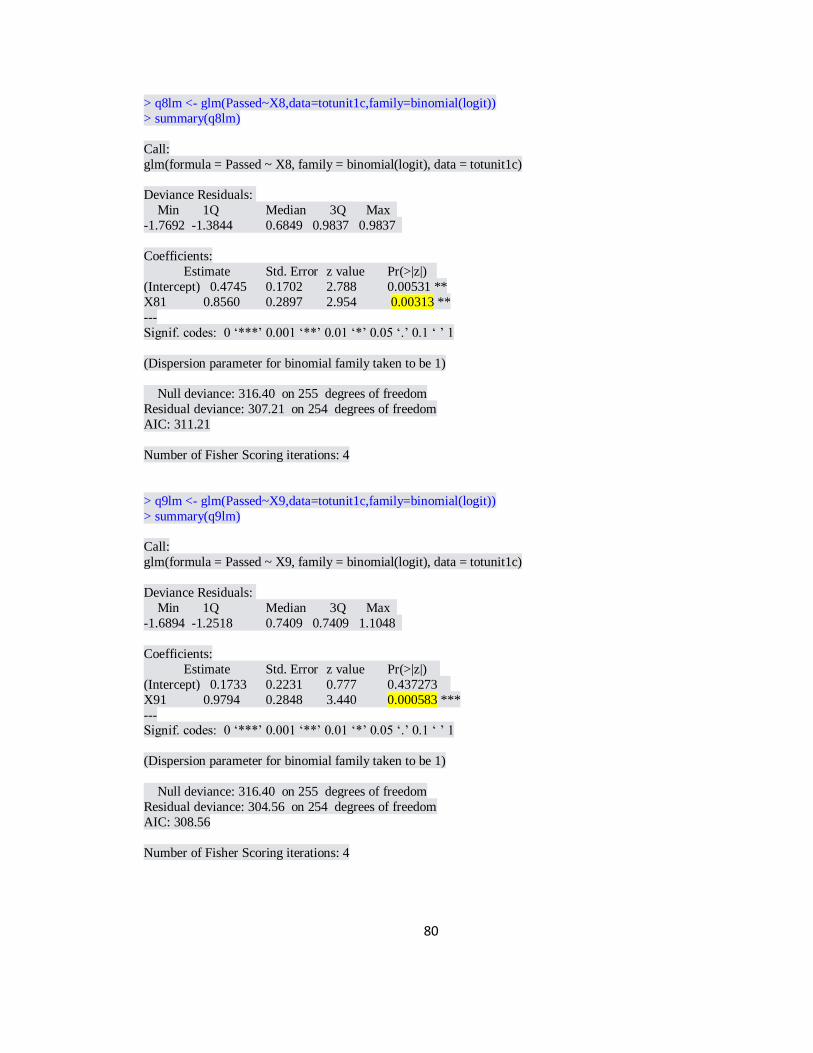
80
> q8lm <- glm(Passed~X8,data=totunit1c,family=binomial(logit))
> summary(q8lm)
Call:
glm(formula = Passed ~ X8, family = binomial(logit), data = totunit1c)
Deviance Residuals:
Min 1Q Median 3Q Max
-1.7692 -1.3844 0.6849 0.9837 0.9837
Coefficients:
Estimate Std. Error z value Pr(>|z|)
(Intercept) 0.4745 0.1702 2.788 0.00531 **
X81 0.8560 0.2897 2.954 0.00313 **
---
Signif. codes: 0 ‘***’ 0.001 ‘**’ 0.01 ‘*’ 0.05 ‘.’ 0.1 ‘ ’ 1
(Dispersion parameter for binomial family taken to be 1)
Null deviance: 316.40 on 255 degrees of freedom
Residual deviance: 307.21 on 254 degrees of freedom
AIC: 311.21
Number of Fisher Scoring iterations: 4
> q9lm <- glm(Passed~X9,data=totunit1c,family=binomial(logit))
> summary(q9lm)
Call:
glm(formula = Passed ~ X9, family = binomial(logit), data = totunit1c)
Deviance Residuals:
Min 1Q Median 3Q Max
-1.6894 -1.2518 0.7409 0.7409 1.1048
Coefficients:
Estimate Std. Error z value Pr(>|z|)
(Intercept) 0.1733 0.2231 0.777 0.437273
X91 0.9794 0.2848 3.440 0.000583 ***
--- Signif. codes: 0 ‘***’ 0.001 ‘**’ 0.01 ‘*’ 0.05 ‘.’ 0.1 ‘ ’ 1
(Dispersion parameter for binomial family taken to be 1)
Null deviance: 316.40 on 255 degrees of freedom
Residual deviance: 304.56 on 254 degrees of freedom
AIC: 308.56
Number of Fisher Scoring iterations: 4

81
> q10lm <- glm(Passed~X10,data=totunit1c,family=binomial(logit))
> summary(q10lm)
Call:
glm(formula = Passed ~ X10, family = binomial(logit), data = totunit1c)
Deviance Residuals:
Min 1Q Median 3Q Max
-1.6541 -1.0108 0.7667 0.7667 1.3537
Coefficients:
Estimate Std. Error z value Pr(>|z|)
(Intercept) -0.4055 0.3227 -1.256 0.209
X101 1.4795 0.3586 4.126 3.68e-05 ***
---
Signif. codes: 0 ‘***’ 0.001 ‘**’ 0.01 ‘*’ 0.05 ‘.’ 0.1 ‘ ’ 1
(Dispersion parameter for binomial family taken to be 1)
Null deviance: 316.40 on 255 degrees of freedom
Residual deviance: 298.94 on 254 degrees of freedom
AIC: 302.94
Number of Fisher Scoring iterations: 4
> q11lm <- glm(Passed~X11,data=totunit1c,family=binomial(logit))
> summary(q11lm)
Call:
glm(formula = Passed ~ X11, family = binomial(logit), data = totunit1c)
Deviance Residuals:
Min 1Q Median 3Q Max
-1.6394 -0.7920 0.7775 0.7775 1.6200
Coefficients:
Estimate Std. Error z value Pr(>|z|)
(Intercept) -0.9985 0.4421 -2.258 0.0239 *
X111 2.0400 0.4669 4.369 1.25e-05 ***
--- Signif. codes: 0 ‘***’ 0.001 ‘**’ 0.01 ‘*’ 0.05 ‘.’ 0.1 ‘ ’ 1
(Dispersion parameter for binomial family taken to be 1)
Null deviance: 316.40 on 255 degrees of freedom
Residual deviance: 294.31 on 254 degrees of freedom
AIC: 298.31
Number of Fisher Scoring iterations: 4

82
> q12lm <- glm(Passed~X12,data=totunit1c,family=binomial(logit))
> summary(q12lm)
Call:
glm(formula = Passed ~ X12, family = binomial(logit), data = totunit1c)
Deviance Residuals:
Min 1Q Median 3Q Max
-1.5555 -1.5555 0.8416 0.8416 0.9990
Coefficients:
Estimate Std. Error z value Pr(>|z|)
(Intercept) 0.4353 0.3870 1.125 0.261
X121 0.4203 0.4131 1.017 0.309
(Dispersion parameter for binomial family taken to be 1)
Null deviance: 316.40 on 255 degrees of freedom Residual deviance: 315.39 on 254 degrees of freedom
AIC: 319.39
Number of Fisher Scoring iterations: 4
> q13lm <- glm(Passed~X13,data=totunit1c,family=binomial(logit))
> summary(q13lm)
Call:
glm(formula = Passed ~ X13, family = binomial(logit), data = totunit1c)
Deviance Residuals:
Min 1Q Median 3Q Max
-1.7974 -1.1278 0.6659 0.6659 1.2278
Coefficients:
Estimate Std. Error z value Pr(>|z|)
(Intercept) -0.1178 0.2173 -0.542 0.588
X131 1.5114 0.2897 5.217 1.82e-07 ***
---
Signif. codes: 0 ‘***’ 0.001 ‘**’ 0.01 ‘*’ 0.05 ‘.’ 0.1 ‘ ’ 1
(Dispersion parameter for binomial family taken to be 1)
Null deviance: 316.40 on 255 degrees of freedom
Residual deviance: 288.12 on 254 degrees of freedom
AIC: 292.12
Number of Fisher Scoring iterations: 4

83
> q14lm <- glm(Passed~X14,data=totunit1c,family=binomial(logit))
> summary(q14lm)
Call:
glm(formula = Passed ~ X14, family = binomial(logit), data = totunit1c)
Deviance Residuals:
Min 1Q Median 3Q Max
-1.8352 -1.1113 0.6408 0.6408 1.2450
Coefficients:
Estimate Std. Error z value Pr(>|z|)
(Intercept) -0.1576 0.2127 -0.741 0.459
X141 1.6363 0.2913 5.618 1.93e-08 ***
---
Signif. codes: 0 ‘***’ 0.001 ‘**’ 0.01 ‘*’ 0.05 ‘.’ 0.1 ‘ ’ 1
(Dispersion parameter for binomial family taken to be 1)
Null deviance: 316.40 on 255 degrees of freedom
Residual deviance: 283.09 on 254 degrees of freedom
AIC: 287.09
Number of Fisher Scoring iterations: 4
> q15lm <- glm(Passed~X15,data=totunit1c,family=binomial(logit))
> summary(q15lm)
Call:
glm(formula = Passed ~ X15, family = binomial(logit), data = totunit1c)
Deviance Residuals:
Min 1Q Median 3Q Max
-1.5425 -1.5183 0.8519 0.8712 0.8712
Coefficients:
Estimate Std. Error z value Pr(>|z|)
(Intercept) 0.82668 0.17128 4.826 1.39e-06 ***
X151 -0.05349 0.27938 -0.191 0.848
--- Signif. codes: 0 ‘***’ 0.001 ‘**’ 0.01 ‘*’ 0.05 ‘.’ 0.1 ‘ ’ 1
(Dispersion parameter for binomial family taken to be 1)
Null deviance: 316.40 on 255 degrees of freedom
Residual deviance: 316.36 on 254 degrees of freedom
AIC: 320.36
Number of Fisher Scoring iterations: 4

84
> q16lm <- glm(Passed~X16,data=totunit1c,family=binomial(logit))
> summary(q16lm)
Call:
glm(formula = Passed ~ X16, family = binomial(logit), data = totunit1c)
Deviance Residuals:
Min 1Q Median 3Q Max
-1.5910 -1.5910 0.8141 0.8141 1.3370
Coefficients:
Estimate Std. Error z value Pr(>|z|)
(Intercept) -0.3677 0.4336 -0.848 0.39643
X161 1.3020 0.4573 2.847 0.00441 **
---
Signif. codes: 0 ‘***’ 0.001 ‘**’ 0.01 ‘*’ 0.05 ‘.’ 0.1 ‘ ’ 1
(Dispersion parameter for binomial family taken to be 1)
Null deviance: 316.40 on 255 degrees of freedom
Residual deviance: 308.17 on 254 degrees of freedom
AIC: 312.17
Number of Fisher Scoring iterations: 4
> q17lm <- glm(Passed~X17,data=totunit1c,family=binomial(logit))
> summary(q17lm)
Call:
glm(formula = Passed ~ X17, family = binomial(logit), data = totunit1c)
Deviance Residuals:
Min 1Q Median 3Q Max
-1.7737 -1.3145 0.6818 1.0462 1.0462
Coefficients:
Estimate Std. Error z value Pr(>|z|)
(Intercept) 0.3167 0.1841 1.720 0.085419 .
X171 1.0240 0.2810 3.644 0.000268 ***
--- Signif. codes: 0 ‘***’ 0.001 ‘**’ 0.01 ‘*’ 0.05 ‘.’ 0.1 ‘ ’ 1
(Dispersion parameter for binomial family taken to be 1)
Null deviance: 316.40 on 255 degrees of freedom
Residual deviance: 302.58 on 254 degrees of freedom
AIC: 306.58
Number of Fisher Scoring iterations: 4

85
> q18lm <- glm(Passed~X18,data=totunit1c,family=binomial(logit))
> summary(q18lm)
Call:
glm(formula = Passed ~ X18, family = binomial(logit), data = totunit1c)
Deviance Residuals:
Min 1Q Median 3Q Max
-1.6165 -0.9619 0.7946 0.7946 1.4094
Coefficients:
Estimate Std. Error z value Pr(>|z|)
(Intercept) -0.5306 0.3985 -1.331 0.183033
X181 1.5215 0.4254 3.577 0.000348 ***
---
Signif. codes: 0 ‘***’ 0.001 ‘**’ 0.01 ‘*’ 0.05 ‘.’ 0.1 ‘ ’ 1
(Dispersion parameter for binomial family taken to be 1)
Null deviance: 316.40 on 255 degrees of freedom
Residual deviance: 303.06 on 254 degrees of freedom
AIC: 307.06
Number of Fisher Scoring iterations: 4
> q19lm <- glm(Passed~X19,data=totunit1c,family=binomial(logit))
> summary(q19lm)
Call:
glm(formula = Passed ~ X19, family = binomial(logit), data = totunit1c)
Deviance Residuals:
Min 1Q Median 3Q Max
-1.633 -1.194 0.782 0.782 1.161
Coefficients:
Estimate Std. Error z value Pr(>|z|)
(Intercept) 0.03922 0.28011 0.140 0.88864
X191 0.98908 0.32187 3.073 0.00212 **
--- Signif. codes: 0 ‘***’ 0.001 ‘**’ 0.01 ‘*’ 0.05 ‘.’ 0.1 ‘ ’ 1
(Dispersion parameter for binomial family taken to be 1)
Null deviance: 316.40 on 255 degrees of freedom
Residual deviance: 307.09 on 254 degrees of freedom
AIC: 311.09
Number of Fisher Scoring iterations: 4

86
> q21lm <- glm(Passed~X21,data=totunit1c,family=binomial(logit))
> summary(q21lm)
Call:
glm(formula = Passed ~ X21, family = binomial(logit), data = totunit1c)
Deviance Residuals:
Min 1Q Median 3Q Max
-1.5856 -1.5856 0.8182 0.8182 1.2491
Coefficients:
Estimate Std. Error z value Pr(>|z|)
(Intercept) -0.1671 0.4097 -0.408 0.6834
X211 1.0894 0.4348 2.506 0.0122 *
---
Signif. codes: 0 ‘***’ 0.001 ‘**’ 0.01 ‘*’ 0.05 ‘.’ 0.1 ‘ ’ 1
(Dispersion parameter for binomial family taken to be 1)
Null deviance: 316.40 on 255 degrees of freedom
Residual deviance: 310.18 on 254 degrees of freedom
AIC: 314.18
Number of Fisher Scoring iterations: 4
> q22lm <- glm(Passed~X22,data=totunit1c,family=binomial(logit))
> summary(q22lm)
Call:
glm(formula = Passed ~ X22, family = binomial(logit), data = totunit1c)
Deviance Residuals:
Min 1Q Median 3Q Max
-1.5934 -1.5934 0.8123 0.8123 1.7552
Coefficients:
Estimate Std. Error z value Pr(>|z|)
(Intercept) -1.2993 0.6513 -1.995 0.046066 *
X221 2.2388 0.6669 3.357 0.000787 ***
--- Signif. codes: 0 ‘***’ 0.001 ‘**’ 0.01 ‘*’ 0.05 ‘.’ 0.1 ‘ ’ 1
(Dispersion parameter for binomial family taken to be 1)
Null deviance: 316.40 on 255 degrees of freedom
Residual deviance: 301.99 on 254 degrees of freedom
AIC: 305.99
Number of Fisher Scoring iterations: 4

87
> q23lm <- glm(Passed~X23,data=totunit1c,family=binomial(logit))
> summary(q23lm)
Call:
glm(formula = Passed ~ X23, family = binomial(logit), data = totunit1c)
Deviance Residuals:
Min 1Q Median 3Q Max
-1.7196 -1.0842 0.7194 0.7194 1.2735
Coefficients:
Estimate Std. Error z value Pr(>|z|)
(Intercept) -0.2231 0.2535 -0.880 0.379
X231 1.4429 0.3061 4.713 2.44e-06 ***
---
Signif. codes: 0 ‘***’ 0.001 ‘**’ 0.01 ‘*’ 0.05 ‘.’ 0.1 ‘ ’ 1
(Dispersion parameter for binomial family taken to be 1)
Null deviance: 316.40 on 255 degrees of freedom
Residual deviance: 293.77 on 254 degrees of freedom
AIC: 297.77
Number of Fisher Scoring iterations: 4
> q24lm <- glm(Passed~X24,data=totunit1c,family=binomial(logit))
> summary(q24lm)
Call:
glm(formula = Passed ~ X24, family = binomial(logit), data = totunit1c)
Deviance Residuals:
Min 1Q Median 3Q Max
-1.6179 -1.1963 0.7936 0.7936 1.1586
Coefficients:
Estimate Std. Error z value Pr(>|z|)
(Intercept) 0.04445 0.29822 0.149 0.88151
X241 0.94945 0.33611 2.825 0.00473 **
--- Signif. codes: 0 ‘***’ 0.001 ‘**’ 0.01 ‘*’ 0.05 ‘.’ 0.1 ‘ ’ 1
(Dispersion parameter for binomial family taken to be 1)
Null deviance: 316.40 on 255 degrees of freedom
Residual deviance: 308.56 on 254 degrees of freedom
AIC: 312.56
Number of Fisher Scoring iterations: 4

88
> q25lm <- glm(Passed~X25,data=totunit1c,family=binomial(logit))
> summary(q25lm)
Call:
glm(formula = Passed ~ X25, family = binomial(logit), data = totunit1c)
Deviance Residuals:
Min 1Q Median 3Q Max
-1.8484 -1.2504 0.6322 0.7507 1.1062
Coefficients:
Estimate Std. Error z value Pr(>|z|)
(Intercept) 0.1699 0.1848 0.919 0.358
X251 1.3386 0.2881 4.647 3.37e-06 ***
---
Signif. codes: 0 ‘***’ 0.001 ‘**’ 0.01 ‘*’ 0.05 ‘.’ 0.1 ‘ ’ 1
(Dispersion parameter for binomial family taken to be 1)
Null deviance: 316.40 on 255 degrees of freedom
Residual deviance: 293.32 on 254 degrees of freedom
AIC: 297.32
Number of Fisher Scoring iterations: 4
> q26lm <- glm(Passed~X26,data=totunit1c,family=binomial(logit))
> summary(q26lm)
Call:
glm(formula = Passed ~ X26, family = binomial(logit), data = totunit1c)
Deviance Residuals:
Min 1Q Median 3Q Max
-2.0332 -1.3726 0.5203 0.9940 0.9940
Coefficients:
Estimate Std. Error z value Pr(>|z|)
(Intercept) 0.4480 0.1541 2.907 0.00365 **
X261 1.4835 0.3718 3.990 6.61e-05 ***
--- Signif. codes: 0 ‘***’ 0.001 ‘**’ 0.01 ‘*’ 0.05 ‘.’ 0.1 ‘ ’ 1
(Dispersion parameter for binomial family taken to be 1)
Null deviance: 316.40 on 255 degrees of freedom
Residual deviance: 296.72 on 254 degrees of freedom
AIC: 300.72
Number of Fisher Scoring iterations: 4

89
> q27lm <- glm(Passed~X27,data=totunit1c,family=binomial(logit))
> summary(q27lm)
Call:
glm(formula = Passed ~ X27, family = binomial(logit), data = totunit1c)
Deviance Residuals:
Min 1Q Median 3Q Max
-1.6221 -1.4572 0.7904 0.9214 0.9214
Coefficients:
Estimate Std. Error z value Pr(>|z|)
(Intercept) 0.6373 0.1823 3.496 0.000473 ***
X271 0.3660 0.2732 1.340 0.180335
---
Signif. codes: 0 ‘***’ 0.001 ‘**’ 0.01 ‘*’ 0.05 ‘.’ 0.1 ‘ ’ 1
(Dispersion parameter for binomial family taken to be 1)
Null deviance: 316.40 on 255 degrees of freedom
Residual deviance: 314.59 on 254 degrees of freedom
AIC: 318.59
Number of Fisher Scoring iterations: 4
> q28lm <- glm(Passed~X28,data=totunit1c,family=binomial(logit))
> summary(q28lm)
Call:
glm(formula = Passed ~ X28, family = binomial(logit), data = totunit1c)
Deviance Residuals:
Min 1Q Median 3Q Max
-1.958 -1.192 0.564 0.564 1.163
Coefficients:
Estimate Std. Error z value Pr(>|z|)
(Intercept) 0.03334 0.18260 0.183 0.855
X281 1.72452 0.30325 5.687 1.3e-08 ***
--- Signif. codes: 0 ‘***’ 0.001 ‘**’ 0.01 ‘*’ 0.05 ‘.’ 0.1 ‘ ’ 1
(Dispersion parameter for binomial family taken to be 1)
Null deviance: 316.4 on 255 degrees of freedom
Residual deviance: 279.9 on 254 degrees of freedom
AIC: 283.9
Number of Fisher Scoring iterations: 4

90
> q29lm <- glm(Passed~X29,data=totunit1c,family=binomial(logit))
> summary(q29lm)
Call:
glm(formula = Passed ~ X29, family = binomial(logit), data = totunit1c)
Deviance Residuals:
Min 1Q Median 3Q Max
-1.6830 -1.2871 0.7455 0.7455 1.0715
Coefficients:
Estimate Std. Error z value Pr(>|z|)
(Intercept) 0.2542 0.2162 1.176 0.23953
X291 0.8842 0.2809 3.147 0.00165 **
---
Signif. codes: 0 ‘***’ 0.001 ‘**’ 0.01 ‘*’ 0.05 ‘.’ 0.1 ‘ ’ 1
(Dispersion parameter for binomial family taken to be 1)
Null deviance: 316.40 on 255 degrees of freedom
Residual deviance: 306.49 on 254 degrees of freedom
AIC: 310.49
Number of Fisher Scoring iterations: 4
> q30lm <- glm(Passed~X30,data=totunit1c,family=binomial(logit))
> summary(q30lm)
Call:
glm(formula = Passed ~ X30, family = binomial(logit), data = totunit1c)
Deviance Residuals:
Min 1Q Median 3Q Max
-1.6317 -1.4689 0.7832 0.9116 0.9116
Coefficients:
Estimate Std. Error z value Pr(>|z|)
(Intercept) 0.6633 0.1724 3.848 0.000119 ***
X301 0.3612 0.2797 1.291 0.196591
--- Signif. codes: 0 ‘***’ 0.001 ‘**’ 0.01 ‘*’ 0.05 ‘.’ 0.1 ‘ ’ 1
(Dispersion parameter for binomial family taken to be 1)
Null deviance: 316.40 on 255 degrees of freedom
Residual deviance: 314.71 on 254 degrees of freedom
AIC: 318.71
Number of Fisher Scoring iterations: 4

91
> q31lm <- glm(Passed~X31,data=totunit1c,family=binomial(logit))
> summary(q31lm)
Call:
glm(formula = Passed ~ X31, family = binomial(logit), data = totunit1c)
Deviance Residuals:
Min 1Q Median 3Q Max
-1.7747 -0.9196 0.6812 0.6812 1.4592
Coefficients:
Estimate Std. Error z value Pr(>|z|)
(Intercept) -0.6419 0.2763 -2.323 0.0202 *
X311 1.9845 0.3272 6.065 1.32e-09 ***
---
Signif. codes: 0 ‘***’ 0.001 ‘**’ 0.01 ‘*’ 0.05 ‘.’ 0.1 ‘ ’ 1
(Dispersion parameter for binomial family taken to be 1)
Null deviance: 316.40 on 255 degrees of freedom
Residual deviance: 276.71 on 254 degrees of freedom
AIC: 280.71
Number of Fisher Scoring iterations: 4
> q32lm <- glm(Passed~X32,data=totunit1c,family=binomial(logit))
> summary(q32lm)
Call:
glm(formula = Passed ~ X32, family = binomial(logit), data = totunit1c)
Deviance Residuals:
Min 1Q Median 3Q Max
-1.8026 -1.4542 0.6624 0.9238 0.9238
Coefficients:
Estimate Std. Error z value Pr(>|z|)
(Intercept) 0.6306 0.1524 4.139 3.49e-05 ***
X321 0.7747 0.3450 2.246 0.0247 *
--- Signif. codes: 0 ‘***’ 0.001 ‘**’ 0.01 ‘*’ 0.05 ‘.’ 0.1 ‘ ’ 1
(Dispersion parameter for binomial family taken to be 1)
Null deviance: 316.4 on 255 degrees of freedom
Residual deviance: 310.9 on 254 degrees of freedom
AIC: 314.9
Number of Fisher Scoring iterations: 4
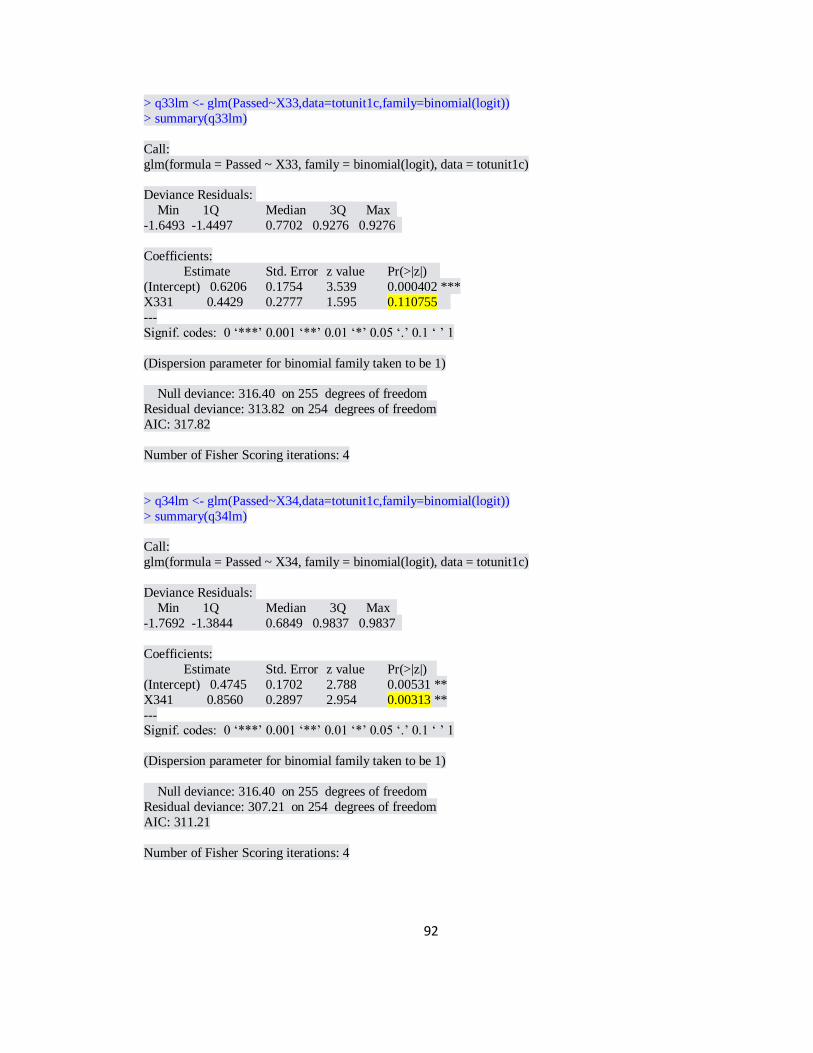
92
> q33lm <- glm(Passed~X33,data=totunit1c,family=binomial(logit))
> summary(q33lm)
Call:
glm(formula = Passed ~ X33, family = binomial(logit), data = totunit1c)
Deviance Residuals:
Min 1Q Median 3Q Max
-1.6493 -1.4497 0.7702 0.9276 0.9276
Coefficients:
Estimate Std. Error z value Pr(>|z|)
(Intercept) 0.6206 0.1754 3.539 0.000402 ***
X331 0.4429 0.2777 1.595 0.110755
---
Signif. codes: 0 ‘***’ 0.001 ‘**’ 0.01 ‘*’ 0.05 ‘.’ 0.1 ‘ ’ 1
(Dispersion parameter for binomial family taken to be 1)
Null deviance: 316.40 on 255 degrees of freedom
Residual deviance: 313.82 on 254 degrees of freedom
AIC: 317.82
Number of Fisher Scoring iterations: 4
> q34lm <- glm(Passed~X34,data=totunit1c,family=binomial(logit))
> summary(q34lm)
Call:
glm(formula = Passed ~ X34, family = binomial(logit), data = totunit1c)
Deviance Residuals:
Min 1Q Median 3Q Max
-1.7692 -1.3844 0.6849 0.9837 0.9837
Coefficients:
Estimate Std. Error z value Pr(>|z|)
(Intercept) 0.4745 0.1702 2.788 0.00531 **
X341 0.8560 0.2897 2.954 0.00313 **
--- Signif. codes: 0 ‘***’ 0.001 ‘**’ 0.01 ‘*’ 0.05 ‘.’ 0.1 ‘ ’ 1
(Dispersion parameter for binomial family taken to be 1)
Null deviance: 316.40 on 255 degrees of freedom
Residual deviance: 307.21 on 254 degrees of freedom
AIC: 311.21
Number of Fisher Scoring iterations: 4

93
General Linear Models (Residuals, AIG, and P-values)
GLM Logistics for Reduced Model
(Table 5 only)
> thesislm <- glm(Passed~X2+X13+X14+X17+X28+X31,data=totunit1c,family=binomial(logit))
> summary(thesislm)
Call:
glm(formula = Passed ~ X2 + X13 + X14 + X17 + X28 + X31, family = binomial(logit),
data = totunit1c)
Deviance Residuals:
Min 1Q Median 3Q Max -2.6672 -0.5128 0.3719 0.6061 2.4473
Coefficients:
Estimate Std. Error z value Pr(>|z|)
(Intercept) -2.9434 0.4860 -6.056 1.39e-09 ***
X21 1.4022 0.3591 3.905 9.42e-05 ***
X131 0.9731 0.3551 2.740 0.006136 **
X141 0.8914 0.3545 2.515 0.011907 *
X171 0.9222 0.3577 2.578 0.009932 **
X281 1.0045 0.3678 2.731 0.006314 **
X311 1.2779 0.3873 3.300 0.000968 ***
--- Signif. codes: 0 ‘***’ 0.001 ‘**’ 0.01 ‘*’ 0.05 ‘.’ 0.1 ‘ ’ 1
(Dispersion parameter for binomial family taken to be 1)
Null deviance: 316.40 on 255 degrees of freedom
Residual deviance: 208.74 on 249 degrees of freedom
AIC: 222.74
Number of Fisher Scoring iterations: 5
P-value for Reduced Model > pchisq(208.74,249)
[1] 0.02996081

94
GLM Logistics for Study Model without Questions 18 and 7
(Table 5 only)
> thesislm <- glm(Passed~X2+X13+X14+X17+X28+X31+X5,data=totunit1c,family=binomial(logit))
> summary(thesislm)
Call:
glm(formula = Passed ~ X2 + X13 + X14 + X17 + X28 + X31 + X5,
family = binomial(logit), data = totunit1c)
Deviance Residuals:
Min 1Q Median 3Q Max -2.7833 -0.5721 0.3134 0.5863 2.4705
Coefficients:
Estimate Std. Error z value Pr(>|z|)
(Intercept) -3.0033 0.4886 -6.147 7.89e-10 ***
X21 1.2703 0.3657 3.474 0.000513 ***
X131 0.8631 0.3620 2.385 0.017099 *
X141 0.8703 0.3574 2.435 0.014884 *
X171 0.8846 0.3619 2.444 0.014519 *
X281 0.9054 0.3728 2.429 0.015156 *
X311 1.2940 0.3918 3.303 0.000956 *** X51 0.7680 0.3941 1.948 0.051364 .
---
Signif. codes: 0 ‘***’ 0.001 ‘**’ 0.01 ‘*’ 0.05 ‘.’ 0.1 ‘ ’ 1
(Dispersion parameter for binomial family taken to be 1)
Null deviance: 316.40 on 255 degrees of freedom
Residual deviance: 204.86 on 248 degrees of freedom
AIC: 220.86
Number of Fisher Scoring iterations: 5
P-value for Study Model without Questions 18 and 7
> pchisq(204.86,248)
[1] 0.02107943

95
GLM Logistics for Score Only Model
> thesislm <- glm(Passed~Score,data=totunit1c,family=binomial(logit))
> summary(thesislm) Call:
glm(formula = Passed ~ Score, family = binomial(logit), data = totunit1c)
Deviance Residuals:
Min 1Q Median 3Q Max
-2.32725 -0.00013 0.37146 0.66805 1.73440 Coefficients: Estimate Std. Error z value Pr(>|z|)
(Intercept) -1.857e+01 6.523e+03 -0.003 0.998
Score18 -4.282e-08 9.224e+03 0.000 1.000
Score21 -4.264e-08 7.989e+03 0.000 1.000
Score24 -4.275e-08 7.989e+03 0.000 1.000
Score26 -4.236e-08 9.224e+03 0.000 1.000
Score29 -4.255e-08 7.145e+03 0.000 1.000
Score32 -4.259e-08 7.532e+03 0.000 1.000
Score35 -4.255e-08 7.989e+03 0.000 1.000
Score38 1.787e+01 6.523e+03 0.003 0.998
Score41 1.857e+01 6.523e+03 0.003 0.998
Score44 1.897e+01 6.523e+03 0.003 0.998 Score47 1.731e+01 6.523e+03 0.003 0.998
Score50 1.821e+01 6.523e+03 0.003 0.998
Score53 1.843e+01 6.523e+03 0.003 0.998
Score56 1.926e+01 6.523e+03 0.003 0.998
Score59 1.948e+01 6.523e+03 0.003 0.998
Score62 1.917e+01 6.523e+03 0.003 0.998
Score65 2.058e+01 6.523e+03 0.003 0.997
Score68 1.938e+01 6.523e+03 0.003 0.998
Score71 2.105e+01 6.523e+03 0.003 0.997
Score74 1.995e+01 6.523e+03 0.003 0.998
Score76 2.105e+01 6.523e+03 0.003 0.997 Score79 2.121e+01 6.523e+03 0.003 0.997
Score82 3.713e+01 6.684e+03 0.006 0.996
Score85 2.087e+01 6.523e+03 0.003 0.997
Score88 3.713e+01 6.973e+03 0.005 0.996
Score91 3.713e+01 6.973e+03 0.005 0.996
Score94 2.051e+01 6.523e+03 0.003 0.997
Score97 3.713e+01 7.989e+03 0.005 0.996
Null deviance: 316.40 on 255 degrees of freedom
Residual deviance: 205.41 on 227 degrees of freedom
AIC: 263.41
P-value for Score Only Model > pchisq(205.41,227)
[1] 0.1548737

96
GLM Logistics for Study Model without Question 18
> thesislm <- glm(Passed~X2+X13+X14+X17+X28+X31+X5+X7,data=totunit1c,family=binomial(logit))
> summary(thesislm)
Call:
glm(formula = Passed ~ X2 + X13 + X14 + X17 + X28 + X31 + X5 +
X7, family = binomial(logit), data = totunit1c)
Deviance Residuals:
Min 1Q Median 3Q Max
-2.8587 -0.5403 0.2833 0.5788 2.5492
Coefficients:
Estimate Std. Error z value Pr(>|z|)
(Intercept) -3.2096 0.5119 -6.270 3.62e-10 ***
X21 1.3506 0.3738 3.614 0.000302 ***
X131 0.8735 0.3656 2.389 0.016885 *
X141 0.6919 0.3732 1.854 0.063756 .
X171 0.9397 0.3673 2.558 0.010517 *
X281 0.7241 0.3889 1.862 0.062586 .
X311 1.2713 0.3945 3.223 0.001268 **
X51 0.7358 0.3995 1.842 0.065506 .
X71 0.6917 0.3824 1.809 0.070460 .
Null deviance: 316.40 on 255 degrees of freedom
Residual deviance: 201.58 on 247 degrees of freedom
AIC: 219.58
Number of Fisher Scoring iterations: 5
P-value for Study Model without questions 18
> pchisq(201.58,247)
[1] 0.0156299

97
GLM Logistics for Study Model
> thesislm <- glm(Passed~X2+X13+X14+X17+X28+X31+X5+X7+X18,data=totunit1c
,family=binomial(logit)) > summary(thesislm)
Call:
glm(formula = Passed ~ X2 + X13 + X14 + X17 + X28 + X31 + X5 +
X7 + X18, family = binomial(logit), data = totunit1c)
Deviance Residuals:
Min 1Q Median 3Q Max
-2.8624 -0.4934 0.2780 0.5554 2.4769
Coefficients:
Estimate Std. Error z value Pr(>|z|)
(Intercept) -3.8871 0.6898 -5.635 1.75e-08 ***
X21 1.3557 0.3768 3.598 0.000321 ***
X131 0.8240 0.3692 2.232 0.025609 *
X141 0.6677 0.3769 1.771 0.076522 .
X171 0.9116 0.3703 2.462 0.013819 *
X281 0.7095 0.3927 1.807 0.070817 . X311 1.2740 0.3975 3.205 0.001349 **
X51 0.6804 0.4048 1.681 0.092755 .
X71 0.6766 0.3869 1.749 0.080308 .
X181 0.8673 0.5429 1.598 0.110132
---
Signif. codes: 0 ‘***’ 0.001 ‘**’ 0.01 ‘*’ 0.05 ‘.’ 0.1 ‘ ’ 1
(Dispersion parameter for binomial family taken to be 1)
Null deviance: 316.40 on 255 degrees of freedom
Residual deviance: 198.98 on 246 degrees of freedom
AIC: 218.98
P-value for the Study Model
> pchisq(198.98,246)
[1] 0.01248981

98
GLM Logistics for Study Model with Question 25
> thesislm <- glm(Passed~X2+X13+X14+X17+X28+X31+X5+X7+X18+X25,data=totunit1c,
family=binomial(logit))
> summary(thesislm)
Call:
glm(formula = Passed ~ X2 + X13 + X14 + X17 + X28 + X31 + X5 + X7 + X18 + X25, family = binomial(logit), data = totunit1c)
Deviance Residuals:
Min 1Q Median 3Q Max
-2.9040 -0.5264 0.2657 0.5500 2.3232
Coefficients:
Estimate Std. Error z value Pr(>|z|)
(Intercept) -3.8989 0.6934 -5.623 1.87e-08 ***
X21 1.3018 0.3805 3.421 0.000624 ***
X131 0.8269 0.3705 2.232 0.025641 *
X141 0.6761 0.3801 1.779 0.075240 . X171 0.8752 0.3722 2.351 0.018703 *
X281 0.5978 0.4044 1.478 0.139293
X311 1.2466 0.3980 3.132 0.001737 **
X51 0.6219 0.4116 1.511 0.130798
X71 0.6844 0.3911 1.750 0.080108 .
X181 0.7895 0.5527 1.428 0.153198
X251 0.4804 0.3846 1.249 0.211596
Null deviance: 316.40 on 255 degrees of freedom
Residual deviance: 197.43 on 245 degrees of freedom
AIC: 219.43
Number of Fisher Scoring iterations: 5
P-value for Study Model with Question 25
> pchisq(197.43,245)
[1] 0.01143234
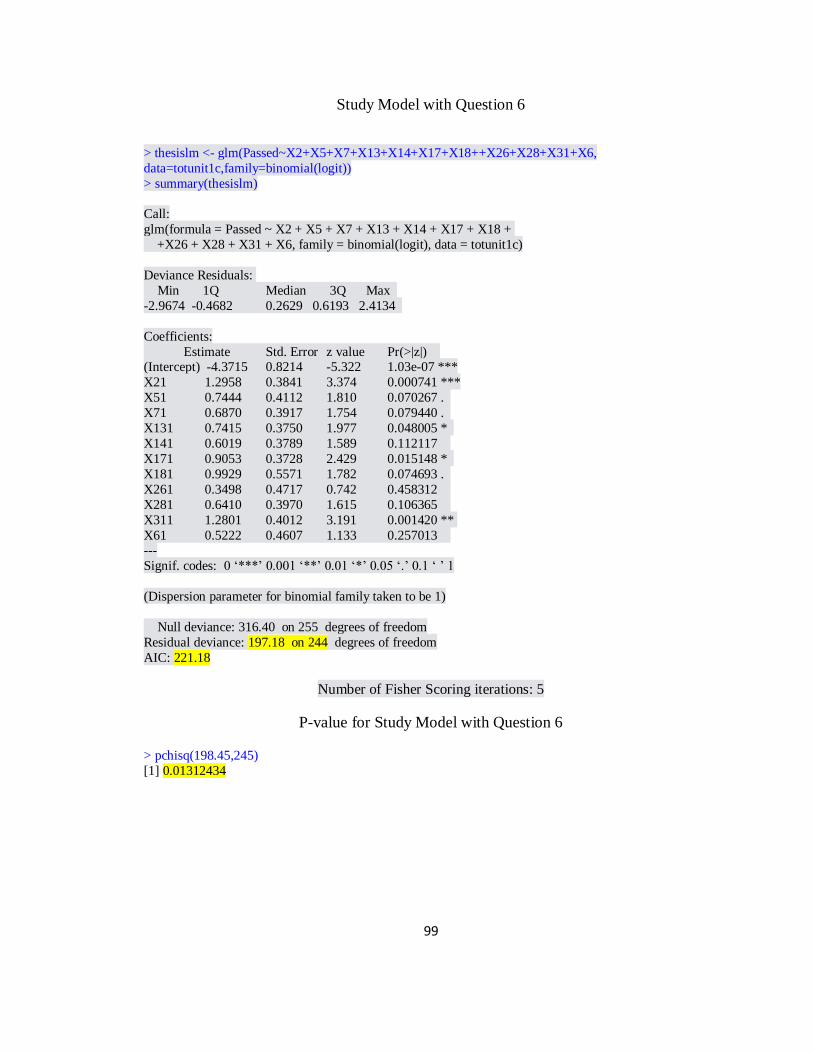
99
Study Model with Question 6
> thesislm <- glm(Passed~X2+X5+X7+X13+X14+X17+X18++X26+X28+X31+X6,
data=totunit1c,family=binomial(logit))
> summary(thesislm)
Call:
glm(formula = Passed ~ X2 + X5 + X7 + X13 + X14 + X17 + X18 +
+X26 + X28 + X31 + X6, family = binomial(logit), data = totunit1c)
Deviance Residuals:
Min 1Q Median 3Q Max
-2.9674 -0.4682 0.2629 0.6193 2.4134
Coefficients:
Estimate Std. Error z value Pr(>|z|) (Intercept) -4.3715 0.8214 -5.322 1.03e-07 ***
X21 1.2958 0.3841 3.374 0.000741 ***
X51 0.7444 0.4112 1.810 0.070267 .
X71 0.6870 0.3917 1.754 0.079440 .
X131 0.7415 0.3750 1.977 0.048005 *
X141 0.6019 0.3789 1.589 0.112117
X171 0.9053 0.3728 2.429 0.015148 *
X181 0.9929 0.5571 1.782 0.074693 .
X261 0.3498 0.4717 0.742 0.458312
X281 0.6410 0.3970 1.615 0.106365
X311 1.2801 0.4012 3.191 0.001420 **
X61 0.5222 0.4607 1.133 0.257013 ---
Signif. codes: 0 ‘***’ 0.001 ‘**’ 0.01 ‘*’ 0.05 ‘.’ 0.1 ‘ ’ 1
(Dispersion parameter for binomial family taken to be 1)
Null deviance: 316.40 on 255 degrees of freedom
Residual deviance: 197.18 on 244 degrees of freedom
AIC: 221.18
Number of Fisher Scoring iterations: 5
P-value for Study Model with Question 6
> pchisq(198.45,245)
[1] 0.01312434

100
GLM Logistics for All Model (without 4, 12, 15, and 20)
> thesislm <- glm(Passed~X1+X2+X3+X5+X6+X7+X8+X9+X10+X11+X13+X14+X16+
X17+X18+X19+X21+X22+X23+X24+X25+X26+X27+X28+X29+X30+X31+X32+X33+
X34,data=totunit1c,family=binomial(logit))
> summary(thesislm)
Call:
glm(formula = Passed ~ X1 + X2 + X3 + X5 + X6 + X7 + X8 + X9 +
X10 + X11 + X13 + X14 + X16 + X17 + X18 + X19 + X21 + X22 +
X23 + X24 + X25 + X26 + X27 + X28 + X29 + X30 + X31 + X32 +
X33 + X34, family = binomial(logit), data = totunit1c)
Deviance Residuals:
Min 1Q Median 3Q Max
-3.1445 -0.3830 0.2126 0.5644 2.1430
Coefficients:
Estimate Std. Error z value Pr(>|z|)
(Intercept) -6.19517 1.50810 -4.108 3.99e-05 ***
X11 0.33691 0.51553 0.654 0.51343
X21 1.36876 0.45553 3.005 0.00266 **
X31 -0.66586 0.46787 -1.423 0.15469
X51 0.77830 0.45978 1.693 0.09050 .
X61 0.53330 0.51288 1.040 0.29842
X71 0.81595 0.43164 1.890 0.05871 .
X81 0.41816 0.45407 0.921 0.35710
X91 -0.44505 0.46578 -0.955 0.33933
X101 0.53407 0.52842 1.011 0.31216 X111 0.39487 0.72159 0.547 0.58423
X131 0.73939 0.41725 1.772 0.07638 .
X141 0.53074 0.43271 1.227 0.21999
X161 -0.26947 0.70497 -0.382 0.70228
X171 0.99605 0.41306 2.411 0.01589 *
X181 0.92953 0.63650 1.460 0.14419
X191 -0.16957 0.50644 -0.335 0.73775
X211 0.49989 0.67029 0.746 0 .45580
X221 0.83416 0.92232 0.904 0.36577
X231 -0.01251 0.49730 -0.025 0.97993
X241 0.41606 0.53550 0.777 0.43719 X251 0.65679 0.44154 1.488 0.13688
X261 0.32520 0.52733 0.617 0.53744
X271 -0.62367 0.43928 -1.420 0.15568
X281 0.61859 0.45549 1.358 0.17444
X291 0.31114 0.44030 0.707 0.47978
X301 -0.36460 0.42700 -0.854 0.39318
X311 1.46355 0.49931 2.931 0.00338 **
X321 0.27667 0.50917 0.543 0.58686
X331 -0.37208 0.42063 -0.885 0.37638
X341 -0.16839 0.44725 -0.377 0.70654
---
Signif. codes: 0 ‘***’ 0.001 ‘**’ 0.01 ‘*’ 0.05 ‘.’ 0.1 ‘ ’ 1

101
(Dispersion parameter for binomial family taken to be 1)
Null deviance: 316.40 on 255 degrees of freedom
Residual deviance: 183.74 on 225 degrees of freedom
AIC: 245.74
P-value for All Model
> pchisq(183.74,225)
[1] 0.02035031

102
SAS Output - ROC Curves
Sample of Complete SAS program Utilized for ROC Curves
proc logistic data=WORK.TH desc; model Passed = Score
/ outroc=roc1;
run;
data roc2;
set roc1;
spec = 1-_1mspec_;
run;
symbol1 i=join v=none ;
proc gplot data=roc2;
plot _sensit_*_PROB_=1 spec*_PROB_=1 / overlay haxis=0 to 1 by .25 vaxis=0 to 1 by .1 ;
run;
quit;
ROC Curve for Score Only Model – Year 1
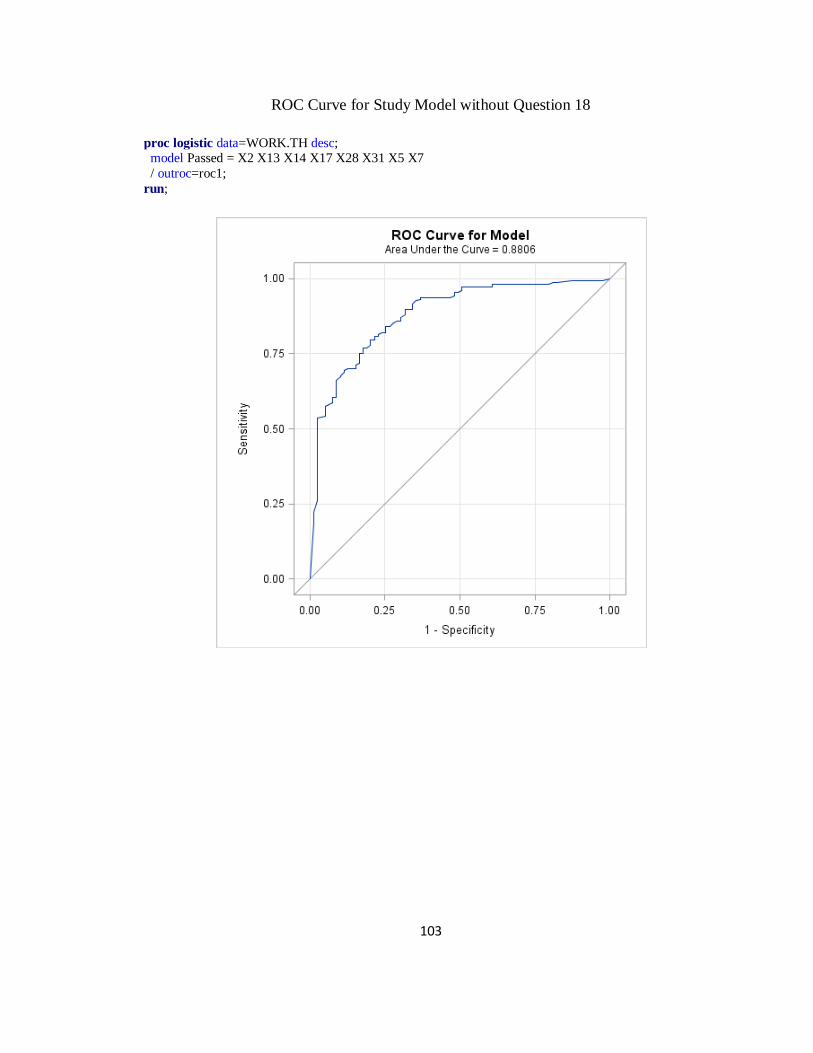
103
ROC Curve for Study Model without Question 18
proc logistic data=WORK.TH desc; model Passed = X2 X13 X14 X17 X28 X31 X5 X7
/ outroc=roc1;
run;

104
ROC Curve for the Study Model
proc logistic data=WORK.TH desc;
model Passed = X2 X13 X14 X17 X28 X31 X5 X7 X18
/ outroc=roc1;
run;

105
ROC Curve for Study Model with Question 25
proc logistic data=WORK.TH desc;
model Passed = X2 X13 X14 X17 X28 X31 X5 X7 X18 X25
/ outroc=roc1;
run;

106
ROC Curve for Study Model with Question 6
proc logistic data=WORK.TH desc;
model Passed = X2 X13 X14 X17 X28 X31 X5 X7 X18 X6
/ outroc=roc1;
run;

107
ROC Curve for All Questions Model –Year 1
proc logistic data=WORK.TH desc;
model Passed = X1 X2 X3 X5 X6 X7 X8 X9 X10 X11 X12 X13 X14 X16 X17 X18 X19 X21 X22 X23
X24 X25 X26 X27 X28 X29 X30 X31 X32 X33 X34
/ outroc=roc1; run;

108
Classification Tables for Predictions
Classification Table for Score Only Model
proc logistic data=WORK.TH desc; model Passed = Score
/ ctable pprob = (.67 to .85 by .01);
run;
Classification Table
Prob
Level
Correct Incorrect Percentages
Event Non-
Event
Event Non-
Event
Correct Sensi-
tivity
Speci-
ficity
False
POS
False
NEG
0.670 134 60 19 43 75.8 75.7 75.9 12.4 41.7
0.680 134 60 19 43 75.8 75.7 75.9 12.4 41.7
0.690 134 60 19 43 75.8 75.7 75.9 12.4 41.7
0.700 134 60 19 43 75.8 75.7 75.9 12.4 41.7
0.710 134 60 19 43 75.8 75.7 75.9 12.4 41.7
0.720 134 60 19 43 75.8 75.7 75.9 12.4 41.7
0.730 123 66 13 54 73.8 69.5 83.5 9.6 45.0
0.740 123 66 13 54 73.8 69.5 83.5 9.6 45.0
0.750 123 66 13 54 73.8 69.5 83.5 9.6 45.0
0.760 123 66 13 54 73.8 69.5 83.5 9.6 45.0
0.770 123 66 13 54 73.8 69.5 83.5 9.6 45.0
0.780 108 68 11 69 68.8 61.0 86.1 9.2 50.4
0.790 108 68 11 69 68.8 61.0 86.1 9.2 50.4
0.800 108 68 11 69 68.8 61.0 86.1 9.2 50.4
0.810 108 68 11 69 68.8 61.0 86.1 9.2 50.4
0.820 99 68 11 78 65.2 55.9 86.1 10.0 53.4
0.830 99 72 7 78 66.8 55.9 91.1 6.6 52.0
0.840 99 72 7 78 66.8 55.9 91.1 6.6 52.0
0.850 99 72 7 78 66.8 55.9 91.1 6.6 52.0

109
Classification Table for Study Model without Question 18
proc logistic data=WORK.TH desc;
model Passed = X2 X13 X14 X17 X28 X31 X5 X7
/ ctable pprob = (.67 to .85 by .01);
run;
Classification Table
Prob
Level
Correct Incorrect Percentages
Event Non-
Event
Event Non-
Event
Correct Sensi-
tivity
Speci-
ficity
False
POS
False
NEG
0.670 143 59 20 34 78.9 80.8 74.7 12.3 36.6
0.680 141 60 19 36 78.5 79.7 75.9 11.9 37.5
0.690 141 61 18 36 78.9 79.7 77.2 11.3 37.1
0.700 141 61 18 36 78.9 79.7 77.2 11.3 37.1
0.710 140 61 18 37 78.5 79.1 77.2 11.4 37.8
0.720 136 61 18 41 77.0 76.8 77.2 11.7 40.2
0.730 133 62 17 44 76.2 75.1 78.5 11.3 41.5
0.740 132 62 17 45 75.8 74.6 78.5 11.4 42.1
0.750 130 62 17 47 75.0 73.4 78.5 11.6 43.1
0.760 130 62 17 47 75.0 73.4 78.5 11.6 43.1
0.770 127 63 16 50 74.2 71.8 79.7 11.2 44.2
0.780 124 65 14 53 73.8 70.1 82.3 10.1 44.9
0.790 123 65 14 54 73.4 69.5 82.3 10.2 45.4
0.800 122 66 13 55 73.4 68.9 83.5 9.6 45.5
0.810 122 66 13 55 73.4 68.9 83.5 9.6 45.5
0.820 119 66 13 58 72.3 67.2 83.5 9.8 46.8
0.830 119 67 12 58 72.7 67.2 84.8 9.2 46.4
0.840 112 69 10 65 70.7 63.3 87.3 8.2 48.5
0.850 103 70 9 74 67.6 58.2 88.6 8.0 51.4

110
Classification Table for Study Model
proc logistic data=WORK.TH desc;
model Passed = X2 X13 X14 X17 X28 X31 X5 X7 X18
/ ctable pprob = (.67 to .85 by .01);
run;
Classification Table
Prob
Level
Correct Incorrect Percentages
Event Non-
Event
Event Non-
Event
Correct Sensi-
tivity
Speci-
ficity
False
POS
False
NEG
0.670 142 60 19 35 78.9 80.2 75.9 11.8 36.8
0.680 142 60 19 35 78.9 80.2 75.9 11.8 36.8
0.690 142 61 18 35 79.3 80.2 77.2 11.3 36.5
0.700 141 62 17 36 79.3 79.7 78.5 10.8 36.7
0.710 139 63 16 38 78.9 78.5 79.7 10.3 37.6
0.720 139 63 16 38 78.9 78.5 79.7 10.3 37.6
0.730 139 63 16 38 78.9 78.5 79.7 10.3 37.6
0.740 135 63 16 42 77.3 76.3 79.7 10.6 40.0
0.750 132 63 16 45 76.2 74.6 79.7 10.8 41.7
0.760 128 65 14 49 75.4 72.3 82.3 9.9 43.0
0.770 128 65 14 49 75.4 72.3 82.3 9.9 43.0
0.780 128 65 14 49 75.4 72.3 82.3 9.9 43.0
0.790 122 65 14 55 73.0 68.9 82.3 10.3 45.8
0.800 120 67 12 57 73.0 67.8 84.8 9.1 46.0
0.810 120 67 12 57 73.0 67.8 84.8 9.1 46.0
0.820 120 68 11 57 73.4 67.8 86.1 8.4 45.6
0.830 120 68 11 57 73.4 67.8 86.1 8.4 45.6
0.840 116 68 11 61 71.9 65.5 86.1 8.7 47.3
0.850 113 70 9 64 71.5 63.8 88.6 7.4 47.8

111
Classification Table for Study Model with Question 25
proc logistic data=WORK.TH desc;
model Passed = X2 X13 X14 X17 X28 X31 X5 X7 X18 X25
/ ctable pprob = (.67 to .85 by .01);
run;
Classification Table
Prob
Level
Correct Incorrect Percentages
Event Non-
Event
Event Non-
Event
Correct Sensi-
tivity
Speci-
ficity
False
POS
False
NEG
0.670 144 60 19 33 79.7 81.4 75.9 11.7 35.5
0.680 142 61 18 35 79.3 80.2 77.2 11.3 36.5
0.690 142 61 18 35 79.3 80.2 77.2 11.3 36.5
0.700 142 61 18 35 79.3 80.2 77.2 11.3 36.5
0.710 137 61 18 40 77.3 77.4 77.2 11.6 39.6
0.720 135 63 16 42 77.3 76.3 79.7 10.6 40.0
0.730 134 63 16 43 77.0 75.7 79.7 10.7 40.6
0.740 133 64 15 44 77.0 75.1 81.0 10.1 40.7
0.750 132 64 15 45 76.6 74.6 81.0 10.2 41.3
0.760 129 65 14 48 75.8 72.9 82.3 9.8 42.5
0.770 129 65 14 48 75.8 72.9 82.3 9.8 42.5
0.780 129 66 13 48 76.2 72.9 83.5 9.2 42.1
0.790 126 66 13 51 75.0 71.2 83.5 9.4 43.6
0.800 124 66 13 53 74.2 70.1 83.5 9.5 44.5
0.810 124 66 13 53 74.2 70.1 83.5 9.5 44.5
0.820 122 66 13 55 73.4 68.9 83.5 9.6 45.5
0.830 115 68 11 62 71.5 65.0 86.1 8.7 47.7
0.840 114 68 11 63 71.1 64.4 86.1 8.8 48.1
0.850 114 68 11 63 71.1 64.4 86.1 8.8 48.1

112
Study Model with Question 6
proc logistic data=WORK.TH desc;
model Passed = X2 X13 X14 X17 X28 X31 X5 X7 X18 X6
/ ctable pprob = (.67 to .85 by .01);
run;
Classification Table
Prob
Level
Correct Incorrect Percentages
Event Non-
Event
Event Non-
Event
Correct Sensi-
tivity
Speci-
ficity
False
POS
False
NEG
0.650 143 58 21 34 78.5 80.8 73.4 12.8 37.0
0.660 142 58 21 35 78.1 80.2 73.4 12.9 37.6
0.670 141 61 18 36 78.9 79.7 77.2 11.3 37.1
0.680 140 61 18 37 78.5 79.1 77.2 11.4 37.8
0.690 140 61 18 37 78.5 79.1 77.2 11.4 37.8
0.700 139 62 17 38 78.5 78.5 78.5 10.9 38.0
0.710 138 63 16 39 78.5 78.0 79.7 10.4 38.2
0.720 138 63 16 39 78.5 78.0 79.7 10.4 38.2
0.730 138 63 16 39 78.5 78.0 79.7 10.4 38.2
0.740 135 64 15 42 77.7 76.3 81.0 10.0 39.6
0.750 133 65 14 44 77.3 75.1 82.3 9.5 40.4
0.760 130 65 14 47 76.2 73.4 82.3 9.7 42.0
0.770 127 66 13 50 75.4 71.8 83.5 9.3 43.1
0.780 125 66 13 52 74.6 70.6 83.5 9.4 44.1
0.790 123 67 12 54 74.2 69.5 84.8 8.9 44.6
0.800 118 68 11 59 72.7 66.7 86.1 8.5 46.5
0.810 113 68 11 64 70.7 63.8 86.1 8.9 48.5
0.820 112 68 11 65 70.3 63.3 86.1 8.9 48.9
0.830 111 68 11 66 69.9 62.7 86.1 9.0 49.3
0.840 111 68 11 66 69.9 62.7 86.1 9.0 49.3
0.850 110 68 11 67 69.5 62.1 86.1 9.1 49.6
0.860 106 70 9 71 68.8 59.9 88.6 7.8 50.4
0.870 102 70 9 75 67.2 57.6 88.6 8.1 51.7
0.880 99 70 9 78 66.0 55.9 88.6 8.3 52.7

113
Classification Table for All Model Year 1
proc logistic data=WORK.TH desc;
model Passed = X1 X2 X3 X5 X6 X7 X8 X9 X10 X11 X12 X13 X14 X16 X17 X18 X19 X21 X22 X23
X24 X25 X26 X27 X28 X29 X30 X31 X32 X33 X34
/ ctable pprob = (.74 to .90 by .01); run;
Classification Table
Prob
Level
Correct Incorrect Percentages
Event Non-
Event
Event Non-
Event
Correct Sensi-
tivity
Speci-
ficity
False
POS
False
NEG
0.740 133 59 20 44 75.0 75.1 74.7 13.1 42.7
0.750 130 60 19 47 74.2 73.4 75.9 12.8 43.9
0.760 129 61 18 48 74.2 72.9 77.2 12.2 44.0
0.770 124 61 18 53 72.3 70.1 77.2 12.7 46.5
0.780 121 61 18 56 71.1 68.4 77.2 12.9 47.9
0.790 120 62 17 57 71.1 67.8 78.5 12.4 47.9
0.800 118 63 16 59 70.7 66.7 79.7 11.9 48.4
0.810 117 63 16 60 70.3 66.1 79.7 12.0 48.8
0.820 115 64 15 62 69.9 65.0 81.0 11.5 49.2
0.830 115 64 15 62 69.9 65.0 81.0 11.5 49.2
0.840 113 65 14 64 69.5 63.8 82.3 11.0 49.6
0.850 107 66 13 70 67.6 60.5 83.5 10.8 51.5
0.860 106 68 11 71 68.0 59.9 86.1 9.4 51.1
0.870 103 68 11 74 66.8 58.2 86.1 9.6 52.1
0.880 103 70 9 74 67.6 58.2 88.6 8.0 51.4
0.890 99 70 9 78 66.0 55.9 88.6 8.3 52.7
0.900 97 70 9 80 65.2 54.8 88.6 8.5 53.3

114
R Squared Tests
Example of Partial SAS Program Used to Find R Squared Values
proc logistic data=WORK.TH; model Passed(desc) = Score;
output out=a xbeta=xb;
data b;
set a;
za=xb**2*(xb>=0);
zb=xb**2*(xb<0);
num=1;
proc logistic data=b;
model Passed(desc) = Score;
test za=0,zb=0;
run;
(Using macro goflogit Procedure in SAS)
Score Only Model
TEST Value p-Value
Results from the Goodness-of-Fit Tests Standard Pearson Test 270.499 0.228
Standard Deviance 224.982 0.905
Osius-Test 0.644 0.260
McCullagh-Test 0.687 0.246
Farrington-Test 0.000 1.000
IM-Test 0.416 0.812
RSS-Test 36.407 0.964
For Study Model without Question 18
TEST Value p-Value
Results from the Goodness-of-Fit Tests Standard Pearson Test 278.332 0.083
Standard Deviance 201.579 0.984
Osius-Test 0.709 0.239
McCullagh-Test 0.634 0.263
Farrington-Test 0.000 1.000
IM-Test 3.623 0.934
RSS-Test 31.671 0.668
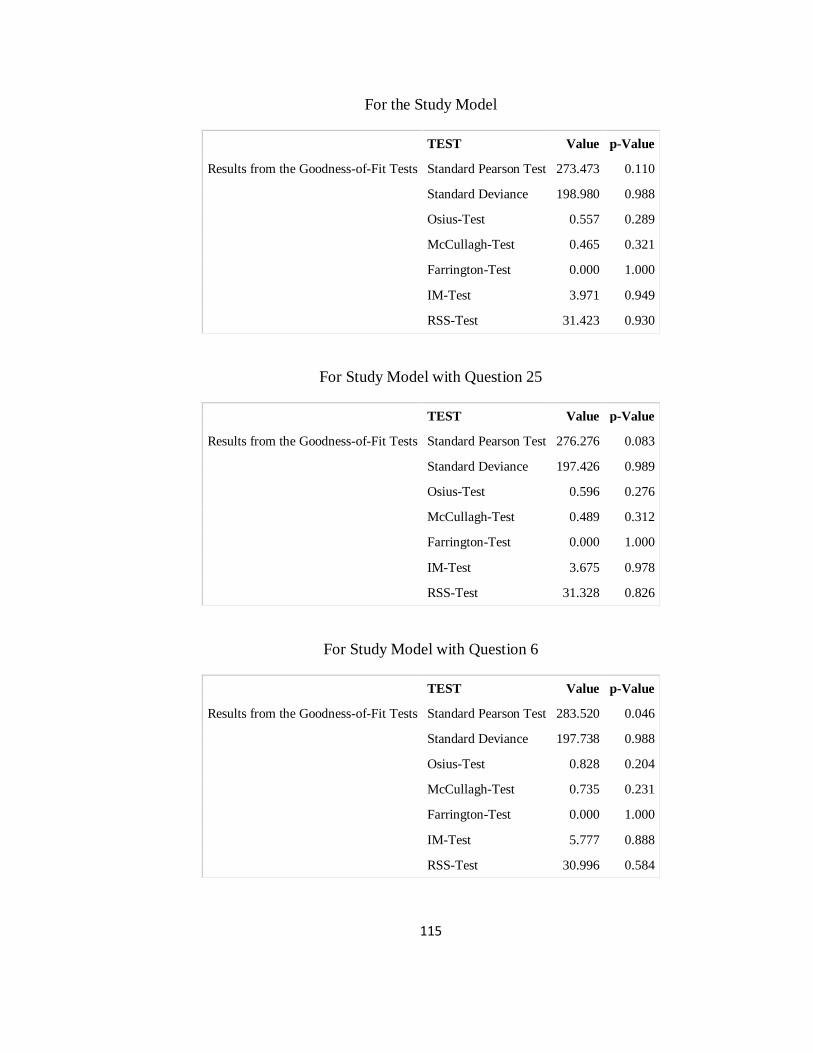
115
For the Study Model
TEST Value p-Value
Results from the Goodness-of-Fit Tests Standard Pearson Test 273.473 0.110
Standard Deviance 198.980 0.988
Osius-Test 0.557 0.289
McCullagh-Test 0.465 0.321
Farrington-Test 0.000 1.000
IM-Test 3.971 0.949
RSS-Test 31.423 0.930
For Study Model with Question 25
TEST Value p-Value
Results from the Goodness-of-Fit Tests Standard Pearson Test 276.276 0.083
Standard Deviance 197.426 0.989
Osius-Test 0.596 0.276
McCullagh-Test 0.489 0.312
Farrington-Test 0.000 1.000
IM-Test 3.675 0.978
RSS-Test 31.328 0.826
For Study Model with Question 6
TEST Value p-Value
Results from the Goodness-of-Fit Tests Standard Pearson Test 283.520 0.046
Standard Deviance 197.738 0.988
Osius-Test 0.828 0.204
McCullagh-Test 0.735 0.231
Farrington-Test 0.000 1.000
IM-Test 5.777 0.888
RSS-Test 30.996 0.584

116
APPENDIX 4
CHAPTER 7 DATA
Score Only Model
Year 2
proc logistic data=WORK.THESIS desc;
model passed = score
/ ctable pprob = (.75 to .90 by .01);
run;
Classification Table
Prob
Level
Correct Incorrect Percentages
Event Non-
Event
Event Non-
Event
Correct Sensi-
tivity
Speci-
ficity
False
POS
False
NEG
0.750 82 33 6 22 80.4 78.8 84.6 6.8 40.0
0.760 82 33 6 22 80.4 78.8 84.6 6.8 40.0
0.770 77 33 6 27 76.9 74.0 84.6 7.2 45.0
0.780 77 34 5 27 77.6 74.0 87.2 6.1 44.3
0.790 77 34 5 27 77.6 74.0 87.2 6.1 44.3
0.800 77 34 5 27 77.6 74.0 87.2 6.1 44.3
0.810 77 34 5 27 77.6 74.0 87.2 6.1 44.3
0.820 77 34 5 27 77.6 74.0 87.2 6.1 44.3
0.830 68 34 5 36 71.3 65.4 87.2 6.8 51.4
0.840 68 35 4 36 72.0 65.4 89.7 5.6 50.7
0.850 68 35 4 36 72.0 65.4 89.7 5.6 50.7
0.860 60 35 4 44 66.4 57.7 89.7 6.3 55.7
0.870 60 36 3 44 67.1 57.7 92.3 4.8 55.0
0.880 60 36 3 44 67.1 57.7 92.3 4.8 55.0
0.890 60 36 3 44 67.1 57.7 92.3 4.8 55.0
0.900 48 36 3 56 58.7 46.2 92.3 5.9 60.9

117
Study Model
Year 2
proc logistic data=WORK.THESIS desc;
model passed = q2 q13 q14 q17 q28 q31 q5 q7 q18
/ ctable pprob = (.75 to .90 by .01);
run;
Classification Table
Prob
Level
Correct Incorrect Percentages
Event Non-
Event
Event Non-
Event
Correct Sensi-
tivity
Speci-
ficity
False
POS
False
NEG
0.750 76 27 12 27 72.5 73.8 69.2 13.6 50.0
0.760 75 27 12 28 71.8 72.8 69.2 13.8 50.9
0.770 75 27 12 28 71.8 72.8 69.2 13.8 50.9
0.780 74 27 12 29 71.1 71.8 69.2 14.0 51.8
0.790 74 28 11 29 71.8 71.8 71.8 12.9 50.9
0.800 71 28 11 32 69.7 68.9 71.8 13.4 53.3
0.810 71 28 11 32 69.7 68.9 71.8 13.4 53.3
0.820 70 30 9 33 70.4 68.0 76.9 11.4 52.4
0.830 68 30 9 35 69.0 66.0 76.9 11.7 53.8
0.840 67 31 8 36 69.0 65.0 79.5 10.7 53.7
0.850 62 31 8 41 65.5 60.2 79.5 11.4 56.9
0.860 60 31 8 43 64.1 58.3 79.5 11.8 58.1
0.870 60 31 8 43 64.1 58.3 79.5 11.8 58.1
0.880 51 33 6 52 59.2 49.5 84.6 10.5 61.2
0.890 49 33 6 54 57.7 47.6 84.6 10.9 62.1
0.900 45 36 3 58 57.0 43.7 92.3 6.3 61.7

118
Cohort 2 Data
Univariate testing for the second cohort group
> thesislm <- glm(passed~q1,data=testdata,family=binomial(logit))
> summary(thesislm)
Call: glm(formula = passed ~ q1, family = binomial(logit), data = testdata)
Deviance Residuals:
Min 1Q Median 3Q Max
-1.7277 -0.8203 0.7136 0.7136 1.5829
Coefficients:
Estimate Std. Error z value Pr(>|z|)
(Intercept) -0.9163 0.5916 -1.549 0.121426
q11 2.1542 0.6281 3.430 0.000604 ***
--- Signif. codes: 0 ‘***’ 0.001 ‘**’ 0.01 ‘*’ 0.05 ‘.’ 0.1 ‘ ’ 1
(Dispersion parameter for binomial family taken to be 1)
Null deviance: 167.58 on 142 degrees of freedom
Residual deviance: 154.25 on 141 degrees of freedom
AIC: 158.25
Number of Fisher Scoring iterations: 4
> thesislm <- glm(passed~q2,data=testdata,family=binomial(logit))
> summary(thesislm)
Call:
glm(formula = passed ~ q2, family = binomial(logit), data = testdata)
Deviance Residuals:
Min 1Q Median 3Q Max
-1.8170 -1.2557 0.6528 0.6528 1.1010
Coefficients:
Estimate Std. Error z value Pr(>|z|)
(Intercept) 0.1823 0.3028 0.602 0.54705
q21 1.2553 0.3960 3.170 0.00152 ** ---
Signif. codes: 0 ‘***’ 0.001 ‘**’ 0.01 ‘*’ 0.05 ‘.’ 0.1 ‘ ’ 1
(Dispersion parameter for binomial family taken to be 1)
Null deviance: 167.58 on 142 degrees of freedom
Residual deviance: 157.45 on 141 degrees of freedom
AIC: 161.45

119
> thesislm <- glm(passed~q3,data=testdata,family=binomial(logit))
> summary(thesislm)
Call:
glm(formula = passed ~ q3, family = binomial(logit), data = testdata)
Deviance Residuals:
Min 1Q Median 3Q Max
-1.7610 -1.3370 0.6905 0.6905 1.0258
Coefficients:
Estimate Std. Error z value Pr(>|z|)
(Intercept) 0.3677 0.3066 1.199 0.2304 q31 0.9445 0.3930 2.403 0.0163 *
---
Signif. codes: 0 ‘***’ 0.001 ‘**’ 0.01 ‘*’ 0.05 ‘.’ 0.1 ‘ ’ 1
(Dispersion parameter for binomial family taken to be 1)
Null deviance: 167.58 on 142 degrees of freedom
Residual deviance: 161.85 on 141 degrees of freedom
AIC: 165.85
Number of Fisher Scoring iterations: 4
> thesislm <- glm(passed~q5,data=testdata,family=binomial(logit))
> summary(thesislm)
Call:
glm(formula = passed ~ q5, family = binomial(logit), data = testdata)
Deviance Residuals: Min 1Q Median 3Q Max
-1.6894 -1.5330 0.7409 0.8595 0.8595
Coefficients:
Estimate Std. Error z value Pr(>|z|)
(Intercept) 0.8056 0.2625 3.069 0.00215 **
q51 0.3471 0.3768 0.921 0.35705
---
Signif. codes: 0 ‘***’ 0.001 ‘**’ 0.01 ‘*’ 0.05 ‘.’ 0.1 ‘ ’ 1
(Dispersion parameter for binomial family taken to be 1)
Null deviance: 167.58 on 142 degrees of freedom
Residual deviance: 166.73 on 141 degrees of freedom
AIC: 170.73
Number of Fisher Scoring iterations: 4
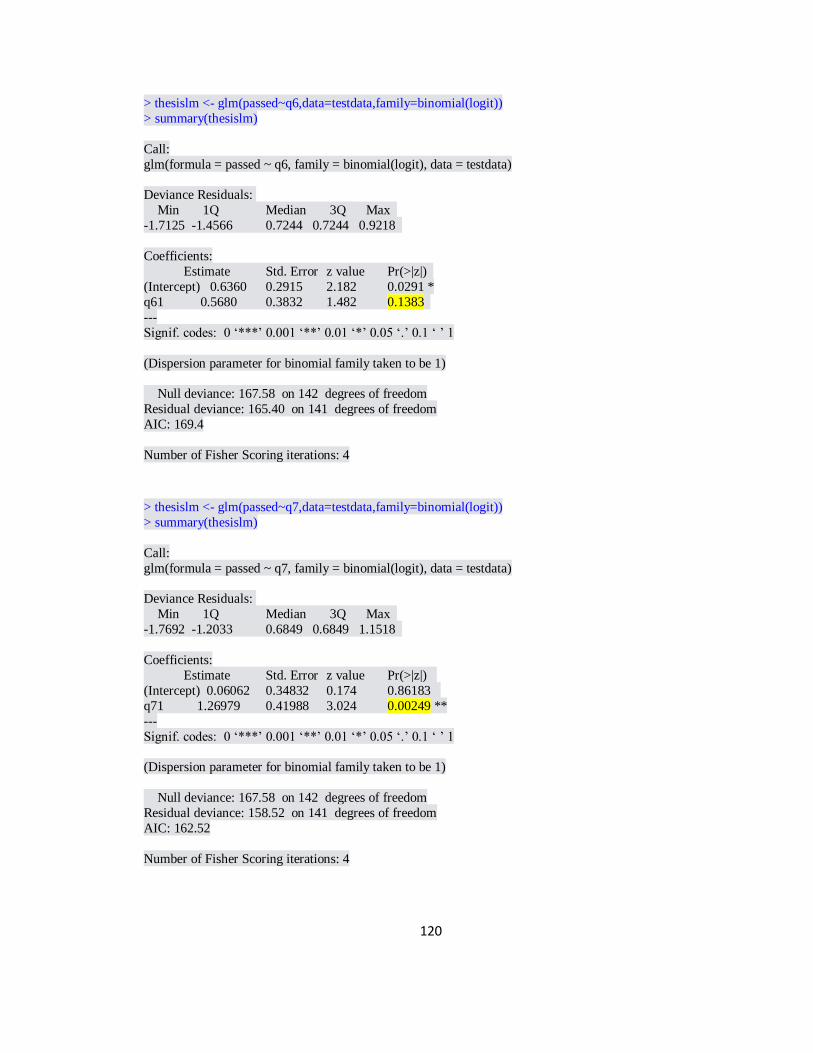
120
> thesislm <- glm(passed~q6,data=testdata,family=binomial(logit))
> summary(thesislm)
Call:
glm(formula = passed ~ q6, family = binomial(logit), data = testdata)
Deviance Residuals:
Min 1Q Median 3Q Max
-1.7125 -1.4566 0.7244 0.7244 0.9218
Coefficients:
Estimate Std. Error z value Pr(>|z|)
(Intercept) 0.6360 0.2915 2.182 0.0291 *
q61 0.5680 0.3832 1.482 0.1383
---
Signif. codes: 0 ‘***’ 0.001 ‘**’ 0.01 ‘*’ 0.05 ‘.’ 0.1 ‘ ’ 1
(Dispersion parameter for binomial family taken to be 1)
Null deviance: 167.58 on 142 degrees of freedom
Residual deviance: 165.40 on 141 degrees of freedom
AIC: 169.4
Number of Fisher Scoring iterations: 4
> thesislm <- glm(passed~q7,data=testdata,family=binomial(logit))
> summary(thesislm)
Call:
glm(formula = passed ~ q7, family = binomial(logit), data = testdata)
Deviance Residuals:
Min 1Q Median 3Q Max
-1.7692 -1.2033 0.6849 0.6849 1.1518
Coefficients:
Estimate Std. Error z value Pr(>|z|)
(Intercept) 0.06062 0.34832 0.174 0.86183
q71 1.26979 0.41988 3.024 0.00249 **
---
Signif. codes: 0 ‘***’ 0.001 ‘**’ 0.01 ‘*’ 0.05 ‘.’ 0.1 ‘ ’ 1
(Dispersion parameter for binomial family taken to be 1)
Null deviance: 167.58 on 142 degrees of freedom
Residual deviance: 158.52 on 141 degrees of freedom
AIC: 162.52
Number of Fisher Scoring iterations: 4

121
> thesislm <- glm(passed~q8,data=testdata,family=binomial(logit))
> summary(thesislm)
Call:
glm(formula = passed ~ q8, family = binomial(logit), data = testdata)
Deviance Residuals:
Min 1Q Median 3Q Max
-1.9886 -1.3824 0.5460 0.9854 0.9854
Coefficients:
Estimate Std. Error z value Pr(>|z|)
(Intercept) 0.4700 0.2327 2.019 0.04344 *
q81 1.3581 0.4279 3.174 0.00151 **
---
Signif. codes: 0 ‘***’ 0.001 ‘**’ 0.01 ‘*’ 0.05 ‘.’ 0.1 ‘ ’ 1
(Dispersion parameter for binomial family taken to be 1)
Null deviance: 167.58 on 142 degrees of freedom
Residual deviance: 156.22 on 141 degrees of freedom
AIC: 160.22
Number of Fisher Scoring iterations: 4
> thesislm <- glm(passed~q9,data=testdata,family=binomial(logit))
> summary(thesislm)
Call:
glm(formula = passed ~ q9, family = binomial(logit), data = testdata)
Deviance Residuals:
Min 1Q Median 3Q Max
-1.837 -1.105 0.640 0.640 1.251
Coefficients:
Estimate Std. Error z value Pr(>|z|)
(Intercept) -0.1719 0.3393 -0.506 0.613
q91 1.6535 0.4201 3.936 8.29e-05 ***
---
Signif. codes: 0 ‘***’ 0.001 ‘**’ 0.01 ‘*’ 0.05 ‘.’ 0.1 ‘ ’ 1
(Dispersion parameter for binomial family taken to be 1)
Null deviance: 167.58 on 142 degrees of freedom
Residual deviance: 151.76 on 141 degrees of freedom
AIC: 155.76
Number of Fisher Scoring iterations: 4

122
> thesislm <- glm(passed~q10,data=testdata,family=binomial(logit))
> summary(thesislm)
Call:
glm(formula = passed ~ q10, family = binomial(logit), data = testdata)
Deviance Residuals:
Min 1Q Median 3Q Max
-1.6459 -1.4132 0.7726 0.7726 0.9587
Coefficients:
Estimate Std. Error z value Pr(>|z|)
(Intercept) 0.5390 0.4756 1.133 0.257
q101 0.5171 0.5180 0.998 0.318
(Dispersion parameter for binomial family taken to be 1)
Null deviance: 167.58 on 142 degrees of freedom Residual deviance: 166.62 on 141 degrees of freedom
AIC: 170.62
Number of Fisher Scoring iterations: 4
> thesislm <- glm(passed~q11,data=testdata,family=binomial(logit))
> summary(thesislm)
Call:
glm(formula = passed ~ q11, family = binomial(logit), data = testdata)
Deviance Residuals: Min 1Q Median 3Q Max
-1.6924 -0.7090 0.7387 0.7387 1.7344
Coefficients:
Estimate Std. Error z value Pr(>|z|)
(Intercept) -1.2528 0.8018 -1.562 0.11818
q111 2.4120 0.8270 2.917 0.00354 **
---
Signif. codes: 0 ‘***’ 0.001 ‘**’ 0.01 ‘*’ 0.05 ‘.’ 0.1 ‘ ’ 1
(Dispersion parameter for binomial family taken to be 1)
Null deviance: 167.58 on 142 degrees of freedom
Residual deviance: 156.85 on 141 degrees of freedom
AIC: 160.85
Number of Fisher Scoring iterations: 4

123
> thesislm <- glm(passed~q12,data=testdata,family=binomial(logit))
> summary(thesislm)
Call:
glm(formula = passed ~ q12, family = binomial(logit), data = testdata)
Deviance Residuals:
Min 1Q Median 3Q Max
-1.6394 -1.5066 0.7775 0.7775 0.8806
Coefficients:
Estimate Std. Error z value Pr(>|z|)
(Intercept) 0.7472 0.4047 1.847 0.0648 .
q121 0.2942 0.4570 0.644 0.5197
---
Signif. codes: 0 ‘***’ 0.001 ‘**’ 0.01 ‘*’ 0.05 ‘.’ 0.1 ‘ ’ 1
(Dispersion parameter for binomial family taken to be 1)
Null deviance: 167.58 on 142 degrees of freedom
Residual deviance: 167.18 on 141 degrees of freedom
AIC: 171.18
Number of Fisher Scoring iterations: 4
> thesislm <- glm(passed~q13,data=testdata,family=binomial(logit))
> summary(thesislm)
Call:
glm(formula = passed ~ q13, family = binomial(logit), data = testdata)
Deviance Residuals:
Min 1Q Median 3Q Max
-1.750 -1.231 0.698 0.698 1.125
Coefficients:
Estimate Std. Error z value Pr(>|z|)
(Intercept) 0.1252 0.3542 0.353 0.72385
q131 1.1627 0.4227 2.751 0.00594 **
---
Signif. codes: 0 ‘***’ 0.001 ‘**’ 0.01 ‘*’ 0.05 ‘.’ 0.1 ‘ ’ 1
(Dispersion parameter for binomial family taken to be 1)
Null deviance: 167.58 on 142 degrees of freedom Residual deviance: 160.14 on 141 degrees of freedom
AIC: 164.14
Number of Fisher Scoring iterations: 4

124
> thesislm <- glm(passed~q14,data=testdata,family=binomial(logit))
> summary(thesislm)
Call:
glm(formula = passed ~ q14, family = binomial(logit), data = testdata)
Deviance Residuals:
Min 1Q Median 3Q Max
-1.7420 -1.2068 0.7036 0.7036 1.1483
Coefficients:
Estimate Std. Error z value Pr(>|z|)
(Intercept) 0.06899 0.37161 0.186 0.85271
q141 1.20077 0.43512 2.760 0.00579 **
---
Signif. codes: 0 ‘***’ 0.001 ‘**’ 0.01 ‘*’ 0.05 ‘.’ 0.1 ‘ ’ 1
(Dispersion parameter for binomial family taken to be 1)
Null deviance: 167.58 on 142 degrees of freedom
Residual deviance: 160.10 on 141 degrees of freedom
AIC: 164.1
Number of Fisher Scoring iterations: 4 > thesislm <- glm(passed~q15,data=testdata,family=binomial(logit))
> summary(thesislm)
Call:
glm(formula = passed ~ q15, family = binomial(logit), data = testdata)
Deviance Residuals:
Min 1Q Median 3Q Max
-1.7090 -1.5542 0.7268 0.8427 0.8427
Coefficients:
Estimate Std. Error z value Pr(>|z|)
(Intercept) 0.8528 0.2342 3.641 0.000272 ***
q151 0.3435 0.3937 0.872 0.383029
---
Signif. codes: 0 ‘***’ 0.001 ‘**’ 0.01 ‘*’ 0.05 ‘.’ 0.1 ‘ ’ 1
(Dispersion parameter for binomial family taken to be 1)
Null deviance: 167.58 on 142 degrees of freedom Residual deviance: 166.81 on 141 degrees of freedom
AIC: 170.81
Number of Fisher Scoring iterations: 4

125
> thesislm<- glm(passed~q16,data=testdata,family=binomial(logit))
> summary(thesislm)
Call:
glm(formula = passed ~ q16, family = binomial(logit), data = testdata)
Deviance Residuals:
Min 1Q Median 3Q Max
-1.6225 -1.6225 0.7901 0.7901 1.0108
Coefficients:
Estimate Std. Error z value Pr(>|z|)
(Intercept) 0.4055 0.9129 0.444 0.657
q161 0.5987 0.9329 0.642 0.521
(Dispersion parameter for binomial family taken to be 1)
Null deviance: 167.58 on 142 degrees of freedom
Residual deviance: 167.19 on 141 degrees of freedom
AIC: 171.19
Number of Fisher Scoring iterations: 4
> thesislm <- glm(passed~q17,data=testdata,family=binomial(logit))
> summary(thesislm)
Call:
glm(formula = passed ~ q17, family = binomial(logit), data = testdata)
Deviance Residuals: Min 1Q Median 3Q Max
-1.8607 -1.2322 0.6243 0.6243 1.1236
Coefficients:
Estimate Std. Error z value Pr(>|z|)
(Intercept) 0.1278 0.2923 0.437 0.661896
q171 1.4084 0.3962 3.555 0.000378 ***
---
Signif. codes: 0 ‘***’ 0.001 ‘**’ 0.01 ‘*’ 0.05 ‘.’ 0.1 ‘ ’ 1
(Dispersion parameter for binomial family taken to be 1)
Null deviance: 167.58 on 142 degrees of freedom
Residual deviance: 154.62 on 141 degrees of freedom
AIC: 158.62
Number of Fisher Scoring iterations: 4

126
> thesislm <- glm(passed~q18,data=testdata,family=binomial(logit))
> summary(thesislm)
Call:
glm(formula = passed ~ q18, family = binomial(logit), data = testdata)
Deviance Residuals:
Min 1Q Median 3Q Max
-1.7034 -1.0108 0.7308 0.7308 1.3537
Coefficients:
Estimate Std. Error z value Pr(>|z|)
(Intercept) -0.4055 0.5270 -0.769 0.44171
q181 1.5892 0.5668 2.804 0.00505 **
---
Signif. codes: 0 ‘***’ 0.001 ‘**’ 0.01 ‘*’ 0.05 ‘.’ 0.1 ‘ ’ 1
(Dispersion parameter for binomial family taken to be 1)
Null deviance: 167.58 on 142 degrees of freedom
Residual deviance: 159.58 on 141 degrees of freedom
AIC: 163.58
Number of Fisher Scoring iterations: 4
> thesislm <- glm(passed~q19,data=testdata,family=binomial(logit))
> summary(thesislm)
Call:
glm(formula = passed ~ q19, family = binomial(logit), data = testdata)
Deviance Residuals:
Min 1Q Median 3Q Max
-1.6799 -1.2637 0.7478 0.7478 1.0935
Coefficients:
Estimate Std. Error z value Pr(>|z|)
(Intercept) 0.2007 0.4495 0.446 0.6553
q191 0.9307 0.4961 1.876 0.0606 .
---
Signif. codes: 0 ‘***’ 0.001 ‘**’ 0.01 ‘*’ 0.05 ‘.’ 0.1 ‘ ’ 1
(Dispersion parameter for binomial family taken to be 1)
Null deviance: 167.58 on 142 degrees of freedom
Residual deviance: 164.19 on 141 degrees of freedom
AIC: 168.19
Number of Fisher Scoring iterations: 4
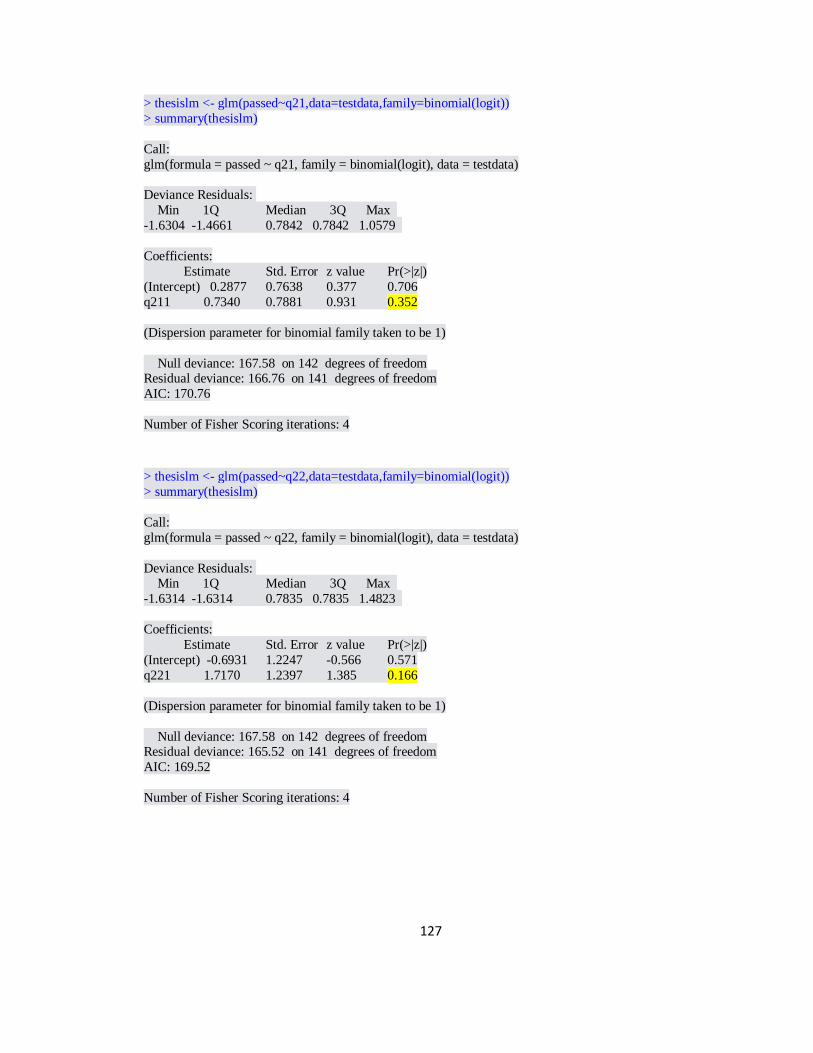
127
> thesislm <- glm(passed~q21,data=testdata,family=binomial(logit))
> summary(thesislm)
Call:
glm(formula = passed ~ q21, family = binomial(logit), data = testdata)
Deviance Residuals:
Min 1Q Median 3Q Max
-1.6304 -1.4661 0.7842 0.7842 1.0579
Coefficients:
Estimate Std. Error z value Pr(>|z|)
(Intercept) 0.2877 0.7638 0.377 0.706
q211 0.7340 0.7881 0.931 0.352
(Dispersion parameter for binomial family taken to be 1)
Null deviance: 167.58 on 142 degrees of freedom Residual deviance: 166.76 on 141 degrees of freedom
AIC: 170.76
Number of Fisher Scoring iterations: 4
> thesislm <- glm(passed~q22,data=testdata,family=binomial(logit))
> summary(thesislm)
Call:
glm(formula = passed ~ q22, family = binomial(logit), data = testdata)
Deviance Residuals: Min 1Q Median 3Q Max
-1.6314 -1.6314 0.7835 0.7835 1.4823
Coefficients:
Estimate Std. Error z value Pr(>|z|)
(Intercept) -0.6931 1.2247 -0.566 0.571
q221 1.7170 1.2397 1.385 0.166
(Dispersion parameter for binomial family taken to be 1)
Null deviance: 167.58 on 142 degrees of freedom Residual deviance: 165.52 on 141 degrees of freedom
AIC: 169.52
Number of Fisher Scoring iterations: 4

128
> thesislm <- glm(passed~q23,data=testdata,family=binomial(logit))
> summary(thesislm)
Call:
glm(formula = passed ~ q23, family = binomial(logit), data = testdata)
Deviance Residuals:
Min 1Q Median 3Q Max
-1.6171 -1.5829 0.7942 0.7942 0.8203
Coefficients:
Estimate Std. Error z value Pr(>|z|)
(Intercept) 0.91629 0.48305 1.897 0.0578 .
q231 0.07584 0.52428 0.145 0.8850
---
Signif. codes: 0 ‘***’ 0.001 ‘**’ 0.01 ‘*’ 0.05 ‘.’ 0.1 ‘ ’ 1
(Dispersion parameter for binomial family taken to be 1)
Null deviance: 167.58 on 142 degrees of freedom
Residual deviance: 167.56 on 141 degrees of freedom
AIC: 171.56
Number of Fisher Scoring iterations: 4
> thesislm <- glm(passed~q24,data=testdata,family=binomial(logit))
> summary(thesislm)
Call:
glm(formula = passed ~ q24, family = binomial(logit), data = testdata)
Deviance Residuals:
Min 1Q Median 3Q Max
-1.7047 -1.1330 0.7299 0.7299 1.2225
Coefficients:
Estimate Std. Error z value Pr(>|z|)
(Intercept) -0.1054 0.4595 -0.229 0.8186
q241 1.2919 0.5061 2.553 0.0107 *
--- Signif. codes: 0 ‘***’ 0.001 ‘**’ 0.01 ‘*’ 0.05 ‘.’ 0.1 ‘ ’ 1
(Dispersion parameter for binomial family taken to be 1)
Null deviance: 167.58 on 142 degrees of freedom
Residual deviance: 161.18 on 141 degrees of freedom
AIC: 165.18
Number of Fisher Scoring iterations: 4

129
> thesislm <- glm(passed~q25,data=testdata,family=binomial(logit))
> summary(thesislm)
Call:
glm(formula = passed ~ q25, family = binomial(logit), data = testdata)
Deviance Residuals:
Min 1Q Median 3Q Max
-1.8692 -1.0302 0.6189 0.6189 1.3321
Coefficients:
Estimate Std. Error z value Pr(>|z|)
(Intercept) -0.3567 0.3485 -1.024 0.306
q251 1.9120 0.4303 4.443 8.86e-06 ***
---
Signif. codes: 0 ‘***’ 0.001 ‘**’ 0.01 ‘*’ 0.05 ‘.’ 0.1 ‘ ’ 1
(Dispersion parameter for binomial family taken to be 1)
Null deviance: 167.58 on 142 degrees of freedom
Residual deviance: 146.93 on 141 degrees of freedom
AIC: 150.93
Number of Fisher Scoring iterations: 4
> thesislm <- glm(passed~q26,data=testdata,family=binomial(logit))
> summary(thesislm)
Call: glm(formula = passed ~ q26, family = binomial(logit), data = testdata)
Deviance Residuals:
Min 1Q Median 3Q Max
-2.0255 -1.3336 0.5246 1.0288 1.0288
Coefficients:
Estimate Std. Error z value Pr(>|z|)
(Intercept) 0.3600 0.2379 1.513 0.130191
q261 1.5536 0.4291 3.621 0.000293 ***
--- Signif. codes: 0 ‘***’ 0.001 ‘**’ 0.01 ‘*’ 0.05 ‘.’ 0.1 ‘ ’ 1
(Dispersion parameter for binomial family taken to be 1)
Null deviance: 167.58 on 142 degrees of freedom
Residual deviance: 152.58 on 141 degrees of freedom
AIC: 156.58
Number of Fisher Scoring iterations: 4

130
> thesislm <- glm(passed~q27,data=testdata,family=binomial(logit))
> summary(thesislm)
Call:
glm(formula = passed ~ q27, family = binomial(logit), data = testdata)
Deviance Residuals:
Min 1Q Median 3Q Max
-1.8365 -1.3777 0.6400 0.9895 0.9895
Coefficients:
Estimate Std. Error z value Pr(>|z|)
(Intercept) 0.4595 0.2607 1.762 0.07799 .
q271 1.0221 0.3870 2.641 0.00827 **
---
Signif. codes: 0 ‘***’ 0.001 ‘**’ 0.01 ‘*’ 0.05 ‘.’ 0.1 ‘ ’ 1
(Dispersion parameter for binomial family taken to be 1)
Null deviance: 167.58 on 142 degrees of freedom
Residual deviance: 160.39 on 141 degrees of freedom
AIC: 164.39
Number of Fisher Scoring iterations: 4
> thesislm <- glm(passed~q28,data=testdata,family=binomial(logit))
> summary(thesislm)
Call:
glm(formula = passed ~ q28, family = binomial(logit), data = testdata)
Deviance Residuals:
Min 1Q Median 3Q Max
-1.9214 -1.1774 0.5863 0.5863 1.1774
Coefficients:
Estimate Std. Error z value Pr(>|z|)
(Intercept) -3.400e-15 2.887e-01 0.000 1
q281 1.674e+00 4.031e-01 4.153 3.29e-05 ***
---
Signif. codes: 0 ‘***’ 0.001 ‘**’ 0.01 ‘*’ 0.05 ‘.’ 0.1 ‘ ’ 1
(Dispersion parameter for binomial family taken to be 1)
Null deviance: 167.58 on 142 degrees of freedom
Residual deviance: 149.41 on 141 degrees of freedom
AIC: 153.41
Number of Fisher Scoring iterations: 3

131
> thesislm <- glm(passed~q29,data=testdata,family=binomial(logit))
> summary(thesislm)
Call:
glm(formula = passed ~ q29, family = binomial(logit), data = testdata)
Deviance Residuals:
Min 1Q Median 3Q Max
-1.7520 -1.1461 0.6967 0.6967 1.2090
Coefficients:
Estimate Std. Error z value Pr(>|z|)
(Intercept) -0.07411 0.38516 -0.192 0.84742
q291 1.36609 0.44648 3.060 0.00222 **
---
Signif. codes: 0 ‘***’ 0.001 ‘**’ 0.01 ‘*’ 0.05 ‘.’ 0.1 ‘ ’ 1
(Dispersion parameter for binomial family taken to be 1)
Null deviance: 167.58 on 142 degrees of freedom
Residual deviance: 158.31 on 141 degrees of freedom
AIC: 162.31
Number of Fisher Scoring iterations: 4
> thesislm <- glm(passed~q30,data=testdata,family=binomial(logit))
> summary(thesislm)
Call:
glm(formula = passed ~ q30, family = binomial(logit), data = testdata)
Deviance Residuals:
Min 1Q Median 3Q Max
-1.7578 -1.4724 0.6927 0.9087 0.9087
Coefficients:
Estimate Std. Error z value Pr(>|z|)
(Intercept) 0.6712 0.2563 2.618 0.00883 **
q301 0.6338 0.3810 1.664 0.09621 .
---
Signif. codes: 0 ‘***’ 0.001 ‘**’ 0.01 ‘*’ 0.05 ‘.’ 0.1 ‘ ’ 1
(Dispersion parameter for binomial family taken to be 1)
Null deviance: 167.58 on 142 degrees of freedom
Residual deviance: 164.77 on 141 degrees of freedom
AIC: 168.77
Number of Fisher Scoring iterations: 4

132
> thesislm <- glm(passed~q31,data=testdata,family=binomial(logit))
> summary(thesislm)
Call:
glm(formula = passed ~ q31, family = binomial(logit), data = testdata)
Deviance Residuals:
Min 1Q Median 3Q Max
-1.7080 -0.9400 0.7276 0.7276 1.4350
Coefficients:
Estimate Std. Error z value Pr(>|z|)
(Intercept) -0.5878 0.5578 -1.054 0.29197
q311 1.7817 0.5954 2.992 0.00277 **
---
Signif. codes: 0 ‘***’ 0.001 ‘**’ 0.01 ‘*’ 0.05 ‘.’ 0.1 ‘ ’ 1
(Dispersion parameter for binomial family taken to be 1)
Null deviance: 167.58 on 142 degrees of freedom
Residual deviance: 158.18 on 141 degrees of freedom
AIC: 162.18
Number of Fisher Scoring iterations: 4
> thesislm <- glm(passed~q32,data=testdata,family=binomial(logit)) > summary(thesislm)
Call:
glm(formula = passed ~ q32, family = binomial(logit), data = testdata)
Deviance Residuals:
Min 1Q Median 3Q Max
-1.6765 -1.5759 0.7502 0.8257 0.8257
Coefficients:
Estimate Std. Error z value Pr(>|z|) (Intercept) 0.9008 0.2326 3.873 0.000107 ***
q321 0.2231 0.3950 0.565 0.572109
---
Signif. codes: 0 ‘***’ 0.001 ‘**’ 0.01 ‘*’ 0.05 ‘.’ 0.1 ‘ ’ 1
(Dispersion parameter for binomial family taken to be 1)
Null deviance: 167.58 on 142 degrees of freedom
Residual deviance: 167.26 on 141 degrees of freedom
AIC: 171.26
Number of Fisher Scoring iterations: 4

133
> thesislm <- glm(passed~q33,data=testdata,family=binomial(logit))
> summary(thesislm)
Call:
glm(formula = passed ~ q33, family = binomial(logit), data = testdata)
Deviance Residuals:
Min 1Q Median 3Q Max
-1.7105 -1.4408 0.7258 0.7258 0.9351
Coefficients:
Estimate Std. Error z value Pr(>|z|)
(Intercept) 0.6008 0.3018 1.991 0.0465 *
q331 0.5986 0.3876 1.544 0.1225
---
Signif. codes: 0 ‘***’ 0.001 ‘**’ 0.01 ‘*’ 0.05 ‘.’ 0.1 ‘ ’ 1
(Dispersion parameter for binomial family taken to be 1)
Null deviance: 167.58 on 142 degrees of freedom
Residual deviance: 165.22 on 141 degrees of freedom
AIC: 169.22
Number of Fisher Scoring iterations: 4
> thesislm <- glm(passed~q34,data=testdata,family=binomial(logit))
> summary(thesislm)
Call:
glm(formula = passed ~ q34, family = binomial(logit), data = testdata)
Deviance Residuals:
Min 1Q Median 3Q Max
-2.0828 -1.3088 0.4927 1.0515 1.0515
Coefficients:
Estimate Std. Error z value Pr(>|z|)
(Intercept) 0.3037 0.2368 1.283 0.2
q341 1.7440 0.4441 3.927 8.59e-05 ***
---
Signif. codes: 0 ‘***’ 0.001 ‘**’ 0.01 ‘*’ 0.05 ‘.’ 0.1 ‘ ’ 1
(Dispersion parameter for binomial family taken to be 1)
Null deviance: 167.58 on 142 degrees of freedom
Residual deviance: 149.29 on 141 degrees of freedom
AIC: 153.29
Number of Fisher Scoring iterations: 4
General Linear Models (Residuals, AIG, and P-values)

134
GLM Logistics for Full Model minus
4,5,10,12,15,16,20,21,23,32 (univariate rejects) Year 2 > thesislm <- glm(passed~q1+q2+q3+q6+q7+q8+q9+q11+q13+q14+q17+q18+q19+q22+q24+q25+q26+q
27+q28+q29+q30+q31+q33+q34,data=testdata,family=binomial(logit)) > summary(thesislm)
Call:
glm(formula = passed ~ q1 + q2 + q3 + q6 + q7 + q8 + q9 + q11 +
q13 + q14 + q17 + q18 + q19 + q22 + q24 + q25 + q26 + q27 +
q28 + q29 + q30 + q31 + q33 + q34, family = binomial(logit),
data = testdata)
Deviance Residuals:
Min 1Q Median 3Q Max
-2.23396 -0.04016 0.03502 0.29590 2.26611
Coefficients:
Estimate Std. Error z value Pr(>|z|)
(Intercept) -13.48702 4.17639 -3.229 0.001241 **
q11 5.83567 1.75521 3.325 0.000885 ***
q21 1.47224 0.88152 1.670 0.094899 .
q31 1.89754 0.93344 2.033 0.042069 *
q61 -0.06835 0.75155 -0.091 0.927541
q71 -0.62736 0.90048 -0.697 0.485994
q81 1.68614 1.04193 1.618 0.105603
q91 1.76690 0.85749 2.061 0.039345 *
q111 3.70767 2.01465 1.840 0.065716 . q131 2.41663 1.09892 2.199 0.027872 *
q141 0.93389 0.89751 1.041 0.298093
q171 2.25126 1.13824 1.978 0.047947 *
q181 2.23382 1.11971 1.995 0.046042 *
q191 0.50741 1.09611 0.463 0.643425
q221 -7.01003 3.19182 -2.196 0.028074 *
q241 2.54192 1.25732 2.022 0.043207 *
q251 0.16050 0.97470 0.165 0.869203
q261 2.30948 1.02234 2.259 0.023883 *
q271 1.23633 0.90764 1.362 0.173155
q281 -0.65901 0.84258 -0.782 0.434135
q291 1.03241 0.87952 1.174 0.240462 q301 0.33529 0.76807 0.437 0.662445
q311 0.30961 1.08436 0.286 0.775245
q331 -3.09795 1.22574 -2.527 0.011491 *
q341 2.35655 0.92954 2.535 0.011239 *
---
Signif. codes: 0 ‘***’ 0.001 ‘**’ 0.01 ‘*’ 0.05 ‘.’ 0.1 ‘ ’ 1
(Dispersion parameter for binomial family taken to be 1)
Null deviance: 167.582 on 142 degrees of freedom
Residual deviance: 67.409 on 118 degrees of freedom
AIC: 117.41
GLM Logistics for Year 2 Best Fit Model without Question 8

135
> thesislm <- glm(passed~q1+q2+q3+q9+q11+q13+q17+q18+q22+q24+q26+q27+q33+q34,
data=testdata,family=binomial(logit))
> summary(thesislm)
Call: glm(formula = passed ~ q1 + q2 + q3 + q9 + q11 + q13 + q17 +
q18 + q22 + q24 + q26 + q27 + q33 + q34, family = binomial(logit),
data = testdata)
Deviance Residuals:
Min 1Q Median 3Q Max
-2.41987 -0.13562 0.08652 0.41323 1.98419
Coefficients:
Estimate Std. Error z value Pr(>|z|)
(Intercept) -8.5081 2.2893 -3.716 0.000202 ***
q11 4.2509 1.2299 3.456 0.000548 *** q21 1.3024 0.6578 1.980 0.047701 *
q31 1.4108 0.6670 2.115 0.034433 *
q91 1.3851 0.6670 2.077 0.037832 *
q111 2.9389 1.5357 1.914 0.055652 .
q131 2.2806 0.8769 2.601 0.009299 **
q171 2.4754 0.8764 2.825 0.004733 **
q181 2.1832 0.9233 2.365 0.018045 *
q221 -6.3806 2.3722 -2.690 0.007150 **
q241 1.6241 0.9358 1.736 0.082641 .
q261 1.7559 0.7996 2.196 0.028092 *
q271 1.0991 0.7299 1.506 0.132107 q331 -2.6622 0.9832 -2.708 0.006778 **
q341 2.1864 0.7635 2.864 0.004187 **
---
Signif. codes: 0 ‘***’ 0.001 ‘**’ 0.01 ‘*’ 0.05 ‘.’ 0.1 ‘ ’ 1
(Dispersion parameter for binomial family taken to be 1)
Null deviance: 167.582 on 142 degrees of freedom
Residual deviance: 74.723 on 128 degrees of freedom
AIC: 104.72
Number of Fisher Scoring iterations: 7

136
GLM Logistics for Year 2 Best Fit Model without Question 27
> thesislm <- glm(passed~q1+q2+q3+q8+q9+q11+q13+q17+q18+q22+q24+q26+q33+q34,data=testdata,fa
mily=binomial(logit))
> summary(thesislm)
Call:
glm(formula = passed ~ q1 + q2 + q3 + q8 + q9 + q11 + q13 + q17 + q18 + q22 + q24 + q26 + q33 + q34, family = binomial(logit),
data = testdata)
Deviance Residuals:
Min 1Q Median 3Q Max
-2.62794 -0.10517 0.07663 0.39678 1.89379
Coefficients:
Estimate Std. Error z value Pr(>|z|)
(Intercept) -10.0724 2.8016 -3.595 0.000324 ***
q11 4.7454 1.3598 3.490 0.000484 ***
q21 1.1191 0.6749 1.658 0.097285 . q31 1.5643 0.7090 2.206 0.027358 *
q81 1.1186 0.7698 1.453 0.146203
q91 1.4274 0.6575 2.171 0.029940 *
q111 3.6557 1.6173 2.260 0.023800 *
q131 2.1588 0.8509 2.537 0.011175 *
q171 1.6321 0.8022 2.035 0.041896 *
q181 2.4280 0.9011 2.694 0.007051 **
q221 -5.9356 2.4016 -2.472 0.013454 *
q241 1.9877 1.0355 1.920 0.054910 .
q261 2.3380 0.8596 2.720 0.006530 **
q331 -2.5085 0.9776 -2.566 0.010288 * q341 2.0604 0.7534 2.735 0.006238 **
---
Signif. codes: 0 ‘***’ 0.001 ‘**’ 0.01 ‘*’ 0.05 ‘.’ 0.1 ‘ ’ 1
(Dispersion parameter for binomial family taken to be 1)
Null deviance: 167.582 on 142 degrees of freedom
Residual deviance: 74.777 on 128 degrees of freedom
AIC: 104.78
Number of Fisher Scoring iterations: 7

137
GLM Logistics for Year 2 Best Fit Model without Questions 8 and 27
> thesislm <- glm(passed~q1+q2+q3+q9+q11+q13+q17+q18+q22+q24+q26+q33+q34
,data=testdata,family=binomial(logit))
> summary(thesislm)
Call:
glm(formula = passed ~ q1 + q2 + q3 + q9 + q11 + q13 + q17 + q18 + q22 + q24 + q26 + q33 + q34, family = binomial(logit),
data = testdata)
Deviance Residuals:
Min 1Q Median 3Q Max
-2.6255 -0.1327 0.1161 0.3862 1.9381
Coefficients:
Estimate Std. Error z value Pr(>|z|)
(Intercept) -8.6967 2.3354 -3.724 0.000196 ***
q11 4.2292 1.1996 3.526 0.000423 ***
q21 1.2256 0.6483 1.890 0.058715 . q31 1.3712 0.6542 2.096 0.036087 *
q91 1.4130 0.6512 2.170 0.030014 *
q111 3.5206 1.6339 2.155 0.031183 *
q131 2.1230 0.8448 2.513 0.011976 *
q171 1.9751 0.7765 2.544 0.010969 *
q181 2.3660 0.8912 2.655 0.007934 **
q221 -6.0846 2.4326 -2.501 0.012374 *
q241 1.5541 0.9288 1.673 0.094272 .
q261 2.0816 0.7668 2.715 0.006636 **
q331 -2.4382 0.9639 -2.530 0.011418 *
q341 2.1866 0.7615 2.872 0.004084 ** ---
Signif. codes: 0 ‘***’ 0.001 ‘**’ 0.01 ‘*’ 0.05 ‘.’ 0.1 ‘ ’ 1
(Dispersion parameter for binomial family taken to be 1)
Null deviance: 167.582 on 142 degrees of freedom
Residual deviance: 77.103 on 129 degrees of freedom
AIC: 105.1
Number of Fisher Scoring iterations: 7

138
GLM Logistics for Score Only Model
Year 2
> thesislm <- glm(passed~score,data=testdata,family=binomial(logit))
> summary(thesislm)
Call:
glm(formula = passed ~ score, family = binomial(logit), data = testdata)
Deviance Residuals:
Min 1Q Median 3Q Max
-2.26493 -0.60386 0.00008 0.57802 1.89302
Coefficients:
Estimate Std. Error z value Pr(>|z|)
(Intercept) 1.957e+01 1.075e+04 0.002 0.999
score26% -3.913e+01 1.521e+04 -0.003 0.998
score29% -3.913e+01 1.521e+04 -0.003 0.998
score41% -2.026e+01 1.075e+04 -0.002 0.998
score47% -2.026e+01 1.075e+04 -0.002 0.998 score50% -1.997e+01 1.075e+04 -0.002 0.999
score53% -2.066e+01 1.075e+04 -0.002 0.998
score56% -2.066e+01 1.075e+04 -0.002 0.998
score59% -1.957e+01 1.075e+04 -0.002 0.999
score62% -2.008e+01 1.075e+04 -0.002 0.999
score65% -2.118e+01 1.075e+04 -0.002 0.998
score68% -1.872e+01 1.075e+04 -0.002 0.999
score71% -1.796e+01 1.075e+04 -0.002 0.999
score74% -1.737e+01 1.075e+04 -0.002 0.999
score76% -1.749e+01 1.075e+04 -0.002 0.999
score79% -1.708e+01 1.075e+04 -0.002 0.999 score82% -1.786e+01 1.075e+04 -0.002 0.999
score85% -2.327e-07 1.128e+04 0.000 1.000
score88% -2.343e-07 1.242e+04 0.000 1.000
score91% -2.342e-07 1.113e+04 0.000 1.000
score94% -2.344e-07 1.162e+04 0.000 1.000
score97% -2.341e-07 1.242e+04 0.000 1.000
(Dispersion parameter for binomial family taken to be 1)
Null deviance: 167.58 on 142 degrees of freedom
Residual deviance: 101.84 on 121 degrees of freedom AIC: 145.84
Number of Fisher Scoring iterations: 18
P-value for Score Only Model
Year 2
> pchisq(101.84,121)
[1] 0.1038434

139
GLM Logistics for Study Model
Year 2
> thesislm <- glm(passed~q2+q13+q14+q17+q28+q31+q5+q7+q18,data=testdata,family=binomial(logit))
> summary(thesislm)
Call:
glm(formula = passed ~ q2 + q13 + q14 + q17 + q28 + q31 + q5 + q7 + q18, family = binomial(logit), data = testdata)
Deviance Residuals:
Min 1Q Median 3Q Max
-2.4855 -0.4464 0.3054 0.5704 2.0354
Coefficients:
Estimate Std. Error z value Pr(>|z|)
(Intercept) -4.6957 1.1448 -4.102 4.1e-05 ***
q21 1.2470 0.4995 2.496 0.01254 *
q131 1.3278 0.5479 2.423 0.01538 *
q141 0.4699 0.5293 0.888 0.37460 q171 0.9078 0.4960 1.830 0.06722 .
q281 1.2003 0.5078 2.364 0.01809 *
q311 1.9811 0.7625 2.598 0.00937 **
q51 -0.2106 0.4977 -0.423 0.67221
q71 0.1724 0.5357 0.322 0.74755
q181 0.6423 0.6947 0.925 0.35513
---
Signif. codes: 0 ‘***’ 0.001 ‘**’ 0.01 ‘*’ 0.05 ‘.’ 0.1 ‘ ’ 1
(Dispersion parameter for binomial family taken to be 1)
Null deviance: 167.58 on 142 degrees of freedom
Residual deviance: 119.00 on 133 degrees of freedom
AIC: 139
Number of Fisher Scoring iterations: 5
P-value for Study Model
Year 2
> pchisq(119,133)
[1] 0.1978711

140
GLM Logistics for Year 2 Best Fit Model
> thesislm <- glm(passed~q1+q2+q3+q8+q9+q11+q13+q17+q18+q22+q24+q26+q27
+q33+q34,data=testdata,family=binomial(logit))
> summary(thesislm)
Call:
glm(formula = passed ~ q1 + q2 + q3 + q8 + q9 + q11 + q13 + q17 + q18 + q22 + q24 + q26 + q27 + q33 + q34, family = binomial(logit),
data = testdata)
Deviance Residuals:
Min 1Q Median 3Q Max
-2.38173 -0.09655 0.06427 0.40531 2.16275
Coefficients:
Estimate Std. Error z value Pr(>|z|)
(Intercept) -9.9052 2.8226 -3.509 0.000449 ***
q11 4.8053 1.4103 3.407 0.000656 ***
q21 1.2384 0.6828 1.814 0.069702 . q31 1.6097 0.7264 2.216 0.026696 *
q81 1.0483 0.7841 1.337 0.181235
q91 1.3881 0.6705 2.070 0.038434 *
q111 3.1648 1.5601 2.029 0.042496 *
q131 2.3259 0.8914 2.609 0.009075 **
q171 2.1474 0.9042 2.375 0.017550 *
q181 2.3160 0.9358 2.475 0.013326 *
q221 -6.3374 2.4027 -2.638 0.008349 **
q241 2.0372 1.0396 1.960 0.050050 .
q261 2.0064 0.8927 2.247 0.024609 *
q271 1.0360 0.7471 1.387 0.165527 q331 -2.7823 1.0188 -2.731 0.006313 **
q341 2.0894 0.7598 2.750 0.005962 **
---
Signif. codes: 0 ‘***’ 0.001 ‘**’ 0.01 ‘*’ 0.05 ‘.’ 0.1 ‘ ’ 1
(Dispersion parameter for binomial family taken to be 1)
Null deviance: 167.582 on 142 degrees of freedom
Residual deviance: 72.771 on 127 degrees of freedom
AIC: 104.77
Number of Fisher Scoring iterations: 7
P-value for Year 2 Best Fit Model
> pchisq(72.771,127)
[1] 2.939287e-05

141
SAS Output - ROC Curves
Year 2
proc logistic data=WORK.THESIS desc;
model Passed = score
/ outroc=roc1;
run;
ROC Curve for Score Only Model – Year 2

142
ROC Curve for Study Model on Year 2
proc logistic data=WORK.THESIS desc;
model Passed = q2 q13 q14 q17 q28 q31 q5 q7 q18
/ outroc=roc1;
run;

143
ROC Curve for the Year 2 Best Fit Model
proc logistic data=WORK.THESIS desc;
model Passed = q1 q2 q3 q8 q9 q11 q13 q17 q118 q22 q24 q26 q27 q33 q34
/ outroc=roc1;
run;

144
Classification Tables for Predictions
Classification Table for Score Only Model
Year 2
proc logistic data=WORK.THESIS desc;
model passed = score
/ ctable pprob = (.62 to .87 by .01);
run;
Classification Table
Prob
Level
Correct Incorrect Percentages
Event Non-
Event
Event Non-
Event
Correct Sensi-
tivity
Speci-
ficity
False
POS
False
NEG
0.620 89 25 14 15 79.7 85.6 64.1 13.6 37.5
0.630 89 25 14 15 79.7 85.6 64.1 13.6 37.5
0.640 89 30 9 15 83.2 85.6 76.9 9.2 33.3
0.650 89 30 9 15 83.2 85.6 76.9 9.2 33.3
0.660 89 30 9 15 83.2 85.6 76.9 9.2 33.3
0.670 89 30 9 15 83.2 85.6 76.9 9.2 33.3
0.680 89 30 9 15 83.2 85.6 76.9 9.2 33.3
0.690 89 30 9 15 83.2 85.6 76.9 9.2 33.3
0.700 82 30 9 22 78.3 78.8 76.9 9.9 42.3
0.710 82 33 6 22 80.4 78.8 84.6 6.8 40.0
0.720 82 33 6 22 80.4 78.8 84.6 6.8 40.0
0.730 82 33 6 22 80.4 78.8 84.6 6.8 40.0
0.740 82 33 6 22 80.4 78.8 84.6 6.8 40.0
0.750 82 33 6 22 80.4 78.8 84.6 6.8 40.0
0.760 82 33 6 22 80.4 78.8 84.6 6.8 40.0
0.770 77 33 6 27 76.9 74.0 84.6 7.2 45.0
0.780 77 34 5 27 77.6 74.0 87.2 6.1 44.3
0.790 77 34 5 27 77.6 74.0 87.2 6.1 44.3
0.800 77 34 5 27 77.6 74.0 87.2 6.1 44.3
0.810 77 34 5 27 77.6 74.0 87.2 6.1 44.3
0.820 77 34 5 27 77.6 74.0 87.2 6.1 44.3
0.830 68 34 5 36 71.3 65.4 87.2 6.8 51.4
0.840 68 35 4 36 72.0 65.4 89.7 5.6 50.7

145
Classification Table
Prob
Level
Correct Incorrect Percentages
Event Non-
Event
Event Non-
Event
Correct Sensi-
tivity
Speci-
ficity
False
POS
False
NEG
0.850 68 35 4 36 72.0 65.4 89.7 5.6 50.7
0.860 60 35 4 44 66.4 57.7 89.7 6.3 55.7
0.870 60 36 3 44 67.1 57.7 92.3 4.8 55.0

146
Classification Table for Study Model
Year 2
proc logistic data=WORK.THESIS desc;
model Passed = q2 q13 q14 q17 q28 q31 q5 q7 q18
/ ctable pprob = (.80 to .92 by .01); run;
Classification Table
Prob
Level
Correct Incorrect Percentages
Event Non-
Event
Event Non-
Event
Correct Sensi-
tivity
Speci-
ficity
False
POS
False
NEG
0.740 76 27 12 27 72.5 73.8 69.2 13.6 50.0
0.750 76 27 12 27 72.5 73.8 69.2 13.6 50.0
0.760 75 27 12 28 71.8 72.8 69.2 13.8 50.9
0.770 75 27 12 28 71.8 72.8 69.2 13.8 50.9
0.780 74 27 12 29 71.1 71.8 69.2 14.0 51.8
0.790 74 28 11 29 71.8 71.8 71.8 12.9 50.9
0.800 71 28 11 32 69.7 68.9 71.8 13.4 53.3
0.810 71 28 11 32 69.7 68.9 71.8 13.4 53.3
0.820 70 30 9 33 70.4 68.0 76.9 11.4 52.4
0.830 68 30 9 35 69.0 66.0 76.9 11.7 53.8
0.840 67 31 8 36 69.0 65.0 79.5 10.7 53.7
0.850 62 31 8 41 65.5 60.2 79.5 11.4 56.9
0.860 60 31 8 43 64.1 58.3 79.5 11.8 58.1
0.870 60 31 8 43 64.1 58.3 79.5 11.8 58.1
0.880 51 33 6 52 59.2 49.5 84.6 10.5 61.2
0.890 49 33 6 54 57.7 47.6 84.6 10.9 62.1
0.900 45 36 3 58 57.0 43.7 92.3 6.3 61.7
0.910 45 36 3 58 57.0 43.7 92.3 6.3 61.7
0.920 41 38 1 62 55.6 39.8 97.4 2.4 62.0
0.930 41 38 1 62 55.6 39.8 97.4 2.4 62.0
0.940 39 38 1 64 54.2 37.9 97.4 2.5 62.7
0.950 37 38 1 66 52.8 35.9 97.4 2.6 63.5
0.960 13 38 1 90 35.9 12.6 97.4 7.1 70.3

147
Classification Table
Prob
Level
Correct Incorrect Percentages
Event Non-
Event
Event Non-
Event
Correct Sensi-
tivity
Speci-
ficity
False
POS
False
NEG
0.970 0 39 0 103 27.5 0.0 100.0 . 72.5
0.980 0 39 0 103 27.5 0.0 100.0 . 72.5
0.990 0 39 0 103 27.5 0.0 100.0 . 72.5

148
Classification Table Year 2 Best Fit Model
proc logistic data=WORK.THESIS desc;
model passed = q1 q2 q3 q8 q9 q11 q13 q17 q18 q22 q24 q26 q27 q33 q34
/ ctable pprob = (.62 to .87 by .01);
run;
Classification Table
Prob
Level
Correct Incorrect Percentages
Event Non-
Event
Event Non-
Event
Correct Sensi-
tivity
Speci-
ficity
False
POS
False
NEG
0.740 84 29 10 18 80.1 82.4 74.4 10.6 38.3
0.750 84 29 10 18 80.1 82.4 74.4 10.6 38.3
0.760 84 30 9 18 80.9 82.4 76.9 9.7 37.5
0.770 83 30 9 19 80.1 81.4 76.9 9.8 38.8
0.780 83 30 9 19 80.1 81.4 76.9 9.8 38.8
0.790 83 30 9 19 80.1 81.4 76.9 9.8 38.8
0.800 83 30 9 19 80.1 81.4 76.9 9.8 38.8
0.810 81 30 9 21 78.7 79.4 76.9 10.0 41.2
0.820 81 31 8 21 79.4 79.4 79.5 9.0 40.4
0.830 81 32 7 21 80.1 79.4 82.1 8.0 39.6
0.840 81 32 7 21 80.1 79.4 82.1 8.0 39.6
0.850 79 32 7 23 78.7 77.5 82.1 8.1 41.8
0.860 78 32 7 24 78.0 76.5 82.1 8.2 42.9
0.870 77 32 7 25 77.3 75.5 82.1 8.3 43.9
0.880 73 32 7 29 74.5 71.6 82.1 8.8 47.5
0.890 73 33 6 29 75.2 71.6 84.6 7.6 46.8
0.900 70 33 6 32 73.0 68.6 84.6 7.9 49.2
0.910 68 33 6 34 71.6 66.7 84.6 8.1 50.7
0.920 65 34 5 37 70.2 63.7 87.2 7.1 52.1
0.930 65 35 4 37 70.9 63.7 89.7 5.8 51.4
0.940 63 35 4 39 69.5 61.8 89.7 6.0 52.7
0.950 61 35 4 41 68.1 59.8 89.7 6.2 53.9
0.960 60 35 4 42 67.4 58.8 89.7 6.3 54.5
0.970 56 37 2 46 66.0 54.9 94.9 3.4 55.4
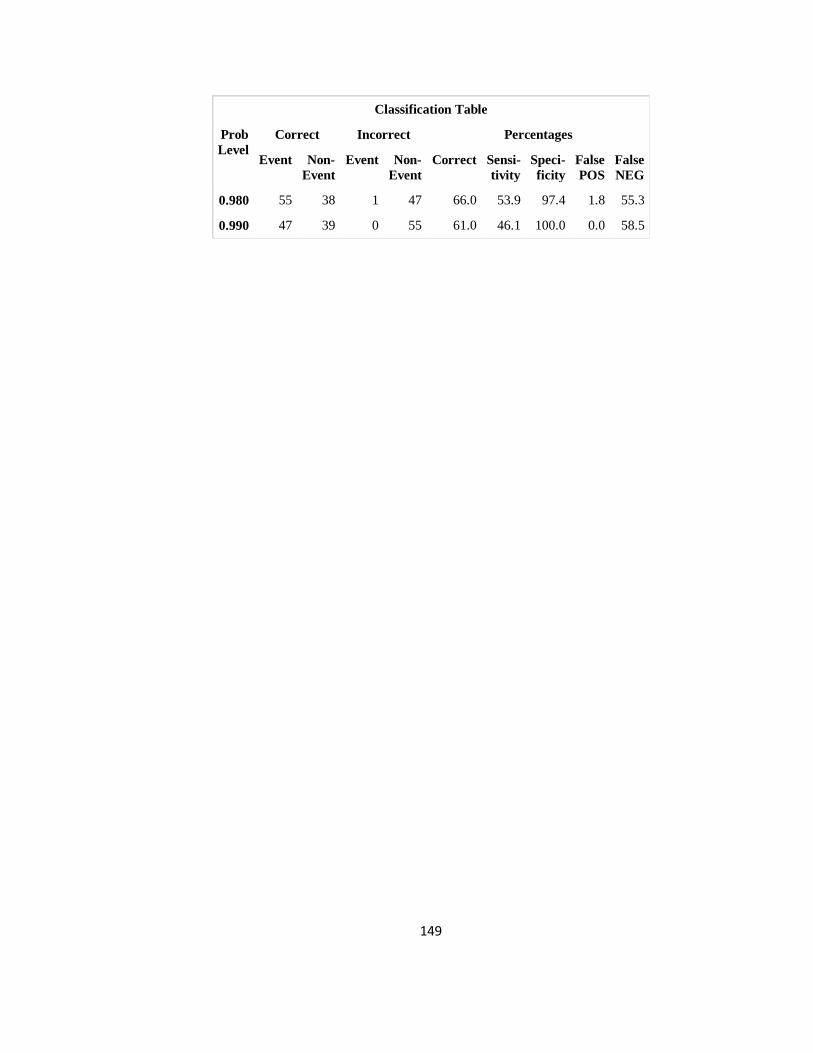
149
Classification Table
Prob
Level
Correct Incorrect Percentages
Event Non-
Event
Event Non-
Event
Correct Sensi-
tivity
Speci-
ficity
False
POS
False
NEG
0.980 55 38 1 47 66.0 53.9 97.4 1.8 55.3
0.990 47 39 0 55 61.0 46.1 100.0 0.0 58.5

150
GLM Logistics for Year 1 All Questions Model for Table 13
> thesislm <- glm(Passed~X1+X2+X3+X5+X6+X7+X8+X9+X10+X11+X12+X13+X14+X15+X16+X17
+X18+X19+X21+X22+X23+X24+X25+X26+X27+X28+X29+X30+X31+X32+X33+X34,data=totunit1c,f
amily=binomial(logit))
> summary(thesislm)
Call:
glm(formula = Passed ~ X1 + X2 + X3 + X5 + X6 + X7 + X8 + X9 +
X10 + X11 + X12 + X13 + X14 + X15 + X16 + X17 + X18 + X19 +
X21 + X22 + X23 + X24 + X25 + X26 + X27 + X28 + X29 + X30 +
X31 + X32 + X33 + X34, family = binomial(logit), data = totunit1c)
Deviance Residuals:
Min 1Q Median 3Q Max
-3.1502 -0.4011 0.2110 0.5538 2.1386
Coefficients:
Estimate Std. Error z value Pr(>|z|)
(Intercept) -5.818943 1.575369 -3.694 0.000221 ***
X11 0.332547 0.520138 0.639 0.522599
X21 1.371807 0.457839 2.996 0.002733 **
X31 -0.671287 0.467480 -1.436 0.151011
X51 0.780039 0.459410 1.698 0.089524 .
X61 0.529928 0.511548 1.036 0.300235
X71 0.808455 0.433878 1.863 0.062417 .
X81 0.396492 0.454988 0.871 0.383518
X91 -0.447417 0.468777 -0.954 0.339864
X101 0.564253 0.548995 1.028 0.304047 X111 0.433265 0.720485 0.601 0.547606
X121 -0.503284 0.741287 -0.679 0.497180
X131 0.713066 0.422484 1.688 0.091450 .
X141 0.573189 0.444660 1.289 0.197381
X151 -0.024118 0.428302 -0.056 0.955094
X161 -0.249918 0.711640 -0.351 0.725448
X171 0.967952 0.415330 2.331 0.019776 *
X181 0.918234 0.631666 1.454 0.146037
X191 -0.198516 0.508888 -0.390 0.696464
X211 0.477509 0.673498 0.709 0.478325
X221 0.881231 0.935442 0.942 0.346168 X231 -0.005255 0.500196 -0.011 0.991618
X241 0.407575 0.531802 0.766 0.443436
X251 0.686277 0.444616 1.544 0.122703
X261 0.341087 0.529596 0.644 0.519543
X271 -0.577853 0.447617 -1.291 0.196720
X281 0.601797 0.459153 1.311 0.189970
X291 0.364078 0.447309 0.814 0.415685
X301 -0.333579 0.432959 -0.770 0.441025
X311 1.425621 0.502445 2.837 0.004549 **
X321 0.279017 0.514507 0.542 0.587612
X331 -0.366188 0.425043 -0.862 0.388946
X341 -0.173844 0.448617 -0.388 0.698378 ---

151
Signif. codes: 0 ‘***’ 0.001 ‘**’ 0.01 ‘*’ 0.05 ‘.’ 0.1 ‘ ’ 1
(Dispersion parameter for binomial family taken to be 1)
Null deviance: 316.40 on 255 degrees of freedom
Residual deviance: 183.26 on 223 degrees of freedom AIC: 249.26
Number of Fisher Scoring iterations: 6

152
GLM Logistics for Year 2 All Questions Model for Table 13
> thesislm <- glm(passed~q1+q2+q3+q5+q6+q7+q8+q9+q10+q11+q12+q13+q14+q15+
q16+q17+q18+q19+q21+q22+q23+q24+q25+q26+q27+q28+q29+q30+q31+q32+q33
+q34,data=testdata,family=binomial(logit))
> summary(thesislm)
Call:
glm(formula = passed ~ q1 + q2 + q3 + q5 + q6 + q7 + q8 + q9 +
q10 + q11 + q12 + q13 + q14 + q15 + q16 + q17 + q18 + q19 +
q21 + q22 + q23 + q24 + q25 + q26 + q27 + q28 + q29 + q30 +
q31 + q32 + q33 + q34, family = binomial(logit), data = testdata)
Deviance Residuals:
Min 1Q Median 3Q Max
-2.66722 -0.00633 0.01340 0.20197 2.43519
Coefficients:
Estimate Std. Error z value Pr(>|z|)
(Intercept) -19.50105 9.01568 -2.163 0.03054 *
q11 7.85093 2.88069 2.725 0.00642 **
q21 1.11008 1.17356 0.946 0.34419
q31 2.20449 1.25808 1.752 0.07973 .
q51 -0.93292 1.14200 -0.817 0.41397
q61 -0.67278 1.03901 -0.648 0.51729
q71 1.43286 1.39037 1.031 0.30275
q81 2.00169 1.35162 1.481 0.13862
q91 3.76284 1.54912 2.429 0.01514 *
q101 -1.19190 1.25499 -0.950 0.34225 q111 1.93572 2.30163 0.841 0.40033
q121 -2.56766 1.35108 -1.900 0.05737 .
q131 1.89846 1.63682 1.160 0.24611
q141 3.17396 1.50848 2.104 0.03537 *
q151 -0.50139 1.09694 -0.457 0.64761
q161 2.11497 5.27836 0.401 0.68865
q171 1.29901 1.41517 0.918 0.35866
q181 3.66143 1.73142 2.115 0.03446 *
q191 2.30873 1.49454 1.545 0.12240
q211 -3.16273 3.45395 -0.916 0.35983
q221 -3.40133 4.57478 -0.743 0.45718 q231 -2.13112 1.50683 -1.414 0.15727
q241 4.56441 1.89800 2.405 0.01618 *
q251 1.72671 1.32125 1.307 0.19126
q261 4.85188 1.85155 2.620 0.00878 **
q271 0.34309 1.16041 0.296 0.76749
q281 -0.96905 1.15275 -0.841 0.40055
q291 1.69514 1.25878 1.347 0.17809
q301 0.24611 1.02885 0.239 0.81095
q311 0.04328 1.26954 0.034 0.97281
q321 -0.89868 1.03218 -0.871 0.38394
q331 -3.42479 1.81888 -1.883 0.05971 .
q341 2.56756 1.13916 2.254 0.02420 * ---

153
Signif. codes: 0 ‘***’ 0.001 ‘**’ 0.01 ‘*’ 0.05 ‘.’ 0.1 ‘ ’ 1
(Dispersion parameter for binomial family taken to be 1)
Null deviance: 166.298 on 140 degrees of freedom
Residual deviance: 52.212 on 108 degrees of freedom (2 observations deleted due to missingness)
AIC: 118.21
Number of Fisher Scoring iterations: 9
Traditional Cutoff Score Tables for Year 2
> View(testdata)
> table(testdata$passed,testdata$cutoff50)
f p
f 6 33
p 2 102
> table(testdata$passed,testdata$cutoff55)
f p
f 12 27
p 5 99
> table(testdata$passed,testdata$cutoff60)
f p
f 20 19
p 11 93
> table(testdata$passed,testdata$cutoff65)
f p
f 25 14
p 14 90
> table(testdata$passed,testdata$cutoff70)
f p
f 33 6
p 22 82
> table(testdata$passed,testdata$cutoff75)
f p
f 35 4
p 36 68
Related Documents