BENCHMARKING ENERGY INTENSITY IN THE CANADIAN STEEL INDUSTRY PREPARED FOR CANADIAN STEEL PRODUCERS ASSOCIATION AND NATURAL RESOURCES CANADA

Welcome message from author
This document is posted to help you gain knowledge. Please leave a comment to let me know what you think about it! Share it to your friends and learn new things together.
Transcript

BENCHMARKING ENERGY INTENSITY INTHE CANADIAN STEEL INDUSTRY
PREPARED FOR CANADIAN STEEL PRODUCERS ASSOCIATIONAND NATURAL RESOURCES CANADA

For more information or to receive additional copies of this publication, write to:
Canadian Industry Program for Energy ConservationOffice of Energy Efficiencyc/o Natural Resources Canada580 Booth Street, 18th FloorOttawa ON K1A 0E4
Tel.: 613-995-6839Fax: 613-992-3161E-mail: [email protected] Site: oee.nrcan.gc.ca/cipec
Or
Canadian Steel Producers Association350 Sparks Street, Suite 407Ottawa ON K1R 7S8
Tel.: 613-238-6049Fax: 613-238-1832Web site: canadiansteel.ca
Library and Archives Canada Cataloguing in Publication
Benchmarking energy intensity in the Canadian steel industry.
Aussi disponible en français sous le titre : Analyse comparative de l’intensitéénergétique dans l’industrie sidérurgique canadienne.Includes bibliographical references: p.ISBN 978-0-662-43410-8Cat. No. M144-125/2006E
1. Steel industry and trade--Energy consumption--Canada. 2. Iron industryand trade--Energy consumption--Canada. I. Canada. Natural Resources Canada
TJ163.5.S83B46 2006 333.79'65C2006-980213-0
© Her Majesty the Queen in Right of Canada, 2007
Recycled paper

BENCHMARKING ENERGY INTENSITY IN THE CANADIAN STEEL INDUSTRY
I
CONTENTS
LIST OF FIGURES . . . . . . . . . . . . . . . . . . . . . . . . . . . . . . . . . . . . . . . . . . . . . . . . . . . . . . . iii
1. INTRODUCTION . . . . . . . . . . . . . . . . . . . . . . . . . . . . . . . . . . . . . . . . . . . . . . . . . . . . . . . 1
1.1 Focus . . . . . . . . . . . . . . . . . . . . . . . . . . . . . . . . . . . . . . . . . . . . . . . . . . . . . . . . . . 2
1.2 Objectives . . . . . . . . . . . . . . . . . . . . . . . . . . . . . . . . . . . . . . . . . . . . . . . . . . . . . . 3
1.3 Layout of This Report . . . . . . . . . . . . . . . . . . . . . . . . . . . . . . . . . . . . . . . . . . . . . 3
2. ENERGY USE IN THE CANADIAN STEEL INDUSTRY . . . . . . . . . . . . . . . . . . . . . . . . . . . . . . . . 5
2.1 Industry Background . . . . . . . . . . . . . . . . . . . . . . . . . . . . . . . . . . . . . . . . . . . . . . 6
2.2 Energy Use . . . . . . . . . . . . . . . . . . . . . . . . . . . . . . . . . . . . . . . . . . . . . . . . . . . . . 6
3. METHODOLOGY . . . . . . . . . . . . . . . . . . . . . . . . . . . . . . . . . . . . . . . . . . . . . . . . . . . . . . . 9
3.1 Energy-Intensity Indicators . . . . . . . . . . . . . . . . . . . . . . . . . . . . . . . . . . . . . . . . 10
3.2 Energy-Saving Technologies . . . . . . . . . . . . . . . . . . . . . . . . . . . . . . . . . . . . . . . . 11
3.3 Applicability of Energy-Intensity Indicators to the Canadian Steel Sector . . . . . . 13
3.4 Data Collection . . . . . . . . . . . . . . . . . . . . . . . . . . . . . . . . . . . . . . . . . . . . . . . . . 14
3.5 Energy-Intensity Indicators for Processes . . . . . . . . . . . . . . . . . . . . . . . . . . . . . . 15
3.6 Energy-Intensity Indicators for Plants . . . . . . . . . . . . . . . . . . . . . . . . . . . . . . . . . 15
3.6.1 EAF Plant Energy-Intensity Indicators . . . . . . . . . . . . . . . . . . . . . . . . . . . . 17
3.6.2 Integrated Plant Energy-Intensity Indicators. . . . . . . . . . . . . . . . . . . . . . . . . 17
3.7 Energy-Intensity Indicators for Reheating Furnaces . . . . . . . . . . . . . . . . . . . . . . . 18
3.8 CO2 Emission-Intensity Indicators . . . . . . . . . . . . . . . . . . . . . . . . . . . . . . . . . . . 18
4. RESULTS . . . . . . . . . . . . . . . . . . . . . . . . . . . . . . . . . . . . . . . . . . . . . . . . . . . . . . . . . . 21
4.1 Interpretation of the Results . . . . . . . . . . . . . . . . . . . . . . . . . . . . . . . . . . . . . . . . 22
4.2 Presentation of the Results . . . . . . . . . . . . . . . . . . . . . . . . . . . . . . . . . . . . . . . . . 22
4.3 Process Areas . . . . . . . . . . . . . . . . . . . . . . . . . . . . . . . . . . . . . . . . . . . . . . . . . . . 23
4.3.1 Cokemaking – Figures 4-1 and 4-2 . . . . . . . . . . . . . . . . . . . . . . . . . . . . . . . 23
4.3.2 Ironmaking – Figures 4-3 to 4-7 . . . . . . . . . . . . . . . . . . . . . . . . . . . . . . . . . 25
4.3.3 Basic Oxygen Furnace (BOF) Steelmaking – Figures 4-8 and 4-9 . . . . . . . . . 29
iNatural Resources Canada’s Office of Energy Efficiency
Leading Canadians to Energy Efficiency at Home, at Work and on the Road
II
BENCHMARKING ENERGY INTENSITY IN THE CANADIAN STEEL INDUSTRY
4.3.4 Electric Arc Furnace (EAF) Steelmaking and Continuous Casting –Figures 4-10 and 4-11 . . . . . . . . . . . . . . . . . . . . . . . . . . . . . . . . . . . . . . . . . 30
4.3.5 Continuous Casting – Figures 4-12 and 4-13 . . . . . . . . . . . . . . . . . . . . . . . . 31
4.3.6 Hot Strip and Plate Mills – Figures 4-14 and 4-15 . . . . . . . . . . . . . . . . . . . . 31
4.3.7 Section Mills – Figures 4-16 and 4-17 . . . . . . . . . . . . . . . . . . . . . . . . . . . . . 32
4.4 Plants . . . . . . . . . . . . . . . . . . . . . . . . . . . . . . . . . . . . . . . . . . . . . . . . . . . . . . . . . 32
4.4.1 EAF Plants . . . . . . . . . . . . . . . . . . . . . . . . . . . . . . . . . . . . . . . . . . . . . . . . . 33
4.4.2 Integrated Plants . . . . . . . . . . . . . . . . . . . . . . . . . . . . . . . . . . . . . . . . . . . . . 33
4.4.3 EAF Plant with Direct Reduced Iron . . . . . . . . . . . . . . . . . . . . . . . . . . . . . . 35
4.5 Plant Energy Management . . . . . . . . . . . . . . . . . . . . . . . . . . . . . . . . . . . . . . . . . 37
4.5.1 Energy Monitoring and Reporting – Figures 4-44 and 4-45. . . . . . . . . . . . . . 37
4.5.2 Energy Management at Integrated Steel Plants . . . . . . . . . . . . . . . . . . . . . . . 38
4.6 Reheating Furnaces . . . . . . . . . . . . . . . . . . . . . . . . . . . . . . . . . . . . . . . . . . . . . . . 40
4.6.1 Slab Reheating Furnaces – Figure 4-49 . . . . . . . . . . . . . . . . . . . . . . . . . . . . . 40
4.6.2 Billet and Bloom Reheating Furnaces – Figure 4-50 . . . . . . . . . . . . . . . . . . . 43
4.6.3 Combustion Air Preheat Temperature – Figure 4-51 . . . . . . . . . . . . . . . . . . . 44
4.6.4 Unfired Charge Preheat Zone Length – Figure 4-52 . . . . . . . . . . . . . . . . . . . 45
4.6.5 Furnace Average Charging Temperature – Figure 4-53 . . . . . . . . . . . . . . . . . 45
5. POTENTIAL AREAS FOR INCREASED ENERGY EFFICIENCY . . . . . . . . . . . . . . . . . . . . . . . . . . 47
5.1 Identifying Potential Areas for Reducing Energy Intensity . . . . . . . . . . . . . . . . . . 48
5.2 Factors for Reducing Energy Intensity Not Determined by This Study . . . . . . . . 48
5.3 Identifying Areas of Greatest Potential. . . . . . . . . . . . . . . . . . . . . . . . . . . . . . . . . 49
5.3.1 Areas Where the Implementation of Technology andPractice Are Unlikely . . . . . . . . . . . . . . . . . . . . . . . . . . . . . . . . . . . . . . . . . . 50
5.3.2 Areas Where the Implementation of Technology and Practice Are Likely,but the Potential for Implementation Is Limited . . . . . . . . . . . . . . . . . . . . . . 51
5.3.3 Areas Where the Implementation of Technology and Practice Are Likely,and the Potential for Lower Energy Intensity Is Great . . . . . . . . . . . . . . . . . . 51
6. REFERENCES . . . . . . . . . . . . . . . . . . . . . . . . . . . . . . . . . . . . . . . . . . . . . . . . . . . . . . . 55
7. FIGURES, CHARTS AND TABLES . . . . . . . . . . . . . . . . . . . . . . . . . . . . . . . . . . . . . . . . . . . 57
APPENDIX A – ECOTECH TECHNOLOGIES AND ENERGY-INTENSITY ANDCO2 EMISSION-INTENSITY INDICATORS . . . . . . . . . . . . . . . . . . . . . . . . . . . . . . . . . . . . . . . . 84
APPENDIX B – CO2 EMISSION FACTORS . . . . . . . . . . . . . . . . . . . . . . . . . . . . . . . . . . . . . . . 92
ii

BENCHMARKING ENERGY INTENSITY IN THE CANADIAN STEEL INDUSTRY
IIILIST OF FIGURES
FIGURE TITLE PAGE
2-1 Iron and Steel Mills and Ferroalloy Manufacturing, 2002Energy Consumption. . . . . . . . . . . . . . . . . . . . . . . . . . . . . . . . . . . . . . . . . . . 58
2-2 EAF Plant Production – Flow Diagram . . . . . . . . . . . . . . . . . . . . . . . . . . . . . 582-3 Energy-Intensity Indicator – EAF Plants, 2002 . . . . . . . . . . . . . . . . . . . . . . . 592-4 Integrated Plant Production – Flow Diagram . . . . . . . . . . . . . . . . . . . . . . . . 602-5 Energy-Intensity Indicator Integrated Plants, 2002 . . . . . . . . . . . . . . . . . . . . 612-6 Specific Energy Consumption . . . . . . . . . . . . . . . . . . . . . . . . . . . . . . . . . . . . 613-1 EcoTech EAF Bar Plant . . . . . . . . . . . . . . . . . . . . . . . . . . . . . . . . . . . . . . . . . 613-2 EcoTech Integrated Hot Strip Coil Plant and Utilities . . . . . . . . . . . . . . . . . . 624-1 Cokemaking – Energy and Technology . . . . . . . . . . . . . . . . . . . . . . . . . . . . . 634-2 Cokemaking – CO2 . . . . . . . . . . . . . . . . . . . . . . . . . . . . . . . . . . . . . . . . . . . . 634-3 Blowing – Energy and Technology . . . . . . . . . . . . . . . . . . . . . . . . . . . . . . . . 644-4 Stoves – Energy and Technology . . . . . . . . . . . . . . . . . . . . . . . . . . . . . . . . . . 644-5 Blast Furnace – Energy and Technology . . . . . . . . . . . . . . . . . . . . . . . . . . . . 654-6 Ironmaking – Energy. . . . . . . . . . . . . . . . . . . . . . . . . . . . . . . . . . . . . . . . . . . 654-7 Ironmaking – CO2. . . . . . . . . . . . . . . . . . . . . . . . . . . . . . . . . . . . . . . . . . . . . 664-8 Basic Oxygen Furnace Steelmaking – Energy and Technology . . . . . . . . . . . . 664-9 Basic Oxygen Furnace Steelmaking – CO2 . . . . . . . . . . . . . . . . . . . . . . . . . . . 674-10 Electric Arc Furnace Steelmaking and Continuous Casting –
Energy and Technology . . . . . . . . . . . . . . . . . . . . . . . . . . . . . . . . . . . . . . . . . 674-11 Electric Arc Furnace Steelmaking and Continuous Casting – CO2 . . . . . . . . . 684-12 Continuous Casting – Energy. . . . . . . . . . . . . . . . . . . . . . . . . . . . . . . . . . . . 684-13 Continuous Casting – CO2 . . . . . . . . . . . . . . . . . . . . . . . . . . . . . . . . . . . . . . 684-14 Hot Strip and Plate Mills – Energy and Technology . . . . . . . . . . . . . . . . . . . 694-15 Hot Strip and Plate Mills – CO2 . . . . . . . . . . . . . . . . . . . . . . . . . . . . . . . . . . 704-16 Section Mills – Energy . . . . . . . . . . . . . . . . . . . . . . . . . . . . . . . . . . . . . . . . . 704-17 Section Mills – CO2. . . . . . . . . . . . . . . . . . . . . . . . . . . . . . . . . . . . . . . . . . . . 714-18 EAF Rod Plant – Energy . . . . . . . . . . . . . . . . . . . . . . . . . . . . . . . . . . . . . . . . 714-19 EAF Rod Plant – CO2 . . . . . . . . . . . . . . . . . . . . . . . . . . . . . . . . . . . . . . . . . . 714-20 EAF Bar Plant – Energy. . . . . . . . . . . . . . . . . . . . . . . . . . . . . . . . . . . . . . . . . 724-21 EAF Bar Plant – CO2 . . . . . . . . . . . . . . . . . . . . . . . . . . . . . . . . . . . . . . . . . . 724-22 EAF Hot Strip Plant – Energy . . . . . . . . . . . . . . . . . . . . . . . . . . . . . . . . . . . . 734-23 EAF Hot Strip Plant – CO2 . . . . . . . . . . . . . . . . . . . . . . . . . . . . . . . . . . . . . . 73
iii

iv
BENCHMARKING ENERGY INTENSITY IN THE CANADIAN STEEL INDUSTRY
FIGURE TITLE PAGE
4-24 Integrated Iron Plant – Energy . . . . . . . . . . . . . . . . . . . . . . . . . . . . . . . . . . . 734-25 Integrated Iron Plant – CO2 . . . . . . . . . . . . . . . . . . . . . . . . . . . . . . . . . . . . . 734-26 Integrated Steel Plant – Energy . . . . . . . . . . . . . . . . . . . . . . . . . . . . . . . . . . . 744-27 Integrated Steel Plant – CO2 . . . . . . . . . . . . . . . . . . . . . . . . . . . . . . . . . . . . . 744-28 Integrated Semifinished Steel Plant – Energy . . . . . . . . . . . . . . . . . . . . . . . . . 744-29 Integrated Semifinished Steel Plant – CO2 . . . . . . . . . . . . . . . . . . . . . . . . . . . 744-30 Integrated Hot Strip Plant – Energy . . . . . . . . . . . . . . . . . . . . . . . . . . . . . . . 754-31 Integrated Hot Strip Plant – CO2 . . . . . . . . . . . . . . . . . . . . . . . . . . . . . . . . . 754-32 Integrated Hot Strip Plant – Energy (Including Gas Flare Allocation) . . . . . . 754-33 Integrated Hot Strip Plant – CO2 (Including Gas Flare Allocation) . . . . . . . . 754-34 Integrated Hot Strip Plant – Energy (Including Gas Flare and
Utilities Allocation) . . . . . . . . . . . . . . . . . . . . . . . . . . . . . . . . . . . . . . . . . . . . 764-35 Integrated Hot Strip Plant – CO2 (Including Gas Flare and
Utilities Allocation) . . . . . . . . . . . . . . . . . . . . . . . . . . . . . . . . . . . . . . . . . . . . 764-36 Integrated Plate Plant – Energy . . . . . . . . . . . . . . . . . . . . . . . . . . . . . . . . . . . 764-37 Integrated Plate Plant – CO2 . . . . . . . . . . . . . . . . . . . . . . . . . . . . . . . . . . . . . 764-38 Integrated Plate Plant – Energy (Including Gas Flare Allocation). . . . . . . . . . 774-39 Integrated Plate Plant – CO2 (Including Gas Flare Allocation) . . . . . . . . . . . 774-40 Integrated Plate Plant – Energy (Including Gas Flare and
Utilities Allocation) . . . . . . . . . . . . . . . . . . . . . . . . . . . . . . . . . . . . . . . . . . . . 774-41 Integrated Plate Plant – CO2 (Including Gas Flare and
Utilities Allocation) . . . . . . . . . . . . . . . . . . . . . . . . . . . . . . . . . . . . . . . . . . . . 774-42 Direct Reduced Iron and Integrated Hot Strip Plants – Energy . . . . . . . . . . . 784-43 Direct Reduced Iron and Integrated Hot Strip Plants – CO2 . . . . . . . . . . . . . 784-44 Energy Monitoring . . . . . . . . . . . . . . . . . . . . . . . . . . . . . . . . . . . . . . . . . . . . 794-45 Energy Reporting . . . . . . . . . . . . . . . . . . . . . . . . . . . . . . . . . . . . . . . . . . . . . 794-46 Gas Flares – Energy and Technology . . . . . . . . . . . . . . . . . . . . . . . . . . . . . . . 794-47 Gas Flares – CO2 . . . . . . . . . . . . . . . . . . . . . . . . . . . . . . . . . . . . . . . . . . . . . . 794-48 Power Plant – Performance and Technology . . . . . . . . . . . . . . . . . . . . . . . . . 804-49 Slab Reheating Furnaces – Energy and Technology . . . . . . . . . . . . . . . . . . . . 804-50 Billet and Bloom Reheating Furnaces – Energy and Technology . . . . . . . . . . 814-51 Combustion Air Preheat Temperature . . . . . . . . . . . . . . . . . . . . . . . . . . . . . . 824-52 Unfired Charge Preheat Zone Length . . . . . . . . . . . . . . . . . . . . . . . . . . . . . . 824-53 Furnace Average Charging Temperature . . . . . . . . . . . . . . . . . . . . . . . . . . . . 82

INTRODUCTION1
2
BENCHMARKING ENERGY INTENSITY IN THE CANADIAN STEEL INDUSTRY
1 INTRODUCTION
1. INTRODUCTION
The Canadian Steel Producers Association (CSPA) represents Canada’s primary steelproducers at the national level. One of Canada’s largest industries, the steel sector gener-ates annual sales of more than $11 billion, including $3 billion in exports, and directlyemploys about 35 000 workers. Energy efficiency is a priority for the CSPA, and Canadiansteel producers have reduced specific energy consumption (megajoules [MJ] per tonne ofsteel shipped) by 23 percent since 1990.1 In 2002, the CSPA agreed to undertake anenergy benchmarking study with funding provided by the Industrial Programs Division ofthe Office of Energy Efficiency of Natural Resources Canada (NRCan) to identify furtheropportunities for energy reduction.
In addition to conservation of natural resources, there are compelling economic and envi-ronmental reasons for the nation’s steel plants to comprehensively examine their energyconsumption. Energy consumed by Canada’s steel sector represents a sizeable componentof the total cost of ironmaking and steelmaking operations. In addition, directly and indi-rectly, energy used in the steel sector is a contributor to carbon dioxide (CO2) and otherair emissions.
NRCan has been promoting more efficient use of energy in the Canadian economy fora number of years. The Canadian steel sector, through its involvement in the CanadianIndustry Program for Energy Conservation (CIPEC), has participated actively in theseenergy initiatives.
1.1 Focus
The study focussed on the operations that produce steel and form it into hot rolledproducts. Twelve steel-producing plants (the participating plants) took part in the study –the four integrated plants and eight of the nine electric arc furnace (EAF) plants. The par-ticipating plants produced 14.9 million tonnes of steel in 2002, representing 97 percent ofthe steel produced in Canada that year.
The study involved a detailed inter-facility comparison of the energy consumed in steelproduction during 2002. Fifteen separate processes, each a production stage at two ormore plants, were examined.
It was agreed with CSPA members that it was important to provide an international con-text for the detailed Canadian analysis. More specifically, it was deemed important to relateenergy intensity (e.g. MJ per tonne of product) of the Canadian operations to that of thetechnology-based International Iron and Steel Institute (IISI) EcoTech plant. The IISI
1 Canadian Industry Program for Energy Conservation 2002/2003 Annual Report: Energy Ideas at Work,pages 72–73 (oee.nrcan.gc.ca/Publications/infosource/Pub/cipec/AnnualReport02-03).
BENCHMARKING ENERGY INTENSITY IN THE CANADIAN STEEL INDUSTRY
INTRODUCTION 1
3EcoTech Plant is a hypothetical plant that employs energy-saving technologies that areboth commercially available and economically attractive. The concept of the EcoTech Plantis further described in Section 3.2, “Energy-Saving Technologies.”
1.2 Objectives
The CSPA established the following objectives for this study:
1. Provide Canadian steel producers with a methodology to determine benchmarks for theefficiency with which energy is consumed at the plant level and at each stage of production.
2. Provide a list of technologies with the potential for achieving more efficient use ofenergy and enhancing the competitive position of the Canadian steel sector.
3. Provide a compilation of energy-intensity benchmarks and an analysis of the penetrationof energy-efficient technologies for the CSPA member plants.
4. Provide a comparison of benchmarks and technology penetration between plants andagainst international technology-based benchmark levels, thereby allowing areas ofpotential improvement to be identified.
1.3 Layout of This Report
Chapter 2 provides some background information on energy use in Canada’s steel sector.
Chapter 3 describes the methodology used to develop and apply energy-intensity bench-marks and to establish technology penetration.
Chapter 4 contains the principal findings.
Chapter 5 identifies the potential areas for energy savings based on the comparison ofsector performance to the international technology-based benchmark level.
Chapter 6 lists the references used in the text.
Chapter 7 contains all figures, charts and tables.
Appendix A provides a list of EcoTech Technologies and energy-intensity andCO2 emission-intensity indicators.
Appendix B provides a list of CO2 emission factors.

4
BENCHMARKING ENERGY INTENSITY IN THE CANADIAN STEEL INDUSTRY
1 INTRODUCTION

ENERGY USE IN THECANADIAN STEEL
INDUSTRY2
6
BENCHMARKING ENERGY INTENSITY IN THE CANADIAN STEEL INDUSTRY
2 ENERGY USE IN THE CANADIAN STEEL INDUSTRY
2. ENERGY USE IN THE CANADIAN STEEL INDUSTRY
2.1 Industry Background
Steel is produced at 13 plants in five provinces (Alberta, Saskatchewan, Manitoba, Ontarioand Quebec). The industry is concentrated in Ontario, with six plants operating there.
Steel plants are divided into two general categories according to their major source ofmetal. Plants that produce steel from iron ore using the blast furnace and basic oxygen fur-nace (BOF) process are referred to as integrated plants. Plants that produce steel by melt-ing steel scrap in the electric arc furnace (EAF) process are referred to as EAF plants. OneCanadian integrated plant also uses the EAF process to produce a portion of its steel. OneEAF plant has a direct reduction facility that produces “sponge” iron from iron ore, forconversion into steel in the EAF process. All four integrated steel plants are in Ontario.
2.2 Energy Use
The steel industry is a large industrial energy user in Canada, accounting for about2.0 percent of the nation’s primary energy consumption, which is 7.5 percent of Canada’sindustrial energy demand.2,3 Year 2002 energy consumption for the Canadian steel sector isshown in Figure 2-1.
Steel is also highly recycled, with the recycling rate (defined as the amount of steel producedfrom salvaged obsolete steel products) being 40 percent in Canada. Recycling of steelstrongly affects the energy performance of the sector as a whole, since steel produced fromscrap requires considerably less energy than steel produced from iron ore. However, the sup-ply of steel scrap is limited, so the steel demand must be satisfied with product made fromboth recycled scrap and iron ore. Also, the quality of steel produced from salvaged scrap isnot satisfactory for some steel applications, due to impurities contained in scrap steel.
2 Based on data contained in NAICS Energy Consumption Report, Statistics Canada, Cat. No. 57-003-XPB.3 Energy values are based on the higher heating values for fuels, which include the latent heat of vaporizationof the water formed in the combustion process.All electrical energy consumption has been converted to a unit of heat using a factor of 3600 megajoulesper megawatt hour (MJ/MWh), which is the heat equivalent of the electrical energy consumed.
BENCHMARKING ENERGY INTENSITY IN THE CANADIAN STEEL INDUSTRY
ENERGY USE IN THE CANADIAN STEEL INDUSTRY 2
7The production flow diagram for an EAF plant is shown in Figure 2-2, and the energyintensity for the participating EAF plants, for the year 2002, is shown in Figure 2-3. Theproduction flow diagram for an integrated plant is shown in Figure 2-4, and the energyintensity for the participating integrated plants, for the year 2002, is shown in Figure 2-5.4
These charts illustrate that the energy intensity of EAF plants is less than half that of theintegrated plants. This comparison assumes that all electricity consumed was generated byfossil fuel power plants. In reality, a portion of the electricity consumed by Canadian steelplants is generated by nuclear or hydroelectric plants, so the amount of fossil fuel used togenerate power for the steel plants would be less. The use of actual fossil fuel rates forpower generation makes the inherently lower energy consumption of EAF plants evenmore favourable for overall energy efficiency and CO2 intensity.
Energy expense for Canada’s steel sector represents the second highest component (afterlabour) of the total cost of operation. Not surprisingly then, through its involvement inCIPEC and other initiatives, the steel sector has continually improved energy efficiency asa means of bettering its competitive position. Since 1990, the sector has reduced specificenergy consumption (gigajoules per tonne of product) by 23 percent (see Figure 2-6) andhas reduced CO2 emissions by 20 percent.5 This achievement was brought about largely byinvestments in new processes and energy-reducing technologies.
4 All energy-intensity values in this report are based on the lower heating values for fuels, which do notinclude the latent heat of vaporization of the water formed in the combustion process.All electrical-energy-intensity values in this report have been converted to fossil fuel input using a factorof 9200 MJ/MWh, which assumes 100 percent fossil fuel generation. The 9200 MJ/MWh factor wasdeemed to be representative of modern fossil fuel power generation in Europe by the International Ironand Steel Institute and the European Steelworks Energy Committee (see Chapter 6, references 1 and 2).
5 Canadian Industry Program for Energy Conservation 2002/2003 Annual Report: Energy Ideas at Work,pages 72–73 (oee.nrcan.gc.ca/Publications/infosource/Pub/cipec/AnnualReport02-03).
METHODOLOGY3
BENCHMARKING ENERGY INTENSITY IN THE CANADIAN STEEL INDUSTRY
3 METHODOLOGY
3. METHODOLOGY
3.1 Energy-Intensity Indicators
The steel industry worldwide has worked diligently to provide the knowledge and tools toenable steel plants to apply the energy-intensity indicator concept to their processes andplants. An in-depth understanding of the methodology can be found in reports producedby the IISI and the European Steelworks Energy Committee (ESEC)6 associated with theorganization Association Technique de la Sidérurgie (ATS). Knowledge of the methodol-ogy is not required to understand the results of the present study, but understanding thefollowing aspects of the energy-intensity-indicator concept helps to ensure that the resultsare not misinterpreted or misapplied.
Energy-intensity benchmarking requires some type of indicator that is determined solely bythe efficiency with which energy is consumed by the process or plant being evaluated. Theindicator must be sensitive only to changes in technology and practice within the boundaryof the particular process under review.
External differences, such as how purchased electrical energy is generated or how pur-chased oxygen is produced, will change the actual energy consumed per unit of steel prod-uct, but they will not change the efficiency with which energy is consumed in a givenprocess. The energy-indicator methodology, therefore, assigns a fixed value to each manu-factured energy stream (electricity, steam, oxygen) that enters or leaves the process beingevaluated, and it applies the fixed values to the process at each plant under study.
For example, the fossil fuel energy consumed in generating electricity can range from0 megajoules per megawatt hour (MJ/MWh) of electricity produced by a hydroelectric plantto 9200 MJ/MWh for electricity from a coal-fired power plant. The values for Canadianelectrical utilities naturally fall within that general range. As the benchmark energy-intensityindicator in the present study, the fossil fuel energy value for electricity is fixed at theamount from a coal-fired plant – 9200 MJ/MWh. That value is applied to all plants,regardless of the actual value for electricity produced by their utility supplier.
The purchase and sale of intermediate products, such as coke, iron or steel slabs, alsochanges the specific energy consumption of a plant. Hence, the energy-intensity indicatormust factor out sales and purchases and must consider all material to be produced andprocessed at the same energy intensity as the plant or process being evaluated.
The energy-intensity indicator is expressed in units of energy per unit of product (usually MJper tonne). These are the same units as those used for specific energy consumption data.However, the values of the energy-intensity indicator must not be construed as specific
10
6 Ibid. See Chapter 6, references 1 and 2.
BENCHMARKING ENERGY INTENSITY IN THE CANADIAN STEEL INDUSTRY
energy consumptions. They will differ significantly from the specific energy consumptionnumbers reported by the steel plants to the various government programs, such as Canada’sClimate Change Voluntary Challenge and Registry Inc. (VCR Inc.) [now CSA ClimateChange, GHG Registries] and CIPEC. The energy-intensity indicator is different for thefollowing reasons:
• The energy-intensity indicator is based on the lower (or net) heating values for the fuelsconsumed. The lower heating value does not include the latent heat of vaporization forthe water formed in the combustion process. The lower heating value is used, to be con-sistent with the practice used by IISI and ESEC. All energy reporting in Canada is basedon the higher (or gross) heating value for the fuels consumed. The higher heating valueincludes the latent heat of vaporization for the water formed in the combustion process.
• Process and plant boundaries are not necessarily the same.
• Fixed values are used for energy inputs that flow across the boundaries into the processesand plants.
• Energy associated with the sale and purchase of intermediate product is factored out inestablishing the plant energy-intensity indicator.
The energy-intensity indicator must never be used in the context of actual plant energyconsumption. The only legitimate use of the energy-intensity indicator is to compare therelative performance of identical or very similar processes or plants.
3.2 Energy-Saving Technologies
Since many energy-saving technologies are available to the steel industry, theenergy-intensity indicator can be used to establish the potential for efficiency if one ormore of these technologies are incorporated into existing processes or plants. This evalua-tion is accomplished by establishing the energy indicator for a reference process or plantthat has the desired technologies in place and then using it as the benchmark against whichthe existing processes or plants are compared. Such benchmarks have been developed byIISI and are available for use as international guidelines for establishing the penetration ofenergy-saving technologies and the potential for further application.
The IISI EcoTech Plant,7 a hypothetical plant that employs energy-saving technologies thatare both commercially available and economically attractive (EcoTech Technologies), wasselected as the benchmark for the present study. Whether the technologies are economicallyattractive depends on many factors, such as the energy price in a particular jurisdiction, thedifficulty of retrofitting the technologies into existing process equipment and the incrementalbenefits if the technologies are only partially implemented. The economic attractiveness for aparticular plant can be determined only by the plant considering the technology.
11
METHODOLOGY 3
7 See Chapter 6, reference 1.

12
BENCHMARKING ENERGY INTENSITY IN THE CANADIAN STEEL INDUSTRY
3 METHODOLOGY
There are few, if any, plants and processes operating with all of the IISI EcoTechTechnologies in place. Therefore, the EcoTech energy-intensity values were established byextrapolating the energy-intensity indicators of operating processes and plants by the effi-ciency gains attributed to the additional energy-saving technologies required to completethe EcoTech Technology set. Admittedly, the EcoTech energy-intensity values are some-what theoretical, and there is a lack of actual process and plant operating data to verify thatthey can be achieved in real life.
The IISI AllTech Plant8 is a variant of the EcoTech Plant into which all proven energy-saving technologies have been incorporated, regardless of financial viability. Economicpayback times in excess of 20 years are not uncommon for some AllTech Technologies.The AllTech Plant represents a severe standard of energy efficiency and, as such, was notan appropriate benchmark for this study. However, some AllTech Technologies are in placein the Canadian steel industry, which is an indication of their viability. AllTech Technologiesthat are utilized in the Canadian steel industry are included in the present study.
Of course, technology is only one factor that influences the energy efficiency of processesand plants. Some other factors include:
• Utilization of equipment: Energy efficiency increases if equipment is operated at or neardesign capacity. Although all plants strive for high equipment utilization, market andcompetitive pressure can result in equipment being idle or shut down for periods.
• Maintenance of equipment and technology: The 100 percent performance of technologyrequires material and labour for proper maintenance that, to a certain extent, is dictatedby the economic condition of the industry.
• Product mix: The energy intensity will be higher for mills that produce a broad rangeof products because of material losses and energy consumption that occur during theperiod required to change over to the next product. Also, some grades of steel requiremore energy to produce.
• Climate: Energy intensity at Canadian mills will be greater because of the energyrequired to protect equipment and personnel from the harsh winter climate and tomake up for greater process heat losses caused by low ambient temperatures.
Note that the effects of these other factors are not included in the EcoTech energy-intensityvalues.
For the present study, energy-efficient technologies were selected for each process investi-gated. The selected technologies include all of the EcoTech Technologies and otherenergy-saving technologies that either are in place at Canadian steel plants or have beenrecommended by previous studies for their potential for improving energy efficiency in theCanadian steel sector.9 The technologies selected for each process and the penetration ofthe various technologies at each plant can be found in Chapter 4, “Results.”
8 See Chapter 6, reference 1.9 See Chapter 6, reference 3.
BENCHMARKING ENERGY INTENSITY IN THE CANADIAN STEEL INDUSTRY
METHODOLOGY 3
13Some difficulties were encountered in using the EcoTech Plant as the benchmark fortechnology penetration and energy intensity. The difficulties, which pertain to the interpre-tation of the data and information in the IISI report,10 include the following:
• Carbon in the metallic input and output to the processes was not always included in theenergy balance. (It is in the present study.)
• The EcoTech Plant was not always defined by both technology and energy intensity.In some areas, such as reheating furnaces, energy-saving technologies are discussed butare not specifically identified as included in the EcoTech Plant. The technologies are,however, implied by the EcoTech Plant performance.
• Some EcoTech Technologies are defined in terms that are difficult or impossible to relateto actual plant performance or that have no universal meaning. (For example, definingrecuperator performance in terms of efficiency instead of air preheat temperature.)
• In some cases, the energy-intensity indicators for the EcoTech Plant differ from theones used by the ESEC.11
Consequently, the interpretation of the EcoTech Plant used in this study may differ fromothers.
Appendix A defines the interpretation of the EcoTech Plant used in this study. It providesfor each process:
• the list of EcoTech Technologies
• the EcoTech energy-intensity indicator and CO2 emission-intensity indicator, by energytype
• references to the IISI report for all EcoTech data and information
A table of the CO2 emission factors, used to establish CO2 intensity, is provided inAppendix B.
3.3 Applicability of Energy-Intensity Indicators to theCanadian Steel Sector
It must be emphasized that use of energy-intensity indicators is of value only for compar-ing identical or very similar processes. By properly applying the indicator, the operatingpractices and equipment technologies that produce the highest efficiency should becomeapparent. There is little value in comparing different processes that produce the sameproduct. For example, liquid steel is produced by both the EAF process and the blastfurnace/BOF process. The intrinsic differences between the two routes result in the EAF
10 See Chapter 6, reference 1.11 See Chapter 6, reference 2.
14
BENCHMARKING ENERGY INTENSITY IN THE CANADIAN STEEL INDUSTRY
3 METHODOLOGY
process consuming about half as much energy as the BOF process. However, because theequipment used in the two situations is quite different, changing operating practices andtechnologies in one will not produce the same results in the other.
The processes and plants analysed in the present study were selected using the followingcriteria:
• They are applicable at two or more plants.
• They contain comparable process equipment.
• They have essentially the same material input and output streams.
• They have sufficient specific energy consumption to offer potential for noticeablereduction in energy use.
Two other processes not meeting the above criteria were also analysed:
1. One involves a direct reduction facility at an EAF plant. This facility is the onlyCanadian example of a number of alternate ironmaking technologies in use today. Thefacility uses Midrex Technologies Inc.’s MIDREX® Direct Reduction Process, the mostwidely accepted technology for producing direct reduced iron (DRI), which is naturalgas based and requires the use of agglomerated iron ores.
2. The other is a cast-and-roll hot strip coil facility at an integrated plant. Liquid steel iscast into a thin slab (or thick strip) that is then hot rolled into hot strip coil products.The process is an alternative to the continuous casting and hot strip mill processes byeliminating two energy-intensive stages – the slab reheating furnace and the slabroughing or breakdown mill.
3.4 Data Collection
The calculation of energy-intensity indicators for the processes and plants requires the useof actual energy consumption and production data from a specific period. The presentstudy is based on 2002 calendar year data that were obtained under a confidentiality agree-ment. The data for each process were collected using spreadsheet reporting forms basedon the spreadsheets developed by ESEC.12 The reporting forms calculate the energy-intensity indicators for each process as the data are entered. This enabled participatingplants to instantly see their results and to question any results or data that seemed out ofthe expected range. A questionnaire was developed to collect additional information onthe energy-saving technologies and practices that were in place for each process at eachplant. The reporting forms were completed by personnel at each participating plant.
12 See Chapter 6, reference 2.

BENCHMARKING ENERGY INTENSITY IN THE CANADIAN STEEL INDUSTRY
METHODOLOGY 3
15Missing or questionable data were identified by the aggregation of the data for eachprocess. The plants were contacted and additional and/or revised data were submitted.Dialogue continued with plant personnel to ensure that the information used was as com-plete and accurate as possible, although precision and certainty are difficult to evaluatebecause of different levels of metering at the various plants. Some of the data at someplants had to be estimated because of lack of metering. Where estimates of energy inputallocation to processes were necessary, they were based on the relative energy requirementsof the equipment, operating level and time.
3.5 Energy-Intensity Indicators for Processes
The energy efficiency indicators for each process at each participating plant were calculatedby the “Reporting Form – Process Areas” spreadsheet.
3.6 Energy-Intensity Indicators for Plants
For energy benchmarking, plants are defined by their associated processes required to pro-duce a specific product. Since the product could be an intermediate product or the finalhot rolled product, more “Model” plants must be defined for energy benchmarking thanthe number of real-life plants participating in the present study. For example, three“Model” plants would be needed for a real EAF plant that produces both bar and rod:
• a plant consisting of the EAF and Continuous Casting processes for the production ofbillets, the intermediate product
• a plant consisting of the EAF, Continuous Casting and Bar Mill processes for theproduction of bar
• a plant consisting of the EAF, Continuous Casting and Rod Mill processes for theproduction of rod
The energy-intensity indicator for a plant is expressed in units of energy (MJ) per tonne ofplant product.
The plant energy-intensity indicator is based on the energy-intensity indicator and thematerial input factor for each process in the operational stream. The energy-intensity indi-cators for the processes have been previously explained (see Section 3.5 “Energy-IntensityIndicators for Processes”).
The material input factor is defined as the amount (tonnes) of input material that must besupplied to a process to produce a tonne of output. Since most processes lose material dueto oxidation of the metal and the scrapping of material that is off specification, the inputfactor is often greater than one. Process input factors for each process are calculated fromthe material input and output data reported by the participating plants.
16
BENCHMARKING ENERGY INTENSITY IN THE CANADIAN STEEL INDUSTRY
3 METHODOLOGY
The processes required for a plant are linked by the material input factors to determinehow much each process must produce for the plant to make one tonne of product. Thatnumber is then multiplied by the process energy-intensity indicator to establish the contri-bution that the process makes to the overall plant energy-intensity indicator. The plantenergy-intensity indicator is the sum of the contributions of each process.
Figure 3.1 shows the operational stream for the EcoTech EAF Bar Plant and the EcoTechinput factors that link the EAF, Continuous Casting and Bar Mill processes.
First, the amount of product that each process must make to produce a tonne of bar productis calculated by linking the input factors:
• tonnes of cast steel/tonne of bar = Bar Mill input factor = 1.031
• tonnes of liquid steel/tonne of bar = Bar Mill input factor × Continuous Casting inputfactor = 1.031 × 1.020 = 1.05
The plant energy-intensity indicator can then be calculated by adding the products of theamount of product required and the energy-intensity indicator for each process:
• Energy-intensity indicator for EcoTech EAF Bar Plant = Bar Plant energy-intensityindicator + (tonnes of cast steel/tonne of bar × Continuous Casting energy-intensityindicator) + (tonnes of liquid steel/tonne of bar × EAF energy-intensity indicator)
i.e. 2236 + (1.031 × 101) + (1.05 × 5154) = 7760 MJ/tonne of bar
Energy-intensity indicators for the production of intermediate products can be determinedin a similar manner. For example, referring again to Figure 3-1, the energy-intensityindicator for the EcoTech EAF Billet Plant would be:
• Energy-intensity indicator for EcoTech EAF Billet Plant = Continuous Casting energy-intensity indicator + tonnes of liquid steel/tonne of billets × EAF energy-intensity indicator
i.e. 101 + (1.02 × 5154) = 5358 MJ/tonne of billets
Figure 3-2 illustrates how the processes for an integrated mill can be linked in a similarmanner to obtain the “Model” EcoTech Integrated Hot Strip Coil Plant energy-intensityindicator. The integrated plant situation has the additional complication of the need toincorporate the plant utilities into the calculations. The plant energy-intensity indicatorfor the production facilities (peach boxes) is determined first. The overall plant energy-intensity indicator can then be determined by adding in the utilities’ energy consumptions(fuel gases to the boilers and flares) and credits (steam and electricity).
BENCHMARKING ENERGY INTENSITY IN THE CANADIAN STEEL INDUSTRY
METHODOLOGY 3
173.6.1 EAF Plant Energy-Intensity IndicatorsThe process areas studied at the EAF plants are shown as peach boxes in Figure 2-2. Theelectric arc furnace and continuous casting processes are separate production stages; but atmost plants, they are treated as a single unit for energy metering and accounting.Therefore, in this study, arc furnace steelmaking and casting are combined.
The EAF plant consists of arc furnace steelmaking, casting and hot rolling operations. Thelatter can encompass one or more of four hot rolling processes – rod, bar, heavy section orhot strip rolling. These hot rolling processes differ according to the size and shape of theproduct made. Therefore, the EcoTech energy-intensity value is not the same for eachprocess. To enable a meaningful and fair comparison of the plants, a separate “Model”plant energy-intensity indicator was determined for each of the four hot rolling processes.
3.6.2 Integrated Plant Energy-Intensity IndicatorsThe process areas studied at the integrated plants are shown in Figure 2-4. They are dividedinto two categories: production processes, which are shown as peach boxes; and plant utili-ties, which are shown as blue boxes. The division is required in order to achieve meaningfulcomparisons of plant performance. (Note that plant utilities in EAF plants are insignificantcontributors to the overall plant energy balance because of the type of equipment used,e.g. no coke ovens, blast furnaces.)
The design and operation of integrated plant production processes are influenced by suchpriorities as productivity, cost, product quality and available raw materials. The utilities’processes are designed and operated to minimize energy cost. Recognition of this differenceis important.
Plant utilities offer the following opportunities to reduce energy consumption and cost:
• distribution of plant by-product fuels (coke oven gas, blast furnace gas, basic oxygenfurnace gas) for use in process heating applications, thus reducing or eliminating theneed to purchase other fuels (natural gas, oil)
• conversion of plant by-product fuels into other energy forms (steam, electricity, compressedair) to meet the demands of the production processes and minimize the purchase of fueland electricity
• sale of surplus or unusable energy (such as hot water for district heating)
Since the influence of the plant utilities on the overall integrated plant energy efficiency isimmense, the effect of the utilities must be separated in order to isolate any energy efficiencygains in the production stream. Also, it is not possible to proportion the operation of theplant utilities to the individual production processes. For example, the flaring of unused plantby-product fuels depends on the demand for such fuels at other processes throughout theplant. The demand, in turn, is related to such aspects as the plant operating level and thecapability of the power plant to convert the fuels to steam or electricity. Hence, the flaring ofa given by-product fuel cannot be attributed to the process that produces that fuel.

18
BENCHMARKING ENERGY INTENSITY IN THE CANADIAN STEEL INDUSTRY
3 METHODOLOGY
In this study, a number of comparisons of plant performance were made. The energyefficiency of the production process stream was evaluated first for each intermediate productand then for the final hot rolled product without considering the effect of the plant utilities.The energy efficiency for the final hot rolled product was then established when the effects ofthe plant utilities were included.
For plants that operate two or more hot rolling processes (e.g. a hot strip mill, a cast-and-roll hot strip mill, a plate mill), the utilities (gas flares, water supply and treatment, andpower plant) were allocated to each process in proportion to the quantity of hot rolledproduct that was produced by each process.
3.7 Energy-Intensity Indicators for Reheating Furnaces
Hot rolling processes are common to both EAF plants and integrated plants, so they canbe compared at the process level. Reheating is the first operational stage in producing hotrolled products, with each hot rolling facility being equipped with one or more reheatingfurnaces to heat the semifinished steel to a uniform rolling temperature (1000 to 1250°C).Although the reheating furnace is not a separate process, it is studied separately in thepresent study for the following reasons:
• Reheating furnaces consume 60 percent or more of the total energy required forhot rolling.
• Most of the opportunities for applying energy-saving technologies in hot rolling arerelated to reheating furnaces.
• The penetration of energy-saving technologies for reheating furnaces cannot beevaluated at the overall hot rolling process level because some mills are equipped withtwo or more furnaces with different degrees of technical sophistication.
The energy-intensity indicators for each reheating furnace at each participating plant werecalculated by the “Reporting Form – Reheating Furnaces” spreadsheet.
3.8 CO2 Emission-Intensity Indicators
CO2 emission-intensity indicators are derived by applying emission factors to the energycomponents of the energy-intensity indicators. Hence, the CO2 emission-intensity indica-tor will depend not only on the process energy efficiency, but also on the energy resourceconsumed.
Emission factors for fuel (coal, carbon, coke, natural gas, oil, coke oven gas, blast furnacegas, BOF gas) are derived from the carbon content of the fuel. Participating plants wereasked to report CO2 emission factors for the fuels they consumed. Chemical analysis offuels was also requested so that emission factors could be checked.

BENCHMARKING ENERGY INTENSITY IN THE CANADIAN STEEL INDUSTRY
METHODOLOGY 3
19A significant amount of natural gas was consumed by all participating plants. Five plantsfrom three provinces provided analyses of natural gas that yielded emission factors rangingfrom 55.77 to 56.06 g CO2/MJ. Based on these data, an emission factor of 56 g CO2/MJwas used for all reported natural gas consumption.
The emission factor for carbon is 3664 kg CO2 per tonne of carbon.
There was considerable variation in the chemical analyses and CO2 emission factors forthe other fuels, especially the by-product fuel gases produced at the integrated plants.Therefore, plant-specific emission factors were used. Carbon balances were performed onthe coke oven, blast furnace and BOF process areas at each integrated plant to ensure thatthe carbon content (and hence CO2 emission factors) of their by-product fuel gases wasreasonable.
Appendix B contains a complete table of CO2 emission factors.
Fluxes are required in the ironmaking and steelmaking processes to separate impurities fromthe iron and steel. It is recognized that some materials when used as fluxes produce CO2
emissions. Two examples are limestone, which is mostly calcium carbonate (CaCO3), anddolomite, which is about 60 percent calcium carbonate and 40 percent magnesium carbonate(MgCO3). When heated, calcium carbonate breaks down to form CO2 and calcium oxide(CaO), which is a flux. Magnesium carbonate undergoes a similar reaction when heated toform CO2 and magnesium oxide (MgO), which is also a flux. Burnt lime, another commonterm for calcium oxide, is produced by the calcination of limestone in rotary cement kilns.There are no CO2 emissions from the ironmaking and steelmaking processes associated withthe use of burnt lime as a flux. The CO2 emission-intensity indicators in the present study donot include CO2 emissions resulting from the use of limestone and dolomite.
The CO2 emission-intensity indicator consists of three components: direct, utilities andexternal. Direct emission intensity considers emissions from sources within the processboundary. The utilities emission-intensity component takes into account emissions fromfacilities that supply utilities (steam, water, etc.) that are located outside of the process itselfbut are within the boundary of the plant. When benchmarking processes at different plants,standard emission factors are used for the utilities. This ensures the CO2 emission-intensityindicators for the processes depend only on the technologies and practices within the processarea boundary. When comparing plants, the actual emission factors for the production of theutilities at the plant being considered must be used because the facilities providing theutilities are within the plant boundary.
The external emission-intensity component in the present study is limited to the consump-tion of electricity used directly by the process and by the oxygen plant to produce anyoxygen consumed by the process. Emissions associated with the production and delivery ofother energy forms (natural gas, oil) and of raw materials (burnt lime, coal, iron ore, scrap,etc.) were not considered.
20
BENCHMARKING ENERGY INTENSITY IN THE CANADIAN STEEL INDUSTRY
3 METHODOLOGY
As explained in Section 3.1, “Energy-Intensity Indicators,” the heat rate (energy value) forelectricity is fixed at the amount for a coal-fired plant – 9200 MJ/MWh. That value isapplied to all plants, regardless of the actual value for electricity produced by their utilitysupplier. To be consistent, the CO2 emission factor used to calculate external CO2 emission-intensity indicators is 856 kg/MWh. By using these factors, the results are comparable withthe IISI and ESEC benchmarking practice. These factors are also considered to represent themarginal emission value. (The marginal emission value is the change in emissions that wouldoccur if electricity demand were increased or decreased.) This assumption would be valid forjurisdictions that have modern coal-fired plants in operation or that have grid connections tojurisdictions that use coal-fired plants.
It must be emphasized that for benchmarking, the same factors for electrical energy andCO2 emissions must be applied to all plants, regardless of the actual value for electricityproduced by their utility supplier. All Canadian jurisdictions generate electrical energy withsome facilities other than coal-fired plants. Therefore, the average heat rate and CO2 emis-sion factor for the various generation facilities in any Canadian jurisdiction will be muchlower than the numbers used in the present study. For example, in Quebec, where hydroplants generate most of the electricity, the average heat rate and CO2 emission factor fortheir generation facilities would be close to zero.
RESULTS4
22
BENCHMARKING ENERGY INTENSITY IN THE CANADIAN STEEL INDUSTRY
4 RESULTS
4. RESULTS
4.1 Interpretation of the Results
The data presented in this section are energy-intensity and CO2 emission-intensity indicators.These indicators were designed and are intended for the sole use of evaluating the efficiencywith which energy is consumed by the process or plant being evaluated. The indicators illus-trate how changes in technology and practice within the boundary of the particular processunder review could improve energy efficiency and reduce CO2 emission intensity.
The energy-intensity and CO2 emission-intensity indicators, although expressed in identicalunits, are not specific energy consumptions and specific CO2 emissions, neither for theprocesses and plants evaluated nor for the industry as a whole. They can differ significantlyfrom the actual specific energy-consumption numbers and specific CO2 emission numbersfor the participating steel plants. (The reasons for the differences are given in Section 3.1,“Energy-Intensity Indicators.”) Therefore, they must not be used for energy consumptionand emission reporting.
The energy-intensity indicators for fuel consumption are based on the lower (or net) heat-ing values for the fuels consumed. They will differ from indicators derived from Canadianfuel consumption energy-reporting data, which are based on the higher (or gross) heatingvalue for the fuels consumed.
The energy-intensity and CO2 emission-intensity indicators provide some insight into thepotential to improve energy efficiency and reduce CO2 emission intensity by implementingavailable technology. However, quantifying the potential to improve energy efficiency andreduce CO2 emission intensity is not an objective of this study, and the methods used forenergy benchmarking are not intended for that purpose.
The results identify opportunities for implementing technologies that are technically possible.However, the implementation of a particular technology may not necessarily be economicallyattractive. That decision can be made only by the plants that are considering the technology.
4.2 Presentation of the Results
The results for each process area are arranged and numbered so that the energy-intensityindicator, technology penetration and CO2 emission-intensity indicator for a particularparticipating plant are linked.
Each bar on the Energy-Intensity Indicator charts for a particular process area (or reheatingfurnace type or plant) represents the performance of that process at a participating plant. Thefirst bar is always the EcoTech Plant. The adjacent bars are arranged and numbered in order
BENCHMARKING ENERGY INTENSITY IN THE CANADIAN STEEL INDUSTRY
RESULTS 4
23of energy-intensity-indicator ranking for the process. For example, Plant 1 is the plant withthe best energy-intensity indicator; Plant 2 is the second best, etc. The plant numbers areprovided to link the energy-intensity indicator, technology penetration and CO2 emission-intensity indicator of a plant.
The arrangement and numbering of the columns in the Technology Penetration tables arethe same as those on the corresponding Energy-Intensity Indicator charts. If a plant isPlant 2 on the Energy-Intensity Indicator chart for a particular process, it is also Plant 2on the Technology Penetration table for that process. Hence, the energy-intensity indica-tor bar and the technology penetration for a particular plant will be in line on the charts.
The arrangement and numbering of the plants on the CO2 Emission-Intensity Indicatorcharts are also the same on the corresponding Energy-Intensity Indicator charts. If a par-ticular process at a plant is shown as Plant 2 on the Energy-Intensity Indicator chart, it isalso shown as Plant 2 on the CO2 Emission-Intensity Indicator chart.
There is no specific relation between the numbering of the plants on the charts and tables,and the identity of the plants. Also, there is no correlation between the numbering of theplants on the charts and tables from one process area to another.
4.3 Process Areas
4.3.1 Cokemaking – Figures 4-1 and 4-2Energy-Intensity Indicators
• Canadian cokemaking operations are significantly less efficient than those of the EcoTechPlant. Based on the energy-intensity indicators, they require 60 to 110 percent moreenergy than does the EcoTech Plant. Since the addition of the EcoTech Technologiesto the operating plants would not bring their efficiency into line with that of theEcoTech Plant, other factors must be adversely affecting the energy efficiency.
• All plants use more fuel (15 to 60 percent) for coke oven underfiring than does theEcoTech Plant.
• All plants use much more steam (four to seven times more) than does the EcoTech Plant.
• All plants use much more electricity (60 to 115 percent) than does the EcoTech Plant.
Technology Penetration
• High-pressure ammonia liquor spray aspiration could be employed to replace steamaspiration at the three plants that do not have this technology.
• Variable speed drives could be installed at all plants to reduce electricity and steam con-sumption. The opportunity would be less for Plants 1 and 4, which reported that theyalready use variable speed steam drives.
24
BENCHMARKING ENERGY INTENSITY IN THE CANADIAN STEEL INDUSTRY
4 RESULTS
• Enhanced combustion control should be investigated as a means of reducing fuelconsumption at all plants. Although Plant 3 uses this technology, fuel consumption hasroom for improvement.
• The remaining technologies offer potential for further energy savings but may not beeconomically feasible. The applicability of these technologies should be investigatedafter the other improvements are in place.
CO2 Emission-Intensity Indicators
• The high direct CO2 emission-intensity indicator for Plant 2 results from using blastfurnace gas to underfire the coke ovens.
Other Considerations
• Enhanced combustion control improves combustion efficiency by reducing the amountof excess combustion air. However, there may be reasons why combustion efficiencycannot be improved. The age and condition of coke ovens affects the fuel required forunderfiring. As ovens deteriorate, excess combustion air levels, which rob heat from theovens, must be increased to prevent smoking, which is environmentally unacceptable.Under such conditions, better combustion control cannot be employed. Further inves-tigation is required to establish if the apparent potential for the application of enhancedcombustion control is feasible.
• The partial penetration of technology for high-pressure ammonia liquor spray aspira-tion, by itself, does not account for the high steam consumption. There have to beother reasons to explain the difference in steam consumption. Information about thetechnologies used at the by-product plant and the products produced was not given forthe EcoTech Plant and was not collected for the plants participating in the present study.It may well be that the by-product plants operating in Canada are of broader scope, ordiffer considerably in function and equipment, than those used to define the EcoTechPlant. If so, the EcoTech Plant may not be a fair comparison for the Canadian plants.However, considering the quantity of steam consumed at the cokemaking plants, thereis likely an opportunity to increase energy efficiency through improved steam systempractices (insulation of lines and equipment, steam trap maintenance, steam leak repair,condensate recovery, etc.). Improved efficiency of equipment (steam turbines, heatexchangers, distillation and mass transfer equipment) may also be possible.
• The large potential indicated for reduction in electricity consumption also cannot beexplained by technology penetration. Such high intensity relative to the EcoTechbenchmark indicates that the easy and lucrative electrical-energy-reduction practices arenot in place. Considering that electricity is an external energy source and cost, an auditof electricity use is recommended.
Before embarking on measures to reduce coke oven fuel and steam consumption, seeSection 4.5.2, “Energy Management at Integrated Steel Plants.”
BENCHMARKING ENERGY INTENSITY IN THE CANADIAN STEEL INDUSTRY
RESULTS 4
254.3.2 Ironmaking – Figures 4-3 to 4-7For the purpose of better understanding the differences in performance and identifyingpotential energy-intensity-improvement opportunities, the ironmaking process area is sub-divided into four areas: blowing, stoves, blast furnace and pulverized coal preparation.These four areas work as a system, and it is necessary to adjust operating practice so thatthe combined results are optimized. Therefore, it is sometimes necessary to operate one ofthe areas in a way that is less efficient in order to achieve a greater gain in efficiency for theoverall ironmaking process.
4.3.2.1 Blowing – Figure 4-3
Energy-Intensity Indicators
• Blowing efficiency could be improved at Plants 2, 3 and 4.
Technology Penetration
• Axial-flow blowers are in place at Plant 1. Considering that axial-flow blower efficiencycan reach 90 percent compared with 70 percent maximum efficiency for radial-flowblowers, this technology can reduce blowing energy consumption by 20 percent.Implementing axial-flow blowers at Plants 2, 3 and 4 would bring blowing energyconsumption in line with that of Plant 1.
• Three plants use oxygen enrichment rates of 50 normal cubic metres per tonne of hotmetal production (Nm3/thm) or more. That practice exceeds both the EcoTech Plantand AllTech Plant practices. The oxygen enrichment rate at the other plant is less thanthe 35 Nm3/thm rate for the EcoTech Plant. On average, this technology is wellestablished in Canada.
Other Considerations
The integrated plants studied are equipped with blowers driven by steam turbines. TheEcoTech Plant is based on using half the blowers with electrical drives and half with steamdrives. Both the steam and electricity supply are outside of the blowing process area.Therefore, the efficiency at which they are generated should not be reflected in the blowingenergy indicator. For an all-steam-drive situation, the EcoTech indicator would increase from740 MJ/thm to 804 MJ/thm. Plant 1 steam consumption of 823 MJ/thm comparesfavourably with that value.
Most Canadian plants operate with one blower. Hence, it would not be possible to operatewith half electrical drives and half steam drives, as suggested by the EcoTech Plant.
Blowers are extremely expensive equipment, and increased energy efficiency alone wouldnot justify replacing them.
Aside from equipment technology (axial flow versus centrifugal blowers), the energyrequired for blowing is proportional to the mass of air delivered. Since the purpose ofblowing is to deliver oxygen to the blast furnace for combustion of the fuel, oxygen
26
BENCHMARKING ENERGY INTENSITY IN THE CANADIAN STEEL INDUSTRY
4 RESULTS
enrichment reduces the volume of air needed, with each cubic metre of oxygen enrichmentreducing the air requirement by five cubic metres.
The energy requirement for blowing also increases in proportion to the pressure at whichthe air is delivered. Higher pressure improves the performance of the blast furnace andenables a reduction in the amount of coke used in the furnace. These factors offset thehigher blower energy consumption.
Blowing energy also depends on the steam available to power the turbines that drive theblowers. Steam at higher pressure and temperature can be more efficiently converted intopower by the turbines. However, the effect of steam pressure was not reflected in theresults.
Before embarking on measures to reduce blowing steam consumption, see Section4.5.2, “Energy Management at Integrated Steel Plants.”
4.3.2.2 Stoves – Figure 4-4
Energy-Intensity Indicators
• All plants use more fuel (14 to 42 percent) for stove heating than does the EcoTechPlant.
• Plants 2 and 3 use much more electricity (four to seven times as much) than does theEcoTech Plant.
• Plant 4 was operating with abnormally high excess combustion air due to damagedstove burners. That mode of operation decreases combustion efficiency and helpsexplain the high energy intensity.
Technology Penetration
• Waste-heat-recovery technology could be implemented at three plants to reduce fuelconsumption.
• Staggered/parallel stove operating practice is not used and is not feasible for Canadianplants. The staggered/parallel stove operating practice employed by the EcoTech Plantrequires four stoves, whereas Canadian blast furnaces operate with three stoves. (Stovesare extremely expensive, and it is more economical to build three large stoves than foursmaller stoves.) Staggered/parallel stove operating practice is economically attractiveonly for plants that already have four stoves.
• Oxygen enrichment of the blast is used at all plants (see Figure 4-3 for details). There islittle potential to increase the use of this technology.
• None of the plants has stove combustion controls that achieve the EcoTech Plant practiceof limiting the excess combustion air to 5 percent. Some operations require higher excessair levels during the later part of the heating cycle to cool the flame, so that the flame tem-perature will not exceed the melting temperature of the stove dome refractory. Such opera-tions would need to first implement individual stove fuel-blending technology to enableonly cool-burning blast furnace gas for the later part of the heating cycle.

BENCHMARKING ENERGY INTENSITY IN THE CANADIAN STEEL INDUSTRY
RESULTS 4
27• The stove efficiency at all plants is less than the 85 percent EcoTech Plant level. Stove
efficiency is a metric that reflects the overall performance of the stoves and is not relatedto a specific technology or practice. It is more meaningful than the energy-intensityindicator. Higher stove energy per tonne of hot metal production may be more an indi-cator of the amount of energy supplied to the blast furnace in the hot blast than anindicator of energy efficiency of the stoves. The fuel required at the blast furnace can bereduced by supplying more energy to the blast furnace in the hot blast from the stoves.
Other Considerations
Waste-heat-recovery technology is employed by the EcoTech Plant to reduce stove fuelconsumption. (Stove efficiency is increased by using heat in the waste gas to preheat com-bustion air.) Waste-heat-recovery technology is in place only at Plant 2. However, it is adifferent technology than that referenced in the EcoTech Plant. The heat is recovered andused externally for another process that, in turn, reaps the benefit.
The large potential indicated for reduction in electricity consumption at Plants 2 and 3cannot be explained by technology penetration. Such poor efficiency relative to the bench-mark is an indication that the easy and lucrative electrical-energy-reduction practices arenot in place. Considering that electricity is an external energy source and cost, an audit ofelectricity use is recommended. The first place to look would be the efficiency and operat-ing practice of the stove combustion air fans, which are the large electricity consumers.
Before embarking on measures to reduce stove fuel consumption, see Section 4.5.2,“Energy Management at Integrated Steel Plants.”
4.3.2.3 Blast Furnace – Figure 4-5
Energy-Intensity Indicators
• Furnace 1 is operating as efficiently as the blast furnace of the EcoTech Plant.
• Furnaces 2 and 4 have achieved the EcoTech Plant coke rate.
• Furnace 4 uses considerably more fuel than the others do. It may have an opportunityto reduce furnace fuel consumption.
Technology Penetration
Blast furnace injectants (fuels injected to reduce the amount of coke required) are usedextensively at all plants. The use of blast furnace fuel injection is not intended to reducethe energy intensity of the blast furnace process. In fact, this technology may cause a blastfurnace to operate at higher energy intensity. The purpose of blast furnace fuel-injectiontechnology is to reduce the dependency on coke, which decreases the overall plant energyconsumption per tonne of product, because cokemaking is energy intensive.
• An additional bar has been added to the chart to show the combined performance ofall four blast furnaces. As a whole, the rate of blast furnace fuel injection has exceededthe EcoTech level of 3870 MJ/thm, and the coke rate is approaching that of theEcoTech Plant.
28
BENCHMARKING ENERGY INTENSITY IN THE CANADIAN STEEL INDUSTRY
4 RESULTS
• Plants 2 and 4 have reduced specific coke consumption to the EcoTech Plant level.However, both furnaces have fuel-injection rates and, consequently, total fuel rates,which are considerably higher than the rates of the EcoTech Plant.
• Plant 3 has potential to increase blast furnace fuel injection by 50 percent. That wouldachieve the EcoTech Plant injection rate and bring with it a 15 percent reduction inspecific coke consumption.
The other plants have some potential to increase the use of injectants and to reduce thecoke rate.
Blast furnace top gas recovery turbine technology has not been implemented in Canada.The potential amount of energy to be recovered using this technology increases with thepressure at the top of the blast furnace. Canadian blast furnaces are designed to operate ata relatively low furnace-top pressure. Therefore the potential for recovering energy wouldbe less than that for the EcoTech Plant, and the technology may not be economicallyattractive. Also, the price of electricity in Ontario, the province in which all Canadian blastfurnaces are operated, has been historically low relative to the price in other countries.However, as the price escalates, a second look would be warranted.
Other Considerations
Using the EcoTech Plant coal-injection rate may not be appropriate for Canada’s blast fur-naces. Natural gas is readily available and relatively inexpensive in Ontario. Based on the per-formance of Furnaces 1 and 2, it appears to be the most effective and most favoured injec-tant. Coal and oil are favoured in other jurisdictions because of lower cost. Fuels that containsulphur (coal, oil) can be used in the blast furnace because the sulphur is removed in the slag.
4.3.2.4 Pulverized Coal Injection (PCI) Preparation – No Figure
Considerations
• The EcoTech energy-intensity indicator includes the energy for preparation of pulver-ized coal for injection. Since only one plant has a PCI preparation facility, data cannotbe shown and no comparison of Canadian operations can be made.
• Including PCI preparation could be considered unfair because the preparation energyfor other injectants (cleaning and pressurization of natural gas, refining of oil) is notincluded. However, PCI preparation energy is a small component of the total ironmak-ing energy and is included only to be consistent with the reference EcoTech Plant.
4.3.2.5 Ironmaking – Figures 4-6 and 4-7
Energy-Intensity Indicators
• The overall energy efficiency of ironmaking is dominated by the Blast Furnace performance.
• The cumulative effect of the energy consumption in the Blowing, Stoves and PCIPreparation areas is apparent, and inefficiencies in those areas contribute to the differ-ences between the performance of Plants 1–4 and that of the EcoTech Plant.
BENCHMARKING ENERGY INTENSITY IN THE CANADIAN STEEL INDUSTRY
RESULTS 4
29Technology Penetration
• Technology penetration is evaluated and discussed in Sections 4.3.2.1, 4.3.2.2 and4.3.2.3 (above).
4.3.3 Basic Oxygen Furnace (BOF) Steelmaking – Figures 4-8 and 4-9Energy-Intensity Indicators
• The energy credit for plants equipped with suppressed combustion hoods to collectBOF gas as a fuel is more than twice that for plants equipped with full combustionhoods that burn the gas as it evolves from the vessel to produce steam.
• All plants use twice as much electricity as does the EcoTech Plant. The carbon and oxygenenergy inputs at all plants are in line with the EcoTech Plant practice. However, the use ofother energy inputs (natural gas, steam, electricity) is greater than that for the EcoTech Plant.
Technology Penetration
• Two plants are equipped with BOF gas recovery systems. These systems use wet gasscrubbers to clean and cool the gas. The EcoTech Plant is equipped with a dry gascleaning system, and the gas is cooled by steam generators that recover the heat. Gasrecovery technology employing dry gas cleaning and steam recovery is required toachieve the energy efficiency of the EcoTech Plant.
• All plants practice ladle management and use lids to retain heat in the ladles. Ladleheaters are not equipped with waste heat recovery (recuperators).
CO2 Emission-Intensity Indicators
• CO2 emission intensity for plants equipped with gas recovery systems is low because thegas is delivered to other process areas, which include gas flares.
Other Considerations
• Energy recovery offers the largest opportunity to improve BOF efficiency. Gas collec-tion technology is economically attractive when building new facilities, but it is mostlikely not economically feasible to abandon the steam recovery systems already in useand replace them with gas recovery systems.
• Canadian plants that recover waste heat as steam are equipped with half-boiler technol-ogy, in which the gas is partially cooled in a radiant boiler hood. Full-boiler steamrecovery technology includes the radiant boiler hood followed by a convection boilertube bank.13 The amount of energy recovered as steam by the full-boiler technologyapproaches that which can be recovered by the gas collection system. Plants equippedwith steam recovery systems might be better advised to consider upgrading to thefull-boiler technology, rather than converting to a gas collection system.
• The relative advantage of gas recovery systems depends on how the recovered gas is used.Both plants that recover BOF gas have not invested in the gasholder and distributionsystem required to deliver the gas to potential users. Hence, the gas is flared, resulting in
13 See Chapter 6, reference 3, page 119.
30
BENCHMARKING ENERGY INTENSITY IN THE CANADIAN STEEL INDUSTRY
4 RESULTS
an energy-intensity disadvantage compared with the plants equipped with steam recoverysystems.
• The excessive use of electricity may reflect high utilization of the ladle metallurgyfacility (LMF) at the plants. The LMF is an electric arc furnace that adjusts the temper-ature and chemistry of the steel prior to casting. The amount of steel treated in theLMF depends on the grades of steel produced, with plants that produce high-gradesteel having greater LMF utilization and electricity consumption.
• The LMF can also be used to increase steel production. More scrap is added to theBOF, which results in a drop in liquid steel temperature, but the temperature isrestored by electrical-energy input at the LMF. This practice should be competitivewith, and as energy efficient as, electric arc furnace steelmaking.
4.3.4 Electric Arc Furnace (EAF) Steelmaking and Continuous Casting –Figures 4-10 and 4-11Note: To be consistent with the energy-intensity indicators provided for the EcoTechPlant, EAF Steelmaking and Continuous Casting are shown as separate processes inFigure 3.1. However, it was not possible to separate them for energy benchmarkingbecause most EAF plants meter and account for EAF Steelmaking and Casting energyflows as single entities. Also, while four integrated plants took part in the study, eight ofthe nine EAF plants took part.
Energy-Intensity Indicators
• All plants consume 35 to 700 percent more natural gas than does the EcoTech Plant.
• All plants consume 2 to 40 percent more electricity than does the EcoTech Plant.
Technology Penetration
• All nine plants incorporate at least five of the eight EcoTech Technologies. Five plantshave six and one plant has seven of the EcoTech Technologies in place. Average pene-tration of EcoTech Technologies is 76 percent (six of eight plants), an indication thatthere is not a lot of opportunity left.
CO2 Emission-Intensity Indicators
• Oxy-Fuel Burners and Supplementary Fuel are two EcoTech Technologies that reducethe energy intensity of the EAF process. Use of fuel, of course, increases direct emis-sions. However, the consumption of electricity is reduced, and the resulting reductionin indirect emissions can result in a net emission reduction if fossil fuel power genera-tion is on the margin. (A power generation facility is deemed to be on the margin if itis dispatched to respond to the incremental increases and decreases in demand.)
Other Considerations
• No correlation can be seen between technology penetration and the energy-intensity per-formance of the plants. Plant utilization also failed to explain the difference in plant effi-ciency. It appears that other operating and general energy-management practices must beinfluencing the energy efficiency of the EAF Steelmaking and Casting process area.

BENCHMARKING ENERGY INTENSITY IN THE CANADIAN STEEL INDUSTRY
RESULTS 4
314.3.5 Continuous Casting – Figures 4-12 and 4-13Note: The results in this section are for the integrated plants where casting operationenergy flows are metered and accounted for separately.
Energy-Intensity Indicators
• All plants consume 80 to 450 percent more energy than does the EcoTech Plant.
Technology Penetration
• There are no energy-saving technologies specific to the Continuous Casting process.
Other Considerations
• General energy-saving practices and technologies should be investigated as a means ofbringing caster energy efficiency into line with that of the EcoTech Plant benchmark.
4.3.6 Hot Strip and Plate Mills – Figures 4-14 and 4-15Energy-Intensity Indicators
• The Hot Strip Mills consume 20 to 270 percent more fuel than does the EcoTechPlant Hot Strip Mill.
• The Plate Mills consume 220 to 570 percent more energy than does the EcoTech PlantPlate Mill.
• Except for Plant 7, the energy-intensity ranking of each plant is determined by fuelconsumption.
Technology Penetration
• Four of the six Hot Strip Mills are equipped with Coilbox technology; only one mill isequipped with Thermal Cover technology. The Coilbox and Thermal Cover technolo-gies reduce heat loss from the steel during rolling. By reducing the heat loss, less heatneeds to be supplied to the steel by the reheating furnace, which reduces furnace fuelconsumption. Also, the steel remains at a higher temperature throughout the rollingprocess, which reduces the electrical power required to form it during rolling.
• Schedule-Free Rolling, Transfer Bar Edge Heating and High Edging Capability aretechnologies that facilitate hot slab charging.14 The poor penetration of hot slab charg-ing, which is shown in Section 4.6.1, “Slab Reheating Furnaces,” may be attributed tothe lack of implementation of these rolling mill technologies.
• One mill is equipped with Alternating Current Roughing Mill Motor. Alternatingcurrent motors are more efficient than the traditional direct current drives.
• The energy-intensity ranking of the mills is, almost without exception, a reflection ofthe energy-intensity ranking of their slab reheat furnaces. The penetration of energy-saving furnace technology for the furnaces operated at these mills is shown inSection 4.6, “Reheating Furnaces.”
14 See Chapter 6, reference 1, section 3.6.4.6, page 104.
32
BENCHMARKING ENERGY INTENSITY IN THE CANADIAN STEEL INDUSTRY
4 RESULTS
Other Considerations
• There is major potential for the Hot Strip Mills and Plate Mills to increase the energyefficiency in their slab reheating operation. That potential, and the penetration of appli-cable furnace energy-saving technologies, is also discussed in Section 4.6, “ReheatingFurnaces.”
4.3.7 Section Mills – Figures 4-16 and 4-17Energy-Intensity Indicators
• Section Mills are divided into three categories based primarily on the size (section areaor weight per metre) of the product. The EcoTech Plant energy efficiency is differentfor each category. The Medium Section (Bar) Mill requires the least energy. The LightSection (Rod) Mill requires more energy in the rolling process because the steel has tobe worked down to the smaller section. Heavy Section (Bloom and Structural) Millsrequire more energy because it is more difficult to heat the large blooms that feed thesemills and to roll the complex structural shapes.
• The Section Mills consume from 10 percent less to 90 percent more fuel than do themills of the EcoTech Plant.
• Fuel consumption at Plants 1, 2, 4, 5, 6 and 7 is in line with that of the EcoTech Plant,indicating efficient furnace operation.
• Electricity consumption at Plants 4, 5, 7, 11 and 12 is less than that of the EcoTechPlant.
Technology Penetration
• The penetration of energy-saving furnace technologies for Section Mills is shown inSection 4.6.2, “Billet and Bloom Reheating Furnaces.”
• There are no EcoTech Technologies for Section Mill rolling equipment.
4.4 Plants
This section provides energy-intensity and CO2 emission-intensity indicators for plants.
Penetration of technology and practices was evaluated at the process level and, therefore, isnot repeated at the plant level.
In addition to reflecting the energy intensity and CO2 emission-intensity of the processesthat make up the plants, the plant results also indicate the effect of product input factors.The energy used to produce intermediate product, which is lost to oxidation or scrapped/recycled because it is unsuitable for further processing or sale, is distributed over the finalproduct.
Interpretation and comments on the plant results are limited to new insight that was notapparent in the results for the processes.
BENCHMARKING ENERGY INTENSITY IN THE CANADIAN STEEL INDUSTRY
RESULTS 4
334.4.1 EAF PlantsThe plant results show the energy-intensity indicator and the CO2 emission-intensityindicator for each hot rolled product made by the EAF plants. The EAF plants wereconstructed by coupling the EAF Steelmaking and Casting process at each EAF plant toeach hot rolling process in operation at that particular plant.
4.4.1.1 EAF Rod Plant – EAF, Caster and Rod Mill – Figures 4-18 and 4-19
This plant produces rod products from steel made by the EAF process. The plant is con-structed by linking the EAF Steelmaking and Continuous Casting processes (Figure 4-10)and Rod Mills (Figure 4-16). Billet and Bloom Reheating Furnaces (Figure 4-50) alsoprovides some insight into the relative performance of the EAF Rod Plants.
The energy intensity of the EAF Rod Plants is 12 to 21 percent more than that of theEcoTech Plant. Plant 2 consumes 33 percent more electrical energy than does theEcoTech Plant.
4.4.1.2 EAF Bar Plant – EAF, Caster and Bar Mill – Figures 4-20 and 4-21
This plant produces bar products from steel made by the EAF process. The plant is con-structed by linking the EAF Steelmaking and Continuous Casting processes (Figure 4-10)and Bar Mills (Figure 4-16). Billet and Bloom Reheating Furnaces (Figure 4-50) alsoprovides some insight to the relative performance of the EAF Bar Plants.
The energy intensity of the EAF Bar Plants is 14 to 60 percent more than that of theEcoTech Plant.
4.4.1.3 EAF Hot Strip Plant – EAF, Caster and Hot Strip Mill – Figures 4-22 and 4-23
This plant produces hot strip coils from steel made by the EAF process. The plant is con-structed by linking the EAF Steelmaking and Continuous Casting processes (Figure 4-10)and Hot Strip Mill (Figure 4-14). Slab Reheating Furnaces (Figure 4-49) also providessome insight to the relative performance of the EAF Hot Strip Plants.
The energy intensity of the EAF Hot Strip Plants is 14 to 40 percent more than that ofthe EcoTech Plant.
4.4.2 Integrated PlantsThe plant results show the energy-intensity and CO2 emission-intensity indicators for eachintermediate product (liquid iron, liquid steel and cast steel) and for final hot strip andplate products. Additional plants are provided for the production of final hot strip andplate products with the inclusion of plant gas flares and plant utility processes (gas flares,water supply and treatment, and power plant).
4.4.2.1 Integrated Iron Plant – Cokemaking and Ironmaking – Figures 4-24 and 4-25
The first intermediate product of the integrated plant is liquid iron (often referred to ashot metal). The Integrated Iron Plant is configured by linking the Cokemaking process(Figure 4-1) to the Ironmaking process (Figures 4-3 to 4-6).
34
BENCHMARKING ENERGY INTENSITY IN THE CANADIAN STEEL INDUSTRY
4 RESULTS
4.4.2.2 Integrated Steel Plant – Coke Ovens, Blast Furnace and BOF – Figures 4-26 and4-27
The second intermediate product of the integrated plant is liquid steel. The IntegratedSteel Plant is configured by linking the BOF process (Figure 4-8) and the BOF Gas Flaresto the Integrated Iron Plant.
4.4.2.3 Integrated Semifinished Steel Plant – Coke Ovens, Blast Furnace, BOF and Caster– Figures 4-28 and 4-29
The final intermediate product of the integrated plant is semifinished (cast) steel. TheIntegrated Semifinished Steel Plant is configured by linking the Continuous Castingprocess (Figure 4-12) to the Integrated Steel Plant.
4.4.2.4 Integrated Hot Strip Plant – Integrated Semifinished Steel Plant and Hot StripMill – Figures 4-30 and 4-31
The Integrated Hot Strip Plant is configured by linking the Hot Strip Mill process(Figure 4-14) to the Integrated Semifinished Steel Plant.
For completeness of the present analysis of hot strip steel production, it is necessary tointroduce the cast-and-roll hot strip mill process at this stage. One integrated plant inCanada uses this process and the conventional hot strip mill process so, on an analyticalbasis, the number of plants under study increases from four to five. In this scenario, thecast-and-roll process is linked to the Integrated Steel Plant.
4.4.2.5 Integrated Hot Strip Plant and Gas Flares – Integrated Semifinished Steel Plant,Hot Strip Mill and Gas Flares – Figures 4-32 and 4-33
The Integrated Hot Strip Plant and Gas Flares is configured by linking the Hot Strip Millprocess (Figure 4-14) and the Gas Flares (Figure 4-46) to the Integrated SemifinishedSteel Plant.
4.4.2.6 Integrated Hot Strip Plant and Utilities – Integrated Semifinished Steel Plant,Hot Strip Mill and Utilities – Figures 4-34 and 4-35
The Integrated Hot Strip Plant and Utilities is configured by linking the Hot Strip Millprocess (Figure 4-14) and the Utilities to the Integrated Semifinished Steel Plant.
4.4.2.7 Integrated Plate Plant – Integrated Semifinished Steel Plant and Plate Mill –Figures 4-36 and 4-37
The Integrated Plate Plant is configured by linking the Plate Mill process (Figure 4-14) tothe Integrated Semifinished Steel Plant.
4.4.2.8 Integrated Plate Plant and Gas Flares – Integrated Semifinished Steel Plant,Plate Mill and Gas Flares – Figures 4-38 and 4-39
The Integrated Plate Plant and Gas Flares is configured by linking the Plate Mill process(Figure 4-14) and the Gas Flares (Figure 4-46) to the Integrated Semifinished Steel Plant.

BENCHMARKING ENERGY INTENSITY IN THE CANADIAN STEEL INDUSTRY
RESULTS 4
354.4.2.9 Integrated Plate Plant and Utilities – Integrated Semifinished Steel Plant, PlateMill and Utilities – Figures 4-40 and 4-41
The Integrated Plate Plant and Utilities is configured by linking the Plate Mill process(Figure 4-14) and the Utilities to the Integrated Semifinished Steel Plant.
4.4.3 EAF Plant with Direct Reduced Iron4.4.3.1 Direct Reduced Iron and Integrated Hot Strip Plants – DRI Plant, EAF, Caster,Hot Strip Mill, and Integrated Hot Strip Plant and Utilities – Figures 4-42 and 4-43
The MIDREX process, which produces solid direct reduced iron (DRI), is unique to oneCanadian plant and, therefore, was not included in the Process Areas section. The ironmade in the MIDREX® Shaft Furnace is usually melted and converted to steel by the EAFprocess and, therefore, is considered a substitute for scrap. The Direct Reduced Iron,Electric Arc Furnace, Hot Strip Plant (DRI-EAF Hot Strip Plant) is considered to be avariation of the EAF Hot Strip Plant, which was previously defined in Section 4.4.1.3.The only difference is that a portion of the scrap charged to the EAF is replaced with DRI.
The DRI-EAF Hot Strip Plant is included in this study to provide some insight as to how aplant based on an alternate iron-producing technology compares with an integrated plant.However, the process equipment and the material inputs and outputs for the DRI process dif-fer significantly from those of the blast furnace process. Therefore, any comparison betweenthe two is not consistent with normal energy benchmarking practice and is not intended toindicate how the energy intensity and CO2 intensity of either type of plant might be reduced.
The EcoTech DRI-EAF Hot Strip Plant includes EcoTech energy-intensity data for theMIDREX process.15
The energy intensity of the EAF process increases somewhat as increasing amounts of DRIare substituted for scrap. The EcoTech EAF energy-intensity indicator for a 100 percentscrap charge practice is 5079 MJ per tonne of liquid steel. The EcoTech EAF energy-intensityindicator for the typical practice of charging 60 percent DRI and 40 percent scrap is5805 MJ per tonne of liquid steel.16 (The EcoTech DRI-EAF Hot Strip Plant, in fact,includes the energy-intensity indicator for the 60 percent DRI and 40 percent scrap practice.)Accordingly, the EAF process at DRI Plant 1 on Figures 4-42 and 4-43, which operates closeto this DRI/scrap ratio, can be readily compared with that of the EcoTech DRI Plant.
Energy-Intensity Indicators
• The energy intensity of the EcoTech DRI-EAF Hot Strip Plant is close to that of theEcoTech Integrated Steel Hot Strip Coil Plant.
• The energy intensity of DRI-EAF Hot Strip Plant 1 is at the lower end of the range ofenergy intensity for the integrated plants.
• The DRI-EAF Hot Strip Plant uses significantly less fuel and more electricity than dothe integrated plants.
15 See Chapter 6, reference 1, page 179.16 See Chapter 6, reference 1, page 91.
36
BENCHMARKING ENERGY INTENSITY IN THE CANADIAN STEEL INDUSTRY
4 RESULTS
• Most of the electricity used in the DRI-EAF Hot Strip Plant is consumed by the EAFprocess. (Typically, melting and refining in an arc furnace accounts for close to 90 percentof the total electricity used in an EAF-based steel plant.)
CO2 Emission-Intensity Indicators
• The DRI Plant direct CO2 emission intensity is much less than that for the integrated plants.This reflects the lower fuel use at the DRI Plant, with natural gas being the major fuel input,whereas coal (coke and coke oven gas) is the major fuel input to the integrated plants.
• The DRI Plant indirect CO2 emission intensity is much greater than that for the integratedplants. This reflects the higher use of electricity in the EAF process and the assumption, inthe current study, that all electricity is produced at coal-fired power plants.
• The DRI Plant total CO2 emission intensity is less than that for the integrated plants.This reflects the use of natural gas, which is less carbon intensive than the coal used atthe integrated plants, and the higher level of scrap steel input to the DRI Plant.
Other Considerations
• The amount of scrap steel input for the DRI-EAF Plant is significantly different thanthat used for the integrated plant. Any proportion of DRI and scrap can be chargedinto the EAF steelmaking process, with a typical practice being a 60 percent DRI and40 percent scrap charge. For integrated plants, the scrap charged into the BOF steel-making process must be melted by the energy in the liquid iron derived from the blastfurnace process. This limits the amount of scrap that can be charged at the integratedplants, so that the typical practice is 10 to 20 percent. The energy intensity for producingsteel by melting scrap in the EAF is less than half that for producing steel from iron ore(see Section 2.2, “Energy Use,” for details) because no energy is required for convertingiron oxide (ore) to iron. Therefore, in the comparison of energy intensity for DRI-EAFPlants and integrated plants, the relative efficiency of the iron ore reduction process ismasked by the favourable effect of the higher level of scrap input to the steelmakingprocess at the DRI-EAF Plant.
• The MIDREX DRI process, which is natural gas based, offers an opportunity to produceiron and quality steel from energy sources other than coal and, hence, significantly reducethe CO2 emission intensity of steel production. The DRI process is followed by the EAFprocess, which is electricity intensive. However, if an EAF plant is in a jurisdiction whereelectricity is produced by hydraulic or nuclear power plants, and not by fossil-fuel-firedpower plants, it would, in fact, cause no indirect CO2 emission.17
17 As previously explained in Section 3, throughout the present study, all electrical-energy-intensity values havebeen converted to fossil fuel input using a factor of 9200 MJ/MWh, which assumes 100 percent fossil fuelgeneration. To be consistent, the CO2 emission factor used to calculate external CO2 emission-intensityindicators must be 856 kg/MWh. These factors were deemed to be representative of fossil fuel powergeneration in Europe by the International Iron and Steel Institute and the European Steel Energy Committee(see Chapter 6, references 1 and 2). By using these factors, the results of the present study are comparablewith IISI and ESEC benchmarking practice.
BENCHMARKING ENERGY INTENSITY IN THE CANADIAN STEEL INDUSTRY
RESULTS 4
37• The DRI-EAF Hot Strip Plant included in the present study is in Quebec, where almost
all electricity is generated at hydraulic plants. The integrated plants are all in Ontario,where a good portion of the electricity is generated by hydraulic or nuclear facilities. Forhydraulic or nuclear power plants, the energy-intensity factor for generating electricity is3600 MJ/MWh, and the CO2 emission-intensity factor is zero. Therefore, in reality, theindirect CO2 emission intensities for the plants are much less than those shown onFigure 4-43. The real issue is direct CO2 emission intensity.
• The direct CO2 emission intensity for the EcoTech DRI-EAF Hot Strip Plant is only479 kg CO2 per tonne, which is considerably less than the 1547 kg CO2 per tonne ofdirect CO2 emission intensity for the EcoTech Integrated Hot Strip Plant.
• The same could be said of CO2 emission intensity for steel produced only from scrap bythe EAF process. The direct CO2 emission intensity for the EcoTech EAF Hot Strip Plant(Section 4.4.1.3, “EAF Hot Strip Plant,” and Figure 4-23) is only 130 kg CO2 per tonne.However, the quality of steel produced from salvaged scrap is generally not satisfactory forsome steel applications due to impurities contained in scrap steel. Therefore, not all steelproduced from scrap can be substituted for steel made from virgin iron at the integratedmills. The substitution of DRI for scrap at the EAF Plant can result in steel of sufficientquality to compete with most grades of steel from the integrated plants.
• In conclusion, the Midrex DRI-EAF Hot Strip Plant, powered by electricity generatedby hydraulic or nuclear power plants, can produce quality steel at a CO2 emissionintensity that is significantly less than that for integrated plants.
• The feasibility of future DRI plants depends on the availability and price of scrap steel,natural gas and electricity. DRI processes have been available on a commercial scale sincethe 1950s and, when introduced, were considered to be a real alternative to the blast fur-nace. However, the expected large growth in DRI installations never took place due to theeconomics of the process. DRI plants have been built only in places favoured by low-costnatural gas and the availability of iron ore or where there was a need for scrap replacementin the EAF process (due to the availability and cost considerations or product qualityrequirements).18 The ready availability of iron ore and the desire for good product qualitywere the main reasons for the implementation of the Midrex DRI Plant in Canada.
4.5 Plant Energy Management
This section provides an evaluation of the energy management practices at the participating plants.
4.5.1 Energy Monitoring and Reporting – Figures 4-44 and 4-45To evaluate the extent that energy consumption is tracked, plants were asked to estimatethe percentage of the energy data that was monitored for this energy benchmarking report.Energy inputs that are continuously metered and either recorded, data logged or integratedwere deemed to be monitored.
18 See Chapter 6, reference 1, page 170.
38
BENCHMARKING ENERGY INTENSITY IN THE CANADIAN STEEL INDUSTRY
4 RESULTS
The extent of energy data monitoring is shown on the histogram “Energy Monitoring”(Figure 4-44). The bin categories, which are in 10 percent increments on the x-axis, indi-cate the maximum percentage for the group, e.g. the bar above 70 shows that four plantsreported their level of monitored energy data to be between 60 and 70 percent.
Four plants reported 100 percent energy data monitoring, six plants reported between60 and 80 percent, and the remaining plants reported some monitoring. On average,72 percent of the energy data at the plants is monitored.
Energy monitoring is not considered an EcoTech Technology because, in one form oranother, it has been in place at steel plants for many years. Energy monitoring leads toimproved energy efficiency by increasing awareness of energy consumption and cost andby identifying and quantifying energy-saving opportunities. In many cases, it producesimmediate savings by driving conservation and identifying over-billing.
It is doubtful that the full benefit of implementing EcoTech Technologies could be realizedwithout total plant energy monitoring.
Energy reporting can be considered an indication of the priority and importance placed onenergy efficiency by a company. To evaluate the extent of energy reporting, plants wereasked to state the frequency that energy data are presented to the plant manager.
The extent of energy reporting is indicated on the histogram “Energy Reporting”(Figure 4-45). The bin categories show the energy reporting period. All plants except onereport energy consumption monthly or more frequently. Monthly reporting to the plantmanager is probably adequate because day-to-day issues are addressed at a lower level.Monthly reporting enables the plant manager to be made aware of, and address, majorproblems and to pursue opportunities to improve efficiency.
4.5.2 Energy Management at Integrated Steel PlantsAt integrated steel plants, much of the energy management activity is focused on the plantutilities, which are shown as blue boxes on Figure 2-4. Efficient use of utilities minimizes theneed to purchase external energy, usually natural gas and electricity, by optimizing the use ofsteel plant fuel gases (coke oven gas, blast furnace gas and BOF gas) and heat (steam and hotwater) obtained from heat rejected from the production processes. The EcoTech strategy foremploying the plant utilities to maximize efficiency includes the following:
• Equip reheating furnaces, coke ovens and blast furnace stoves to fire steel plant fuelgases, to minimize the purchase of other fuels.
• Burn the remaining steel plant fuel gases in a cogeneration power plant to produceelectricity and steam for internal use and sale.
• Maximize the energy available for the generation of electricity by implementing energyconservation practices and technologies throughout the plant.
The EcoTech Plant illustrates that it is essential for an integrated plant to be equippedwith an adequate and efficient cogeneration power plant, since there are practical and
BENCHMARKING ENERGY INTENSITY IN THE CANADIAN STEEL INDUSTRY
RESULTS 4
39thermodynamic limits to the extent that purchased fuel can be displaced by improvements inenergy efficiency. Many of the technologies and practices available for improving energyefficiency result in the generation of low-grade energy (low-temperature heat) that is notsuitable for use in the high-temperature steelmaking processes. This low-grade energy mustbe converted to electricity to achieve improved energy efficiency and economic return.
4.5.2.1 Gas Flares – Figures 4-46 and 4-47
• All integrated plants flare considerably more steel plant fuel gas (4 to 40 times more)than does the EcoTech Plant.
• The flaring of blast furnace gas and BOF gas accounts for 85 percent of the gas burnedoff. In the EcoTech Plant, surplus blast furnace gas and BOF gas are used to generateelectricity at the power plant. Therefore, the flaring of these gases at the integrated plantsindicates a lack of capacity at the power plants to convert plant gases into electricity.
4.5.2.2 Power Plant – Figure 4-48
The EcoTech Power Plant is defined as a steam cogeneration plant with the followingequipment and operating characteristics:
• Steam boilers generating superheated steam at a pressure of 180 bar and a temperatureof 530°C and equipped with a steam reheater
• A steam turbogenerator set equipped to operate with one stage of steam reheat and sixstages of steam extraction for regeneration or the supply of process steam
• An overall power generation efficiency of 32 percent when operated as a power plant(no steam extracted for process heating). The corresponding heat rate is 11.25 MJ/kWh.
• Sufficient boiler and turbogenerator capacity to use all available steel plant fuel gasesand recovered heat
Figure 4-48 compares the power plant technology at the participating integrated plantswith that of the EcoTech Plant:
• Boilers at the plants generate steam at pressures and temperatures that are much lowerthan those of the EcoTech Plant.
• The steam turbines at the plants are not equipped for steam reheat and operate withonly one stage of regeneration.
• The technology in place at the power plants is capable of an overall power generationefficiency in the range of 22 to 24 percent when operated as a power plant(no steam extracted for process heating). The corresponding heat rates range from15 to 16 MJ/kWh. A comparison of this range of heat rates with the heat rate of theEcoTech Plant shows that for a given energy input, the EcoTech Power Plant is capableof producing 38 percent more electrical energy.
• Plants 1 and 2 have some electrical generation capability, but it is a small percentage(3 and 18 percent, respectively) of the EcoTech Plant requirement. The other twoplants reported no capability to generate electricity.

40
BENCHMARKING ENERGY INTENSITY IN THE CANADIAN STEEL INDUSTRY
4 RESULTS
It appears that the power plants at all four integrated plants are inadequate for presentenergy management requirements and will become even more inadequate as EcoTechTechnologies are implemented throughout the plants. The main inadequacies are lack ofpower generation capability and the inability to efficiently convert surplus energy intoelectrical energy.
4.5.2.3 Steam and Plant Fuel Gas Conservation
Referring to the figures for the integrated plants (Figures 4-24 to 4-41), it can be seen thatutilities’ consumption at all the integrated plants is extremely high compared with that of theEcoTech Plant. For example, the average utilities consumed per tonne of hot strip coil at theintegrated plants was six times higher than the utilities requirement for the EcoTech Plant.Steam consumption accounts for most of the utilities consumption at the integrated plants.The excessive use of steam at the integrated plants is most likely another indication of inade-quate power plants. Lacking the power plant equipment to generate electricity, there is littleincentive to conserve steam. Reducing steam demand would reduce fuel demand at thepower plant boilers that, in turn, would result in a proportional increase in the flaring of steelplant fuel gases. No energy, emission or cost savings would be realized.
Suitably sized cogeneration power plants, with the ability to efficiently convert steam andfuel gas into electrical energy, are required to provide the incentive for the plants to investin such practices and technologies as the following:
1. Maintain and improve steam line insulation and steam traps.2. Generate steam from the recovered heat from process waste gas streams.3. Recover BOF gas and deliver it to the power plant boilers.4. Improve boiler efficiency.5. Improve blast furnace stove efficiency.6. Improve the efficiency of coke ovens and reheating furnaces that burn
coke oven gas.
4.6 Reheating Furnaces
4.6.1 Slab Reheating Furnaces – Figure 4-49Note: Slab reheating furnaces are broken out of the Hot Strip Mill and Plate Mill processareas to better show the penetration of energy-saving furnace technologies and the contri-bution that the furnaces can make to reduce overall energy consumption of the mills.
Energy-Intensity Indicators
• All furnaces consume 15 to 250 percent more fuel than does the EcoTech Plantfurnace.
• The EcoTech benchmark shown (1232 MJ/tonne) is for slab furnaces at Hot StripMills. The EcoTech benchmark for slab furnaces at Plate Mills assumes greater penetra-tion of hot slab charging technology and, therefore, is less (1010 MJ/tonne).
BENCHMARKING ENERGY INTENSITY IN THE CANADIAN STEEL INDUSTRY
RESULTS 4
41Technology Penetration
• Hot slab charging practice is used by Furnaces 3, 4, 5 and 6. However, the averagecharging temperatures for Furnaces 3, 4 and 5 are below the hot charging criterion forthe EcoTech Plant. Limited penetration of this technology contributes to the high fuelconsumption reported.
• Furnaces 1, 2, 3 and 6 are equipped with recuperators to produce a combustion airpreheat temperature that meets the EcoTech Plant criterion, whereas recuperation onFurnaces 4 and 5 leads to temperatures close to that level. Recuperation is an extremelyeffective energy-reduction technology, and as expected, the furnaces with reasonablerecuperation are, without exception, the leaders in energy efficiency. Limited penetra-tion of this technology at the other furnaces contributes to their indicated high fuelconsumption.
• Most furnaces (15 of 17) are equipped with an unfired charge preheat zone. Only twohave an unfired charge preheat zone longer than the 10.0-metre zone for the EcoTechPlant furnace. The average length of the unfired charge preheat zone for all furnaces is7.5 metres, which indicates fair penetration of this technology. However, the technologyappears to have much less effect on energy consumption than does recuperation.
• Four furnaces are equipped with evaporative skid cooling systems. Evaporative skidcooling uses the heat lost to the skid cooling system to produce steam, which is anenergy output credit. The furnaces equipped with this technology are among the topfive most energy efficient.
• One furnace is equipped with double-insulated (ceramic fibre and castable refractory)skid insulation. Double-insulated technology significantly reduces heat loss to thefurnace skid cooling system. The furnace equipped with this technology is also amongthe top five most energy efficient.
• Twelve furnaces are equipped with Level II control systems, and nine of those are alsoequipped with Level III control. Level II control tracks each piece of steel as it travelsthrough the furnace, calculates the amount of heat and time required to bring eachpiece up to rolling temperature, and adjusts the furnace temperature/firing rate toachieve the desired thermal state with the lowest possible fuel consumption. Level IIIcontrol links the Level II control system to the mill scheduling computer, enabling thefurnace controls to adjust in advance to operational changes, such as changes to the sizeand grade of the steel to be heated and production interruptions to reset the mill forproduct changes. Level II and Level III furnace control systems enable full advantageto be taken of the energy efficiency potential of the furnace. However, it is clear thatcontrol, by itself, cannot make up for the lack of energy-efficient features or poorfurnace design and maintenance.
• Two furnaces are equipped with heat recovery steam boilers. One would expect a creditfor the steam produced, rather than the large steam consumption reported for thesefurnaces.
• Six slab furnaces are equipped with most of the EcoTech Technologies, and theyapproach the EcoTech efficiency. The remaining 11 furnaces lack most, if not all, of theEcoTech Technologies and, accordingly, are extremely inefficient.

42
BENCHMARKING ENERGY INTENSITY IN THE CANADIAN STEEL INDUSTRY
4 RESULTS
Other Considerations
• The EcoTech Plant furnace operates with 30 percent of the steel charged at 600°C, whichreduces fuel consumption by 260 MJ/tonne, suggesting that hot charging is required toachieve the indicated furnace efficiency. Furnace 1, which is equipped with the otherEcoTech furnace technologies, approaches the efficiency of the EcoTech Plant furnace.
• The EcoTech Plant furnace is equipped with recuperators that preheat the combustionair to 450°C. Preheating the combustion air increases the flame temperature, which isthe main factor in the formation of nitrogen oxide (NOx). Because NOx is a pollutant,there are regulatory limits for it in jurisdictions where acid deposition and smog forma-tion are a problem. NOx emissions can be held below air-pollution-control-based limitsby burner technology for combustion air preheats up to about 400°C. Above that tem-perature, the formation of NOx increases rapidly, and costly end-of-pipe abatementequipment may be required. Hence, the feasibility of recuperation change and investingin more recuperation to raise combustion air temperature above 400°C may requiretrade-offs between energy efficiency, NOx emissions and cost. If recuperation is limitedto 400°C by NOx air-pollution-control-based limits and economic considerations, thenother forms of waste heat recovery are available to use the large amount of heat stillcontained in the waste gas. Steam recovery boilers are a consideration, but there mustbe a need for the steam to justify the boilers – and that is a plant energy managementissue (see Section 4.5, “Plant Energy Management”).
• The length of the unfired charge preheat zone of a furnace is difficult to change oncethe furnace is installed. It requires relocation of the furnace charge-end material handlingsystem, which may not be possible due to mill layout and would definitely not beeconomically justifiable by the energy cost savings.
• Evaporative skid cooling technology is viable for the recovery of heat lost to the furnaceskids. It also eliminates the energy used for water pumping and cooling tower fans inconventional water cooling skid systems. However, this technology is no substitute forgood skid insulation. Making steam with evaporative skid cooling is much less efficientthan making steam in a steam boiler. The energy-intensity indicators show thatFurnaces 3 and 5 are making far too much steam and, hence, are not as efficient asFurnaces 1 and 2.
• Double-insulated furnace skids are effective in reducing heat loss to the skid coolingsystem. At plants that do not have steam systems, this technology would be preferableto evaporative skid cooling. However, skid insulation fails over time and needs to berepaired or replaced regularly to remain effective.
• Reducing heat loss to the furnace skid system is a requirement to achieving the efficiencyof the EcoTech Plant furnace. A combination of evaporative skid cooling and double-insulated skids should be considered. Four furnaces are equipped with skid cooling heatrecovery systems. However, these furnaces lose much more energy to skid cooling(especially Furnaces 3 and 5) than does the EcoTech Plant furnace, which can be seenin the amount of energy recovered. Excessive skid cooling heat loss is a reason thatthese furnaces are more energy intensive than the EcoTech Plant furnace. Furnace 4,which is equipped with double-insulated furnace skids, is as efficient as Furnaces 3 and5, which are equipped with skid cooling heat recovery systems.
BENCHMARKING ENERGY INTENSITY IN THE CANADIAN STEEL INDUSTRY
RESULTS 4
434.6.2 Billet and Bloom Reheating Furnaces – Figure 4-50Note: Billet and Bloom reheating furnaces are broken out of the Rod Mill, Bar Mill andHeavy Section Mill process areas to better show the penetration of energy-saving furnacetechnologies and the contribution that the furnaces can make to the overall energy con-sumption of the mills.
Energy-Intensity Indicators
• Four furnaces have achieved energy efficiency greater than that of the EcoTech Plantfurnace, and a fifth furnace is close. The other seven furnaces consume more(10 to 70 percent) energy than does the EcoTech Plant furnace.
Technology Penetration
• Furnaces 3, 4 and 8 are equipped with recuperators to produce a combustion air pre-heat temperature that meets the EcoTech Plant criterion. Recuperation on Furnaces 6and 11 comes close to achieving the EcoTech Plant standard. Three furnaces are oper-ating without recuperators.
• Most furnaces (8 of 12) are equipped with an unfired charge preheat zone. The averagelength of this zone for all furnaces is three metres, which indicates poor penetration ofthis technology.
Other Considerations
• The low-tech pusher furnace is known for high efficiency heating of small billets (under150 mm). Since these billets are small enough to be heated from one side, there is noneed for walking beams to space them in the furnace or for a skid system to supportthem for heating from the bottom. That makes the pusher furnace inexpensive to buildand long unfired charge preheat zones economically attractive. Coupled with modestrecuperation, these features result in an energy-efficient furnace, as can be seen by theefficiency of Furnaces 1 and 2.
• The comments made about recuperation in Section 4.6.1, “Slab Reheating Furnaces,”also apply here.
• Billet reheat furnaces require less extensive skid systems, and hence, evaporative skidcooling is often not economically feasible. Bloom furnaces that heat heavy blooms willhave skid systems comparable to those in slab furnaces, and evaporative skid coolingsystems should be economically attractive.
• Double-insulation skid technology can be economically applied regardless of the size ofthe skid system.
• The comments made about Level II and Level III furnace control in Section 4.6.1,“Slab Reheating Furnaces,” also apply here.
The following figures illustrate the penetration of furnace technologies that reducefurnace energy input (as opposed to technologies that recover heat rejected by thefurnace). The effectiveness of these technologies in improving furnace energy efficiencyis not necessarily cumulative. A complete thermal balance of a furnace is required toestablish the combined effect of these technologies.

44
BENCHMARKING ENERGY INTENSITY IN THE CANADIAN STEEL INDUSTRY
4 RESULTS
4.6.3 Combustion Air Preheat Temperature – Figure 4-51• This histogram shows the extent to which recuperation technology is practised. The bin
categories are in increments of 100°C, and these numbers on the x-axis indicate themaximum combustion air temperature for the group, e.g. the bar above 400°C showsthat nine furnaces reported combustion air preheat temperatures between300 and 400°C. It would be safe to assume that the nine furnaces reporting combustionair preheat temperatures below 100°C are not equipped with recuperation.
• Recuperation transfers heat from the furnace waste gas to the combustion air. The heatdelivered to the furnace burners in the combustion air reduces the amount of fuelrequired to supply the furnace energy demand. Combustion air preheating increasesflame temperature, which increases the rate of heat transfer in the furnace. This con-tributes to increased efficiency and may also increase furnace productivity.
• Preheating the combustion air increases the flame temperature, which is the main factorin the formation of NOx. Since NOx is a pollutant that contributes to acid depositionand smog formation, there are air-pollution-control-based limits for it. NOx emissionscan be held below regulatory limits by burner technology for combustion air preheatsup to about 400°C. Above that temperature, the formation of NOx increases rapidly,and costly end-of-pipe abatement equipment may be required. Hence, the feasibility ofrecuperation change and investing in more recuperation to raise combustion air tempera-ture above 400°C may require trade-offs between energy efficiency, NOx emissionsand cost.
• Recuperation, in general, should be economically attractive for all reheating furnacesbecause:
• Furnaces that charge cold steel into unfired preheat zones have low waste gas tem-perature. Therefore, recuperators are cheaper to install because they do not need tobe constructed from expensive high-temperature materials. Also, since a portion ofthe waste gas heat has been removed in the unfired preheat zones, optimumfurnace efficiency can often be achieved with combustion air preheat temperaturebelow the 400°C break point.
• Furnaces that hot charge will have high waste gas temperature, so high-cost, high-temperature materials will be required for recuperator construction. High-temperature waste gas produces high heat-transfer rates, which enable smallerrecuperators to be installed for the same duty. Also, simple radiant heat transferdesigns can be used. These factors make recuperators for high-temperatureapplications economically attractive.
Because of the differences in recuperator construction and service, before contemplatingrecuperation, plants should first establish to what extent they intend to implement a hotcharging practice.
BENCHMARKING ENERGY INTENSITY IN THE CANADIAN STEEL INDUSTRY
RESULTS 4
454.6.4 Unfired Charge Preheat Zone Length – Figure 4-52• This histogram shows the extent to which furnaces are equipped with unfired charge
preheat zones. The bin categories are in two-metre increments, and these numbers onthe x-axis indicate the maximum length for the group, e.g. the bar above two metresshows that eight furnaces reported a charge preheat zone length between zero andtwo metres.
• The unfired preheat zone reduces energy consumption by decreasing the heat lost fromthe furnace in the waste gas. In the unfired preheat zone, the hot furnace waste gasflows countercurrent to the incoming cold steel so that the waste gas is cooled as heatis transferred to the steel. The effectiveness of this technology depends on the tempera-ture difference between the furnace waste gas and the steel being charged into thefurnace. Therefore, this technology is less effective with hot charging.
4.6.5 Furnace Average Charging Temperature – Figure 4-53• This histogram shows the extent to which hot charging is practised. The bin categories
are in increments of 100°C, and these numbers on the x-axis indicate the maximumaverage charge temperature for the group. For example, the bar above 100°C showsthat 27 furnaces reported average charge temperature between 0°C and 100°C. Itwould be safe to assume that these furnaces are not using a hot charging practice.
• Hot charging reduces energy consumption by decreasing the amount of heat requiredto raise the temperature of the steel to rolling temperature. However, because the aver-age temperature of the steel in the furnace is higher, the rate of heat transfer from thefurnace gases to the steel is lower, which increases the waste gas temperature from thefurnace. This can reduce furnace efficiency and decrease the gain expected from hotcharging. Hence, hot charging will tend to nullify the benefits of an unfired preheatzone and increase the need for recuperation.
• Some grades of steel must be cooled after casting to produce the desired metallurgicalproperties.

POTENTIAL AREASFOR INCREASED
ENERGY EFFICIENCY5
48
BENCHMARKING ENERGY INTENSITY IN THE CANADIAN STEEL INDUSTRY
5 POTENTIAL AREAS FOR INCREASED ENERGY EFFICIENCY
5. POTENTIAL AREAS FOR INCREASED ENERGY EFFICIENCY
5.1 Identifying Potential Areas for Reducing Energy Intensity
The key objective of this study is to compare benchmarks and technology penetrationbetween plants and against international technology-based benchmark levels, therebyallowing areas of potential improvement to be identified. That has been accomplished bythe results provided in Chapter 4. In all cases, those comparisons indicate a possibleopportunity for one or more of the participating plants to reduce their energy intensity.
5.2 Factors for Reducing Energy Intensity Not Determined byThis Study
The objectives for this study do not include quantifying the potential for reducing energyintensity. Chapter 4 benchmarked the energy intensity of the processes at the participatingplants against those of the IISI EcoTech Plant. In every case, there are energy-intensityindicators for plants that are higher than those for the EcoTech Plant. It is tempting toview the gaps between the energy-intensity indicators for the plants and those of theEcoTech Plant as the potential for reducing energy intensity in the steel industry.However, that would produce a misleading result. For the following reasons, the actualpotential for reducing energy intensity is much different:
1. The IISI EcoTech Plant represents a very energy-efficient practice and is considerablybetter (12 percent) than best practice today. As stated in Chapter 3, the EcoTech Plantis hypothetical, and its energy-intensity indicators are somewhat theoretical. Also, someprocess areas lack actual process and plant operating data to verify that they can beachieved in real life.
2. The economics of EcoTech Technologies depend on factors that differ from plant toplant and jurisdiction to jurisdiction. Moreover, the EcoTech Technologies are notnecessarily fundamentally economically attractive.
3. It would also be unrealistic to expect that it would be feasible to implement all of theEcoTech Technologies at all plants. Some of the EcoTech Technologies are difficult orimpossible to retrofit. It is doubtful that it would be economically feasible to abandonmost existing facilities and replace them with new facilities incorporating the EcoTechTechnologies.
BENCHMARKING ENERGY INTENSITY IN THE CANADIAN STEEL INDUSTRY
POTENTIAL AREAS FOR INCREASED ENERGY EFFICIENCY 5
494. The implementation of every technology and practice considered in this study involves
capital expenditure. Fully implementing the EcoTech Technologies in the Canadiansteel industry would require billions of dollars. The limited availability of capital withinthe steel industry and the number of priorities competing for the little capital that isavailable are most likely the controlling factors for the extent to which energy-savingtechnology will be implemented.
5. There are new processes for ironmaking and steelmaking that have potential for reducingcost and energy intensity. Some are in place in Canada (direct reduced iron production,cast-and-roll strip production), others are commercially available, and others are beingdeveloped. It would likely make business sense to invest in those technologies rather thanattempting to upgrade existing facilities. However, the potential of these processes toreduce the energy intensity of iron and steel production is beyond the scope and mandateof this study.
6. The following factors, which are not considered in the EcoTech Plant performance, cansignificantly increase energy intensity:
• Utilization of equipment: Energy intensity increases if equipment is not operated ator near design capacity, which is a reflection of the market and competition.
• Product mix: The energy intensity will be higher for mills that produce a broadrange of products because material losses and energy consumption occur duringthe period required to change over to the next product.
• Climate: Energy intensity at Canadian mills will be greater because of the energyrequired to protect equipment and personnel from the harsh winter climate and tomake up for greater process heat losses caused by low ambient temperatures.
For the above reasons, the results in Chapter 4 cannot be construed as indicating thereal-life achievable energy-intensity reduction in the Canadian steel industry.
5.3 Identifying Areas of Greatest Potential
The results, as intended, identify areas of potential improvement in energy efficiency.Examining which EcoTech Technologies have been implemented in the Canadian steelindustry, and which have not, provides some insight into which technologies might be mosteffective and feasible. To that end, the following focuses on areas where the potential toreduce energy intensity will likely be most realistic and achievable.
Practices and technologies with the potential to achieve more efficient use of energy for eachprocess area are shown in the Energy and Technology figures for Chapter 4. They include allof the practices and technologies used to define the EcoTech Plant and some additionaltechnologies and practices recommended by the CSPA participating plants. The penetrationof those technologies was quantified for each plant and linked to their energy intensities.

50
BENCHMARKING ENERGY INTENSITY IN THE CANADIAN STEEL INDUSTRY
5 POTENTIAL AREAS FOR INCREASED ENERGY EFFICIENCY
Based on that information, the penetration of EcoTech Technologies can be summarized bythe following:
1. Certain EcoTech Technologies in some process areas have not been implemented.2. Some EcoTech Technologies have been implemented for each process in one or
more plants.3. Certain process areas, such as the EAF and the Blast Furnace, have a high degree of
EcoTech Technology penetration.4. Every process area has opportunities for one or more plants to reduce energy intensity
by implementing EcoTech Technologies.5. In some areas, such as steel reheating furnaces and power plants at integrated plants,
the implementation of technology could significantly reduce energy intensity.6. In some process areas, the variance in energy intensity between the participating plants
cannot be explained by the penetration of technology and practices.
5.3.1 Areas Where the Implementation of Technology and Practice Are UnlikelyCertain EcoTech Technologies, in some process areas, have not been implemented.This could indicate that no plants have been able to justify implementing the technology.Possible reasons include:
1. The life of the process or the facility is seen to be too short to provide a return oninvestment.
• An example is the lack of EcoTech Technology penetration in the cokemakingprocess area. Canadian cokemaking facilities are old, with limited life.(However, blast furnace technology to reduce dependence on coke has beenimplemented.) Coke is available on the world market from more modern facili-ties. Direct reduction and new smelt-reduction ironmaking technologies, whichmay replace aging blast furnaces, do not require coke.
2. The technology is not effective considering the design and operating characteristics ofthe existing facility.
• An example is the lack of energy-recovery technology for blast furnace top gas.Canadian blast furnaces are designed for, and operate at, relatively low top-gaspressure. Hence, the amount of pressure energy to be recovered is less than forfurnaces designed and operated with high top-gas pressure.
Some EcoTech Technologies have been implemented in one or more plants, but not themajority. This could indicate that not all plants could justify the technology. One possiblereason is that the technology was not available or practical when the facility was built andis difficult or impossible to retrofit.
• An example is two BOF steelmaking facilities not equipped with gas recovery. Theywere built when the prevailing technology was to burn the off-gas and recover some ofthe heat in steam generation hoods. The cost of retrofitting a gas recovery system, anda system to deliver the recovered gas to users, is likely prohibitive.

BENCHMARKING ENERGY INTENSITY IN THE CANADIAN STEEL INDUSTRY
POTENTIAL AREAS FOR INCREASED ENERGY EFFICIENCY 5
51• Another example is the unfired charge preheat zone length of a steel reheating furnace.
To add an unfired charge preheating zone or to lengthen an existing one requiresadding to the overall length of the furnace. That is often extremely difficult because themills are laid out so that the furnace fits between the furnace charging equipment anddischarging equipment. To accommodate a change in furnace length, the mill layoutwould need to be altered and equipment relocated, which would be costly and may notbe possible.
5.3.2 Areas Where the Implementation of Technology and Practice Are Likely, butthe Potential for Implementation Is LimitedCertain process areas have a high degree of EcoTech Technology penetration. This indicatesthat implementing EcoTech Technology is justifiable, and implementing the remaining tech-nologies would likely be effective and feasible, based on broad success across the industry.
• One example is EAF steelmaking. The high penetration of technology in the EAF canbe seen by looking at the Technology table in Figure 4-10, “Electric Arc FurnaceSteelmaking and Casting – Energy and Technology,” where eight EcoTechTechnologies are apparent. Implementation of the eight technologies at the nine EAFfacilities ranges from a minimum of five to a maximum of seven technologies, with anaverage of six. However, because of the high technology penetration, there is little leftto be done. Oxygen blowing for post-combustion technology has been implementedon only one furnace. Implementing it on the remaining furnaces could result in a5 percent reduction in energy intensity, which is about all the potential that remains.
• Another example is the use of fuel injection technology at the blast furnace to reducedependency on coke. The high penetration of this technology can be seen by looking atthe technology table in Figure 4-5, “Blast Furnace – Energy and Technology.” Twofurnaces have surpassed the EcoTech fuel injection rate of 3870 MJ per tonne of hotmetal and have achieved the EcoTech coke rate of 361 tonnes of coke per tonne of hotmetal. Also, the average fuel injection rate for all furnaces surpasses the EcoTech Plantperformance, and the average coke rate is approaching that of the EcoTech Plant. Theremaining industry-wide potential to lower coke dependency by achieving the EcoTechPlant performance at all furnaces is 27 kg of coke per tonne of hot metal. This goalshould be pursued, but it is small compared with what has been achieved.
5.3.3 Areas Where the Implementation of Technology and Practice Are Likely, andthe Potential for Lower Energy Intensity Is GreatIn some areas, implementation of technology could significantly reduce energy intensity.In these areas, the technologies offer significant energy savings and can be readily imple-mented. These opportunities have most likely been studied and are well known to theparticipating plants. Other factors, such as availability of capital, competing priorities andexternal policy, have likely prevented the plants from pursuing these opportunities.

52
BENCHMARKING ENERGY INTENSITY IN THE CANADIAN STEEL INDUSTRY
5 POTENTIAL AREAS FOR INCREASED ENERGY EFFICIENCY
• An example is the power plant at integrated steel plants. The potential to reduce energyintensity at all the Canadian integrated steel plants is severely limited by inadequatepower plant technology, as explained in Section 4.5.2.2. Based on the performance ofthe EcoTech Plant, Canadian integrated steel plants could produce enough electricity,without consuming any additional fuel, to approach being self-sufficient. Consideringthat all four integrated steel plants are in Ontario, where coal-fired electricity-generating plants are on the margin, the impact of the integrated plants generating thatamount of electricity is immense. The order of magnitude of the savings couldapproach 2.7 million MWh per year of electrical energy, representing 2.3 million tonnesper year reduction in CO2 emissions and $140 million in energy costs.
The EcoTech steam cogeneration power plant technology is mature, and there are no tech-nical risks. It is in place throughout the world, including neighbouring states in the UnitedStates. A possible reason why this technology has not been implemented in Ontario (whereall of the integrated plants are located) could be the province’s electrical power generationpolicy. Other reasons include:
• Conflicting priorities at the steel plant (the power plant does not enhance productivityor product quality)
• Uncertain environmental policy
• Lack of capital (trade and tax issues)
There are certain areas where:
• Technology has been implemented in a sufficient number of Canadian steel plants toconfirm that the EcoTech Plant performance is achievable.
• Implementing the technology in the remaining plants could significantly reduce energyintensity.
This situation leads one to the conclusion that, to remain competitive, all plants willeventually have to install the technologies and implement the practices.
• Reheating furnaces are an example of this situation. In the bloom and billet area,33 percent of billet reheating furnaces are more efficient than the EcoTech Plant furnace,an indication that the EcoTech energy intensity can be achieved or surpassed. The energyintensity of four billet furnaces could be significantly reduced (by 20 to 25 percent) byimplementing recuperation technology. It is also interesting that pusher furnaces can beas efficient as the EcoTech walking beam furnace because it is often necessary to installa new furnace to change from pusher to walking beam.
• In the area of slab reheating furnaces, the six slab furnaces equipped with most of theEcoTech Technologies approach the EcoTech efficiency, again an indication that theEcoTech energy intensity can be reached. The remaining 11 furnaces lack most, if not all,of the EcoTech Technologies and, accordingly, are extremely inefficient. Equipping thesefurnaces with the EcoTech Technologies (which in most cases would likely be best doneby installing new furnaces) could reduce furnace energy intensity by 50 to 65 percent.

BENCHMARKING ENERGY INTENSITY IN THE CANADIAN STEEL INDUSTRY
POTENTIAL AREAS FOR INCREASED ENERGY EFFICIENCY 5
53The steel industry and the participating plants can better determine which opportunitieswarrant their further investigation by categorizing all areas of opportunity according to thefollowing:
• areas where the implementation of technology and practices are unlikely
• areas where the implementation of technology and practices are likely, but the potentialfor implementation is limited
• areas where the implementation of technology and practices are likely, and the potentialfor lower energy intensity is great
REFERENCES6

56
BENCHMARKING ENERGY INTENSITY IN THE CANADIAN STEEL INDUSTRY
6 REFERENCES
6. REFERENCES
1. Energy Use in the Steel Industry, Committee on Technology, International Iron andSteel Institute, Brussels, 1998.
2. European Steelworks Energy Committee Energy Reporting, Yann de Lassat, AssociationTechnique de la Sidérurgie Française, June 2001.
3. Present and Future Use of Energy in the Canadian Steel Industry, CANMET – EnergyMines and Resources Canada (now Natural Resources Canada), March 1993.
FIGURES, CHARTSAND TABLES7
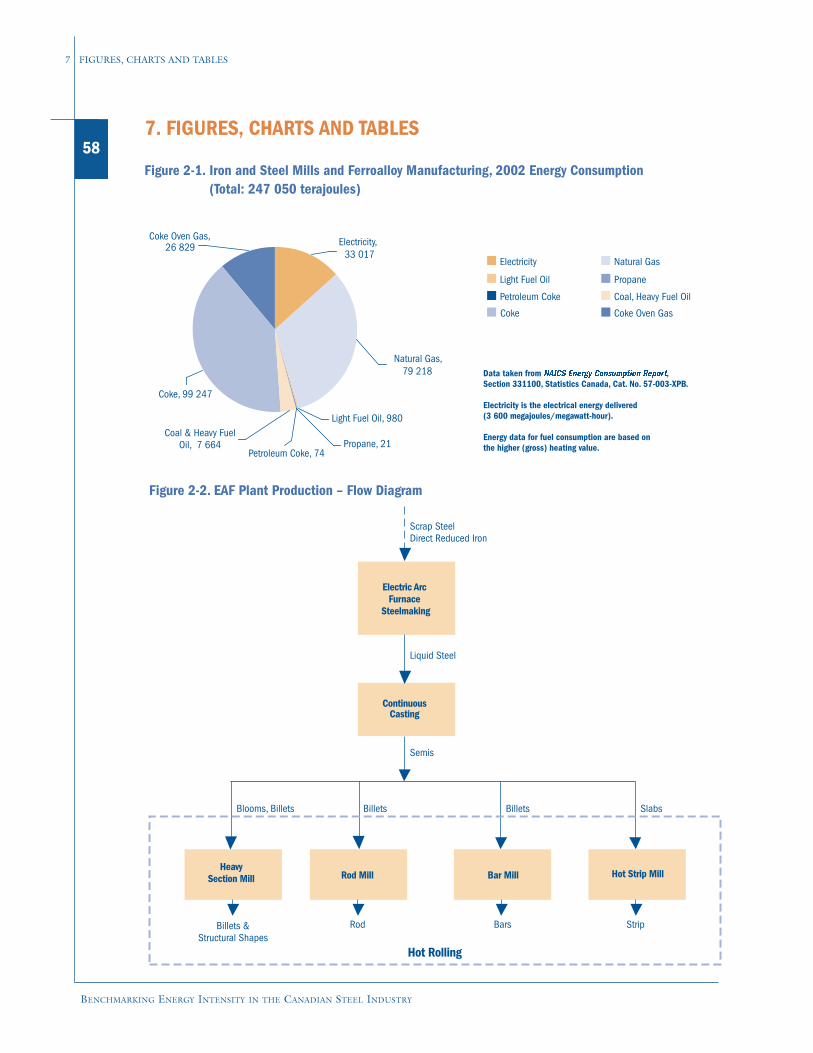
58
BENCHMARKING ENERGY INTENSITY IN THE CANADIAN STEEL INDUSTRY
7 FIGURES, CHARTS AND TABLES
7. FIGURES, CHARTS AND TABLES
Electricity Natural Gas
Light Fuel Oil Propane
Petroleum Coke Coal, Heavy Fuel Oil
Coke Coke Oven Gas
Iron and Steel Mills and Ferroalloy Manufacturing, 2002 Energy Consumption(Total: 247 050 terajoules)
Figure 2-1.
Natural Gas, 79 218
Coke, 99 247
Electricity, 33 017
Coke Oven Gas, 26 829
Propane, 21 Petroleum Coke, 74
Light Fuel Oil, 980Coal & Heavy Fuel
Oil, 7 664
Data taken from NAICS Energy Consumption Report, Section 331100, Statistics Canada, Cat. No. 57-003-XPB.
Electricity is the electrical energy delivered(3 600 megajoules/megawatt-hour).
Energy data for fuel consumption are based on the higher (gross) heating value.
Scrap SteelDirect Reduced Iron
Liquid Steel
Semis
Blooms, Billets BilletsBillets Slabs
Billets &Structural Shapes
Figure 2-2. EAF Plant Production – Flow Diagram
Electric ArcFurnace
Steelmaking
Hot Strip Mill
Hot Rolling
ContinuousCasting
Rod Mill Bar Mill
Bars StripRod
HeavySection Mill
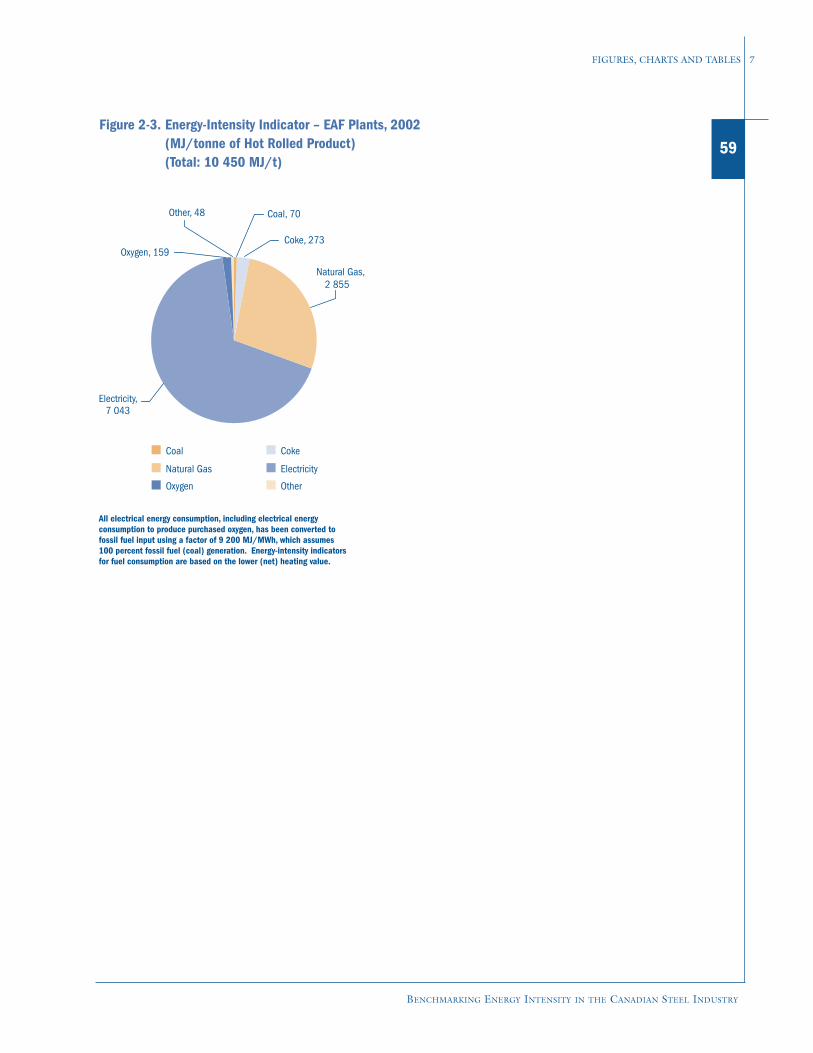
BENCHMARKING ENERGY INTENSITY IN THE CANADIAN STEEL INDUSTRY
FIGURES, CHARTS AND TABLES 7
59
Coal Coke
Natural Gas Electricity
Oxygen Other
Energy-Intensity Indicator – EAF Plants, 2002 (MJ/tonne of Hot Rolled Product)(Total: 10 450 MJ/t)
Figure 2-3.
Natural Gas,2 855
Coke, 273
Coal, 70 Other, 48
Oxygen, 159
Electricity,7 043
All electrical energy consumption, including electrical energy consumption to produce purchased oxygen, has been converted to fossil fuel input using a factor of 9 200 MJ/MWh, which assumes 100 percent fossil fuel (coal) generation. Energy-intensity indicators for fuel consumption are based on the lower (net) heating value.
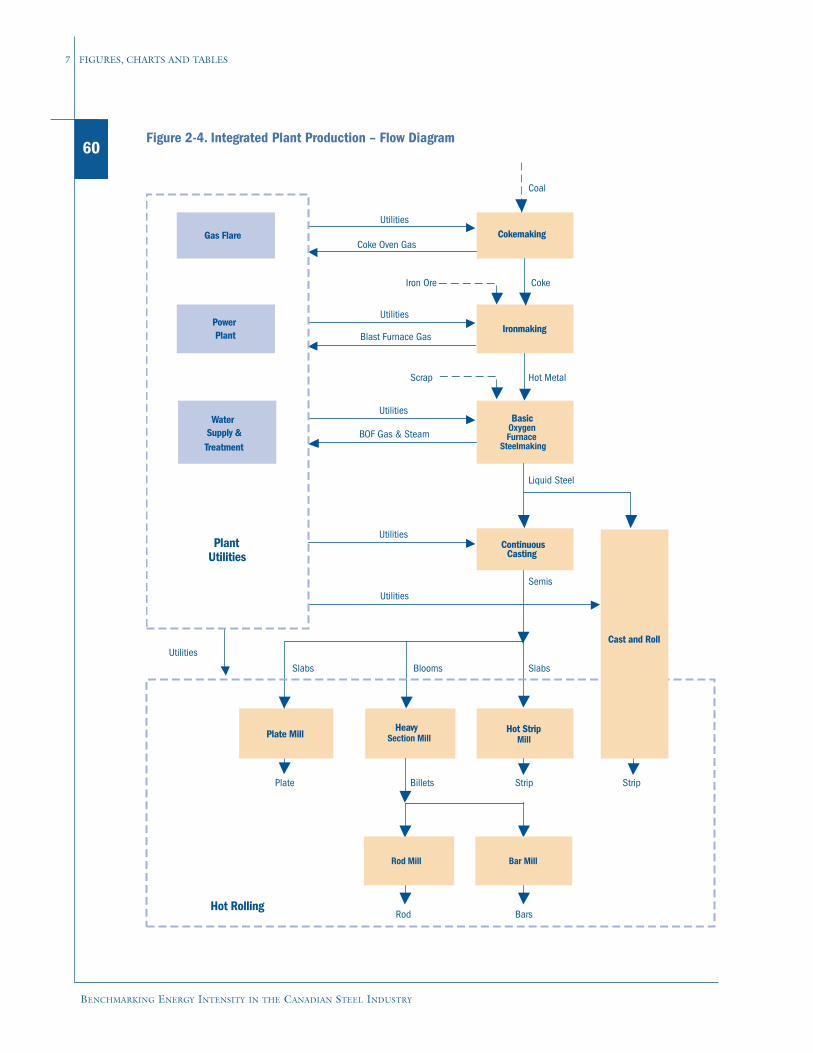
60
BENCHMARKING ENERGY INTENSITY IN THE CANADIAN STEEL INDUSTRY
7 FIGURES, CHARTS AND TABLES
Coal
Iron Ore Coke
Scrap Hot Metal
Liquid Steel
Semis
Utilities
SlabsSlabs Blooms
Billets Strip
Utilities
Gas Flare
Basic Oxygen Furnace
Steelmaking
Hot Strip Mill
HeavySection Mill
UtilitiesPower Plant
IronmakingBlast Furnace Gas
Rod Bars
Utilities
Plant Utilities
ContinuousCasting
Figure 2-4. Integrated Plant Production – Flow Diagram
StripPlate
Utilities
BOF Gas & SteamWater
Supply &Treatment
CokemakingCoke Oven Gas
Hot Rolling
Rod Mill Bar Mill
Plate Mill
Cast and Roll
Utilities
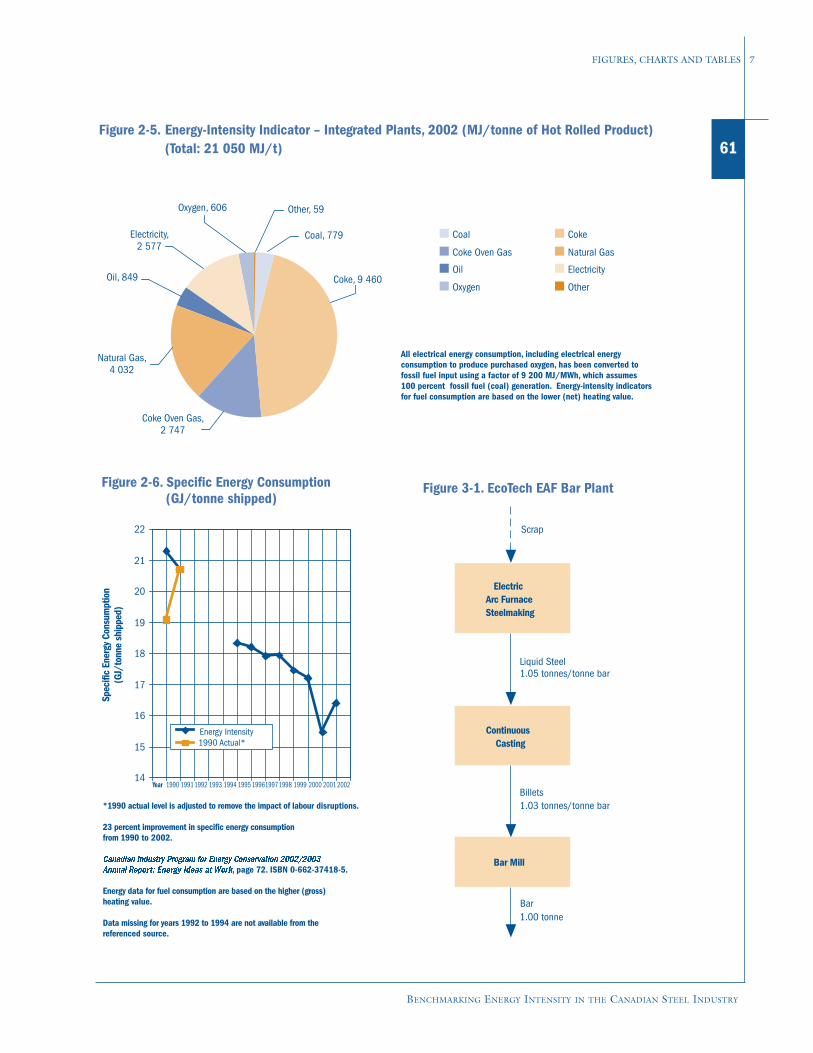
BENCHMARKING ENERGY INTENSITY IN THE CANADIAN STEEL INDUSTRY
FIGURES, CHARTS AND TABLES 7
61
Coal Coke
Coke Oven Gas Natural Gas
Oil Electricity
Oxygen Other
Energy-Intensity Indicator – Integrated Plants, 2002 (MJ/tonne of Hot Rolled Product)(Total: 21 050 MJ/t)
Figure 2-5.
Natural Gas,4 032
Coke, 9 460
Coal, 779
Other, 59 Oxygen, 606
Oil, 849
Electricity,2 577
All electrical energy consumption, including electrical energy consumption to produce purchased oxygen, has been converted to fossil fuel input using a factor of 9 200 MJ/MWh, which assumes 100 percent fossil fuel (coal) generation. Energy-intensity indicators for fuel consumption are based on the lower (net) heating value.
Coke Oven Gas,2 747
(GJ/tonne shipped)
14
15
16
17
18
19
20
21
22
Energy Intensity1990 Actual*
Figure 2-6. Specific Energy Consumption
Spec
ific
Ener
gyCo
nsum
ptio
n(G
J/to
nne
ship
ped)
*1990 actual level is adjusted to remove the impact of labour disruptions. 23 percent improvement in specific energy consumptionfrom 1990 to 2002. Canadian Industry Program for Energy Conservation 2002/2003 Annual Report:ÊEnergy Ideas at Work, page 72. ISBN 0-662-37418-5. Energy data for fuel consumption are based on the higher (gross) heating value. Data missing for years 1992 to 1994 are not available from the referenced source.
1990Year 19911992 1993 1994 1995 199619971998 1999 2000 2001 2002
Scrap
1.05 tonnes/tonne bar
Billets1.03 tonnes/tonne bar
Bar1.00 tonne
Bar Mill
Electric Arc Furnace Steelmaking
Continuous Casting
Liquid Steel
Figure 3-1. EcoTech EAF Bar Plant
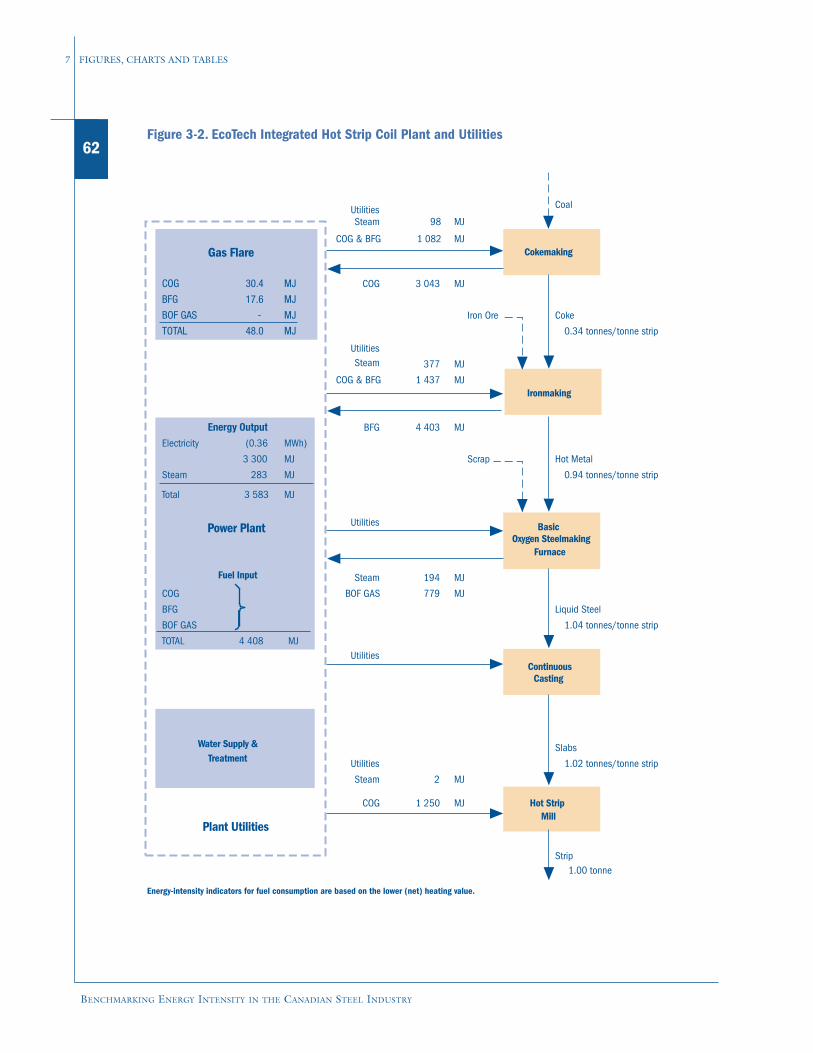
62
BENCHMARKING ENERGY INTENSITY IN THE CANADIAN STEEL INDUSTRY
7 FIGURES, CHARTS AND TABLES
Utilities Coal
Steam 98 MJ
COG & BFG 1 082 MJ
COG 30.4 MJ COG 3 043 MJ
BFG 17.6 MJ
BOF GAS - MJ Iron Ore Coke
TOTAL 48.0 MJ 0.34 tonnes/tonne strip UtilitiesSteam 377 MJ
COG & BFG 1 437 MJ
BFG 4 403 MJ
Electricity (0.36 MWh)
3 300 MJ Scrap Hot Metal
Steam 283 MJ 0.94 tonnes/tonne strip
Total 3 583 MJ
Utilities
Steam 194 MJ
COG BOF GAS 779 MJ
BFG Liquid Steel
BOF GAS 1.04 tonnes/tonne strip TOTAL 4 408 MJ
Utilities
Slabs
Utilities 1.02 tonnes/tonne strip Steam 2 MJ
COG 1 250 MJ
Strip1.00 tonne
Energy Output
Power Plant
Cokemaking
Ironmaking
Gas Flare
Basic Oxygen Steelmaking
Furnace
SFuel Input
Continuous Casting
Hot Strip Mill
Water Supply &Treatment
Plant Utilities
Figure 3-2. EcoTech Integrated Hot Strip Coil Plant and Utilities
Energy-intensity indicators for fuel consumption are based on the lower (net) heating value.
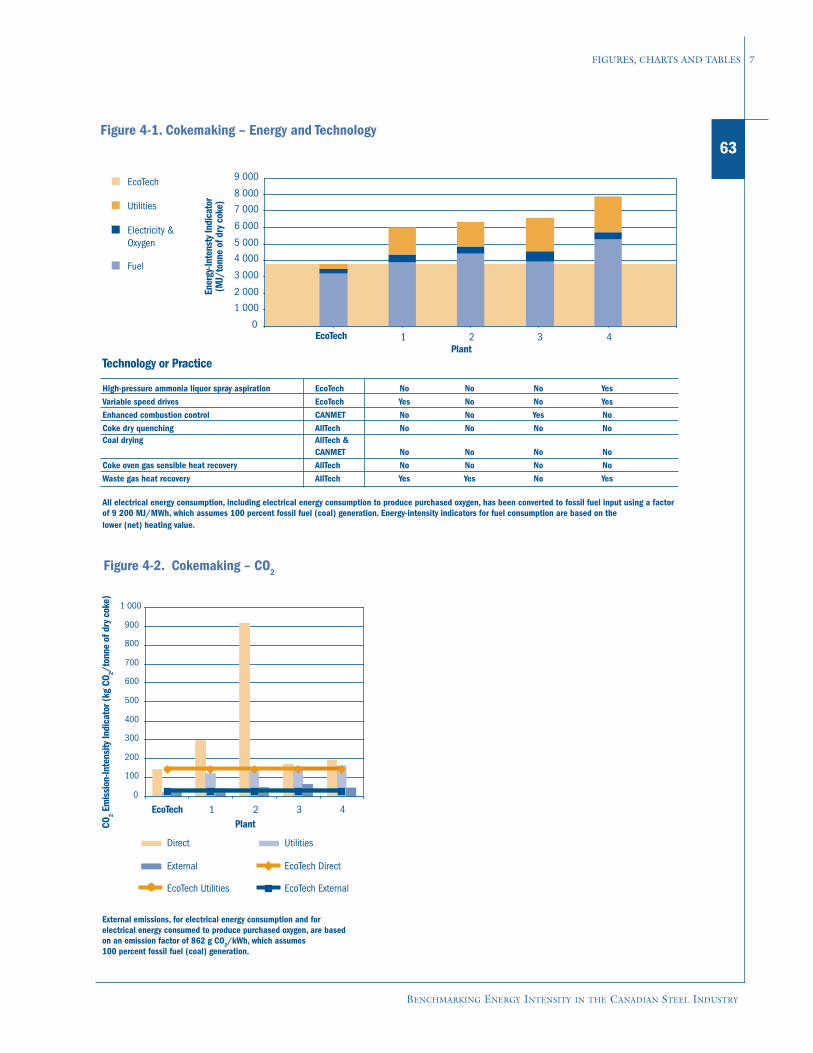
BENCHMARKING ENERGY INTENSITY IN THE CANADIAN STEEL INDUSTRY
FIGURES, CHARTS AND TABLES 7
63
0
1 000
2 000
3 000
4 000
5 000
6 000
7 000
8 000
9 000
EcoTech 1 2 3 4
EcoTech
Utilities
Electricity &Oxygen
Fuel
Figure 4-1. Cokemaking – Energy and Technology
Technology or Practice
High-pressure ammonia liquor spray aspiration EcoTech No No No YesVariable speed drives EcoTech Yes No No Yes Enhanced combustion control CANMET No No Yes No Coke dry quenching AllTech No No No No Coal drying AllTech & CANMET No No No No Coke oven gas sensible heat recovery AllTech No No No No Waste gas heat recovery AllTech Yes Yes No Yes
All electrical energy consumption, including electrical energy consumption to produce purchased oxygen, has been converted to fossil fuel input using a factorof 9 200 MJ/MWh, which assumes 100 percent fossil fuel (coal) generation. Energy-intensity indicators for fuel consumption are based on the lower (net) heating value.
Ener
gy-In
tens
tyIn
dica
tor
(MJ/
tonn
eof
dryc
oke)
Plant
External emissions, for electrical energy consumption and for electrical energy consumed to produce purchased oxygen, are based on an emission factor of 862 g CO2/kWh, which assumes 100 percent fossil fuel (coal) generation.
Figure 4-2. Cokemaking – CO2
CO2
Emis
sion
-Inte
nsity
Indi
cato
r(kg
CO2/
tonn
eof
dryc
oke)
0
100
200
300
400
500
600
700
800
900
1 000
EcoTech 1 2 3 4Plant
Direct Utilities
External EcoTech Direct
EcoTech Utilities EcoTech External

64
BENCHMARKING ENERGY INTENSITY IN THE CANADIAN STEEL INDUSTRY
7 FIGURES, CHARTS AND TABLES
Axial blowers EcoTech no yes no noOxygen enrichment of cold blast EcoTech 35 Nm3/thm yes yes no yes
yes yes no yes
All electrical energy consumption, including electrical energy consumption to produce purchased oxygen, has been converted to fossil fuel input using a factorof 9 200 MJ/MWh, which assumes 100 percent fossil fuel (coal) generation. Energy-intensity indicators for fuel consumption are based on thelower (net) heating value.
AllTech 50 Nm3/thm
0100 200 300 400 500 600 700 800 900
1 0001 1001 2001 300
EcoTech 1 2 3 4Plant
Ener
gy-In
tens
ityIn
dica
tor
(MJ/
tonn
eof
hotm
etal
)EcoTech
Utilities
Electricity
Figure 4-3. Blowing – Energy and Technology
Technology or Practice
Technology or PracticeWaste gas heat recovery EcoTech no yes no noStaggered/parallel stove operation EcoTech no no no noOxygen enrichment of cold blast EcoTech yes yes no yesCombustion control (<5% excess air) EcoTech 10% 17% 10% 50%Stove efficiency (85%) EcoTech 78% 76% 78% 67%
All electrical energy consumption, including electrical energy consumption to produce purchased oxygen, has been converted to fossil fuel input using a factor of 9 200 MJ/MWh, which assumes 100 percent fossil fuel (coal) generation. Energy-intensity indicators for fuel consumption are based on the lower (net) heating value.
Figure 4-4. Stoves – Energy and Technology
Note: Plant 4 was operating with abnormally high excess air due to damaged stove burners. This mode of operation significantly decreases efficiency.Hence, the stove efficiency is below normal.
0
500
1 000
1 500
2 000
2 500
EcoTech 1 2 3 4
EcoTech
Fuel
Electricity
Utilities
Plant
Ener
gy-In
tens
ityIn
dica
tor
(MJ/
tonn
eof
hotm
etal
)
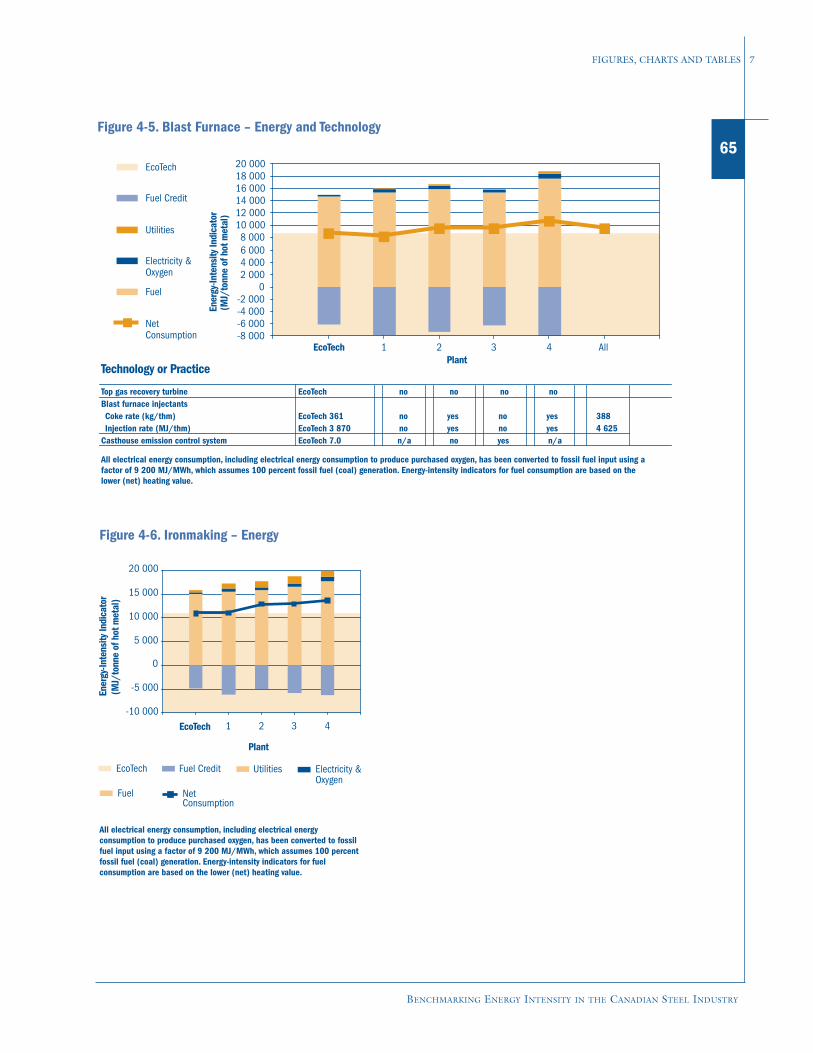
BENCHMARKING ENERGY INTENSITY IN THE CANADIAN STEEL INDUSTRY
FIGURES, CHARTS AND TABLES 7
65
Technology or Practice
Top gas recovery turbine EcoTech no no no noBlast furnace injectantsCoke rate (kg/thm) EcoTech 361 no yes no yes 388Injection rate (MJ/thm) EcoTech 3 870 no yes no yes 4 625
Casthouse emission control system EcoTech 7.0 n/a no yes n/a
All electrical energy consumption, including electrical energy consumption to produce purchased oxygen, has been converted to fossil fuel input using a factor of 9 200 MJ/MWh, which assumes 100 percent fossil fuel (coal) generation. Energy-intensity indicators for fuel consumption are based on the lower (net) heating value.
Figure 4-5. Blast Furnace – Energy and Technology
-8 000-6 000-4 000-2 000
02 0004 0006 0008 000
10 00012 00014 00016 00018 00020 000
EcoTech 1 2 3 4 AllPlant
EcoTech
Fuel Credit
Utilities
Electricity &Oxygen
Fuel
NetConsumption
Ener
gy-In
tens
ityIn
dica
tor
(MJ/
tonn
eof
hotm
etal
)
Figure 4-6. Ironmaking – Energy
-10 000
-5 000
0
5 000
10 000
15 000
20 000
EcoTech 1 2 3 4
Plant
EcoTech Fuel Credit Utilities Electricity &Oxygen
Fuel NetConsumption
All electrical energy consumption, including electrical energy consumption to produce purchased oxygen, has been converted to fossil fuel input using a factor of 9 200 MJ/MWh, which assumes 100 percentfossil fuel (coal) generation. Energy-intensity indicators for fuel consumption are based on the lower (net) heating value.
Ener
gy-In
tens
ityIn
dica
tor
(MJ/
tonn
eof
hotm
etal
)
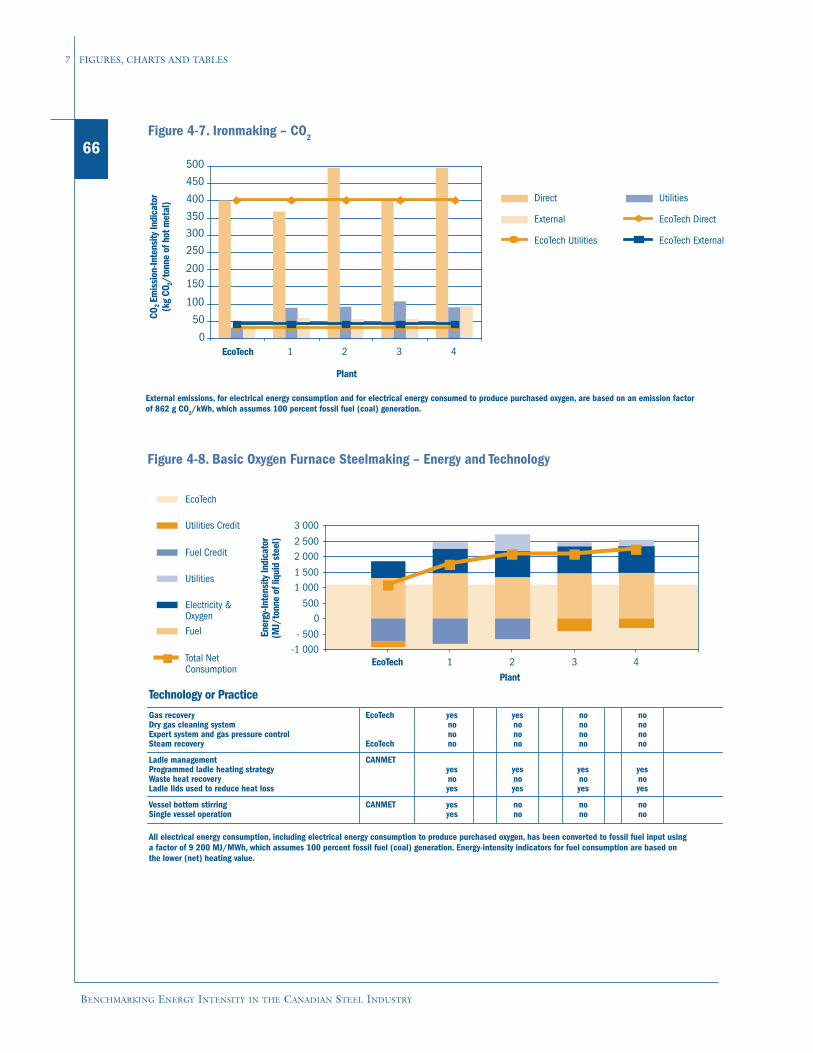
66
BENCHMARKING ENERGY INTENSITY IN THE CANADIAN STEEL INDUSTRY
7 FIGURES, CHARTS AND TABLES
External emissions, for electrical energy consumption and for electrical energy consumed to produce purchased oxygen, are based on an emission factor of 862 g CO2/kWh, which assumes 100 percent fossil fuel (coal) generation.
Figure 4-7. Ironmaking – CO2
0
50
100
150200
250
300
350
400
450
500
EcoTech 1 2 3 4
Plant
Direct Utilities
External EcoTech Direct
EcoTech Utilities EcoTech External
COEm
issi
on-In
tens
ityIn
dica
tor
(kg
CO/t
onne
ofho
tmet
al)
2
2
Gas recovery EcoTech yes yes no noDry gas cleaning system no no no noExpert system and gas pressure control no no no noSteam recovery EcoTech no no no no
Ladle management CANMETProgrammed ladle heating strategy yes yes yes yesWaste heat recovery no no no noLadle lids used to reduce heat loss yes yes yes yes
Vessel bottom stirring CANMET yes no no noSingle vessel operation yes no no no
All electrical energy consumption, including electrical energy consumption to produce purchased oxygen, has been converted to fossil fuel input using a factor of 9 200 MJ/MWh, which assumes 100 percent fossil fuel (coal) generation. Energy-intensity indicators for fuel consumption are based on the lower (net) heating value.
Figure 4-8. Basic Oxygen Furnace Steelmaking – Energy and Technology
-1 000- 500
0500
1 0001 500
2 0002 500
3 000
EcoTech 1 2 3 4
Plant
EcoTech
Utilities Credit
Fuel Credit
Utilities
Electricity &OxygenFuel
Total NetConsumption
Technology or Practice
Ener
gy-In
tens
ityIn
dica
tor
(MJ/
tonn
eof
liqui
dst
eel)
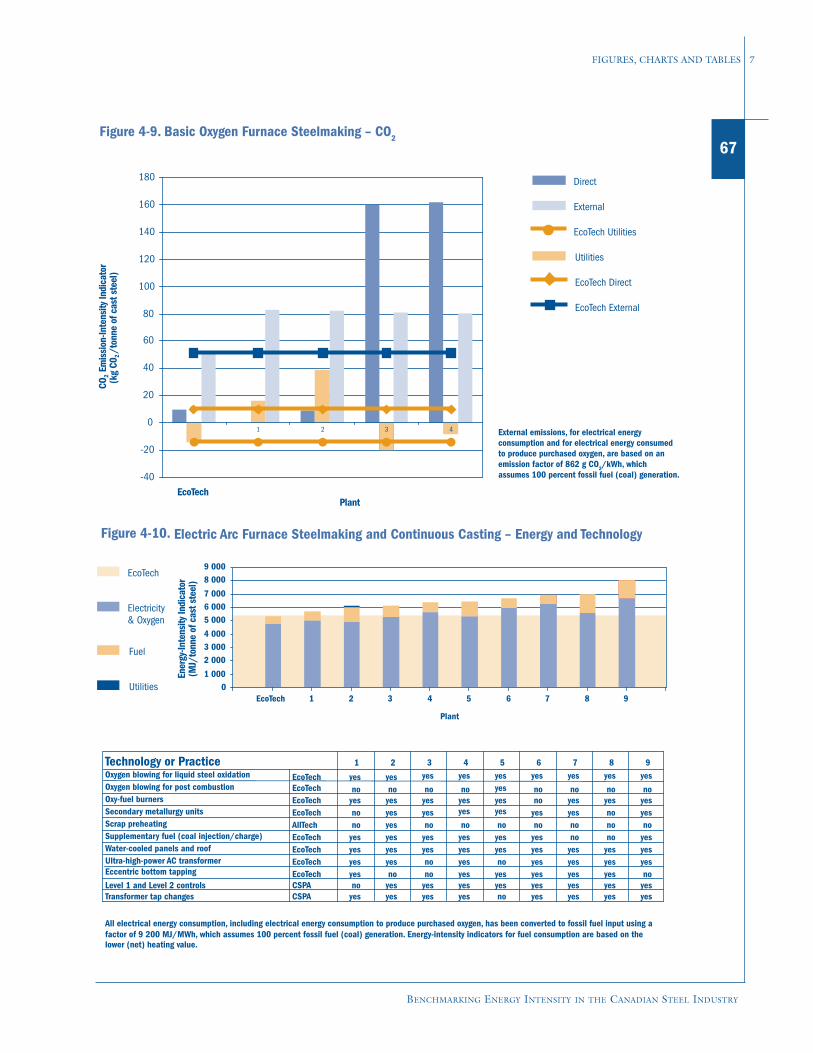
BENCHMARKING ENERGY INTENSITY IN THE CANADIAN STEEL INDUSTRY
FIGURES, CHARTS AND TABLES 7
67Figure 4-9. Basic Oxygen Furnace Steelmaking – CO2
External emissions, for electrical energy consumption and for electrical energy consumedto produce purchased oxygen, are based on an emission factor of 862 g CO2/kWh, which assumes 100 percent fossil fuel (coal) generation. -40
-20
0
20
40
60
80
100
120
140
160
180
EcoTech
1 2 3 4
Plant
Direct
Utilities
External
EcoTech Direct
EcoTech Utilities
EcoTech External
CO 2
Emis
sion
-Inte
nsity
Indi
cato
r(k
gC0
2/t
onne
ofca
stst
eel)
01 000
2 0003 0004 000
5 0006 0007 000
8 0009 000
EcoTech 1 2 3 4 5 6 7 8 9
EcoTech
Electricity & Oxygen
Fuel
Utilities
Technology or Practice 1 2 3 4 5 6 7 8 9Oxygen blowing for liquid steel oxidation EcoTech yes yes yes yes yes yes yes yes yesOxygen blowing for post combustion EcoTech no no no no yes no no no noOxy-fuel burners EcoTech yes yes yes yes yes no yes yes yesSecondary metallurgy units EcoTech no yes yes yes yes yes yes no yesScrap preheating AllTech no yes no no no no no no noSupplementary fuel (coal injection/charge) EcoTech yes yes yes yes yes yes no no yesWater-cooled panels and roof EcoTech yes yes yes yes yes yes yes yes yesUltra-high-power AC transformer EcoTech yes yes no yes no yes yes yes yesEccentric bottom tapping EcoTech yes no no yes yes yes yes yes noLevel 1 and Level 2 controls CSPA no yes yes yes yes yes yes yes yesTransformer tap changes CSPA yes yes yes yes no yes yes yes yes
All electrical energy consumption, including electrical energy consumption to produce purchased oxygen, has been converted to fossil fuel input using afactor of 9 200 MJ/MWh, which assumes 100 percent fossil fuel (coal) generation. Energy-intensity indicators for fuel consumption are based on the lower (net) heating value.
Figure 4-10. Electric Arc Furnace Steelmaking and Continuous Casting – Energy and Technology
Ener
gy-In
tens
ityIn
dica
tor
(MJ/
tonn
eof
cast
stee
l)
Plant
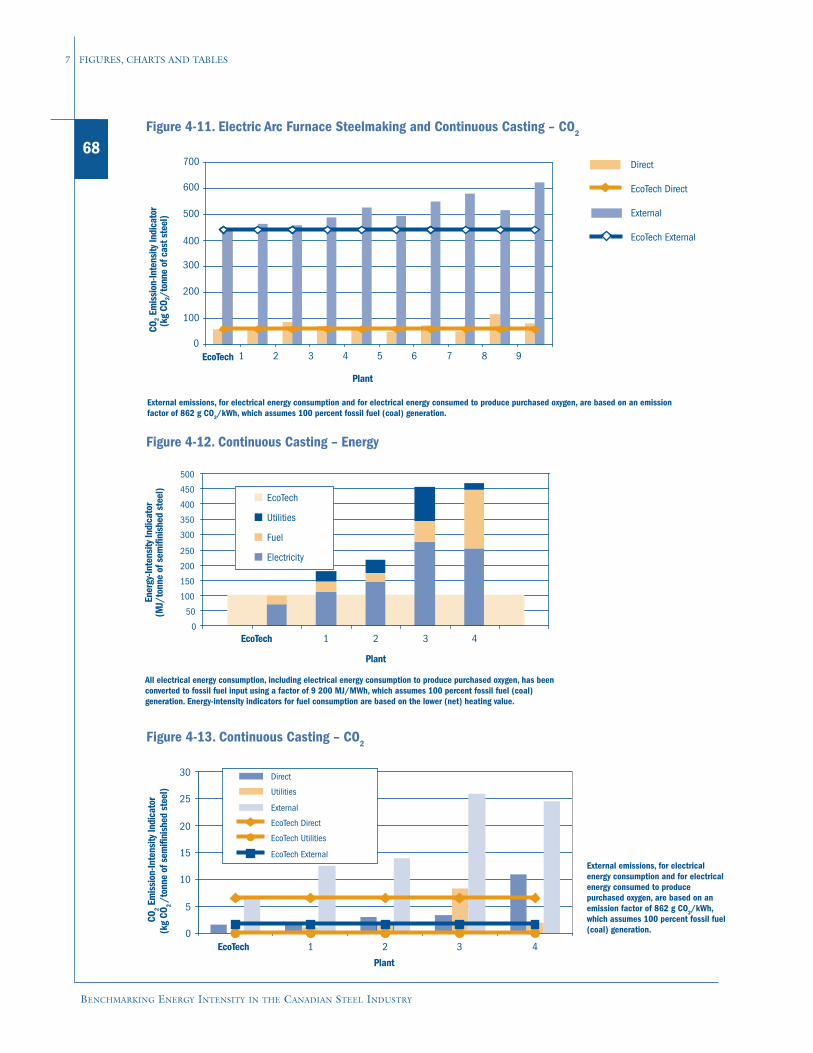
68
BENCHMARKING ENERGY INTENSITY IN THE CANADIAN STEEL INDUSTRY
7 FIGURES, CHARTS AND TABLES
External emissions, for electrical energy consumption and for electrical energy consumed to produce purchased oxygen, are based on an emission factor of 862 g CO2/kWh, which assumes 100 percent fossil fuel (coal) generation.
Figure 4-11. Electric Arc Furnace Steelmaking and Continuous Casting – CO2
0
100
200
300
400
500
600
700
Plant
Direct
External
EcoTech Direct
EcoTech External
EcoTech 1 2 3 4 5 6 7 8 9
CO 2
Emis
sion
-Inte
nsity
Indi
cato
r(k
gCO
2/to
nne
ofca
stst
eel)
Figure 4-12. Continuous Casting – Energy
All electrical energy consumption, including electrical energy consumption to produce purchased oxygen, has been converted to fossil fuel input using a factor of 9 200 MJ/MWh, which assumes 100 percent fossil fuel (coal) generation. Energy-intensity indicators for fuel consumption are based on the lower (net) heating value.
0
50
100
150
200
250
300
350
400
450
500
EcoTech 1 2 3 4
Plant
EcoTech
Utilities
Fuel
Electricity
Ener
gy-In
tens
ityIn
dica
tor
(MJ/
tonn
eof
sem
ifini
shed
stee
l)
External emissions, for electrical energy consumption and for electrical energy consumed to produce purchased oxygen, are based on an emission factor of 862 g CO2/kWh,which assumes 100 percent fossil fuel (coal) generation.
Figure 4-13. Continuous Casting – CO2
0
5
10
15
20
25
30
EcoTech 1 2 3 4
Plant
Direct
Utilities
External
EcoTech Direct
EcoTech Utilities
EcoTech External
CO 2
Emis
sion
-Inte
nsity
Indi
cato
r(k
gCO
2/t
onne
ofse
mifi
nish
edst
eel)
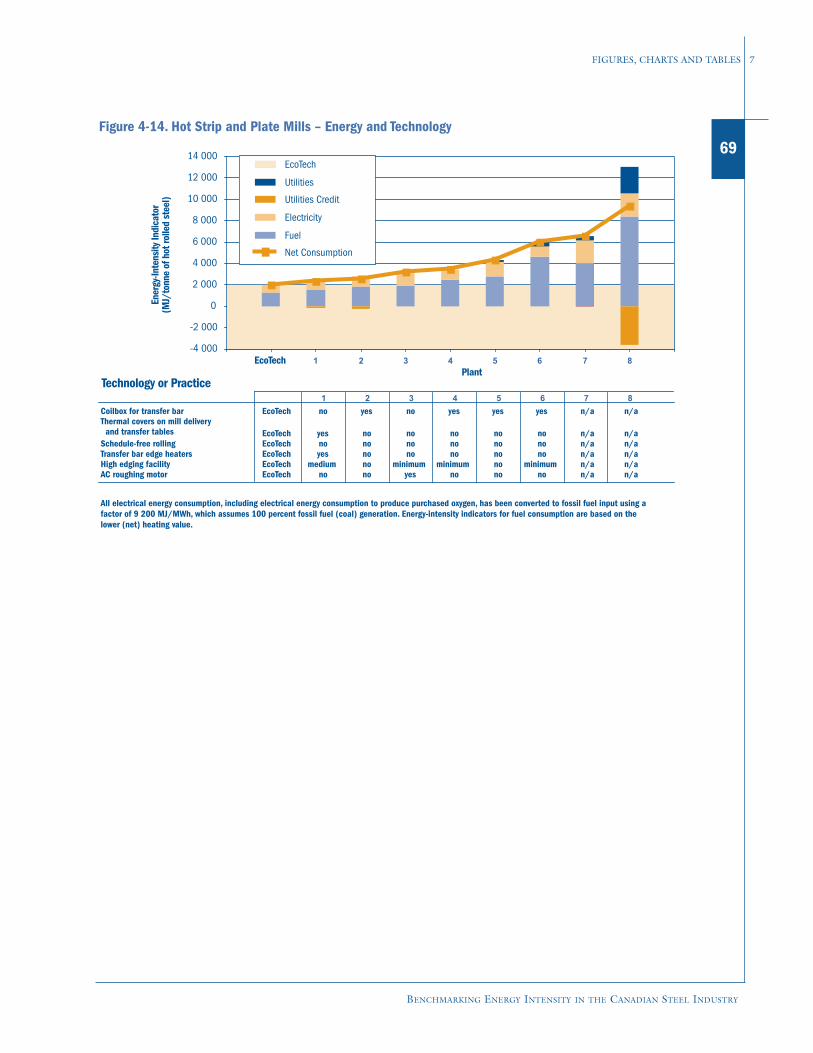
BENCHMARKING ENERGY INTENSITY IN THE CANADIAN STEEL INDUSTRY
FIGURES, CHARTS AND TABLES 7
69
1 2 3 4 5 6 7 8
Coilbox for transfer bar EcoTech no yes no yes yes yes n/a n/aThermal covers on mill delivery and transfer tables EcoTech yes no no no no no n/a n/aSchedule-free rolling EcoTech no no no no no no n/a n/aTransfer bar edge heaters EcoTech yes no no no no no n/a n/aHigh edging facility EcoTech medium no minimum minimum no minimum n/a n/aAC roughing motor EcoTech no no yes no no no n/a n/a
All electrical energy consumption, including electrical energy consumption to produce purchased oxygen, has been converted to fossil fuel input using afactor of 9 200 MJ/MWh, which assumes 100 percent fossil fuel (coal) generation. Energy-intensity indicators for fuel consumption are based on the lower (net) heating value.
Figure 4-14. Hot Strip and Plate Mills – Energy and Technology
-4 000
-2 000
0
2 000
4 000
6 000
8 000
10 000
12 000
14 000
EcoTech 1 2 3 4 5 6 7 8Plant
EcoTech
Utilities
Utilities Credit
Electricity
Fuel
Net Consumption
Technology or Practice
Ene
rgy-
Inte
nsity
Indi
cato
r(M
J/to
nne
ofho
trol
led
stee
l)
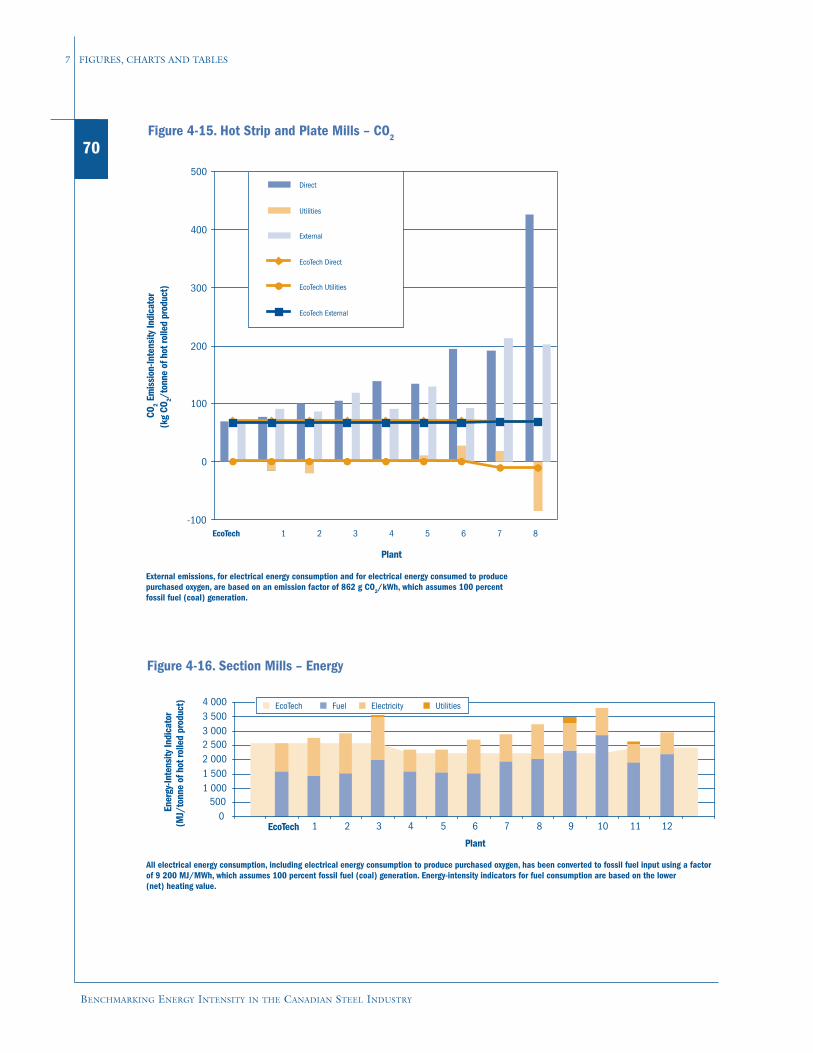
70
BENCHMARKING ENERGY INTENSITY IN THE CANADIAN STEEL INDUSTRY
7 FIGURES, CHARTS AND TABLES
EcoTech 1 2 3 4 5 6 7 8
Plant
External emissions, for electrical energy consumption and for electrical energy consumed to produce purchased oxygen, are based on an emission factor of 862 g CO2/kWh, which assumes 100 percentfossil fuel (coal) generation.
Figure 4-15. Hot Strip and Plate Mills – CO2
-100
0
100
200
300
400
500Direct
Utilities
External
EcoTech Direct
EcoTech Utilities
EcoTech External
CO2
Emis
sion
-Inte
nsity
Indi
cato
r(k
gCO
2/to
nne
ofho
trol
led
prod
uct)
All electrical energy consumption, including electrical energy consumption to produce purchased oxygen, has been converted to fossil fuel input using a factorof 9 200 MJ/MWh, which assumes 100 percent fossil fuel (coal) generation. Energy-intensity indicators for fuel consumption are based on the lower (net) heating value.
0500
1 0001 5002 0002 5003 0003 5004 000
1 2 3 4 5 6 7 8 9 10 11 12
EcoTech Fuel Electricity Utilities
Figure 4-16. Section Mills – Energy
EcoTech
Plant
Ene
rgy-
Inte
nsity
Indi
cato
r(M
J/to
nne
ofho
trol
led
prod
uct)
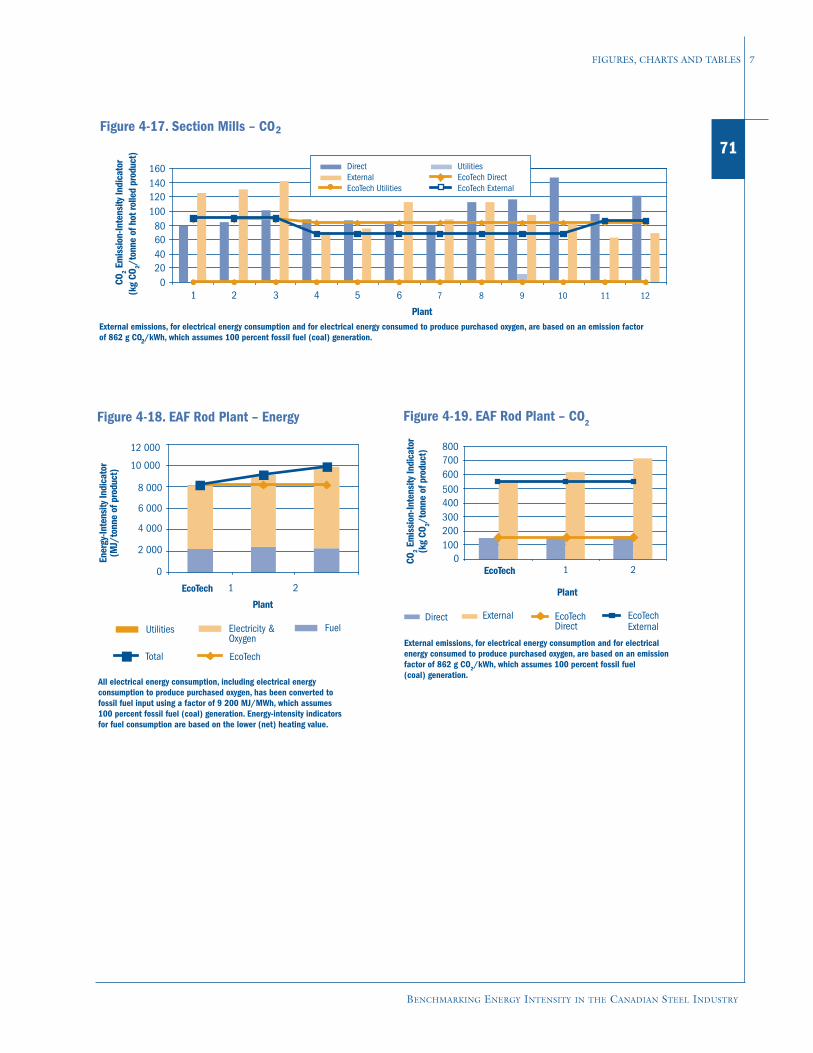
BENCHMARKING ENERGY INTENSITY IN THE CANADIAN STEEL INDUSTRY
FIGURES, CHARTS AND TABLES 7
71
External emissions, for electrical energy consumption and for electrical energy consumed to produce purchased oxygen, are based on an emission factor of 862 g CO /kWh, which assumes 100 percent fossil fuel (coal) generation.
020406080
100120140160
1 2 3 4 5 6 7 8 9 10 11 12
Direct UtilitiesExternal EcoTech DirectEcoTech Utilities EcoTech External
2Figure 4-17. Section Mills – CO
2
Plant
CO 2
Emis
sion
-Inte
nsity
Indi
cato
r(k
gCO
2/to
nne
ofho
trol
led
prod
uct)
0
2 000
4 000
6 000
8 000
10 000
12 000
EcoTech 1 2
Utilities Electricity &Oxygen
Fuel
Total EcoTech
All electrical energy consumption, including electrical energy consumption to produce purchased oxygen, has been converted to fossil fuel input using a factor of 9 200 MJ/MWh, which assumes100 percent fossil fuel (coal) generation. Energy-intensity indicators for fuel consumption are based on the lower (net) heating value.
Ene
rgy-
Inte
nsity
Indi
cato
r(M
J/to
nne
ofpr
oduc
t)
Figure 4-18. EAF Rod Plant – Energy
Plant
External emissions, for electrical energy consumption and for electrical energy consumed to produce purchased oxygen, are based on an emission factor of 862 g CO2/kWh, which assumes 100 percent fossil fuel (coal) generation.
CO 2
Emis
sion
-Inte
nsity
Indi
cato
r(k
gCO
2/to
nne
ofpr
oduc
t)Figure 4-19. EAF Rod Plant – CO2
0100 200 300 400 500 600 700 800
EcoTech 1 2
Plant
Direct External EcoTechDirect
EcoTechExternal
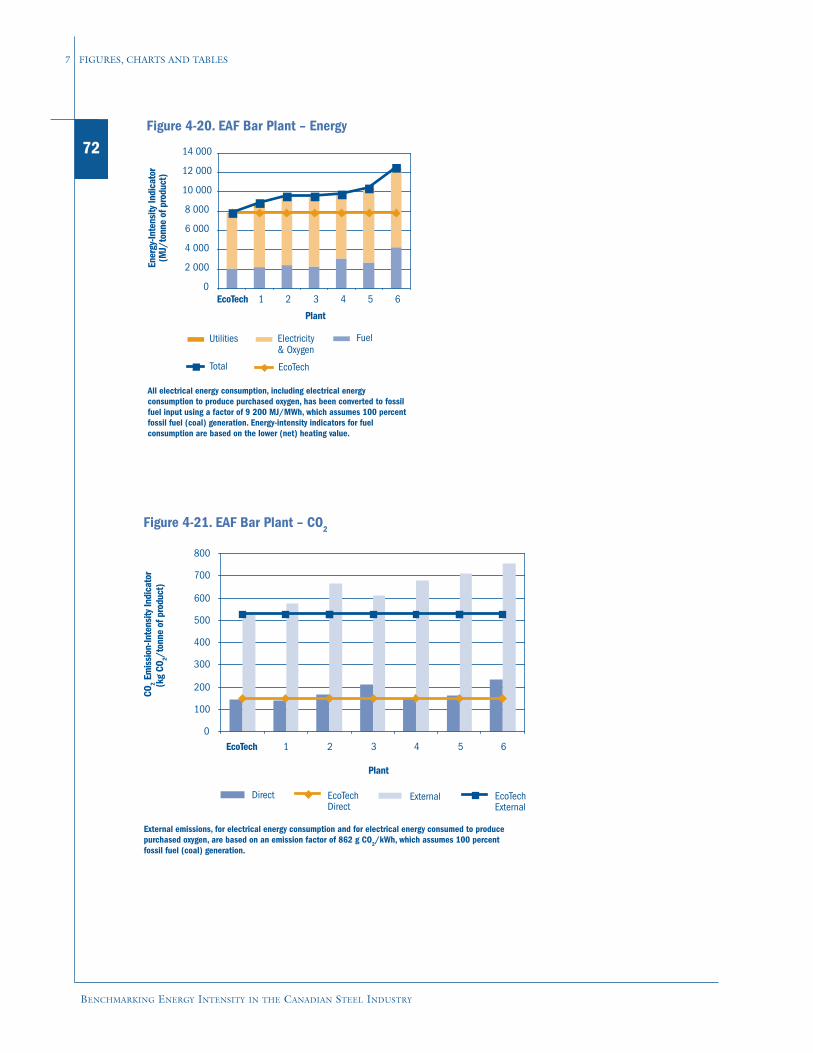
72
BENCHMARKING ENERGY INTENSITY IN THE CANADIAN STEEL INDUSTRY
7 FIGURES, CHARTS AND TABLES
All electrical energy consumption, including electrical energy consumption to produce purchased oxygen, has been converted to fossilfuel input using a factor of 9 200 MJ/MWh, which assumes 100 percent fossil fuel (coal) generation. Energy-intensity indicators for fuel consumption are based on the lower (net) heating value.
Ene
rgy-
Inte
nsity
Indi
cato
r(M
J/to
nne
ofpr
oduc
t)
Figure 4-20. EAF Bar Plant – Energy
0
2 000
4 000
6 000
8 000
10 000
12 000
14 000
EcoTech 1 2 3 4 5 6
Plant
Utilities Electricity& Oxygen
Fuel
Total EcoTech
External emissions, for electrical energy consumption and for electrical energy consumed to produce purchased oxygen, are based on an emission factor of 862 g CO2/kWh, which assumes 100 percent fossil fuel (coal) generation.
Plant
CO 2
Emis
sion
-Inte
nsity
Indi
cato
r(k
gCO
2/to
nne
ofpr
oduc
t)
Figure 4-21. EAF Bar Plant – CO2
0
100
200
300
400
500
600
700
800
EcoTech 1 2 3 4 5 6
Direct ExternalEcoTechDirect
EcoTechExternal
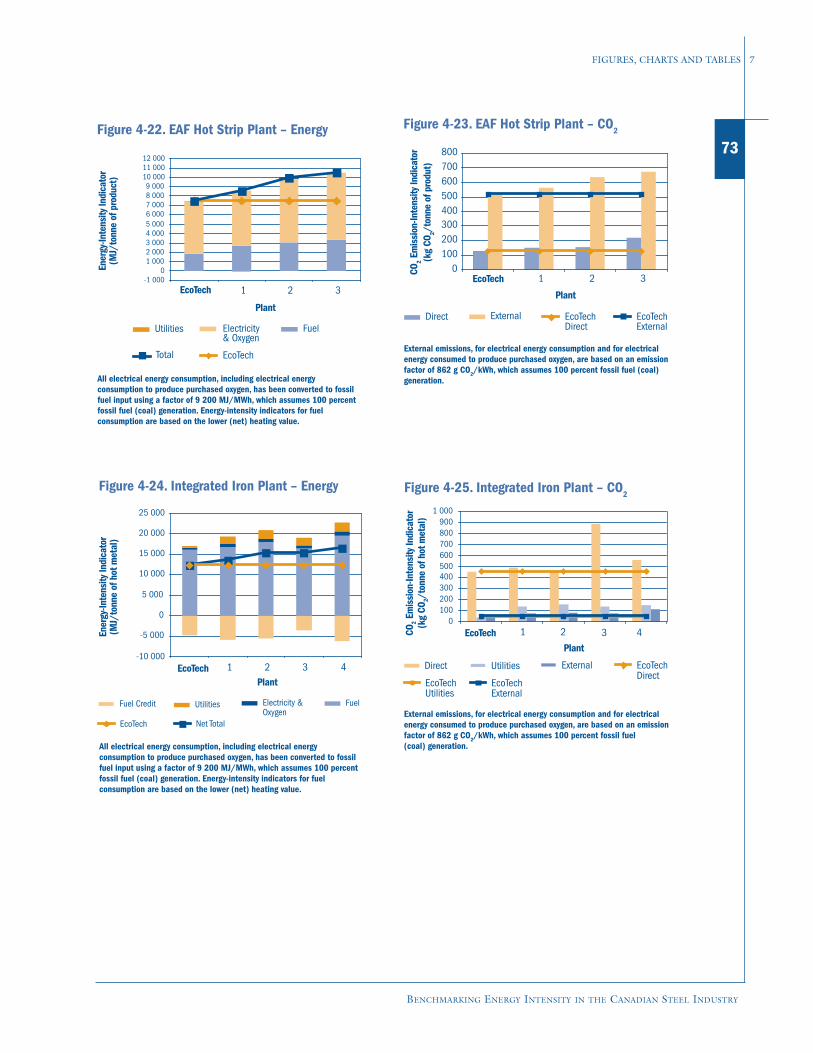
BENCHMARKING ENERGY INTENSITY IN THE CANADIAN STEEL INDUSTRY
FIGURES, CHARTS AND TABLES 7
73
Ener
gy-In
tens
ityIn
dica
tor
(MJ/
tonn
eof
prod
uct)
Figure 4-22. EAF Hot Strip Plant – Energy
-1 000 0
1 0002 0003 0004 0005 0006 0007 0008 0009 000
10 00011 00012 000
1 2 3
Utilities Electricity& Oxygen
Fuel
Total EcoTech
Plant
EcoTech
All electrical energy consumption, including electrical energy consumption to produce purchased oxygen, has been converted to fossilfuel input using a factor of 9 200 MJ/MWh, which assumes 100 percent fossil fuel (coal) generation. Energy-intensity indicators for fuel consumption are based on the lower (net) heating value.
Figure 4-23. EAF Hot Strip Plant – CO2
0100 200 300 400 500 600 700 800
1 2 3
Direct External EcoTechDirect
EcoTechExternal
Plant
EcoTech
External emissions, for electrical energy consumption and for electrical energy consumed to produce purchased oxygen, are based on an emission factor of 862 g CO2/kWh, which assumes 100 percent fossil fuel (coal)generation.
CO 2
Emis
sion
-Inte
nsity
Indi
cato
r(k
gCO
2/to
nne
ofpr
odut
)
Figure 4-24. Integrated Iron Plant – Energy
PlantEcoTech
All electrical energy consumption, including electrical energy consumption to produce purchased oxygen, has been converted to fossilfuel input using a factor of 9 200 MJ/MWh, which assumes 100 percent fossil fuel (coal) generation. Energy-intensity indicators for fuel consumption are based on the lower (net) heating value.
-5 000
0
5 000
10 000
-10 000
15 000
20 000
25 000
1 2 3 4
Fuel Credit Utilities Electricity &Oxygen
Fuel
EcoTech Net Total
Ene
rgy-
Inte
nsity
Indi
cato
r(M
J/to
nne
ofho
tmet
al)
PlantEcoTech
External emissions, for electrical energy consumption and for electrical energy consumed to produce purchased oxygen, are based on an emission factor of 862 g CO2/kWh, which assumes 100 percent fossil fuel (coal) generation.
0100200300400500600700800900
1 000
1 2 3 4
Direct Utilities External EcoTechDirect
EcoTechUtilities
EcoTechExternal
Figure 4-25. Integrated Iron Plant – CO2
CO2
Emis
sion
-Inte
nsity
Indi
cato
r(k
gCO
2/to
nne
ofho
tmet
al)
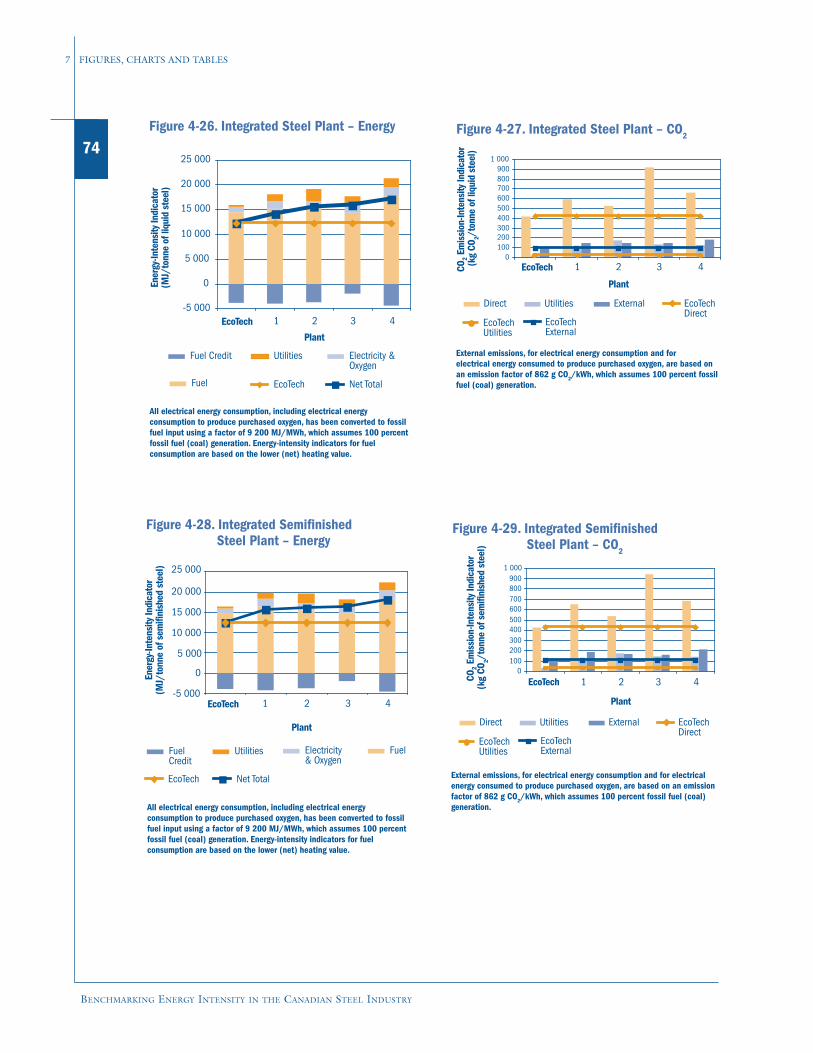
74
BENCHMARKING ENERGY INTENSITY IN THE CANADIAN STEEL INDUSTRY
7 FIGURES, CHARTS AND TABLES
Ener
gy-In
tens
ityIn
dica
tor
(MJ/
tonn
eof
liqui
dst
eel)
Figure 4-26. Integrated Steel Plant – Energy
All electrical energy consumption, including electrical energy consumption to produce purchased oxygen, has been converted to fossilfuel input using a factor of 9 200 MJ/MWh, which assumes 100 percent fossil fuel (coal) generation. Energy-intensity indicators for fuel consumption are based on the lower (net) heating value.
-5 000
0
5 000
10 000
15 000
20 000
25 000
1 2 3 4
Fuel Credit Utilities Electricity &Oxygen
Fuel EcoTech Net Total
Plant
EcoTech
Figure 4-27. Integrated Steel Plant – CO2
External emissions, for electrical energy consumption and for electrical energy consumed to produce purchased oxygen, are based on an emission factor of 862 g CO2/kWh, which assumes 100 percent fossil fuel (coal) generation.
0100200300400500600700800900
1 000
1 2 3 4
Direct Utilities External EcoTechDirect
EcoTechUtilities
EcoTechExternal
Plant
EcoTechCO2
Emis
sion
-Inte
nsity
Indi
cato
r(k
gCO
2/to
nne
ofliq
uid
stee
l)
All electrical energy consumption, including electrical energy consumption to produce purchased oxygen, has been converted to fossilfuel input using a factor of 9 200 MJ/MWh, which assumes 100 percent fossil fuel (coal) generation. Energy-intensity indicators for fuel consumption are based on the lower (net) heating value.
Ene
rgy-
Inte
nsity
Indi
cato
r(M
J/to
nne
ofse
mifi
nish
edst
eel)
Figure 4-28. Integrated SemifinishedSteel Plant – Energy
Plant
-5 000
0
5 000
10 000
15 000
20 000
25 000
1 2 3 4
FuelCredit
Utilities Electricity& Oxygen
Fuel
EcoTech Net Total
EcoTech
CO2
Emis
sion
-Inte
nsity
Indi
cato
r(k
gCO
2/to
nne
ofse
mifi
nish
edst
eel)
Plant
Figure 4-29. Integrated SemifinishedSteel Plant – CO2
0100200300400500600700800900
1 000
EcoTech 1 2 3 4
Direct Utilities External EcoTechDirect
EcoTechUtilities
EcoTechExternal
External emissions, for electrical energy consumption and for electrical energy consumed to produce purchased oxygen, are based on an emission factor of 862 g CO2/kWh, which assumes 100 percent fossil fuel (coal)generation.
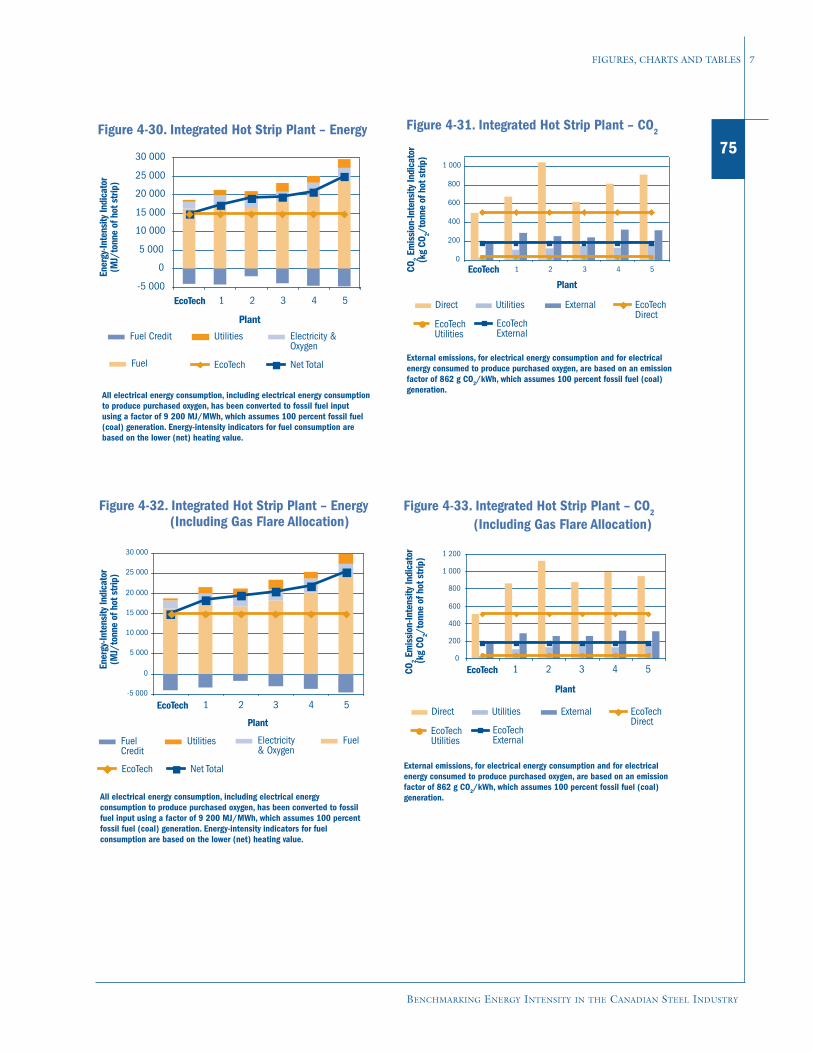
BENCHMARKING ENERGY INTENSITY IN THE CANADIAN STEEL INDUSTRY
FIGURES, CHARTS AND TABLES 7
75
Ener
gy-In
tens
ityIn
dica
tor
(MJ/
tonn
eof
hots
trip)
Figure 4-30. Integrated Hot Strip Plant – Energy
-5 000
0
5 000
10 000
15 000
20 000
25 000
30 000
1 2 3 4 5
Fuel Credit Utilities Electricity &Oxygen
Fuel EcoTech Net Total
EcoTech
Plant
All electrical energy consumption, including electrical energy consumption to produce purchased oxygen, has been converted to fossil fuel input using a factor of 9 200 MJ/MWh, which assumes 100 percent fossil fuel (coal) generation. Energy-intensity indicators for fuel consumption arebased on the lower (net) heating value.
CO2
Emis
sion
-Inte
nsity
Indi
cato
r(k
gCO
2/to
nne
ofho
tstri
p)
Figure 4-31. Integrated Hot Strip Plant – CO2
Plant
EcoTech0
200
400
600
800
1 000
1 2 3 4 5
Direct Utilities External EcoTechDirect
EcoTechUtilities
EcoTechExternal
External emissions, for electrical energy consumption and for electrical energy consumed to produce purchased oxygen, are based on an emission factor of 862 g CO2/kWh, which assumes 100 percent fossil fuel (coal)generation.
All electrical energy consumption, including electrical energy consumption to produce purchased oxygen, has been converted to fossilfuel input using a factor of 9 200 MJ/MWh, which assumes 100 percentfossil fuel (coal) generation. Energy-intensity indicators for fuel consumption are based on the lower (net) heating value.
-5 000
0
5 000
10 000
15 000
20 000
25 000
30 000
1 2 3 4 5
Plant
Figure 4-32. Integrated Hot Strip Plant – Energy (Including Gas Flare Allocation)
EcoTech
FuelCredit
Utilities Electricity& Oxygen
Fuel
EcoTech Net Total
Ene
rgy-
Inte
nsity
Indi
cato
r(M
J/to
nne
ofho
tstri
p)
CO2
Emis
sion
-Inte
nsity
Indi
cato
r(k
gCO
2/to
nne
ofho
tstri
p)
External emissions, for electrical energy consumption and for electrical energy consumed to produce purchased oxygen, are based on an emission factor of 862 g CO2/kWh, which assumes 100 percent fossil fuel (coal)generation.
Figure 4-33. Integrated Hot Strip Plant – CO2
(Including Gas Flare Allocation)
0
200
400
600
800
1 000
1 200
EcoTech 1 2 3 4 5
Plant
Direct Utilities External EcoTechDirect
EcoTechUtilities
EcoTechExternal

76
BENCHMARKING ENERGY INTENSITY IN THE CANADIAN STEEL INDUSTRY
7 FIGURES, CHARTS AND TABLES
Ener
gy-In
tens
ityIn
dica
tor
(MJ/
tonn
eof
hots
trip
)
Figure 4-34. Integrated Hot Strip Plant – Energy (Including Gas Flare and Utilities Allocation)
-5 000
0
5 000
10 000
15 000
20 000
25 000
30 000
EcoTech 1 2 3 4 5
Plant
All electrical energy consumption, including electrical energy consumption to produce purchased oxygen, has been converted to fossilfuel input using a factor of 9 200 MJ/MWh, which assumes 100 percent fossil fuel (coal) generation. Energy-intensity indicators for fuel consumption are based on the lower (net) heating value.
Fuel Credit Utilities Electricity &Oxygen
Fuel EcoTech Net Total
CO2
Emis
sion
-Inte
nsity
Indi
cato
r(k
gCO
2/to
nne
ofho
tstri
p)
Plant
EcoTech 1 2 3 4 5
External emissions, for electrical energy consumption and for electrical energy consumed to produce purchased oxygen, are based on an emission factor of 862 g CO2/kWh, which assumes 100 percent fossil fuel (coal)generation.
Figure 4-35. Integrated Hot Strip Plant – CO2
(Including Gas Flare and Utilities Allocation)
- 200 0
200 400 600 800
1 0001 2001 4001 6001 8002 000
Direct External Total EcoTechDirect
EcoTechExternal
EcoTechTotal
Figure 4-36. Integrated Plate Plant – Energy
-5 000
0
5 000
10 000
15 000
20 000
25 000
30 000
35 000
EcoTech 1 2
Plant
FuelCredit
Utilities Electricity& Oxygen
Fuel
EcoTech Net Total
Ene
rgy-
Inte
nsity
Indi
cato
r(M
J/to
nne
ofpl
ate)
All electrical energy consumption, including electrical energy consumption to produce purchased oxygen, has been converted to fossilfuel input using a factor of 9 200 MJ/MWh, which assumes 100 percent fossil fuel (coal) generation. Energy-intensity indicators for fuel consumption are based on the lower (net) heating value.
Direct Utilities External EcoTechDirect
EcoTechUtilities
EcoTechExternal
External emissions, for electrical energy consumption and for electrical energy consumed to produce purchased oxygen, are based on an emission factor of 862 g CO2/kWh, which assumes 100 percent fossil fuel (coal)generation.
Figure 4-37. Integrated Plate Plant – CO2
0
200
400
600
800
1 000
1 200
EcoTech 1 2
Plant
CO2
Emis
sion
-Inte
nsity
Indi
cato
r(k
gCO
2/to
nne
ofpl
ate)
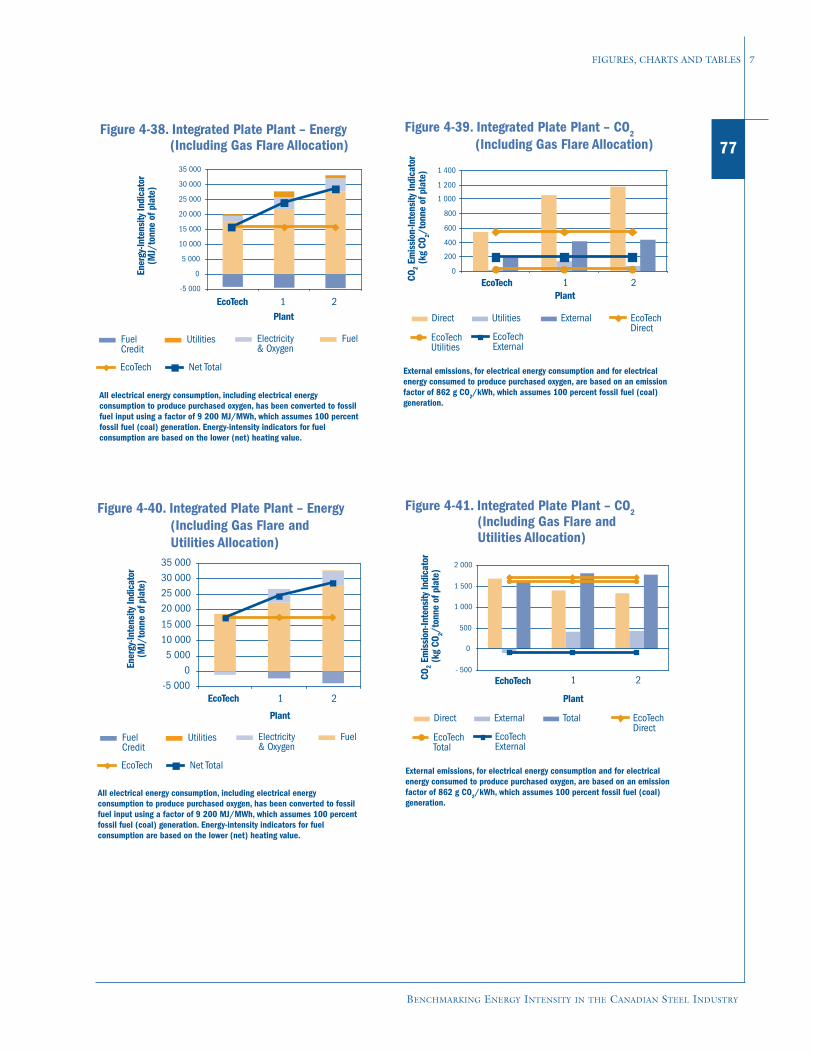
BENCHMARKING ENERGY INTENSITY IN THE CANADIAN STEEL INDUSTRY
FIGURES, CHARTS AND TABLES 7
77
All electrical energy consumption, including electrical energy consumption to produce purchased oxygen, has been converted to fossilfuel input using a factor of 9 200 MJ/MWh, which assumes 100 percent fossil fuel (coal) generation. Energy-intensity indicators for fuel consumption are based on the lower (net) heating value.
FuelCredit
Utilities Electricity& Oxygen
Fuel
EcoTech Net Total
Figure 4-38. Integrated Plate Plant – Energy (Including Gas Flare Allocation)
-5 000
0
5 000
10 000
15 000
20 000
25 000
30 000
35 000
EcoTech 1 2Plant
Ener
gy-In
tens
ityIn
dica
tor
(MJ/
tonn
eof
plat
e)
CO2
Emis
sion
-Inte
nsity
Indi
cato
r(k
gCO
2/to
nne
ofpl
ate)
EcoTech
Figure 4-39. Integrated Plate Plant – CO2
(Including Gas Flare Allocation)
0
200
400
600
800
1 000
1 200
1 400
1 2Plant
Direct Utilities External EcoTechDirect
EcoTechUtilities
EcoTechExternal
External emissions, for electrical energy consumption and for electrical energy consumed to produce purchased oxygen, are based on an emission factor of 862 g CO2/kWh, which assumes 100 percent fossil fuel (coal)generation.
Figure 4-40. Integrated Plate Plant – Energy (Including Gas Flare and Utilities Allocation)
-5 000
0
5 000
10 000
15 000
20 000
25 000
30 000
35 000
EcoTech 1 2
Plant
FuelCredit
Utilities Electricity& Oxygen
Fuel
EcoTech Net Total
All electrical energy consumption, including electrical energy consumption to produce purchased oxygen, has been converted to fossilfuel input using a factor of 9 200 MJ/MWh, which assumes 100 percent fossil fuel (coal) generation. Energy-intensity indicators for fuel consumption are based on the lower (net) heating value.
Ene
rgy-
Inte
nsity
Indi
cato
r(M
J/to
nne
ofpl
ate)
CO2
Emis
sion
-Inte
nsity
Indi
cato
r(k
gCO
2/to
nne
ofpl
ate)
Figure 4-41. Integrated Plate Plant – CO2(Including Gas Flare and
Utilities Allocation)
- 500
0
500
1 000
1 500
2 000
Direct External Total EcoTechDirect
EcoTechTotal
EcoTechExternal
External emissions, for electrical energy consumption and for electrical energy consumed to produce purchased oxygen, are based on an emission factor of 862 g CO2/kWh, which assumes 100 percent fossil fuel (coal)generation.
EchoTech 1 2
Plant

78
BENCHMARKING ENERGY INTENSITY IN THE CANADIAN STEEL INDUSTRY
7 FIGURES, CHARTS AND TABLES
Ener
gy-In
tens
ityIn
dica
tor
(MJ/
tonn
eof
hots
trip)
Figure 4-42. Direct Reduced Iron and IntegratedHot Strip Plants — Energy
-5 000
0
1 2 3 4 5
5 000
10 000
15 000
20 000
25 000
30 000
EcoTech 60% DRIDRI 1
EcoTech Integrated
Plant
All electrical energy consumption, including electrical energy consumption to produce purchased oxygen, has been converted to fossilfuel input using a factor of 9 200 MJ/MWh, which assumes 100 percent fossil fuel (coal) generation. Energy-intensity indicators for fuel consumption are based on the lower (net) heating value.
Fuel Credit Utilities Electricity &Oxygen
Fuel EcoTech Net Total
Figure 4-43. Direct Reduced Iron and Integrated Hot Strip Plants — CO2
- 200
0
200
400
600
800
1 000
1 200
1 400
1 600
1 800
2 000
Plant
Direct
External
Total
CO2
Emis
sion
-Inte
nsity
Indi
cato
r(M
J/to
nne
ofho
tstri
pco
il)
EcoTech Direct
EcoTech Total
EcoTech External
1
EcoTe
chInt
egrat
ed
EcoTe
ch60
%DR
I
DRI 1 2 3 4 5
External emissions, for electrical energy consumption and for electrical energy consumed to produce purchased oxygen, are based on an emission factor of 862 g CO2/kWh, which assumes 100 percent fossil fuel (coal) generation.
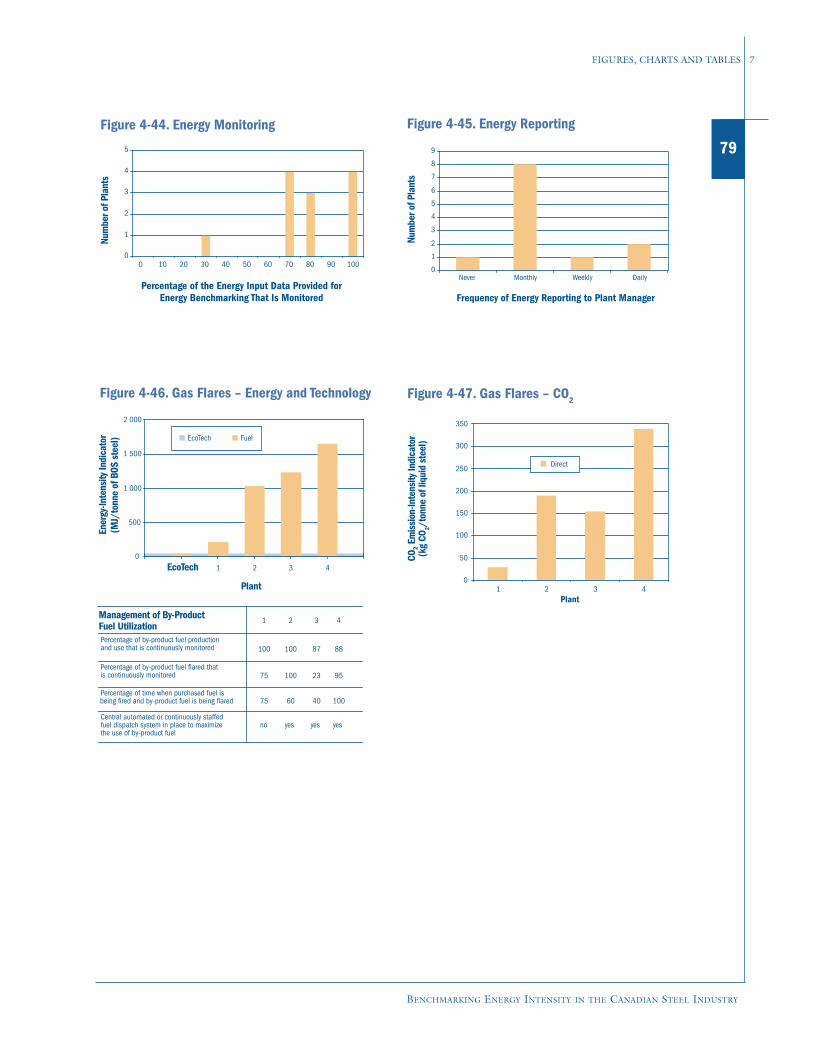
BENCHMARKING ENERGY INTENSITY IN THE CANADIAN STEEL INDUSTRY
FIGURES, CHARTS AND TABLES 7
79Figure 4-44. Energy Monitoring
0
1
2
3
4
5
0 10 20 30 40 50 60 70 80 90 100
Percentage of the Energy Input Data Provided for Energy Benchmarking That Is Monitored
Num
bero
fPla
nts
Figure 4-45. Energy Reporting
Num
bero
fPla
nts
0
1
2
3
4
5
6
7
8
9
Never Monthly Weekly Daily
Frequency of Energy Reporting to Plant Manager
Figure 4-46. Gas Flares – Energy and Technology
0
500
1 000
1 500
2 000
EcoTech 1 2 3 4
Plant
EcoTech Fuel
Management of By-Product 1 2 3 4
Fuel UtilizationPercentage of by-product fuel productionand use that is continuously monitored 100 100 87 88
Percentage of by-product fuel flared that is continuously monitored 75 100 23 95
Percentage of time when purchased fuel is being fired and by-product fuel is being flared 75 60 40 100
Central automated or continuously staffedfuel dispatch system in place to maximize the use of by-product fuel
no yes yes yes
Ener
gy-In
tens
ityIn
dica
tor
(MJ/
tonn
eof
BOS
stee
l)
Figure 4-47. Gas Flares – CO2CO
2Em
issi
on-In
tens
ityIn
dica
tor
(kg
CO2/
tonn
eof
liqui
dst
eel)
0
50
100
150
200
250
300
350
1 2 3 4Plant
Direct

80
BENCHMARKING ENERGY INTENSITY IN THE CANADIAN STEEL INDUSTRY
7 FIGURES, CHARTS AND TABLES
Figure 4-48. Power Plant – Performance andTechnology
Stea
mPr
essu
re(B
ar)
65
67
6563
89
0
50
100
150
200
250
0 100 200 300 400 500 600
Steam Temperature (°C)
Power Rate kWh/GJ EcoTech
Plants
Technology or Practice
EcoTech 1 2 3 4Steam GenerationPressure 180 42 32 32 21Temperature (°C) 530 399 399 399 301
Electricity Generation MWh/t BOF steel 0.359 0.068 0.012 0 0
TechnologySteam reheat stages 1 0 0 0 0Regeneration stages 6 1 1 1 1
PerformancePower rate (kWh/GJ) 89 67 65 65 63Heat rate (MJ/kWh) 11.3 15.0 15.5 15.5 16.0
Plant
Energy-intensity indicators for fuel consumption are based on thelower (net) heating value.
Figure 4-49. Slab Reheating Furnaces – Energy and Technology
Ener
gy-In
tens
ityIn
dica
tor
(MJ/
tonn
ech
arge
d)
-1 000
0
1 000
2 000
3 000
4 000
5 000
6 000
7 000
EcoTech 1 2 3 4 5 6 7 8 9 10 11 12 13 14 15 16 17
Furnace
EcoTech Fuel
Utilities Electricity
Utilities Credit Net Total
Technology or Practice EcoTech 1 2 3 4 5 6 7 8 9 10 11 12 13 14 15 16 17
Furnace application STRIP STRIP STRIP STRIP STRIP STRIP STRIP P & S* P & S* P & S* STRIP STRIP STRIP STRIP STRIP PLATE PLATEFurnace type Walking Walking Walking Pusher Walking Walking Pusher Pusher Walking Walking Walking Pusher Pusher Pusher Pusher Pusher Pusher Pusher
Charge temperature (°C) 200 AMB** AMB** 100 100 350 100 AMB** AMB** AMB** AMB** AMB** AMB** AMB** AMB** AMB** AMB** AMB**Recuperation temperature (°C) 450 550 550 450 400 480 425 AMB** 315 371 AMB**121 232 177 121 93 232 232Charge preheat zone length (m) 10 8.8 8.8 6.76 10.82 9.14 6.76 3.4 10 0 0 12.192 7.9 7.0 12.2 7.0 8.7 8.7Heat recovery steam boilers AllTec no no no no no no no no no no no no no no no yes yes
Skid cooling heat recovery yes yes yes yes no no yes no 0 0 0 no no no no no no noStaggered or offset skids yes yes yes yes no yes no no no no yes yes yes yes yes yes yesDouble insulated skids AllTec no no no yes no no no no yes no no no no no no no no
Level I control yes yes yes yes yes yes yes yes yes yes yes yes yes yes yes yes yes yesLevel II control yes yes yes yes yes yes yes yes yes yes yes no no no no no yes yesLevel III control yes yes yes no no no no yes yes yes yes no no no no no yes yes
All electrical energy consumption, including electrical energy consumption to produce purchased oxygen, has been converted to fossil fuel input using a factor of 9 200 MJ/MWh, which assumes 100 percent fossil fuel (coal) generation. Energy-intensity indicators for fuel consumption are based on the lower (net) heating value. *Plate and Strip (P&S) ** Ambient (AMB)

BENCHMARKING ENERGY INTENSITY IN THE CANADIAN STEEL INDUSTRY
FIGURES, CHARTS AND TABLES 7
81
0
500
1 000
1 500
2 000
2 500
3 000
EcoTech 1 2 3 4 5 6 7 8 9 10 11 12
Plant
EcoTech Fuel
Electricity Utilities
Figure 4-50. Billet and Bloom Reheating Furnaces – Energy and Technology
Ener
gy-In
tens
ityIn
dica
tor
(MJ/
tonn
ech
arge
d)
Technology or Practice EcoTech 1 2 3 4 5 6 7 8 9 10 11 12
Furnace application Rod Mill Bar Mill Bar Mill Rod Mill Bar Mill Other Bar Mill Bar Mill Rod Mill Other Bar Mill Bar MillFurnace type Walking Pusher Walking Pusher Walking Pusher Walking Pusher Walking Pusher Pusher Walking Walking
Charge temperature (°C) ambient ambient ambient ambient ambient 564 ambient ambient ambient ambient ambient ambientRecuperation temperature (°C) 400 ambient ambient 400 430 315 385 ambient 450 316 315 399 0Charge preheat zone length (m) yes 6.5 8.7 2 6 8.53 3 1.8 0 0 0 0 2.4Heat recovery steam boilers no no no no no no no no no no no no
Skid cooling heat recovery no no no no no no no no no no no noStaggered or offset skids no no no yes no no no no no no yes noDouble insulated skids no no no no no no no no no no yes no
Level I control yes yes yes yes yes yes yes yes yes yes yes yesLevel II control yes no no yes yes yes yes no no yes yes yesLevel III control yes no no yes no yes no no no no yes no
All electrical energy consumption, including electrical energy consumption to produce purchased oxygen, has been converted to fossil fuel input using a factor of 9 200 MJ/MWh, which assumes 100 percent fossil fuel (coal) generation. Energy-intensity indicators for fuel consumption are based on the lower (net) heating value.
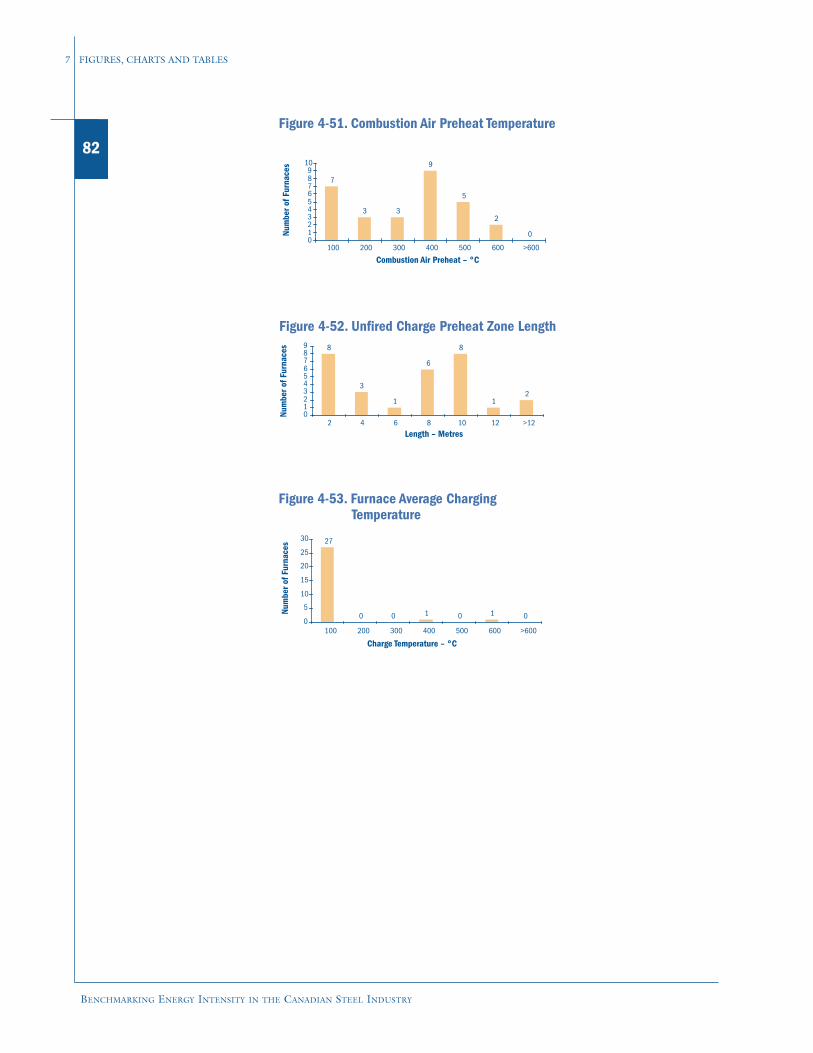
82
BENCHMARKING ENERGY INTENSITY IN THE CANADIAN STEEL INDUSTRY
7 FIGURES, CHARTS AND TABLES
Figure 4-51. Combustion Air Preheat Temperature
7
3 3
9
5
2
00123456789
10
100 200 300 400 500 600 >600
Combustion Air Preheat – °C
Num
bero
fFur
nace
s
Figure 4-52. Unfired Charge Preheat Zone Length8
3
1
6
8
12
0123456789
2 4 6 8 10 12 >12
Length – Metres
Num
bero
fFur
nace
s
Figure 4-53. Furnace Average Charging Temperature
27
0 0 1 0 1 00
5
10
15
20
25
30
100 200 300 400 500 600 >600
Charge Temperature – °C
Num
bero
fFur
nace
s

APPENDICES

84
BENCHMARKING ENERGY INTENSITY IN THE CANADIAN STEEL INDUSTRY
APPENDIX A
APPENDIX A – ECOTECH TECHNOLOGIES AND ENERGY-INTENSITY ANDCO2 EMISSION-INTENSITY INDICATORS
COKEMAKING REFERENCES*
High-Pressure Ammonia Liquor Spray Aspiration EcoTech Page 36, Section 3.1.7Variable Speed Drives EcoTech Page 36, Section 3.1.7Coke Dry Quenching AllTech Page 36, Section 3.1.7Coal Drying AllTech Page 36, Section 3.1.7Enhanced Combustion Control CANMET
ENERGY CO2
INTENSITY INTENSITY(MJ/tdc) (kg/tdc)
Underfiring 3 200 144 Page 36, Section 3.1.7Steam for By-Products Plant 290 21 Page 36, Section 3.1.7Electricity 286 27 Page 36, Section 3.1.7Total 3 776 192
IRONMAKING
STOVES REFERENCES
REFERENCES
Waste Gas Heat Recovery EcoTech Page 64, Section 3.3.7.1Staggered/Parallel Stove Operation EcoTech Page 64, Section 3.3.7.1Oxygen Enrichment of Cold Blast 35 m 3/tonne of hot metal EcoTech Page 64, Section 3.3.7.150 m 3/tonne of hot metal AllTech Page 64, Section 3.3.7.1
Combustion Control (5% Excess Air) EcoTech Page 64, Section 3.3.7.1Stove Efficiency (Above 85%) EcoTech Page 64, Section 3.3.7.1
ENERGY INTENSITY
(MJ/thm)Blast Furnance Gas 1 303 Page 71, Table 7Coke Oven Gas 231 Page 71, Table 7Electricity 28 Page 68, Section 3.3.9Total 1 562
PULVERIZED COAL PREPARATIONENERGY INTENSITY
(MJ/thm)Electricity
*Energy Use in the Steel Industry, Committee on Technology, International Iron and Steel Institute, Brussels, 1998.
18 Page 68, Section 3.3.9
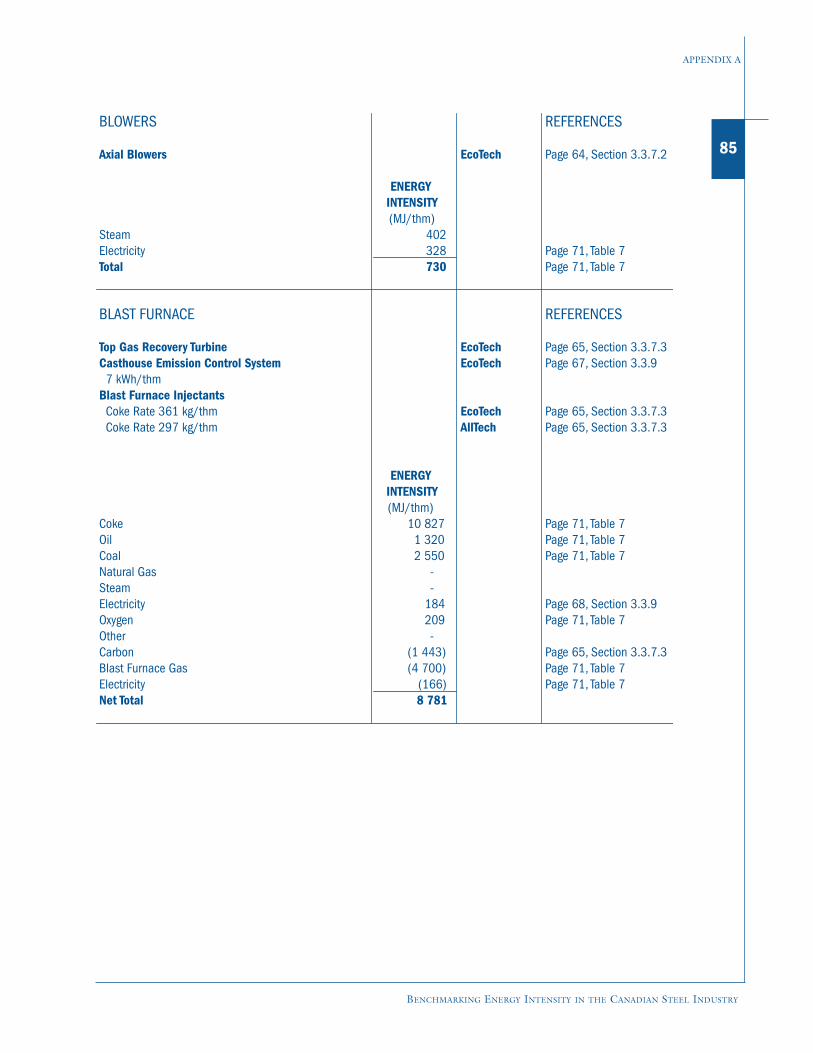
BENCHMARKING ENERGY INTENSITY IN THE CANADIAN STEEL INDUSTRY
APPENDIX A
85
BLOWERS REFERENCES
Axial Blowers EcoTech Page 64, Section 3.3.7.2
ENERGY INTENSITY(MJ/thm)
Steam 402 Electricity 328 Page 71, Table 7Total 730 Page 71, Table 7
BLAST FURNACE REFERENCES
Top Gas Recovery Turbine EcoTech Page 65, Section 3.3.7.3Casthouse Emission Control System EcoTech Page 67, Section 3.3.9 7 kWh/thmBlast Furnace InjectantsCoke Rate 361 kg/thm EcoTech Page 65, Section 3.3.7.3
Coke Rate 297 kg/thm AllTech Page 65, Section 3.3.7.3
ENERGY INTENSITY(MJ/thm)
Coke 10 827 Page 71, Table 7Oil 1 320 Page 71, Table 7Coal 2 550 Page 71, Table 7Natural Gas - Steam - Electricity 184 Page 68, Section 3.3.9Oxygen 209 Page 71, Table 7Other - Carbon (1 443) Page 65, Section 3.3.7.3Blast Furnace Gas (4 700) Page 71, Table 7Electricity (166) Page 71, Table 7Net Total 8 781
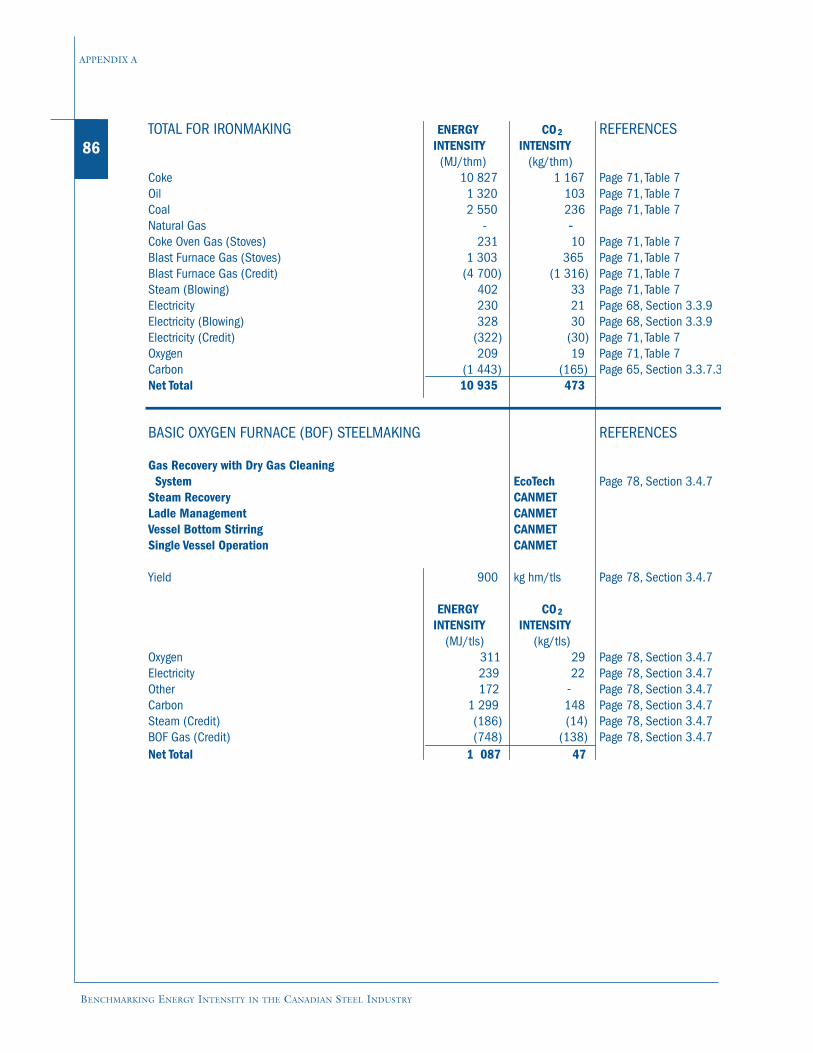
86
BENCHMARKING ENERGY INTENSITY IN THE CANADIAN STEEL INDUSTRY
APPENDIX A
TOTAL FOR IRONMAKING ENERGY CO2 REFERENCESINTENSITY INTENSITY(MJ/thm) (kg/thm)
Coke 10 827 1 167 Page 71, Table 7Oil 1 320 103 Page 71, Table 7Coal 2 550 236 Page 71, Table 7Natural Gas - -Coke Oven Gas (Stoves) 231 10 Page 71, Table 7Blast Furnace Gas (Stoves) 1 303 365 Page 71, Table 7Blast Furnace Gas (Credit) (4 700) (1 316) Page 71, Table 7Steam (Blowing) 402 33 Page 71, Table 7Electricity 230 21 Page 68, Section 3.3.9Electricity (Blowing) 328 30 Page 68, Section 3.3.9Electricity (Credit) (322) (30) Page 71, Table 7Oxygen 209 19 Page 71, Table 7Carbon (1 443) (165) Page 65, Section 3.3.7.3Net Total 10 935 473
BASIC OXYGEN FURNACE (BOF) STEELMAKING REFERENCES
Gas Recovery with Dry Gas Cleaning System EcoTech Page 78, Section 3.4.7Steam Recovery CANMETLadle Management CANMETVessel Bottom Stirring CANMETSingle Vessel Operation CANMET
Yield 900 kg hm/tls Page 78, Section 3.4.7
ENERGY CO2
INTENSITY INTENSITY(MJ/tls) (kg/tls)
Oxygen 311
29
Page 78, Section 3.4.7Electricity 239
22
Page 78, Section 3.4.7Other 172
- Page 78, Section 3.4.7Carbon 1 299
148
Page 78, Section 3.4.7Steam (Credit) (186)
(14)
Page 78, Section 3.4.7BOF Gas (Credit) (748)
(138)
Page 78, Section 3.4.7Net Total 1 087
47
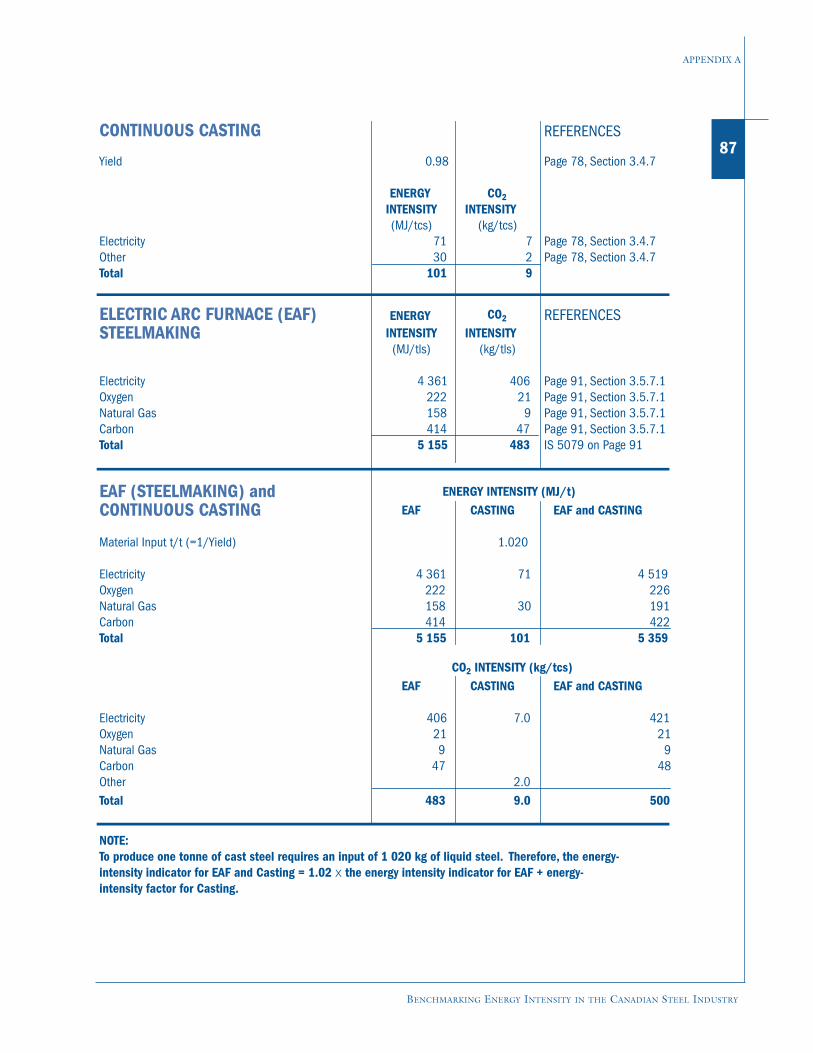
BENCHMARKING ENERGY INTENSITY IN THE CANADIAN STEEL INDUSTRY
APPENDIX A
87CONTINUOUS CASTING REFERENCES
Yield 0.98 Page 78, Section 3.4.7
ENERGY CO2INTENSITY INTENSITY(MJ/tcs) (kg/tcs)
Electricity 71 7 Page 78, Section 3.4.7Other 30 2 Page 78, Section 3.4.7Total 101 9
ELECTRIC ARC FURNACE (EAF) STEELMAKING
ENERGY CO2 REFERENCESINTENSITY INTENSITY(MJ/tls) (kg/tls)
Electricity 4 361 406 Page 91, Section 3.5.7.1Oxygen 222 21 Page 91, Section 3.5.7.1Natural Gas 158 9 Page 91, Section 3.5.7.1Carbon 414 47 Page 91, Section 3.5.7.1Total 5 155 483 IS 5079 on Page 91
EAF (STEELMAKING) andCONTINUOUS CASTING EAF CASTING
Material Input t/t (=1/Yield) 1.020
Electricity 4 361 71 Oxygen 222Natural Gas 158 30 Carbon 414Total 5 155 101
EAF CASTING
Electricity 406 7.0 Oxygen 21Natural Gas 9Carbon 47Other 2.0 Total 483 9.0
NOTE:
ENERGY INTENSITY (MJ/t)EAF and CASTING
4 519 226 191 422
5 359
EAF and CASTINGCO2 INTENSITY (kg/tcs)
421
To produce one tonne of cast steel requires an input of 1 020 kg of liquid steel. Therefore, the energy-intensity indicator for EAF and Casting = 1.02 x the energy intensity indicator for EAF + energy-intensity factor for Casting.
21 9
48
500
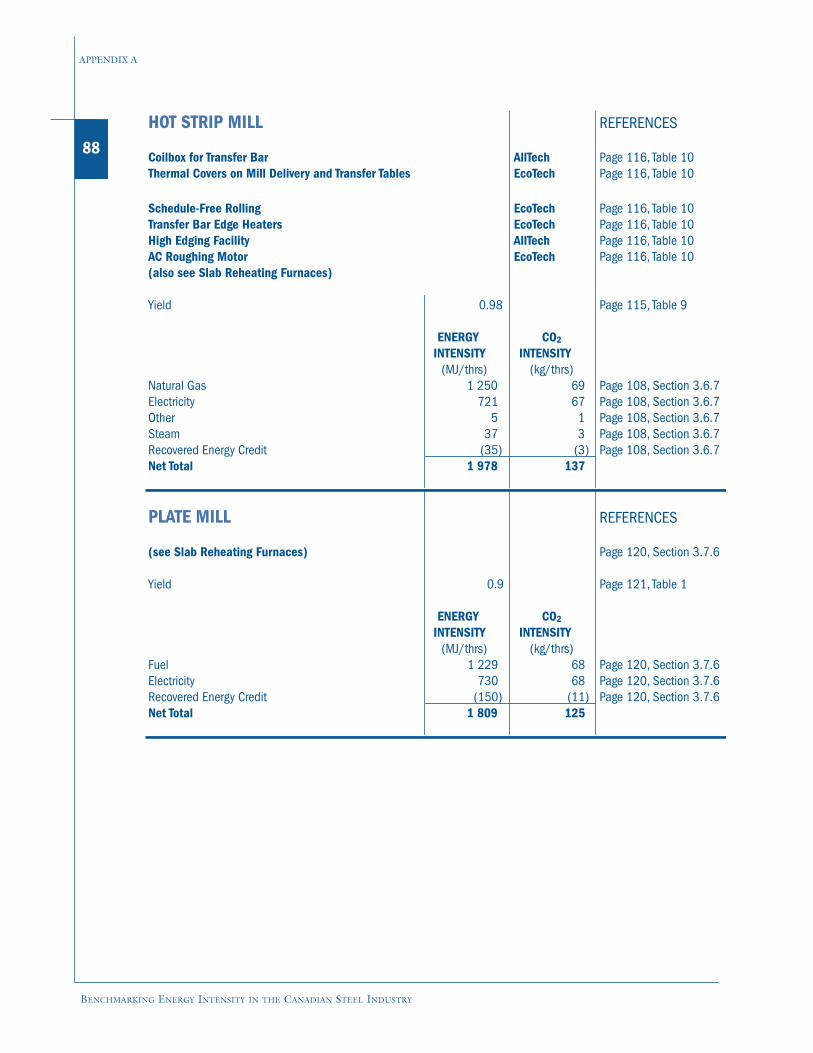
88
BENCHMARKING ENERGY INTENSITY IN THE CANADIAN STEEL INDUSTRY
APPENDIX A
HOT STRIP MILL REFERENCES
Coilbox for Transfer Bar AllTech Page 116, Table 10EcoTech Page 116, Table 10
Schedule-Free Rolling EcoTech Page 116, Table 10Transfer Bar Edge Heaters EcoTech Page 116, Table 10High Edging Facility AllTech Page 116, Table 10AC Roughing Motor EcoTech Page 116, Table 10(also see Slab Reheating Furnaces)
Yield 0.98 Page 115, Table 9
ENERGY CO2
INTENSITY INTENSITY(MJ/thrs) (kg/thrs)
Natural Gas 1 250 69 Page 108, Section 3.6.7Electricity 721 67 Page 108, Section 3.6.7Other 5 1 Page 108, Section 3.6.7Steam 37 3 Page 108, Section 3.6.7Recovered Energy Credit (35) (3) Page 108, Section 3.6.7Net Total 1 978 137
PLATE MILL REFERENCES
(see Slab Reheating Furnaces) Page 120, Section 3.7.6
Yield 0.9 Page 121, Table 1
ENERGY CO2
INTENSITY INTENSITY(MJ/thrs) (kg/thrs)
Fuel 1 229 68 Page 120, Section 3.7.6Electricity 730 68 Page 120, Section 3.7.6Recovered Energy Credit (150) (11) Page 120, Section 3.7.6Net Total 1 809 125
Thermal Covers on Mill Delivery and Transfer Tables
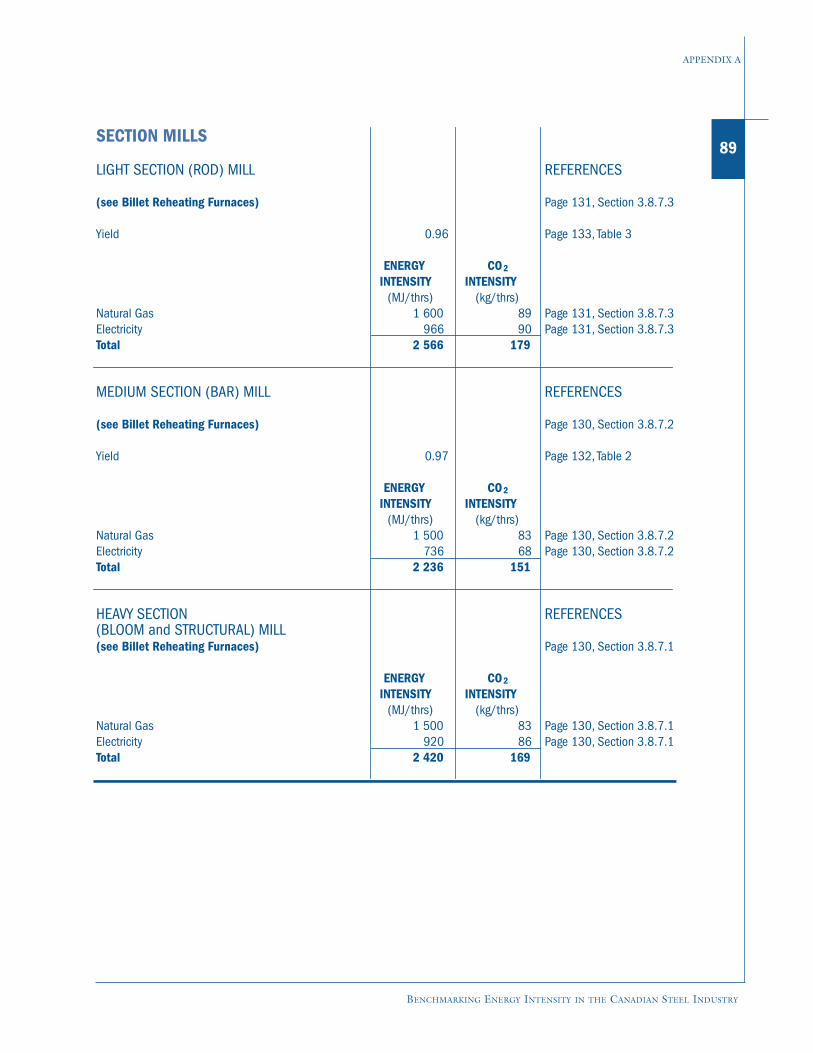
BENCHMARKING ENERGY INTENSITY IN THE CANADIAN STEEL INDUSTRY
APPENDIX A
89SECTION MILLS
LIGHT SECTION (ROD) MILL REFERENCES
(see Billet Reheating Furnaces) Page 131, Section 3.8.7.3
Yield 0.96 Page 133, Table 3
ENERGY CO2
INTENSITY INTENSITY(MJ/thrs) (kg/thrs)
Natural Gas 1 600 89 Page 131, Section 3.8.7.3Electricity 966 90 Page 131, Section 3.8.7.3Total 2 566 179
MEDIUM SECTION (BAR) MILL REFERENCES
REFERENCES
(see Billet Reheating Furnaces) Page 130, Section 3.8.7.2
Yield 0.97 Page 132, Table 2
ENERGY CO2
INTENSITY INTENSITY(MJ/thrs) (kg/thrs)
Natural Gas 1 500 83 Page 130, Section 3.8.7.2Electricity 736 68 Page 130, Section 3.8.7.2Total 2 236 151
HEAVY SECTION (BLOOM and STRUCTURAL) MILL(see Billet Reheating Furnaces) Page 130, Section 3.8.7.1
ENERGY CO2
INTENSITY INTENSITY(MJ/thrs) (kg/thrs)
Natural Gas 1 500 83 Page 130, Section 3.8.7.1Electricity 920 86 Page 130, Section 3.8.7.1Total 2 420 169
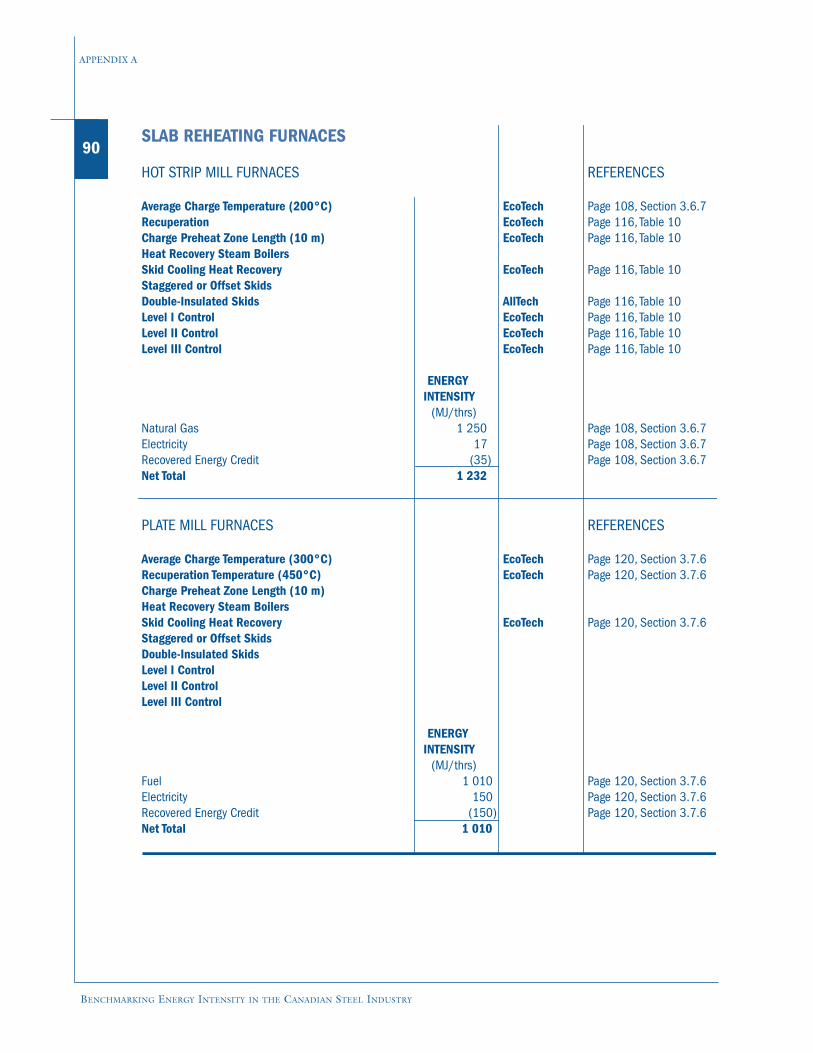
90
BENCHMARKING ENERGY INTENSITY IN THE CANADIAN STEEL INDUSTRY
APPENDIX A
SLAB REHEATING FURNACES
HOT STRIP MILL FURNACES REFERENCES
Average Charge Temperature (200°C) EcoTech Page 108, Section 3.6.7Recuperation EcoTech Page 116, Table 10Charge Preheat Zone Length (10 m) EcoTech Page 116, Table 10Heat Recovery Steam BoilersSkid Cooling Heat Recovery EcoTech Page 116, Table 10Staggered or Offset SkidsDouble-Insulated Skids AllTech Page 116, Table 10Level I Control EcoTech Page 116, Table 10Level II Control EcoTech Page 116, Table 10Level III Control EcoTech Page 116, Table 10
ENERGY INTENSITY
(MJ/thrs)Natural Gas 1 250 Page 108, Section 3.6.7Electricity 17 Page 108, Section 3.6.7Recovered Energy Credit (35) Page 108, Section 3.6.7Net Total 1 232
PLATE MILL FURNACES REFERENCES
Average Charge Temperature (300°C) EcoTech Page 120, Section 3.7.6Recuperation Temperature (450°C) EcoTech Page 120, Section 3.7.6Charge Preheat Zone Length (10 m)Heat Recovery Steam BoilersSkid Cooling Heat Recovery EcoTech Page 120, Section 3.7.6Staggered or Offset SkidsDouble-Insulated SkidsLevel I ControlLevel II ControlLevel III Control
ENERGY INTENSITY
(MJ/thrs)Fuel 1 010 Page 120, Section 3.7.6Electricity 150 Page 120, Section 3.7.6Recovered Energy Credit (150) Page 120, Section 3.7.6Net Total 1 010
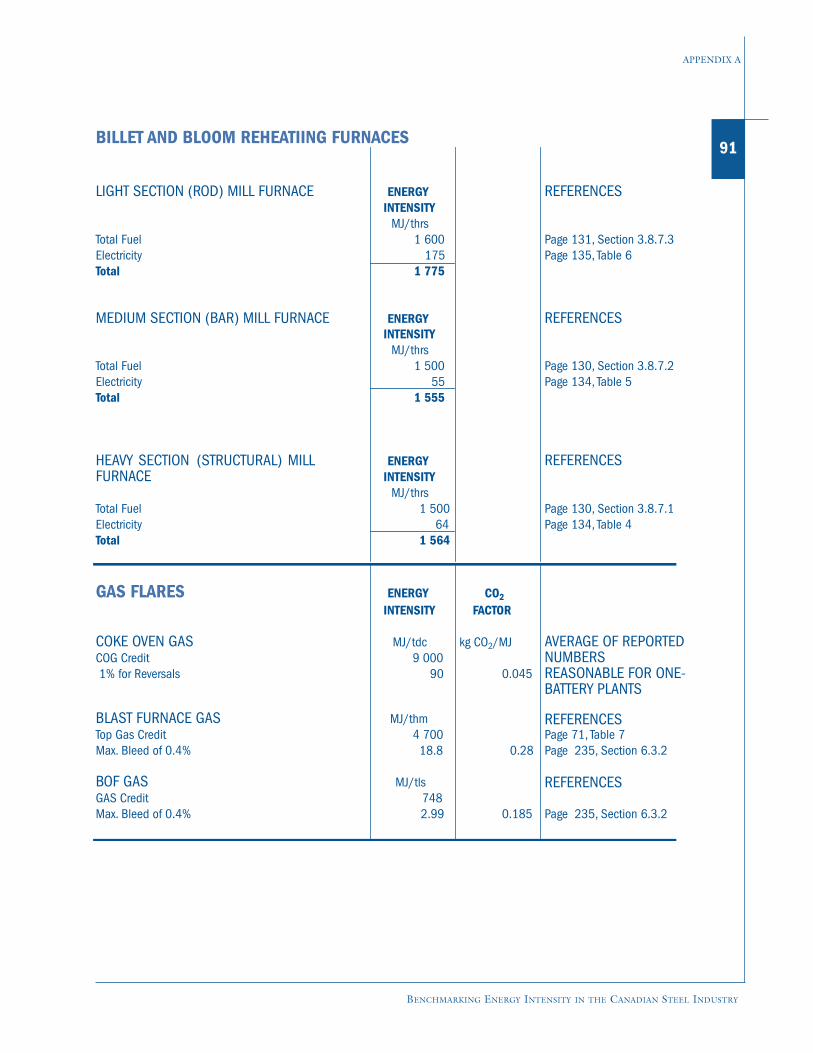
BENCHMARKING ENERGY INTENSITY IN THE CANADIAN STEEL INDUSTRY
APPENDIX A
91BILLET AND BLOOM REHEATIING FURNACES
LIGHT SECTION (ROD) MILL FURNACE ENERGY INTENSITY
MJ/thrs
REFERENCES
Total Fuel 1 600 Page 131, Section 3.8.7.3Electricity 175 Page 135, Table 6Total 1 775
ENERGY INTENSITY
MJ/thrs
REFERENCES
Total Fuel 1 500 Page 130, Section 3.8.7.2Electricity 55 Page 134, Table 5Total 1 555
ENERGY INTENSITY
MJ/thrs
REFERENCES
REFERENCES
REFERENCES
Total Fuel 1 500 Page 130, Section 3.8.7.1Electricity 64 Page 134, Table 4Total 1 564
GAS FLARES ENERGY CO2
INTENSITY FACTOR
COKE OVEN GAS MJ/tdc kg CO2/MJCOG Credit 9 000 1% for Reversals 90 0.045
BLAST FURNACE GAS MJ/thmTop Gas Credit 4 700
Page 71, Table 7
Max. Bleed of 0.4% 18.8 0.28 Page 235, Section 6.3.2
BOF GAS MJ/tlsGAS Credit 748
Max. Bleed of 0.4% 2.99
0.185 Page 235, Section 6.3.2
MEDIUM SECTION (BAR) MILL FURNACE
HEAVY SECTION (STRUCTURAL) MILLFURNACE
AVERAGE OF REPORTEDNUMBERS REASONABLE FOR ONE-BATTERY PLANTS
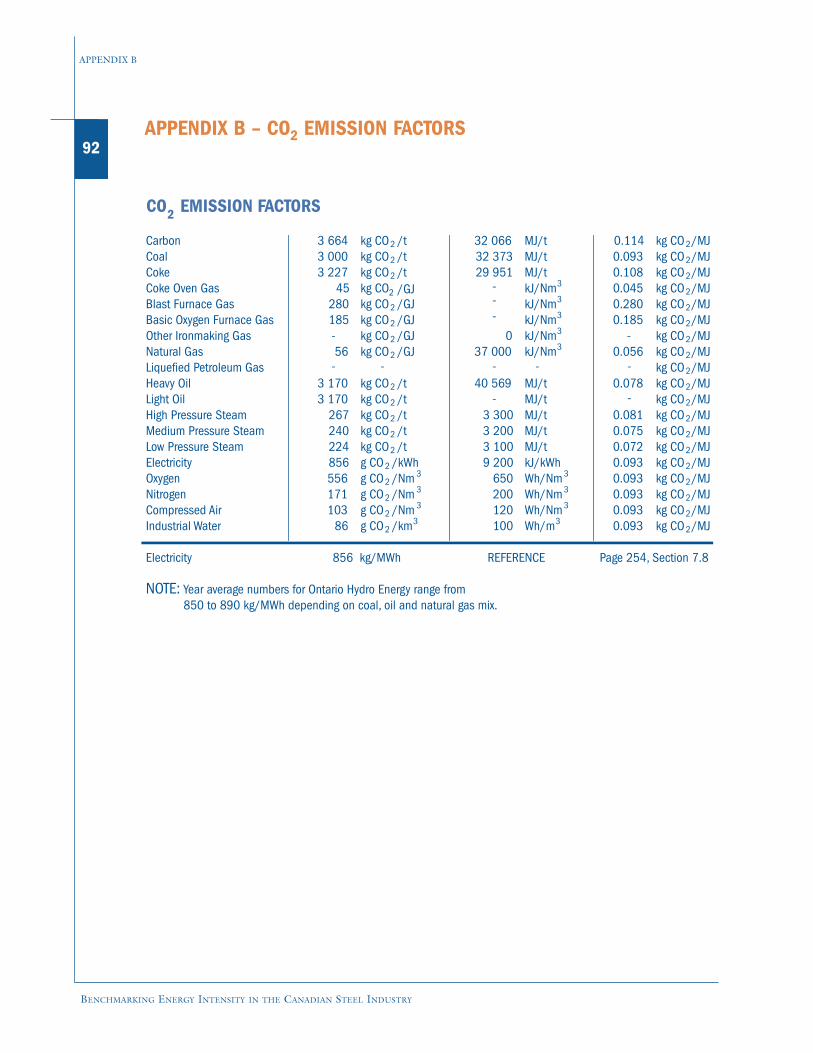
92
BENCHMARKING ENERGY INTENSITY IN THE CANADIAN STEEL INDUSTRY
APPENDIX B
APPENDIX B – CO2 EMISSION FACTORS
CO2 EMISSION FACTORS
Carbon 3 664 kg CO2 /t 32 066 MJ/t 0.114 kg CO2/MJCoal 3 000 kg CO2 /t 32 373 MJ/t 0.093 kg CO2/MJCoke 3 227 kg CO2
2
/t 29 951 MJ/t 0.108 kg CO2/MJCoke Oven Gas 45 kg CO kJ/Nm3 0.045 kg CO2/MJBlast Furnace Gas 280 kg CO2 /GJ
/GJkJ/Nm3 0.280 kg CO2/MJ
Basic Oxygen Furnace Gas 185 kg CO2 /GJ kJ/Nm3 0.185 kg CO2/MJOther Ironmaking Gas -
- - - -
-
-
---
-
kg CO2 /GJ 0 kJ/Nm3 - kg CO2/MJNatural Gas 56 kg CO2 /GJ 37 000 kJ/Nm3 0.056 kg CO2/MJLiquefied Petroleum Gas kg CO2/MJHeavy Oil 3 170 kg CO2 /t 40 569 MJ/t 0.078 kg CO2/MJLight Oil 3 170 kg CO2 /t MJ/t kg CO2/MJHigh Pressure Steam 267 kg CO2 /t 3 300 MJ/t 0.081 kg CO2/MJMedium Pressure Steam 240 kg CO2 /t 3 200 MJ/t 0.075 kg CO2/MJLow Pressure Steam 224 kg CO2 /t 3 100 MJ/t 0.072 kg CO2/MJElectricity 856 g CO2 /kWh 9 200 kJ/kWh 0.093 kg CO2/MJOxygen 556 g CO2 /Nm 3 650 Wh/Nm3 0.093 kg CO2/MJNitrogen 171 g CO2 /Nm 3 200 Wh/Nm3 0.093 kg CO2/MJCompressed Air 103 g CO2 /Nm 3 120 Wh/Nm3 0.093 kg CO2/MJIndustrial Water 86 g CO2 /km3 100 Wh/m3 0.093 kg CO2/MJ
Electricity 856 kg/MWh Page 254, Section 7.8
NOTE: Year average numbers for Ontario Hydro Energy range from 850 to 890 kg/MWh depending on coal, oil and natural gas mix.
REFERENCE
C
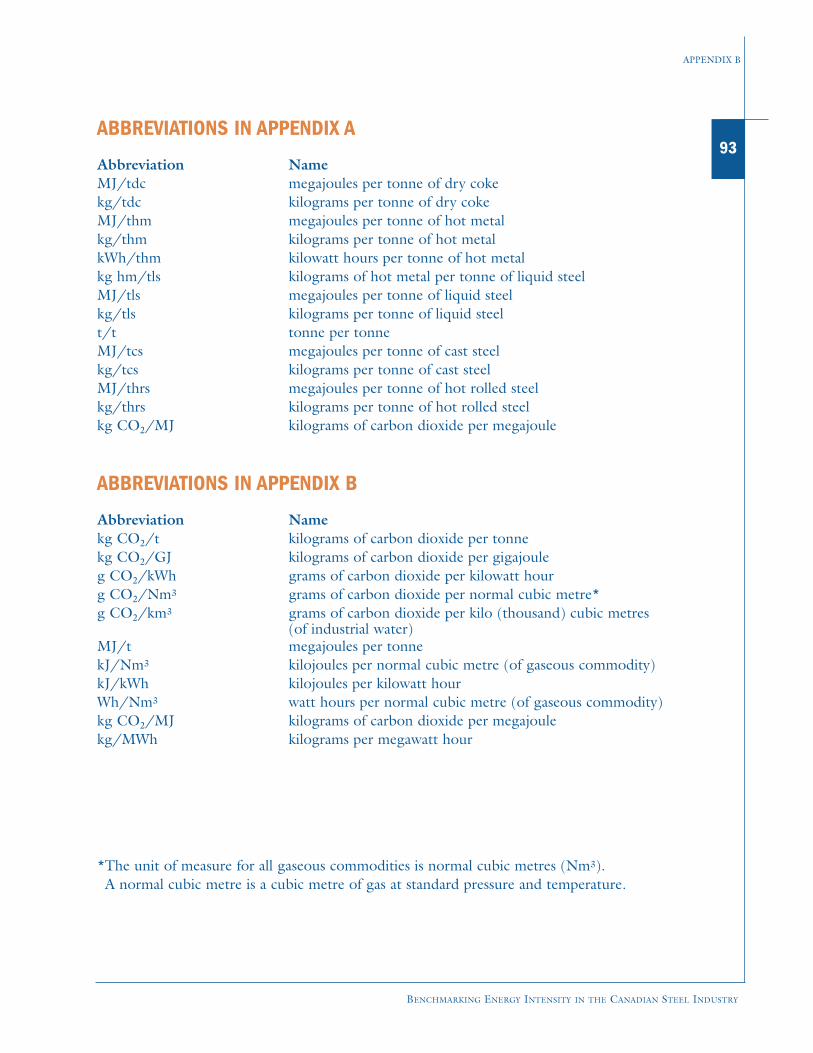
BENCHMARKING ENERGY INTENSITY IN THE CANADIAN STEEL INDUSTRY
APPENDIX B
93ABBREVIATIONS IN APPENDIX A
Abbreviation NameMJ/tdc megajoules per tonne of dry cokekg/tdc kilograms per tonne of dry cokeMJ/thm megajoules per tonne of hot metalkg/thm kilograms per tonne of hot metalkWh/thm kilowatt hours per tonne of hot metalkg hm/tls kilograms of hot metal per tonne of liquid steelMJ/tls megajoules per tonne of liquid steelkg/tls kilograms per tonne of liquid steelt/t tonne per tonneMJ/tcs megajoules per tonne of cast steelkg/tcs kilograms per tonne of cast steelMJ/thrs megajoules per tonne of hot rolled steelkg/thrs kilograms per tonne of hot rolled steelkg CO2/MJ kilograms of carbon dioxide per megajoule
ABBREVIATIONS IN APPENDIX B
Abbreviation Namekg CO2/t kilograms of carbon dioxide per tonnekg CO2/GJ kilograms of carbon dioxide per gigajouleg CO2/kWh grams of carbon dioxide per kilowatt hourg CO2/Nm3 grams of carbon dioxide per normal cubic metre*g CO2/km3 grams of carbon dioxide per kilo (thousand) cubic metres
(of industrial water)MJ/t megajoules per tonnekJ/Nm3 kilojoules per normal cubic metre (of gaseous commodity)kJ/kWh kilojoules per kilowatt hourWh/Nm3 watt hours per normal cubic metre (of gaseous commodity)kg CO2/MJ kilograms of carbon dioxide per megajoulekg/MWh kilograms per megawatt hour
*The unit of measure for all gaseous commodities is normal cubic metres (Nm3).A normal cubic metre is a cubic metre of gas at standard pressure and temperature.
Related Documents