Benchmarking Analysis of the Electricity Distribution Sector in the Latin American and Caribbean Region Final Report Date 70849 Public Disclosure Authorized Public Disclosure Authorized Public Disclosure Authorized Public Disclosure Authorized Public Disclosure Authorized Public Disclosure Authorized Public Disclosure Authorized Public Disclosure Authorized

Welcome message from author
This document is posted to help you gain knowledge. Please leave a comment to let me know what you think about it! Share it to your friends and learn new things together.
Transcript
Benchmarking Analysis of the
Electricity Distribution Sector in the
Latin American and Caribbean Region
Final Report
Date
70849
Pub
lic D
iscl
osur
e A
utho
rized
Pub
lic D
iscl
osur
e A
utho
rized
Pub
lic D
iscl
osur
e A
utho
rized
Pub
lic D
iscl
osur
e A
utho
rized
Pub
lic D
iscl
osur
e A
utho
rized
Pub
lic D
iscl
osur
e A
utho
rized
Pub
lic D
iscl
osur
e A
utho
rized
Pub
lic D
iscl
osur
e A
utho
rized
LIST OF ACRONYMS
ABRADEE Associação Brasileira de Distribuidores de Energia Eléctrica
ADEERA Asociación de Distribuidores de Energía Eléctrica de la República Argentina
AEA Alianza en Energía y Ambiente con Centroamérica
AMM Administrador del Mercado Mayorista (Guatemala)
ANEEL Agência Nacional de Energia Elétrica (Brazil)
ARESEP Autoridad Reguladora de los Servicios Públicos (Costa Rica)
ARIAE Asociación Iberoamericana de Entidades Reguladoras de Energía
ASI Asociación Salvadoreña de Industriales
CAPEX Capital Expenditures
CAVEINEL Cámara Venezolana de la Industria Eléctrica
CCEE Câmara de Comercializacão de Energia Elétrica (Brazil)
CNDC Centro Nacional de Despacho de Carga (Nicaragua)
CNDC Comisión Nacional de Despacho de Carga (Bolivia)
CNE Comisión Nacional de Energía (Chile / Honduras / Nicaragua)
CNEE Comisión Nacional de Energía Eléctrica (Guatemala)
CONELEC Consejo Nacional de Electricidad (Ecuador)
CPI Consumer Price Index
CREG Comisión de Regulación de Energía y Gas (Colombia)
CRIE Comisión Regional de Interconexión Eléctrica
ECLAC Economic Commission for Latin America and the Caribbean
EIA Energy Information Administration of the US government
ENRE Ente Nacional Regulador de la Energía Eléctrica (Argentina)
EOR Ente Operador del Mercado Eléctrico Regional (El Salvador)
ERSP Ente Regulador de Servicios Públicos (Panama)
FMIK Mean frequency of Interruption per kVA
FTE Full Time Employment
FUNDELEC Fundación para el Desarrollo del Servicio Eléctrico (Venezuela)
GWh Giga Watt Hour
IADB Inter-American Development Bank
IAEE International Association for Energy Economics
IEA Internacional Energy Agency
INE Instituto Nacional de Estadística (Bolivia)
INE Instituto Nicaragüense de Energía
INEC Instituto Nacional de Estadísticas y Censos (Nicaragua)
kVA kilo Volt Ampere
kWh kilo Watt hour
LCR Latin America and the Caribbean Region
MINAE Ministerio de Energía y Ambiente (Costa Rica)
MINEC Ministerio de Economía (El Salvador)
MW MegaWatt
MWh Mega Watt Hour
OLADE Organización Latinoamericana de Energía
OPEX Operational Expenditures
OPSIS Oficina de Operación de Sistemas Interconectados (Venezuela)
OSINERG Organismo Supervisor de Inversión en Energía (Peru)
PPI Private Participation in Infrastructure
PPP Private Public Partnership
SAIDI System Average Interruption Duration Index
SAIFI System Average Interruption Frequency Index

SEC Superintendencia de Electricidad y Combustibles (Chile)
SIE Super Intendencia de Electricidad (Bolivia)
SIGET Superintendencia General de Electricidad y Telecomunicaciones (El Salvador)
SIRESE Sistema de Regulación Sectorial (Bolivia)
SUI Sistema Único de Información de Servicios Públicos (Colombia)
TOTEX Total Expenditures
TTIK Total interruption time per kVA
URSEA Unidad Reguladora de los Servicios de Agua y Energía (Uruguay)
NOTE: For the acronyms of the firms, please refer to Annex 3.

ACKNOWLEDGEMENTS
This Benchmarking report was prepared by a core team consisting of Luis Alberto Andres (Co-
Task Team Leader), Jose Luis Guasch (Co-Task Team Leader), Julio A. Gonzalez, and Georgeta Dragoiu
(Consultants).
The team benefited from contributions by Jordan Z. Schwartz (Lead Economist, LCSSD) who
provided data for six Caribbean countries, Lucio Monari (Sector Manager, ETWEN) who shared data for
Honduras and the Dominican Republic, Martin Rossi (Consultant) who contributed supplementary data
for seventeen countries in the region, and Katharina B. Gassner (Senior Economist, FEU) who shared
complementary data for several utilities in eight countries in the region. The following in-field consultants
also contributed to the data collection process: Marina Figueira de Mello in Brazil, Fernando Muñoz
Davila in Ecuador Ecoanálisis (Julio Rosales and Luis Rivera) in Costa Rica, Alejandro Vivas in
Colombia, Jose Luis Lima and Karen Delgado in Chile, and Guillermo Lopez Flores in Paraguay. Peer
reviewers include Douglas Andrew (Consultant), Kyran O'Sullivan (Senior Energy Specialist, ETWEN),
and Prasad V.S.N. Tallapragada (Senior Energy Specialist, AFTEG).
Makhtar Diop (Director, Strategy and Operations, LCRVP), Laura Tuck (Sector Director,
LCSSD), Philippe Benoit (Sector Manager, LCSEG), and Susan Goldmark (Country Director, Nepal)
provided support and guidance for this Benchmarking Initiative.
Funding for this Benchmarking project was provided by the Energy Sector Management
Assistance Program (ESMAP) and the World Bank.
DISCLAIMER
This report is a product of the International Bank for Reconstruction and Development/the World Bank.
The findings, interpretations, and conclusions expressed in this paper do not necessarily reflect the views
of the Executive Directors of the World Bank, the Energy Sector Management Assistance Program
(ESMAP) or the governments and donors they represent.
Although significant efforts have been made to ensure data comparability and consistency across time and
utilities, the World Bank and the ESMAP do not guarantee the accuracy of the data included in this work.

TABLE OF CONTENTS
EXECUTIVE SUMMARY ........................................................................................................................... I
INTRODUCTION ........................................................................................................................................ 1
1. A REGIONAL ASSESSMENT FOR ELECTRICITY DISTRIBUTION ..................................... 4
1.1 MAIN FINDINGS............................................................................................................................ 4 1.2 COVERAGE AND PRIVATE SECTOR PARTICIPATION ...................................................................... 4 1.3 OUTPUT ........................................................................................................................................ 5 1.4 LABOR PRODUCTIVITY ................................................................................................................. 6 1.5 INPUT INDICATORS ....................................................................................................................... 6 1.6 PRICES: AVERAGE RESIDENTIAL AND INDUSTRIAL TARIFFS ........................................................ 8 1.7 OPERATING PERFORMANCE ......................................................................................................... 9 1.8 QUALITY OF SERVICE ................................................................................................................... 9 1.9 CONCLUSIONS .............................................................................................................................10
2. A COUNTRY-LEVEL ASSESSMENT OF ELECTRICITY DISTRIBUTION ..........................11
2.1 MAIN FINDINGS...........................................................................................................................11 2.2 COVERAGE AND OUTPUT ............................................................................................................11 2.3 LABOR PRODUCTIVITY ................................................................................................................13 2.4 INPUT INDICATORS ......................................................................................................................15 2.5 PRICES: AVERAGE RESIDENTIAL AND INDUSTRIAL TARIFFS .......................................................17 2.6 OPERATING PERFORMANCE ........................................................................................................18 2.7 QUALITY OF SERVICE ..................................................................................................................19 2.8 CONCLUSIONS .............................................................................................................................21
3. A UTILITY-LEVEL ASSESSMENT OF ELECTRICITY DISTRIBUTION .............................22
3.1 MAIN FINDINGS...........................................................................................................................22 3.2 COVERAGE AND OUTPUT ............................................................................................................22 3.3 LABOR PRODUCTIVITY ................................................................................................................24 3.4 INPUT INDICATORS ......................................................................................................................26 3.5 PRICE: AVERAGE RESIDENTIAL AND INDUSTRIAL TARIFFS .........................................................33 3.6 OPERATING PERFORMANCE ........................................................................................................34 3.7 QUALITY OF SERVICE ..................................................................................................................35 3.8 CONCLUSION ...............................................................................................................................37
4. AN ASSESSMENT OF THE DISTRIBUTION OF PRIVATE AND PUBLIC UTILITIES .....39
4.1 MAIN FINDINGS ............................................................................................................................40 4.2 COVERAGE AND OUTPUT .............................................................................................................41 4.3 LABOR PRODUCTIVITY ................................................................................................................42 4.4 INPUT INDICATORS ......................................................................................................................43 4.5 PRICES: RESIDENTIAL AND INDUSTRIAL TARIFFS ........................................................................44 4.6 OPERATING PERFORMANCE ........................................................................................................45 4.7 QUALITY OF SERVICE ..................................................................................................................46 4.8 TOP TEN AND BOTTOM TEN PERCENT PERFORMERS .....................................................................47 4.9 CONCLUSIONS .............................................................................................................................50
CONCLUSIONS ..........................................................................................................................................51
REFERENCES ............................................................................................................................................55
ANNEX 1 - METHODOLOGY ..................................................................................................................56
ANNEX 2 - SOURCES OF INFORMATION BY COUNTRY ...............................................................62
ANNEX 3 - LIST OF UTILITIES COVERED IN THIS REPORT .......................................................67

ANNEX 4 – CAPITAL AND TOTAL EXPENDITURES PER CONNECTION ..................................73
ANNEX 5 –TOP TEN AND BOTTOM TEN PERCENT PUBLIC AND PRIVATE DISTRIBUTION
UTILITIES...................................................................................................................................................76

- i -
EXECUTIVE SUMMARY
Investments in infrastructure have been on the development agenda of Latin American and
Caribbean (LCR) countries as they move towards economic and social progress. Investing in
infrastructure is investing in human welfare by providing access to quality basic infrastructure services.
Improving the performance of the electricity sector is an important part of this major infrastructure action
and the focus of the benchmarking study. A key initiative for both public and private owned distribution
utilities has been to upgrade their efficiency as well as to increase the coverage and quality of service. The
report contributes to this initiative by serving as a clearing house for information regarding the regional,
country, and utility level performance of the electricity distribution sector. It allows countries and utilities
to benchmark their performance in relation to other comparator utilities and countries, filling in
knowledge gaps for the identification of the best performers of the region. In doing so, this benchmarking
study promotes the improvement of the electricity sector performance.
In order to conduct a benchmarking analysis, the study collected detailed information of 26
countries and 250 utilities in the region. An analytical framework was designed to produce a
comprehensive description of the sector as well as a mechanism for ranking countries and utilities
for best performance. The data collected for this benchmarking project is representative of 88 percent of
the electrification in the region from 1995 until 2005. By serving as a mirror of good performance, the
report allows for a comparative analysis and the ranking of utilities and countries according to the
indicators used to measure performance. Through in-house and field data collection, consultants compiled
data to tell various stories about the distribution sector based on accomplishments in output, coverage,
input, labor productivity, operating performance, the quality of service and prices. Based on the results of
these performance indicators, the report benchmarks the performance of electricity distribution at the
regional, country, and utility-level.
The following four chapters describe the analysis developed to capture the different aspects
of the performance of electricity distribution, providing countries and utilities with the knowledge
necessary to develop and improve their services:
The first chapter provides an assessment of distribution performance at the regional level. The
story being told here is one based on the weighted averages of the distribution utilities in order to capture
the regional status of the electricity sector. The main finding of this report is the overall improvement
across the region during the last decade with significant changes in the following areas: a ten percentage
point increase in coverage reaching 94.6 percent in 2005, a rise in private sector participation from 11
percent of electricity connections in 1995 to 60 percent in 2005, labor productivity that more than doubled
and an improvement in the quality of service by more than 40 percent. While there were no clear trends in
operational expenditures, overall OPEX grew between 40.8 and 44 percent during the last decade.
Concurrently, residential and industrial tariffs (in real terms) have increased by 70 – 90 percent since
1995. In contrast, there appeared to be no significant changes in distributional losses.
The second chapter focuses on the performance at country level. The analysis is based on the
weighted averages of the utilities within each country. It provides a cross-country comparison that
identifies and ranks the best performer according to the indicators measured. The countries are ranked
according to their aggregated level of output, coverage, labor productivity, input, operating performance,
service quality, and prices. According to the analyses, most countries demonstrate a significant overall
improvement in the coverage and labor efficiency of electricity services during the last 10 years. Chile is
amongst the strongest regional leader with 97 percent electricity coverage, labor productivity that is triple
that of the regional average, and the lowest distributional loss. In regards to the average residential tariff,

- ii -
Argentina and Peru serve their customers at the lowest rate of $38 and $43 per MWh per year respectively
while Paraguay provides industrial consumers the lowest regional tariff of $34. When assessing the quality
of service by measuring the frequency and duration of interruptions, Mexico takes the lead with a low of
2.19 interruptions per consumer while Ecuador sets the standard for the lowest duration time averaging 2
hour durations. Another regional forerunner is Peru with one of the most notable improvement trends in
labor productivity and distributional losses. Finally, Honduras is noted for the lowest operational
expenditures followed closely by Paraguay.
In addition, the chapter reports improvements of the underperforming countries as evidenced by
the time trends. In summary, for the time period of 1995-2005, the lower performing countries have
doubled their electricity coverage and labor productivity, curtailed the frequency of interruptions per
connection by 73 percent and the duration of interruptions by 55.9 percent, decreased their total
expenditures per connection by 56.2 percent and finally diminished the duration of interruptions by 17.2
percent. As indicated, there has been significant progress made by the majority of the utilities throughout
the last decade.
In third chapter, the utility is the object of analysis. The performance of electricity distribution
is assed by evaluating the simple averages for different sub-groups of the 250 utilities included in this
study. The method used to benchmark the performance of all the utilities was to rank them according to
the top ten percent, middle 80 percent, and bottom ten percent of distribution performance. The best
performing utilities are listed in the top or bottom ten percent depending on the indicator being measured.
Amongst the characteristics of the top performing utilities are utilities with 100 percent electrification, an
average of 897.1 residential connections or 6,402 MWh of energy sold per employee, 6.5 percent
distributional losses, and residential prices in the range of $591 per MWh consumed. The story of the last
decade is one of universal electrification and significant improvements of the utilities and is better
represented by the middle 80 percent. Electrification increased by almost 15 percentage points for the
middle 80 percent resulting in 88 percent coverage while the bottom ten percent increased by 20
percentages points resulting in 60 percent coverage by 2005. The chapter offers three main messages:
First, there are significant discrepancies amongst utility performance. Second, there has been an overall
improvement of the underperforming utilities during the last ten years. Third, there are cases with
significant deterioration in distribution performance as reflected by indicators such as the average tariffs
and distributional losses.
Considering the major impact of private participation on electricity development, we have
dedicated this fourth chapter to providing a comparative analysis of private and public distribution
utilities. While the previous chapters of this report indicate major improvements in coverage and quality at
the regional, country, and utility-levels, this chapter provides insight on utility performance based on the
means of ownership. The utilities presented in this chapter fall into the following three categories: public
utilities throughout the period of 1995-2005, utilities that privatized before 1995 and remained private
throughout 2005, and utilities that privatized after 1995 and remained private throughout 2005. In order to
most accurately assess and compare the performance of public and private distribution utilities, we
considered the initial conditions in 1995 as well as the overall trend of the last ten years. Finally, we
present the variance of change and improvement of the studied indicators. For this comparison, we report
the average top ten, bottom ten, and middle eighty percent public and private utilities.
The results indicate that on average, private utilities performed better than public utilities with
clear differences after the change in ownership. While there have been modest improvements by public
utilities, on average, private utilities surpassed the performance (improvement) of public utilities as is
evident by indicators measuring labor productivity, distribution losses, quality of service and tariffs. A key
message is that despite the fact that private and public utilities experienced similar initial conditions in
1995, by the end of the decade, the two groups diverged in performance. For instance, when measuring

- iii -
distributional losses, private and public utilities were separated by a 2 percentage point gap in 1995, yet by
the end of 2005, there was a 4 percentage point difference between the two utility types. With respect to
labor productivity, in 1995, public utilities resulted with 10.7 percent less residential connections per
employee than that of post 1995 privatized utilities, yet by the end of 2005, the labor productivity of post-
1995 privatized utilities almost tripled its initial amount, and doubled the amount of the labor productivity
of public utilities, which totaled 326 connections per employee in 2005, a 4.5 percent increase over the
last decade.
Another interesting result is that for the indicators measuring output, labor productivity and
operating performance, the top 10 percent public utilities outperformed the average private utilities and the
bottom 10 percent private utilities performed poorer than the average public utilities. Inequality in
performance seems higher among private utilities.
Complementary to this report, this benchmarking initiative launched a web site in order to
provide access to the data1 collected and represented here. The website includes features that allow the
users to benchmark electricity distribution performance at the utility and country level by choosing which
countries or utilities they wish to compare. In addition, the interface presents the data in tables, graphs,
and maps available for download.
1 Accessible through the LAC-Energy site ( http://www.worldbank.org/lacenergy ) or using the following link:
http://info.worldbank.org/etools/lacelectricity/home.htm

- 1 -
INTRODUCTION
BACKGROUND
Since the late 1980s, a wave of reform has transformed the institutional framework,
organization, and operational environment of the infrastructure industries, particularly those in the
electricity sectors in most developed and developing countries. In addition, other countries are either
implementing or evaluating some form of power sector reform. Although the structure of the power
sectors and the approaches to reform vary across countries, their main objectives are to improve the
efficiency of the sector as well as to increase the coverage and quality of service. Separation of roles,
unbundling, competition and private participation were used as key instruments to increase efficiency,
improve the government’s fiscal position and increase access to electricity service for the poor. In many
countries in the region the combination of private participation, competition and better regulation was
effective in improving productive efficiency and quality of service.
The last decade has witnessed significant progress in the power sector of Latin America and
the Caribbean. While there are differences between countries, overall supply has increased substantially
and with it access to electricity. The best electricity distribution performer is Uruguay with 97.5 percent
coverage followed by Costa Rica, Brazil, Argentina, Chile, and Mexico with more than 95 percent
coverage. However, equally important is to consider the overall improvement in coverage as reflected in
the growth rate of countries such as Peru, Paraguay, Honduras, and El Salvador demonstrating an average
growth of 19.7 percentage points in the last 10 years.
Despite the fact that electricity coverage in LCR increased from 84.7 to 94.6 percent in 2005,
evidence suggests that the poor and rural areas were not the main beneficiaries of the improvements
in productive efficiency and coverage.2 According to the LCR Energy Strategy (2007), in many
countries, industrial consumers and high income residential consumers were the main beneficiaries of
competition and rebalancing of tariffs, which reduced substantial cross-subsidies of the pre-reform period.
However, it is also true that privatization and cost-covering tariffs ensured the financial feasibility of
efficient electricity providers, which were able to expand access and improve the quality of service to a
large number of consumers in urban and peri-urban areas, including poor people.
WHY BENCHMARKING MATTERS
Benchmarking the electricity distribution segment in the Latin American and Caribbean
Region (LCR) is a means of providing countries and utilities with a point of reference regarding
their performance. Considering the changes that have shaped the power sector during the last decade,
this benchmarking report provides country and utility level direction and a framework of comparison for
identifying where they stand in relation to the others, detecting their strengths and weaknesses, and setting
goals for improvement.
The purpose of benchmarking the power sector is to provide a detailed description of the
2 The coverage figures presented in this report reflect that of the 250 utilities measured in our sample set.

- 2 -
electricity distribution segment in the Latin American and Caribbean Region and to identify and
rank the best performers in the region. A number of empirical studies have used benchmarking
methods within the electricity supply industry. These studies have traditionally focused on generation or
on vertically integrated utilities; however, probably due to regulators’ demand, the interest on
benchmarking the natural monopoly segments (i.e., transmission and distribution) has recently increased.
Surveys of the benchmarking literature (Jamasb and Pollitt [2001], Mota [2004])3 have concluded that,
due to issues of data standardization and currency conversion, international benchmarking has not been
widely used. When international efficiency comparisons have been used, they have traditionally focused
on developed countries.
This report is designed to be solely factual, aimed at describing electricity distribution
performance at the regional, country, and utility levels and does not assume, at this stage, an
analytical or explanatory role. Additionally, this study will contribute towards a more consistent
benchmarking analysis in the electricity distribution segment and serves as a path-breaker for other
regional benchmarking initiatives.
This benchmarking initiative contributes primarily with the collection and analysis of
detailed data for 26 countries and 250 utilities that represent 88 percent of the electricity
connections in the Latin American and Caribbean region4. An analytical framework was designed to
produce a comprehensive description of the sector as well as a mechanism for ranking countries and
utilities for best performance. By serving as a mirror of good performance, the report allows for a
comparative analysis and the ranking of utilities and countries according to the indicators used to measure
performance. Through in-house and field data collection, we compiled data on the electricity distribution
sector based on accomplishments in output, coverage, labor productivity, input, operating performance,
service quality and prices. Based on the results of these performance indicators, the report benchmarks the
performance of electricity distribution at the regional, country, and utility-level.
WHERE WE ARE
This report is organized to tell multiple stories of the substantial improvement in the
electricity distribution sector by documenting the changes and progress made during the last
decade. The objective of this report is to fill in the knowledge gaps that exist regarding the status of
electricity distribution by benchmarking utility performance at the regional, country, and utility level. This
report serves as a standard reference for and defines good and poor electricity distribution performance in
Latin America and the Caribbean.
The following four chapters benchmark and serve as a guide to the sector evolution of 250
utilities in 26 LCR countries according to indicators of output, coverage, labor productivity, input,
operating performance, service quality, and prices.
The first chapter provides a description of the performance of electricity distribution utilities at
the regional level based on the weighted average of the utilities in the region, highlighting time trends and
the overall electricity distribution status. The second chapter presents and ranks the best performing
3 Jamasb and Pollitt (2001) is a survey of the electricity supply industry (all segments), whereas Mota (2004)
concentrates on the electricity distribution segment. 4 Accessible through the LAC-Energy site ( http://www.worldbank.org/lacenergy ) or using the following link:
http://info.worldbank.org/etools/lacelectricity/home.htm

- 3 -
countries of electricity distribution using the simple average across countries as well as the weighted
averages within countries for each indicator which allows for comparability across variables. In addition,
the use of weighted averages delineates the leader country in the region as well as the dispersion of levels
across time. Through a comparative analysis, the chapter establishes the top countries in electricity
distribution with sensitivity to size and location. The third chapter benchmarks electricity distribution
performance by ranking utilities according to the top ten percent, bottom ten percent, and the simple
average of the rest of the 80 percent performers. Best performing utilities are listed in the top or bottom
ten percent depending on the variable at hand. While the best performer for electricity coverage is listed in
the top ten percent, the best performer for distribution losses would form part of the bottom ten percent.
Finally, the last chapter depicts the progress made by both public and private utilities and provides a
comparative analysis of public utilities throughout the period of 1995-2005, utilities that privatized before
1995 and remained private throughout 2005, and utilities that privatized after 1995 and remained private
throughout 2005. In order to most accurately assess and compare the performance of public and private
distribution utilities, we considered the initial conditions in 1995 as well as the overall trend of the last ten
years. Finally, we present the variance of change and improvement of the studied indicators. For this
comparison, we report the average top ten, bottom ten, and middle eighty percent public and private
utilities.
- 4 -
1. A REGIONAL ASSESSMENT FOR ELECTRICITY DISTRIBUTION
The objective of this chapter is to provide a description of the performance of electricity
distribution utilities at the regional level, detailing the sector evolution according to indicators of output,
coverage, labor productivity, input, operating performance, service quality, and prices. The following
results are based on the weighted average of the utilities in the region and reflect the performance of the 26
countries and 250 utilities used in the benchmarking study for the period of 1995-2005, highlighting time
trends and the overall electricity distribution status. This chapter synthesizes the results from the
methodology used in the benchmarking study to relate the story of electricity distribution in the region in
light of the reforms and other sector changes.
1.1 MAIN FINDINGS
This chapter benchmarks electricity distribution in Latin America and the Caribbean region and
depicts the progress made in the last ten years. The main finding of this chapter is one of overall
improvement across the region during the last decade with significant changes in the following areas: a ten
percentage point increase in coverage reaching 94.6 percent in 2005, a rise in private sector participation
from 11 percent of electricity connections in 1995 to 60 percent in 2005, labor productivity that more than
doubled and an improvement in the quality of service by more than 40 percent. While there were no clear
trends in operational expenditures, overall OPEX grew between 40.8 and 44 percent during the last
decade. Similarly, residential and industrial tariffs (in real terms) doubled since 1995. In contrast, there
appeared to be no significant changes in distributional losses.
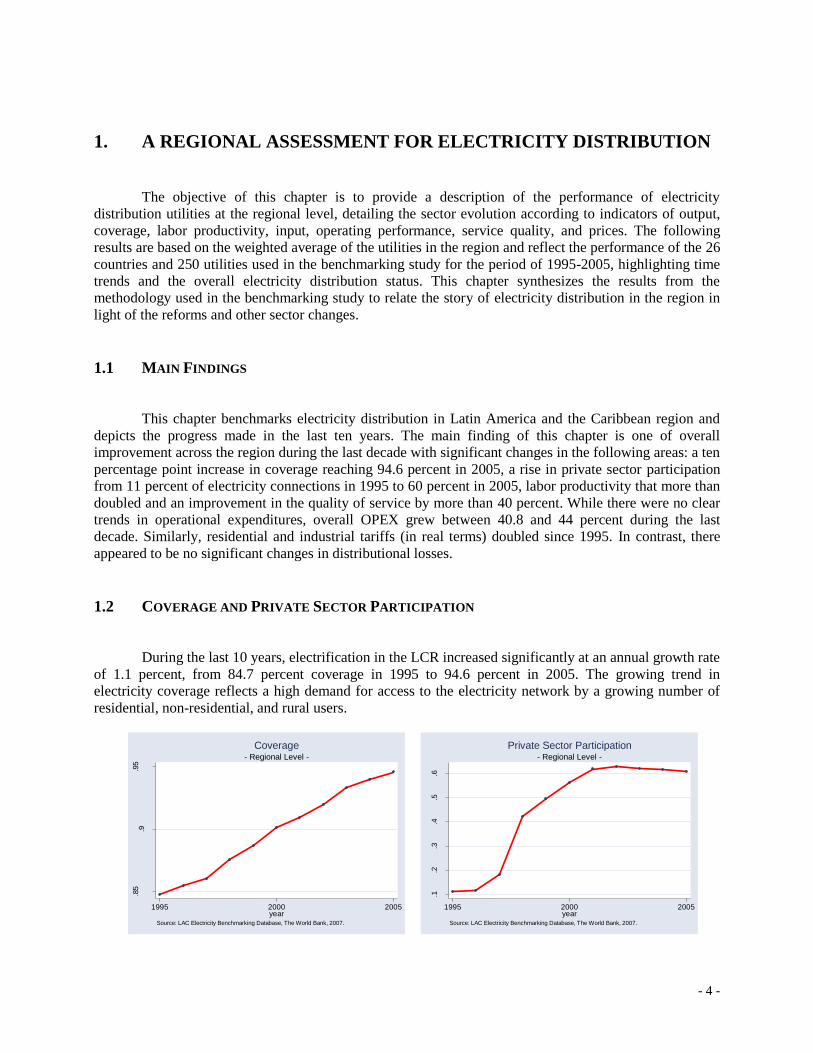
1.2 COVERAGE AND PRIVATE SECTOR PARTICIPATION
During the last 10 years, electrification in the LCR increased significantly at an annual growth rate
of 1.1 percent, from 84.7 percent coverage in 1995 to 94.6 percent in 2005. The growing trend in
electricity coverage reflects a high demand for access to the electricity network by a growing number of
residential, non-residential, and rural users.
.85
.9.9
5
Perc
enta
ge
1995 2000 2005year
Source: LAC Electricity Benchmarking Database, The World Bank, 2007.
- Regional Level -
Coverage
.1.2
.3.4
.5.6
Share
of to
tal co
nnect
ions
1995 2000 2005year
Source: LAC Electricity Benchmarking Database, The World Bank, 2007.
- Regional Level -
Private Sector Participation
- 5 -
As demand for electricity increased, so has private participation in electricity distribution
throughout Latin America and the Caribbean Region. Private participation has grown substantially since
1990, and especially between 1995-1998. While in 1990 there was little significant participation of the
private sector in electricity distribution, by 1995, 11.1 percent of electricity connections in the region were
served by the private sector. By the end of our period of analysis, 60 percent of electrical connections were
supplied by private utilities. Based on the data from the Private Participation in Infrastructure (PPI) Project
Database, during the last 15 years, US$ 102.6 billion was invested in 384 private electricity projects in
LCR. Most Latin American countries have introduced private participation in electricity as part of broader
reforms attempting to establish a more competitive market structure. However, in the last four years
private participation has remained mostly stagnant with low levels of investments. It is worth considering
this phenomenon when analyzing the regional performance of the electricity distribution in the following
sections.
Despite the fact that electricity coverage in LCR increased from 84.7 to 94.6 percent in 2005 there
are still many people, almost all poor and in rural areas, without electricity.5 There is still a strong need to
expand electrification in rural areas in LCR countries since these areas lag behind. For example, large
increases in electricity coverage in Argentina are related to the normalization of illegal connections in
urban slums rather than the expansion of electricity service to rural areas. Private investors were effective
in connecting consumers in urban and rural areas near the power grid but are reluctant to extend access to
rural areas where electricity service is not financially viable. In Bolivia and Nicaragua, countries that
privatized distribution, only 30% of rural population has access to electricity. Further increases of
coverage in rural areas usually require substantial investment subsidies and strong government support.
The government of Chile, a leader in reform and privatization, provided investment subsidies of about
US$1500/household to increase electricity coverage in rural areas from 62% to 92% in 1995-2005.6
Rural electrification is not only directly linked with poverty reduction and economic development,
but forms a necessary response to strong social pressures in client countries. Access to electricity is an
essential element in improving quality of life, access to basic services such as good education, health care,
and opportunities for economic development. In surveys of rural and marginalized urban communities,
electrification is consistently indicated to be among the top five infrastructure priorities, usually
immediately following roads and water supply. While this report does not focus on rural electrification, it
attests to the need for increased support of developing rural energy programs.
1.3 OUTPUT
The energy sold per connection per year exhibits an increasing trend until 2000 with a total
increase of 0.29 MWh sold per connection, after which there is a sudden drop in sales that continues to
decrease until the end of 2005, with a total reduction in MWh sold per connection of 2.9 percent. During
the last 10 years, the average energy sold per connection is 5.5 MWh. Albeit a 45 percent increase in the
number of connections from 1995-2005, the total amount of energy sold per connection has declined.
When considering the evolution of energy sold, the fluctuating values of the energy sold per connection
may be attributed to the increase in residential and industrial tariffs and thus a decrease in demand.
5 The coverage figures presented in this report reflect that of the 250 utilities measured in our sample set.
6 ESMAP Study Latin American and the Caribbean Region (LCR) Energy Strategy, 2007.

- 6 -
5.3
5.4
5.5
5.6
5.7
5.8
MW
h/y
r
1995 2000 2005year
Source: LAC Electricity Benchmarking Database, The World Bank, 2007.
- Regional Level -
Energy Sold per Connection per year
1.4 LABOR PRODUCTIVITY
Amongst the measures used for estimating labor productivity is the number of residential
connections per employee. During the 1995-2005 timeframe, this value has doubled from 384 residential
connections in 1995 to 701 in 2005. The natural growth trend in population (approximately 1.1 percent per
year) accounts for the suggestive "natural" growth in the number of connections contributing at most for
one fifth of the improvement in labor productivity. A second contributing factor is the substantial
improvement in electricity coverage. The final concurrent factor that drives this change is the reduction of
the labor force in the sector. Based on this analysis, there was a 23.2 cumulative percent reduction in the
number of employees for the period analyzed.
In the same vein, an analysis of the regional labor productivity tells a story of results that doubled
throughout the decade. Labor productivity, measured as the energy sold per employee increased gradually
from 2,194 MWh sold per employee in 1995 with a peak of 4,060 MWh in 2005, totaling a 85.1 percent
growth for the last decade.
400
500
600
700
1995 2000 2005year
Source: LAC Electricity Benchmarking Database, The World Bank, 2007.
- Regional Level -
Residential Connections per Employee
2000
2500
3000
3500
4000
1995 2000 2005year
Source: LAC Electricity Benchmarking Database, The World Bank, 2007.
- Regional Level -
Energy Sold per Employee
1.5 INPUT INDICATORS
With respect to input indicators, the region has witnessed fluctuating values of expenditures with
more prominent changes towards the end of the decade. Operation expenditures per connection have

- 7 -
increased 40.8 percent throughout the decade. Despite the irregular activity between 1995-2005 with
unexpected changes in expenditures between 2000 and 2003, the regional average for OPEX was $128
with an average 3.5 percent increase per year. Similarly, results for the capital expenditures per connection
were also characterized by sharp increases and decreases between 1999 and 2005. Throughout the decade,
capital expenditures have increased by 20.3 percent with an average change of 1.9 percent per year.
CAPEX per connection peaked in 1998, with a weighted average of $37.3 per connection, and reached its
nadir in 2003, with just $23 spent per connection. It is believed that the drop in 1999 is due to the January
1999 Brazilian financial crisis, because this drop does not appear when CAPEX is measured in local
nominal currency.
The results for TOTEX per connection express the overall direction of operational and capital
expenditures for LCR in the last decade. Defined as the total operation and capital expenditures, TOTEX
exhibits a steady increase with the exception of a drop between 1998-1999 and 2001-2003. By the end of
2005 total expenditures reached $173.7 per connection, from $ 99, a two-fold increase since 1995.
110
120
130
140
150
160
Dolla
rs
1995 2000 2005year
Source: LAC Electricity Benchmarking Database, The World Bank, 2007.
- Regional Level -
OPEX per Connection (in dollars)
20
25
30
35
40
Dolla
rs
1995 2000 2005year
Source: LAC Electricity Benchmarking Database, The World Bank, 2007.
- Regional Level -
CAPEX per Connection (in dollars)
100
120
140
160
180
Dolla
rs
1995 2000 2005year
Source: LAC Electricity Benchmarking Database, The World Bank, 2007.
- Regional Level -
TOTEX per Connection (in dollars)
The results for OPEX and CAPEX per MWh energy sold show a similar tendency to that of
OPEX and CAPEX per connection. OPEX per energy sold demonstrates a 44 percent increase throughout
the last 10 years with an annual growth rate of 3.7 percent. With respect to the regional average of $26.6
per connection, OPEX reached $33.28 per connection by 2005. On the same note, CAPEX, which on
average is a fourth of OPEX reached $7.39 per connection by 2005. With a regional average of $6.69 per
connection, CAPEX experienced an average growth rate of 2.1 percent per year.

- 8 -
24
26
28
30
32
34
Dolla
rs
1995 2000 2005year
Source: LAC Electricity Benchmarking Database, The World Bank, 2007.
- Regional Level -
OPEX per Energy Sold (in dollars)
5.5
66.5
77.5
8
Dolla
rs
1995 2000 2005year
Source: LAC Electricity Benchmarking Database, The World Bank, 2007.
- Regional Level -
CAPEX per Energy Sold (in dollars)
20
25
30
35
40
Dolla
rs
1995 2000 2005year
Source: LAC Electricity Benchmarking Database, The World Bank, 2007.
- Regional Level -
TOTEX per Energy Sold (in dollars)
The decrease in the number of employees through the past ten years is inversely related to the rise
in private participation. The 23.2 percent reduction in employees is visible in the trend between 1995 and
2000, when privatization reached its peak. For the last five years the database suggests that no significant
changes in the regional level of the labor force have occurred, consistent with decreased private
participation levels.
45000
50000
55000
60000
65000
1995 2000 2005year
Source: LAC Electricity Benchmarking Database, The World Bank, 2007.
- Regional Level -
Number of Employees
1.6 PRICES: AVERAGE RESIDENTIAL AND INDUSTRIAL TARIFFS
Average end-user tariffs for electricity (dollars/MWh) supplied to residential connections show an

- 9 -
overall increase with the exception of 1999, with a 12 percent decrease, mainly caused by the crisis in
Brazil. By the end of 2005, the average residential tariff was $104 per MWh, a 70.3 percent accumulative
increase over 1995’s $61.33 average residential tariff. Following the same pattern, the average industrial
tariff increased by 90.8 percent since 1995. While the weighted average in 1995 was $44.28, in 2005 the
weighed industrial tariff reached $84.48. The figure shows a steady increasing trend with the exception of
the period between 1997 and 1999 where there was a slight decrease in prices.
60
70
80
90
100
110
Dolla
rs
1995 2000 2005year
Source: LAC Electricity Benchmarking Database, The World Bank, 2007.
- Regional Level -
Average Residential Tariffs (dollars/MWh)
40
50
60
70
80
90
Dolla
rs
1995 2000 2005year
Source: LAC Electricity Benchmarking Database, The World Bank, 2007.
- Regional Level -
Average Industrial Tariffs (dollars/MWh)
1.7 OPERATING PERFORMANCE
When assessing regional distribution losses, there is no apparent trend but rather sporadic
increases and decreases throughout the 10 year period. The lowest distributional loss was observed in
2001, with a 0.9 percentage point decrease over 1995’s 14.5 percent distributional loss. Since 2001, the
region has experienced a one percentage point increase, resulting in a 14.7 percent distributional loss in
2005.
.13
.135
.14
.145
.15
1995 2000 2005year
Source: LAC Electricity Benchmarking Database, The World Bank, 2007.
- Regional Level -
Distributional Losses
1.8 QUALITY OF SERVICE
A look at the quality of electricity distribution in Latin America and the Caribbean Region allows
one to qualify the region as improving in the delivery of its services. In the last ten years, the frequency of
interruptions in the region has decreased by almost half, with a 42.4 percent drop in the frequency of the
interruptions and 40.2 percent decrease in the duration of the interruptions per connection per year.

- 10 -
12
14
16
18
20
Num
ber
1995 2000 2005year
Source: LAC Electricity Benchmarking Database, The World Bank, 2007.
- Regional Level -
Frequency of Interruptions per Connection
12
14
16
18
20
Hours
1995 2000 2005year
Source: LAC Electricity Benchmarking Database, The World Bank, 2007.
- Regional Level -
Duration of Interruptions per Connection
When measuring the quality of service, there has been a steady decline in the number of
interruptions per connection. While the average number of interruptions per connection was 20.5 times in
1995, this dropped to 11.8 times in 2005, a reduction of 5.4 percent per year, totaling a 42.4 percent
reduction in ten years. A second indicator used to measure quality of the service is the average number of
hours the customer did not have service. The last decade presents a generally downward trend with a 40.2
percent decrease in the duration time per connection. The indicator presents a remarkable increase in 2002
in the duration of interruptions. As explained in the next chapter, Brazil and Paraguay are the main
contributors for the 1996 increase while the peak in 2002 is explained by the hurricanes that affected the
quality of service in Mexico. These two indicators successfully encapsulate two root causes of
interruptions: the reduction in the number of outages per connection shows managerial improvement,
while the duration of the interruption serves as a proxy for natural events or disasters that affect service.
1.9 CONCLUSIONS
Electricity distribution is at the forefront of infrastructure improvement in LCR with 95 percent
coverage and a ten percentage point increase by 2005. Since 1995, most countries in the region have made
considerable progress in expanding access to electricity and improving the quality of their service. In the
period covered in this report, private sector participation increased from 11 percent to 60 percent of
electricity connections and labor productivity doubled since 1995. In addition, the results of this chapter
exhibit improvements in the frequency and duration of interruptions per connection showing a 42.2 and
40.2 percent reduction accordingly. While there are no clear trends in operational expenditures, these
values have grown between 40.8 and 44 percent in the last decade. Furthermore, there are no considerable
changes in distributional losses and tariffs have grown steadily with a cumulative increase of 70.3 and
90.8 percent for residential and industrial users, respectively.
The following chapter continues to present the evolution of electricity distribution at the country-
level and provides a comparative analysis amongst countries.

- 11 -
2. A COUNTRY-LEVEL ASSESSMENT OF ELECTRICITY
DISTRIBUTION
The objective of this chapter is to present the best performing countries of electricity distribution
in Latin America and the Caribbean region. For this, we present the simple average across countries as
well as the weighted averages within countries for each indicator which allows for comparability across
variables. In addition, the use of weighted averages delineates the leader country in the region as well as
the dispersion of levels across time. The countries are ranked according to a set of indicators that show
output, coverage, labor productivity, input, operating performance, service quality, and prices. Through a
comparative analysis, the chapter establishes the top countries in electricity distribution with sensitivity to
size and location. The 26 countries are classified according to the following four categories: countries with
a population above 25 million, countries with a population below 25 million in South America, the
countries of Central America, and the countries of the Caribbean. The countries with a high population,
labeled Group 1, consist of Argentina, Brazil, Colombia, Mexico, Peru, and Venezuela. The countries with
a lower population, marked Group 2, consist of Bolivia, Chile, Ecuador, Paraguay, and Uruguay. The
countries of Central America are: Costa Rica, Belize, El Salvador, Guatemala, Honduras, Nicaragua,
Panama, and the Dominican Republic7. Finally, the Caribbean countries that form part of this
benchmarking study are: Antigua and Barbuda, Dominica, Grenada, Jamaica, St. Kitts and Nevis, St.
Lucia, and St. Vincent and the Grenadines.
2.1 MAIN FINDINGS
The following sections present the best electricity distribution performers in Latin America and
how they rank in comparison to their fellow neighbors. According to the analyses, most countries
demonstrate a significant overall improvement in the coverage and labor efficiency of electricity services
during the last 10 years. Chile is amongst the strongest regional leader with 97 percent electricity
coverage, labor productivity that is double the regional average, and the lowest distributional losses. In
regards to the average residential tariff, Argentina and Peru serve their customers at the lowest rate of $38
and $43 per MWh per year respectively, while Paraguay provides industrial consumers the lowest regional
tariff of $34. When assessing the quality of service by measuring the frequency and duration of
interruptions, Mexico takes the lead with a low of 2 interruptions per consumer, while Ecuador has the
lowest duration time averaging 2 hours per connection. When considering the countries exhibiting the
greatest improvement trends, Peru is the regional forerunner with notable improvement trends in labor
productivity and distributional losses. Finally, Paraguay is noted for the lowest operational expenditures
followed closely by Honduras. While these assessment figures are only glimpses of the country-level
performance of electricity distribution, the following sections are a more detailed account of the changes
since 1995.
2.2 COVERAGE AND OUTPUT
7 Note we decided to include Dominican Republic in this group given its size and comparability with the countries in
this group.

- 12 -
Electricity coverage for most of the countries in the region exhibits a steady increasing trend with
the exception of Argentina, Mexico, Chile, Uruguay, Nicaragua, and Costa Rica which have remained at a
constant level. All these countries except Nicaragua have attained at least 95 percent electricity coverage.
The simple average across the countries in the database experienced a 16 percentage point increase in
electrification and a 2 percent annual growth rate; placing it at a simple average of 80.1 percent coverage
in 2005. In light of the regional average, the best performer is Uruguay with 97.5 percent coverage
followed by Costa Rica, Brazil, Argentina, Chile, and Mexico with more than 95 percent coverage. The
overall improvement in coverage is reflected in the growth rate of countries such as Peru, Paraguay,
Honduras, and El Salvador demonstrating an average growth of 19.7 percentage points in the last 10 years.
It is important to consider that cross country differences in the evolution of connections may be a result of
initial coverage conditions and therefore the time trends are an equally important indicator of a country’s
coverage and efficiency.
.4.6
.81
1995 2000 2005year
ARG BRA COL
MEX PER VEN
Source: LAC Electricity Benchmarking Database, The World Bank, 2007.
- South America & Mexico (GRP 1) -
Electricity Coverage
.4.6
.81
1995 2000 2005year
BOL CHL ECU
PRY URY
Source: LAC Electricity Benchmarking Database, The World Bank, 2007.
- South America (GRP 2) -
Electricity Coverage
.4.6
.81
1995 2000 2005year
CRI BLZ SLV GTM
HND NIC PAN DOM
Source: LAC Electricity Benchmarking Database, The World Bank, 2007.
- Central America -
Electricity Coverage
Parallel to the increase in electricity coverage, there is a slight increment of energy sold per
connection. The greatest amount of energy sold per connection was in Venezuela with 9.95 MWh per year
double the regional average of 4.9 MWh annually. The same high level of consumption characterizes
Costa Rica with 9.6 MWh energy sold per connection in 2005, followed closely by Panama with 6.9
MWh. The rest of the region ranges between 2 and 6 MWh per year and even a 4:1 ratio as in the case of
Guatemala and Venezuela. Possible reasons for the linear trend of consumption in the majority of the
countries include: an overall decrease in the average consumption per household, increase in prices, and a
reduction in distributional losses.

- 13 -
02
46
810
1995 2000 2005year
ARG BRA COL
MEX PER VEN
Source: LAC Electricity Benchmarking Database, The World Bank, 2007.
- South America & Mexico (GRP 1) -
Energy Sold per Connection per year (MWh)
02
46
810
1995 2000 2005year
BOL CHL ECU
PRY URY
Source: LAC Electricity Benchmarking Database, The World Bank, 2007.
- South America (GRP 2) -
Energy Sold per Connection per year (MWh)
02
46
810
1995 2000 2005year
CRI BLZ SLV GTM
HND NIC PAN DOM
Source: LAC Electricity Benchmarking Database, The World Bank, 2007.
- Central America -
Energy Sold per Connection per year (MWh)
02
46
810
2000 2001 2002 2003 2004 2005year
ATG DMA GRD
KNA LCA VCT
Source: LAC Electricity Benchmarking Database, The World Bank, 2007.
- Caribe -
Energy Sold per Connection per year (MWh)
2.3 LABOR PRODUCTIVITY
Two variables are used to measure the labor productivity of distribution utilities: residential
connections per employee and the energy sold (MWh) per employee. During the last decade, the region
has experienced an impressive 46.2 percent increase in labor productivity in terms of residential
connections per employee and a 55.7 percent accumulative growth in the energy sold per employee. The
leading country in labor productivity defined as residential connections per employee is Chile with 1,349
connections per employee in 2005 followed closely by Peru with 1,118 and Colombia, El Salvador, and
Bolivia yet performing only at about half of Chile’s productivity level. Chile’s labor productivity is over
three times the regional simple average of 416 connections per employee while most South and Central
American countries operate between 250 and 1000 residential connections per employee. There is also a
significant amount of disparity between countries of the same size as in the case of South America and
Mexico where Peru proves to be up to 5 times more productive than similar countries such as Venezuela.
In addition, Chile has the highest rate of growth during the last decade with 720 additional connections,
followed closely by Peru with 637 additional connections. When assessing the labor productivity of
Central American countries, El Salvador leads with 987 connections per employee, almost double the
labor productivity of the rest of the comparable countries. When analyzing these results, it is worth noting
that the size of the utilities within each country contributes to the level of productivity. While explaining
this factor is beyond the scope of this section, the following chapter will touch upon this aspect.

- 14 -
0
250
500
750
1000
1995 2000 2005year
ARG BRA COL
MEX PER VEN
Source: LAC Electricity Benchmarking Database, The World Bank, 2007.
- South America & Mexico (GRP 1) -
Residential Connections per Employee
0
500
1000
1500
2000
1995 2000 2005year
BOL CHL ECU
PRY URY
Source: LAC Electricity Benchmarking Database, The World Bank, 2007.
- South America (GRP 2) -
Residential Connections per Employee
0
250
500
750
1000
1995 2000 2005year
CRI BLZ SLV GTM
HND NIC PAN DOM
Source: LAC Electricity Benchmarking Database, The World Bank, 2007.
- Central America -
Residential Connections per Employee
0
250
500
750
1000
2000 2001 2002 2003 2004 2005year
ATG DMA GRD
KNA LCA VCT
Source: LAC Electricity Benchmarking Database, The World Bank, 2007.
- Caribe -
Residential Connections per Employee
In the case of labor productivity defined as the energy sold per employee, the best performer is
once again Chile with 9,248 MWh in 2005, which is more than 4 times the regional simple average of
2,196 MWh per employee. The rest of the countries in South America operate with half of the labor
productivity of Chile ranging between 2,000 and 5,000 MWh of energy sold per employee. When
considering the labor productivity of utilities in Central America and the Caribbean, Panama leads with
4,081 MWh per employee followed by El Salvador with 3,464 MWh. By 2005, the Caribbean countries
range between 376 and 1,222 MWh per employee.
Similar to the trends for residential connections per employee, the results for the energy sold per
employee indicate overall growth. It is worth noting however, that labor productivity represented by the
residential connections and energy sold per employee is affected by factors such as increased private
participation and population growth in the case of residential connections per employee, and distributional
losses when assessing energy sold per employee.

- 15 -
0
1000
2000
3000
4000
5000
1995 2000 2005year
ARG BRA COL
MEX PER VEN
Source: LAC Electricity Benchmarking Database, The World Bank, 2007.
- South America & Mexico (GRP 1) -
Energy Sold per employee (MWh)
0
2500
5000
7500
10000
1995 2000 2005year
BOL CHL ECU
PRY URY
Source: LAC Electricity Benchmarking Database, The World Bank, 2007.
- South America (GRP 2) -
Energy Sold per employee (MWh)
0
1000
2000
3000
4000
5000
1995 2000 2005year
CRI BLZ SLV GTM
HND NIC PAN DOM
Source: LAC Electricity Benchmarking Database, The World Bank, 2007.
- Central America -
Energy Sold per employee (MWh)
0
1000
2000
3000
4000
5000
2000 2001 2002 2003 2004 2005year
ATG DMA GRD
KNA LCA VCT
Source: LAC Electricity Benchmarking Database, The World Bank, 2007.
- Caribe -
Energy Sold per employee (MWh)
2.4 INPUT INDICATORS
Measuring the input of electricity distribution at the country-level calls for close attention to the
operation expenditures of utilities. According to the data collected the simple average across countries of
operation expenditures (OPEX) is $275 per connection. During the last decade, the region showed
inconsistent values of OPEX and several extreme increases and decreases. The countries with the lowest
operational expenditure are Paraguay and Honduras with $49 and $24 respectively. The highest values of
OPEX are found in the Caribbean countries which operate between $400 and $800 per connection with the
exception of Antigua and Barbuda in 2004 averaging an unusual $1,805 per connection, more than 6 times
greater than the simple average in the region. In contrast, the rest of the region performs at a lower level of
OPEX per connection with the exception of Colombia with $406 per connection. Overall, the total average
change in operation expenditures is a three-fold increase throughout the last 10 years.
Similar to operation expenditures, capital expenditures per connection do not display a consistent
trend throughout the decade. With a regional average of $74 per connection, capital expenditures are a
fourth of operation expenditures and have increased 3.5 times during the last decade. For more detailed
information on capital and total expenditures per connection, refer to Annex 4.

- 16 -
0
200
400
600
1995 2000 2005year
ARG BRA COL
MEX PER VEN
Source: LAC Electricity Benchmarking Database, The World Bank, 2007.
- South America & Mexico (GRP 1) -
OPEX per Connection (in dollars/yr)
0
200
400
600
1995 2000 2005year
BOL CHL ECU
PRY URY
Source: LAC Electricity Benchmarking Database, The World Bank, 2007.
- South America (GRP 2) -
OPEX per Connection (in dollars/yr)
0
200
400
600
1995 2000 2005year
CRI BLZ SLV GTM
HND NIC PAN DOM
Source: LAC Electricity Benchmarking Database, The World Bank, 2007.
- Central America -
OPEX per Connection (in dollars/yr)
0
500
1000
1500
2000
2000 2001 2002 2003 2004 2005year
ATG DMA GRD
KNA LCA VCT
Source: LAC Electricity Benchmarking Database, The World Bank, 2007.
- Caribe -
OPEX per Connection (in dollars/yr)
With respect to OPEX per MWh sold, the regional average is $65 per MWh sold. Similar to
OPEX per connection, Honduras and Paraguay have the lowest operation expenditures per MWh sold.
There is no apparent trend delineating the performance of the region with the exception of the Caribbean
countries which exhibit growth. Comparable to OPEX per connection, the scale for the Caribbean
countries is quite above the regional range with OPEX in Antigua and Barbuda as high as $294 in 2005.
The rest of the region remains at a constant level.
The regional average for capital expenditures per MWh sold is $17.5, which is a third of the
operation expenditures per MWh sold.
050
100
150
1995 2000 2005year
ARG BRA COL
MEX PER VEN
Source: LAC Electricity Benchmarking Database, The World Bank, 2007.
- South America & Mexico (GRP 1) -
OPEX per MWh Sold (in dollars/yr)
050
100
150
1995 2000 2005year
BOL CHL ECU
PRY URY
Source: LAC Electricity Benchmarking Database, The World Bank, 2007.
- South America (GRP 2) -
OPEX per MWh Sold (in dollars/yr)

- 17 -
050
100
150
1995 2000 2005year
CRI BLZ SLV GTM
HND NIC PAN DOM
Source: LAC Electricity Benchmarking Database, The World Bank, 2007.
- Central America -
OPEX per MWh Sold (in dollars/yr)
0
100
200
300
2000 2001 2002 2003 2004 2005year
ATG DMA GRD
KNA LCA VCT
Source: LAC Electricity Benchmarking Database, The World Bank, 2007.
- Caribe -
OPEX per MWh Sold (in dollars/yr)
2.5 PRICES: AVERAGE RESIDENTIAL AND INDUSTRIAL TARIFFS
Amongst the most indicative features of distribution performance is the price at which it operates
and serves its clientele. The analysis shows that tariffs throughout the region have slightly increased in
some countries and slightly decreased in others but with no significant price growth pattern. The regional
average residential tariff is $95 per MWh with most South American countries falling within the range of
$50 and $150. Argentina serves its residential customers at the lowest average tariff of $38. On the
contrary, the end-user price charged in most Central American and Caribbean countries is above the
average price reaching as high as $151 in Guatemala and $314 in Dominica. When evaluating the
evolution of the average residential tariffs in Argentina the economic crisis accounts for the sudden drop
in tariffs in 2002 to one third of the levels (in dollars) in 2001.
050
100
150
200
1995 2000 2005year
ARG BRA COL
MEX PER VEN
Source: LAC Electricity Benchmarking Database, The World Bank, 2007.
- South America & Mexico (GRP 1) -
Average Residential Tariff (in US$/MWh)
050
100
150
200
1995 2000 2005year
BOL CHL ECU
PRY URY
Source: LAC Electricity Benchmarking Database, The World Bank, 2007.
- South America (GRP 2) -
Average Residential Tariff (in US$/MWh)

- 18 -
050
100
150
200
1995 2000 2005year
CRI BLZ SLV GTM
HND NIC PAN DOM
Source: LAC Electricity Benchmarking Database, The World Bank, 2007.
- Central America -
Average Residential Tariff (in US$/MWh)
0
100
200
300
2000 2001 2002 2003 2004 2005year
ATG DMA GRD
KNA LCA VCT
Source: LAC Electricity Benchmarking Database, The World Bank, 2007.
- Caribe -
Average Residential Tariff (in US$/MWh)
In regard to the average industrial tariffs, there is a similar tendency to that of residential tariffs.
Most industrial tariffs in South America fall between $40 and $100, including Argentina despite the 2002
drop explained by the monetary devaluation during this period. Like the residential tariffs, Central
America and the Caribbean are above the regional average tariff of $81. By the end of 2005, Dominica
had the highest industrial tariff of $372 while Paraguay maintained the lowest tariff of $34. It is worth
noting that the overall average residential tariffs are 14 percent higher than the average industrial tariffs
and have increased by 24.7 percent.
050
100
150
1995 2000 2005year
ARG BRA COL
MEX PER VEN
Source: LAC Electricity Benchmarking Database, The World Bank, 2007.
- South America & Mexico (GRP 1) -
Average Industrial Tariff (in US$/MWh)
050
100
150
1995 2000 2005year
BOL CHL ECU
PRY URY
Source: LAC Electricity Benchmarking Database, The World Bank, 2007.
- South America (GRP 2) -
Average Industrial Tariff (in US$/MWh)
050
100
150
1995 2000 2005year
CRI BLZ SLV GTM
HND NIC PAN DOM
Source: LAC Electricity Benchmarking Database, The World Bank, 2007.
- Central America -
Average Industrial Tariff (in US$/MWh)
0
100
200
300
400
2000 2001 2002 2003 2004 2005year
ATG DMA GRD
KNA LCA VCT
Source: LAC Electricity Benchmarking Database, The World Bank, 2007.
- Caribe -
Average Industrial Tariff (in US$/MWh)
2.6 OPERATING PERFORMANCE
Throughout the last decade, distributional losses have either slightly increased or decreased but for

- 19 -
the most part have remained close to the simple average across countries of 15.7 percent. According to the
following figures, the country with the lowest amount of distributional losses was Chile with 6.5 percent
by 2005. The country with the largest reduction in losses was Peru with an 11 percentage point drop
during the last decade, followed by Colombia with a 6.9 percentage point drop. While more countries
experienced a reduction in distributional losses, there were several that encountered significant increases.
These include Venezuela, Paraguay, and the Dominican Republic.
0.1
.2.3
.4
1995 2000 2005year
ARG BRA COL
MEX PER VEN
Source: LAC Electricity Benchmarking Database, The World Bank, 2007.
- South America & Mexico (GRP 1) -
% Distributional Losses
0.1
.2.3
.4
1995 2000 2005year
BOL CHL ECU
PRY URY
Source: LAC Electricity Benchmarking Database, The World Bank, 2007.
- South America (GRP 2) -
% Distributional Losses
0.1
.2.3
.4
1995 2000 2005year
CRI BLZ SLV GTM
HND NIC PAN DOM
Source: LAC Electricity Benchmarking Database, The World Bank, 2007.
- Central America -
% Distributional Losses
0.1
.2.3
.4
2000 2001 2002 2003 2004 2005year
ATG DMA GRD
KNA LCA VCT
Source: LAC Electricity Benchmarking Database, The World Bank, 2007.
- Caribe -
% Distributional Losses
2.7 QUALITY OF SERVICE
The quality of electricity distribution is measured by the average frequency and duration of
interruptions per connection. While the following graphs indicate a slight reduction in the average
frequency of interruptions per connection, there is no consistent trend for most countries but rather
fragmentary results. The regional simple average for the frequency of interruptions per connection is 19.8
per year and Mexico leads the region with the lowest frequency level of 2.19 in 2005 followed by Panama
and Ecuador with 2.4 and 2.7 respectively. Paraguay has experienced the greatest quality deterioration
with the highest frequency of interruptions, namely 16.4 in 2005. On the contrary, Costa Rica shows the
greatest improvement with a 56 percent reduction from 1999-2005.

- 20 -
010
20
30
40
1995 2000 2005year
ARG BRA COL
MEX PER VEN
Source: LAC Electricity Benchmarking Database, The World Bank, 2007.
- South America & Mexico (GRP 1) -
Average Frequency of Interruptions per Connection (#/Yr)
010
20
30
40
1995 2000 2005year
BOL CHL ECU
PRY URY
Source: LAC Electricity Benchmarking Database, The World Bank, 2007.
- South America (GRP 2) -
Average Frequency of Interruptions per Connection (#/Yr)
010
20
30
40
1995 2000 2005year
CRI BLZ SLV GTM
HND NIC PAN DOM
Source: LAC Electricity Benchmarking Database, The World Bank, 2007.
- Central America -
Average Frequency of Interruptions per Connection (#/Yr)
010
20
30
40
2000 2001 2002 2003 2004 2005year
ATG DMA GRD
KNA LCA VCT
Source: LAC Electricity Benchmarking Database, The World Bank, 2007.
- Caribe -
Average Frequency of Interruptions per Connection (#/Yr)
In comparison to the average frequency of interruptions, the results for the average duration of
interruptions are even more erratic. The average duration of interruptions per connection was calculated in
terms of hours that service was discontinued per connection per year, and the simple average across the
region for the period covered in this report was 21 hours per consumer per year. The country with the least
time of interruption is Ecuador with 2 hour durations. The country with the highest duration of
interruptions by the end of 2005 was Venezuela with 42 hours per connection.
025
50
75
1995 2000 2005year
ARG BRA COL
MEX PER VEN
Source: LAC Electricity Benchmarking Database, The World Bank, 2007.
- South America & Mexico (GRP 1) -
Average Duration of interruptions per Connection (in hrs/year)
025
50
75
1995 2000 2005year
BOL CHL ECU
PRY URY
Source: LAC Electricity Benchmarking Database, The World Bank, 2007.
- South America (GRP 2) -
Average Duration of interruptions per Connection (in hrs/year)

- 21 -
050
100
150
1995 2000 2005year
CRI BLZ SLV GTM
HND NIC PAN DOM
Source: LAC Electricity Benchmarking Database, The World Bank, 2007.
- Central America -
Average Duration of interruptions per Connection (in hrs/year)
2.8 CONCLUSIONS
The main results of this chapter exhibit overall improvements across the region during the last
decade with various best performers for each indicator provided. In light of the simple averages across
countries presented in this chapter, there are several countries that stand out as best performers. When
assessing labor productivity, Chile takes the lead with 1,349 connections per employee, 3 times above the
regional average. Venezuela is the country with the most energy sold per connection averaging 10 MWh
per year, almost double the regional average. In regards to losses, Chile had the lowest level of
distributional losses averaging 6.5 percent by the end of 2005. However, Peru was most successful in
reducing distributional losses by 11 percentage points during the last ten years. Furthermore, Mexico came
out on top for the best quality of service with a frequency of 2 interruptions per year while Ecuador sets
the standard for the lowest duration of interruptions. Finally, Argentina and Paraguay provide their
residential and industrial customers with the lowest tariffs in the region. While this analysis is only a part
of the electrification story in Latin America, we conclude that there have been uneven, but significant
improvements in the past ten years in most of the countries.
- 22 -
3. A UTILITY-LEVEL ASSESSMENT OF ELECTRICITY
DISTRIBUTION
The objective of this chapter is to benchmark the performance of 250 electricity distribution
utilities in the LCR. We rank them according to the top ten percent, bottom ten percent, and the simple
average of the rest of the 80 percent performers. The utilities are evaluated based on their achievements in
coverage, labor productivity, output, input, operating performance, service quality, and prices. Best
performing utilities are listed in the top or bottom ten percent depending on the variable at hand. While the
best performer for electricity coverage is listed in the top ten percent, the best performer for distribution
losses would form part of the bottom ten percent. In addition, it is worth noting that for certain indicators
such as operation and capital expenditures, ranking in the top or bottom ten percent is not necessarily a
benchmark of good performance.
3.1 MAIN FINDINGS
The best performing electricity distribution utilities are ranked either in the top ten or bottom
percent depending on the indicator being benchmarked. The best performers in our database are
characterized by 100 percent electrification, an average of 871.6 residential connections and 5,127.7 MWh
of energy sold per employee, 6.4 percent distributional losses, and residential prices in the range of $51
per MWh, amongst other indicators. Although there are some variations within and between countries, in
general, several companies in Brazil lead with best performance in terms of labor productivity,
distributional losses, OPEX, and coverage. In addition, Costa Rica sets the standard for good performance
in coverage, OPEX, and tariffs. Finally, several utilities in Chile produced leaders for the indicators
measuring labor productivity and technical efficiency.
Compania Eléctrica del Rio Maipo of Chile and Manaus Energía S.A. of Brazil led the region
with more than 3 times the labor productivity of the average utility in the middle eighty percent. With
regards to operation expenditures per connection Compañía Nacional de Fuerza y Luz and Junta
Administradora de Servicios Eléctricos de Cartago of Costa Rica incur the least expenses and operate at 2
percent of the costs of the utilities in the top ten percent. When assessing the best utility performer for the
lowest capital expenditures per connection, Electro Sur S.A. of Peru has averaged $3.01 per connection for
the last 10 years. Furthermore, C.A. Electricidad de Valencia provides its residential customers with the
lowest tariffs, 4 times less than the utilities in the top ten percent. Finally, Compañía Força e Luz do Oeste
and Empresa Força e Luz de Urussanga Ltda of Brazil stand out for the least distributional losses.
Empresa Eléctrica Esmeraldas S.A. of Ecuador provides its customers the best quality of service in the
region with 0.96 when measuring the frequency of interruptions while Empresas Públicas de Medellín
E.S.P. lead with the lowest average duration of 0.54 hours per connection.
The following sections serve as a guide for assessing the best utility performers in the LCR and
demonstrating the improvements from 1995-2005.
3.2 COVERAGE AND OUTPUT

- 23 -
The best performers when measuring electricity coverage form the top ten percent with 100
percent electrification. Several utilities in Brazil, Chile, Colombia, and Costa Rica lead the region with the
highest percentage electrification. Most of the utilities in the top ten percent are on average 19 percentage
points above the 80.5 percent mean of the middle group and double the coverage of the bottom ten percent
with 48.9 percent electrification. Throughout the last 10 years, there has been an overall 11.6 percentage
point increase in electrification with considerable improvement amongst the bottom ten percent increasing
20.1 percentage points from their initial coverage of 40.9 percent electrification in 1995. Concurrently, the
utilities in the middle group have risen from 73.1 percent coverage to 87.8 percent during the last decade.
.4.6
.81
1995 2000 2005year
Bottom 10% Mean Top 10%
Source: LAC Electricity Benchmarking Database, The World Bank, 2007.
Electricity Coverage
Coverage
Year Bottom10%
Mean Top10%
Total
1995 0.409 0.731 0.999 0.7131996 0.427 0.749 0.999 0.7251997 0.448 0.759 0.999 0.7351998 0.454 0.776 0.999 0.7431999 0.471 0.792 0.999 0.7542000 0.481 0.809 0.999 0.7632001 0.484 0.822 0.999 0.7682002 0.501 0.832 0.999 0.7772003 0.530 0.847 1.000 0.7922004 0.564 0.865 1.000 0.8102005 0.610 0.878 1.000 0.829Total 0.489 0.805 0.999 0.765
COVERAGE
Country Name Mean 95-05Brazil Espírito Santo Centrais Elétricas S/A. 1.000Brazil Companhia Energética de Minas Gerais 0.994Brazil Companhia Energética de Brasília 0.999Brazil Empresa Elétrica Bragantina S.A. 1.000Brazil CNEE - Companhia Nacional de Energia Elétrica 1.000Brazil Companhia Paulista de Força e Luz - Piratininga 0.998Brazil Departamento Municipal de Energia de Ijuí 1.000Brazil Centrais Elétricas de Carazinho S/A. 1.000Chile Empresa Eléctrica de Magallanes S.A. 0.994Colombia Empresas Públicas De Medellín E.S.P. 1.000Colombia Electrificadora del Huila S.A. ESP 0.994Costa Rica Instituto Costarricense de Electricidad 1.000Costa Rica Compañia Nacional de Fuerza y Luz 1.000
0.998 With respect to the amount of energy sold (MWh) per connection there are significant variations
across the groups. While the utilities in the top decile reported an average of 8.25 MWh per connection per
year, those in the bottom percent only sold 1.41 MWh per connection. There are no remarkable changes
across time within groups though the middle group underwent a 20 percent increase in the energy sold per
connection between 1995 and 2000. Despite this increase, the values remained fairly constant. Low selling
utilities were not concentrated in one country, but rather dispersed throughout the region.

- 24 -
24
68
1995 2000 2005year
Bottom 10% Mean Top 10%
Source: LAC Electricity Benchmarking Database, The World Bank, 2007.
Energy Sold per Connection per year (MWh)
Energy Sold per Connection (MWh)
Year Bottom
10%
Mean Top
10%
Total
1995 1.48 3.57 8.21 4.42
1996 1.48 3.69 8.16 4.44
1997 1.50 3.88 8.23 4.53
1998 1.48 3.97 8.26 4.57
1999 1.42 3.96 8.12 4.50
2000 1.43 4.07 8.35 4.61
2001 1.30 3.98 8.22 4.50
2002 1.32 4.01 8.19 4.50
2003 1.34 4.04 8.29 4.56
2004 1.37 4.09 8.45 4.64
2005 1.38 4.15 8.33 4.62
Total 1.41 3.95 8.25 4.54
Energy Sold per Connection (MWh)
Country Name Mean 95-05
Bolivia Servicios Eléctricos Tarija S.A. 1.74
Brazil Companhia Força e Luz Cataguazes - Leopoldina 0.29
Chile Empresa Eléctrica de Casablanca S.A. 1.78
Chile Empresa Eléctrica de la Frontera S.A. 1.73
Chile Compañía Eléctrica del Litoral S.A. 1.28
Colombia Centrales Eléctricas del Cauca S.A. ESP 1.80
Colombia Empresa de Energía de Putumayo S.A. ESP 1.46
Colombia Centrales Eléctricas de Nariño S.A. ESP 1.80
Ecuador Empresa Eléctrica Riobamba S.A. 1.36
Ecuador Empresa Eléctrica Regional Sur S.A. 1.34
Ecuador Empresa Eléctrica Ambato S.A. 1.75
Ecuador Empresa Eléctrica Azogues S.A. 1.54
Ecuador Empresa Eléctrica Bolivar S.A. 0.94
Guatemala Distribuidora de Electricidad de Occidente 1.03
Guatemala Distribuidora de Electricidad de Oriente 1.47
Peru Electro Centro S.A. 1.51
Peru Electro Norte S.A. 1.48
Peru Electro Oriente S.A 1.76
Peru Electro Puno S.A.A. 0.69
Peru Electro Sur Este SA 0.96
Peru Proyecto Especial Chavimochic 1.80
El Salvador Distribuidora Eléctrica de Usulatan S.A. 1.70
1.42
3.3 LABOR PRODUCTIVITY
The utilities that form the top ten percent in labor productivity had an average of 871.6 residential
connections per employee which is approximately nine times the productivity of the utilities included in
the bottom ten percent. Unlike coverage, labor productivity tripled between 1995 and 2005 for the top ten
percent utilities, while there was little improvement for the bottom ten percent. Nevertheless, the labor
productivity of the utilities in the top ten percent improved at an annual growth rate of 10.3 percent in
contrast to the 4 percent annual improvement of the utilities in the bottom ten percent; there was a
cumulative improvement of 48.1 percent in the lower performing decile.

- 25 -
0
500
1000
1500
1995 2000 2005year
Bottom 10% Mean Top 10%
Source: LAC Electricity Benchmarking Database, The World Bank, 2007.
Residential Connections per Employee
Residential Connections per Employee
Year Bottom10%
Mean Top10%
Total
1995 79.1 241.5 435.1 251.91996 82.9 267.0 523.5 291.11997 89.9 304.1 656.7 350.21998 95.1 345.4 729.5 390.01999 98.9 380.3 819.5 432.92000 99.6 419.8 937.9 485.82001 102.6 442.9 1033.5 526.32002 106.5 452.6 1049.8 536.32003 110.0 472.2 1098.4 560.22004 114.5 486.5 1136.3 579.12005 117.1 502.0 1167.8 595.6Total 99.6 392.2 871.6 454.5
Compañia Eléctrica del Rio Maipo in Chile with an average 1,327 connections per employee is
the pioneer for the highest labor productivity throughout the last 10 years. Empresa Eléctrica de Colina
S.A.. follows with 1,111.5 residential connections per employee.
Residential Connections per Employee
Country Name Mean 95-05Argentina Empresa Distribuidora San Luis S.A. 853.3Argentina Empresas Distribuidora de Electricidad de Salta S.A. 998.5Bolivia Electricidad De La Paz S.A. 920.1Brazil AES SUL Distribuidora Gaúcha de Energia S/A 893.1Brazil Companhia de Eletricidade do Rio de Janeiro 864.3Brazil Companhia Energética do Rio Grande do Norte 832.5Brazil Companhia Energética do Ceará 882.2Brazil Companhia Paulista de Força e Luz - Piratininga 971.3Chile Compañía General de Electricidad S.A. 863.4Chile Compañía Eléctrica Osorno S.A. 909.6Chile Empresa Eléctrica de Colina S.A. 1111.5Chile Compañía Eléctrica del Litoral S.A. 989.5Chile Compañía Eléctrica Puente Alto Ltda. 831.6Chile Compañía Eléctrica del Rio Maipo S.A. 1327.4Guatemala Distribuidora de Electricidad de Occidente 1041.9Peru EdelNor 1054.9Peru Luz del Sur 910.2Peru EdelNor - Zonal Chancay 973.1Peru Empresa de Distribuición Eléctrica Canete S.A. 915.2El Salvador Distribuidora Eléctrica de Usulatan, S.A. 1020.6
The average energy sold by the utilities in the top ten percent is 5,127.7 MWh per employee, more
than twice as much as the middle 80 percent, which sold an average of 1,790.8 MWh per employee.
Similar to the time trend for labor productivity of residential connections per employee, the utilities in the
top ten percent have doubled their productivity with an annual growth rate of 7.3 percent. In contrast, the
utilities in the bottom ten percent have only slightly increased their productivity from 1995-2005 with an
average of 5 percent per year. On average, the utilities in the top ten percent have been 14.6 times more
productive than those in the bottom ten percent. It is noteworthy that most of the improvements for this
indicator occurred in the first half of the decade.

- 26 -
0
2000
4000
6000
1995 2000 2005year
Bottom 10% Mean Top 10%
Source: LAC Electricity Benchmarking Database, The World Bank, 2007.
Energy Sold per employee (MWh)
Energy Sold per Employee (MWh)
Year Bottom10%
Mean Top10%
Total
1995 271.4 1003.8 3184.2 1486.51996 278.2 1142.8 3536.6 1652.51997 326.7 1382.1 4013.7 1907.51998 319.4 1602.0 4576.5 2166.01999 336.9 1746.6 4974.8 2352.82000 349.5 1995.8 5730.2 2691.82001 366.9 2020.7 5830.6 2739.42002 363.5 2057.5 5739.1 2720.02003 389.6 2130.1 6092.7 2870.82004 411.2 2252.0 6260.6 2974.62005 443.6 2365.3 6465.6 3091.5Total 350.6 1790.8 5127.7 2423.0
In terms of the average energy sold per employee during the last decade, Manaus Energia S.A. of
Brazil ranks first with 6,402 MWh sold per employee followed by Codensa S.A. ESP from Colombia
with 5,648 MWh sold.
Energy Sold per Employee (MWh)
Country Name Mean 95-05Argentina Empresa Distribuidora y Comercializadora Norte S.A. 4934.5Argentina Empresa Distribuidora Sur S.A. 4667.0Argentina Empresa Distribuidora San Luis S.A. 4907.7Argentina Empresa Distribuidora de Electricidad de la Roja S.A. 4842.3Brazil Rio Grande Energia S/A 5158.1Brazil Companhia Paulista de Força e Luz 5027.9Brazil Eletropaulo Metropolitana – Eletricidade de São Paulo S/A 5094.3Brazil Bandeirante Energia S/A. 5457.9Brazil Manaus Energia S/A 6402.3Brazil Companhia Jaguari de Energia 5273.7Brazil Companhia Paulista de Força e Luz - Piratininga 4487.2Chile Chilectra S.A. 4739.1Chile Cooperativa Eléctrica Osorno 5511.6Chile Compañía Eléctrica del Rio Maipo S.A. 5286.4Colombia Codensa S.A. ESP 5648.0Colombia Empresas Municipales De Cali Eice 4472.5Peru EdelNor 5410.0Peru Luz del Sur 5293.2Venezuela Energía Eléctrica de la Costa Oriental 4795.5
3.4 INPUT INDICATORS
As presented in the previous chapters, OPEX represents the amount of expenditure for operating
and maintaining service. The following figure presents the evolution of OPEX (in dollars) per connection.
The top ten percent utilities incurred higher operating expenses averaging $648.78 per connection per
year, almost four times higher than the utilities in the middle group, and more than 26 times the average of
the utilities in the bottom ten percent. The utilities in the bottom ten percent operate at an average $24.75
per connection which is 6 times less than the simple average of the utilities in the mean group, averaging
$164.65 per connection. The top ten percent group had an annual increase of 2.2 percent in the last seven
years of the sample, half of the 4.8 percent increase of the bottom ten percent.

- 27 -
0
200
400
600
800
1995 2000 2005year
Bottom 10% Mean Top 10%
Source: LAC Electricity Benchmarking Database, The World Bank, 2007.
OPEX per Connection (in dollars)
Opex per Connection
Year Bottom10%
Mean Top10%
Total
1995 n.a. 183.57 n.a. 183.571996 n.a. 194.64 n.a. 194.641997 n.a. 208.50 n.a. 208.501998 26.82 175.17 675.61 292.531999 20.71 146.46 556.02 241.062000 17.24 156.12 666.04 279.802001 16.57 142.23 654.71 271.172002 20.39 135.90 580.27 245.522003 27.02 132.98 613.41 257.812004 31.94 150.08 654.80 278.942005 37.33 185.45 789.39 337.39Total 24.75 164.65 648.78 266.64
Compañia Nacional de Fuerza y Luz and Junta Administradora de Servicios Eléctricos de
Cartago of Costa Rica have the lowest OPEX at $12.98 per connection and $14.71 per connection
respectively. Compañia Nacional de Fuerza y Luz spends a third of what Empresa Luz e Força Santa
Maria S.A. does on electricity connections. While Empresa Luz e Força Santa Maria S.A. of Brazil is
amongst the utilities with low OPEX, it has the highest operation expenditures in this group.
OPEX per Connection
Country Name Mean 95-05Brazil Companhia de Eletricidade do Rio de Janeiro 31.29Brazil Companhia Energética de Alagoas 22.82Brazil Empresa Luz e Força Santa Maria S/A 47.25Costa Rica Compañia Nacional de Fuerza y Luz 12.98Costa Rica Junta Administradora de Servicios Eléctricos de Cartago 14.71Ecuador Empresa Eléctrica Milagro S.A. 30.36Ecuador Empresa Eléctrica Norte S.A. 28.82Ecuador Empresa Eléctrica Riobamba S.A. 26.46Ecuador Empresa Eléctrica Regional Sur S.A. 28.70Ecuador Empresa Eléctrica Ambato S.A. 24.92Ecuador Empresa Eléctrica Bolívar S.A. 25.45Ecuador Empresa Eléctrica Centro Sur S.A. 31.14Ecuador Empresa Eléctrica Cotopaxi S.A. 31.08Ecuador Empresa Eléctrica El Oro S.A. 31.47Honduras Empresa Nacional de Energía Eléctrica 20.15Paraguay Compañia Luz y Fuerza S.A. 15.05
The utilities in the bottom ten percent perform at a sixth of the total regional mean of $164.65 and
at four percent of the operational expenditures of utilities found in the top ten percent. The disparity
between the top ten percent and the bottom ten percent is notable as in the case of Compania Luz y Fuerza
S.A. (CLYFSA) of Paraguay incurring 2.5 percent of the expenditures of the utilities in the top ten percent.
However, unlike operation expenditures per connection, the operation expenditures per MWh
energy sold of the utilities in the top ten percent witnessed a significant change especially between 1997
and 2000 with a total 123.2 unit reduction. Meanwhile, the utilities in the middle 80 percent reported a
12.11 unit reduction while those in the bottom decile were able to decrease OPEX per MWh by 2.32 MWh
in the same three years. Beginning in 1997, the total annual reduction for the top decile was 3 percent per
year, in contrast to the minimal annual change for the intermediate and bottom groups.
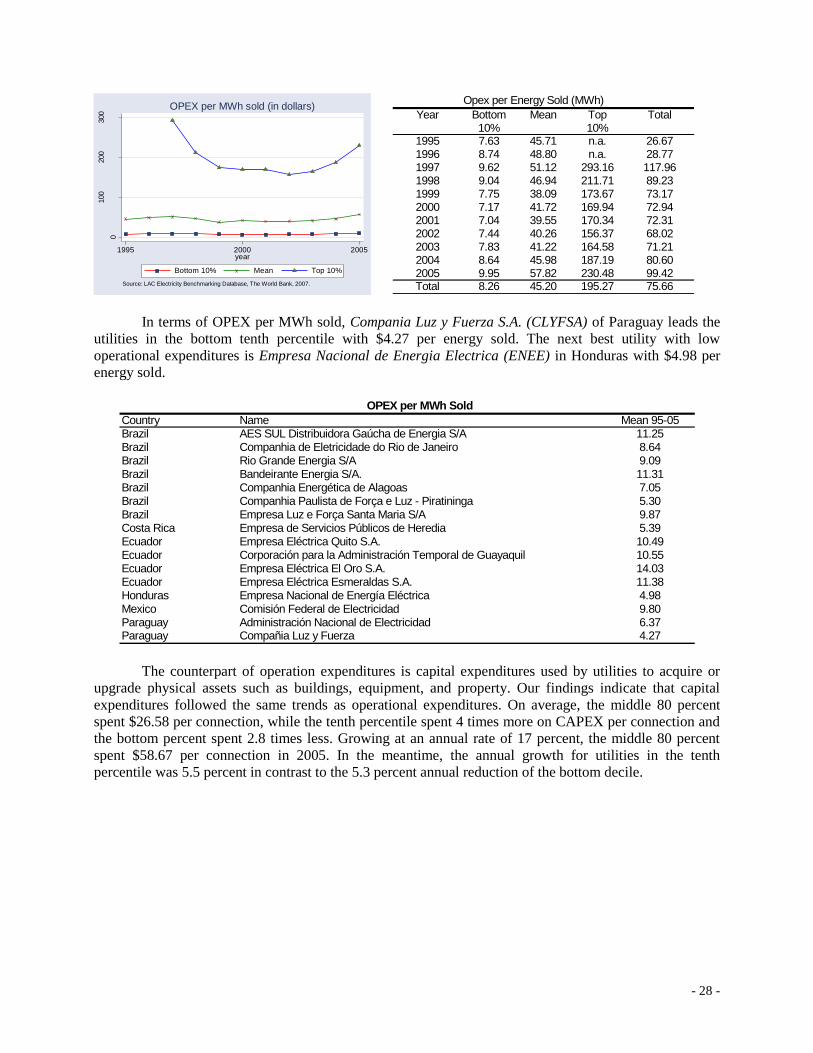
- 28 -
0
100
200
300
1995 2000 2005year
Bottom 10% Mean Top 10%
Source: LAC Electricity Benchmarking Database, The World Bank, 2007.
OPEX per MWh sold (in dollars)
Opex per Energy Sold (MWh)
Year Bottom10%
Mean Top10%
Total
1995 7.63 45.71 n.a. 26.671996 8.74 48.80 n.a. 28.771997 9.62 51.12 293.16 117.961998 9.04 46.94 211.71 89.231999 7.75 38.09 173.67 73.172000 7.17 41.72 169.94 72.942001 7.04 39.55 170.34 72.312002 7.44 40.26 156.37 68.022003 7.83 41.22 164.58 71.212004 8.64 45.98 187.19 80.602005 9.95 57.82 230.48 99.42Total 8.26 45.20 195.27 75.66
In terms of OPEX per MWh sold, Compania Luz y Fuerza S.A. (CLYFSA) of Paraguay leads the
utilities in the bottom tenth percentile with $4.27 per energy sold. The next best utility with low
operational expenditures is Empresa Nacional de Energia Electrica (ENEE) in Honduras with $4.98 per
energy sold.
OPEX per MWh Sold
Country Name Mean 95-05Brazil AES SUL Distribuidora Gaúcha de Energia S/A 11.25Brazil Companhia de Eletricidade do Rio de Janeiro 8.64Brazil Rio Grande Energia S/A 9.09Brazil Bandeirante Energia S/A. 11.31Brazil Companhia Energética de Alagoas 7.05Brazil Companhia Paulista de Força e Luz - Piratininga 5.30Brazil Empresa Luz e Força Santa Maria S/A 9.87Costa Rica Empresa de Servicios Públicos de Heredia 5.39Ecuador Empresa Eléctrica Quito S.A. 10.49Ecuador Corporación para la Administración Temporal de Guayaquil 10.55Ecuador Empresa Eléctrica El Oro S.A. 14.03Ecuador Empresa Eléctrica Esmeraldas S.A. 11.38Honduras Empresa Nacional de Energía Eléctrica 4.98Mexico Comisión Federal de Electricidad 9.80Paraguay Administración Nacional de Electricidad 6.37Paraguay Compañia Luz y Fuerza 4.27
The counterpart of operation expenditures is capital expenditures used by utilities to acquire or
upgrade physical assets such as buildings, equipment, and property. Our findings indicate that capital
expenditures followed the same trends as operational expenditures. On average, the middle 80 percent
spent $26.58 per connection, while the tenth percentile spent 4 times more on CAPEX per connection and
the bottom percent spent 2.8 times less. Growing at an annual rate of 17 percent, the middle 80 percent
spent $58.67 per connection in 2005. In the meantime, the annual growth for utilities in the tenth
percentile was 5.5 percent in contrast to the 5.3 percent annual reduction of the bottom decile.
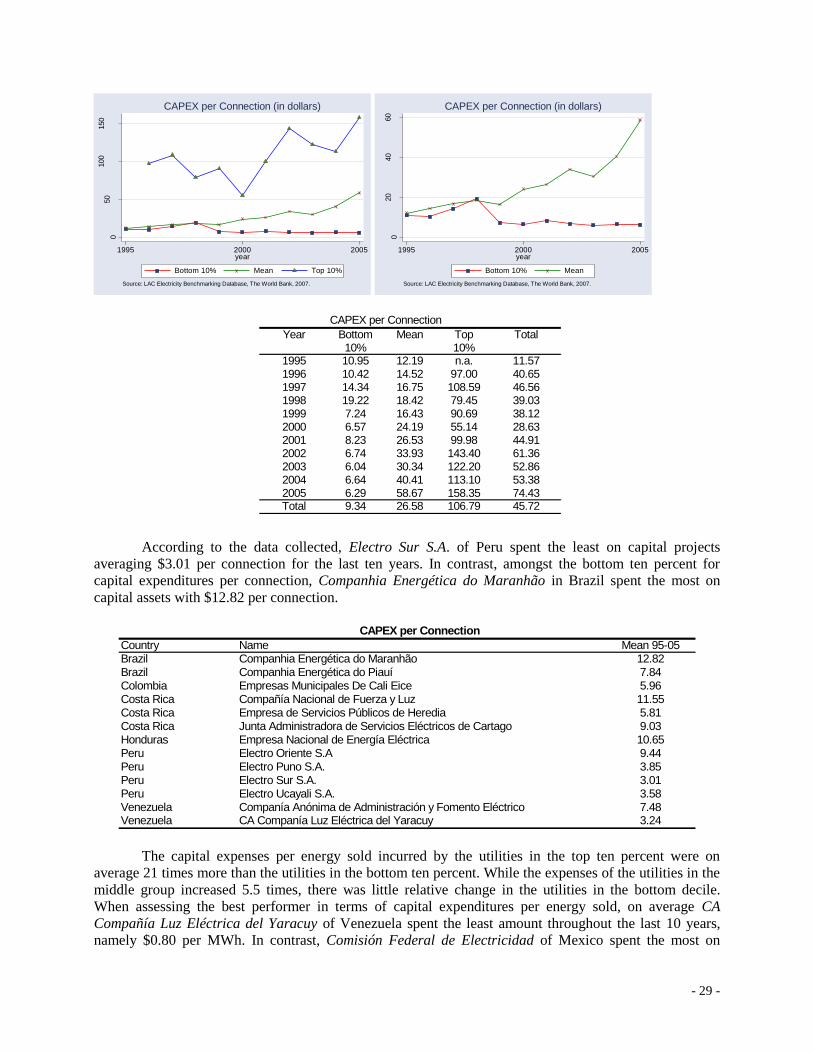
- 29 -
050
100
150
1995 2000 2005year
Bottom 10% Mean Top 10%
Source: LAC Electricity Benchmarking Database, The World Bank, 2007.
CAPEX per Connection (in dollars)
020
40
60
1995 2000 2005year
Bottom 10% Mean
Source: LAC Electricity Benchmarking Database, The World Bank, 2007.
CAPEX per Connection (in dollars)
CAPEX per Connection
Year Bottom10%
Mean Top10%
Total
1995 10.95 12.19 n.a. 11.571996 10.42 14.52 97.00 40.651997 14.34 16.75 108.59 46.561998 19.22 18.42 79.45 39.031999 7.24 16.43 90.69 38.122000 6.57 24.19 55.14 28.632001 8.23 26.53 99.98 44.912002 6.74 33.93 143.40 61.362003 6.04 30.34 122.20 52.862004 6.64 40.41 113.10 53.382005 6.29 58.67 158.35 74.43Total 9.34 26.58 106.79 45.72
According to the data collected, Electro Sur S.A. of Peru spent the least on capital projects
averaging $3.01 per connection for the last ten years. In contrast, amongst the bottom ten percent for
capital expenditures per connection, Companhia Energética do Maranhão in Brazil spent the most on
capital assets with $12.82 per connection.
CAPEX per Connection
Country Name Mean 95-05Brazil Companhia Energética do Maranhão 12.82Brazil Companhia Energética do Piauí 7.84Colombia Empresas Municipales De Cali Eice 5.96Costa Rica Compañía Nacional de Fuerza y Luz 11.55Costa Rica Empresa de Servicios Públicos de Heredia 5.81Costa Rica Junta Administradora de Servicios Eléctricos de Cartago 9.03Honduras Empresa Nacional de Energía Eléctrica 10.65Peru Electro Oriente S.A 9.44Peru Electro Puno S.A. 3.85Peru Electro Sur S.A. 3.01Peru Electro Ucayali S.A. 3.58Venezuela Companía Anónima de Administración y Fomento Eléctrico 7.48Venezuela CA Companía Luz Eléctrica del Yaracuy 3.24
The capital expenses per energy sold incurred by the utilities in the top ten percent were on
average 21 times more than the utilities in the bottom ten percent. While the expenses of the utilities in the
middle group increased 5.5 times, there was little relative change in the utilities in the bottom decile.
When assessing the best performer in terms of capital expenditures per energy sold, on average CA
Compañía Luz Eléctrica del Yaracuy of Venezuela spent the least amount throughout the last 10 years,
namely $0.80 per MWh. In contrast, Comisión Federal de Electricidad of Mexico spent the most on

- 30 -
capital assets with $2.76 per energy sold (MWh).
0
20
40
60
1995 2000 2005year
Bottom 10% Mean Top 10%
Source: LAC Electricity Benchmarking Database, The World Bank, 2007.
CAPEX per MWh sold (in dollars)
05
10
15
20
1995 2000 2005year
Bottom 10% Mean
Source: LAC Electricity Benchmarking Database, The World Bank, 2007.
CAPEX per MWh sold (in dollars)
CAPEX per Energy Sold (MWh)
Year Bottom10%
Mean Top10%
Total
1995 1.78 3.44 n.a. 2.611996 2.00 4.05 46.31 17.451997 2.82 4.30 58.35 21.821998 2.14 5.12 47.57 18.281999 1.34 5.02 25.79 10.722000 1.79 7.67 29.68 13.052001 1.64 9.13 35.26 15.352002 1.76 10.65 36.61 16.342003 1.79 9.43 35.35 15.522004 2.01 12.43 41.31 18.592005 1.87 18.94 52.82 24.54Total 1.90 8.20 40.90 16.26
CAPEX per Energy Sold (MWh)
Country Name Mean 95-05Brazil Companhia Paulista de Força e Luz - Piratinin 2.06Brazil Manaus Energia S/A 2.42Brazil Companhia Paulista de Força e Luz - Piratininga 2.52Brazil Companhia Força e Luz do Oeste 2.64Costa Rica Compañía Nacional de Fuerza y Luz 1.73Costa Rica Empresa de Servicios Públicos de Heredia 1.02Costa Rica Junta Administradora de Servicios Eléctricos de Cartago 1.52Honduras Empresa Nacional de Energía Eléctrica 2.74Mexico Comisión Federal de Electricidad 2.76Peru Electro Sur S.A. 1.71Peru Electro Ucayali S.A. 1.41Venezuela Compañía Anónima de Administración y Fomento Eléctrico 0.94Venezuela CA Compañía Luz Eléctrica del Yaracuy 0.80
For the last decade, an average of $134.57 was incurred for operational and capital expenditures
per connection by the utilities in the middle 80 percent. The utilities in the bottom ten percent spent 5
percent of the amount of the utilities in the top ten percent. Nevertheless, beginning in 1998, the utilities in
the top ten percent curtailed their total expenditures by 26 percent, while those in the bottom ten percent
more than doubled and the middle 80 percent more than tripled since 1995.

- 31 -
0
500
1000
1995 2000 2005year
Bottom 10% Mean Top 10%
Source: LAC Electricity Benchmarking Database, The World Bank, 2007.
TOTEX per Connection (in dollars)
050
100
150
200
250
1995 2000 2005year
Bottom 10% Mean
Source: LAC Electricity Benchmarking Database, The World Bank, 2007.
TOTEX per Connection (in dollars)
TOTEX per Connection
Year Bottom10%
Mean Top10%
Total
1995 21.80 61.32 n.a. 41.561996 25.36 69.51 n.a. 47.441997 28.22 103.63 n.a. 65.921998 42.34 124.24 1100.18 422.251999 31.98 101.69 537.71 223.802000 32.21 133.77 725.75 297.242001 37.33 132.26 654.91 274.832002 38.46 176.70 586.47 267.212003 37.00 160.97 657.62 285.202004 44.25 187.12 675.37 302.252005 48.25 229.07 814.16 363.83Total 35.20 134.57 719.02 253.99
The Junta Administradora de Servicios Eléctricos de Cartago and Compañia Nacional de Fuerza
y Luz of Costa Rica were the operators with the least total expenditures at $23 and $24 per connection per
year.
TOTEX per Connection
Country Name Mean 95-05Brazil Companhia de Eletricidade do Rio de Janeiro 59.15Brazil Companhia Energética do Maranhão 39.52Brazil Companhia Energética de Alagoas 34.89Costa Rica Compañia Nacional de Fuerza y Luz 24.53Costa Rica Empresa de Servicios Públicos de Heredia 40.54Costa Rica Junta Administradora de Servicios Eléctricos de Cartago 23.09Ecuador Empresa Eléctrica Norte S.A. 48.94Ecuador Empresa Eléctrica Bolívar S.A. 58.13Honduras Empresa Nacional de Energía Eléctrica 28.79Mexico Comisión Federal de Electricidad 55.02Peru Electro Oriente S.A 38.70Peru Proyecto Especial Chavimochic 54.04Paraguay Administración Nacional de Electricidad 54.63Paraguay Compañía Luz y Fuerza S.A. 53.12 With respect to the total expenditures per energy sold, the simple average for the middle group
was $44.05 per MWh with an annual growth rate of 14.8 percent. The greatest change when addressing
the total expenditures per energy sold is apparent in the performance of the utilities in the middle group
that have increased total expenditures by 300 percent implying a 14.8 percent increase per year. From
1995 to 2005, the utilities in the top ten percent have experienced a cumulative 25 percent decrease in total
expenditures with the exception of the sudden reversion starting in 2003. Although the utilities in the

- 32 -
bottom ten percent exhibit an increase in the period studied, it is significantly smaller than the average
increase for the middle 80 percent.
0
100
200
300
400
1995 2000 2005year
Bottom 10% Mean Top 10%
Source: LAC Electricity Benchmarking Database, The World Bank, 2007.
TOTEX per MWh sold (in dollars)
020
40
60
80
1995 2000 2005year
Bottom 10% Mean
Source: LAC Electricity Benchmarking Database, The World Bank, 2007.
TOTEX per MWh sold (in dollars)
TOTEX per Energy Sold (MWh)
Year Bottom10%
Mean Top10%
Total
1995 10.44 19.27 412.55 147.421996 9.07 22.45 397.46 142.991997 10.16 33.75 430.78 158.231998 18.01 42.81 345.69 135.501999 14.83 32.73 287.90 111.822000 14.65 42.06 252.81 103.172001 13.38 41.91 223.67 92.992002 13.36 58.17 208.38 93.302003 13.07 53.22 225.19 97.162004 14.12 60.95 241.13 105.402005 16.89 77.25 309.26 134.47Total 13.45 44.05 303.17 120.22
While Brazilian utilities make up 61 percent of the bottom ten percentile, Comisión Federal de
Electricidad of Mexico spends the least on total expenditures with $11.26 per MWh followed by
Companhia Paulista de Força e Luz – Piratininga in Brazil with $11.70 per energy sold.
TOTEX per Energy Sold (MWh)
Country Name Mean 95-05Brazil AES SUL Distribuidora Gaúcha de Energia S/A 14.00Brazil Rio Grande Energia S/A 11.83Brazil Eletropaulo Metropolitana 16.52Brazil Elektro Eletricidade e Servicios S/A 18.44Brazil Bandeirante Energia S/A 17.35Brazil Companhia Energética de Alagoas 11.84Brazil Companhia Paulista de Força e Luz - Piratininga 11.70Brazil Empresa Luz e Força Santa Maria S/A 14.60Ecuador Empresa Eléctrica Quito S.A. 16.45Honduras Empresa Nacional de Energía Eléctrica 12.97Mexico Comisión Federal de Electricidad 11.26Paraguay Administración Nacional de Electricidad 15.77Paraguay Compañia Luz y Fuerza S.A. 15.32

- 33 -
3.5 PRICE: AVERAGE RESIDENTIAL AND INDUSTRIAL TARIFFS
Utilities in the top ten percent reported average residential tariffs of $144.69, double the $74.79
simple average of the middle 80 percent, and triple the simple average of the utilities in the bottom ten
percent. Despite the slight decrease in the average of the bottom ten percent, the middle 80 percent
increased the average tariff more than two-fold, at an annual rate of 9.9 percent. Finally, utilities in the top
ten percent increased their residential tariffs by 36.7 percent throughout the last ten years.
50
100
150
200
1995 2000 2005year
Bottom 10% Mean Top 10%
Source: LAC Electricity Benchmarking Database, The World Bank, 2007.
Average Residential Tariffs (dollars/MWh)
Average Residential Tariffs (dollars/MWh)
Year Bottom10%
Mean Top10%
Total
1995 55.56 44.46 127.79 75.941996 60.63 50.68 147.92 86.411997 54.51 80.51 147.11 94.041998 43.34 78.35 144.80 88.831999 49.20 65.77 131.44 82.142000 49.23 69.26 143.31 87.272001 48.11 73.04 139.92 87.022002 51.07 73.95 136.74 87.252003 46.90 76.68 146.58 90.052004 51.92 95.48 151.30 99.572005 52.97 114.49 174.75 114.07Total 51.22 74.79 144.69 90.24
C.A. Electricidad de Valencia, C.A. Electricidad de Venezuela, and C.A. Energía Eléctrica de
Barquisimeto provide their residential customers with the lowest tariffs amongst the utilities found in the
bottom ten percent.
Residential Tariffs in Dollars
Country Name Mean 95-05Bolivia Compañia Eléctrica de Sucre S.A. 55.96Colombia Empresas Públicas De Medellín E.S.P. 52.29Costa Rica Cooperativa de Electrificación Rural de San Carlos 52.44Costa Rica Empresa de Servicios Públicos de Heredia 49.55Costa Rica Junta Administradora de Servicios Eléctricos de Cartago 47.22Peru EdelNor 54.03Peru Luz del Sur 54.27Peru Electro Sur Medio S.A. 54.35Peru Electro Centro S.A. 54.93Peru Electro Nor Oeste S.A. 55.93Peru Electronorte Medio S.A.-Hidradina S.A. 54.35Paraguay Administración Nacional de Electricidad 55.07Venezuela Compañia Anónima de Administración y Fomento Eléctrico 48.71Venezuela C.A. Electricidad de Valencia 33.99Venezuela C.A. Energía Eléctrica de Venezuela 37.63Venezuela C.A. Energía Eléctrica de Barquisimeto 41.62 Assessing the change in the industrial tariff per MWh is partly accounting for the 54 percent
increase of the utilities in the middle 80 percent at an annual growth rate of 4.4 percent from 1995 to 2005.
Concurrently, the utilities in the bottom ten percent increased tariffs by 12 percent at an annual growth rate
of 1.1 percent. In contrast, the utilities forming the top decile report a 15 percent deduction in tariffs
ending in $118.92 in 2005. This amount however remains on average $54.91 more than that of the middle
group and $ 86.6 more that the utilities in the bottom ten percent.

- 34 -
40
60
80
100
120
140
1995 2000 2005year
Bottom 10% Mean Top 10%
Source: LAC Electricity Benchmarking Database, The World Bank, 2007.
Average Industrial Tariffs (dollars/MWh)
Average Industrial Tariffs (dollars/MWh)
Year Bottom10%
Mean Top10%
Total
1995 37.62 69.59 140.21 82.471996 41.57 66.99 133.80 80.791997 43.26 71.20 146.77 87.081998 41.99 62.16 138.71 80.951999 42.99 53.11 126.62 74.242000 42.78 56.54 129.50 76.272001 43.85 70.78 121.55 78.732002 38.21 71.68 114.02 74.632003 37.61 72.50 115.52 75.212004 39.44 98.26 118.46 85.392005 42.16 107.25 118.92 89.44Total 41.04 72.73 127.64 80.47
Venezuelan utilities once again lead the region with the lowest industrial tariffs followed by
Administración Nacional de Electricidad (ANDE) and Compania Luz y Fuerza S.A. (CLYFSA) of
Paraguay.
Industrial Tariffs
Country Name Mean 95-05Argentina Dirección Provincial de Energía de Corrientes 47.09Argentina Ente Provincial de Neuquén 41.22Paraguay Administración Nacional de Electricidad 36.25Paraguay Compañia Luz y Fuerza S.A. 36.54Uruguay Administración Nacional de Usinas y Transmisiones Eléctricas 43.77Venezuela La Electricidad de Caracas S.A. 42.03Venezuela C.A. Electricidad de Valencia 47.11Venezuela C.A. Luz y Fuerza de Puerto Cabello 24.31Venezuela C.A. Energía Eléctrica de Barquisimeto 28.40Venezuela C.V.G. Electrificación del Caroni C.A. Caracas 17.36
3.6 OPERATING PERFORMANCE
In regards to distributional losses, the situation for the middle 80 percent exhibits a cumulative
increase of 7.1 percent in ten years. The utilities in the top ten percent have experienced an upturn in
losses with a 27 percent increase, a 3.7 percent annual increase in loss since 1998. In contrast, utilities in
the bottom ten percent reduced their distributional losses by 21.7 percent since 1995, a 1.6 percentage
point decrease from their initial 7.3 percent in 1995.
0.1
.2.3
.4
1995 2000 2005year
Bottom 10% Mean Top 10%
Source: LAC Electricity Benchmarking Database, The World Bank, 2007.
% Distributional Losses
Distributional Losses
Year Mean Top10%
Total
1995 0.073 0.133 0.310 0.1721996 0.074 0.133 0.309 0.1721997 0.073 0.132 0.303 0.1691998 0.065 0.126 0.306 0.1661999 0.065 0.124 0.319 0.1692000 0.064 0.131 0.338 0.1782001 0.058 0.141 0.347 0.1822002 0.060 0.146 0.356 0.1872003 0.060 0.148 0.371 0.1932004 0.055 0.145 0.379 0.1932005 0.057 0.143 0.395 0.199Total 0.064 0.136 0.339 0.180
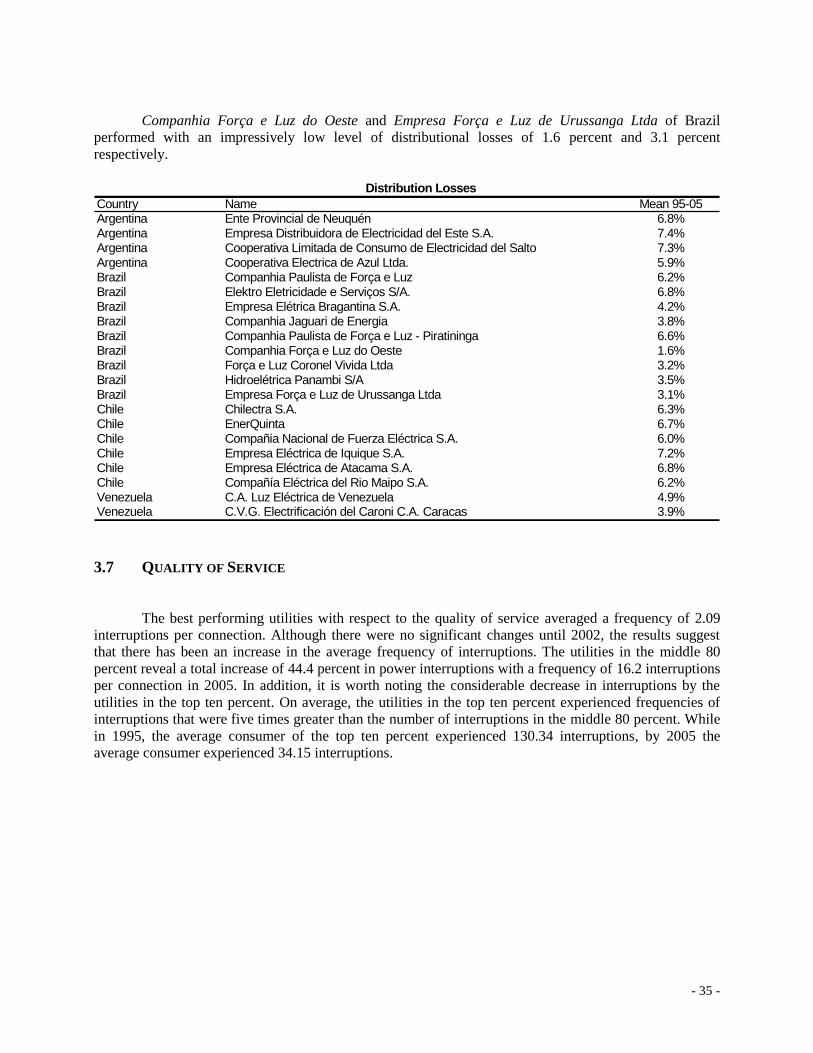
- 35 -
Companhia Força e Luz do Oeste and Empresa Força e Luz de Urussanga Ltda of Brazil
performed with an impressively low level of distributional losses of 1.6 percent and 3.1 percent
respectively.
Distribution Losses
Country Name Mean 95-05Argentina Ente Provincial de Neuquén 6.8%Argentina Empresa Distribuidora de Electricidad del Este S.A. 7.4%Argentina Cooperativa Limitada de Consumo de Electricidad del Salto 7.3%Argentina Cooperativa Electrica de Azul Ltda. 5.9%Brazil Companhia Paulista de Força e Luz 6.2%Brazil Elektro Eletricidade e Serviços S/A. 6.8%Brazil Empresa Elétrica Bragantina S.A. 4.2%Brazil Companhia Jaguari de Energia 3.8%Brazil Companhia Paulista de Força e Luz - Piratininga 6.6%Brazil Companhia Força e Luz do Oeste 1.6%Brazil Força e Luz Coronel Vivida Ltda 3.2%Brazil Hidroelétrica Panambi S/A 3.5%Brazil Empresa Força e Luz de Urussanga Ltda 3.1%Chile Chilectra S.A. 6.3%Chile EnerQuinta 6.7%Chile Compañia Nacional de Fuerza Eléctrica S.A. 6.0%Chile Empresa Eléctrica de Iquique S.A. 7.2%Chile Empresa Eléctrica de Atacama S.A. 6.8%Chile Compañía Eléctrica del Rio Maipo S.A. 6.2%Venezuela C.A. Luz Eléctrica de Venezuela 4.9%Venezuela C.V.G. Electrificación del Caroni C.A. Caracas 3.9%
3.7 QUALITY OF SERVICE
The best performing utilities with respect to the quality of service averaged a frequency of 2.09
interruptions per connection. Although there were no significant changes until 2002, the results suggest
that there has been an increase in the average frequency of interruptions. The utilities in the middle 80
percent reveal a total increase of 44.4 percent in power interruptions with a frequency of 16.2 interruptions
per connection in 2005. In addition, it is worth noting the considerable decrease in interruptions by the
utilities in the top ten percent. On average, the utilities in the top ten percent experienced frequencies of
interruptions that were five times greater than the number of interruptions in the middle 80 percent. While
in 1995, the average consumer of the top ten percent experienced 130.34 interruptions, by 2005 the
average consumer experienced 34.15 interruptions.

- 36 -
050
100
150
1995 2000 2005year
Bottom 10% Mean Top 10%
Source: LAC Electricity Benchmarking Database, The World Bank, 2007.
Avg Frequency of Interruptions per Connection (#/yr)
Frequency of Interruptions per Connection
Year Bottom10%
Mean Top10%
Total
1995 1.67 11.24 130.34 47.751996 1.82 11.52 102.41 38.581997 1.60 11.85 86.31 33.251998 1.72 11.78 84.06 32.521999 1.81 12.84 70.13 28.262000 1.67 11.54 62.55 25.252001 1.45 12.79 50.89 21.712002 1.51 12.41 45.02 19.642003 3.14 12.50 37.72 17.792004 2.61 14.68 35.99 17.762005 4.02 16.24 34.15 18.14Total 2.09 12.67 67.23 27.33
Empresa Eléctrica Esmeraldas S.A. of Ecuador provides the best quality of service in the region
with an average of 0.96 interruptions per connection. Luz Linares S.A. of Chile is the second best
performer with 1 interruption per connection.
Frequency of Interruptions
Country Name Mean 95-05Argentina Empresa Distribuidora Sur S.A. 2.76Bolivia Electricidad De La Paz S.A. 3.13Chile Luz Linares S.A. 1.00Ecuador Empresa Eléctrica Manabí S.A. 3.52Ecuador Empresa Eléctrica Quito S.A. 2.89Ecuador Empresa Eléctrica Santo Domingo S.A. 3.79Ecuador Empresa Eléctrica Regional Sur S.A. 2.42Ecuador Empresa Eléctrica Bolivar S.A. 2.95Ecuador Empresa Eléctrica Regional Centro Sur S.A. 2.37Ecuador Empresa Eléctrica Esmeraldas S.A. 0.96Mexico Comisión Federal de Electricidad 2.99Venezuela La Electricidad de Caracas S.A. 3.47
The average duration of interruptions for the utilities in the middle 80 percent was 13.9 hours per
connection. This group had 3.6 fewer hours of interruptions than in 1995, a drop of 23.5 percent. The
utilities in the bottom ten percent reported an average of 2.2 hours of interruption, one-sixth of the simple
average for the middle 80 percent. The simple average for utilities in the top ten percent was 95.4 hours,
6.8 times more than the power outages experienced by the customers represented in the middle 80 percent
utilities. Despite the long duration times in comparison to the simple average, utilities in the top decile
made significant progress throughout the decade and reduced duration time by 71.3 hours.
050
100
150
1995 2000 2005year
Bottom 10% Mean Top 10%
Source: LAC Electricity Benchmarking Database, The World Bank, 2007.
Avg Duration of Interruptions per Connection (#/yr)
Duration of Interruptions per Connection
Year Bottom10%
Mean Top10%
Total
1995 n.a. 15.1 134.6 74.81996 n.a. 16.1 130.2 73.21997 n.a. 15.8 115.4 65.61998 1.6 15.3 139.7 52.21999 1.8 15.5 107.1 41.42000 1.9 13.3 88.5 34.62001 2.0 12.8 76.9 30.62002 2.6 13.9 70.3 28.92003 2.6 12.1 63.1 25.92004 2.0 11.6 59.8 24.52005 2.8 11.5 63.3 25.9Total 2.2 13.9 95.4 40.6

- 37 -
The best utility performer when measuring the duration time of interruptions was Empresas
Públicas De Medellín E.S.P. in Colombia with 0.54 hours of interruptions per consumer. Empresa
Antioqueña de Energía S.A. E.S.P in Colombia exhibits the second lowest duration time of .94 hours per
connection.
Average Duration of Interruptions per Connection
Country Name Mean 95-05Bolivia Electricidad De La Paz S.A. 3.17Bolivia Empresa de Luz y Fuerza Eléctrica Oruro S.A. 3.58Chile Luz Linares S.A. 2.67Colombia Empresa Antioqueña de Energía S.A. E.S.P 0.94Colombia Electrificadora de Santander (Bucaramanga) 3.58Colombia Empresas Municipales De Cali Eice 1.55Colombia Empresas Públicas De Medellín E.S.P. 0.54Colombia Electrificadora del Huila S.A. ESP 1.45Costa Rica Empresa de Servicios Públicos de Heredia 2.38Ecuador Empresa Eléctrica Manabí S.A. 2.76Ecuador Empresa Eléctrica Quito S.A. 2.21Ecuador Empresa Eléctrica Regional Sur S.A. 1.76Ecuador Empresa Eléctrica Regional Centro Sur S.A. 2.53Mexico Luz y Fuerza del Centro 2.49Mexico Comision Federal de Electricidad 3.46Peru Electro Puno S.A.A. 1.43Peru Electro Sur Este SA 3.41Peru Sociedad Eléctrica del Sur Oeste S.A. 2.16
3.8 CONCLUSION
While assessing the performance of the distribution utilities presented in this study, we have
encountered significant discrepancies amongst utilities. For instance, in 2005, utilities in the top ten
percentile were ten times more productive and sold six times the amount of energy (per connection) of
utilities in the bottom ten percent. The best performing utilities had less than four interruptions per year
and less than 4 hours of duration of the utilities represented in the bottom ten percent. In the same vein, the
bottom decile utilities had one fifth of the distributional losses that characterized the underperforming
utilities.
A second but equally important message is the overall improvement of the underperforming
utilities during the last ten years. As attested by the time trends, the utilities in the bottom ten percent
improved significantly in coverage from an initial 40 percent electrification in 1995 to 61 percent
electrification in 2005. Similar improvements were observed in the frequency and duration of interruptions
especially by the underperforming utilities. The evolution of the level of labor productivity illustrates the
progress of the poorer performers with a three-fold improvement in the last ten years.
Third, there were cases with significant deterioration in performance reflected in indicators such
as the average tariffs and distributional losses. While the residential tariff increased from $44.4 in 1995 to
$114.4 in 2005 for the middle 80 percent, the top ten percent increased their residential tariffs by 36.7
percent compared to the initial $127 per MWh sold in 1995. With respect to distributional losses, while the
middle 80 percent did not exhibit a significant change during the decade, the underperforming ten percent
showed a 27 percent increase in distribution losses.

- 38 -
Chronicling the story of the best performing distribution utilities during the last decade is a story
of universal electrification and significant improvements of the utilities represented in the middle 80
percent. Electrification increased by almost 15 percentage points for the middle 80 percent and 20
percentage points for the bottom ten percent attaining 88 percent and 61 percent coverage in 2005
respectively.
Finally, the chapter also identifies the utilities that set the standard of good performance for each
indicator. Although there are some variations within and between countries, in general, several companies
in Brazil lead with best performance in terms of labor productivity, distributional losses, OPEX, and
coverage. In addition, Costa Rica benchmarks good performance in coverage, OPEX, and tariffs. Finally,
several utilities in Chile produced leaders for indicators measuring labor productivity and technical
efficiency.

- 39 -
4. AN ASSESSMENT OF THE DISTRIBUTION OF PRIVATE AND
PUBLIC UTILITIES 8
Private sector participation has been a major component in shaping electricity trends in the region
over the last ten years. Private participation has grown substantially since 1990, and especially between
1995-1998. While in 1990 there was little significant participation of the private sector in electricity
distribution, by 1995, 11.1 percent of electricity connections in the region were served by the private
sector. By the end of our period of analysis, 60 percent of electricity connections in our database were
supplied by private utilities. According to the Private Participation in Infrastructure (PPI) Project
Database, during the last 15 years, US$ 102.6 billion was the total investment9 made in 384 private
electricity projects in LCR of which one third corresponded to distribution. Most Latin American countries
have introduced private participation in electricity as part of broader reforms attempting to establish a
more competitive market structure. Considering the major impact of private participation on electricity
development, we have dedicated this chapter to provide a comparative analysis of private and public
distribution utilities.
Private sector participation in Electricity Distribution in LAC (as a % of the total number
of connections):
A) 1995: 11 % B) 2005: 60 %
8 In our sample (250 cases), there are a few utilities in Peru (4) and the Dominican Republic (2) in which privatized
electricity distribution utilities have recently reverted to public sector ownership. It worth noting that the change in
ownership in these cases has not impacted the overall results we have drawn from our benchmarking analysis. While
we are accounting for this change, it has not shown to have a significant immediate affect on our Private and Public
Comparison results. Considering the small size of this sub-sample, we have included them in our privatized after
1995 utilities group since they do not establish a trend by themselves nor alter our results.
9 This includes investments in facilities as resources the project company commits to invest in expanding and
modernizing facilities, and investment in government assets.

- 40 -
This chapter benchmarks electricity distribution in Latin America and the Caribbean region and
depicts the progress made by both public and private utilities. The objective is to present the results
describing electricity activity in the last ten years. At this stage, the report does not attempt to explain the
existing facts nor draw any conclusions. While the previous chapters of this report indicate major
improvements in coverage and quality at the regional, country, and utility-levels, this chapter provides
insight on utility performance based on the means of ownership. The following results are based on the
simple average across the 250 utilities measured according to the 26 indicators used in the methodology
implemented for this benchmarking study. The utilities presented in this chapter fall into the following
three categories: public utilities throughout the period of 1995-2005, utilities that privatized before
1995 and remained private throughout 2005, and utilities that privatized after 1995 and remained private
throughout 2005. In order to most accurately assess and compare the performance of public and private
distribution utilities, we considered the initial conditions in 1995 as well as the overall trend of the last ten
years. Finally, we present the variance of change and improvement of the studied indicators. For this
comparison, we report the average top ten, bottom ten, and middle eighty percent public and private
utilities.
4.1 MAIN FINDINGS
The main findings of this chapter attest to the considerable improvement in the performance of the
electricity sector. The following results show the public and/or private utilities that benchmark good
performance for each respective indicator.
o When comparing the performance of private and public utilities, the main differences in
performance are marked by: labor productivity, distribution losses, quality of service, and tariffs.

- 41 -
In contrast, other indicators such as coverage and operation expenditures exhibit similar trends
and/or do not present significant changes between the groups.
o On average, private utilities performed better than public utilities with clear differences after
the change in ownership. Significant improvements in labor productivity are a distinguishing
factor when assessing the performance of the sector. When measuring the number of connections
per employee in 1995, the labor productivity of post-1995 privatized utilities was only 10.7
percent greater that that of public utilities. Yet by the end of the decade, the labor productivity of
post 1995 privatizations increased three-fold and doubled the amount of public utilities. Another
indicator exhibiting significant improvement after the change in ownership is that of distribution
losses. In 1995, public and post-1995 utilities experienced on average 17.9 and 15.3 distributional
losses. However whereas private utilities by 2005 reduced distribution losses by 12.6 percent,
public utilities resulted with a 4.9 percent increase.
o More remarkable are the cases in which public utilities and post 1995 utilities experienced
similar initial conditions in 1995, yet after the change in ownership diverged in their
performance. One such instance is noted when assessing the quality of service. In 1995, public
utilities experienced on average a frequency of 22 interruptions per connection, 5 interruptions
less than that of private utilities. However by the end of the decade, public utilities reduced the
average frequency of interruptions by 4 (interruptions), a modest improvement considering that
private utilities cut their average frequency of interruptions by half. Moreover, this
contradistinction is more evident when comparing the average duration time of private and public
utilities. Whereas public and private utilities were separated by one hour duration in 1995, by the
end of 2005, public utilities exhibit a 48.8 percent increase in the average duration per connection,
while private utilities improved the quality of service by reducing the average duration per
connection by 28.2 percent.
o There are good public and private utilities and underperforming private and public utilities. For
several indicators the top 10 percent public utilities performed better than the average private
utilities and in other cases the bottom 10 percent of the private utilities performed worse than the
average public utilities. In the case of distribution losses, it is noteworthy that the public utilities in
the bottom 10 percent perform better than the average private utilities. Likewise the private
utilities forming the top decile experience more distribution losses than the average public
utilities.
4.2 COVERAGE AND OUTPUT
There has been significant progress made in the last ten years by both public and private utilities
to expand electricity coverage. Starting with 69 percent coverage in 1995, public utilities increased at an
annual rate of 1.7 percent to reach 81 percent coverage by 2005. Similarly, utilities that privatized after
1995 started around the same range with 71 percent coverage in 1995 and increased at an annul rate of two
percent to reach 87 percent coverage by the end of 2005. While utilities that privatized before 1995
experienced a smaller annual growth rate of 0.9 percent, these utilities experienced an 8.2 percentage point
increase during the last ten years covering 92.3 of electricity connections by 2005. Despite the fact that
public utilities and post 1995 privatized utilities started in the same range, with only a 2.7 percentage point
difference, post 1995 privatized utilities ended with 6.1 percentage points higher in coverage than public
utilities by the end of 2005 and 4.9 percentage points lower than utilities privatized prior to 1995.

- 42 -
.7.7
5.8
.85
.9
1995 2000 2005year
Public Utilities Private Utilities
Source: LAC Electricity Benchmarking Database, The World Bank, 2007.
Electricity Coverage
.7.7
5.8
.85
.9.9
5
1995 2000 2005year
Public Utilities Privatized after '95 Privatized before '95
Source: LAC Electricity Benchmarking Database, The World Bank, 2007.
Electricity Coverage
Assessing output in terms of the amount of energy sold per connection per year is a multifaceted
measurement dependent on demand. On average, consumption per connection for public utilities was at
3.7 MWh per year while for private utilities it was 4.4 MWh, 14.1 percent higher. Pre 95 privatized
utilities depict a 16.5 percent increase in consumption and an annual growth rate of 1.5 percent. When
assessing this increase according to the utilities privatized after 1995, the post-1995 privatized utilities
experienced a 10.3 percent increase from 4.1 MWhs sold per connection in 1995 to 4.5 in 2005.
Concurrently, those utilities that privatized before 1995 exceeded the annual growth rate of the post 1995
privatized utilities. Perhaps the most striking improvement is the increase in consumption of privatized
utilities when compared to that of public utilities. In 1995, both public and pre 1995 privatized utilities
experienced similar amounts of energy sold, respectively 3.7 MWhs per connection for public utilities and
3.8 MWhs for privatized utilities. However, throughout the decade, pre 1995 privatizations contributed to
this gap with a total of 0.63 MWh more per connection than that of public utilities by the end of 2005.
3.6
3.8
44.2
4.4
4.6
1995 2000 2005year
Public Utilities Private Utilities
Source: LAC Electricity Benchmarking Database, The World Bank, 2007.
Energy Sold per Connection per year (MWh)
3.6
3.8
44.2
4.4
4.6
1995 2000 2005year
Public Utilities Privatized after '95 Privatized before '95
Source: LAC Electricity Benchmarking Database, The World Bank, 2007.
Energy Sold per Connection per year (MWh)
4.3 LABOR PRODUCTIVITY
When measuring the number of residential connections per employee, there is once again a major
increase in the labor productivity of private utilities creating a stark contrast with the productivity levels of
public utilities. In 1995, the labor productivity of public utilities was measured at 223 residential
connections per employee, while that of post 1995 privatizations was only 27 connections higher.
However, by the end of the decade, the labor productivity of post 1995 privatizations increased three-fold
and doubled that of public utilities. In 2005, not only did post 1995 privatizations exceed public utilities by

- 43 -
357 connections per employee, but post 1995 privatizations overtook pre 1995 privatizations by 193
connections, growing steadily until 684 residential connections per employee. Post 1995 privatizations
grew at an impressive annual rate of 10.6 percent and almost tripled during the last decade.
200
300
400
500
600
1995 2000 2005year
Public Utilities Private Utilities
Source: LAC Electricity Benchmarking Database, The World Bank, 2007.
Residential Connections per Employee
200
300
400
500
600
700
1995 2000 2005year
Public Utilities Privatized after '95 Privatized before '95
Source: LAC Electricity Benchmarking Database, The World Bank, 2007.
Residential Connections per Employee
Labor productivity measured as the energy (MWh) sold per employee exhibits a significant
increase for private utilities in contrast to the slight change in public utilities. A closer look at the
evolution of labor productivity shows a 112 percent increase in pre 1995 privatizations at an annual
growth rate of 7.8 percent, and a 192 percent increase in post 1995 privatizations. Unlike the increasing
trend of private utilities, public utilities grew at a lower annual rate of 4.2 percent resulting with 1447
MWhs of energy sold per employee. A noteworthy observation is that both public utilities and post 1995
privatizations displayed approximately the same level of labor productivity in 1995, respectively 961
MWhs by public utilities and 1061 MWhs by post 1995 privatizations. Post 1995 privatized utilities
tripled their labor productivity to 3099 MWhs of energy sold per employee, and public utilities increased
by only 50.5 percent to result in 1447 MWhs in 2005. The labor productivity of post 1995 privatizations
more than doubled that of public during the last ten years.
1000
1500
2000
2500
3000
1995 2000 2005year
Public Utilities Private Utilities
Source: LAC Electricity Benchmarking Database, The World Bank, 2007.
Energy Sold per employee (MWh)
1000
1500
2000
2500
3000
1995 2000 2005year
Public Utilities Privatized after '95 Privatized before '95
Source: LAC Electricity Benchmarking Database, The World Bank, 2007.
Energy Sold per employee (MWh)
4.4 INPUT INDICATORS
When measuring the operation expenditures per connection (in dollars), private utilities decreased
expenditures by 30.1 percent spending on average $237 per connection in 2005. On the other hand, public
utilities experienced a 34 percent increase resulting with $272 per connection in 2005, surpassing the
amount it spend on OPEX per connection in 1995. When assessing OPEX per connection as disaggregated

- 44 -
values of private utilities, the pre 1995 utilities spent 1.5 times more than post 1995 privatized utilities
during the last 10 years. Post 1995 privatized utilities started with operation expenditures of $298 per
connection in 1995, but decreased this amount by 46.7 percent and charged $158 per connection by the
end of 2005. When attempting to assess these values and the discrepancies within and between private and
public utilities, it is important to note that higher or lower operation expenditures are not necessarily
better. These values are dependent upon the results of other indicators such as efficiency.
150
200
250
300
350
1995 2000 2005year
Public Utilities Private Utilities
Source: LAC Electricity Benchmarking Database, The World Bank, 2007.
OPEX per Connection (in dollars)
100
150
200
250
300
350
1995 2000 2005year
Public Utilities Privatized after '95 Privatized before '95
Source: LAC Electricity Benchmarking Database, The World Bank, 2007.
OPEX per Connection (in dollars)
With respect to operation expenditures per MWh sold (in dollars), public utilities do not depict a
trend in OPEX values throughout the last decade. Operation expenditures dropped by $11.6 per MWh sold
between 1997 and 2001, only to gradually increase by $38 per energy sold by 2005. While operation
expenses for private companies exhibit a more gradual decrease throughout the decade, by 2005 public
utilities experience a significant increase. By the end of 2005, pre 1995 privatizations and public utilities
spent approximately the same amount on operations, $90 and $97 respectively. On the contrary, post 1995
privatizations spent on average $36 less per MWh than public utilities and $44 less than pre-1995
privatized utilities during the last decade.
40
60
80
100
1995 2000 2005year
Public Utilities Private Utilities
Source: LAC Electricity Benchmarking Database, The World Bank, 2007.
OPEX per MWh sold (in dollars)
20
40
60
80
100
1995 2000 2005year
Public Utilities Privatized after '95 Privatized before '95
Source: LAC Electricity Benchmarking Database, The World Bank, 2007.
OPEX per MWh sold (in dollars)
4.5 PRICES: RESIDENTIAL AND INDUSTRIAL TARIFFS
Depicting the average tariffs of public and private utilities in Latin America and the Caribbean is
telling a story about initial conditions and overall trends during the last ten years. Average residential
tariffs increased by 50.8 percent in public utilities, 58.3 percent in the post 1995 privatizations, and 32.9
percent in pre 1995 privatizations. It is noteworthy that despite the fact that public utilities in 1995 charged

- 45 -
on average $12.9 less per MWh than private utilities, throughout the decade, public utilities increased
tariffs by 50.8 percent while private utilities increased tariffs by 42.6 percent, resulting in a $13.14
difference in 2005.
Post 1995 privatized utilities exhibit the greatest increase in residential tariffs and the highest
annual growth rate of 4.7 percent. Utilities that privatized after 1995 charged the highest residential tariffs
in 2005 averaging at $122 per MWh. This amount is $44.8 greater than the initial charge, $25 more than
public utilities and $20 more than pre 1995 privatized utilities.
60
70
80
90
100
110
1995 2000 2005year
Public Utilities Private Utilities
Source: LAC Electricity Benchmarking Database, The World Bank, 2007.
Average Residential Tariffs (dollars/MWh)
60
80
100
120
1995 2000 2005year
Public Utilities Privatized after '95 Privatized before '95
Source: LAC Electricity Benchmarking Database, The World Bank, 2007.
Average Residential Tariffs (dollars/MWh)
The average industrial tariffs per MWh charged by public utilities in 1995 was $77.3, $5.1 less
than the price charged by private utilities. However, by 2005, the average public industrial tariffs reached
$90.6, a 17.2 percent increase compared to the modest 4.5 percent increase exhibited by private utilities. A
closer look at the disaggregation of the charges by utilities privatized pre and post 1995 recounts a story of
gradual increases and decreases throughout the last 10 years. When considering the industrial charges
administered by pre 1995 utilities, there was a significant drop for the first part of the decade driven by the
Brazilian utilities that underwent devaluation, followed by a gradual increase in the last 5 years. Utilities
that privatized after 1995 increased tariffs by 19.4 percent at an annual growth rate of 1.8 percent. Albeit
this increment, by the end of 2005, post 1995 utilities charged only $1.1 more than public utilities.
60
70
80
90
1995 2000 2005year
Public Utilities Private Utilities
Source: LAC Electricity Benchmarking Database, The World Bank, 2007.
Average Industrial Tariffs (dollars/MWh)
60
70
80
90
100
110
1995 2000 2005year
Public Utilities Privatized after '95 Privatized before '95
Source: LAC Electricity Benchmarking Database, The World Bank, 2007.
Average Industrial Tariffs (dollars/MWh)
4.6 OPERATING PERFORMANCE
When measuring distribution losses, there have been visible improvements for private and

- 46 -
privatized utilities. In 1995, private utilities experienced 16 percent distribution losses which decreased to
14 percent by 2005. Post 1995 privatized utilities followed a similar pattern reducing distribution losses by
0.8 percentage points, from 16.5 percent in 1995 to 15.7 percent in 2005. Pre 1995 privatized utilities
experienced a 2.7 percentage point drop from 13.8 percent in 1995 to 11.1 percent in 2005. On the
contrary, public utilities increased their distributional losses by 4.9 percentage points from 17.3 in 1995 to
18.2 in 2005. It is worth noting that despite the fact that public and post 1995 privatized utilities started in
the same range of 17.3 percent and 16.5 percent (a 0.8 percentage point difference) respectively in 1995,
there was a 2.5 percentage point difference between the two utility types by the end of 2005. Finally, the
utilities privatized before 1995 experienced a greater improvement in operating performance than the other
two groups during the last decade. Post 1995 utilities decreased distribution losses by 4.9 percent during
the last ten years. Based on these results, private utilities have significantly exceeded public utilities in
decreasing and maintaining low levels of distribution losses.
.12
.14
.16
.18
.2
1995 2000 2005year
Public Utilities Private Utilities
Source: LAC Electricity Benchmarking Database, The World Bank, 2007.
% Distributional Losses
.1.1
2.1
4.1
6.1
8.2
1995 2000 2005year
Public Utilities Privatized after '95 Privatized before '95
Source: LAC Electricity Benchmarking Database, The World Bank, 2007.
% Distributional Losses
4.7 QUALITY OF SERVICE
When benchmarking the quality of service for public and private electricity distribution utilities, it
is worth noting that most public and private utilities have only recently started to collect and disclose data
indicating the frequency and duration of interruptions. In light of this, it is important to understand the
following results as indicators not only of the quality of service but also of the quality of measurement.
Based on the data collected in our sample, the average frequency of interruptions per connection per year
dropped from 12.9 times per connection in 1995 to 8.9 times in 2005 for pre 1995 privatized utilities
whereas interruptions increased from 15.2 to 20 in post 1995 privatized utilities. Public utilities, which in
1995 exhibited 23.2 interruptions per connection, reduced the frequency of interruptions to 18.9
interruptions at an annual rate of 2.0 percent. Both pre 1995 privatized utilities and public utilities
managed to reduce the average frequency of interruptions by 4 interruptions per connection, while post-
1995 private utilities lag behind in improving the quality of service.

- 47 -
10
15
20
25
1995 2000 2005year
Public Utilities Private Utilities
Source: LAC Electricity Benchmarking Database, The World Bank, 2007.
Avg Frequency of Interruptions per Connection (#/yr)
510
15
20
25
1995 2000 2005year
Public Utilities Privatized after '95 Privatized before '95
Source: LAC Electricity Benchmarking Database, The World Bank, 2007.
Avg Frequency of Interruptions per Connection (#/yr)
With regards to the average duration of interruptions per connection the results exhibit a slight
decrease in the average duration of interruptions per connection for private utilities yet a significant
increase in duration time of public utilities. In 1995, the average duration time for public utilities was 21
hours per connection compared to the 31 hour duration per connection in 2005. Unlike the increase in
duration time for public utilities, the aggregated result for private utilities demonstrate a gradual decrease
throughout most of the decade with the exception of the last year. Utilities that privatized after 1995,
show a 35 percent total increase in duration time resulting with 24 hour durations. The best performers
when measuring the quality of service are the utilities privatized before 1995 with a 34 percent reduction
in the last decade and low 12 hour durations by 2005.
15
20
25
30
35
40
1995 2000 2005year
Public Utilities Private Utilities
Source: LAC Electricity Benchmarking Database, The World Bank, 2007.
Avg Duration of Interruptions per Connection (#/yr)
10
20
30
40
1995 2000 2005year
Public Utilities Privatized after '95 Privatized before '95
Source: LAC Electricity Benchmarking Database, The World Bank, 2007.
Avg Duration of Interruptions per Connection (#/yr)
4.8 TOP TEN AND BOTTOM TEN PERCENT PERFORMERS
The following section serves as a supplementary comparative analysis of the top ten and bottom
ten percent public and private distribution utilities. The main message is that, although private utilities
performed better than public utilities with clear differences after the change in ownership, there are cases
in which the top 10 percent public utilities outperformed the average private utilities and the bottom 10
percent private utilities performed poorer than the average public utilities. The following indicators were
selected because they exhibit significant change and improvement that may be less perceptible in the
previous comparisons. For the results of the remaining indicators, please see Annex 5.
Output
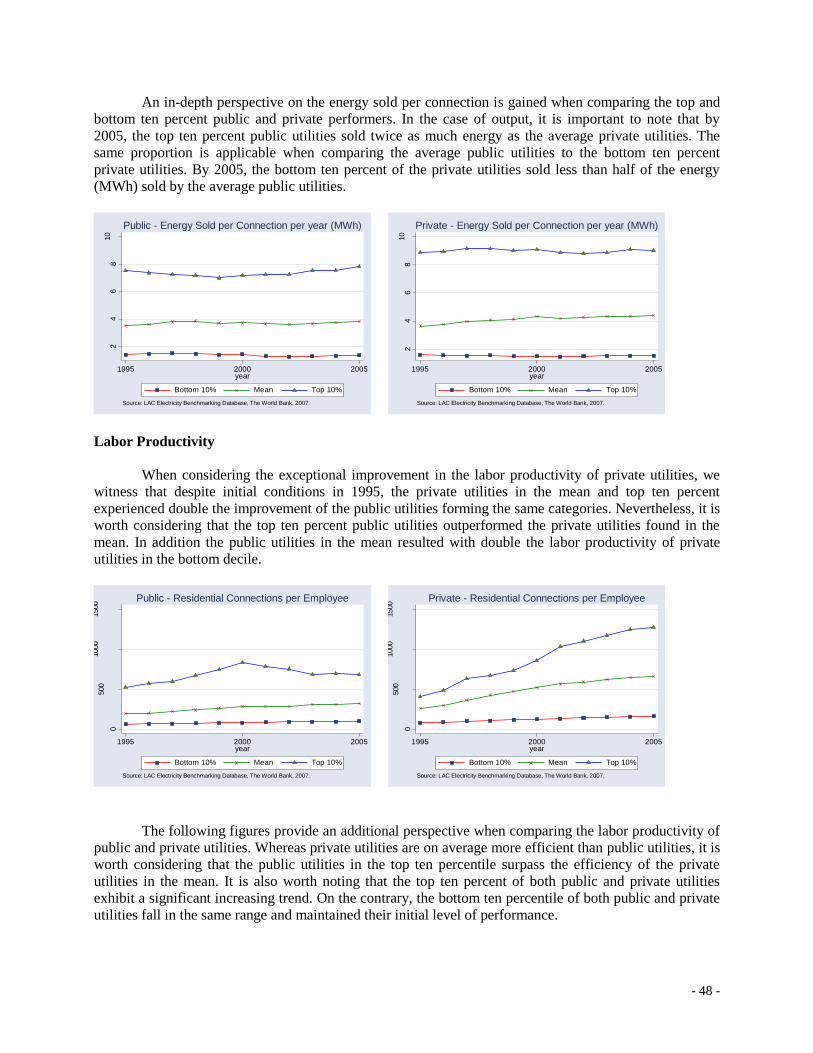
- 48 -
An in-depth perspective on the energy sold per connection is gained when comparing the top and
bottom ten percent public and private performers. In the case of output, it is important to note that by
2005, the top ten percent public utilities sold twice as much energy as the average private utilities. The
same proportion is applicable when comparing the average public utilities to the bottom ten percent
private utilities. By 2005, the bottom ten percent of the private utilities sold less than half of the energy
(MWh) sold by the average public utilities.
24
68
10
1995 2000 2005year
Bottom 10% Mean Top 10%
Source: LAC Electricity Benchmarking Database, The World Bank, 2007.
Public - Energy Sold per Connection per year (MWh)
2
46
810
1995 2000 2005year
Bottom 10% Mean Top 10%
Source: LAC Electricity Benchmarking Database, The World Bank, 2007.
Private - Energy Sold per Connection per year (MWh)
Labor Productivity
When considering the exceptional improvement in the labor productivity of private utilities, we
witness that despite initial conditions in 1995, the private utilities in the mean and top ten percent
experienced double the improvement of the public utilities forming the same categories. Nevertheless, it is
worth considering that the top ten percent public utilities outperformed the private utilities found in the
mean. In addition the public utilities in the mean resulted with double the labor productivity of private
utilities in the bottom decile.
0
500
1000
1500
1995 2000 2005year
Bottom 10% Mean Top 10%
Source: LAC Electricity Benchmarking Database, The World Bank, 2007.
Public - Residential Connections per Employee
0
500
1000
1500
1995 2000 2005year
Bottom 10% Mean Top 10%
Source: LAC Electricity Benchmarking Database, The World Bank, 2007.
Private - Residential Connections per Employee
The following figures provide an additional perspective when comparing the labor productivity of
public and private utilities. Whereas private utilities are on average more efficient than public utilities, it is
worth considering that the public utilities in the top ten percentile surpass the efficiency of the private
utilities in the mean. It is also worth noting that the top ten percent of both public and private utilities
exhibit a significant increasing trend. On the contrary, the bottom ten percentile of both public and private
utilities fall in the same range and maintained their initial level of performance.

- 49 -
0
2000
4000
6000
1995 2000 2005year
Bottom 10% Mean Top 10%
Source: LAC Electricity Benchmarking Database, The World Bank, 2007.
Public - Energy Sold per employee (MWh)
0
2000
4000
6000
1995 2000 2005year
Bottom 10% Mean Top 10%
Source: LAC Electricity Benchmarking Database, The World Bank, 2007.
Private - Energy Sold per employee (MWh)
Operating Performance
Another dimension to consider when assessing the operating performance of distribution utilities
is the performance of the utilities in the decile that benchmarks good performance. In the case of
distribution losses, it is noteworthy that the public utilities in the bottom 10 percent perform better than the
average private utilities. Likewise the private utilities forming the top decile experience more distribution
losses than the average public utilities.
.1.2
.3.4
.5
1995 2000 2005year
Bottom 10% Mean Top 10%
Source: LAC Electricity Benchmarking Database, The World Bank, 2007.
Public - % Distributional Losses
.1.2
.3.4
.5
1995 2000 2005year
Bottom 10% Mean Top 10%
Source: LAC Electricity Benchmarking Database, The World Bank, 2007.
Private - % Distributional Losses
Quality of Service
Despite similar initial conditions, by 2005 there is a significant gap between the average frequency
of interruptions characterizing private and public utilities. However, when comparing the top ten percent
public and private performers, both utility types result in close proximity. Moreso, the extraordinary
reduction in the average frequency of interruptions per connection attest to the improved quality of service
for the top ten percent public utilities. A similar trend is noticeable when measuring the average duration
of interruptions per connection. Please see Annex 5 for a detailed representation.

- 50 -
050
100
150
200
250
1995 2000 2005year
Bottom 10% Mean Top 10%
Source: LAC Electricity Benchmarking Database, The World Bank, 2007.
Public - Avg Frequency of Interruptions per Connection (#/yr)
050
100
150
200
250
1995 2000 2005year
Bottom 10% Mean Top 10%
Source: LAC Electricity Benchmarking Database, The World Bank, 2007.
Private - Avg Frequency of Interruptions per Connection (#/yr)
4.9 CONCLUSIONS
The results presented in this chapter indicate that on average, private utilities performed better
than public utilities with clear differences after the change in ownership. While there have been modest
improvements by public utilities, on average, private utilities surpassed the performance (improvement) of
public utilities as is evident by indicators measuring labor productivity, distribution losses, quality of
service and tariffs.
A key message is that despite the fact that private and public utilities experienced similar initial
conditions in 1995, by the end of the decade, the two groups diverged in performance. For instance, when
measuring distributional losses, private and public utilities were separated by a 1.4 percentage point gap in
1995, yet by the end of 2005, there was a 4.2 percentage point difference between the two utility types.
With respect to labor productivity, in 1995, public utilities resulted with 10.7 percent less residential
connections per employee than that of post 1995 privatized utilities, yet by the end of 2005, the labor
productivity of post-1995 privatized utilities almost tripled its initial amount, and doubled the amount of
the labor productivity of public utilities, which totaled 326 connections per employee in 2005, a 4.5
percent increase over the last decade.
A final notable message is that for the indicators measuring output, labor productivity and
operating performance, the top 10 percent public utilities outperformed the average private utilities and the
bottom 10 percent private utilities performed poorer than the average public utilities.

- 51 -
CONCLUSIONS
Latin American and Caribbean countries have made significant efforts in improving infrastructure,
the backbone of economic activity, and the channel of social integration. Significant progress has been
noted in the electricity sector during the last 10 years and describing this process is one of the objectives of
this report. A key initiative for both public and private owned distribution utilities has been to upgrade
their efficiency as well as to increase the coverage and quality of service. In order to accomplish this goal,
this report serves as a clearing house for information regarding the regional, country, and utility level
performance of the electricity distribution sector. By providing multiple perspectives of the performance
of distribution utilities, this initiative allows countries and utilities to benchmark their performance in
relation to other comparator utilities and countries in light of the regional average. In doing so, this
benchmarking study contributes to the improvement of the electricity sector by filling in knowledge gaps
for the identification of the best performers of the region.
In producing a benchmarking analysis, the report collected detailed information of 26
countries and 250 utilities in the region. An analytical framework was designed to produce a
comprehensive description of the sector as well as a mechanism for ranking countries and utilities for best
performance. The data collected for this benchmarking project is representative of 88 percent of the
electrification in the region. By serving as a mirror of good performance, the report allows for a
comparative analysis and the ranking of utilities and countries according to the indicators used to measure
performance. Through in-house and field data collection, consultants compiled data to tell various stories
about the distribution sector based on accomplishments in output, coverage, labor productivity, input,
operating performance, the quality of service, and prices. Based on the results of these performance
indicators, the report benchmarks the performance of electricity distribution at the regional, country, and
utility-level.
The assessment of distribution performance at the regional level is based on the weighted averages
of the distribution utilities representing the regional status of the electricity sector. The main findings of
this report indicate overall improvement across the region during the last decade with significant
changes in the following areas: a ten percentage point increase in coverage reaching 94.6 percent in
2005, a rise in private sector participation from 11 percent of electricity connections in 1995 to 60 percent
in 2005, labor productivity that more than doubled and an improvement in the quality of service by more
than 40 percent. While there were no clear trends in operational expenditures, overall OPEX grew between
40.8 and 44 percent during the last decade. Concurrently, residential and industrial tariffs (in real terms)
doubled since 1995. In contrast, there appeared to be no significant changes in distributional losses.
The second chapter presents the status of electricity distribution at the country-level by using the
simple average across countries based on the weighted averages of the utilities. It provides a cross-country
comparison that identifies the best performer according to the indicators measured. The utilities are ranked
according to their output, coverage, labor productivity, input, operating performance, quality, and prices.
According to the analyses, most countries demonstrate a significant overall improvement in the
coverage and labor efficiency of electricity services during the last 10 years. Chile is amongst the
strongest regional leader with 97 percent electricity coverage, labor productivity that is double the regional
average, and the lowest distributional losses. In regards to the average residential tariff, Argentina and
Peru serve their customers at the lowest rate of $38 and $43 per MWh per year respectively while
Paraguay provides industrial consumers the lowest regional tariff of $34. When assessing the overall
quality of service by measuring the frequency and duration of interruptions, Mexico takes the lead with a
low of 2.19 interruptions per consumer while Ecuador has the lowest duration time, averaging 2 hours.

- 52 -
Another regional forerunner is Peru with one of the most notable improvement trends in labor
productivity and distributional losses. Finally, Honduras is noted for the lowest operational expenditures
followed closely by Paraguay.
The third chapter assesses the performance of electricity distribution by evaluating the results of
the simple average of the 250 utilities included in this study. The method used to benchmark the
performance of all the utilities for this initiative was to rank them according to the top ten percent, middle
80 percent, or bottom ten percent of distribution performance. In this chapter, the best performing utilities
are listed in the top or bottom ten percent depending on the indicator being measured. Amongst the
characteristics of the top performing utilities are utilities with 100 percent electrification, an average
of 897.1 residential connections or 6,402 MWh of energy sold per employee, 6.5 percent
distributional losses, and residential prices in the range of $591 per MWh consumed. The story of the
last decade is one of universal electrification and significant improvements of the utilities represented in
the middle 80 percent. Electrification increased by almost 15 percentage points for the middle 80 percent
resulting in 88 percent coverage while the bottom ten percent increased by 20 percentages points resulting
in 61 percent coverage by 2005. The chapter provides three main messages: First, there are significant
discrepancies amongst utility performance. Second, there has been an overall improvement of the
underperforming utilities during the last ten years. Third, there are cases with significant deterioration in
distribution performance as reflected by indicators such as the average tariffs and distributional losses.
Notwithstanding the overall improvements of electricity distributors over the last 10 years, several
utilities stand out as a reference point for good performance. Compania Eléctrica del Rio Maipo of Chile
and Manaus Energía S.A. of Brazil lead with more than 3 times the labor productivity of the average
utility in the middle eighty percent. With regards to operation expenditures per connection, Compañía
Nacional de Fuerza y Luz and Junta Administradora de Servicios Eléctricos de Cartago of Costa Rica
incur the least amount of expenses and operate at 2 percent of the costs of the utilities in the top ten
percent. When assessing the best utility performer for the lowest capital expenditures per connection,
Electro Sur S.A. of Peru has averaged $3.01 per connection for the last 10 years. Furthermore, C.A.
Electricidad de Valencia provides its residential customers with the lowest tariffs, 4 times less than the
utilities in the top ten percent. Finally, Compañía Força e Luz do Oeste and Empresa Força e Luz de
Urussanga Ltda of Brazil stand out for the least distributional losses. Empresa Eléctrica Esmeraldas S.A.
of Ecuador provides its customers the best quality of service in the region with 0.96 when measuring the
frequency of interruptions while Empresas Públicas de Medellín E.S.P. lead with the lowest average
duration of 0.54 hours per connection.
In addition, the third chapter reports improvements of the underperforming countries as
manifested by the time trends. In summary, for the time period of 1995-2005, the lower performing
countries have doubled their electricity coverage and labor productivity, curtailed the frequency of
interruptions per connection by 73 percent and the duration of interruptions by 55.9 percent, and
decreased their total expenditures per connection by 26 percent. As attested by the aforementioned
results, significant progress has been made by the majority of the utilities in all categories throughout the
last decade.
The last chapter compares the performance of private and public utilities. The main
differences in performance are marked by: labor productivity, distribution losses, quality of
service, and tariffs. In contrast, other indicators such as coverage and operation expenditures exhibit
similar trends and/or do not present significant changes between the groups.
On average, private utilities performed better than public utilities with clear differences
after the change in ownership. Significant improvements in labor productivity are a distinguishing factor
when assessing the performance of the sector. When measuring the number of connections per employee

- 53 -
in 1995, the labor productivity of post-1995 privatized utilities was only 10.7 percent greater that that of
public utilities. Yet by the end of the decade, the labor productivity of post 1995 privatizations increased
three-fold and doubled the amount of public utilities. Another indicator exhibiting significant
improvement after the change in ownership is that of distribution losses. In 1995, public and post-1995
utilities experienced on average 17.9 and 15.3 distributional losses. However whereas private utilities by
2005 reduced distribution losses by 12.6 percent, public utilities resulted with a 4.9 percent increase.
More remarkable are the cases in which public utilities and post 1995 utilities experienced
similar initial conditions in 1995, yet after the change in ownership diverged in their performance.
One such instance is noted when assessing the quality of service. In 1995, public utilities experienced on
average a frequency of 22 interruptions per connection, 5 interruptions less than that of private utilities.
However by the end of the decade, public utilities reduced the average frequency of interruptions by 4
(interruptions), a modest improvement considering that private utilities cut their average frequency on
interruptions by half. Moreover, this contradistinction is more evident when comparing the average
duration time of private and public utilities. Whereas public and private utilities were separated by one
hour duration in 1995, by the end of 2005, public utilities exhibit a 48.8 percent increase in the average
duration per connection, while private utilities improved the quality of service by reducing the average
duration per connection by 28.2 percent.
There are good public and private utilities and underperforming private and public utilities.
For several indicators the top 10 percent public utilities performed better than the average private utilities
and in other cases the bottom 10 percent of the private utilities performed worse than the average public
utilities. In the case of distribution losses, it is noteworthy that the public utilities in the bottom 10 percent
perform better than the average private utilities. Likewise the private utilities forming the top decile
experience more distribution losses than the average public utilities.
The benchmarking of the electricity sector reveals the status of distribution services at the
regional, country and utility level. In turn, this knowledge is intended to serve as the foundation for setting
and achieving higher standards in coverage and services delivery. Furthermore, the comparative analyses
provide country and utility-specific direction to the actors that form part of the electricity market. Finally,
the all-encompassing purpose of this benchmarking report is to foster knowledge and incentive for the
improvement of electricity distribution.
LOOKING AHEAD
While this benchmarking initiative serves as a transparent baseline of electricity distribution
utilities in LAC, it calls upon further analytical work to explain the best practices that characterize
the region’s good or poor performers. An in-depth analysis of the facts presented in this report, would
all us to draw conclusions regarding the changes and trends that characterize the region. Future analytical
work would focus on questions such as: Why have distribution losses increased by 1.1 percent? How was
Peru able to reduce distribution losses by 11 percent? What are the reasons for a 40 – 44 percent increase
in OPEX and TOTEX, a 70 to 90 percent increase in tariffs, yet little improvement in distributional losses?
What are the reasons for a 2.9 percent decrease in sales despite an increase in the power generated and a
45 percent increase in the number of electricity connections? What is the correlation between prices and
performance? And why is there such a wide variance between tariffs in the region?
Understanding how and why regional, country, and utility performance has improved or
worsened would allow Latin American and Caribbean countries to share experiences and learn
from each other by appraising what has worked and what has not worked, in order to establish the

- 54 -
strongest possible basis for an efficient and reliable electricity sector in the future. In addition, future
analytical work is valuable because it may be used to target potential users such as the private sector,
utility managers, political decision makers, policy makers, and regulators, among others. Providing
potential users with knowledge about the status and best practices of the electricity sector is providing
them the tools for moving forward and additional impetus for reform.
It is equally important to sustain, update and improve the quality of the data used in this
benchmarking report, so that it remains an on-going resource for the Bank and the world at large.
Efforts to continue data collection and analysis are crucial in order for the World Bank to provide a
resource that is continuously valid not only for LAC but also for the other regions.

- 55 -
REFERENCES
Andres, L., J.L. Guasch, T. Haven, and V. Foster (2008) “The Impact of Private Sector Participation in
Infrastructure: Lights, Shadows, and the Road Ahead,” The World Bank.
Gassner, K. A. Popov, and N. Pushak. “An Empirical Assessment of Private Sector Participation in
Electricity and Water Distribution in Developing Countries,” World Bank, forthcoming 2007.
Jamasb and Pollitt [2000]). xxx
Schwartz, J. “The Feasibility of Regional Cooperation in Regulation of the Electricity Sector of the
Eastern Caribbean States,” World Bank, January 2007.

- 56 -
ANNEX 1 - METHODOLOGY The results of this paper serve as a guide to the performance of electricity distribution utilities in 26
countries in the Latin American and Caribbean Region. Sector performance is assessed according to the
benchmarking of electricity distribution at regional, country, and utility levels. Broadly defined,
benchmarking is the comparison of some measure of actual accomplishment against a reference or
benchmark performance (Jamasb and Pollitt [2000]). In this study, the benchmarking model consists of a
database containing annual information of 250 private and state-owned utilities using 26 variables
indicating coverage, output, input, labor productivity, operating performance, quality and customer
services, and prices. The time frame covers data as early as 1990 but the main focus is the period of 1995-
2005. It is important to acknowledge that data availability and data sources vary from each respective
country, often times depending on their ownership and means of regulation. While the benchmarking
study uses a homogenous set of variables for collecting data and measuring performance, each country
represents a special case and therefore efforts were made to assure consistency of the data across time and
utility. The following sections define the indicators used, describe the process of data collection, and
explain the efforts and challenges encountered in the completion of the database.
The Process of Data Collection:
Data for each performance indicator was registered in a database with a detailed description of
sources and collected variables, including comments clarifying the methodology used in the cases where
variables were constructed or proxies used. For each identified indicator in the database, information was
collected at country and utility level in order to have a product that could be compared across the region.
In order to obtain such a cross-country product, data sources and categories were standardized and keen
attention was given to the consistency of units. Necessary conversions were performed in electrical units
or monetary currency in order to have an equivalent comparison. Furthermore, the data was collected with
sensitivity to the variance in size of each respective country and utility, as well as other factors such as the
time and process of privatization, geography, and subsidies.
The primary means of conducting research was field data collection and in house data collection.
A standard template and set of variables was used by both field and in house consultants. Field consultants
collected data to complement the information in some of the countries (see Annex 2 – Source of the data).
Due to limited information available on the web for these countries, local consultants were the most
resourceful. For these selected countries and utilities a preliminary feasibility screening was conducted in
order to determine which countries would be likely to provide information. While field workers had direct
access to the respective utility and government, the process of data collection was often hindered by
unexpected factors such as: political affairs, bureaucracy, un-systematized data, and confidentiality issues,
among other elements.
The main sources for the in house data collection were the World Wide Web, information collected
by staff bank for other projects, and the internal World Bank Databases (SIMA, IRIS, etc.). The main
source of information on the internet was the utility's website. For some countries, the following proved to
be useful sources: regulators, ministries, partnerships, central banks, online financial journals, papers, loan
reports, financial reports, annual reports, monthly bulletins, statistics offices, and contacts with the
companies and regulators. In addition, the following associations and organizations provided valuable
statistics for the region: ARIAE (Asociación Iberoamericana de Entidades Reguladores de Energía),
ECLAC (Economic Commission for Latin America and the Caribbean), IEA (International Energy
Agency), and CIER (Comisión de Integración Energética Regional). However, since regulators and
international organizations or and commissions cover the electricity distribution of the entire region, most
of the information provided was aggregated at country level and not disaggregated by utility. One of the
challenges of data collection was the inconsistency between the data provided by utilities or regulators in

- 57 -
annual and financial reports. Considering this, appropriate calculations and approximations were made to
construct missing data points. For example, through the method of interpolation, data was constructed for
the earlier years of certain variables such as number of connections, number of employees, etc. However,
it is essential to note that interpolation and other means of constructing data was the exception based on
already concrete data and time trends. Specific methodologies were designed according to the variables at
hand in order to ensure their comparability and consistency across time and utilities.
For the results presented at country and regional level, the values were averaged weighting the
observations by the size of the utility (measured as the number of total connections). In order to avoid
misleading tendencies due to the change in the composition of the sample, we computed the annual growth
rate for each indicator and for each utility after which we aggregated these values for each year in order to
calculate the weighted annual change. In order to define the average level, we computed the weighted
average for 2002 and then imputed the annual change calculated before in order to build the time series.
Finally, we filtered the annual growth rates out of the 3-standard deviation range from the mean in order to
exclude outlier values.
Performance Indicators:
In order to best describe the efficiency of the distribution sector of LAC, indicators were selected
to determine utility-level performance. The utility-level indicators reflect relevant and feasible
measurements in depicting the distribution segment of the electricity sector. The utility-level indicators
were computed in order to measure factors such as technical efficiency, operating efficiency, cost
efficiency, quality of service, etc. Technical efficiency is defined as the capacity of the utility to achieve
maximum output from a given set of inputs. In order to compute the technical efficiency of a utility,
output and input indicators reflecting operating and cost efficiency were aggregated.
The following table lists the output variables used in this benchmarking study. The data collected
for the output variables are the prime indicators of a utility's efficiency. In the cases that data were not
found according to the selected or designed variables, the second best option was selected. For example,
when the Total number of connections was not available, the Total number of clients was used instead.
Similarly, the Total electricity sold per year was also calculated and defined by several utilities as the
Total electricity produced and thus used as a proxy once corrected for distributional losses.
OUTPUT VARIABLES
1 Total Number of Connections (Residential and Non-
residential) in the utility area. number
2 Total number of residential connections in the utility area number
3 Total electricity sold per year MWh
4 Length of distribution network km
5 Energy sold per connection per year MWh
With respect to measuring the total cost efficiency, the following input indicators were calculated:
INPUT VARIABLES
6 Total number of employees number
7 OPEX (operation expenditures) of the distribution
services per connection. in dollars
8 CAPEX (capital expenditures) of the distribution in dollars

- 58 -
services per connection.
9 TOTEX (total expenditures) of the distribution services
per connection. in dollars
10 OPEX of the distribution services per MWh sold. in dollars
11 CAPEX of the distribution services per MWh sold. in dollars
12 TOTEX of the distribution services per MWh sold. in dollars
OPEX consists of operating and maintenance costs, customer service and accounts expenses, sales
expenses, administrative, and general expenses. Usually, the biggest items of OPEX were labor, materials,
and third party service contract expenses. While OPEX reflects the operations of the distribution segment,
it does not include purchases of electricity, taxes, transmission payments, and at times depreciation.
CAPEX consists of the expenditures to acquire, expand, repair, or renovate fixed assets, implying the
purchase of goods and services whose benefits extend beyond the year and add to the company's assets.
CAPEX represents the annual gross capital outlays of a company.
However when calculating CAPEX and OPEX, there were several cases in which CAPEX and
OPEX had overlapping or disaggregated amounts, making it difficult to calculate them or establish
TOTEX. In addition, each country calculated and presented CAPEX and OPEX amounts differently
according to their distinct accounting styles. When operating and capital expenditures were provided by
the utility or regulator, that amount was registered. In the cases that OPEX and CAPEX were not
provided, the amounts were aggregated according to the criteria mentioned above. Furthermore, collecting
data for the average wholesale price, average transmission charges, and number of employees posed a
challenge when the respective utility was vertically integrated, managing generation, transmission, and
distribution. In such cases, the utility often times did not provide the internal price of transference but
rather only accounted for the end user price.
With respect to labor productivity, two variables were used: residential connections per employee
and energy sold per employee.
LABOR PRODUCTIVITY
13 Number of Residential Connections per Employee #
14 Energy Sold per Employee MWh
When assessing labor productivity, it is worth noting that this value is affected by factors such as
increased private participation and population growth in the case of residential connections per employee,
and distributional losses when calculating energy sold per employee. With increased private participation
and the unbundling of the sector, electricity utilities significantly reduced the number of employees. After
the separation of electricity generation, transmission, and distribution, we gathered the total employment
information for each of the segments in order to compute the average change before and after the reforms.
For consistency purposes, we imputed the total percent reduction in each of the segments in order to have
a proportionally similar drop in the number of employees.
The indicators used to measure operating performance consist of the energy losses (percent) in
distribution, disaggregated, when possible, as technical and non-technical losses. While technical losses
represent the energy lost in the network for physical reasons, non-technical losses represents the amount of
energy stole from the system. While the selected variable set reflects the operating performance of
electricity distribution, the study also accounts for external factors that may impact efficiency such as the
environment and customer density per network.
OPERATING PERFORMANCE

- 59 -
15 Energy losses in distribution per year (due to technical losses
and illegal connections) percentage
16 Energy losses in distribution per year due to technical losses Percentage
17 Energy losses in distribution per year due to non-technical
losses (illegal connections) Percentage
In addition, the benchmarking study included the following variables to indicate quality and
customer services.
QUALITY AND CUSTOMER SERVICES
18 Average duration of interruptions per subscriber hours / year
19 Average frequency of interruptions per subscriber # interruptions / year
20
Number of residential subscribers per 100
households in the concession area (Residential
coverage)
# / 100 households
When calculating the average duration and frequency of interruptions per subscriber, the majority
of the information found expressed this information according to the standard international measures:
SAIDI, System Average Interruption Duration Index (calculated by dividing the sum of all customer
interruption durations, in minutes, by the total number of customers served) and SAIFI, System Average
Interruption Frequency Index (calculated by dividing the total number of sustained customer interruptions
by the total number of customers served). However, some countries such as Guatemala reported the
quality of service in terms of TTIK (Total interruption time per kVA) and FMIK (Mean frequency of
Interruption per kVA). In such cases, TTIK was used as a proxy after accounting for the difference in
units.
When considering the variables for measuring quality and customer services, the recent trend
reflects a greater emphasis on quality indicators as countries recognize the importance of measuring
quality and customer service. Considering that most countries have only recently started to measure and
report the quality of their services, the data collected for these variables is fragmented and, in some cases,
inadequate. For example the average duration of interruptions was sometimes presented in hours, days, or
minutes, depending on the country, year, and report. In light of this, the study accorded careful attention to
measures of consistency and trends over time.
Finally, in order to determine the relationship between prices and cost, the study measured the
allocative efficiency of each utility. The following indicators were used to measure allocative efficiency.
PRICES
21 Average residential tariff dollars / MWh
22 Average industrial tariff dollars / MWh
Appendix: Definition of the variables
A. Output Variables:
1. Total Number of Connections (Residential and Non-residential) in the utility area. This is the
total number of connections (subscribers) in the utility area (i.e. Number of residential and non-
residential connections)

- 60 -
2. Total number of residential connections in the utility area. This is the total number of residential
connections (subscribers) in the utility area.
3. Total electricity sold per year. This is the total electricity supplied in MWh or the amount of
electricity that was put on the network.
4. Length of distribution network. The length (km) of the network was reported by voltage. Only
networks whose voltages are classified by the country's regulator as distribution were added in the
distribution network length measure.
5. Energy sold per connection. This is the ratio between the Total energy sold per year and the Total
number of connections.
B. Input Variables: 6. Total number of employees. This is the total number of employees related to electricity
distribution activities. When the end of the year number was not available, then the Full Time
Employment number (FTE) was used. Outsourced labor was added as an Extra variable at the end
of the excel sheet.
7. OPEX (operation expenditures) of the distribution services per connection (in dollars). OPEX
consists of operating and maintenance costs, customer service and accounts expenses, sales
expenses, administrative and general expenses. Usually, the biggest items of OPEX were labor,
materials and third party service contract expenses. OPEX reflects the operations of the
distribution segment and therefore do not include depreciation. Nominal values were converted to
nominal dollars. Finally, for each year observation, we divided OPEX by the number of total
connections.
8. CAPEX (capital expenditures) of the distribution service per connection (in dollars). CAPEX
consists of the expenditures to acquire, expand, repair, or renovate fixed assets, implying the
purchase of goods and services whose benefits extend beyond the year and add to the company's
assets. CAPEX represents the annual gross capital outlays of a company. Nominal values were
converted to nominal dollars. Finally, for each year observation, we divided OPEX by the number
of total connections.
9. TOTEX (total expenditures) of the distribution service per connection (in dollars). TOTEX is
the sum of OPEX and CAPEX (TOTEX = OPEX + CAPEX). Nominal values were converted to
nominal dollars. Finally, for each year observation, we divided by the number of total
connections.
10. OPEX of the distribution services per MWh sold (in dollars). Same OPEX definition provided
above but divided by the total energy sold.
11. CAPEX of the distribution service per MWh sold (in dollars). Same CAPEX definition provided
above but divided by the total energy sold (in MWhs).
12. TOTEX of the distribution service per MWh sold (in dollars). Same TOTEX definition provided
above but divided by the total energy sold (in MWhs).
C. Labor Productivity:
13. Residential Connections per Employee: This is the division of the number of residential
connections by the number of employees.
14. Energy Sold per Employee: This is the division of the energy sold in MWh by the number of
employees.
D. Operating Performance:
15. Total Energy losses in distribution per year (due to technical losses and illegal connections)
Total Energy losses. Total distribution losses is the sum of technical and non-technical
(commercial losses).

- 61 -
16. Energy losses in distribution per year due to technical losses. Energy losses due to technical
reasons (i.e. Dissipation of power in electrical system components).
17. Energy losses in distribution per year due to non-technical losses. Energy losses due to non-
technical or commercial losses (i.e. Theft of service (illegal connections) and losses due to failure
in the billing system).
E. Quality and Customer Services: 18. Average duration of interruptions per subscriber. This is the number of hours-subscriber the
system was without power in a year, divided by the total number of subscribers. The equivalent is
SAIDI, System Average Interruption Duration Index calculated by dividing the sum of all
customer interruption durations, in minutes, by the total number of customers served.
19. Average frequency of interruptions per subscriber. The average number of interruptions
experienced by a consumer unit during one year. The equivalent is SAIFI, System Average
Interruption Frequency Index calculated by dividing the total number of sustained customer
interruptions by the total number of customers served.
20. Number of residential subscribers per 100 households in the concession area (Residential
coverage). Ration of residential connections per 100 households (within the area of operation). In
other words, the percentage of households connected in each concession area (residential service
coverage = residential connection / number of households).
F. Prices:
21. Average residential tariff. The average price per MWh of electricity sold to residential
consumers, including both fixed and variable components, in local nominal currency.
22. Average industrial tariff. The average price per MWh of electricity sold to industrial consumers,
including both fixed and variable components, in local nominal currency.

- 62 -
ANNEX 2 - SOURCES OF INFORMATION BY COUNTRY
Three main sources of information were used to compile data for the benchmarking analysis of the
electricity distribution sector for Latin American and Caribbean countries: the study “Impact of
Privatization on Firms in the Infrastructure Sector in the Latin American Countries” 10
, the study “An
Empirical Assessment of Private Sector Participation in Electricity and Water Distribution in Developing
Countries”11
, a benchmarking database compiled by Martin Rossi, and the study “The Feasibility of
Regional Cooperation in Regulation of the Electricity Sector of the Eastern Caribbean States.”12
In addition, regional sources were consulted. These sources comprise of the Asociación
Iberoamericana de Entidades Reguladoras de Energía (ARIAE), the Comisión de Integración Eléctrica
Regional (CIER), the Internacional Association for Energy Economics (IAEE), the Internacional Energy
Agency (IEA), and in some cases the Alianza en Energía y Ambiente con Centroamérica (AEA), and the
Energy Information Administration of the US government (EIA).
1. Argentina
Data for Argentina was obtained using different sources. In total there is data for 38 companies.
Most of the data was integrated using the three main sources: the study “Impact of Privatization on Firms
in the Infrastructure Sector in the Latin American Countries” which supplied data for about 18
companies, the study “An Empirical Assessment of Private Sector Participation in Electricity and Water
Distribution in Developing Countries” which provided data for 7 companies, and the database provided by
Martin Rossi which contributed with 13 companies and complemented some missing observations from
the previous two sources. In-house collection was done by reviewing sources such as the Ente Nacional
Regulador de la Energía Eléctrica (ENRE) and the Asociación de Distribuidores de Energía Eléctrica de
la República Argentina (ADEERA).
2. Belize
Data gathering for the only electricity distribution company in the country was accomplished in-
house. The main source of information was the company’s website and the annual reports published there.
3. Bolivia
The main sources of data are the study “Impact of Privatization on Firms in the Infrastructure
Sector in the Latin American Countries” and in-house collection. Through these channels, it was possible
to gather data for 7 companies. The sources used for the in-house collection are: Superintendencia de
Electricidad (SIE), Comisión Nacional de Despacho de Carga (CNDC), the Sistema de Regulación
Sectorial (SIRESE), and the Instituto Nacional de Estadística (INE). In addition, the companies’ websites,
if any, were also consulted.
4. Brazil
10 Andres, L. V. Foster, and J.L. Guasch. “Impact of Privatization on Firms in the Infrastructure Sector in the Latin
American Countries,” World Bank, forthcoming 2007. 11
Gassner, K. A. Popov, and N. Pushak. “An Empirical Assessment of Private Sector Participation in Electricity and
Water Distribution in Developing Countries,” World Bank, forthcoming 2007. 12
Schwartz, J. “The Feasibility of Regional Cooperation in Regulation of the Electricity Sector of the Eastern
Caribbean States,” World Bank, January 2007.
- 63 -
This country represented a challenge as the number of electricity distribution companies is very
large. Therefore, different approaches for data gathering were followed here. Some of the data was
obtained from the study “Impact of Privatization on Firms in the Infrastructure Sector in the Latin
American Countries”, totaling 45 companies. Some more companies were obtained from the study “An
Empirical Assessment of Private Sector Participation in Electricity and Water Distribution in Developing
Countries”, which accounted for 5 more companies. Data shared by Martin Rossi advanced the
completion of some indicators in the database. In addition, a local consultant gathered data for 10 more
companies. Several sources of data were used in the in–field data gathering process. The most effective
was direct contact with the companies and the departments which are in charge of documenting such
information. In-house collection was accomplished by consulting sources such as the Agência Nacional de
Energía Elétrica (ANEEL), the Associação Brasileira de Distribuidores de Energia Eléctrica
(ABRADEE), and the Câmara de Comercializacão de Energia Elétrica (CCEE)
5. Chile
Chile also posed a challenge in the data collection process as it has several electricity distribution
companies. Since the regulatory system works efficiently and companies are accountable, information is
available. Identifying the 36 companies was done by using the information from the study “Impact of
Privatization on Firms in the Infrastructure Sector in the Latin American Countries”. However, some of
the information was fragmentary, and in some cases very limited. Therefore, a local consultant was hired
in order to fill in the missing information for the 36 companies in Chile. In addition, information was
obtained from the Comisión Nacional de Energía (CNE), the Superintendencia de Electricidad y
Combustibles (SEC), and the individual distribution firms.
6. Colombia
When gathering data for this country, we grouped the data already collected for 3 companies
according to the study “Impact of Privatization on Firms in the Infrastructure Sector in the Latin
American Countries” and by the study “An Empirical Assessment of Private Sector Participation in
Electricity and Water Distribution in Developing Countries”, which accounted for 7 more companies. In
house work was performed to complete some variables missing in the previous studies, while a local
consultant was hired to collect data for 12 more companies, for a total of 22 electricity distribution firms.
The main sources of data for Colombia were the Comisión de Regulación de Energía y Gas (CREG), the
Superintendencia de Servicios Públicos Domiciliarios, and the Sistema Único de Información de
Servicios Públicos (SUI), in addition to individual distribution firms.
7. Costa Rica
A local consultant was in charge of the data collection of four companies in Costa Rica: ICE,
CNFL, ESPH, and JASEC. The data was obtained from direct consultation with the firms. The rest of the
companies (four cooperatives) included in this analysis were obtained from the study “Impact of
Privatization on Firms in the Infrastructure Sector in the Latin American Countries”. Information
provided by Martin Rossi contributed to the completion of some of the missing variables, particularly for
years previous to 2000. In addition to the electricity distribution firms, the Autoridad Reguladora de los
Servicios Públicos (ARESEP) and the Ministerio de Energía y Ambiente (MINAE) were also consulted.
8. Dominican Republic
In-house data collection was carried out to obtain data for 3 electricity distribution companies in

- 64 -
the Dominican Republic. Data was obtained from the publication “Memorias 2000-2004 EDENORTE”
and “Memorias 2000-2004 EDESUR” published by the Corporación Dominicana de Empresas Electricas
Estatales. Additional data was obtained from the websites of the companies.
9. Ecuador
The Consejo Nacional de Electricidad (CONELEC), through its different divisions, was the main
provider of data for this country. CONELEC’s Rates Division, Supervision Division, and Planning
Division were useful in the data gathering. In addition, data was obtained from the Central Bank of
Ecuador. The rest of the data was obtained directly for each one of the companies listed in the study. An
in-field consultant was in charge of coordinating the data collection in Ecuador.
10. El Salvador
The main source of data for El Salvador’s five electricity distribution companies was the study
“Impact of Privatization on Firms in the Infrastructure Sector in the Latin American Countries”. In
addition, in-house collection of data was accomplished using the following sources: Superintendencia
General de Electricidad y Telecomunicaciones (SIGET), the Ministerio de Economía (MINEC), the
Asociación Salvadoreña de Industriales (ASI), the Ente Operador del Mercado Eléctrico Regional (EOR),
the Administradora del Mercado Mayorista de Energía Eléctrica de El Salvador (also known as Unidad
de Transacciones, UT), and the websites of the companies.
11. Guatemala
For this country, the study “Impact of Privatization on Firms in the Infrastructure Sector in the
Latin American Countries” was used as well as in-house work that focused on the main 4 companies in
the country. The four companies cover the majority of the electricity market in Guatemala. The main
sources included the Comisión Nacional de Energía (CNEE) and the Administrador del Mercado
Mayorista (AMM).
12. Honduras
Data for Honduras’ Empresa Nacional de Energía Eléctrica (ENEE) was collected in-house. Data
sources included the Comisión Nacional de Energía (CNE) and the website for the Empresa Nacional de
Energía Eléctrica.
13. Mexico
In this case, data was obtained by direct request through the Ministry of Energy in Mexico. The
office of the Vice ministry of Electricity contacted the two electricity companies in Mexico (CFE and
LyFC) and requested the data which was compiled for this study.
14. Nicaragua
Data for the two Nicaraguan electricity distribution companies was obtained from the study
“Impact of Privatization on Firms in the Infrastructure Sector in the Latin American Countries”, and by
means of in-house collection. The sources for the in-house collection were: the Instituto Nicaragüense de
Energía (INE), the Comisión Nacional de Energía (CNE), the Centro Nacional de Despacho de Carga
(CNDC), the Public Services International Research Unit (PSIRU), the Unidad de Reestructuración de
ENEL (URE), the Instituto Nacional de Estadísticas y Censos (INEC), in addition to companies’ websites.

- 65 -
15. Panama
Data for the three Panamanian companies was obtained from the study “Impact of Privatization on
Firms in the Infrastructure Sector in the Latin American Countries”, and through in-house collection. The
sources for the in-house collection were: Autoridad Nacional de Servicios Públicos (also known as Ente
Regulador de Servicios Públicos, ERSP) and the Bolsa de Valores de Panamá (PANABOLSA), in
addition to the websites of the companies.
16. Paraguay
Because of the structure of the electricity sector in Paraguay, a local consultant with extensive
knowledge of the electricity sector was hired. (ANDE) a large company in Paraguay accounts for almost
all the market. In addition, an effort was made to gather some data of a smaller company CLYFSA. In-
house work was done and a request for information was sent to ANDE. The local consultant followed up
with the request and dealt with the questions and comments regarding the quality of data and technical
details. The main sources are the distribution companies (ANDE and CLYFSA).
17. Peru
Peru also used the three main sources of data: the studies “Impact of Privatization on Firms in the
Infrastructure Sector in the Latin American Countries”, which contributed data for 10 companies, and “An
Empirical Assessment of Private Sector Participation in Electricity and Water Distribution in Developing
Countries”, which contributed data for 7 companies. Rossi’s data base was used to complete the
information gaps for the 17 companies. In addition, in-house work was performed to obtain financial
indicators through the Organismo Supervisor de Inversión en Energía (OSINERG).
18. Uruguay
The data for this country was obtained by direct request to the utility and after in-house review of
external sources of information and of the Unidad Reguladora de los Servicios de Agua y Energía
(URSEA). The bulk of data was granted by different departments within UTE, after direct approval from
the president of the company.
19. Venezuela
Partial information for 13 companies has been gathered for this country. Data for Venezuela came
from two sources: electricity distribution companies, by means of in-house collection, and data provided
by Martin Rossi. In-house collection relied on the following sources: the Fundación para el Desarrollo del
Servicio Eléctrico (FUNDELEC), the Cámara Venezolana de la Industria Eléctrica (CAVEINEL), the
Oficina de Operación de Sistemas Interconectados (OPSIS), and the Superintendencia para la Promoción
y Protección de la Libre Competencia (Procompetencia). In those cases where it was possible, the
websites of the different companies were consulted.
20. Caribbean
The following countries are part of the Caribbean and are significantly smaller than the rest of the
region. In most of these countries the energy sector is significantly small and every country has one or two
electricity distribution companies. In addition, countries have done little recording of past statistics,
marking it difficult to gather consistent data.
For these countries, in-house collection was the primary mean of data collection extracting

- 66 -
information from different projects that the World Bank has implemented in the Caribbean. The main
reference for these countries was data gathered by Jordan Schwartz who has been working with these
countries. He shared data from Antigua and Barbuda, Dominica, Grenada, St. Kitts and Nevis, St.
Lucia, and St. Vincent and the Grenadines.
.

- 67 -
ANNEX 3 - LIST OF UTILITIES COVERED IN THIS REPORT
Country Acronyms Name
Antigua and Barbuda APUA Antigua Public Utilities Authority
Argentina APELP Administración Provincial de Energía de la Pampa
Argentina Coop TANDIL Coop. Agropecuaria de Tandil Limitada
Argentina Coop AZUL Coop. Eléctrica de Azul Ltda.
Argentina Coop CHACABUCO Coop. Eléctrica de Chacabuco Ltda.
Argentina Coop PERGAMINO Coop. Eléctrica de Serv. Anexos de Vivienda y Crédito de Pergamino
Ltda.
Argentina Coop LUJAN Coop. Eléctrica y Servicios Públicos Lujanense Ltda.
Argentina Coop MORENO Coop. Eléctrica y de Servicios Mariano Moreno Ltda. 9 de Julio
Argentina Coop SALTO Coop. Limitada de Consumo de Electricidad del Salto
Argentina Coop OLAVARRIA Coop. Ltda. de Consumo de Electricidad y Serv. Anexos de Olavaria
Argentina Coop GUALEGUACU Coop. de Consumo de Electricidad y Afines de Gualeguaychú LTDA
Argentina Coop ZARATE Cooperativa de Electricidad y Servicios Anexos Ltda. De Zarate
Argentina Coop SAN PEDRO Coop. de Provisión de Serv. Eléctricos Públicos y Sociales de San Pedro
Ltda.
Argentina Coop COLON Coop. de Provisión de Serv. Eléctricos y Sociales, Vivienda y Crédito
Colón Ltd
Argentina DPEC Dirección Provincial de Energía de Corrientes
Argentina EMSA Electricidad de Misiones S.A.
Argentina EDESAL Empresa Distribuidora San Luis S.A.
Argentina EDESUR Empresa Distribuidora Sur S.A.
Argentina EDEMSA Empresa Distribuidora de Electricidad de Mendoza S.A.
Argentina EDESE Empresa Distribuidora de Electricidad de Santiago del Estero S.A.
Argentina EDELAR Empresa Distribuidora de Electricidad de la Roja S.A.
Argentina EDESTESA Empresa Distribuidora de Electricidad del Este S.A.
Argentina EDEA Empresa Distribuidora de Energía Atlántica
Argentina EDELAP Empresa Distribuidora de Energía La Plata S.A.
Argentina EDEN Empresa Distribuidora de Energía Norte S.A.
Argentina EDES Empresa Distribuidora de Energía Sur S.A.
Argentina EDECAT Empresa Distribuidora de Energía de Catamarca S.A.
Argentina EDEFOR Empresa Distribuidora de Energía de Formosa S.A.
Argentina EDENOR Empresa Distribuidora y Comercializadora Norte S.A.
Argentina EJE Empresa Jujeña de Energía S.A.
Argentina EPEC Empresa Provincial de Energía de Córdoba
Argentina EPESF Empresa Provincial de la Energía de Santa Fe
Argentina EDET Empresa de Distribución Eléctrica de Tucumán S.A.
Argentina EDERSA Empresa de Energía Rió Negro
Argentina EDESA Empresas Distribuidora de Electricidad de Salta S.A.
Argentina ESJ Energía San Juan S.A.
Argentina EDEERSA Energía de Entre Ríos S.A.
Argentina EPEN Ente Provincial de Neuquén
Argentina SECHEEP Servicios Energéticos del Chaco Empresa del Estado Provincial
Belize BEL Belize Electricity Limited
Bolivia CESSA Compañía Eléctrica de Sucre S.A.
Bolivia CRE Cooperativa Rural de Electrificación - ÁREA INTERGRADA
Bolivia ELECTROPAZ Electricidad De La Paz S.A.
Bolivia ELFEC Empresa de Luz y Fuerza Eléctrica Cochabamba S.A.

- 68 -
Bolivia ELFEO Empresa de Luz y Fuerza Eléctrica Oruro S.A.
Bolivia SEPSA Servicios Eléctricos Potosí
Bolivia SETAR - CENTRAL Servicios Eléctricos Tarija S.A.
Brazil AES Sul AES SUL Distribuidora Gaúcha de Energia S/A
Brazil BANDEIRANTE Bandeirante Energia S/A.
Brazil BOVESA Boa Vista Energia S.A.
Brazil CNEE CNEE - Companhia Nacional de Energia Elétrica (Southeast region)
Brazil CAIUA Caiuá Serviços de Eletricidade S/A.
Brazil CEMAT Centrais Elétricas Matogrossenses S/A.
Brazil CELESC Centrais Elétricas Santa Catarina S/A
Brazil ELETROCAR Centrais Elétricas de Carazinho S/A.
Brazil CERON Centrais Elétricas de Rondônia S/A
Brazil CELPA Centrais Elétricas do Pará S/A
Brazil COCEL Companhia Campolarguense de Energia
Brazil CEAM Companhia Energetica do Amazonas
Brazil CELB Companhia Energética da Borborema
Brazil CEAL Companhia Energética de Alagoas
Brazil CEB Companhia Energética de Brasília
Brazil CELG Companhia Energética de Goiás
Brazil CEMIG Companhia Energética de Minas Gerais
Brazil CELPE Companhia Energética de Pernambuco
Brazil COELCE Companhia Energética do Ceará
Brazil CEMAR Companhia Energética do Maranhão
Brazil CEPISA Companhia Energética do Piauí
Brazil COSERN Companhia Energética do Rio Grande do Norte
Brazil CEEE Companhia Estadual de Energia Elétrica
Brazil CFLCL Companhia Força e Luz Cataguazes - Leopoldina
Brazil CFLO Companhia Força e Luz do Oeste
Brazil CHESF Companhia Hidro Elétrica do São Francisco
Brazil CJE Companhia Jaguari de Energia
Brazil CLFSC Companhia Luz e Força Santa Cruz
Brazil COPEL Companhia Paranaense de Energia
Brazil CPEE Companhia Paulista de Energia Elétrica
Brazil CPFL Companhia Paulista de Força e Luz
Brazil CPFL Companhia Paulista de Força e Luz - Piratininga
Brazil SULGIPE Companhia Sul Sergipana de Eletricidade
Brazil CENF Companhia de Eletricidade Nova Friburgo
Brazil ELETROACRE Companhia de Eletricidade do Acre
Brazil CEA Companhia de Eletricidade do Amapã
Brazil COELBA Companhia de Eletricidade do Estado da Bahia
Brazil CERJ Companhia de Eletricidade do Rio de Janeiro
Brazil CELTINS Companhia de Energia Elétrica do Estado do Tocantins
Brazil CLFM Companhia de Luz e Força Mococa
Brazil DEMEI Departamento Municipal de Energia de Ijuí
Brazil ELEKTRO Elektro Eletricidade e Serviços S/A.
Brazil ELETROPAULO Eletropaulo Metropolitana – Eletricidade de São Paulo S/A
Brazil EEB Empresa Elétrica Bragantina S.A.
Brazil ENERSUL Empresa Energética de Mato Grosso do Sul S/A.
Brazil ENERGIPE Empresa Energética de Sergipe
Brazil EFLUL Empresa Força e Luz de Urussanga Ltda
Brazil ELFSM Empresa Luz e Força Santa Maria S/A
- 69 -
Brazil EEVP Empresa de Eletricidade do Vale do Paranapanema
Brazil ESCELSA Espírito Santo Centrais Elétricas S/A.
Brazil FORCEL Força e Luz Coronel Vivida Ltda
Brazil PANAMBI Hidroelétrica Panambi S/A (HIDROPAN)
Brazil LIGHT Light Serviços de Eletricidade S/A
Brazil MANAUS Manaus Energia S/A
Brazil MUXFELDT Muxfeldt Marin & Cia. Ltda
Brazil RGE Rio Grande Energia S/A
Brazil SAELPA Saelpa S/A de Eletrificação da Paraíba
Brazil NOVAPALMA Usina Hidroelétrica de Nova Palma
Chile CHILECTRA Chilectra S.A.
Chile CODINER Compañía Distribuidora de Energía S.A.
Chile LUZ OSORNO Compañía Eléctrica Osorno S.A.
Chile CONAFE Compañía Nacional de Fuerza Eléctrica S.A.
Chile LITORAL Compañía Eléctrica del Litoral S.A.
Chile RIO MAIPO Compañía Eléctrica del Rió Maipo S.A.
Chile CGE Compañía General de Electricidad S.A.
Chile COELCHA Cooperativa Eléctrica de Charrúa
Chile COOP. CURICO Cooperativa Eléctrica de Curicó S.A.
Chile COOPELAN Cooperativa Eléctrica de Los Angeles S.A.
Chile SOCOEPA Cooperativa Eléctrica de Paillaco S.A.
Chile ELECOOP Cooperativa Eléctrica del Limarí
Chile COOPREL Cooperativa Rural Eléctrica de Rió Bueno Ltda
Chile COPELEC Cooperativa de Consumo de Energía Eléctrica de Chillán
Chile LUZPARRAL Distribuidora Parral S.A. (LUZPAR LTDA.)
Chile CHILQUINTA Enerquinta (Chilquinta Energies S.A.)
Chile EMEC Empresa Eléctrica EMEC S.A.
Chile TIL TIL Empresa Eléctrica Municipal de Til-Til
Chile EEPA Empresa Eléctrica Puente Alto Ltda.
Chile ELECDA Empresa Eléctrica de Antofagasta S.A.
Chile EMELARI Empresa Eléctrica de Arica S.A.
Chile EMELAT Empresa Eléctrica de Atacama S.A.
Chile EDELAYSEN Empresa Eléctrica de Aysen S.A.
Chile EMELCA Empresa Eléctrica de Casablanca S.A.
Chile EEC (Colina) Empresa Eléctrica de Colina S.A.
Chile ELIQSA Empresa Eléctrica de Iquique S.A.
Chile EDELMAG Empresa Eléctrica de Magallanes S.A.
Chile EMELECTRIC Empresa Eléctrica de Melipilla, Colchagua y Maule S.A.
Chile EMETAL Empresa Eléctrica de Talca S.A.
Chile FRONTEL Empresa Eléctrica de la Frontera S.A.
Chile EDECSA Energía de Casablanca S.A.
Chile GEDELSA GEDELSA
Chile LUZANDES Luz Andes S.A. (Lo Barnechea)
Chile LUZLINARES Luz Linares S.A. (LuzAgro LTDA.)
Chile SAESA Sociedad Austral de Electricidad S.A.
Chile SEP Sociedad Eléctrica de Pirque S.A.
Colombia CODENSA CODENSA S.A. ESP
Colombia CHEC Central Hidroeléctrica de Caldas S.A. ESP
Colombia CENS Centrales Eléctricas del Norte de Santander
Colombia CEDENAR Centrales Eléctricas de Nariño S.A. ESP
Colombia CEDELCA Centrales Eléctricas del Cauca S.A. ESP

- 70 -
Colombia TULUA Compañía de Electricidad del Tulúa S.A. ESP
Colombia ElectroCosta Electrificadora de La Costa Atlántica S.A.
Colombia ElectriCaribe Electrificadora del Caribe S.A. E.S.P.
Colombia ESSA Electrificadora de Santander (Bucaramanga)
Colombia ELECTROHUILA Electrificadora del Huila S.A. ESP
Colombia EMSA Electrificadora del Meta S.A. ESP
Colombia ELECTOLIMA Electrificadora del Tolima S.A ESP
Colombia EADE Empresa Antioqueña de Energía S.A. E.S.P
Colombia EDEQ Empresa de Energía Eléctrica del Quindio S.A. E.S.P.
Colombia EPSA Empresa de Energía del Pacifico
Colombia EBSA Empresa de Energía de Boyaca ESP
Colombia EEC Empresa de Energía de Cundinamarca S.A. E.S.P.
Colombia EEP Empresa de Energía de Pereira S.A. ESP
Colombia PUTUMAYO Empresa de Energía de Putumayo S.A. ESP
Colombia EEAMAZONAS Empresa de Energía del Amazonas S.A. ESP
Colombia EMCALI Empresas Municipales de Cali Eice
Colombia EEPPMM Empresas Públicas de Medellín E.S.P.
Costa Rica CNFL Compañía Nacional de Fuerza y Luz
Costa Rica Coopealfaro Cooperativa de Electrificación Rural de Alfaro Ruiz
Costa Rica Coopeguana Cooperativa de Electrificación Rural de Guanacaste
Costa Rica Coopesantos Cooperativa de Electrificación Rural de Los Santos
Costa Rica Coopelesca Cooperativa de Electrificación Rural de San Carlos
Costa Rica ESPH Empresa de Servicios Públicos de Heredia
Costa Rica ICE Instituto Costarricense de Electricidad
Costa Rica JASEC Junta Administradora de Servicios Eléctricos de Cartago
Dominica DOMLEC Dominica Electricity Services Limited
Ecuador CATEG-D / EMELEC Corporación para la Administración Temporal Eléctrica de Guayaquil
Ecuador STA. ELENA Empresa Eléctrica Santa Elena S.A.
Ecuador COTOPAXI Empresa Eléctrica Cotopaxi S.A.
Ecuador LOS RIOS Empresa Eléctrica Los Ríos S.A.
Ecuador MANABÍ Empresa Eléctrica Manabí S.A.
Ecuador NORTE Empresa Eléctrica Norte S.A.
Ecuador SUR Empresa Eléctrica Regional Sur S.A.
Ecuador STO. DOMINGO Empresa Eléctrica Santo Domingo S.A.
Ecuador SUCUMBÍOS Empresa Eléctrica Sucumbios S.A.
Ecuador AMBATO Empresa Eléctrica Ambato S.A.
Ecuador AZOGUES Empresa Eléctrica Azogues S.A.
Ecuador BOLIVAR Empresa Eléctrica Bolívar S.A.
Ecuador EL ORO Empresa Eléctrica El Oro S.A.
Ecuador ESMERALDAS Empresa Eléctrica Esmeraldas S.A.
Ecuador GALAPAGOS Empresa Eléctrica Galápagos S.A.
Ecuador GUAYAS-LOS RÍOS Empresa Eléctrica Guayas Los Ríos S.A.
Ecuador MILAGRO Empresa Eléctrica Milagro S.A.
Ecuador QUITO Empresa Eléctrica Quito S.A.
Ecuador CENTRO SUR Empresa Eléctrica Regional Centro Sur S.A.
Ecuador RIOBAMBA Empresa Eléctrica Riobamba S.A.
El Salvador AES CLESA AES CLESA y Compañía, S. en C. de C.V.
El Salvador CAESS Compañía de Alumbrado Eléctrico de San Salvador, S.A.
El Salvador DEUSEM Distribuidora Eléctrica de Usulatan, S.A.
El Salvador DEL SUR Distribuidora de Electricidad del Sur
El Salvador EEO Empresa Eléctrica de Oriente, S.A.

- 71 -
Grenada GRENLEC Grenada Electricity Services Limited
Guatemala DEOCSA Distribuidora de Electricidad de Occidente
Guatemala DEORSA Distribuidora de Electricidad de Oriente
Guatemala EGEE Empresa Generadora de Energía Eléctrica
Guatemala EEGSA Empresas Eléctricas de Guatemala S.A.
Honduras ENEE Empresa Nacional de Energía Eléctrica
Mexico CFE Comisión Federal de Electricidad
Mexico LyFC Luz y Fuerza del Centro
Nicaragua DISNORTE Distribuidora de Electricidad del Norte
Nicaragua DISSUR Distribuidora de Electricidad del Sur
Panama EDECHI Empresa de Distribución Eléctrica Chiriquí, S.A
Panama EDEMET Empresa de Distribución Eléctrica Metro Oeste, S.A.
Panama ELEKTRA NORESTE Empresa de Distribución Eléctrica Noreste
Paraguay ANDE Administración Nacional de Electricidad
Paraguay CLYFSA Compañía Luz y Fuerza S.A.
Peru EDELNOR Edelnor
Peru ELDENOR-
CHANGAY
Edelnor - Zonal Chancay
Peru ELC Electro Centro S.A.
Peru ENOSA Electro Nor Oeste S.A.
Peru ENSA Electro Norte S.A.
Peru ELSM Electro Sur Medio S.A.
Peru ELOR Electro Oriente S.A
Peru ELPUNO Electro Puno S.A.A.
Peru ELSE Electro Sur Este SA
Peru ELS Electro Sur S.A.
Peru ELU Electro Ucayali S.A.
Peru ELECTRO NORTE
MEDIO
Electronorte Medio S.A.-Hidradina S.A.
Peru EDECAÑETE Empresa de Distribución Eléctrica Canete S.A.
Peru LUZ del Sur Luz del Sur
Peru INADE Proyecto Especial Chavimochic
Peru SEAL Sociedad Eléctrica del Sur Oeste S.A.
Rep. Dominicana EDEESTE Empresa Distribuidora de Electricidad del Este
Rep. Dominicana EDESUR Empresa Distribuidora de Electricidad del Sur
Rep. Dominicana EDENORTE Empresa Distribuidora de Electricidad del Norte
St Kitts and Nevis Electricity Department Electricity Department
St Kitts and Nevis NEVLEC Nevis Electricity Company
St Lucia LUCELEC St. Lucia Electricity Services Limited
St Vincent and the
Grenadines
VINLEC St. Vincent Electricity Services Limited
Uruguay UTE Administración Nacional de Usinas y Transmisiones Eléctricas
Venezuela ELEGGUA C.A. Electricidad de Guarenas y Guatire
Venezuela ELEVAL C.A. Electricidad de Valencia
Venezuela ENELBAR C.A. Energía Eléctrica de Barquisimeto
Venezuela ENELVEN C.A. Energía Eléctrica de Venezuela
Venezuela ELEBOL C.A. La Electricidad de Ciudad Bolívar
Venezuela CALEV C.A. Luz Eléctrica de Venezuela
Venezuela EDELCA C.V.G. Electrificación del Caroni C.A. Caracas
Venezuela CALEY CA Compañía Luz Eléctrica del Yaracuy
Venezuela CALIFE CA Luz y Fuerza de Puerto Cabello

- 72 -
Venezuela CADAFE Compañía Anónima de Administración y Fomento Eléctrico
Venezuela ENELCO Energía Eléctrica de la Costa Oriental
Venezuela EDC- AES La Electricidad de Caracas S.A.
Venezuela SENECA Sistema Eléctrico del Estado Nueva Esparta

- 73 -
ANNEX 4 – CAPITAL AND TOTAL EXPENDITURES PER CONNECTION
The following results reflect the capital and total expenditures of the distribution utilities in LCR.
There are no consistent trends throughout the decade and there are wide discrepancies between
comparable countries. Furthermore, this report does not attempt, at this stage, to explain whether and why
the following values represent good or poor performance but rather to provide the region with a
benchmark of the average total expenditures.
050
100
150
1995 2000 2005year
ARG BRA COL
MEX PER VEN
Source: LAC Electricity Benchmarking Database, The World Bank, 2007.
- South America & Mexico (GRP 1) -
CAPEX per Connection (in dollars/yr)
0
50
100
150
1995 2000 2005year
BOL CHL ECU
PRY URY
Source: LAC Electricity Benchmarking Database, The World Bank, 2007.
- South America (GRP 2) -
CAPEX per Connection (in dollars/yr)
0
100
200
300
400
500
1995 2000 2005year
CRI BLZ SLV GTM
HND NIC PAN DOM
Source: LAC Electricity Benchmarking Database, The World Bank, 2007.
- Central America -
CAPEX per Connection (in dollars/yr)
0
100
200
300
400
500
2000 2001 2002 2003 2004 2005year
ATG DMA GRD
KNA LCA VCT
Source: LAC Electricity Benchmarking Database, The World Bank, 2007.
- Caribe -
CAPEX per Connection (in dollars/yr)
025
50
75
100
1995 2000 2005year
ARG BRA COL
MEX PER VEN
Source: LAC Electricity Benchmarking Database, The World Bank, 2007.
- South America & Mexico (GRP 1) -
CAPEX per MWh Sold (in dollars/yr)
025
50
75
100
1995 2000 2005year
BOL CHL ECU
PRY URY
Source: LAC Electricity Benchmarking Database, The World Bank, 2007.
- South America (GRP 2) -
CAPEX per MWh Sold (in dollars/yr)

- 74 -
025
50
75
100
1995 2000 2005year
CRI BLZ SLV GTM
HND NIC PAN DOM
Source: LAC Electricity Benchmarking Database, The World Bank, 2007.
- Central America -
CAPEX per MWh Sold (in dollars/yr)
025
50
75
100
2000 2001 2002 2003 2004 2005year
ATG DMA GRD
KNA LCA VCT
Source: LAC Electricity Benchmarking Database, The World Bank, 2007.
- Caribe -
CAPEX per MWh Sold (in dollars/yr)
0
200
400
600
1995 2000 2005year
ARG BRA COL
MEX PER VEN
Source: LAC Electricity Benchmarking Database, The World Bank, 2007.
- South America & Mexico (GRP 1) -
TOTEX per Connection (in US$/yr)
0
200
400
600
1995 2000 2005year
BOL CHL ECU
PRY URY
Source: LAC Electricity Benchmarking Database, The World Bank, 2007.
- South America (GRP 2) -
TOTEX per Connection (in US$/yr)
0
200
400
600
1995 2000 2005year
CRI BLZ SLV GTM
HND NIC PAN DOM
Source: LAC Electricity Benchmarking Database, The World Bank, 2007.
- Central America -
TOTEX per Connection (in US$/yr)
0
500
1000
1500
2000
2000 2001 2002 2003 2004 2005year
ATG DMA GRD
KNA LCA VCT
Source: LAC Electricity Benchmarking Database, The World Bank, 2007.
- Caribe -
TOTEX per Connection (in US$/yr)
050
100
150
200
1995 2000 2005year
ARG BRA COL
MEX PER VEN
Source: LAC Electricity Benchmarking Database, The World Bank, 2007.
- South America & Mexico (GRP 1) -
TOTEX per MWh Sold (in US$/yr)
050
100
150
200
1995 2000 2005year
BOL CHL ECU
PRY URY
Source: LAC Electricity Benchmarking Database, The World Bank, 2007.
- South America (GRP 2) -
TOTEX per MWh Sold (in US$/yr)
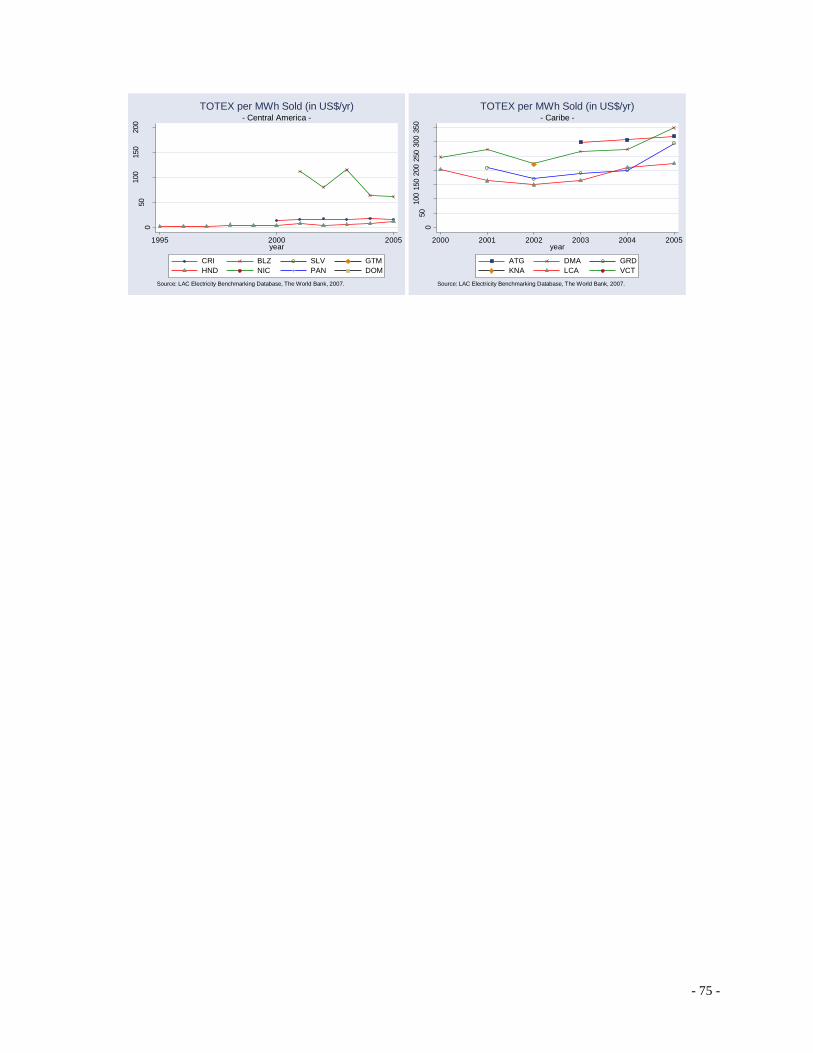
- 75 -
050
100
150
200
1995 2000 2005year
CRI BLZ SLV GTM
HND NIC PAN DOM
Source: LAC Electricity Benchmarking Database, The World Bank, 2007.
- Central America -
TOTEX per MWh Sold (in US$/yr)
050
100
150
200
250
300
350
2000 2001 2002 2003 2004 2005year
ATG DMA GRD
KNA LCA VCT
Source: LAC Electricity Benchmarking Database, The World Bank, 2007.
- Caribe -
TOTEX per MWh Sold (in US$/yr)

- 76 -
ANNEX 5 –TOP TEN AND BOTTOM TEN PERCENT PUBLIC AND
PRIVATE DISTRIBUTION UTILITIES
The following graphs provide further comparison of the top ten and bottom ten percent public and private
utilities when measuring coverage, quality of service, tariffs, OPEX, CAPEX, and TOTEX. When assessing
coverage and the quality of service, the top ten percent private utilities performed better than the top ten percent
public utilities. However, in the case of the average duration per connection, the average public utilities out-
performed the average private utilities. With regards to tariffs, private utilities charged more than public utilities yet
public utilities exhibited a higher rate of growth throughout the last ten years. Finally, while there are no clear trends
that delineate OPEX and CAPEX, on average, OPEX and CAPEX are higher for public utilities and are mostly
accompanied by increasing trends.
.4.6
.81
1995 2000 2005year
Bottom 10% Mean Top 10%
Source: LAC Electricity Benchmarking Database, The World Bank, 2007.
Public - Electricity Coverage
.4.6
.81
1995 2000 2005year
Bottom 10% Mean Top 10%
Source: LAC Electricity Benchmarking Database, The World Bank, 2007.
Private - Electricity Coverage
050
100
150
1995 2000 2005year
Bottom 10% Mean Top 10%
Source: LAC Electricity Benchmarking Database, The World Bank, 2007.
Public - Avg Duration of Interruptions per Connection (#/yr)
050
100
150
1995 2000 2005year
Bottom 10% Mean Top 10%
Source: LAC Electricity Benchmarking Database, The World Bank, 2007.
Private - Avg Duration of Interruptions per Connection (#/yr)
50
100
150
200
1995 2000 2005year
Bottom 10% Mean Top 10%
Source: LAC Electricity Benchmarking Database, The World Bank, 2007.
Public - Average Residential Tariffs (dollars/MWh)
50
100
150
200
1995 2000 2005year
Bottom 10% Mean Top 10%
Source: LAC Electricity Benchmarking Database, The World Bank, 2007.
Private - Average Residential Tariffs (dollars/MWh)

- 77 -
40
60
80
100
120
140
1995 2000 2005year
Bottom 10% Mean Top 10%
Source: LAC Electricity Benchmarking Database, The World Bank, 2007.
Private - Average Industrial Tariffs (dollars/MWh)
40
60
80
100
120
140
1995 2000 2005year
Bottom 10% Mean Top 10%
Source: LAC Electricity Benchmarking Database, The World Bank, 2007.
Public - Average Industrial Tariffs (dollars/MWh)
050
100
150
200
250
1995 2000 2005year
Bottom 10% Mean Top 10%
Source: LAC Electricity Benchmarking Database, The World Bank, 2007.
Public - OPEX per MWh sold (in dollars)
050
100
150
200
250
1995 2000 2005year
Bottom 10% Mean Top 10%
Source: LAC Electricity Benchmarking Database, The World Bank, 2007.
Private - OPEX per MWh sold (in dollars)
0
250
500
750
1000
1250
1995 2000 2005year
Bottom 10% Mean Top 10%
Source: LAC Electricity Benchmarking Database, The World Bank, 2007.
Public - OPEX per Connection (in dollars)
0
250
500
750
1000
1250
1995 2000 2005year
Bottom 10% Mean Top 10%
Source: LAC Electricity Benchmarking Database, The World Bank, 2007.
Private - OPEX per Connection (in dollars)
0
100
200
300
1995 2000 2005year
Bottom 10% Mean Top 10%
Source: LAC Electricity Benchmarking Database, The World Bank, 2007.
Public - CAPEX per MWh sold (in dollars)
0
100
200
300
1995 2000 2005year
Bottom 10% Mean Top 10%
Source: LAC Electricity Benchmarking Database, The World Bank, 2007.
Private - CAPEX per MWh sold (in dollars)

- 78 -
05
10
15
20
25
1995 2000 2005year
Bottom 10% Mean
Source: LAC Electricity Benchmarking Database, The World Bank, 2007.
Public - CAPEX per MWh sold (in dollars)
05
10
15
20
25
1995 2000 2005year
Bottom 10% Mean
Source: LAC Electricity Benchmarking Database, The World Bank, 2007.
Private - CAPEX per MWh sold (in dollars)
0
100
200
300
400
500
1995 2000 2005year
Bottom 10% Mean Top 10%
Source: LAC Electricity Benchmarking Database, The World Bank, 2007.
Public - CAPEX per Connection (in dollars)
0
100
200
300
400
500
1995 2000 2005year
Bottom 10% Mean Top 10%
Source: LAC Electricity Benchmarking Database, The World Bank, 2007.
Private - CAPEX per Connection (in dollars)
10
20
30
40
50
60
1995 2000 2005year
Bottom 10% Mean
Source: LAC Electricity Benchmarking Database, The World Bank, 2007.
Public - CAPEX per Connection (in dollars)
10
20
30
40
50
60
1995 2000 2005year
Bottom 10% Mean
Source: LAC Electricity Benchmarking Database, The World Bank, 2007.
Private - CAPEX per Connection (in dollars)
0
100
200
300
400
500
1995 2000 2005year
Bottom 10% Mean Top 10%
Source: LAC Electricity Benchmarking Database, The World Bank, 2007.
Public - TOTEX per MWh sold (in dollars)
0
100
200
300
400
500
1995 2000 2005year
Bottom 10% Mean Top 10%
Source: LAC Electricity Benchmarking Database, The World Bank, 2007.
Private - TOTEX per MWh sold (in dollars)

- 79 -
020
40
60
80
100
1995 2000 2005year
Bottom 10% Mean
Source: LAC Electricity Benchmarking Database, The World Bank, 2007.
Public - TOTEX per MWh sold (in dollars)
020
40
60
80
100
1995 2000 2005year
Bottom 10% Mean
Source: LAC Electricity Benchmarking Database, The World Bank, 2007.
Private - TOTEX per MWh sold (in dollars)
0
1000
2000
3000
1995 2000 2005year
Bottom 10% Mean Top 10%
Source: LAC Electricity Benchmarking Database, The World Bank, 2007.
Public - TOTEX per Connection (in dollars)
0
1000
2000
3000
1995 2000 2005year
Bottom 10% Mean Top 10%
Source: LAC Electricity Benchmarking Database, The World Bank, 2007.
Private - TOTEX per Connection (in dollars)
050
100
150
200
250
1995 2000 2005year
Bottom 10% Mean
Source: LAC Electricity Benchmarking Database, The World Bank, 2007.
Public - TOTEX per Connection (in dollars)
50
100
150
200
250
1995 2000 2005year
Bottom 10% Mean
Source: LAC Electricity Benchmarking Database, The World Bank, 2007.
Private - TOTEX per Connection (in dollars)
Related Documents