Benchmarking Alliances A Discussion Document from Alliance Best Practice

Benchmarking Alliances A Discussion Document from Alliance Best Practice.
Dec 25, 2015
Welcome message from author
This document is posted to help you gain knowledge. Please leave a comment to let me know what you think about it! Share it to your friends and learn new things together.
Transcript
Benchmarking Alliances
A Discussion Document from Alliance Best Practice
Understanding Begins with Insightful Questions – In other words good data = good decisions and bad data = bad decisions
What would ‘good’ data look like (as opposed to bad or misleading data)?
What should we measure and why?
What would a good benchmark overview report look like?
What are the proven common success factors (CSFs) in successful strategic alliances?
Why is benchmarking different from health checks?
What is the typical revenue increase after a benchmarking exercise?
Further Details
Issues addressed in this briefing pack
Why do some alliances succeed when others fail?
Has there ever been any structured research in this area?
Is there such a thing as alliance best practice?
Is there a common ‘language’ or approach which can be applied consistently across different types of relationships?
What are the limited things that we should focus our attention on to effect the greatest change?
“The most valuable information for corporate decision-making is concentrated in a relatively small number of sweet spots of information that flows through a corporation2”
What are the alliance sweet spots?
1 Anthony Robbins2 The Performance Manager Roland and Patrick Mosimann and Meg Dussault
Understanding begins with insightful questions1
1Every decision making cycle depends on finding the answers to three core questions;
How are we doing?
Why?
What should we be doing?
Today’s alliance manager needs integrated decision making ability in various user modes; Strategic, Managerial and Operational
1 The Performance Manager Roland and Patrick Mosimann and Meg Dussault 2007
Alliance decision making cycle
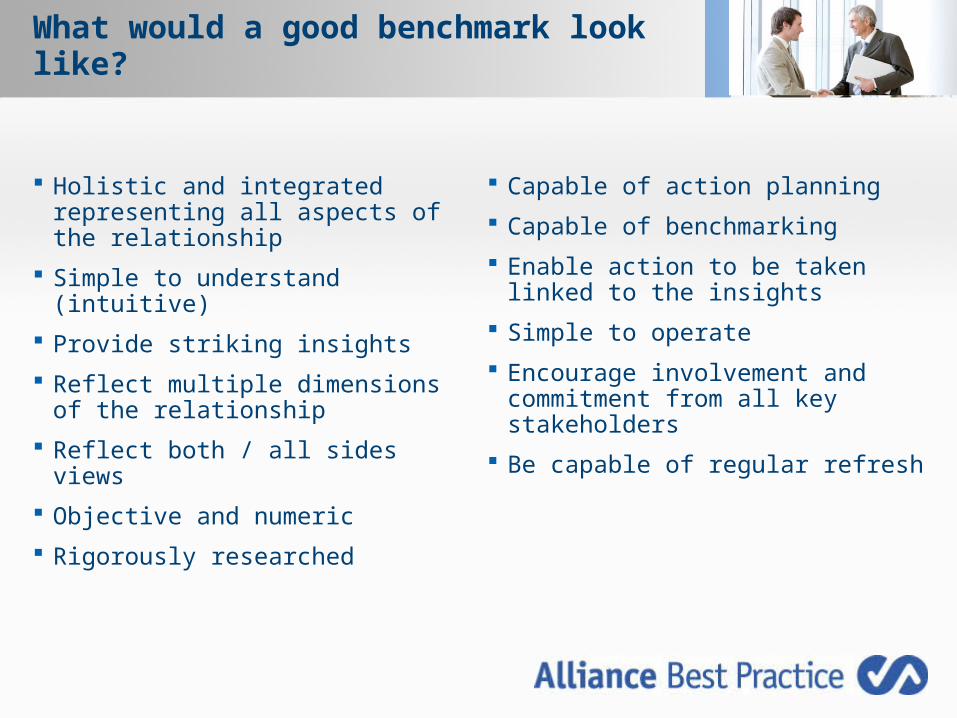
Holistic and integrated representing all aspects of the relationship
Simple to understand (intuitive)
Provide striking insights
Reflect multiple dimensions of the relationship
Reflect both / all sides views
Objective and numeric
Rigorously researched
Capable of action planning
Capable of benchmarking
Enable action to be taken linked to the insights
Simple to operate
Encourage involvement and commitment from all key stakeholders
Be capable of regular refresh
What would a good benchmark look like?
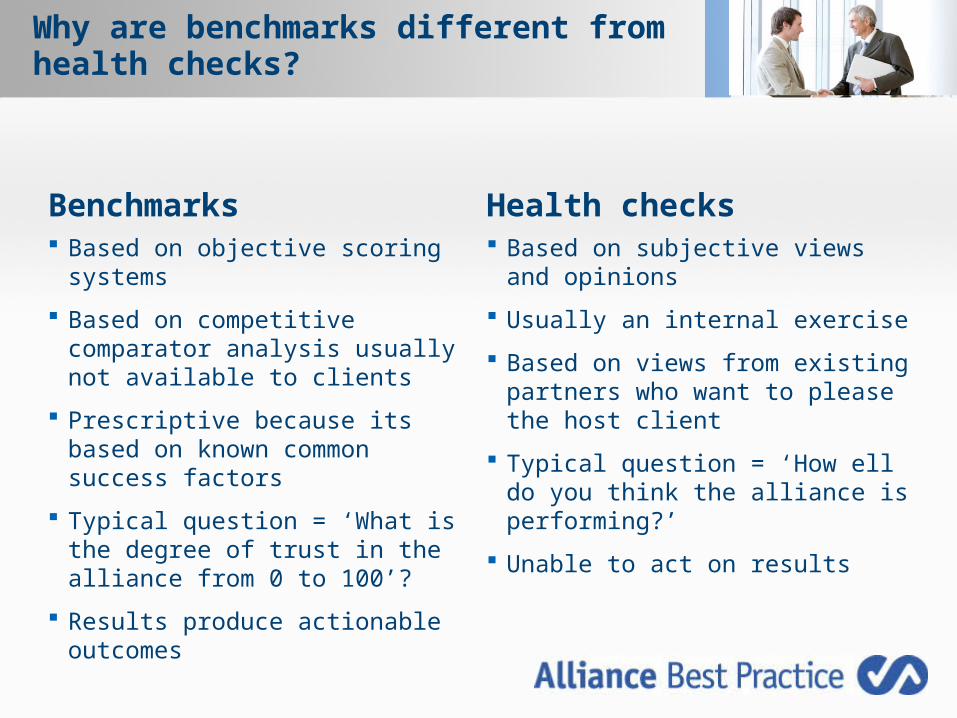
Benchmarks Based on objective scoring systems
Based on competitive comparator analysis usually not available to clients
Prescriptive because its based on known common success factors
Typical question = ‘What is the degree of trust in the alliance from 0 to 100’?
Results produce actionable outcomes
Health checks Based on subjective views and
opinions
Usually an internal exercise
Based on views from existing partners who want to please the host client
Typical question = ‘How ell do you think the alliance is performing?’
Unable to act on results
Why are benchmarks different from health checks?
0
10
20
30
40
50
60
70
80
90
100Co1
Co2 Co3Co4
Co5Co6
Co7Co8
Co9
Co10
T11
T12
T13
T14
T15
T16
T17
T18
T19
S20S21
S22S23
S24S25S26
S27S28S29
S30Cu31
Cu32
Cu33Cu34
Cu35
Cu36
Cu37
Cu38
O39
O40
O41
O42
O43
O44
O45
O46O47
O48O49
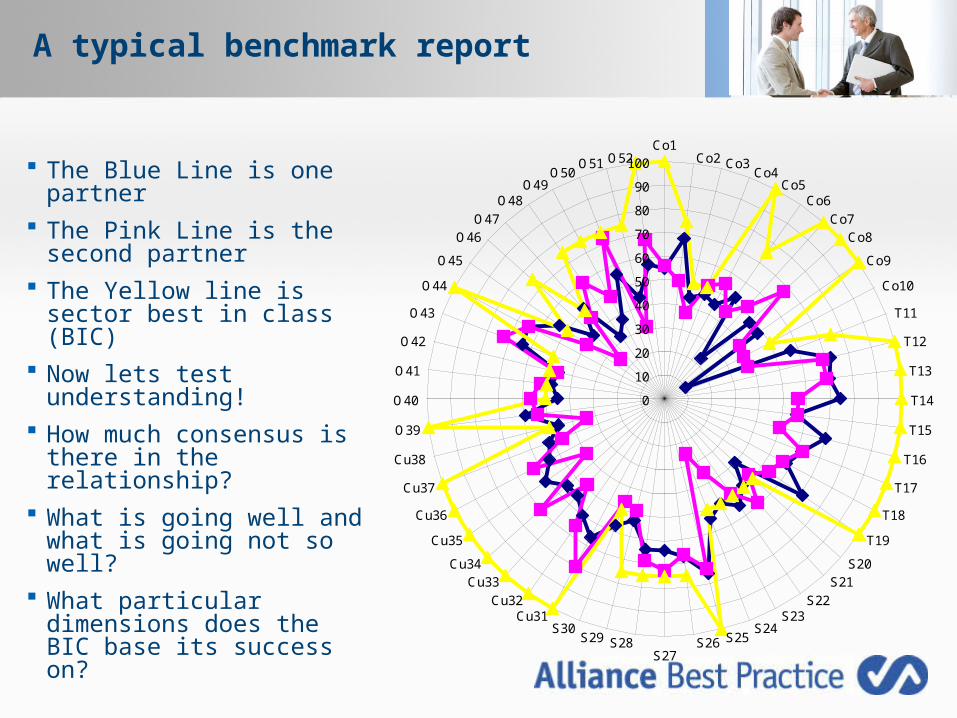
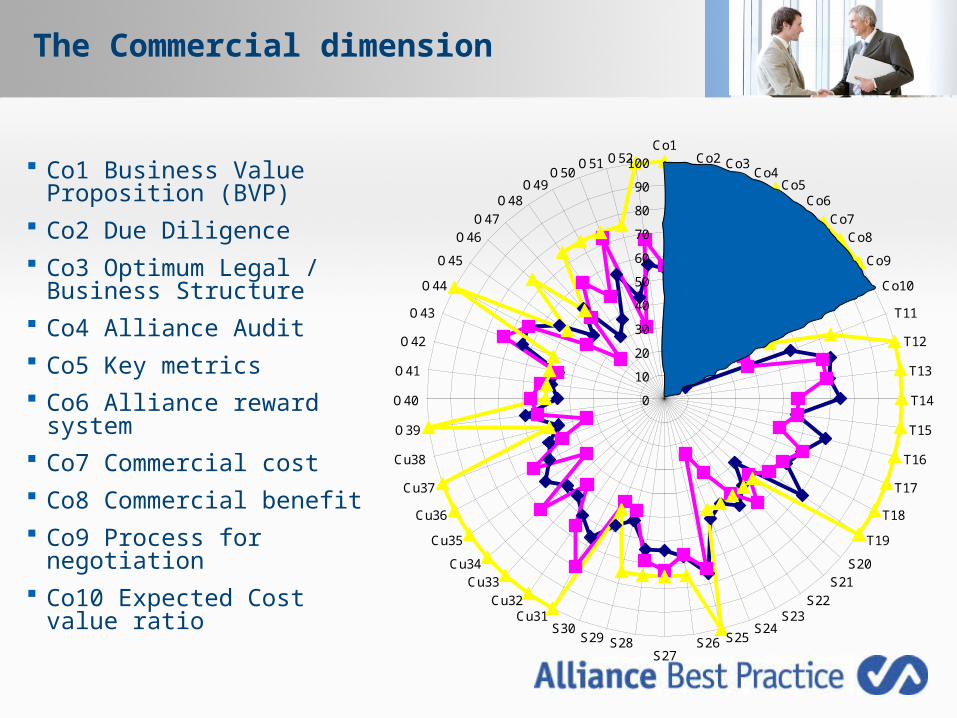
O50O51 O52 The Blue Line is one
partner The Pink Line is the
second partner The Yellow line is sector
best in class (BIC) Now lets test
understanding! How much consensus is
there in the relationship? What is going well and
what is going not so well? What particular
dimensions does the BIC base its success on?
A typical benchmark report
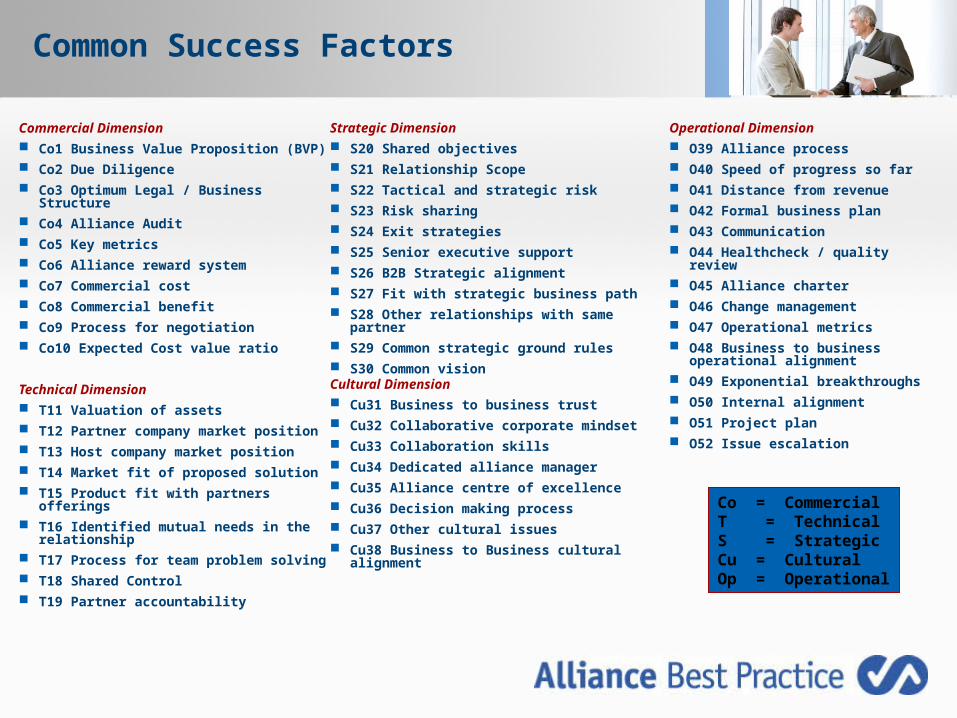
Commercial Dimension Co1 Business Value Proposition (BVP) Co2 Due Diligence Co3 Optimum Legal / Business
Structure Co4 Alliance Audit Co5 Key metrics Co6 Alliance reward system Co7 Commercial cost Co8 Commercial benefit Co9 Process for negotiation Co10 Expected Cost value ratio
Technical Dimension T11 Valuation of assets T12 Partner company market position T13 Host company market position T14 Market fit of proposed solution T15 Product fit with partners offerings T16 Identified mutual needs in the
relationship T17 Process for team problem solving T18 Shared Control T19 Partner accountability
Strategic Dimension S20 Shared objectives S21 Relationship Scope S22 Tactical and strategic risk S23 Risk sharing S24 Exit strategies S25 Senior executive support S26 B2B Strategic alignment S27 Fit with strategic business path S28 Other relationships with same
partner S29 Common strategic ground rules S30 Common visionCultural Dimension Cu31 Business to business trust Cu32 Collaborative corporate mindset Cu33 Collaboration skills Cu34 Dedicated alliance manager Cu35 Alliance centre of excellence Cu36 Decision making process Cu37 Other cultural issues Cu38 Business to Business cultural
alignment
Operational Dimension O39 Alliance process O40 Speed of progress so far O41 Distance from revenue O42 Formal business plan O43 Communication O44 Healthcheck / quality
review O45 Alliance charter O46 Change management O47 Operational metrics O48 Business to business
operational alignment O49 Exponential breakthroughs O50 Internal alignment O51 Project plan O52 Issue escalation
Co = CommercialT = TechnicalS = StrategicCu = CulturalOp = Operational
Common Success Factors
Co1 Business Value Proposition (BVP)
Co2 Due Diligence Co3 Optimum Legal /
Business Structure Co4 Alliance Audit Co5 Key metrics Co6 Alliance reward
system Co7 Commercial cost Co8 Commercial benefit Co9 Process for
negotiation Co10 Expected Cost value
ratio
0
10
20
30
40
50
60
70
80
90
100Co1
Co2 Co3Co4
Co5Co6
Co7Co8
Co9
Co10
T11
T12
T13
T14
T15
T16
T17
T18
T19
S20S21
S22S23
S24S25S26
S27S28S29
S30Cu31
Cu32
Cu33Cu34
Cu35
Cu36
Cu37
Cu38
O39
O40
O41
O42
O43
O44
O45
O46O47
O48O49
O50O51 O52
The Commercial dimension
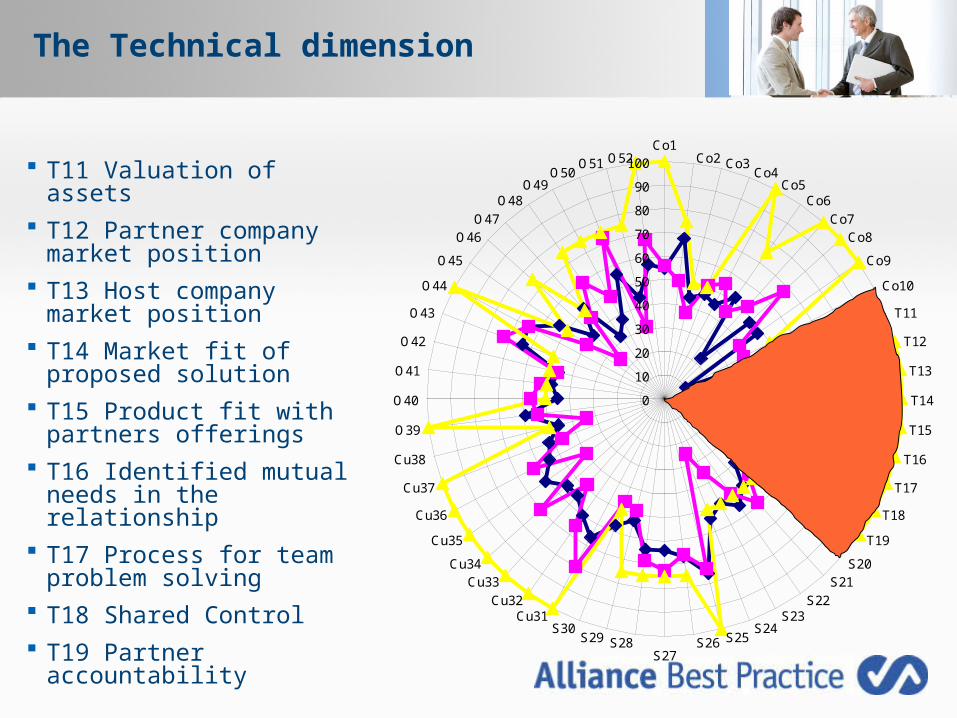
T11 Valuation of assets T12 Partner company
market position T13 Host company market
position T14 Market fit of proposed
solution T15 Product fit with
partners offerings T16 Identified mutual
needs in the relationship T17 Process for team
problem solving T18 Shared Control T19 Partner accountability
0
10
20
30
40
50
60
70
80
90
100Co1
Co2 Co3Co4
Co5Co6
Co7Co8
Co9
Co10
T11
T12
T13
T14
T15
T16
T17
T18
T19
S20S21
S22S23
S24S25S26
S27S28S29
S30Cu31
Cu32
Cu33Cu34
Cu35
Cu36
Cu37
Cu38
O39
O40
O41
O42
O43
O44
O45
O46O47
O48O49
O50O51 O52
The Technical dimension
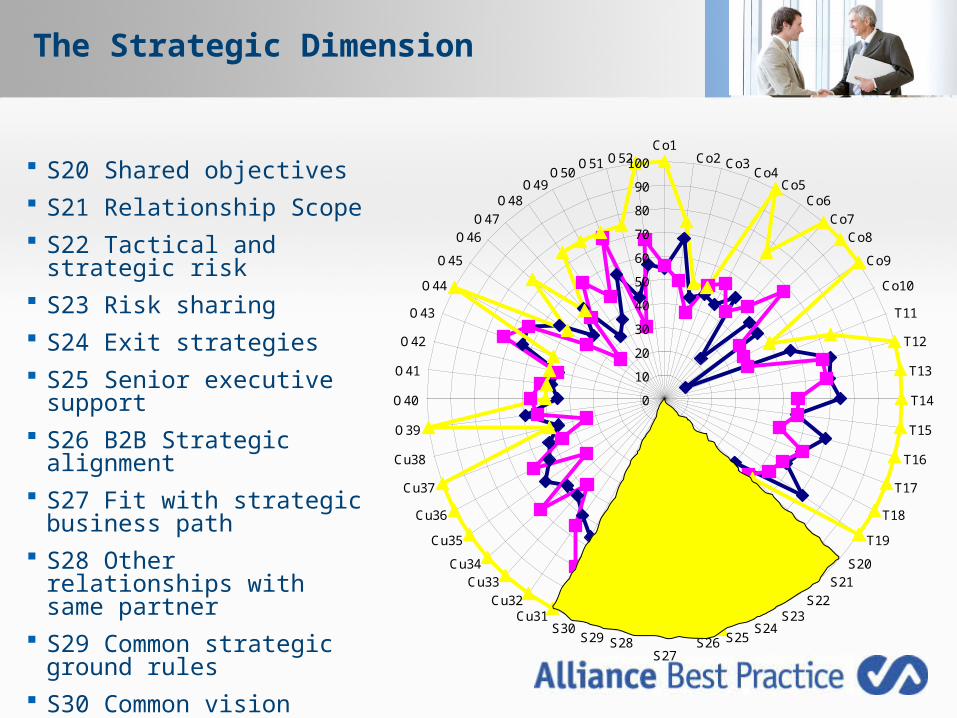
S20 Shared objectives S21 Relationship Scope S22 Tactical and strategic
risk S23 Risk sharing S24 Exit strategies S25 Senior executive
support S26 B2B Strategic
alignment S27 Fit with strategic
business path S28 Other relationships
with same partner S29 Common strategic
ground rules S30 Common vision
0
10
20
30
40
50
60
70
80
90
100Co1
Co2 Co3Co4
Co5Co6
Co7Co8
Co9
Co10
T11
T12
T13
T14
T15
T16
T17
T18
T19
S20S21
S22S23
S24S25S26
S27S28S29
S30Cu31
Cu32
Cu33Cu34
Cu35
Cu36
Cu37
Cu38
O39
O40
O41
O42
O43
O44
O45
O46O47
O48O49
O50O51 O52
The Strategic Dimension
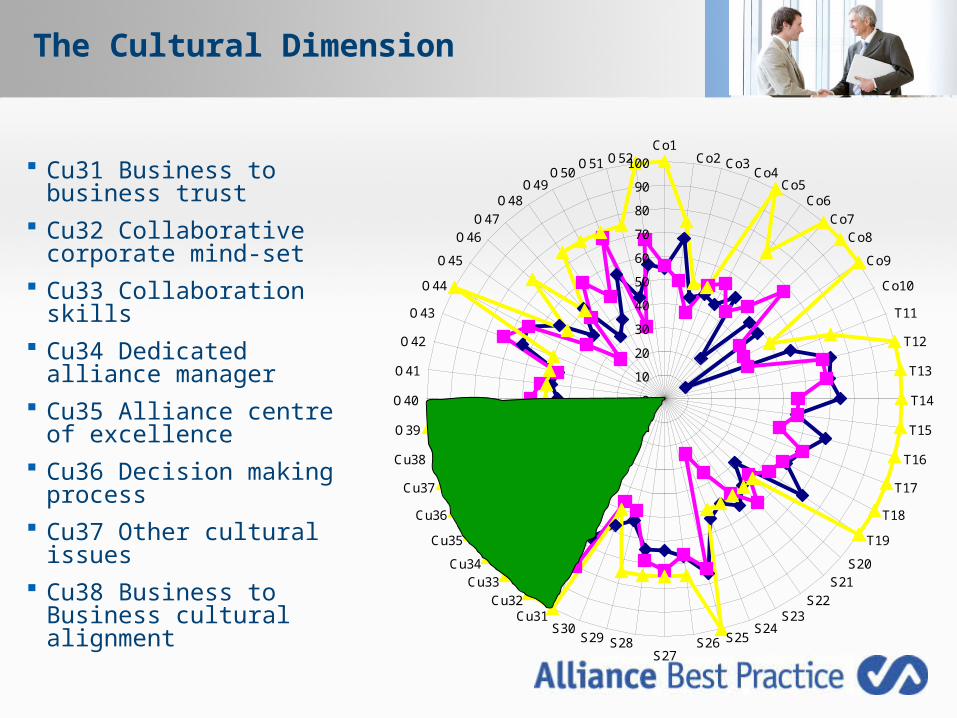
Cu31 Business to business trust
Cu32 Collaborative corporate mind-set
Cu33 Collaboration skills Cu34 Dedicated alliance
manager Cu35 Alliance centre of
excellence Cu36 Decision making
process Cu37 Other cultural issues Cu38 Business to
Business cultural alignment
0
10
20
30
40
50
60
70
80
90
100Co1
Co2 Co3Co4
Co5Co6
Co7Co8
Co9
Co10
T11
T12
T13
T14
T15
T16
T17
T18
T19
S20S21
S22S23
S24S25S26
S27S28S29
S30Cu31
Cu32
Cu33Cu34
Cu35
Cu36
Cu37
Cu38
O39
O40
O41
O42
O43
O44
O45
O46O47
O48O49
O50O51 O52
The Cultural Dimension
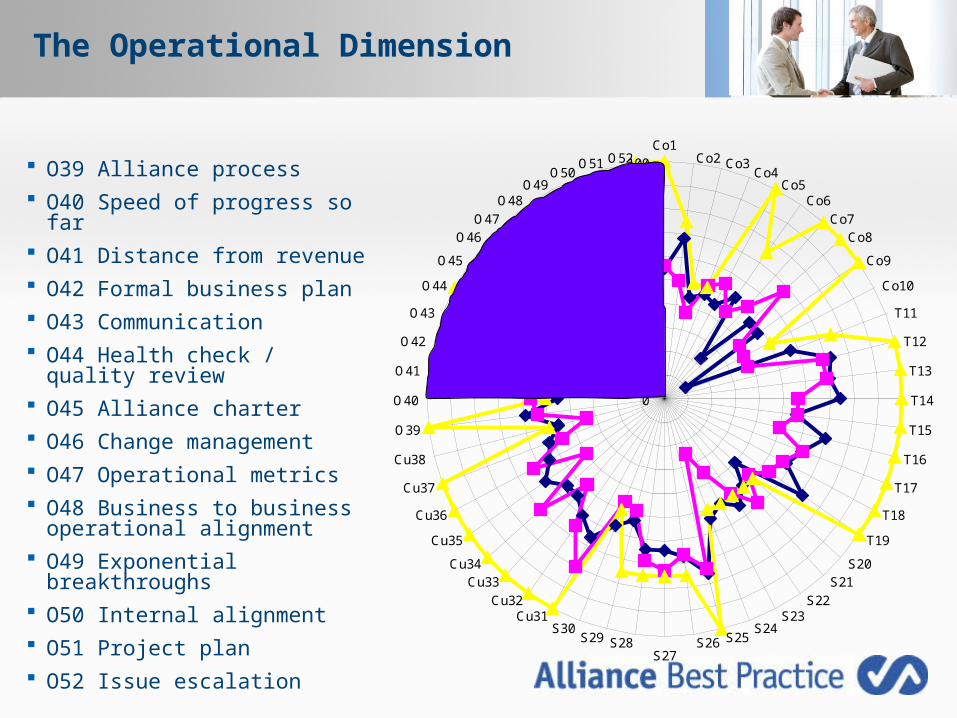
O39 Alliance process O40 Speed of progress so far O41 Distance from revenue O42 Formal business plan O43 Communication O44 Health check / quality
review O45 Alliance charter O46 Change management O47 Operational metrics O48 Business to business
operational alignment O49 Exponential
breakthroughs O50 Internal alignment O51 Project plan O52 Issue escalation
0
10
20
30
40
50
60
70
80
90
100Co1
Co2 Co3Co4
Co5Co6
Co7Co8
Co9
Co10
T11
T12
T13
T14
T15
T16
T17
T18
T19
S20S21
S22S23
S24S25S26
S27S28S29
S30Cu31
Cu32
Cu33Cu34
Cu35
Cu36
Cu37
Cu38
O39
O40
O41
O42
O43
O44
O45
O46O47
O48O49
O50O51 O52
The Operational Dimension
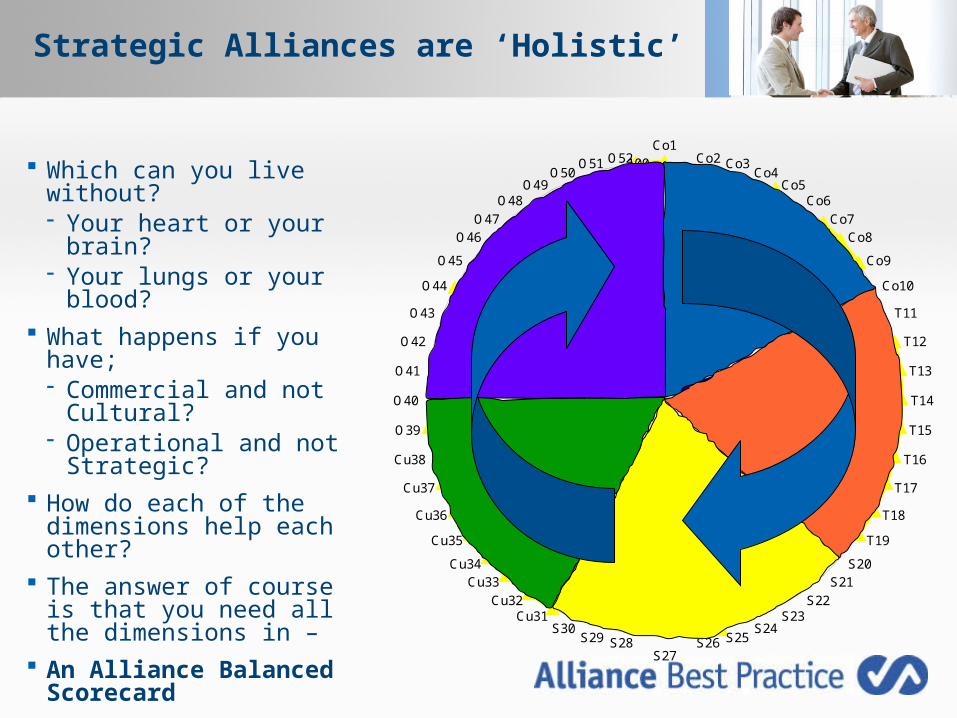
Which can you live without?- Your heart or your brain?- Your lungs or your
blood? What happens if you
have;- Commercial and not
Cultural?- Operational and not
Strategic? How do each of the
dimensions help each other?
The answer of course is that you need all the dimensions in –
An Alliance Balanced Scorecard
0
10
20
30
40
50
60
70
80
90
100Co1
Co2 Co3Co4
Co5Co6
Co7Co8
Co9
Co10
T11
T12
T13
T14
T15
T16
T17
T18
T19
S20S21
S22S23
S24S25S26
S27S28S29
S30Cu31
Cu32
Cu33Cu34
Cu35
Cu36
Cu37
Cu38
O39
O40
O41
O42
O43
O44
O45
O46O47
O48O49
O50O51 O52
Strategic Alliances are ‘Holistic’
0
10
20
30
40
50
60
70
80
90
100Co1
Co2 Co3Co4
Co5Co6
Co7Co8
Co9
Co10
T11
T12
T13
T14
T15
T16
T17
T18
T19
S20S21
S22S23
S24S25S26
S27S28S29
S30Cu31
Cu32
Cu33Cu34
Cu35
Cu36
Cu37
Cu38
O39
O40
O41
O42
O43
O44
O45
O46O47
O48O49
O50O51 O52
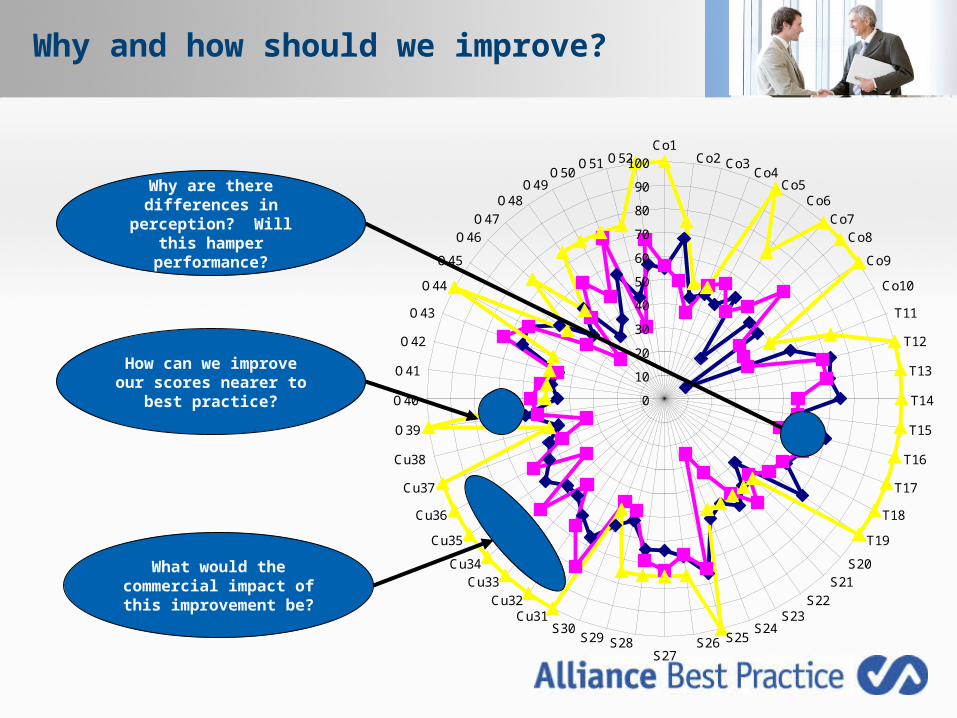
Why are there differences in perception? Will this hamper performance?
How can we improve our scores nearer to best
practice?
What would the commercial impact of this
improvement be?
Why and how should we improve?
0
10
20
30
40
50
60
70
80
90
100Co1
Co2 Co3Co4
Co5Co6
Co7Co8
Co9
Co10
T11
T12
T13
T14
T15
T16
T17
T18
T19
S20S21
S22S23
S24S25S26
S27S28S29
S30Cu31
Cu32
Cu33Cu34
Cu35
Cu36
Cu37
Cu38
O39
O40
O41
O42
O43
O44
O45
O46O47
O48O49
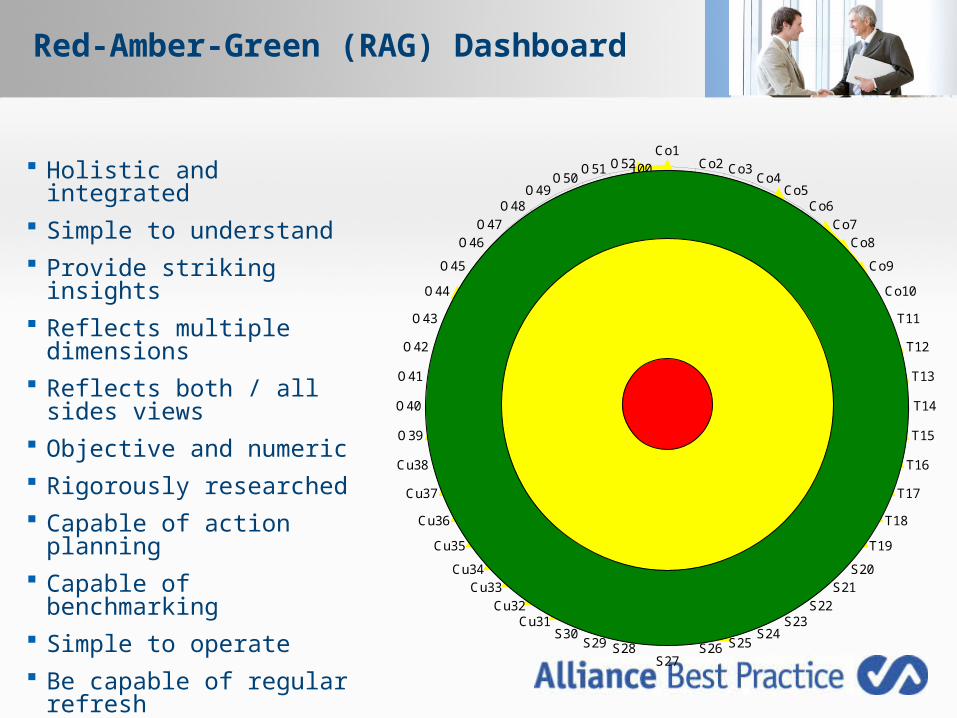
O50O51 O52 Holistic and integrated
Simple to understand Provide striking insights Reflects multiple
dimensions Reflects both / all sides
views Objective and numeric Rigorously researched Capable of action
planning Capable of benchmarking Simple to operate Be capable of regular
refresh
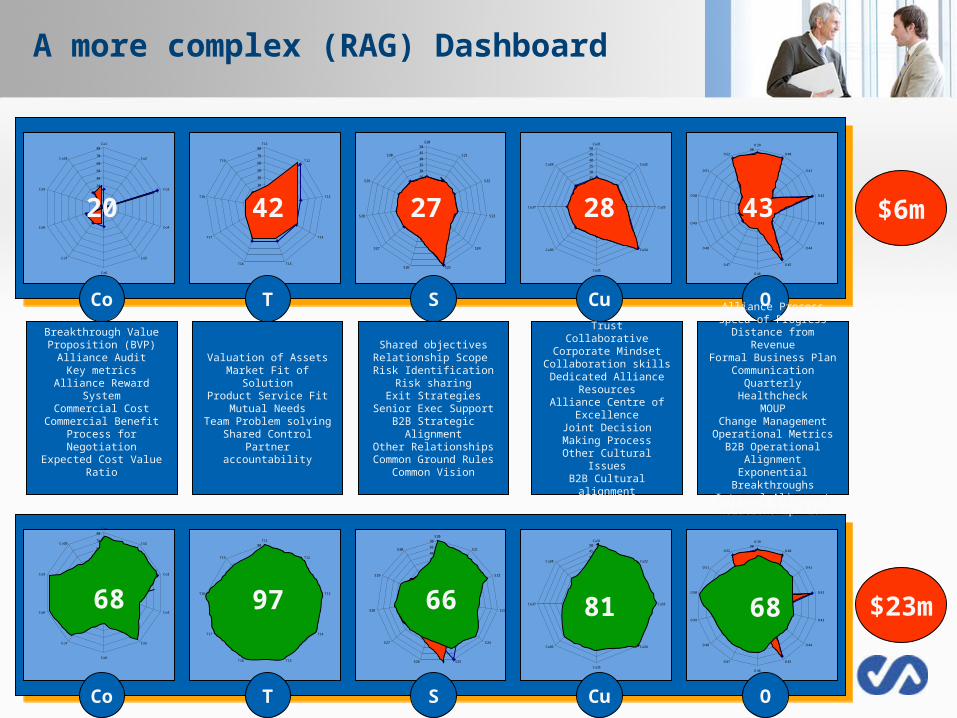
Red-Amber-Green (RAG) Dashboard
0
10
20
30
40
50
60
70
80Co1
Co2
Co3
Co4
Co5
Co6
Co7
Co8
Co9
Co10
0
10
20
30
40
50
60
70
80T11
T12
T13
T14
T15T16
T17
T18
T19
0
5
10
15
20
25
30
35
40
45
50S20
S21
S22
S23
S24
S25S26
S27
S28
S29
S30
0
5
10
15
20
25
30
35
40
45
50Cu31
Cu32
Cu33
Cu34
Cu35
Cu36
Cu37
Cu38
0
10
20
30
40
50
60
70
80O39
O40
O41
O42
O43
O44
O45
O46
O47
O48
O49
O50
O51
O52
$6m
Co T S Cu O
0
10
20
30
40
50
60
70
80Co1
Co2
Co3
Co4
Co5
Co6
Co7
Co8
Co9
Co10
0
10
20
30
40
50
60
70
80T11
T12
T13
T14
T15T16
T17
T18
T19
0
5
10
15
20
25
30
35
40
45
50S20
S21
S22
S23
S24
S25S26
S27
S28
S29
S30
0
5
10
15
20
25
30
35
40
45
50Cu31
Cu32
Cu33
Cu34
Cu35
Cu36
Cu37
Cu38
0
10
20
30
40
50
60
70
80O39
O40
O41
O42
O43
O44
O45
O46
O47
O48
O49
O50
O51
O52
$23m
Co T S Cu O
68 97 66 81 68
20 42 27 28 43
Valuation of AssetsMarket Fit of SolutionProduct Service Fit
Mutual NeedsTeam Problem solving
Shared ControlPartner accountability
Breakthrough Value Proposition (BVP)
Alliance AuditKey metrics
Alliance Reward SystemCommercial Cost
Commercial BenefitProcess for Negotiation
Expected Cost Value Ratio
Shared objectivesRelationship Scope Risk Identification
Risk sharingExit Strategies
Senior Exec SupportB2B Strategic Alignment
Other RelationshipsCommon Ground Rules
Common Vision
TrustCollaborative Corporate
MindsetCollaboration skillsDedicated Alliance
ResourcesAlliance Centre of
ExcellenceJoint Decision Making
ProcessOther Cultural Issues
B2B Cultural alignment
Alliance ProcessSpeed of Progress
Distance from RevenueFormal Business Plan
CommunicationQuarterly Healthcheck
MOUPChange ManagementOperational Metrics
B2B Operational AlignmentExponential Breakthroughs
Internal AlignmentRelationship Plan
A more complex (RAG) Dashboard
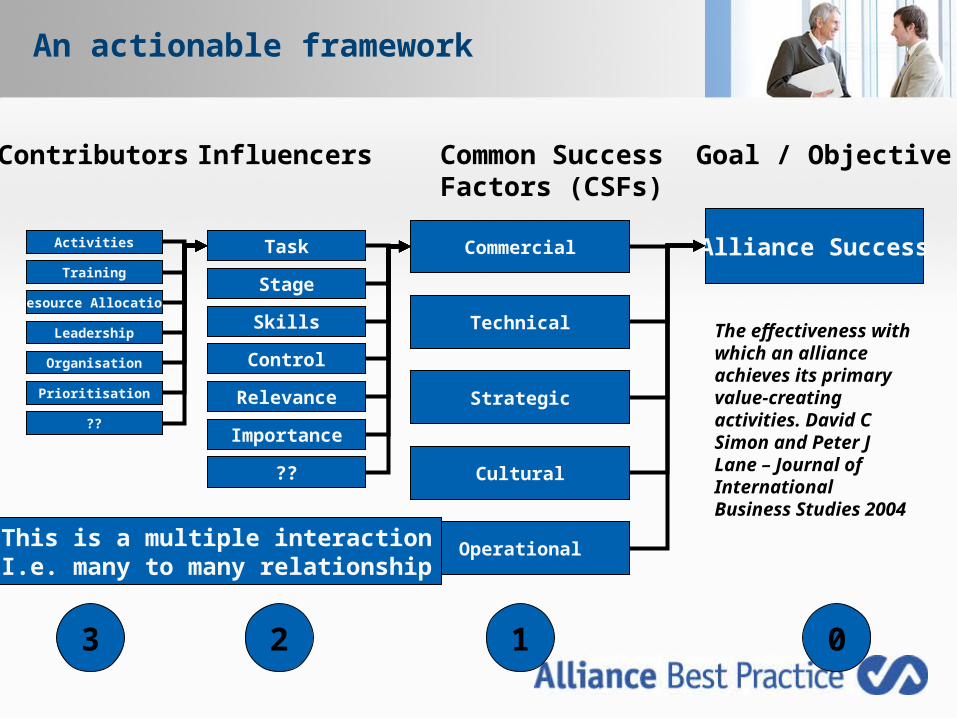
Alliance Success
The effectiveness with which an alliance achieves its primary value-creating activities. David C Simon and Peter J Lane – Journal of International Business Studies 2004
Commercial
Technical
Strategic
Cultural
Operational
Goal / ObjectiveCommon SuccessFactors (CSFs)
InfluencersContributors
Task
Relevance
Stage
Control
Skills
??
Importance
Activities
Organisation
Training
Resource Allocation
Leadership
Prioritisation
123 0
??
This is a multiple interactionI.e. many to many relationship
An actionable framework
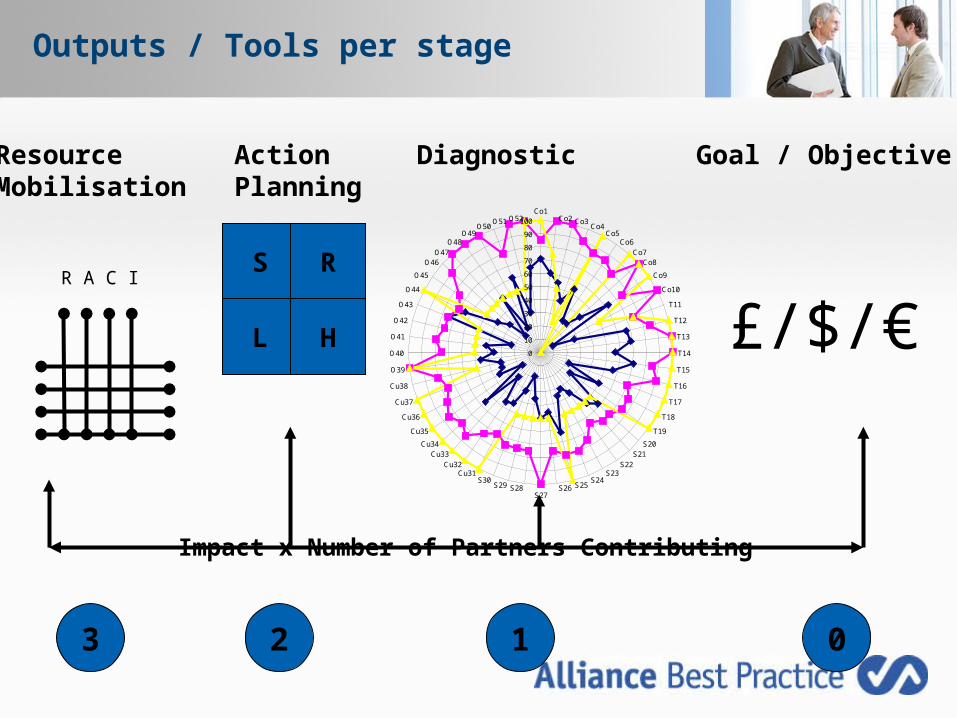
Goal / ObjectiveDiagnosticActionPlanning
ResourceMobilisation
123 0
0
10
20
30
40
50
60
70
80
90
100Co1
Co2 Co3Co4
Co5Co6
Co7Co8
Co9
Co10
T11
T12
T13
T14
T15
T16
T17
T18
T19
S20S21
S22S23
S24S25S26
S27S28S29
S30Cu31
Cu32
Cu33Cu34
Cu35
Cu36
Cu37
Cu38
O39
O40
O41
O42
O43
O44
O45
O46O47
O48O49
O50O51 O52
£/$/€S
L
R
H
Impact x Number of Partners Contributing
R A C I
Outputs / Tools per stage
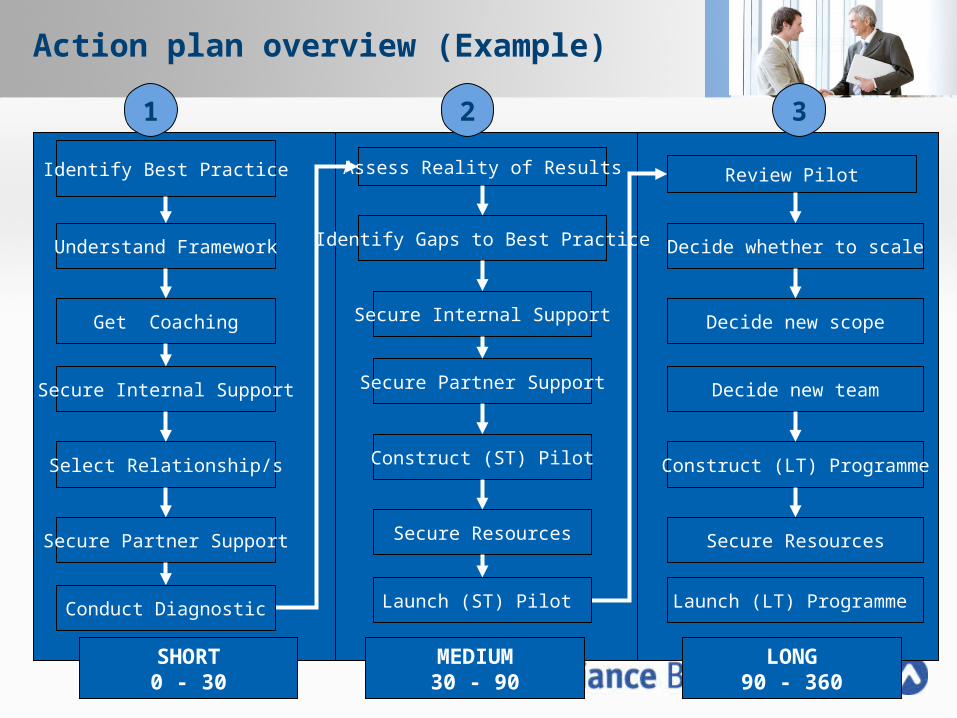
Identify Best Practice Assess Reality of Results Review Pilot
Understand Framework
Get Coaching
Select Relationship/s
Secure Internal Support
Identify Gaps to Best Practice
Construct (ST) Pilot
Secure Partner Support
Secure Partner Support
Conduct Diagnostic
SHORT0 - 30
MEDIUM30 - 90
LONG90 - 360
Secure Internal Support
Secure Resources
Launch (ST) Pilot
Decide whether to scale
Construct (LT) Programme
Decide new team
Decide new scope
Secure Resources
Launch (LT) Programme
1 2 3
Action plan overview (Example)
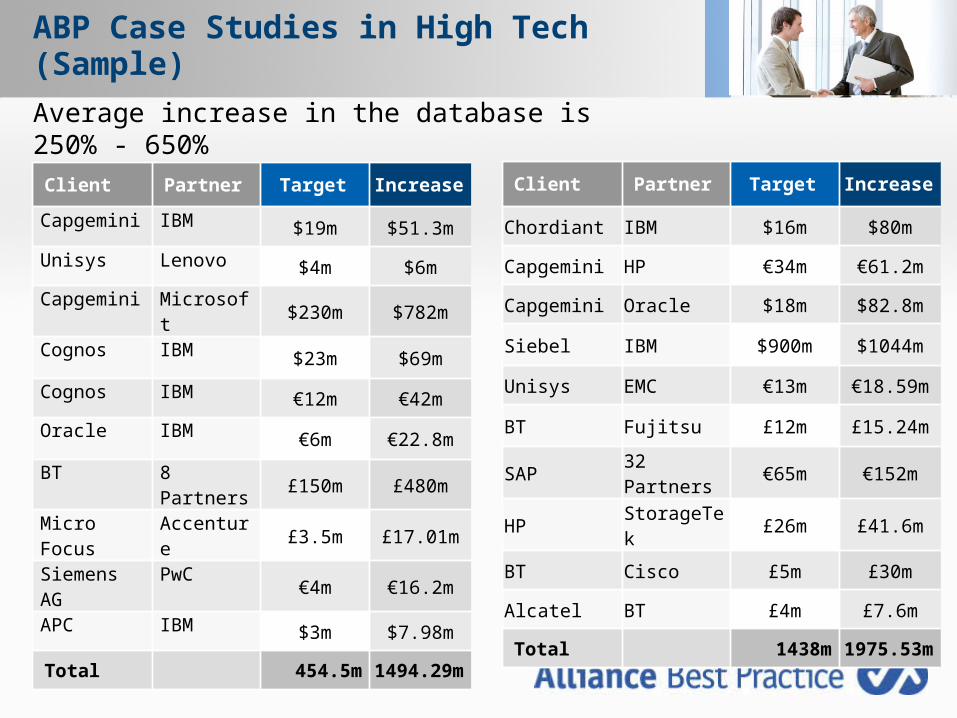
ABP Case Studies in High Tech (Sample)
Average increase in the database is 250% - 650%
Client Partner Target Increase
Capgemini IBM $19m $51.3m
Unisys Lenovo $4m $6m
Capgemini Microsoft $230m $782m
Cognos IBM $23m $69m
Cognos IBM €12m €42m
Oracle IBM €6m €22.8m
BT 8 Partners £150m £480m
Micro Focus
Accenture £3.5m £17.01m
Siemens AG
PwC€4m €16.2m
APC IBM $3m $7.98m
Total 454.5m 1494.29m
Client Partner Target Increase
Chordiant IBM $16m $80m
Capgemini HP €34m €61.2m
Capgemini Oracle $18m $82.8m
Siebel IBM $900m $1044m
Unisys EMC €13m €18.59m
BT Fujitsu £12m £15.24m
SAP32 Partners
€65m €152m
HP StorageTek £26m £41.6m
BT Cisco £5m £30m
Alcatel BT £4m £7.6m
Total 1438m 1975.53m
Further Details
For further details please contact;
Mike Nevin
Managing Partner
Alliance Best Practice Ltd
Web: www.alliancebestpractice.com
Office: +44 (0)1675 442490
Mobile: +44 (0)7766 752350
E Mail: [email protected]
Related Documents