Benchmarking a Child Nutrition Program against Cash: Experimental Evidence from Rwanda ⇤ Craig McIntosh † and Andrew Zeitlin ‡ June 15, 2018 Abstract We present the results of a study designed to ‘benchmark’ a major USAID-funded child malnutrition program against what would have occurred if the cost of the program had simply been disbursed directly to beneficiaries to spend as they see fit. Using a three- armed trial from 248 villages in Rwanda, the study measures impacts on households containing poor or underweight children, or pregnant or lactating women, as well as the broader population of study villages. We find that the bundled health program delivers benefits in an outcome directly targeted by specific sub-components of the intervention (savings), but does not improve household dietary diversity, child anthropometrics, or anemia within the year of the study. A cost-equivalent cash transfer boosts productive asset investment and allows households to pay down debt. The bundled program is significantly better in cost-equivalent terms at generating savings and worse for debt reduction, while cost-equivalent cash drives more asset investment. A much larger cash transfer of more than $500 per household improves a wide range of consumption measures including dietary diversity, as well as savings, assets, and housing values. Only the large cash transfer shows evidence of moving child outcomes, with significant but modest improvements in child height-for-age, weight-for-age, and mid upper-arm circumference (about 0.1 SD). The results indicate that programs targeted towards driving specific outcomes can do so at lower cost than cash, but large cash transfers drive substantial benefits across a wide range of impacts, including many of those targeted by the more tailored program. Keywords: Experimental Design, Cash Transfers, Malnutrition JEL Codes: O12, C93, I15 ⇤ We are grateful to DIV, Google.org, and USAID Rwanda for funding, and to USAID, CRS, GiveDirectly, and IPA for their close collaboration. We thank Leodimir Mfura and Marius Chabi for overseeing the fieldwork, and Richard Appell, Sarait Cardenas-Rodriguez, Chris Gray, Ali Hamza, and Bastien Koch for research assistance. This project is covered by Rwanda National Ethics Committee IRB 143/RNEC/2017 and IPA IRB 13730, and the study is pre-registered with the AEA as trial AEARCTR-0002559. † University of California, San Diego, [email protected] ‡ Georgetown University, [email protected]

Welcome message from author
This document is posted to help you gain knowledge. Please leave a comment to let me know what you think about it! Share it to your friends and learn new things together.
Transcript

Benchmarking a Child Nutrition Program against Cash:
Experimental Evidence from Rwanda
⇤
Craig McIntosh
†and Andrew Zeitlin
‡
June 15, 2018
Abstract
We present the results of a study designed to ‘benchmark’ a major USAID-fundedchild malnutrition program against what would have occurred if the cost of the programhad simply been disbursed directly to beneficiaries to spend as they see fit. Using a three-armed trial from 248 villages in Rwanda, the study measures impacts on householdscontaining poor or underweight children, or pregnant or lactating women, as well as thebroader population of study villages. We find that the bundled health program deliversbenefits in an outcome directly targeted by specific sub-components of the intervention(savings), but does not improve household dietary diversity, child anthropometrics, oranemia within the year of the study. A cost-equivalent cash transfer boosts productiveasset investment and allows households to pay down debt. The bundled program issignificantly better in cost-equivalent terms at generating savings and worse for debtreduction, while cost-equivalent cash drives more asset investment. A much larger cashtransfer of more than $500 per household improves a wide range of consumption measuresincluding dietary diversity, as well as savings, assets, and housing values. Only the largecash transfer shows evidence of moving child outcomes, with significant but modestimprovements in child height-for-age, weight-for-age, and mid upper-arm circumference(about 0.1 SD). The results indicate that programs targeted towards driving specificoutcomes can do so at lower cost than cash, but large cash transfers drive substantialbenefits across a wide range of impacts, including many of those targeted by the moretailored program.
Keywords: Experimental Design, Cash Transfers, Malnutrition
JEL Codes: O12, C93, I15
⇤We are grateful to DIV, Google.org, and USAID Rwanda for funding, and to USAID, CRS,GiveDirectly, and IPA for their close collaboration. We thank Leodimir Mfura and Marius Chabi foroverseeing the fieldwork, and Richard Appell, Sarait Cardenas-Rodriguez, Chris Gray, Ali Hamza,and Bastien Koch for research assistance. This project is covered by Rwanda National EthicsCommittee IRB 143/RNEC/2017 and IPA IRB 13730, and the study is pre-registered with theAEA as trial AEARCTR-0002559.
†University of California, San Diego, [email protected]‡Georgetown University, [email protected]
Andrew Zeitlin
1 Introduction
This study experimentally evaluates the relative cost-effectiveness of alternative programs to im-
prove the nutritional status of vulnerable households. We pursue a cluster-randomized trial across
248 Rwandan villages to understand how a ‘standard’ package of nutritional, informational, and
savings interventions compares not only to an experimental control group but to an additional arm
that receives household grants of equal cost to the donor—a cash benchmark. The study follows
households with children under the age of five or women of reproductive age, with an emphasis
on the 1,000 day window of opportunity from pregnancy until a child’s second birthday (Currie
and Almond, 2011). The core program is called Gikuriro, which means ‘well-growing child’ in
Kinyarwanda; it follows USAID’s strategy on multi-dimensional approaches to malnutrition, and is
implemented by Catholic Relief Services. The benchmarking household grant program was imple-
mented by GiveDirectly, a US-based nonprofit that specializes in making unconditional household
grants via mobile money. These two treatments are compared to a control group, namely, a set of
villages that receive neither program.
This study conducts a type of cost-effectiveness benchmarking increasingly called for in recent
years: the comparison of a standard and widespread development intervention with the outcome that
would occur if the cost of the intervention were simply given away to the beneficiaries. Proponents
of cash transfers have suggested that they should be considered the ‘index funds’ of international
development, meaning a benchmark against which other programs are compared (Blattman and
Niehaus, 2014). Just as index funds have helped to provide a reference rate of return against which
fee-charging financial managers can be compared, cash transfers of equal cost to the implementer
provide an important counterfactual, and establish a hurdle rate that places the burden of proof
on complex, overhead-heavy development programs to show that they can justify their costs by
generating benefits superior to simply disbursing the cost of the program directly to beneficiaries.1
The appeal of cash transfer programs as a benchmark lies in their simplicity and scaleability, their
low overhead costs, and the extent to which they put aid beneficiaries in control of how resources
are allocated.
The momentum for benchmarking has built as numerous studies have shown meaningful impacts1For a discussion of the political economy and public finance dimensions of the tradeoffs between cash and in-kind
programs, see Currie and Gahvari (2008) and Jones et al. (2016).
2

of cash transfers on important life outcomes in the short term, such as child nutrition (Aguero et
al., 2006; Seidenfeld et al., 2014), schooling (Skoufias et al., 2001), mental health (Baird et al., 2013;
Samuels and Stavropoulou, 2016), teen pregnancy and HIV (Baird et al., 2011), microenterprise
outcomes (De Mel et al., 2012), consumer durables (Haushofer and Shapiro, 2016), and productive
assets (Gertler et al., 2012). The evidence on the long-term impacts of cash transfers is more mixed,
but some studies have found substantial impacts (Aizer et al., 2016; Barham et al., 2014; Fernald
et al., 2009; Hoynes et al., 2016).2 The largest extant literature on benchmarking is based on the
comparison of cash aid to food aid (Ahmed et al., 2016; Cunha et al., forthcoming; Hidrobo et
al., 2014; Hoddinott et al., 2014; Leroy et al., 2010; Schwab et al., 2013), which has uncovered a
fairly consistent result that food aid leads to a larger change in total calories while cash aid leads
to an improvement in the diversity of foods consumed. Efforts to benchmark more complex, multi-
dimensional programs against cash include BRAC’s Targeting the Ultra-Poor program (Chowdhury
et al., 2016), microfranchising (Brudevold-Newman et al., 2017), agricultural inputs (Brudevold-
Newman et al., 2017), and sustainable livelihoods (Sedlmayr et al., 2017). These studies have
typically struggled with the question of how to anticipate costs and compliance well enough to realize
an exact cost-equivalent comparison after the fact. Our study provides a methodology incorporating
randomization of transfer amounts and ex-post, regression-based cost adjustment that can achieve
this objective in a general way.
Using a village-level randomization across 248 villages, we compare the Gikuriro program to
cash transfers.3 Gikuriro deploys the type of multi-pronged approach advocated by Ruel et al.
(2013), in which the program aims to improve child nutrition through superior information, direct
transfer of productive assets, and improvements in household diet and santation. A similar program
in adjacent Burundi was found to decrease child and maternal anemia (Leroy et al., 2016). Gikuriro
consists of four components targeted directly at beneficiary households: a Village Nutritional School,
Farmer Field Learning Schools, Savings and Internal Lending Communities (SILCs), and a Water,
Sanitation, and Hygiene (WASH) intervention), as well as a Behavior Change Communication2For examples of studies that find dissipating long-term benefits, see Baird et al. (2016) and Araujo et al. (2017).
Evidence from systematic reviews of cash transfers on schooling (Molina-Millan et al., 2016) and child health (Manleyet al., 2013; Pega et al., 2014) has been similarly uneven.
3The village-level study design was motivated both by the clustered nature of the Gikuriro intervention, andhelps to allay concerns about the potential for negative spillovers of cash transfers on adjacent controls observed inHaushofer et al. (2015).
3

intervention implemented at the village level. This combination has been developed by CRS over the
course of many years implementing anti-malnutrition programs across the world. The cash transfer
arm, implemented by GiveDirectly, provided unconditional household grants via mobile money, an
intervention that has been found to improve consumption and/or dietary diversity in many contexts
across Sub-Saharan Africa (Aker et al., 2016; Haushofer and Shapiro, 2016). Transfer amounts
were randomized across villages, and within GiveDirectly villages we implemented a household-
level experiment whereby beneficiary households were randomized to receive one-time, lump-sum
transfers, a monthly flow of cash transfers over the duration of the study, or a choice between these
two alternatives.
The study takes place in Kayonza and Nyabihu, two districts that span the range of economic and
health outcomes observed in Rwanda.4 The endline survey took place 13 months after baseline, and
we measure impacts on five primary outcomes: (a) household consumption, (b) household dietary
diversity; (c) child and maternal anemia; (d) child growth; (e) value of household non-land net
wealth. These are outcomes chosen to balance the theories of change of the two implementers, as well
as being well documented in the literature as core drivers of improved long-run outcomes for children
(Hoddinott et al., 2013; Maluccio et al., 2009). In addition, we report impacts on a set of secondary
outcomes including borrowing and savings, fertility, health knowledge and sanitation practices,
diseases and mortality, household assets, and the quality of housing stock.5 Prior to randomization
the survey firm classified households as ‘eligible’ (identifiable using administrative data sources as
containing underweight children, or households in the bottom two income categories with children
5 years old or younger or with pregnant or lactating women), or ‘ineligible’ (everyone else). We can
therefore measure impacts both on the mutually agreed-upon intended target population as well as
on the study villages as a whole, even in the presence of potential differences in actual targeting
across implementers. We can use the eligible sample to estimate experimental intention-to-treat4Kayonza is a relatively prosperous district in the far East of the country, with a poverty rate of 24 percent
that ranks it behind only the three districts of Kigali NISR (2017). The relative prosperity of the Eastern Provinceis further reflected in child health measures: outside of Kigali Province, the Eastern Province had in the 2015Demographic and Health Surveys rates of stunting and underweight, at shares of under-five children with HAZ andWAZ below -2 standard deviations of 34.8 and 9.2 percent, respectively. However, this district was hit by a severedrought around the time of the baseline. Nyabihu is in the Northwest and is a relatively poor, mountainous, andremote area, with a poverty rate of nearly 40 percent placing it 16th in the country NISR (2017). The WesternProvince, in which Nyabihu is situated, ranks worst in the country on rates of children stunted and underweight, at44.9 and 10.1 percent, respectively (DHS, 2016).
5All primary and secondary outcomes were registered prior to receipt of endline data no the American EconomicAssociation RCT Registry, with ID AEARCTR-0002559.
4

effects, and the full sample (population weighted) to estimate total causal effects on the average
household in study villages.
Both implementers made contact with the study subjects and began enrollment immediately
after baseline. GD began implementation shortly after the baseline meaning that at endline indi-
viduals in that arm had experienced about 12 months of the household grants treatment (running up
through the month before endline). Gikuriro was slower than the cash program to begin implementa-
tion on the ground; in that arm households had typically experienced 8-9 months of household-level
implementation at the time of the endline.6 The duration of the RCT component of the study was
limited by the fact that local governments wanted to hit targets for the broader, national rollout of
nutritional and WASH programming, of which the eight districts covered by the Gikuriro program-
ming were a part, and hence we were not able to maintain the control groups for more than one
year.
To permit a rigorous comparison of cost-effectiveness, we costed both programs in detail prior
to, and after, the intervention period, following Levin and McEwan (2001). The ex-ante costing
exercise was used to identify the approximate total cost of the Gikuriro intervention, as well as the
estimated overhead costs to GiveDirectly of providing household grants in this context. It arrived at
an ex-ante cost of $119 per eligible household. We then randomized transfer amounts at the village
level in the cash arm across four possible transfer amounts. These amounts were chosen to provide
informative benefit/cost comparisons across two different margins: Gikuriro vs cash, and small
versus large cash transfer amounts. Three smaller cash transfer amounts bracket the anticipated
cost of Gikuriro per household (ex-ante costs of $77, $119, and $152, with beneficiaries actually
receiving $41, $84, and $117, respectively); these arms are provide a straightforward window on
cost-equivalent impacts. The fourth and much larger transfer arm transferred $532, the amount
chosen by GiveDirectly as likely to maximize their own cost-effectiveness given the fixed costs in
providing cash transfers via mobile money. The inclusion of this arm provides a statistically high-
powered way of examining how benefit/cost ratios shift as the transfer amount rises. The final,
ex-post costing exercise arrived a cost for Gikuriro of $141.84, and actual GD costs of $66, $111,
and $145, meaning realized Gikuriro costs were within the range over which we randomized but6Since both programs had six months of notice that they would be implementing in the study sample in these
two districts and began national-level implementation at the same time, this differential delay likely reflects a realdifference in the relative ramp-up speeds of cash versus more complex programming.
5
28 percent higher than the ex-ante number. We present a method to adjust for the randomized
GD cost differentials using linear regression, and hence can provide comparative impacts at exactly
equivalent costs to the donor, USAID.
Our results provide quite a nuanced view of the relative impact of a highly tailored child malnu-
trition program and the cost of the program in cash. The Gikuriro bundle of interventions, costing
USAID $142 and delivering $73 in direct benefits per household, was successful at delivering gains
in savings, a domain that was the target of the SILC intervention (the remaining costs were split
between training/capacity building and overhead). It did not lead to improvements in consump-
tion, dietary diversity, wealth, child anthropometrics, or anemia within the thirteen-month period
of the study. A cash transfer of exactly the same cost to USAID could, because of lower over-
heads, deliver $113 in direct benefits. Such a transfer allows households to pay down debt, and
generates increased investment in productive and consumption assets. A much larger cash transfer
costing $567, and transferring $532 per beneficiary household) led to across-the-board improvements
in consumption-based welfare measures, a substantial improvement in dietary diversity, a drop in
child mortality, and modest improvements of about 0.1 standard deviation in the anthropometric
indicators of height-for-age, weight-for-age, and mid-upper arm circumference (all signficant at 10
percent or above). Despite 90.9 and 96.9 percent of the eligible households in treatment villages
receiving Gikuriro and GiveDirectly, respectively (for the villages as a whole the treatment rates
were 19 and 18.3 percent, respectively), neither treatment resulted in sufficiently widespread bene-
fits as to be detectable in the general population, with the exception of an improvement in health
knowledge and vaccination rates in Gikuriro villages and vaccination rates in GD large villages.
These results are intuitive in many ways. When a program uses targeted interventions, it can at
relatively low cost shift a specific set of welfare indicators tied to these behaviors (for example, the
strong impacts of Gikuriro’s savings groups). If such a program is built on a solid theory of change
connecting outcomes such as savings stocks to long-term outcomes, this can be a well-justified use
of development assistance. Unconditional cash is spent on many different things in terms of sample
averages, and hence is hard to detect when the tranfer amount is small but improves outcomes
almost across the board as the transfer amount increases. The large cash transfer delivers benefits
even on outcomes specifically targeted by the other program. While it is unsurprising that very
large amounts of money show up in consumption and productive assets, the improvements in diet
6
and particularly child anthropometrics over such a short period of time are impressive. Further,
while it may be unsurprising that the impact of cash transfers scales with amount spent in the way
found here, the same may not be true of other types of development intervention that would quickly
hit diminishing marginal returns once certain core objectives were achieved.
This points to an inherently different way of thinking about cash-transfer programs as a ‘bench-
mark’. While transfer programs maximize scope for choice and therefore provide an important
window on beneficiary priorities, a comparison to other more targeted programs will inevitably
require policymakers to explicitly make tradeoffs across outcome dimensions, across beneficiary
populations, and between large benefits for concentrated subgroups or small benefits that are dif-
fuse over a broader target population. By contrast with the index fund analogy, part of the value of
cash transfer programs as a benchmark is that they may require donors to be explicit about their
preferences, and to justify interventions that constrain beneficiary choices.
The rest of the paper is organized as follows. The next section of the paper lays out the study
design, including a detailed decription of the interventions, sampling routine, costing principles, the
experimental structure, as well as primary and secondary outcomes. Section 3 presents the core
empirical results of the benchmarking exercise, as well as the results of sub-experiments on cash
transfer modalities. Section 4 presents the pre-specified analysis of heterogeneity, including by child
age and by baseline malnutrition The final section concludes, and provides specific examples of how
the results of the study can be used to bound the preferences over benefit/cost ratios required to
justify each program.
2 Study Design
2.1 Description of Interventions
The Gikuriro program was developed by USAID, Catholic Relief Services (CRS), and the Nether-
lands Development Organization (SNV) to combat food insecurity among pregnant women and
children, particularly during the critical first 1,000 days of life that play such a dominant role in
later-life outcomes and cognition (Figlio et al., 2014). The resulting multi-faceted program brings
together several components in order to attack this problem from multiple directions at once, and
is a central pillar of the Government of Rwanda’s approach to combatting malnutrition in rural
7
Rwanda.7 Gikuriro combines an integrated nutrition program with a standard WASH curriculum
(water, sanitation, and hygiene), and seeks to build the capacity of the health infrastructure pro-
viding services to mothers and newborns, particularly Community Health Workers (CHWs). The
program also seeks to build livelihoods by providing additional assistance to eligible households,
including (a) Village Nutrition Schools (VNS); (b) Farmer field learning schools (FFLS), which po-
tentially includes distribution of small livestock, fortified seed, etc.; (c) Savings and Internal Lend-
ing Communities (SILCs); and (d) the Government of Rwanda’s Community-Based Environmental
Health Promotion Program (CBEHPP). In addition, Gikuriro provided a program of Behavioral
Change Communication (BCC), supporting participation in all components of the program includ-
ing savings, agriculture, and nutrition, as well as hygiene. This comprehensive approach seeks to
build supply and demand for child health services simultaneously, and is fairly typical of the kinds
of multi-sectoral child health programs implemented by USAID in many parts of the developing
world.8
To benchmark the impact of this program against cash we worked with GiveDirectly, a US-based
501(c)3 Non-Profit organization. GiveDirectly specializes in sending mobile money transfers directly
to the mobile phones of beneficiary households to provide large-scale household grants in develop-
ing countries including Kenya, Uganda, and Rwanda. GiveDirectly’s typical model has involved
targeting households using mass-scale proxy targeting criteria such as roof quality. GiveDirectly
builds an in-country infrastructure that allows them to enroll and make transfers to households
while simultaneously validating via calls from a phone bank that transfers have been received by
the correct people and in a timely manner. Their typical transfers are large and lump-sum, on the
order of $1,000, and the organization provides a programatically relevant counterfactual to standard
development aid programs because it has a scalable business model that would in fact be capable
of providing transfers to the tens of thousands of households that are served by the Gikuriro pro-
gram. Because of the nutritional focus of the Gikuriro intervention, GiveDirectly incorporated a
‘nudge’ into the way the program was introduced (Benhassine et al., 2015), utilizing a low-cost7USAID’s Global Health and Nutrition Strategy explicitly calls for multi-sectoral interventions that incorporate
agriculture, WASH, education, and outreach to mothers in the first 1,000 days through the public health system.The agency reports reaching 27 million children worldwide under the age of 5 in 2016 alone through such programs,which represent the prescribed USAID modality for Scaling up Nutrition (SUN) countries.
8Examples of similar integrated WASH/agriculture/child nutrition programs funded by USAID include SPRINGin Bangladesh, RING in Ghana, Yaajende in Senegal, and ENGINE in Ethiopia.
8

flyer emphasizing the importance of child nutrition that was given to households at the time of
the intervention. An English translation of this flyer is included in Appendix A. Given observed
impacts of cash transfers on other goods, e.g., productive assets and housing value, it is evident
that households felt at liberty to spend the grants on items not directly related to child nutrition.
Rwanda may be a particularly interesting environment in which to pose the benchmarking ques-
tion for several reasons. First, child malnutrition rates overall are high—the prevalence of stunting
among children under age five in the 2014-15 Demographic and Health Survey was 37.9 percent,
underweight 9.3 percent and wasted 2.2 percent—though this represents an improvement in recent
years (DHS, 2016) Second, Rwanda is a country notable in Africa for its bureaucratic competence
and the public health infrastructure has been successful in delivering substantial improvements in
child and maternal health outcomes (NISR, 2015) through schemes such as Pay-for-Performance
(Basinga et al., 2011). Hence, it may provide a relatively strong case in terms of interventions such
as Gikuriro that are led through the public health system and lean heavily on Community Health
Workers (CHWs). Third, the Government of Rwanda has been experimenting extensively with cash
transfer programs over the past few years, such as the inclusion of cash in the flagship Umurenge
poverty reduction program (Gahamanyi and Kettlewell, 2015), the $50 million ‘Cash-to-poor’ pro-
gram supported by the World Bank, as well as a number of efforts to transition the support systems
for the country’s large population of refugees to cash transfers (such as a World Food Programme
(WFP) program that is now supporting 15,000 refugees in Gihembe Camp using cash rather than
traditional in-kind aid mechanisms (Taylor et al., 2016)). Hence there should be the bureaucratic
capacity to implement Gikuriro well, and there is both experience with and interest in cash transfers
as a safety net modality in the country.9
Gikuriro is in the midst of a full-scale rollout in 8 districts, and the randomized study design was
based on delaying implementation of the program in a number of eligible villages for one year. For
this reason the study is only able to measure impacts over the course of the 13 months from baseline
to endline, which capture 12 months of on-the-ground implementation for GD and 8-9 months for
Gikuriro. We cannot therefore speak to the long-term impacts of the interventions. Anticipating
this issue, we took two approaches to measurement. One of them was to try capture the stocks9Given the framing provided by GiveDirectly and the unusually strong degree of social control exerted by local
officials in the Rwandan context, it is certainly possible that our ‘unconditional’ transfers have been more forciblydevoted to child consumption than they would have been in a different context.
9

of intertemporal assets that would be the obvious conduits to future consumption benefits for the
households. The second was to emphasize outcomes such as dietary diversity and anemia that have
the potential to respond quickly to changes in consumption patterns, while also retaining the more
standard metrics of child malnutrition such as height for age (HAZ), weight for age (WAZ), and mid-
upper arm circumference (MUAC).10 Further, a number of recent RCTs have shown that programs
can have meaningful impacts on biometric outcomes over timeframes similar to that analyzed in
this study, such as Desai et al. (2015), Leroy et al. (2016), Fink et al. (2017), and Null et al. (2018).
2.2 Eligibility for the Study
The study aims to compare nutrition and health gains among poor households with young
children across the two programs and a control. We therefore used a definition of eligibility tailored
to Gikuriro’s stated target population: namely, households that contained malnourished children, or
pregnant and lactating mothers. A core challenge of the benchmarking endeavor is the need to use
a measure of eligibility in a manner that can be defined identically across arms.11 As a result, we
established a set of ‘hard’ eligibility criteria on the basis of which beneficiaries would be selected and
the survey would be stratified. Households meeting these criteria would be identified by the survey
firm, Innovations for Poverty Action (IPA), prior to sampling for the baseline study, to establish a
comparable population of eligible households in all arms—including control—of the study.
CRS and USAID agreed that the following criteria represent the target population for Gikuriro:
• Criteria 1. All households in a village with a malnourished child (defined by a threshold value
of weight/age) were enrolled.
– Weight/age is used because it is believed that this data is more consistently available
than data on middle-upper arm circumference (MUAC) and height/age, and because it
is used by CHWs as a basis for referring children to their local Health Centers.
– The threshold weight/age value for inclusion was determined using the Rwandan Ministry
of Health standards for malnutrition. The data used to identify eligibles was based on10Dietary diversity is an immediate indicator of improvements in consumption, and the clinical literature has shown
that anemia tests respond within 3 months of improvements in diet (Habicht and Pelletier, 1990).11We did not intend the scope of the benchmarking exercise to include the implementers’ (potentially different)
ability to cost-effectively identify this target population, so as to maintain the interpretation of impacts as beingdifferential impacts on a consistently defined beneficiary group.
10

the Community Health Worker data from Growth Monitoring and Promotion visits.
• Criteria 2. All households in Ubudehe 1 or 2 with children under the age of 5 (Ubudehe is
the Rwandan government household-level poverty classification, with 1 being the poorest, 3
being non-poor, and rural areas containing very few of the wealthiest Ubudehe 4 households).
• Criteria 3. All households in Ubudehe 1 or 2 with a pregnant or lactating mother.
Both implementers agreed to attempt to treat all eligible households that were identified as meeting
any of these criteria. CRS anticipated an average of 30 eligible households per village, and in
principle had established a rationing rule in case that number was exceeded. As will be described
below, the number of households per village that could be identified by the survey firm as meeting
these targets turned out to be substantially lower. We did not try to impose restrictions on how
Gikuriro would target outside of the households identified by the survey firm to be eligible.
We asked IPA to identify the universe of households that they could locate who met these criteria,
using three sources. First, CHW records from the national ‘Growth Monitoring and Promotion’
exercise, which is intended to provide monthly height and weight measurements for all children
under two and annual measurements for all children under five; second, government (census) records
of household Ubudehe classifications; and finally local health facility information, which provides an
alternative data point on children’s nutritional status.12 Children were defined as malnourished if
they had at least one measurement that met government thresholds for malnourishment definitions
in the past year, and households were defined as eligible if they had any individual meeting the
criteria above. In each village we recorded the number of households in each stratum and sampled
up to eight eligibles and four ineligibles for inclusion in the study. Throughout this document we
use the words ‘eligible’ and ‘ingeligible’ to refer to the classification made by the survey firm at
baseline.
While the primary analysis focuses on outcomes in the eligible group, we randomly sampled
ineligibles into the survey so as to be able to consider broader Total Causal Effects (TCEs). Impacts
among ineligibles may arise either because the implementers treated some households outside of the
IPA-defined eligible group, or because of spillovers from beneficiary to non-beneficiary households.12In practice, most children attending local clinics are referred by a CHW and so are also recorded as malnourished
in the Growth Monitoring process.
11

The primary analysis is weighted to be representative of all eligible households in study villages,
and the analysis including ineligibles is weighted to be representative of all households in study
villages. Eligibility lists were shared with both implementers at the same time in the same way, but
the sampling of eligible and eligible households for the survey was not revealed to implementers, so
as to avoid the possibility that the implementers would specifically target the research sample. Our
sample of ineligible households lets us understand both how treatment across the implementers may
have varied in this ineligible sample, as well as the nature of the impacts observed in this group.Both
implementers concurred closely with our definition of treatment on the ground, and compliance was
high: we have 90.9 percent of the survey-defined eligibles treated by Gikuriro, and 96.9 percent
of the survey-defined eligibles treated by GiveDirectly.13 This means that the Intention-to-Treat
effects estimated on the eligibles should be well powered and are close to providing the Average
Treatment Effect within this group.
We did not however encounter the number of eligible households anticipated; despite having
expanded the eligibility criteria beyond what was originally envisioned, we nonetheless found an
average of only 13.9 eligible households per village using the hard targeting information. Some
villages did not even contain the 8 eligible households we intended to sample and hence we end
up with fewer eligibles than 8 in smaller or wealthier villages. On average we have 7.23 eligible
households and 4.01 ineligible households sampled per village.
When Gikuriro began their actual program implementation, they continued their standard con-
sultative process for beneficiary identification, which included the use of soft targeting information
not available to IPA. Using this additional, richer information set to target, they identified and
treated an average of 25.8 households in study villages in Kayonza district, and 26.97 in Nyabihu.
Since our first tranche of GiveDirectly treatments were only among IPA-defined eligible households,
we found ourselves with a substantial discrepency in the intensity of treatment across implementers.
We responded to this asymmetry by drawing in an additional sample of the poorest ineligible house-
holds in GiveDirectly villages to receive household grants so as to maintain parity in village-level13Because eligible was determined from records rather than from face-to-face visits, it was possible that some
identified households were not in fact resident in the village, or that the individuals whose presence made a householdeligible had moved out. These were the only reasons that GiveDirectly did not treat a household, and it shouldbe noted that households rejected for the former reason would also not appear in the study sample. In addition,CRS implemented a ‘consultative’ process with community members and determined that official Ubudehe statuswas incorrect or outdated for some IPA-determined eligible households.
12

treatment intensity. One month after baseline we sampled from within the broader set of ineligi-
ble Ubudehe 1 and 2 households (e.g. without young children) and passed this additional list to
GiveDirectly to be treated with household grants. We already knew the realized treatment intensity
from CRS at the time we drew in this additional ‘top-up’ sample, and so we selected the fraction of
ineligibles to be treated by GD such that the realized fraction of households treated per village was
identical for Gikuriro and CRS within each district. Given the treatment of the entire eligible stra-
tum by GD, we gave them top-up lists that brought in an additional 11.26 households in Kayonza
and 12.56 households in Nyabihu during tranche 2. The top-up lists were presented in a randomized
order with instructions that GD should replace any non-complying households with the next one on
the list to get as close as possible to the assigned number of treated households in Tranche 2. In the
end, although the targeting of ineligibles will differ across implementers, the treatment intensities
across the two arms are therefore identical by construction.
2.3 Design of the Experiment
Randomization occurred at the village level across 248 villages, using a blocked randomization
where the blocks were formed by the combination of districts and village-level poverty scores within
district, creating a total of 22 blocks with between 10 and 13 villages per block. Fixed effects for
these blocks are included in all analysis. A computer was used by the researchers to conduct the
randomization based on a frame of villages agreed to by CRS and government officials.
Table 1 presents a schematic of the design of the study. 74 villages were assigned to the
Gikuriro intervention, 74 were assigned to the control group (no intervention), and 100 were as-
signed to GiveDirectly household grants. The GiveDirectly villages were further split into four
transfer amounts, randomized at the village level. Three treatment amount arms, with 22 villages
in each, received transfer amounts in a range around the anticipated cost of Gikuriro. A final 34
villages were assigned to the ‘large’ GiveDirectly transfer amount which was selected by GiveDi-
rectly as the amount anticipated to maximize the cost effectiveness of cash. The transfers actually
received by households in the GD ‘small’ arms (not inclusive of overhead) were $41.32, $83.63, and
$116.91. Then, the large transfer amount selected to optimize GiveDirectly’s benefit/cost ratio was
$532 actually transferred to households. All transfer amounts were translated into Rwandan Francs
at an exchange rate of 790 RwF per US dollar, and were rounded to the nearest hundred.
13
Subject to the constraint of maintaining the assigned average household transfer value at the
village level, GiveDirectly believed that most cost-effective use of these funds would be to attempt
to equalize the amount transferred per household member, rather than to have households of very
different sizes receiving the same transfer amount. To accomplish this, we scaled the transfer
amounts within a village by household size, such that larger households received larger transfers,
but leaving the mean transfer amount at the village level unaffected. This formula first calculated
the per-capita transfer for a village using household sizes and the desired average household transfer
value. Second, it scaled household-level transfer amounts with household size, applying a minimum
of 3 members and a maximum of 8 members, so as to achieve the intended mean transfer amount per
household per village. Household sizes for scaling transfer amounts were derived from administrative
data (Community Health Worker reports), and not from baseline surveys. Figure 1 provides a box
and whisker plot of the randomly assigned mean transfer amount per village relative to the actual
amount received per household observed in the GD institutional data, and shows that the two
correspond closely.
Within the GD arm we conducted a number of additional, individual-level experiments.
1. Transfer Timing. Evidence from other contexts suggests that a regular, monthly flow of
transfers is likely to be a more effective way of delivering the kinds of nutrition and health
outcomes that are the target of Gikuriro, rather than large lump-sum transfers (Haushofer
and Shapiro, 2016). We randomized eligible beneficiaries in the household grants arm of the
study to three groups designed to measure the effect of frequency: flow transfers divided into
a sequence of monthly transfers; lump-sum transfers given all up front; and a choice arm that
could decide which of these two modalities they wanted.
2. Choice experiment. The modality for the choice experiment, conducted only in the GD arm,
is as follows:
(a) First, all respondents were given a menu illustrating the choice between a single lump-
sum transfer delivered in any of the 12 months from August 2016 to July 2017 and a
flow of monthly payments totaling the same amount. The choice was recorded for each
month for each household.
(b) Then, the household was randomized to one of three conditions:
14
Andrew Zeitlin

i. with 5/8 probability, they were assigned to the monthly flow treatment.
ii. with 1/4th probability, they were assigned to the lump sum treatment.
iii. with 1/8th probability, they were assigned to the choice arm.
(c) The large majority of the choice arm were given whichever they chose of the Lump Sum
versus Flow treatment in the first month. 1 out of 20 individuals in the choice arm were
given their choice in a randomly selected month so as to preserve the incentivization of
the monthly choice questions.
2.4 Study Outcomes
Primary Outcomes. The study focuses on five dimensions. Here we briefly summarize each;
details of the construction of these outcomes are included in Appendix A.
1. Household monthly consumption per capita (inverse hyperbolic sine—henceforth IHS—to deal
with skewness).
2. Household Dietary Diversity, measured using hte WHO standard Household Dietary Diversity
Score.
3. Anemia: measured with a biomarker test following DHS protocols at endline only.
4. Child growth and development: measured using in height-for-age, weight-for-age and Mid
Upper Arm Circumference at baseline and endline for children under the age of 6 in eligible
households.
5. Value of household non-land net wealth. This outcome is the sum of productive and consump-
tion assets; the value of the household’s dwelling, if owned; and the value of the stock of net
savings, less the stock of debt (IHS).
Secondary Outcomes. Three types of outcomes are selected to be secondary: proximate
outcomes of one or both interventions that do not have an intrinsic welfare interpretation (such
as borrowing and saving stocks); outcomes that have welfare weight but are not within the causal
chain of both programs (such as investments in health-seeking behavior, which Gikuriro seeks to
impact, or housing quality, which has been identified as a dimension of benefit in prior evaluations
15

of GiveDirectly (Haushofer and Shapiro, 2016)); or outcomes of common interest on which power is
limited (such as disease burden and mortality).
1. Stock of borrowing and stock of savings (IHS).
2. Birth outcomes: the likelihood of pregnancy and likelihood of live birth within 12 months
prior to endline.
3. Health knowledge and sanitation practices.
4. Disease burden and mortality. Mortality is measured as the likelihood that an individual
member of the household from baseline has died prior to endline. Disease burden is measured
as the prevalence of fever, fever with diarrhea or vomiting, or coughing with blood at endline,
5. Health-seeking behavior/preventative care. We focus on the share of pregnancies resulting
in births in medical facilities, the share of children under two years of age with at least one
vaccination in the prior year, and the share of children under two years of age with a complete
dose of vaccines.
6. Household productive assets (IHS).
7. Housing quality. Two measures are used: the self-reported replacement cost of the current
dwelling (irrespective of ownership status, IHS), and an index of housing construction quality,
constructed from measures of wall and roof materials and from the number of rooms in the
dwelling.
The inverse hyperbolic sine is commonly used in analysis of outcomes such as consumption, savings,
and asset values that tend to be highly right-skewed and also to contain zeros. The IHS transfor-
mation preserves the interpretation of a log (meaning that impacts can be interpreted as percent
changes) but does not drop zeros. Only outcomes that we expected to be skewed were pre-registered
to be analyzed using IHS. All non-binary outcomes are also Winsorized at the 1 percent and 99
percent level (values above the 99th percentile are overwritten with the value at the 99th percentile
to reduce skewness and increase statistical power). Because we restrict the analysis in this paper to
the pre-specified primary and secondary outcomes only, we do not correct the results for multiple
inference (Anderson, 2008).
16

2.5 Regression Specifications
The data from the study are analyzed following our pre-analysis plan, consistent with the design
being a three-armed, cluster randomized trial. Let the subscript i indicate the individual, c the
cluster (village), and b the randomization block. Eicb is an indicator for eligibility status, defined at
the household level. For outcomes observed both at baseline (Yicb1) and at endline (Yicb2), we conduct
ANCOVA analysis including the baseline outcome; otherwise we omit the baseline outcome and run
a simple post-treatment cross-sectional regression. Fixed effects for the village-level assignment
blocks within which the randomization was conducted ↵b are included, as well as a set of baseline
control variables selected from the baseline data on the basis of their ability to predict the primary
outcomes, denoted by Xicb1. In our simple experimental analysis we include two distinct dummies
for GD treatment; one for the three smaller amounts TGDSc chosen to be close to the cost of Gikuriro,
and one for the ‘large’ transfer amount TGDLc , whose impact is not cost comparable to any of the
other treatments. Thus the regressions to estimate the Intention to Treat Effect among eligibles
are:
Yicb2 = ↵b + �GKTGKc + �GDSTGDS
c + �GDLTGDLc + �Xicb1 + ⇢Yicb1 + ✏icb2 8 i : Eicb = 1 (1)
Standard errors are clustered at the village level to reflect the design effect in the study (Athey and
Imbens, 2017). The block-level fixed effects are be included to account for the block-randomization
of the study (blocks are defined by district/sector and village-level poverty rankings, there are
22 blocks in the study). Following the ‘post-double-LASSO’ procedure of Belloni et al. (2014b),
a set of covariates were selected using a LASSO algorithm on the control data as described in
our pre-analysis plan; this model selection procedure is detailed, together with the resulting set of
baseline covariates for each primary and secondary outcome, in Appendix Section B. This regression
includes sample weights equal to the number of eligible households in the village divided by the
number of eligible households in the study in that village, so as to make the results representative of
all eligible households in study villages. For outcomes such as anemia that are collected at endline
only, we cannot include the lagged outcome to run the ANCOVA regression, and so use the simple
cross-sectional analog to Equation (1).
17
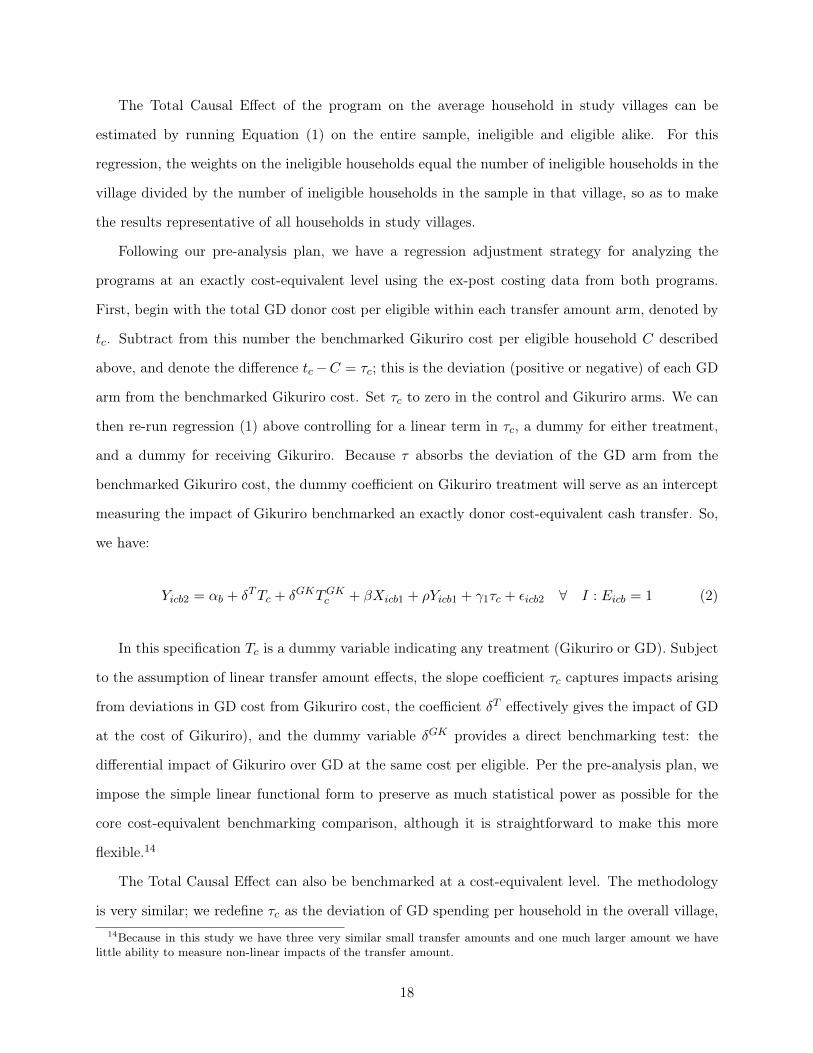
The Total Causal Effect of the program on the average household in study villages can be
estimated by running Equation (1) on the entire sample, ineligible and eligible alike. For this
regression, the weights on the ineligible households equal the number of ineligible households in the
village divided by the number of ineligible households in the sample in that village, so as to make
the results representative of all households in study villages.
Following our pre-analysis plan, we have a regression adjustment strategy for analyzing the
programs at an exactly cost-equivalent level using the ex-post costing data from both programs.
First, begin with the total GD donor cost per eligible within each transfer amount arm, denoted by
tc. Subtract from this number the benchmarked Gikuriro cost per eligible household C described
above, and denote the difference tc�C = ⌧c; this is the deviation (positive or negative) of each GD
arm from the benchmarked Gikuriro cost. Set ⌧c to zero in the control and Gikuriro arms. We can
then re-run regression (1) above controlling for a linear term in ⌧c, a dummy for either treatment,
and a dummy for receiving Gikuriro. Because ⌧ absorbs the deviation of the GD arm from the
benchmarked Gikuriro cost, the dummy coefficient on Gikuriro treatment will serve as an intercept
measuring the impact of Gikuriro benchmarked an exactly donor cost-equivalent cash transfer. So,
we have:
Yicb2 = ↵b + �TTc + �GKTGKc + �Xicb1 + ⇢Yicb1 + �1⌧c + ✏icb2 8 I : Eicb = 1 (2)
In this specification Tc is a dummy variable indicating any treatment (Gikuriro or GD). Subject
to the assumption of linear transfer amount effects, the slope coefficient ⌧c captures impacts arising
from deviations in GD cost from Gikuriro cost, the coefficient �T effectively gives the impact of GD
at the cost of Gikuriro), and the dummy variable �GK provides a direct benchmarking test: the
differential impact of Gikuriro over GD at the same cost per eligible. Per the pre-analysis plan, we
impose the simple linear functional form to preserve as much statistical power as possible for the
core cost-equivalent benchmarking comparison, although it is straightforward to make this more
flexible.14
The Total Causal Effect can also be benchmarked at a cost-equivalent level. The methodology
is very similar; we redefine ⌧c as the deviation of GD spending per household in the overall village,14Because in this study we have three very similar small transfer amounts and one much larger amount we have
little ability to measure non-linear impacts of the transfer amount.
18

relative to the Gikuriro cost defined in the same way. By then cost-adjusting an estimate of the
TCE weighted to be representative of all households in the village, we can measure how the overall
village-level average impact of each program differs when spending per household is the same.
2.6 Cost Equivalence, Before and After the Fact
The costing exercise in the study utilized the ‘ingredients method’ which specifies all the ingre-
dients (resources and inputs) used in performing the activities that produce the key outcomes of
interest. In this costing, cost is defined as opportunity cost: the value of a good or service in its
best alternative use. When a good or service is used for a specific purpose, the user "gives up"
the possibility of employing it in another application (see Dhaliwal and Tulloch, 2012; Levin and
McEwan, 2001, for more discussion).
The policy question is asked from the perspective of the donor (in this case, USAID): the policy
objective is to achieve the highest benefit-cost ratio per intended beneficiary for each dollar that is
spent on a program. Overhead expenditures in the implementation chain are an inherent part of
these costs, and so the lower transactions costs in getting mobile money to the beneficiary play an
important role in their potential attractiveness. We conducted two different costing exercises at two
moments in time. The ex-ante exercise, which was based on projected budgets and staffing costs,
was used to predict the cost at the time of the study design, and to choose the ranges over which
the lower GiveDirectly transfer amounts would be randomized. Then, a rigorous ex-post costing
exercise was conducted for both programs after the fact using actual expenditures.
Since the Gikuriro program covers eight districts (e.g. much larger than the study population
only) we attempt to cost the full national program (not just the study sample), inclusive of all
direct costs, all indirect in-country management costs including transport, real estate, utilities,
and the staffing required to manage the program, and all international overhead costs entailed in
managing the Gikuriro program. Beneficiary identification costs, incurred by the survey firm and
identical across all arms of the study, are excluded from the cost-benefit calculation. Monitoring and
Evaluation costs, similarly, were excluded so as to be costing only the implementation component.
All administrative costs, including the appropriate share of the costs of maintaining international
headquarters infrastructure, were included in the costing. Because we do not want differences in
scale to drive differential costs per beneficiary, we asked GiveDirectly to artificially scale up their
19

operations and provide us with numbers reflecting the costs per beneficiary if they were running a
national-scale program across eight districts, including 56,127 beneficiary households like Gikuriro.
This is the relevant question for a USAID program officer contemplating commissioning a program
to move the outcomes studied at comparable scale.
We costed each GD arm separately, asking what the overhead rate would have been if GD had run
a national program at the scale of Gikuriro giving only transfers of that amount. Overhead costs as
a percentage of the amount transferred decline sharply with transfer amount for GD because fixed
costs represent a large share of their total overhead. This allows us to conduct the benefit/cost
comparisons ‘at scale’, rather than having the artificial, multi-amount environment of the study
contaminate the costing exercise across arms.
Another important issue in costing is compliance. Our study impacts focus on the ITT, and the
costing number that matches this estimand is the amount spent per eligible household, rather than
per beneficiary household. We can incorporate non-compliance into the effective amount spent by
each implementer per study household by differentiating costs of two types: first there are ‘averted’
costs, which are not spent on a household if they do not comply with treatment; second there are
‘non-averted’ costs which will be expended whether or not the household complies. For GiveDirectly
all variable costs are averted, for Gikuriro all variable costs except for the village-level behavior
change component are averted. Using this approach we can recover a cost-equivalent comparison
even if the compliance rates are different across arms. To do this, we match institutional data from
Gikuriro and GiveDirectly to the study village and study sample, and calculate compliance rates in
both the eligible sample and the overall village population.15
Gikuriro can be broken into two kinds of costs which have different numbers of beneficiaries.
First is the village-level treatments (WASH and BCC) which are applied very broadly to the village
population. These costs drive 40 percent of the total cost of the program, and are applied to
households whether or not they comply with Gikuriro treatment directly (non-averted). The second
are costs that pertain only to households that directly participate in the program; these costs are15Several details require further description here. First, our pre-analysis plan indicated that we would cost each
sub-ingredient of Gikuriro and use survey data to calculate compliance with each ingredient. Costing every ingredientof that program proved infeasible, and in the event households that benefit from any one of the direct interventionsin Gikuriro are likely to receive them all. So, with the exception of the Behavior Change component (which wasprovided to the entire village and is costed as such) we cost the two implementers in the same way: the product ofcost per beneficiary and the compliance rate calculated from institutional data in the relevant population.
20

incurred only if the household complies with treatment and averted otherwise, hence we hit these
costs with the compliance rates among eligibles and overall to calculate the cost per eligible and
cost per household overall. As described in the Introduction, we designed the study around an
anticipated Gikuriro cost of $119 per beneficiary household, which given the ex-ante costing of GD
led us to transfer $41, $84, and $117 dollars to households in those arms.
Table 2 provides the exact costing numbers arrived at by the ex-post exercise. Gikuriro treatment
rates are 90.9 percent among eligibles and 19 percent in the population as a whole. Given an actual
cost to USAID of $141.84 per beneficiary, this gives a cost of $134.13 per eligible household and
$72.94 per household in the village. GD faced few refusals for eligible individuals they attempted
to treat (0.3 percent), but due to a remit from the government only to treat households in Ubudehe
1 and 2, they declined to treat specific households that IPA defined as eligible if they found the
Community Health Worker-provided listing information to be incorrect when they approached them
for enrollment (1.6 percent). They were also unable to locate 3.0 percent of surveyed eligible
households. Total treatment rates in the GiveDireclty arm among eligibles are therefore 96.9 percent,
and within the whole population 18.3 percent. Given costs to USAID of $66, $111, $145, and $567
across the GD arms, this implies costs per eligible of $64, $111, $136, and $555 (compliance rates
are calculated separately for each GD arm), and costs per household in the village of $12, $21, $27,
and $100.
3 Analysis
3.1 Attrition and Balance of the Experiment
Endline outcome measurement is subject to a number of distinct forms of attrition; we start our
empirical analysis by considering each of these in turn. The most straightforward of these is standard
household-level attrition, meaning that a household sampled into the baseline survey attrited from
the endline survey. In Table 3, we see that overall rates of attrition at the household level were
low, around 3.3 percent in the control. We see the pattern typical in RCT studies where attrition
is somewhat lower in the treatment groups (where both ongoing contact and a sense of reciprocity
may keep individuals in the endline), but these differentials are small, from 0.89 percentage point in
the GD ‘small’ arm to 1.7 percentage point in the GD ‘large’ arm; only the latter is significant, and
21

only at the 10 percent level. Looking at the other covariates of attrition in column 2 we see that
attriters and non-attriting households are similar. Hence we conclude that household-level attrition
is unlikely to be a source of bias in the study.
When we turn to the analysis of individual-level outcomes in Panel B the picture is more
complex, because many of the primary and secondary outcomes are only measured for certain
types of individuals (anthropometrics for children, birth outcomes only for those pregnant). Each
of these forms of missingness may be driven by the treatments, so attrition for each type of outcome
must be taken in turn. We present a basic analysis of attrition here, and return to a discussion of
this issue when we show treatment effects on fertility and mortality.
We analyze in Panel B four types of differential missingness that may occur. First, we compare
the attrition of all household members from the roster in the household survey; both the rates
and the differentials here are very similar to the household attrition problem suggesting that there
has been little additional differential attrition of individuals. Next we examine the anthropometric
panel, whereby all children under 6 at baseline who were given anthropometrics at the baseline
should have been followed up with at endline. Here the absolute rates of attrition are a little more
than double what they are for individuals overall, presumably because of the greater difficulty of
finding and measuring children for this exercise. More concerningly, the decline in attrition in
the treatment groups now becomes strongly significant, particularly for Gikuriro villages (perhaps
evidence of the superior monitoring of malnourished children taking place in those villages). Given
this significance, we follow our Pre-Analysis Plan in also presenting results for the anthropometric
impacts that are corrected by inverse propensity weights to correct for the observable determinants
of selection. Third, we examine whether individuals who should have been anemia tested in the
followup were; here we see no evidence of differential attrition across arms. Finally, we examine the
likehood that a new household member appears (typically due to births subsequent to baseline),
and find no significant differences. Overall, then, differential selection across treatment arms is not
a major problem for study outcomes other than anthropometrics. We return to the issue of unequal
attrition in anthropometrics in the following section.
In Table 4 we present the comparison of baseline outcomes and control variables for eligibles at
both the individual and household level, using the unattrited panel sample that will be the basis of
the evaluation. The regressions used here mimic as closely as possible the impact regressions, using
22

fixed effects for randomization blocks, including a battery of baseline control variables, weighting to
make the sample representative of all eligibles, and clustering standard errors at the village level to
account for the design effect. At the household level the experiment is generally well balanced; we
present 33 comparisons in this table and find four of them to be significant at the 10 percent level,
much as we would expect. In Panel B we present all of the individual-level primary and secondary
outcomes that are observed at baseline, and again find the experiment to be very well-balanced
with only two outcomes of 27 significant at the 10 percent level. Unfortunately the only individual
imbalance significant at the 5 percent level is in one of the core study outcomes; weight for age.
The anthropometric indicators generally appear superior at baseline in the GD Large arm, an issue
to which we return in the discussion of our results where we focus on the ANCOVA analysis to deal
with this issue. Overall, the experiment is well-balanced at baseline.
3.2 Basic Experimental Results on Eligibles
Table 5 presents the core results of the study on the eligible population. Panel A shows
household-level impacts on the panel sample, and Panel B presents impacts on the individual-
level primary and secondary outcomes, where the relevant sample is outcome-specific and follows
the Pre-Analysis Plan.
Taking the Gikuriro treatment first, we see impacts on a set of proximate and directly targeted
outcomes of the program components. Household savings increases by a massive 109 percent (con-
sistent with the creation of SILCs). Dietary diversity, anthropometrics, and maternal anemia all
move in the right direction but none of these changes is significant. No consistent impacts appear
for consumption and wealth outcomes, or for health knowledge and sanitation practices. Hence the
program has been successful in moving an indicator closely related to one of its sub-components,
but at least within the timeframe of the study these changes in savings have not yet translated into
signficant improvements in the anthropometric child outcomes.
We turn next to to the impact of the three smaller GiveDirectly arms whose average cost is $111,
78 percent of the cost of Gikuriro. Here, we see quite a different set of outcomes move. Instead
of increasing savings, small GD transfers lead to a 76 percent paydown of debt, and an increase
in the value of productive and consumption assets, by 26 percent and 37 percent respectively. A
number of surpring negative results also emerge; we find a small deterioration in household wealth
23

and home values, and some of the child biometric measures move in the wrong direction.16 Thus far,
then, the comparison of Gikuriro to cash breaks down into two distinct dimensions of improvement,
each of which has a different and entirely plausible pathway to long-term improvements: savings
(Gikuriro), or debt reduction and asset investment (GiveDirectly).
When we examine the third row, however, a more transformative impact arising from of the
‘large’ cash transfer is clearly apparent. Not only do omnibus measures of consumption and wealth
go up across the board, but metrics of consumption closely linked to child health improve. The
dietary diversity score increases by 15 percent off a base of 4.16. Productive assets increase by
76 percent, consumer assets almost double in value, and home value increases substantially. In
the individual outcomes the benefits of this surge in consumption are evident as well; within the
course of one year we see a 0.091 SD improvement in HAZ, a 0.067 SD improvement in WAZ, and
a 0.13 SD improvement in MUAC, all significant at least at the 10 percent level.17. The ANCOVA
specification should be particularly important in the analysis of the anthropometric indicators that
showed signs of imbalance at baseline; indeed if we examine these outcomes in post-treatment levels
we see substantially stronger apparent treatment effects. Anemia falls slightly (not significant), and
there is a substantial decrease in child mortality of almost 1 percentage point(or 70 percent off of the
baseline value). To contextualize these effects using unweighted numbers, the control group eligibles
saw 13 cases of child mortality out of 2,596 children (0.5 percent) while the GD Large arm saw 2
cases out of 1,200 children (0.16 percent). Hence the GD Large arm saw meaningful improvements
in consumption and child health. At the bottom of this table we provide the t-statistics on an F-test
that the ratio of the benefits across the GD large and small arm differs from the ratio of their costs
(5.01 to 1). This statistic asks whether we can say that the impact scale in a manner different to the
costs; only in the case of debt reduction (where small transfers have a big effect and big transfers do
not) and house quality (where small transfers have a engative and large transfers a positive effect)
can we reject cost-symmetric benefit scaling for cash transfers.
Before taking the individual-level impacts at face value, it is important to recognize that most of16The pattern here would be consistent with the theoretical insight presented in (Duflo et al., 2013), where a new
opportunity to invest in productive assets can cause a ‘piling in’ of other sources of liquidity in the household, meaningthat individuals may choose to consume less or buy fewer consumer durables during the investment phase.
17These improvements should be viewed against the backdrop of a sharp deterioration in anthropometrics subse-quent to birth that typically occurs in LDCs, leaving rural African children often two full SDs below the internationalnorm by age 3 (Shrimpton et al., 2001), (Victora et al., 2010).
24

the endline outcomes are only observed for in potentially endogenously selected (surviving children,
women who had children during the study, etc.). If the treatments led to substantial changes in
fertility or mortality patterns, then the average outcome among surviving children or mothers is
subject to both extensive and an intensive margin drivers, and cannot be interpreted simply as a
ceteris paribus impact on a given baseline individual (see Baird et al. (2016) for more discussion of
this issue). In this sense the lack of impacts on pregnancy rates, and the small absolute value of the
impacts on live births and mortality, suggest that shifts in the composition of living children are
unlikely to be large drivers of the treatment/control differentials. It therefore appears very unlikely
that differential patterns of fertility or mortality in response to the treatments are leading to large
shifts in the composition of surviving children or mothers across arms, and hence we can interpret
these impacts in a standard way.
One of the most fundamental results in theoretical development economics is that poor house-
holds should have a single ‘shadow value’ of cash which pulls down investment in all capital-hungry
endeavors in a symmetric way. The above findings are generally consistent with this view of the
world, as an intervention that relaxes credit constraints leads to shifts in consumption patterns that
are very broadly spread across domains. This property means that small cash transfers are hard to
detect because they move too many outcomes by too small an amount to be significant, while large
cash transfers result in a broad-based increase in consumption in many dimensions.
Our pre-analysis plan states that for any outcomes where we find differential attrition, we would
estimate a propensity to remain in the sample incorporating covariates, dummies for treatments,
and their interactions on the right-hand side, and then re-weight the analysis by the product of the
inverse of this probability and the standard sampling weight. This procedure corrects the impacts
for the observable determinants of attrition, and uses regression weighting to attempt to make the
treatment and control samples comparable on important covariates even after attrition. Because we
primarily found significantly differential attrition for the anthropometric outcomes, in Table IPW
we present the results of this correction. We interact with each treatment dummy the same right-
hand side covariates we use the same controls in the anthropometric regressions: gender, a linear,
quadratic, and cubic for age in months, baseline household wealth, and a dummy for membership in
Ubudehe poverty category 1. The first three columns show the standard results, as in the previous
table, and the next three show the corrected estimates. The results are virtually identical, indicating
25

that the types of children who attrited from the study are similar across arms and hence differential
attrition is unlikely to be driving our impacts.
3.3 Cost-Equivalent Benchmarking
The core purpose of the comparative experiment conducted is to exploit the randomized vari-
ation in transfer amounts to conduct an exact cost-equivalent benchmarking exercise. Using the
costing numbers emerging from the ex-post exercise, we use the observed costs, overhead rates,
and compliance rates to calculate the donor cost per eligible household in each arm of the study.
Using Equation 3 from Section 3.1, we can control for ‘any treatment’, for the monetary deviation
of the cash transfer arm amount from the ex-post Gikuriro cost, and then the inclusion of a dummy
for ‘Gikuriro treatment’ will test the differential impact of Gikuriro over GD at precisely the same
ex-post donor cost (subject to the assumption of linearity implicit in this formulation). A graphical
representation of our strategy is provided in Figure 2, which plots the IHS of savings on the y-axis
for all four GD treatment amounts (black circles), for GK (gray diamond), and the control (white
circle). The line represents the fitted average savings by GD transfer amount, and by predicting
the outcome on this line at the exact cost of Gikuriro (gray triangle), the benchmarked differential
is then the vertical difference between the Gikuriro impact and the projected cost-equivalent GD
impact.
The results of this analysis are presented in Table 7. Starting with the third row first, we have
a direct estimate of the marginal effect of an additional 100 dollars in donor cost via cash transfers
the primary and secondary outcomes.18 As could be inferred from previous tables, this coefficient
is strongly significant across a wide range of outcomes, particularly those most related to household
consumption. An extra 100 dollars leads to a 5.6 percent increase in consumption, a 7.7 percent
increase in dietary diversity, a 17 percent increase in savings, an 11 percent and 12 percent increase in
productive and consumption assets, respectively, and leads housing value to improve by 4.6 percent
and the index of housing quality to increase by 0.1 SD. In terms of anthropometrics, the change in
value of transfer is significant only for height-for-age (where small transfers had a slight depressive
effect). An extra $100 per beneficiary household—with eligible households containing an average18While GiveDirectly does of course have fixed costs, nearly all of the marginal increase in transfer value to a
fixed population of recipients is received by the beneficiary: of the USD 421 increase from the upper cost-equivalenttransfer and the GD-large transfer, USD 415.09 was received by beneficiaries themselves.
26

of 2.7 children under the age of six—increases HAZ by 0.022 standard deviations. Comparing a
positive and insignicant effect of small transfers and a negative and insignificant effect of large
transfers on the rate of live births, the transfer amount slope turns out to be significantly negative.
Beyond this, none of the other individual outcomes respond to transfer amount in a manner that
we can reject at 95 percent significance.
With the third row estimating the linear heterogeneity in impacts by transfer size around the
cost-equivalent transfer, the second row (dummy for ‘any treatment’) becomes an intercept term
that estimates the impact of cash transfers at a cost equivalent to Gikuriro, although this exact
amount was not included in the experiment. Given that the mean transfer amount in the ‘small’
arm is only slightly lower than the GK cost, this estimate looks generally similar to the second row
of table 5 (the simple average experimental effect across the ‘small’ transfer amounts). At the exact
cost of Gikuriro, we estimate that cash transfers would have led to a significant 73 percent decrease
in the stock of debt, and a 30 percent and 40 percent increase in productive and consumption assets,
respectively.
The first row of this table contains the heart of the comparative benchmarking exercise. Looking
first at the household outcomes, we see that Gikuriro is superior at driving up savings balances, while
cash generates more debt reduction, a greater increase in consumption, and a larger accumulation
of assets. The differential effect of the programs on savings and borrowing is interesting, and
suggests that while both interventions serve to improve the net stock of liquid wealth (savings net
of borrowing), the focused push on SILC groups in Gikuriro drives this more strongly through the
vehicle of new savings while households making their own choices are more strongly disposed to
reduce debt instead. Which of these strategies makes more sense? A simple comparison of interest
rates is revealing. Gikuriro SILCs were free to set their own interest rates, but typically paid about
5 percent per annum nominal. Credit interest rates, by comparison, vary from an average of 22
percent in the MFI sector to upwards of 60 percent in informal credit markets. Given that 32 percent
of eligible households reported having both borrowing and savings at baseline (and 79 percent had
either borrowing or saving) it seems that the desire to pay down debt might be warranted.
Virtually none of the individual-level outcomes are significantly different across the interventions,
arising from the fact that both of the inexpensive interventions in this study were ineffective at
moving child outcomes, and only large cash transfers did this. There are two outcomes significant
27

in the differential comparisons that are not significant in either intervention in Table 5, namely
sanitation practices and births in facilities (both of which somewhat surprisingly favor GD). We
do not emphasize these results because in absolute comparison to the control group both arms are
ineffective.
3.4 Total Causal Effects
Because of the random sampling of ineligibles, we can conduct an analysis representive of the
population of study villages by pooling the strata together and using population sampling weights.
The average weight in the ineligible sample is 24.4 and in the eligible sample it is 2, meaning
that while the unweighted eligible sample is larger, it is the ineligibles who will dominate the
weighted sample. Recall that the treatment effects on ineligible households may arise either from
the treatment and targeting of the two interventions among ineligible households (with saturations
set to be the same at just over 18 percent on average in both arms, but with targeting differing), or
from spillovers between eligible and ineligible households. With 11.4 percent of all households being
defined as eligible, the treatment rate in the ineligible sample is 8.4 percent. This means that the
large majority of the additional sample included in the TCE analysis only receive impacts through
spillover effects to untreated households.
These impacts, using (1) but including the ineligible sample and using weights to reflect the
whole village population, are presented in Table 8. Here, the overall picture is very different from
the impact among eligibles. For Gikuriro, we see improvements at the 99 percent signficance level
in the index of health knowledge, a core component of the program and one which was broadly
targeted at the village population by the program (as reflected by our accounting of these costs as
‘non-averted’). Vaccinations, presumably provided by government health facilities but not a central
focus of Gikuriro, also improve significantly. So there is some real evidence of holistic benefits
in health-related domains for the population of Gikuriro villages. These changes, it is true, do
not translate into observable improvements in health outcomes for children or adults within the
timeframe of the study, but still suggest that Gikuriro implementers have been successful in driving
community-level health knowledge.
With cash transfers, on the other hand, improvements appear to be more narrowly limited to
the beneficiaries of the transfers. The ‘small’ transfers do not change any village-level outcome at
28

the 10 percent level. The ‘large’ transfers, so positive among beneficiaries, in general see negative
signs across the consumption indicators, lead to a significant drop in savings at the village level, and
are only positively associated with vaccination rates. These results are consistent with GD ‘large’
transfers having some negative spillover effects on non-beneficiaries, such as might be generated
by an increase in local consumer prices (consistent with Cunha et al. (forthcoming)) or a decrease
in interest rates as transfers are consumed and saved. On net there is little evidence that the
widespread benefits observed in the eligibles carry over to the broader population of the village
when the transfers are targeted at a relatively small fraction of the households.
3.5 Benchmarked Total Causal Effects
We can perform a similar cost-equivalent benchmarking exercise for the TCEs, adjusting now by
cost per household in the overall village. This allows us to ask how the two programs differ in their
impact on households in the village as a whole when the same amount is spent by each program
on average. This analysis is presented in table 9. Again beginning with the third row, we see that
an increase in transfers of $100 (now to the average household in the village) increases the value of
productive assets by a half of a percent. Health knowledge appears to deteriorate with the amount
transferred. The cost benchmarked cash transfer in the second row has no impact on household-level
variables at the village level, but does improve vaccinations. The core comparative benchmarking
exercise in the first row shows Gikuriro strongly superior at improving health knowledge at the
village level. A significantly larger improvement in dietary diversity under Gikuriro is based on a
comparison between two insignificant effects and so again is not emphasized.
3.6 Lump Sum versus Flow Transfers
GiveDirectly households were further randomized to Lump Sum, Flow, and Choice treatments.
We can set aside the (random) group assigned to choice and begin our analysis of the GD sub-
experiments by comparing how receiving money as a lump sum drives differential impact relative
to the same amount of money assigned as a flow. We include separate dummy variables for the
impact of the lump sum transfer in the ‘small’ and ‘large’ arms, using the flow transfers as the base
category in both arms. Our hypothesis for this analysis was that lump sum transfers would be less
good at improving outcomes such as nutrition, anthropometrics, and anemia that are based on a
29

cumulate flow of consumption over the duration of the study, while the lump sum transfers would
be superior in driving large one-time investments such as productive assets and consumer durables.
Table 10 shows the results of this analysis. In the ‘large’ arm we see results that are largely
in line with expectations, in that lump sum transfers generate weakly better household wealth
and strongly superior value of consumption assets, leading to a doubling of value relative to flow
transfers. In the ‘small’ arm we see a weakly larger pay-down of debt for lump sum transfers, but
contrary to expectations housing values are somewhat lower. Overall, we see some confirmation
at the superiority of lump-sum transfers in driving fixed investment. In the individual outcomes,
we also see some confirmation of expectations in that 5 out of 6 estimates of anthropometrics have
negative signs on the lump sum interactions, and improvements in MUAC for the ‘large’ arm were
limited to the flow transfers.
3.7 Analysis of Transfer Timing Choice within the GD Arm
An intriguing benefit of offering a choice of treatment modalities is that individuals might be
able to use private information to select a welfare-optimizing treatment in a way that a central
targeter could not. While we have relatively low power to examine this question, we can attempt to
shed light on the direct benefits of choice using our experimental variation. To do this, we evaluate
the outcome in the choice arm relative to a counterfactual that would be generated if individuals had
no ability to select according to treatment effects and so choose effectively at random, generating
an outcome that would be the weighted average of the outcomes of those assigned to lump sum and
flow (where weights come from the fraction of the choice arm choosing each alternative).
We define dummy variables for the flow transfer, the lump-sum transfer, and the choice treat-
ment. We can run the ANCOVA impact regression as follows:
(3) Yic2 = �0 + �FTFc + �LSTLS
c + �CTCc + �Xic1 + ⇢Yic1 + ✏ic2 8 Ei = 1, TGK = 0
The benefit of choice than then be tested via an F-test of the hypothesis that �C = µ�F +
(1 � µ)�LS , where µ is the fraction of the choice arm that chooses the Flow arm. This tests for
the domains in which individuals are able to obtain superior outcomes via choice than would be
30

expected given the average outcome that would be expected if they had been assigned to those
arms.
The results of this exercise are presented in Table 11. This test is based on only 89 eligible panel
households assigned to the choice arm, but it nonetheless provides some suprisingly strong evidence
in favor of flexibility in cash transfer modality. Dietary diversity, maternal anemia, live births, and
births in facilities all not only improve significantly in the choice arm, but improve significantly
more than would be expected based on the proportionately weighted averages of the lump sum and
flow arms. Only health knowledge looks worse with choice. While these results are more speculative
due to the small sample size, this suggests that choice itself is generating superior health outcomes
relative to an external assignment mechanism.
4 Analysis of Heterogeneity
4.1 Anthropometric effects by baseline malnourishment
We hypothesized in the Pre-Analysis Plan that the benefits of the treatments in terms of child
anthropometrics would be largest for those who began the study most malnourished. To test this,
we run a regression with child anthropometrics (HAZ, WAZ, and MUAC) as the outcomes, using
the structure of Equation 1 above and controlling for our battery of baseline covariates, a dummy for
all three treatments (GK, GD, and GD large), the baseline biometric outcome, and the interaction
between the treatments and baseline biometrics. The hypothesis is that the interaction terms will
be negative, meaning that the programs are most effective for those who had the worst baseline
biometric outcomes. Table 12 the results of this analysis. The interpretation of the impacts in this
table are as follows: rows 4-6 give the simple impact of the programs when the interacted term is
zero (which, in this case, is at the mean). Rows 1-3 provide a test of the differential impact of the
program across baseline anthropometric measures, so the lack of significance in these rows means
that the impacts are not heterogeneous by nutrition status at baseline. The implication is that
the improvement in anthropometrics induced by the GD large treatment were experienced broadly
across the baseline distribution of HAZ and WAZ, and were not concentrated among those who
began the study most malnourished.
31

4.2 Anthropometric impacts by child age
We can use a similar approach to examine heterogeneity by child age. Given that we have
children who start the study outside of the first 1,000 days (those 2-5 years old at baseline), we
might expect that the impact of the program on these more fully developed children would be
smaller. Similarly, we can examine the relative impacts of the program for children born during the
study to examine the relative benefits of newborn/in utero exposure relative to children who were
eating solid foods when the program began. Given the impacts on household dietary diversity this
latter outcome may be particularly relevant.
In Table 13 we run regressions on the eligible sample, allowing treatment interactions with an
indicator for child age at endline (we do not use the ANCOVA specification in this regression so
as to be able to include children born subsequent to the baseline survey). We include two different
interactions; one using a dummy for ‘first 1,000 days at baseline’, and a second more stringent
dummy for ‘born since baseline’. The results are presented in Table 13, and are in many ways
surprising. Again, rows 4-6 provide the simple effect of the program in the older group (where
the interaction term is set to zero) and the first three rows provide a test of whether the impact is
differential for those in their first 1000 days (columns 1-3) or for newborns (columns 4-6). The small
GD treatment is less successful for HAZ among children in the first 1,000 days, and the Gikuriro
and large GD treatment effects display no consistent relationship to age.
Because of the strong overall impacts of the large GD arm on HAZ, we delve deeper into the
heterogeneity of this result. Figure 3 uses a Fan regression to present a non-parametric picture
of the GD large treatment effects across the age distribution for HAZ, and Figure 4 presents the
same graphic using anemia as the outcome. Both of these figures provide suggestive evidence that
larger treatment effects are emerging among the very youngest children who were exposed to the
program in utero. This pattern is similar to the medium-term results in Baird et al. (2016), who
find unconditional transfers in Malawi to have the largest effect on children exposed in utero. More
speculatively, for both outcomes effects are also significant again for children in the 2-4 year age
range when the program began, who would have been eating solid food, and hence the impacts
appear least significant among children of age to be being breastfed at the time of the intervention.
To summarize, treatment effects prove to be relatively homogeneous across both age and base-
32

line malnutrition status, although there is a suggestion that children exposed in utero may have
benefitted the most from the consumption increases seen in the GD Large arm. Given the rela-
tively short-term nature of our followup survey, we consider this analysis to illustrate the speed
at which the dramatic improvements in consumption and dietary diversity at the household level
seen under the GD Large treatment translate into improved biometric outcomes. The longer-term
literature has typically found impacts of large cash transfer programs on HAZ in the range of 0.2–
0.45 standard deviations (Aguero et al., 2006; Barham et al., 2014); our results suggest that these
measures improve roughly 0.1 standard deviation within a year of the inception of treatment, are all
significant at 10 percent level or above, and are relatively invariant to baseline age or malnutrition.
Comparison to the broader literature suggests that these impacts may grow over time.
5 Conclusion
This study compares a multi-pronged child nutrition program against cash transfers that have
been benchmarked to have equal cost to the donor. We find that this integrated program was
able within 8-9 months to move an important outcome directly generated by a component of its
intervention, namely SILC-driven savings, and also to significantly improve health knowledge at the
village level, a core component of the WASH and BCC interventions. The program appears to have
improved the trackability of malnourished children in treatment villages. Nonetheless, it did not
significantly shift the core child anthropometric outcomes that these interventions are intended to
target, nor child or maternal anemia. An equivalent amount of money provided in the form of a
cash transfer led to small increases across many consumption outcomes, and significantly increased
the paydown of debt, as well as production and consumption assets. A much larger cash transfer of
over $500 per household delivered comprehensive consumption benefits and also moved key health
outcomes such as dietary diversity, height and weight for age, and mortality. The results are nuanced
in terms of the modality of delivery, the choice of outcome, and the magnitude of transfers.
In concluding on the impact of Gikuriro, it is certainly possible that investments in behavior
change (such as the substantial village-level improvement in health knowledge) as well as improve-
ments in the Community Health Worker system will have longer term impacts that may do more
for the population’s nutrition over time than even a large cash transfer to a single cohort today. If
33

an increasingly capable local health infrastructure can deliver nutrition interventions over the next
ten years, then a huge number of future children could benefit and their well-being certainly should
be part of the policy calculation. However a recent RCT evaluation of the Government of Rwanda’s
CBEHPP, which is the WASH program implemented under Gikuriro, found that it was not effective
at decreasing diarrheal disease (Sinharoy et al., 2017). Given that the Gikuriro bundle which also
included direct in-kind transfers of livestock and seed was not found here to improve short-term
consumption, these broader institutional impacts would need to be substantial and improving over
time if they are lead to large long-term impacts. Therefore while Gikuriro did shift some outcomes
closely related to pieces of the intervention, we uncover little evidence that directly confirms the
program’s theory of change in driving primary child outcomes.
Our study design places some limitations on what can be learned. First, the cross-village exper-
iment lets us measure the impact of those parts of the Gikuro intervention that are implemented at
the village or household level only. Further, the relatively short time frame of the study means that
we are measuring impacts over a shorter timeframe than would be ideal, particularly for outcomes
such as malnutrition and anthropometrics that may respond slowly to improvements in nutrition.
Gikuriro made substantial investments in local capacity around health and sanitation, and this
infrastructure may drive future benefits in a way not captured in our study. We do however cost
both interventions in a manner that reflects only the ingredients to the spatial and temporal scales
over which we can measure impacts (cross-village, one year) and hence can cleanly benchmark the
benefit/cost ratios of these two very different interventions over their first year of operation.
We can use our results to make concrete two types of tradeoffs that policymakers considering
counterfactual uses of funds are forced to confront. First, tradeoffs across outcomes—for a given
set of beneficiaries—and second, tradeoffs between larger impacts concentrated among a smaller
number of beneficiaries and more diffuse impacts in a broader swathe of the target population.
To illustrate the first of these margins, consider the a policymaker who values impacts on savings
and productive assets; for simplicity of exposition we ignore other dimensions of impact.19 Both of
these represent investments in the future consumption of the household. When compared with a
cost-equivalent cash transfer, Gikuriro has relatively larger effects on savings: a differential impact19In general, it is appropriate to ignore dimensions of impact only when either the policymaker places no weight
on them, or when there is no differnetial impact of available interventions on these dimensions.
34

of 118 percent as shown in Table 7. On the other hand, GiveDirectly’s cost-equivalent transfer
delivers an impact on the value of productive assets of approximately 30 percent relative to control,
and our estimates suggest the impact of Gikuriro is 29 percent smaller. Then, a policy preference
for Gikuriro is equivalent to asserting that it is worth foregoing the increase in productive assets in
order to obtain the improvement in savings, or that the relative benefit from percent increases in
savings versus productive assets exceeds 4.06, the ratio of the differential treatment effects. This
kind of precision can help policymakers be much more exact as to the types of tradeoffs required to
justify one type of intervention over another.
Our design further reveals tradeoffs on the second, interpersonal margin. Within the cash arm,
variation in the transfer amount provides one simple way of posing this question. The ratio of
consumption impacts between the GD Small and Large treatment effects, for example, is 5.2, very
close to the ratio of transfer amounts. This suggests that consumption impacts will scale linearly
with transfer amounts. Other outcomes, such as savings or height-for-age, actually deteriorate
slightly (and statistically insignificantly) under small transfers and are only improved with large
transfers, suggesting that more resources must be concentrated on fewer households in order to drive
these outcomes. We can also compare Gikuriro to cash in this respect. While at cost-equivalent
values, Gikuriro demonstrates larger impacts on savings than a household grant, the results in Table
7 demonstrate that this is specific to the relatively small value of the cash transfer involved. We can
use the slope term on the transfer amount to calculate the smallest transfer at which the benefit of
cash would exceed Gikuriro; for savings this number is $694, and for HAZ it is $277. Obviously, on
a fixed budget large cash transfers can only be given to a smaller number of households. So we can
use our estimates to paramaterize tradeoffs between cash transfer and Gikuriro in terms of the types
of outcomes we would be able to drive as we concentrate more resources on fewer households. The
elasticity of cash’s impacts as amounts are varied illustrates that programmatic choices hinge not
only on preferences for equality across beneficiaries, but the specific outcomes being targeted.20 The
strong consumption benefits that have quite consistently been found in large cash transfer programs
may well tip the scales in favor of concentrated programs, even for inequality-averse planners.20More generally, one might characterize funders as having, e.g., CES preferences of the form W =Pi
�Pk ↵kx
⇢ik
��/⇢, where i indexes beneficiaries and k indexes dimensions of program objectives xik. Here, ↵k
captures the relative weight of outcome k in funder preferences, ⇢ captures the extent of substitutability across theseoutcomes, and � > 0 captures the degree of substitutability across individuals (with a low value of � implying astrong preference for equality across beneficiaries).
35

Given the nuance of our results, it is hard to square these results with any simple idea of cash
transfers as a kind of uni-dimensional ‘index fund’. While business investment has a single, cardinal
objective (financial profit), humanitarian investment is undertaken with many goals in mind, and
a perfect reconciling of these competing benefits would require a clear statement of tradeoffs in
this multi-dimensional space. Perhaps a clearer way of stating the counterfactual provided by
unconditional cash is that it gives us a statement of the priorities that the beneficiaries themselves
hold when credit constraints are relaxed, and thereby motivates us to be clearer about the logic
underlying paternalistic development programs. While beneficiary decisions may not be ‘optimal’
in terms of long-term social welfare (due high discount rates, to self- or other-control problem, or to
resource and information constraints for example), the impact of unconditional money is nonetheless
a powerful statement of the outcomes that the beneficiaries themselves want changed. For us to
argue that a program is justified in using resources to drive outcomes different from the ones the
beneficaries would choose, we should have a clear reason why they fail to arrive at the right decision
themselves. This is a view of benchmarking that is not about picking a winner but rather about
quantifying tradeoffs.
36
References
Aguero, Jorge, Michael Carter, and Ingrid Woolard, “The impact of unconditional cashtransfers on nutrition: The South African Child Support Grant,” 2006.
Ahmed, AU, JF Hoddinott, S Roy, E Sraboni, WR Quabili, and A Margolies, “WhichKinds of Social Safety Net Transfers Work Best for the Ultra Poor in Bangladesh,” Operation andImpacts of the Transfer Modality Research Initiative, 2016.
Aizer, Anna, Shari Eli, Joseph Ferrie, and Adriana Lleras-Muney, “The long-run impactof cash transfers to poor families,” The American Economic Review, 2016, 106 (4), 935–971.
Aker, Jenny C, Rachid Boumnijel, Amanda McClelland, and Niall Tierney, “Paymentmechanisms and antipoverty programs: Evidence from a mobile money cash transfer experimentin Niger,” Economic Development and Cultural Change, 2016, 65 (1), 1–37.
Anderson, Michael L, “Multiple inference and gender differences in the effects of early interven-tion: A reevaluation of the Abecedarian, Perry Preschool, and Early Training Projects,” Journalof the American statistical Association, 2008, 103 (484), 1481–1495.
Araujo, M Caridad, Mariano Bosch, and Norbert Schady, “Can Cash Transfers Help House-holds Escape an Inter-Generational Poverty Trap?,” in “The Economics of Poverty Traps,” Uni-versity of Chicago Press, 2017.
Athey, S. and G.W. Imbens, “The Econometrics of Randomized Experiments,” Handbook ofEconomic Field Experiments, 2017, 1, 73 – 140.
Baird, Sarah, Craig McIntosh, and Berk Özler, “Cash or condition? Evidence from a cashtransfer experiment,” The Quarterly Journal of Economics, 2011, 126 (4), 1709–1753.
, , and , “When the Money Runs Out: Do Cash Transfers Have Sustained Effects on HumanCapital Accumulation?,” World Bank Policy Research Working Paper, 2016, 7901.
, Jacobus De Hoop, and Berk Özler, “Income shocks and adolescent mental health,” Journalof Human Resources, 2013, 48 (2), 370–403.
Barham, Tania, Karen Macours, and John A Maluccio, “Schooling, Learning, and Earn-ings: Effects of a 3-Year Conditional Cash Transfer Program in Nicaragua After 10 Years,” LaPlata, Argentina: Centro para los Estudios Distributivos, de Trabajo y Sociales. Disponible en:http://www. cedlas-er. org/sites/default/files/aux_files/barham-maluccio-macours_. pdf, 2014.
Basinga, Paulin, Paul J Gertler, Agnes Binagwaho, Agnes LB Soucat, Jennifer Sturdy,and Christel MJ Vermeersch, “Effect on maternal and child health services in Rwanda ofpayment to primary health-care providers for performance: an impact evaluation,” The Lancet,2011, 377 (9775), 1421–1428.
Belloni, A, D Chen, V Chernozhukov, and C Hansen, “Sparse models and methods foroptimal instruments with an application to eminent domain,” Econometrica, November 2012, 80(6), 2369–2429.
Belloni, Alexandre, Victor Chernozhukov, and Christian Hansen, “High-dimensional meth-ods and inference on structural and treatment effects,” The Journal of Economic Perspectives,2014, 28 (2), 29–50.
37

, , and , “Inference on treatment effects after selection among high-dimensional controls,”Review of Economic Studies, 2014, 81, 608–650.
Benhassine, Najy, Florencia Devoto, Esther Duflo, Pascaline Dupas, and VictorPouliquen, “Turning a shove into a nudge? A âœlabeled cash transferâ for education,” AmericanEconomic Journal: Economic Policy, 2015, 7 (3), 86–125.
Blattman, Christopher and Paul Niehaus, “Show them the money: why giving cash helpsalleviate poverty,” Foreign Aff., 2014, 93, 117.
Brudevold-Newman, Andrew Peter, Maddalena Honorati, Pamela Jakiela, andOwen W Ozier, “A firm of one’s own: experimental evidence on credit constraints and oc-cupational choice,” 2017.
Card, David and Alan B Krueger, “Time-series minimum-wage studies: a meta-analysis,”American Economic Review, May 1995, 85 (2), 238–243.
Casey, Katherine, Rachel Glennerster, and Edward Miguel, “Reshaping institutions: Evi-dence on aid impacts using a preanalysis Plan,” Quarterly Journal of Economics, 2012, 127 (4),1755–1812.
Chowdhury, Reajul, Elliott Collins, Ethan Ligon, and Kaivan Munshi, “Valuing AssetsProvided to Low-Income Households in South Sudan,” 2016.
Cunha, Jesse M, Giacomo De Giorgi, and Seema Jaychandran, “The price effects of cashversus in-kind transfers,” Review of Economic Studies, forthcoming.
Currie, Janet and Douglas Almond, “Human capital development before age five,” Handbookof labor economics, 2011, 4, 1315–1486.
and Firouz Gahvari, “Transfers in cash and in-kind: theory meets the data,” Journal ofEconomic Literature, 2008, 46 (2), 333–383.
Desai, Amy, Laura E Smith, Mduduzi NN Mbuya, Ancikaria Chigumira, DadiraiFundira, Naume V Tavengwa, Thokozile R Malaba, Florence D Majo, Jean HHumphrey, and Rebecca J Stoltzfus, “The SHINE Trial infant feeding intervention: pi-lot study of effects on maternal learning and infant diet quality in rural Zimbabwe,” ClinicalInfectious Diseases, 2015, 61 (suppl_7), S710–S715.
Dhaliwal, Iqbal and Caitlin Tulloch, “From research to policy: using evidence from impactevaluations to inform development policy,” Journal of Development Effectiveness, 2012, 4 (4),515–536.
DHS, “Rwanda Demographic and Health Survey, 2014–15,” Technical Report, National Instituteof Statistics of Rwanda, Minisry of Finance and Economic Planning, Ministry of Health, and theDHS Program, ICF International March 2016.
Duflo, Esther, Abhijit Banerjee, Rachel Glennerster, and Cynthia G Kinnan, “Themiracle of microfinance? Evidence from a randomized evaluation,” Technical Report, NationalBureau of Economic Research 2013.
Fernald, Lia CH, Paul J Gertler, and Lynnette M Neufeld, “10-year effect of Oportu-nidades, Mexico’s conditional cash transfer programme, on child growth, cognition, language,and behaviour: a longitudinal follow-up study,” The Lancet, 2009, 374 (9706), 1997–2005.
38

Figlio, David, Jonathan Guryan, Krzysztof Karbownik, and Jeffrey Roth, “The effectsof poor neonatal health on children’s cognitive development,” The American Economic Review,2014, 104 (12), 3921–3955.
Fink, Günther, Rachel Levenson, Sarah Tembo, and Peter C Rockers, “Home-andcommunity-based growth monitoring to reduce early life growth faltering: an open-label, cluster-randomized controlled trial,” The American journal of clinical nutrition, 2017, 106 (4), 1070–1077.
Gahamanyi, Vincent and Andrew Kettlewell, “Evaluating graduation: insights from the Vi-sion 2020 Umurenge Programme in Rwanda,” IDS Bulletin, 2015, 46 (2), 48–63.
Gertler, Paul J, Sebastian W Martinez, and Marta Rubio-Codina, “Investing cash transfersto raise long-term living standards,” American Economic Journal: Applied Economics, 2012, 4(1), 164–192.
Habicht, Jean-Pierre and David L Pelletier, “The importance of context in choosing nutritionalindicators,” The Journal of nutrition, 1990, 120 (11 Suppl), 1519–1524.
Haushofer, Johannes and Jeremy Shapiro, “The short-term impact of unconditional cashtransfers to the poor: Experimental Evidence from Kenya,” The Quarterly Journal of Economics,2016, 131 (4), 1973–2042.
, James Reisinger, and Jeremy Shapiro, “Your gain is my pain: Negative psychologicalexternalities of cash transfers,” Technical Report, Working Paper, Princeton University 2015.
Hidrobo, Melissa, John Hoddinott, Amber Peterman, Amy Margolies, and VanessaMoreira, “Cash, food, or vouchers? Evidence from a randomized experiment in northernEcuador,” Journal of Development Economics, 2014, 107, 144–156.
Hoddinott, John, Harold Alderman, Jere R Behrman, Lawrence Haddad, and SusanHorton, “The economic rationale for investing in stunting reduction,” Maternal & Child Nutri-tion, 2013, 9 (S2), 69–82.
, Susanna Sandström, and Joanna Upton, “The impact of cash and food transfers: Evidencefrom a randomized intervention in Niger,” 2014.
Hoynes, Hilary, Diane Whitmore Schanzenbach, and Douglas Almond, “Long-run impactsof childhood access to the safety net,” The American Economic Review, 2016, 106 (4), 903–934.
Jones, Nicola, Bassam Abu-Hamad, Paola Pereznieto, and Kerry Sylvester, “Transform-ing Cash Transfers: CitizensâTM Perspectives on the Politics of Programme Implementation,”The Journal of Development Studies, 2016, 52 (8), 1207–1224.
Leroy, Jef L, Deanna Olney, and Marie Ruel, “Tubaramure, a Food-Assisted Integrated Healthand Nutrition Program in Burundi, Increases Maternal and Child Hemoglobin Concentrationsand Reduces Anemia: A Theory-Based Cluster-Randomized Controlled Intervention Trial–3,”The Journal of nutrition, 2016, 146 (8), 1601–1608.
, Paola Gadsden, Sonia Rodríguez-Ramírez, and Teresa González De Cossío, “Cashand in-kind transfers in poor rural communities in Mexico increase household fruit, vegetable,and micronutrient consumption but also lead to excess energy consumption,” The Journal ofnutrition, 2010, 140 (3), 612–617.
39

Levin, Henry M and Patrick J McEwan, Cost-effectiveness analysis: Methods and applications,Vol. 4, Sage, 2001.
Maluccio, John A, John Hoddinott, Jere R Behrman, Reynaldo Martorell, Agnes RQuisumbing, and Aryeh D Stein, “The impact of improving nutrition during early childhoodon education among Guatemalan adults,” The Economic Journal, 2009, 119 (537), 734–763.
Manley, James, Seth Gitter, and Vanya Slavchevska, “How effective are cash transfers atimproving nutritional status?,” World development, 2013, 48, 133–155.
Mel, Suresh De, David McKenzie, and Christopher Woodruff, “One-time transfers of cashor capital have long-lasting effects on microenterprises in Sri Lanka,” Science, 2012, 335 (6071),962–966.
Molina-Millan, Teresa, Tania Barham, Karen Macours, John A Maluccio, and MarcoStampini, “Long-Term Impacts of Conditional Cash Transfers in Latin America: Review of theEvidence,” Technical Report, Inter-American Development Bank 2016.
NISR, “Rwanda Demographic and Health Survey 2014-15. Rockvill,” Technical Report, National In-stitute of Statistics of Rwanda (NISR) [Rwanda], Ministry of Health (MOH) [Rwanda] Rockville,Maryland, USA. 2015.
NISR, “Poverty Mapping Report, 2013/14,” Technical Report, National Institute of Statistics ofRwanda, Kigali, Rwanda 2017.
Null, Clair, Christine P Stewart, Amy J Pickering, Holly N Dentz, Benjamin FArnold, Charles D Arnold, Jade Benjamin-Chung, Thomas Clasen, Kathryn GDewey, Lia CH Fernald et al., “Effects of water quality, sanitation, handwashing, and nutri-tional interventions on diarrhoea and child growth in rural Kenya: a cluster-randomised controlledtrial,” The Lancet Global Health, 2018, 6 (3), e316–e329.
Pega, Frank, Stefan Walter, Sze Yan Liu, Roman Pabayo, Stefan K Lhachimi, andRuhi Saith, “Unconditional cash transfers for reducing poverty and vulnerabilities: effect onuse of health services and health outcomes in low-and middle-income countries,” The CochraneLibrary, 2014.
Ruel, Marie T, Harold Alderman, Maternal, Child Nutrition Study Group et al.,“Nutrition-sensitive interventions and programmes: how can they help to accelerate progressin improving maternal and child nutrition?,” The Lancet, 2013, 382 (9891), 536–551.
Samuels, Fiona and Maria Stavropoulou, “â~Being Able to Breathe AgainâTM: The Effectsof Cash Transfer Programmes on Psychosocial Wellbeing,” The Journal of Development Studies,2016, 52 (8), 1099–1114.
Schwab, Benjamin et al., “In the form of bread? A randomized comparison of cash and foodtransfers in Yemen,” in “Agricultural & Applied Economics AssociationâTMs 2013 AAEA & CAESJoint Annual Meeting” 2013, pp. 4–6.
Sedlmayr, Richard, Anuj Shah, Munshi Sulaiman et al., “Cash-Plus: Cash Transfer Ex-tensions and Recipient Agency,” Technical Report, Centre for the Study of African Economies,University of Oxford 2017.
40
Seidenfeld, David, Sudhanshu Handa, Gelson Tembo, Stanfield Michelo, Charlotte Har-land Scott, and Leah Prencipe, “The impact of an unconditional cash transfer on food securityand nutrition: the Zambia child grant programme,” 2014.
Shrimpton, Roger, Cesar G Victora, Mercedes de Onis, Rosângela Costa Lima, MonikaBlössner, and Graeme Clugston, “Worldwide timing of growth faltering: implications fornutritional interventions,” Pediatrics, 2001, 107 (5), e75–e75.
Sinharoy, Sheela S, Wolf-Peter Schmidt, Ronald Wendt, Leodomir Mfura, Erin Cros-sett, Karen A Grépin, William Jack, Bernard Ngabo Rwabufigiri, James Habyari-mana, and Thomas Clasen, “Effect of community health clubs on child diarrhoea in westernRwanda: cluster-randomised controlled trial,” The Lancet Global Health, 2017, 5 (7), e699–e709.
Skoufias, Emmanuel, Susan W Parker, Jere R Behrman, and Carola Pessino, “Condi-tional cash transfers and their impact on child work and schooling: Evidence from the progresaprogram in mexico [with comments],” Economia, 2001, 2 (1), 45–96.
Taylor, J Edward, Mateusz J Filipski, Mohamad Alloush, Anubhab Gupta, RubenIrvin Rojas Valdes, and Ernesto Gonzalez-Estrada, “Economic impact of refugees,” Pro-ceedings of the National Academy of Sciences, 2016, 113 (27), 7449–7453.
Victora, Cesar Gomes, Mercedes de Onis, Pedro Curi Hallal, Monika Blössner, andRoger Shrimpton, “Worldwide timing of growth faltering: revisiting implications for interven-tions,” Pediatrics, 2010, pp. peds–2009.
41

Tab
les
Tabl
e1:
Res
earc
hD
esig
nG
ikur
iro B
ench
mar
king
Res
earc
h D
esig
n.C
ontr
olG
ikur
iroT
otal
Low
er
trans
fer
$66
Mid
dle
trans
fer
$111
Upp
er
trans
fer
$145
Larg
e
tra
nsfe
r
$566
74 v
illag
es74
vill
ages
22 v
illag
es22
vill
ages
22 v
illag
es34
vill
ages
248
villa
ges
Inel
igib
le
Hou
seho
lds
298
297
8887
8813
799
5
Elig
ible
H
ouse
hold
s52
154
116
515
416
724
61,
794
Hou
seho
ld-le
vel r
ando
miz
atio
n of
cas
h pa
ymen
t mod
ality
am
ong
elig
ible
s:Fl
ow T
rans
fers
:83
8710
414
742
1Lu
mp-
Sum
Tra
nsfe
rs:
5150
4168
210
Choi
ce:
3117
2231
101
Giv
e D
irect
ly
42

Tabl
e2:
Inte
rven
tion
Cos
tsan
dC
ompl
ianc
eR
ates
Trea
tmen
t
A
rm:
Cost
per
ben
efic
iary
to U
SAID
Frac
tion
of c
ost t
hat
is ov
erhe
ad
(ID
C/(D
C+ID
C))
Valu
e re
ceiv
ed b
y be
nefic
iary
hous
ehol
ds
Frac
tion
spen
ding
not
av
erte
d if
hous
ehol
d no
t tre
ated
(fra
ctio
n co
sts @
vill
age
leve
l)Co
mpl
iance
Rat
e am
ong
elig
ible
s
Cost
to U
SAID
pe
r elig
ible
ho
useh
old
Com
plian
ce ra
te in
po
pulat
ion
Cost
to U
SAID
pe
r ho
useh
old
in
villa
geG
ikur
iro$1
41.8
451
.4%
$72.
9140
%90
.9%
$134
.13
19.0
%$7
2.94
GD
low
er$6
6.02
37.4
%$4
1.32
0%96
.5%
$63.
7418
.5%
$12.
20G
D m
id$1
11.0
924
.7%
$83.
630%
99.7
%$1
10.7
318
.8%
$20.
83G
D u
pper
$145
.43
19.6
%$1
16.9
10%
93.3
%$1
35.7
218
.4%
$26.
69G
D la
rge
$566
.55
6.1%
$532
.00
0%98
.0%
$555
.15
17.6
%$9
9.56
43

Tabl
e3:
Att
riti
on
Pane
l A:
Hou
seho
ld-L
evel
Attr
ition
:Pa
nel B
: Ind
ivid
ual-L
evel
Attr
ition
:
VA
RIA
BLE
SV
ARI
ABL
ES
New
indi
vidu
al ap
pear
s in
surv
ey
data
(1)
(2)
(1)
(2)
(3)
(4)
(5)
(6)
(5)
Gik
uriro
trea
tmen
t vill
age
-0.0
13-0
.011
Gik
uriro
trea
tmen
t vill
age
-0.0
10-0
.008
6-0
.037
***
-0.0
38**
*-0
.004
4-0
.004
6-0
.000
50(0
.009
2)(0
.008
5)(0
.008
3)(0
.007
9)(0
.013
)(0
.012
)(0
.021
)(0
.016
)(0
.008
1)G
iveD
irect
ly N
orm
al tre
atm
ent v
illag
e-0
.008
9-0
.009
7G
iveD
irect
ly N
orm
al tre
atm
ent v
illag
e-0
.007
7-0
.007
6-0
.024
*-0
.025
**-0
.006
9-0
.001
3-0
.002
7(0
.010
)(0
.010
)(0
.009
3)(0
.009
7)(0
.013
)(0
.013
)(0
.019
)(0
.016
)(0
.008
8)G
iveD
irect
ly H
uge
treat
men
t vill
age
-0.0
17*
-0.0
15G
iveD
irect
ly L
arge
trea
tmen
t vill
age
-0.0
15*
-0.0
13-0
.022
-0.0
200.
027
0.00
56-0
.005
1(0
.009
7)(0
.009
3)(0
.008
6)(0
.008
8)(0
.016
)(0
.015
)(0
.026
)(0
.023
)(0
.009
6)H
H H
ead
Fem
ale0.
0011
Fem
ale0.
0011
0.00
12-0
.045
***
(0.0
11)
(0.0
026)
(0.0
088)
(0.0
14)
HH
doe
s eng
age
in a
gric
ultu
re a
t bas
elin
e-0
.015
HH
doe
s eng
age
in a
gric
ultu
re a
t bas
elin
e-0
.020
-0.0
37*
0.02
3(0
.012
)(0
.013
)(0
.020
)(0
.023
)H
H h
as w
age
wor
ker a
t bas
elin
e0.
0076
HH
has
wag
e w
orke
r at b
asel
ine
0.01
60.
019
0.00
38(0
.009
3)(0
.009
9)(0
.015
)(0
.016
)H
H d
oes o
pera
te m
icro
ente
rpris
e at
bas
elin
e-0
.008
3H
H d
oes o
pera
te m
icro
ente
rpris
e at
bas
elin
e-0
.008
5-0
.000
60-0
.039
*(0
.007
5)(0
.006
3)(0
.017
)(0
.022
)H
H d
oes p
artic
ipat
e in
SIL
C at
bas
elin
e0.
0004
0H
H d
oes p
artic
ipat
e in
SIL
C at
bas
elin
e-0
.005
1-0
.015
-0.0
020
(0.0
085)
(0.0
071)
(0.0
12)
(0.0
17)
Frac
tion
of v
illag
e de
fined
elig
ible
by
IPA
0.02
1Fr
actio
n of
vill
age
defin
ed e
ligib
le b
y IP
A0.
015
0.03
2-0
.003
0(0
.053
)(0
.048
)(0
.050
)(0
.060
)A
ge o
f hou
seho
ld h
ead
in y
ears
-0.0
0034
Age
of h
ouse
hold
hea
d in
yea
rs-0
.000
250.
0001
3-0
.001
7***
(0.0
0022
)(0
.000
19)
(0.0
0034
)(0
.000
52)
Hou
seho
ld h
ead
is in
scho
ol0.
11H
ouse
hold
hea
d is
in sc
hool
0.21
0.05
30.
13**
*(0
.14)
(0.2
1)(0
.11)
(0.0
25)
HH
dep
ende
ncy
ratio
(#ol
d +
#yo
ung)
/(#
hh m
embe
rs)
0.03
5H
H d
epen
denc
y ra
tio (#
old
+ #
youn
g)/(
#hh
mem
bers
)0.
027
0.05
80.
029
(0.0
30)
(0.0
32)
(0.0
56)
(0.0
63)
How
man
y pe
ople
live
in y
our h
ouse
hold
?-0
.003
6H
ow m
any
peop
le li
ve in
you
r hou
seho
ld?
-0.0
031
-0.0
060
-0.0
40**
*(0
.002
3)(0
.002
3)(0
.004
0)(0
.005
8)U
bude
he p
over
ty C
ateg
ory
1 (p
oore
st)
0.00
97U
bude
he p
over
ty C
ateg
ory
1 (p
oore
st)
-0.0
055
0.00
65-0
.017
(0.0
11)
(0.0
098)
(0.0
18)
(0.0
21)
Ubu
dehe
pov
erty
Cat
egor
y 1
(nex
t poo
rest
)0.
0061
Ubu
dehe
pov
erty
Cat
egor
y 1
(nex
t poo
rest
)-0
.004
80.
0059
0.00
64(0
.008
5)(0
.009
4)(0
.014
)(0
.017
)Co
ntro
l gro
up m
ean
0.03
30.
033
Cont
rol g
roup
mea
n0.
030
0.03
00.
071
0.07
10.
800.
800.
057
Obs
erva
tions
1793
1793
Obs
erva
tions
9189
9189
2265
2265
5192
5192
9509
$R^2
$0.
0019
0.02
3$R
^2$
0.00
140.
028
0.00
490.
025
0.00
068
0.06
80.
0000
54
***
p<0.
01, *
* p<
0.05
, * p
<0.
1**
* p<
0.01
, **
p<0.
05, *
p<
0.1
R2
Ane
mia
is ob
serv
ed
(am
ong
thos
e w
ho
shou
ld)
Regr
essio
ns a
re b
asel
ine
cros
s-se
ctio
ns, s
tand
ard
erro
rs a
re c
lust
ered
at t
he v
illag
e le
vel t
o re
flect
the
desig
n ef
fect
, and
ana
lysis
is w
eigh
ted
to b
e
Child
Attr
ites
fr
om A
nthr
opom
etric
s
Out
com
e:
Hou
seho
ld A
ttrite
sIn
divi
dual
Attr
ites
from
Ros
ter
Out
com
e:
Regr
essio
ns a
re b
asel
ine
cros
s-se
ctio
ns, s
tand
ard
erro
rs a
re c
lust
ered
at t
he v
illag
e le
vel t
o
44

Tabl
e4:
Bal
ance
Bas
elin
e B
alan
ce T
ests
Pane
l A:
Base
line
Hou
seho
ld-le
vel O
utco
mes
:
VA
RIA
BLE
S
Per C
apita
M
onth
ly
Cons
umpt
ion†
Die
tary
D
iver
sity
Tota
l H
ouse
hold
W
ealth
†Bo
rrow
ing†
Savi
ng†
Hea
lth
Kno
wle
dge
Sani
tatio
n Pr
actic
esPr
oduc
tive
Ass
ets†
Cons
umpt
ion
Ass
ets†
Hou
se V
alue†
Hou
se Q
ualit
y
(1)
(2)
(3)
(4)
(5)
(6)
(7)
(8)
(9)
(10)
(11)
Gik
uriro
Tre
atm
ent
0.04
4-0
.071
0.19
-0.4
3-0
.19
-0.5
90.
29*
0.30
**0.
15-0
.050
0.01
7(0
.12)
(0.1
4)(0
.29)
(0.3
6)(0
.38)
(0.3
7)(0
.17)
(0.1
3)(0
.29)
(0.0
62)
(0.1
1)G
iveD
irect
ly S
mall
tran
sfer
s0.
047
-0.0
710.
038
-0.0
069
-0.6
7*-0
.12
-0.1
00.
21-0
.055
-0.0
19-0
.19
(0.1
2)(0
.14)
(0.2
8)(0
.41)
(0.3
6)(0
.41)
(0.1
9)(0
.14)
(0.3
1)(0
.076
)(0
.13)
Giv
eDire
ctly
Lar
ge tr
ansf
er-0
.10
-0.0
63-0
.070
-0.2
9-0
.24
-0.2
3-0
.069
0.28
**0.
45-0
.075
-0.0
26(0
.13)
(0.1
7)(0
.31)
(0.4
2)(0
.42)
(0.5
2)(0
.21)
(0.1
3)(0
.30)
(0.0
69)
(0.2
0)Co
ntro
l Gro
up M
ean
10.4
4.16
12.7
5.96
5.18
0.19
-0.2
311
.28.
7213
.60.
018
Obs
erva
tions
1744
1744
1745
1745
1744
1751
1751
1744
1744
1638
1750
R-sq
uare
d0.
053
0.09
80.
053
0.04
00.
016
0.02
90.
042
0.12
0.07
80.
098
0.04
0
Pane
l B:
Base
line
Indi
vidu
al-le
vel O
utco
mes
:
VA
RIA
BLE
SH
eigh
t-for
-Age
Wei
ght-f
or-A
geM
id-U
pper
A
rm
Circ
umfe
renc
ePr
egna
ncy
Live
Birt
hBi
rths i
n Fa
cilit
ies
Vac
cina
tions
(a
ny in
pas
t ye
ar)
Vac
cina
tions
co
mpl
ete
Diar
rhea
l Pr
evale
nce
(1)
(2)
(3)
(4)
(5)
(6)
(7)
(8)
(9)
Gik
uriro
Tre
atm
ent
-0.0
21-0
.029
0.00
0099
-0.0
11-0
.008
50.
010
0.00
44-0
.001
80.
023
(0.0
86)
(0.0
67)
(0.0
68)
(0.0
26)
(0.0
42)
(0.0
38)
(0.0
19)
(0.0
36)
(0.0
39)
Giv
eDire
ctly
Sm
all tr
ansf
ers
0.06
40.
031
0.05
8-0
.026
0.00
65-0
.076
-0.0
092
-0.0
090
0.00
42(0
.091
)(0
.065
)(0
.067
)(0
.024
)(0
.044
)(0
.047
)(0
.022
)(0
.041
)(0
.031
)G
iveD
irect
ly L
arge
tran
sfer
0.15
0.15
**0.
065
-0.0
430.
091*
-0.0
320.
0071
0.04
0-0
.007
6(0
.097
)(0
.070
)(0
.090
)(0
.028
)(0
.055
)(0
.046
)(0
.025
)(0
.040
)(0
.042
)Co
ntro
l Gro
up M
ean
-1.9
2-1
.04
-0.6
50.
320.
810.
930.
930.
720.
43O
bser
vatio
ns21
2521
0416
2920
9966
356
113
8613
8411
63R-
squa
red
0.16
0.07
60.
094
0.05
30.
160.
150.
071
0.08
70.
047
Sam
ple
Wom
enPr
egna
ncie
sBi
rths
K
ids u
nder
5U
nder
6 A
nthr
o pa
nel
Prim
ary
Out
com
es:
Seco
ndar
y O
utco
mes
:
Prim
ary
Out
com
es:
Seco
ndar
y O
utco
mes
:
Regr
essio
ns a
re b
asel
ine
cros
s-se
ctio
ns, s
tand
ard
erro
rs a
re c
lust
ered
at t
he v
illag
e le
vel t
o re
flect
the
desig
n ef
fect
, and
ana
lysis
is w
eigh
ted
to b
e re
pres
enta
tive
of a
ll el
igib
le h
ouse
hold
s in
stud
y vi
llage
s. O
utco
mes
m
arke
d w
ith a
† a
re a
naly
zed
in In
vers
e H
yper
bolic
Sin
es, m
eani
ng th
at im
pact
s sho
uld
be in
tere
pret
ed a
s per
cent
cha
nges
in th
e ou
tcom
e. *
** p
<0.
01, *
* p<
0.05
, * p
<0.
1
Kid
s und
er 2
Regr
essio
ns a
re b
asel
ine
cros
s-se
ctio
ns, s
tand
ard
erro
rs a
re c
lust
ered
at t
he v
illag
e le
vel t
o re
flect
the
desig
n ef
fect
, and
ana
lysis
is w
eigh
ted
to b
e re
pres
enta
tive
of a
ll el
igib
le h
ouse
hold
s in
stud
y vi
llage
s. *
** p
<0.
01, *
* p<
0.05
, * p
<0.
1
45

Tabl
e5:
Impa
cts
amon
gE
ligib
leH
ouse
hold
s
Pane
l A:
Hou
seho
ld-le
vel O
utco
mes
:
VA
RIA
BLE
S
Per C
apita
M
onth
ly
Cons
umpt
ion†
Die
tary
D
iver
sity
Tota
l H
ouse
hold
W
ealth
†Bo
rrow
ing†
Savi
ng†
Hea
lth
Kno
wle
dge
Sani
tatio
n Pr
actic
esPr
oduc
tive
Ass
ets†
Cons
umpt
ion
Ass
ets†
Hou
se V
alue†
Hou
se Q
ualit
y
(1)
(2)
(3)
(4)
(5)
(6)
(7)
(8)
(9)
(10)
(11)
Gik
uriro
Tre
atm
ent
-0.0
970.
17-0
.028
0.07
51.
09**
*-0
.086
-0.2
70.
0008
2-0
.38
-0.0
19-0
.20
(0.0
99)
(0.1
3)(0
.19)
(0.3
5)(0
.32)
(0.3
7)(0
.22)
(0.1
0)(0
.24)
(0.0
57)
(0.1
5)G
iveD
irect
ly S
mall
tran
sfer
s0.
062
0.16
-0.0
17-0
.76*
*-0
.14
0.15
0.17
0.26
**0.
37*
-0.0
25-0
.22*
(0.0
92)
(0.1
5)(0
.21)
(0.3
1)(0
.34)
(0.3
2)(0
.23)
(0.1
0)(0
.21)
(0.0
62)
(0.1
3)G
iveD
irect
ly L
arge
tran
sfer
0.32
***
0.52
***
0.34
-0.3
30.
60*
0.05
90.
074
0.76
***
0.92
***
0.20
***
0.21
(0.1
1)(0
.13)
(0.2
8)(0
.40)
(0.3
2)(0
.47)
(0.2
9)(0
.11)
(0.2
5)(0
.063
)(0
.18)
Base
line
Cont
rol M
ean
10.7
4.77
13.0
7.39
5.88
2.89
-0.6
811
.28.
7013
.8-0
.17
F-te
st: G
D b
enef
it ra
tio =
cos
t rat
io0.
980.
690.
670.
012
0.42
0.64
0.47
0.25
0.32
0.26
0.04
8O
bser
vatio
ns17
4417
4417
4517
4517
4417
5117
5117
4417
4416
3817
50R-
squa
red
0.12
0.18
0.23
0.12
0.16
0.03
60.
064
0.29
0.35
0.34
0.09
8
Pane
l B:
Indi
vidu
al-le
vel O
utco
mes
:
VA
RIA
BLE
SH
eigh
t-for
-Age
Wei
ght-f
or-
Age
Mid
-Upp
er
Arm
Ci
rcum
fere
nce
Ane
mia,
Ch
ildre
nA
nem
ia,
Mot
hers
Child
Mor
talit
yPr
egna
ncy
Live
Birt
hBi
rths i
n Fa
cilit
ies
Vac
cina
tions
(a
ny in
pas
t ye
ar)
Vac
cina
tions
co
mpl
ete
Dise
ase
Burd
enD
iarrh
eal
Prev
alenc
e
(1)
(2)
(3)
(4)
(5)
(6)
(7)
(8)
(9)
(10)
(11)
(12)
(13)
Gik
uriro
Tre
atm
ent
0.05
20.
039
0.02
20.
0041
-0.0
23-0
.006
1-0
.031
0.11
-0.0
500.
010
0.01
1-0
.019
-0.0
035
(0.0
45)
(0.0
40)
(0.0
56)
(0.0
22)
(0.0
27)
(0.0
051)
(0.0
25)
(0.0
79)
(0.0
59)
(0.0
34)
(0.0
39)
(0.0
32)
(0.0
15)
Giv
eDire
ctly
Sm
all tr
ansf
ers
-0.0
190.
011
-0.0
065
0.02
4-0
.001
5-0
.003
6-0
.035
0.09
20.
067
-0.0
11-0
.013
-0.0
31-0
.000
22(0
.039
)(0
.033
)(0
.065
)(0
.025
)(0
.029
)(0
.006
4)(0
.031
)(0
.072
)(0
.051
)(0
.032
)(0
.035
)(0
.030
)(0
.016
)G
iveD
irect
ly L
arge
tran
sfer
0.09
1**
0.06
7*0.
13*
-0.0
078
-0.0
26-0
.009
0**
-0.0
065
-0.0
67-0
.064
-0.0
060
0.00
50-0
.018
-0.0
067
(0.0
45)
(0.0
36)
(0.0
78)
(0.0
38)
(0.0
31)
(0.0
044)
(0.0
27)
(0.0
81)
(0.0
99)
(0.0
39)
(0.0
38)
(0.0
33)
(0.0
16)
End
line
Cont
rol M
ean
-1.9
2-1
.06
-0.7
20.
180.
120.
013
0.20
0.68
0.84
0.72
0.58
0.54
0.09
0F-
test
: GD
ben
efit
ratio
= c
ost r
atio
0.30
0.93
0.60
0.30
0.88
0.76
0.24
0.11
0.10
0.75
0.66
0.33
0.94
Obs
erva
tions
2125
2104
1629
2372
1581
2687
2552
411
293
1291
1291
2680
2680
R-sq
uare
d0.
710.
680.
510.
070
0.11
0.00
970.
082
0.13
0.16
0.26
0.17
0.05
30.
043
AN
COV
AY
YY
NN
NN
NN
NN
NN
Sam
ple
Und
er 6
Mom
sU
nder
6W
omen
Preg
nanc
ies
Birth
s
***
p<0.
01, *
* p<
0.05
, * p
<0.
1
Regr
essio
ns w
ith b
oth
base
line
and
endl
ine
outc
ome
mea
sure
men
t are
AN
COV
A w
ith la
gged
dep
ende
nt v
ariab
les a
s con
trols,
run
on th
e pa
nel s
ampl
e. A
nem
ia da
ta w
as o
nly
colle
cted
at e
ndlin
e, an
d re
gres
ions
on
preg
nanc
y ou
tcom
es a
nd m
orta
lity
are
endl
ine
cros
s-se
ctio
nal r
egre
ssio
ns.
Regr
essio
ns a
re w
eigh
ted
so a
s to
be re
pres
enta
tive
of a
ll el
igib
le h
ouse
hold
s in
stud
y vi
llage
s. S
tand
ard
erro
rs a
re c
lust
ered
at t
he v
illag
e le
vel t
o re
flect
the
desig
n ef
fect
.
Und
er 3
Und
er 6
Und
er 6
Ant
hro
pane
l
Prim
ary
Out
com
es:
Seco
ndar
y O
utco
mes
:
All
regr
essio
ns a
re A
NCO
VA
with
lagg
ed d
epen
dent
var
iable
s as c
ontro
ls, ru
n on
the
pane
l sam
ple.
Reg
ress
ions
are
wei
ghte
d so
as t
o be
repr
esen
tativ
e of
all
elig
ible
hou
seho
lds i
n st
udy
villa
ges.
Sta
ndar
d er
rors
are
cl
uste
red
at th
e vi
llage
leve
l to
refle
ct th
e de
sign
effe
ct.
Out
com
es m
arke
d w
ith a
† a
re a
naly
zed
as in
vers
e hy
perb
olic
sine
, mea
ning
that
impa
cts s
houl
d be
inte
repr
eted
as p
erce
nt c
hang
es in
the
outc
ome.
***
p<
0.01
, **
p<0.
05, *
p<
0.1
Seco
ndar
y O
utco
mes
:Pr
imar
y O
utco
mes
:
46

Tabl
e6:
Ant
hrop
omet
ric
Impa
cts
usin
gA
ttri
tion
IPW
s
Ana
lysi
s us
ing
Attr
ition
IPW
s fo
r Ant
hrop
omet
ric O
utco
mes
:In
divi
dual
-leve
l Out
com
es:
VA
RIA
BLE
SH
eigh
t-for
-Age
Wei
ght-f
or-A
geM
id-U
pper
A
rm
Circ
umfe
renc
eH
eigh
t-for
-Age
Wei
ght-f
or-A
geM
id-U
pper
A
rm
Circ
umfe
renc
e(1
)(2
)(3
)(4
)(5
)(6
)G
ikur
iro T
reat
men
t0.
052
0.03
90.
022
0.05
10.
038
0.02
2(0
.045
)(0
.040
)(0
.056
)(0
.045
)(0
.040
)(0
.056
)G
iveD
irect
ly S
mall
tran
sfer
s-0
.019
0.01
1-0
.006
5-0
.021
0.01
00-0
.006
5(0
.039
)(0
.033
)(0
.065
)(0
.039
)(0
.034
)(0
.066
)G
iveD
irect
ly L
arge
tran
sfer
0.09
1**
0.06
7*0.
13*
0.09
1**
0.06
6*0.
13*
(0.0
45)
(0.0
36)
(0.0
78)
(0.0
46)
(0.0
36)
(0.0
78)
End
line
Cont
rol M
ean
-1.9
2-1
.06
-0.7
2-1
.92
-1.0
6-0
.72
F-te
st: G
D b
enef
it ra
tio =
cos
t rat
io0.
300.
930.
600.
280.
920.
60O
bser
vatio
ns21
2521
0416
2921
2521
0416
29R-
squa
red
0.71
0.68
0.51
0.71
0.68
0.50
AN
COV
AY
YY
YY
YSa
mpl
eRe
gres
sions
are
AN
COV
A w
ith la
gged
dep
ende
nt v
ariab
les a
s con
trols,
run
on th
e pa
nel s
ampl
e.
Regr
essio
ns a
re w
eigh
ted
so a
s to
be
repr
esen
tativ
e of
all
elig
ible
hou
seho
lds i
n st
udy
villa
ges.
Sta
ndar
d er
rors
are
clu
ster
ed a
t the
vill
age
leve
l to
refle
ct th
e de
sign
effe
ct.
***
p<0.
01, *
* p<
0.05
, * p
<0.
1
Surv
ey *
Attr
ition
Pro
pens
ity W
eigh
ts
Und
er 6
Ant
hro
pane
l
Nor
mal
Sur
vey
Wei
ghts
47

Tabl
e7:
Cos
tE
quiv
alen
tB
ench
mar
king
Pane
l A:
Hou
seho
ld-le
vel O
utco
mes
:
VA
RIA
BLE
S
Per C
apita
M
onth
ly
Cons
umpt
ion†
Die
tary
D
iver
sity
Tota
l H
ouse
hold
W
ealth
†Bo
rrow
ing†
Savi
ng†
Hea
lth
Kno
wle
dge
Sani
tatio
n Pr
actic
esPr
oduc
tive
Ass
ets†
Cons
umpt
ion
Ass
ets†
Hou
se V
alue†
Hou
se Q
ualit
y
(1)
(2)
(3)
(4)
(5)
(6)
(7)
(8)
(9)
(10)
(11)
Diff
eren
tial e
ffec
t of G
ikur
iro a
t ben
chm
arke
d co
st-0
.18*
*-0
.016
-0.0
400.
80**
*1.
18**
*-0
.23
-0.4
4**
-0.2
9***
-0.7
9***
-0.0
15-0
.005
5(0
.082
)(0
.13)
(0.2
0)(0
.28)
(0.3
4)(0
.33)
(0.2
2)(0
.099
)(0
.26)
(0.0
52)
(0.1
5)G
D c
ost e
quiv
alent
impa
ct (d
umm
y fo
r 'ei
ther
trea
tmen
t')0.
082
0.19
0.01
1-0
.73*
*-0
.094
0.15
0.16
0.30
***
0.40
**-0
.005
1-0
.19
(0.0
90)
(0.1
4)(0
.21)
(0.3
1)(0
.32)
(0.3
2)(0
.22)
(0.1
0)(0
.20)
(0.0
60)
(0.1
3)A
dditi
onal
effe
ct o
f eac
h $1
00 fr
om G
D0.
056*
*0.
077*
*0.
075
0.09
20.
17**
-0.0
24-0
.021
0.11
***
0.12
**0.
046*
**0.
098*
*(0
.022
)(0
.031
)(0
.064
)(0
.074
)(0
.074
)(0
.097
)(0
.066
)(0
.025
)(0
.056
)(0
.014
)(0
.045
)Ba
selin
e Co
ntro
l Mea
n10
.44.
1612
.75.
965.
180.
19-0
.23
11.2
8.72
13.6
0.01
8O
bser
vatio
ns17
4417
4417
4517
4517
4417
5117
5117
4417
4416
3817
50R-
squa
red
0.12
0.18
0.23
0.12
0.16
0.03
60.
064
0.29
0.35
0.33
0.09
9
Pane
l B:
Indi
vidu
al-le
vel O
utco
mes
:
VA
RIA
BLE
SH
eigh
t-for
-Age
Wei
ght-f
or-A
geM
id-U
pper
A
rm
Circ
umfe
renc
e
Ane
mia,
Ch
ildre
nA
nem
ia,
Mot
hers
Child
Mor
talit
yPr
egna
ncy
Live
Birt
hBi
rths i
n Fa
cilit
ies
Vac
cina
tions
(a
ny in
pas
t ye
ar)
Vac
cina
tions
co
mpl
ete
Dise
ase
Burd
enD
iarrh
eal
Prev
alenc
e
(1)
(2)
(3)
(4)
(5)
(6)
(7)
(8)
(9)
(10)
(11)
(12)
(13)
Diff
eren
tial e
ffec
t of G
ikur
iro a
t ben
chm
arke
d co
st0.
061
0.02
40.
019
-0.0
18-0
.019
-0.0
023
0.00
230.
024
-0.1
1**
0.01
90.
022
0.01
2-0
.003
4(0
.040
)(0
.039
)(0
.062
)(0
.026
)(0
.021
)(0
.004
9)(0
.027
)(0
.067
)(0
.051
)(0
.032
)(0
.036
)(0
.033
)(0
.014
)G
D c
ost e
quiv
alent
impa
ct (d
umm
y fo
r 'ei
ther
trea
tmen
t')-0
.009
80.
014
0.00
310.
022
-0.0
046
-0.0
038
-0.0
340.
081
0.05
7-0
.008
7-0
.010
-0.0
31-0
.000
11(0
.038
)(0
.032
)(0
.063
)(0
.025
)(0
.028
)(0
.006
1)(0
.030
)(0
.070
)(0
.050
)(0
.031
)(0
.034
)(0
.029
)(0
.015
)A
dditi
onal
effe
ct o
f eac
h $1
00 fr
om G
D0.
022*
*0.
013
0.03
0-0
.007
6-0
.004
3-0
.001
40.
0070
-0.0
35**
-0.0
28-0
.000
330.
0029
0.00
42-0
.001
9(0
.009
6)(0
.008
6)(0
.019
)(0
.009
3)(0
.005
5)(0
.001
2)(0
.006
3)(0
.017
)(0
.021
)(0
.008
8)(0
.008
5)(0
.007
9)(0
.003
4)E
ndlin
e Co
ntro
l Mea
n-1
.92
-1.0
6-0
.72
0.22
0.12
0.00
560.
200.
680.
840.
720.
580.
540.
090
Obs
erva
tions
2125
2104
1629
2372
1581
2687
2552
411
293
1291
1291
2680
2680
R-sq
uare
d0.
710.
680.
510.
071
0.11
0.00
980.
082
0.13
0.16
0.26
0.17
0.05
30.
043
AN
COV
AY
YY
NN
NN
NN
NN
NN
Sam
ple
Und
er 6
Mom
sU
nder
6W
omen
Preg
nanc
ies
Birth
s
Regr
essio
ns w
ith b
oth
base
line
and
endl
ine
outc
ome
mea
sure
men
t are
AN
COV
A w
ith la
gged
dep
ende
nt v
ariab
les a
s con
trols,
run
on th
e pa
nel s
ampl
e. A
nem
ia da
ta w
as o
nly
colle
cted
at e
ndlin
e, an
d re
gres
ions
on
preg
nanc
y ou
tcom
es a
nd m
orta
lity
are
endl
ine
cros
s-se
ctio
nal
regr
essio
ns.
Regr
essio
ns a
re w
eigh
ted
so a
s to
be re
pres
enta
tive
of a
ll el
igib
le h
ouse
hold
s in
stud
y vi
llage
s. S
tand
ard
erro
rs a
re c
lust
ered
at t
he v
illag
e le
vel t
o re
flect
the
desig
n ef
fect
. **
* p<
0.01
, **
p<0.
05, *
p<
0.1
Prim
ary
Out
com
es:
Seco
ndar
y O
utco
mes
:
All
regr
essio
ns a
re A
NCO
VA
with
lagg
ed d
epen
dent
var
iable
s as c
ontro
ls, ru
n on
the
pane
l sam
ple.
Firs
t row
is a
dum
my
for G
ikur
iro tr
eatm
ent,
and
refle
cts t
he d
iffer
entia
l eff
ect o
f Gik
uriro
trea
tmen
t ove
r GD
at e
quiv
alent
cos
t. S
econ
d ro
w
is a
dum
my
for e
ither
trea
tmen
t. T
he th
ird ro
w in
clud
es th
e do
llar-
valu
e de
viat
ion
(in h
undr
eds o
f dol
lars)
of t
he G
D v
illag
e-le
vel t
rans
fer a
mou
nt fr
om th
e co
st o
f Gik
uriro
, mea
ning
that
the
first
row
serv
es a
s an
inte
rcep
t and
mea
sure
s im
pact
at
equ
ivale
nt c
ost.
Reg
ress
ions
wei
ghte
d so
as t
o be
repr
esen
tativ
e of
elig
ible
hou
seho
lds i
n st
udy
villa
ges.
Sta
ndar
d er
rors
are
clu
ster
ed a
t the
vill
age
leve
l to
refle
ct th
e de
sign
effe
ct. O
utco
mes
mar
ked
with
a †
are
ana
lyze
d as
inve
rse
hype
rbol
ic
sine,
mea
ning
that
impa
cts s
houl
d be
inte
repr
eted
as p
erce
nt c
hang
es in
the
outc
ome.
***
p<
0.01
, **
p<0.
05, *
p<
0.1
Prim
ary
Out
com
es:
Seco
ndar
y O
utco
mes
:
Und
er 6
Ant
hro
pane
lU
nder
3U
nder
6
48
Andrew Zeitlin

Tabl
e8:
Tota
lCau
salE
ffect
son
Who
leV
illag
e
Pane
l A:
Hou
seho
ld-le
vel O
utco
mes
:
VA
RIA
BLE
S
Per C
apita
M
onth
ly
Cons
umpt
ion†
Die
tary
D
iver
sity
Tota
l H
ouse
hold
W
ealth
†Bo
rrow
ing†
Savi
ng†
Hea
lth
Kno
wle
dge
Sani
tatio
n Pr
actic
esPr
oduc
tive
Ass
ets†
Cons
umpt
ion
Ass
ets†
Hou
se V
alue†
Hou
se Q
ualit
y
(1)
(2)
(3)
(4)
(5)
(6)
(7)
(8)
(9)
(10)
(11)
Gik
uriro
Tre
atm
ent
-0.1
40.
12-0
.19
0.14
-0.2
11.
44**
*0.
17-0
.056
0.10
0.00
65-0
.17
(0.1
0)(0
.13)
(0.2
4)(0
.41)
(0.3
7)(0
.39)
(0.2
0)(0
.14)
(0.2
3)(0
.074
)(0
.17)
Giv
eDire
ctly
Sm
all tr
ansf
ers
-0.1
30.
0010
-0.3
2-0
.39
-0.4
00.
68*
-0.2
7-0
.15
0.02
10.
031
-0.0
081
(0.1
1)(0
.13)
(0.2
8)(0
.39)
(0.4
0)(0
.41)
(0.2
3)(0
.14)
(0.2
4)(0
.066
)(0
.16)
Giv
eDire
ctly
Lar
ge tr
ansf
er-0
.090
-0.2
4-0
.47
-0.2
6-0
.75*
*-0
.40
0.30
0.25
0.35
0.08
3-0
.019
(0.1
8)(0
.18)
(0.3
0)(0
.43)
(0.3
8)(0
.54)
(0.3
5)(0
.17)
(0.3
7)(0
.077
)(0
.19)
Base
line
Cont
rol M
ean
10.6
4.29
13.9
5.35
6.03
-0.1
20.
2912
.09.
8514
.00.
20F-
test
: GD
ben
efit
ratio
= c
ost r
atio
0.26
0.68
0.40
0.35
0.50
0.04
80.
140.
140.
830.
820.
98O
bser
vatio
ns27
1027
1027
1027
0827
1027
1827
1827
1027
0924
9427
16R-
squa
red
0.11
0.22
0.28
0.11
0.15
0.05
50.
068
0.31
0.31
0.40
0.16
Pane
l B:
Indi
vidu
al-le
vel O
utco
mes
:
VA
RIA
BLE
SH
eigh
t-for
-Age
Wei
ght-f
or-A
geM
id-U
pper
A
rm
Circ
umfe
renc
e
Child
Mor
talit
yPr
egna
ncy
Live
Birt
hBi
rths i
n Fa
cilit
ies
Vac
cina
tions
(a
ny in
pas
t ye
ar)
Vac
cina
tions
co
mpl
ete
Dise
ase
Burd
enD
iarrh
eal
Prev
alenc
e
(1)
(2)
(3)
(4)
(5)
(6)
(7)
(8)
(9)
(10)
(11)
Gik
uriro
Tre
atm
ent
-0.0
15-0
.066
-0.0
720.
0042
0.02
00.
0070
-0.0
270.
11*
0.20
***
0.01
80.
0070
(0.0
54)
(0.0
49)
(0.0
69)
(0.0
057)
(0.0
22)
(0.0
77)
(0.0
70)
(0.0
59)
(0.0
64)
(0.0
52)
(0.0
18)
Giv
eDire
ctly
Sm
all tr
ansf
ers
-0.0
12-0
.015
-0.0
24-0
.001
40.
0017
-0.0
430.
048
0.07
40.
079
-0.0
280.
033
(0.0
54)
(0.0
39)
(0.0
69)
(0.0
021)
(0.0
20)
(0.0
91)
(0.0
61)
(0.0
57)
(0.0
64)
(0.0
47)
(0.0
22)
Giv
eDire
ctly
Lar
ge tr
ansf
er0.
049
0.02
00.
062
-0.0
030
-0.0
072
-0.0
44-0
.006
00.
16**
0.21
***
-0.0
026
0.03
0(0
.058
)(0
.051
)(0
.086
)(0
.002
3)(0
.023
)(0
.093
)(0
.088
)(0
.062
)(0
.064
)(0
.055
)(0
.025
)E
ndlin
e Co
ntro
l Mea
n-1
.75
-0.8
7-0
.61
0.00
590.
120.
700.
900.
730.
480.
500.
068
F-te
st: G
D b
enef
it ra
tio =
cos
t rat
io0.
650.
610.
580.
690.
860.
690.
350.
390.
520.
520.
19O
bser
vatio
ns26
1825
9419
8133
7341
3759
441
614
7914
7933
6633
66R-
squa
red
0.74
0.74
0.57
0.02
00.
110.
130.
160.
310.
170.
064
0.05
3A
NCO
VA
YY
YN
NN
NN
NN
NSa
mpl
eU
nder
6W
omen
Preg
nanc
ies
Birth
s
Regr
essio
ns w
ith b
oth
base
line
and
endl
ine
outc
ome
mea
sure
men
t are
AN
COV
A w
ith la
gged
dep
ende
nt v
ariab
les a
s con
trols,
run
on th
e pa
nel s
ampl
e. A
nem
ia da
ta w
as o
nly
colle
cted
at e
ndlin
e, an
d re
gres
ions
on
preg
nanc
y ou
tcom
es a
nd m
orta
lity
are
endl
ine
cros
s-se
ctio
nal r
egre
ssio
ns. R
egre
ssio
ns in
clud
e bo
th 'e
ligib
le' a
nd 'i
nelig
ible
' hou
seho
lds a
rnd
are
wei
ghte
d to
be
repr
esen
tativ
e of
all
hous
ehol
ds in
stud
y vi
llage
s. *
** p
<0.
01,
** p
<0.
05, *
p<
0.1
Prim
ary
Out
com
es:
Seco
ndar
y O
utco
mes
:
Prim
ary
Out
com
es:
Seco
ndar
y O
utco
mes
:
All
regr
essio
ns a
re A
NCO
VA
with
lagg
ed d
epen
dent
var
iable
s as c
ontro
ls, ru
n on
the
pane
l sam
ple.
Reg
ress
ions
incl
ude
both
'elig
ible
' and
'ine
ligib
le' h
ouse
hold
s and
are
wei
ghte
d so
as t
o be
repr
esen
tativ
e of
all
hous
ehol
ds in
stud
y vi
llage
s. S
tand
ard
erro
rs a
re c
lust
ered
at t
he v
illag
e le
vel t
o re
flect
the
desig
n ef
fect
. O
utco
mes
mar
ked
with
a †
are
ana
lyze
d as
inve
rse
hype
rbol
ic si
ne, m
eani
ng th
at im
pact
s sho
uld
be in
tere
pret
ed a
s pe
rcen
t cha
nges
in th
e ou
tcom
e. **
* p<
0.01
, **
p<0.
05, *
p<
0.1
Und
er 6
Ant
hro
pane
lU
nder
3U
nder
6
49

Tabl
e9:
Cos
tB
ench
mar
ked
Tota
lCau
salE
ffect
s
Pane
l A:
Hou
seho
ld-le
vel O
utco
mes
:
VA
RIA
BLE
S
Per C
apita
M
onth
ly
Cons
umpt
ion†
Die
tary
D
iver
sity
Tota
l H
ouse
hold
W
ealth
†Bo
rrow
ing†
Savi
ng†
Hea
lth
Kno
wle
dge
Sani
tatio
n Pr
actic
esPr
oduc
tive
Ass
ets†
Cons
umpt
ion
Ass
ets†
Hou
se V
alue†
Hou
se Q
ualit
y
(1)
(2)
(3)
(4)
(5)
(6)
(7)
(8)
(9)
(10)
(11)
Diff
eren
tial e
ffec
t of G
ikur
iro a
t ben
chm
arke
d co
st-0
.033
0.27
*0.
220.
480.
431.
49**
*0.
057
-0.1
8-0
.13
-0.0
57-0
.15
(0.1
3)(0
.15)
(0.2
4)(0
.37)
(0.3
5)(0
.43)
(0.2
5)(0
.14)
(0.2
8)(0
.074
)(0
.15)
GD
cos
t equ
ivale
nt im
pact
(dum
my
for '
eith
er tr
eatm
ent')
-0.1
1-0
.14
-0.4
0-0
.33
-0.6
4*-0
.043
0.11
0.12
0.23
0.06
3-0
.021
(0.1
3)(0
.14)
(0.2
5)(0
.37)
(0.3
3)(0
.43)
(0.2
6)(0
.14)
(0.2
8)(0
.063
)(0
.16)
Add
ition
al ef
fect
of e
ach
$100
from
GD
0.
0004
6-0
.002
5-0
.001
10.
0004
7-0
.004
6-0
.014
**0.
0070
0.00
52**
0.00
380.
0005
8-0
.000
35(0
.002
2)(0
.002
2)(0
.004
3)(0
.005
1)(0
.005
1)(0
.006
8)(0
.004
5)(0
.002
0)(0
.004
5)(0
.000
99)
(0.0
021)
Base
line
Cont
rol M
ean
10.6
4.29
13.9
5.35
6.03
-0.1
20.
2912
.09.
8514
.00.
20O
bser
vatio
ns27
1027
1027
1027
0827
1027
1827
1827
1027
0924
9427
16R-
squa
red
0.11
0.21
0.28
0.11
0.15
0.05
60.
068
0.31
0.31
0.40
0.16
Pane
l B:
Indi
vidu
al-le
vel O
utco
mes
:
VA
RIA
BLE
SH
eigh
t-for
-Age
Wei
ght-f
or-A
geM
id-U
pper
A
rm
Circ
umfe
renc
e
Ane
mia,
Ch
ildre
nA
nem
ia,
Mot
hers
Child
Mor
talit
yPr
egna
ncy
Live
Birt
hBi
rths i
n Fa
cilit
ies
Vac
cina
tions
(a
ny in
pas
t ye
ar)
Vac
cina
tions
co
mpl
ete
Dise
ase
Burd
enD
iarrh
eal
Prev
alenc
e
(1)
(2)
(3)
(4)
(5)
(6)
(7)
(8)
(9)
(10)
(11)
(12)
(13)
Diff
eren
tial e
ffec
t of G
ikur
iro a
t ben
chm
arke
d co
st-0
.043
-0.0
74-0
.098
0.00
22-0
.007
50.
0068
0.02
50.
049
-0.0
39-0
.013
0.03
50.
033
-0.0
24(0
.049
)(0
.050
)(0
.072
)(0
.028
)(0
.022
)(0
.005
9)(0
.020
)(0
.083
)(0
.066
)(0
.045
)(0
.054
)(0
.045
)(0
.020
)V
illag
e re
ceiv
es e
ither
Tre
atm
ent (
GD
eff
ect)
0.02
70.
0076
0.02
60.
0019
-0.0
16-0
.002
4-0
.004
6-0
.042
0.01
20.
13**
0.16
***
-0.0
150.
031
(0.0
50)
(0.0
41)
(0.0
69)
(0.0
28)
(0.0
28)
(0.0
018)
(0.0
19)
(0.0
76)
(0.0
73)
(0.0
56)
(0.0
58)
(0.0
47)
(0.0
21)
Add
ition
al ef
fect
of e
ach
$100
from
GD
0.00
073
0.00
041
0.00
084
-0.0
0043
-0.0
0023
-0.0
0002
3-0
.000
130.
0000
71-0
.000
700.
0009
50.
0016
**0.
0001
7-0
.000
067
(0.0
0071
)(0
.000
65)
(0.0
011)
(0.0
0053
)(0
.000
31)
(0.0
0003
0)(0
.000
28)
(0.0
014)
(0.0
0088
)(0
.000
59)
(0.0
0077
)(0
.000
62)
(0.0
0034
)E
ndlin
e Co
ntro
l Mea
n-1
.75
-0.8
7-0
.61
0.22
0.12
0.00
590.
120.
700.
900.
730.
480.
500.
068
Obs
erva
tions
2618
2594
1981
2372
1581
3373
4137
594
416
1479
1479
3366
3366
R-sq
uare
d0.
740.
740.
570.
071
0.11
0.01
90.
110.
130.
160.
310.
170.
064
0.05
3A
NCO
VA
YY
YN
NN
NN
NN
NN
NSa
mpl
eU
nder
6M
oms
Und
er 6
Wom
enPr
egna
ncie
sBi
rths
Re
gres
sions
with
bot
h ba
selin
e an
d en
dlin
e ou
tcom
e m
easu
rem
ent a
re A
NCO
VA
with
lagg
ed d
epen
dent
var
iable
s as c
ontro
ls, ru
n on
the
pane
l sam
ple.
Ane
mia
data
was
onl
y co
llect
ed a
t end
line,
and
regr
esio
ns o
n pr
egna
ncy
outc
omes
and
mor
talit
y ar
e en
dlin
e cr
oss-
sect
iona
l re
gres
sions
. Re
gres
sions
are
wei
ghte
d so
as t
o be
repr
esen
tativ
e of
all
elig
ible
hou
seho
lds i
n st
udy
villa
ges.
Sta
ndar
d er
rors
are
clu
ster
ed a
t the
vill
age
leve
l to
refle
ct th
e de
sign
effe
ct.
***
p<0.
01, *
* p<
0.05
, * p
<0.
1
Prim
ary
Out
com
es:
Seco
ndar
y O
utco
mes
:
All
regr
essio
ns a
re A
NCO
VA
with
lagg
ed d
epen
dent
var
iable
s as c
ontro
ls, ru
n on
the
pane
l sam
ple.
Firs
t row
is a
dum
my
for G
ikur
iro tr
eatm
ent,
and
refle
cts t
he d
iffer
entia
l eff
ect o
f Gik
uriro
trea
tmen
t ove
r GD
at e
quiv
alent
cos
t. S
econ
d ro
w
is a
dum
my
for e
ither
trea
tmen
t. T
he th
ird ro
w in
clud
es th
e do
llar-
valu
e de
viat
ion
(in h
undr
eds o
f dol
lars)
of t
he G
D v
illag
e-le
vel t
rans
fer a
mou
nt fr
om th
e co
st o
f Gik
uriro
, mea
ning
that
the
first
row
serv
es a
s an
inte
rcep
t and
mea
sure
s im
pact
at
equ
ivale
nt c
ost.
Reg
ress
ions
wei
ghte
d so
as t
o be
repr
esen
tativ
e of
elig
ible
hou
seho
lds i
n st
udy
villa
ges.
Sta
ndar
d er
rors
are
clu
ster
ed a
t the
vill
age
leve
l to
refle
ct th
e de
sign
effe
ct. O
utco
mes
mar
ked
with
a †
are
ana
lyze
d as
inve
rse
hype
rbol
ic si
ne, m
eani
ng th
at im
pact
s sho
uld
be in
tere
pret
ed a
s per
cent
cha
nges
in th
e ou
tcom
e. *
** p
<0.
01, *
* p<
0.05
, * p
<0.
1
Prim
ary
Out
com
es:
Seco
ndar
y O
utco
mes
:
Und
er 6
Ant
hro
pane
lU
nder
3U
nder
6
50

Tabl
e10
:C
ompa
riso
nof
Lum
pSu
man
dFl
owTr
ansf
ers
Pane
l A:
Hou
seho
ld-le
vel O
utco
mes
:
VA
RIA
BLE
S
Per C
apita
M
onth
ly
Cons
umpt
ion†
Die
tary
D
iver
sity
Tota
l H
ouse
hold
W
ealth
†Bo
rrow
ing†
Savi
ng†
Hea
lth
Kno
wle
dge
Sani
tatio
n Pr
actic
esPr
oduc
tive
Ass
ets†
Cons
umpt
ion
Ass
ets†
Hou
se V
alue†
Hou
se Q
ualit
y
(1)
(2)
(3)
(4)
(5)
(6)
(7)
(8)
(9)
(10)
(11)
Flow
GD
Tre
atm
ent i
n Sm
all G
D a
rm0.
082
0.04
8-0
.036
-1.0
3***
-0.4
70.
290.
055
0.17
0.33
0.03
6-0
.31
(0.0
97)
(0.1
6)(0
.27)
(0.3
2)(0
.38)
(0.3
7)(0
.31)
(0.1
3)(0
.24)
(0.0
65)
(0.2
2)A
dditi
onal
Impa
ct o
f Lum
p Su
m in
Sm
all-0
.026
0.06
5-0
.21
0.85
*0.
50-0
.041
0.46
0.12
0.47
-0.1
6**
0.26
(0.1
3)(0
.18)
(0.4
7)(0
.44)
(0.4
5)(0
.49)
(0.5
2)(0
.30)
(0.3
4)(0
.066
)(0
.44)
Flow
GD
Tre
atm
ent i
n La
rge
GD
arm
0.30
***
0.57
***
0.12
-0.0
410.
550.
180.
280.
75**
*0.
67**
0.18
*0.
21(0
.10)
(0.1
4)(0
.38)
(0.4
0)(0
.41)
(0.5
5)(0
.28)
(0.1
3)(0
.32)
(0.0
93)
(0.2
1)A
dditi
onal
Impa
ct o
f Lum
p Su
m in
Lar
ge0.
077
-0.1
90.
85*
-0.1
5-0
.021
0.19
-0.0
890.
181.
03**
0.02
20.
22(0
.12)
(0.2
4)(0
.47)
(0.8
1)(0
.79)
(0.6
0)(0
.58)
(0.2
5)(0
.52)
(0.1
2)(0
.25)
Cont
rol O
utco
me
10.4
4.16
12.7
5.96
5.18
0.19
-0.2
311
.28.
7213
.60.
018
Obs
erva
tions
1131
1131
1131
1131
1131
1132
1132
1131
1130
1064
1131
R-sq
uare
d0.
130.
190.
260.
150.
170.
049
0.07
30.
290.
380.
340.
11
Pane
l B:
Indi
vidu
al-le
vel O
utco
mes
:
VA
RIA
BLE
SH
eigh
t-for
-Age
Wei
ght-f
or-A
geM
id-U
pper
A
rm
Circ
umfe
renc
e
Ane
mia,
Ch
ildre
nA
nem
ia,
Mot
hers
Child
Mor
talit
yPr
egna
ncy
Live
Birt
hBi
rths i
n Fa
cilit
ies
Vac
cina
tions
(a
ny in
pas
t ye
ar)
Vac
cina
tions
co
mpl
ete
Dise
ase
Burd
enD
iarrh
eal
Prev
alenc
e
(1)
(2)
(3)
(4)
(5)
(6)
(7)
(8)
(9)
(10)
(11)
(12)
(13)
Flow
GD
Tre
atm
ent i
n Sm
all G
D a
rm-0
.018
0.00
80-0
.001
50.
027
0.00
0084
-0.0
031
-0.0
330.
075
0.08
4-0
.017
-0.0
15-0
.028
0.00
32(0
.037
)(0
.033
)(0
.065
)(0
.025
)(0
.029
)(0
.006
4)(0
.032
)(0
.071
)(0
.051
)(0
.032
)(0
.034
)(0
.029
)(0
.016
)A
dditi
onal
Impa
ct o
f Lum
p Su
m in
Sm
all-0
.021
-0.1
1-0
.20
-0.0
160.
23-0
.014
*-0
.20*
**0
00.
220.
25-0
.13
-0.0
96**
*(0
.19)
(0.1
3)(0
.34)
(0.2
0)(0
.25)
(0.0
074)
(0.0
46)
(.)(.)
(0.2
3)(0
.21)
(0.2
0)(0
.025
)Fl
ow G
D T
reat
men
t in
Larg
e G
D a
rm0.
088*
*0.
061
0.16
**0.
0002
1-0
.021
-0.0
074*
-0.0
040
-0.0
78-0
.020
-0.0
0091
0.02
1-0
.007
3-0
.000
93(0
.044
)(0
.037
)(0
.072
)(0
.036
)(0
.030
)(0
.004
0)(0
.027
)(0
.078
)(0
.078
)(0
.036
)(0
.036
)(0
.033
)(0
.015
)A
dditi
onal
Impa
ct o
f Lum
p Su
m in
Lar
ge-0
.071
0.00
54-0
.40*
*-0
.091
0.02
2-0
.005
60.
068
-0.0
47-0
.79*
**-0
.10
-0.1
1-0
.37*
**-0
.007
1(0
.071
)(0
.088
)(0
.18)
(0.1
3)(0
.16)
(0.0
064)
(0.0
88)
(0.1
8)(0
.15)
(0.0
91)
(0.0
91)
(0.1
1)(0
.035
)Co
ntro
l Out
com
e-1
.92
-1.0
6-0
.72
0.22
0.12
0.00
560.
200.
680.
840.
720.
580.
540.
090
Obs
erva
tions
1474
1461
1132
1644
1103
1867
1767
299
205
907
907
1861
1861
R-sq
uare
d0.
740.
700.
520.
073
0.12
0.01
80.
084
0.20
0.26
0.27
0.20
0.06
00.
052
AN
COV
AY
YY
NN
NN
NN
NN
NN
Sam
ple
Und
er 6
Mom
sU
nder
6W
omen
Preg
nanc
ies
Birth
s
Und
er 6
Regr
essio
ns w
ith b
oth
base
line
and
endl
ine
outc
ome
mea
sure
men
t are
AN
COV
A w
ith la
gged
dep
ende
nt v
ariab
les a
s con
trols,
run
on th
e pa
nel s
ampl
e. A
nem
ia da
ta w
as o
nly
colle
cted
at e
ndlin
e, an
d re
gres
ions
on
preg
nanc
y ou
tcom
es a
nd m
orta
lity
are
endl
ine
cros
s-se
ctio
nal r
egre
ssio
ns.
Regr
essio
ns a
re w
eigh
ted
so a
s to
be re
pres
enta
tive
of a
ll el
igib
le h
ouse
hold
s in
stud
y vi
llage
s. S
tand
ard
erro
rs a
re c
lust
ered
at t
he v
illag
e le
vel t
o re
flect
the
desig
n ef
fect
. **
* p<
0.01
, **
p<0.
05, *
p<
0.1
Prim
ary
Out
com
es:
Seco
ndar
y O
utco
mes
:
All
regr
essio
ns a
re A
NCO
VA
with
lagg
ed d
epen
dent
var
iable
s as c
ontro
ls, ru
n on
the
pane
l sam
ple.
Reg
ress
ions
use
onl
y th
e G
D (n
on-c
hoic
e) a
rm a
nd c
ontro
l arm
, and
ana
lyze
the
indi
vidu
al-le
vel e
xper
imen
t in
whi
ch h
ouse
hold
s w
ere
rand
omly
ass
igne
d to
rece
ive
Flow
tran
sfer
s (58
% o
f sam
ple)
, Lum
p-Su
m tr
ansf
ers (
29%
of s
ampl
e), o
r the
Cho
ice
betw
een
the
two
(13%
of s
ampl
e).
We
also
incl
ude
a du
mm
y fo
r the
vill
age-
leve
l exp
erim
ent i
n gi
ving
Hug
e G
D
trans
fer a
mou
nts.
The
F-te
st a
t the
bot
tom
of t
he ta
ble
com
pare
s the
out
com
e in
the
Choi
ce a
rm to
the
aver
age
of th
e ou
tcom
e in
the
LS a
nd F
low
arm
s, w
eigh
ted
by th
e fr
actio
n of
the
choi
ce g
roup
that
cho
se e
ach.
Reg
ress
ions
w
eigh
ted
so a
s to
be re
pres
enta
tive
of e
ligib
le h
ouse
hold
s in
stud
y vi
llage
s. S
tand
ard
erro
rs a
re c
lust
ered
at t
he v
illag
e le
vel t
o re
flect
the
desig
n ef
fect
. O
utco
mes
mar
ked
with
a †
are
ana
lyze
d as
inve
rse
hype
rbol
ic si
ne, m
eani
ng th
at
impa
cts s
houl
d be
inte
repr
eted
as p
erce
nt c
hang
es in
the
outc
ome.
***
p<0.
01, *
* p<
0.05
, * p
<0.
1
Prim
ary
Out
com
es:
Seco
ndar
y O
utco
mes
:
Und
er 6
Ant
hro
pane
lU
nder
3
51
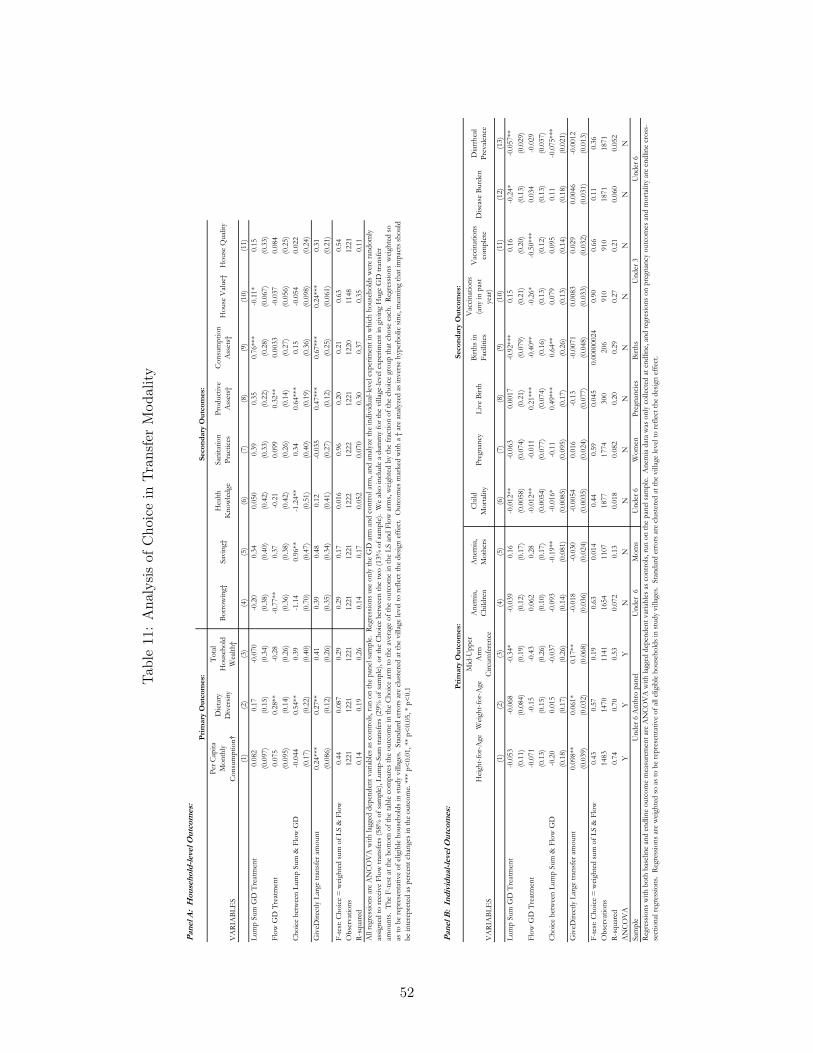
Tabl
e11
:A
naly
sis
ofC
hoic
ein
Tran
sfer
Mod
ality
Pane
l A:
Hou
seho
ld-le
vel O
utco
mes
:
VA
RIA
BLE
S
Per C
apita
M
onth
ly
Cons
umpt
ion†
Die
tary
D
iver
sity
Tota
l H
ouse
hold
W
ealth
†Bo
rrow
ing†
Savi
ng†
Hea
lth
Kno
wle
dge
Sani
tatio
n Pr
actic
esPr
oduc
tive
Ass
ets†
Cons
umpt
ion
Ass
ets†
Hou
se V
alue†
Hou
se Q
ualit
y
(1)
(2)
(3)
(4)
(5)
(6)
(7)
(8)
(9)
(10)
(11)
Lum
p Su
m G
D T
reat
men
t0.
082
0.17
-0.0
70-0
.20
0.34
0.05
00.
390.
350.
76**
*-0
.11*
0.15
(0.0
97)
(0.1
5)(0
.34)
(0.3
8)(0
.40)
(0.4
2)(0
.33)
(0.2
2)(0
.28)
(0.0
67)
(0.3
3)Fl
ow G
D T
reat
men
t0.
075
0.28
**-0
.28
-0.7
7**
0.37
-0.2
10.
099
0.32
**0.
0033
-0.0
370.
084
(0.0
95)
(0.1
4)(0
.26)
(0.3
6)(0
.38)
(0.4
2)(0
.26)
(0.1
4)(0
.27)
(0.0
56)
(0.2
5)Ch
oice
bet
wee
n Lu
mp
Sum
& F
low
GD
-0.0
440.
54**
0.39
-1.1
40.
96**
-1.2
4**
0.34
0.64
***
0.15
-0.0
540.
022
(0.1
7)(0
.22)
(0.4
0)(0
.70)
(0.4
7)(0
.51)
(0.4
0)(0
.19)
(0.3
6)(0
.098
)(0
.24)
Giv
eDire
ctly
Lar
ge tr
ansf
er a
mou
nt0.
24**
*0.
27**
0.41
0.39
0.48
0.12
-0.0
350.
47**
*0.
67**
*0.
24**
*0.
31(0
.086
)(0
.12)
(0.2
6)(0
.35)
(0.3
4)(0
.41)
(0.2
7)(0
.12)
(0.2
5)(0
.061
)(0
.21)
F-te
st: C
hoic
e =
wei
ghte
d su
m o
f LS
& F
low
0.44
0.08
70.
290.
290.
170.
016
0.96
0.20
0.21
0.63
0.54
Obs
erva
tions
1221
1221
1221
1221
1221
1222
1222
1221
1220
1148
1221
R-sq
uare
d0.
140.
190.
260.
140.
170.
052
0.07
00.
300.
370.
350.
11
Pane
l B:
Indi
vidu
al-le
vel O
utco
mes
:
VA
RIA
BLE
SH
eigh
t-for
-Age
Wei
ght-f
or-A
geM
id-U
pper
A
rm
Circ
umfe
renc
e
Ane
mia,
Ch
ildre
nA
nem
ia,
Mot
hers
Child
Mor
talit
yPr
egna
ncy
Live
Birt
hBi
rths i
n Fa
cilit
ies
Vac
cina
tions
(a
ny in
pas
t ye
ar)
Vac
cina
tions
co
mpl
ete
Dise
ase
Burd
enD
iarrh
eal
Prev
alenc
e
(1)
(2)
(3)
(4)
(5)
(6)
(7)
(8)
(9)
(10)
(11)
(12)
(13)
Lum
p Su
m G
D T
reat
men
t-0
.053
-0.0
68-0
.34*
-0.0
390.
16-0
.012
**-0
.063
0.00
17-0
.92*
**0.
150.
16-0
.24*
-0.0
57**
(0.1
1)(0
.084
)(0
.19)
(0.1
2)(0
.17)
(0.0
058)
(0.0
74)
(0.2
1)(0
.079
)(0
.21)
(0.2
0)(0
.13)
(0.0
29)
Flow
GD
Tre
atm
ent
-0.0
71-0
.15
-0.4
30.
062
0.28
-0.0
12**
-0.0
110.
21**
*-0
.40*
*-0
.26*
-0.5
0***
0.03
4-0
.029
(0.1
3)(0
.15)
(0.2
6)(0
.10)
(0.1
7)(0
.005
4)(0
.077
)(0
.074
)(0
.16)
(0.1
3)(0
.12)
(0.1
3)(0
.037
)Ch
oice
bet
wee
n Lu
mp
Sum
& F
low
GD
-0.2
00.
015
-0.0
37-0
.093
-0.1
9**
-0.0
16*
-0.1
10.
49**
*0.
64**
0.07
90.
095
0.11
-0.0
75**
*(0
.18)
(0.1
7)(0
.26)
(0.1
4)(0
.081
)(0
.008
5)(0
.095
)(0
.17)
(0.2
6)(0
.13)
(0.1
4)(0
.18)
(0.0
21)
Giv
eDire
ctly
Lar
ge tr
ansf
er a
mou
nt0.
098*
*0.
061*
0.17
**-0
.018
-0.0
30-0
.005
40.
016
-0.1
3-0
.007
10.
0083
0.02
90.
0046
-0.0
012
(0.0
39)
(0.0
32)
(0.0
68)
(0.0
36)
(0.0
24)
(0.0
035)
(0.0
24)
(0.0
77)
(0.0
48)
(0.0
33)
(0.0
32)
(0.0
31)
(0.0
13)
F-te
st: C
hoic
e =
wei
ghte
d su
m o
f LS
& F
low
0.43
0.57
0.19
0.63
0.01
40.
440.
590.
045
0.00
0000
240.
900.
660.
110.
36O
bser
vatio
ns14
8314
7011
4116
5411
0718
7717
7430
020
691
091
018
7118
71R-
squa
red
0.74
0.70
0.53
0.07
20.
130.
018
0.08
20.
200.
290.
270.
210.
060
0.05
2A
NCO
VA
YY
YN
NN
NN
NN
NN
NSa
mpl
eU
nder
6M
oms
Und
er 6
Wom
enPr
egna
ncie
sBi
rths
U
nder
6 A
nthr
o pa
nel
Und
er 3
Und
er 6
Regr
essio
ns w
ith b
oth
base
line
and
endl
ine
outc
ome
mea
sure
men
t are
AN
COV
A w
ith la
gged
dep
ende
nt v
ariab
les a
s con
trols,
run
on th
e pa
nel s
ampl
e. A
nem
ia da
ta w
as o
nly
colle
cted
at e
ndlin
e, an
d re
gres
ions
on
preg
nanc
y ou
tcom
es a
nd m
orta
lity
are
endl
ine
cros
s-se
ctio
nal r
egre
ssio
ns.
Regr
essio
ns a
re w
eigh
ted
so a
s to
be re
pres
enta
tive
of a
ll el
igib
le h
ouse
hold
s in
stud
y vi
llage
s. S
tand
ard
erro
rs a
re c
lust
ered
at t
he v
illag
e le
vel t
o re
flect
the
desig
n ef
fect
.
Prim
ary
Out
com
es:
Seco
ndar
y O
utco
mes
:
All
regr
essio
ns a
re A
NCO
VA
with
lagg
ed d
epen
dent
var
iable
s as c
ontro
ls, ru
n on
the
pane
l sam
ple.
Reg
ress
ions
use
onl
y th
e G
D a
rm a
nd c
ontro
l arm
, and
ana
lyze
the
indi
vidu
al-le
vel e
xper
imen
t in
whi
ch h
ouse
hold
s wer
e ra
ndom
ly
assig
ned
to re
ceiv
e Fl
ow tr
ansf
ers (
58%
of s
ampl
e), L
ump-
Sum
tran
sfer
s (29
% o
f sam
ple)
, or t
he C
hoic
e be
twee
n th
e tw
o (1
3% o
f sam
ple)
. W
e als
o in
clud
e a
dum
my
for t
he v
illag
e-le
vel e
xper
imen
t in
givi
ng H
uge
GD
tran
sfer
am
ount
s. T
he F
-test
at t
he b
otto
m o
f the
tabl
e co
mpa
res t
he o
utco
me
in th
e Ch
oice
arm
to th
e av
erag
e of
the
outc
ome
in th
e LS
and
Flo
w a
rms,
wei
ghte
d by
the
frac
tion
of th
e ch
oice
gro
up th
at c
hose
eac
h. R
egre
ssio
ns w
eigh
ted
so
as to
be
repr
esen
tativ
e of
elig
ible
hou
seho
lds i
n st
udy
villa
ges.
Sta
ndar
d er
rors
are
clu
ster
ed a
t the
vill
age
leve
l to
refle
ct th
e de
sign
effe
ct.
Out
com
es m
arke
d w
ith a
† a
re a
naly
zed
as in
vers
e hy
perb
olic
sine
, mea
ning
that
impa
cts s
houl
d be
inte
repr
eted
as p
erce
nt c
hang
es in
the
outc
ome.
***
p<0.
01, *
* p<
0.05
, * p
<0.
1 Prim
ary
Out
com
es:
Seco
ndar
y O
utco
mes
:
52

Tabl
e12
:H
eter
ogen
eity
byB
asel
ine
Mal
nutr
itio
n
VA
RIA
BLE
SH
eigh
t-for
-Age
Wei
ght-f
or-A
geM
id-U
pper
A
rm
Circ
umfe
renc
e(1
)(2
)(3
)Ba
selin
e O
utco
me
* G
ikur
iro T
reat
men
t-0
.041
-0.0
350.
085
(0.0
44)
(0.0
62)
(0.0
56)
Base
line
Out
com
e *
Giv
eDire
ctly
Tre
atm
ent
-0.0
25-0
.066
0.07
7(0
.046
)(0
.044
)(0
.065
)Ba
selin
e O
utco
me
* G
iveD
irect
ly L
arge
tran
sfer
0.02
30.
007
0.08
1(0
.043
)(0
.046
)(0
.060
)G
ikur
iro T
reat
men
t0.
043
0.03
20.
025
(0.0
43)
(0.0
36)
(0.0
56)
Giv
eDire
ctly
Tre
atm
ent
-0.0
250.
002
-0.0
05(0
.040
)(0
.036
)(0
.065
)G
iveD
irect
ly L
arge
tran
sfer
0.09
3*0.
063
0.13
5*(0
.052
)(0
.039
)(0
.079
)Ba
selin
e O
utco
me
0.76
8***
0.74
9***
0.60
0***
(0.0
34)
(0.0
35)
(0.0
43)
Base
line
Cont
rol M
ean
-1.9
2-1
.06
-0.7
2O
bser
vatio
ns21
2521
0416
29R-
squa
red
0.69
60.
673
0.50
7Sa
mpl
e
***
p<0.
01, *
* p<
0.05
, * p
<0.
1
Regr
essio
ns w
ith b
oth
base
line
and
endl
ine
outc
ome
mea
sure
men
t are
AN
COV
A w
ith la
gged
de
pend
ent v
ariab
les a
s con
trols,
run
on th
e pa
nel s
ampl
e. R
egre
ssio
ns in
clud
e fix
ed e
ffec
ts fo
r the
ra
ndom
izat
ion
bloc
ks, a
nd a
re w
eigh
ted
to b
e re
pres
enta
tive
of a
ll ho
useh
olds
in st
udy
villa
ges.
A
nthr
opom
etric
out
com
es a
re d
emea
ned
prio
r to
inte
ract
ion
so th
at th
e un
inte
ract
ed tr
eatm
ent t
erm
s pr
ovid
e im
pact
at a
vera
ge le
vel o
f bas
elin
e an
thro
mea
sure
.
Ant
hrop
omet
ric O
utco
mes
:
Ant
hro
pane
l und
er 6
at e
ndlin
e
53

Tabl
e13
:H
eter
ogen
eity
byC
hild
Age
VA
RIA
BLE
S
Hei
ght-f
or-A
geW
eigh
t-for
-Age
Mid
-Upp
er A
rm
Circ
umfe
renc
eH
eigh
t-for
-Age
Wei
ght-f
or-A
geM
id-U
pper
Arm
Ci
rcum
fere
nce
(1)
(2)
(3)
(4)
(5)
(6)
Indi
cato
r * G
ikur
iro T
reat
men
t-0
.014
-0.0
260.
112
0.59
50.
249
0.28
(0.1
38)
(0.1
13)
(0.1
09)
(0.6
44)
(0.5
05)
(0.4
89)
Indi
cato
r * G
iveD
irect
ly T
reat
men
t-0
.307
**-0
.158
0.15
60.
380.
592
0.66
6(0
.138
)(0
.115
)(0
.104
)(0
.525
)(0
.498
)(0
.506
)In
dica
tor *
Giv
eDire
ctly
Lar
ge tr
ansf
er-0
.125
-0.0
250.
157
0.40
80.
730.
307
(0.1
39)
(0.1
23)
(0.1
45)
(0.3
99)
(0.4
72)
(0.2
80)
Gik
uriro
Tre
atm
ent
0.01
20.
013
-0.0
80.
004
0.00
2-0
.027
(0.1
06)
(0.0
80)
(0.0
82)
(0.0
83)
(0.0
63)
(0.0
69)
Giv
eDire
ctly
Tre
atm
ent
0.11
70.
08-0
.107
-0.0
180.
009
-0.0
35(0
.119
)(0
.083
)(0
.091
)(0
.099
)(0
.068
)(0
.073
)G
iveD
irect
ly L
arge
tran
sfer
0.24
8**
0.19
4**
0.07
60.
193*
*0.
183*
**0.
156*
*(0
.105
)(0
.081
)(0
.111
)(0
.085
)(0
.066
)(0
.078
)In
dica
tor u
nint
erac
ted
0.14
70.
13-0
.007
-0.0
10.
023
0.17
8(0
.149
)(0
.118
)(0
.141
)(0
.255
)(0
.298
)(0
.270
)Ba
selin
e Co
ntro
l Mea
n-1
.92
-1.0
6-0
.72
-1.9
2-1
.06
-0.7
2O
bser
vatio
ns23
6023
4720
2023
6023
4720
20R-
squa
red
0.07
10.
035
0.07
20.
068
0.03
50.
073
Sam
ple
Inte
ract
ion
with
'Firs
t 100
0 D
ays'
dum
my
Inte
ract
ion
with
'New
born
' dum
my
Kid
s und
er 6
at e
ndlin
eRe
gres
sions
are
end
line
cros
s-se
ctio
ns, r
un o
n th
e pa
nel s
ampl
e, an
d do
not
incl
ude
the
lagge
d ou
tcom
e va
riabl
e so
as t
o be
abl
e to
con
sider
chi
ldre
n w
ho a
re n
ewbo
rns i
n R2
. Re
gres
sions
incl
ude
fixed
eff
ects
for t
he ra
ndom
izat
ion
bloc
ks, a
nd a
re w
eigh
ted
to b
e re
pres
enta
tive
of e
ligib
le h
ouse
hold
s in
stud
y vi
llage
s. *
** p
<0.
01, *
* p<
0.05
, * p
<0.
1
54

Figures
Figure 1: Actual and Assigned Treatment Amounts
02
00
40
06
00
80
01
,00
0
Actu
al T
ran
sfe
r A
mo
un
t fr
om
GD
Da
ta
41.32 83.63 116.91 532
Horizontal lines represent intended transfer amounts
Comparing Assigned and Actual GD Transfer Amounts
55

Figure 2: Plotting Outcomes by Program Cost
���
����
����
VDYLQJVVWRFNBDVLQK
� ��� ��� ���
7UHDWPHQW�&RVW
)LWWHG�LQ�*'�WUHDWPHQW &RQWURO
*LNXULUR�$FWXDO *'
(VWLPDWHG�*'�LPSDFW�DW�*LNXULUR�FRVW
$UHD�RI�VKDSHV�SURSRUWLRQDO�WR�ZHLJKWHG�VDPSOH�VL]H�LQ�HDFK�FHOO�
$YHUDJH�6DYLQJV�E\�7UHDWPHQW�&RVW
Figure 3: Fan Regression Impacts by Age
���
���
����
��
+HLJKW�IRU�$JH
� �� �� ��
$JH�LQ�0RQWKV�DW�(QGOLQH
)DQ�5HJUHVVLRQ�IRU�LPSDFW�RI�WKH�*'�/DUJH�WUHDWPHQW��VPRRWKHG�RYHU�DJH�DW�HQGOLQH
:LWK������&RQILGHQFH�,QWHUYDOV
7KH�*'�/DUJH�WUHDWPHQW�HIIHFW�RQ�+HLJKW�IRU�$JH
56
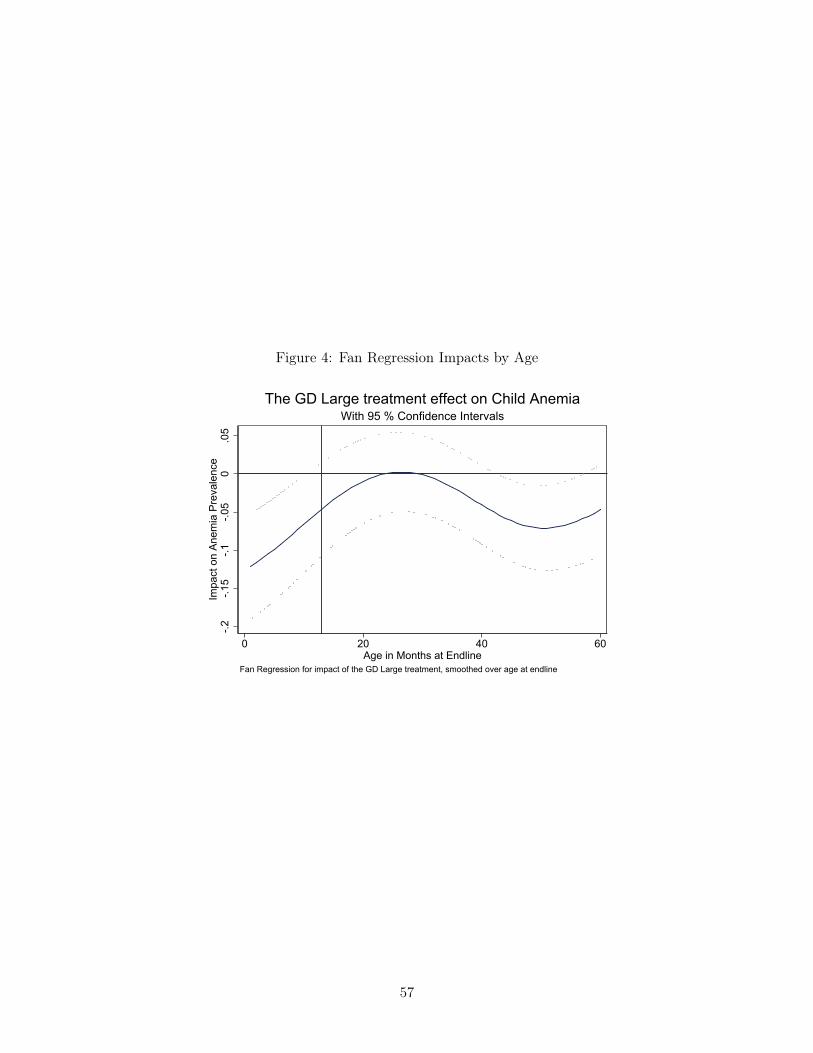
Figure 4: Fan Regression Impacts by Age
���
����
���
����
����
,PSDFW�RQ�$QHPLD�3UHYDOHQFH
� �� �� ��
$JH�LQ�0RQWKV�DW�(QGOLQH
)DQ�5HJUHVVLRQ�IRU�LPSDFW�RI�WKH�*'�/DUJH�WUHDWPHQW��VPRRWKHG�RYHU�DJH�DW�HQGOLQH
:LWK������&RQILGHQFH�,QWHUYDOV
7KH�*'�/DUJH�WUHDWPHQW�HIIHFW�RQ�&KLOG�$QHPLD
57

Appendix A GiveDirectly Nutritional Handout
1
GDID: _________________________ PAYMENT METHOD: _______________________
RECIPIENT INFORMATION REGARDING NUTRITION AND HYGIENE
GiveDirectly’s program is supported by made possible by the generous support of the American people through USAID. The information below is approved by the Rwanda Ministry of Health.
● Infant Nutrition○ Infants less than 6 months old should be fed by breast only. During this period an infant
receives only breast milk and no other liquids or solids, not even water, unless medicallyindicated. A non-breastfed baby is 14 times more likely to die than an exclusivelybreastfed baby in the first 6 months.
○ Infants 6 to 24 months old should continue to be fed by breast, but should also receivecomplementary feeding that includes animal-source foods (meats, fish, milk products,eggs) and fruits and vegetables that are rich in vitamin A (such as mango, papaya,oranges, yellow sweet potato and carrots). Guidelines are for kids 6-24 months to eat atleast 4 food groups: fruits, vegetables and legumes, grains, meats, dairy.
■ Infants 6 to 8 months old should be fed complementary foods 2-3 times daily;■ Infants 9 to 24 months old should be fed complementary foods 3-4 times daily,
plus 1-2 snacks.● Reducing Illness
○ If you or your children get diarrhoea, use Oral Rehydration Salts (ORS) to replace thenutrients being lost. Typical symptoms of diarrhoea include frequent, loose, waterystools, abdominal cramps, and/or abdominal pain. If ORS is not available, a simplesolution can be prepared for drinking by mixing one liter of clean drinking water and mixit with ½ teaspoon of salt and 6 teaspoons of sugar.
○ The government has a 6-monthly deworming program and Vitamin A supplementationprogram. Ask your Community Health Worker for more information.
● Dietary Diversity○ Anemia
■ Anemia is a health condition, commonly caused by nutritional deficiency of ironand other nutrients (folate or vitamin B12). Around 72% of 6-8 months-olds inRwanda have Anemia. Anemia can be an underlying cause for maternal deathand prenatal and perinatal infant loss. Anemia among children is associatedwith low mental performance and physical development.
■ Examples of iron-rich food: fish, meat, milk products, oranges, lemons,grapefruits, guavas, papayas, and green leafy vegetables. Breast milk for yourchild is an important source of iron, too.
○ Here are some other examples of food you can produce/buy/eat to cheaply increasenutrition:
58

2
■ Breeding small, inexpensive animals such as hens, rabbits and guinea pigs canprovide you and your children with important body building protein and otherimportant nutrients.
■ Grow kitchen gardens if you have time. You can grow different vegetables foryour family throughout the year, like amaranths, carrots, and dark-green leavessuch as spinach and dodo, all of which are important sources of body protectingnutrients.
■ Consume soya beans, yogurt, avocados and dodo (which you could grow)■ Eat orange-flesh rather than white-flesh sweet potatoes
● Hygiene○ Handwashing with soap or wood ash can kill bacteria/viruses and prevents the spread
of disease. Handwashing with soap at critical times is estimated to reduce diarrhoea by47%. The most important times that hands should be washed with soap and water are:
■ After defecating■ After cleaning a child who has defecated■ Before eating or handling food
○ Recommended practices for personal hygiene further include:■ Washing hair every week with shampoo■ Washing the face every day after sleeping■ Brushing teeth twice every day, in the morning and the night after eating
○ Safe disposal of waste means defecating into a latrine, disposing into a latrine, or burial.Inappropriate disposal of human feces, such as open defecation, facilitates thetransmission of pathogens and disease.
● Birth preparedness for delivery○ Early initiation of antenatal care (ANC) can reduce common maternal complications and
maternal and perinatal mortality. Visit your nearest health facility early during pregnancyfor medical tests and more information. The World Health Organization promotes fourantenatal clinic visits, one in each trimester, during each pregnancy.
59
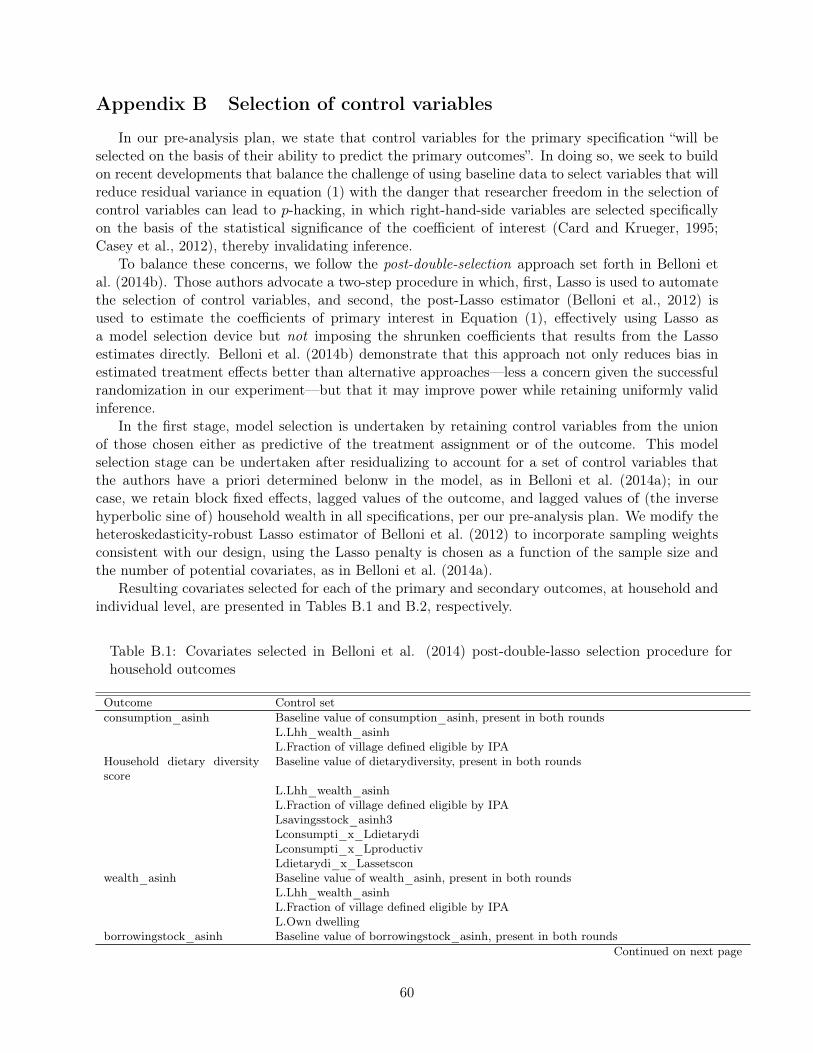
Appendix B Selection of control variables
In our pre-analysis plan, we state that control variables for the primary specification “will beselected on the basis of their ability to predict the primary outcomes”. In doing so, we seek to buildon recent developments that balance the challenge of using baseline data to select variables that willreduce residual variance in equation (1) with the danger that researcher freedom in the selection ofcontrol variables can lead to p-hacking, in which right-hand-side variables are selected specificallyon the basis of the statistical significance of the coefficient of interest (Card and Krueger, 1995;Casey et al., 2012), thereby invalidating inference.
To balance these concerns, we follow the post-double-selection approach set forth in Belloni etal. (2014b). Those authors advocate a two-step procedure in which, first, Lasso is used to automatethe selection of control variables, and second, the post-Lasso estimator (Belloni et al., 2012) isused to estimate the coefficients of primary interest in Equation (1), effectively using Lasso asa model selection device but not imposing the shrunken coefficients that results from the Lassoestimates directly. Belloni et al. (2014b) demonstrate that this approach not only reduces bias inestimated treatment effects better than alternative approaches—less a concern given the successfulrandomization in our experiment—but that it may improve power while retaining uniformly validinference.
In the first stage, model selection is undertaken by retaining control variables from the unionof those chosen either as predictive of the treatment assignment or of the outcome. This modelselection stage can be undertaken after residualizing to account for a set of control variables thatthe authors have a priori determined belonw in the model, as in Belloni et al. (2014a); in ourcase, we retain block fixed effects, lagged values of the outcome, and lagged values of (the inversehyperbolic sine of) household wealth in all specifications, per our pre-analysis plan. We modify theheteroskedasticity-robust Lasso estimator of Belloni et al. (2012) to incorporate sampling weightsconsistent with our design, using the Lasso penalty is chosen as a function of the sample size andthe number of potential covariates, as in Belloni et al. (2014a).
Resulting covariates selected for each of the primary and secondary outcomes, at household andindividual level, are presented in Tables B.1 and B.2, respectively.
Table B.1: Covariates selected in Belloni et al. (2014) post-double-lasso selection procedure forhousehold outcomes
Outcome Control setconsumption_asinh Baseline value of consumption_asinh, present in both rounds
L.Lhh_wealth_asinhL.Fraction of village defined eligible by IPA
Household dietary diversityscore
Baseline value of dietarydiversity, present in both rounds
L.Lhh_wealth_asinhL.Fraction of village defined eligible by IPALsavingsstock_asinh3Lconsumpti_x_LdietarydiLconsumpti_x_LproductivLdietarydi_x_Lassetscon
wealth_asinh Baseline value of wealth_asinh, present in both roundsL.Lhh_wealth_asinhL.Fraction of village defined eligible by IPAL.Own dwelling
borrowingstock_asinh Baseline value of borrowingstock_asinh, present in both roundsContinued on next page
60
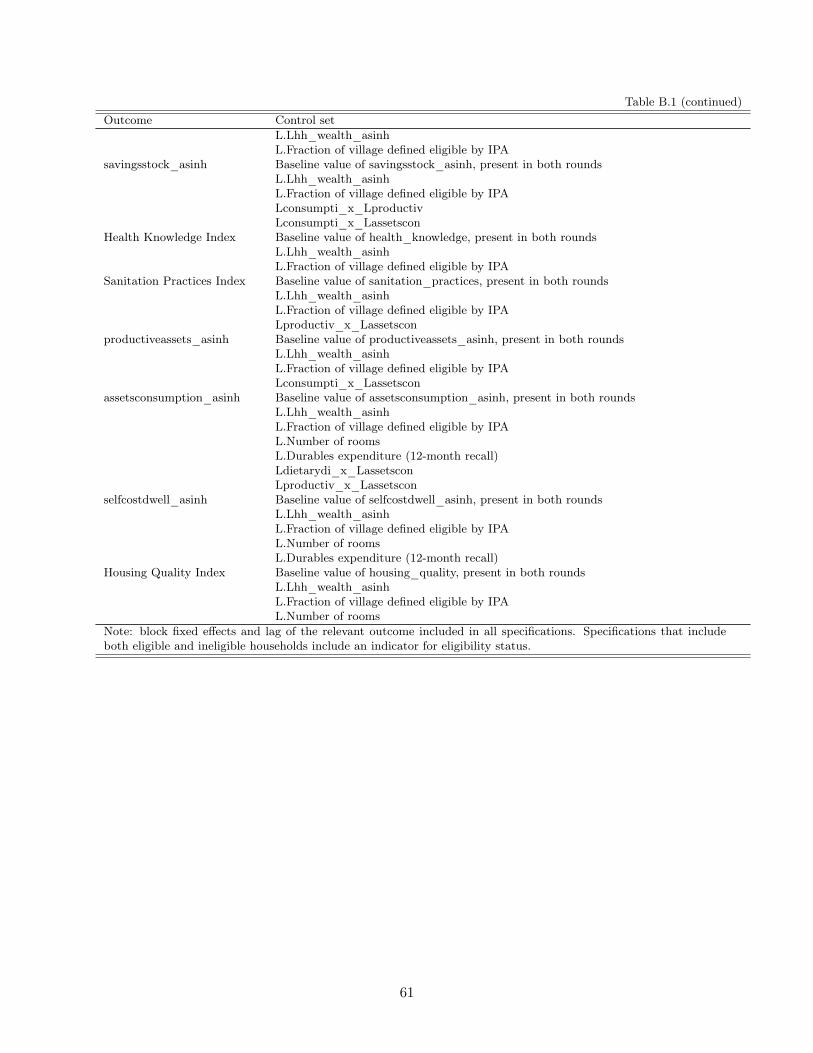
Table B.1 (continued)Outcome Control set
L.Lhh_wealth_asinhL.Fraction of village defined eligible by IPA
savingsstock_asinh Baseline value of savingsstock_asinh, present in both roundsL.Lhh_wealth_asinhL.Fraction of village defined eligible by IPALconsumpti_x_LproductivLconsumpti_x_Lassetscon
Health Knowledge Index Baseline value of health_knowledge, present in both roundsL.Lhh_wealth_asinhL.Fraction of village defined eligible by IPA
Sanitation Practices Index Baseline value of sanitation_practices, present in both roundsL.Lhh_wealth_asinhL.Fraction of village defined eligible by IPALproductiv_x_Lassetscon
productiveassets_asinh Baseline value of productiveassets_asinh, present in both roundsL.Lhh_wealth_asinhL.Fraction of village defined eligible by IPALconsumpti_x_Lassetscon
assetsconsumption_asinh Baseline value of assetsconsumption_asinh, present in both roundsL.Lhh_wealth_asinhL.Fraction of village defined eligible by IPAL.Number of roomsL.Durables expenditure (12-month recall)Ldietarydi_x_LassetsconLproductiv_x_Lassetscon
selfcostdwell_asinh Baseline value of selfcostdwell_asinh, present in both roundsL.Lhh_wealth_asinhL.Fraction of village defined eligible by IPAL.Number of roomsL.Durables expenditure (12-month recall)
Housing Quality Index Baseline value of housing_quality, present in both roundsL.Lhh_wealth_asinhL.Fraction of village defined eligible by IPAL.Number of rooms
Note: block fixed effects and lag of the relevant outcome included in all specifications. Specifications that includeboth eligible and ineligible households include an indicator for eligibility status.
61
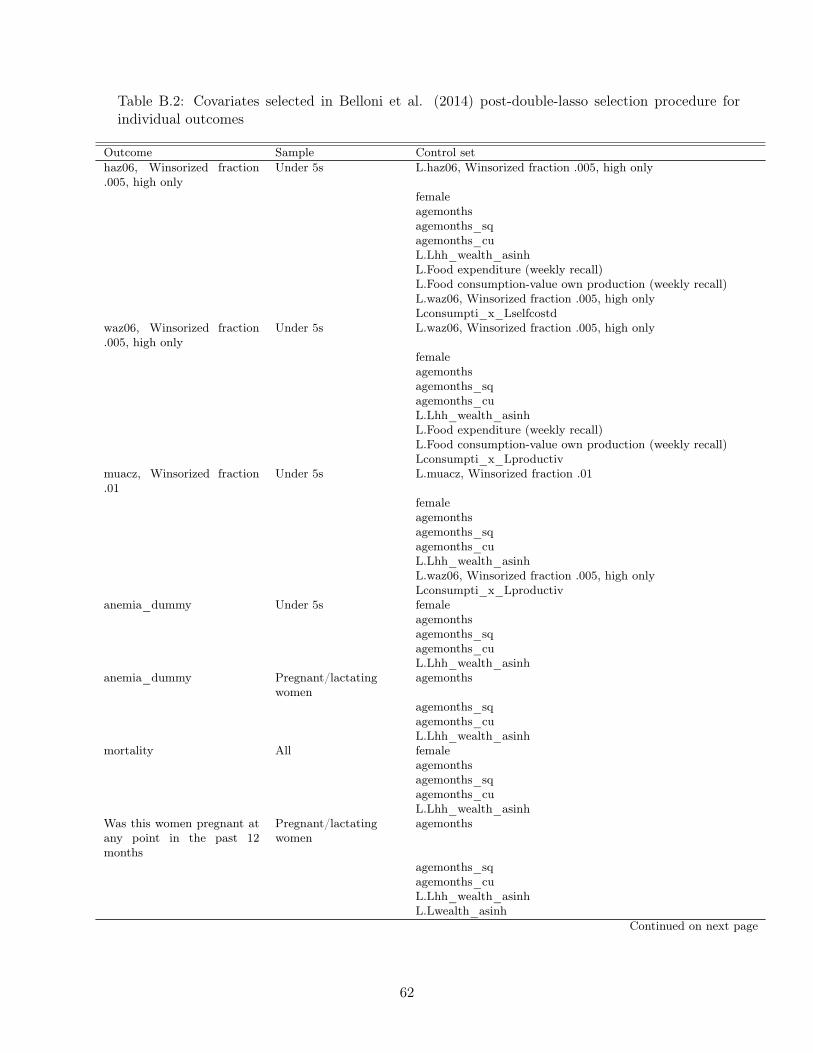
Table B.2: Covariates selected in Belloni et al. (2014) post-double-lasso selection procedure forindividual outcomes
Outcome Sample Control sethaz06, Winsorized fraction.005, high only
Under 5s L.haz06, Winsorized fraction .005, high only
femaleagemonthsagemonths_sqagemonths_cuL.Lhh_wealth_asinhL.Food expenditure (weekly recall)L.Food consumption-value own production (weekly recall)L.waz06, Winsorized fraction .005, high onlyLconsumpti_x_Lselfcostd
waz06, Winsorized fraction.005, high only
Under 5s L.waz06, Winsorized fraction .005, high only
femaleagemonthsagemonths_sqagemonths_cuL.Lhh_wealth_asinhL.Food expenditure (weekly recall)L.Food consumption-value own production (weekly recall)Lconsumpti_x_Lproductiv
muacz, Winsorized fraction.01
Under 5s L.muacz, Winsorized fraction .01
femaleagemonthsagemonths_sqagemonths_cuL.Lhh_wealth_asinhL.waz06, Winsorized fraction .005, high onlyLconsumpti_x_Lproductiv
anemia_dummy Under 5s femaleagemonthsagemonths_sqagemonths_cuL.Lhh_wealth_asinh
anemia_dummy Pregnant/lactatingwomen
agemonths
agemonths_sqagemonths_cuL.Lhh_wealth_asinh
mortality All femaleagemonthsagemonths_sqagemonths_cuL.Lhh_wealth_asinh
Was this women pregnant atany point in the past 12months
Pregnant/lactatingwomen
agemonths
agemonths_sqagemonths_cuL.Lhh_wealth_asinhL.Lwealth_asinh
Continued on next page
62

Table B.2 (continued)Outcome Sample Control setDid pregnancy conclude inlive birth
Pregnant/lactatingwomen
agemonths
agemonths_sqagemonths_cuL.Lhh_wealth_asinhL.Food expenditure (weekly recall)L.Food consumption-value own production (weekly recall)Lconsumpti_x_Lwealth_as
facility_birth Pregnant/lactatingwomen
agemonths
agemonths_sqagemonths_cuL.Lhh_wealth_asinh
anthro_vacc_year Under 3s femaleagemonthsagemonths_sqagemonths_cuL.Lhh_wealth_asinhLconsumpti_x_Lproductiv
anthro_vacc_complete Under 3s femaleagemonthsagemonths_sqagemonths_cuL.Lhh_wealth_asinh
Any fever, diarrhea, orcoughing blood at individ-ual/round level
Under 5s female
agemonthsagemonths_sqagemonths_cuL.Lhh_wealth_asinhL.Food consumption-value own production (weekly recall)
Individual reported with di-arrhea/vomiting/fever now
Under 5s female
agemonthsagemonths_sqagemonths_cuL.Lhh_wealth_asinh
Note: block fixed effects and lag of the relevant outcome included in all specifications. Specifications that includeboth eligible and ineligible households include an indicator for eligibility status.
63
Related Documents