Benchmark Middle East hotel benchmark survey report May 2016 The hotel benchmark report provides a monthly performance overview of leading hotels in the Middle East. The hotel set includes international branded and operated properties across the five-star and four-star segments.

Welcome message from author
This document is posted to help you gain knowledge. Please leave a comment to let me know what you think about it! Share it to your friends and learn new things together.
Transcript
BenchmarkMiddle East hotel benchmark survey report
May 2016
The hotel benchmark report provides a monthly performance overview of leading hotels in the Middle East. The hotel set includes international branded and operated properties across the five-star and four-star segments.

2 | Benchmark May 2016
EY Middle East hotel benchmark survey
We hope you enjoy the May 2016 report of the EY Middle East hotel benchmark survey. Inside we cover occupancy and rate performance in key hotel markets across selected countries and cities in the Middle East on a monthly and year-to-date basis in local currencies and US dollars.
This monthly Middle East hotel benchmark survey is part of our services to the hospitality sector.
The EY Transaction Real Estate Advisory Services team, headquartered in Dubai, is the leading business advisory practice in the region. Our team consists of professionals from around the globe with extensive real estate, hospitality operations and advisory experience. We understand and offer a full scope of multidisciplinary services for developers, lenders, owners and operators. Our specialist services include acquisitions, capital sourcing, highest- and best-use analysis, due diligence, market and financial feasibility
studies, management company selection/contract reviews, strategic business planning, repositioning analysis, operational enhancement/diagnostics, valuations/appraisals and disposition, for every real estate industry segment,such as hotel, residential, commercial, retail, restaurant, golf, marina, theme park and convention center.
EY is the largest professional services organization in the Middle East with 20 offices in 15 countries and is part of the global EY organization with more than 225,000 people in 150 countries.
Page 3:May 2016 key performance highlights
Page 4:We have highlighted the largest variance on a per-month basis for the various markets over the last 12-month period in regards to occupancy, average room rate, and rooms yield
Page 5:Dubai overall occupancy, average room rate and rooms yield over the past 12 months
Page 6:Monthly performance of various markets compared to the previous year’s monthly period in local currency
Page 7:Monthly performance of various markets compared to the previous year’s monthly period in US dollars
Page 8:Year-to-date performance of various markets compared to the previous year. In local currency
Page 9:Year-to-date performance of various markets compared to the previous year. In US dollars
Yousef Wahbah MENA Real Estate, Hospitality and Construction Sector Leader, Ernst & Young Middle East, UAE
3Benchmark |
Hospitality markets in Amman, Muscat and Jeddah witnessed a positive increase when compared to the same period last year • Amman’s hospitality market witnessed an increase in occupancy
from 63.0% in May 2015 to 64.0% in May 2016. The increase in occupancy was coupled with a jump in ADR from US$158 in May 2015 to US$179 in May 2016, resulting in a rise in RevPAR by 14.4% in May 2016 when compared to the same period last year.
• In May 2016, Muscat’s hospitality market witnessed an increase in average occupancy of 3.0% when compared to the same time last year. However, it should be noted that ADR dropped from US$188 in May 2015 to US$172 in May 2016, resulting a drop in RevPAR by 3.5%.
• The increase in occupancy in both Amman and Muscat maybe attributed to the Easter Holiday.
• In May 2016, Jeddah’s hospitality market witnessed an increase in average occupancy of 11.0% when compared to the same time last year. Average daily room rates increased from US$268 in May 2015 to US$313 in May 2016, resulting in an increase in RevPAR by 33.0%. The increase in Jeddah’s occupancy maybe ascribed to the start of the summer holidays and it being the summer escape for its nationals during this time a year.
Madina and Doha’s hospitality market performance dropped when compared to May 2015 • Madina’s hospitality market witnessed a decrease in RevPAR
of 26.5% in May 2016 when compared to May 2015, this was mainly due to the drop in ADR from US$182 in May 2015 to US$179 in May 2016, coupled by a slump in average occupancy of 17.0% in May 2016 when compared to the same time last year.
• Doha’s hospitality market witnessed a drop in occupancy from 72.0% in May 2015 to 66.0% in May 2016, coupled with a decrease in ADR from US$250 in May 2015 to US$211 in May 2016, causing a drop in RevPAR by 23.2% when compared to the same time last year. The drop in occupancy maybe attributed to government spending cuts that have effected business tourism which constitutes to about 70% of Doha’s hotel demand.
Dubai and Abu Dhabi’s hospitality market witnessed a decrease in RevPAR in May 2016• Dubai’s hospitality market witnessed a drop in RevPAR from
US$200 in May 2015 to US$186 in May 2016.
• Abu Dhabi’s hospitality market witnessed a drop in RevPAR by 8.9% in May 2016 when compared to the same period last year, this was mainly due to the drop in ADR from US$127 in May 2015 to US$115 in May 2016.
• It should be noted that Abu Dhabi’s hospitality market sustained occupancy levels during the month of May 2016 when compared to the same time last year.
May 2016 Key Performance Highlights

4 | Benchmark May 2016
Markets with the largest variance on a per-month basis
% Occupancy for Madina Hotels
Average Room Rate for Beirut (US$)
RevPAR in Amman (US$)
0MayMay Jun Jul Aug Sep Oct Nov Dec Jan Feb Mar Apr
Occ
upan
cy %
Months
Occupancy % May 2015–May 2016
0
10
20
30
40
50
60
70
80
6872 73
76 77
63
54
6670
63
7368
51
199
Ave
rage
room
rate
Months
Average room rate May 2015–May 2016
0
50
100
150
200200
300
250
MayMay Jun Jul Aug Sep Oct Nov Dec Jan Feb Mar Apr
169182 185
171160 154
178
147138 133 129
141
Roo
m y
ield
Room yield May 2015–May 2016
0
20
40
60
80
100
120
140
160
180
MayMay Jun Jul Aug Sep Oct Nov Dec Jan Feb Mar Apr
Months
100
8272
9790
10493
77
58
7888 90
115

5Benchmark |
Dubai overall monthly performance
% Occupancy for Dubai — Overall hotels
Average Room Rate for Dubai — Overall hotels (US$)
RevPAR in Dubai — Overall hotels (US$)
Occ
upan
cy %
Months
0
10
20
30
40
50
60
70
80
90
100
MayAprMay Jun Jul Aug Sep Oct Nov Dec Jan Feb Mar
Occupancy % May 2015–May 2016
85
6861
7680
83 8681
87 8690
85 84
Months
Ave
rage
room
rate
Average room rate May 2015–May 2016
0
50
100
150
200
250
300
350
MayNovOct Dec Jan Feb Mar AprMay Jun Jul Aug Sep
234
174 172 167
194
314304 300 300
279296
270
221
Roo
m y
ield
Room yieldMay 2015–May 2016
Months
0
50
100
150
200
250
300
NovOct Dec Jan Feb Mar Apr MayMay Jun Jul Aug Sep
200
119105
127
154
261 261242
260240
265
229
186
6 | Benchmark May 2016
Occupancy Average room rate Rooms yield
Currency 2016 % 2015 % Change in % Points 2016 2015 Change 2016 2015 Change
Bahrain
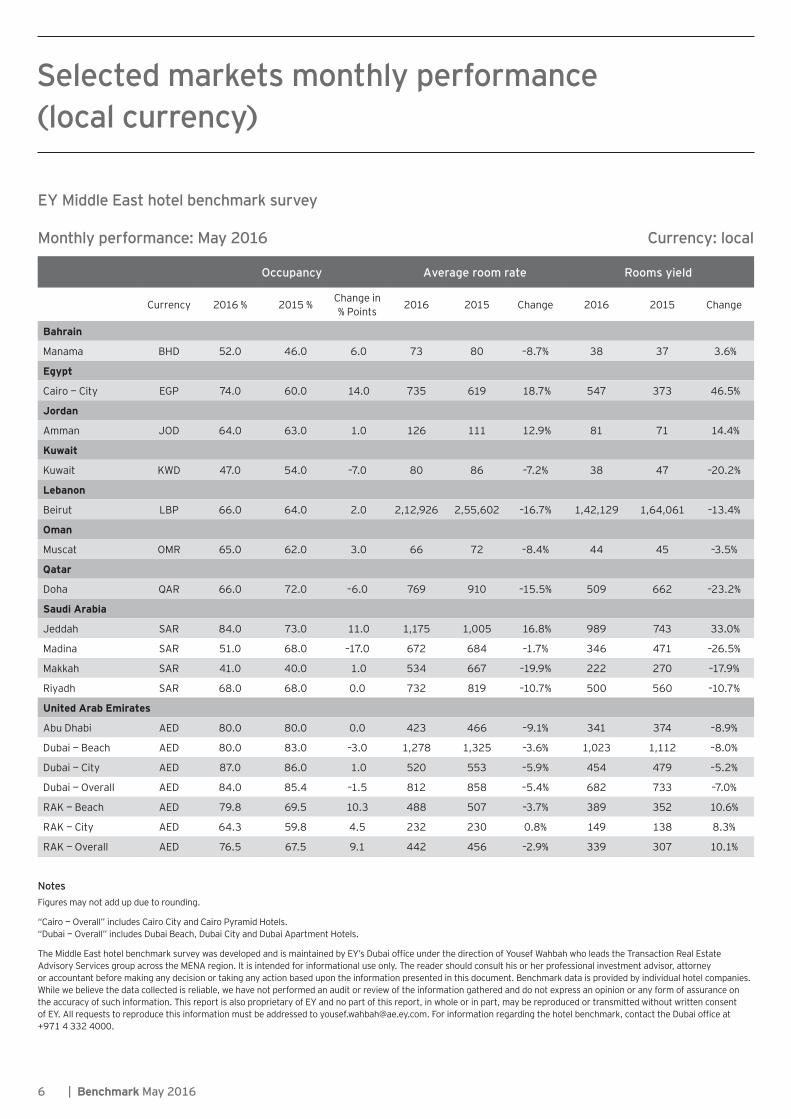
Manama BHD 52.0 46.0 6.0 73 80 –8.7% 38 37 3.6%
Egypt
Cairo — City EGP 74.0 60.0 14.0 735 619 18.7% 547 373 46.5%
Jordan
Amman JOD 64.0 63.0 1.0 126 111 12.9% 81 71 14.4%
Kuwait
Kuwait KWD 47.0 54.0 –7.0 80 86 –7.2% 38 47 –20.2%
Lebanon
Beirut LBP 66.0 64.0 2.0 2,12,926 2,55,602 –16.7% 1,42,129 1,64,061 –13.4%
Oman
Muscat OMR 65.0 62.0 3.0 66 72 –8.4% 44 45 –3.5%
Qatar
Doha QAR 66.0 72.0 –6.0 769 910 –15.5% 509 662 –23.2%
Saudi Arabia
Jeddah SAR 84.0 73.0 11.0 1,175 1,005 16.8% 989 743 33.0%
Madina SAR 51.0 68.0 –17.0 672 684 –1.7% 346 471 –26.5%
Makkah SAR 41.0 40.0 1.0 534 667 –19.9% 222 270 –17.9%
Riyadh SAR 68.0 68.0 0.0 732 819 –10.7% 500 560 –10.7%
United Arab Emirates
Abu Dhabi AED 80.0 80.0 0.0 423 466 –9.1% 341 374 –8.9%
Dubai — Beach AED 80.0 83.0 –3.0 1,278 1,325 –3.6% 1,023 1,112 –8.0%
Dubai — City AED 87.0 86.0 1.0 520 553 –5.9% 454 479 –5.2%
Dubai — Overall AED 84.0 85.4 –1.5 812 858 –5.4% 682 733 –7.0%
RAK — Beach AED 79.8 69.5 10.3 488 507 –3.7% 389 352 10.6%
RAK — City AED 64.3 59.8 4.5 232 230 0.8% 149 138 8.3%
RAK — Overall AED 76.5 67.5 9.1 442 456 –2.9% 339 307 10.1%
EY Middle East hotel benchmark survey
Monthly performance: May 2016 Currency: local
NotesFigures may not add up due to rounding.
“Cairo — Overall” includes Cairo City and Cairo Pyramid Hotels. “Dubai — Overall” includes Dubai Beach, Dubai City and Dubai Apartment Hotels.
The Middle East hotel benchmark survey was developed and is maintained by EY’s Dubai office under the direction of Yousef Wahbah who leads the Transaction Real Estate Advisory Services group across the MENA region. It is intended for informational use only. The reader should consult his or her professional investment advisor, attorney or accountant before making any decision or taking any action based upon the information presented in this document. Benchmark data is provided by individual hotel companies. While we believe the data collected is reliable, we have not performed an audit or review of the information gathered and do not express an opinion or any form of assurance on the accuracy of such information. This report is also proprietary of EY and no part of this report, in whole or in part, may be reproduced or transmitted without written consent of EY. All requests to reproduce this information must be addressed to [email protected]. For information regarding the hotel benchmark, contact the Dubai office at +971 4 332 4000.
Selected markets monthly performance (local currency)

7Benchmark |
Occupancy Average room rate Rooms yield
Currency 2016 % 2015 % Change in % Points 2016 2015 Change 2016 2015 Change
Bahrain
Manama US$ 52.0 46.0 6.0 193 212 –8.7% 102 98 3.6%
Egypt
Cairo — City US$ 74.0 60.0 14.0 127 107 18.7% 95 65 46.5%
Jordan
Amman US$ 64.0 63.0 1.0 179 158 12.9% 115 100 14.4%
Kuwait
Kuwait US$ 47.0 54.0 –7.0 273 295 –7.2% 129 162 –20.2%
Lebanon
Beirut US$ 66.0 64.0 2.0 141 169 –16.7% 94 108 –13.4%
Oman
Muscat US$ 65.0 62.0 3.0 172 188 –8.4% 113 117 –3.5%
Qatar
Doha US$ 66.0 72.0 –6.0 211 250 –15.5% 140 182 –23.2%
Saudi Arabia
Jeddah US$ 84.0 73.0 11.0 313 268 16.8% 264 198 33.0%
Madina US$ 51.0 68.0 –17.0 179 182 –1.7% 92 126 –26.5%
Makkah US$ 41.0 40.0 1.0 142 178 –19.9% 59 72 –17.9%
Riyadh US$ 68.0 68.0 0.0 195 219 –10.7% 133 149 –10.7%
United Arab Emirates
Abu Dhabi US$ 80.0 80.0 0.0 115 127 –9.1% 93 102 –8.9%
Dubai — Beach US$ 80.0 83.0 –3.0 348 361 –3.6% 279 303 –8.0%
Dubai — City US$ 87.0 86.0 1.0 142 151 –5.9% 124 130 –5.2%
Dubai — Overall US$ 84.0 85.4 –1.5 221 234 –5.4% 186 200 –7.0%
RAK — Beach US$ 79.8 69.5 10.3 134 139 –3.7% 107 96 10.6%
RAK — City US$ 64.3 59.8 4.5 64 63 0.8% 41 38 8.3%
RAK — Overall US$ 76.5 67.5 9.1 121 125 –2.9% 93 84 10.1%
EY Middle East hotel benchmark survey
Monthly performance: May 2016 Currency: US$
NotesFigures may not add up due to rounding.
“Cairo — Overall” includes Cairo City and Cairo Pyramid Hotels. “Dubai — Overall” includes Dubai Beach, Dubai City and Dubai Apartment Hotels.
The Middle East hotel benchmark survey was developed and is maintained by EY’s Dubai office under the direction of Yousef Wahbah who leads the Transaction Real Estate Advisory Services group across the MENA region. It is intended for informational use only. The reader should consult his or her professional investment advisor, attorney or accountant before making any decision or taking any action based upon the information presented in this document. Benchmark data is provided by individual hotel companies. While we believe the data collected is reliable, EY has not performed an audit or review of the information gathered and do not express an opinion or any form of assurance on the accuracy of such information. This report is also proprietary of EY and no part of this report, in whole or in part, may be reproduced or transmitted without written consent of EY. All requests to reproduce this information must be addressed to [email protected]. For information regarding the hotel benchmark, contact the Dubai office at +971 4 332 4000.
Selected markets monthly performance (US dollars)

8 | Benchmark May 2016
Occupancy Average room rate Rooms yield
Currency 2016 % 2015 % Change in % Points 2016 2015 Change 2016 2015 Change
Bahrain
Manama BHD 56.0 51.0 5.0 77 84 –9.1% 43 43 0.1%
Egypt
Cairo — City EGP 63.0 50.0 13.0 727 597 21.9% 461 299 54.3%
Jordan
Amman JOD 53.0 57.0 –4.0 113 111 2.0% 61 64 –4.8%
Kuwait
Kuwait KWD 44.0 58.0 –14.0 81 80 1.4% 36 46 –23.1%
Lebanon
Beirut LBP 56.0 57.0 –1.0 2,07,919 2,51,965 –17.5% 1,18,384 1,45,153 –18.4%
Oman
Muscat OMR 74.0 74.0 0.0 77 87 –12.1% 57 65 –12.1%
Qatar
Doha QAR 70.0 74.0 –4.0 813 956 –14.9% 577 715 –19.3%
Saudi Arabia
Jeddah SAR 71.0 74.0 –3.0 979 971 0.8% 704 721 –2.5%
Madina SAR 65.0 79.0 –14.0 733 711 3.0% 479 566 –15.3%
Makkah SAR 51.0 59.0 –8.0 617 607 1.7% 316 359 –11.9%
Riyadh SAR 66.0 70.0 –4.0 753 817 –7.8% 501 577 –13.2%
United Arab Emirates
Abu Dhabi AED 81.0 83.0 –2.0 498 592 –15.9% 408 497 –17.9%
Dubai — Beach AED 84.0 85.0 –1.0 1,538 1,677 –8.3% 1,294 1,442 –10.2%
Dubai — City AED 87.0 88.0 –1.0 671 731 –8.2% 589 649 –9.2%
Dubai — Overall AED 86.0 87.0 –1.0 1,006 1,096 –8.2% 868 960 –9.7%
RAK — Beach AED 76.4 65.3 11.0 614 631 –2.7% 464 409 13.5%
RAK — City AED 66.2 66.3 –0.1 258 259 –0.3% 172 172 0.0%
RAK — Overall AED 74.2 65.5 8.6 544 550 –1.0% 401 360 11.4%
EY Middle East hotel benchmark survey
Year-to-Date Performance (January 2016–May 2016) Currency: local
NotesFigures may not add up due to rounding.
“Cairo — Overall” includes Cairo City and Cairo Pyramid Hotels. “Dubai — Overall” includes Dubai Beach, Dubai City and Dubai Apartment Hotels.
The Middle East hotel benchmark survey was developed and is maintained by EY’s Dubai office under the direction of Yousef Wahbah who leads the Transaction Real Estate Advisory Services group across the MENA region. It is intended for informational use only. The reader should consult his or her professional investment advisor, attorney or accountant before making any decision or taking any action based upon the information presented in this document. Benchmark data is provided by individual hotel companies. While we believe the data collected is reliable, we have not performed an audit or review of the information gathered and do not express an opinion or any form of assurance on the accuracy of such information. This report is also proprietary of EY and no part of this report, in whole or in part, may be reproduced or transmitted without written consent of EY. All requests to reproduce this information must be addressed to [email protected]. For information regarding the hotel benchmark, contact the Dubai office at +971 4 332 4000.
Selected markets year-to-date performance (local currency)

9Benchmark |
EY Middle East hotel benchmark survey
Year-to-Date Performance (January 2016–May 2016) Currency: US$
NotesFigures may not add up due to rounding.
“Cairo — Overall” includes Cairo City and Cairo Pyramid Hotels. “Dubai — Overall” includes Dubai Beach, Dubai City and Dubai Apartment Hotels.
The Middle East hotel benchmark survey was developed and is maintained by EY’s Dubai office under the direction of Yousef Wahbah who leads the Transaction Real Estate Advisory Services group across the MENA region. It is intended for informational use only. The reader should consult his or her professional investment advisor, attorney, or accountant before making any decision or taking any action based upon the information presented in this document. Benchmark data is provided by individual hotel companies. While we believe the data collected is reliable, EY has not performed an audit or review of the information gathered and do not express an opinion or any form of assurance on the accuracy of such information. This report is also proprietary of EY and no part of this report, in whole or in part, may be reproduced or transmitted without written consent of EY. All requests to reproduce this information must be addressed to [email protected]. For information regarding the hotel benchmark, contact the Dubai office at +971 4 332 4000.
Occupancy Average room rate Rooms yield
Currency 2016 % 2015 % Change in % Points 2016 2015 Change 2016 2015 Change
Bahrain
Manama US$ 56.0 51.0 5.0 203 224 –9.1% 115 115 0.1%
Egypt
Cairo — City US$ 63.0 50.0 13.0 126 103 21.9% 80 52 54.3%
Jordan
Amman US$ 53.0 57.0 –4.0 161 158 2.0% 86 90 –4.8%
Kuwait
Kuwait US$ 44.0 58.0 –14.0 278 274 1.4% 122 159 –23.1%
Lebanon
Beirut US$ 56.0 57.0 –1.0 137 166 –17.5% 78 96 –18.4%
Oman
Muscat US$ 74.0 74.0 0.0 200 227 –12.1% 148 169 –12.1%
Qatar
Doha US$ 70.0 74.0 –4.0 224 263 –14.9% 159 197 –19.3%
Saudi Arabia
Jeddah US$ 71.0 74.0 –3.0 261 259 0.8% 188 192 –2.5%
Madina US$ 65.0 79.0 –14.0 195 190 3.0% 128 151 –15.3%
Makkah US$ 51.0 59.0 –8.0 164 162 1.7% 84 96 –11.9%
Riyadh US$ 66.0 70.0 –4.0 201 218 –7.8% 134 154 –13.2%
United Arab Emirates
Abu Dhabi US$ 81.0 83.0 –2.0 136 161 –15.9% 111 135 –17.9%
Dubai — Beach US$ 84.0 85.0 –1.0 419 457 –8.3% 352 393 –10.2%
Dubai — City US$ 87.0 88.0 –1.0 183 199 –8.2% 160 177 –9.2%
Dubai — Overall US$ 86.0 87.0 –1.0 274 299 –8.2% 236 261 –9.7%
RAK — Beach US$ 76.4 65.3 11.0 168 173 –2.7% 127 112 13.5%
RAK — City US$ 66.2 66.3 –0.1 71 71 –0.3% 47 47 0.0%
RAK — Overall US$ 74.2 65.5 8.6 149 151 –1.0% 110 99 11.4%
Selected markets year-to-date performance (US dollars)

EY | Assurance | Tax | Transactions | Advisory
About EY
EY is a global leader in assurance, tax, transaction and advisory services. The insights and quality services we deliver help build trust and confidence in the capital markets and in economies the world over. We develop outstanding leaders who team to deliver on our promises to all of our stakeholders. In so doing, we play a critical role in building a better working world for our people, for our clients and for our communities.
EY refers to the global organization, and may refer to one or more, of the member firms of Ernst & Young Global Limited, each of which is a separate legal entity. Ernst & Young Global Limited, a UK company limited by guarantee, does not provide services to clients. For more information about our organization, please visit ey.com.
The MENA practice of EY has been operating in the region since 1923. For over 90 years, we have grown to over 6,000 people united across 20 offices and 15 countries, sharing the same values and an unwavering commitment to quality. As an organization, we continue to develop outstanding leaders who deliver exceptional services to our clients and who contribute to our communities. We are proud of our accomplishments over the years, reaffirming our position as the largest and most established professional services organization in the region.
© 2016 EYGM Limited. All Rights Reserved.
ED none
This material has been prepared for general informational purposes only and is not intended to be relied upon as accounting, tax, or other professional advice. Please refer to your advisors for specific advice.
ey.com/mena
Related Documents