What Do You Measure, and How Do You Review Faculty? Katy Oksuita, MS – University of Wisconsin Greg Archual, MBA – The Ohio State University Greg Volturo, MD – University of Massachusetts Jim Scheulen, PA, MBA – Johns Hopkins Cathi Harbertson – Johns Hopkins

Welcome message from author
This document is posted to help you gain knowledge. Please leave a comment to let me know what you think about it! Share it to your friends and learn new things together.
Transcript

What Do You Measure, and How Do You Review Faculty?Katy Oksuita, MS – University of WisconsinGreg Archual, MBA – The Ohio State UniversityGreg Volturo, MD – University of MassachusettsJim Scheulen, PA, MBA – Johns HopkinsCathi Harbertson – Johns Hopkins

Annual Faculty Review: Using Metrics for Success

Annual Faculty Review: Using Metrics for Success
What you can expect from this session:– Review feedback received from survey on the information programs
are using to conduct their annual review process
– Benchmark data currently available that may be beneficial for your programs
– Discussion on what additional information would be valuable to collect into the future
– Group consensus on how to move forward with next steps

Annual Faculty Review: Using Metrics for Success
Feedback received from Pre-meeting Survey sent to Administrators:
N=29
60% of programs use benchmark data during the annual review process
Of the benchmarks used:94% utilize departmental data77% utilize AAAEM data38% utilize organizational data
Annual Faculty Review: Using Metrics for Success
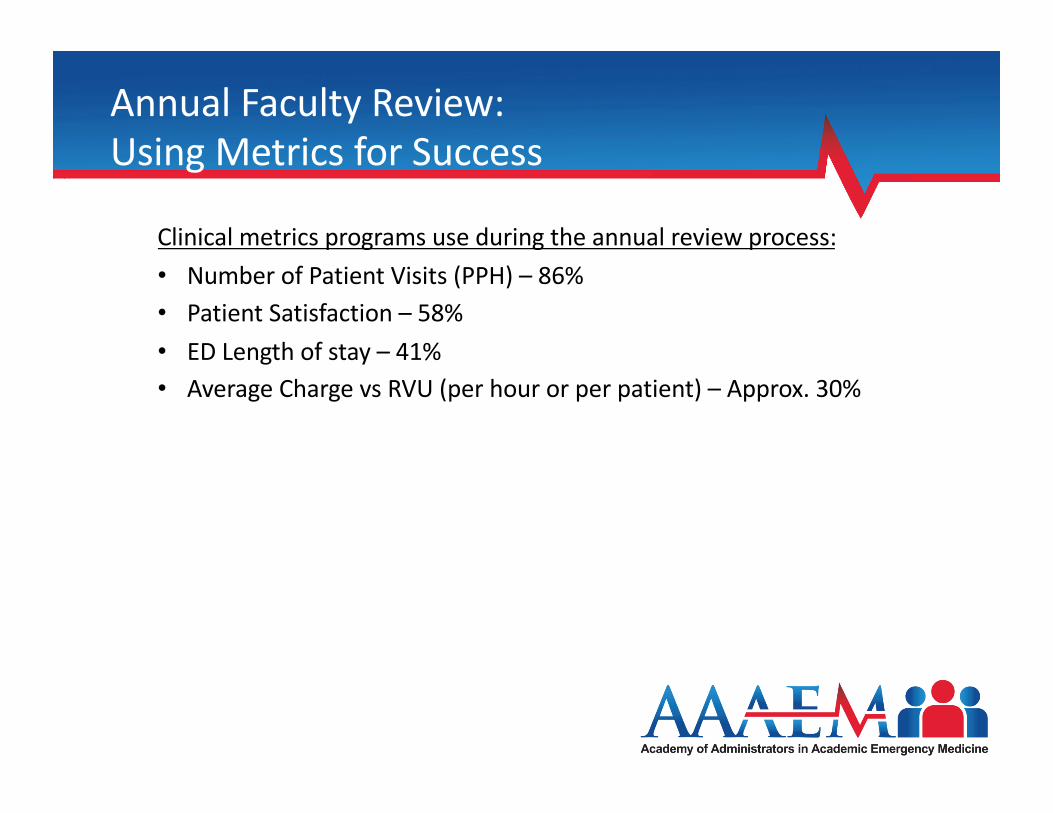
Clinical metrics programs use during the annual review process:
• Number of Patient Visits (PPH) – 86%• Patient Satisfaction – 58%
• ED Length of stay – 41%• Average Charge vs RVU (per hour or per patient) – Approx. 30%

Annual Faculty Review: Using Metrics for Success
Non-Clinical Metrics Programs use during the annual review process:• Scholarly Work – 100%• Attendance – GR/JC/M&M – 92%• Publications– 89%• Resident Evaluations – 89%• Faculty Meeting Attendance – 89%• Non-Departmental Committee Attendance – 67%• Student Evaluations – 57%• Awards – 50%

Annual Faculty Review:
Using Metrics for Success
AAAEM Clinical Throughput Benchmarks
FY18 AAAEM FY18 AAAEM
Average Median
Patients Per Hour 2.52 2.56
Bed to Decision (Discharge) 3.38 2.76
Bed to Decision (Admit) 4.10 3.18
ALOS (All Patients) 4.84 3.71
% Hospitalized 26.2% 26.0%

Annual Faculty Review: Using Metrics for Success
AAAEM Patient Satisfaction Benchmarks
FY18 AAAEM FY18 AAAEM Average Median
Press Ganey: Physician Overall Score 77.9 81.7Press Ganey: Likelihood to Recommend 70.3 73.0

Press Ganey Physician Overall Score
55
60
65
70
75
80
85
90
95
0 5 10 15 20 25 30 35 40 45 50 55 60 65 70 75 80 85 90 95
Score
Percentile RankAAAEM FY18 Press Ganey Pt Sat: Physician Overall Score PG Large Hospital Jan - Mar 2018 PG Academic Jan - Mar 2018
15th
Percentile
50th
Percentile
11th
Percentile

Annual Faculty Review: Using Metrics for Success
AAAEM Financial Benchmarks
FY18 AAAEM FY18 AAAEM Average Median
Collections Per Patient $131.01 $128.50wRVU Per Hour 6.96 6.84wRVU Per Patient 3.00 2.94% EM Level 1 0.6% 0.3%% EM Level 2 3.8% 2.8%% EM Level 3 19.9% 20.4%% EM Level 4 37.8% 35.1%% EM Level 5 33.6% 34.2%% EM Level CC 4.2% 3.6%

Annual Faculty Review: Using Metrics for Success
Academic Metrics Not Being Collected In AAAEM Benchmark Survey• Scholarly Work – 100%• Attendance - GR/JC/M&M – 92%• Publications– 89%• Resident Evaluations – 89%• Student Evaluations – 57%• Awards – 50%• Faculty Meeting Attendance – 89%• Non-Departmental Committee Attendance – 67%

Annual Faculty Review: Using Metrics for Success
Potential AAAEM Data Collection Metrics for Annual Reviews
Clinical Academic Other
Patients Per Hour Scholarly Work Faculty Meeting Attendance Bed to Decision (Discharge) Awards Non-Departmental Committee Bed to Decision (Admit) Publications Attendance Collections Per Patient Resident Evaluations ALOS (All Patients) Student Evaluations % Hospitalized Attendance (GR/JC/M&M) Press Ganey:
Physician Overall ScoreLikelihood to Recommend
wRVU Per HourwRVU Per Patient% EM Level 5% EM Level CC

Annual Faculty Review: Using Metrics for Success
Time to Vote
• Go to www.menti.com
• Use code 630875
Related Documents