Belarus and the IMF JVI Course - Financial Programming and Policies Raubichi, January 25, 2017 Bas B. Bakker Senior Regional Resident Representative for Central and Eastern Europe

Welcome message from author
This document is posted to help you gain knowledge. Please leave a comment to let me know what you think about it! Share it to your friends and learn new things together.
Transcript

Belarus and the IMF
JVI Course - Financial Programming and Policies
Raubichi, January 25, 2017
Bas B. Bakker
Senior Regional Resident Representative
for Central and Eastern Europe

Three phases in Belarus macro
performance since independence:
Post independence contraction (1992-1995)
Boom years (1995-2009)
Slow growth and recession (2010-201x)
2

Sharp decline in GDP in the early
transition
3
30
40
50
60
70
80
90
100
110
t t+1 t+2 t+3 t+4 t+5 t+6
Real GDP per capita, PPP-adjusted
(t=100)
POLCZESVK
BGRROM
EST
BLR
RUS
LVA
UKR
MDA
LTU
t=1991 for former soviet republics (solid lines)
t=1989 for other countries (dashed lines)

UKR
75
100
125
150
175
200
225
250
275
300
1995 1996 1997 1998 1999 2000 2001 2002 2003 2004 2005 2006 2007 2008
ROM
1995-2008: rapid growth
4
Real GDP per capita, PPP-adjusted
(1995=100)
POL
CZE
SVK
BGR
EST
BLR
RUS
LVA
MDA

-10
-5
0
5
10
15
2000 2001 2002 2003 2004 2005 2006 2007 2008 2009 2010 2011 2012 2013 2014 2015 2016
Since 2009, growth has slowed sharply
5
Real GDP growth
(2-year moving average, percent)
Belarus
Russia
CE4SEE EU
Baltics

Seen over entire 1990-2016 period,
growth in Belarus has not been bad…
6
-40
-20
0
20
40
60
80
100
120
140
160
0 5,000 10,000 15,000 20,000 25,000
GDP per capita, PPP-adjusted, 1990
GD
P p
er
cap
ita
gro
wth
, 1990-2
014
(perc
en
t)
GDP per capita growth, 1990-2014
But this largely reflects very rapid growth
during boom years.
7
-15
-10
-5
0
5
10
15
1995 1997 1999 2001 2003 2005 2007 2009 2011 2013 2015 2017
GDP growth in Belarus
(percent y/y)

Why has economic performance
deteriorated?
Is it due to external reasons (including
recession in Russia and Ukraine)?
Or were there also internal reasons? Was the
growth model unsustainable?
Which reforms could help to restore growth?
How can the IMF help?
8

External Reasons for the
Growth slowdown
9

-8
-6
-4
-2
0
2
4
6
8
2000 2001 2002 2003 2004 2005 2006 2007 2008 2009 2010 2011 2012 2013 2014 2015 2016
External factors have certainly played a role in the
slowdown: Belarus export markets have done poorly
10
Export market growth
(percent, y/y)
Note: export market growth is weighted average of Belarus’ trading partners real GDP growth, covering over 95 percent of
exports.
5-year moving average

Global growth has been fairly stable in recent
years…
11
Global GDP growth
(percent)
-1
0
1
2
3
4
5
6
2000 2001 2002 2003 2004 2005 2006 2007 2008 2009 2010 2011 2012 2013 2014 2015 2016 2017

-4
-2
0
2
4
6
8
10
12
14
2000 2001 2002 2003 2004 2005 2006 2007 2008 2009 2010 2011 2012 2013 2014 2015 2016 2017
But growth in emerging markets has slowed—
particularly outside China and India
12
GDP growth
(percent)
Advanced economies
China and India
Other EMs

Within CESEE, there were significant
differences in growth….
13

-10
-8
-6
-4
-2
0
2
4
6
8
10
2000 2001 2002 2003 2004 2005 2006 2007 2008 2009 2010 2011 2012 2013 2014 2015 2016 2017
As CIS was in recession, and the rest of
CESEE was growing quite strongly
14
PPP weighted real GDP growth
(percent)
CIS
Other CESEE
-16
-14
-12
-10
-8
-6
-4
-2
0
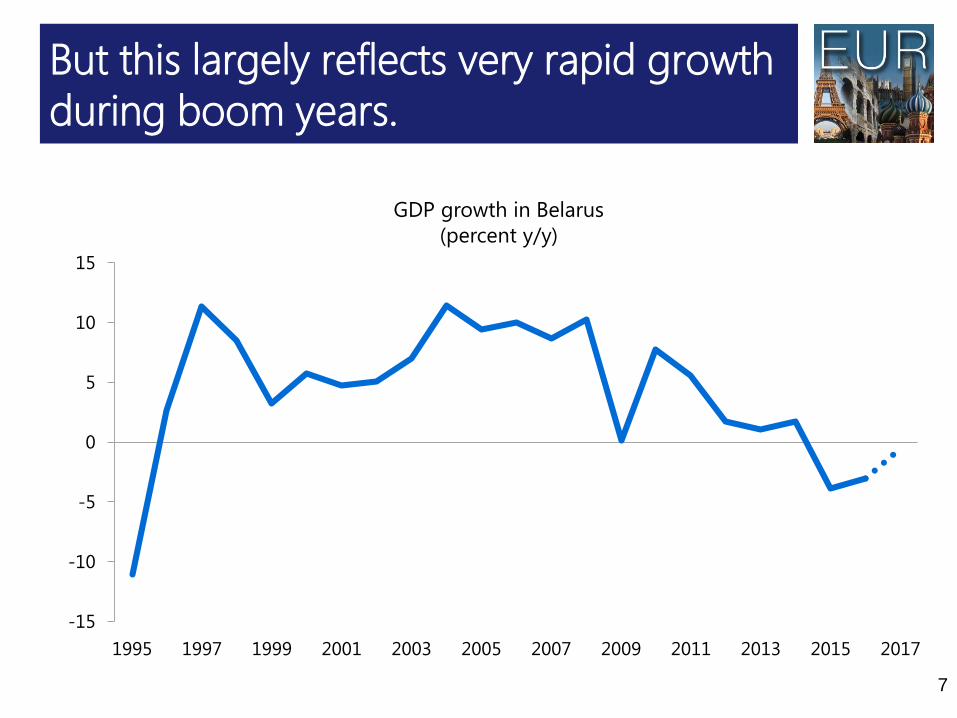
Ukraine Belarus Russia
Russia and Ukraine suffered from shocks, and
Belarus from spillovers.
Collapse of commodity prices
Sudden stop in capital flows to Russia, result of sanctions on Russia
Conflict in Ukraine
15
Change in GDP
(percent)
Between
2013-15
Between
2013-16

Exchange rate flexibility was unavoidable
given the limited buffers…
16
20
30
40
50
60
70
80
90
100
110
120
20 30 40 50 60 70 80 90 100 110
RUS
UKRBLR
2013
2014 2014
2014
2015
2015
2015
2016
2016
2016
Foreign reserves and XR depreciation
(6-month moving averages)
USD exchange rate (index, H1’2013=100)
Fo
reig
n r
ese
rves
(USD
in
dex,
H1’2
013=
100)
Depreciation
Reserv
es d
raw
dow
n

-5
0
5
10
15
20
25
30
2004 2006 2008 2010 2012 2014 2016
…but increased inflation and reduced real
wages
17
CPI Inflation in European CIS
(percent, weighted average)
max
min
0
250
500
750
1000
Q1'2010 Q1'2012 Q1'2014 Q1'2016
RUS
UKR
BLR
USD 500 line
Average monthly wages
(USD)

-20
-15
-10
-5
0
5
10
15
20
2005 2007 2009 2011 2013 2015
Ukraine and Russia are now recovering (helped
by rising oil prices)
18
-100
-75
-50
-25
0
25
50
75
100
-20
-15
-10
-5
0
5
10
15
20
2005 2007 2009 2011 2013 2015
RUS
Oil prices
(right axis)
Real GDP growth in Russia, other CIS countries and changes in oil prices
(percent, y/y)
UKR
RUS
BLR

-12
-9
-6
-3
0
3
Demand Supply
-12
-9
-6
-3
0
3
Demand Supply
Statistical
discrepancy
-12
-9
-6
-3
0
3
Demand Supply
No signs of recovery yet in Belarus; recession
driven by sharp drop in domestic demand
19
Belarus Russia Ukraine
Domestic
demand
Exports
GDP
growth
Demand and supply components: contribution to GDP in 2016
(percent)
Imports

Forecast for 2017: Non-CIS similar as 2016;
pick-up in CIS; Belarus still in recession
20
-3
-2
-1
0
1
2
3
4
5
6
BLR RUS SVN HRV HUN EST UKR CZE BGR SRB LTU MDA BIH SVK UVK POL LVA MKD MNE ALB ROM
2016
2017
GDP growth
(percent)
Note: CIS countries in red.

Internal Causes for
Growth Slowdown
21

Belarus growth model was unsustainable
Growth was increasingly driven by
unsustainable investment /domestic demand
boom
This led to BOP crises
Productivity (TFP) declined, offsetting the
impact of the larger capital stock
22

15
20
25
30
35
40
45
2000 2001 2002 2003 2004 2005 2006 2007 2008 2009 2010 2011 2012 2013 2014 2015 2016
Investment to GDP ratio increased
sharply in the 2000s
23
Investment rates
(percent of GDP)
Belarus
SEE non-EU
SEE EU
BalticsCE5

20
25
30
35
40
45
2000 2002 2004 2006 2008 2010 2012 2014 2016
As domestic saving was not sufficient…
24
Investment
Saving
Investment and saving rates
(percent of GDP)

…the current account deficit increased sharply…
25
Current Account Balance
(percent of GDP)
-16
-14
-12
-10
-8
-6
-4
-2
0
2
2000 2002 2004 2006 2008 2010 2012 2014 2016

…and would have been even higher
without support from Russia.
26

Wages increased strongly
27
Average monthly wages in USD
0
100
200
300
400
500
600
700
2005 2006 2007 2008 2009 2010 2011 2012 2013 2014 2015 2016
USD 500 line
0
10
20
30
40
50
60
70
80
90
2000 2001 2002 2003 2004 2005 2006 2007 2008 2009 2010 2011 2012 2013 2014 2015 2016
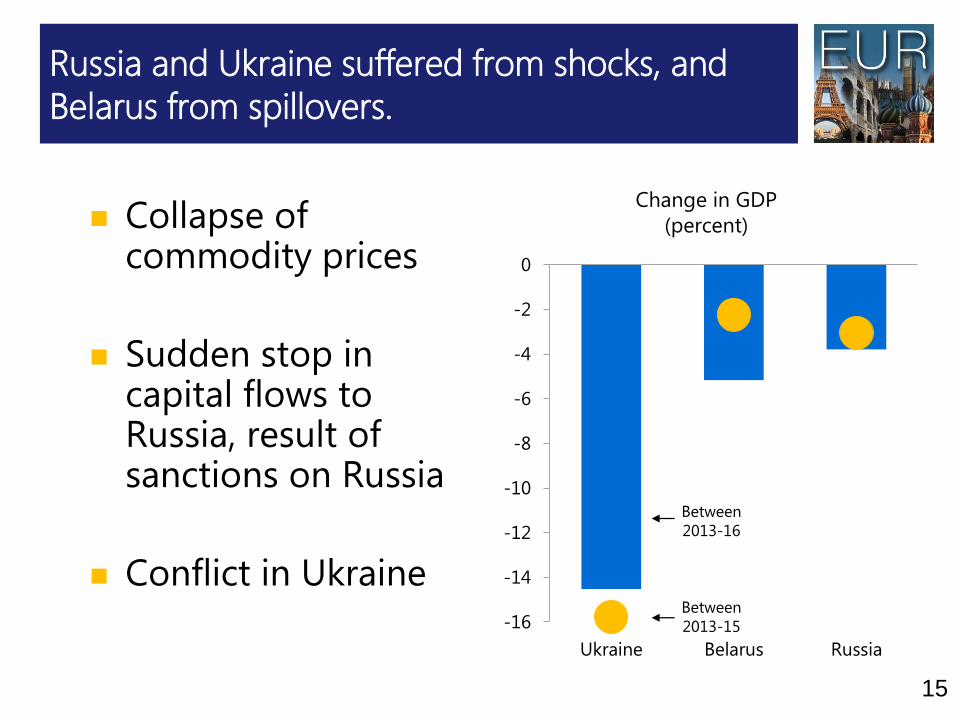
External debt accelerated
28
External debt
(percent of GDP)

0
10
20
30
40
50
60
2004 2005 2006 2007 2008 2009 2010 2011 2012 2013 2014 2015 2016
As did public debt.
29
General government debt
(percent of GDP)

-12
-7
-2
3
8
13
18
-40
-30
-20
-10
0
10
20
30
40
50
60
2006 2007 2008 2009 2010 2011 2012 2013 2014 2015 2016
The result was several BOP crises
30
Official reserves , rhs
(percent of GDP)
BYR/USD exchange rate
(monthly changes, percent)
Changes in exchange rate and official reserves

Reigniting growth
31

40
50
60
70
80
90
100
Jan-13 Jul-13 Jan-14 Jul-14 Jan-15 Jul-15 Jan-16 Jul-16
Exchange rate has now stabilized
32
BYR/USD
(Jan-2013=100)
Floating of BYR
Dep
reci
ati
on

How can growth be reignited?
33
-15
-10
-5
0
5
10
15
1995 1997 1999 2001 2003 2005 2007 2009 2011 2013 2015 2017
GDP growth in Belarus
(percent y/y)

Not by generating another investment
boom
Without improving exports, investment boom
would increase the current account deficit and
lead to another BOP crisis
We cannot count on a return to past higher
growth rates in Belarus’s key trading partner
Russia
Nor the same level of favorable energy import
pricing.
34

-3
0
3
6
9
12
2000 2001 2002 2003 2004 2005 2006 2007 2008 2009 2010 2011 2012 2013 2014 2015
Without meaningful SOE restructuring,
investment alone will not improve productivity
and exports
35
Contributions to GDP growth
(2-year moving average, percentage points)
GDP growth
Capital
TFP
Labor

Increasing efficiency rather than
increasing inputs
Instead, growth will to a much larger extent need
to come from increasing efficiency rather than
increasing inputs.
Indeed, what sets Belarus apart from other
countries, is not low investment or low
employment, but, rather low productivity.
36

Investment in Belarus is quite high
37
0
5
10
15
20
25
30
35
UKR BIH SVN SRB HRV POL LTU BGR HUN LVA RUS EST MDA SVK ROM CZE MNE BLR KOS ALB
Investment to GDP ratio, 2016

0
10
20
30
40
50
60
70
80
90
0 10 20 30 40 50 60 70 80 90 100
What sets Belarus from other countries is low
productivity
38
Em
plo
ym
en
t ra
te
(perc
en
t o
f w
ork
ing
ag
e p
op
.)
Labor productivity
(PPP adjusted 2014 USD, thousands)
Labor productivity and utilization, 2015
Flags size reflects GDP per capita in 2015 (PPP-adjusted).

Economic efficiency may be hampered by the too
limited role of the price mechanism in allocating
resources
39
Examples:
Absent hard financial constraint, many
state-owned enterprises are loss
making
Household energy prices are below
cost-recovery levels

Losses of SOEs create macro problem
They have to be compensated by
Higher fiscal expenditures
Or by cheap credit (directed lending)
While current policies have protected
employment in inefficient SOEs, this comes at
the cost of seeding the sows of the next crisis.
40

Simply stopping transfers may create a
banking sector problem
SOEs need to be restructured
IMF providing TA on how to do this
Strong social safety net needed to cushion
adverse impact on unemployment
Growth-enhancing policies, such as lending
programs for privately-owned SME may help
The World Bank is working on a loan/project to
support SME lending.
41

Setting heating tariffs at cost-recovery levels and reducing cross-
subsidization means lower subsidies and more incentive to use
more energy-efficient technologies
42Source: IMF Staff Report, September 2016. Methodology for calculating cost-
recovery in Belarus has since changed.

Belarus needs to catch-up with transition
43
0
1
2
3
4
1989 1999 2009 1989 1999 20091989 1999 20091989 1999 2009 1989 1999 2009
Large scale
privatization
Small scale
privatization
Governance and
restructuring
Price
liberalization
Trade and
forex system
Competition
policy
Belarus
Baltics
SEE EU CE4*
*CE4 includes Hungary, Poland, Slovakia and Slovenia.
1989 1999 2009
EBRD transition indicators

Lessons from Early Transition
In the early 1990s economists had strong
disagreements about whether transition should
be gradual or more rapid
In the end, some countries (Czech, Poland,
Baltics) opted for rapid; others (CIS, Bulgaria)
for more gradual
44
What were the results?
Rapid liberalizers had a much shallower
recession—as well as strong long-term
growth
So waiting with liberalization did not
moderate the pain—it exacerbated it.
45

Postponing reforms can be costly
Reforms can certainly be painful in the short
run, but not transforming the inefficient
economy can have even larger costs
Example: in 1989 Poland and Ukraine were
equally poor. Poland pursued transition
reforms quickly, as opposed to Ukraine.
46
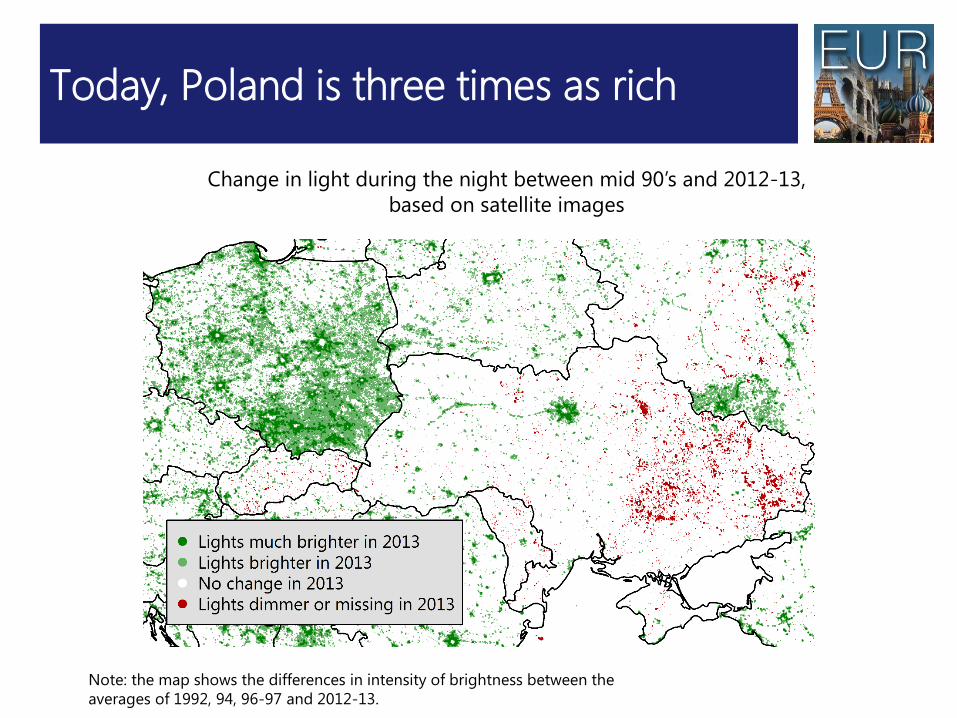
Today, Poland is three times as rich
Change in light during the night between mid 90’s and 2012-13,
based on satellite images
Note: the map shows the differences in intensity of brightness between the
averages of 1992, 94, 96-97 and 2012-13.

Belarus and the IMF
48

Belarus has had several IMF Programs
since independence
49
0.0
0.5
1.0
1.5
2.0
2.5
1993 1995 1997 1999 2001 2003 2005 2007 2009 2011 2013 2015
IMF arrangements with Belarus and credit outstanding
(SDR billion)
Systemic Transformation Facility
Standby Arrangement
Standby Arrangement
Systemic Transformation Facility

Many promised reforms not
implemented
Many of the structural reforms pledged in STF
have still not be done.
SOE Reform
Utility Reform
50

Last program in 2009/10
Achieved temporary stability, but
Macro-adjustment was not durable
Directed lending increased sharply during
program
Shortly after program ended, policies were
loosened
BOP crises followed
Few structural reforms
51

Belarus and IMF have talking on and off for
past two years about possible new program
Goal is to reach agreement on 3 year EFF
program
Macro-adjustment to reduce vulnerabilities
Structural reforms to reignite growth (and
further reduce vulnerabilities)
52

More contentious elements of program
Pace and depth of SOE Reform
Raise cost recovery for utilities
Adequacy of Social Safety Nets
53

Experience in other countries suggests
“ownership” is important
Programs are most successful if governments
implement reforms because they believe in
them—not because they feel they have to
Examples of successful IMF programs with
ownership
Korea
Ireland
Latvia
54

IMF does not impose reforms
The IMF is a strong supporter, not just of growth, but of inclusive growth.
That is why we advocate reforms that will support economic growth, with targeted support for those in need.
We cannot and do not want to impose reforms.
But we can help countries that want to reform.
We hope that we will be able to help Belarus to reform.
55

Conclusions
Belarus has had rapid growth
But growth model no longer sustainable
Reforms and more market mechanism needed
To fix macro problems
To fix micro problems
Waiting with reforms may exacerbate pain—
not lessen it.
56

Thank you
Related Documents