Pre-print version of the article forthcoming in Organization Science BEING A CATALYST OF INNOVATION: THE ROLE OF KNOWLEDGE DIVERSITY AND NETWORK CLOSURE Marco Tortoriello IESE Business School 28023 Madrid, Spain [email protected] Bill McEvily Rotman School of Management University of Toronto Toronto, Ontario M5S 3E6, Canada [email protected] David Krackhardt Carnegie Mellon University Pittsburgh PA, 15213, US [email protected] (forthcoming in Organization Science) Keywords: Innovation, Social Networks, Catalysts Acknowledgments: This research is supported by the Ewing Marion Kauffman Foundation, the Fondazione IRI Research Fellowship, IESE Business School, the Spanish Ministry of Science and Innovation (ECO2011- 23220 and ECO2011-13361-E), and the Singapore National Research Foundation under its International Research Centre @ Singapore Funding Initiative and administered by the IDM Programme Office. The generous support of the Center for Organizational Learning, Innovation and Knowledge at the Tepper School of Business - Carnegie Mellon University is also gratefully acknowledged. We would like to thank senior editor Steve Borgatti for his guidance, Linda Argote, Fabrizio Ferraro, David Hounshell, Pablo Ruiz- Verdú, seminar participants at Dartmouth College, Grenoble Ecole de Management, Rotman School of Management, Universidad Carlos III de Madrid, University of Michigan, Washington University in St. Luis, for their comments and insightful suggestions. Remaining mistakes are our own.

Welcome message from author
This document is posted to help you gain knowledge. Please leave a comment to let me know what you think about it! Share it to your friends and learn new things together.
Transcript
Pre-print version of the article forthcoming in Organization Science
BEING A CATALYST OF INNOVATION:
THE ROLE OF KNOWLEDGE DIVERSITY AND NETWORK CLOSURE
Marco Tortoriello
IESE Business School
28023 Madrid, Spain
Bill McEvily
Rotman School of Management
University of Toronto
Toronto, Ontario M5S 3E6, Canada
David Krackhardt
Carnegie Mellon University
Pittsburgh PA, 15213, US
(forthcoming in Organization Science)
Keywords: Innovation, Social Networks, Catalysts Acknowledgments: This research is supported by the Ewing Marion Kauffman Foundation, the Fondazione IRI Research Fellowship, IESE Business School, the Spanish Ministry of Science and Innovation (ECO2011-23220 and ECO2011-13361-E), and the Singapore National Research Foundation under its International Research Centre @ Singapore Funding Initiative and administered by the IDM Programme Office. The generous support of the Center for Organizational Learning, Innovation and Knowledge at the Tepper School of Business - Carnegie Mellon University is also gratefully acknowledged. We would like to thank senior editor Steve Borgatti for his guidance, Linda Argote, Fabrizio Ferraro, David Hounshell, Pablo Ruiz-Verdú, seminar participants at Dartmouth College, Grenoble Ecole de Management, Rotman School of Management, Universidad Carlos III de Madrid, University of Michigan, Washington University in St. Luis, for their comments and insightful suggestions. Remaining mistakes are our own.
2
BEING A CATALYST OF INNOVATION:
THE ROLE OF KNOWLEDGE DIVERSITY AND NETWORK CLOSURE
Abstract
Whereas recent research on organizational innovation suggests that there is an ecology of roles supporting
the innovative process, the majority of network research has concentrated on the role of inventors. In this
paper, we contribute to research on organizational innovation by studying the social structural conditions
conducive to individuals supporting, facilitating and promoting the innovativeness of their colleagues – a
role we refer to as catalysts of innovation. We consider an individual’s network position and the type of
knowledge available to them through their network as key enabling conditions. We argue that the unique
configuration of having access to diverse knowledge through a closed network enables individuals to act as
innovation catalysts. Based on a study of 276 researchers in the R&D division of a large multinational
high-tech company we find strong support for our prediction and demonstrate that catalysts make
important contributions to the innovative outputs of other researchers in terms of their colleagues’ patent
applications.

3
Research on the social structure of innovation has advanced considerably in recent years and
enriched our understanding of how the generation of new products, processes, and ideas in organizations is
contingent upon the surrounding social context (Phelps et. al, 2011). Most notably, social structures
characterized by brokerage and closure have been shown to have independent and contingent effects on
innovation processes and outcomes (Burt 2005; Fleming, Mingo & Chen 2007; Reagans & McEvily 2008;
Tortoriello, 2014). A key insight emerging from this stream of research is that an actor’s network position
influences that actor’s own innovativeness. This observation is important because it identifies how
patterns of informal social relations contribute to an actor’s capacity to perform the role of innovator. At
the same time, the primary focus on innovators and the extent to which they occupy advantageous network
positions overlooks other important questions about the influence of social structure on organizational
innovation. Indeed, implicit in the emphasis on the network position of innovators is the idea that their
network contacts contribute to their innovativeness. Yet, network contacts have largely been treated as
homogeneous and undifferentiated in terms of their ability to contribute to innovators and we know
relatively little about the social structural conditions that are conducive to network contacts stimulating the
innovativeness of others.
The broader literature on organizational innovation emphasizes that the generation of new
products, processes, and ideas is often the result of collaborative efforts involving numerous parties who
perform a variety of distinct roles. Along these lines, Hargadon and Bechky (2006) identify different
innovation activities performed by individuals including help giving, help seeking, reflective reframing, and
reinforcing. Similarly, Ibarra (1993) differentiates administrative from technical innovation roles. And,
Obstfeld (2005) distinguishes among individuals acting as initiators of innovation, major contributors, and
minor contributors. Taken together these studies suggests that in addition to the primary role played by
innovators, there are a number of supporting roles that contribute to the overriding objective of generating
innovations in organizations (Hargadon, 2002; Carlile, 2004). Beyond a general recognition of multiple
innovation roles, however, we know relatively little about the relationships and connections among these
4
roles, the extent to which they are mutually supportive, and how they collectively form an ecology of
innovation roles in organizations.
Although well-suited to do so, previous research on the social structure of innovation has yet to
systematically explore the pattern of connections that contributes to the emergence of different innovation
roles in general, and, in particular, the specific network configurations conducive to the formation of those
roles that act in a supportive capacity to the role of innovators. Scholars who study organizational
innovation from a network perspective have described the importance of supporting social structures to
numerous high-profile breakthroughs. For instance, key to the invention of the electric light bulb was “the
web around [Thomas] Edison … thick with ties to other people, ideas, and objects that together made up
his particular ‘invention’ … Ignoring these connections hides central insights into how innovations unfold”
(Hargadon 2003: 7). Additionally, network scholars studying organizational innovation have implicitly
focused on the type and content of relationships that trigger creativity (Sosa 2011). While such
observations do reflect a general recognition of supporting roles, they are less informative of the types of
roles that may be critical to facilitating and enabling innovation in organizations and the extent to which
social structural conditions are integral to the fulfillment of such roles.
In this paper we focus on one type of role through which organizational members support,
facilitate, and promote their colleagues’ innovativeness. We refer to this role as catalysts of innovation, defined
as individuals who are able to stimulate and enhance the development of new ideas in their colleagues by
providing them with relevant knowledge, and who are recognized by their colleagues as key contributors to
the process of generating innovations.
To gain a better understanding of the social structural conditions enabling individuals to act as
catalysts of innovation, we draw on and extend research examining the influence of networks on the
creation, dissemination, and use of knowledge in organizations (Cummings, 2004; Borgatti and Cross,
2003; Obstfeld 2005; Haas, 2006; Reagans and McEvily, 2003). According to this body of research, the role
of innovators has been explained as a function of the position individuals occupy in social structure and by
the type of knowledge available to them by virtue of their network position. For instance, individuals

5
maintaining bridging ties between otherwise disconnected contacts have access to diverse knowledge (Burt,
1992), which favors their ability to identify innovative solutions (Hargadon and Sutton, 1997), develop
good ideas (Burt, 2004), and generate innovations (Tortoriello and Krackhardt, 2010; Reagans and
Zuckerman, 2001). We extend this line of work to explain how individuals’ positions in social structure,
and the diversity of knowledge accessed through individuals’ networks, combine to influence their ability to
act as catalysts of innovation.
Secondarily, we also explore the interplay between network position and knowledge diversity.
Central to research on the social structure of innovators is the assumption of a strong correspondence
between network structure and knowledge diversity. Specifically, a sparse network rich in bridging ties is
thought to provide access to diverse, non-redundant knowledge, whereas a dense network of closure ties is
argued to provide homogeneous and overlapping knowledge. Yet, the degree to which an individual’s
position in network structure corresponds with the diversity of knowledge available to that individual may
vary (Rodan and Galunic, 2004). For instance, knowledge sourced from outside of the organization can
substantially change the knowledge base of a focal individual irrespective of the configuration of her
network of contacts inside the organization. To the extent that network structure is not strictly isomorphic
with knowledge diversity, there may be a multitude of ways in which networks and knowledge are
configured, and those different configurations may matter for furthering our understanding of
organizational innovation. Given our interest in explaining the ability of individuals to act as catalysts of
innovation and that, as described further below, a defining activity of this role is the sharing of relevant
knowledge with others, we treat social structure and knowledge diversity as distinct. We further argue that
the configuration of social structure and knowledge diversity conducive to performing the role of catalyst is
fundamentally different from that for the innovator role. Specifically, we propose that being embedded in a
closed network (e.g., overlapping ties to common third parties) within an organization and having access to
diverse external sources of knowledge increases an individual’s capacity to act as a catalyst of innovation.
We refer to this configuration of internal social structure and external knowledge diversity as a “diverse
knowledge clique.”

6
To gain a better understanding of how internal social structure and external knowledge diversity
combine to influence individuals’ ability to act in the role of catalyst of innovation, we conducted a study
of 276 researchers in the R&D division of a large multinational high-tech company. In addition to
conducting preliminary field interviews, we surveyed the members of the R&D division to obtain
information about their external sources of knowledge and their knowledge sharing networks within the
organization. As a complement to the survey data, we also drew on archival sources from the company to
obtain details about respondents’ background, research profile, and position in the formal organization. In
addition, we collected data about the innovative outputs of the individuals in the company based on
monthly reports that identified patent applications and that the company used to assess and reward
individual performance.
Based on our analysis of the data collected, we make three key observations. First, consistent with
our prediction, individuals having access to diverse sources of external knowledge through a closed
network of contacts within the organization are well positioned to play the role of innovation catalysts.
Second, the role of catalysts of innovation is distinct from the role of innovators. Third, having knowledge
sharing relationship with catalysts of innovation helps inventors generate innovations. We discuss the
implications of these observations for research on organizational innovation and for research on social
networks in the concluding section of the paper.
ENABLING CONDITIONS
Anecdotally, innovation catalysts appear to be prevalent in organizations. For instance, a number
of companies have established specialized roles, or teams of individuals, primarily responsible for enabling
and facilitating the innovative activities of their colleagues (Martin 2011). In other organizations, the role is
less well defined and individuals informally fulfill the function of assisting their colleagues’ innovative
efforts (Hargadon and Bechky 2006; Obstfeld, 2005). Regardless of the extent to which organizations
structure the role, the general observation that certain individuals in organizations act as catalysts by
supporting and facilitating their colleagues’ ability to generate innovations appears to have some

7
representative validity. At the same time, however, systematic evidence on innovation catalysts is rather
limited and little is known about the supporting conditions that enable individuals to perform this role.
By definition, catalysts share knowledge with others. What sets apart the catalyst from others who
perform similar activities is the combination of the relevance of the knowledge shared with recipients and
the generative influence of that knowledge for colleagues in terms of stimulating and enhancing the
development of novel products, processes, and ideas. For knowledge to be relevant, individuals need to be
aware of who in their network is likely to benefit from that knowledge. And, for knowledge to be
generative of novel outputs requires that it be diverse relative to a colleague’s existing stock of knowledge.
Thus, beyond just the willingness to share knowledge with others, we would argue that awareness of
knowledge needs in one’s network and diversity of knowledge shared constitute a minimal set of enabling
conditions for individuals to perform the role of catalyst. As we further argue below, these three conditions
emerge from closed social structures which also provide access to diverse pools of knowledge.
In structural terms, the willingness to help and assist others by sharing knowledge has been
traditionally associated with being embedded in a closed network of dense and overlapping connections to
mutual third parties. Individuals embedded in closed networks develop norms of cooperation, increased
trust, and are well positioned to pursue collective rather than individual gains (Coleman 1988). Individuals
embedded in closed networks are also likely to develop a clear understanding of what their colleagues do
and do not know, which provides them with an enhanced awareness of their colleagues’ knowledge
requirements (Uzzi 1997). Thus, both in terms of the willingness to do so and the awareness of others’
needs, closed networks are conducive to the knowledge sharing activities that are integral to the catalyst
role. Yet, to stimulate and enhance the development of new ideas by others also requires innovation
catalysts to have access to diverse sources of knowledge. We suggest that it is this configuration of access
to diverse sources of external knowledge through contacts within an organization that are embedded in a
closed network structure (i.e., a diverse knowledge clique) that provides the explanatory power for
predicting individuals’ ability to act as catalysts of innovation. In the next section, we develop a theory of
innovation catalysts that focuses on the enabling conditions emerging from diverse knowledge cliques:
8
access to diverse external knowledge, awareness of colleagues’ knowledge needs, and willingness to share
knowledge.
A THEORY OF INNOVATION CATALYSTS
While the combination of network closure and knowledge diversity is unique with respect to the
traditional literature on networks and innovation, more recent research has decoupled the type of
knowledge accessed from the structure of the network (Rodan and Galunic, 2004). The implication is that
while knowledge diversity and network structure are related, they are not perfectly overlapping (Fleming,
Mingo and Chen 2007). We build on this insight by considering a specific driver of knowledge diversity
which is likely to introduce heterogeneity, even into closed networks: access to knowledge sources that are
external to the organization.
Knowledge Diversity: We focus on external knowledge because the broader literature on
organizational innovation has stressed its critical role in fostering innovation (Cohen and Levinthal 1990;
Chesbrough 2003). Short of assuming that individuals inside an organization acquire the exact same type of
knowledge from the same external sources, external knowledge presents elements of novelty with respect to
the knowledge available inside the organization (Laursen and Salter 2006; Chesbrough, 2003; Zahra and
George, 2002; Cohen and Levinthal, 1990). It follows that the diversity of knowledge sourced from outside
the organization, makes the knowledge base of individuals inside the organization less homogeneous even in
those cases in which the pressure towards knowledge homogenization are greater (i.e. in closed networks).
Our contention is based on the premise that the diversity of knowledge introduced into the organization as a
result of individuals internalizing external sources of knowledge represents one important condition through
which even structurally redundant contacts can come to possess knowledge that is not entirely overlapping of
one another. As noted above, previous research has shown that access to diverse sources of knowledge is
an important precursor to the innovative process. Similarly, access to diverse knowledge is also a pre-
condition to helping and assisting others in the process leading to the generation of innovations. In
particular, individuals act as a catalyst of innovation when they share the diverse knowledge accessible to
them with others who might benefit from it.

9
Absorbing knowledge and insights from external sources is an important input into the process
through which organizations generate innovations (Chesbrough, 2003). For research intensive
organizations, being able to acquire and leverage inputs developed outside of the organization, is
particularly critical for their innovativeness (Cohen and Levinthal, 1990). For instance, searching outside of
technological and organizational boundaries has been shown to have a positive impact on a firms’
technological evolution (Rosenkopf and Nerkar, 2001). And, engaging in wide and deep searches for
external knowledge by leveraging market, institutional and specialized channels, promotes companies’
innovative performance (Laursen and Salter, 2006). However, external knowledge can also be difficult to
integrate and leverage into an organization’s own operations, suggesting that its internal use cannot be
taken for granted. Thus, while numerous members of an organization may access diverse sources of
knowledge, they may not all have the awareness of who needs what type of knowledge.
Awareness: When the diversity of knowledge and perspectives in an organization increases as a
function of the diversity of knowledge accessed from outside, individuals are less likely to have a common
knowledge base to understand and integrate the newly acquired knowledge (Cramton, 2002; Simon, 1985;
Ellis, 1965). This lack of common knowledge base could partially, or completely, prevent the further
diffusion of external knowledge throughout the organization by increasing the difficulties associated with
its transfer (Reagans and McEvily, 2003) and acquisition (Tortoriello, Reagans, and McEvily, 2012). Closed
network structures, however, tend to facilitate the development of shared languages, frames of reference,
and eventually of a common knowledge base (Carlile and Rebentisch, 2003).
In addition to facilitating the development of a common knowledge base, the frequent and repeated
interactions that are characteristic of closed structures promote fine-grained information sharing and allow
individuals to recalibrate their understanding of a contact’s skills and knowledge (Borgatti and Cross, 2003:
442). Frequent interactions observed in cliques favor the formation of individuals’ expertise-associations so
that individuals interacting with one another learn about the content and depth of each other’s knowledge.
In this way, it is easier to develop an accurate understanding of what colleagues know, what kind of
10
problems they are currently working on, and what type of knowledge and expertise could be of help to
them given their specific knowledge needs (Huber and Lewis, 2010).
The preceding arguments suggest that when individuals inside an organization source different
types of knowledge from outside, network closure is critical to explaining individuals’ ability to perform the
role of innovation catalyst. On the one hand, network closure promotes the development of a common
language and shared frames of reference. On the other hand, individuals embedded in closed structures
develop a capacity for understanding what their colleagues know (or do not know) so that they become
better able to identify their colleagues’ specific knowledge needs. Thus, individuals embedded in a diverse
knowledge clique should have an enhanced awareness of their colleagues’ knowledge requirements.
Willingness: While access to diverse knowledge and awareness of others’ knowledge requirements
are important preconditions, assisting others’ innovative efforts also require the willingness to share
knowledge that may be relevant and valuable to others. In closed networks, pro-social behaviors such as
the willingness to share knowledge are enabled due to the ease of creating and enforcing cooperative
norms. Since behaviors in closed networks are more ‘public,’ news of one person’s actions quickly spread
to mutually-connected third parties. As a result, reputational considerations and encouragement to engage
in cooperative behaviors act as powerful inducements to, for instance, share diverse knowledge with
colleagues who might be in a better position to exploit it. The norms of reciprocity and cooperation that
develop in a close-knit social system (Coleman, 1988) increase the likelihood that individuals embedded in
that system would help and assist others when they are in need (Reagans and McEvily, 2003; Granovetter,
1983). By talking about common past experiences when interacting with a particular colleague, different
individuals contribute to creating, maintaining and disseminating that colleague’s reputation in the broader
social network. To the extent that such a reputation is positive, it facilitates interactions with others
because of the greater availability of information about the focal party’s trustworthiness. In the specific
case of catalysts, their positive behaviors helping and supporting others’ efforts toward the generation of
innovations increases the degree of trust their colleagues have in them, and contributes to maintaining and
projecting their reputation as catalysts throughout the network.
11
To summarize the foregoing arguments, we propose that being embedded in a diverse knowledge
clique creates the conditions conducive to individuals acting as catalysts of innovation. When the external
knowledge sourced by an individual’s internal contacts is diverse, we expect closure in the individual’s
network to be positively associated with the individual’s ability to contribute to their colleagues’
innovativeness due to the individual’s increased awareness of colleagues’ knowledge requirements and to
the individual’s increased willingness to collaborate by sharing it with others. Based on this reasoning, we
predict:
H1: Embeddedness in a diverse knowledge clique is positively related to being a catalyst of innovation.
DATA AND METHODS
Research Setting
To test our theory of innovation catalysts, we collected data on 276 scientists, researchers, and
engineers in the research and development (R&D) division of a large multinational high tech company. The
R&D division consists of 16 research centers located in 10 countries around the world: 4 in the US, 10 in
Europe and 2 in Asia. The R&D division’s activities deal with a broad range of products, such as
microelectronic components (e.g. memories, transistors, wireless applications, integrated circuits amplifiers,
and microprocessor) and develop specific applications targeting markets such as digital consumer electronics,
wireless communications, storage, security, etc. The R&D division’s personnel is further assigned to one of
21 different areas of technological expertise. Each area of technological expertise is focused on the
development of a distinct technology. Examples of such areas/technology are Bluetooth data transfer, low
power devices, imaging/rendering, etc. Interviews with lab personnel prior to data collection revealed the
importance of informal interactions for knowledge sharing within the R&D division. For instance, a senior
engineer in one of the largest labs explained that: “keeping relationships with a lot of different people helps
you ask the right questions. It also improves your understanding of their problems.” This general statement
about the relevance of informal relationships to facilitate knowledge sharing and understanding, was further
confirmed by another quote offered from a mid-career researcher at a different lab who reflected on his

12
network as follows: “I think it is important to spend a lot of time with technicians, listening to their problems,
understanding exactly what they need, I call this active listening. At the same time it is also important to go
back and talk with people in your group, with knowledge more similar to yours.”
Data sources. In addition to preliminary interviews, data for this paper came from survey and archival
sources. In particular, we surveyed the members of the R&D division to obtain information about their
external sources of knowledge and their knowledge sharing networks within the organization. To
complement survey data, we obtained data about respondents’ backgrounds (gender, level of education),
position in the formal organization (job grade, tenure, laboratory), and research profile (areas of technological
expertise) from archival sources provided by the company.
The survey was administered using a password-protected website. Questionnaire items were
developed after extensive field interviews with the company’s senior managers and several researchers and
engineers at different R&D labs. The survey was then pre-tested prior to the beginning of the actual data
collection process. Only personnel with active research and development duties (e.g. no administrative or
support staff) participated in the study. The survey yielded a response rate of 91% (249 actual respondents
out of 276 potential respondents). Even though a minority of individuals did not respond, we tested for non-
response bias looking at lab location, organizational tenure, organizational job grade, age, and gender,
obtaining no statistically significant differences. The survey asked respondents different questions about the
type of external sources of knowledge they systematically relied upon to accomplish their tasks in the
innovation process (discussed in more detail below), and their knowledge-sharing network.
To collect network data we used a sociometric approach, presenting respondents with a list of all the
people working in the R&D division organized by lab, and asking them to check the names of those with
whom they have worked in the past two years on one or more projects or who represented an important
sources of knowledge for them even though they did not work on a project together. This process generated
a unique list of contacts for each respondent which were then interpreted through specific questions about
frequency of interaction with each contact and the extent to which each contact facilitated their own
innovativeness. To address concerns about construct validity and accuracy of network data, we implemented
13
Marsden’s (1990) recommendations. For instance, we pre-tested the instrument used and, in the definition of
specific question items, we focused on long-term patterns of relationships rather than interactions limited to
specific situations or narrowly defined periods of time (Freeman, Romney and Freeman, 1987; Borgatti and
Cross, 2003).
Dependent Variable
Catalysts of Innovation. The extent to which an individual fulfils the catalyst role by helping his/her
contacts to generate new creative solutions and ideas is the dependent variable in this study. Focusing on the
supporting role of catalysts we followed the same measurement strategy implemented by previous research
emphasizing the diversity of innovation roles in which individuals engage during the innovative process
(Ibarra, 1993; Obstfeld, 2005; Hargadon and Bechky, 2006). In our particular case, we took into account
relational assessments of individuals’ contributions to the innovative process considering the extent to which
a given individual is recognized as a catalyst of innovation by his/her colleagues. Respondents assessed the
extent to which each of their contacts was considered instrumental in supporting and developing their own
innovativeness by answering the following survey item: “When I interact with this person it is easy for me to
generate new creative solutions and/or ideas. (1 = Strongly disagree, 3 = Neither agree nor disagree, 5 =
Strongly agree).” We entered the responses to this question into a squared matrix (i.e. catalyst matrix “C”)
that report individuals’ evaluations of their colleagues ability to facilitate the generation of new solutions and
ideas. We used this matrix to derive the extent to which each person was considered a catalyst of innovation
by his/her contacts.
Since our intention was to capture the extent to which the catalysts role was instrumental in
promoting the innovativeness of others, we weighted the scores reported in the “C” matrix by each
respondent’s innovativeness. In particular, we weighted a respondent’s assessment of their colleagues as
catalysts of innovation by multiplying the entries in the “C” matrix by the log-transformation of the number
of patents the respondent applied for in a 24 month period. Accordingly, the catalyst assessments reported
by researchers who applied for patents increased with the number of applications, whereas the catalyst

14
assessments reported by researchers who applied for no patents remained unchanged1. We calculated our
dependent variable as the normalized in-degree centrality of the weighted “C” matrix.
This measure of innovation catalysts is particularly appropriate for our purposes for several reasons.
First, it is consistent with the relational nature of the phenomenon studied. We conceptualized the role of
innovation catalyst as an individual’s contribution to other researchers’ innovativeness, and our measure
reflects each researcher’s assessment of the extent to which each of their contacts enhanced their own
innovativeness. Second, by weighting catalysts’ evaluation by the actual innovativeness of the evaluators, our
measure takes into account variation in the extent to which individuals are effective in their role as catalysts.
For instance, our measure allows us to discriminate between someone who catalyzes prolific innovators, vs.
someone who is indicated to be a catalyst by individuals who are not very prolific innovators. Third, being
based on everybody’s evaluation of all the contacts in their network, this measure takes into account multiple
perspectives. This makes our measure more robust than, for instance, a simple supervisor’s ratings where one
individual provides evaluations of all his/her subordinates. Fourth, since this measure is based on the
evaluations of ego made by his/her alters it has the additional advantage of not being a self-reported measure.
This allows for mitigating possible issues of common method variance in the analysis, since the other
independent variables of interests (e.g. exchange of information, type of knowledge sourced from outside,
etc.) are based on self-reported measures2. Taken together, we believe that our measure for catalyst of
innovation is consistent with our theoretical conceptualization.
1 The exact transformation is ln(e + p), where e is a constant and p = the number of patent applications. Thus, a researcher who applies for 0 patents and assesses a particular colleague as a 5 on the catalysts scale would yield a rating of 5, a researcher who applies for 1 patent and assesses a particular colleague as a 5 on the catalysts scale would yield a rating of 6.57, a researcher who applies for 2 patents and assesses a particular colleague as a 5 on the catalysts scale would yield a rating of 7.76, etc. 2 As a robustness check, we ran several additional analyses based on catalyst measures that were calculated in different ways. One possible objection to the use of our catalyst measure is that in-degree only considers local (i.e., direct) connections and does not take into account the general perceptions of an individual as a catalysts that is prevalent in the broader social structure of the organization studied. To address this concern, we used Bonacich’s centrality (Bonacich, 1987) to measure the extent to which individuals are recognized as catalysts of innovation. One of the advantages of Bonacich’s centrality is that in addition to evaluations made by direct connections, it also takes into account catalysts’ evaluations provided by indirect connections through the beta parameter. When using Bonacich’s centrality computed on the transpose of the catalysts matrix “C” we obtained substantively similar results to those presented in Table 4. In addition, we also estimated our models using un-weighted in-degree centrality to measure catalysts, which also produced results that are consistent with those reported in Table 4.
15
In addition to the theoretical consistency of our catalyst measure, we also thought it was important to
assess the measure’s empirical properties. To our knowledge, the concept of the innovation catalyst is novel,
and certainly our proposed indicator of the catalyst role is heretofore untested in its psychometric properties.
While in depth psychometric analysis of this measure is beyond the scope of this paper, we did explore two
properties of this measure that are generally considered critical in measurement theory: convergent and
discriminant validity (Campbell & Fiske, 1959; Urbina, 2004, p. 180). That is, we explore the question of
whether our measure of innovation catalysts converges on independently measured indicators that being a
catalyst should predict; and we explore whether our measure of catalysts adequately discriminates from other
potentially confounding but different constructs.
Discriminant validity. A catalyst is one who inspires others toward innovation. One could argue,
though, that innovators themselves are seen as fountains of ideas, that these ideas inspire others to be
innovative. Perhaps being a proficient innovator is both necessary and sufficient to be a catalyst. If this were
the case, then being a catalyst would add nothing more than being an innovator; and the concept of the
catalyst would provide little insight into the innovation process. While it is possible that some catalysts may
be innovators, our argument about the role of the catalyst does not require the person to be an innovator
him/herself. Thus, we would expect that some, but not all, innovators would be catalysts. Conversely, we
would expect that some, but not all, catalysts will be innovators. Thus, the extent to which identification as a
catalyst and identification as an innovator are relatively unrelated to each other is an indication that the two
roles are distinct concepts and provides evidence to support the discriminant validity our measure of catalyst
relative to innovation itself.
Table 1 shows the relationship between the roles of catalysts and innovators. Of the 276 researchers,
39 (14%) are designated as catalysts; 21 (8%) are designated as innovators. As can be seen, the overlap
between catalysts innovators is minimal (1.5% or 4 individuals out of 276 are both innovators and catalysts).
The majority of innovators are not catalysts (i.e. 17/21 or approximately ~ 81% of innovators are not
catalysts) and the majority of catalysts are not innovators (i.e. 35/39 or approximately ~ 90% of catalysts are
not innovators). More telling, the proportion of innovators who are catalysts is 19% (4/21), which is not
16
substantially higher than the proportion of non-innovators who are catalysts (14%, or 35/255). A similar
account is found if we look at the proportion of catalysts who are innovators: 10% (4/39) of the catalysts are
also innovators, only slightly higher than the 7% (17/237) of non-catalysts who are innovators. The point
biserial correlation between these two constructs is 0.13. This is safely below the commonly used threshold
of .8 to establish discriminant validity between two constructs (values above .8 are often interpreted as
suggesting a lack of discriminant validity). Indeed, a chi-square test of independence (χ2=.12, p>.7) indicates
there is no significant relationship at all between these two measures. Being a catalyst is clearly distinct from
being an innovator.
****Table 1 and Figure 1a/1b about here****
Convergent validity. Perhaps even more important, though, is whether the instrument adequately
assesses the underlying construct it purports to measure. Several types of convergence of the measure with
its underlying construct are typically used to evaluate how good the measure is. We have access to two types
of convergent validity tests. First, a construct has “face validity” if, by virtue of its specific wording on a
questionnaire, it appears to be related to the underlying construct. The face validity is evident in our case,
since respondents are asked directly whether the target is a catalyst in innovation.
A second, more critical, test of convergent validity, however, is whether the measure empirically is
associated with what it is theoretically supposed to capture – that is, whether it has what Anastasi and Urbina
(1997) refer to as “criterion-prediction validity” (p. 188). If an individual colleague is truly a catalyst, then
those researchers who are connected to that catalyst should be more innovative than those researchers who
have no direct tie to such a catalyst. To test this, we examined the innovative productivity of researchers who
were directly connected to a catalyst in their network, comparing this to the productivity of researchers who
had no such catalyst in their local network.
The results of this comparison are reported in Figure 1a and Figure 1b. Figure 1a uses the patent-
weighted specification of the catalyst measure as described above, while Figure 1b identifies catalysts as
simple in-degree of the “C” matrix (i.e. without patent weighting). For ease of exposition we refer below to
the patent-weighted specification of the catalysts measure, results obtained considering the un-weighted

17
specification of catalysts are substantially similar. While the number of catalysts in the R&D division was
relatively small (less than 15% of the sample in either specification), each of these catalysts connected to a
number of researchers. Thus their catalytic benefits spread to a larger number of colleagues than their small
numbers would imply. Of the 276 researchers, 185 (67%) enjoyed the benefit of having at least one catalyst
in their local network. The remaining 55 (33%) were not connected to any catalysts. The difference between
these two sets was substantial. As shown in Figure 1a and b, those who were connected to a catalyst were
almost twice as productive as those who had no catalysts in their local network. This difference is significant
as well as substantial (t = 2.19, p < 0.015, one-tailed)3.
Independent Variables
The social network measures used as independent variables in the analysis are based on knowledge
and information exchange relationships. The following two questions were used to capture information
exchange relationships: “Please indicate how often you generally go to this person for information or
knowledge on work-related topics” and “Please indicate how often this person generally comes to you for
information or knowledge on work-related topics.” Respondents were asked to answer these questions on a
one-to-five scale, one being “seldom” and five being “very frequently”. Following Krackhardt (1990)4, we
derived a matrix of confirmed information exchange relationships based on the combination of entries in the
“go to for information” matrix with the transpose of the “come to you for information” matrix. This allowed
us to retain only those relationships for which both parties involved agree that one goes to the other for
knowledge or information.
3 Results reported in Figure 1a/1b are further corroborated by more comprehensive regression models in which, to establish the relationship between having catalysts in the ego-network and number of patents generated we controlled for individuals’ job grade, gender, level of education, seniority, network size, size of the laboratory and size of area of technological expertise in which the focal node belongs. In particular, while controlling for these covariates, we observed that having at least 1 catalyst of innovation in the ego-network is significantly associated with patenting output at p < 0.019 level. 4 This confirmation technique is commonly used in network research to increase the reliability of relational measures (Krackhardt, 1990; Hansen, 1999). As both matrices are valued, the exchange of information matrix considers, for each confirmed relationship, the average of the go-to and the (transposed of) the come-to matrices. Unconfirmed relationships are set equal to zero. In a series of robustness checks, we obtained substantively similar results when calculating network redundancy based on unconfirmed ties (i.e. ties reported in the go-to matrix only).

18
Network Redundancy. In general terms, network redundancy refers to the situation in which ego’s
alters are also themselves connected. To measure redundancy in our particular case, we used the algorithm
implemented in Ucinet 6 (Borgatti, Everett, and Freeman, 2002), computed on the confirmed exchange of
information matrix described above. As described in detail in Borgatti (1997), for each ego in the network this
measure represents the average within ego-network degree of alters and expresses the extent to which each of
ego’s alters are tied to ego's other alters. Network redundancy can be expressed as 2t/n, where t is the number
of ties in the network (not counting ties to ego) and n is the number of nodes excluding ego. Greater values
of redundancy indicate that the individuals’ ego-network is mostly composed of contacts that are themselves
connected to each other, whereas lower levels of redundancy indicate that the individuals’ ego-network is
mostly composed of contacts that are not connected to each other. We entered these values into a squared
matrix (i.e., the redundancy matrix, R).
External Knowledge Diversity. External knowledge sources were defined after extensive interviews with
senior researchers at the company prior to data collection and were subsequently approved by a panel of
senior managers. The final set of knowledge sources include: conferences, scientific journals, patents,
collaboration with research institutions, relationships with clients, relationships with suppliers, funded
projects, and standardization committees. Respondents were asked to rate on a scale from 1 to 7 (1 being
‘not at all’ and 7 being ‘to a very large extent’) “the extent to which each item represented for them an
important source of scientific and/or technological knowledge for their professional activity at <name of the
company>.”
A principal component factor analysis with varimax rotation performed on the external knowledge
items identified two distinct factors with eigenvalue > 1: scientific external knowledge and industrial external
knowledge5. As shown in Table 2 below, industrial external knowledge is defined by four items with a
Cronbach’s alpha of .77, and the first principal component explained 63.2 percent of the variance. Scientific
external knowledge is also defined by four items with a Cronbach’s alpha of .81, and the first principal
component explained 58.4 percent of the variance.
5 The same results were obtained using an oblique rotational strategy.

19
***Insert Table 2 about here***
We captured heterogeneity in the type of knowledge sourced from outside the organization based on the
combination of scientific vs. industrial sources of knowledge accessed by individuals in our sample6. We
measured the diversity of knowledge available in each ego network i as composed of two parts.
First we identify the diversity of external knowledge sources between each pair of individuals in our sample
by computing the matrix D:
where Si (Sj) is the reliance of individual i (j) on scientific sources of external knowledge and Ii (Ij) is the
reliance of individual i (j) on industrial sources of external knowledge7. The term dij in the D matrix in
equation (1) expresses for each possible dyad, similarity (or differences) in the combination of external
knowledge that the members of that dyad access from outside the organization.
The next step was to measure the diversity of external knowledge available in each ego-network by taking the
average of alter-alter knowledge differences for all the contacts available in that ego-network. We entered
these values in the K matrix. The generic element kij in the matrix K is described in equation (2) and reports
for each alter in a given ego-network i, the average knowledge differences among alter j and all the other
alters q in the ego-network i.
Finally, to obtain the measure of external knowledge diversity for each ego-network i (based on the alter-alter
knowledge differences described above), we summed the values k across all the js in i’s ego-network and
divided by the number of alters.
6 In the reported analysis we use the average of the respective four items to identify scientific and industrial external knowledge. Our results don’t vary when using factor scores instead of averages to measure scientific and industrial external knowledge. 7 In additional analysis not reported here we obtained the same results adjusting the dij term for the total amount of external knowledge available in each dyad (i.e. multiplying each term dj in the D matrix by the term tij = Si+Sj+Ii+Ij/Max(Si+Sj+Ii+Ij).
)1(22 jiIISSD jiji
)2()1(
2
,
qjdNN
kiEgoqj
qjegoego
ij

20
R-K Index (Diverse Knowledge Clique). In the theory section we argued that being embedded in a diverse
knowledge clique is positively related with the extent to which individuals are recognized as catalysts of
innovation by their colleagues. To test this hypothesis we created a measure to indicate the extent to which
knowledge diversity and network redundancy coincide in the dyads of an individual’s ego-network. In
particular, if R is the matrix with dyadic redundancy values (i.e. expressing the extent to which each alter
represents a redundant contact for ego) and K is the knowledge diversity matrix composed of the elements
described in equation 2 (i.e. expressing the amount of external knowledge diversity that each alter brings to
ego), we obtained a newly defined matrix, B, by performing an element-wise multiplication of the values
reported in the matrices R and K. In this way we adjusted the redundancy score of each alter in a given ego-
network by the amount of knowledge diversity s/he provided to ego. Summing the values reported in the B
matrix across all alters, we obtained a measure describing the extent to which each ego in our sample is
embedded in a redundant structure which is, at the same time, rich in diverse external knowledge. In the
analyses that follow we refer to this measure as the “R-K Index,” formally defined as:
A possible objection to this approach is that instead of equation (3) which weights each alter’s
redundancy by the diversity of knowledge s/he provides, our theory could be tested with a simple interaction
term between the two “main effects”, network redundancy and knowledge diversity considered at the ego-
network level. Although a conventional interaction term obtained by multiplying the overall network
redundancy and overall knowledge diversity measured at the ego-network level of analysis has the virtue of
)3( j
i KRBb
j
ijego
i akN
EgoinDiversityKnowledgeExternal )2(1

21
simplicity, it also has the disadvantage of producing ambiguous values for our purposes8. Specifically, an
interaction term defined at the ego-network level of analysis clouds the extent to which contacts that are
redundant are also characterized by diverse knowledge among themselves – the very distinction we seek to
highlight. For instance, an interaction term between network redundancy and knowledge diversity considered
at the level of the ego-network could yield the same result for an ego-network in which the most redundant
contacts provide the most diverse knowledge and an ego-network in which the most redundant contacts
provide the least diverse knowledge. However, based on our theorizing, the extent to which redundant
contacts provide diverse knowledge to ego is more accurately captured at the level of the specific dyads and
then aggregated up at the level of the ego-network (Reagans and Zuckerman, 2001: 508-509) rather than
obtained through an ego-network interaction between overall redundancy and overall knowledge diversity.
Implicit in our theory and prediction is the assumption that knowledge diversity and network
redundancy are distinct, rather than isomorphic as much previous social network research has treated them.
To validate this assumption, we calculated at the dyadic level the correlation between knowledge diversity and
network redundancy. We calculated the dyadic correlation using QAP (Krackhardt 1988) and found a very
modest and not statistically significant association (p = 0.079, n.s.). We find similar results computing a
standard Pearson correlation between dyadic-level knowledge diversity and network redundancy (r = 0.014,
n.s.). These results suggest that it is not only appropriate, but also more precise, to treat knowledge diversity
and network redundancy as distinct.
Controls. In each model we control for several covariates that might provide alternative explanations
for the hypothesized effect of external knowledge and social structure on individual’s contribution to the
innovative process. In particular, we use organizational seniority (i.e. days since hiring/100) to control for the
fact that individuals with longer tenure have had more time to “prove themselves” useful in the innovative
process relative to someone newly hired. Members of the organizations with more seniority might also have
more “network-leverage” than those newly hired. We also control for education (1-to-4 scale, from High
8 Running the analysis with a simple interaction term computed at the node level of analysis yields a positive but not significant coefficient (p=0.698). The lack of significance is consistent with our view that a node-level interaction term does not discriminate ego-network effects due to network redundancy versus knowledge heterogeneity.
22
School degree to PhD degree) since individuals with PhDs likely have a higher research potential than people
with less advanced degrees, and this might translate into a higher potential for contributing to the generation
of innovations independent of the social network in which they are embedded. Organizational job grade could
also be an alternative explanation for the relationship hypothesized in our model. Individuals with higher
positions in the organization have presumably a record of being successful in the field of research and
development that led to their career advancement, and individuals with higher positions in the organization
are also often tasked with mentoring and assisting junior colleagues in their research efforts, which is akin to
being a catalyst. Here we use the 9-point scale adopted in the company to identify 9 different formal levels.
We also control for confounding effects provided by contextual features. For instance the size of the laboratory
(number of people) is an important covariate of networking opportunities: bigger laboratories offer more
contacts and afford greater visibility than smaller ones. Similarly, we use dummy variables to control for
differences in labs, and individuals’ areas of technological expertise. Finally, we control for the type of
external knowledge sourced by ego distinguishing between scientific and industrial external knowledge, and for
number of contacts in each ego network based on out-degree in the knowledge sharing network (network size)
since individuals with more contacts might have more opportunities to access knowledge and information
that could increase their ability to act as catalysts of innovation independent of the proposed theoretical
mechanisms.
ANALYSIS AND RESULTS
Descriptive statistics and correlations among all variables are reported in Table 3. We used a set of
OLS regressions to evaluate the effects of internal social structure and external knowledge sources on
individuals’ ability to help their colleagues generate new ideas and creative solutions. Table 4 presents
regression coefficients, standard errors, R-squared, and adjusted R-squared. Model 1 estimates the effects of
the control variables. Among the controls, job grade, scientific external knowledge (only marginally so), and
network size are significantly associated with our dependent variable. Occupying a high position in the formal

23
organization of the R&D division, accessing scientific knowledge from outside the organization, and having a
large network of contacts are positively associated with being recognized as a catalyst of innovation.
In Model 2 we introduce external knowledge diversity which is positively and significantly associated
with being recognized as a catalyst of innovation. This suggests that there are direct benefits of having
relationships with contacts that source diverse types of knowledge from outside the organization. Model 3
introduces internal network redundancy which is negatively and significantly associated with being recognized
as a catalyst of innovation. The negative effect of network redundancy is consistent with prevailing
theoretical accounts for the “vision” advantage (Burt, 1992; Burt, 2004) associated with non-redundant
network structures, or conversely that there are limited informational and knowledge advantages associated
with redundant network structures. In model 4 we include both external knowledge diversity and internal
network redundancy in the same equations obtaining the same results. Model 5, finally, introduces the effect
of the R-K Index in which the redundancy of each contact is weighted by the heterogeneity of external
knowledge provided by that contact. As predicted in our main hypothesis, being embedded in a redundant
structure in which individuals have access to diverse sources of knowledge is positively and significantly
associated with being identified as a catalyst of innovation. In particular, comparing the effect of network
redundancy with the effect of the R-K Index, we observe that the effect of the latter is more than half the size
of the effect of the former. One standard deviation increase in network redundancy translates in a 0.56
standard deviation decrease in individuals’ ability to act as an innovation catalyst, while one standard deviation
increase in the R-K Index translates in a 0.42 standard deviation increase in an individuals’ ability to act as a
catalyst of innovation. As a further check we estimate Model 6 using the un-weighted specification of the
catalysts’ measure as dependent variable (i.e. the simple in-degree centrality of matrix “C”). The fact that
results are virtually identical to those reported in Model 5 suggests that the patent-weighting used to identify
catalysts of innovation does not appear to be biasing our results in any direction.
*** Table 3 and 4 about here ***
Robustness checks. In addition to the OLS models presented in Table 4, given the potential for non-
independence of observation within labs or within areas of technological expertise, we reran all the analysis
24
clustering observations by lab and by areas of technological expertise. Since social interactions among
individuals are more likely within rather than across organizational or technological boundaries, it is possible
that social network data provided by individuals located in the same lab or working in the same technological
area do not satisfy the requirement of independence of observation imposed by OLS estimation techniques.
Individual responses about their networks’ ties and about their colleagues’ role as facilitators in the generation
of new ideas and solutions might in fact be more similar within than across laboratories or areas of
technological expertise, and this can potentially bias the results of traditional OLS models. A two-way
clustering (by laboratories and by areas of technological expertise in our case) provides robust variance
estimates that adjust for within-cluster correlation and thus controls for the potential non-independence of
observations (Cameron, Gelbach and Miller, 2011; Kleinbaum, Stuart and Tushman, 2013). Adopting this
modeling technique we obtained the same results as those presented in Table 4. This provides important
evidence for the robustness of the findings presented in this paper. In addition to two-way clustering, our
findings are also robust to other modeling techniques such as robust regression and regression with robust
standard errors.
Additional analyses not reported here show that multicollinearity does not affect our results. As a
rule of thumb, multicollinearity is an issue when a predictor has a variance-inflation factor (VIF) larger than
10 (Belsley, Kuh, and Welsch, 1980). In the final model of Table 4, the average VIF is 2.03 with the largest
value of 4.28 for the effect of external knowledge diversity. We also checked for heteroscedasticity using a
Breusch-Pagan test. The results of the test confirmed the constant variance of residuals (Chi2=1.38, p=0.24).
In one last set of analysis not reported here, we control for the possibility that catalysts’ evaluation
might be due to homophily/similarity between the parties involved and/or to individuals’ previous track-
record as innovators. Regarding the first point, for instance, there might be a tendency to recognize as
catalysts individuals from the same occupational cohort, or within the same job grade, or with the same
educational degree. To dispel the possibility of biases in catalyst evaluations due to homophily-based
explanations, we computed for each ego-network similarity measures for each of the three attributes
discussed above (seniority, job grade, level of education). Our results are unchanged when adding these
25
additional controls in our models. With regard to the second point, to capture individuals’ previous track-
record as innovators, we also controlled for the number of patents generated by individuals in the sample in
the three years before the collection of network data. Consistent with the discriminant validity analysis
presented above, this covariate is not statistically associated with our catalyst measure (p = 0.581) and our
results remain unchanged when this variable is introduced.
Endogeneity and reverse causality. Due to the cross-sectional nature of the data, the potential for
endogeneity and reverse causality are two important concerns. Individuals that play a critical role in
enhancing their colleagues’ innovativeness may have idiosyncratic characteristics (experience, talent, abilities,
expertise, etc.) that could explain their ability to generate innovations and could also explain, at the same time,
their position in the overall social structure. For instance, more skilled/knowledgeable individuals might be
more helpful in the innovative process and might also end up occupying network positions that further their
ability to help their colleagues in the innovative process. Within the limitations of a cross-sectional design we
took all possible actions to reduce the potential risks of endogeneity. Consistent with previous research on
social networks and knowledge management (Reagans and Zuckerman, 2001; Reagans and McEvily, 2003),
we used individual level covariates to control for unobserved differences in individuals’ knowledge, ability,
experience, and expertise, which may affect their capacity to contribute to the generation of innovations. The
fact that the effects of the network variables persist and remain statistically significant with the inclusion of
these controls enhances our confidence in the validity of the results. At the same time though, it is important
to acknowledge that without the ability to lag our dependent variable or to instrument our explanatory
variables (Wooldridge, 2002: 50-51), we cannot definitively rule out the possibility that unobserved variables
might affect our results.
In addition to exploring the possibility of unobserved heterogeneity, we also attempted to address the
issue of reverse causality. Indeed, given our cross-sectional design, one might argue that the hypothesized
effect of social structure and knowledge diversity on individual’s ability to act as a catalyst of innovation runs
in the opposite direction to what we predicted (i.e. being a catalyst of innovation affects individuals position
in the social structure and access to diverse knowledge). If this was the case, the frequency of interactions

26
should be biased toward individuals widely recognized by their colleagues as catalysts of innovation, since
there should be a tendency to favor interactions with those who have a positive reputation for their role as
catalysts of innovations versus those who do not enjoy such reputation. To address this issue, as a robustness
check, we computed a version of our dependent variable based only on a subset of the relational evaluations
used to derive the original measure. In particular, for each ego in the analysis we recomputed our dependent
variable after removing the evaluations received from those alters who frequently interact with ego. 9 The
results obtained with this different operationalization of our measure of catalyst of innovation are exactly the
same as those obtained with the original specification of the dependent variable. This provides some
indication that reverse causality does not appear to affect the results of the analysis in terms of biasing
frequency of interaction in favor of more innovative individuals.
One last element that mitigates concerns of reverse causality is given by the pattern of results
obtained. In Table 4 we observe that the direct effect of network redundancy is negative, while the effect of
the R-K Index is positive. The change in the sign of the coefficients between network redundancy and
network redundancy adjusted for knowledge diversity would appear to be difficult to explain based on
reverse-causality. If reverse causality were operating in our analysis, it is not clear why taking into account the
type of knowledge exchanged through network ties would change the sign of the network redundancy
measure. In fact, if reverse causality were operating in our context, we would expect the relationship between
network redundancy and being a catalyst of innovation to be the same independent of the type of knowledge
exchanged among individuals.
DISCUSSION
Being able to support and inspire others’ innovativeness is critical because it is at the core of the
social and collective nature of the innovative process. Yet, research on social structure and innovation has
primarily focused on the role of innovators and on the knowledge and structural conditions that promote and
support the development of this role.
9 We categorized as high frequency those interactions among ego and alters that were rated greater than 3 on the 1 to 5 scale for information sharing.

27
While a considerable body of research on organizational innovation has focused on the role of
innovators and the conditions affecting their productivity, we join a growing stream of research suggesting
that in addition to innovators, there is an ecology of roles that support the innovation process that are seldom
considered (Hargadon and Bechky 2006; Ibarra 1993; Obstfeld 2005). Among those, the role of catalyst is
particularly important because it gets at the core of the social and collective nature of the innovative process
which has highlighted that the myth of the lone inventor is, to a certain degree, just that (Hargadon 2003).
Ironically though, while acknowledging that innovators are not alone in the pursuit of the innovative process,
the majority of research in this area has remained relatively silent about the supporting roles that exist and
under what conditions such supporting roles are more likely to emerge.
Catalysts of innovation are one specific example of the “less visible” but still critical role that
individuals play in the process leading to the generation of innovations in organizations, and therefore it
deserves to be explicitly studied. Clearly different roles might require different enabling conditions in terms
of access to knowledge and position in the social structure. For instance, previous network research has
suggested that brokers are ideally positioned to act as innovators since they benefit from access to diverse
sources of knowledge (Perry-Smith, 2006; Burt, 2004) and, at the same time, enjoy relative freedom to pursue
their own goals and objectives thanks to their network positions rich in bridging opportunities (Burt, 1992).
Catalysts of innovation, however, while still requiring access to diverse knowledge and information to inspire
creativity in others, differ from brokers, in that rather than pursuing independently the generation of
innovation, are willing to provide knowledge inputs to help their colleagues be more innovative. In structural
terms, we identified the condition of being embedded in a diverse knowledge clique as being associated with
an individuals’ ability to successfully act as a catalyst of innovation.
Our research further provides evidence for the fact that innovation catalysts are distinct from
innovators, not just in terms of knowledge and structural positions, but, most importantly in terms of actual
innovative output generated. Identifying innovators based on the number of their patent applications, our
analysis shows that innovators and catalysts are two distinct roles, such that there is no statistically significant
overlap between these two categories in the empirical context studied. Finally, our analysis also shows how
28
the role of innovation catalysts is consequential for innovators’ ability to generate patent applications. In
particular, being connected to a catalyst is associated with researchers applying for a greater number of
patents.
In addition to introducing the role of catalysts and distinguishing it from that of innovators, our
study also suggests the importance of treating as distinct the type knowledge individuals access through their
contacts and the structural configuration of the contact network in which individuals are embedded. For
instance, when the type of knowledge flowing through network ties is not explicitly considered, our results
suggest that being embedded in a cohesive network structure has a negative impact on individuals’ ability to
act as innovation catalysts. This result is consistent with previous research on social networks and
organizational innovation that have observed a negative association between being embedded in redundant
social structures and various indicators of innovation in organizations (Models 3-5). When considering the
impact of the R-K Index we observed a positive effect on an individual’s ability to contribute to the
innovative process by helping others being more innovative (Model 5). Thus, while the assumption of
isomorphism between the distribution of network ties and the type of knowledge has been widely accepted by
social network and organizational scholars, we join an emerging line of research that has begun to explore the
extent to which this assumption holds uniformly (Fleming, Mingo, and Chen, 2007; Rodan and Galunic
2004). We complement this stream of research by examining a different innovation outcome (i.e., playing the
role of catalyst) and by considering a different element of knowledge diversity (i.e., external knowledge).
Taken together these studies along with the present research suggest that the degree of correspondence
between network structure and knowledge diversity may vary across different empirical contexts and should
not be assumed to be perfectly aligned in all circumstances. Future research in this area could evaluate how
unusual configurations of knowledge and networks, such as diverse knowledge cliques, affect other
innovation-related outcomes, or innovation related roles in addition to individuals’ ability to act as catalysts.
In addition to other innovation-related outcomes, we also see the relationship between the catalyst
role and other organizational outcomes as an interesting avenue to pursue. Emphasizing the variety of roles
that support the innovation process is also an important way of gaining a better understanding of the
29
underlying causal mechanisms linking social networks and innovation in a way to inspire new managerial
practices and improve on current ones. For instance, one practical implication of our study could be in the
re-design of team composition in a way to promote closer interactions among individuals with different
knowledge orientation. Perhaps, investing in the formation of such teams, might not immediately result in the
generation of innovations per se, but would likely promote the emergence of catalysts’ role that could help,
indirectly, in the process leading to the generation of innovation. Moreover, iIn this study we exclusively
studied the catalyst role in the context of organizational innovation. We believe, however, that the role
potentially extends to other critical organizational processes and outcomes such as change (Battilana and
Casciaro, 2013), growth (McEvily, Jaffee, and Tortoriello, 2012), and performance (Galunic, Ertug and
Gargiulo, 2012) and that the way to improve individuals’ ability to get things done in different organizational
realms, could pass through the development of supporting roles that emerge out of close interactions among
individuals with different knowledge and skill sets.
LIMITATIONS AND FUTURE DIRECTIONS
The implications of this research should be considered within the confines of the study’s limitations.
One limitation is the measure used for the outcome variable. While the measure is consistent with the theory
proposed, it is based on a single item, which might raise questions about the precision of the instrument.
Future studies could advance our understanding of the potentially multifaceted role of innovation catalysts.
A second limitation concerns our measure of knowledge heterogeneity. While we have measured
knowledge heterogeneity in terms of differences between external sourcing of scientific and industrial
knowledge, knowledge diversity could also be operationalized in other ways. The distinction adopted here is
both very general and context specific. It is context specific because, while distinguishing between industrial
and scientific knowledge could be important in R&D divisions of large organizations, it might not be as
salient in different organizational units (e.g. manufacturing). This distinction is also very general because
within both realms of scientific and industrial knowledge there are obviously several distinct content areas
that introduce additional elements of heterogeneity that we are not capturing. Even though we considered it

30
encouraging to observe the hypothesized effects on catalysts’ roles when using two broad dimensions such as
scientific and industrial knowledge, taking into account additional specifications of knowledge diversity would
help to generalize the validity of our findings.
Finally, while we focused on the structural drivers of individuals’ ability to fulfill the role of
innovation catalysts, it would be valuable to consider the extent to which there are different types of catalyst
roles and the extent to which the effectiveness of each role varies across different contexts. For instance,
individuals in organizations can help their colleagues improve on their performance by inspiring and
encouraging them to pursue certain directions, or by offering them tangible resources and inputs, or by
constantly criticizing and finding problems in what they do. Our goal with this paper was to bring attention to
the role of catalysts with the hope of inspiring future research to further our understanding of the
contingencies and mechanisms that drive the effectiveness of different catalyst roles.
CONCLUSIONS
Organizational innovation is increasingly coming to be understood as a collective, rather than
exclusively individual, activity. Research on the social structure of innovation has contributed greatly to
advancing our understanding of the collective nature of the innovative process. Apart from considering the
different network configurations and positions that are central to the generation of innovations in
organizations, we would stress the importance of identifying and understanding the ecology of roles involved
in this essential organizational activity. This study provides an initial effort in this respect by focusing on
catalysts and the social structural conditions conducive to performing this role. We hope that future research
will build on these insights and further advance our understanding of the collective nature of organizational
innovation.
REFERENCES Anastasi, A., S. Urbina (1997). Psychological Testing (Seventh ed.). Upper Saddle River (NJ): Prentice Hall.

31
Battilana, J., Casciaro, T., (2013). Overcoming resistance to organizational change: strong ties and affective cooptation. Man Sci, 59(4): 819-836. Belsley, D.A., E. Kuh, R.E. Welsh. 1980. Regression Diagnostics: Identifying Influential Data and Sources of Collinearity. Wiley, New York. Bonacich, P. 1987. Power and centrality: a family of measures. American Journal of Sociology 92(5) 1170-1182. Borgatti, S.P. 1997. Structural holes: unpacking Burt's redundacy measures. Connections 20(1) 35-38. Borgatti, S.P., M.G. Everett, L.C. Freeman. 2002. UCINET 6 for Windows: Software for Social Network Analysis. Analytic Technologies, Harvard. Borgatti, S.P., R. Cross. 2003. A relational view of information seeking and learning in social networks. Manage. Sci. 49(4) 432-445. Burt, R.S. 1992. Structural Holes: the social structure of competition. Harvard University Press, Cambridge, MA. Burt, R.S. 2004. Structural holes and good ideas. American Journal of Sociology 110 349-399. Burt, R.S. 2005. Brokerage and Closure: An Introduction to Social Capital., Oxford University Press. Cameron AC, Gelbach JB, Miller DL. 2011. Robust Inference with Multi-way Clustering. Journal of Business and Economic Statistics 29(2): 238-249. Campbell, D.T., D.W. Fiske, (1959). Convergent and discriminant validation by the multitrait-multimethod matrix. Psychological Bulletin, Vol 56(2): 81-105 Carlile, P.R. 2004. Transferring, translating, and transforming: an integrative framework for managing knowledge across boundaries. Organ Sci. 15(5) 555-568. Carlile, P.R., E.S. Rebentisch. 2003. Into the black box: the knowledge transformation cycle. Manage. Sci. 49(9) 1180-1195. Chesbrough, H. 2003. Open Innovation. Harvard University Press, Cambridge, MA. Cohen, W.M., D.A. Levinthal. 1990. Absorptive capacity: A new perspective on learning and innovation. Adm. Sci. Q. 35 128-152. Coleman, J.S. 1988. Social capital in the creation of human capital. American Journal of Sociology 94 95-120. Cramton, C. 2002. Finding common ground in dispersed collaboration. Organ. Dyn. 30(4) 356-367. Cummings, J.N. 2004. Work groups, structural diversity, and knowledge sharing in a global organization. Manage. Sci. 50(3) 352-364. Ellis, H.C. 1965. The transfer of learning. MacMillan, New York. Fleming, L., S. Mingo, D. Chen. 2007. Collaborative brokerage, generative creativity, and creative success. Adm. Sci. Q. 52 443-475.
32
Freeman, L. C., Romney, A. K., & Freeman, S. C. 1987. Cognitive structure and informant accuracy. American Anthropologist, 89: 310-325. Granovetter, M. (1983). The strength of weak ties: A network theory revisited. Sociological theory, 1(1), 201-233. Galunic, C., Ertug, G., & Gargiulo, M., (2012). The positive externalities of social capital: benefiting from senior brokers. Acad. Manage. J. 55(5): 1213-1231 Haas, M. 2006. Acquiring and applying knowledge in transnational teams: the roles of cosmopolitans and locals. Organ Sci. 17(3) 367-384. Hansen, M. 1999. The search-transfer problem: the role of weak ties in sharing knowledge across organization subunits. Adm. Sci. Q. 44 82-111. Hargadon, A. 2002. Brokering knowledge: linking learning and innovation. B.M. Staw, R.M. Kramer, eds. Research in Organizational Behavior. JAI Press, Greenwich, CT. Hargadon, A. 2003. How Breakthroughs Happen: The Surprising Truth About How Companies Innovate. Harvard Business School Press, Boston, MA. Hargadon, A., B.A. Bechky. 2006. When collections of creatives become creative collectives: a field study of problem solving at work. Organ Sci. 17(4) 484-500. Hargadon, A., R.I. Sutton. 1997. Technology brokering and innovation in a product development firm. Adm. Sci. Q. 42 716-749. Huber, G.P., K. Lewis. 2010. Cross-Understanding and Shared Social Theories. Academy of Management Review 36, 422-424. Ibarra, H. 1993. Network centrality, power, and innovation involvement: determinants of technical and administrative roles. Acad. Manage. J. 36 471-501. Kleinbaum AM, Stuart TE, Tushman ML. (2013). Discretion within constraint: Homophily and structure in a formal organization. Organization Science 24(5): 1316-1336. Krackhardt, D. 1988. Predicting with networks: a multiple regression approach to analyzing dyadic data. Social Networks 10 359-381. Krackhardt, D. 1990. Assessing the political landscape: structure, cognition, and power in organizations. Adm. Sci. Q. 35 342-369. Laursen, K., A. Salter. 2006. Open for innovation: the role of openness in explaining innovation performance among U.K. manufacturing firms. Strateg. Manage. J. 27 131-150. Marsden, P.V. 1990. Network data and measurement. Annu. Rev. Sociol. 16 435-463. Martin, R. L. (2011). The innovation catalysts. Harvard Business Review, 89(6), 82-87. McEvily, B., Jaffee, J., & Tortoriello, M. (2012). Not all bridging ties are equal: Network imprinting and firm growth in the Nashville legal industry, 1933–1978. Organ Sci, 23(2), 547-563. Obstfeld, D. 2005. Social networks, the tertius iungens orientation, and involvement in innovation. Adm. Sci. Q. 50 100-130.
33
Perry-Smith, J.E. 2006. Social yet creative: the role of social relationships in facilitating individual creativity. Acad. Manage. J. 49 85-101. Phelps, C., Heidl, R & A. Wadhwa, 2011. Networks, knowledge, and knowledge networks: A critical review and research agenda. Journal of Management 38 (4), 1115-1166 Reagans, R., B. McEvily. 2003. Network structure and knowledge transfer: The effects of cohesion and range. Adm. Sci. Q. 48(2) 240-267. Reagans, R., B. McEvily. 2008. Contradictory or compatible? Reconsidering the tradeoff between brokerage and closure on knowledge sharing. J.A.C. Baum, T.J. Rowley, eds. Advances in Strategy Management: Vol(25). Reagans, R., E. Zuckerman. 2001. Network, diversity and performance: The social capital of R&D units. Organ Sci. 12 502-517. Rodan, S., C. Galunic. 2004. More than network structure: how knowledge heterogeneity influences managerial performance and innovativeness. Strateg. Manage. J. 25 541-562. Simon, H.A. 1985. What we know about the creative process. R.L. Kuhn, ed. Frontiers in Creative and Innovative Management. Ballinger, Cambridge, MA, 3-20. Sosa M.E., 2011. Where Do Creative Interactions Come From? The Role of Tie Content and Social Networks. Organ Sci. 22(1) 1-21. Tortoriello, M. (2014) “The social underpinnings of absorptive capacity: The moderating effects of structural holes on innovation generation based on external knowledge. Strateg. Manage. J. Article first published online: 12 Feb 2014, DOI: 10.1002/smj.2228 Tortoriello, M., & Krackhardt, D. (2010). Activating cross-boundary knowledge: the role of Simmelian ties in the generation of innovations. Academy of Management Journal, 53(1), 167-181. Tortoriello, M., Reagans, R., & B. McEvily (2012) “Bridging the knowledge gap: the influence of strong ties, network cohesion, and network range on the transfer of knowledge between organizational units” Organ Sci 23(4)1024-1032. Urbina S. 2004. Essentials of Psychological Testing. John Wiley & Sons, Inc. Uzzi, B. 1997. Social structure and competition in interfirm networks: the paradox of embeddedness. Adm. Sci. Q. 42 35-67. Wooldridge, J.M. 2002. Econometric Analysis of Cross Section and Panel Data. The MIT Press, Cambridge, MA. Zahra, S.A., G. George. 2002. Absorptive capacity: A review, reconceptualization, and extension. Acad. Manage. Rev. 27(2) 185-203.

34
Table 1 – Comparing Catalysts and Innovators’ roles.
Low score High score total
High score 17 (6.2%) 4 (1.5%) 21 (7.7%)
INNOVATORS
Low score 220 (79.6%) 35 (12.7%) 255 (92.3%)
total 237 (85.8%) 39 (14.2%) 276 (100%)
CATALYSTS
low/high defined in terms of </> than mean + standard deviation
Table 2 – Sources of external knowledge: items loadings.
External Knowledge Variables
Mean S.D. Loading on
Scientific KnowledgeLoading on
Industrial Knowledge
Funded Projects 4.23 1.85 0.46 0.61
Standardization Committees 4.68 1.82 0.37 0.67
Collaboration with Clients 4.11 1.92 0.15 0.84
Collaboration with Suppliers 3.43 1.83 -0.03 0.87
Conferences 4.67 1.84 0.81 0.11
Scientific Journals 5.01 1.65 0.84 0.00
Patents 3.71 1.82 0.55 0.45
Collaboration with Research Institutions 5.06 1.79 0.78 0.28
The question asked was: "For each item please indicate the extent to which it represents an important
source of technical and/or scientific knowledge for your professional activity at <name of the company>
Items were measured with a 7-point Likert scale, ranging from "Not at all" to "To a great extent"
Loading factors > .5 are bold and underlined
Loadings are based on Varimax rotation
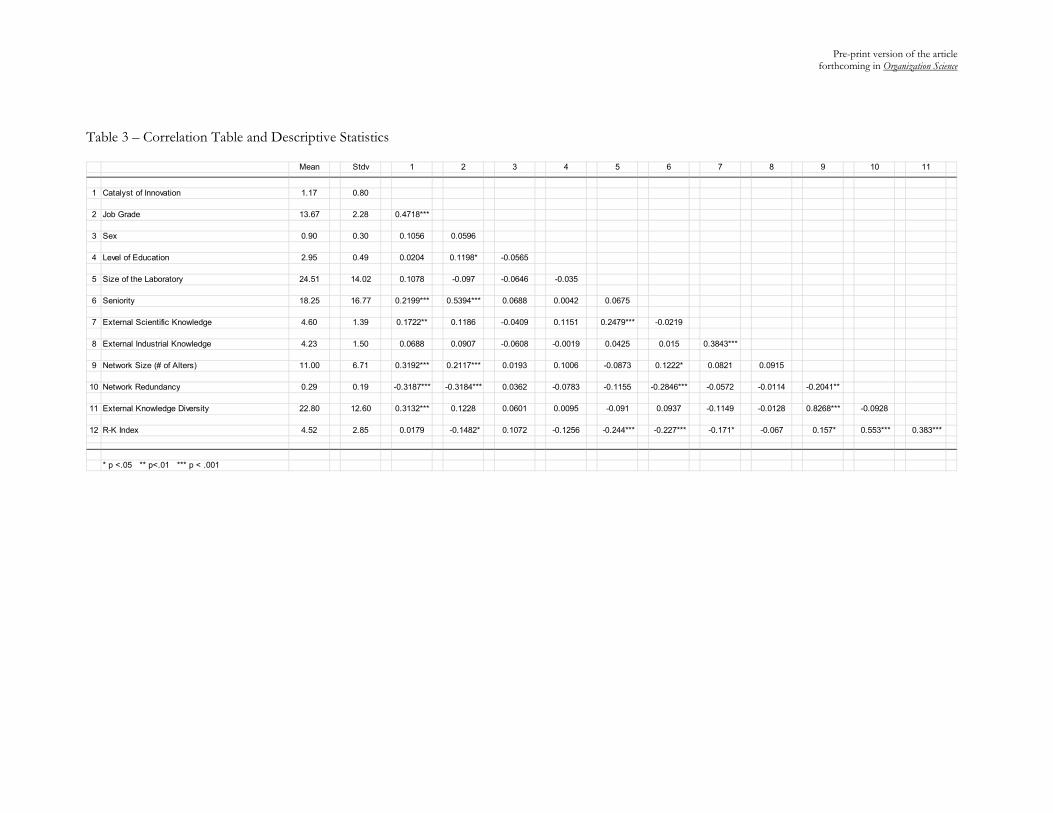
Pre-print version of the article forthcoming in Organization Science
Table 3 – Correlation Table and Descriptive Statistics
Mean Stdv 1 2 3 4 5 6 7 8 9 10 11
1 Catalyst of Innovation 1.17 0.80
2 Job Grade 13.67 2.28 0.4718***
3 Sex 0.90 0.30 0.1056 0.0596
4 Level of Education 2.95 0.49 0.0204 0.1198* -0.0565
5 Size of the Laboratory 24.51 14.02 0.1078 -0.097 -0.0646 -0.035
6 Seniority 18.25 16.77 0.2199*** 0.5394*** 0.0688 0.0042 0.0675
7 External Scientific Knowledge 4.60 1.39 0.1722** 0.1186 -0.0409 0.1151 0.2479*** -0.0219
8 External Industrial Knowledge 4.23 1.50 0.0688 0.0907 -0.0608 -0.0019 0.0425 0.015 0.3843***
9 Network Size (# of Alters) 11.00 6.71 0.3192*** 0.2117*** 0.0193 0.1006 -0.0873 0.1222* 0.0821 0.0915
10 Network Redundancy 0.29 0.19 -0.3187*** -0.3184*** 0.0362 -0.0783 -0.1155 -0.2846*** -0.0572 -0.0114 -0.2041**
11 External Knowledge Diversity 22.80 12.60 0.3132*** 0.1228 0.0601 0.0095 -0.091 0.0937 -0.1149 -0.0128 0.8268*** -0.0928
12 R-K Index 4.52 2.85 0.0179 -0.1482* 0.1072 -0.1256 -0.244*** -0.227*** -0.171* -0.067 0.157* 0.553*** 0.383***
* p <.05 ** p<.01 *** p < .001

36
Table 4 – Effects of External Knowledge Diversity and Network Redundancy on being a Catalyst of Innovation DV: Catalysts of Innovation 1 2 3 4 5 6
(un-w eighted scores)
Job Grade 0.170*** 0.179*** 0.165*** 0.176*** 0.155*** .343***(0.02) (0.03) (0.02) (0.03) (0.02) (0.05)
Sex 0.042 0.015 0.118 0.098 0.004 -0.002(0.15) (0.15) (0.15) (0.15) (0.15) (.331)
Level of Education 0.04 0.085 0.082 0.086 0.179 0.369†(0.10) (0.10) (0.09) (0.09) (0.10) (0.22)
Size of the Laboratory 0.008 0.011 0.01 0.013 0.001 -0.003(0.02) (0.02) (0.02) (0.02) (0.01) (0.03)
Seniority 0.001 0.001 0.003 -0.001 0.003 -0.001(0.00) (0.00) (0.00) (0.00) (0.00) (0.01)
External Scientific Knowledge 0.073† 0.07† 0.066 0.06 0.048 0.11(0.04) (0.04) (0.04) (0.04) (0.04) (0.09)
External Industrial Knowledge -0.032 -0.022 -0.036 -0.027 -0.009 -0.012(0.03) (0.03) (0.03) (0.03) (0.03) (0.07)
Network Size (# of Alters) 0.037*** 0.002 0.032*** -0.007 -0.015 -0.031(0.01) (0.02) (0.01) (0.02) (0.02) (0.04)
External Knowledge Diversity 0.020* 0.021* 0.007 0.014(0.01) (0.01) (0.01) (0.02)
Network Redundancy -0.642* -0.741** -2.486*** -5.45***(0.27) (0.27) (0.38) (0.84)
R-K Index 0.100*** .221***(0.02) (0.05)
Constant Term -2.516* -3.133** -2.366* -1.566 -1.526 -3.405(0.99) (1.07) (1.07) (0.93) (1.03) (2.27)
Laboratory dummy yes yes yes yes yes yes
Area of Technological Expertise dummy yes yes yes yes yes yes
R-Square 0.525 0.539 0.549 0.561 0.647 0.643Adj. R-Square 0.429 0.44 0.448 0.46 0.554 0.548Number of Observations 245 245 237 237 237 237Model F-Test 5.469*** 5.459*** 5.440*** 5.532*** 6.930*** 6.8***
† p< .10 * p <.05 ** p<.01 *** p < .001(Standard Errors in Parentheses)

Pre-print version of the article forthcoming in Organization Science
Figure 1a - Effect of Catalysts on Other Researchers’ Patent Applications
(Weighted DV to identify Catalysts) Figure 1b - Effect of Catalysts on Other Researcher’s Patent Applications (Unweighted DV to identify Catalysts)
Zero catalysts One or more catalysts
in ego network in ego network
Number of Researchers 52 188
Number of Patent Applications 27 203
Patent Applications per Researcher
Average 0.52 1.08
Standard Deviation 1.24 2.14
Zero catalysts One or more catalysts
in ego network in ego network
Number of Researchers 55 185
Number of Patent Applications 31 199
Patent Applications per Researcher
Average 0.56 1.08
Standard Deviation 1.27 2.15
Related Documents