BEHAVIOURAL COMPETENCY MANAGEMENT WITH SPECIAL REFERENCE TO COMMERCIAL BANKS HEADQUARTERED IN KERALA Thesis Submitted to Cochin University of Science and Technology for the award of the degree of Doctor of Philosophy under the Faculty of Social Sciences By Vigi V Nair Reg. No.3671 Under the guidance of Prof. (Dr) K.C.Sankaranarayanan DEPARTMENT OF APPLIED ECONOMICS COCHIN UNIVERSITY OF SCIENCE AND TECHNOLOGY KOCHI - 682022 October 2014

Welcome message from author
This document is posted to help you gain knowledge. Please leave a comment to let me know what you think about it! Share it to your friends and learn new things together.
Transcript
BEHAVIOURAL COMPETENCY MANAGEMENT WITH SPECIAL REFERENCE TO COMMERCIAL BANKS
HEADQUARTERED IN KERALA
Thesis Submitted to
Cochin University of Science and Technology
for the award of the degree of
Doctor of Philosophy
under the Faculty of Social Sciences
By
Vigi V Nair Reg. No.3671
Under the guidance of
Prof. (Dr) K.C.Sankaranarayanan
DEPARTMENT OF APPLIED ECONOMICS COCHIN UNIVERSITY OF SCIENCE AND TECHNOLOGY
KOCHI - 682022 October 2014


This is to certify that to the best of my knowledge the thesis entitled
“ Behavioural Competency Management with special reference to Commercial Banks
headquartered in Kerala”, is a bona-fide record of research work carried out by
Ms. Vigi V Nair, part-time research scholar under my supervision and guidance.
The thesis is an original piece of work and has not formed the basis for the
award of any degree, diploma, associateship, fellowship or any other similar title and is
worth submitting for the award of degree of Doctor of Philosophy under the Faculty of
Social Sciences of Cochin University of Science and Technology.
Certified that all the relevant corrections and modifications suggested by the
audience during the pre-synopsis seminar and recommended by the Doctoral committee
of the candidate has been incorporated in the thesis.
The work is adequate and complete and I recommend for the award of Ph.D
Degree to Ms. Vigi V Nair.
Place: Prof. (Dr) K.C.Sankaranarayanan Date: (Research Guide)

I hereby declare that the dissertation entitled “ Behavioural Competency
Management with special reference to Commercial Banks headquartered in Kerala”
is the outcome of the original research work done by me and that it has not
previously formed the basis for the award of any degree, diploma, associateship,
fellowship or any other title of recognition from any University/Institution.
Place: Vigi V Nair Date:


The completion of this thesis has been a long journey and could not
accomplish with the generous help and support of many people. My sincere thanks
to the people who is helped me in assorted ways to conduct the research and make
this thesis a reality. It is my great pleasure to express my gratitude through this
humble acknowledgement.
Firstly, I praise the almighty God for his abundant blessings showered upon
me without which this research work would never have been possible.
I express my sincere gratitude and indebtedness to my supervising guide
Dr.K.C.Sankaranarayanan, Former Head of the Department, Department of
Applied Economics and Former Dean of Faculty of Social science, Cochin
University of Science and Technology for his unwavering support and constant
encouragement in bringing this work to its culmination. I am proud to record that
his immense knowledge and expertise have benefited me in each and every sphere of
the research work.
I gratefully thank to Dr.Arunachalam, Head of the Department of Applied
Economics and my Doctoral committee member, Prof.Dr.Harikumar,
Prof.Dr.D.Rajasenan, Prof.Dr.M.Meera Bai and Dr.P.K.Manoj, Department of
Applied Economics, who have helped and supported me in various ways in
completing this work. I thank Prof. P. R. Poduval, Dean, Faculty of Social Science
for being very supportive.
I sincerely thank to all the staff of the five banks – State Bank of
Travancore, Federal Bank, South Indian Bank, Catholic Syrian Bank and
Dhanlaxmi Bank for their immense support during data collection period.
I express my heartfelt thanks to Dr.Ajims P Muhammed, Principal, MES
Asmabi College, Kodungallur for his encouragement and guidance for the successful
completion of my work.
I deeply express my gratitude to Dr. Igy George, Reenamol S, Nikitha
Manoj and Sunitha K Nair for the valuable guidance during the crucial stage.
I extend my sincere thanks to all the faculties of MES College, Marampally,
BPC College, Piravom, KMM College, Thrikkakara and SN College, Kumarakom
for their sincere cooperation and support.
I am also grateful to the office staff of the Department of applied economics
and Administrative office, for their cooperation and sincere assistance rendered to
me. I owe much to the Librarians of Department of Applied Economics and School
of Management Studies, Cochin University for their cooperation.
I am indebted to all the fellow researchers in the Department of Applied
Economics for their timely support.
I remember my family with gratitude, for the love and encouragement I received
from them. Words cannot express the love and appreciation that goes to my family
especially my husband Adarsh K.G, Son Advaitkrishna, My Father Adv.N.Vikraman
Nair, My mother Komalam V Nair for their warm care and constant love and blessings.
I also grateful to my father-in-law Adv.C.P.Gopalakrishnan Nair and mother-in-law
P.K.Chellamma for their unfailing support and love. Their invaluable sacrifices and
prayers have indeed brought this work to its culmination.
I place on record my sincere gratitude to all my colleagues and friends who
have helped me in their own ways for the preparation and successful completion of
this work.
Vigi V Nair

Contents
Contents
List of tables
List of figures
Chapter 1 Introduction ............................................................................ 1
1.1 Introduction to Competency in Banking Industry ....................... 1
1.2 Significance of the Study ............................................................. 3
1.3 Research Problem ......................................................................... 4
1.4 Scope of the Study ....................................................................... 6
1.5 Objectives of the Study ................................................................. 6
1.6 Hypotheses: .................................................................................. 7
1.7 Limitation of the Study ................................................................ 7
1.8 Scheme of the Study ...................................................................... 8
Chapter 2 Review of Literature ................................................................ 9
2.1 The Performance and Human Resource Practices in Banks ........... 9
2.2 Employee Competency ................................................................... 17
2.3 Employee Performance Evaluation .............................................. .35
Conclusion ......................................................................................... 38
Chapter 3 Research Design ....................................................................... 41
3.1 Rationality of the Study .............................................................. 41
3.2 Conceptual Framework ................................................................ 43
3.3 Area of the Study ......................................................................... 47
3.4 Sample Framework ...................................................................... 48
3.5 Data Collection ............................................................................. 49
3.6 Data Collection Period.................................................................. 49
3.7 Data Collection Tool Framing ..................................................... 50
3.8 Stationarity Test and Unit Root Test .......................................... 51
3.9 Reliability and Validation Measures ............................................ 54
3.10 Statistical Tools Applied in the Study ........................................ 57
Chapter 4 Banking System in India and the Need for Enhancing Behavioural Competency of Bank Officers Working in Schedule Commercial Banks Operating in India ........................ 59
4.1 Overview of Banking in India ...................................................... 59
4.2 Changing Role of Banks in India ................................................. 60
4.3 Importance of HRM Practices .................................................... 66
4.4 HRD in Indian Banking Sector ................................................... 67
4.4.1 Role of HRM in Banks ................................................................ 69
4.5 Need of Employee Competency .................................................... 70
4.5.1 Employee Competency in Banking Sector .................................... 71
4.5.2 Significance of Employees’ Competency in Banking ................... 73
4.6 Role of the Indian Institute of Banking & Finance (IIBF) In Enhancing Banking Employees’ Competency .............. 75
4.6.1 Components of Employee Competencies ....................................... 77
4.6.2 Measures to Identify Employee Competencies in Banking Sectors ..................................................................................................... 78
4.6.3 Measurement of Competencies ..................................................... 80
4.6.4 Characteristics of Good Competencies .......................................... 81
4.6.5 Process of Competencies ............................................................... 81
4.6.6 Classification of Competencies ..................................................... 84
4.6.7 Benefits of Competencies.............................................................. 86
4.6.8 Models of Competencies ............................................................... 86
4.7 Building Change Competence in Employees .................................. 90
4.8 Dimensions of Competency ........................................................... 91
Conclusion .......................................................................................... 92
Chapter 5 Employee Competency in the Scheduled Commercial Banks Headquartered in Kerala .......................................................... 96
5.1 Employee Strength ........................................................................ 96

5.2 Competency in Terms of Business per Employee ........................... 98
5.3 Competency in Terms of Deposits per Employee ........................... 99
5.4 Competency in Terms of Investment per Employee ....................... 102
5.5 Competency in Terms of Advances per Employee.......................... 104
5.6 Competency in Terms of Spread per Employee .............................. 105
5.7 Competency in Terms of Profit per Employee ............................... 108
5.8 Measure of Competency-Comparative Analysis ............................ 109
Conclusion ........................................................................................... 110
Chapter 6 Analysis and Interpretation ...................................................... 111
6.1 Demographic &Socio-economic Analysis ...................................... 112
6.1.1. Gender of the respondents ........................................................... 114
6.1.2 Age group of the respondents ....................................................... 115
6.1.3 Educational Qualification ........................................................... 115
6.1.4 Rank of Employees ...................................................................... 116
6.1.5 Designation of the Respondents .................................................. 118
6.1.6 Mode of Entry to Current Designation ...................................... 119
6.1.7 Work Experience ......................................................................... 120
6.1.8 Monthly Income .......................................................................... 121
6.2 Importance of competency in Organisational HR Practices ......... 122
6.2.1 Employee Selection ....................................................................... 122
6.2.2 Job Design .................................................................................... 126
6.2.3 Performance Appraisal ................................................................. 131
6.2.4 Career Development ..................................................................... 134
6.2.5 Promotion and Pay ....................................................................... 137
6.2.6 Superior-Subordinate Relationship .............................................. 140
6.2.7 Training and Development ........................................................... 143
6.2.8 Competency Assessment ............................................................... 144
6.3 Job Satisfaction ........................................................................... 146

6.4 Assessment of Behavioural Competency (Will Mapping Procedure) ............................................................................................. 152
6.5 Analysis of Skill Mapping Procedure .......................................... 154
6.6 Results of Hypotheses Testing ...................................................... 157
Conclusion ......................................................................................... 170
Chapter 7 Summary, Findings, Suggestions and Conclusion ........................ 171
7.1 Summary ...................................................................................... 171
7.2 Findings of the Study ................................................................... 173
7.2.3 Results of Hypothesis Testing ...................................................... 177
7.3 Conclusion .................................................................................... 178
7.4 Suggestions ................................................................................... 179
7.5 Scope for Future Research work ................................................... 180
Bibliography .................................................................................................... 181
Annexure 1 Questionnaire ................................................................................. 193
Annexure 2 Will Mapping Questionnaire .......................................................... 197
Annexure 3 Skill Mapping Procedure Skill assessment ........................................ 201

List of Tables
Table 3.1: Sample Framework ............................................................................ 48
Table 3.2 Sample Framework ............................................................................ 49
Table: 3.3 Unit Root/Co-Integration Results of State Bank of Travancore Employee Performances .................................................. 51
Table: 3.4 Unit Root/Co-Integration Results of Federal Bank Limited Employee Performances .................................................................... 52
Table: 3.5 Unit Root/Co-Integration Results of Dhanlaxmi Bank Limited Employee Performances ....................................................... 53
Table: 3.6 Unit Root/Co-Integration Results of Catholic Syrian Limited Employee Performances ....................................................... 53
Table: 3.7 Unit Root/Co-Integration Results of South Indian Bank Limited Employee Performances ........................................................ 54
Table: 3.8 Cronbach’s Alpha for the Variables .................................................. 55
Table: 5.1 Number of Employees of Banks ......................................................... 96
Table: 5.2 Business Per Employee of Banks ....................................................... 98
Table: 5.3 Deposits per Employee of Banks ....................................................... 100
Table: 5.4 Investments per Employee of Banks .................................................. 102
Table: 5.5 Advances per Employee of Banks ...................................................... 104
Table: 5.6 Spread per Employee of the Banks Studied ....................................... 106
Table: 5.7 Net Profit Per Employee Of Banks ................................................... 108
Table: 5.8 Comparative Analyses of Employees Performances in Sample Banks ................................................................................................. 110
Table 6.1 Gender of Banking Staff ................................................................... 113
Table 6.2 Age of the Respondents...................................................................... 114
Table 6.3 Educational Qualification of the Respondents.................................. 115
Table 6.4 Rank of Employees ............................................................................ 116
Table: 6.5 Designation ........................................................................................ 118
Table 6.6 Mode of Entry to Current Designation ............................................. 119
Table 6.7 Work Experience................................................................................ 120

Table 6.8 Monthly Income of the respondents .................................................. 121
Table 6.9 Employee Selection Process ................................................................ 123
Table 6.10 Job Design (Managerial Staff) .......................................................... 126
Table 6.11 Job Design (Clerical Staffs) ............................................................... 129
Table 6.12 Performance Appraisal ...................................................................... 132
Table 6.13 Career Development ......................................................................... 135
Table 6.14 Promotion and Pay ............................................................................ 138
Table 6.15 Superior- Clerical staffs Relationship ................................................ 141
Table 6.16 Training & Development .................................................................. 143
Table 6.17 Types of competencies ....................................................................... 145
Table: 6.18 Managers’ Level of Satisfaction ........................................................ 147
Table: 6.19 Clerical Staffs’ Level of Satisfaction ............................................... 149
Table 6.20 Clerical Staffs’ Behavioural Competency based on officer’s perception ........................................................................................... 152
Table 6.21 Officers’ Behavioural Competency based on Clerical staff’s perception ........................................................................................... 153
Table: 6.22 Level of Job Skills (Present Level) .................................................... 155
Table: 6.23 Levels of Job Skills (Desired Level) .................................................. 156
Table: 6.24 Result of Anova ................................................................................. 157
Demographic and Socio-Status of the Managerial Staffs and their Competency Level
Table: 6.25 Result of Anova ................................................................................. 158 Demographic and socio-status of clerical staffs and their
competency level
Table 6.26 Paired T Test.......................................................................................... 159 Superior and Subordinate Perception
Table 6.27 Paired T Test ...................................................................................... 160 Overall Will Parameters
Table 6.28 Paired T Test ..................................................................................... 161 Level of Job Skills
Table 6.29 KMO and Bartlett's Test Overall Will Parameter ............................ 162

Table 6.30 Cumulative Factors Influence of Overall Will Parameter ................. 163
Table 6.31 Factor Analysis of Association of Overall Will Parameter ............... 164
Table 6.32 Summary of Rotational Factor Analysis & Cronbach’s Alpha Overall Will Parameter ........................................................... 165
Table 6.33 KMO and Bartlett's Test Overall Will Parameter ............................ 166
Table 6.34 Cumulative Factors Influence of Overall Will Parameter ................. 167
Table 6.35 Factor Analysis of Association of Overall Will Parameter ............... 168
Table 6.36 Summary of Rotational Factor Analysis & Cronbach’s Alpha Overall Will Parameter of Overall Will Parameter ................ 169


List of Exhibits
Exhibit: 3.1 Measure of Banking Employees’ Behavioural Competency ............. 46
Exhibit: 3.2 Brief Profile of Banks Headquarter In Kerala ................................ 47
Exhibit: 4.1 Changing Role of Banks in India ..................................................... 61
Exhibit: 4.2 SWOT Analysis of Indian Commercial Banks (In HR Context)............ 74
Exhibit: 4.3 People involved identification of competencies ............................... 78
Exhibit: 5.1 Number of Employees of Banks ....................................................... 97
Exhibit: 5.2 Business Per Employee Of Banks .................................................... 99
Exhibit: 5.3 Deposits per Employee of Banks ...................................................... 101
Exhibit: 5.4 Investments per Employee of Banks ................................................ 103
Exhibit: 5.5 Advances per Employee of Banks ................................................... 105
Exhibit: 5.6 Spread Per Employee of Banks ........................................................ 107
Exhibit: 5.7 Net Profits per Employee of Banks ................................................. 109
Exhibit 6.1 Gender of baking staff ..................................................................... 113
Exhibit 6.2 Age of banking staff ........................................................................ 115
Exhibit 6.3 Managers and Clerical staffs ........................................................... 117
Exhibit 6.4 Work experience ............................................................................... 122
Exhibit 6.5 Monthly income ............................................................................... 123
Exhibit 6.6 Employee Selection (Managerial Staff) ........................................... 125
Exhibit 6.7 Clerical staffs’ Employee Selection .................................................. 125
Exhibit: 6.8 Job Design (Managerial staff) ......................................................... 128
Exhibit: 6.9 Job Design (Managerial Staff) ......................................................... 128
Exhibit: 6.10 Job Design (Clerical Staffs) .............................................................. 129
Exhibit: 6.11 Job Design (Clerical Staffs) .............................................................. 130
Exhibit 6.12 Performance Appraisal (Officers) ..................................................... 134
Exhibit 6.13 Performance Appraisal (Clerical Staffs) ........................................... 134
Exhibit: 6.14 Career Development (Officers) ........................................................ 137
Exhibit: 6.15 Career Development (Clerical Staffs) ............................................... 137

Exhibit: 6.16 Promotion And Pay (Officers) .......................................................... 139
Exhibit: 6.17 Promotion and Pay (Clerical Staffs)................................................. 140
Exhibit: 6.18 Managers’ Perception towards Their Relation and Participations with the clerical staffs ............................................................................... 142
Exhibit: 6.19 Clerical Staffs’ Perception Towards their Relation and Participations with the officers ....................................................... 142
Exhibit: 6.20 Officers- Training & Development ................................................. 144
Exhibit: 6.21 Clerical Staffs-Training & Development ........................................ 144
Exhibit: 6.22 Types of competencies ....................................................................... 146
Exhibit: 6.23 Managers Level Of Satisfaction ...................................................... 147
Exhibit: 6.24 Clerical Staffs’ Level of Satisfaction ............................................. 150
Exhibit: 6.25 Clerical Staffs’ Behavioural Competency ......................................... 153
Exhibit: 6.26 Officers’ Behavioural Competency ................................................... 154
Exhibit 6.27 Overall Will Parameter .................................................................... 165
Exhibit 6.28 Overall Will Parameter .................................................................... 169
Introduction
Department of Applied Economics, Cochin University of Science and Technology 1
1.1 Introduction to Competency in Banking Industry
Competency is the sum total of all skills, knowledge and attitudes,
manifested in the employee's behaviour. It is the "means" to achieve the
"ends." “Competency is an underlying characteristic of an individual that is
causally related to effective and/or superior performance in a job or a
situation.” (Boyatzis, 1982). A plan to build and effectively utilize the
required competency is the core theme in competency management, which
determines the economic optimization of organizational goals. In today’s
fast moving and knowledgeable world, it is very difficult for an organization
to develop a sustainable competitive advantage. For achieving this,
organizations are required to improve their operational efficiency and
effectiveness. Competency management of currently available resources
determines performance of any organization. Among the resources of an
organization, skilled Labour is the vital resource for enhancing the output of

Chapter 1
2 Department of Applied Economics, Cochin University of Science and Technology
the organization. According to Cheng et.al (2003) “the establishment of the
competency of individuals is crucial for the further development of an
organization”. Therefore, it is very essential to identify the individual
competencies to improve the performance of the employees.
According to Zeti Akhtar Aziz (2005) “Banking is a knowledge-
intensive, skills-based and relationship-rich industry”. In a progressive,
complex and a more liberalized environment, competitiveness of banks will
depend significantly on the quality of human resource and the extent to
which the industry is able to enhance these talents. To compete effectively,
banking institutions need professionals with the ample skills and expertise at
all functional areas. Thus, the banking sector gives more priority to
strengthen their intellectual human resources and the competency of them.
With rapid changes taking place in the financial landscape,
Scheduled Commercial banks in India need a new generation of professional
bankers who are more customer-centric, technology-savvy, more highly
qualified, flexible and agile with behavioural skill sets that are now more
comprehensive than previously. The quality of human capital will
increasingly become the cutting edge of competitiveness. Having competent
staff to deliver high quality products and services is important to build
customer confidence and goodwill, driving customer satisfaction, enhancing
reputation, and ultimately realising individual bank’s corporate vision and
strategic goals. Therefore, banking institutions are interested to ensure
competency and professionalism to serve their customers better.
Kerala can boast of a well developed banking sector from an early
period. Initially private sector banks dominated the Kerala scene. At a later
stage public sector bank’s branches were started in Kerala. Today Kerala is
Introduction
Department of Applied Economics, Cochin University of Science and Technology 3
one of the most developed states in the case of Banking.
This study aims to analyse, compare and contrast the behavioural
competency of officials in commercial banks headquartered in Kerala. This
is done by analysing the soft skills/behavioural skills possessed by an
individual employee in both clerical and managerial levels and the means
adopted to enhance their said skills in near future.
1.2 Significance of the Study
The last two decades, marked the era of liberalization and
globalization. The reforms in the country have been eventful one for the
Banking industry. It changed the face of the industry far beyond recognition.
Banking sector in India has a very old origin and the modern banking in
India began with the rise of power of the British. Banks are extremely useful
and indispensable in the modern community and played substantial role in
the growth of economies. The banks create purchasing power in the form of
bank notes, cheques, bills, and drafts that encourage the habit of saving
money among people. The customers have become more demanding and
they need value added services from the banks. The service quality of the
bank mainly depends on the attitude or behavior of the employees towards
the customers. Narayana Murthy, chief mentor, Infosys, mentioned that
organizational attributes is required for success in the banks: "Only those
banks which use speed and excellence in execution will survive. Others will
disappear like dew in the morning. Indian banks have several legacy issues
hampering their progress - including inadequate customer support, human
resources practices and a customer-centric focus."
Technology has brought substantial changes in banking in terms of
customer services and new product innovations. The private sector banks

Chapter 1
4 Department of Applied Economics, Cochin University of Science and Technology
are more dynamic in adopting latest Human Resource Practices. Banking
sector have realised the fact that in the changed scenario, success will
depend on the ability of banks to leverage the human potential and
capabilities. The competency approach to human resources management is
based on identifying, defining and measuring individual differences in terms
of the abilities that are vital for the successful job performance. The
commercial banks operating in Kerala aims to build highly competitive
structure by means of enhancing unexceptionable levels of workforce
performance; those are tenacious commitment towards their competency.
1.3 Research Problem
Today, in every organization, human resource plays an important
role in its success. The constant challenge for banks is getting their people
to execute those behaviors that will deliver the organizational vision, values
or strategic goals. Every person has different qualities, attitude, motives,
personality traits, skills etc. that will affect their work performance. Human
Resource (HR) department of banks is entrusted with the responsibility of
searching, assigning and evaluating the employees by recruitment, selection
and performance appraisal. The main objective of these functions is the
assessment of suitability of the individuals for different functional jobs and
developing their potential to be effective and excel in assigned jobs.
According to Mangaleswaran (2007) Human Resources (HR) are
more important in the service organizations than in goods producing
industry. Banking sector is one of the most important service sectors. In the
present era, Banking has become a highly competitive industry and for the
competitive advantage, it has to enter new businesses and new markets, to
develop new ways of working, to improve efficiency of employees, and to
Introduction
Department of Applied Economics, Cochin University of Science and Technology 5
deliver higher levels of customer service. The recent trend is opening the
commercial banks and their branches in every corner of the state for
providing extended services to the society. Now everybody knows that the
market and customers are changing frequently, their expectations have taken
new forms and policies relating to people change as it is the people who are
the key differentiators in the new era. But it is difficult to practice
customer-centric strategic management without first achieving
employee satisfaction. Therefore, the banks are focusing on the customer-
centric strategic management. Employees on the frontline in banking sector
are in constant contact with the customer and the customer satisfaction
depends upon employee performance that in turn depends on employee
satisfaction. However, earlier studies show that, in banking sector,
employees are less satisfied and less motivated than other lines of work
employees (Kelley, 1990; Bajpai, Naval & Deepak, 2004). This is reflected
by high employee turnover rate (Branham, 2005; Nelson, 2007) and high
level of stress (Chen &Lien, 2008) in the banking industry.
The winners in this sector will be the players who can understand the
customer, fulfill customer needs, and achieve high levels of customer
retention. For understanding the needs of the customers and fulfilling them,
the bank employees both at the managerial and clerical level must have the
required level of competency in their behavioural skills. For this, they must
aim to improve their skills as and when new changes occur. The current
study seeks to find out how Commercial banks headquartered in Kerala to
improve the behavioural competency of their staff and to what extent they
have succeeded in their attempts.

Chapter 1
6 Department of Applied Economics, Cochin University of Science and Technology
1.4 Scope of the Study
In India, Kerala boasts of a well-developed banking infrastructure.
With passage of time, Kerala banking system has attained a high benchmark.
A large number of branches of nationalized and commercial, banks along
with Grameen banks have sprung up within the state. Among these banks,
following are the five major commercial banks, viz. Federal Bank, South
Indian Bank, Catholic Syrian Bank, Dhanlaxmi Bank and the State Bank of
Travancore have head offices in Kerala. These banks play a vital role in the
economic growth and overall development of the Kerala state. Along with
financial capital and technology, human resources contribute a lot to the
capabilities of the banking sector to face the new challenges thrown open by
globalization and liberalization. It is in this context, the present study focuses
on the management of the behavioral competencies of employees in the
commercial banking sector headquartered in Kerala.
1.5 Objectives of the Study
The objectives of the study are:
• To study the socio-economic and job profile of the bank officers and
clerical staffs in selected banks headquartered in Kerala.
• To analyse how far competency gets importance in the present set-up
of the selected banking sector.
• To analyse the employee competency in the selected Commercial
banks headquartered in Kerala.
• To measure the behavioural competencies of banking staff based on
will parameters.
Introduction
Department of Applied Economics, Cochin University of Science and Technology 7
• To identify the gap between desired and the actual level of
employee’s competency for effective competency management.
1.6 Hypotheses:
The hypotheses of the study are:
• Demographic and socio-status of the managerial officers and clerical
staff influences their competency level in the selected banks.
• There exist no difference in managerial staffs’ and clerical staffs’
perception about competency evaluation during (a) employee selection,
(b) job design, (c) performance appraisal, (d) career development,
(e) promotion and pay and (f) relation and participations.
• There exists no gap in managerial staffs and clericall staffs’
understanding on each other’s performance.
• There exists no gap in employees’ desired level of competency and
the actual level.
• Employees’ competency differs from one bank to another.
1.7 Limitation of the Study
The limitations of the study are:
• The scope of the study is restricted to the banks headquartered in
Kerala.
• No competency mapping or scaling technique is applied. This may
reflect on the findings and conclusion drawn by the researcher.

Chapter 1
8 Department of Applied Economics, Cochin University of Science and Technology
1.8 Scheme of the Study
The thesis is organised under seven chapters.
Chapter I introduces the theme of the thesis. It states the problem, the
significance, scope, objectives, hypotheses and limitations of the study.
Chapter II presents the review of literature relevant to the topic of
research.
Chapter III provides the conceptual framework, research design and
methodology adopted in conducting the study.
Chapter IV contains discussions on the concept of banking system in India
and the need for enhancing competency of bank employees working in
scheduled commercial banks.
Chapter V contains a detailed diagnostic analysis on employee
performances in the five sample banks during the study period (2001-02 to
2012-13).
Chapter VI presents the analysis and interpretation of the responses of the
respondents.
Chapter VII sums up the findings, suggestions and conclusions of the
study. Some suggestions with respect to further research is also listed
herein.
…….. ……..

Review of Literature
Department of Applied Economics, Cochin University of Science and Technology 9
Banking industry is the lifeline of the nation and its people. Banking
has helped in developing the vital sectors of the economy and usher in a
new dawn of progress on the Indian horizon. The sector has translated the
hopes and aspirations of millions of people into reality. However, to do so,
it has had to control miles and miles of difficult terrain, suffer the indignities
of foreign rule and the pangs of partition. Today, Indian banks can
confidently compete with modern banks of the world.
The success of the bank mainly depends on the services provided to
the customers and the quality of services rendered on the employee
performance or the competency of them. There are a number of studies and
surveys conducted to improve the performance of the banks. Therefore, this
chapter makes a review of the literature on the subject of the study.
2.1 The Performance and Human Resource Practices in Banks
Nanayakkara (1999)1 in his study on “Changing Paradigms in
Human Resource Management’’ pointed out that the performance of the
banks (as any other service sector organization) highly depends on their
Human Resource Management (HR). Hence, efficient and effective HR
Chapter 2
10 Department of Applied Economics, Cochin University of Science and Technology
practices of selecting the right people, who would maximize value and
minimize cost within the organization remains a challenging task.
This was also observed by Randy (2000)2-“Why Loyal Employees
and Customers Improve the Bottom Line” that between 40 and 80 percent
of customer satisfaction and loyalty is determined by the customer-employee
relationship, depending upon the industry and market segment. At sears,
employee satisfaction accounts for 60 to 80 percent of customer satisfaction.
At the Royal Bank of Canada, 40 percent of the difference in how customers
view its services can be linked directly to their relationship with bank staff.
Therefore, if customers are well treated and their needs fully catered for,
employee productivity increases leading to increase in performance.
According to Kamesam (2004)3 the core function of Human
Resource Development (HRD) in the banking industry is to facilitate
performance improvement, measured not only in terms of financial
indicators of operational efficiency but also in terms of the quality of
financial services provided. Factors like skills, attitudes and knowledge of
the human capital play a crucial role in determining the competitiveness of
the financial sector. The quality of HR indicates the ability of banks to
deliver value to customers.
Capital and technology are replicable but not the human capital, which
needs to be valued as a highly valuable resource for achieving that competitive
edge. The primary emphasis needs to be on integrating human resource
management strategies with the business strategy. HRM strategies include
managing change, creating commitment, achieving flexibility and improving
teamwork. The other processes representing the overt aspects of HRM, viz.
recruitment, placement, performance management, are complementary.
Review of Literature
Department of Applied Economics, Cochin University of Science and Technology 11
Krishnamurthy K. V. (2004)4 highlighted the deficiencies in
compensation policies as follows. In the process, we are paying same
compensation to the performers and non-performers, the talented and the
menials, often unable or unwilling to make the distinction, creating a
disastrous situation where those with talent look for exit options like
Voluntary Retirement Scheme (VRS).
Patnaik (2004)5 Chief Manager (HRD) Central Bank of India opines
that "Recruitment policy should go beyond writing eligibility criteria. Man
power planning and recruitment policies should be reviewed and
institutionalized."
Bimal Jalan (2004)6 Ex-Governor, Reserve Bank of India stated that
"A major challenge for many banks will be to develop the special
competencies and skills for credit appraisal and risk management in an
environment of deregulation and openness".
Mohan Deshmukh (2004)7 in the study entitled "Human Resource
Mnagement: need for a pragmatic approach” stated that "In Indian
banks, job descriptions are still not drawn up in greater detail so as to cover
individual posts in a branch or departments of branch and controlling
offices. Job profiles and job requirements are not defined."
Purwar A.K. (2004)8 Chairman, State Bank of India, stressed on
customer focus. "Greater customer centric focus calls for greater employee
involvement and motivation and change in mindset. Long used to working
in a protected environment, staffs in public sector banks are widely
perceived to have low motivation and low involvement, and the lack of
distinction between high performers and poor performers with no reward
and punishment system has only added to the lethargy. He also mentioned

Chapter 2
12 Department of Applied Economics, Cochin University of Science and Technology
that the banks needed to build a service culture using technology in a
customer friendly manner. This requires reorienting HRD strategies in
banks on an urgent basis and banks need to emphasize right size, right skills
and right attitude".
Other challenges in Human Resource Management are
• Over manning
• Low manpower productivity
• Employee unions
G.S. Bhaskara Rao (2004)9 in his study "Changing Profile of
Banking Impact on HRM policies and processes" pointed that "HRM
practices and policies in Indian banks have been evolved primarily through
reactive processes, and were the matters of bilateral agreements between the
managements and the representative Unions. The post-nationalization period
had witnessed a phenomenal growth in the number of trade unions,
encouraged by the management's continued patronage by way of leaving all
matters relating to HR to the prudence of unions.
Till the advent of financial sector reforms the concept of "human" as
an "asset" was not assigned much importance and the role of HRM was
mainly focused towards maintenance of personnel, and thus was not attuned
to the emerging business priorities".
Sangwan (2005)10 in his research article entitled ‘Human Resource
Management in Banks’ has mentioned that Human Resources are the most
important element for the progress of banking. Though technology can
replace manual intervention, the thinking process is the exclusive preserve
of human beings. With changing times and technology, banks would require
Review of Literature
Department of Applied Economics, Cochin University of Science and Technology 13
employees with special skills in the areas of risk management, treasury,
product development, customer relationship management and IT services.
The technology can improve speed and quality of performance, but at the
same time it can also unleash the risk factor. It is rightly said: “We are
trying to apply third generation ideas on second generation organizations
which are unfortunately run by first generation managers”.
Anil K. Khandelwal (2005)11 in the study entitled "Criticality of
HR reforms for Public sector banks in the new era", observed "Though
the system of employee appraisal has been vogue in banks, it has not helped
in developing an organization-wide performance culture in Public Sector
Banks. The system often fails to differentiate performers from non-
performers, average performers from high performers. Reforming the
performance appraisal system by making it more objective and linked to
corporate business objectives is the need of the hour. Key performance
indicators need to be scientifically assessed and objectively linked with
organizational goals so that the performance of the employees can be
assessed on critical parameters".
Mangaleswaran T and Srinivasan P T (2007)12 designed an
empirical study “Human resource management practices in Sri Lankan
and Indian public sector banks: an empirical comparison” to explore and
compare Human Resource Management practices in Sri Lankan and Indian
Public Sector Banks. Human Resource Management (HRM) is a developed
concept. It has tremendous relevance to service sector like Banks. Human
input is the single largest input to the banking industry. The level of
efficiency/productivity of this input gets reflected in the quality of service
offered by the banks to its customers, as also in its ultimate growth,
productivity and profitability. Human Resource Management Practices have
Chapter 2
14 Department of Applied Economics, Cochin University of Science and Technology
been studied extensively among Manufacturing, Service and Small Medium
Enterprises. However, only a few studies have addressed the banking
industry. Even these researchers have not compared Human Resource
Management Practices in Sri Lankan Public Sector banks (SLPSBs) and
Indian Public Sector Banks (IPSBs). The investigation is based on a survey of
730 employees. It consisted of 281 responses from SLPSBs and 449
responses from IPSBs. To measure the HRM Practices, a structured
questionnaire was used to collect data. The key area of analysis includes
staffing, training, compensation, performance appraisal, and employee
relations. Data were analyzed employing descriptive statistics and t‐test with
the help of SPSS. The study results reveal that Public Sector Banks in both
countries practice HRM but the extent of practices vary from one another.
Further, the results show a number of similarities and differences in HRM
systems of Sri Lankan and Indian public sectors Banks. Against the
established idea, the results of this study reveal that the gap between Sri
Lankan and Indian public sector banks’ HRM practices is very significant.
Moreover, in one of the HR functional area (compensation), Sri Lankan
public sector Banks show to adopt a more rational approach than their
counterparts.
Mangaleswaran (2007)13 in his study ‘Human Resource
Management Practices and its outcomes in Indian and Sri Lankan Public
Sector Banks’ revealed that Human Resources (HR) are more important in
the service organizations than in goods producing industry, as their cost of
labour is relatively high proportion in the total cost of production. Moreover,
employees on the front line in the service sector are in contact with the
customer, and the customer satisfaction depends upon employee performance.
Banks in the service industry delivers its service across the counter to the

Review of Literature
Department of Applied Economics, Cochin University of Science and Technology 15
ultimate customer. The activities of banking industry are all about
“relationship”. Hence, banking industry has to provide better services with a
smile to the customers in order to cultivate and maintain long lasting
relationship with their customers. Notwithstanding the level of technology,
banking is primarily a labour intensive service sector. Hence, it will not be
possible for the banks to sustain effectiveness unless human resource
management is given prime importance because the technology is only an aid
to human effort and not a substitution thereof. If the technology is the
equalizer, then the human capital shall be the differential in future.
Sujatha Mellacheruvu and Krishnamacharyulu C. S. G (2008)14
their research work “Challenges of Human Resource Management in
Public Sector Banks” pointed that Indian public sector banks have been
facing a number of challenges ever since the industry was opened up for
private and international players. Social banking practices followed by public
sector banks consequent to nationalization have resulted in increased non-
performing assets, decreased profitability and operational efficiency.
Privatization of banking sector forced public sector banks to take up serious
measures for improving profitability and efficiency of operations. Human
resource management is the area where many initiatives were implemented
for streamlining banking operations. In the study HRM challenges faced by
public sector banks were analyzed and suggestions made by the experts in the
field, summarized.
Kadian W. Wanyama and S. N. Mutsotso (2010)15 conducted a
study “Relationship between capacity building and employee
productivity on performance of commercial banks in Kenya” focusing on
the influence of employee productivity on organizational performance. This
study investigated the impact of capacity building and employee productivity

Chapter 2
16 Department of Applied Economics, Cochin University of Science and Technology
on commercial banks. Kenya has experienced banking problems since
independence in 1964 culminating in major Bank failures (37 failed banks as
at 1998). The bank failures were largely due to weak supervision; poor
service delivery, poor public relations and organizational ineffectiveness.
Their study revealed that equipping employees with expertise, skills and
knowledge can improve employee productivity and thereby improve
performance of the banks. The results of their study was published in the form
of an article and thereafter research focusing on the firm-level impact of
human resource management practices such as employee productivity,
satisfaction and motivation has become popular.
According to Kwabena Frimpong and Alan Wilson (2012)16
though a great deal of attention has been given to measuring service
orientation as a personality trait, very little attention has been given to
conceptualizing and measuring the construct in terms of what employees
actually do in service delivery. The few studies that have attempted to fill
this gap tend to focus narrowly on what service employees do in their
interactions with external customers via global measures.
The purpose of their paper was to provide a broader conceptualization
and measurement of service orientation in service delivery, reflecting
employees’ interactions with both internal and external customers. An
instrument was developed following a systematic scale development
approach. Survey data were collected from 535 employees and 1,970
customers. Results from an exploratory factor analysis suggested that service
orientation in delivery was underpinned by four major structures, namely
internal cooperative behaviours, service responsiveness, service competence
and enhanced service. Findings cannot be generalized as the study was based
on only the banking sector in one country.

Review of Literature
Department of Applied Economics, Cochin University of Science and Technology 17
2.2 Employee Competency
Quinn, R.E., et.al (1990)17 in his study on “Becoming a master
manager” specified eight interconnected roles that effective managers
perform as, director, producer, monitor, coordinator, facilitator, mentor,
innovator and broker.
Cockerilland Tony (1995)18 - “Managerial Competencies: Fact or
Fiction?” presented eleven dimensions of managerial competency for high
performance which are, information search, concept formation, conceptual
flexibility, interpersonal search, managing interaction, development
orientation, impact, self-confidence, presentation, proactive and achievement
orientation.
The American Compensation Association (1996)19 conducted a
major survey of 217 mid to large size organizations to determine
competencies. Respondents of this research study were senior management,
high performers, and functional experts. The survey found organizations
using competencies for communicating valued behaviours and organizational
culture (75% agreed competencies have a positive effect),"Raising the bar" of
performance for all employees (59% agreed), emphasizing people (rather than
job) capabilities as a way to gain competitive advantage (42% agreed),
encouraging cross-functional and team behaviour (34% agreed). The report
points out that competency-based HR applications are evolutionary rather
than revolutionary, in that they are treated as add-ons to existing HR
practices. And also noted that competencies tended to highlight organizational
behaviours rather than job-related skills.

Chapter 2
18 Department of Applied Economics, Cochin University of Science and Technology
Quinn et al. (1996)20 subsequently, proposed eight managerial roles as
mentor, facilitator, monitor, coordinator, director, producer, broker and
innovator. Each role is composed of specific competencies, for example, the
role of mentor involves communicating effectively and developing
subordinates. These eight roles reflect two organisational dimensions,
flexibility Vs control and internal Vs external. Depending upon the
organizational goals, the CEO places greater emphasis on certain managerial
roles.
Martin (1997)21, in his study, “The sickening mind: Brain, Behavior,
Immunity, and Disease” named competencies, as believed, are universal,
regardless of context (four competencies under each of three headings labeled
sharpening the focus building commitment and driving for success). In the
study, three kinds of competencies identified that vary as a function of a given
cultural context (business relationships, the role of action and the style of
authority).
Bratton, (1998)22 “Develop a framework of core competencies”
pointed that managerial core competency is any knowledge, skill, trait motive,
attitude, value or other personal characteristics which are essential to perform
a job. To obtain an effective performance, a work organisation needs people,
who have a suitable competency. It is a paradigm shift from old to new
wherein now managements are focused on more humanistic aspect. In the
present regime of globalised business environment, managers should give
more attention and motivation to their employees. Accordingly, managers are
required to have good interpersonal skills.
Gregersen, Morrison, and Black (1998)23 conducted interviews and
gathered data for international managers and identified five characteristics of
Review of Literature
Department of Applied Economics, Cochin University of Science and Technology 19
successful global business leaders; (1) context specific knowledge and skill,
(2) inquisitiveness, (3) personal character (connection and integrity),(4)
duality (the capacity of managing uncertainty and the ability to balance
tension)and (5) savvy (business savvy, political savvy and organisational
savvy).
Rolland Le Brasseur, Huguette Blanco and John Dodge (2002)24 in
their work titled “Competencies of CEOs in Technology – Oriented SMEs
An Exploratory Study of Skills for Survival & Initial Growth” revealed
that in managerial competencies, 14 significant findings were found. When
comparing the fast growth with the survival stage, there was a significant
increase in the importance of the following competencies such as
communicating effectively, developing subordinates, managing organisational
performance, planning and goal setting, delegating effectively, fostering
productive work environment, building/maintaining a power base and creating
change in contrast etc. There was a significant decrease in the importance of the
following competencies such as innovating in products/services, managing
projects, selling and promotion, planning and monitoring cash flows,
perseverance, technical competence and intuition.
Leslie et.al (2002)25 has commented that learning behaviour include
the motivation and skill to work and learn across cultural differences, the
willingness to take the perspective of others and the capacity to learn from
workplace experiences’. These variables have held a tacitly strong position
in the management-development literature and some of the global –
management literature. Resilience refers to the ability to manage time and
stress, factors that might, be more salient in the management task. The third
skill group ‘business knowledge’ represents knowledge of the business
strategies and practices. Therefore, managerial roles stand for behaviour

Chapter 2
20 Department of Applied Economics, Cochin University of Science and Technology
which managers employ to carry out the basic function of their work they
are, managing relationship, managing information and managing action.
Current thought suggests that in a way all of the roles are important for
attaining managerial competencies.
Zeti Akhtar Aziz (2005)26 did an opening speech on “Developing a
robust competency framework for the Malaysian banking industry” at
the Industry Competency Framework Study Focus Group Discussion. In
that session, he narrated that the banking is a knowledge-intensive, skills-
based and relationship-rich industry. In an increasingly complex and a more
liberalised environment, the competitiveness of banking institutions will
depend critically on the quality of human intellectual capital and the extent
to which the industry is able to leverage on these talents. To compete
effectively, banking institutions need professionals with the requisite skills
and expertise not only at the strategic and management level, but also at the
technical and operational level. Successful institutions will be the ones
which accord high priority to effective placements, rewards, retention and
most importantly, life-long learning and the continuous enhancement of
human capital. Life-long learning is becoming increasingly important in this
knowledge-based economy where knowledge and skills need to be
continuously updated and upgraded. At the macro-level, the breadth and
depth of skills of the entire financial services workforce will increasingly be
the defining factor in determining the success in building a more efficient,
effective and dynamic financial sector. The availability of appropriately
trained and competent human resources is a critical factor key to support the
performance of the industry. In essence, continuous strengthening of
intellectual resources and capabilities must be made.

Review of Literature
Department of Applied Economics, Cochin University of Science and Technology 21
Maria Vakola, Klas Eric Soderquist, Gregory P. Prastacos,
(2007)27 "Competency management in support of organisational change"
This paper dealt with analysis of forward‐looking, dynamic and proactive
approach to competency modeling explicitly aligned with strategic business
needs and oriented to long‐term future success. The study is based on a
longitudinal research project by a leading Greek bank, currently undergoing
fundamental corporate restructuring. The paper describes how the
competency model was developed and how it facilitated strategy
implementation and change by supporting communication, employee
understanding of business goals, and the incorporation of new behaviours,
roles and competencies in operations. The major findings are the
organisational core competencies is required for a business to compete
successfully in the banking sector and the skills and behaviours that the
individuals would need to possess in order to produce and support those core
competencies.
Jyothi, P. and Jyothi, V. Sree (2009)28 in their study “HR Issues and
Challenges in Indian Banking Sector” mentioned that over the last three
decades, there has been a remarkable increase in the size, spread and activities
of banks in India. The number of bank branches rose considerably during this
period. The business profile of banks has transformed dramatically to include
non-traditional activities like merchant banking, mutual funds, new financial
services and products and the human resource development. Change is the
only constant factor in this dynamic world and banking is not an exception.
The changes staring in the face of bankers relate to the fundamental way of
banking-which is undergoing rapid transformation in the world of today. The
major challenge faced by banks today is to protect the falling margins due to
the impact of competition. Another significant impact of banks today is the

Chapter 2
22 Department of Applied Economics, Cochin University of Science and Technology
use of technology. There is an imperative need for not mere technology up-
gradation but also its integration with the general way of functioning of
banks. All these are possible with the help of efficient human resource
management. However, the challenges faced in the HR front are numerous
and need to be handled diligently. The paper attempts to identify few HR
challenges in the Indian Banking Context and suggests mechanisms to handle
them.
Naveed Saif et.al (2010)29 “Competency based analysis” The study
was conducted at Bank of Khyber Main Head office, Peshawar with an
object to assess competency based job performance. A stratified random
sample of 60 employees from 200 employees was taken for this study, nine
respondents were from top level, 36 from middle level and 15 respondents
were from lower level of management. Competency was assessed in term of
knowledge, skill and attitude using Likert scale. Chi-square test was used
for hypothesis testing. The results showed that performance and job
satisfaction were strongly associated. Similarly knowledge (shared and
priorities) and skill (training and willingness) were strongly associated with
job performance. However, attitude (tolerated and productive) of the
respondent were insignificantly associated with job performance. Finally, it
is recommended that organization may focus on knowledge, skill and
particularly on attitude by arranging training to improve performance level
of the respondents.
Kumari, Anitha and Sita, V. (2010)30 conducted a study on “Role of
Competencies in Human Resource Management: A Study in Indian
Organizations” had mentioned in their empirical research work that
contemporary organizations are essentially people driven.Creating new forms
of competitive advantage has thus become a major area of concern for

Review of Literature
Department of Applied Economics, Cochin University of Science and Technology 23
organizations. It gets more complex in the contemporary knowledge based
industry with the knowledge workers contributing to the organization in the
form of human capital. The searches for newer forms of competitive
advantage in organizations are seen in the name of competencies at the
individual level. Competencies are a combination of observable and applied
knowledge, skills and behaviors that create a competitive advantage for an
organization. It focuses on how an employee creates value and what is
actually accomplished (Nath & Raheja in, 2004). From a managerial point of
view, very little has so far been achieved with regard to the question of which
competencies create success in the organizations. The same is true in the
scholarly research arena thus making the subject an exciting field of enquiry.
Their study empirically investigated the role of competencies for employee
development in the Indian IT and Pharma Industry. The importance of
competencies in the talent acquisition, talent development and talent retention
was also examined. The data was collected from a randomly selected sample
of 89 employees in the IT and Pharmaceutical industry. The Awareness level
of employees, usage of competencies in the different functions along with
their perceptions has been collected through a specifically designed
questionnaire. Data were content analyzed in a descriptive way with simple
statistical treatment of frequency and percentages using the SPSS package.
The results show the importance of competencies for organizational success.
It also underscores the need for developing/ implementing competency based
approach for effective human resource management.
School of Land Science and Technology (2010)31 conducted a study
on “Employees' career competency in commercial banks”. They reached
the conclusion that the employee's career competency is critical for an
enterprise to survive and develop. By analyzing the components of

Chapter 2
24 Department of Applied Economics, Cochin University of Science and Technology
employee's career competency in commercial banks, they formulated a
suitable development model of career competency for commercial banks, and
also explained its operating mechanism based on human resources disposition
and information flow separately. They figured out professional ability,
leading ability and endogenous quality as employees' career competency in
commercial banks. Therefore, according to them, the main contents of the
development system should involve professional and leading ability. They
proposed a career-competency development system with four basic modules.
The modules proposed are “pre-career development subsystem”, “enterprise
development subsystem”, “individual self-development subsystem” and
“transformation & integration subsystem”. It helps to achieve the intercourse
of employee and information between interior and interior, interior and
exterior, to promote the employee's career competency during the dynamic
process of internal operation and external competition, and eventually
maximizing the effectiveness of human resources development.
Mily Velayudhan T.K (2011)32 conducted a study on “Competency
Mapping of the Employees” pointed that competency mapping is a strategic
HR framework for monitoring the performance and development of human
resource in organizations. Regardless of whatever happens to the future of
software in India, people who are outstanding in their performance will
continue to be in demand and will keep rising and for this, the human resource
of each organization should develop the competencies that they have in order to
compete with the highly competitive market. This conclusion was based on
data from 195 software employees of whom 145 were from Cognizant
Technology Solutions (CTS) and the rest form Hindustan Technology Limited
(HCL). Their competencies were studied in-depth to bridge the gap of the

Review of Literature
Department of Applied Economics, Cochin University of Science and Technology 25
lacking competency that would help the employees to outshine in the
organization to lead its goal through its objectives.
Anathbandhu Patra(2011)33 “Creating more effective HR managers
through Emotional Intelligence skill straining” mentioned in his study is
Emotional Intelligence (EI), unlike Intelligent Quotient (IQ), is important for
managerial success and competencies. Emotional Intelligence is the ability to
monitor one’s own and other’s emotions to discriminate among them. It
involves self-awareness (ability to understand one’s own emotions), self-
management (ability to keep negative emotions and impulses under control),
and self-motivation (the drive to achieve despite setbacks, developing skills to
attain target and taking initiative to act on opportunities). It helps to: (a)
enhance communicating skills, (b) adjust with others, (c) build team, and (d)
manage conflict. Not only do most of us spend the largest portion of our day at
work but our identity, self esteem and well being are strongly affected by our
work experiences. It has been reinforced by self awareness, optimism, and
empathy which can enhance satisfaction and productivity at workplace. The
workplace is the ideal setting for the promotion of these competencies. In the
workplace, this ability can greatly enhance interpersonal communication and
people skills.
Das, Debabrata and Mukherjee, Soumya(2012)34 a study on “A
Competency Mapping Framework for Indian Services Sector” stated that
economic liberalization policies adopted by the lawmakers in the last decade
of the previous century have resulted in steady growth in India's GDP and the
share of services sector in this growth story is remarkable. At present, services
sector contributes to Indian economy in a significant manner by providing
huge employment. The success of a services sector depends on the capacity
and ability of its employees in providing excellent services to the customers.

Chapter 2
26 Department of Applied Economics, Cochin University of Science and Technology
In India, services sector companies ranging from telecom, software to
banking, insurance and financial services face a challenging task to recruit
develop and retain skilled and effective manpower and that is why HR experts
and consultants are worried about the future growth of services sector in
India. In most of the services sector organizations, Competency Mapping is
being used as a process to identify key competencies for the organization
and/or a particular job and based on that the identified competencies are being
incorporated throughout the various processes (i.e. job evaluation, training,
recruitment, etc.) of the firm.
A recent empirical study shows in the context of banking and financial
sector that customers' satisfaction depends heavily on some factors related
with certain skills and behaviours of the employees of the firm. Therefore, it
is necessary to incorporate the customers' views and thoughts in identifying
competencies for a particular job that involves frequent customer interaction.
The study attempted to develop a framework through which the competencies
for a job can be identified from all directions – be it employees or be it
customers and thus the proposed framework makes the competency mapping
process more prudent and effective for the services sector firms in the present
Indian economic scenario.
Nagaraju and Sathyanarayana Gowda (2012)35 a study on
Employee Competency Mapping Strategies at Select Organizations of
Bangalore” concluded that to-day’s business is characterised by global
operations, transitions, paradigm shifts, pressure of competition, wealth
creation, shareholder value creation, customer focus, culture, value-based
products, context-based approach, managing diversity, culture and value driven
and what not. The organizational success earlier depended on physical and
financial assets, today the success solely rely on the intangible ability and

Review of Literature
Department of Applied Economics, Cochin University of Science and Technology 27
capability that lie in the human capital and manifested in the form of
competencies. The methodologies used for the present study are both analytical
& survey. The entire research programme dealt on the linkage of employee
competencies with business strategies and at the same time the linkage
outcomes in terms of individual employee performance and organization
performance. The major findings are:
• Competency is a key behaviour of employee’s in the sample
organizations that enables the superior performance of the organizations
as a whole. It is more pronounced in sample information technology
and foreign banks.
• Two-thirds of the sample firms achieved competitive edge through
developing and sustaining employee competencies in addition to
ability to innovate, ability to adopt new technologies and the ability
to understand the customers and their needs.
Sambasivan (2012)36 conducted an empirical study on “Managerial
Core Competency Perceptions of business executives” undertaken by India
corporate sectors, to determine the competencies required to be successful
business managers in India. It is based on competency research methods
pioneered by United States Geological Survey (USGS). It identified a need to
implement a behaviorally based ‘Core-Competency Model for Managers’
(CCMM). The study commenced by focusing on private companies (India),
Private companies (Multinational) and Public and Government sector
managers. Managers from various business sectors validated the findings. The
study made significant contributions for Team Building, Creative and
innovative Judgment / Decision making, Supervision, Motivation, Flexibility,
Conflict Management, Goal setting, Vision and Mission, Organizing and
Chapter 2
28 Department of Applied Economics, Cochin University of Science and Technology
Control, Delegation of Authority and development of Leadership skills for
successful managerial persons.
Ramakrishna G, Kameswari, Giridhar.M.Kumar And Krishnudu
CH. (2012) 37 conducted a case study on “Effectiveness of training and
development programmes-A case study of Canara bank employees in
Kurnool district in India” mentioned that the banking industry is becoming
more competitive than ever, private and public sector banks are competing
each other to perform well. The executives of the banks are now in the
position to modify their traditional human resources practice in to innovative
human resources practices in order to meet the challenges from other
competitive banks. The Human Resource Development department has to
play a more proactive role in shaping the employees to fight out the
challenges. The banks not only have to make plans and policies and devise
strategies, the actual functionaries have to show competence and effectiveness
in executing the said policies and strategies. In commercial organizations like
banks, HRD departments have the advantage of not being excessively
burdened with day–to–day problems of running the banks or ensuring
profitability of individual transactions. They are in positions to take strategic
and long-term view of the competitive advantage of the human resources as
well as identify areas of professional weaknesses to rectify well before any
damage takes place in the organization. Indeed, they have the excellent
opportunity to implement the desired HR policies to improve and strengthen
the organization to withstand the onslaught of fierce competition in future.
Rama L and Dr. Sarada S (2014) 38 conducted a study on
“Competency mapping of Managers in Textile unit” to find out the
competency level of managers. Competency mapping is used as a tool to
analyse the competency of the managers. To assess the competency, the

Review of Literature
Department of Applied Economics, Cochin University of Science and Technology 29
researcher has identified 33 competencies in to four broad categories such as
functional, analytical, potential and Behavioural. From the analysis, it was
found that the analytical skills were found to be lower (2.99 average score)
and the functional competency to be higher (3.37 average score).It is
concluded that the individual gap analysis and training required in the lowest
competency areas and properly designed activities help to develop the
competencies of the managers .
Job Satisfaction
Gregson (1991)39 in his empirical research work “The Separate
Constructs of Communication Satisfaction and Job Satisfaction” had
mentioned that the most popular and researched measures of job satisfaction
is the Job Descriptive Index (JDI). The author had used a JDI with a 72-item
questionnaire for his study that was an adjective checklist type questionnaire
developed by Smith, Kendall, and Hulin in 1969”. This measure is based on
the five facets of job satisfaction measures.
According to Cranny, C. J, Smith, P. C. and Stone E. F. (1992)40
job-satisfaction is one of the most studied constructs in the areas of
industrial organizational psychology, social psychology, organizational
behavior, personnel and human resource management, and organizational
management. This makes sense in that knowledge of the determinants, the
consequences, and other correlates of job satisfaction can be vital to
organizational success.
The history of job satisfaction stems back to the early 1900 s with the
situations perspective on job satisfaction. This perspective states that
satisfaction is determined by certain characteristics of the job and
characteristics of the job environment itself. This view has been present in

Chapter 2
30 Department of Applied Economics, Cochin University of Science and Technology
the literature since the first studies by Hauser, Taylor and the various
projects at the Western Electric plants in Hawthorne.
According to Tack and Patitu (1992)41 until recently most
researches on job satisfaction were done in the industrial sector with
attempts to adapt the findings to higher education. While the above findings
have relevance, job satisfaction for faculty must be examined. Given the
impending shortage of prospective faculty to fill the numerous vacancies,
the topics of job satisfaction for faculty, recruitment, and retention must be
given attention. Consequently, university officials and current faculty in
higher education must recognize the factors that lead to job dissatisfaction
among faculty and eliminate them; as well as, recognize the factors that
increase job satisfaction and enhance them.
According to Hakim (1993)42 a satisfied employee tends to be absent
less often, to make positive contributions and to stay with the organization
very eagerly. However, a non-satisfied employee may be absent more often,
may experience stress that disrupts co-workers, and may be continually
looking for another job.
Cardona (1996)43 conducted a survey among members of the
Association for Investment Management and Research on “Job Satisfaction
not Due to Cash, Pensions & Investments”. The survey revealed that 81
per cent of the managers were satisfied or very satisfied with their job.
When asked to identify the factors that created positive feelings about their
job, most managers named ‘professional achievement, personal or
professional growth, the work itself and their degree of responsibility’ as
more important than compensation. Factors they viewed as creating negative
feelings about their jobs were ‘company policies, administration,
Review of Literature
Department of Applied Economics, Cochin University of Science and Technology 31
relationships with supervisors, compensation and the negative impact of
work’ on their personal lives.
National Center for Education Statistics (1997)44 had reported on
job satisfaction among American teachers that more administrative support
and leadership, good student behavior, a positive school atmosphere, and
teacher autonomy as working conditions associated with higher job
satisfaction. A weak relationship was found between faculty satisfaction,
salary and benefits. Research also shows that demographic variable such as
age and gender have little or no significant impact on job satisfaction.
Karl and Sutton (1998)45 conducted a study on “Job Values in
Today’s Workforce: A Comparison of Public and Private Sector
Employees”. The study revealed that “From an employee’s standpoint”, say
“job satisfaction is a desirable outcome in itself”. From a managerial or
organizational effectiveness standpoint, job satisfaction is important due to its
impact on (1) absenteeism (2) turnover, and (3) pro-social citizenship
behaviors such as helping co-workers, helping customers, and being more
cooperative. Thus, to redesign jobs, reward systems, and human resource
management policies that will result in optimum job satisfaction and
productivity, managers need to know what employees value.” In order to
know what employees value it is necessary for organizations to assess and
pay attention to current levels of job satisfaction.
Yankelovich Partners (1998)46 surveyed 10,339 workers across 10
European countries and the USA. Across the four major geographic regions
studied, workers specifically emphasized the importance of potential
advancement and the opportunity to build skills as a way to maintain
employability and job security”.

Chapter 2
32 Department of Applied Economics, Cochin University of Science and Technology
Maurice (1998)47 a study on “Happy Workers Miss Fewer Days”
holds the view that in order to decrease some of the negative feelings
towards job and increase productivity it is necessary to reduce the number of
work days employees miss by increasing job satisfaction, redesigning
disability plans and involving supervisors in management.
McDonald and Hutcheson (1999)48 in his on “Employee Loyalty,
Commitment Directly Impact the Bottom Line” have stated that “Research
indicates that customer satisfaction and loyalty are excellent predictors of
profitability…the strongest predictors of customer satisfaction: employees’
general satisfaction with their jobs and employees’ satisfaction with their
work/life balance.” Again, it is important to note that job satisfaction is
subject to change.
According to Wiggins and Bowman (2000)49 current studies on job
satisfaction are plentiful with some interesting results. In one study, the
relationship among career experience, life satisfaction, and organizational
factors for managers of healthcare organizations is explored. Within this study
a two-stage Delphi analysis of American College of Healthcare Executives
(ACHE) members identified nine domains of important job skills, viz.
knowledge, and abilities necessary for success as healthcare managers. The
nine domains, ranked in order of importance, are ‘cost/finance, leadership,
professional staff interactions, healthcare delivery concepts, accessibility,
ethics, quality/risk management, technology, and marketing’.
In their study Wagner and Rush (2000)50 focused on Organizational
Citizenship Behaviors (OCB) analyzing peer ratings of altruistic OCB in a
sample of 96 US nurses. The study showed that the contextual variables such

Review of Literature
Department of Applied Economics, Cochin University of Science and Technology 33
as job satisfaction, organizational commitment, and trust in management were
pertinent for the participants.
Brannigan and Zwerman (2001)51 in their study assumed that when a
certain set of job conditions are present a certain level of job satisfaction will
follow. The Hawthorne Studies are considered as the most important
investigation of the human dimensions of industrial relations in the early 20th
century. They were done at the Bell Telephone Western Electric manufacturing
plant in Chicago beginning in 1924 through the early years of the Depression.
The Hawthorne plant created an Industrial Research Division in the early
1920s. Personnel managers developed experiments to explore the effects of
various conditions of work on morale and productivity.
Bruce and Kay (2002)52 in his study “The Hidden Human
Resource: Shareholder Value Finding the Right Blend of Rewards”
stated that highly satisfied groups of employees’ characteristics are customer
loyalty (56 percent), productivity (50 percent), employee retention (50
percent), safety records (50 percent), profitability (33 percent), (available
through www.gallup.com). A Watson Wyatt Worldwide study found that the
practice of maintaining a collegial, flexible workplace is associated with the
second-largest increase in shareholder value (nine percent), suggesting that
employee satisfaction is directly related to financial gain. Over 40 percent of
the companies listed in the top 100 of Fortune magazine’s “America’s Best
Companies to Work For” also appear on the Fortune 500. While it is possible
that employees enjoy working at these organizations because they are
successful. The Watson Wyatt Worldwide Human Capital Index study
suggests that effective human resources practices like employee satisfaction,
motivation, punctuality lead to positive financial outcomes.

Chapter 2
34 Department of Applied Economics, Cochin University of Science and Technology
According to Robbins et al. (2003)53, job satisfactions can be
defined as an individual’s general attitude towards his or her job. In another
study, Aronson et al. (2005)37 state that job satisfaction plays an important
role in improving the financial standing of organizations. Dissatisfaction
amongst higher-level employees will most likely reflect on lower-level
employees thus resulting in economic, financial and morale problems that
indicate that a positive relationship between job satisfaction and job level
conveys certain economic advantages to business organizations.
Eyupoglu and Saner (2009)54 conducted a study on “Job
Satisfaction: Does Rank Make a Difference?” said that job satisfaction
today is a topic of major interest for many researchers and is an organizational
variable that should be understood and constantly monitored for the welfare
of any organization.
Vijayashree and Jagdish chandran (2011)55 in their study on
“Locus of Control and Job Satisfaction: PSU Employees” attempted to
identify the type of locus of control (i.e. internal or external) present in
Public Sector Units (PSU) in Bangalore, of India, on job satisfaction of PSU
employees. Their research indicates that there is a positive correlation
between internal locus of control and job satisfaction as well as between
external (other) locus of control and job satisfaction. They show that
internal control is the term used to describe the belief that control of future
outcomes resides primarily in oneself and external control refers either to
the expectancy that control is outside of oneself, in the hands of powerful
other people or due to fate/chance.
Akinbobola (2011)56 in his study “Conflict in Human Capital
Relationships: The Impact of Job Satisfaction on Job Involvement in a
Review of Literature
Department of Applied Economics, Cochin University of Science and Technology 35
Workplace” stated that there is significant independent prediction of job
involvement by age, job satisfaction and some characteristics which are
supervision, fringe benefit, contingent reward, operating procedure, co-
workers and communication. She discussed the implications of the result in
line with corporate governance and conflict resolution.
Jain S, Sharma S. and Jain, R. (2011)57 conducted a study on “Job
Satisfaction in Banking: A Study of Private and Public Sector Banks
(Comparative Study)” is of the opinion that job is not only just obeying the
boss; it provides internal satisfaction and is something for which employees
bear to live. Organizations put efforts and provide excellent conditions for
satisfying their employees.
Folami and Bline (2012)58 a study on “Relationship among Job
Satisfaction, Task Complexity, and Organizational Context in Public
Accounting” discussed in their research the evidence on the link between job
satisfaction and employee affective outcomes, including turnover and job
performance. They examined the association between task complexity,
organizational context variables of centralization, organizational complexity,
formalization, and environmental uncertainty with job satisfaction.
2.3 Employee Performance Evaluation
Efficient human resource management i.e., performance analysis and
maintaining higher job satisfaction level in banks determine not only the
performance of the bank but also affect the growth and performance of its
employees’. When thinking about competences, concepts such as
performance and effectiveness are involved because competence is directly
linked with effective performance in complex situations as it is thought to

Chapter 2
36 Department of Applied Economics, Cochin University of Science and Technology
serve as a causal factor for success because “competent performance
presumes competence” (Westera, 2001).
Delaney (1996)59– “Forthcoming Unions, Human Resource
Innovations and Organizational Outcomes” organizations can adopt various
HRM practices to enhance employee skills. First, efforts are on improving the
quality of the individuals hired, or on raising the skills and abilities of current
employees, or both. This can be done by providing comprehensive training on
the job and development activities after selection.
Walker (1998) 60 in his study “Satisfying Employees is a Profitable
Strategy” expressed that “Rewarding employees for work well have done
increases satisfaction and productivity.” Simple practices like this can aid
the atmosphere of the work environment. Metzler (1998)15 cited that
“Giving recognition and rewards outside the paycheck such as recognizing
key employees by name may also help in improving his/her performances.”
Huselid MA, Becker BE, Ulrich D (2001)61 a study on “The HR
scorecard: Linking people, strategy, and performance” said that there is
a positive association between employee participation, empowerment and
organizational performance.
Mejoy Patnaik (2004)62 in his work "Structural changes in banks':
HRM policies and procedures" opined "compensation in most of the banks
now follows low wages and high employment model. The emerging model of
banking would lead to some of the major paradigm shifts in core values
....man power planning, recruitment, training and development, talent
retention, succession planning, performance compensation, reward and
punishment mechanisms are to be reviewed/institutionalized."
Review of Literature
Department of Applied Economics, Cochin University of Science and Technology 37
Janmejaya K. Sinha (2004)63 - 'The challenges in HR and IT"
stated that as for incentive, the present status is tenure based fixed
compensation and poor measurement.
Kazmi R, Amjad S and Khan D. (2008)64 conducted a case study
on “Occupational stress and its effect on job performance: A case
study” said that in workplaces where people are constantly afraid and
insecure, employees are at risk of "turning numb" to protect themselves.
This is clearly seen in the blank faces of sub staff’s, the lack of enthusiasm
by front line workers, and in the remarkably insensitive ways managers and
employees treat each other. The very mechanism, which allows a person to
survive an emotionally painful environment, also makes it difficult for them
to respond sensitively and empathetically towards others. Stress affects
employer’s and employee’s performance which questions the survival of
both because if employees reduce their work efficiency there would be a
great fall in productivity may affect the employer also. This tends to affect
the organizational performance in an increasingly competitive market, but
even jeopardizes their survival.
R.K.Sahu(2009)65 “Competency Mapping” – he pointed that
caompetencies are performance enablers and the key to superior
performances. The major contribution of him was the evaluation of
competency. In addition to competency mapping, a new method Will and
skill mapping was introduced to evaluate the competency of the employees.
There were different variables used for assessing will mapping are attendance,
teamwork, reaction to criticism, discipline, initiative, responsibility, quality of
job and support. Skill assessement is based on the gap analysis between
desired level and actual level performance of employees.

Chapter 2
38 Department of Applied Economics, Cochin University of Science and Technology
Jamal Nazrul Islam et.al (2012)66 in his study “A Study On Job
Satisfaction And Morale Of Commercial Banks Bangladesh” said that in
today’s changing world the business environment is changing rapidly. The
emergence of e-commerce and development of information and technology
plays a significant role in the nature of work as well as their attitude towards
the organization. We have been experiencing a tremendous growth in
banking sector of Bangladesh during the last decade of the twentieth
century. Private commercial bank plays a vital role in the overall
development of our economy. Though it is a challenging profession, people
working in this sector have increased notably during last few years. In
recent time banking sector have become the first choice for career
development. In consideration of that factor, this study investigates job
satisfaction among employees of all public and private commercial bank
limited. The research method used an anonymous survey that was
voluntarily completed and returned to the researcher. The study determined
that morale and job satisfaction plays a vital role in overall performance of
the employees in the workplace. The study also determined that social
status, supportive colleagues and feeling secure about the job were the top
three best reasons for working in the banks. It was also determined that pay,
decision-making authority, and promotional policy were the three top
priorities for improving the work environment.
Conclusion
The above literature survey explained that the importance of human
resources in the banks and different types of competencies needed to the
staffs for their superior performance. Managers need such skills, in order to
build a new organizational culture and meet future challenges. They help

Review of Literature
Department of Applied Economics, Cochin University of Science and Technology 39
organisations to clarify expectations, define future development needs and
do more focused recruitment and development planning. Literature also
pointed that the job satisfaction of the employees is the indicator of the
sound banking system. It depends on the competencies of their employees.
……..……..

Research Design
Department of Applied Economics, Cochin University of Science and Technology 41
The last chapter was a discussion on the review of literature with
respect to the topic of the study. In this chapter, a detailed discussion on the
rationality of the study, research design and the methodology are presented.
3.1 Rationality of the Study
The global banking scenario is currently undergoing radical
transformation owing to the liberalization, privatization and globalization
measures introduced by economies of the world. The Indian banking
industry is not an exception. Banks play vital roles in the economic
development of all countries. After nationalization of the major private
sector banks in 1969, the government of India restricted private participation
in the banking sector. This gave public sector banks complete protection.
However, things changed since 1991. The decades that followed witnessed

Chapter 3
42 Department of Applied Economics, Cochin University of Science and Technology
sea changes in the working of banking sector. The entry of technology has
made tremendous impact and revolutionized the working style of many
public sector commercial banks of India. They started introducing
‘anywhere banking’ and ‘anytime banking’ to meet the growing customer
needs. Rapidly changing market environment, fierce competition in the
field, economic uncertainties, demanding customers force the banks the
banks to excel in providing services to the customers. Customer focus and
customer service has thus become the differentiating factors and the banks
have to equip their employees to meet the new requirements. To excel and
remain competitive in the banking industry it became imperative to deliver
better services to customers than the competitors.
The competitive environment in the banking sector is forcing
individual players to work out differentiated strategies based on their
strengths and market niches. A bank’s competitive status can be determined
by the competency of its employee’s in dealing with its customers. This
largely depends upon the behavior pattern and the soft skills of the
employees. Therefore, employing and retaining skilled workers and
specialists, re-training the existing workforce and promoting a culture of
continuous learning have become a challenge for the banking institutions.
The present study is an attempt to analyze the competency of both
managerial and clerical level employees of the selected Scheduled
Commercial Banks headquartered in Kerala. This is to find out whether
these categories of employees have the required skill sets to meet the
challenges faced by the banking sector and if not what the banks do to equip
them with the required skill sets.
Research Design
Department of Applied Economics, Cochin University of Science and Technology 43
3.2 Conceptual Framework
Banks have become an integral part of every country and they
influence the life of the people. Even before the arrival of British in India,
some kind of banking was practiced in India. But, the scope of such banks
was confined to lending and borrowing and that too was on a limited and
localized scale. During the British rule, banks sector started operations in an
organized manner. But, these banks were in the private sector. After
winning freedom, the Government of India felt the need for introducing
social control on private sector banks. With this end, in view the Reserve
Bank of India started making regulations and supervising operations of the
banks. But, the social control measures did not produce the desired effects.
Therefore, in 1969, the government of India nationalized the leading 14
private sector banks and in 1980, four more banks were nationalized. This
made banking in India almost a monopoly of the state. Thereafter employees
of nationalized banks began to work like government servants having no
regard for their responsibilities to the customers. They used to keep
customers in waiting by indulging in cross talks. There was no human touch
at all in any of their activities.
The year 1991 witnessed the dawn of globalization. The decades that
followed, the banking sector was opened to private players. This led to the
emergence of a set of new generation banks, both Indian and foreign. These
new generation banks created severe competition in the Indian banking
sector. Consequently, the traditional banks started losing their business to
the new generation banks because of the sophisticated methods and
approaches adopted by the new generation banks. This forced traditional
Chapter 3
44 Department of Applied Economics, Cochin University of Science and Technology
banks to make a realistic evaluation about their capability to face the
competition from the new generation banks. The evaluation revealed that a
large number of employees in these banks were not trained in soft skills viz.
communication, human relations, customer service etc. They were also not
exposed to the use of modern technologies in promoting banking activities.
The new generation private banks were far ahead of the traditional banks in
imparting training to their employees in human skills and people skills as
well as the use of modern technology in furtherance of banking activities.
Moreover, the world over, technology driven channels such as, ATM,
net banking and mobile banking have reduced walk-in-customers at the bank
branches. However, in India especially in Kerala, majority of customers are not
accustomed to use this technology based channels and they are more
comfortable with traditional banking to ensure error-free and risk-free banking
service. While struggling to provide better and efficient service at the counters,
the staff is also confronted with various regulatory norms to mitigate risks in
operations. This clearly establishes that employees of scheduled commercial
banks play a vital role in managing not only the ‘transactions’ of a customer but
also future long-term relationship with them. In this respect, the behavioral
competency of employees’ plays an important role.
Literature Review
S. C Gupta (2003) in his Report to the Indian Bankers Association
indicated that the composition of bank staff will change as total
computerization will render a part of the workforce surplus and so banks
will go for a rightsizing exercise. This may be through another round of
Voluntary Retirement Scheme (VRS) or outsourcing or re-deployment of
Research Design
Department of Applied Economics, Cochin University of Science and Technology 45
the existing staff to strengthen the marketing arms. With greater use of
technology, recruitment will mostly be confined to manpower with
specialized skills in technology applications. This can shift commitment of
the employees from the organization to their profession and that could
witness greater lateral movement of banking personnel. Training and skill
development will, however, be continued to be key Human Resource (HR)
functions. With the age profile of staff undergoing changes, banks will have
to focus on leadership development and succession planning. Knowledge
management will become a critical issue.
Study by Ramakrishna. G et.al (2012) revealed that in India the
banking industry is becoming more competitive than ever. Private and
public sector banks are competing to perform well. The executives of the
banks are now in a position to modify their traditional human resources
practice in to innovative human resources practices in order to meet the
challenges from other competing banks. Hence, the Human Resource
Development department has to play a more proactive role in shaping the
employees to fight out the challenges. The banks not only have to make
plans and policies and devise strategies, the actual functionaries have to
show competence and effectiveness in executing the said policies and
strategies. Jyothi P and Jyothi V Sree (2009) and Das et.al (2012) stated that
the success of the banking sector depends on competency of the employees
in providing excellent services to the customers. So the assessment of
competency is needed. R.K.Sahu (2009) and Naveed Saif et.al (2010)
among the different competencies, behavioral competency and its
assessment is an essential for employee performance. The conceptual
framework for the study (Exhibit 3.1) is framed based on the understanding
of the above developments.

Chapter 3
46 Department of Applied Economics, Cochin University of Science and Technology
Exhibit: 3.1 Measure of Banking Employees’ Behavioural Competency
The present study aims at analysing the importance of employee competency evaluation during selection process, job design, performance appraisal, career development, promotion and pay, superior subordinate

Research Design
Department of Applied Economics, Cochin University of Science and Technology 47
relations and participations, training & development, prominent behavioural competencies accessed and level of satisfaction that contribute to their behavioural competency.
3.3 Area of the Study
In India, when compared to other states, Kerala boasts of a well-developed banking infrastructure. With progress of time, Kerala banking system has attained a high benchmark. Commercial banks play a vital role in the economic growth and overall development of the state of Kerala. So the area covered in this study is the various branches of the five commercial banks headquartered in Kerala, namely the State Bank of Travancore, the Federal Bank, the Dhanlaxmi Bank, the Catholic Syrian Bank and the South Indian Bank.
Exhibit: 3.2 Brief Profile of Banks Headquarter In Kerala
Name of the Bank Year of Starting
Place of Origin Profile
Catholic Syrian Bank Limited 1920 Kerala
Catholic Syrian Bank Limited is a private sector bank situated in Thrissur City of Kerala state in India, Catholic Syrian Bank has 383 branches, and over 194 ATMs, and a net profit of `. 36.56 crore in 2007-08 on revenues of `.50 crore. Catholic Syrian Bank has a strong presence in rural India and around 80% of the bank’s branches are located in the semi-urban and rural areas of India.
Dhanalakshmi Bank Limited 1927 Kerala
Dhanlaxmi Bank Ltd is an old private sector bank headquartered in Thrissur City of Kerala state in India. The bank was focusing mostly on Southern states like Karnataka, Tamil Nadu, Andhra Pradesh and Kerala but it is looking for a pan India presence since the last few years.
Federal Bank 1931 Kerala
Originally known as Travancore Federal Bank. Federal bank is a regional banking giant with strong national presence and global reach. From its humble beginning as Travancore Federal Bank Ltd, Federal Bank has grown to become India's largest private sector bank and is now the largest scheduled commercial bank in Kerala. For well over 5 decades Federal Bank has been known in Kerala for outstanding quality in financial products and services. Federal is unique on several fronts. Its pioneering spirit, customer focus, will to adopt and absorb positive trends, high productivity, professional management etc., are some of the facets of its uniqueness.
South Indian Bank Limited 1929 Kerala
South Indian Bank Limited (SIB) is a private sector bank headquartered at Thrissur City in Kerala, India. South Indian Bank has 750 branches spread across more than 26 states and union territories in India. It has set up 785 ATMs all over India.
State Bank of Travancore 1945 Kerala
Originally known as Travancore Bank Ltd.State Bank of Travancore (SBT), is a subsidiary of the State Bank Group and also has private share-holders. It is the premier bank of Kerala, India, where it has 676 branches. Overall, SBT has a network of over 879 branches spread over 16 Indian states.
http://en.wikipedia.org/wiki/Banking_in_Kerala

Chapter 3
48 Department of Applied Economics, Cochin University of Science and Technology
3.4 Sample Framework
For this study, a multistage sampling technique was used. In the first stage, all the commercial banks headquartered in Kerala namely the State Bank of Travancore, the Federal Bank; the Dhanlaxmi Bank, the South Indian Bank and the Catholic Syrian Bank are taken for the study. In the second stage by using lottery method the researcher chose ten percent of the branches of these banks. That came to 197 bank branches. The split up is State Bank of Travancore (68 branches), Federal Bank (52 branches), Dhanlaxmi Bank (15 branches), Catholic Syrian Bank (25 branches) and South Indian Bank (37 branches). The selected branches of the banks are given in Table 3.1.
Table 3.1: Sample Framework
Strata Actual Population of
Bank Branches Sample Population of Bank
Branches Value % Value %
State Bank of Travancore 676 34.63 68 34.52
Federal Bank Limited 518 26.54 52 26.40
South Indian Bank Limited 367 18.80 37 18.78
Catholic Syrian Limited 246 12.60 25 12.69
Dhanlaxmi Bank Limited 145 7.43 15 7.61
Total 1952 100 197 100
Source: www.rbi.org.in.
In the third stage, the target respondents of the selected branches of the
banks were stratified in to two groups-- managers and clerical staff. Then
from each stratum, the respondents were chosen by applying the lottery
method. From each bank branch, a sample of two higher officials in
administrative carder and three clerk level officers were chosen as the sample
population that is in the ratio of 40:60 (forty per cent of senior officials and 60
per cent of junior officials). The number of respondents selected from each
stratum of the selected branches of the banks is shown in Table 3.2.

Research Design
Department of Applied Economics, Cochin University of Science and Technology 49
Table 3.2 Sample Framework
Strata Sample Population of
Bank Branches Managerial Staff
(Values in Number)Clerical Staff
(Values in Number) Value % Value % Value %
State Bank of Travancore 68 34.52 136 34.52 204 34.52
Federal Bank Limited 52 26.40 104 26.40 156 26.40
South Indian Bank Limited 37 18.78 74 18.78 111 18.78
Catholic Syrian Limited 25 12.69 50 12.69 75 12.69
Dhanlaxmi Bank Limited 15 7.61 30 7.61 45 7.61
Total 197 100 394 100 591 100
Source: As per Employee Enrollment Recorded in Official Attendance Ledger
Out of 985 bank officers were surveyed. This included 591 clerical
staff and 394 officers. With the support of a well-structured questionnaire,
information was collected from the selected respondents. At the end of data
collection, it was found that 94 questionnaires were found either missing or
unfilled. These questionnaires were deducted from the actual sample and
the effective sample for the study was restricted to 369 Managerial officers
and 522 clerical staffs. The overall response rate was thus 90.46 percent
(891/985), which was considered satisfactory for subsequent analysis.
3.5 Data Collection
The data collection for the study was conducted at two stages. In the
first stage, the researcher concentrated on desk research. Thus, data were
collected from bank reports, RBI database, HRM reports published in journals,
magazines and web sites related to the problem. In the second stage, data were
collected from the respondents using well-structured questionnaires.
3.6 Data Collection Period
Data were collected for the period 2001-02 to 2012-13. The various
sources of data were the Data Bank on Indian Commercial Banks published
Chapter 3
50 Department of Applied Economics, Cochin University of Science and Technology
by the Indian Banks’ Association, the Statistical Tables Relating to Banks in
India published by the Reserve Bank of India for various years and the
website of the Reserve Bank of India.
3.7 Data Collection Tool Framing
Two questionnaires are used for data collection. One questionnaire is
for collecting information from managerial staff and the second one for
collecting information from the clerical staff. The time series data about the
employee performance are collected from the website of the Reserve Bank
of India for a period of twelve years.
• Queries related to socio-economic and job profile of the employees
to gather information about age, gender, educational qualifications,
designation, mode of entry to current designation, experience length
and salary scale.
The following variables are framed to evaluate how far competency
aspect is considered in banks:
• Queries related to consideration of competency in employee
selection, Job design, Performance appraisal, Career development,
Promotion &Pay structure, Training & Development and inter-
personnel relationship.
• Employees’ level of satisfaction towards organisation, pay,
promotion, job and work conditions and inter-personnel
relationships are measured with four-point scale.
• Individual competency is measured based on Will parameter. It
contained information on eight important behavioural competency

Research Design
Department of Applied Economics, Cochin University of Science and Technology 51
aspects such as Attendance, Team Work, Reaction to Criticism,
Discipline, Initiative, Responsibility, Quality job and Support.
• Employee Skill assessment is done based on desired and actual
performance. Through the discussion bank managerial officials, the
areas are decided such as Marketing transfer, Retail and loans, NRI
banking, Customer relationship, Commercial purpose, Billing,
Personal loan, Deposits, Legal, Savings, Cash present, Advances,
Credit, Loans and advances and gold loan.
3.8 Stationarity Test and Unit Root Test
The stationarity of the data were checked using unit root test to
avoid spurious results. Augmented Dickey-Fuller (ADF) test is used for co-
integrating the data (Gujarati, 2003).The researcher has checked the unit
root of 5 percent critical τ value of different levels. The stationarity of a
variable is proved only when the estimated value is lesser than the critical
value at 5 percent levels of significance.
Table 3.3 to Table 3.7 present the results of ADF test with respect to
the performance of employees in the selected banks.
Table: 3.3 Unit Root/Co-Integration Results of State Bank of Travancore Employee Performances
Variables UT(-1) (τ) D(UT(-1))
(τ) D(UT(-1),2)
(τ) Critical
Value (5%) Results
Number of employees -.76163 - - -4.0816 Stationary
Business per employee - .99886 - -4.0816 Stationary
Deposits per employee - - 1.6241 -4.0816 Stationary
Investments per employee - .80901 - -4.0816 Stationary
Advances per employee - 1.4873 - -4.0816 Stationary
Gross profit per employee - 1.0416 -4.0816 Stationary
Net profit per employee - - .62207 -4.0816 Stationary
Spread per employee - - .76987 -4.0816 Stationary
Source: RBI (2001-13)

Chapter 3
52 Department of Applied Economics, Cochin University of Science and Technology
The stationarity test was conducted for eight variables to ascertain
first, second and third differences. The test shows that in the case of State
Bank of Travancore employee performance is significant at first differences
for one variable number of employees. At second difference, there are four
variables: business per employee, investments, advances and gross profit per
employee and in third differences three variables are listed. They are
deposits, net profit and spread per employee. Table: 3.4 Unit Root/Co-Integration Results of Federal Bank Limited Employee Performances
Variables UT(-1) (τ) D(UT(-1)) (τ)D(UT(-1),2)
(τ) Critical
Value (5%) Results
Number of employees - 1.3700 - -4.0816 Stationary
Business per employee - .85719 - -4.0816 Stationary
Deposits per employee - 1.0190 - -4.0816 Stationary
Investments per employee - 1.2236 - -4.0816 Stationary
Advances per employee - 1.4498 - -4.0816 Stationary
Gross profit per employee - .88236 - -4.0816 Stationary
Net profit per employee - .79478 - -4.0816 Stationary
Spread per employee - .72491 - -4.0816 Stationary
Source: RBI (2001-13)
Table 3.4 indicates the result of Augmented Dickey-Fuller (ADF)
test with respect to Federal Bank Employees. From the ADF test analysis, it
is inferred that the stationarity tests for eight variables are derived at first,
second and third differences. The time series data collected for employee
performances of Federal Bank Limited are observed to be significant at
second differences for all the eight variables considered for the analysis.

Research Design
Department of Applied Economics, Cochin University of Science and Technology 53
Table: 3.5 Unit Root/Co-Integration Results of Dhanlaxmi Bank Limited Employee Performances
Variables UT(-1) (τ) D(UT(-1))
(τ) D(UT(-1),2)
(τ) Critical Value
(5%) Results
Number of employees - .803 - -4.0816 Stationary
Business per employee - .9120 - -4.0816 Stationary
Deposits per employee - .8900 - -4.0816 Stationary
Investments per employee - .7790 - -4.0816 Stationary
Advances per employee - .9250 - -4.0816 Stationary
Gross profit per employee - -.1800 - -4.0816 Stationary
Net profit per employee - -.5790 - -4.0816 Stationary
Spread per employee - .6170 - -4.0816 Stationary
Source: RBI (2001-13)
Table 3.5 indicates the result of Augmented Dickey-Fuller (ADF)
test. From the above test analysis it has inferred that the stationarity tests for
eight variables are derived at first, second and third differences. The time
series data collected for employee performances of Dhanlaxmi Bank
Limited are observed to significant at second differences for all the eight
variables considered for analysis.
TABLE: 3.6 Unit Root/Co-Integration Results of Catholic Syrian Limited Employee Performances
Variables UT(-1) (τ) D(UT(-1))
(τ) D(UT(-1),2)
(τ) Critical Value
(5%) Results
Number of employees -.3720 - - -4.0816 Stationary
Business per employee .9500 - - -4.0816 Stationary
Deposits per employee - .3140 - -4.0816 Stationary
Investments per employee - - -.0160 -4.0816 Stationary
Advances per employee - -.0420 - -4.0816 Stationary
Gross profit per employee - - .0030 -4.0816 Stationary
Net profit per employee -.1120 - - -4.0816 Stationary
Spread per employee - .2210 - -4.0816 Stationary
Source: RBI (2001-13)

Chapter 3
54 Department of Applied Economics, Cochin University of Science and Technology
Table 3.6 presents the result of ADF test. From the test analysis it has
inferred that the stationarity tests for eight variables are derived at first,
second and third differences. The time series data collected for employee
performances of Catholic Syrian Bank Limited are observed to significant at
first differences for three variables number of employees, business and net
profit per employee. At second differences there are three variables:
deposits, advances and spread per employee and in third differences two
variables are listed, they are investment and gross profit per employee.
Table: 3.7 Unit Root/Co-Integration Results of South Indian Bank Limited Employee Performances
Variables UT(-1)
(τ) D(UT(-1))
(τ) D(UT(-1),2)
(τ) Critical
Value (5%) Results
Number of employees - .9770 - -4.0816 Stationary
Business per employee - .9760 - -4.0816 Stationary
Deposits per employee - .8890 - -4.0816 Stationary
Investments per employee - .9730 - -4.0816 Stationary
Advances per employee - .8650 - -4.0816 Stationary
Gross profit per employee - .7900 - -4.0816 Stationary
Net profit per employee - .9780 - -4.0816 Stationary
Spread per employee - .9110 - -4.0816 Stationary
Source: RBI (2001-13)
Table 3.7 indicates the result of ADF test. From the test analysis it
has inferred that the stationarity tests for eight variables are derived at first,
second and third differences. The time series data collected for employee
performances of South Indian Bank Limited are observed to significant at
second differences for all the eight variables considered for analysis.
3.9 Reliability and Validation Measures
The reliability of an indicator is defined as its overall quality,
i.e. its consistency and its ability to give the same results in repeated

Research Design
Department of Applied Economics, Cochin University of Science and Technology 55
measurement. The most outstanding feature of reliability is the test-
retest correlation of the specific measure under scrutiny. It is well-
known that minor differences in circumstances and technical features
of the specific questionnaire used, affect the reported causes for stress,
its level of occurrence and coping strategies. Correspondingly, the
test-retest correlation for most single-item measures is presented
following table.
Table: 3.8 Cronbach’s Alpha for the Variables
General Variables Number of items Range
Officers Clerical staff Cronbach’s
alpha Cronbach’s
alpha Employee selection 2 1-5 .812 .736
Job Design 2 1-5 .807 .725
Performance appraisal 2 1-5 .868 .813
Career development 2 1-5 .864 .787
Promotion and pay 3 1-4 .863 .792
Superior subordinate relationship& participations 2 1-4 .862 .776
training & development 1 1-4 .867 .785
Level of satisfaction 5 1-4 .866 .768
Attendance 1 1-5 .868 .787
Team Work 1 1-5 .896 .712
Reaction to Criticism 1 1-5 .840 .766
Discipline 1 1-5 .845 .764
Initiative 1 1-5 .815 .742
Responsibility 1 1-5 .816 .763
Quality job 1 1-5 .815 .753
Support 1 1-5 .846 .771
Source: Computed from Primary Data
The most widely used measure to assess the internal consistency of
constructs is Cronbach’s alpha. The generally agreed upon value of

Chapter 3
56 Department of Applied Economics, Cochin University of Science and Technology
Cronbach’s alpha is 0.70, although it may decrease to 0.60 in case of
exploratory research (Hair et al. 2006; p. 137). In this study, the reliability
measure for the whole scale is 0.852 for senior and .770 for junior officers,
which is acceptable. Again the reliability for all the constructs is shown in
Table 3.3; the values for all the constructs range between 0.815- 0.896 for
senior officers and .712-.813 in the case of junior officers, which is
acceptable. Hence, construct reliability in this research is satisfactory. The
result of Cronbach’s alpha draws a significant amount of correlation
between the variables tested. The validity of a test is the extent to which
differences in scores reflect differences in the measured characteristic.
Predictive validity is a measure of the usefulness of a measuring instrument
as a predictor. Proof of predictive validity is determined by the correlation
between results and actual behavior. Construct validity is the extent to
which a measuring instrument measures what it intends to measure.
The primary data for this study are collected through a structured
questionnaire to answer the research questions and objectives. The
structured questionnaire consists of 13 distinct sections each of which
contains queries pertaining to personal and job profile of the bank officers
and staffs, importance of the competency in the present environment of the
bank, Will competency parameter assessment and future expected job
growth. The secondary data needed for the study were sourced from various
magazines, journals, internet and thesis works. The data collected are
analysed and tabulated with help of SPSS package version 19.

Research Design
Department of Applied Economics, Cochin University of Science and Technology 57
3.10 Statistical Tools Applied in the Study
For the application of statistical tools, the data collected were
classified and tabulated.
• Summary statistics was applied to measure mean, SD and CV to find
the variation between or among the employee performance parameters.
• The measure of Dispersion, Co-efficient of variance, ACGR and
financial trend were used to depict employee performance under
various parameter from 2001-2013.
• The frequency distribution of the variables has helped the researcher
to calculate distribution value of variables tested.
• Weighted arithmetic means and scaling techniques helped in
interpreting the averages.
• One-way ANOVA test was applied to measure the association
between demographic and socio-economic status and employees’
competency level in selected banks.
• Paired ‘t’ test is applied to measure superior and subordinate’s
understanding on each other’s performances.
• Same test is applied to measure the existing gap between employees’
desired level of competency and the actual level and the importance of
evaluation of competencies during HR practices.
• With the help of Rotation Factor analysis, employee’s competency
differs from one bank to another were proved.
…….. ……..

Banking System in India and the Need for Enhancing Behavioural Competency…………….
Department of Applied Economics, Cochin University of Science and Technology 59
After discussing the research methodology in the last chapter here it
is proposed to discuss the HRM practices adhered in Indian banking sector
and the level of employee competency that currently prevail in this sector.
4.1 Overview of Banking in India Banking System is the backbone of every country’s economy. It is
generally agreed that a strong and healthy banking system is a prerequisite
for sustainable economic growth and development. Banks play a substantial
role in capital accumulation, firm’s growth and economic prosperity. A
sound and profitable banking system always supports to face the negative
shocks and contribute to the stability of the financial system. Banks are in a
business that receive deposits or liabilities and issue debt securities on the

Chapter 4
60 Department of Applied Economics, Cochin University of Science and Technology
one hand and create or invest in assets on the other. A bank collects the
savings and disburses the same in various productive sectors.
The Indian Banking sector has played a commendable role in sustaining
growth in the economy. In the recent, a large part of the growth of the banking
sector was energised by financing consumption, as reflected in the growth of
retail banking. Profitability, viability and development of financial institutions
are directly affected by the quality and performance of advances. Indian banks
are weighted down by enormous amounts of bad debts that threaten the very
health of the banking system. In fact, banks extended large number of loans to
all sector at the request of ruling governments and policy makers, but their
experience with these borrowers has not been satisfactory.
The new economic reforms have given a new thrust to the Indian
banking sector as a whole and private sector banks in particular. The banking
system in the country has undergone a sea - change with the introduction of
prudential norms on income recognition, asset classification and their
provisioning. In spite of commanding role of the Indian banking sector in the
last five decades under the competitive global environmental conditions, the
banking sector currently suffers from a number of weakness such as low
recovery rate of credit, high costs, poor management practices, trade union
pressures, political interferences, unprofitable branches and mounting Non-
Performing Assets (NPAs).
4.2 Changing Role of Banks in India In a developing country, banking is seen as an important instrument
of development. The role of banks in India has changed a lot since the
economic reforms of 1991. These changes came due to LPG, i.e.
liberalization, privatization and globalization policy being followed by

Banking System in India and the Need for Enhancing Behavioural Competency…………….
Department of Applied Economics, Cochin University of Science and Technology 61
Government of India. Since then most traditional and outdated concepts,
practices, procedures and methods of banking have changed significantly.
Today, banks in India have become more customer-focused and service-
oriented than they were prior to 1991. They now also give a lot of
importance to their rural customers. They are even willing to help them and
serve regularly the banking needs of country-side India. The changing role
of banks in India can be glanced in points depicted in exhibit 4.1
Exhibit: 4.1 Changing Role of Banks in India
Exhibit 4.1 indicates that the role of banks in India is changing. Now
let's note the changes taking place in the Indian banking sector.

Chapter 4
62 Department of Applied Economics, Cochin University of Science and Technology
Better Customer Service
Before 1991, the overall service provided by banks in India was very
poor. There used to be very long queues (lines) to receive payment for
cheques and to deposit money. In those days, some bank’s staffs were very
rude to their customers. However, all this changed remarkably, after India
initiated economic reforms in 1991. Banks in India have now become very
customer and service focused. Their service has become quick, efficient and
customer-friendly. This positive change is mostly due to rising competition
from new generation private banks and the initiation of Ombudsman Scheme
by the RBI.
i. Mobile Banking
Under mobile banking service, customers can easily carry out major
banking transactions by simply using their cell phones or mobiles. Here,
first a customer needs to activate this service by contacting his bank.
Generally, bank officer asks the customer to fill a simple form to register
(authorize) his mobile number. After registration, this service is activated,
and the customer is provided with a username and password. Using secret
credentials and the registered phone, customer can now comfortably and
securely find his bank balance, transfer money from his account to another,
ask for a cheque book, stop payment of a cheque, etc. Today, almost all
banks in India provide mobile-banking service.
ii. Bank on Wheels
The 'Bank on Wheels' scheme was introduced in the North-East
Region of India. Under this scheme, banking services are made accessible to
people staying in the far-flung (remote) areas of India. This scheme is a
generous attempt to serve banking needs of rural India.
Banking System in India and the Need for Enhancing Behavioural Competency…………….
Department of Applied Economics, Cochin University of Science and Technology 63
iii. Portfolio Management
In portfolio management, banks do all the investment work of their
clients. Banks invest their clients' money in shares, debentures, fixed
deposits, etc. They first enter a contract with their clients and charge them a
fee for this service. Then they have the full power to invest or disinvest their
clients' money. However, they have to give safety and profit to their clients.
iv. Issue of Electro-Magnetic Cards
Banks in India have already started issuing Electro-Magnetic Cards
to their customers. These cards help to carry out cashless transactions, make
an online purchase, avail ATM facility, book a railway ticket, etc. Banks
issue many types of electro-magnetic cards, which are as follows:
a) Credit cards help customers to spend money (loaned up to a certain
limit as previously settled by the bank) which they don't have in
hand. They get a monthly statement of their purchases and
withdrawals. Along with the transacted amount, this statement also
includes the interest and service fee. The entire amount (as reflected
in the statement of credit card) must be paid back to the bank either
fully or in installments, but before due date.
b) Debit cards help customers to spend that money which they have
saved (credited) in their individual bank accounts. They need not
carry cash but instead can use a debit card to make a purchase (for
shopping) and/or withdraw money (get cash) from an ATM. No
interest is charged on the usage of debit cards.
c) Charge cards are used to spend money up to a certain limit for a
month. At the end of the month, customer gets a statement. If he has
Chapter 4
64 Department of Applied Economics, Cochin University of Science and Technology
a sufficient balance, then he only had to pay a small fee. However, if
he does not have a necessary balance, he is given a grace period
(which is generally of 25 to 50 days) to repay the money.
d) Smart cards are currently being used as an alternative to avail
public transport services. In India, this covers Railways, State
Transport and City (Local) Buses. Smart card has an integrated
circuit (IC) embedded in its plastic body. It is made as per norms
specified by ISO.
e) Kisan credit cards are used for the benefit of the rural population of
India. The Indian farmers (Kisans) can use this card to buy
agricultural inputs and goods for self-consumption. These cards are
issued by both Commercial and Co-operative banks.
v. Universal Banking
In India, the concept of universal banking has gained recognition
after the year 2000. The customers can get all banking and non-banking
services under one roof. Universal bank is like a super store. It offers a wide
range of services, including banking and other financial services like
insurance, merchant banking etc.
vi. Automated Teller Machine (ATM)
There are many advantages of ATM. As a result, many banks have
opened up ATM centers to offer convenience to their customers. Now banks
are operating ATM centers not only in their branches but also at public
places like airports, railway stations, hotels, etc. Some banks have joined
together and agreed upon to set up common ATM centers all over India.

Banking System in India and the Need for Enhancing Behavioural Competency…………….
Department of Applied Economics, Cochin University of Science and Technology 65
vii. Internet Banking
Internet banking or E-banking or net banking: Under this system, the
customer can do banking transactions through the medium of the internet or
World Wide Web (WWW). The customer need not visit the bank's branch.
Through this facility, the customer can easily inquire about his bank
balance, transfer funds, request for a cheque, book, etc. Most large banks
offer this service to their tech-savvy customers.
viii. Encouragement to Bank Amalgamation
Failure of banks is well protected with the facility of amalgamation.
Therefore, depositors need not worry about their deposits. When weaker
banks are absorbed by stronger banks, it is called amalgamation of banks.
ix. Encouragement to Personal Loans
Today, the purchasing power of Indian consumers has increased
dramatically because banks give them easy personal loans. Generally,
interest charged by the banks on such loans is very high. Interest is
calculated on reducing balance. Large banks offer loans of huge amount like
rupees one crore and above. Some banks even organise Loan Mela (Fair)
where loans are sanctioned on the spot to deserving candidates after they
submit proper documents.
x. Marketing of Mutual Funds
A mutual fund collects money from many investors and invests the
money in shares, bonds, short-term money market instruments, gold assets;
etc. Mutual funds earn income by interest and dividend or both from its
investments. It pays a dividend to subscribers. The rate of dividend
fluctuates with the income on mutual fund investments. Now banks have
Chapter 4
66 Department of Applied Economics, Cochin University of Science and Technology
started selling these funds in their own names. These funds are not insured
like other bank deposits. There are different types of funds such as open-
ended funds, closed-ended funds, growth funds, balanced funds, income
funds, etc.
xi. Social Banking
The government uses the banking system to alleviate poverty and
unemployment. Many social development programmes are initiated by the
banks from time to time. The success of these programmes depends on
financial support provided by the banks. Banks supply a lot of finance to
farmers, artisans, scheduled castes (SC) and scheduled tribe (ST) families,
unemployed youth and people living below the poverty line (BPL).
In the context of the scenario explained the need for enhancing
competency of the banking staff has become imperative.
4.3 Importance of HRM Practices
Human resource management is developed as a part of management.
In simple sense, human resource management means employing people,
developing their resources, utilizing, maintaining and compensating their
services in tune with the job and organizational requirements with a view to
contribute to the organization, individual and the society. Human resource is
an important asset for any organization. Human resources are a private
variable without which the inanimate assets are worthless. Human resources
are also known to be as people management. HR is the bridge between
people and management of the company. In earlier days, personnel
department dealt only with the administration of people oriented activities.

Banking System in India and the Need for Enhancing Behavioural Competency…………….
Department of Applied Economics, Cochin University of Science and Technology 67
Later emerging trends of people resources plays a major role in
organization development. Corporate started to think personnel department as
valuable one. Modern concepts evolved in the human resources in order to
use personals of organization in more effective manner. Organization started
to give importance to employee’s problems like stress, conflicts, team
building, interpersonal and intra-personal relationships due to various reasons
like attrition rate, demand for knowledge, to meet globalization, training
overheads etc. But no single rigid system is followed in industries. HR system
differs from industry to industry and even from company to company.
In today’s global and competitive business environment, to thrive,
organizations need highly competent employees. The capabilities of its
employees decide if an industry succeeds in business or buckles up under
intense competition. But, many industries are finding it difficult to
determine whether employees have the capabilities needed for success. The
capabilities needed vary from one business unit to another and even across
roles within a business unit. So, many industries now a days use
competency models to identify the knowledge, skill and personal
characteristics required to perform a job successfully.
4.4 HRD in Indian Banking Sector
Human Resource Development (HRD) has assumed considerable
importance in the recent years. In business organization or a bank, the
development of human resource is necessary for its efficient and effective
working. Liberalisation of Indian economy has not only triggered changes in
the whole economy, including the banking sector, but has also thrown up
challenges for banks, in general, and public sector banks, in particular.
Human Resource Management (HRM) is an important element in the
Chapter 4
68 Department of Applied Economics, Cochin University of Science and Technology
business process evolution, post-liberalisation, has given a strategic
telescopic focus is subject to debate.
During the post liberalization period, banks faced various HR issues.
Some of these are:
i. Changed business positioning is to align with the global players
and technology to implement the business positioning
ii. Repositioning of the people in the organisation to effect the
changing banking paradigm
iii. The real challenge for Indian banks, how to transform into global
corporations without losing the positive values and culture that
they have developed
iv. As most part of the jobs in banks are monotonous/repetitive and
routine, the HRD Department has to empower, engage and
energize employees to create effectiveness and efficiency through
motivation organizational structures, systems & procedures which
facilitate of these the need to focus greater attention on these
aspects of the industry
v. The emergence of a core and peripheral workforce in many
organization has presented new challenges for HR managers of
public & private sector organizations that are fast becoming
diverse communities for core workers, flexibly employed casual
and part-time workers, consultants, contractors & business partners
vi. Certain rigidities have also developed in HRD within banking
system itself because this industry is largely in the public sector

Banking System in India and the Need for Enhancing Behavioural Competency…………….
Department of Applied Economics, Cochin University of Science and Technology 69
vii. New generation private banks entered with clear business
positioning (investment, retail, and corporate banking) and to a
certain extent lured away the cream of experienced and trained
human resource in the respective fields from public sector banks
(PSBs) and that too in the lower and middle management levels
(that constituted the core customer relations human resource) and
viii. the training establishments need to be actively involved in the
total training process starting from the identification of training
needs, evaluation of training.
The core function of HRD in the banking industry is to facilitate
performance improvement and enhance employee competency, measured not
only in terms of financial indicators of operational efficiency but also in terms
of the quality of financial services provided. Factors like skills, attitudes and
knowledge of the human capital play a crucial role in determining the
competitiveness of the financial sector. The quality of human resources
indicates the ability of banks to deliver value to customers. Capital and
technology are replicable but not the human capital that needs to be valued as
a highly valuable resource for achieving the competitive edge. The primary
emphasis needs to be on integrating human resource management strategies
with the business strategy. HRM strategies include managing change, creating
commitment, achieving flexibility and improving teamwork.
4.4.1 Role of HRM in Banks
The banking industry is a highly regulated powerhouse that stabilizes
the economic environment of nations around the world. Banks store
sensitive, personal information about their clients, and commercial banks
often house more valuable inventory -cash - than other retail operations.

Chapter 4
70 Department of Applied Economics, Cochin University of Science and Technology
Bank employees, from executives to tellers, must have a higher level of
integrity and trustworthiness than employees in most other industries
• Select, identify and develop the right person for the right job.
• Retain the competent employees in rapidly changing technological
environment.
• Creating work culture provides such a working environment where
people feel satisfied and enjoy their work.
• To educate and to bring about the changes in the attitudes managerial
personnel towards human resource approach.
• Framing human resource policies and strategies according to the
needs and expectations of various people in the organization
• Develop a two-way communication system.
• Ensure the punctuality and regular attendance of the staff.
• To appraise the performance of the Branch staff in a timely and fair
manner and ensure safekeeping of the filled Appraisal forms.
• Ensure proper maintenance of leave/ service /contract records of
each employee.
• Allocate staff responsibilities for efficient and effective implementation
of the operational plan / accounting / administrative work.
4.5 Need of Employee Competency
India is fast emerging as a Human Resource Powerhouse for the
world where 11 million workforces is getting added to the job market every
year. This paves way for tough competition that will result in high demand

Banking System in India and the Need for Enhancing Behavioural Competency…………….
Department of Applied Economics, Cochin University of Science and Technology 71
and expectation from the organisations. With high demand on job
requirements, employees should prepare themselves for this scenario and
hone the skills accordingly. As corporate India is becoming more global and
diverse, organisations across industry sectors are recruiting talents from
various geographies. Companies are therefore looking for employees with
effective social skills who can fit into the organisation's culture. Thus, in
short, it can be said that employers now-a-days are making higher demand
from their employees’ competencies than five years ago and job
requirements are likely to become even more demanding in the next 5 years.
4.5.1 Employee Competency in Banking Sector
The banking scenario in India is at cross roads and is continuously
evolving, but the progress has been remarkable over the decade with the
level of competition increasing in the banking industry. “Competency is a
set of skills, related knowledge and attitudes that allow an individual to
perform a task or an activity within a specific function or job”. Banking
industry moves from a transaction-centric to a relationship-centric business
approach. Competency is a standardized requirement for an individual to
perform a specific job. It encompasses a combination of knowledge, skills
and behavior utilized to improve performance. More generally, competency
is the state or quality of being adequately or well qualified, having the
ability to perform a specific role.
For instance, management competency includes the traits of systems
thinking and emotional intelligence, and skills in influence and negotiation.
A person possesses a competency as long as the skills, abilities, and
knowledge that constitute that competency are a part of that person,
enabling the person to perform effective action within a certain workplace

Chapter 4
72 Department of Applied Economics, Cochin University of Science and Technology
environment. Therefore, one might not lose knowledge, a skill, or an ability,
but still lose a competency if what is needed to do a job well changes.
Competency is also used to work with more general descriptions of
the requirements of human beings in organizations and communities.
Examples are educations and other organizations that want to have a general
language to tell what a graduate of an education must be able to do in order
to graduate or what a member of an organization is required to be able to do
in order to be considered competent. An important detail of this approach is
that all competencies have to be action competencies, which means that a
person shows in action that that person is competent. In the military, the
training system for this kind of competency is called artificial experience,
which is the basis for all simulators.
Competency is one of the most essential concepts for business to
achieve success in any of the day-to-day job performance responsibilities
from task management to recruiting, from training & development to
advancement. Competency for your business is having personnel with the
ability to execute the principles, skills, behaviors, processes and techniques
needed to perform a given task, procedure or set of tasks to achieve your
desired results.
Banks are functioning increasingly under competitive pressures
emanating from within the banking system, from non-banking institutions as
well as from the domestic and international capital markets. Thus, in this era
of increased competition in order to prosper, it will be imperative for banks
to focus on developing long term relationships. The operating principle is to
“Build good relationship and profitable transaction will follow
automatically”.

Banking System in India and the Need for Enhancing Behavioural Competency…………….
Department of Applied Economics, Cochin University of Science and Technology 73
4.5.2 Significance of Employees’ Competency in Banking
In the globalized Indian economy, all the industries are doing well in the
market and Indian banks are also performing well comparatively. In the
booming economy and the continuing expansion most of the banks facing
challenges to perform well and it clearly brought out by the fact that contrary to
public perception, it is not just the new private sector banks that are doing well.
A few public sector banks are functioning well. They got a place among the top
10 best performing Indian banks. It is worth mentioning that these public sector
banks have performed so admirably in spite of the fact that they operate with
many handicaps, such as strong unions and the inability to offer market salaries
and incentives and burdened with huge workforce. The secret of success of any
company simply depends on how they treat employees and keep them satisfied.
For that, they have design their human resources process like recruitment,
selection, training and development, performance appraisal and other based on
employee perspective in order to benefit them. In India the banking industry
becoming more competitive than ever, private and public sector banks are
competing each other to perform well. The executives of banks are now in the
position to modify their traditional human resource practices in order to meet
the challenges from other competitive banks.
Banking being a service sector industry, productivity of the staff has
a significant bearing on the banks overall performance. Profitability based
indicator -the profit per employee of public sector banks witnessed a
significant rise between the period 1996-97 and 1999-2000. It rose from
about Rs.35000/- per employee to about Rs.65000/-. This is so conspicuous
that much prominence is attached to the people who deliver services to the
wider stakeholders of the Banks.

Chapter 4
74 Department of Applied Economics, Cochin University of Science and Technology
Exhibit 4.2 gives SWOT analysis of Indian commercial banks in HR context Exhibit: 4.2 SWOT Analysis of Indian Commercial Banks (In HR Context)
Strengths WeaknessesHigh skilled personnel in middle and low level in banks Poor technology infrastructure
Aggression towards the development of the existing
standards
Presence of more number of smaller banks that would
likely to be impacted adversely
Strong regulatory impact by central bank to all banks for
implementation Poor compensation system
Presence of intellectual capital to face the change in
implementation with good quality
Poor talent management
Opportunities ThreatsAvailability of fresh talent to strengthen the bank
operations
Inability to meet additional capital requirements
Increasing risk manage expertise Huge investment in technology
Need significant connection among business, credit & risk
management and information technology
Entrance of foreign banks to capture talent HR
- Increasing the cost of human capital
Source: Jagannath Mishra &Pankaj Kumar Kalawatia: Basel II: Challenges Ahead of the Indian Banking Industry 2008.
In future, the response of Indian banks to the challenges imposed by
the changing economic and business environment will mainly depend upon
the extent to which they can leverage their intrinsic strength called human
resources. The banking system confronts certain rigidities in this regard.
Especially, the large public ownership has operated as a drag on human
resources development, particularly on skill development, management
change and career planning. A major challenge for many banks will be to
develop the special competencies and skills for credit appraisal and risk
management in an environment of deregulation and openness. As
emphasized by Bimal Jalan, Former Governor of Reserve Bank of India, the
recommendation of the second Narasimhan Committee could provide useful
guidance to banks particularly in recruiting skilled manpower from the open

Banking System in India and the Need for Enhancing Behavioural Competency…………….
Department of Applied Economics, Cochin University of Science and Technology 75
market, including lateral induction of experts and deployment of existing
staff in new business and activities after suitable training. In this context, the
importance of building and reinforcing corporate vision and culture that
fosters creativity and recognizes talent and merit cannot be regulated to the
behind.
The Human Resource Development department has to pay a more
proactive role in shaping the employee to flight out the challenges. The
banks not only have to make plans and polices and devise strategies, the
actual functionaries have to show willingness, competence and effectiveness
in executing the said policies and strategies. In Banks, HRD departments
have the advantages of not being excessively burdened with day to day
problems of running the banks or ensuring profitability of individual
transactions.
They are in a position to take strategic and long- term view of the
competitive advantage of the human resources as well as identify areas of
professional weaknesses to rectify well before any damage takes place in the
bank. Indeed, they have excellent opportunity to implement the desired
human resources policies to improve and strengthen the organization to
withstand the onslaught of fierce competition in future. Based on this
perspective, an attempt has been made to highlight the factors which may
lead to substantial transformation of banks to compete in an environment of
risk and uncertainty.
4.6 Role of the Indian Institute of Banking & Finance (IIBF)
In Enhancing Banking Employees’ Competency
Indian banks also realized that with organic growth there is a need to
grow inorganically as well, to be competitive with other players in the market.

Chapter 4
76 Department of Applied Economics, Cochin University of Science and Technology
The banking in India, as the world over, is undergoing rapid transformation.
The business of banking is not only expanding its frontiers, both physical and
functional, but also increasingly becoming sophisticated. The business
processes are getting highly computerised with customer preferences and
convenience dominating the drive besides the competitive forces. The decision-
making skills with the perceptive approach of Risk Management in all the
business decisions are adding a new dimension to the managerial competence.
In this scenario, the only way the functionaries of banks can keep pace
with the change and make contribution to the growth of sound banking business
is to be professionally knowledgeable. Bank employees today are expected to
move between roles throughout their career and therefore they need to be
flexible. The employers expect their workforce to be competent, flexible and
increasingly productive, with a high quality of work produced. The customers
expect high standards of service from the employees. In this context, it will be
appropriate to expect that the employees take control of their own development
so that they are able to respond to their employer’s and customers’ expectations
while shaping their own career in an increasingly competitive industry. Staff
reductions, limited opportunities for progression and competition are all
compelling reasons for one to take control of the career.
Competencies help to improve the individual performance, by modeling
the behaviors that make high performing employees successful in their jobs. In
this way, we can use competencies to further professional development. These
competencies help lay out a road map to superior performance, but they do not
ensure it. Only the personal commitment to excellence, motivation, and actual
consistent performance determines the performance level. Ideally,
competencies can help fix the attention on key business goals and values, such
as improved customer service. Competencies can help to be more flexible in

Banking System in India and the Need for Enhancing Behavioural Competency…………….
Department of Applied Economics, Cochin University of Science and Technology 77
meeting various work requirements. Applying the competencies at work will
help us to become more creative in meeting job demands and allow us to
quickly adapt to changes at work. Finally, competencies encourage teamwork
by promoting cooperation and sharing.
Recognizing this need of the bankers, the Indian Institute of Banking
& Finance (IIBF), like many other initiatives in the competence building
exercise of bankers, has come up with a certification process in the area of
Continuing Professional Development. The bank employees may be
acquiring a great deal of knowledge and experience on their own through
training/seminars/workshops sponsored by the banks both within and
outside the banks, even though they might not have necessarily undergone a
formal qualification from a University or Professional Institute. The efforts
of the bankers often go unnoticed and their professional competence
building efforts go unrecognized. The Institute believes that all the efforts
on the part of the employee towards his competence building and
professional up gradation need to be recognised and suitably documented.
4.6.1 Components of Employee Competencies
Competencies are identified behaviors, knowledge, skills, and abilities
that directly and positively impact on the success of employees and
organizations. Coaching and learning opportunities can enhance the
competencies. Competency is defined as a behavior that describes excellent
performance in a particular work context (eg: job, role or group of jobs,
function or whole organization). Competency for a job can be defined as a set
of human attributes that enable an employee to meet and exceed expectations of
his internal as well as external employees. Competency may take the following
forms: Knowledge, Attitude and Skill. Other characteristics of an individual

Chapter 4
78 Department of Applied Economics, Cochin University of Science and Technology
includes: Motives, Values and Self-concept etc. The set of human qualities
and/or attributes that make a person a star performer for a particular activity
defines the competency for that particular activity.
"Competence" as a combination of knowledge, skills and behavior
utilized to improve performance; or as the state or quality of being
adequately or well qualified, having the ability to perform a specific role.
For instance, management competency might include systems thinking and
emotional intelligence, and skills in influence and negotiation.
4.6.2 Measures to Identify Employee Competencies in Banking
Sectors
Competencies can be identified among one or more of the following
category of people:
Exhibit: 4.3 People involved identification of competencies

Banking System in India and the Need for Enhancing Behavioural Competency…………….
Department of Applied Economics, Cochin University of Science and Technology 79
Competencies are mainly seen as inputs. Any underlying
characteristics required for performing a given task, activity, or role
successfully can be considered as competency. According to Hayes,
competencies are generic, knowledge, motive trait, social role or a skill a
person linked to superior performance on the job. UNIDO defined
competency as a set of skills, related knowledge and attributes that allow an
individual to successfully perform a task or an activity within a specific
function or job. Competency represents observable and measurable
knowledge, skill, ability, behaviours, and attitudes associated with excellent
job performance, work results or outputs. It defines performance in terms of
what work is done and how it is done. Competency may take the following
forms: knowledge, Attitude, Skill and other individual characteristics
including: Motives, Values, Self-concept, etc. A competency is described in
terms of key behaviors that enable recognition of that competency at the
work place. Competencies are always behavior specific.
Skills, Knowledge, attitude and other personal characteristics that
lead to superior performance are typically bunched together into the concept
of competencies. Competencies are generic, meaning that they are relevant
for a wide variety of jobs. For example, Erickson, the Swedish
telecommunications grant, has a competence triangle consisting of
technical/professional competencies, human competencies and business
competencies. Each of these generic groups has a set of more specific
competencies. Erickson lists teamwork, communications; cultural awareness
as the competencies necessary for social interaction. Stuart stated that
“while an individual may be ‘deemed competent’, ‘occupational
competence’ relates to the functions associated with an occupation. Standard

Chapter 4
80 Department of Applied Economics, Cochin University of Science and Technology
of competent are used to describe characteristics of the functions and so are
independent of the individual.”
HRD theorists and practitioners came up with a rather integrated and
definitive definition of the term competency as a cluster of skills and
attitudes, (conveniently labeled in the industry as K, S, A i.e., Knowledge,
Skill and Attitude) that
• Affects the major part once job
• That correlates with performance on the job
• That can be measured against well accepted standards
• That can be improved through training and development
4.6.3 Measurement of Competencies
The competencies schema intended to capture information about
measurable characteristics. Some competencies may be measurable, but
never the less difficult to quantify. In some cases, the measure may be
simply whether the characteristics exists or does not exist. Some
competencies can be objectively measured, whereas others may only be
subjectively recognized.
“Effectiveness of an organization is the summation of the required
competencies in the organization.” Competency helps in Gap analysis, Role
clarity, Selection, Potential identification, Growth plans, Succession
planning Restructuring, and Inventory of competencies for planning. For
effectively playing the different HR roles, the HR manager should have the
following knowledge, skills and abilities (competencies). These are Problem
solving skills, Business knowledge/organization sensitivity, Knowledge of
compensation techniques to reinforce business plans, Strategic and
Banking System in India and the Need for Enhancing Behavioural Competency…………….
Department of Applied Economics, Cochin University of Science and Technology 81
conceptual skills, Knowledge of succession/career planning systems,
leadership skills, Ability to analyze data and plan from it., Computer
literacy, Competence in HR functional area and Awareness of the financial
impacts in the HR function as well as to the organization.
4.6.4 Characteristics of Good Competencies
Some of the characteristics of good competencies are:
i. Manageable: Too many competencies will become confusing and
inefficient, clouding rather than clarifying an organization's priorities.
ii. Defined Behaviorally: Competencies should be described in terms of
specific, observable behaviors.
iii. Independent: Important behaviors should be included in just one, not
multiple, competencies.
iv. Comprehensive: No important behaviors should be excluded.
v. Accessible: Competencies are written and communicated is clear,
understandable and useful to those outside of the HR world.
vi. Current: Competencies should be up-to-date, and reviewed regularly
to keep pace with industry and company changes.
vii. Compatible: Competencies should "fit in" with a company's vision,
values and culture.
4.6.5 Process of Competencies
The processes of competencies are: (i) Identification, (ii)
Standardization, (iii) Assessment and (iv) Certification.
Chapter 4
82 Department of Applied Economics, Cochin University of Science and Technology
i. Identification: This process establishes or defines the competencies
needed to perform a work activity satisfactorily. Three principle
methods have been developed to identify competencies.
• Occupational Analysis: In this method the task is the object of
analysis. Occupational analysis was developed and that is widely
used in the United States.
• Constructivist Analysis: Constructivist analysis in which typical
job is studied in its dynamic is the object of analysis and is a
construct built out of consideration of different but related jobs.
Constructivist analysis was developed and is used mostly in
France.
• Functional Analysis: Functional analysis in which the function (a
meaningful set of interrelated tasks that are performed to attain an
objective) is the object of analysis. Functional analysis was
developed and is used in the United Kingdom, as well as by many
European and Latin American countries. Functional analysis is the
most widely used method to identify competencies mainly because
it is more holistic than occupational analysis and less time-
consuming to develop the constructivist analysis.
ii. Standardization: By standardization we mean the process of
generalizing a competence and turning it into a competence standard. A
standard is a competence that becomes a valid benchmark for a given
group of workers or organizations.
iii. Assessment: It is the process of collecting evidence to measure
competence of a worker’s performance. This is to judge the competency
against a pre-determined standard and to identify areas that need to be

Banking System in India and the Need for Enhancing Behavioural Competency…………….
Department of Applied Economics, Cochin University of Science and Technology 83
strengthened, modified, or improved. Strategies and instruments to
collect evidence for assessment of competency include oral or written
tests, interviews, execution tests, and observation of performance,
simulations, examination of work products, portfolios, and testimonies
from third parties.
iv. Certification: The process of formal recognition of competence
demonstrating that the worker can perform a standardized labor activity
is certification. Experts judge the mastery attained in each competence
and may grant a certificate or some other credential to those showing
that competence has been achieved. Being aware of the organizational
priorities and thus setting proper guidelines which helps to empower
their organization to know itself and identify its social/human capital, is
much more valuable than most of the current focus in knowledge
management. Following may be considered as a sort of guidelines to do
competency at low cost:
• Identify a role that is relatively well-understood by all individuals
in the organization. Work out for this role and give it as an
illustration. For example sales executive, production supervisor,
assistant HR manager, receptionist, transport manager etc. are
known to all and easy to profile.
• Identify competencies for the role selected, if necessary, with the
help of job analysis specialist or an internal member who have
the knowledge of competencies.
• Circulates to others and ask various departments to do it on their
own. Circulate samples of competencies done by others. Illustrate
knowledge, attitudes, skills, values etc.
Chapter 4
84 Department of Applied Economics, Cochin University of Science and Technology
4.6.6 Classification of Competencies
Competencies can be broadly classified into three categories namely:
(i) Organizational competencies, (ii) Job related competencies, (iii) Personal
competencies includes Threshold competencies and Differentiating
competencies.
i. Organizational Competencies: Organizational competencies are
unique factors that make an organization competitive. According to
C.K. Prahlad and Hamel who wrote the famous book “Competing in the
future”, organizational competencies:
• Provide potential access to a wide variety of markets.
• Make a significant contribution to perceived customer benefits of the
end product.
• Are difficult for competitors to imitate.
Organizations need to focus their efforts in the area of their
competencies and strengthen them and outsource the other activities. This is
very important as these competencies are fundamental to the success of the
organization. Some of the examples for organizational competencies include
Sony-miniaturization, Phillips-optical media, Honda-engines, and Intel-
microchip.
ii. Job Related Competencies: Job related competencies are those
competencies which are required for performing a specific job. These
are the competencies someone must demonstrate to be effective in his
job/role, task or duty. Thus these competencies are job or role specific
and vary from job to job. A competency model can be used to develop
specific job related competencies and come out with a competency

Banking System in India and the Need for Enhancing Behavioural Competency…………….
Department of Applied Economics, Cochin University of Science and Technology 85
dictionary. These competencies are organization specific as roles and
responsibilities may vary from organization to organization even
though the job title may be the same. Job related competencies may
become the criteria for most of the HR functions like selection,
Training and development, performance appraisal, compensation etc.
iii. Personal Competencies: Personal competencies are aspects of an
individual they include the abilities of individuals to perform the
activities within an occupation or function to the standard expected in
employment. It includes the various behavioral competencies apart
from the knowledge and skill level of an individual. These
competencies includes-
• Personal competencies like developing oneself, taking initiative,
delivering results, showing commitment, and adaptability.
• Interpersonal competencies such as relationship building,
advising, team orientation, service orientation, cultural
awareness, communication, and openness.
• Information oriented competencies like strategic thinking,
business understanding, conceptualizing, innovation, processing,
analyzing and comprehending.
• Management competencies such as leadership, directing, building
teams, facilitating performance, motivating, guiding people, and
transferring knowledge

Chapter 4
86 Department of Applied Economics, Cochin University of Science and Technology
4.6.7 Benefits of Competencies
In a competency-based system, both the employer and the employee
benefit. This is a result of establishing a transparent blueprint for
recruitment, Job expectations, job performances evaluation and
advancement path. Personal judgment and subjectivity are minimized,
creating a more positive work environment and a stronger relationship
between employee and employer.
• Reduction in staff turnover, recruitment costs, training costs, etc
• Improvement in productivity, performance, training and
development
• Reliable and consistence performance data across cultures and
geographic borders
• Delivery of comprehensive training & development plans
• Creation of training & development processes that identify and
deliver the most effective sessions
• Identify employee’s capabilities for an organization’s future needs
• Analyzing capability gaps.
4.6.8 Models of Competencies
The models of competencies are behavioral and functional
competencies
i. Creativity: Creativity is the act of turning new and imaginative ideas
into reality. Creativity is a crucial part of the innovation equation.
Creativity is a core competency for leaders and managers and one of

Banking System in India and the Need for Enhancing Behavioural Competency…………….
Department of Applied Economics, Cochin University of Science and Technology 87
the best ways to set your company apart from the competition.
Corporate Creativity is characterized by the ability to perceive the
world in new ways, to find hidden patterns, to make connections
between seemingly unrelated phenomena, and to generate solutions.
ii. Self-confidence: Self-confidence is extremely important in almost
every aspect of our lives. Self-confidence is considered one of the most
influential motivators and regulators of behavior in people's everyday
lives. It also associated with the life of an employee because self-
confidence can contribute to the determination of an employee to
increase the productivity of a company.
iii. Teamwork: Teamwork is used as the most popular and effective way
of improving organisational health. This has resulted in the recognition
that people are the most important resource in an organisation. Using
their knowledge and experience in the most productive way leads to
quality improvements in products and services. Teamwork also can
benefit the organisation and the members of the teams. However,
commitment and a good infrastructure are needed for consciously
develop teamwork.
iv. Influence: Influencing is the ability to impact and influence others is
often the number one competency in helping, service, managerial and
leadership roles. Influence as a competency is the ability to persuade or
convince others to support an idea, agenda or direction. It involves
taking a variety of actions to influence others including establishing
credibility or using data to directly persuade or address a person’s
issues or concerns. Learning to increase the ability to impact and
influence others can make a big difference to your career success.

Chapter 4
88 Department of Applied Economics, Cochin University of Science and Technology
v. Problem Solving: Problem solving is the most basic and most
important human mental activity. HR professionals are hired to
supervise a particular aspect of an organization, and problem solving is
an important part of this responsibility. Often the most creative HR
professionals make the most effective problem solvers. These HR
professionals have mastered the art of recognizing problems and
tackling them, logically and creatively, before they get blown out of
proportion. Problem solving itself can create further problems,
depending on the methods used, and so the HR professional must tread
carefully. Here the HR professional’s responsibility is immense.
Human resources professionals must aid their team members in
developing their own problem-solving abilities.
vi. Inter personal Skills: Interpersonal skills are the life skills that use
every day to communicate and interact with other people, individually
and in groups. Interpersonal skills include not only how the people
communicate with others, but also the confidence, and the ability to
listen and understand. Problem solving, decision making and personal
stress management are also considered interpersonal skills.
vii. Business Knowledge: It represents the ability to understand business
including the market and its segments, the products and services
offered, the customers and their business and business model itself,
value creation as opposed to cost effective HR. It happens when HR
managers demonstrate their understanding of business while designing
and delivering HR system and process. All business decisions have
people issues and it is important that HR professional provides
appropriate input to evaluate the implications of such issues.
Banking System in India and the Need for Enhancing Behavioural Competency…………….
Department of Applied Economics, Cochin University of Science and Technology 89
viii. Change Management: Change management refers to the ability to
diagnose design and deliver change processes for organization’s culture
transformation. The key message for HR manager is that winning
organization differ from losing ones only in their ability to respond to
the pace of change. Any change in system, policies and processes has
to have people acceptability for them to be successful. HR has a crucial
role in preparing people for the change, educating them of the
advantage and implication of a new system and clarifying issues that
may arise in the implementations and competencies building.
ix. Execution Excellence: It refers to the ability to consistently deliver on
time on commitments to internal and external customers. HR system
and policies that inhibit speed in the organization will be eliminated. In
the process HR staff necessary to administer and audit those system
will be eliminated. HR professional must begin to question and change
the basic premises and assumptions on which organizations must exist.
x. Personal Credibility: Personal credibility refers to demonstrate high
integrity in personal and professional transaction with others. As a key
competence for HR managers personal credibility is of paramount
importance as it earns trust and respect of people they work with be it
superior peers and juniors.
xi. Relationship Management: It refers to the ability to develop effective
relationship with internal and external forums. As organizations are
often described as a network of roles-conflicts is an integral part of the
organization. Since these are people sensitive issues, right mix of
behavioral and functional skill are required to address these conflicts
tactfully. Relationship management no wonder becomes focused area

Chapter 4
90 Department of Applied Economics, Cochin University of Science and Technology
of HR and HR professional need to acquire an expertise in these areas
for an effective interface with internal and external environment.
4.7 Building Change Competence in Employees
The following list defines the requirements for building change
competency in employees. It uses the ADKAR model as a framework. The
requirements must be filled in sequential order. In other words, only when
the first requirement is met should you move to the second requirement.
i. Awareness: Employees are aware of the significant role they play in
the overall change management process. They understand that change
is the norm, not the exception. They also understand that some
changes may happen quickly and without warning. Employees expect
change, and understand that their change competency is part of their
job responsibility. Employees are aware that they collectively produce
business success and understand the need to change to keep pace with
changing market conditions.
ii. Desire: Employees are committed to building change competency.
They understand the business risk of not building this competency into
the organization, and understand the personal consequences for them
(both good and bad) that create a desire to develop this competency.
Employees recognize that being able to adapt to change is part of their
job responsibilities, and that doing their job well requires constant
adaptation and change. They see evidence that adaptability and change
competence is part of their overall performance evaluation.
iii. Knowledge: Employees understand how to cope and thrive in a
changing environment. Tools like the ADKAR model of change are

Banking System in India and the Need for Enhancing Behavioural Competency…………….
Department of Applied Economics, Cochin University of Science and Technology 91
provided to employees and are part of the coach-employee
relationship. Employees understand the tools and resources they have
to assist them through the transition. They know how to identify where
they are having problems and know how to seek solutions. Employees
have the skills, behaviors and knowledge to be change competent.
iv. Ability: Employees have a chance to practice and fail in a non-
threatening environment. They have been given the appropriate
coaching and know where to go for help.
v. Reinforcement: The values of a change-competent organization are
factored into the job descriptions, compensation and reward schemes
for employees. Their direct supervisors provide guidance and
opportunities to practice the skills needed to support constant change.
4.8 Dimensions of Competency
The concept of competency includes all aspects of work performance
and not only task skills. The assessment of competency should involve a
demonstration of competence in all of the dimensions of the competency,
including: Task skills, Task management skills, Contingency management
skills, Job/role environment skills and Transfer skills
i. Task Skills: Undertaking the specific task/s required to complete a
work activity to the required standard. This means being able to
perform the individual actions as well as the whole task.
ii. Task Management Skills: Managing a number of different tasks to
complete a whole work activity. This means working efficiently to
meet deadlines, handle a sequence of interrelated tasks, and progress
smoothly between tasks.

Chapter 4
92 Department of Applied Economics, Cochin University of Science and Technology
iii. Contingency Management Skills: Responding to problems and
irregularities when undertaking a work activity, such as: Breakdowns,
Changes in routine, Unexpected or atypical results or outcomes and
Difficult or dissatisfied clients.
iv. Job Role/Environment Skills: Dealing with the responsibilities and
expectations of the work environment when undertaking a work
activity, such as: Working with others, Interacting with clients and
suppliers, Complying with standard operating procedures and
Observing enterprise policy and procedures
Conclusion
Banking services growth in India is closely associated with the
employee competency in the respective organization in the form of its
productivity and profitability. Banks in India generally appoint well-educated
and technically sound work forces for execution of their financial operations.
Thus, it can be rightly said that banking is a knowledge-intensive, skills-based
and relationship-rich industry. In an increasingly complex and a more
liberalized environment, the competitiveness of banking institutions will
depend critically on the quality of human intellectual capital and the extent to
which the industry is able to leverage on these talents. To compete effectively,
banking institutions need professionals with the requisite skills and expertise
not only at the strategic and management level, but also at the technical and
operational levels. Thus, it can be rightly said that with the changing
environment both public and private sector banks have opportunities and at
the same time have to face the threats that have been posse by the HR
resources imbalances. Strengthening the employees’ competency is the only
possible solution by which the banks can determine its future growth
Banking System in India and the Need for Enhancing Behavioural Competency…………….
Department of Applied Economics, Cochin University of Science and Technology 93
prospects. Competency always contributes to the high levels of performance
between individuals as well as organization.
Chapter V and VI provide a detailed empirical analysis on the employee
competency of selected banks headquartered in Kerala. The analysis of
chapters also provided detailed empirical discussion on employee behavioural
competency based on will parameters and skill assessment.
.…….. ……..

Employee Competency in the Scheduled Commercial Banks Headquartered in Kerala
Department of Applied Economics, Cochin University of Science and Technology 95
The last chapter was devoted to discuss banking system in India and
Kerala and the need for enhancing competency of bank officers working in scheduled commercial banks. This chapter discuss employee competency in the scheduled commercial banks headquartered in Kerala.
Employee performance analysis is a popular technique for the appraisal of financial performance of a bank. Employees are the most valuable assets to increase the profitability of the organization. According to R.K Sahu (2009), Competencies are required for superior performance of an employee. So this chapter discussed with the analysis of employee competency of scheduled commercial banks head quartered in Kerala based on the data provided by the RBI. The variables used in the study are competency in terms of business per employee, deposits per employee, investment per employee, advances per employee, spread per employee and profit per employee (source of variables:- RBI Database from 2001-02 to 2012-13). Detailed analysis are given below.

Chapter 5
96 Department of Applied Economics, Cochin University of Science and Technology
5.1. Employee Strength
The developments in banking sector such as technological advances in
information technology and securitization bill, reduction in employee strength
through Voluntary Retirement Schemes (VRS) has greatly reduced costs and
Non-Performing Assets (NPAs) thereby increasing the efficiency among Indian
banks. The role of employees is also of great significance as each and every
activity of a bank is directly related to the attitude, motivation and work culture
of the employees. Therefore, the parameters that are used to measure the
efficiency of banks should also include the performance of employees.
Table: 5.1 Number of Employees of Banks (Values in Number)
Year
BanksState Bank of
Travancore Catholic Syrian
Bank Dhanlaxmi Bank Federal Bank South Indian Bank
Value Index Value Index Value Index Value Index Value Index 2001-02 12137 100 3014 100 1269 100 6240 100 3697 100
2002-03 12005 99 3014 100 1305 103 6217 100 3550 96
2003-04 12007 99 2890 96 1325 104 6363 102 3534 96
2004-05 11828 97 2863 95 1310 103 6474 104 3588 97
2005-06 11642 96 2863 95 1385 109 6015 96 3709 100
2006-07 11019 91 2791 93 1385 109 6029 97 3868 105
2007-08 11423 94 2723 90 1411 111 6945 111 4223 114
2008-09 11365 94 2676 89 1402 110 7570 121 4523 122
2009-10 12192 100 2696 89 3275 258 7896 127 4860 131
2010-11 11735 97 2820 94 3665 289 8270 133 5619 152
2011-12 12597 104 2651 88 3468 273 8745 140 5630 152
2012-13 12525 103 2817 93 2601 205 10059 161 6087 165
Total 142475 33818 23801 86823 52888
Mean 11872.92 2818.17 1983.42 7235.25 4407.33
SD 469.08 120.14 968.64 1288.70 928.77
CV (%) 3.95 4.26 48.84 17.81 21.07
CGR 0.26 -0.91 10.46 4.28 5.41
Source: RBI data base from 2001-02 to 2012-13
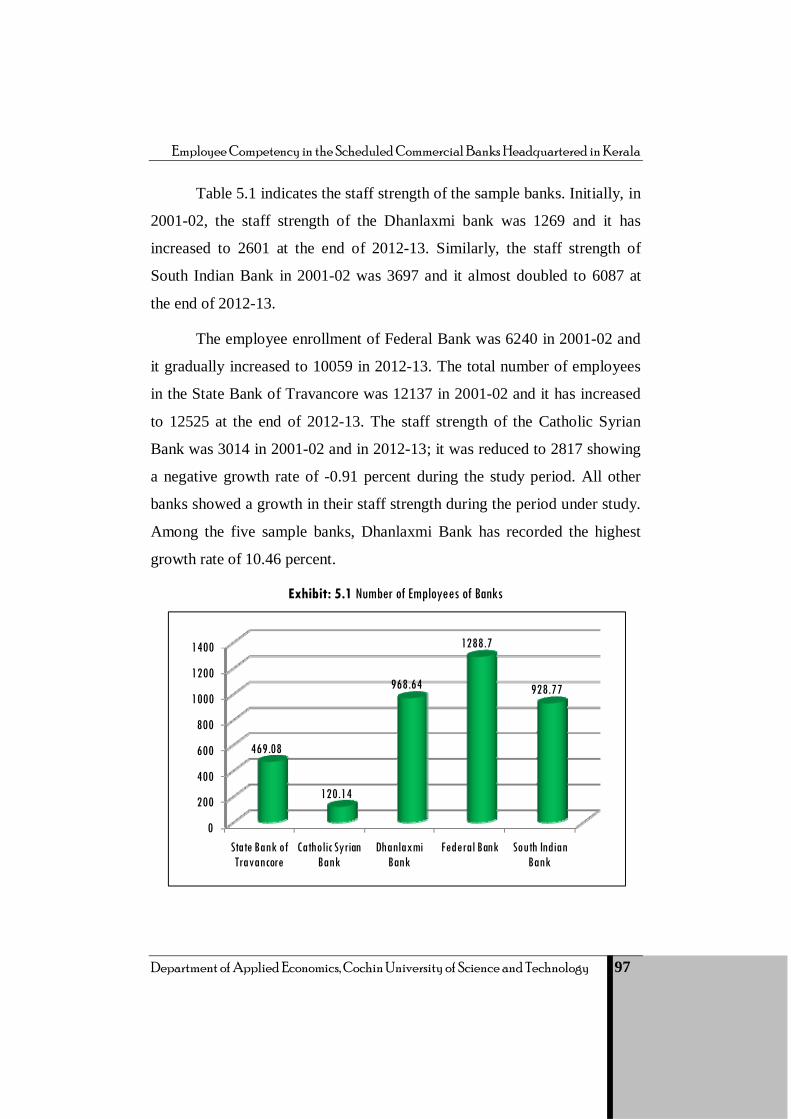
Employee Competency in the Scheduled Commercial Banks Headquartered in Kerala
Department of Applied Economics, Cochin University of Science and Technology 97
Table 5.1 indicates the staff strength of the sample banks. Initially, in
2001-02, the staff strength of the Dhanlaxmi bank was 1269 and it has
increased to 2601 at the end of 2012-13. Similarly, the staff strength of
South Indian Bank in 2001-02 was 3697 and it almost doubled to 6087 at
the end of 2012-13.
The employee enrollment of Federal Bank was 6240 in 2001-02 and
it gradually increased to 10059 in 2012-13. The total number of employees
in the State Bank of Travancore was 12137 in 2001-02 and it has increased
to 12525 at the end of 2012-13. The staff strength of the Catholic Syrian
Bank was 3014 in 2001-02 and in 2012-13; it was reduced to 2817 showing
a negative growth rate of -0.91 percent during the study period. All other
banks showed a growth in their staff strength during the period under study.
Among the five sample banks, Dhanlaxmi Bank has recorded the highest
growth rate of 10.46 percent.
Exhibit: 5.1 Number of Employees of Banks
0
200
400
600
800
1000
1200
1400
State Bank of Travancore
Catholic Syrian Bank
Dhanlaxmi Bank
Federal Bank South Indian Bank
469.08
120.14
968.64
1288.7
928.77

Chapter 5
98 Department of Applied Economics, Cochin University of Science and Technology
5.2. Competency in Terms of Business per Employee
The Business per employee on which normally profitability of each
bank branch rests is a crucial parameter to judge the efficiency of a bank and
its branch. If the business per employee grows i.e., deposits, credit and
profit year –after-year at an increased rate one can assume that the standing
of the bank in the market has been improving. Table 5.2 depicts the earning
of business per employee of banks in Kerala.
Table: 5.2 Business Per Employee of Banks
(Values in `. Lakhs)
Year
BanksState Bank of
Travancore Catholic Syrian
Bank Dhanlaxmi Bank Federal Bank South Indian Bank
Value Index Value Index Value Index Value Index Value Index 2001-02 178.78 100 140.98 100 199.24 100 219.00 100 218.00 100 2002-03 217.68 122 165.00 117 222.10 111 270.00 123 265.00 122 2003-04 271.80 152 182.16 129 248.63 125 327.00 149 306.00 140 2004-05 346.25 194 220.00 156 292.70 147 266.00 121 352.00 161 2005-06 381.19 213 247.00 175 311.71 156 431.00 197 422.00 194 2006-07 506.13 283 278.00 197 366.68 184 544.00 248 508.00 233 2007-08 588.65 329 317.00 225 409.08 205 840.00 384 600.00 275 2008-09 658.00 368 374.00 265 585.88 294 750.00 342 645.00 296 2009-10 696.00 389 423.00 300 369.61 186 813.00 371 771.00 354 2010-11 888.00 497 537.00 381 589.22 296 923.00 421 918.00 421 2011-12 1066.00 596 675.00 479 592.90 298 1011.00 462 1079.00 495 2012-13 1259.00 704 736.00 522 729.70 366 1075.00 491 1201.00 551 Total 7057.48 4295.14 4917.45 7469 7285 Mean 588.12 357.93 409.79 622.42 607.08 SD 343.48 198.77 173.57 314.81 325.95 CV (%) 58.40 55.53 42.36 50.58 53.69 CGR 18.83 16.25 11.97 16.77 16.82
Source: RBI data base from 2001-02 to 2012-13
Table 5.2 presents the business per employee in different banks studied.
During 2001-02, the business per employee in the State Bank of Travancore was
Rs.178.78 lakhs and it increased to Rs.1259 lakhs at end of the year 2012-13.
The growth rate of South Indian Bank was 16.82 percent during the
same period. The business per employee in the South Indian Bank was
Rs.218 lakhs in the year 2001-02 and it increased to Rs.1201 lakhs in 2012-

Employee Competency in the Scheduled Commercial Banks Headquartered in Kerala
Department of Applied Economics, Cochin University of Science and Technology 99
13. Similarly, the Federal Bank employees have made business of Rs.219
lakhs and it increased to Rs.1075 lakhs in 2013.
In the case of the Catholic Syrian Bank, an employee was
contributing Rs.140.98 lakhs in 2001-02 and that went up to Rs. 736 lakhs
in 2013. The business per employee of Dhanlaxmi Bank was Rs. 199.24
lakhs and that increased to Rs. 729.70 lakhs during 2012-13. The business
per employee of all banks increased during the study period. The table
reveals that out of the five sample banks surveyed, the State Bank of
Travancore has recorded the highest growth rate of 18.83 percent during the
study period of 2001-13.
Exhibit: 5.2 Business Per Employee Of Banks
5.3. Competency in Terms of Deposits per Employee
Deposits are the basic raw materials for the banks. Deposits help the
banks to channelize credit for productive investment in the economy. The
higher the deposit mobilization is the larger the scope for development of
0 100 200 300 400 500 600 700
State Bank of Travancore
Catholic Syrian Bank
Dhanalakshmi Bank
Federal Bank
South Indian Bank
588.12
357.93
409.79
622.42
607.08
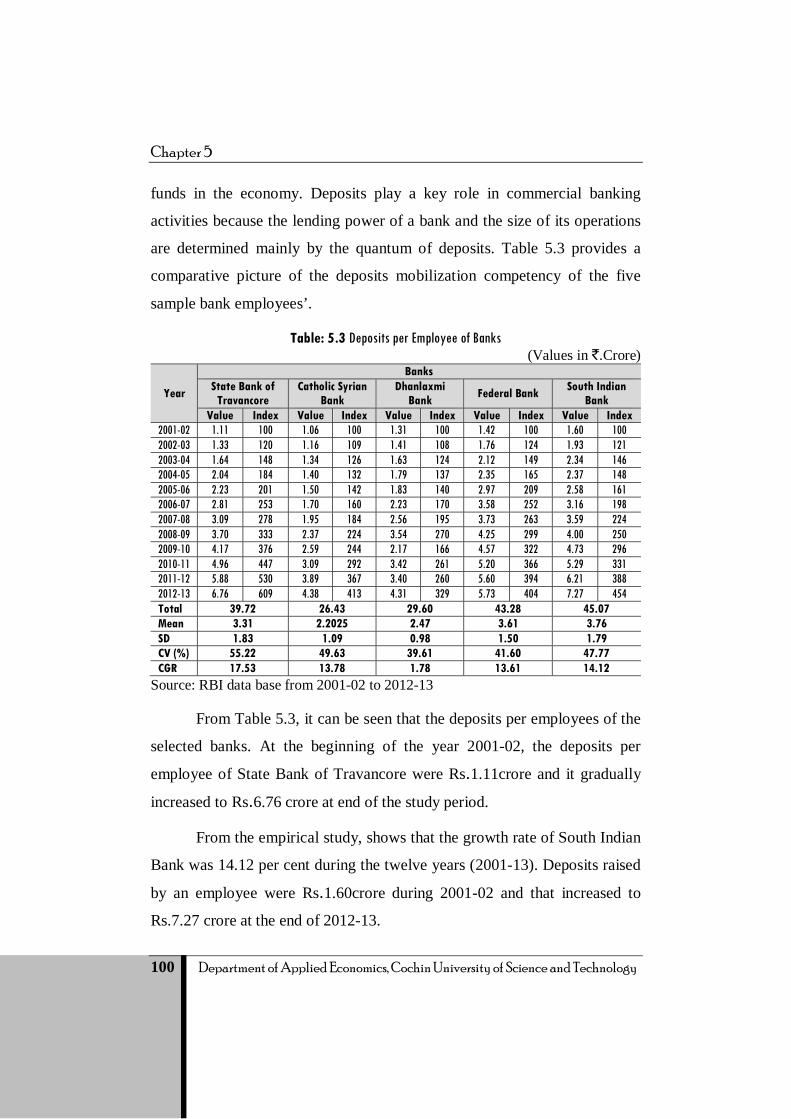
Chapter 5
100 Department of Applied Economics, Cochin University of Science and Technology
funds in the economy. Deposits play a key role in commercial banking
activities because the lending power of a bank and the size of its operations
are determined mainly by the quantum of deposits. Table 5.3 provides a
comparative picture of the deposits mobilization competency of the five
sample bank employees’.
Table: 5.3 Deposits per Employee of Banks (Values in `.Crore)
Year
BanksState Bank of
Travancore Catholic Syrian
Bank Dhanlaxmi
Bank Federal Bank South Indian Bank
Value Index Value Index Value Index Value Index Value Index 2001-02 1.11 100 1.06 100 1.31 100 1.42 100 1.60 100 2002-03 1.33 120 1.16 109 1.41 108 1.76 124 1.93 121 2003-04 1.64 148 1.34 126 1.63 124 2.12 149 2.34 146 2004-05 2.04 184 1.40 132 1.79 137 2.35 165 2.37 148 2005-06 2.23 201 1.50 142 1.83 140 2.97 209 2.58 161 2006-07 2.81 253 1.70 160 2.23 170 3.58 252 3.16 198 2007-08 3.09 278 1.95 184 2.56 195 3.73 263 3.59 224 2008-09 3.70 333 2.37 224 3.54 270 4.25 299 4.00 250 2009-10 4.17 376 2.59 244 2.17 166 4.57 322 4.73 296 2010-11 4.96 447 3.09 292 3.42 261 5.20 366 5.29 331 2011-12 5.88 530 3.89 367 3.40 260 5.60 394 6.21 388 2012-13 6.76 609 4.38 413 4.31 329 5.73 404 7.27 454 Total 39.72 26.43 29.60 43.28 45.07 Mean 3.31 2.2025 2.47 3.61 3.76 SD 1.83 1.09 0.98 1.50 1.79 CV (%) 55.22 49.63 39.61 41.60 47.77 CGR 17.53 13.78 1.78 13.61 14.12
Source: RBI data base from 2001-02 to 2012-13
From Table 5.3, it can be seen that the deposits per employees of the
selected banks. At the beginning of the year 2001-02, the deposits per
employee of State Bank of Travancore were Rs.1.11crore and it gradually
increased to Rs.6.76 crore at end of the study period.
From the empirical study, shows that the growth rate of South Indian
Bank was 14.12 per cent during the twelve years (2001-13). Deposits raised
by an employee were Rs.1.60crore during 2001-02 and that increased to
Rs.7.27 crore at the end of 2012-13.

Employee Competency in the Scheduled Commercial Banks Headquartered in Kerala
Department of Applied Economics, Cochin University of Science and Technology 101
The Catholic Syrian Bank recorded a growth rate of 13.78 percent
during the same period. Deposits raised per employee were Rs.1.06 crore in
2001-02 and that increased to Rs.4.38 crore during 2012-13.Similarly, the
Federal Bank employees have raised deposits worth Rs.1.42 crore in 2001-02
and that increased to Rs.5.73 crore during 2012-13. This works out to be an
average of 13.61 percent during the period of 2001-13.
In the case of the Dhanlaxmi Bank, the deposits raised per employee
was Rs.1.31crore in 2001-02 and it gradually increased to Rs.4.31crore at
the year 2012-13. The CGR is 1.78 percent during the study period of 2001-
13. Among the five banks studied, Dhanlaxmi Bank has the minimum
growth rate in comparison with the other banks.
It is concluded that among the selected banks, State Bank of
Travancore has recorded a growth rate of 17.53 per cent during the study
period. Exhibit 5.3 presents the above information.
Exhibit: 5.3 Deposits per Employee of Banks
0
0.5
1
1.5
2
2.5
3
3.5
4
State Bank of Travancore
Catholic Syrian Bank
Dhanalakshmi Bank
Federal Bank South Indian Bank
3.31
2.202.47
3.61 3.76

Chapter 5
102 Department of Applied Economics, Cochin University of Science and Technology
5.4. Competency in Terms of Investment per Employee
Investment as a window of deployment of funds was given more
emphasis than lending. The year-wise investments made in term of employee
strength by the five sample banks are presented in the Table 5.4.
Table: 5.4 Investments per Employee of Banks (Values in `. Crore)
Year
Banks State Bank of
Travancore Catholic Syrian
Bank Dhanlaxmi
Bank Federal Bank South Indian Bank
Value Index Value Index Value Index Value Index Value Index 2001-02 0.53 100 0.45 100 0.51 100 0.60 100 0.59 100 2002-03 0.67 126 0.60 133 0.52 102 0.73 122 0.84 142 2003-04 0.90 170 0.63 140 0.68 133 0.87 145 1.12 190 2004-05 0.90 170 0.46 102 0.54 106 0.90 150 0.87 147 2005-06 0.91 172 0.50 111 0.51 100 1.04 173 0.74 125 2006-07 0.87 164 0.56 124 0.62 122 1.17 195 0.89 151 2007-08 0.99 187 0.67 149 0.76 149 1.44 240 1.08 183 2008-09 1.16 219 0.82 182 1.12 220 1.60 267 1.34 227 2009-10 1.30 245 0.85 189 0.62 122 1.65 275 1.47 249 2010-11 1.53 289 0.95 211 0.99 194 1.76 293 1.59 269 2011-12 1.85 349 1.15 256 1.26 247 1.99 332 1.60 271 2012-13 2.17 409 1.17 260 1.80 353 2.10 350 2.06 349 Total 13.78 8.81 9.93 15.85 14.19 Mean 1.15 0.73 0.83 1.32 1.18 SD 0.49 0.25 0.40 0.50 0.43 CV (%) 42.33 34.47 48.01 38.19 36.77 CGR 11.47 8.74 10.18 11.94 9.75
Source: RBI data base from 2001-02 to 2012-13
Table 5.4 shows that the Federal Bank has recorded the highest growth rate of 11.94 percent during the study period of 2001-13. The investment made by an employee was Rs.0.60 crore at the beginning and it increased to Rs. 2.10 crore during 2012-13.
The CGR of the State Bank of Travancore was 11.47 percent during the study period (2001-13). The investments made per employee were Rs.0.53

Employee Competency in the Scheduled Commercial Banks Headquartered in Kerala
Department of Applied Economics, Cochin University of Science and Technology 103
crore during 2001-02 and it increased to Rs.2.17 crore at the end of the year 2012-13.
Similarly, the Dhanlaxmi Bank recorded a growth rate of 10.18 percent during the study period. During 2001-02, the investment per employee was Rs.0.51crore and it increased to Rs.1.80 crore at end of the year 2012-13.
The growth rate of South Indian Bank was 9.75 percent during the study period. Investment made by an employee was Rs.0.59 crore at the beginning of the year 2001-02 and it gradually increased to Rs.2.06 crore at the end of 2012-13.
On the other hand, the Catholic Syrian Bank has recorded the lowest growth rate of 8.74 percent during the study period. The investment per employee was Rs.0.45 crore at the year 2001-02 and it increased to Rs.1.17crore at the end of the year 2012-13. Exhibit 5.4 presents the information provided above.
Exhibit: 5.4 Investments per Employee of Banks
1.15
0.73
0.83
1.32
1.180
0.20.40.60.8
11.21.4
State Bank of Travancore
Catholic Syrian Bank
Dhanalakshmi BankFederal Bank
South Indian Bank

Chapter 5
104 Department of Applied Economics, Cochin University of Science and Technology
5.5. Competency in Terms of Advances per Employee
Banks accept deposits to lend at a higher rate of interest. Commercial
Banks are the dealers of money and suppliers of credit. They are the active
participants in the process of deposit mobilization and credit creation. The
year- wise credits supplied by the employees of sample banks are furnished in
Table 5.5.
Table: 5.5 Advances per Employee of Banks (Values in `.Crore)
Year
BanksState Bank of
Travancore Catholic Syrian
Bank Dhanlaxmi
Bank Federal Bank South Indian Bank
Value Index Value Index Value Index Value Index Value Index 2001-02 0.61 100 0.40 100 0.72 100 0.83 100 0.87 100 2002-03 0.76 125 0.49 123 0.83 115 1.00 120 1.02 117 2003-04 0.93 152 0.66 165 0.86 119 1.21 146 1.19 137 2004-05 1.26 207 0.80 200 1.08 150 1.36 164 1.50 172 2005-06 1.62 266 0.94 235 1.15 160 1.95 235 1.72 198 2006-07 2.25 369 1.08 270 1.33 185 2.47 298 2.05 236 2007-08 2.46 403 1.22 305 1.49 207 2.72 328 2.48 285 2008-09 2.87 470 1.38 345 2.28 317 2.96 357 2.62 301 2009-10 3.15 516 1.66 415 1.53 213 3.41 411 3.26 375 2010-11 3.92 643 2.21 553 2.47 343 3.86 465 3.65 420 2011-12 4.56 748 2.81 703 2.52 350 4.32 520 4.64 533 2012-13 5.39 884 3.14 785 2.99 415 4.38 528 5.23 601 Total 29.78 16.79 19.25 30.47 30.23 Mean 2.48 1.40 1.60 2.54 2.52 SD 1.56 0.90 0.77 1.28 1.42 CV (%) 62.67 64.01 47.83 50.48 56.54 CGR 21.86 19.84 13.79 17.26 17.67
Source: RBI data base from 2001-02 to 2012-13
Table 5.5 indicates that at the beginning of the year 2001-02 the
advances per employee of State Bank of Travancore were Rs 0.61crore and it
drastically went up to Rs.5.39 crore at the end of the study period (2012-13).
The Catholic Syrian Bank has recorded a growth rate of 19.84 per
cent during the study period. At the beginning of 2001-02 the advances per
employee with respect to this bank was Rs. 0.40crore and at the end, it went
up to Rs.3.14crore.The growth rate of South Indian Bank was 17.67 per cent

Employee Competency in the Scheduled Commercial Banks Headquartered in Kerala
Department of Applied Economics, Cochin University of Science and Technology 105
during the twelve years. Advances per employee were Rs.0.87crore and it
increased to Rs.5.23crores at the end of 2012-13.
The Federal Bank has secured a growth rate of 17.26 percent during 2001-13. At the beginning of the year 2001-02, advances per employee of this bank was Rs.0.83crore and at the end of the study period, it was Rs.4.38crore.
The CGR of Dhanlaxmi Bank was 13.79 percent from 2001-13. Initially the advances per employee were Rs.0.72crore and it gradually increased to Rs.2.99 crore at the year 2012-13.
State Bank of Travancore has recorded a growth rate of 21.86 percent during the study period of 2001-13. Exhibit 5.5 Presents the above information.
Exhibit: 5.5 Advances per Employee of Banks
5.6. Competency in Terms of Spread per Employee
Five fundamental goals, viz. profit maximization, risk management, service provision, intermediation and utility provision are considered as
0
0.5
1
1.5
2
2.5
3
State Bank of Travancore
Catholic Syrian Bank
Dhanalakshmi Bank
Federal Bank South Indian Bank
2.48
1.41.6
2.54 2.52

Chapter 5
106 Department of Applied Economics, Cochin University of Science and Technology
important in analyzing the functions performed by commercial banks. To keep it simple, one can regroup the five goals into two, viz. profit maximization (by combining features of Bergendhal's profit maximization and risk management) and interest spread (combining service provision, intermediation and utility provision). One can maximize utility of bank by reducing interest spread to customers. This can be achieved by reducing intermediation cost in providing services to both depositors and borrowers. Employees’ competency in term of spread is analyzed in Table 5.6.
Table: 5.6 Spread per Employee of the Banks Studied (Values in `. Crore)
Year
BanksState Bank of
Travancore Catholic Syrian
Bank Dhanlaxmi
Bank Federal Bank South Indian Bank
Value Index Value Index Value Index Value Index Value Index 2001-02 1.06 100 1.23 100 0.78 100 1.31 100 1.68 100 2002-03 1.51 142 1.57 128 1.15 147 1.69 129 2.04 121 2003-04 2.16 204 1.96 159 1.32 169 2.14 163 2.39 142 2004-05 2.21 208 0.37 30 -1.65 -212 1.39 106 0.24 14 2005-06 2.34 221 0.22 18 0.72 92 3.54 270 1.37 82 2006-07 2.96 279 0.68 55 1.18 151 4.43 338 2.69 160 2007-08 3.40 321 1.34 109 2.02 259 5.43 415 3.59 214 2008-09 5.36 506 1.39 113 4.10 526 6.90 527 4.31 257 2009-10 6.00 566 0.06 5 0.71 91 6.01 459 5.00 298 2010-11 8.00 755 0.45 37 0.71 91 7.00 534 5.00 298 2011-12 4.20 396 0.09 7 -3.33 -427 9.00 687 7.00 417 2012-13 0.17 16 0.12 10 0.11 14 0.20 15 0.21 13 Total 39.37 9.48 7.82 49.04 35.52 Mean 3.28 0.79 0.65 4.09 2.96 SD 2.26 0.67 1.81 2.80 2.07 CV (%) 68.76 84.78 278.42 68.45 70.01 CGR 2.07 -20.19 - 4.36 4.39
Source: RBI data base from 2001-02 to 2012-13
The net interest spread is akin to profit margin. The greater the
spread it will be more profitable for the bank, and vice versa. From Table
5.6, it can be seen that the South Indian Bank have recorded a growth rate
4.39 percent during the study period. It can also be seen that the profit
margin per employee was Rs.1.68 crore during 2001-02 and then it
decreased to Rs.0.21 crore during 2012-13.

Employee Competency in the Scheduled Commercial Banks Headquartered in Kerala
Department of Applied Economics, Cochin University of Science and Technology 107
The Federal Bank employees have made a profit margin of 4.36 percent during the period of 2001-13. At the beginning, the spread per employee was Rs.1.31crore and at the end of the study, it was only Rs.0.20 crore.
The State Bank of Travancore has recorded a growth rate of 2.07 percent during the study period. At the year 2001-02 the profit margin per employee was Rs.1.06 crore and it massively went down to Rs.0.17 crore at end of the study period.
On the contrary, the Catholic Syrian Bank has recorded a negative growth rate of -20.19 percent at the study period. At 2001-02, the spread per employee of this bank was Rs.1.23 crore and that has decreased to Rs.0.12 crore at the end of the year 2012-13.
In the case of Dhanlaxmi Bank, the spread at the beginning of the year 2001-02 was Rs.0.78 crore and at the year 2012-13, it was only Rs.0.11crore. Exhibit 5.6 presents the information presented above.
Exhibit: 5.6 Spread Per Employee of Banks
3.28
0.79
0.65
4.09
2.96
0
1
2
3
4
5State Bank of Travancore
Catholic Syrian Bank
Dhanalakshmi BankFederal Bank
South Indian Bank

Chapter 5
108 Department of Applied Economics, Cochin University of Science and Technology
5.7. Competency in Terms of Profit per Employee
The profit performance has been quite varied among different bank
groups and within each group with respect of individual banks as well.
Table 5.7 presents the employees’ profit earning efficiency.
Table: 5.7 Net Profit Per Employee Of Banks
(Values in `.Crore)
Year
BanksState Bank of
Travancore Catholic Syrian
Bank Dhanlaxmi
Bank Federal Bank South Indian Bank
Value Index Value Index Value Index Value Index Value Index 2001-02 0.03 100 0.03 100 0.04 100 0.05 100 0.05 100 2002-03 0.04 133 0.03 100 0.05 125 0.06 120 0.06 120 2003-04 0.06 200 0.04 133 0.05 125 0.07 140 0.07 140 2004-05 0.07 233 0.03 100 0.01 25 0.06 120 0.05 100 2005-06 0.06 200 0.01 33 0.02 50 0.08 160 0.04 80 2006-07 0.06 200 0.02 67 0.03 75 0.10 200 0.07 140 2007-08 0.06 200 0.03 100 0.03 75 0.11 220 0.06 120 2008-09 0.09 300 0.03 100 0.06 150 0.17 340 0.08 160 2009-10 0.08 267 0.00 0 0.01 25 0.16 320 0.08 160 2010-11 0.10 333 0.01 33 0.02 50 0.17 340 0.09 180 2011-12 0.10 333 0.03 100 -0.03 -75 0.17 340 0.11 220 2012-13 0.11 367 0.04 133 0.02 50 0.15 300 0.14 280 Total 0.86 0.30 0.31 1.35 0.90 Mean 0.07 0.03 0.03 0.11 0.08 SD 0.02 0.01 0.02 0.05 0.03 CV (%) 34.61 49.73 92.58 43.24 37.50 CGR 10.28 - - 12.99 8.30
Source: RBI data base from 2001-02 to 2012-13
From Table 5.7, it can be seen that the highest growth rate of net profit
of Federal Bank was 12.99 percent during the study period. At the year 2001-
02, the net profit earned by an employee of Federal Bank was Rs.0.05 crore
and in 2012-13, it increased to Rs.0.15crore.
The State Bank of Travancore net profit earned by an employee
recorded a growth rate of 10.28 percent during the study period. At the year
2001-02, the net profit per employee was Rs.0.03crore and it has increased
to Rs.0.11crore at end of the study period (2012-13).
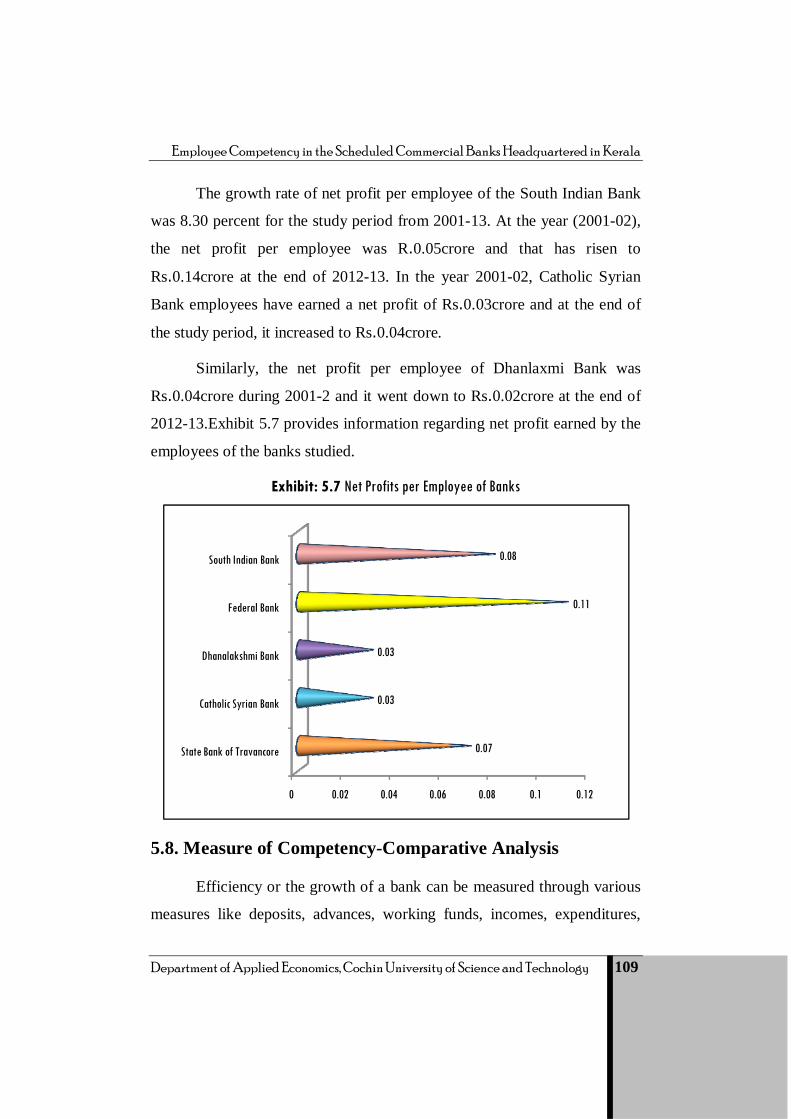
Employee Competency in the Scheduled Commercial Banks Headquartered in Kerala
Department of Applied Economics, Cochin University of Science and Technology 109
The growth rate of net profit per employee of the South Indian Bank
was 8.30 percent for the study period from 2001-13. At the year (2001-02),
the net profit per employee was R.0.05crore and that has risen to
Rs.0.14crore at the end of 2012-13. In the year 2001-02, Catholic Syrian
Bank employees have earned a net profit of Rs.0.03crore and at the end of
the study period, it increased to Rs.0.04crore.
Similarly, the net profit per employee of Dhanlaxmi Bank was
Rs.0.04crore during 2001-2 and it went down to Rs.0.02crore at the end of
2012-13.Exhibit 5.7 provides information regarding net profit earned by the
employees of the banks studied.
Exhibit: 5.7 Net Profits per Employee of Banks
5.8. Measure of Competency-Comparative Analysis
Efficiency or the growth of a bank can be measured through various
measures like deposits, advances, working funds, incomes, expenditures,
0 0.02 0.04 0.06 0.08 0.1 0.12
State Bank of Travancore
Catholic Syrian Bank
Dhanalakshmi Bank
Federal Bank
South Indian Bank
0.07
0.03
0.03
0.11
0.08

Chapter 5
110 Department of Applied Economics, Cochin University of Science and Technology
profit, etc. Table 5.8 provides information with respect to CGR with respect
to various aspects in the case of banks that are studied.
Table: 5.8 Comparative Analyses of Employees Performances in Sample Banks
(Values in CGR in Percentage between 2001-13)
Variables State Bank of Travancore
Catholic Syrian Bank
Dhanlaxmi Bank
Federal Bank
South Indian Bank
Growth in employees Strength 0.26 -0.91 10.46 4.28 5.41
Growth in Business per employee 18.83 16.25 11.97 16.77 16.82
Growth in Deposits per employee 17.53 13.78 1.78 13.61 14.12
Growth in Investments per
employee 11.47 8.74 10.18 11.94 9.75
Growth in Advances per employee 21.86 19.84 13.79 17.26 17.67
Growth in Spread per employee 2.07 -20.19 - 4.36 4.39
Growth in Net profit per employee 10.28 - - 12.99 8.30
Source: RBI (2001-13)
Table 5.8 reveals that during the study period 2001-13, among the selected banks, State Bank of Travancore have a good growth or performance with respect to Business, Deposits and Advances per employee. In case of Net profit and investment per employee, Federal bank have the highest growth rate.
Conclusion
Employee’s competency analysis is a popular technique for the appraisal of financial performance of a bank. It simply means the total resources invested and the profits generated on the investment per employee of the bank. For a bank, its employees are the most valuable corporate asset. Therefore, it is necessary to evaluate profitability of a bank in terms of its employees’ competency. Based on the above analysis, it concluded that State Bank of Travancore has the highest growth rate or performance and the employees are more competent than the other banks. The Federal bank stands second.
.…….. ……..

Analysis and Interpretation
Department of Applied Economics, Cochin University of Science and Technology 111
After analyzing the competency of the employees in the selected
banks based on the secondary data from RBI, the analysis based on the
primary data is presented in this chapter.
This chapter is divided into six sections. The first section deals with
the demographic and socio-economic analysis of the staffs in the selected
banks. The second section includes the analysis about how far the
competency is important in the existing banking system (selected banks).In
this section, the researcher analyse the importance of competency evaluation
during employee selection, job design, performance appraisal, career
development, promotion & pay, superior-subordinate relationship and
training & development. The third section presents the job satisfaction level
of the banking staff.
Chapter 6
112 Department of Applied Economics, Cochin University of Science and Technology
In the fourth section, analysis of managerial and clerical level staffs’
behavioural competency is done. Will mapping procedure is used for this
analysis and the variables used for the study are Attendance/Punctuality,
Team work, Reaction to criticism, Discipline, Imitative, Responsibility,
Quality of Job and Support & Recognise other’s achievements.(R.K.Sahu,
2009). The fifth section analyses the gap between desired and actual
competency level of the employees based on skill assessment. Through the
discussion bank managerial officials, the areas are decided such as
Marketing transfer, Retail and loans, NRI banking, Customer relationship,
Commercial purpose, Billing, Personal loan, Deposits, Legal, Savings, Cash
present, Advances, Credit, Loans and advances and gold loan. In the sixth
section, formulated hypotheses are tested.
6.1. Demographic &Socio-economic Analysis
Research evidence indicates that demographic variables such as age,
gender, qualification, salary, designation, etc. are strongly associated with
the competency level of the banking officials and job satisfaction level both
in industrial and service sector. Here the demographic and socio-economic
profile of bank employees surveyed in Kerala is presented.
All the officials of the selected banks belong to different sex, age
groups, and have different levels of qualification. The distribution of the
respondents based on their socio-economic parameters is discussed below.
6.1.1. Gender of the respondents
Table 6.1 gives the details about gender of the respondents.

Analysis and Interpretation
Department of Applied Economics, Cochin University of Science and Technology 113
Table 6.1 Gender of Banking Staff Managerial Level Officers
Gender Respondents State Bank of Travancore
Federal Bank
South Indian Bank
Catholic Syrian Bank
Dhanlaxmi Bank Total
Male No. of Respondents 71 47 41 21 17 197
Percentage (%) (19.20) (12.70) (11.10) (5.70) (4.60) (53.40)
Female No. of Respondents 59 46 29 25 13 172
Percentage (%) (16.00) (12.50) (7.90) (6.80) (3.50) (46.60)
Total No. of Respondents 130 93 70 46 30 369
Percentage (%) (35.20) (25.20) (19.00) (12.50) (8.10) (100)
Clerical Level staffs
Male No. of Respondents 89 65 46 31 14 245
Percentage (%) (17.00) (12.50) (8.80) (5.90) (2.70) (46.90)
Female No. of Respondents 101 72 47 32 25 277
Percentage (%) (19.30) (13.80) (9.00) (6.10) (4.80) (53.10)
Total No. of Respondents 190 137 93 63 39 522
Percentage (%) (36.40) (26.20) (17.80) (12.10) (7.50) (100)
Source: Primary Data Exhibit 6.1 Gender of baking staff
Out of the 369 managerial level officers and 522 clerical level staffs
surveyed, 53.40 percent of the managerial level officers were male and the
remaining 46.60 percent female. 53.1 percent of clerical staffs were females
and the remaining 46.90 percent were male.
71
4741
21 17
5946
29 2513
89
65
46
31
14
101
72
47
3225
0
20
40
60
80
100
120
State Bank of Travancore
Federal Bank South Indian Bank Catholic Syrian Bank
Dhanlaxmi Bank
Managerial Level Male Managerial Level FemaleClerical Level Male Clerical Level Female
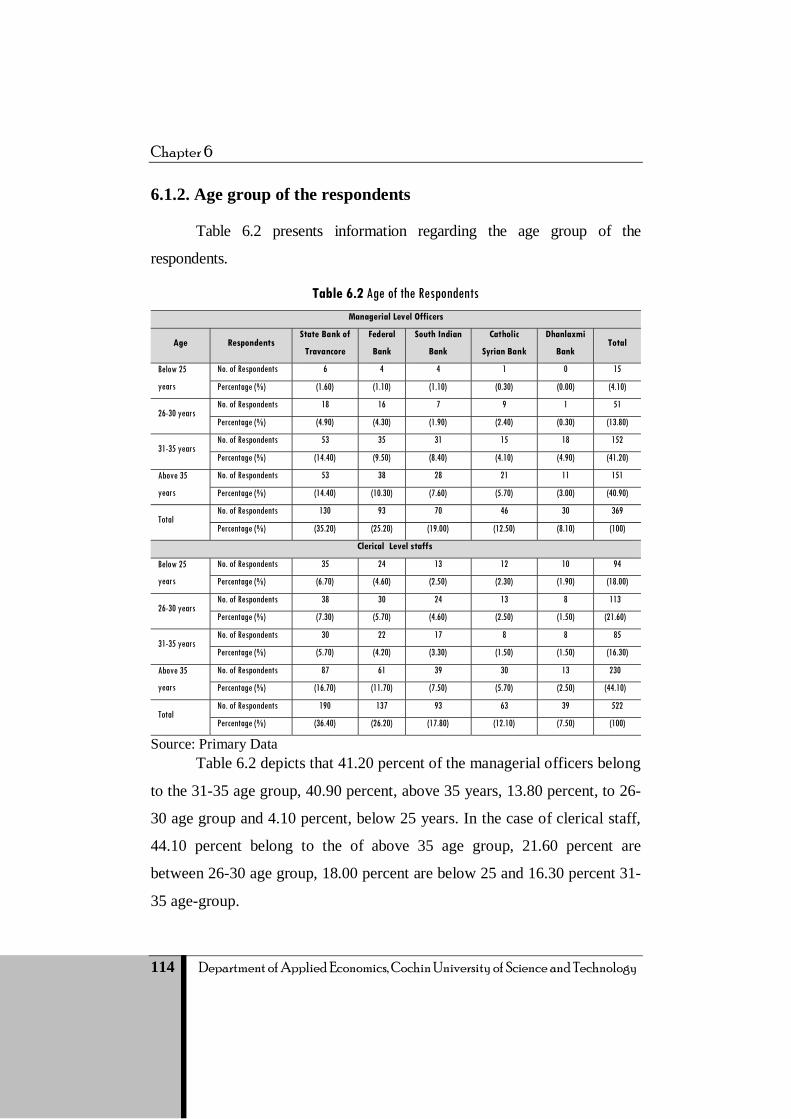
Chapter 6
114 Department of Applied Economics, Cochin University of Science and Technology
6.1.2. Age group of the respondents
Table 6.2 presents information regarding the age group of the
respondents.
Table 6.2 Age of the Respondents Managerial Level Officers
Age Respondents State Bank of
Travancore
Federal
Bank
South Indian
Bank
Catholic
Syrian Bank
Dhanlaxmi
Bank Total
Below 25
years
No. of Respondents 6 4 4 1 0 15
Percentage (%) (1.60) (1.10) (1.10) (0.30) (0.00) (4.10)
26-30 years No. of Respondents 18 16 7 9 1 51
Percentage (%) (4.90) (4.30) (1.90) (2.40) (0.30) (13.80)
31-35 years No. of Respondents 53 35 31 15 18 152
Percentage (%) (14.40) (9.50) (8.40) (4.10) (4.90) (41.20)
Above 35
years
No. of Respondents 53 38 28 21 11 151
Percentage (%) (14.40) (10.30) (7.60) (5.70) (3.00) (40.90)
Total No. of Respondents 130 93 70 46 30 369
Percentage (%) (35.20) (25.20) (19.00) (12.50) (8.10) (100)
Clerical Level staffs
Below 25
years
No. of Respondents 35 24 13 12 10 94
Percentage (%) (6.70) (4.60) (2.50) (2.30) (1.90) (18.00)
26-30 years No. of Respondents 38 30 24 13 8 113
Percentage (%) (7.30) (5.70) (4.60) (2.50) (1.50) (21.60)
31-35 years No. of Respondents 30 22 17 8 8 85
Percentage (%) (5.70) (4.20) (3.30) (1.50) (1.50) (16.30)
Above 35
years
No. of Respondents 87 61 39 30 13 230
Percentage (%) (16.70) (11.70) (7.50) (5.70) (2.50) (44.10)
Total No. of Respondents 190 137 93 63 39 522
Percentage (%) (36.40) (26.20) (17.80) (12.10) (7.50) (100)
Source: Primary Data
Table 6.2 depicts that 41.20 percent of the managerial officers belong
to the 31-35 age group, 40.90 percent, above 35 years, 13.80 percent, to 26-
30 age group and 4.10 percent, below 25 years. In the case of clerical staff,
44.10 percent belong to the of above 35 age group, 21.60 percent are
between 26-30 age group, 18.00 percent are below 25 and 16.30 percent 31-
35 age-group.

Analysis and Interpretation
Department of Applied Economics, Cochin University of Science and Technology 115
Exhibit 6.2 Age of banking staff
6.1.3. Educational Qualification
Education is the basis of knowledge. Table 6.3 shows the educational
qualification of the respondents Table 6.3 Educational Qualification of the Respondents
Managerial Level Officers Educational
Qualification Respondents State Bank of Travancore
Federal Bank
South Indian Bank
Catholic Syrian Bank
Dhanlaxmi Bank Total
SSLC/HSLC No. of Respondents 7 6 5 2 1 21 Percentage (%) (1.90) (1.60) (1.40) (0.50) (0.30) (5.70)
Degree No. of Respondents 84 61 44 30 17 236 Percentage (%) (22.80) (16.50) (11.90) (8.10) (4.60) (64.00)
Post Graduate No. of Respondents 37 24 21 13 11 106 Percentage (%) (10.00) (6.50) (5.70) (3.50) (3.00) (28.70)
Others No. of Respondents 2 2 0 1 1 6 Percentage (%) (0.50) (0.50) (0.00) (0.30) (0.30) (1.60)
Total No. of Respondents 130 93 70 46 30 369 Percentage (%) (35.20) (25.20) (19.00) (12.50) (8.10) (100)
Clerical Level staffs
SSLC/HSLC No. of Respondents 9 8 8 3 1 29 Percentage (%) (1.70) (1.50) (1.50) (0.60) (0.20) (5.60)
Degree No. of Respondents 99 70 43 33 23 268 Percentage (%) (19.00) (13.40) (8.20) (6.30) (4.40) (51.30)
Post Graduate No. of Respondents 82 59 42 27 15 225 Percentage (%) (15.70) (11.30) (8.00) (5.20) (2.90) (43.10)
Others No. of Respondents 0 0 0 0 0 0 Percentage (%) (0.00) (0.00) (0.00) (0.00) (0.00) (0.00)
Total No. of Respondents 190 137 93 63 39 522 Percentage (%) (36.40) (26.20) (17.80) (12.10) (7.50) (100)
Source: Primary Data
6
18
53 53
35 3830
87
4
16
35 38
2430
22
61
4 7
31 28
13
2417
39
19
1521
12 138
30
0 1
1811
10 8 813
0
10
20
30
40
50
60
70
80
90
100
Below 25 years
26-30 years 31-35 years Above 35 years
Below 25 years
26-30 years 31-35 years Above 35 years
State Bank of Travancore Federal Bank South Indian Bank Catholic Syrian Bank Dhanlaxmi Bank

Chapter 6
116 Department of Applied Economics, Cochin University of Science and Technology
Among the 369 managerial officers surveyed, 64.00 percent are
degree holders, 28.70 percent are postgraduates, 5.70 percent are
SSLC/HSLC holders and 1.60 percent has other qualifications. Around,
51.30 percent of clerk level staffs are degree holders, 43.10 percent are
postgraduates and 5.60 percent have SSLC/HSLC qualification.
6.1.4 Rank of Employees
The total employees of the selected banks is classified under
two- Managerial and Clerical. See Table 6.4.
Table 6.4 Rank of employees Managerial Level staffs
Name of the bank Number of Respondents Percentage
State Bank of Travancore 130 35.20
Federal Bank 93 25.20
South Indian Bank 70 19.00
Catholic Syrian Bank 46 12.50
Dhanlaxmi Bank 30 8.10
Total 369 100
Clerical Level staffs
State Bank of Travancore 190 36.40
Federal Bank 137 26.20
South Indian Bank 93 17.80
Catholic Syrian Bank 63 12.10
Dhanlaxmi Bank 39 7.50
Total 522 100
Source: Primary Data

Analysis and Interpretation
Department of Applied Economics, Cochin University of Science and Technology 117
Table 6.4 shows that 35.20 percent of the Managerial officers belong
to the State Bank of Travancore, 25.20 percent to the Federal Bank, 19.00
percent belong to the South Indian Bank, 12.50 percent to the Catholic
Syrian Bank and 8.10 percent to the Dhanlaxmi bank.
The Table further reveals that out of the 522 clerk level staffs 36.40
percent belong to the State Bank of Travancore, 26.20 percent are the
Federal Bank employees, 17.80 percent belong to the South Indian Bank,
12.10 percent to the Catholic Syrian Bank and 7.50 percent to the
Dhanlakxmi Bank.
Exhibit 6.3 Managers and Clerical staffs
35.2
25.219
12.58.1
36.4
26.2
17.812.1
7.5
05
10152025303540
State
Bank
of Tr
avan
core
Fede
ral B
ank
Sout
h Ind
ian Ba
nk
Cath
olic S
yrian
Bank
Dhan
laxmi
Ban
k
State
Bank
of Tr
avan
core
Fede
ral B
ank
Sout
h Ind
ian Ba
nk
Cath
olic S
yrian
Bank
Dhan
laxmi
Ban
k
Managerial Level Clerical Level staffs

Chapter 6
118 Department of Applied Economics, Cochin University of Science and Technology
6.1.5 Designation of the Respondents Table 6.5 presents the designation of the respondents.
Table: 6.5 Designation Managerial Level Officers
Designation Respondents State Bank of Travancore
Federal Bank
South Indian Bank
Catholic Syrian Bank
Dhanlaxmi Bank Total
Branch Manager No. of Respondents 44 30 22 16 8 120
Percentage (%) (11.90) (8.10) (6.00) (4.30) (2.20) (32.50)
Officer No. of Respondents 47 36 23 18 13 137
Percentage (%) (12.70) (9.80) (6.20) (4.90) (3.50) (37.10)
Public Officer No. of Respondents 10 7 7 2 2 28
Percentage (%) (2.70) (1.90) (1.90) (0.50) (0.50) (7.60)
DGM-Legal No. of Respondents 3 3 2 1 0 9
Percentage (%) (0.80) (0.80) (0.50) (0.30) (0.00) (2.40)
Assistant Manager No. of Respondents 20 13 14 6 4 57
Percentage (%) (5.40) (3.50) (3.80) (1.60) (1.10) (15.40)
Business Head No. of Respondents 1 1 0 1 0 3
Percentage (%) (0.30) (0.30) (0.00) (0.30) (0.00) (0.80)
Credit Manager No. of Respondents 3 1 2 1 2 9
Percentage (%) (0.80) (0.30) (0.50) (0.30) (0.50) (2.40)
Others No. of Respondents 2 2 0 1 1 6
Percentage (%) (0.50) (0.50) (0.00) (0.30) (0.30) (1.60)
Total No. of Respondents 130 93 70 46 30 369
Percentage (%) (35.20) (25.20) (19.00) (12.50) (8.10) (100)
Clerical Level staffsSingle window
operator
No. of Respondents 48 36 25 24 17 150
Percentage (%) (9.1) (6.89) (4.78) (4.59) (3.25) (28.73)
Head Cashier No. of Respondents 26 20 15 9 6 76
Percentage (%) (5.00) (3.80) (2.90) (1.70) (1.10) (14.60)
Cashier No. of Respondents 6 4 3 2 1 16
Percentage (%) (1.10) (0.80) (0.57) (0.40) (0.40) (3.06)
Administrative
clerks
No. of Respondents 44 31 22 15 8 120
Percentage (%) (8.40) (5.90) (4.20) (2.90) (1.53) (22.98)
Others No. of Respondents 57 42 30 18 13 160
Percentage (%) (10.90) (8.00) (5.70) (3.40) (2.50) (30.70)
Total No. of Respondents 181 133 95 68 45 522
Percentage (%) (34.67) (25.47) (18.19) (13.02) (8.62) (100)
Source: Primary Data
Table 6.5 shows that out of the 369 respondents surveyed, 37.10 percent of the respondents are officers, 32.60 percent are branch managers,

Analysis and Interpretation
Department of Applied Economics, Cochin University of Science and Technology 119
15.40 percent are assistant managers and 7.60 percent public officers. Similarly, 2.40 percent of the respondents are DGM-Legal officials, 2.40 percent are credit managers, 0.80 percent, 1.60 percent are business heads and working in other sections respectively.
In the case of clerical staff, 28.73 percent of the respondents are single window operators, 14.60 percent head cashiers, 22.98 percent administrative clerks, 3.06 percent cashier and 30.70 percent in other positions.
6.1.6 Mode of Entry to Current Designation
The entry levels of the employees to their present positions are different in different banks. Table 6.6 shows the entry level of employees in the selected banks.
Table 6.6 Mode of Entry to Current Designation Managerial Level Officers
Mode of entry Respondents State Bank of
Travancore Federal Bank
South Indian Bank
Catholic Syrian Bank
Dhanlaxmi Bank Total
Direct No. of Respondents 59 46 32 18 14 169
Percentage (%) (16.00) (12.50) (8.70) (4.90) (3.80) (45.80)
Promotion No. of Respondents 70 46 38 27 16 197
Percentage (%) (19.00) (12.50) (10.30) (7.30) (4.30) (53.40)
Any other No. of Respondents 1 1 0 1 0 3 Percentage (%) (0.30) (0.30) (0.00) (0.30) (0.00) (0.80)
Total No. of Respondents 130 93 70 46 30 369 Percentage (%) (35.20) (25.20) (19.00) (12.50) (8.10) (100)
Clerical Level staffs
Direct No. of Respondents 98 69 47 31 22 267
Percentage (%) (18.80) (13.20) (9.00) (5.90) (4.20) (51.10)
Promotion No. of Respondents 92 68 46 32 17 255
Percentage (%) (17.60) (13.00) (8.80) (6.10) (3.30) (48.90)
Any other No. of Respondents 0 0 0 0 0 0 Percentage (%) (0.00) (0.00) (0.00) (0.00) (0.00) (0.00)
Total No. of Respondents 190 137 93 63 39 522 Percentage (%) (36.40) (26.20) (17.80) (12.10) (7.50) (100)
Source: Primary Data
Table 6.6 indicates that out of the 369 managerial officers surveyed, 53.40 percent entered into the current designation through promotions, 45.80
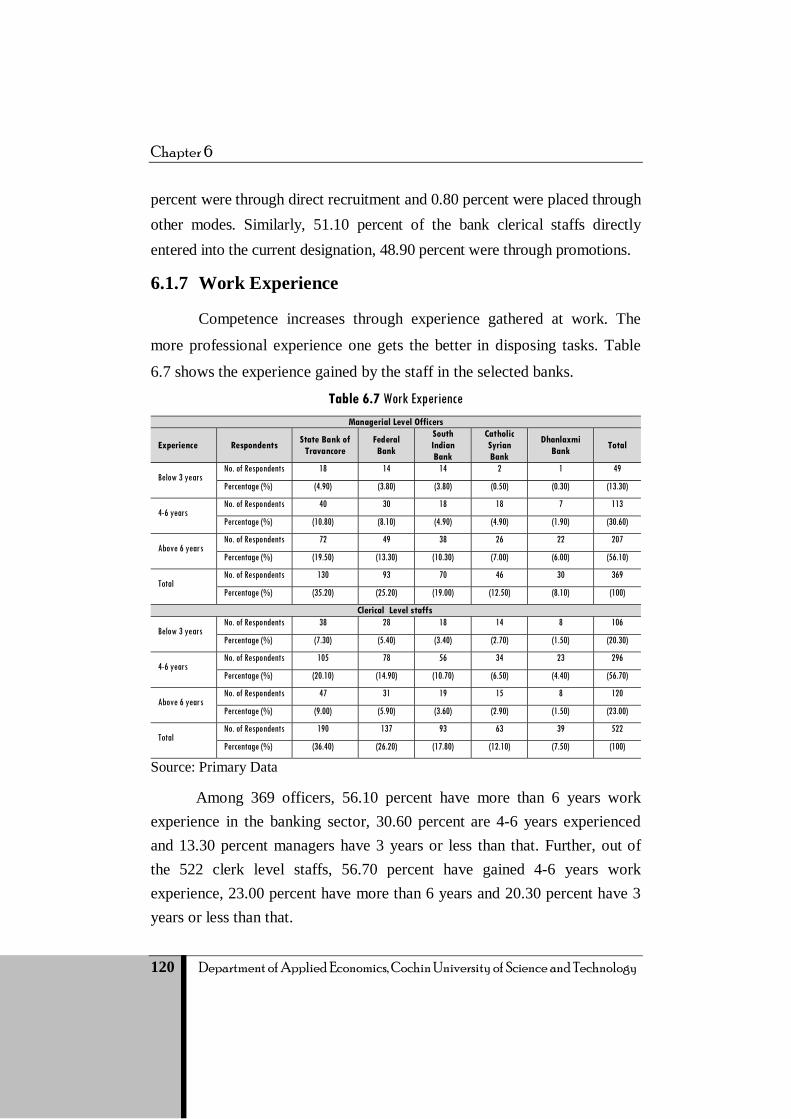
Chapter 6
120 Department of Applied Economics, Cochin University of Science and Technology
percent were through direct recruitment and 0.80 percent were placed through other modes. Similarly, 51.10 percent of the bank clerical staffs directly entered into the current designation, 48.90 percent were through promotions.
6.1.7 Work Experience
Competence increases through experience gathered at work. The
more professional experience one gets the better in disposing tasks. Table
6.7 shows the experience gained by the staff in the selected banks.
Table 6.7 Work Experience Managerial Level Officers
Experience Respondents State Bank of Travancore
Federal Bank
South Indian Bank
Catholic Syrian Bank
Dhanlaxmi Bank Total
Below 3 years No. of Respondents 18 14 14 2 1 49
Percentage (%) (4.90) (3.80) (3.80) (0.50) (0.30) (13.30)
4-6 years No. of Respondents 40 30 18 18 7 113
Percentage (%) (10.80) (8.10) (4.90) (4.90) (1.90) (30.60)
Above 6 years No. of Respondents 72 49 38 26 22 207
Percentage (%) (19.50) (13.30) (10.30) (7.00) (6.00) (56.10)
Total No. of Respondents 130 93 70 46 30 369
Percentage (%) (35.20) (25.20) (19.00) (12.50) (8.10) (100)
Clerical Level staffs
Below 3 years No. of Respondents 38 28 18 14 8 106
Percentage (%) (7.30) (5.40) (3.40) (2.70) (1.50) (20.30)
4-6 years No. of Respondents 105 78 56 34 23 296
Percentage (%) (20.10) (14.90) (10.70) (6.50) (4.40) (56.70)
Above 6 years No. of Respondents 47 31 19 15 8 120
Percentage (%) (9.00) (5.90) (3.60) (2.90) (1.50) (23.00)
Total No. of Respondents 190 137 93 63 39 522
Percentage (%) (36.40) (26.20) (17.80) (12.10) (7.50) (100)
Source: Primary Data
Among 369 officers, 56.10 percent have more than 6 years work experience in the banking sector, 30.60 percent are 4-6 years experienced and 13.30 percent managers have 3 years or less than that. Further, out of the 522 clerk level staffs, 56.70 percent have gained 4-6 years work experience, 23.00 percent have more than 6 years and 20.30 percent have 3 years or less than that.

Analysis and Interpretation
Department of Applied Economics, Cochin University of Science and Technology 121
Exhibit 6.4 Work experience
6.1.8 Monthly Income
Table 6.8 presents information about the income of the employees
surveyed. Table 6.8: Monthly Income of the respondents
Managerial Level Officers
Monthly Income Respondents State Bank of Travancore
Federal Bank
South Indian Bank
Catholic Syrian Bank
Dhanlaxmi Bank Total
Rs20000-Rs.25000 No. of Respondents 21 18 16 3 1 59 Percentage (%) (5.70) (4.90) (4.30) (0.80) (0.30) (16.00)
Rs 25000- Rs 30000
No. of Respondents 34 25 15 15 4 93 Percentage (%) (9.20) (6.80) (4.10) (4.10) (1.10) (25.20)
Rs 30000-Rs 35000 No. of Respondents 35 22 21 10 13 101 Percentage (%) (9.50) (6.00) (5.70) (2.70) (3.50) (27.40)
Rs 35000& Above No. of Respondents 40 28 18 18 12 116 Percentage (%) (10.80) (7.60) (4.90) (4.90) (3.30) (31.40)
Total No. of Respondents 130 93 70 46 30 369 Percentage (%) (35.20) (25.20) (19.00) (12.50) (8.10) (100)
Clerical Level staffs
Below Rs.10000 No. of Respondents 80 58 40 25 18 221 Percentage (%) (15.30) (11.10) (7.70) (4.80) (3.40) (42.30)
Rs 10000- Rs.15000
No. of Respondents 50 36 24 16 10 136 Percentage (%) (9.60) (6.90) (4.60) (3.10) (1.90) (26.10)
Rs. 15000-Rs 20000
No. of Respondents 22 16 10 8 3 59 Percentage (%) (4.20) (3.10) (1.90) (1.50) (0.60) (11.30)
Rs 20000& Above No. of Respondents 38 27 19 14 8 106 Percentage (%) (7.30) (5.20) (3.60) (2.70) (1.50) (20.30)
Total No. of Respondents 190 137 93 63 39 522 Percentage (%) (36.40) (26.20) (17.80) (12.10) (7.50) (100)
Source: Primary Data
18
40
72
38
105
47
14
30
49
28
78
31
14 18
38
18
56
19
2
1826
14
34
151
7
228
23
8
0
20
40
60
80
100
120
Below 3 years 4-6 years Above 6 years Below 3 years 4-6 years Above 6 years
Managerial Level Clerical Level State Bank of Travancore Federal Bank South Indian Bank Catholic Syrian Bank Dhanlaxmi Bank

Chapter 6
122 Department of Applied Economics, Cochin University of Science and Technology
Exhibit 6.5 Monthly income
The table indicates that 31.40 percent of the managers earn above
Rs.35,000 per month, 27.40 percent between Rs.30000- Rs.35,000, 25.20 percent between Rs.25000- Rs.30000 per month and 16.00 percent between Rs. 20000-25000. In addition to that, 42.30 percent of clerical staffs earn below Rs.10000 per month, 26.10 percent of them between Rs.10000- Rs.15000, 11.30 percent between Rs.15000- Rs. 20000 and 20.30 percent of the respondents earn above Rs.20000 per month.
6.2. Importance of competency in Organisational HR Practices In this section of the study, the researcher has attempted to
analyse the selected banks give importance to competency evaluation in HR practices in terms of employee selection, job design, performance appraisal, career development, promotion & pay, superior-subordinate relationship and training & development. 6.2.1. Employee Selection
Behavioural competency is required for the successful performance of the employees. Therefore, the behavioural competency of the employees during the selection process is to be analyzed. Table 6.9 indicates the evaluation of behavioural competency during the selection process.
0
20
40
60
80Rs
2000
0-Rs
.2500
0
Rs 25
000-
Rs 30
000
Rs 30
000-
Rs 35
000
Rs 35
000&
Abo
ve
Below
Rs.10
000
Rs 10
000-
Rs.15
000
Rs. 1
5000
-Rs 2
0000
Rs 20
000&
Abo
ve
Managerial Level Clerical Level
21
34 3540
80
50
22
38
1825 22
28
58
36
1627
16 15 21 18
40
24
1019
315 10
1825
168
14
1 413 12
1810
38
State Bank of Travancore Federal Bank South Indian Bank Catholic Syrian Bank Dhanlaxmi Bank

Analysis and Interpretation
Department of Applied Economics, Cochin University of Science and Technology 123
Tabl
e 6.
9 Em
ploye
e Sele
ction
Proc
ess
Sour
ce: P
rimar
y D
ata

Chapter 6
124 Department of Applied Economics, Cochin University of Science and Technology
Table 6.9 shows that among the managerial staffs, 75 percent of the
Catholic Syrian Bank officials and 74.75 percent of Federal Bank officials,
74 percent of the State Bank of Travancore officials, 71.75 percent of
officers in South Indian Bank and 67.50 percent of Dhanlaxmi Bank
officials revealed that employees are selected based on the written test and
personal interviews.
Regarding the clerical staffs’ opinion, 73.81 percent of Catholic
Syrian Bank clerical employees, 70.70 percent of South Indian Bank
respondents, 68.59 percent of the Dhanlaxmi Bank employees, 67.88
percent of Federal Bank employees and 66.84 percent of State Bank of
Travancore respondents stated that performance in the written test and
personal interviews decide selection of employees.
In the case of evaluation of competency, only 65.75 percent of
Catholic Syrian Bank officers, 64.75 percent of the Federal Bank officers
and 64.50 percent of State Bank of Travancore officers, 64.25 percent of
South Indian Bank officials and only 58.25 percent of the Dhanlaxmi Bank
officials stated that selection procedure based on the competency of the
candidate.
More than that, 63 percent of the Catholic Syrian Bank employees,
62.37 percent of the South Indian Bank employees, 62.23 percent of the
Federal Bank employees, 62.11 percent of State Bank of Travancore
employees and 59.62 percent of the Dhanlaxmi Bank employees stated that
competency is one criterion for employee selection in their banks.

Analysis and Interpretation
Department of Applied Economics, Cochin University of Science and Technology 125
Exhibit 6.6 Employee Selection (Managerial Staff)
Exhibit 6.7 Clerical staffs’ Employee Selection
2.95
2.99
2.873
2.72.58
2.59
2.572.63
2.33
00.5
11.5
22.5
3State Bank of Travancore
Federal Bank
South Indian BankCatholic Syrian Bank
Dhanalakshmi Bank
Employee Selection (Written Test and Personal Interviews)
Measure of Behavioral Competency at time of Recruitment
0
0.5
1
1.5
2
2.5
3
State Bank of Travancore
Federal Bank South Indian Bank
Catholic Syrian Bank
Dhanalakshmi Bank
2.67
2.72 2.8
3 2.95
2.74
2.48
2.49
2.49
2.52
2.38
Employee Selection (Written Test and Personal Interviews)Measure of Behavioral Competency at time of Recruitment
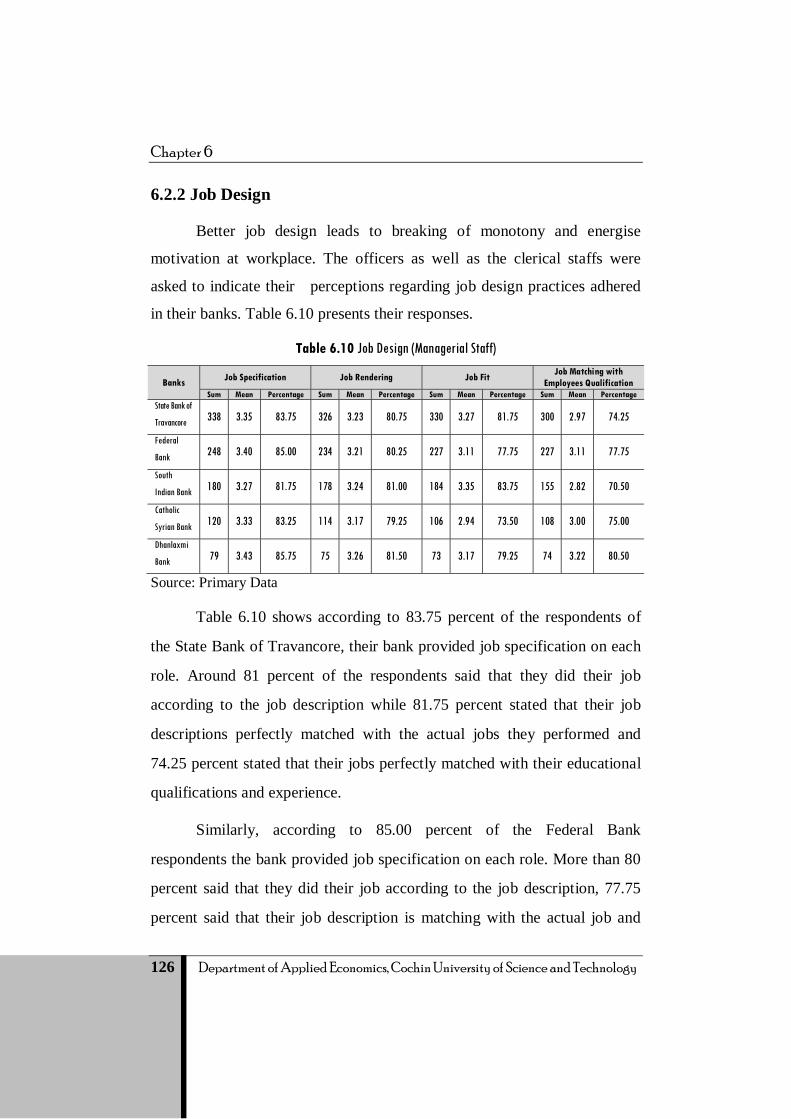
Chapter 6
126 Department of Applied Economics, Cochin University of Science and Technology
6.2.2 Job Design
Better job design leads to breaking of monotony and energise
motivation at workplace. The officers as well as the clerical staffs were
asked to indicate their perceptions regarding job design practices adhered
in their banks. Table 6.10 presents their responses.
Table 6.10 Job Design (Managerial Staff)
Banks Job Specification Job Rendering Job Fit Job Matching with Employees Qualification
Sum Mean Percentage Sum Mean Percentage Sum Mean Percentage Sum Mean Percentage State Bank of
Travancore 338 3.35 83.75 326 3.23 80.75 330 3.27 81.75 300 2.97 74.25
Federal
Bank 248 3.40 85.00 234 3.21 80.25 227 3.11 77.75 227 3.11 77.75
South
Indian Bank 180 3.27 81.75 178 3.24 81.00 184 3.35 83.75 155 2.82 70.50
Catholic
Syrian Bank 120 3.33 83.25 114 3.17 79.25 106 2.94 73.50 108 3.00 75.00
Dhanlaxmi
Bank 79 3.43 85.75 75 3.26 81.50 73 3.17 79.25 74 3.22 80.50
Source: Primary Data
Table 6.10 shows according to 83.75 percent of the respondents of
the State Bank of Travancore, their bank provided job specification on each
role. Around 81 percent of the respondents said that they did their job
according to the job description while 81.75 percent stated that their job
descriptions perfectly matched with the actual jobs they performed and
74.25 percent stated that their jobs perfectly matched with their educational
qualifications and experience.
Similarly, according to 85.00 percent of the Federal Bank
respondents the bank provided job specification on each role. More than 80
percent said that they did their job according to the job description, 77.75
percent said that their job description is matching with the actual job and

Analysis and Interpretation
Department of Applied Economics, Cochin University of Science and Technology 127
77.75 percent opinioned that their jobs perfectly matched with their
educational qualification and experience.
In the case of South Indian Bank 81.75 percent of the respondents
have opined that the organization provided job specification on each role,
81.00 percent stated that they did their job according to the job description.
Around 84 percent said that their job description was matching with the
actual job and 70.50 percent opined that their job was matching with their
educational qualification and experience.
In the case of Catholic Syrian Bank, 83.25 percent of the respondents
opined that the organization provided job specification on each role.
Similarly, 79.25 percent of the employees said that they did their job
according to the job description, 73.50 percent stated that their job
description matched with the actual job and 75.00 percent opined that their
job matched with their educational qualification and experience.
With respect to the Dhanlaxmi Bank, 85.75 percent of respondents
opined that the organization provides job specification on each role, 81.50
percent of them have said that they did their job according to the job
description. More than 79 percent of the managers said that their job
description matched with the actual job and 80.50 percent opined that their
job matched with their educational qualification and experience. Exhibit 6.3
& 6.4 presents the managerial staffs opinion about job design.

Chapter 6
128 Department of Applied Economics, Cochin University of Science and Technology
Exhibit: 6.8 Job Design (Managerial staff)
Exhibit: 6.9 Job Design (Managerial Staff)
3.353.4
3.27
3.33
3.43
3.233.21
3.24
3.17
3.26
3
3.05
3.1
3.15
3.2
3.25
3.3
3.35
3.4
3.45
State Bank of Travancore
Federal Bank South Indian Bank
Catholic Syrian Bank
Dhanalakshmi Bank
Job Specification
Job Rendering
3.27
3.11
3.35 2.94
3.17
2.97
3.11
2.82
3
3.22
0
1
2
3
4
5
6
7
State Bank of Travancore
Federal Bank South Indian Bank Catholic Syrian Bank Dhanalakshmi Bank
Job Matching with Employees Qualification Job Fit

Analysis and Interpretation
Department of Applied Economics, Cochin University of Science and Technology 129
Table 6.11 Job Design (Clerical Staffs)
Banks Job specification Job according Job matching with the actual job
Job matching with employee educational
qualification and experience
Sum Mean Percentage Sum Mean Percentage Sum Mean Percentage Sum Mean Percentage State Bank of
Travancore 480 3.40 85.00 463 3.28 82.00 483 3.43 85.75 428 3.04 76.00
Federal
Bank 348 3.41 85.25 336 3.29 82.25 350 3.43 85.75 308 3.02 75.50
South
Indian Bank 237 3.43 85.75 228 3.30 82.50 237 3.43 85.75 205 2.97 74.25
Catholic
Syrian Bank 159 3.38 84.50 157 3.34 83.50 162 3.45 86.25 141 3.00 75.00
Dhanlaxmi
Bank 95 3.39 84.75 92 3.29 82.25 96 3.43 85.75 87 3.11 77.75
Source: Primary Data
Exhibit: 6.10 Job Design (Clerical Staffs)
3.2
3.25
3.3
3.35
3.4
3.45
State Bank of Travancore
Federal Bank South Indian Bank
Catholic Syrian Bank
Dhanalakshmi Bank
3.4
3.41 3.4
3
3.38 3.3
9
3.28 3.2
9 3.3
3.34
3.29
Job specification Job according
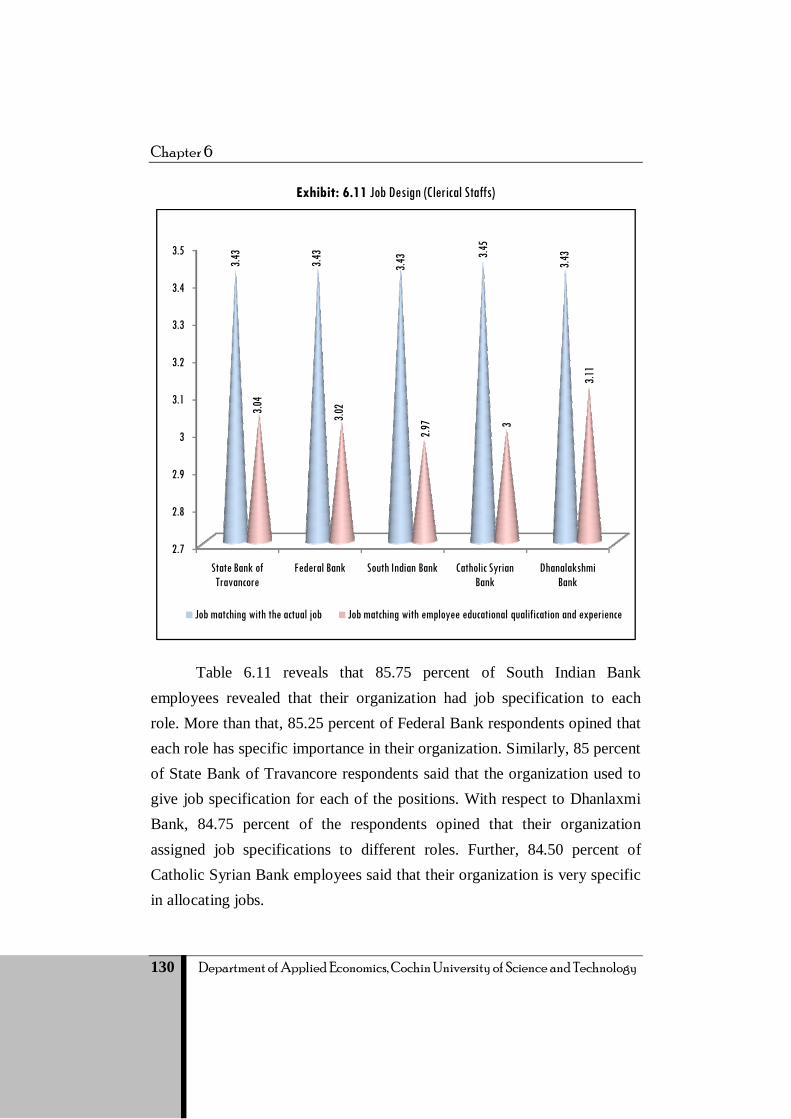
Chapter 6
130 Department of Applied Economics, Cochin University of Science and Technology
Exhibit: 6.11 Job Design (Clerical Staffs)
Table 6.11 reveals that 85.75 percent of South Indian Bank employees revealed that their organization had job specification to each role. More than that, 85.25 percent of Federal Bank respondents opined that each role has specific importance in their organization. Similarly, 85 percent of State Bank of Travancore respondents said that the organization used to give job specification for each of the positions. With respect to Dhanlaxmi Bank, 84.75 percent of the respondents opined that their organization assigned job specifications to different roles. Further, 84.50 percent of Catholic Syrian Bank employees said that their organization is very specific in allocating jobs.
2.7
2.8
2.9
3
3.1
3.2
3.3
3.4
3.5
State Bank of Travancore
Federal Bank South Indian Bank Catholic Syrian Bank
Dhanalakshmi Bank
3.43
3.43
3.43 3.4
5
3.43
3.04
3.02
2.97 3
3.11
Job matching with the actual job Job matching with employee educational qualification and experience

Analysis and Interpretation
Department of Applied Economics, Cochin University of Science and Technology 131
Around 83.50 percent of Catholic Syrian Bank employees stated that they did their job according to the job description provided by the organization. Similarly, 82.50 percent of South Indian Bank employees revealed that they customarily followed the regulations of the organization. More than that, 82.25 percent of the Federal Bank, Dhanlaxmi Bank employees and 82 percent of State Bank of Travancore clerks said that they did their work according to their organization’s description.
In the Catholic Syrian Bank, 86.25 percent of employees stated that the job description provided by the organization is suitable to their actual job. Similarly, 85.75 percent of the State Bank of Travancore, the Federal Bank, the South Indian Bank and the Dhanlaxmi Bank employees said that the job description given by their banks fitted with their jobs.
Around 77.75 percent of the Dhanlaxmi Bank employees revealed that their job fitted well with their educational qualification & experience. Similarly, 76 percent of the State Bank of Travancore employees stated that they are satisfied with the current job as it suited to their qualification & experience. Similarly, 75.50 percent of the Federal Bank employees revealed that their current job is suitable to their capability and so they are comfortable in their work place. In addition, 75 percent of the Catholic Syrian Bank employees hold the view that their current job perfectly suited to their educational qualification and experience and 74.25 percent of South Indian Bank respondents have stated that their role in the bank is suitable to their qualification and experience.
6.2.3 Performance Appraisal
Performance appraisal is a tool to evaluate the performance of the employees as well as job efficacy. The output or performance of the employees reveals the competency level of them. Therefore, the analysis depicted the importance of evaluation of competency during the performance appraisal of them. Table 6.12 presents the results.

Chapter 6
132 Department of Applied Economics, Cochin University of Science and Technology
Tabl
e 6.
12 P
erfo
rman
ce A
ppra
isal
Sour
ce: P
rimar
y D
ata

Analysis and Interpretation
Department of Applied Economics, Cochin University of Science and Technology 133
Table 6.12 reveals that 77.25 percent of the Dhanlaxmi Bank
officers, 77.25 percent of the Federal Bank officers, 75 percent of the State
Bank of Travancore and Catholic Syrian Bank respondents and 73.75
percent of South Indian Bank officers revealed that the organization
consider competency is one of the criteria for performance appraisal.
In the case of clerical staffs, 66.50 percent clerical staff of the
Catholic Syrian Bank, 65 percent of the State Bank, 64.25 percent of the
Federal Bank and the Dhanlaxmi Bank and 61.50 percent of the clerk level
staffs of the South Indian Bank agreed that the competency is the one
criterion considered by the bank for their appraisal.
According to 78.25 percent managers of the Dhanlaxmi Bank, 76.75
percent of the Federal Bank officers, 76.50 percent of the Catholic Syrian
Bank officers, 73.25 percent of the South Indian Bank employees and 74.75
percent of the State Bank of Travancore officers, their banks conducted
regular job analysis and that helped them to improve the competency level
of the staffs.
Around 79.50 percent clerical staffs of the Dhanlaxmi Bank believe
that job analysis is conducted by the bank regularly. Similarly, 73.50
percent of the State Bank of Travancore and the Federal Bank, 74 percent of
the clerical staff of Catholic Syrian Bank and 72.75 percent of the South
Indian Bank stated that their banks give an importance to regular job
analysis.
Exhibit 6.7 and 6.8 presents information with respect to about
performance appraisal.

Chapter 6
134 Department of Applied Economics, Cochin University of Science and Technology
Exhibit 6.12 Performance Appraisal (Officers)
Exhibit 6.13 Performance Appraisal (Clerical Staffs)
6.2.4 Career Development
Career development schemes in the banks help the employees to improve
their work efficiency and make them more competent in their work place.
2.8
2.85
2.9
2.95
3
3.05
3.1
3.15
State Bank of Travancore
Federal Bank South Indian Bank
Catholic Syrian Bank
Dhanalakshmi Bank
3
3.07
2.95
3
3.09
2.99
3.07
2.93
3.06
3.13
Employee competency Job analysis regularly
2.6
2.57
2.46
2.66
2.57
2.94
2.94
2.91
2.96
3.18
0 0.5 1 1.5 2 2.5 3 3.5
State Bank of Travancore
Federal Bank
South Indian Bank
Catholic Syrian Bank
Dhanalakshmi Bank
Job analysis regularly Employee competency

Analysis and Interpretation
Department of Applied Economics, Cochin University of Science and Technology 135
Tabl
e 6.
13 Ca
reer
Dev
elopm
ent
Sour
ce: P
rimar
y D
ata

Chapter 6
136 Department of Applied Economics, Cochin University of Science and Technology
Table 6.13 shows that the officers and clerks opinion about the
career development programmes to enhance their competency level. Among
the managerial staffs, 83.25 percent of the Federal Bank and the Catholic
Syrian Bank, 81.50 percent officers of the Dhanlaxmi Bank, 79.75 percent
of the respondents of the State Bank of Travancore and 76 percent of the
South Indian Bank officers stated that the career development opportunities
existing in the banks develop their talents in the current job. They also
opined that it served as a good platform to learn things.
Around 84.75 percent of Catholic Syrian Bank officers, 83.25 percent
officers of the Federal Bank, 82.50 percent respondents of the Dhanlaxmi
Bank, 77.75 percent respondents of the State Bank of Travancore and 73.75
percent respondents of the South Indian Bank stated that their career
development opportunities helped them to improve their competency in their
current jobs.. Similarly, they have agreed that their job helps them to improve
the competency.
Regarding clerical staffs, 78.25 percent of the Catholic Syrian Bank
clerks, 77.50 percent of Federal Bank, 76.00 percent of South Indian Bank
and 77.75 percent of the State Bank of Travancore and Dhanlaxmi bank
clerical staff expressed the opinion that the career development programmes
in the banks prompted them to perform well in their current jobs. It is
further noted from the table that 74.75 percent of State Bank of Travancore,
74.50 of Federal Bank, 73.25 of South Indian Bank, 75 percent of Catholic
Syrian Bank and 73.25 percent of Dhanlaxmi bank employees agreed that
the career development programmes in the banks helped to improve the
work competency of the staff in their current jobs.

Analysis and Interpretation
Department of Applied Economics, Cochin University of Science and Technology 137
Exhibit: 6.14 Career Development (Officers)
Exhibit: 6.15 Career Development (Clerical Staffs)
6.2.5 Promotion and Pay
The organizations design the promotion and pay structure of the
employees mainly based on their competency level. To see how far this is
true in the case of the banks studied, opinions were collected from the
employees. The same is presented in Table 6.14.
3.193.33
3.04
3.333.26
3.11
3.33
2.95
3.393.3
2.7
2.8
2.9
3
3.1
3.2
3.3
3.4
3.5
State Bank of Travancore
Federal Bank South Indian Bank Catholic Syrian Bank Dhanalakshmi Bank
Proper platform to implement all employee potential in employee jobThe current job helps to increase employee competency level
2.8 2.85 2.9 2.95 3 3.05 3.1 3.15
State Bank of Travancore
Federal Bank
South Indian Bank
Catholic Syrian Bank
Dhanalakshmi Bank
3.11
3.1
3.04
3.13
3.11
2.99
2.98
2.93
3
2.93
The current job helps to increase employee competency level
Proper platform to implement all employee potential in employee job

Chapter 6
138 Department of Applied Economics, Cochin University of Science and Technology
Tabl
e 6.
14 Pr
omot
ion an
d Pay
Sour
ce: P
rimar
y D
ata

Analysis and Interpretation
Department of Applied Economics, Cochin University of Science and Technology 139
Table 6.14 shows that whether the competency is considered for
promotion and pay structure in the selected banks. A sizeable majority of
the managerial and clerical staff (55%-70%) believe that banks considered
their competency while determining salary as well as promotions.
Exhibit: 6.16 Promotion And Pay (Officers)
0
0.5
1
1.5
2
2.5
3
State Bank of Travancore
Federal Bank South Indian Bank Catholic Syrian Bank
Dhanalakshmi Bank
2.82
2.83
2.83
2.76
2.72.76 2.8
3
2.76
2.74
2.57
2.45 2.5
1
2.39
2.61
2.2
Promotion of the employees based on the competency level
Behavioral competency as a one component in the performance appraisal system
Pay structure of the company based on the competency level of the employees
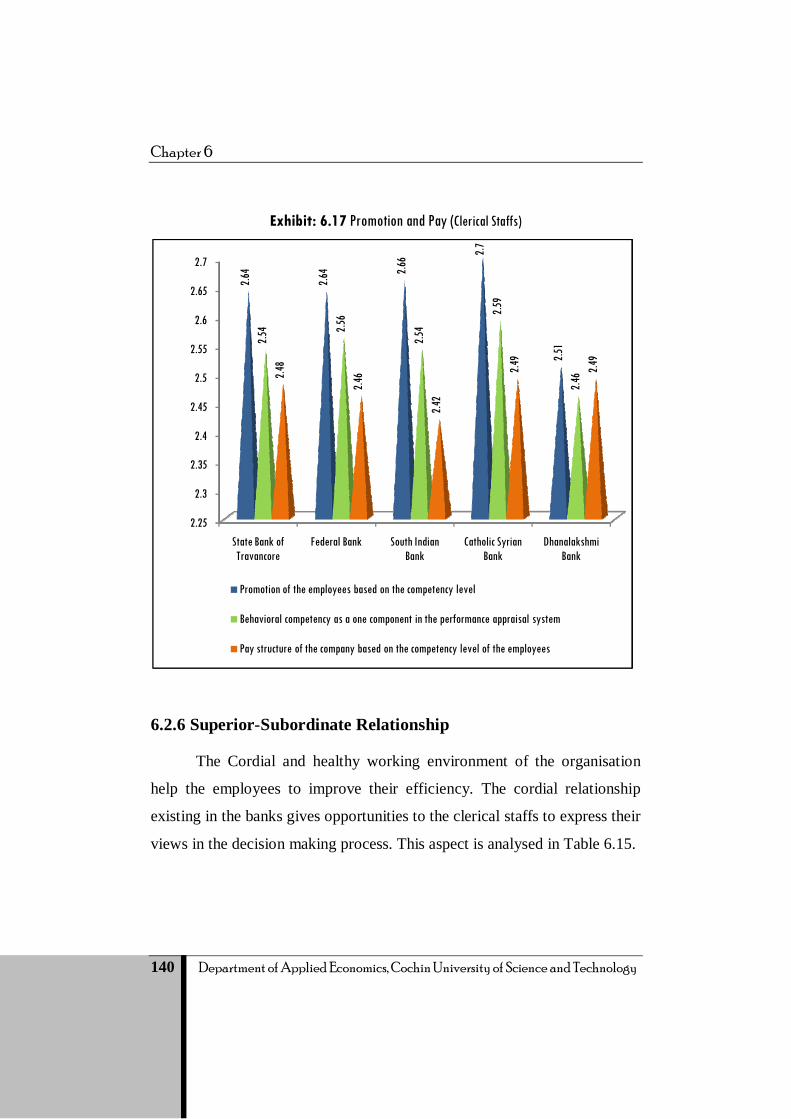
Chapter 6
140 Department of Applied Economics, Cochin University of Science and Technology
Exhibit: 6.17 Promotion and Pay (Clerical Staffs)
6.2.6 Superior-Subordinate Relationship
The Cordial and healthy working environment of the organisation
help the employees to improve their efficiency. The cordial relationship
existing in the banks gives opportunities to the clerical staffs to express their
views in the decision making process. This aspect is analysed in Table 6.15.
2.25
2.3
2.35
2.4
2.45
2.5
2.55
2.6
2.65
2.7
State Bank of Travancore
Federal Bank South Indian Bank
Catholic Syrian Bank
Dhanalakshmi Bank
2.64
2.64 2.6
6 2.7
2.512.5
4 2.56
2.54
2.59
2.462.4
8
2.46
2.42
2.49
2.49
Promotion of the employees based on the competency level
Behavioral competency as a one component in the performance appraisal system
Pay structure of the company based on the competency level of the employees

Analysis and Interpretation
Department of Applied Economics, Cochin University of Science and Technology 141
Tabl
e 6.
15 Su
perio
r- Cle
rical
staffs
Relat
ionsh
ip
Sour
ce: P
rimar
y D
ata
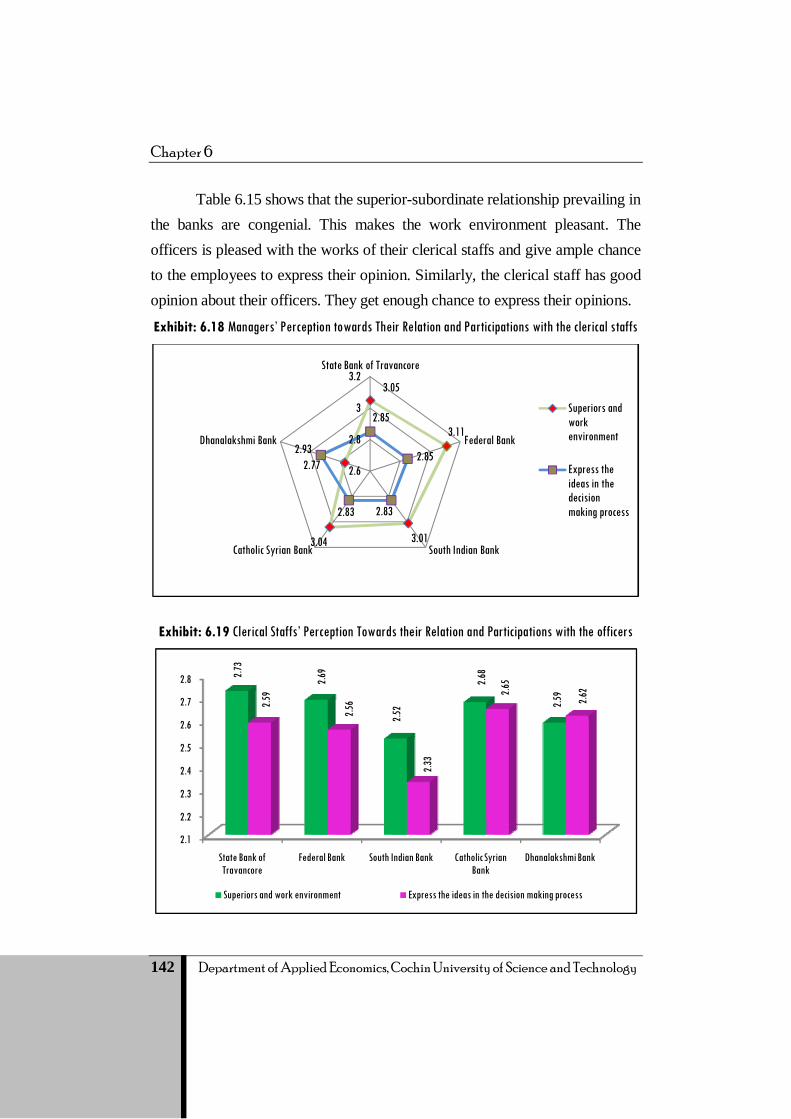
Chapter 6
142 Department of Applied Economics, Cochin University of Science and Technology
Table 6.15 shows that the superior-subordinate relationship prevailing in the banks are congenial. This makes the work environment pleasant. The officers is pleased with the works of their clerical staffs and give ample chance to the employees to express their opinion. Similarly, the clerical staff has good opinion about their officers. They get enough chance to express their opinions. Exhibit: 6.18 Managers’ Perception towards Their Relation and Participations with the clerical staffs
Exhibit: 6.19 Clerical Staffs’ Perception Towards their Relation and Participations with the officers
3.05
3.11
3.013.04
2.77
2.85
2.85
2.832.83
2.93
2.6
2.8
3
3.2State Bank of Travancore
Federal Bank
South Indian BankCatholic Syrian Bank
Dhanalakshmi Bank
Superiors and work environment
Express the ideas in the decision making process
2.1
2.2
2.3
2.4
2.5
2.6
2.7
2.8
State Bank of Travancore
Federal Bank South Indian Bank Catholic Syrian Bank
Dhanalakshmi Bank
2.73
2.69
2.52
2.68
2.59
2.59
2.56
2.33
2.65
2.62
Superiors and work environment Express the ideas in the decision making process

Analysis and Interpretation
Department of Applied Economics, Cochin University of Science and Technology 143
6.2.7 Training and Development
Today the success of any organization depends on the employee competencies. This is more important in the case of service organizations because they deal constantly with the public. Hence, Training and development become an important function to improve the competency level of the employees.
Table 6.16 Training & Development
Banks Officers Clerical staff Sum Mean Percentage Sum Mean Percentage
State Bank of Travancore 383 2.95 59 514 2.71 54.2
Federal Bank 276 2.97 59.4 376 2.74 54.8
South Indian Bank 205 2.93 58.6 249 2.68 53.6
Catholic Syrian Bank 135 2.93 58.6 178 2.83 56.6
Dhanlaxmi Bank 82 2.73 54.6 98 2.51 50.2
Source: Primary Data
Table 6.16 reveals that the officers opined about training programs
provided by the banks. Only 55%-60% of the officers in the selected banks
agreed that the existing training programme help the candidates to develop
their behavioral level of competency. Table also shows that 50% - 57 % of
the clerical staff opined that training programmes enhanced their
competency in performing work.
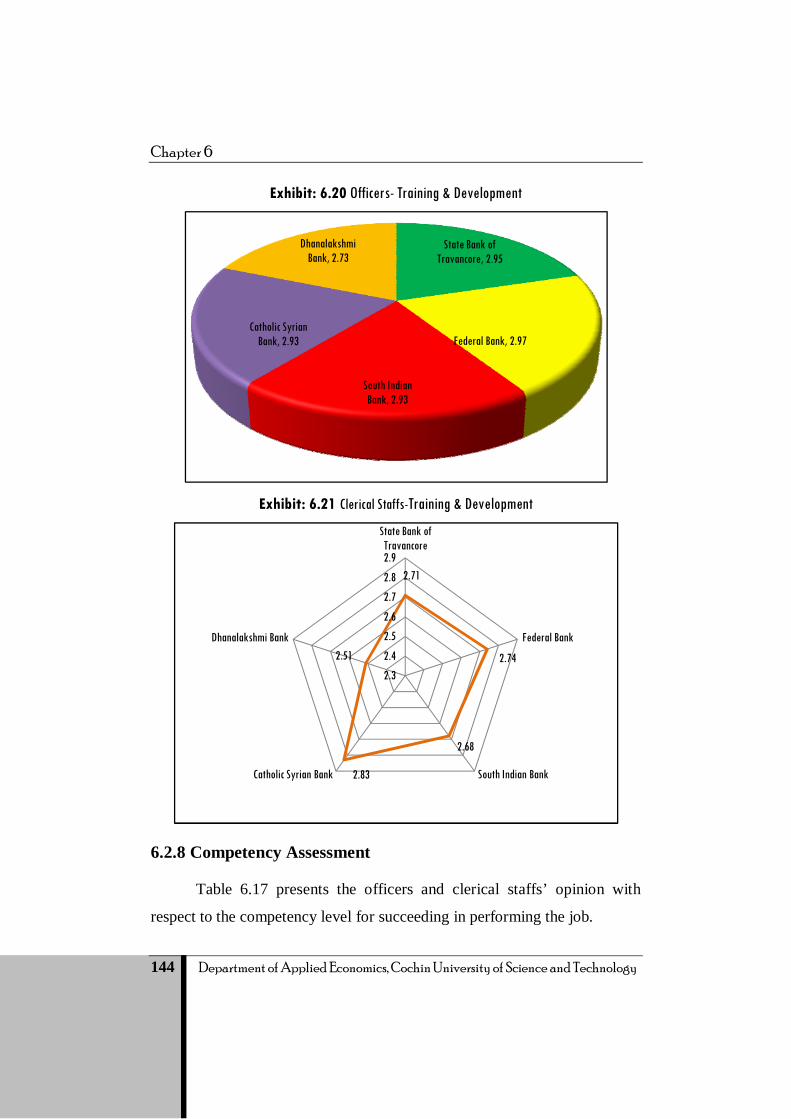
Chapter 6
144 Department of Applied Economics, Cochin University of Science and Technology
Exhibit: 6.20 Officers- Training & Development
Exhibit: 6.21 Clerical Staffs-Training & Development
6.2.8 Competency Assessment
Table 6.17 presents the officers and clerical staffs’ opinion with
respect to the competency level for succeeding in performing the job.
State Bank of Travancore, 2.95
Federal Bank, 2.97
South Indian Bank, 2.93
Catholic Syrian Bank, 2.93
Dhanalakshmi Bank, 2.73
2.71
2.74
2.68
2.83
2.51
2.3
2.4
2.5
2.6
2.7
2.8
2.9
State Bank of Travancore
Federal Bank
South Indian BankCatholic Syrian Bank
Dhanalakshmi Bank

Analysis and Interpretation
Department of Applied Economics, Cochin University of Science and Technology 145
Tabl
e 6.
17 Ty
pes o
f com
pete
ncies
Sour
ce: P
rimar
y D
ata
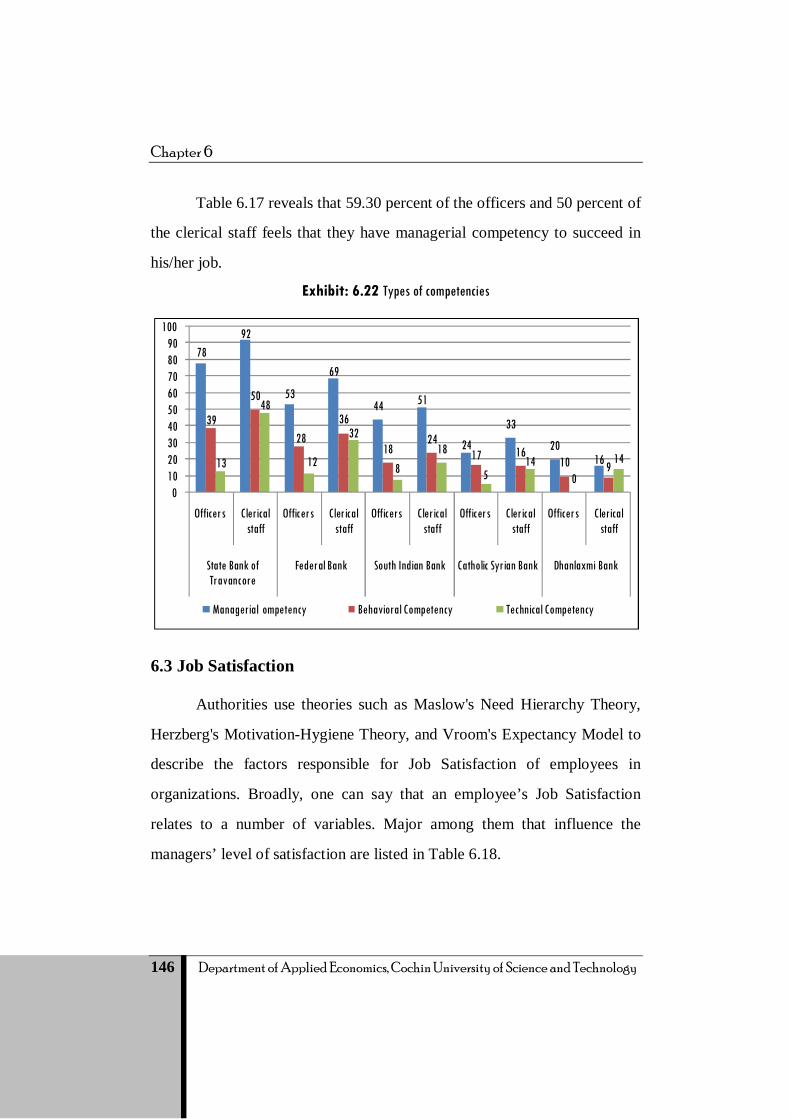
Chapter 6
146 Department of Applied Economics, Cochin University of Science and Technology
Table 6.17 reveals that 59.30 percent of the officers and 50 percent of
the clerical staff feels that they have managerial competency to succeed in
his/her job.
Exhibit: 6.22 Types of competencies
6.3 Job Satisfaction
Authorities use theories such as Maslow's Need Hierarchy Theory,
Herzberg's Motivation-Hygiene Theory, and Vroom's Expectancy Model to
describe the factors responsible for Job Satisfaction of employees in
organizations. Broadly, one can say that an employee’s Job Satisfaction
relates to a number of variables. Major among them that influence the
managers’ level of satisfaction are listed in Table 6.18.
7892
53
69
44 51
24
33
2016
39
50
2836
1824
17 1610 913
48
12
32
818
514
014
0102030405060708090
100
Officers Clerical staff
Officers Clerical staff
Officers Clerical staff
Officers Clerical staff
Officers Clerical staff
State Bank of Travancore
Federal Bank South Indian Bank Catholic Syrian Bank Dhanlaxmi Bank
Managerial ompetency Behavioral Competency Technical Competency

Analysis and Interpretation
Department of Applied Economics, Cochin University of Science and Technology 147
Table: 6.18 Managers’ Level of Satisfaction Sa
tisfa
ctio
n State Bank of
Travancore Federal Bank South Indian Bank
Catholic Syrian Bank Dhanlaxmi Bank
Sum
Mea
n
Perc
enta
ge
Sum
Mea
n
Perc
enta
ge
Sum
Mea
n
Perc
enta
ge
Sum
Mea
n
Perc
enta
ge
Sum
Mea
n
Perc
enta
ge
Pay and
promotion 390 3.00 60.00 279 2.73 60.00 191 2.73 54.57 92 2.00 40.00 60 2.00 40.00
Organization
factor 350 2.69 53.85 186 2.00 40.00 140 2.00 40.00 59 1.28 25.65 30 1.00 20.00
Supervisor
behaviour 390 3.00 60.00 279 3.00 60.00 205 2.93 58.57 92 2.00 40.00 60 2.00 40.00
Job and
working
condition
308 2.37 47.38 126 1.35 27.10 70 1.00 20.00 46 1.00 20.00 30 1.00 20.00
Co-worker
behaviour 323 2.48 49.69 123 1.32 26.45 70 1.00 20.00 46 1.00 20.00 30 1.00 20.00
Source: Primary Data
The factors that influence the mangers’ level of satisfaction with
respect to each bank is discussed herein.
Exhibit: 6.23 Managers Level Of Satisfaction
0
0.5
1
1.5
2
2.5
3
State Bank of Travancore
Federal Bank South Indian Bank Catholic Syrian Bank
Dhanalakshmi Bank
3
2.73
2.73
2 2
2.69
2 2
1.28
1
3 3 2.93
2 2
2.37
1.35
1 1 1
2.48
1.32
1 1 1
Pay and promotion Organization factor Supervisor behaviour
Job and working condition Co-worker behaviour

Chapter 6
148 Department of Applied Economics, Cochin University of Science and Technology
State Bank or Travancore
Table 6.25 indicates that 60 percent of the officers satisfied with pay,
promotion, and superior’s behaviour. Additionally, 53.85 percent, 47.38
percent and 49.69 percent officers satisfied with organisation factor, ob and
working conditions and said co-workers’ behavior.
Federal Bank
From the above empirical study, it is inferred that 60 percent of the
respondents’ are highly satisfied with pay benefits and the behaviour of the
superior officers. Correspondingly, 40 percent of sample subjects’ opine
moderate levels of satisfaction towards the organizational factors of Federal
Bank. Similarly, 27.10 percent of sample subjects’ are comfortable with the
job and working conditions and 26.45 percent of employees’ are happy with
the co-worker’s behaviour in Federal Bank.
South Indian Bank
It is inferred that 58.57 percent of South Indian Bank employees
have said that their supervisor has behaved politely to them. Followed by,
54.57 percent of respondents feel that rules and regulations are properly
followed while fixing salaries and promotions. Consequently, 40 percent of
them are happy with the organizational factors of South Indian Bank and 20
percent of employees have said that they have got good working condition
and peer group relationship in South Indian Bank.
Catholic Syrian Bank
The above table infers that 40 percent of the Catholic Syrian Bank
employees opine that their organisation provides reasonable pay &other
benefits and they have good hierarchy relationship with their seniors.

Analysis and Interpretation
Department of Applied Economics, Cochin University of Science and Technology 149
Followed by, 25.65 percent of respondents’ are satisfied with the
organizational structure of the Catholic Syrian Bank. Further, it has been
observed that 20 percent of respondents’ are happy with co-worker
behaviour and working condition of Catholic Syrian Bank.
Dhanlaxmi Bank
From the above table, it has been inferred that, 40 percent of
Dhanlaxmi Bank officers’ opine that they are highly satisfied with hierarchy
relationship and promotional benefits offered by Dhanlaxmi Bank. Further,
it is observed that 20 percent of the respondents have said that the
organizational framework, peer group relationship and working environment
of Dhanlaxmi Bank are reliable to the needs of the employees.
Table: 6.19 Clerical Staffs’ Level of Satisfaction
Satis
fact
ion
State Bank of Travancore Federal Bank South Indian Bank Catholic Syrian
Bank Dhanlaxmi Bank
Sum
Mea
n
Perc
enta
ge
Sum
Mea
n
Perc
enta
ge
Sum
Mea
n
Perc
enta
ge
Sum
Mea
n
Perc
enta
ge
Sum
Mea
n
Perc
enta
ge
Pay and
promotion 677 3.56 71.21 487 3.55 71.02 329 3.54 70.75 227 3.60 71.90 137 3.50 70.00
Organizatio
n factor 680 3.58 71.58 494 3.60 72.04 341 3.66 73.23 236 3.74 74.76 139 3.56 71.28
Supervisor
behaviour 672 3.54 70.74 488 3.56 71.24 329 3.54 70.75 226 3.59 71.75 135 3.46 69.23
Job and
working
condition 667 3.51 70.16 479 3.49 69.85 317 3.41 68.17 224 3.56 71.11 137 3.50 70.00
Co-worker
behaviour 713 3.75 75.00 511 3.73 74.53 334 3.59 71.72 237 3.75 75.08 143 3.65 73.08
Source: Primary Data
The above table indicates the clerical level staffs’ level of
satisfaction towards sample banks considered in the study.

Chapter 6
150 Department of Applied Economics, Cochin University of Science and Technology
Exhibit: 6.24 Clerical Staffs’ Level of Satisfaction
State Bank of Travancore
From the above empirical study, it is inferred that, 75 percent of State
Bank of Travancore employees’ express high degree of satisfaction towards
co-worker behaviour. Followed by, 71.58 percent of respondents’ are found
to be satisfied with the organizational structure of the State Bank of
Travancore. Consequently, 71.21 percent of respondents’ believe that the
pays and promotions offered by their organization are reliable to them.
Similarly, 70.74 percent of employees have said that their officers are very
cordial and it makes them to work with easiness. On the other hand, 70.16
percent of clerical staffs have said that they are pleased working environment
of their organization.
Federal Bank
The above table infers that out of 522 subordinate level employees
surveyed, 74.53 percent of the Federal Bank employees’ opine that their team
members are supportive and helpful. Subsequently, 72.04 percent of
3.2
3.3
3.4
3.5
3.6
3.7
3.8
State Bank of Travancore
Federal Bank South Indian Bank Catholic Syrian Bank
Dhanalakshmi Bank
3.56
3.55
3.54 3.6
3.5
3.58 3.6
3.66 3.7
4
3.56
3.54 3.5
6
3.54 3.5
9
3.463.5
1
3.49
3.41
3.56
3.5
3.75
3.73
3.59
3.75
3.65
Pay and promotion Organization factor Supervisor behaviour Job and working condition Co-worker behaviour

Analysis and Interpretation
Department of Applied Economics, Cochin University of Science and Technology 151
respondents are satisfied with the organizational structure of the Federal Bank.
Consequently, 71.24 percent of Federal Bank respondents have good hierarchy
relationship with their seniors. Similarly, 71.02 percent of Federal Bank
employees have agreed that their organisation provides reasonable pay & other
benefits to them.
South Indian Bank
It has been inferred that, 73.23 percent of employees’ are found to be
satisfied with the organization structure of their bank. Similarly, 71.72
percent of respondents have said that their peer group members are very
cooperative. Followed by, 70.75 percent of sample subjects express high
degree of satisfaction towards pay and promotion benefits and with their
supervisor’s behaviour. On the other hand, 68.17 percent are pleased with
the working environment of the bank.
Catholic Syrian Bank
From the above data above data analysis, it has been observed that,
75.08 percent of respondents’ have said that their co-workers are supportive
and makes them to work with ease. Followed by, 74.76 percent of the Catholic
Syrian Bank employees opine that their organisation factors are determined to
fulfill its workers’ needs and 71.90 percent of employees have agreed that their
organisation provides reasonable pay & other benefits. Consequently, 71.75
percent of subordinate officers have good hierarchy relationship with their
seniors. Further, it is observed that 71.11 percent of respondents are found to be
satisfied with working environment provided by the organization.
Dhanlaxmi Bank
The above table indicates that 73.08 percent of respondents express high
degree of satisfaction towards their team members, as they are supportive in

Chapter 6
152 Department of Applied Economics, Cochin University of Science and Technology
nature. Similarly, 71.28 percent of employees opine that the organizational
framework of the bank is designed in a manner to make its employees’
beneficial. Consequently, 70 percent of the employees have said that the
working environment, remunerations and other benefits offered by their
organization are reliable. On the other hand, 69.23 percent of respondents have
stated that their seniors are very polite and are comfortable with them.
6.4. Assessment of Behavioural Competency (Will Mapping
Procedure)
This section deals with analysis of behavioural competency of
managerial and clerical level staffs. Will mapping procedure is used for this
analysis and the variables used for the study are Attendance/Punctuality,
Team work, Reaction to criticism, Discipline, Imitative, Responsibility,
Quality of Job and Support & Recognise other’s achievements.(R.K.Sahu,
2009). This method draws an introspective analysis on the superior and sub-
ordinates perception towards each other competencies.
Table 6.20 Clerical Staffs’ Behavioural Competency based on officer’s perception
Variables
State Bank of Travancore Federal Bank South Indian Bank Catholic Syrian
Bank Dhanlaxmi Bank
Sum
Mea
n
Effic
ien
cy
Sum
Mea
n
Effic
ien
cy
Sum
Mea
n
Effic
ien
cy
Sum
Mea
n
Effic
ien
cy
Sum
Mea
n
Effic
ien
cy
Attendance 472 3.63 72.62 449 4.82 96.56 350 5.00 100 212 4.61 92.17 150 5.00 100 Team Work 480 3.69 73.85 280 4.00 80.00 280 4.00 80.00 184 4.00 80.00 149 4.97 99.33 Reaction to
Criticism 165 4.18 83.64 335 3.60 72.04 304 4.34 86.86 270 4.26 85.19 180 4.17 83.32
Discipline 176 3.15 63.07 196 4.46 89.29 280 4.00 80.00 223 4.85 96.96 170 4.41 88.24 Initiative 193 3.12 62.49 192 4.79 95.83 280 4.00 80.00 212 4.61 92.17 180 4.17 83.32 Responsibility 455 3.50 70.00 315 4.71 94.29 280 4.00 80.00 184 4.00 80.00 134 4.47 89.33 Quality job 169 4.35 86.92 225 4.71 94.24 280 4.00 80.00 213 4.63 92.61 175 4.29 85.71 Support 263 2.02 40.46 250 5.00 100 292 4.17 83.43 230 5.00 100 170 4.41 88.24
Source: Primary Data
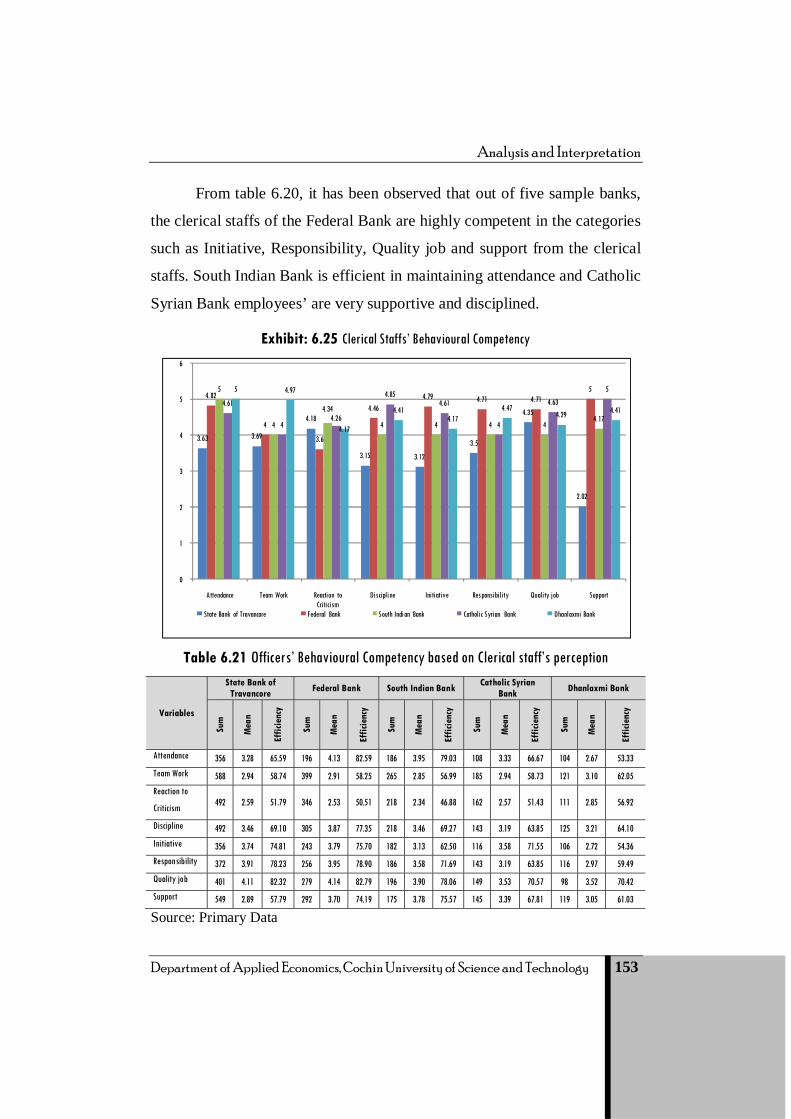
Analysis and Interpretation
Department of Applied Economics, Cochin University of Science and Technology 153
From table 6.20, it has been observed that out of five sample banks,
the clerical staffs of the Federal Bank are highly competent in the categories
such as Initiative, Responsibility, Quality job and support from the clerical
staffs. South Indian Bank is efficient in maintaining attendance and Catholic
Syrian Bank employees’ are very supportive and disciplined.
Exhibit: 6.25 Clerical Staffs’ Behavioural Competency
Table 6.21 Officers’ Behavioural Competency based on Clerical staff’s perception
Variables
State Bank of Travancore Federal Bank South Indian Bank Catholic Syrian
Bank Dhanlaxmi Bank
Sum
Mea
n
Effic
ienc
y
Sum
Mea
n
Effic
ienc
y
Sum
Mea
n
Effic
ienc
y
Sum
Mea
n
Effic
ienc
y
Sum
Mea
n
Effic
ienc
y
Attendance 356 3.28 65.59 196 4.13 82.59 186 3.95 79.03 108 3.33 66.67 104 2.67 53.33 Team Work 588 2.94 58.74 399 2.91 58.25 265 2.85 56.99 185 2.94 58.73 121 3.10 62.05 Reaction to
Criticism 492 2.59 51.79 346 2.53 50.51 218 2.34 46.88 162 2.57 51.43 111 2.85 56.92
Discipline 492 3.46 69.10 305 3.87 77.35 218 3.46 69.27 143 3.19 63.85 125 3.21 64.10 Initiative 356 3.74 74.81 243 3.79 75.70 182 3.13 62.50 116 3.58 71.55 106 2.72 54.36 Responsibility 372 3.91 78.23 256 3.95 78.90 186 3.58 71.69 143 3.19 63.85 116 2.97 59.49 Quality job 401 4.11 82.32 279 4.14 82.79 196 3.90 78.06 149 3.53 70.57 98 3.52 70.42 Support 549 2.89 57.79 292 3.70 74.19 175 3.78 75.57 145 3.39 67.81 119 3.05 61.03
Source: Primary Data
3.63 3.69
4.18
3.15 3.12
3.5
4.35
2.02
4.82
4
3.6
4.464.79 4.71 4.71
55
4
4.34
4 4 4 44.17
4.61
44.26
4.854.61
4
4.63
55 4.97
4.17
4.414.17
4.474.29 4.41
0
1
2
3
4
5
6
Attendance Team Work Reaction to Criticism
Discipline Initiative Responsibility Quality job Support
State Bank of Travancore Federal Bank South Indian Bank Catholic Syrian Bank Dhanlaxmi Bank

Chapter 6
154 Department of Applied Economics, Cochin University of Science and Technology
From Table 6.21, it is inferred that the Clerk level staffs’ perception
towards their superior’ will parameters. Out of five sample banks surveyed,
the officers of the Federal Bank are found to be competent in the variables
such as attendance, discipline, initiative, responsibility and quality job.
Based on this analysis, among the selected banks, staffs of Federal
Bank are competent than other banks.
Exhibit: 6.26 Officers’ Behavioural Competency
6.5. Analysis of Skill Mapping Procedure
In this section, the gap between the desired level and actual level
competency is analysed. Skill mapping procedure is used to analyse the
gap(R.K.Sahu, 2009).There are different 15 functional areas of the banks are
taken for the study which are mentioned in the tables 6.22 & 6.23.
0
0.5
1
1.5
2
2.5
3
3.5
4
4.5
Attendance Team Work Reaction to Criticism
Discipline Initiative Responsibility Quality job Support
3.28
2.94
2.59
3.46
3.74 3.9
1 4.11
2.89
4.13
2.91
2.53
3.87
3.79 3.9
5 4.14
3.7
3.95
2.85
2.34
3.46
3.13
3.58
3.9 3.78
3.33
2.94
2.57
3.19
3.58
3.19
3.53
3.39
2.67
3.1
2.85
3.21
2.72 2.9
7
3.52
3.05
State Bank of Travancore Federal Bank South Indian Bank Catholic Syrian Bank Dhanlaxmi Bank

Analysis and Interpretation
Department of Applied Economics, Cochin University of Science and Technology 155
Tabl
e: 6
.22
Leve
l of J
ob Sk
ills (P
rese
nt Le
vel)
Sour
ce: P
rimar
y D
ata
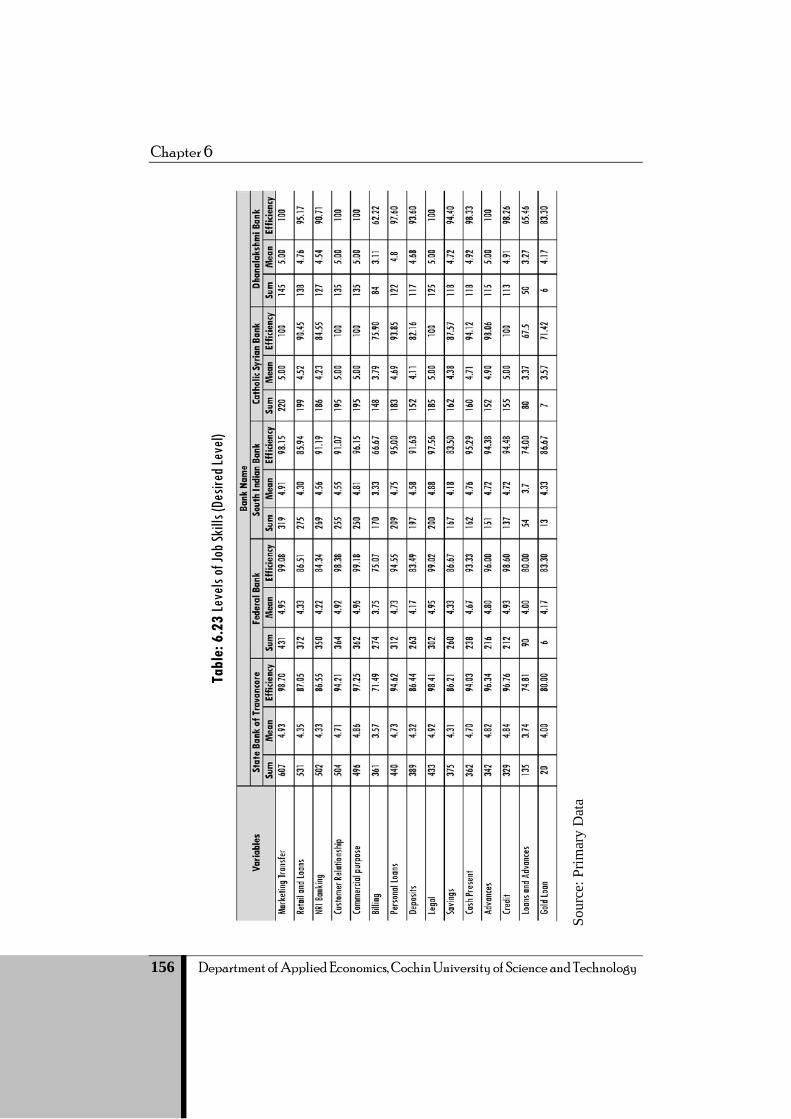
Chapter 6
156 Department of Applied Economics, Cochin University of Science and Technology
Tabl
e: 6
.23
Leve
ls of
Job S
kills
(Des
ired L
evel)
Sour
ce: P
rimar
y D
ata

Analysis and Interpretation
Department of Applied Economics, Cochin University of Science and Technology 157
Table 6.22 infers the level of job skills of the sample banks at present level. Table shows that the present level competency of the employees in Federal bank is higher in the areas such as Commercial purpose (98.92%), Deposits (96.04%), Legal (98.03%), Savings (89.02 %), Cash Present (100), Loans and advances (98.60%) and gold loan (78.14%).
The table 6.23 shows the desired level of employees in the sample banks is expected. The desired competency level of employees of Dhahnalakshmi Bank and Catholic Syrian Bank is 100 percent in the variables Marketing Transfer, Customer Relationship, Commercial Purpose and Legal affairs.
6.6. Results of Hypotheses Testing
H1: Demographic and socio-status of the managerial staffs influences
their competency level in the selected banks. Table: 6.24 Result of Anova
Demographic and Socio-Status of the Managerial Staffs and their Competency Level Variables Source Sum of Square DF Mean square F Sig
Gender Between Groups .696 1 .696
1.030
.311
Within Groups 248.025 367 .676Total 248.721 368 -
Age Between Groups 3.676 1 3.676
15.303
.000
Within Groups 88.151 367 .240Total 91.827 368 -
Educational Qualification Between Groups .626 1 .626
1.841
.176
Within Groups 124.875 367 .340Total 125.501 368 -
Name of the Bank Between Groups .001 1 .001
.000
.983
Within Groups 613.663 367 1.672Total 613.664 368 -
Designation Between Groups .083 1 .083
.028
.867
Within Groups 1088.085 367 2.965Total 1088.168 368 -
Mode of designation Between Groups 2.909 1 2.909
11.307
.001
Within Groups 94.414 367 .257Total 97.322 368 -
Work experience Between Groups .934 1 .934
1.828
.177
Within Groups 187.413 367 .511Total 188.347 368 -
Monthly income Between Groups 7.073 1 7.073
6.278
.013
Within Groups 413.469 367 1.127Total 420.542 368 -
Level of Significance: 5 percent

Chapter 6
158 Department of Applied Economics, Cochin University of Science and Technology
From Table 6.24, it is inferred that the probability value (p value) is
not statistically significant and the hypothesis framed is accepted in terms of
the variables gender, educational level, name of the bank, designation and
work experience. The p value is significant and the null hypothesis is
rejected in this case in terms of variables age, mode of designation and
monthly income.
H2: Demographic and socio status of the clerical staffs influence their
competency level in the selected banks.
TABLE: 6.25 Result of Anova Demographic and socio-status of clerical staffs and their competency level
Variables Source Sum of Square DF Mean square F Sig
Gender Between Groups .027 1 .027
.020
.889
Within Groups 709.316 520 1.364Total 709.343 521 -
Age Between Groups .070 1 .070
.278
.598
Within Groups 129.940 520 .250Total 130.010 521 -
Educational Qualification
Between Groups .017 1 .017 .049
.824
Within Groups 180.389 520 .347Total 180.406 521 -
Name of the Bank Between Groups .226 1 .226
.139
.709
Within Groups 844.939 520 1.625Total 845.165 521 -
Designation Between Groups .010 1 .010
.002
.963
Within Groups 2373.149 520 4.564Total 2373.159 521 -
Mode of designation Between Groups .042 1 .042
.168
.682
Within Groups 130.389 520 .251Total 130.431 521 -
Work experience Between Groups .131 1 .131
.302
.583
Within Groups 225.494 520 .434Total 225.625 521 -
Monthly income Between Groups 4.806 1 4.806
3.599
.058
Within Groups 694.405 520 1.335Total 699.211 521 -
Level of Significance: 5 percent
Table 6.25 shows that the probability value of all the variables are
not statistically significant. Therefore, the hypothesis is accepted and it is
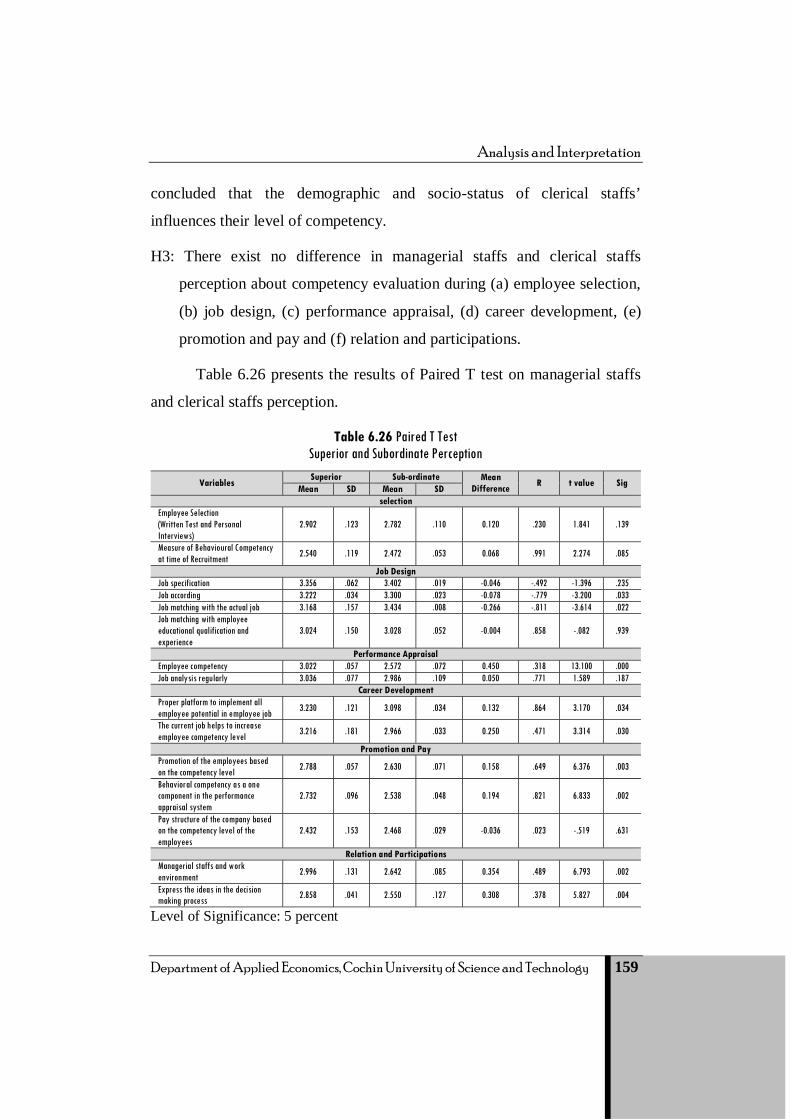
Analysis and Interpretation
Department of Applied Economics, Cochin University of Science and Technology 159
concluded that the demographic and socio-status of clerical staffs’
influences their level of competency.
H3: There exist no difference in managerial staffs and clerical staffs
perception about competency evaluation during (a) employee selection,
(b) job design, (c) performance appraisal, (d) career development, (e)
promotion and pay and (f) relation and participations.
Table 6.26 presents the results of Paired T test on managerial staffs
and clerical staffs perception.
Table 6.26 Paired T Test Superior and Subordinate Perception
Variables Superior Sub-ordinate Mean
Difference R t value Sig Mean SD Mean SD
selectionEmployee Selection (Written Test and Personal Interviews)
2.902 .123 2.782 .110 0.120 .230 1.841 .139
Measure of Behavioural Competency at time of Recruitment 2.540 .119 2.472 .053 0.068 .991 2.274 .085
Job DesignJob specification 3.356 .062 3.402 .019 -0.046 -.492 -1.396 .235 Job according 3.222 .034 3.300 .023 -0.078 -.779 -3.200 .033 Job matching with the actual job 3.168 .157 3.434 .008 -0.266 -.811 -3.614 .022 Job matching with employee educational qualification and experience
3.024 .150 3.028 .052 -0.004 .858 -.082 .939
Performance AppraisalEmployee competency 3.022 .057 2.572 .072 0.450 .318 13.100 .000 Job analysis regularly 3.036 .077 2.986 .109 0.050 .771 1.589 .187
Career DevelopmentProper platform to implement all employee potential in employee job 3.230 .121 3.098 .034 0.132 .864 3.170 .034
The current job helps to increase employee competency level 3.216 .181 2.966 .033 0.250 .471 3.314 .030
Promotion and PayPromotion of the employees based on the competency level 2.788 .057 2.630 .071 0.158 .649 6.376 .003
Behavioral competency as a one component in the performance appraisal system
2.732 .096 2.538 .048 0.194 .821 6.833 .002
Pay structure of the company based on the competency level of the employees
2.432 .153 2.468 .029 -0.036 .023 -.519 .631
Relation and ParticipationsManagerial staffs and work environment 2.996 .131 2.642 .085 0.354 .489 6.793 .002
Express the ideas in the decision making process 2.858 .041 2.550 .127 0.308 .378 5.827 .004
Level of Significance: 5 percent
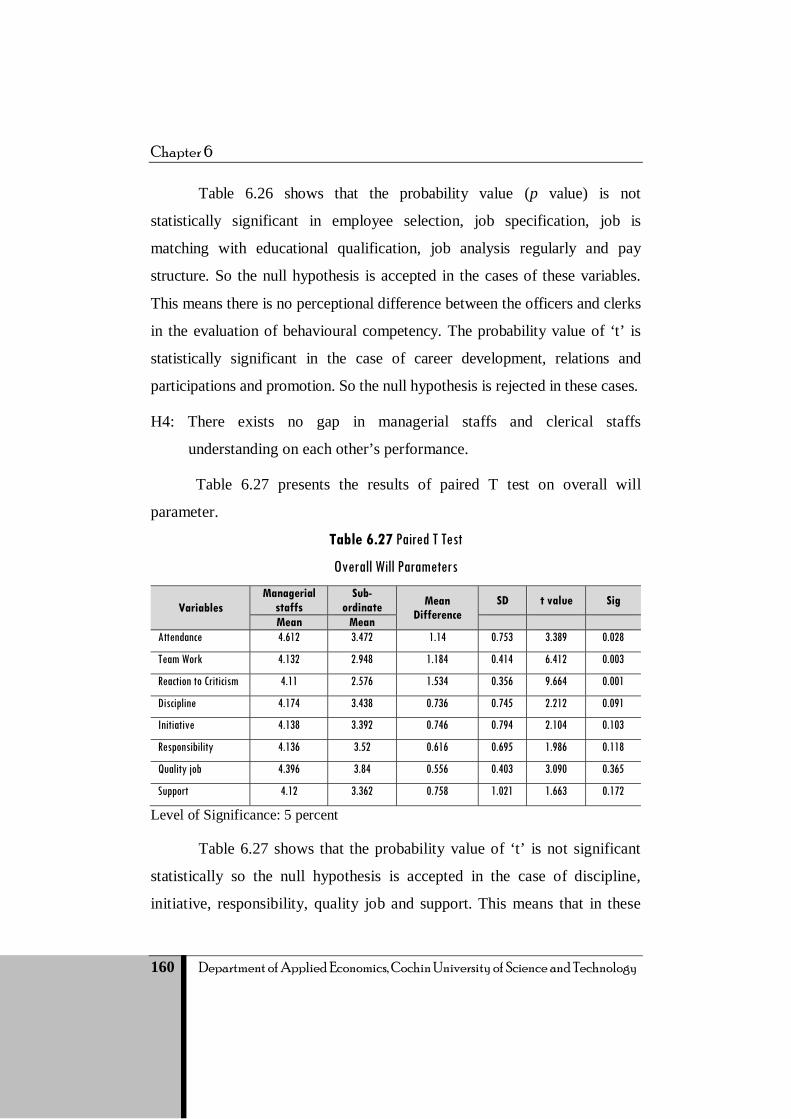
Chapter 6
160 Department of Applied Economics, Cochin University of Science and Technology
Table 6.26 shows that the probability value (p value) is not
statistically significant in employee selection, job specification, job is
matching with educational qualification, job analysis regularly and pay
structure. So the null hypothesis is accepted in the cases of these variables.
This means there is no perceptional difference between the officers and clerks
in the evaluation of behavioural competency. The probability value of ‘t’ is
statistically significant in the case of career development, relations and
participations and promotion. So the null hypothesis is rejected in these cases.
H4: There exists no gap in managerial staffs and clerical staffs
understanding on each other’s performance.
Table 6.27 presents the results of paired T test on overall will
parameter.
Table 6.27 Paired T Test
Overall Will Parameters
Variables Managerial
staffs Sub-
ordinate Mean Difference
SD t value Sig
Mean Mean Attendance 4.612 3.472 1.14 0.753 3.389 0.028
Team Work 4.132 2.948 1.184 0.414 6.412 0.003
Reaction to Criticism 4.11 2.576 1.534 0.356 9.664 0.001
Discipline 4.174 3.438 0.736 0.745 2.212 0.091
Initiative 4.138 3.392 0.746 0.794 2.104 0.103
Responsibility 4.136 3.52 0.616 0.695 1.986 0.118
Quality job 4.396 3.84 0.556 0.403 3.090 0.365
Support 4.12 3.362 0.758 1.021 1.663 0.172
Level of Significance: 5 percent
Table 6.27 shows that the probability value of ‘t’ is not significant
statistically so the null hypothesis is accepted in the case of discipline,
initiative, responsibility, quality job and support. This means that in these

Analysis and Interpretation
Department of Applied Economics, Cochin University of Science and Technology 161
variables, there exists no gap in managerial staffs and clerical staffs
understanding on each other’s performance. The p value is statistically
significant and the null hypothesis is rejected in the case of attendance, team
- work and reaction to criticism.
H5: There exists no gap in employees’ desired level of competency and the
actual level. Table 6.28 presents the results of PAIRED T TEST with
respect to the level of job skills.
TABLE 6.28 Paired T Test Level of Job Skills
Variables Present level Desired level Mean Difference SD t value Sig Mean Mean
Marketing Transfer 4.958 4.892 0.066 0.102 1.448 0.221
Retail and Loans 4.452 4.934 -0.482 0.223 -4.837 0.008
NRI Banking 4.376 4.432 -0.056 0.238 -0.528 0.625
Customer Relationship 4.836 4.288 0.548 0.211 5.828 0.004
Commercial purpose 4.926 4.776 0.15 0.120 2.795 0.049
Billing 3.51 4.112 -0.602 0.105 -12.817 0.000
Personal Loans 4.74 4.752 -0.012 0.061 -0.441 0.683
Deposits 4.372 4.614 -0.242 0.298 -1.820 0.143
Legal 4.95 4.764 0.186 0.088 4.739 0.009
Savings 4.384 4.33 0.054 0.221 0.548 0.613
Cash Present 4.752 4.952 -0.2 0.150 -2.980 0.041
Advances 4.848 4.698 0.15 0.143 2.355 0.078
Credit 4.88 4.756 0.124 0.074 3.769 0.019
Loans and Advances 3.616 4.842 -1.226 0.293 -9.379 0.001
Gold Loan 4.048 3.594 0.454 0.485 2.095 0.104
Level of Significance: 5 percent
Table 6.28 shows that probability value of ‘t’ value is significant at
five percent level. The p value is statistically significant in terms of variables
Retail and loans, Customer relationship, Commercial purpose, Billing, Cash
present, Legal, Credit and Loans and advances. Based on above, null

Chapter 6
162 Department of Applied Economics, Cochin University of Science and Technology
hypothesis is rejected in the case of these variable i.e. there is a gap in desired
level and present level competencies of the employees. The probability value
is statistically not significant and so null hypothesis is accepted in the case of
variables such as marketing transfer, NRI banking, personal loan, deposits,
savings, advances and gold loan. That means in these respective areas, there is
no gap in the present level and desired level.
H6: Clerical staffs’ competency differs from one bank to another.
To examine the suitability of the data for subsequent exploratory
factor analysis (EFA), two tests were used: Kaiser-Meyer-Olkin Measure of
Sampling Adequacy; and Bartlett's Test of Sphericity. Factor analysis
technique has been applied to find the underlying dimension (factors) that
exists among the eight variables relating to overall will parameter.
Table 6.29 KMO and Bartlett's Test Overall Will Parameter
Kaiser-Meyer-Olkin Measure of Sampling Adequacy .909
Bartlett's Test of Sphericity Approx. Chi-Square 837.433
DF 28
Sig .000
Level of Significance: 5 percent
In the present study, Kaiser-Meyer-Oklin (KMO) Measure of
Sampling Adequacy (MSA) and Bartlett’s test of Sphericity were applied to
verify the adequacy or appropriateness of data for factor analysis. In this
study, the value of KMO for overall matrix was found to be excellent
(0.909) and Bartlett’s test of Sphericity was highly significant (p<0.05).
Bartlett’s Sphericity test was effective, as the chi-square value draws
significance at five percent level. The results thus indicated that the sample
taken was appropriate to proceed with a factor analysis procedure. Besides
the Bartlett’s Test of Sphericity and the KMO Measure of sampling
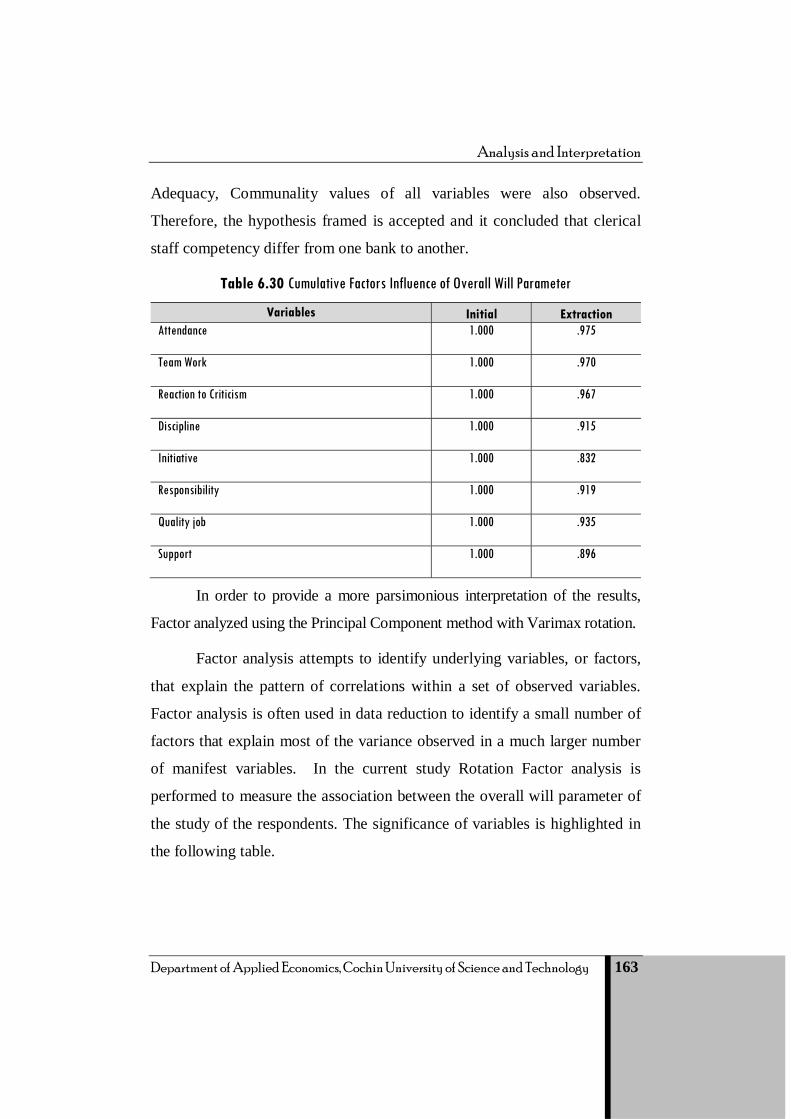
Analysis and Interpretation
Department of Applied Economics, Cochin University of Science and Technology 163
Adequacy, Communality values of all variables were also observed.
Therefore, the hypothesis framed is accepted and it concluded that clerical
staff competency differ from one bank to another.
Table 6.30 Cumulative Factors Influence of Overall Will Parameter
Variables Initial Extraction Attendance 1.000 .975
Team Work 1.000 .970
Reaction to Criticism 1.000 .967
Discipline 1.000 .915
Initiative 1.000 .832
Responsibility 1.000 .919
Quality job 1.000 .935
Support 1.000 .896
In order to provide a more parsimonious interpretation of the results,
Factor analyzed using the Principal Component method with Varimax rotation.
Factor analysis attempts to identify underlying variables, or factors,
that explain the pattern of correlations within a set of observed variables.
Factor analysis is often used in data reduction to identify a small number of
factors that explain most of the variance observed in a much larger number
of manifest variables. In the current study Rotation Factor analysis is
performed to measure the association between the overall will parameter of
the study of the respondents. The significance of variables is highlighted in
the following table.
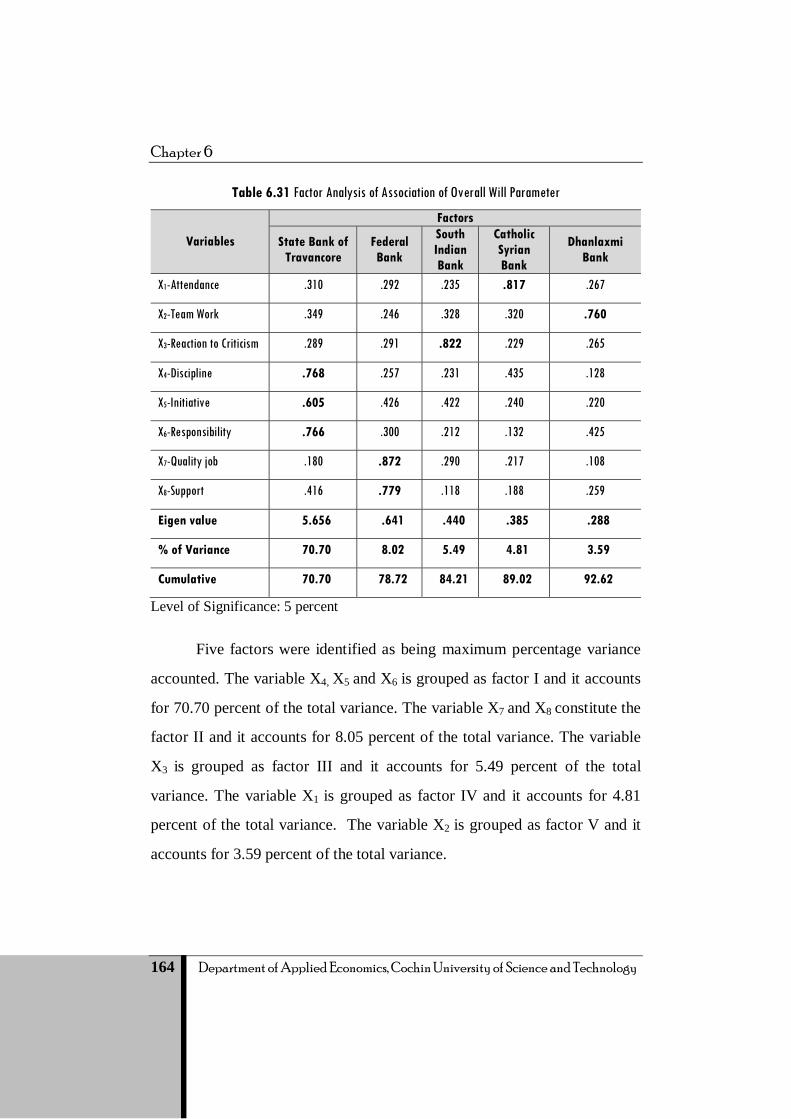
Chapter 6
164 Department of Applied Economics, Cochin University of Science and Technology
Table 6.31 Factor Analysis of Association of Overall Will Parameter
Variables
Factors
State Bank of Travancore
Federal Bank
South Indian Bank
Catholic Syrian Bank
Dhanlaxmi Bank
X1-Attendance .310 .292 .235 .817 .267
X2-Team Work .349 .246 .328 .320 .760
X3-Reaction to Criticism .289 .291 .822 .229 .265
X4-Discipline .768 .257 .231 .435 .128
X5-Initiative .605 .426 .422 .240 .220
X6-Responsibility .766 .300 .212 .132 .425
X7-Quality job .180 .872 .290 .217 .108
X8-Support .416 .779 .118 .188 .259
Eigen value 5.656 .641 .440 .385 .288
% of Variance 70.70 8.02 5.49 4.81 3.59
Cumulative 70.70 78.72 84.21 89.02 92.62
Level of Significance: 5 percent
Five factors were identified as being maximum percentage variance
accounted. The variable X4, X5 and X6 is grouped as factor I and it accounts
for 70.70 percent of the total variance. The variable X7 and X8 constitute the
factor II and it accounts for 8.05 percent of the total variance. The variable
X3 is grouped as factor III and it accounts for 5.49 percent of the total
variance. The variable X1 is grouped as factor IV and it accounts for 4.81
percent of the total variance. The variable X2 is grouped as factor V and it
accounts for 3.59 percent of the total variance.

Analysis and Interpretation
Department of Applied Economics, Cochin University of Science and Technology 165
Exhibit 6.27 Overall Will Parameter
Table 6.32 Summary of Rotational Factor Analysis & Cronbach’s Alpha Overall Will Parameter
Factors Factor interpretation Variables included in the factors Cronbanch's Alpha F1 State Bank of Travancore Discipline, Initiative and Responsibility 0.944
F2 Federal Bank Quality job and Support 0.881
F3 South Indian Bank Reaction to Criticism 0.766
F4 Catholic Syrian Bank Attendance 0.631
F5 Dhanlaxmi Bank Team Work 0.674
Source: Computed From Primary Data
Cronbanch's Alpha values 0.944, 0.881, 0.766, 0.631 and 0.674
presented in Table 6.32 establishes significant and positive association
between the variables tested. It establishes internal consistency with respect
to data collected at the time of filed survey. The results of the test establish
consistency in the opinion of respondents towards the expressed by the
sample population overall wills parameter.
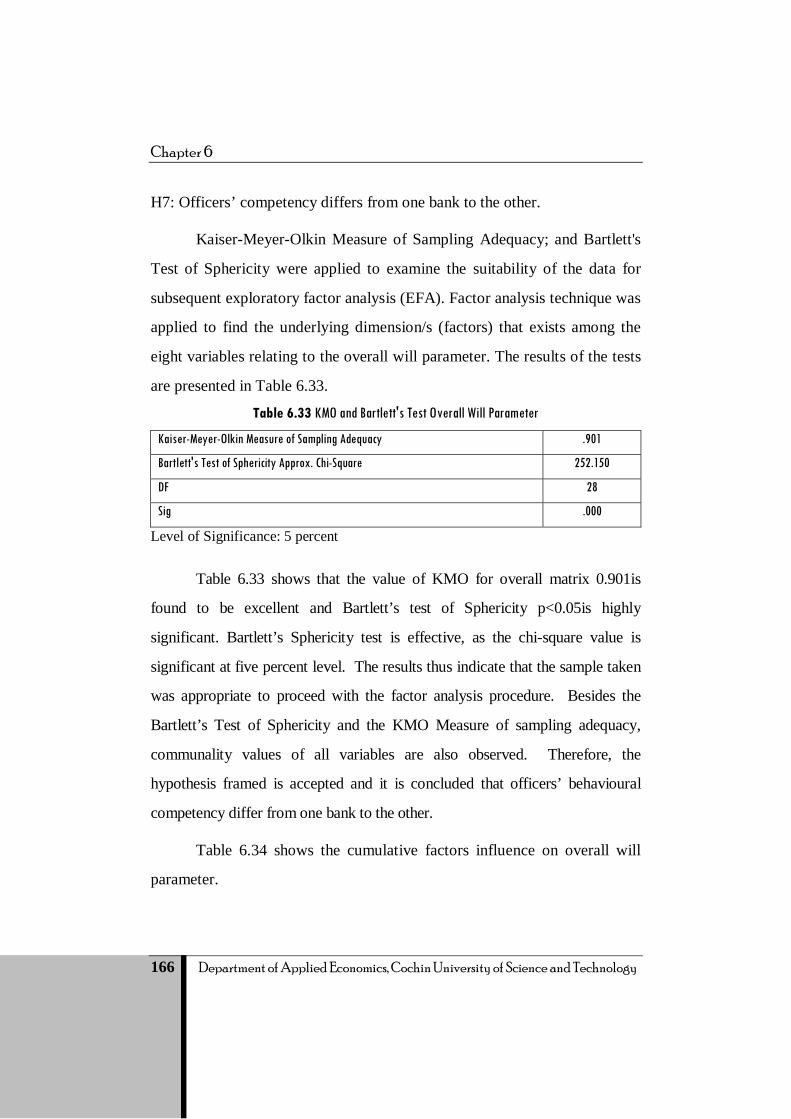
Chapter 6
166 Department of Applied Economics, Cochin University of Science and Technology
H7: Officers’ competency differs from one bank to the other.
Kaiser-Meyer-Olkin Measure of Sampling Adequacy; and Bartlett's
Test of Sphericity were applied to examine the suitability of the data for
subsequent exploratory factor analysis (EFA). Factor analysis technique was
applied to find the underlying dimension/s (factors) that exists among the
eight variables relating to the overall will parameter. The results of the tests
are presented in Table 6.33.
Table 6.33 KMO and Bartlett's Test Overall Will Parameter
Kaiser-Meyer-Olkin Measure of Sampling Adequacy .901
Bartlett's Test of Sphericity Approx. Chi-Square 252.150
DF 28
Sig .000
Level of Significance: 5 percent
Table 6.33 shows that the value of KMO for overall matrix 0.901is
found to be excellent and Bartlett’s test of Sphericity p<0.05is highly
significant. Bartlett’s Sphericity test is effective, as the chi-square value is
significant at five percent level. The results thus indicate that the sample taken
was appropriate to proceed with the factor analysis procedure. Besides the
Bartlett’s Test of Sphericity and the KMO Measure of sampling adequacy,
communality values of all variables are also observed. Therefore, the
hypothesis framed is accepted and it is concluded that officers’ behavioural
competency differ from one bank to the other.
Table 6.34 shows the cumulative factors influence on overall will
parameter.

Analysis and Interpretation
Department of Applied Economics, Cochin University of Science and Technology 167
Table 6.34 Cumulative Factors Influence of Overall Will Parameter
Variables Initial Extraction Attendance 1.000 .938
Team Work 1.000 .936
Reaction to Criticism 1.000 .974
Discipline 1.000 .898
Initiative 1.000 .921
Responsibility 1.000 .989
Quality job 1.000 .969
Support 1.000 .901
In order to provide a more parsimonious interpretation of the results,
Factor analyzed using the Principal Component method with Varimax
rotation.
Factor analysis attempts to identify underlying variables, or factors,
that explain the pattern of correlations within a set of observed variables.
Factor analysis is often used in data reduction to identify a small number of
factors that explain most of the variance observed in a much larger number
of manifest variables. In this study, Rotation Factor Analysis is performed
to measure the association between the overall will parameter of the study of
the respondents. The significance of variables is highlighted in Table 6.46.
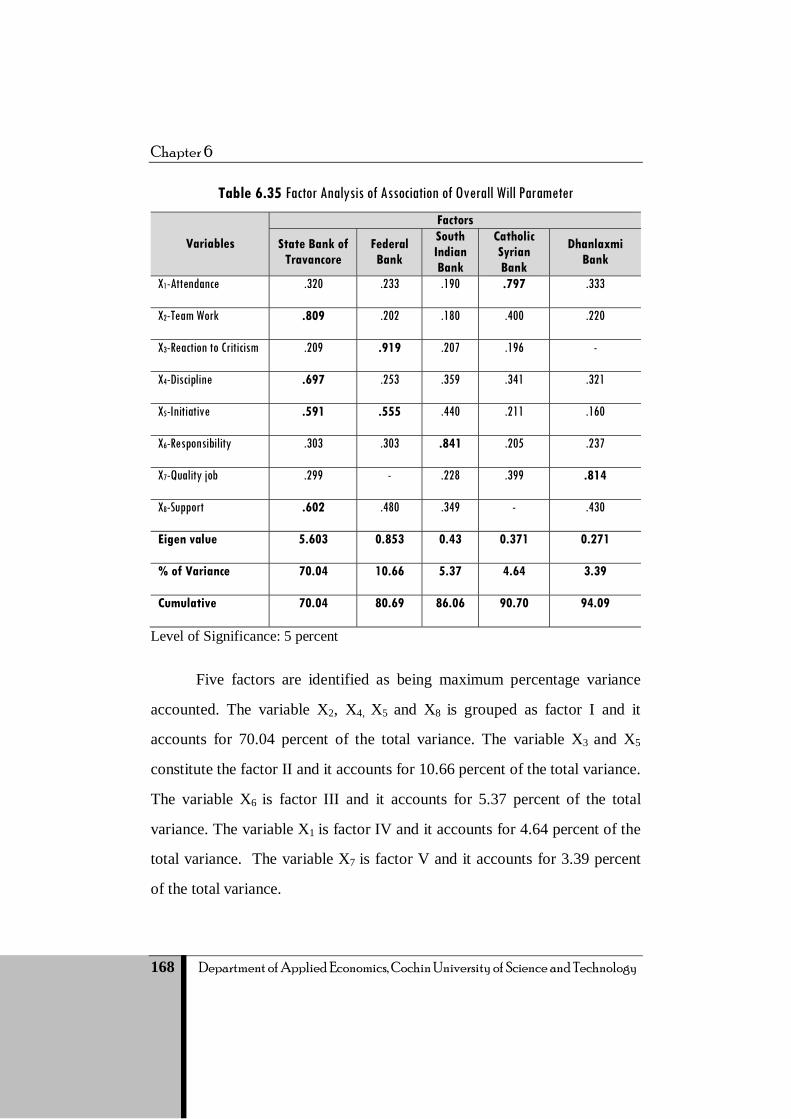
Chapter 6
168 Department of Applied Economics, Cochin University of Science and Technology
Table 6.35 Factor Analysis of Association of Overall Will Parameter
Variables
Factors
State Bank of Travancore
Federal Bank
South Indian Bank
Catholic Syrian Bank
Dhanlaxmi Bank
X1-Attendance .320 .233 .190 .797 .333
X2-Team Work .809 .202 .180 .400 .220
X3-Reaction to Criticism .209 .919 .207 .196 -
X4-Discipline .697 .253 .359 .341 .321
X5-Initiative .591 .555 .440 .211 .160
X6-Responsibility .303 .303 .841 .205 .237
X7-Quality job .299 - .228 .399 .814
X8-Support .602 .480 .349 - .430
Eigen value 5.603 0.853 0.43 0.371 0.271
% of Variance 70.04 10.66 5.37 4.64 3.39
Cumulative 70.04 80.69 86.06 90.70 94.09
Level of Significance: 5 percent
Five factors are identified as being maximum percentage variance
accounted. The variable X2, X4, X5 and X8 is grouped as factor I and it
accounts for 70.04 percent of the total variance. The variable X3 and X5
constitute the factor II and it accounts for 10.66 percent of the total variance.
The variable X6 is factor III and it accounts for 5.37 percent of the total
variance. The variable X1 is factor IV and it accounts for 4.64 percent of the
total variance. The variable X7 is factor V and it accounts for 3.39 percent
of the total variance.

Analysis and Interpretation
Department of Applied Economics, Cochin University of Science and Technology 169
Exhibit 6.28 Overall Will Parameter
Table 6.36 summarizes the results
Table 6.36 Summary of Rotational Factor Analysis & Cronbach’s Alpha Overall Will Parameter of Overall Will Parameter
Factors Factor interpretation Variables included in the factors Cronbach’s Alpha
F1 State Bank of
Travancore Team Work, Discipline, Initiative and Support .939
F2 Federal Bank Reaction to Criticism and Initiative .842
F3 South Indian Bank Responsibility .723
F4 Catholic Syrian Bank Attendance .681
F5 Dhanlaxmi Bank Quality job .655
Source: Computed From Primary Data
Chapter 6
170 Department of Applied Economics, Cochin University of Science and Technology
The result of reliability analysis shows that the Cronbach’s Alpha
values 0.939, 0.842, 0.723, 0.681 and 0.655 establish significant and
positive association between or among the variables tested. It establishes
internal consistency with data collected at the time of filed survey. The
results of the test establish consistency in the opinion of respondents
(Officers& clerical staffs) towards overall will parameters.
Conclusion
From the above analysis, it is concluded that the competency of
employees differs from one bank to another. The hypothesis proved that
demographic and socio-economic factors influence the competency level of
the employees. There is some skill gap existing in some functional areas.
Based on will and skill mapping, it is concluded that the employees of the
Federal bank are more competent.
.…….. ……..

Summary, Findings, Suggestions and Conclusion
Department of Applied Economics, Cochin University of Science and Technology 171
This chapter provides the summary, findings, conclusions and
suggestions.
7.1 Summary
Finding competent (skilled, experienced, responsible) employees is a
challenge for human resource departments in any industry, more so in a
service-oriented industry like banking. In a service-oriented industry like
banking, the quality of human resources has to be the primary focus. Unless
the organizations leverage the strength of their human resource to the
maximum, they would fail miserably in attaining a competitive edge in the
global banking arena.
Presently the competition is sky high in banking industry. Only tough
competitors can survive under these rapid changes. Every bank has a dream
to face this situation and emerge as victorious, but it is not as easy as one
could imagine. However, a collective struggle, a desire to work altogether
for transformation is essential. Bit by bit approach never helps in this cause,
this, too, is an occasion to think, plan and set strategies to reach the goal.
Banks can achieve their goals through an appropriate policy and practice

Chapter 7
172 Department of Applied Economics, Cochin University of Science and Technology
regarding training and development of their human resources. Every
manager especially HRD executive has an immediate task to instruct, guide
and develop the work force, to bring changes in them by resorting to a
viable tool of employee or staff training and development. Success of any
bank, organization and activities largely depends upon its trained and
developed human resource.
The objectives of the study are:
• To study the socio-economic and job profile of the bank officers and
clerical staffs in selected banks headquartered in Kerala.
• To analyse how far competency gets importance in the present set-up
of the selected banking sector.
• To analyse the employee competency in the selected Commercial
banks headquartered in Kerala.
• To measure the behavioural competencies of banking staff based on
will parameters.
• To identify the gap between desired and the actual level of
employee’s competency for effective competency management.
The following hypotheses are formulated for the study:
• Demographic and socio-status of the managerial officers and clerical
staff influences their competency level in the selected banks.
• There exists no difference in managerial staffs’ and clerical staffs’
perception about competency evaluation during: (a) employee
selection, (b) job design, (c) performance appraisal, (d) career
development, (e) promotion and pay and (f) relation and
participations.
Summary, Findings, Suggestions and Conclusion
Department of Applied Economics, Cochin University of Science and Technology 173
• There exists no gap in managerial staffs and clerical staffs’
understanding on each other’s performance.
• There exists no gap in employees’ desired level of competency and
the actual level.
• Employees’ competency differs from one bank to another.
Based on the data analysis the following conclusions are made.
7.2 Findings of the Study
The major findings of the study are summarized in this sub-section.
I. The socio-economic and job profile of the banking officers and
employees in selected sample banks headquartered in Kerala.
The first objective of the study is to draw first-hand information on
the socio-economic and job profile of the banking officers in selected
sample banks headquartered in Kerala. The findings of this respective
objective are as follows:-
• A total of 369 managerial staffs and 522 executive level officers
participated in the survey. Out of 369 officers, 53.40 percent of the
seniors officers surveyed were male and the remaining 46.60 percent
of the respondents were female. Moreover, out of 522 clerical level
employees, 53.10 percent were female and the remaining 46.90
percent of the respondents were male.
• Regarding the age factor, 41.20 percent of administrative officers
belonged to the age group of 31-35 years, 40.90 percent are aged
above 35 years, 13.80 percent, aged between 26-30 years and 4.10
percent, fall under the age group of below 25 years. Regarding

Chapter 7
174 Department of Applied Economics, Cochin University of Science and Technology
clerical staff, 44.10 percent belong to the age group of above 35
years, 21.60 percent are aged between 26-30 years, 18.00 percent are
aged below 25 years and the rests of 16.30 percent of the
respondents are age between 31-35 years.
• With respect to educational qualification of the administrative and
executive/clerk level officers, among 369 senior officers, 64.00
percent of the respondents are degree holders, 28.70 percent,
postgraduates, 5.70 percent, senior officers who have completed
SSLC/HSLC and the remaining 1.60 percent has other
qualifications. It is also found that, 51.30 percent of executive
officers are degree holders, 43.10 percent, postgraduates and 5.60
percent , respondents have completed SSLC/HSLC.
• Of the 369 respondents, 37.10 percent are administrative officers,
32.60 percent, branch managers, 15.40 percent, assistant managers
and 7.60 percent, public officers, 2.40 percent, DGM-Legal officials
and 2.40 percent credit managers. Moreover, 1.60 percent, working
in other sections and the remaining 0.80 percent are employed as
business heads. Among the clerical staffs, 28.73 percent, single
window operators, 14.60 percent, head cashiers and 22.98 percent,
administrative clerks. Of the rest, 3.06 percent, cashier and 30.70
percent, in other positions.
• Majority of the senior officers has entered into the current
designation through promotions (53.40 percent), 45.80 percent
through direct recruitment and 0.80 percent, through other modes.
Similarly, 51.10 percent of the bank executives/clerical employees

Summary, Findings, Suggestions and Conclusion
Department of Applied Economics, Cochin University of Science and Technology 175
entered directly into the current designation, 48.90 percent, through
promotions.
• More than 56 percent of the officers have more than 6 years work
experience, 30.60 percent, 4-6 years and the remaining 13.30
percent, 3 years or less than 3 years. Out of 522 executive/clerk level
officers, 56.70 percent have 4-6 years work experience, 23.00
percent, more than 6 years and the remaining 20.30 percent, less than
3 years.
• More than 31% (31.40%) of the managers earn above Rs.35,000 per
month, 27.40 percent, between Rs.30000- Rs.35,000, 25.20 percent,
between Rs.25000- Rs.30000, 16.00 percent, between 20000-25000.
In the case of the executive/clerk level officers, 42.30 percent ,
below Rs.10000 per month, 26.10 percent ,between Rs.10000-
Rs.15000 and 20.30 percent earn above Rs.20000 and 11.30 percent,
between Rs.15000- Rs. 20000.
II. Importance of Competency in HR practices.
The findings with respect to the second objective are as follows:-
• More than 67% of the officers and clerical level staff in the selected
banks have revealed that employee selection is based on their written
test and personal interviews performance. Sixty percent of the
officers opined that behavioral competency is measured at the time
of interview.
• Above 70 percent of the seniors and clerical staff of the selected
banks opined that the banks have job specification on each role and
all employees have done their job according to the job description. It
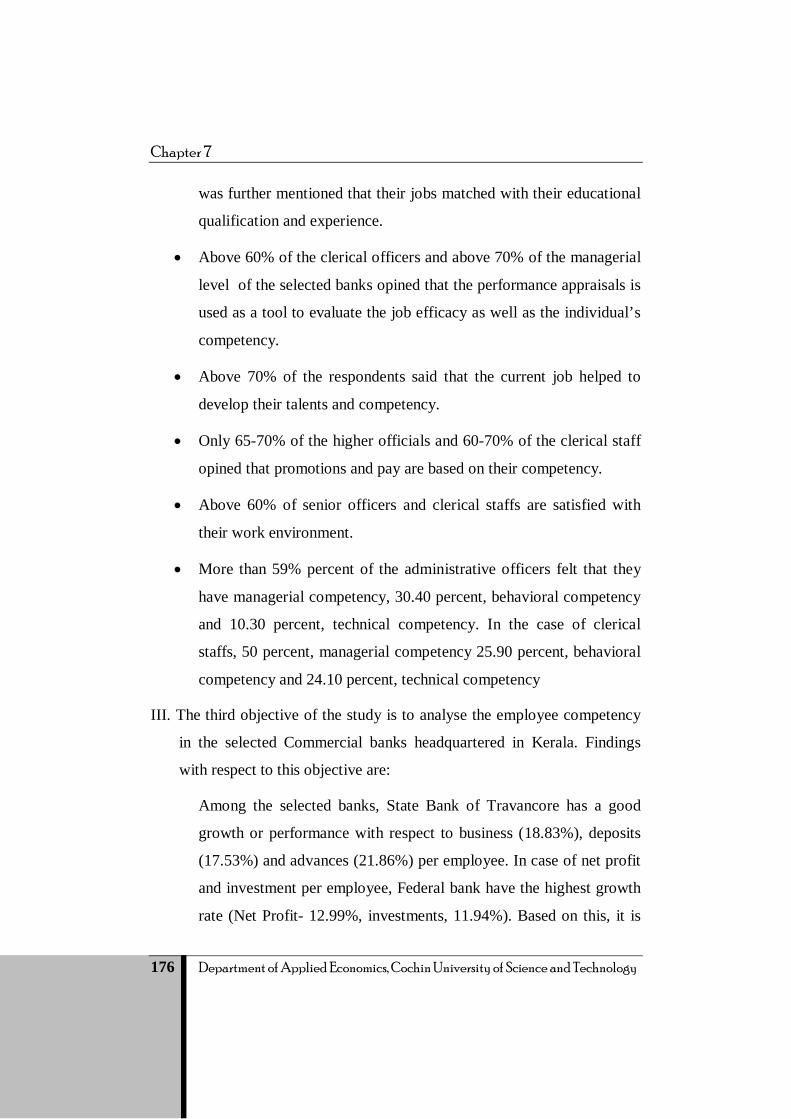
Chapter 7
176 Department of Applied Economics, Cochin University of Science and Technology
was further mentioned that their jobs matched with their educational
qualification and experience.
• Above 60% of the clerical officers and above 70% of the managerial
level of the selected banks opined that the performance appraisals is
used as a tool to evaluate the job efficacy as well as the individual’s
competency.
• Above 70% of the respondents said that the current job helped to
develop their talents and competency.
• Only 65-70% of the higher officials and 60-70% of the clerical staff
opined that promotions and pay are based on their competency.
• Above 60% of senior officers and clerical staffs are satisfied with
their work environment.
• More than 59% percent of the administrative officers felt that they
have managerial competency, 30.40 percent, behavioral competency
and 10.30 percent, technical competency. In the case of clerical
staffs, 50 percent, managerial competency 25.90 percent, behavioral
competency and 24.10 percent, technical competency
III. The third objective of the study is to analyse the employee competency
in the selected Commercial banks headquartered in Kerala. Findings
with respect to this objective are:
Among the selected banks, State Bank of Travancore has a good
growth or performance with respect to business (18.83%), deposits
(17.53%) and advances (21.86%) per employee. In case of net profit
and investment per employee, Federal bank have the highest growth
rate (Net Profit- 12.99%, investments, 11.94%). Based on this, it is
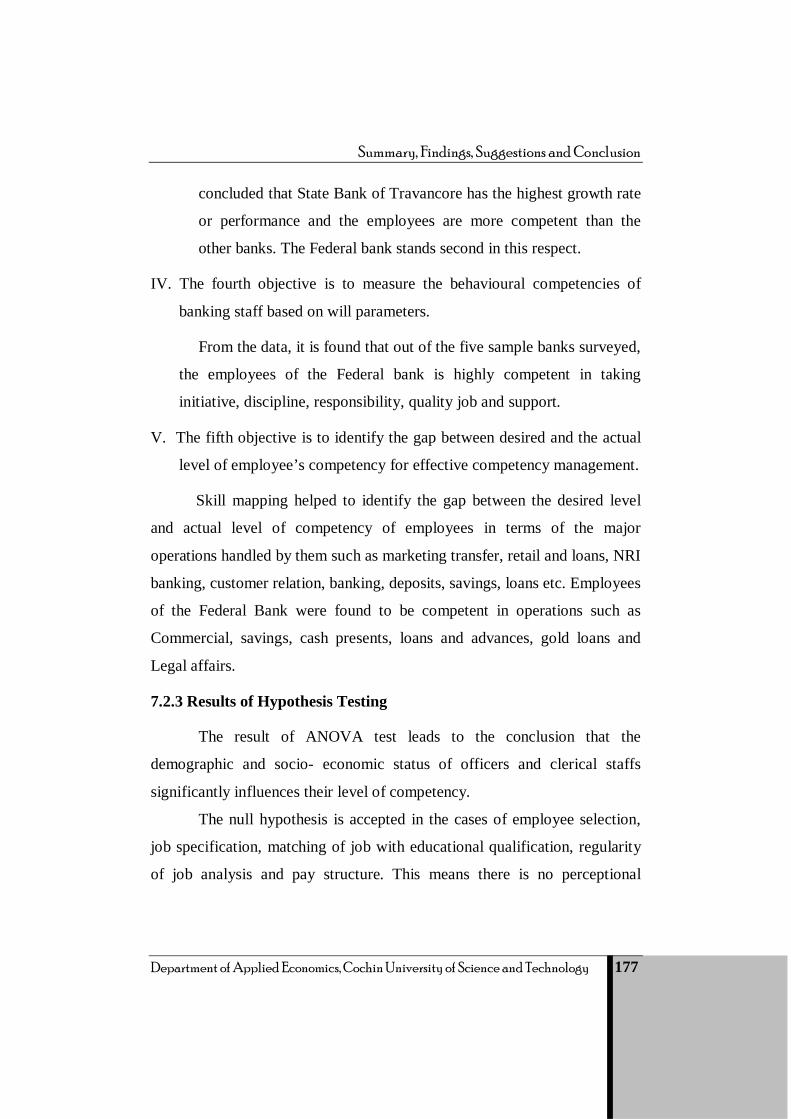
Summary, Findings, Suggestions and Conclusion
Department of Applied Economics, Cochin University of Science and Technology 177
concluded that State Bank of Travancore has the highest growth rate
or performance and the employees are more competent than the
other banks. The Federal bank stands second in this respect.
IV. The fourth objective is to measure the behavioural competencies of
banking staff based on will parameters.
From the data, it is found that out of the five sample banks surveyed,
the employees of the Federal bank is highly competent in taking
initiative, discipline, responsibility, quality job and support.
V. The fifth objective is to identify the gap between desired and the actual
level of employee’s competency for effective competency management.
Skill mapping helped to identify the gap between the desired level
and actual level of competency of employees in terms of the major
operations handled by them such as marketing transfer, retail and loans, NRI
banking, customer relation, banking, deposits, savings, loans etc. Employees
of the Federal Bank were found to be competent in operations such as
Commercial, savings, cash presents, loans and advances, gold loans and
Legal affairs.
7.2.3 Results of Hypothesis Testing
The result of ANOVA test leads to the conclusion that the
demographic and socio- economic status of officers and clerical staffs
significantly influences their level of competency.
The null hypothesis is accepted in the cases of employee selection,
job specification, matching of job with educational qualification, regularity
of job analysis and pay structure. This means there is no perceptional

Chapter 7
178 Department of Applied Economics, Cochin University of Science and Technology
difference between the officers and clerks in the evaluation of behavioural
competency during HR practices.
The results of Paired t-test indicate that the probability of t- value is
significant at five percent level. Therefore, there exists no gap in managerial
staffs and clerical staffs understanding on each other’s performance with
respect to discipline, initiative, responsibility, quality job and support.
The results of Paired t-test indicate that the t- value is significant at
five percent. The hypothesis proved that there is a gap in desired level and
present level competencies of the employees in terms of variables such as
Retail and loans, Customer relationship, Commercial purpose, Billing, Cash
present, Legal affairs, Credit and Loans and advances
The results of Rotation Factor Analysis show that employee’s
competency differ from one bank to another.
7.3 Conclusion
The study was conducted with the objective of analyzing the
behvioural competency of the managers and clerical staff in the commercial
banks headquartered in Kerala. The researcher has gone through the
available literature with respect to employee competency, job satisfaction
and employee performance evaluation to formulate the problem and
conceptualize the framework of the study. The study concluded that the
competency of the employees differs from one bank to the other but
strengthening the employees’ competency is the only possible solution by
which the banks can determine their future growth prospects. Only through
competency, banks can achieve high level of performance especially under
the globalised situation.

Summary, Findings, Suggestions and Conclusion
Department of Applied Economics, Cochin University of Science and Technology 179
7.4 Suggestions
An organization is made up of a number of people who strive to
achieve the organization’s goals; this concept aptly applies to Scheduled
Commercial banks headquartered in Kerala. Human Resources have a
significant bearing on the profitability, efficiency and overall organizational
effectiveness.
Productivity is a vital indicator of measuring competency or
performance. In simple words, it is input - output ratio. It is a relationship
between given means used to produce the output. Labour productivity in
banking sector determines its employees’ competitiveness. From the
detailed empirical data analysis, it is understood that the employees’
competency is assessed and it differs from one scheduled commercial bank
to the other. With the advent of economic reforms in 1991, the deregulation
and opening of the Indian economy to the global market, brings
opportunities over a vast and unlimited market to business and industry in
India, which directly brings added opportunities to the banks and demand
effective competency both in term of operational efficiency and employee
productivity. With due concerns to the discussed issues, the following
suggestions are proposed:
Various categories of Banks headquartered in Kerala are facing lot of
competition due to increased globalization, technological enhancement and
consumer awareness about their rights. This phenomenon has put the banks
to act and revise their service quality. To enhance the competency level of
banks and their employees’ the following suggestion are proposed.
The empirical findings of the study revealed that competency of
officers and clerical staffs differ from one bank to the other. The banks must

Chapter 7
180 Department of Applied Economics, Cochin University of Science and Technology
initiate to minimize the competency gap among their staff. In this respect,
banks must:
Develop job description and avoid role conflicts.
Educate Senior and junior employees about their roles in the
organisation so that the role conflict is minimised.
Identify issues affecting individual performances and sort out the
issues at the right time, for enhancing employees’ competency.
Organise regular meetings of seniors and juniors where they can
discuss and resolve individual challenges, difficulties faced so that
the seniors and junior employees can work together for
organisational growth and development.
Organise training and development programmes to improve the
competency level.
Conduct continuous evaluation of competency to keep the level of
competency high.
Provide good working environment for enhancing their competency
level.
Implement the concept of matching man and the job in the banks.
7.5 Scope for Future Research work
The present study is confined to the analysis of the competency level
of the scheduled commercial banks headquartered in Kerala. There is scope
for extending the study to cover all the banks operating in Kerala.
.…….. ……..

Bibliography
Department of Applied Economics, Cochin University of Science and Technology 181
Books Armstrong M (2000), Performance Management: Key Strategies and
Practical Guidelines, Kogan Page, London
Armstrong M (2003), A Handbook of Human Resource Management
practices, 9th ed., Kogan Page, London
Armstrong M and Baron A (1995), The Job evaluation Handbook, Institute
of Personnel Development, London
Ashforth, B.E. (1989).The experience of powerlessness in organizations,
Atchison, T. (1999). They myths of employee satisfaction. Healthcare
Executive, 14(2): 18-23.
Bajpai, N., & Srivastava, D. (2004). Sectorial comparison of factors
influencing job satisfaction in Indian banking sector, Singapore
Management Review. 26 (2): 89-99.
Boyatzis.R.E(1982).The Competent Manager, John Wiley & Sons, New
York, NY
Branham, L. (2005). The seven hidden reasons employees leave. New
York, NY: Amazon books. Logistics, and Informatics, 1, 393-398.
Bruce P, Ira Kay (2002), The Hidden Human Resource: Shareholder
Chakrabarty K C (2014), Human resource challenges in Indian banks- fool
proofing the employees.

Bibliography
182 Department of Applied Economics, Cochin University of Science and Technology
Chen, M., & Lien, G. (2008). The mediating role of job stress in predicting
retail banking employees' turnover intentions in Taiwan. Service
Operations and Logistics and Informatics. 1, 393-398
Cranny, C. J.; Smith, P. C. and Stone, E. F. (1992), Job Satisfaction,
Lexington Books: New York.
Delaney JT, Huseld MA (1996), Forthcoming. Unions, Human Resource
Innovations and Organizational Outcomes.
Huselid MA, Becker BE, Ulrich D (2001), The HR scorecard: Linking
people, strategy, and performance, Boston: Harvard Business School
Press.
Jean Brittain Leslie, Maxine Dalton, Chris Ernst and Jennifer Deal. (2002),
explains that, managerial capabilities includes three major categories
of skill; learning behaviors, resilience and business knowledge.
Lyle M. Spencer (1983), Soft Skill Competencies: Their Identification,
Measurement and Development for Professional, Managerial, and
Human Services Jobs, Scottish Council for Research in Education,
1983, ISBN 0901116351, 9780901116352.
Lyle M. Spencer, Jr.,PhD Signe M. Spencer (2008), Competence at Work
Models for Superior Performance, Unique Colour Carton, New Delhi.
Mangaleswaran T and Srinivasan P T (2007), Human resource management
practices in SriLankan and Indian public sector banks: an empirical
comparison, page: 61.
Martin, P. (1997), The sickening mind: Brain, behavior, immunity, and
disease. London: Harper Collins.

Bibliography
Department of Applied Economics, Cochin University of Science and Technology 183
National Center for Education Statistics (1997), Job Satisfaction among
America’s Teachers: Effects of Workplace Conditions, Background
Characteristics, and Teacher Compensation, Washington, DC.
Organizational Behavior and Human Decision Processes,43, 207-242.
Quinn, R.E., Faerman, S.R., Thompson, M.P., and Mcgrath, M.R. (1990),
are becoming a master manager, New York: Wiley.
Quinn, R.E., Faerman, S.R., Thompson, M.P., and Mcgrath, M.R. (1996),
Op.cit.
Robbins, S.P; Odendaal, A. and Roodt, G. (2003), Organisational
Behaviour, Global and Southern African Perspectives, Cape Town,
Pearson Education.
Sahu R.K (2009), Competency Mapping, Anurag jain publications, Delhi,
2009
Sangwan, D. S. (2005), Human Resource Management in Banks,IBA
Bulletin,June, 09‐15.
Tack, M.W. and Patitu, C.L. (1992), Faculty Job Satisfaction: Women and
Minorities in Peril,ERIC Clearinghouse on Higher Education,
Washington, D.C.Value Finding the Right Blend of Rewards.
ZetiAkhtar Aziz (2005),Developing a robust competency framework for the
Malaysian banking industry Opening speech by DrZetiAkhtar Aziz,
Governor of the Central Bank of Malaysia, at the Industry
Competency Framework Study Focus Group Discussion, Kuala
Lumpur, 6 December 2005. BIS Review 83/2005

Bibliography
184 Department of Applied Economics, Cochin University of Science and Technology
Journals Akinbobola, O.I. (2011), Conflict in Human Capital Relationships: The
Impact of Job Satisfaction on Job Involvement in a
Workplace,International Journal of Social Science and Humanity,
Volume No.1, Issue No. 2, PP. 92-95.
Anathbandhu Patra(2011) ,International Conference on People
Management: Issues & Challenges, Asian Journal Of Management
Research, Special Issue No-1, 2011.
Anil K. Khandelwal, (2005), Criticality of HR reforms for Public sector
banks in the new era, Economic and political weekly, March 19, pp
1128-1131.
BhaskaraRao, G. S. (2004), Changing Profile of Banking Impact on HRM
policies and processes, in Nagarajan, N.(Ed), Human resource
management, Vo1ume No.5, ICFAI University press, Hyderabad,
PP.115-131 (Paper presented at Bank Economists Conference, 2003)
BimalJalan (2004), Strengthening Indian banking and finance: Progress
and Prospects, in Nagarajan N. (Ed), Indian Banking: Managing
Transformation, Volume No. 1, ICFAI University press, Hyderabad,
PP. 03-26. (Inaugural address at Bank Economists Conference, 2002)
Brannigan, A. and Zwerman, W. (2001), The Real Hawthorne
Effect,Society, Volume No. 38, Issue No. 2, PP. 55.
Bratton, DA. (1998), Develop a framework of core competencies, Credit
Union Magazine, Volume No. 64, Issue No. 10, PP. 17-18.
Cardona, M.M. (1996), Job Satisfaction not Due to Cash, Pensions &
Investments, Volume No. 24, PP. 9-18.
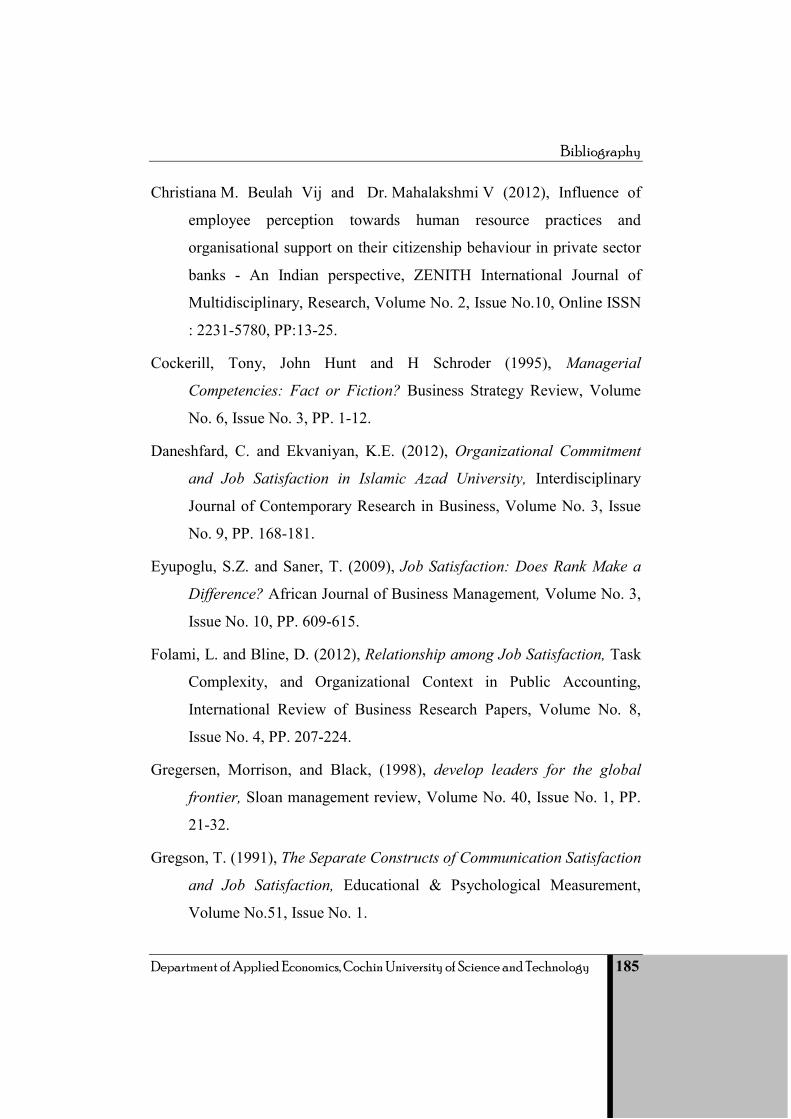
Bibliography
Department of Applied Economics, Cochin University of Science and Technology 185
Christiana M. Beulah Vij and Dr. Mahalakshmi V (2012), Influence of
employee perception towards human resource practices and
organisational support on their citizenship behaviour in private sector
banks - An Indian perspective, ZENITH International Journal of
Multidisciplinary, Research, Volume No. 2, Issue No.10, Online ISSN
: 2231-5780, PP:13-25.
Cockerill, Tony, John Hunt and H Schroder (1995), Managerial
Competencies: Fact or Fiction? Business Strategy Review, Volume
No. 6, Issue No. 3, PP. 1-12.
Daneshfard, C. and Ekvaniyan, K.E. (2012), Organizational Commitment
and Job Satisfaction in Islamic Azad University, Interdisciplinary
Journal of Contemporary Research in Business, Volume No. 3, Issue
No. 9, PP. 168-181.
Eyupoglu, S.Z. and Saner, T. (2009), Job Satisfaction: Does Rank Make a
Difference? African Journal of Business Management, Volume No. 3,
Issue No. 10, PP. 609-615.
Folami, L. and Bline, D. (2012), Relationship among Job Satisfaction, Task
Complexity, and Organizational Context in Public Accounting,
International Review of Business Research Papers, Volume No. 8,
Issue No. 4, PP. 207-224.
Gregersen, Morrison, and Black, (1998), develop leaders for the global
frontier, Sloan management review, Volume No. 40, Issue No. 1, PP.
21-32.
Gregson, T. (1991), The Separate Constructs of Communication Satisfaction
and Job Satisfaction, Educational & Psychological Measurement,
Volume No.51, Issue No. 1.

Bibliography
186 Department of Applied Economics, Cochin University of Science and Technology
Hakim (1993), Boost Morale to Gain Productivity, HR Magazine, and
February: PP. 46-53.
Jain, S.; Sharma, S. and Jain, R. (2011), Job Satisfaction in Banking: A
Study of Private and Public Sector Banks (Comparative Study),
International Journal of Science and Technology, Volume No. 2, Issue
No. 1, PP. 40-48.
Jamal Nazrul Islam, Haradhan Kumar Mohajan and RajibDatta (2012), A
Study On Job Satisfaction And Morale Of Commercial Banks In
Bangladesh ,Jamal Nazrul Islam, Haradhan Kumar Mohajan, Rajib
Datta, Int. J. Eco. Res., ISSN: 2229-6158,PP. 153-173.
Janmejaya K. Sinha, (2004), The challenges in HR and IT in
Nagarajan,N.(Ed), Indian Banking- managing transfornlation, VoU,
ICFAI University press, Hyderabad, PP. 207209. (Keynote address at
Bank Economists Conference, 2002)
Kadian W. Wanyama and S. N. Mutsotso (2010), Relationship between
capacity building and employee productivity on performance of
commercial banks in Kenya, African Journal of History and Culture
Volume No. 2, Issue No. 5, PP. 73-78, October 2010.
Kamesam Vepa. (2004), Banking Tomorrow, Chairman, Governing Council,
Institute for Development And Research in Banking Technology
(IDRBT), Hyderabad and former Deputy Governor, Reserve Bank of
India at the Meet of General Managers in charge of HRD & Training at
JNIBD, Hyderabad on February 7.
Karl and Sutton (1998), Job Values in Today’s Workforce: A Comparison of
Public and Private Sector Employees, Public Personnel Management,
Volume No. 27, PP. 515-528.

Bibliography
Department of Applied Economics, Cochin University of Science and Technology 187
Karthikeyan K., Karthi R. and Shyamala Graf D. (2010), Impact of Training
in Indian Banking Sector – An Empirical Investigation, International
Journal of Business and Management Volume No. 5, Issue No. 7,
ISSN 1833-3850 E-ISSN 1833-8119, PP. 77-82, July.
Kazmi R., Amjad S. and Khan D. (2008), Occupational stress and its effect
on job performance: A case study of medical house officers of district
Abbottabad, Journal of Ayub Medical College, Volume No. 20, PP.
135-139.
Krishnamurty, K.V. (2004), Human Resource Development in Indian Public
Sector Banks in Nagarajan N (Ed), Indian Banking- managing
transformation, Volume No. 1, ICFAI University press, Hyderabad,
pp.l08-113 (Speech delivered at Bank Economists Conference, 2002)
Kumari, Anitha and Sita, V. (2010), Role of Competencies in Human
Resource Management: A Study in Indian Organizations (November
16, 2010), OIDA International Journal of Sustainable Development,
Volume No. 2, Issue No. 3, PP. 29-34.
KwabenaFrimpong and AlanWilson (2012), Measuring service orientation
of service delivery employees, the 12th international research
conference in service management, LaLonde les Maures, France, May
29, 30, 31 & June 1.
Mangaleswaran, T. (2007), Human Resource Management Practices and its
outcomes in Indian and Srilankan Public Sector Banks unpublished
Ph.D. thesis, University of Madras
Maria Vakola, Klas Eric Soderquist, Gregory P. Prastacos, (2007) "Competency
management in support of organisational change", International Journal of
Manpower, Vol. 28 Iss: 3/4, pp.260 - 275

Bibliography
188 Department of Applied Economics, Cochin University of Science and Technology
Maurice, A. (1998), Happy Workers Miss Fewer Days: Study, National
Underwriter/Property & Causality Risk & Benefits, Volume No.102,
PP. 13-18.
McDonald, B.D. and Hutcheson, D. (1999), Employee Loyalty,
Commitment Directly Impact the Bottom Line, Business Press,
Volume No. 11, PP. 18-27.
Mily Velayudhan T.K (2011), Competency Mapping of the Employees- A
Study, International Conference on Information Communication and
Management IPCSIT, Volume No.16, © (2011) IACSIT Press,
Singapore
Mohan Deshmukh, M. (2004), Human Resource Management: need for a
pragmatic approach, in Nagarajan N (Ed), Indian Banking- managing
transformation, Volume No. 7, ICFAI University press, Hyderabad,
PP. 147- 159.(Paper presented at Bank Economists Conference, 2002)
Nagaraju Y and Sathyanarayana Gowda V. (2012), A Study of Employee
Competency Mapping Strategies at Select Organizations of Bangalore,
Volume No. 3, Issue No. 10 (October), ISSN 0976-2183
Nanayakkara, G. (1999), Changing Paradigms in Human Resource
Management, Institute of Personnel Management of SriLanka, Annual
Conference.
Naveed SAIF, Muh Saqib KHAN, Khalid REHMAN, Shafiq ur REHMAN,
Zia-Ur-REHMAN, Tufail NAWA & Muh NAQEEB “Competency
based Job Analysis”, International Journal of Academic Research in
Accounting, Finance and Management Sciences, Vol. 3, No.1, January
2013, pp. 105–111,ISSN: 2225-8329

Bibliography
Department of Applied Economics, Cochin University of Science and Technology 189
Neil Anderson, Deniz S Ones, Handan Kepir Sinangil, Chockalingam
Viswesvaran, Handbook of Industrial, Work & Organizational
Psychology: Volume 2 :organizational psychology, SAGE Publications
India Pvt. Ltd, Delhi 1996
Nelson, B. (2007). Bank of America: Improving turnover. Retrieved
fromhttp.//meetingsnet.com/coforatemeetingsincentives/incentives/bes
t_practices/meetingsbankamericaimproving
Patnaik, (2004), Structural changes in banks': HRM policies and procedures, in
Nagaraj an, N.(Ed), Human resource management, Volume No.5, ICFAI
University press, Hyderabad, PP.44-56 (Paper presented at Bank
Economists Conference, 2003)
Price, J.L. (1997), Handbook of Organizational Measurement, International
Journal of Manpower, Volume No.18, PP. 303- 558.
Purwar, A.K. (2004), Harnessing Facilitators, in Nagarajan, N. (Ed), Indian
Banking- managing transformation, Volume No. 1, ICFAI University
press, Hyderabad, PP. 61-68. (Paper presented at Bank Economists
Conference, 2002)
Ramakrishna G, Kameswari, Giridhar M.Kumar And Krishnudu CH. (2012),
Effectiveness of training and development programmes-A case study of
Canara bank employees in Kurnool district, International Journal of
Multidisciplinary Research, Volume No.2, Issue No. 4, ISSN 2231
5780, April
Randy B (2000), Why Loyal Employees and Customers Improve the Bottom
Line.
Rolland Le Brasseur, Huguette Blanco and John Dodge (2002), Competencies
of CEOs in Technology – Oriented SMEs An Exploratory Study of Skills

Bibliography
190 Department of Applied Economics, Cochin University of Science and Technology
for Survival & Initial Growth Journal of CCSBE, School of Commerce
and Administration, Laurentian University, Volume No. 12, PP. 26-32.
Sambasivan E. (2012), Managerial Core Competency Perceptions of business
executives – a study, researchers world-Journal of Arts, Science &
Commerce, E-ISSN 2229-4686,ISSN 2231-4172, Volume No.– III,
Issue No. 2(3), PP. 56, April.
Sch. of Land Sci. and Technol (2010), A study on Career Competency of
Commercial Bank, International Conference on E-business and E-
Governance, (Beijing), Conference Location: Guangzhou, Print
ISBN: 978-0-7695-3997-3, INSPEC Accession Number: 11569073,
Digital Object Identifier : 10.1109/ICEE.2010.1159 Date of Current
Version : 30 September 2010, Issue Date : 7-9 May 2010
Shilpi Singh (2013), Face of HR Practices in Todays Scenario in Indian
Banks, International Journal of Application or Innovation in
Engineering & Management, (IJAIEM), Volume 2, Issue 1, ISSN
2319 -4847, PP:218-229,January.Web Site: www.ijaiem.org Email:
[email protected], [email protected]
Sujatha Mellacheruvu and Krishnamacharyulu C. S. G (2008), Challenges
of Human Resource Management in Public Sector Banks, JIMS 8M,
January-March, 2008
Teoh Wee Jim, , Bernard Hi, , Lee KahShing,, OngSiew Lin, SitiYasmin and Sofiah
Kadar Khan (2013), The Factors Affecting Organizational Citizenship
Behavior in Banking Industry, International Journal of Management
Sciences Volume No. 1, Issue No. 5, PP. 178-192
Thompson, J. M. and Blain, M. D. (1992), Presenting Feedback on the
Minnesota Importance Questionnaire and the Minnesota Satisfaction

Bibliography
Department of Applied Economics, Cochin University of Science and Technology 191
Questionnaire,Career Development Quarterly, Volume No.41(1),
Issue No. 62.
Vijayashreea, L and Jagdischchandrab, M.V. (2011), Locus of Control and
Job Satisfaction: PSU Employees, Serbian Journal of Management,
Volume No. 6, Issue No. 2, PP. 193-203.
Wagner, S.L. and Rush, M.C. (2000), Altruistic Organizational Citizenship
Behavior: Context, Disposition and Age, Journal of Social
Psychology, Volume No. 140, Issue No. 3, PP. 379.
Walker, J. (1998), Satisfying Employees is a Profitable Strategy,New
Hampshire Business Review, and Volume No. 20, PP. 17-20.
Wiggins, C. and Bowman, S.Y. (2000), Career Success and Life
Satisfaction for Female and Male Healthcare Managers,Hospital
Topics, Volume No. 78, Issue No. 3.
Yankelovich Partners (1998), Workers around the World Share Similar
Attitudes toward Jobs,Houston Business Journal, Volume No. 29, PP.
39-43.
Web-sites
http://www.academicjournals.org/ajhc ISSN 2141-6672 © 2010 Academic
Journals.
http://ssrn.com or http://dx.doi.org Das, Debabrata and Mukherjee, Soumya
(2012), A Competency Mapping Framework for Indian Services
Sector, Available at SSRN:
http://www.thefreelibrary.com, http://dx.doi.org, http://nibmindia.org HRD
in emerging economies-research perspectives in Indian banking,

Bibliography
192 Department of Applied Economics, Cochin University of Science and Technology
http://ssrn.com Jyothi, Dr. P. and Jyothi, V. Sree, (2009), HR Issues and
Challenges in Indian Banking Sector, February 4, Available at
SSRN:
http://www.academia.edu Pallavee Shrivastava, Priyanka Srivastava and
Sandhya Kumari Singh (2010), Performance Appraisal As A Tool
To Improve Marketing Efficiencies In Banking Industry: A Case
Study Of PNB.
www.rbi.org.in
www.emeraldinsight.com
www.ijmra.us

Questionnaire
Department of Applied Economics, Cochin University of Science and Technology 193
General Information
1. Name:
2. Age:
3. Sex: Male Female
4. Qualification:
5. Bank Name:
6. Designation:
7. Mode of entry to the current designation: Direct Promotion Any other
8. Experiences in this organization(in Years):
9. Salary in CTC(around ):
Organizational details 10. Are you satisfied with the working environment of the organization? Yes No
If Yes/No, specify the reason . . . . .
.……………………..…………………………………………………
…………………………………………………………………………
………………………………………..…………………………………
………..…………………………………………………
11. Are you satisfied/fully involved with your current job of the organization Yes No
If Yes/No, specify the reason . . . .
.…………………………………………………………………………
………...…………….…………………………………………………
…………………………………………………………………………
……..…………………………………………………

Annexure 1
194 Department of Applied Economics, Cochin University of Science and Technology
12. If yes, please answer the question no. 12 to 20
Qust. no Questions Strongly agree agree disagree Strongly
disagree 13. The organization provides a job
description &job specification for each role
14. Your job according to the job
description
15. The contents of the job description is matching with the actual job
16. The current job is matching with your educational qualification and experience
17. Getting job is based on your
competency
18. The organization conduct job analysis regularly
19. It is a proper platform to implement all your potential in your job
20. The current job helps to increase your competency level
Qust.no Questions Yes No 21. The job rotation is taken place in the
organization.
22. If no, specify the reason…………………………………………………………………………………………………………………………………………..
23. If Yes, please answer qust no. 24&25 24. The job rotation helps to improve your
competency in various works
25. Competency is measured before rotating the jobs

Questionnaire
Department of Applied Economics, Cochin University of Science and Technology 195
26. Which type of competency you have? 1. Managerial competency 2. Behavioural competency 3. Technical competency
Qust. no Questions Strongly
agree Agree Disagree Strongly disagree
27. The selection procedure is based on the
candidate’s competency
28. The organization analyzes the behavioural
competency of the employees during the
selection procedure
29. The promotion of the employees based on the
competency level
30. Behvioural competency as a one component in
the performance appraisal system
31. Pay structure of the company based on the
competency level of the employees
32. Training programme helps to increase your
behavioral competency level
33. There is a good relationship between the
superiors and the subordinates and between
the coworkers
34. You are satisfied with the motivation getting
from your superiors and work environment
35. Get an opportunity to express your ideas in
the decision- making process

Will Mapping Questionnaire, Evaluation of Worker’s Parameters
Department of Applied Economics, Cochin University of Science and Technology 197
Will Parameters Rating Score 1 Punctuality/Attendance (Weight=5%) A Less than 80% 0
B 80% to 84% 1
C 85% to 90% 2
D 91% to 95% 3
E 96% to 98% 4
F 99% to 100% 5
2 Team Work (weight = 10%) A Not cooperative, causes discord among colleagues 1
B Sometimes indifferent, not always cooperative 2
C Does his own job, does not interfere 4
D Gets along adequately with others 6
E Always cooperative and have good relations with others 8
F Very cooperative and helps others in trouble 10
3 Reaction to criticism (Weight=10%) A Never admits faults, makes no effort to improve 0
B Tries to justify faults and blames others 2
C Admits faults but does not try to improve 4
D Argues but makes efforts to improve 6
E Admits faults and never repeats mistakes 8
F Accepts criticism well and makes concerted effort to improve 10

Annexure 2
198 Department of Applied Economics, Cochin University of Science and Technology
4 Discipline (weight=20%) A Careless, bad in manners/etiquette and disobedient 0
B Fair manners, sometimes impolite and disobedient 5
C Good manners, polite but at times disobedient 8
D Aware of rules and regulations and tries to abide 13
E Never break rules, polite and disciplined 18
F very well-behaved, polite and disciplined and role model 20
5 Initiative (Weight=20%) A No interest in work at all or improvements 0
B Not interested in hard work, satisfied with what he does 5
C Satisfactory interest. Takes extra work, when requested 8
D Good interest in work, asks for exposure and training 13
E Good interest in work, actively participate in improvement, gives suggestions 18
F Enthusiastic, always seeks more responsibility, gives lot of suggestions, always
a self starter 20
6 Responsibility (Weight=10%) A Totally irresponsible, not dependable 1
B Clock watcher, makes frequent mistakes 2
C Average, makes occasional mistakes 4
D Good, occasionally double checks his work 6
E Always double checks, reliable 8
F Highly responsible, dependable, cost conscious 10
7 Quality job (Weight=15%) A Slipshod and haphazard worker 0
B Careless but is trying to improve 3
C Adequate but need guidance to improve 5
D Systematic and organised , needs few corrections 8
E Good in his job, errors in his work very rare 12
F Excellent worker, imaginative and almost zero defect work 15

Will Mapping Questionnaire, Evaluation of Worker’s Parameters
Department of Applied Economics, Cochin University of Science and Technology 199
8 Support & Recognise other's achievements/contributions (Weight=10%) A Always criticise and unrecognise other's hard work and achievements 0
B Not always, but occasionally criticise and unrecognise 3
C occasionally support & recognise the development of others 4
D Not Support but recognize the efforts for the development of others 6
E Support the efforts for the development of others but not recognise 8
F Always Support, Recognise and congratulate others effort/achievements 10

Will Mapping Questionnaire, Evaluation of Superior Parameters
Department of Applied Economics, Cochin University of Science and Technology 201
STANDARD LEVEL OF JOB SKILLS AND THEIR RATING SI. No Levels of job skills Rating
1 Doesn't Know 0 2 Has basic knowledge but cannot do 1 3 Can perform to a certain extent 2 4 Has knowledge and can do independently 3 5 Can do independently and can teach others also 4
Name:
Grade: Employee Designation:
Name of Bank
SI. NO Job Skill Area Level Rating Scale 0 1 2 3 4
1. Marketing Transfer Present Level Desired Level
2. Retail and Loans Present Level Desired Level
3. NRI Banking Present Level Desired Level
4. Customer Relationship Present Level Desired Level
5. Commercial purpose Present Level Desired Level
6. Billing Present Level Desired Level 7. Personal Loans Present Level Desired Level 8. Deposits Present Level Desired Level 9. Legal Present Level Desired Level 10. Savings Present Level Desired Level
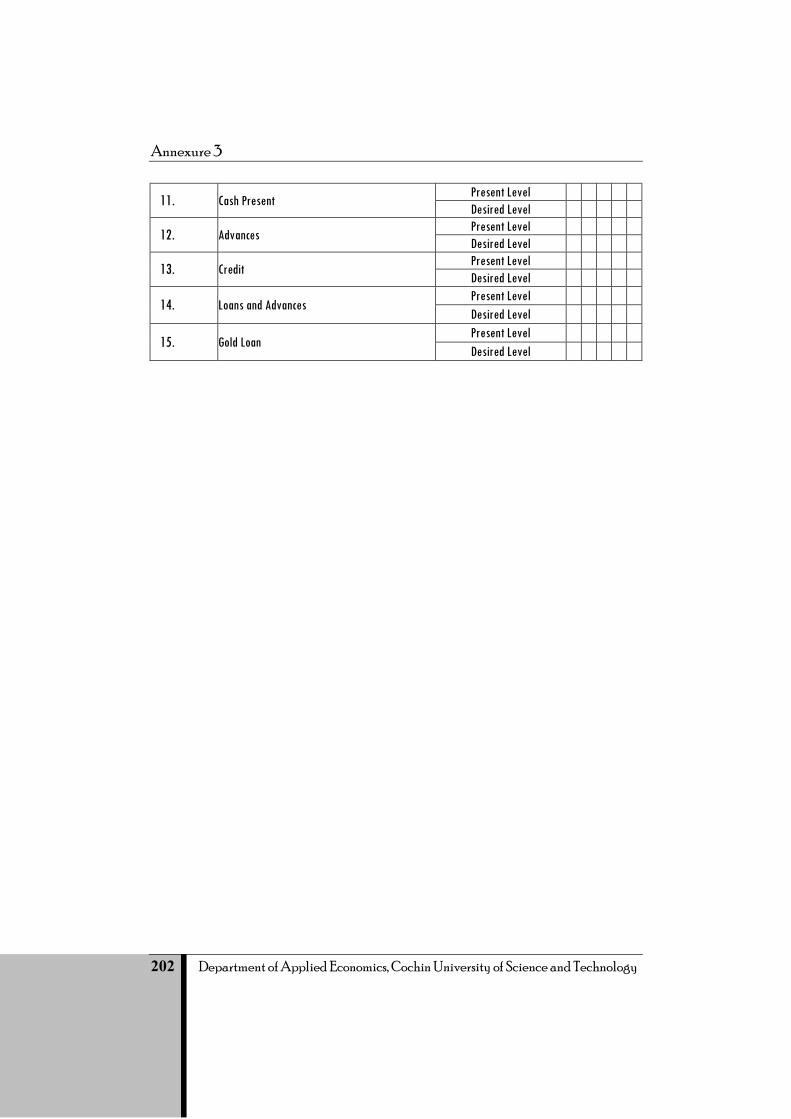
Annexure 3
202 Department of Applied Economics, Cochin University of Science and Technology
11. Cash Present Present Level Desired Level 12. Advances Present Level Desired Level 13. Credit Present Level Desired Level 14. Loans and Advances
Present Level Desired Level
15. Gold Loan Present Level Desired Level

Will Mapping Questionnaire, Evaluation of Superior Parameters
‘Behavioural Competency and Organisational Performance´ paper
published in International Journal of Research in Management,
Economics and Commerce (ISSN:2250-057x)- Volume 1 Issue 2, Ref
No. IJRMEC/V1/I2/D25.
Related Documents