Behavioral Risk Factor Surveillance System (BRFSS) Contributors: Wayne A. Honey, MPH Jennifer E. Daniel, MPH Annie Hickman, BS Survey Unit, Injury & Behavioral Epidemiology Bureau Epidemiology & Response Division, NM Department of Health December 8, 2004

Behavioral Risk Factor Surveillance System (BRFSS) Contributors: Wayne A. Honey, MPH Jennifer E. Daniel, MPH Annie Hickman, BS Survey Unit, Injury & Behavioral.
Dec 14, 2015
Welcome message from author
This document is posted to help you gain knowledge. Please leave a comment to let me know what you think about it! Share it to your friends and learn new things together.
Transcript

Behavioral Risk Factor Surveillance System (BRFSS)
Contributors: Wayne A. Honey, MPH
Jennifer E. Daniel, MPH
Annie Hickman, BS
Survey Unit, Injury & Behavioral Epidemiology Bureau
Epidemiology & Response Division, NM Department of Health
December 8, 2004
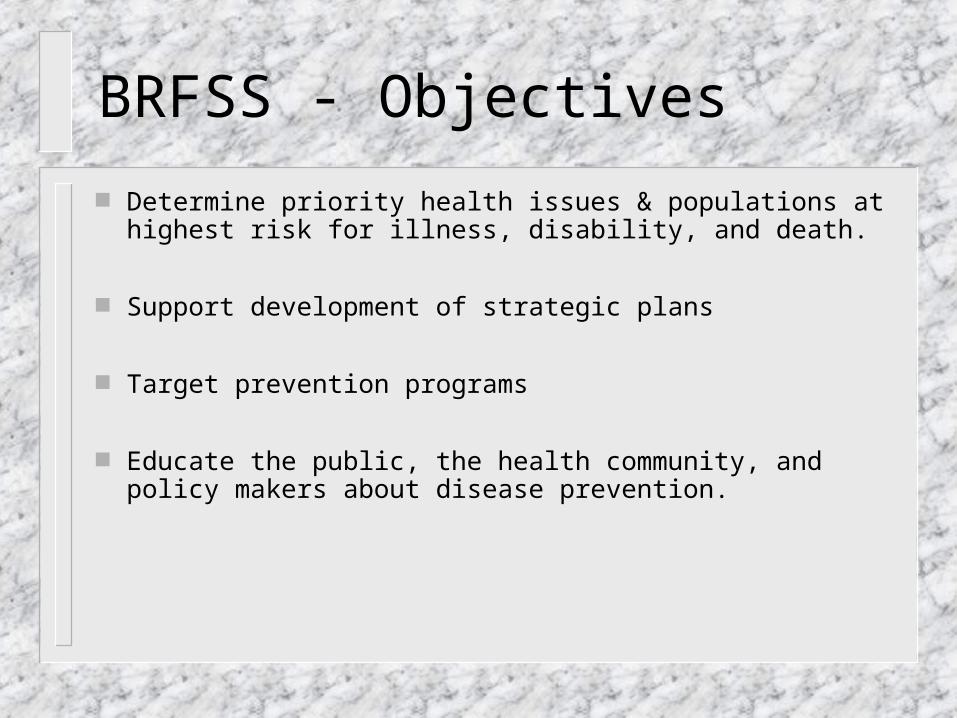
BRFSS - Objectives
Determine priority health issues & populations at highest risk for illness, disability, and death.
Support development of strategic plans
Target prevention programs
Educate the public, the health community, and policy makers about disease prevention.
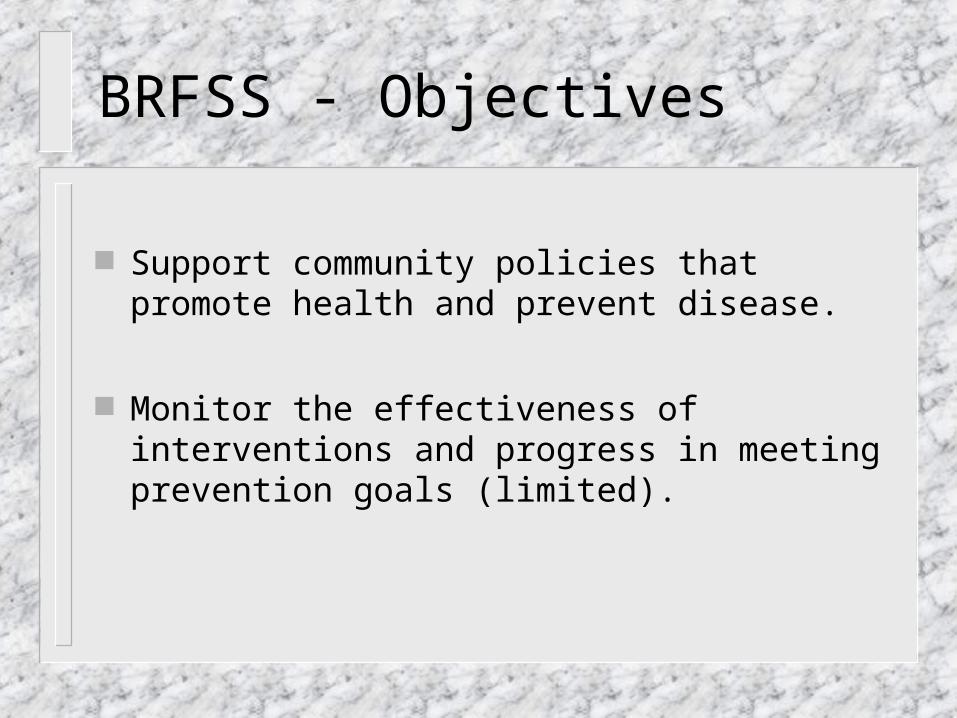
BRFSS - Objectives
Support community policies that promote health and prevent disease.
Monitor the effectiveness of interventions and progress in meeting prevention goals (limited).

BRFSS – Applications (Examples on following slides)
Estimate: Prevalence & Distribution of Selected Diseases/Conditions
Estimate: Prevalence & Distribution of Risk Behaviors & Protective Factors
Comparison to HP2000 & HP2010
Monitor Trends

Binge Drinking 2003Lower UpperTOTAL 5,465 688 15.3 14.1 16.6GENDER
Male 2,211 476 23.7 21.5 25.9Female 3,254 212 7.4 6.3 8.6
AGE18-24 371 107 28.9 23.9 34.625-34 791 177 23.9 20.7 27.635-44 985 155 16.5 13.9 19.445-54 1,176 156 12.8 10.8 15.155-64 900 46 6.6 4.7 9.265-74 699 35 5.1 3.6 7.375+ 522 7 1.4 0.6 2.9
RACE/ETHNICITYWhite, non-Hispanic 3,090 332 12.6 11.2 14.2Hispanic 1,941 307 19.0 16.9 21.4Native American 186 23 15.7 9.9 23.9Other race or multi-racial 214 24 13.6 8.6 20.9
EDUCATIONLess than High School Graduate 734 91 16.9 13.4 21.1High School Graduate or G.E.D. 1,466 211 17.1 14.8 19.8Some College 1,484 211 17.3 14.9 20.0College Graduate 1,757 173 11.0 9.4 12.9
INCOMELess than $10,000 330 42 18.5 12.6 26.2$10-19,999 887 114 17.4 14.2 21.2$20-49,999 2,182 304 17.9 15.9 20.1$50,000 or more 1,509 188 12.3 10.5 14.4
EMPLOYMENTEmployed 3,175 508 18.4 16.7 20.1Unemployed 242 42 24.6 17.6 33.3Other** 2,024 134 8.2 6.7 9.9
REGIONR
NW (Health District 1) 1,194 152 16.1 13.5 19.0NE (Health District 2) 1,049 134 16.3 13.7 19.3SW (Health District 3) 1,072 146 16.8 14.2 19.7SE (Health District 4) 1,055 135 16.5 13.8 19.7Bernalillo County 1,095 121 12.9 10.5 15.6
Demographic Characteristics
Total Number Who Responded to the
Question*Total Number Who Responded "Yes"
Binge drinking: 5 or more drinks on one occasion in the past month
95% Confidence
Interval‡Weighted Percent
(%)§
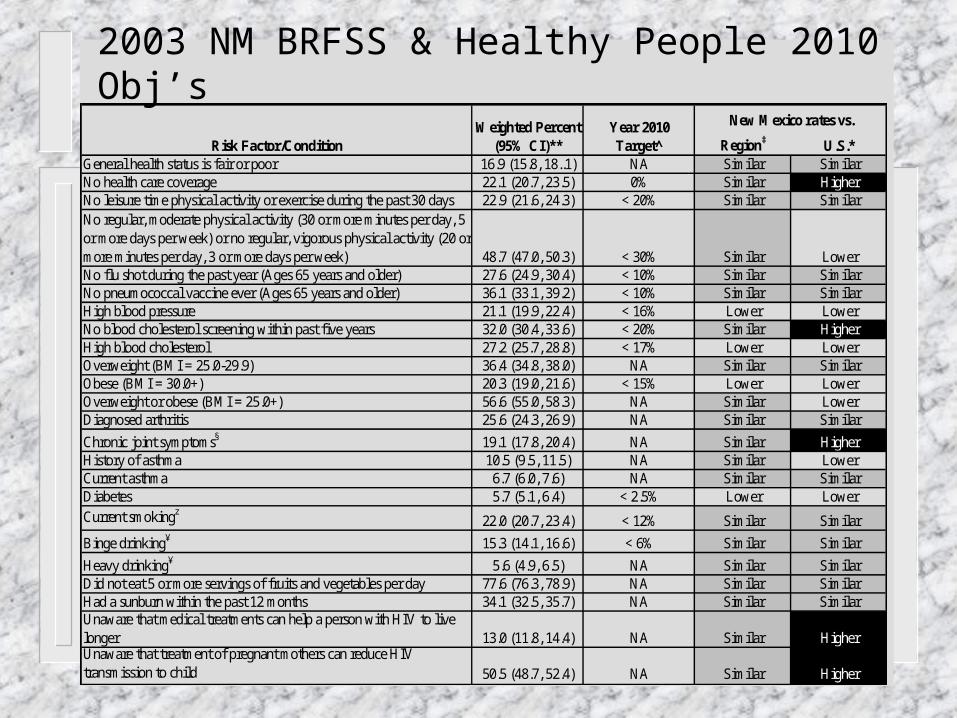
2003 NM BRFSS & Healthy People 2010 Obj’s
Region‡ U.S.*General health status is fair or poor 16.9 (15.8, 18..1) NA Similar SimilarNo health care coverage 22.1 (20.7, 23.5) 0% Similar HigherNo leisure time physical activity or exercise during the past 30 days 22.9 (21.6, 24.3) < 20% Similar SimilarNo regular, moderate physical activity (30 or more minutes per day, 5 or more days per week) or no regular, vigorous physical activity (20 or more minutes per day, 3 or more days per week) 48.7 (47.0, 50.3) < 30% Similar LowerNo flu shot during the past year (Ages 65 years and older) 27.6 (24.9, 30.4) < 10% Similar SimilarNo pneumococcal vaccine ever (Ages 65 years and older) 36.1 (33.1, 39.2) < 10% Similar SimilarHigh blood pressure 21.1 (19.9, 22.4) < 16% Lower LowerNo blood cholesterol screening within past five years 32.0 (30.4, 33.6) < 20% Similar HigherHigh blood cholesterol 27.2 (25.7, 28.8) < 17% Lower LowerOverweight (BMI = 25.0-29.9) 36.4 (34.8, 38.0) NA Similar SimilarObese (BMI = 30.0+) 20.3 (19.0, 21.6) < 15% Lower LowerOverweight or obese (BMI = 25.0+) 56.6 (55.0, 58.3) NA Similar LowerDiagnosed arthritis 25.6 (24.3, 26.9) NA Similar Similar
Chronic joint symptoms§ 19.1 (17.8, 20.4) NA Similar HigherHistory of asthma 10.5 (9.5, 11.5) NA Similar LowerCurrent asthma 6.7 (6.0, 7.6) NA Similar SimilarDiabetes 5.7 (5.1, 6.4) < 2.5% Lower Lower
Current smokingz22.0 (20.7, 23.4) < 12% Similar Similar
Binge drinking¥ 15.3 (14.1, 16.6) < 6% Similar Similar
Heavy drinking¥ 5.6 (4.9, 6.5) NA Similar SimilarDid not eat 5 or more servings of fruits and vegetables per day 77.6 (76.3, 78.9) NA Similar SimilarHad a sunburn within the past 12 months 34.1 (32.5, 35.7) NA Similar SimilarUnaware that medical treatments can help a person with HIV to live longer 13.0 (11.8, 14.4) NA Similar HigherUnaware that treatment of pregnant mothers can reduce HIV transmission to child 50.5 (48.7, 52.4) NA Similar Higher
Risk Factor/ConditionWeighted Percent
(95% CI)**
New Mexico rates vs.Year 2010 Target̂

Monitor Trends

Breast Cancer ScreeningNo Significant Difference (Other than 1991 & 1997)All Female Respondents Age 40+, excluding DK/NS, Refused, or missing.

BRFSS – Applications (Examples on following slides)
Describe Associations Between Disease/Conditions & Risk Factors
Estimate: Prevalence of Health Care Coverage
Comparisons: State-to-State, State to Nation; sub-state areas
Estimate: Utilization of Preventive Screening

Associations
Prevalence of Chronic Health Conditions*, by disability status
0
20
40
60
80
100No disability
Disability not requiring assistance
Disability requiring assistance
Arthritis(2000)
Diabetes (1998-00)
Hypertension(1999)
Cardio-vasculardisease
(1998,99)
Pe
rce
nt
of
gro
up
wit
h c
on
dit
ion
Osteoporosis(1999)
* Rates are age-adjusted by the direct method to the weighted age distribution of the NM BRFSS survey for the designated year or years.

Comparisons: State-to-State; State-to-Region; State-to-Nation
Percentage of New Mexicans Without Health Care Coverage
Percentage of Adults without Health Care Coverage, by New Mexico, Region*, and U.S.**, 2003
22.1 22.515.4
0
20
40
60
New Mexico Region U.S.* Region includes Arizona, Colorado, Oklahoma, Texas, and Utah.
** U.S. includes the 50 states, plus the District of Columbia, Guam, Puerto Rico, and the U.S. Virgin Islands.
Source: U.S. BRFSS, 2003.
Percentage

Percentage of Women Age 40 and Older Who HaveNever Had a Mammogram, by Education. New Mexico, 2000.
11.07.1
13.9
20.6
0
10
20
30
40
50
< HighSchool
Graduate
HighSchool
Graduateor GED
Somecollege
CollegeGraduate
Percentage

BRFSS - Methodology
Telephone Survey Methods On going Survey of Adults Random Selection of Household Random Selection of One Adult (>= 18 Yrs.) Per
Household Computer-Aided Telephone Interviewing (CATI)
System
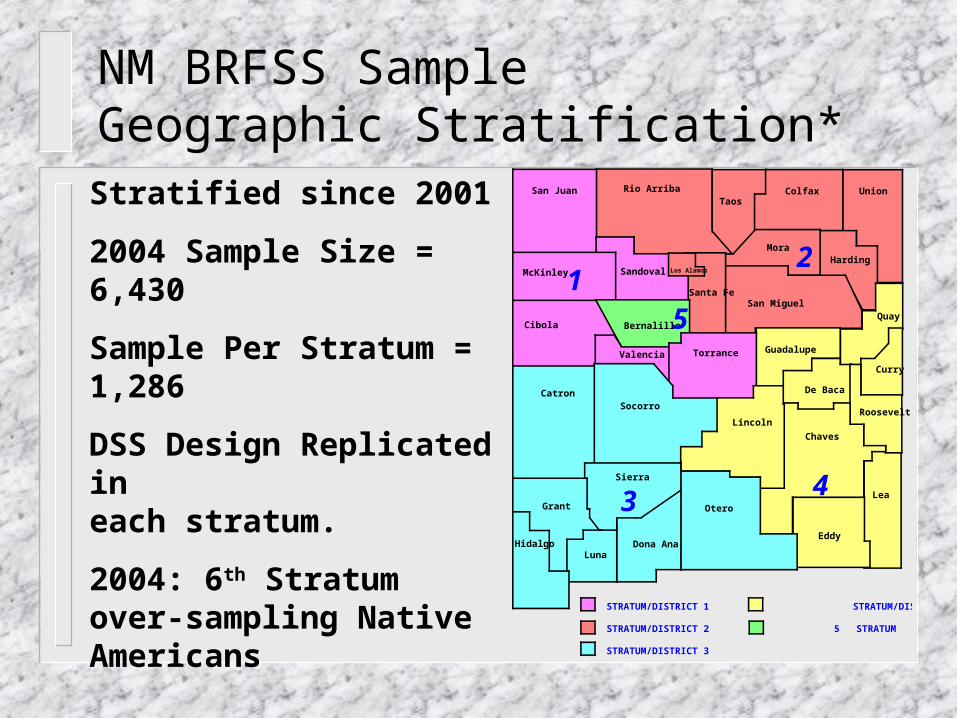
NM BRFSS Sample Geographic Stratification*
San Juan Rio Arriba
Los Alamos
TaosColfax Union
McKinley
MoraHarding
Quay
Sandoval
Cibola Bernalillo
Torrance GuadalupeValencia
CatronSocorro
Curry
Roosevelt
Chaves
Lincoln
Grant
HidalgoLuna
Dona Ana
Otero
Lea
Eddy
Sierra
San Miguel
De Baca
Santa Fe
STRATUM/DISTRICT 1 STRATUM/DISTRICT 4
STRATUM/DISTRICT 2 STRATUM 5
STRATUM/DISTRICT 3
21
5
43
Stratified since 2001
2004 Sample Size = 6,430
Sample Per Stratum = 1,286
DSS Design Replicated in each stratum.
2004: 6th Stratum over-sampling Native Americans
*County assignment to strata will change in 2006 to match new Public Health Districts.
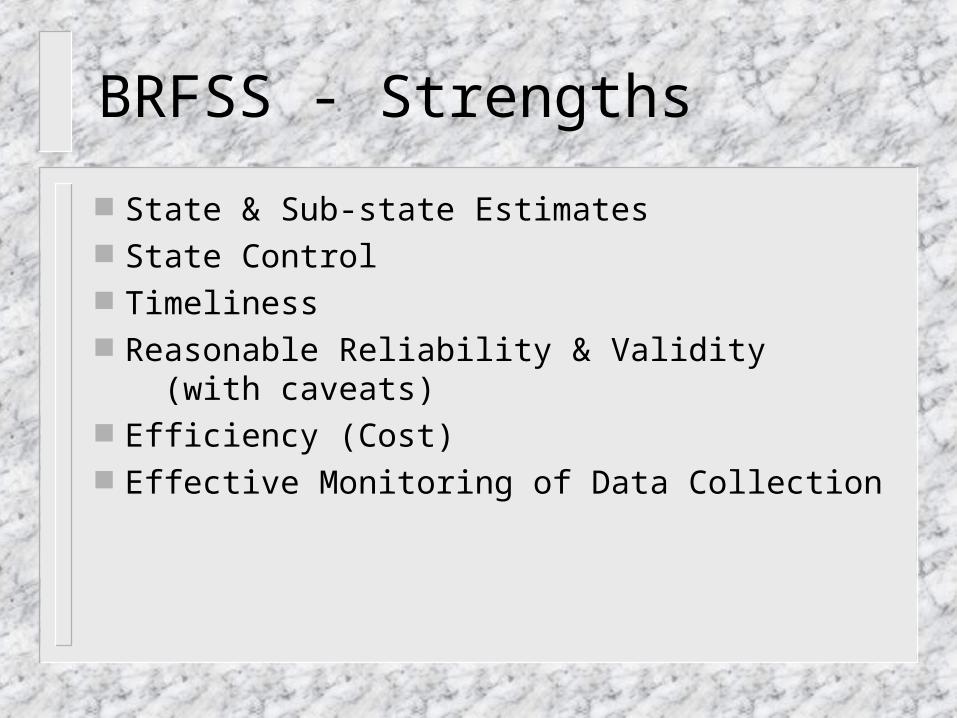
BRFSS - Strengths
State & Sub-state Estimates State Control Timeliness Reasonable Reliability & Validity (with caveats) Efficiency (Cost) Effective Monitoring of Data Collection
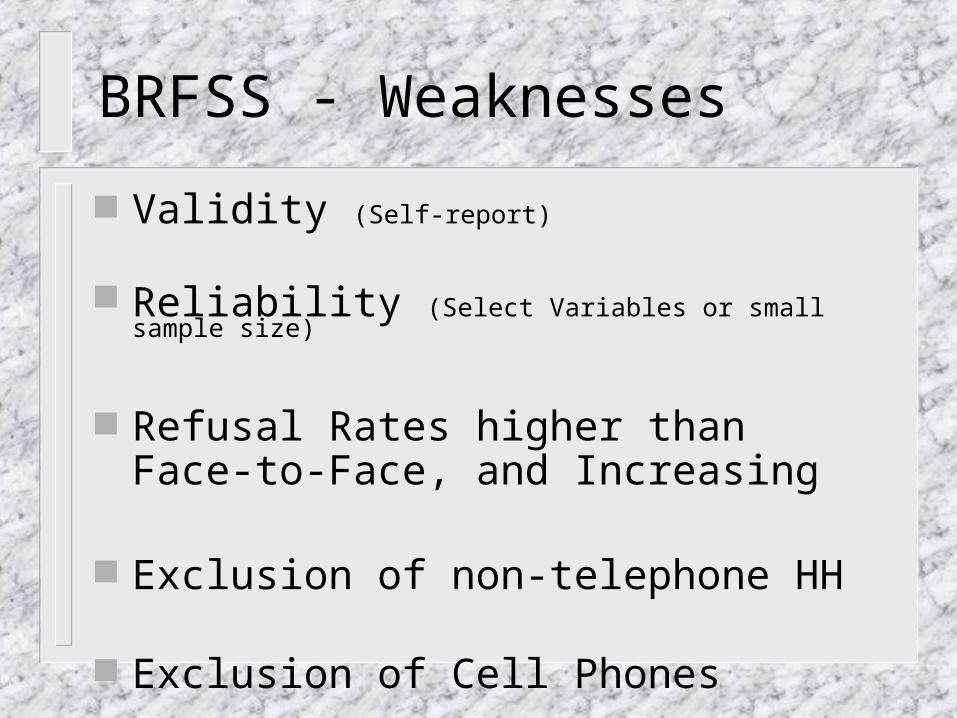
BRFSS - Weaknesses
Validity (Self-report)
Reliability (Select Variables or small sample size)
Refusal Rates higher than Face-to-Face, and Increasing
Exclusion of non-telephone HH
Exclusion of Cell Phones
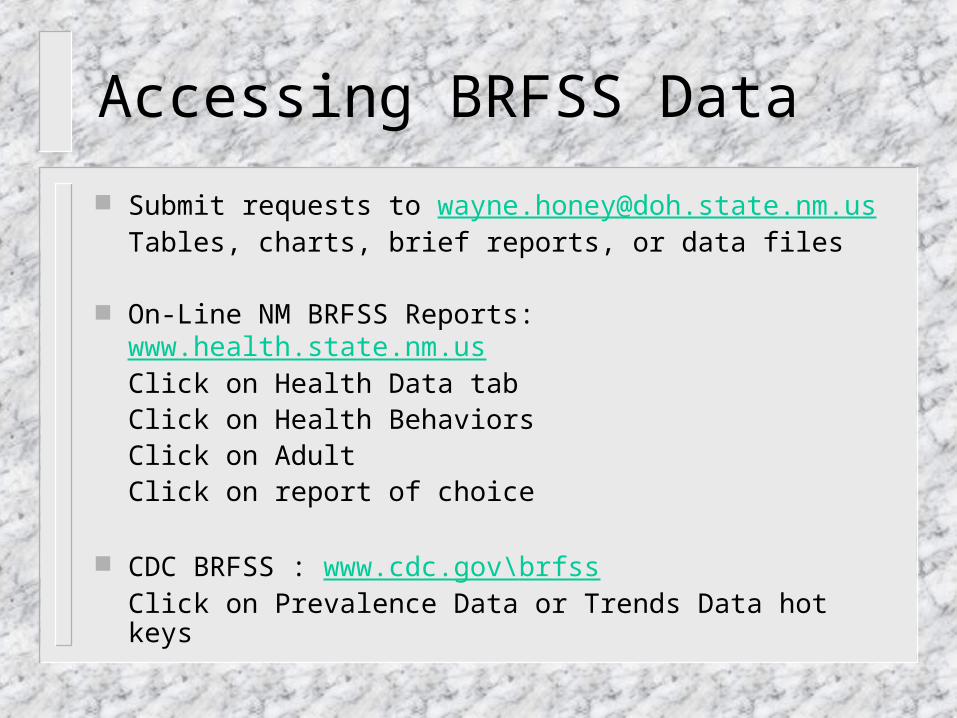
Accessing BRFSS Data
Submit requests to [email protected], charts, brief reports, or data files
On-Line NM BRFSS Reports: www.health.state.nm.us Click on Health Data tabClick on Health BehaviorsClick on AdultClick on report of choice
CDC BRFSS : www.cdc.gov\brfssClick on Prevalence Data or Trends Data hot keys
Related Documents


