Behavioral Economics: Implications for the Conceptualization and Treatment of Addiction James G. Murphy, Ph.D. Associate Professor, Department of Psychology

Behavioral Economics: Implications for the Conceptualization and Treatment of Addiction James G. Murphy, Ph.D. Associate Professor, Department of Psychology.
Dec 23, 2015
Welcome message from author
This document is posted to help you gain knowledge. Please leave a comment to let me know what you think about it! Share it to your friends and learn new things together.
Transcript

Behavioral Economics: Implications for the Conceptualization and Treatment of Addiction
James G. Murphy, Ph.D.Associate Professor, Department of Psychology

Overview
Behavioral economic model of addiction
Behavioral economic indices of the reinforcing value (RV) of alcohol novel measures of alcohol problem severity in
problem drinkers that predict response to brief motivational interventions
How to improve brief interventions by directly targeting behavioral economic mechanisms (substance-free reinforcement, delay discounting)

Overview of Behavioral Economics
Behavioral Economics = Micro-economics + psychology + behavioral pharmacology
Focus on choice: behavior is allocated to an activity based on the cost/benefit ratio of that activity relative to other available activities; patterns of behavior will match patterns of reinforcement
Guided laboratory research on drug self-administration; more recently applied to substance use in the natural environment
Bickel, Madden, & Petry (1998). Behavior Therapy.Herrnstein (1970). Journal of the Experimental Analysis of Behavior. Vuchinich & Tucker (1988). Journal of Abnormal Psychology.

Causes of Substance Abuse
High availability/low price of drugs (minimal constraints on drug use)
Low levels of substance-free alternative reinforcers
Strong preference for immediate relative to delayed rewards (delay discounting)
Rachlin (1995). Behavioral and Brain Sciences.Redish (2004). Science.

Progression of Substance Abuse
Over time increasing substance use can reduce the value of alternatives, result in greater relative value of drugs vs. alternatives psychosocial process (life disruption due to
drug effects, time spent using drugs) neurobiological process (reduced dopamine
response to drug-free rewards) relative value of drugs vs. alternatives is key
index of severity Increases in substance-free rewards are key
element of recovery, may also have preventive effect

Reinforcing Value (RV)
Lab measures = response rate for drugs across price increases, choice between drugs and alternatives
Naturalistic measures Demand for alcohol – levels of alcohol consumption and
expenditures as a function of price (demand curve analysis – how much would you pay?)
Relative levels of activity participation and enjoyment related to substance use versus other activities (Matching Law analysis – is substance use the only game in town?)
RV may indicate the extent to which an individual wants or values a substance and may provide a unique index of substance problem severity and risk for addiction
Murphy et al. (2009). Experimental and Clinical Psychopharmacology. Tucker et al. (2009). Journal of Consulting and Clinical Psychology.
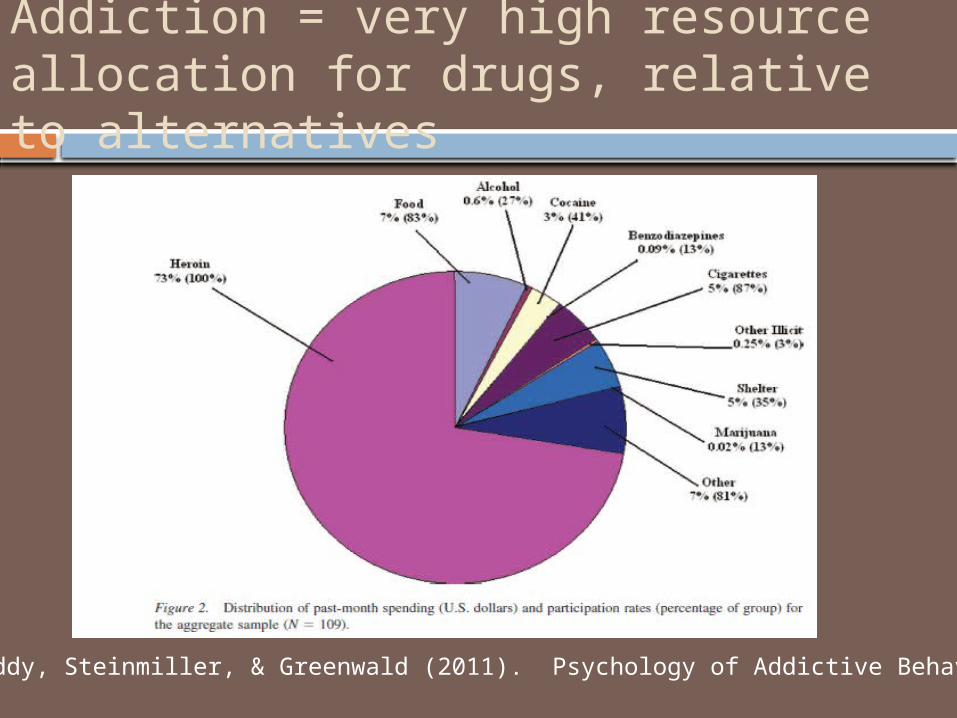
Addiction = very high resource allocation for drugs, relative to alternatives
Roddy, Steinmiller, & Greenwald (2011). Psychology of Addictive Behaviors

“Imagine that you and your friends are at a bar from 9pm to 2am to see a band. The following questions ask how many drinks you would purchase at various prices. The available drinks are standard size beer (12oz), wine (5oz), shots of hard liquor (1.5oz), or mixed drinks with one shot of liquor. Assume that you did not drink alcohol before you went to the bar and will not go out after.”
How many drinks would you have if they were free?_________How many drinks would you have if they were $.25 each?_____How many drinks would you have if they were $.50 each?_____How many drinks would you have if they were $1.00 each?____How many drinks would you have if they were $1.50 each?____How many drinks would you have if they were $2.00 each?____
Murphy and MacKillop (2006). Experimental and Clinical Psychopharmacology.
Hypothetical Alcohol Purchase Task Measure of Reinforcing Value

Demand Curve Measures of Alcohol Reinforcement Value
MacKillop, Murphy, Tidey, Kahler, Ray, & Bickel (2008). Psychopharmacology.
Consumptioncurve
Expenditure curve

Demand for Alcohol Among Heavy vs. Light Drinkers (N = 299)
Murphy and MacKillop (2006). Experimental and Clinical Psychopharmacology.

Hypothetical Alcohol Demand Curves are Reliable
Murphy, MacKillop, Skidmore, & Pederson (2009). Experimental and Clinical Psychopharmacology.

Hypothetical vs. Actual Choices, and Alcohol Cue Exposure
Amlung, M., Acker, J., Stojek, M., Murphy, J. G., & MacKillop, J. (under review)

Demand for Alcohol is Sensitive to Environmental Contingencies
Skidmore & Murphy (2011). Psychology of Addictive Behaviors.

Alcohol Demand among Heavy Drinkers with High vs. Low Levels of Alcohol Use Disorder Symptoms
MacKillop, Miranda, Monti, Ray, Murphy, et al. (2010). Journal of Abnormal Psychology.

High/Inelastic Demand for Alcohol is Associated with Alcohol-Related Pathology and Problem Severity
Acute craving, depressive symptoms, impulsivity, and family history of alcoholism
Murphy, MacKillop, Skidmore, & Pederson (2009). Experimental & Clinical Psychopharmacology. MacKillop, Miranda, Monti, Ray, Murphy, et al. (2010). Journal of Abnormal Psychology. Smith, Martens, Murphy et al. (2010). Experimental & Clinical Psychopharmacology.
Study 1: Does Alcohol Reinforcing Value Predict Response to BMIs?

Method
54 heavy drinking college student participants were randomly assigned to one of two BMIs
Participants averaged 24.12 (SD = 8.74) drinks per week at baseline
51 participants (94%) completed a 6-month follow-up assessment
Main effect for time (reduced drinking), but no difference between the two interventions (see Murphy et al., 2004 for intervention outcomes)

Greater baseline demand curve values were associated with greater follow-up drinking levels after controlling for baseline drinking
Demand Metric ΔR2 b
Omax .10 .33**
Breakpoint .07 .26**
Elasticity .06 .25**
Pmax .04 .20*
*p < .05; ** p < .01; Covariates include gender and baseline drinking
MacKillop and Murphy (2007). Drug and Alcohol Dependence.

Study 2: Can Brief Motivational Interventions Reduce Demand for Alcohol?

Methods
RCT (N = 133) compared MI to e-CHUG (computerized intervention) and assessment only
Participants averaged 16.1 (SD = 13.5) drinks per week
1-month drinking outcomes: MI had a significant advantage over assessment only, trend level advantage over e-CHUG
Participants completed demand curve measures at baseline, immediately post-session, and at 1-month follow-up.

Study 2: Pre to Post Session Change in Demand for e-CHUG and MI
e-CHUG
0
1
2
3
4
5
6
7
8
9
10
11
12
13
14
15
$0.00 $0.25 $0.50 $1.00 $1.50 $2.00 $2.50 $3.00 $4.00 $5.00 $6.00 $7.00 $8.00 $9.00 $10.00 $15.00 $20.00
Price
Standard
drinks Baseline
Post session
MI
0
1
2
3
4
5
6
7
8
9
10
11
12
13
14
15
$0.00 $0.25 $0.50 $1.00 $1.50 $2.00 $2.50 $3.00 $4.00 $5.00 $6.00 $7.00 $8.00 $9.00 $10.00 $15.00 $20.00
Price
Standard
Drinks Baseline
Post session

Study 2: Changes in Demand from Baseline to One-month Follow-up for e-CHUG and MI
e-CHUG
0
1
2
3
4
5
6
7
8
9
10
11
12
13
14
15
$0.00 $0.25 $0.50 $1.00 $1.50 $2.00 $2.50 $3.00 $4.00 $5.00 $6.00 $7.00 $8.00 $9.00 $10.00 $15.00 $20.00
Price
Standar
d drinks Baseline
One Month
MI
0
1
2
3
4
5
6
7
8
9
10
11
12
13
14
15
$0.00 $0.25 $0.50 $1.00 $1.50 $2.00 $2.50 $3.00 $4.00 $5.00 $6.00 $7.00 $8.00 $9.00 $10.00 $15.00 $20.00
Price
Standar
d drinks Baseline
One Month

Study 2: Changes in Demand from Baseline to One-month Follow-up for Assessment only and MI
MI
0
1
2
3
4
5
6
7
8
9
10
11
12
13
14
15
$0.00 $0.25 $0.50 $1.00 $1.50 $2.00 $2.50 $3.00 $4.00 $5.00 $6.00 $7.00 $8.00 $9.00 $10.00 $15.00 $20.00
Price
Standa
rd drink
s
Baseline
One Month
Assessment Only
0
1
2
3
4
5
6
7
8
9
10
11
12
13
14
15
$0.00 $0.25 $0.50 $1.00 $1.50 $2.00 $2.50 $3.00 $4.00 $5.00 $6.00 $7.00 $8.00 $9.00 $10.00 $15.00 $20.00
Price
Standar
d drinks Baseline
One month

Summary of Studies 1 and 2
Demand curve measures of alcohol reinforcement predict response to BMIs and change immediately following BMI, perhaps in a “dose response” manner related to the efficacy of the intervention
Reduction in demand persists to 1-month after the intervention and exceeds control condition reductions
A multi-component MI intervention resulted in a larger and more enduring decrease in demand compared to a computerized intervention

Study 3: Using a Behavioral Allocation Measure of Reinforcement Value to Predict Drinking Outcomes

Activities
Frequency with alcohol or drugs
Frequency without alcohol or drugs
Enjoyment with alcohol or drugs
Enjoyment without alcohol or drugs
1.Go places with siblings or family members
2. Talk with friends
3. Read a book
4. Go on a date
Frequency Enjoyment0 = 0 times 0 = unpleasant or neutral 1 = once a week or less 1 = mildly pleasant2 = 2-4 times per week 2 = moderately pleasant3 = about once a day 3 = very pleasant4 = more than once day 4 = extremely pleasant
Frequency X Enjoyment = Obtained Reinforcement Correia & Carey (1999). Psychology of Addictive Behaviors.

Relative Behavioral Allocation to Substance Use vs. Other Activities
Reinforcement Ratio:
Substance-Related Reinforcement
(Substance-Related Reinforcement + Substance-Free Reinforcement)
-Measures the extent to which substance use dominates behavioral allocation (e.g., ratio value of .4 = 40% of activity participation and enjoyment related to substance use)
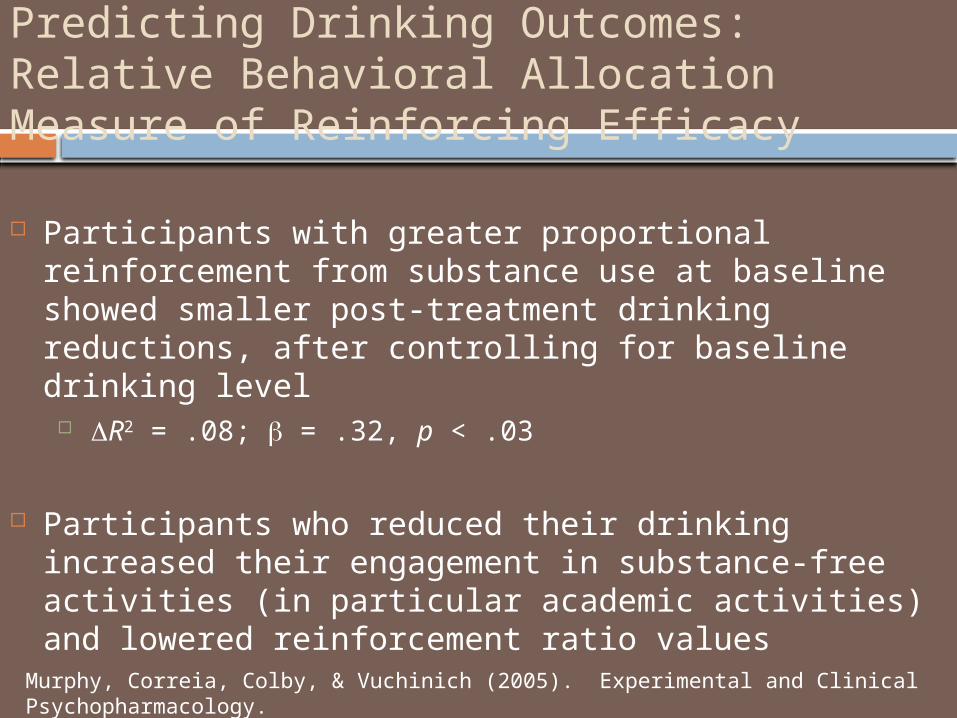
Predicting Drinking Outcomes: Relative Behavioral Allocation Measure of Reinforcing Efficacy
Participants with greater proportional reinforcement from substance use at baseline showed smaller post-treatment drinking reductions, after controlling for baseline drinking level R2 = .08; b = .32, p < .03
Participants who reduced their drinking increased their engagement in substance-free activities (in particular academic activities) and lowered reinforcement ratio values
Murphy, Correia, Colby, & Vuchinich (2005). Experimental and Clinical Psychopharmacology.

Behavioral Economic Implications for Improving Brief Interventions
Traditional BMIs may be insufficient for individuals with few alternatives to substance use, insensitivity to delayed consequences, or high demand for drugs
decreases in substance use are facilitated by increased engagement in substance-free activities (e.g., community reinforcement, and contingency management treatments)
increasing the salience of delayed substance-free rewards, and the extent to which behavior is viewed in patterns rather than isolated choices, can increase their value (counteract delay discounting)Higgins et al., 2003; Murphy, Correia, & Barnett. 2007; Rachlin, 2000; Vuchinich & Tucker, 1988

Behavioral economic supplement to alcohol MI: Substance-Free Activity Session (SFAS) Second 50-minute intervention session delivered after
standard alcohol focused MI “College Adjustment Session” (developed for 1st year college
students) “Post-deployment adjustment session” (for Veterans)
Goals are to increase substance-free activity and commitment to college/life goals
Lifestyle changes may support the drinking reduction goals developed in alcohol focused MI session
Developed using iterative process; expert feedback, focus groups, and an open trial (R21AA016304)
Intervention uses MI + feedback style, but draws form Behavioral Activation and ACT

Substance-Free Activity Session (SFAS) Components
Starts with a discussion of student’s academic and career goals
How do these goals relate to alcohol use?
Graphs and personalized feedback to encourage engagement in academics and other substance-free activities

Good grades = more future income

Your Career Goals:You mentioned your goal was to become a lawyer
Here is what it takes to become a lawyer:•4-year college degree•3 years of law school + passing a written bar examination. Getting accepted to law school:Acceptance into most law schools depends on grades, the LSAT, work experience GPAThe average GPA for admitted students to University of Memphis Law School was 3.36.
Extracurricular Activities •Mock Trial Club •Pre-Law Society
This is what you need to accomplish to become an [career]; here are some specific relevant local resources/internships, etc.

More time spent drinking = lower grades, More time in class or studying = higher grades

How You Spend Your Time (personalized time allocation feedback)
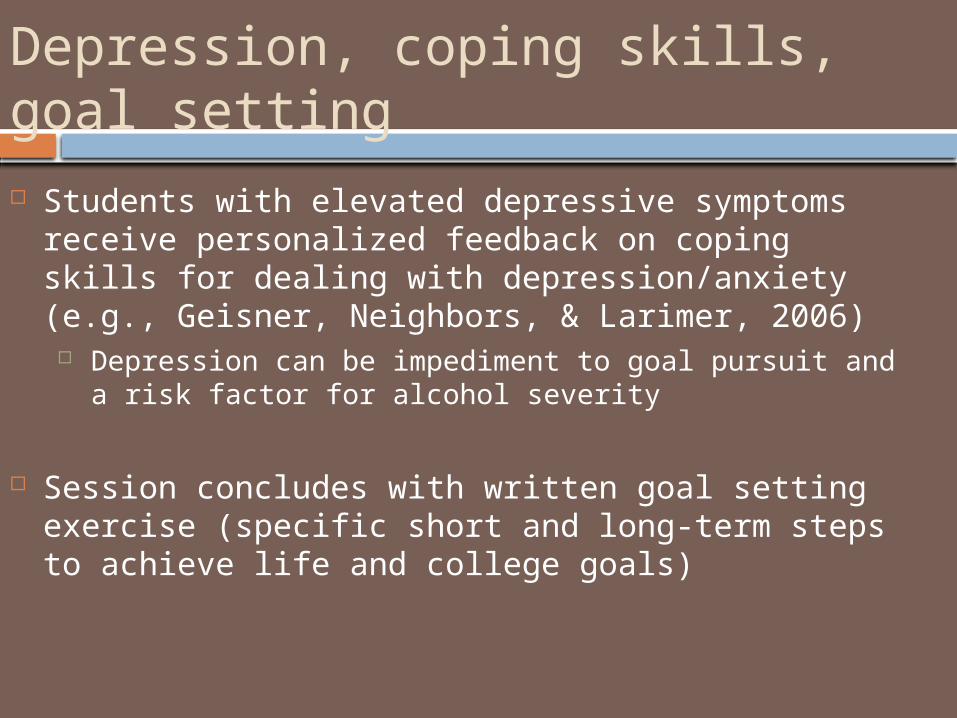
Depression, coping skills, goal setting Students with elevated depressive symptoms receive
personalized feedback on coping skills for dealing with depression/anxiety (e.g., Geisner, Neighbors, & Larimer, 2006) Depression can be impediment to goal pursuit and a risk
factor for alcohol severity
Session concludes with written goal setting exercise (specific short and long-term steps to achieve life and college goals)

Recruitment: First year students completed a classroom screening as part of a core university course
Inclusion criteria: > 2 past-month binge drinking episodes (5/4 drinks for men/women)
82 students (50% female) met inclusion criteria and agreed to participate Mean (SD) Drinking Characteristics:
drinks per week = 16.87 (11.6) Past month binge episodes = 6.02 (4.33) Past month alcohol problems on the YAACQ = 13.87 (8.55)
Study 4: Method

Method All Participants (N = 82) completed:
1) lab based assessment of drinking, drinking problems, and substance-free activity participation
2) standard individual alcohol focused BMI session
Then randomly assigned to complete a 2nd individual 50-minute intervention session with the same clinician Substance-Free Activity Session (SFAS; N = 41) described to student as
“College Adjustment Session” Relaxation Session (N = 41) included diaphragmatic breathing and
progressive muscle relaxation (active control)
Participants completed follow-ups assessments 1 and 6 months post intervention 1-month follow-up rate = 99% 6-month follow-up rate = 87%
Dimeff et al., 1999; Klajner, Hartman, & Sobell, 1984; Miller & Rollnick, 2002

Change in past-month binge drinking
ns

Change in alcohol-related problems (YAACQ)
p < .01

Moderation Analysis: change in binge drinking by baseline depression
Lower Depression Higher Depression0
1
2
3
4
5
SFAS
Relaxation
Hea
vy D
rink
ing
Red
ucti
on

Moderation analysis: Change in binge drinking by baseline substance-free reinforcement
Lower Substance-free Reinforcement
Higher Substance-free Reinforcement
0
1
2
3
4
5
SFAS
Re-laxa-tion

Did the SFAS impact the proposed mediators?
There were no significant changes in overall time spent in academic or other substance-free activities
The SFAS was associated with a significant increase in the frequency of studying or attending alcohol-free campus events in the evening
The SFAS was associated with a trend level increase in Consideration of Future Consequences (p = .08).
Study was not powered to test for mediation

Summary of Study Four The SFAS session significantly enhanced the efficacy of
MI in reducing alcohol problems, this effect was not due to additional (nonspecific) clinical contact
The SFAS session significantly enhanced the efficacy of MI in reducing binge drinking for students with depressive symptoms or low levels of substance-free reinforcement
These students may benefit from the focus on increasing goal-directed behaviors
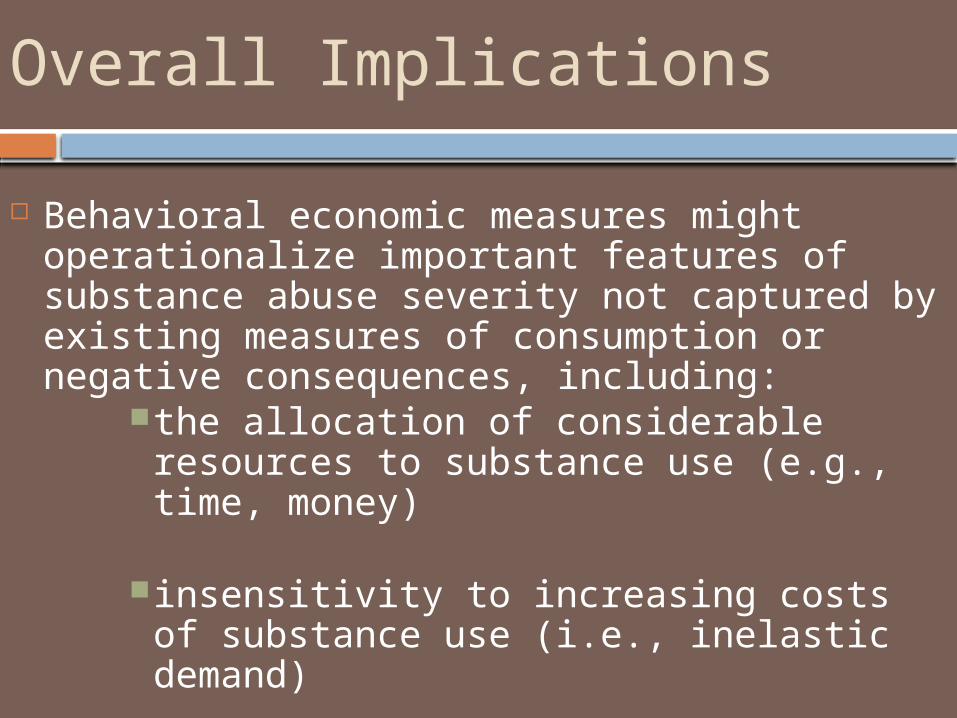
Overall Implications
Behavioral economic measures might operationalize important features of substance abuse severity not captured by existing measures of consumption or negative consequences, including:
the allocation of considerable resources to substance use (e.g., time, money)
insensitivity to increasing costs of substance use (i.e., inelastic demand)
the relative prominence of substance use in an individual's overall lifestyle (Rachlin, 2000)

Overall Implications
Brief alcohol interventions should attempt to shift behavior away from drinking and towards potentially reinforcing substance-free activities (academic, family, community activities, hobbies) using feedback and MI to increase the salience of these delayed rewards
Future research is needed to replicate these results with other high risk populations

Acknowledgements
Kat Bracken-Minor Rachel J. Brooks Joanna Buscemi Ashley A. Dennhardt Claudia McCausland Jessica R. Skidmore Ali M. Yurasek Project Directors: Ashley A. Dennhardt Jessica R. Skidmore
Nancy P. Barnett Brian Borsari Suzanne M. Colby James MacKillop Matthew P. Martens Meghan McDevitt-
Murphy
Funding: NIAAA, ABMRF, DOE
Graduate Clinicians and RAs
Collaborators
Contact: [email protected]

Thank you AMERSA.
Related Documents