BEE TRACKING SYSTEM USING RFID Electronics and Electrical Engineering Department Fontys University of Applied Science Eindhoven 2009 TASK 24, BV The Netherland s

BEE Tracking System Using RFIDdoc
Nov 22, 2014
Welcome message from author
This document is posted to help you gain knowledge. Please leave a comment to let me know what you think about it! Share it to your friends and learn new things together.
Transcript

BEE TRACKING SYSTEM USING RFID
Electronics and Electrical Engineering DepartmentFontys University of Applied Science
Eindhoven
2009TASK 24, BV The Netherlands

2

BEE Tracking System Using RFID
Company
Task24, B.V
Antoniustraat 9, Eindhoven
The Netherlands
Company Mentor
Egbert Touw
Performance Improvement Competence Leader
School Mentor
Piet Van Roij
Fontys Hogeschool Engineering
Author
Safee Hussain
Fontys Hogeschool Engineering Dept. (EEE)
Student-number: 2137177
Graduation Session: 7th July 2009
3

4

Document History
Version Date Remarks Review by
1.0 June 7, 2009 Piet Van Roij
1.1 June 10,2009 Piet Van Roij
1.2 June 12,2009 Piet Van Roij
2.0 June 16,2009 Piet Van Roij
CONFIDENTIALITY & DUPLICATION
The contents of this document must be treated as confidential. Changing the contents of this document is prohibited. No part of this document may be reproduced, stored in a retrieval system or transmitted in any form or by any means, electronic, mechanical, photocopying, recording or otherwise, without the prior written permission of Authors/Mentor.
5

Management Summary
Over recent years farmers and beekeepers who breed bees in conventionally commercial ways and stand direct beneficiaries of the animal keeping through its marvelous abilities of pollinating plant seeds and nectar collection, have encountered a problem of colony collapse in a massive effect. Thousands of bees are disappeared in a season, which greatly affect food and honey production. Our domain specifically contributes by detecting bees and tracking their movement in mass. The solutions rendered in previous expeditions point towards a solution through the technology termed as RFID. This requires us to arrange a system including a tag to be pasted on bee, a reader to register bee entering and leaving of Hive and an interface between the reader and a PC.
Cost on a system that has not yet been realized and created in real world completely is always larger than expected; we’re discussing a problem that could pose threat directly to 15-30 % of total human food production so benefit; is huge in its natural sense and is a service in its moral sense. The cost of for the whole system is suggested to be € 880.5.
Conclusively, our effort shows that the solution of tracking bees; through RFID is really difficult if not “impossible”. This decision is taken after a vigorous exercise which is elaborated in our report below, it includes a research and practical implementation of design proposed to be the best in given conditions and circumstances. The final decision is of course taken by the judges and reader himself through arguments given.
6

Summary
We divided the problem in its core systematic order, we required a transponder with built in antenna and chip small enough to be carried by a bee, such a tag was available from Microsensys a German company and since the tag was following internationally recognized protocols, a reader from Skyetek an American company, was also searched out to be attached with an antenna design proposed and implemented during the project.
Size of the tag, range to be covered by the antenna, frequency selection, physical dimensions of hive entrance, communication hurdles intimately connected RFID and bee’s natural reactive behavior; greatly influence the antenna design part. This writing offers a comprehensive argument on the decisions taken to solve the problem of tracking. It should be clear that the antenna design which we propose is to be attached with reader equipment to detect the transponder, because there’s no design as such which has been brought to reality yet.
Our plan was to implement the detection procedure primarily and then transfer the registered information to a server through GSM modules and upload the information on a website. Although our antenna design did not detect the required tag sensed from the reader equipment, but the tag had clear influence on the magnetic field of antenna in its proximity seen from the network analyzer. Plus our antenna was able to sense and detect most common tags in the market. We can only use the passive tags as bees cannot carry a battery to run the chip on tag.
7

Preface
As the name suggests, the project Bee Tracking System uses RFID for detection of Bees, use of RFID as technology for solving the problem had already been suggested in a prototype proposed by John Roodt, a previous internee on the project. This report demonstrates the practical implementation and implications that came as results after the pursuit of problem solution. There is no debate on the choice of technology, but the report includes a comprehensive debate on physical and practical exercises made to bring the idea to real world.
RFID comprises of two basic modular structures, one to be termed as Reader and other to be Tag. We include the in depth analysis of RFID technology especially in the light of limitations posed by the insect bee, its behavior and its hive.
Once if the bee is detected and registered correctly, we can send the information to an internet server using simple GSM modules. Five months of pursuit doesn’t only include the lab work, but also an internet research on the selection of right equipment, right frequency of communication and antenna design research. The frequency was selected to be in the ISM band 13.56 MHz.
Research part of the project through internet was carried at TASK 24 during the initial period of two months; this also includes the arrangement of reader equipment from a set of companies which shall be explained later. For the rest of the three months, the practical part of the project was pursued at Fontys Telecommunication Laboratory.
8

Table of ContentsIntroduction...................................................................................................................................11
1.1 Problem Description...................................................................................................................11
1.2 Assignment.................................................................................................................................11
1.3 Resources and Support...............................................................................................................11
Research..........................................................................................................................................12
2.1 RFID Technology.........................................................................................................................12
2.1.1 Merits of RFID......................................................................................................................13
2.1.2 Demerits of RFID..................................................................................................................13
2.1.3 Inductive Coupling...............................................................................................................14
2.1.4 Backscatter Coupling...........................................................................................................17
2.2 RFID Antenna Design (Inductively Coupled)...............................................................................19
2.2.1 Current and Magnetic Fields................................................................................................19
2.2.2 Induced Voltage in Antenna Coil.........................................................................................21
2.2.3 Inductance of various Antenna Coils...................................................................................22
2.2.4 Resonance circuits, Quality factor Q and Band width..........................................................26
2.2.5 Antenna Symmetry..............................................................................................................28
2.2.6 Field Strength and effects of Planes....................................................................................29
2.3 Antenna Matching......................................................................................................................32
2.3.1 Significance..........................................................................................................................32
2.3.2 How to Match......................................................................................................................34
2.4 Bee Behavior..............................................................................................................................37
2.4.1 Bees and Magnetic Fields....................................................................................................37
2.4.2 Bee and Bee Hive.................................................................................................................38
2.5 System........................................................................................................................................38
2.5.1 The Tag................................................................................................................................39
2.5.3 Antenna Switching Mechanism...........................................................................................42
2.6 Problem Realization in the light of RFID.....................................................................................43
Implementation............................................................................................................................44
3.1 Antenna Circuit...........................................................................................................................44
3.1.1 Dimensional calculations of Coil..........................................................................................45
3.1.2 Configurations.....................................................................................................................46
9

3.1.3 Measurements.....................................................................................................................47
3.2 Antenna Matching......................................................................................................................49
3.3 Testing with Reader....................................................................................................................52
3.3.1 Results.................................................................................................................................53
3.4 Observations...............................................................................................................................54
3.5 Cost Analysis...............................................................................................................................58
3.6 Problem Faced and Tackled........................................................................................................59
Conclusions.....................................................................................................................................60
Recommendations......................................................................................................................61
References......................................................................................................................................62
Appendix..........................................................................................................................................63
Glossary............................................................................................................................................64
Annex A-1........................................................................................................................................65
Annex A-2........................................................................................................................................69
10

Introduction
1.1 Problem DescriptionColony Collapse Disorder is the name of the problem being faced by most of the beekeepers all over Europe and America. Male bees “drones” are vanishing in large numbers; this directly affects the fruit and vegetable production. To solve the problem we need to track bees and see what makes them disappear. Initially, we need to tag them with any identification and follow their movement by registering them each time they enter or leave any hive. Although U.S. beekeepers have been hardest hit by CCD, beekeepers in Europe have reported similar honeybee problems.
Mr. Egbert being himself as a bee-keeper and member of Beekeeper Association Netherlands encountered the problem of colony collapse. Thus, bee tracking holds key role in the problem solution process.
Now that it is established that bee tracking is important, we need to have a closer look into the situation in terms of Reader Antenna and Tag selection or even a whole lot of new design based on RFID principles.
1.2 AssignmentDetect and register the tagged bees whenever they enter or leave the hive.
1.3 Resources and Supporta) Task 24, provided us with a notebook.b) Mr. Egbert Touw, gave financial support, communicated with companies and
managed the project from company´s end.c) Mr. Piet Van Roij, technically supported each step and mentored this project from
school´s end.d) Fontys, provided with equipment support of network analyzer, spectrum analyzer
along with circuit components and laboratory work place.
11

Research
2.1 RFID TechnologyRadio frequency identification (RFID) is a generic term that is used to
describe a system that transmits the identity (in the form of a unique serial number) of an object or person wirelessly, using radio waves. It's grouped under the broad category of automatic identification technologies.
A typical RFID tag consists of a microchip attached to a radio antenna mounted on a substrate. The chip can store as much as 2 kilobytes of data. For example, information about a product or shipment—date of manufacture, destination and sell-by date—can be written to a tag.
To retrieve the data stored on an RFID tag, you need a reader. A typical reader is a device that has one or MORE antennas that emit radio waves and receive signals back from the tag. The reader then passes the information in digital form to a computer system
Read range is determined by many factors, but one of the most important is the method passive tags use to transmit data to the reader. Low- and high-frequency tags use inductive coupling. Essentially, a coil in the reader antenna and a coil in the tag antenna form an electromagnetic field. The tag draws power from the field, uses the power to run the circuitry on the chip and then changes the electric load on the antenna. The reader antenna senses the change in the magnetic field and converts these changes into the ones and zeros that computers understand. Because the coil in the tag antenna and the coil in the reader antenna must form a magnetic field, the tag must be fairly close to the reader antenna, which limits the read range of these systems.
Illustration of RFID in Block diagram 2.1.1 (**http://www.rfid-handbook.com)
12

2.1.1 Merits of RFID
The following are the benefits of RFID Systems:
Non-line of sight identification of tags. Unattended operations are possible, minimizing human errors and high cost. Ability to identify moving elements that have tags embedded. Larger area of coverage. Up to several feet. Can be used in diverse environments, including live stock, military, and
scientific areas. RFID can be used in addition to Bar Code. These two technologies can be
complementing each other. Automatic integration with back end software solutions provide end to end
integration of data in real time. Enables distributed deployment and edge processing. Provides enterprise-class management and security. Abstracts low-level hardware interfaces. Insulates developers from standards and protocols. Speeds development of business logic. Simplifies integration with enterprise systems. Provides a robust simulator to assist development. Offers an advanced architecture for future growth.
2.1.2 Demerits of RFID Expensive compared with Bar code. Bulkier, due to embedding of electronic components in the tag. However,
with advanced techniques, it is possible to reduce the size, and weight of the tags to a large extent.
Prone to physical/electrical damage due to environmental conditions. For example, tags that are subjected to space exploration may encounter extreme temperatures. The tags required to be designed for a given application, and may be costly when designed for use under extreme environmental conditions.
13

The benefits of this technology are very attractive and technically catchy enough to overrun any other technology for tracking a mobile commodity. The management and organizational abilities of RFID make it more reliable and applicable in different scenario, same is the case with our problem. But this is not all that we should know about RFID before we want to implement this system. We should take specific RFID traits to our consideration; RFID has its own way of operation and posses its own application hurdles. We include the main RFID topics of technicality as under.
2.1.3 Inductive Coupling An inductively coupled transponder comprises of an electronic data carrying device, usually a single microchip and a large area coil that functions as an antenna.
Inductively coupled transponders are almost always operated passively. This means that all the energy needed for the operation of the microchip has to be provided by the reader. For this purpose, the reader's antenna coil generates a strong, high frequency electro-magnetic field, which penetrates the cross -section of the coil area and the area around the coil. Because the wavelength of the frequency range used (< 135 kHz: 2400 m, 13.56 MHz: 22.1 m) is several times greater than the distance between the reader's antenna and the transponder, the electro-magnetic field may be treated as a simple magnetic alternating field with regard to the distance between transponder and antenna.
A small part of the emitted field penetrates the antenna coil of the transponder, which is some distance away from the coil of the reader. By induction, a voltage is generated in the transponder's antenna coil. This voltage is rectified and serves as the power supply for the data carrying device (microchip). A capacitor is connected in parallel with the reader's antenna coil, the capacitance of which is selected such that it combines with the coil inductance of the antenna coil to form a parallel resonant circuit, with a resonant frequency that corresponds with the transmission frequency of the reader. Very high currents are generated in the antenna coil of the reader by resonance step-up in the parallel resonant circuit, which can be used to generate the required field strengths for the operation of the remote transponder.
The antenna coil of the transponder and the capacitor to form a resonant circuit tuned to the transmission frequency of the reader. The voltage at the transponder coil reaches a maximum due to resonance step-up in the parallel resonant circuit.
14
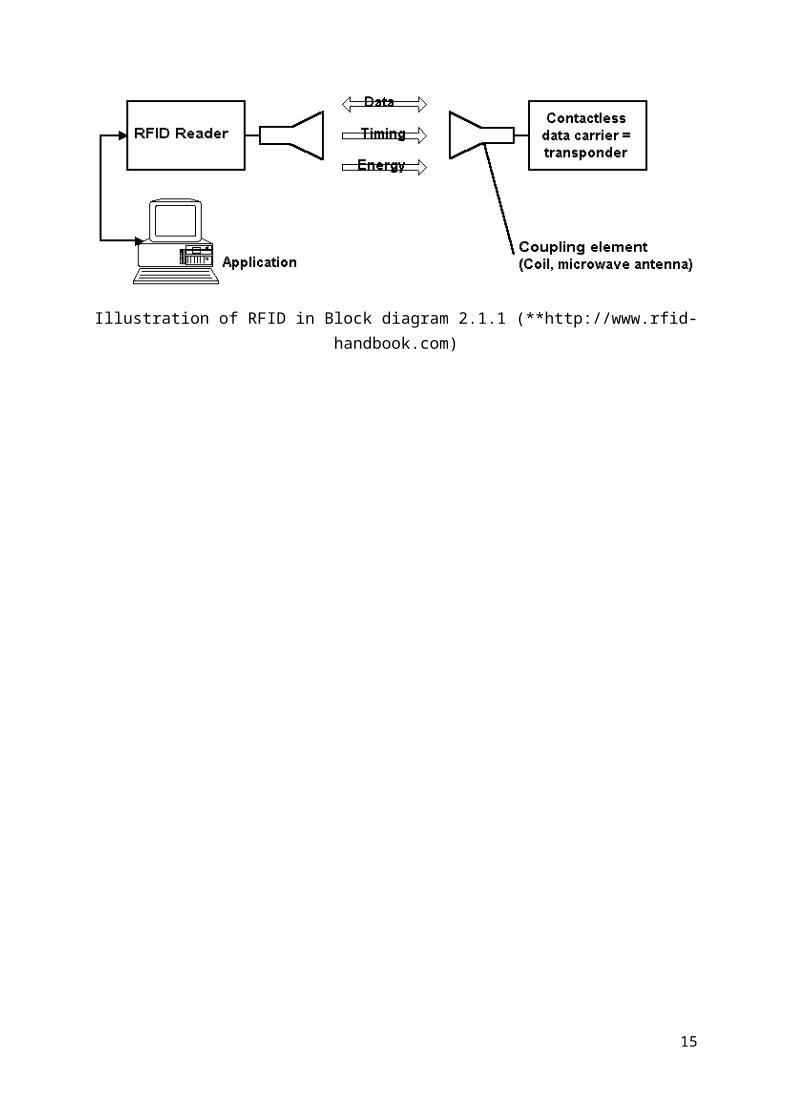
Figure 2.1.2(**http://www.rfid-handbook.com)
As described above, inductively coupled systems are based upon a transformer-type coupling between the primary coil in the reader and the secondary coil in the transponder. This is true when the distance between the coils does not exceed 0.16 λ, so that the transponder is located in the near field of the transmitter antenna.
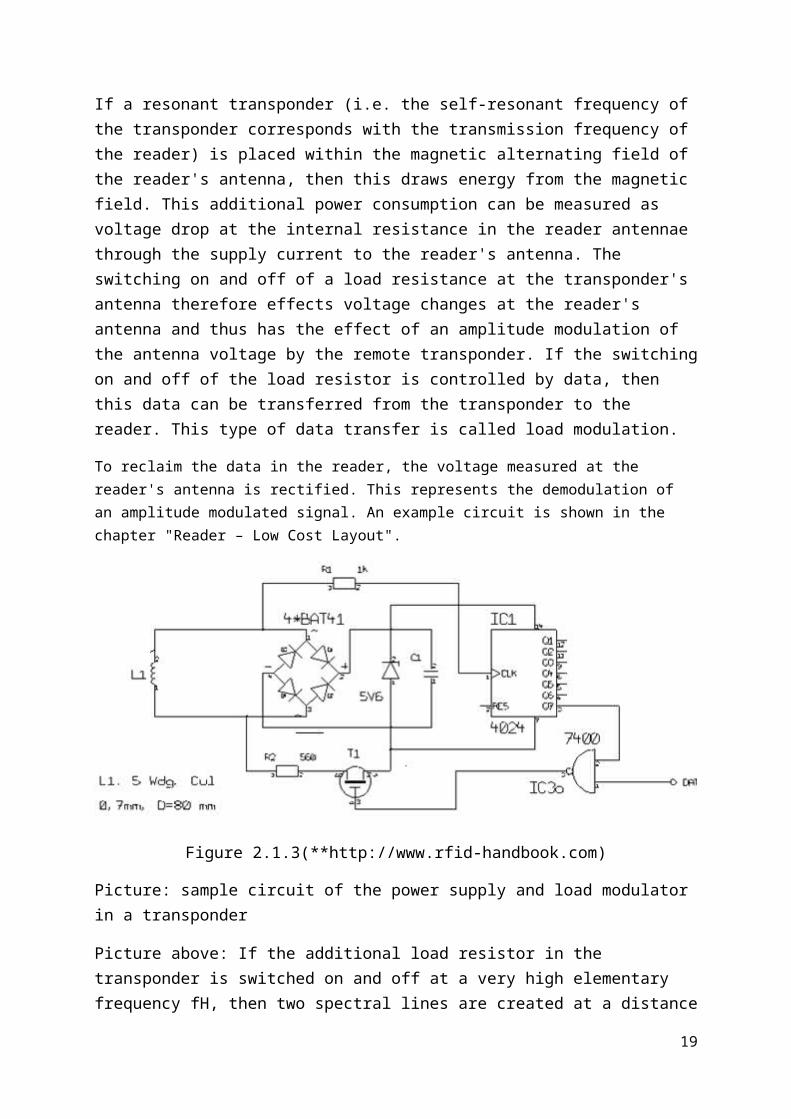
If a resonant transponder (i.e. the self-resonant frequency of the transponder corresponds with the transmission frequency of the reader) is placed within the magnetic alternating field of the reader's antenna, then this draws energy from the magnetic field. This additional power consumption can be measured as voltage drop at the internal resistance in the reader antennae through the supply current to the reader's antenna. The switching on and off of a load resistance at the transponder's antenna therefore effects voltage changes at the reader's antenna and thus has the effect of an amplitude modulation of the antenna voltage by the remote transponder. If the switching on and off of the load resistor is controlled by data, then this data can be transferred from the transponder to the reader. This type of data transfer is called load modulation.
To reclaim the data in the reader, the voltage measured at the reader's antenna is rectified. This represents the demodulation of an amplitude modulated signal. An example circuit is shown in the chapter "Reader – Low Cost Layout".
15

Figure 2.1.3(**http://www.rfid-handbook.com)
Picture: sample circuit of the power supply and load modulator in a transponder
Picture above: If the additional load resistor in the transponder is switched on and off at a very high elementary frequency fH, then two spectral lines are created at a distance of ±fH around the transmission frequency of the reader, and these can be easily detected (however fH must be less than fREADER). In the terminology of radio technology the new elementary frequency is called a subcarrier. Data transfer is by the ASK, FSK or PSK modulation of the subcarrier in time with the data flow. This represents an amplitude modulation of the subcarrier.
Inductive reader-coil: circle radius vs. field strengthThe figure below shows the relationship between the circle radius of the reader-antenna and the field strength H a distance of 0 .. 10 m. In this figure the circle radius slowly increases from 1 .. 50 cm, while the current I is kept constant. It can be seen that while the field strength decreases at zero distance decreases, the distance in large distance increases. That’s the reason, that inductive coupled long range systems (ISO 15693) use large diameter reader antennas, compared to short range systems (ISO 14443) using small diameter reader antennas.
16
Figure2.1.4 (**http://www.rfid-handbook.com)
2.1.4 Backscatter CouplingWe know from the field of RADAR technology that electromagnetic waves are reflected by objects with dimensions greater than around half the wavelength of the wave. The efficiency with which an object reflects electromagnetic waves is described by its reflection cross-section. Objects that are in resonance with the wave front that hits them, as is the case for antenna at the appropriate frequency for example, have a particularly large reflection cross-section.
Figure 2.1.5(**http://www.rfid-handbook.com)
Picture: Operation principle of a backscatter transponder
Power P1 is emitted from the reader's antenna, a small proportion of which (free space attenuation) reaches the transponder's antenna. The power P1' is supplied to the antenna connections as HF voltage and after rectification by the diodes D1 and D2 this can be used as turn on voltage for the deactivation or activation of the power saving "power-down" mode. The diodes used here are low barrier Schottky diodes, which have a particularly low
17
threshold voltage. The voltage obtained may also be sufficient to serve as a power supply for short ranges.
A proportion of the incoming power P1' is reflected by the antenna and returned as power P2. The reflection characteristics (= reflection cross-section) of the antenna can be influenced by altering the load connected to the antenna. In order to transmit data from the transponder to the reader, a load resistor RL connected in parallel with the antenna is switched on and off in time with the data stream to be transmitted. The amplitude of the power P2 reflected from the transponder can thus be modulated (modulated backscatter).
The power P2 reflected from the transponder is radiated into free space. A small proportion of this (free space attenuation) is picked up by the reader's antenna. The reflected signal therefore travels into the antenna connection of the reader in the "backwards direction" and can be decoupled using a directional coupler and transferred to the receiver input of a reader. The "forward" signal of the transmitter, which is stronger by powers of ten, is to a large degree suppressed by the directional coupler.
The ratio of power transmitted by the reader and power returning from the transponder (P1 / P2) can be estimated using the radar equation.
18
2.2 RFID Antenna Design (Inductively Coupled)In an RFID application, an antenna coil is needed for two main reasons:
• To transmit the RF carrier signal to power up the tag• To receive data signals from the tag
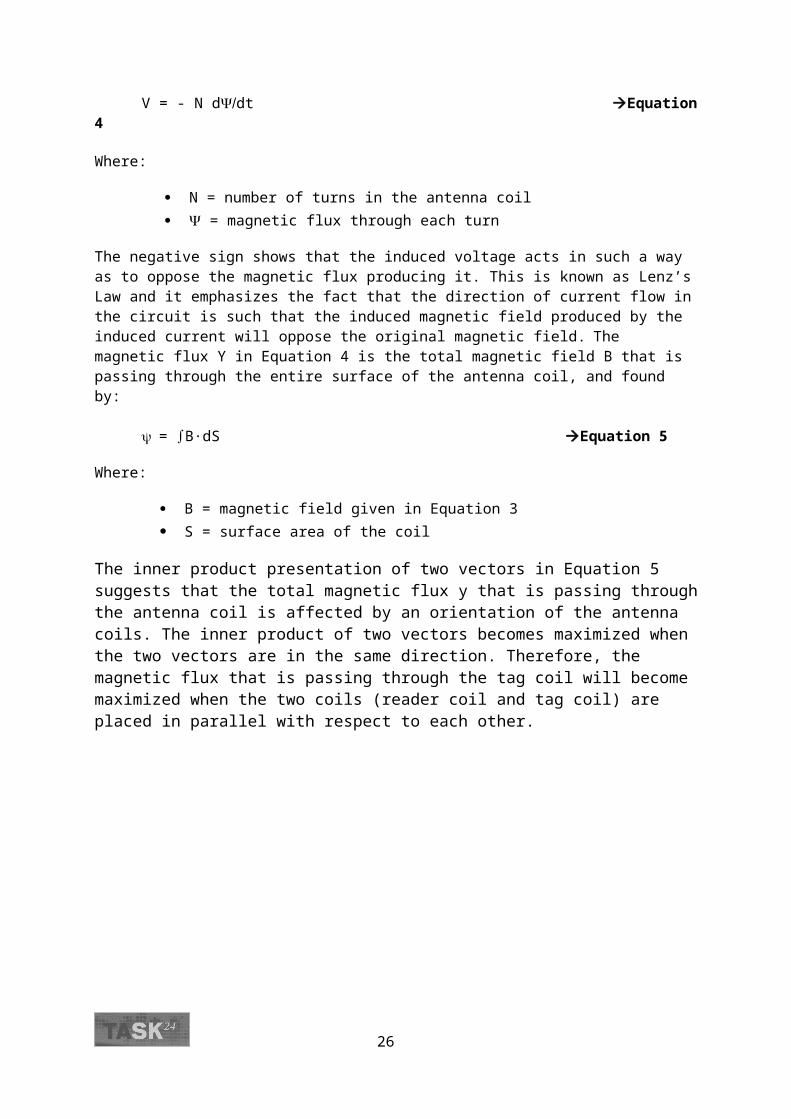
An RF signal can be radiated effectively if the linear dimension of the antenna is comparable with the wavelength of the operating frequency. In an RFID application utilizing the VLF (100 kHz – 500 kHz) band, the wavelength of the operating frequency is a few kilometers (l = 2.4 Km for 125 kHz signal). Because of its long wavelength, a true antenna can never be formed in a limited space of the device. Alternatively, a small loop antenna coil that is resonating at the frequency of the interest (i.e., 13.56) is used. This type of antenna utilizes near field magnetic induction coupling between transmitting and receiving antenna coils. The field produced by the small dipole loop antenna is not a propagating wave, but rather an attenuating wave. The field strength falls off with r-3 (where r = distance from the antenna). This near field behavior (r-3) is a main limiting factor of the read range in RFID applications. When the time-varying magnetic field is passing through a coil (antenna), it induces a voltage across the coil terminal. This voltage is utilized to activate the passive tag device. The antenna coil must be designed to maximize this induced voltage.
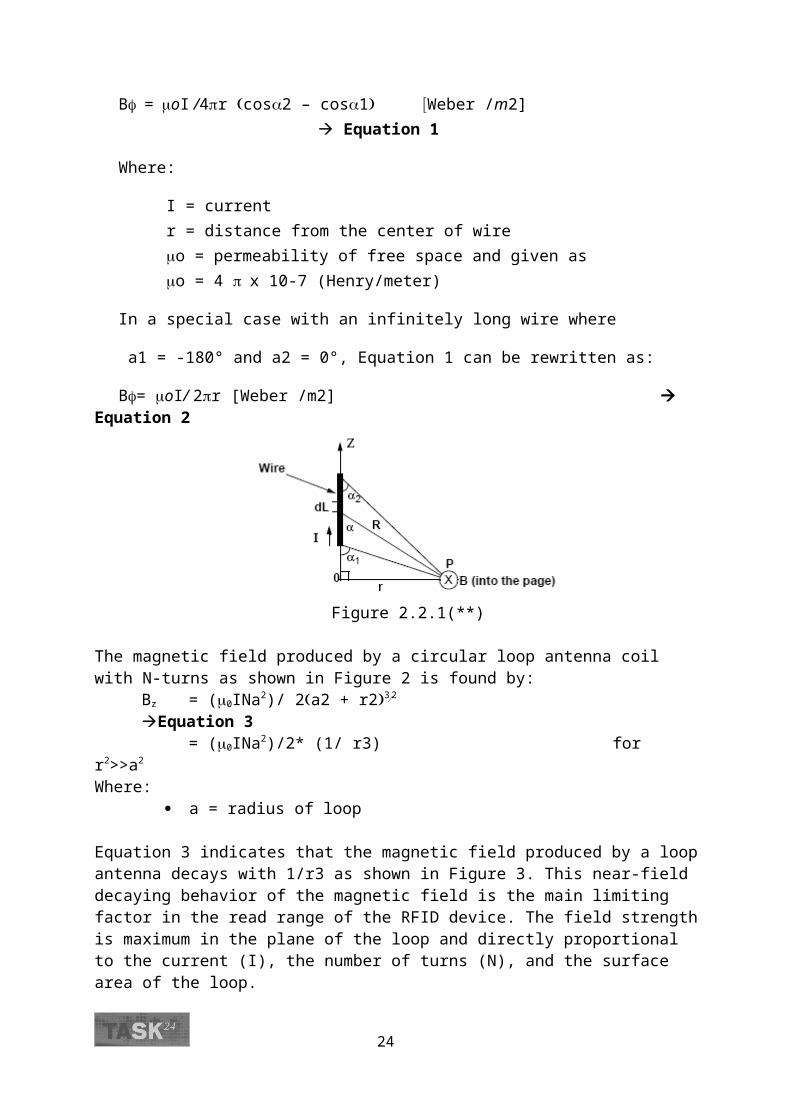
2.2.1 Current and Magnetic Fields Ampere’s law states that current flowing on a conductor produces a magnetic field around the conductor. Figure 1 shows the magnetic field produced by a current element. The magnetic field produced by the current on a round conductor (wire) with a finite length is given by:
B=oI /4r cos2 – cos1Weber /m2] Equation 1
Where:
I = current r = distance from the center of wireo = permeability of free space and given as o = 4 x 10⁻⁷ (Henry/meter)
In a special case with an infinitely long wire where
a1 = -180° and a2 = 0°, Equation 1 can be rewritten as:
B= oI/ 2r [Weber /m2] Equation 2
19
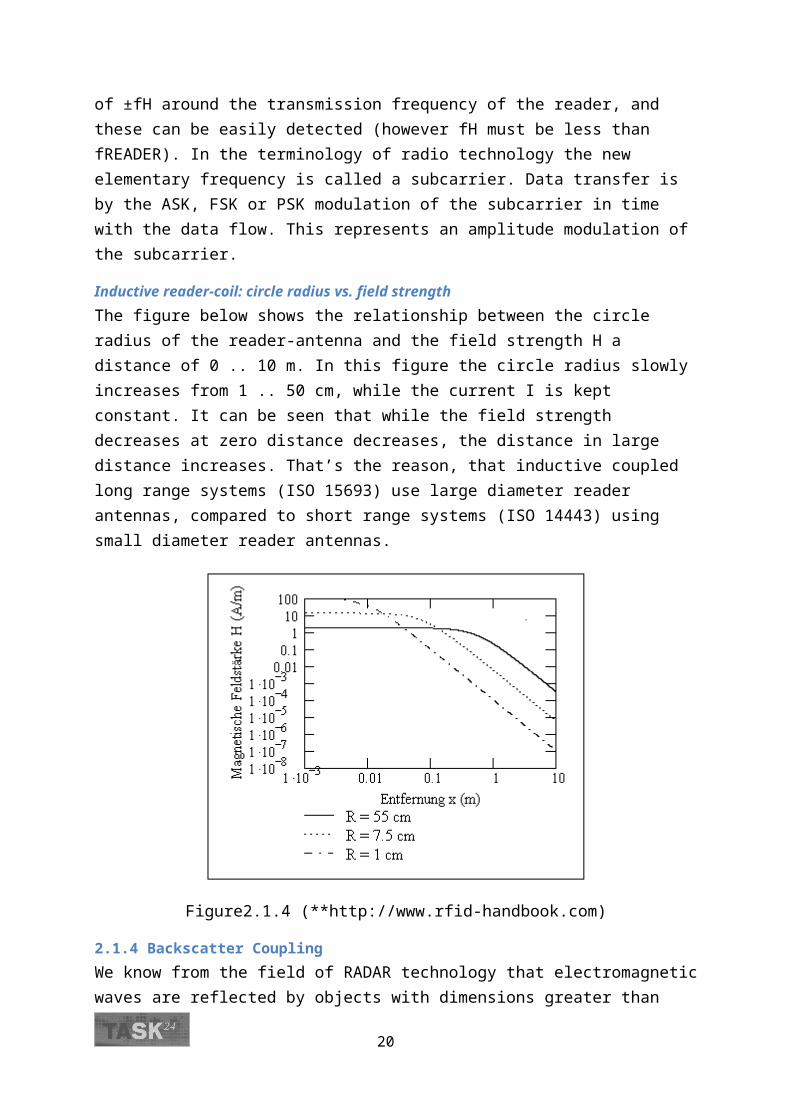
Figure 2.2.1(**)
The magnetic field produced by a circular loop antenna coil with N-turns as shown in Figure 2 is found by:
Bz = (0INa2)/ 2a2 + r232 Equation 3 = (0INa2)/2* (1/ r3) for r2>>a2
Where: a = radius of loop
Equation 3 indicates that the magnetic field produced by a loop antenna decays with 1/r3 as shown in Figure 3. This near-field decaying behavior of the magnetic field is the main limiting factor in the read range of the RFID device. The field strength is maximum in the plane of the loop and directly proportional to the current (I), the number of turns (N), and the surface area of the loop.Equation 3 is frequently used to calculate the ampere-turn requirement for read range. A few Examples that calculate the ampere-turns and the field intensity necessary to power the tag will be given in the coming up section
Figure 2.2.2(**)
20
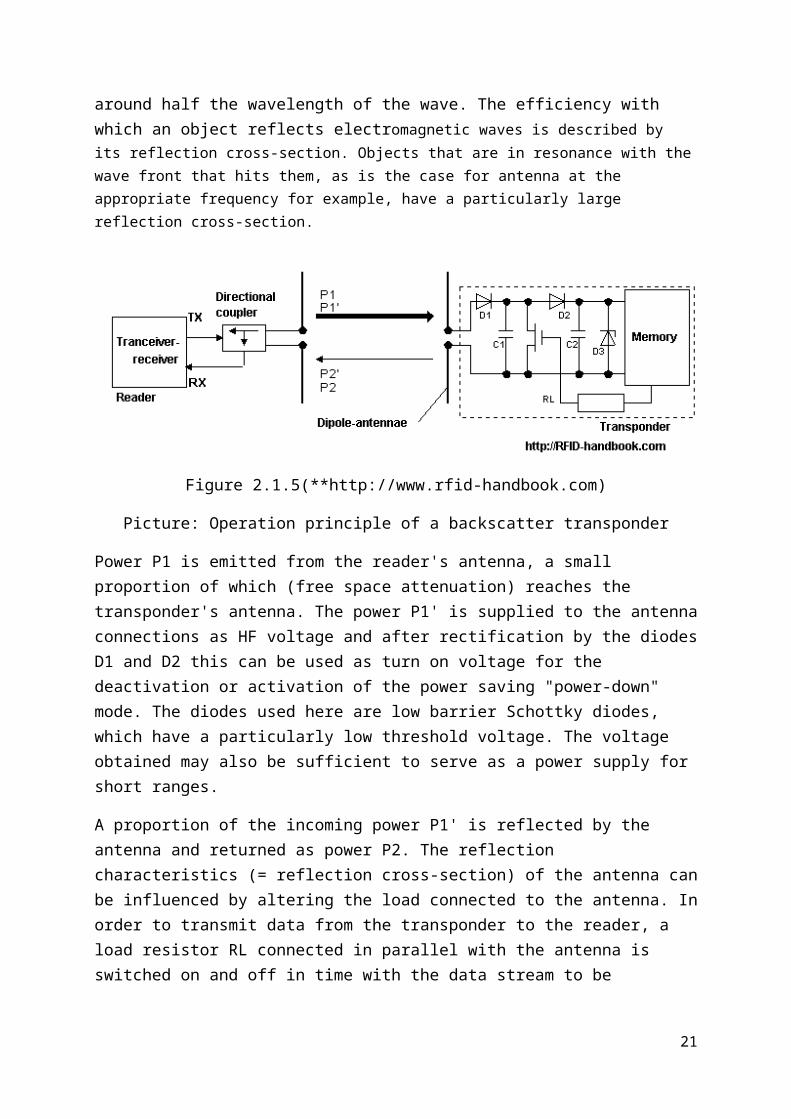
Figure 2.2.3(**)
2.2.2 Induced Voltage in Antenna CoilFaraday’s law states a time-varying magnetic field through a surface bounded by a closed path induces a voltage round the loop. This fundamental principle has important consequences for operation of passive RFID devices. Figure 2.5 shows a simple geometry of an RFID application. When the tag and reader antennas are within a proximity distance, the time-varying magnetic field B that is produced by a reader antenna coil induces a voltage called electromotive force or simply EMF) in the tag antenna coil. The induced voltage in the coil causes a flow of current in the coil. This is called Faraday’s law. The induced voltage on the tag antenna coil is equal to the time rate of change of the magnetic flux .
V = - N ddt Equation 4 Where:
N = number of turns in the antenna coil = magnetic flux through each turn
The negative sign shows that the induced voltage acts in such a way as to oppose the magnetic flux producing it. This is known as Lenz’s Law and it emphasizes the fact that the direction of current flow in the circuit is such that the induced magnetic field produced by the induced current will oppose the original magnetic field. The magnetic flux Y in Equation 4 is the total magnetic field B that is passing through the entire surface of the antenna coil, and found by:
= B·dS Equation 5
Where:
B = magnetic field given in Equation 3 S = surface area of the coil
The inner product presentation of two vectors in Equation 5 suggests that the total magnetic flux y that is passing through the antenna coil is affected by an orientation of the antenna coils. The inner product of two vectors becomes maximized when the two vectors are in the
21

same direction. Therefore, the magnetic flux that is passing through the tag coil will become maximized when the two coils (reader coil and tag coil) are placed in parallel with respect to each other.
Figure 2.2.4(**)
2.2.3 Inductance of various Antenna CoilsThe electrical current flowing through a conductor produces a magnetic field. This time-varying magnetic field is capable of producing a flow of current through another conductor. This is called inductance. The inductance L depends on the physical characteristics of the conductor. A coil has more inductance than a straight wire of the same material and a coil with more turns has more inductance than a coil with fewer turns. The inductance L of inductor is defined as the ratio of the total magnetic flux linkage to the current I through the inductor: i.e.
L= N/ I Equation 6
Where:
N = number of turns I = current = magnetic flux
In a typical RFID antenna coil for 13.56 MHz, the inductance is often chosen as a few (uH) for a tag and from a few hundred to a few thousand (mH) for a reader. For a coil antenna with multiple turns, greater inductance results with closer turns. Therefore, the tag antenna coil that has to be formed in a limited space often needs a multi-layer winding to reduce the number of turns. The design of the inductor would seem to be a relatively simple matter. However, it is almost impossible to construct an ideal inductor because:
22

The coil has a finite conductivity that results in loss; the distributed capacitance exists between turns of a coil and between the conductor and surrounding objects. The actual inductance is always a combination of resistance, inductance, and capacitance. The apparent inductance is the effective inductance at any frequency, i.e. inductive minus the capacitive effect. Various formulas are available in literatures for the calculation of inductance for wires and coils. The parameters in the inductor can be measured. LCR Meter can measure the inductance, resistance, and Q of the coil.
Inductance of a Single Layer CoilThe inductance of a single layer coil shown in Figure 2.6 can be calculated by:
L = (aN)2/ 22.9l + 25.4a Equation 7
Where:
a = coil radius (cm) l = coil length (cm) N = number of turns
Figure 2.2.5(**)
23
Inductance of a Circular Loop Antenna Coil with MultilayerTo form a big inductance coil in a limited space, it is more efficient to use multilayer coils. For this reason, a typical RFID antenna coil is formed in a planar multi-turn structure. Figure 8 shows a cross section of the coil. The inductance of a circular ring antenna coil is calculated by an empirical formula
L = 0.31aN2/ 6a+9h+10b Equation 8
a = average radius of the coil in cm N = number of turns b = winding thickness in cm h = winding height in cm
Figure 2.2.6 a(**)
N = [LH6a+9h+10b0.31a2]1/2
Rectangular Antenna Coil
Calculation of Inductance:
With
24
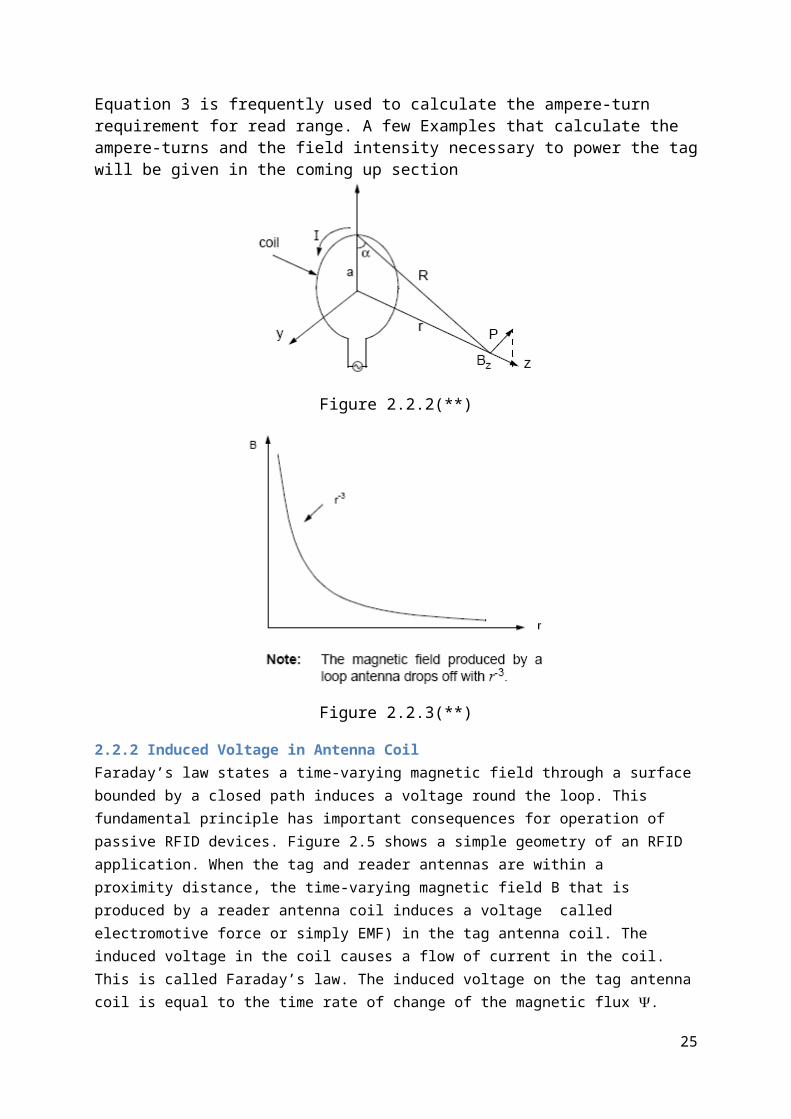
Figure 2.2.6 b(**) ao, bo = Overall dimensions of the coil aavg, bavg = Average dimensions of the coil t= track thickness w= track width g= gap between tracks Na= Number of turns d= equivalent diameter of the track
Theory Behind
The inductance for the reader antenna coil is typically in the range of a few hundred to a few thousand micro- henries (uH) for high frequency applications. The reader antenna can be made of either a single coil that is typically forming a series resonant circuit or a double loop (transformer) antenna coil that forms a parallel resonant circuit.The series resonant circuit results in minimum impedance at the resonance frequency. Therefore, it draws a maximum current at the resonance frequency. On the other hand, the
25
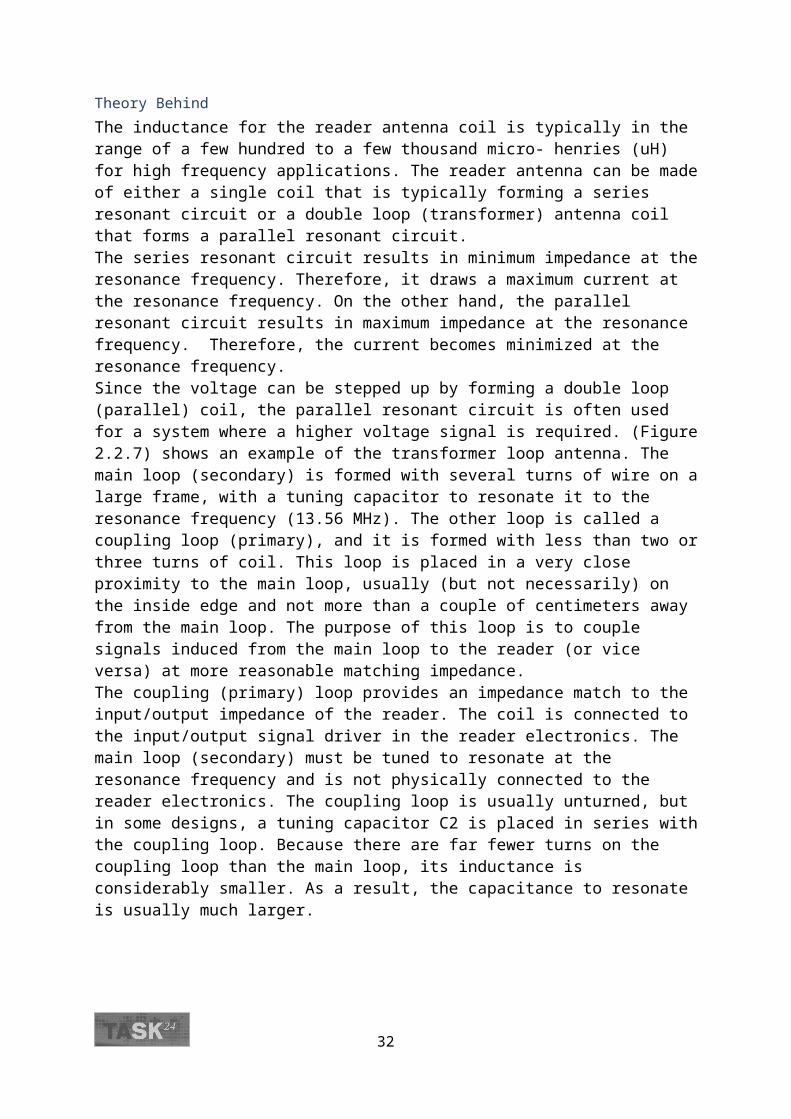
parallel resonant circuit results in maximum impedance at the resonance frequency. Therefore, the current becomes minimized at the resonance frequency.Since the voltage can be stepped up by forming a double loop (parallel) coil, the parallel resonant circuit is often used for a system where a higher voltage signal is required. (Figure 2.2.7) shows an example of the transformer loop antenna. The main loop (secondary) is formed with several turns of wire on a large frame, with a tuning capacitor to resonate it to the resonance frequency (13.56 MHz). The other loop is called a coupling loop (primary), and it is formed with less than two or three turns of coil. This loop is placed in a very close proximity to the main loop, usually (but not necessarily) on the inside edge and not more than a couple of centimeters away from the main loop. The purpose of this loop is to couple signals induced from the main loop to the reader (or vice versa) at more reasonable matching impedance. The coupling (primary) loop provides an impedance match to the input/output impedance of the reader. The coil is connected to the input/output signal driver in the reader electronics. The main loop (secondary) must be tuned to resonate at the resonance frequency and is not physically connected to the reader electronics. The coupling loop is usually unturned, but in some designs, a tuning capacitor C2 is placed in series with the coupling loop. Because there are far fewer turns on the coupling loop than the main loop, its inductance is considerably smaller. As a result, the capacitance to resonate is usually much larger.
Figure 2.2.7(**)
2.2.4 Resonance circuits, Quality factor Q and Band widthIn RFID applications, the antenna coil is an element of resonant circuit and the read range of the device is greatly affected by the performance of the resonant circuit. Figure 2.2.7 show typical examples of resonant circuits formed by an antenna coil and a tuning capacitor. The resonance frequency (fo) of the circuit is determined by:
Equation 9
26

Where:
L = inductance of antenna coil C = tuning capacitance
The resonant circuit can be formed either series or parallel. The series resonant circuit has minimum impedance at the resonance frequency. As a result, maximum current is available in the circuit. This series resonant circuit is typically used for the reader antenna. On the other hand, the parallel resonant circuit has maximum impedance at the resonance frequency. It offers minimum current and maximum voltage at the resonance frequency. This parallel resonant circuit is used for the tag antenna.
Figure 2.2.8 shows a simple parallel resonant circuit. The total impedance of the circuit is given by:
Z(jw)= jwL/ [(1- w2 LC) +j(wL/R)] Equation 10
Where:
w = angular frequency = 2*pi*f R = load resistor
The ohmic resistance r of the coil is ignored. The maximum impedance occurs when the denominator in the above equation minimized such as:
w2LC = 1 Equation 11
This is called a resonance condition and the resonance frequency is given by:
Equation 12
By applying Equation 11 into Equation 10, the impedance at the resonance frequency becomes:
Z = R Equation 13
Figure 2.2.8(**)
27
The R and C in the parallel resonant circuit determine the bandwidth, B, of the circuit.
B = 1/ 2RC Equation 14The quality factor, Q, is defined by various ways such as:
Q = Energy Stored in the System per One Cycle/ Energy Dissipated in the System per One Cycle
Q = fo/B Equation 15
Where:
fo = resonant frequency B = bandwidth
By applying Equation 12 and Equation 14 into Equation 15, the loaded Q in the parallel resonant circuit is:
Q = R Equation 16
The Q in parallel resonant circuit is directly proportional to the load resistor R and also to the square root of the ratio of capacitance and inductance in the circuit. When this parallel resonant circuit is used for the tag antenna circuit, the voltage drop across the circuit can be obtained by combining Equations 16 and ( Vo = 2foNQSBocos)
Vo = 2*pi*foNQSBo * cos a Equation 17
=2*pi*foN[ R( C/ L)1/2]SBo* cos a
The above equation indicates that the induced voltage in the tag coil is inversely proportional to the square root of the coil inductance, but proportional to the number of turns and surface area of the coil. The parallel resonant circuit can be used in the transformer loop antenna for a long-range reader as discussed in "Reader Antenna Coil" (Figure 2.2.7). The voltage in the secondary loop is proportional to the turn ratio (n2/n1) of the transformer loop. However, this high voltage signal can corrupt the receiving signals. For this reason, a separate antenna is needed for receiving the signal. This receiving antenna circuit should be tuned to the modulating signal of the tag and detuned to the carrier signal frequency for maximum read range.
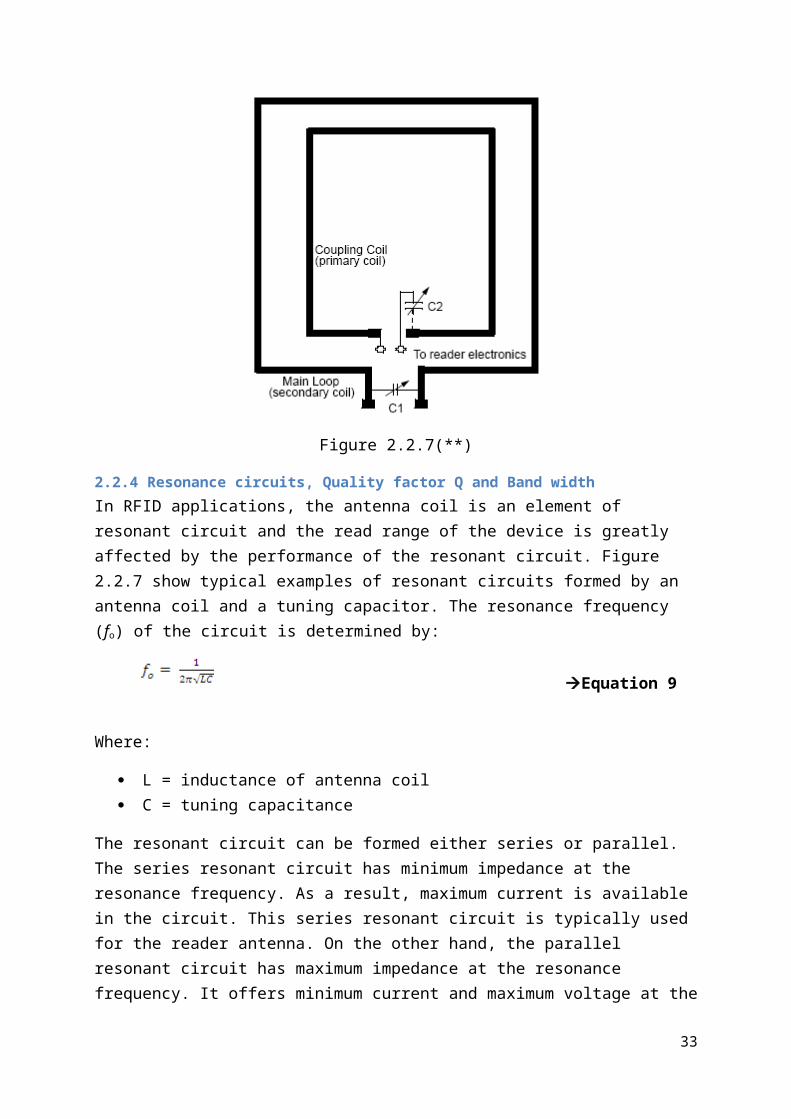
2.2.5 Antenna SymmetryThe symmetry in antenna design is absolutely necessary with respect to tuning and EMC behavior.
28

Figure 2.2.9
The following drawing show and example of a symmetric 4-turn antenna design
Figure 2.2.10
2.2.6 Field Strength and effects of PlanesThe benefit of a ferrite is to shield an antenna against the influence of metal. A metal plane could be part of the housing of the NFC device or a ground plane of the NFC device PCB itself, which has to be connected very near to the antenna. If metal is placed very near to antenna the alternating magnetic field generates eddy currents in the metal. These eddy currents absorbed power, and lead to detuning of the antenna due to a decreased inductance and quality factor. Therefore, for operation of an antenna in close metallic environment, it is necessary to shield the antenna with ferrite.
The following examples should give an impression on the influence of ferrite for the distribution of a magnetic field.
29

Example:
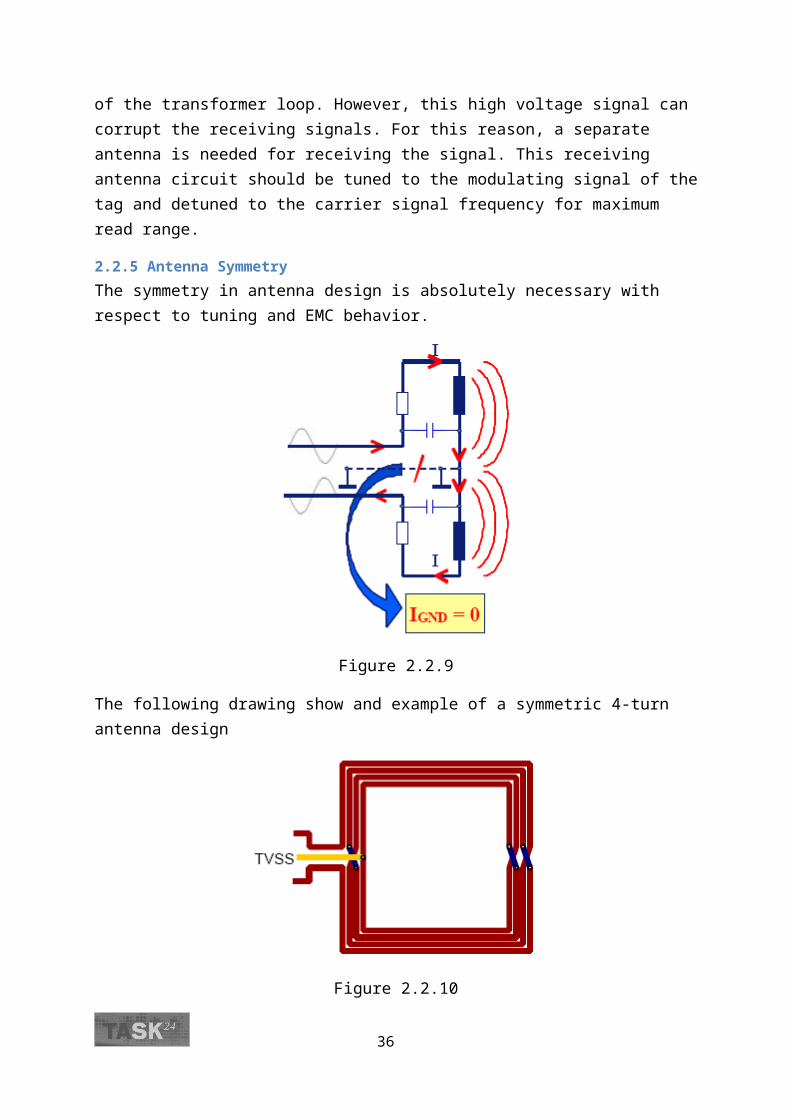
For easy simulation a circular antenna has been used in every case. A circular antenna is rotation symmetric to the x-axis. Therefore the simulation can be reduced to a two dimensional mathematical problem. The simulation shows on the one hand the field distribution of a non-distributed antenna. Common for all examples: Radius of the antenna 7.5 cm, 1 turn, wire width 1mm copper.
Figure 2.2.11 shows the 2D field of the circular antenna. The right part shows the field distribution. The highest field strength is generated in the area of the coil.The left part shows the magnitude of the field strength H over a distance d. The line of a minimal field strength of Hmin = 1.5 A/m is marked.
Figure 2.2.11
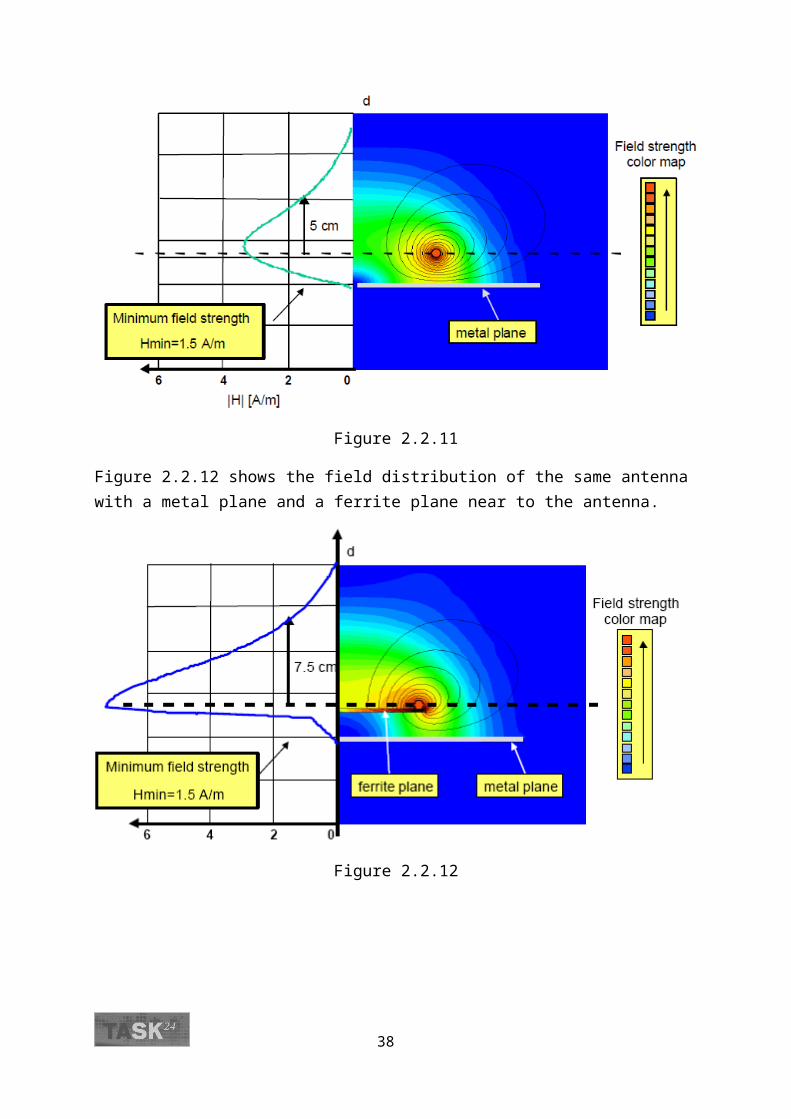
Figure 2.2.12 shows the field distribution of the same antenna with a metal plane and a ferrite plane near to the antenna.
30
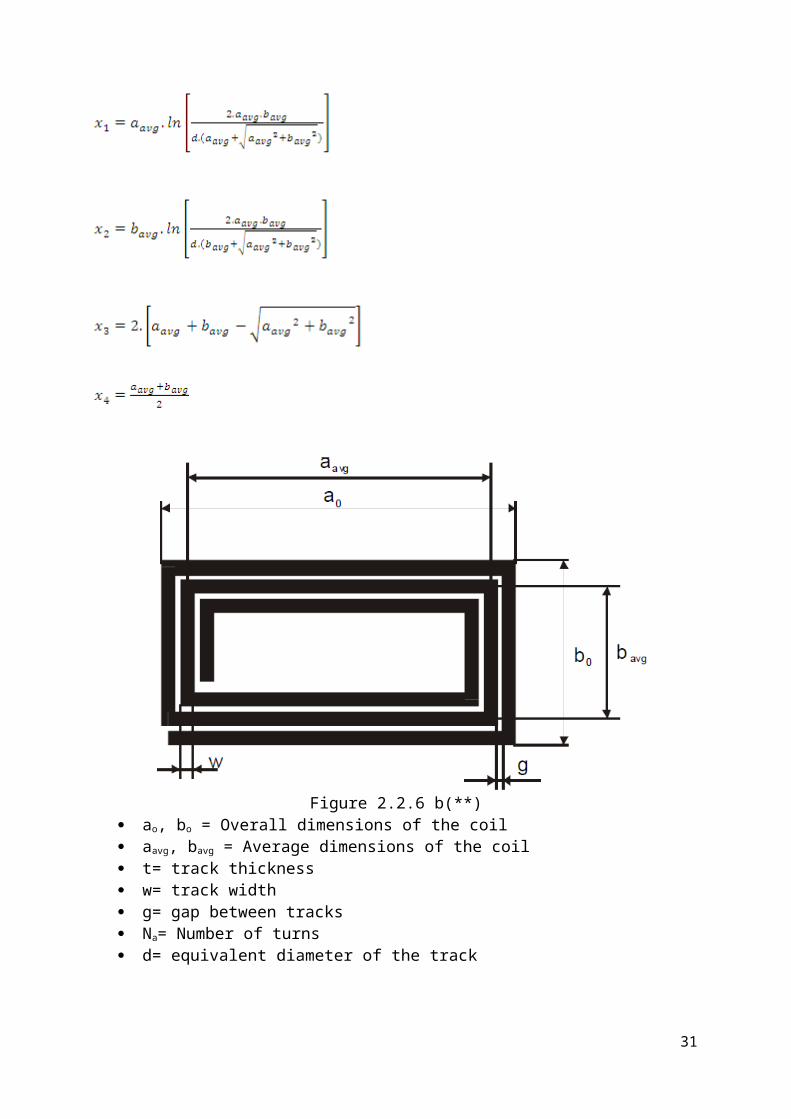
Figure 2.2.12
31
2.3 Antenna Matching Antennas are matched for maximum power transfer from the transmitter to the antenna. Most of the antennas are matched on 50 ohms and 75 ohms. In our exercise we pursued 50 ohms matching.
The first question arising to one’s mind is that why do we need antenna to be matched. The answer is simple if an antenna is matched to 50 ohms it means the total impedance of antenna resonating circuit and matching circuitry is 50 ohms, this is just a standard one can have different impedance for matching but the impedance is chosen in such a manner that the impedance of the whole transmitter equals the impedance of antenna circuitry, so that half of the power from source is dissipated in the transmitter circuit and half of it is dissipated in antenna circuit. This is the only way to supply maximum energy to antenna. In this way we can achieve VSWR=1 and reflection coefficient to be zero.
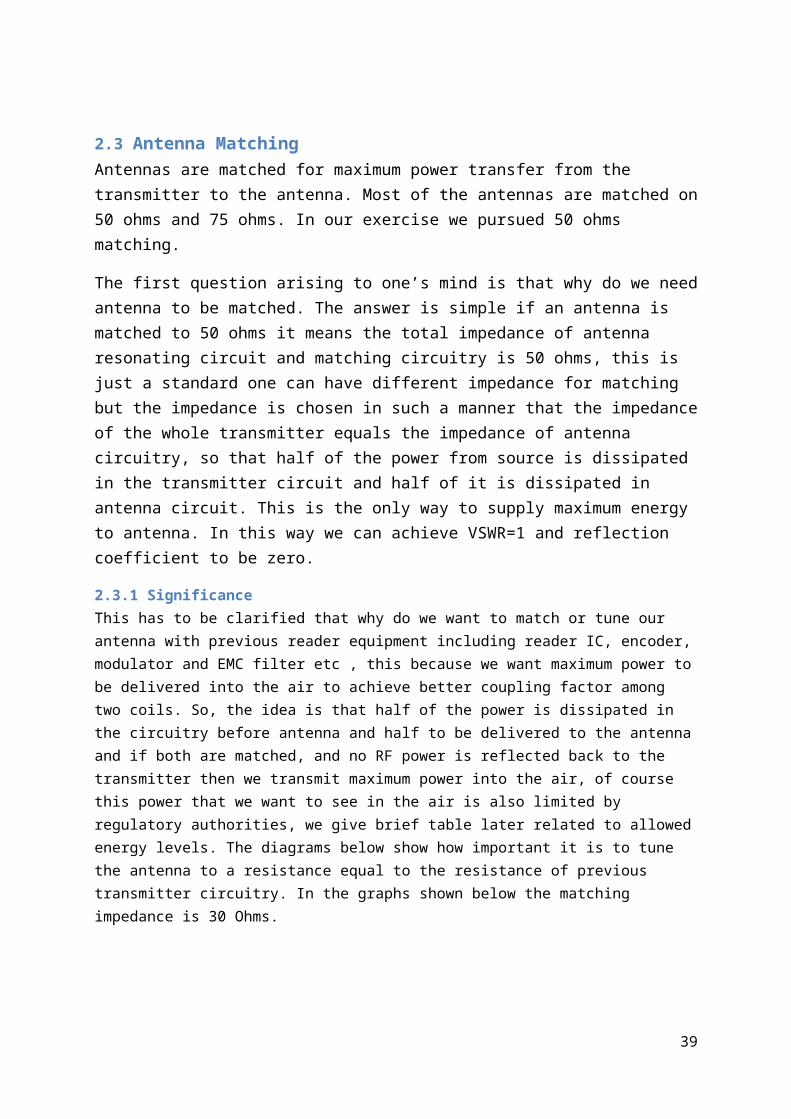
2.3.1 SignificanceThis has to be clarified that why do we want to match or tune our antenna with previous reader equipment including reader IC, encoder, modulator and EMC filter etc , this because we want maximum power to be delivered into the air to achieve better coupling factor among two coils. So, the idea is that half of the power is dissipated in the circuitry before antenna and half to be delivered to the antenna and if both are matched, and no RF power is reflected back to the transmitter then we transmit maximum power into the air, of course this power that we want to see in the air is also limited by regulatory authorities, we give brief table later related to allowed energy levels. The diagrams below show how important it is to tune the antenna to a resistance equal to the resistance of previous transmitter circuitry. In the graphs shown below the matching impedance is 30 Ohms.
32
The Current Vis-à-vis Matching ResistanceThe following figure 2.3.1(**) shows three curves at different voltages.
Figure 2.3.1(**)
The Power Vis-à-vis Matching Resistance
Figure 2.3.2(**)
33

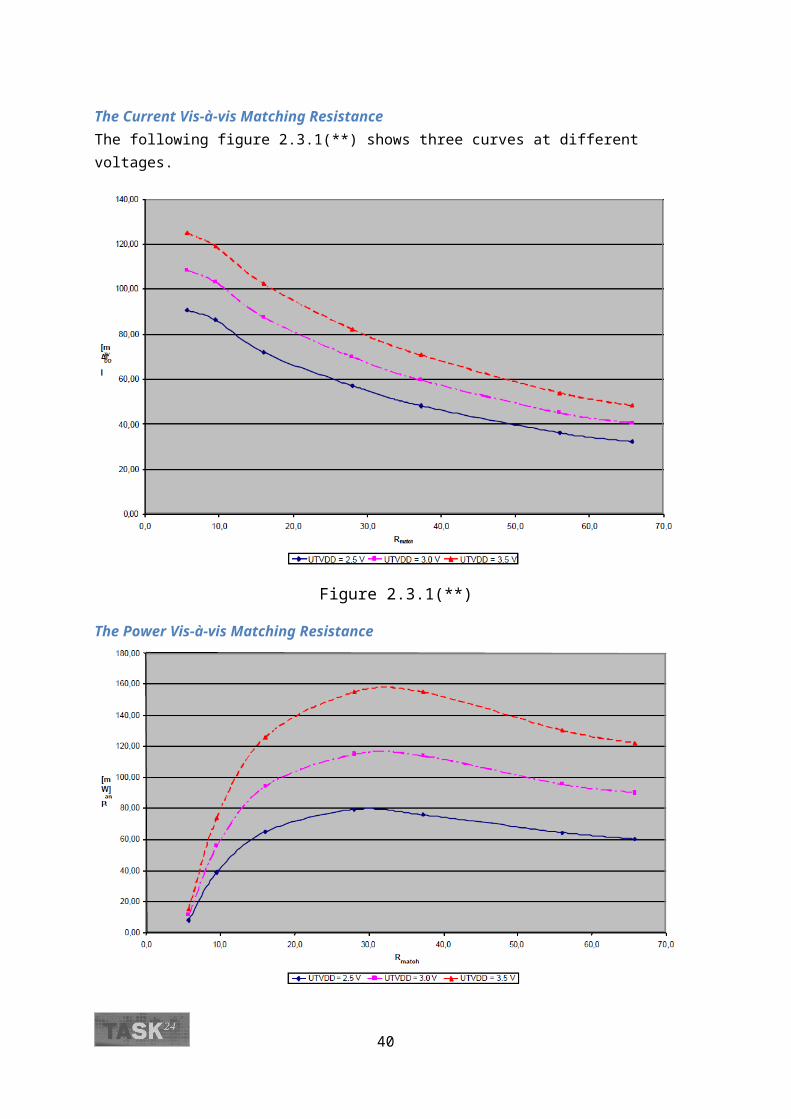
The Power Added Efficiency Vis-à-vis Matching Resistance and Collective Analysis
Figure 2.3.3(**)
We can clearly ponder in the figure above that power added efficiency is the greatest with minimum power applied to antenna at 30 ohms.
2.3.2 How to Match
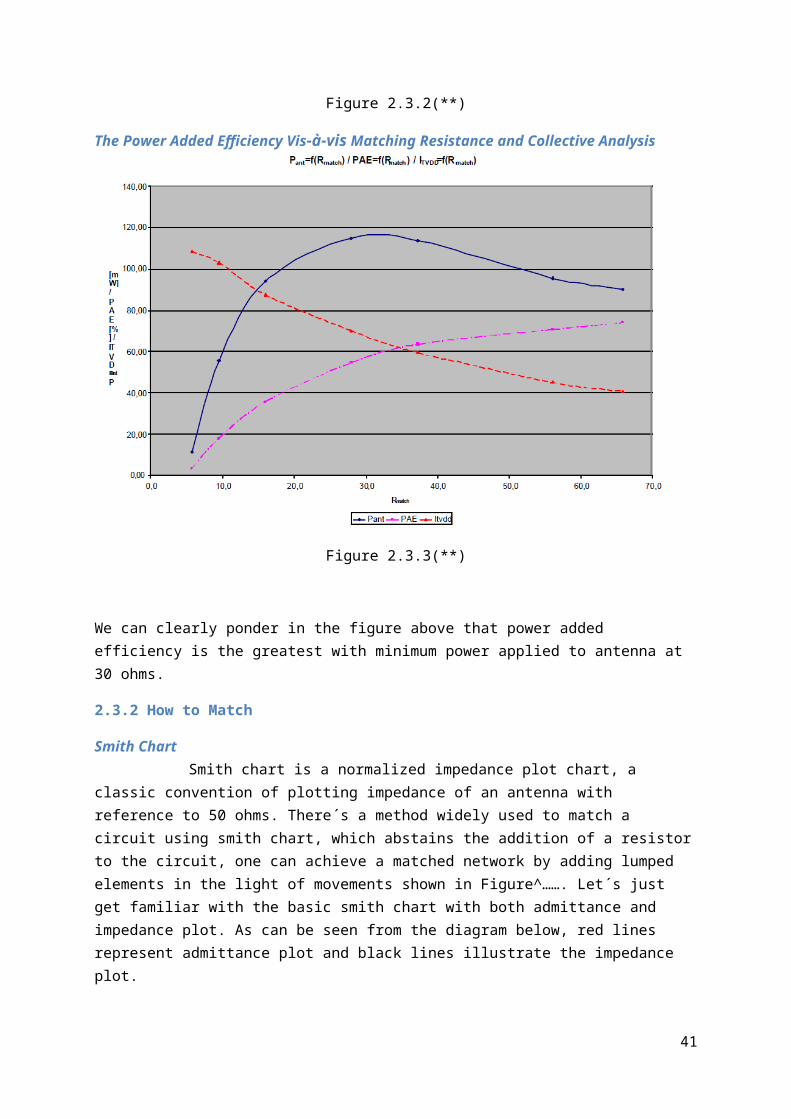
Smith ChartSmith chart is a normalized impedance plot chart, a classic convention of plotting
impedance of an antenna with reference to 50 ohms. There´s a method widely used to match a circuit using smith chart, which abstains the addition of a resistor to the circuit, one can achieve a matched network by adding lumped elements in the light of movements shown in Figure^……. Let´s just get familiar with the basic smith chart with both admittance and impedance plot. As can be seen from the diagram below, red lines represent admittance plot and black lines illustrate the impedance plot.
34

Figure 2.3.4(**)
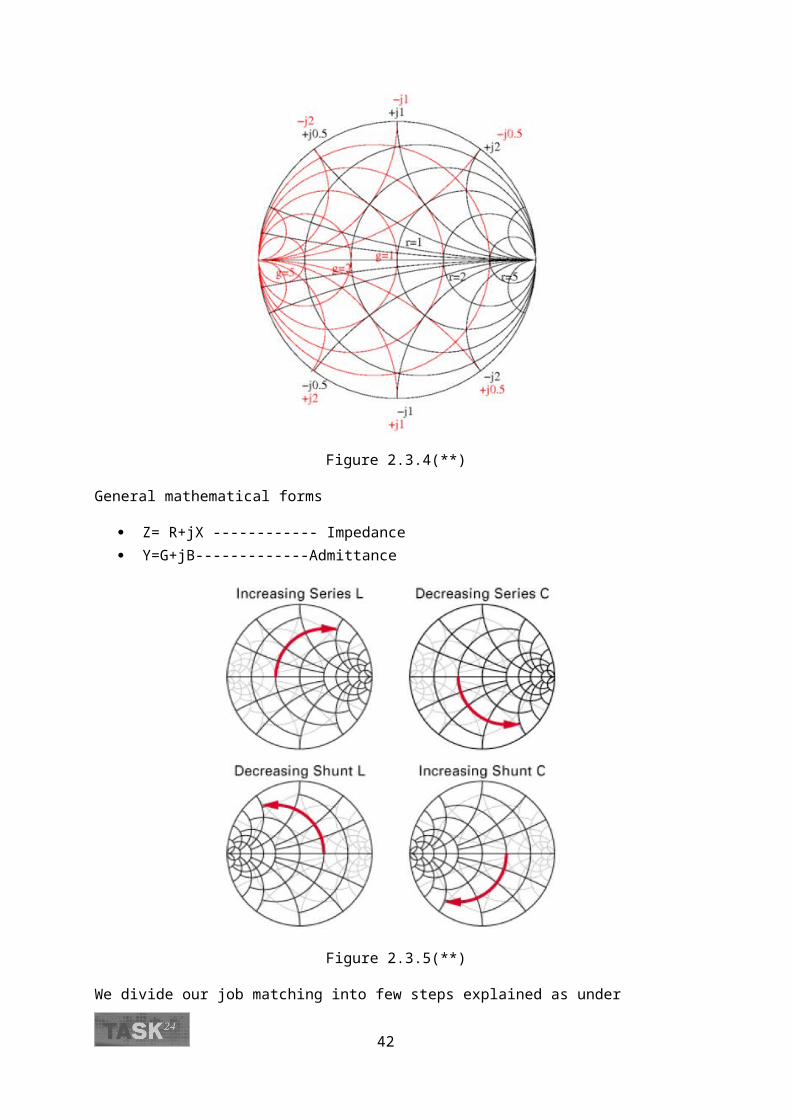
General mathematical forms
Z= R+jX ------------ Impedance Y=G+jB-------------Admittance
Figure 2.3.5(**)
We divide our job matching into few steps explained as under
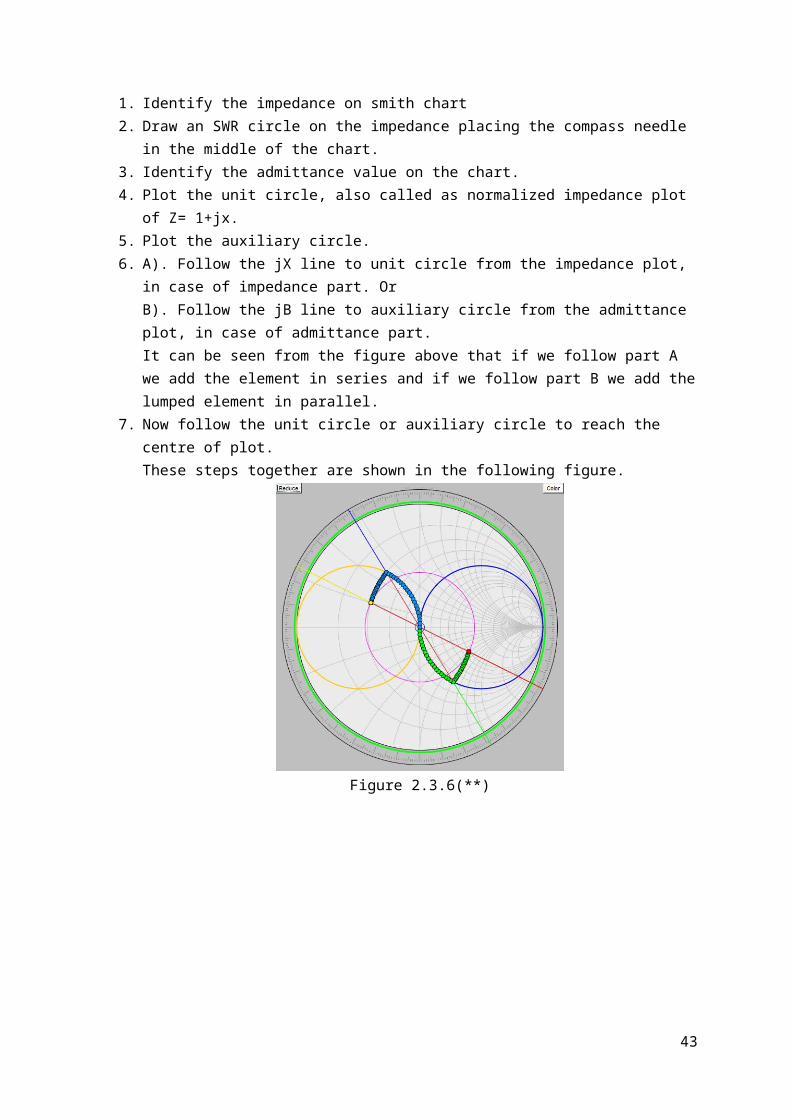
1. Identify the impedance on smith chart
35
2. Draw an SWR circle on the impedance placing the compass needle in the middle of the chart.3. Identify the admittance value on the chart.4. Plot the unit circle, also called as normalized impedance plot of Z= 1+jx.5. Plot the auxiliary circle.6. A). Follow the jX line to unit circle from the impedance plot, in case of impedance part. Or
B). Follow the jB line to auxiliary circle from the admittance plot, in case of admittance part.It can be seen from the figure above that if we follow part A we add the element in series and if we follow part B we add the lumped element in parallel.
7. Now follow the unit circle or auxiliary circle to reach the centre of plot.These steps together are shown in the following figure.
Figure 2.3.6(**)
36

2.4 Bee BehaviorIn this type of detections where the animal has to carry the tag with it, we need take the behavior of the animal to our account.
2.4.1 Bees and Magnetic FieldsOrientation and Navigation of Bees may be disturbed by man-made electric, magnetic and electromagnetic fields. The conclusions of the research of other scientists and of my own research result in the following statement:
1. The integuments of bees (and bird feathers) have semi conductive and piezoelectric functions.
2. This means they act as a transducer of pulse modulated high frequency microwave fields into an audio frequency range. Certain parts of the structure of the integument function as dielectric receptors of electromagnetic radiation in the microwave region.
3. The presence of magnetite nano particles has been demonstrated in the abdomen of bees. Magnetite is an excellent absorber of microwave radiation at frequencies between 0.5 and 10.0 GHz through the process of ferromagnetic resonance. Pulsed microwave energy absorbed by this process is first transduced into acoustic vibrations (magneto acoustic effect).
4. It has been demonstrated that free-flying honeybees are able to detect static intensity fluctuations and ultra low frequency magnetic fields as weak as 26 nT against the background earth-strength magnetic field.
5. Magnetic field bursts at a frequency of 250 Hz oriented parallel to the field lines of the Earth’s magnetic field induce unequivocal jumps of misdirection of up to +10°.
6. The magnetic induction levels in today’s environment range usually between 1 nT and 170,000 nT in the low frequency range and between several nT and several 1000 nT in the high frequency range. Hence, these levels are commonly higher than the threshold of sensibility of bees to variations of magnetic fields.
7. In the honeybee, the NO-system in the antenna lobes is implicated in chemosensory processing and in memory formation. Disturbance of the NO-system through electromagnetic fields with low and high frequency is proved today only in mammals, but it is expected to work in the same manner also in insects. In this case, olfactory function and the memory of bees are fading.
On balance, the consequence of all these investigations is that the orientation and navigation of bees may be disturbed by man-made technical communication fields.
37
2.4.2 Bee and Bee Hive Honeybees are able to carry up to 70 mg After when the wooden slab is placed in the entrance, the total height to enter
remains to be 8mm. Bees Height 5mm So detection range is 3mm excluding the thickness of tag. The width of entrance is around 40 cm.
Figure 2.4.1(**)
2.5 SystemSkimming the research of Mr. Roodt, it was found that Microsensys a German company is the only company offering solutions through RFID for bee tracking worldwide. The equipment they offer is not applicable, which was quite understood between them and us while we communicated about the solution. According to Mr. Sylvo Jeager Marketing Manager of the company, it was possible to detect the pico Mic 3 Tag from iID Maja Reader or iID Mini Pen reader, but a new system was required to be launched in May 2009 which would give an applicable and complete solution. We were able to convince them that we are seriously following the problem and we need their help. Upon a sponsor letter to Mr. Jeager, the company replied us with good news of handing us over the prototype of their upcoming product for a technical feedback and maybe some help on it. This product was a direct solution of bee detection.
Things could not go as smoothly as planned for, and we took the tag from microsensys and decided to make a reader antenna that fit our problem and use an efficient reader from the market to derive our own designed antennas.
The tag and the readers we searched out and found to be relevant to the situation are shown below. Some of the specifications are mentioned here, while for the rest one should refer to the annex and references.
38
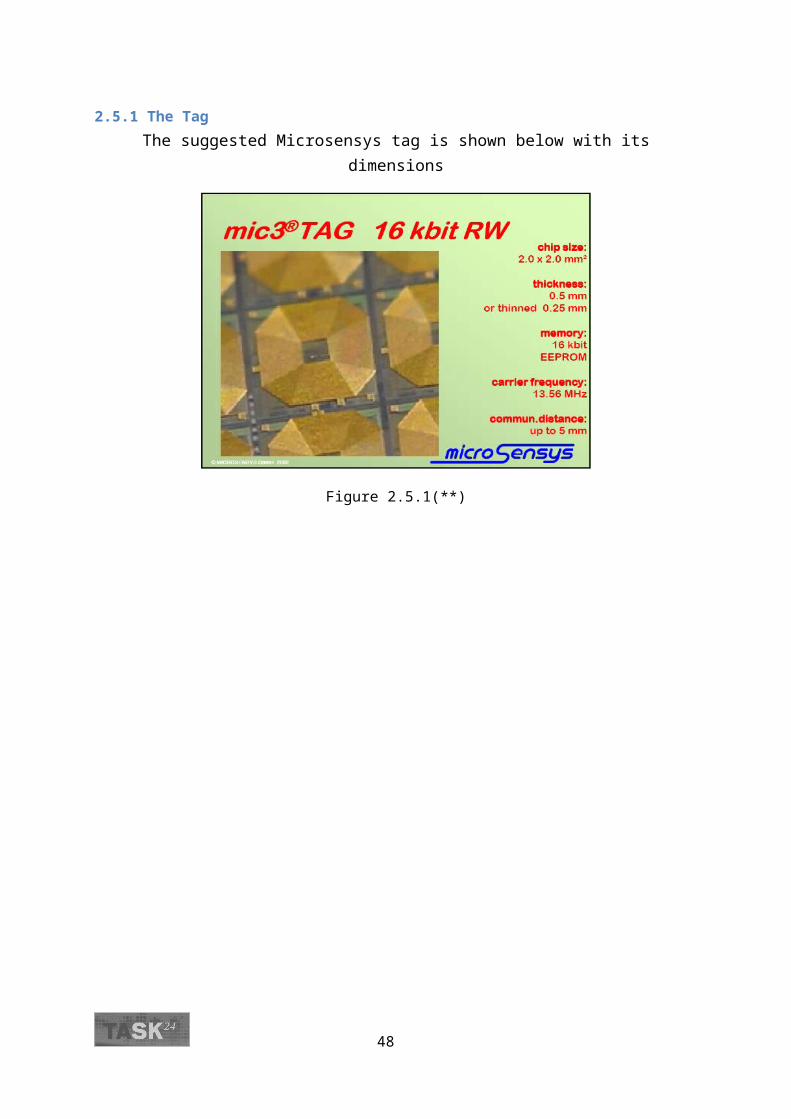
2.5.1 The TagThe suggested Microsensys tag is shown below with its dimensions
Figure 2.5.1(**)
39
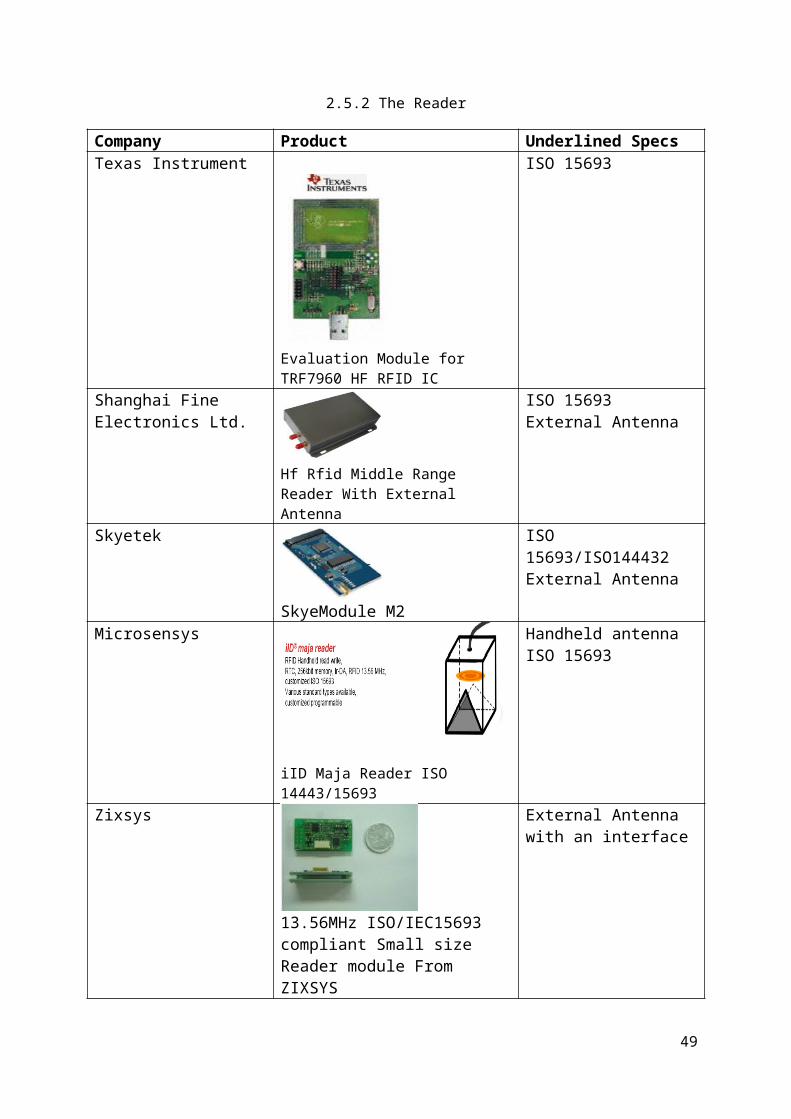
2.5.2 The Reader
Company Product Underlined SpecsTexas Instrument
Evaluation Module for TRF7960 HF RFID IC
ISO 15693
Shanghai Fine Electronics Ltd.
Hf Rfid Middle Range Reader With External Antenna
ISO 15693External Antenna
Skyetek
SkyeModule M2
ISO 15693/ISO144432External Antenna
Microsensys
iID Maja Reader ISO 14443/15693
Handheld antennaISO 15693
Zixsys
13.56MHz ISO/IEC15693 compliant Small size Reader module From ZIXSYS
External Antenna with an interface
Microsensys ISO 15693USB 2.0 Interface
40
iID Mini Pen / USB Interface
HF transponder transmission levels, calculated
Most of the calculated average transponder levels in the HF range are - 30 … -33 dBμA/m @ d=10m or lower. The CISPR 16 signal weighting will reduce the measured level by about 10 dB.
Tag Frequency Carrier fc
Frequency message signal
H (allowed field strength) dBμA/m
ISO-14443, proximity 13.56 MHz fc ± 846 KHz -41 dBμA/m
ISO-15693, vicinity 13.56 MHz fc ± 423/484 KHz -36 dBμA/m
ISO-18000-3 13.56 MHz Similar to the below listed 13.56 MHz systems
I-code (Philips) 13.56 MHz fc ± 423 KHz -36 dBμA/m
Tag-It (TIRIS) 13.56 MHz fc ± 423/484 KHz -36 dBμA/m
Microchip 13.56 MHz fc ± 70 KHz -24 dBμA/m
Gemplus 13.56 MHzfc ± 106 KHzfc ± 212 KHz -27 dBμA/m
-30 dBμA/m
Legic 13.56 MHz fc ± 212 KHz -33 dBμA/m
ISO 15693 (ISO SC17/WG8) - vicinity cardsPower supply
13.56 MHz inductive coupling,0,15 .. 7,5 A/m
Downlink (data transmission reader > card) Modulation:10% ASK, 100% ASK (card supports both)Bit coding:“1 out of 256”, “1 out of 4” (card supports both)Baud rate:1.65 kBit/s, 26.48 kBit/s (card supports both)
Uplink (data transmission card > reader)Modulation:Load modulation with subcarrierBit coding:Manchester, the subcarrier is ASK (423 kHz) or FSK (423/485 kHz) modulated
41
Baud rate:6.62 kBit/s, 26.48 kBit/s (selected by reader)
42
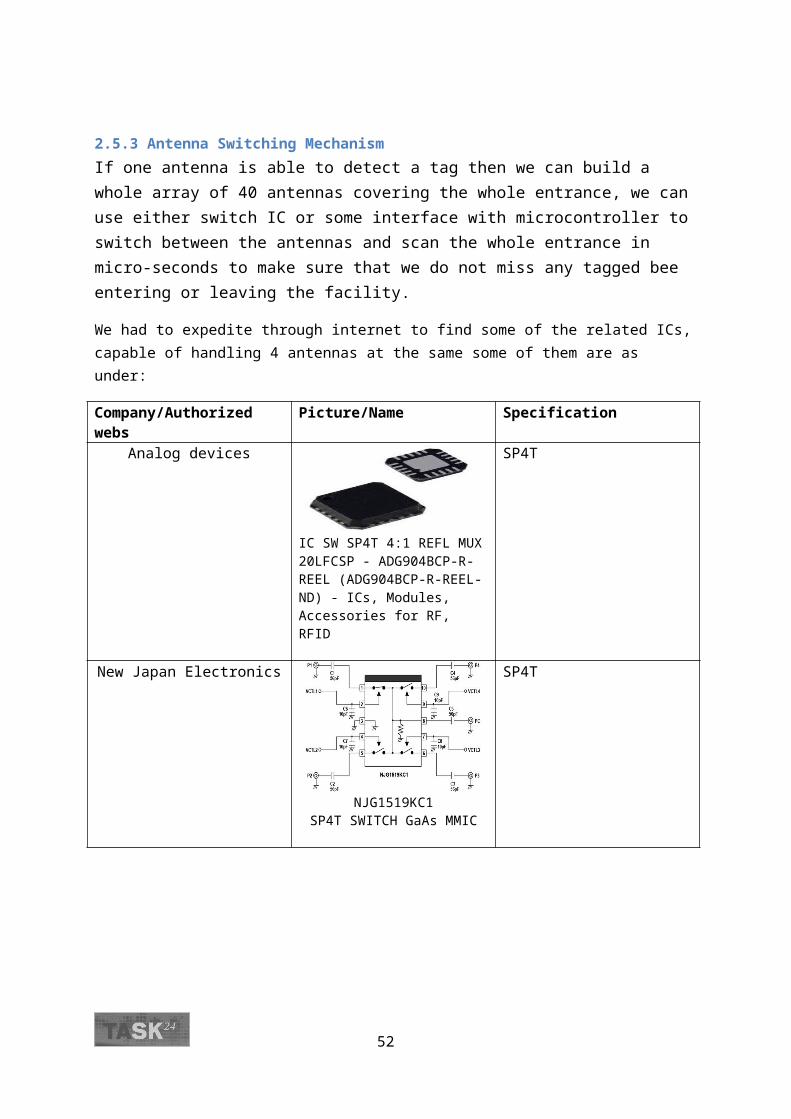
2.5.3 Antenna Switching MechanismIf one antenna is able to detect a tag then we can build a whole array of 40 antennas covering the whole entrance, we can use either switch IC or some interface with microcontroller to switch between the antennas and scan the whole entrance in micro-seconds to make sure that we do not miss any tagged bee entering or leaving the facility.
We had to expedite through internet to find some of the related ICs, capable of handling 4 antennas at the same some of them are as under:
Company/Authorized webs Picture/Name SpecificationAnalog devices
IC SW SP4T 4:1 REFL MUX 20LFCSP - ADG904BCP-R-REEL (ADG904BCP-R-REEL-ND) - ICs, Modules, Accessories for RF, RFID
SP4T
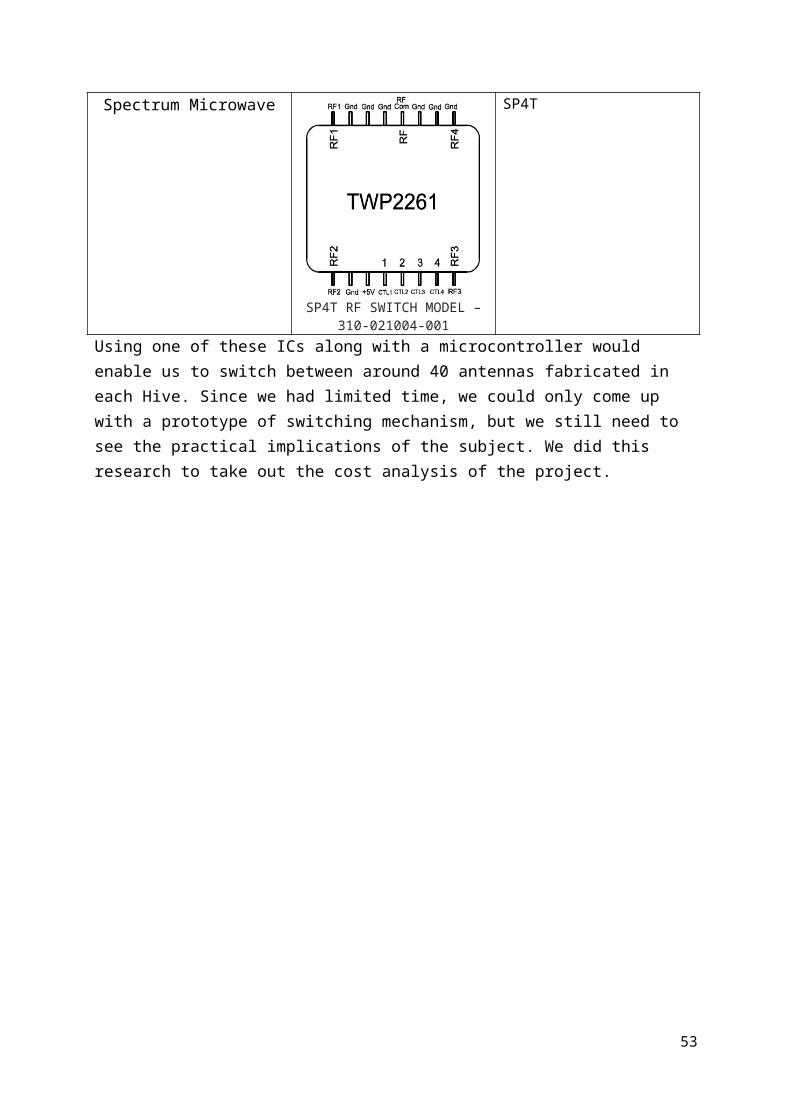
New Japan Electronics
NJG1519KC1SP4T SWITCH GaAs MMIC
SP4T
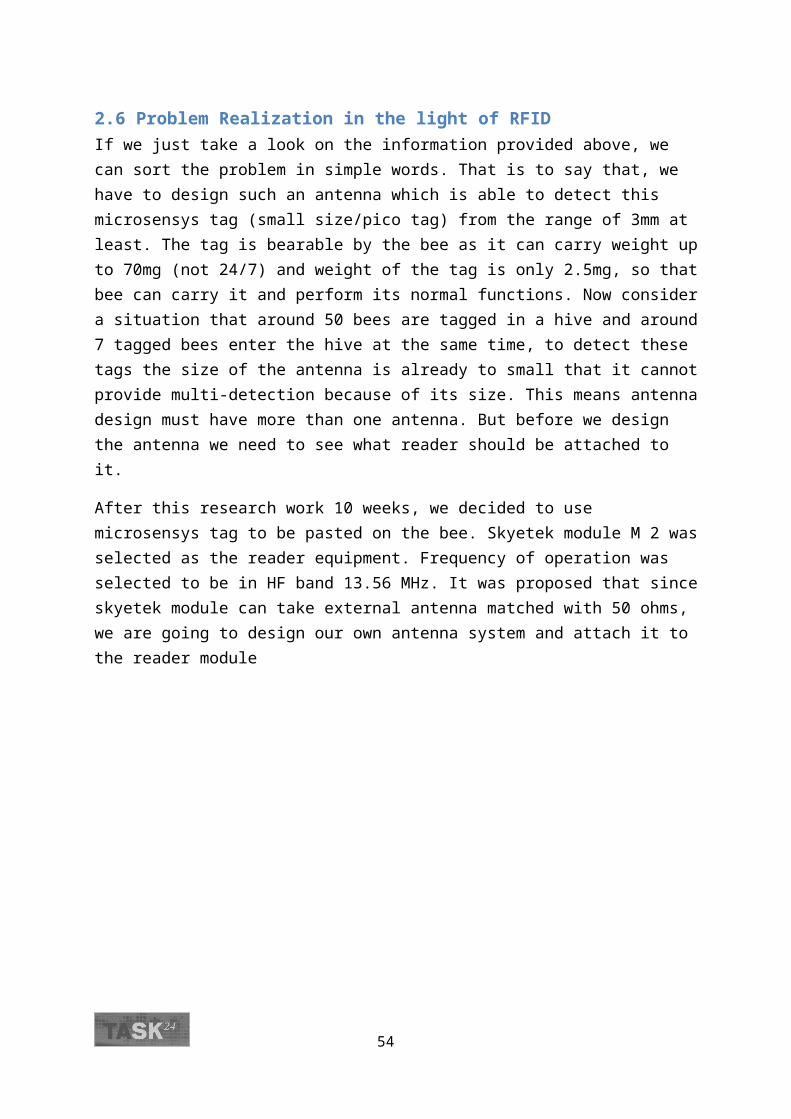
Spectrum Microwave
SP4T RF SWITCH MODEL – 310-021004-001
SP4T
Using one of these ICs along with a microcontroller would enable us to switch between around 40 antennas fabricated in each Hive. Since we had limited time, we could only come up with a prototype of switching mechanism, but we still need to see the practical implications of the subject. We did this research to take out the cost analysis of the project.
43

2.6 Problem Realization in the light of RFIDIf we just take a look on the information provided above, we can sort the problem in simple words. That is to say that, we have to design such an antenna which is able to detect this microsensys tag (small size/pico tag) from the range of 3mm at least. The tag is bearable by the bee as it can carry weight up to 70mg (not 24/7) and weight of the tag is only 2.5mg, so that bee can carry it and perform its normal functions. Now consider a situation that around 50 bees are tagged in a hive and around 7 tagged bees enter the hive at the same time, to detect these tags the size of the antenna is already to small that it cannot provide multi-detection because of its size. This means antenna design must have more than one antenna. But before we design the antenna we need to see what reader should be attached to it.
After this research work 10 weeks, we decided to use microsensys tag to be pasted on the bee. Skyetek module M 2 was selected as the reader equipment. Frequency of operation was selected to be in HF band 13.56 MHz. It was proposed that since skyetek module can take external antenna matched with 50 ohms, we are going to design our own antenna system and attach it to the reader module
44

Implementation
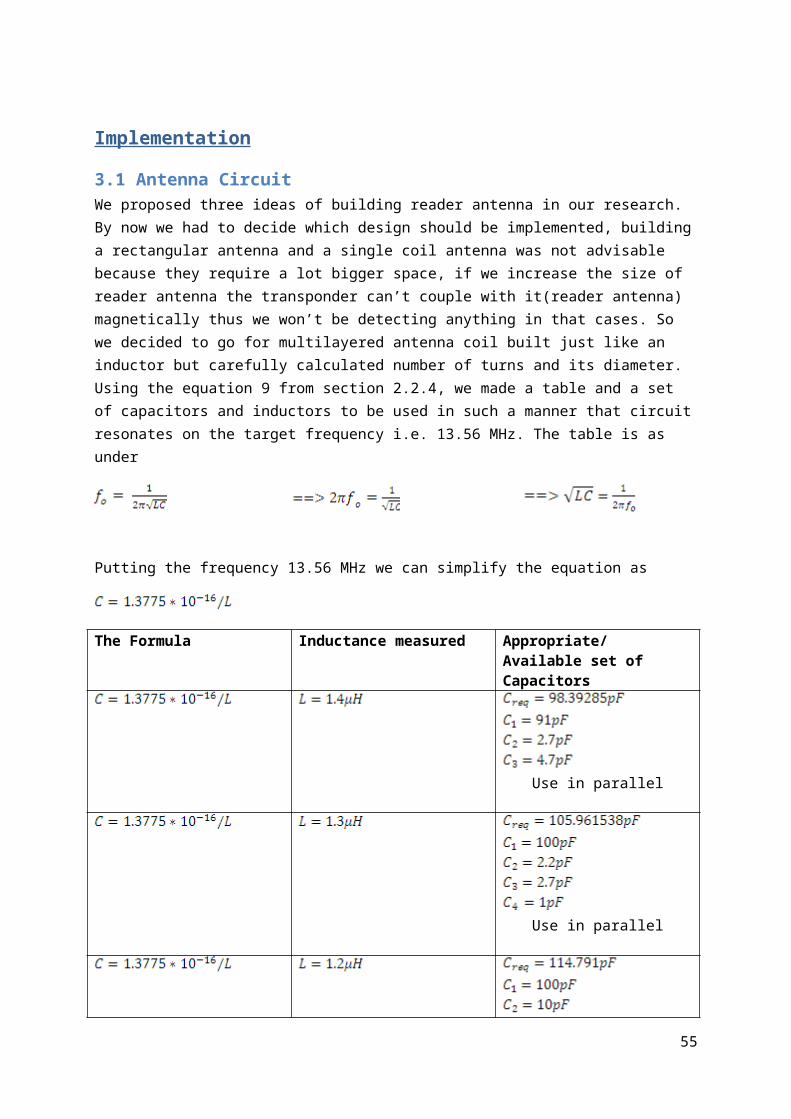
3.1 Antenna CircuitWe proposed three ideas of building reader antenna in our research. By now we had to decide which design should be implemented, building a rectangular antenna and a single coil antenna was not advisable because they require a lot bigger space, if we increase the size of reader antenna the transponder can’t couple with it(reader antenna) magnetically thus we won’t be detecting anything in that cases. So we decided to go for multilayered antenna coil built just like an inductor but carefully calculated number of turns and its diameter. Using the equation 9 from section 2.2.4, we made a table and a set of capacitors and inductors to be used in such a manner that circuit resonates on the target frequency i.e. 13.56 MHz. The table is as under
Putting the frequency 13.56 MHz we can simplify the equation as
The Formula Inductance measured Appropriate/ Available set of Capacitors
Use in parallel
Use in parallel
Use in parallel
Use in parallel
45

Use in parallel
Use in parallel
Use in parallel
3.1.1 Dimensional calculations of CoilNext step was to build and test the inductance of the antenna from LRC meter. Following formulae and calculations show how we measured and constructed the required antenna. We took a multi-row and a multi layered architecture of coil as shown below. We used a wire of AWG 18 and the diameter of the wire was calculated to be 1.0278 millimeters
Formula used:
Putting values:
Turns = 15 radius = 0.25 cm length = 1cm
46

depth = 0.01 cm
We find the inductance as:
Using these calculations above we constructed the coil and found the inductances of
different coils to fall in the region of 1 , so that we just get the idea that how
many turns in actual practice we require to fall in the target region of 13.56 MHz.
3.1.2 Configurations
It is easy to establish the fact that size and range of the antenna in our case are very small the dimensions of transponder are such small that if there are two bees passing very close through the entrance of the hive and going in opposite directions, then bigger or normal patch and micro strip antennas cannot detect their direction and may not be able to detect them simultaneously.
Consequently we decided to build the antenna in such a way that one antenna should take care of only one transponder and covers less area so that one antenna corresponds to one transponder. In this way we can detect the direction of passing transponders and can address more than one transponder at a time.
Moreover since the size and range of the antennas are really small, we decided to build an array of antennas, and a switching mechanism to activate each antenna at high frequency.
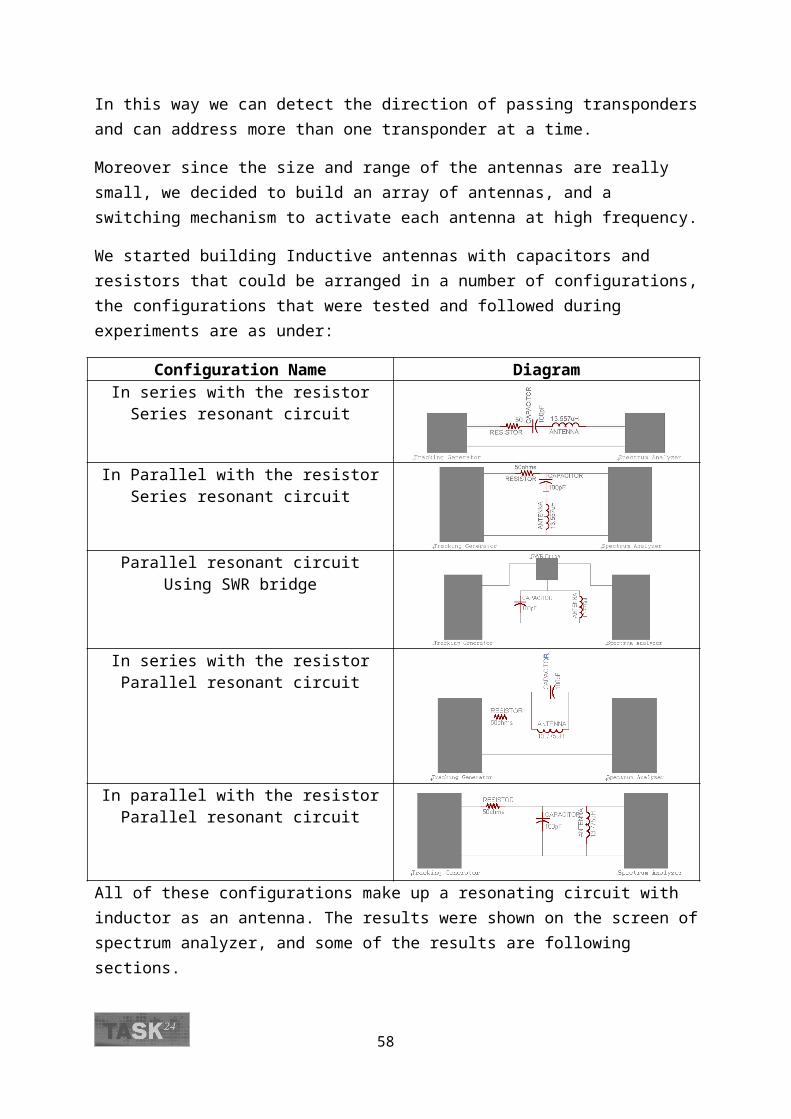
We started building Inductive antennas with capacitors and resistors that could be arranged in a number of configurations, the configurations that were tested and followed during experiments are as under:
Configuration Name DiagramIn series with the resistor
Series resonant circuit
In Parallel with the resistorSeries resonant circuit
Parallel resonant circuitUsing SWR bridge
47
In series with the resistorParallel resonant circuit
In parallel with the resistorParallel resonant circuit
All of these configurations make up a resonating circuit with inductor as an antenna. The results were shown on the screen of spectrum analyzer, and some of the results are following sections.
As we had no idea that how the antenna circuit of the Microsensys tags was made, so we had to have these configurations to find by hit and trial that what type of configuration would work with the tag.
3.1.3 MeasurementsFigure 3.1.1 Figure 3.1.2
Seen from the spectrum analyzer these circuits gave us some useful responses, we had made an antenna resonating on frequencies that are nearby the required frequency of 13.56 MHz. Figure to the left shows a paralell reonant circuit and to the right demonstrates a series resonant circuit.
Next problem was to bring these antennas to precisely to 13.56 MHz to get the best magnetic coupling of the antenna and tags brought in proximity. It is not possible to change your capacitance as we didn’t have the variable capacitors available, we could only change the inductance of the coil to increase or decrease the resonant frequency. As the frequency of resonance is inversely proportional to the inductance, we observed that increasing the number of turns on the coil would increase the inductance and thus would decrease the resonance frequency and vice-versa.
If we develop a relationship of these circuits with our previous RFID knowledge we can say, if we use series circuit the data is carried by current and detected through current change
48
while if the same components are in parallel the data is detected through voltage changes. In these practices total 8 circuits were built resonating at frequencies near 13.56 MHz.
Now the question arises, that where exactly should this dip lie, the first answer that comes to our minds is 13.56 MHz both the tag and reader antennas should be resonating at this frequency, but practically the dip should come a little before the resonating frequency, in such a manner that 13.56 MHz falls at the start of second half of dip.
The reason behind this strange claim is that when the tag is brought close to the reader antenna, due to mutual inductance the inductance of the reader antenna increases. And we know that increasing the inductance would cause the dip to shift left. If we want to bring an optimum change in voltage (in case of parallel circuit), then we can’t place the resonant frequency (13.56 MHz) to the left of the dip. We have to place the target frequency slightly to the right of the dip to get maximum change of voltage. Maximum change in voltage means maximum sensitivity of the antenna. The microsensys tag is very small it won’t be able to cause huge factor of magnetic coupling thus we need a better Q factor from the antenna as well.
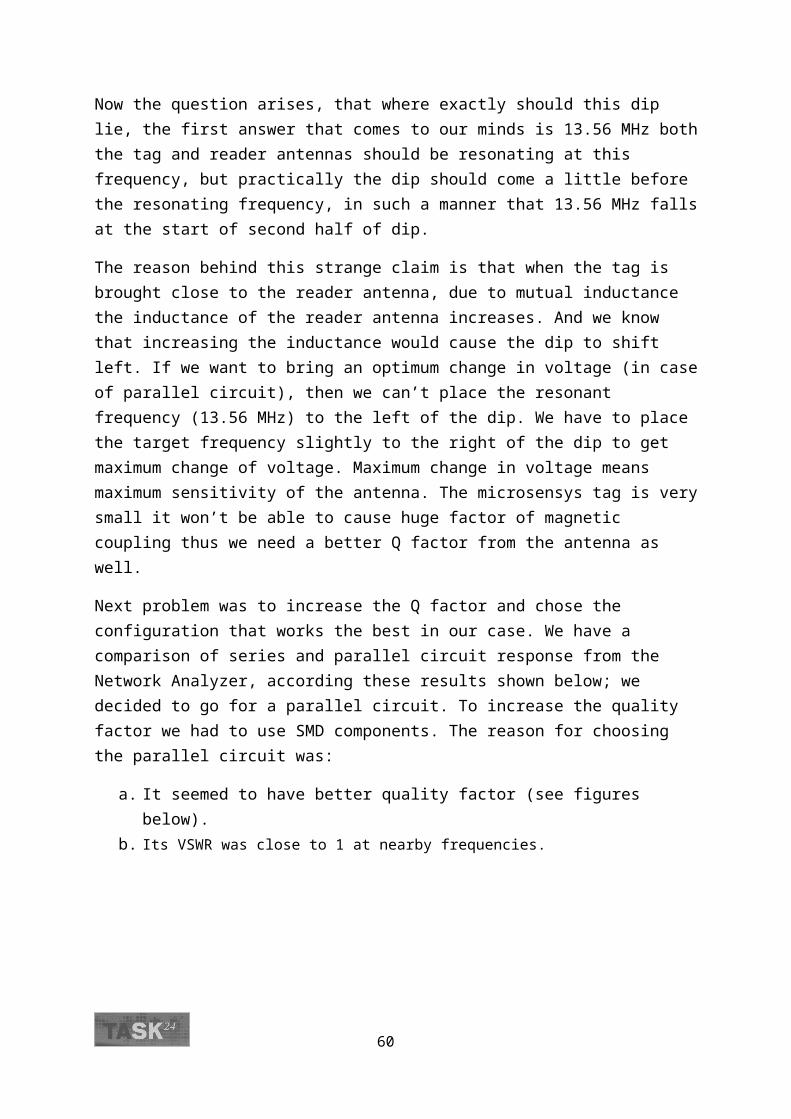
Next problem was to increase the Q factor and chose the configuration that works the best in our case. We have a comparison of series and parallel circuit response from the Network Analyzer, according these results shown below; we decided to go for a parallel circuit. To increase the quality factor we had to use SMD components. The reason for choosing the parallel circuit was:
a. It seemed to have better quality factor (see figures below).b. Its VSWR was close to 1 at nearby frequencies.c. Mostly RFID circuits are implemented in this manner.
Figure 3.1.3 Figure 3.1.4
The figure to left shows two circuits, one in series (yellow) and one in parallel (blue). The figure at the right hand side shows both of these circuits when brought to close to each other. We can clearly examine that the circuit with parallel configuration gives better(higher) quality factor.
49

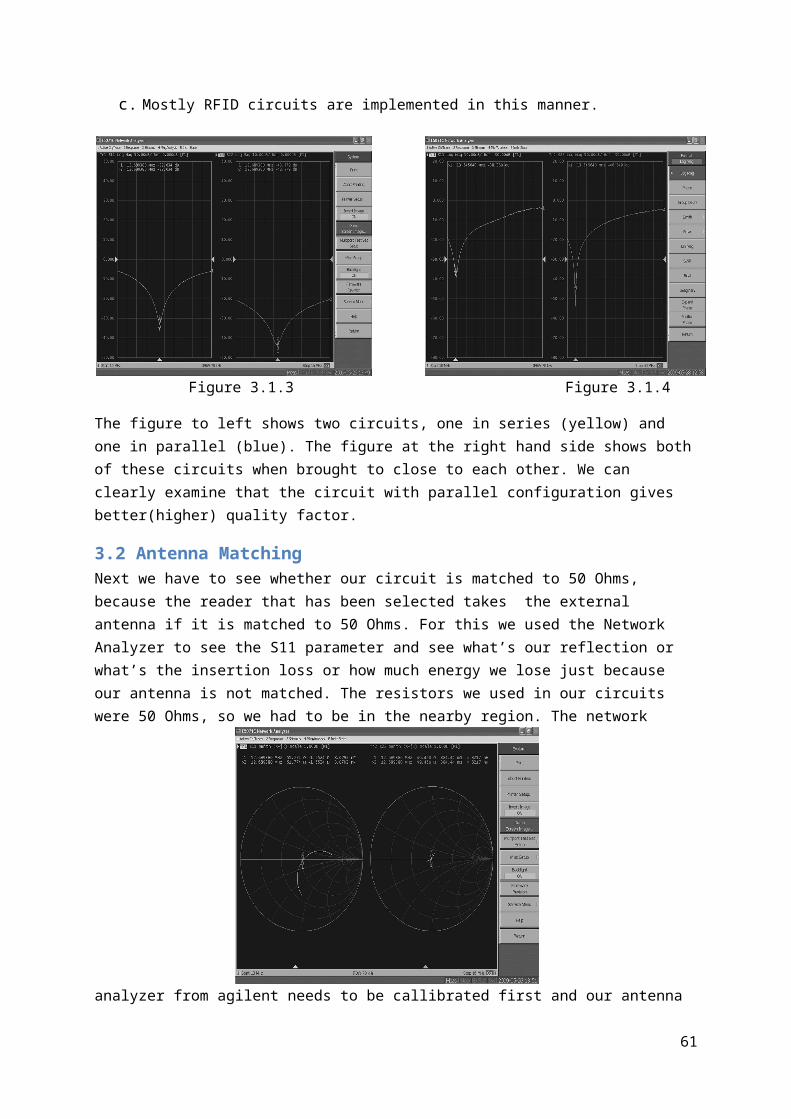
3.2 Antenna MatchingNext we have to see whether our circuit is matched to 50 Ohms, because the reader that has been selected takes the external antenna if it is matched to 50 Ohms. For this we used the Network Analyzer to see the S11 parameter and see what’s our reflection or what’s the insertion loss or how much energy we lose just because our antenna is not matched. The resistors we used in our circuits were 50 Ohms, so we had to be in the nearby region. The network analyzer from agilent needs to be callibrated first and our antenna required the machine to be callibrated to 50 ohms. We can see these expected results in the following measurements.
Figure 3.2.1
The response was over whelming, we fell close to the required impedance. But it wasn’t exactly up to the mark of 50 Ohms, we can observe the impedance to be ZL = 51.774 – j1.5524.
We have explained the method of matching in the research section 2.3. The impedance that has to be plotted in the first step of matching as explained in sub-section 2.3.2 is ZL found here in the measurement above. Using the smith chart and exactly following the steps we can match the circuit we had from the configurations we followed above.
A reader might have following questions
What changes does matching cause as far as circuitry is concerned? What is a solution and results from the smith-chart? Number of solutions offered? What selects among those solutions?
We have to add an inductor in series and a capacitor in parallel. The value of capacitor and inductor can be known from the distance (in λ) travelled to reach the centre of the smith chart.
As told above in the theory research (section 2.3), we have to reach the centre of the smith chart. And we have two solutions to reach the centre. The distance travelled on the chart is measured in terms of λ. A semi circular travel is 0.5λ.
50
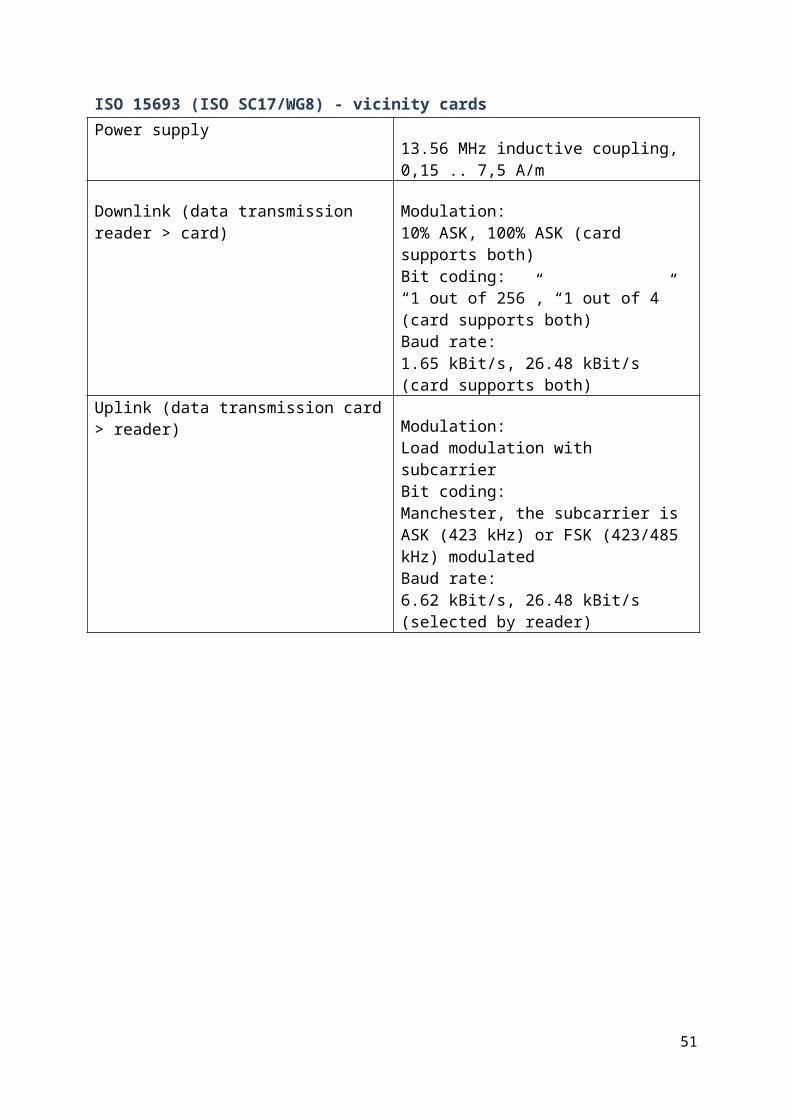
Figure 3.2.2
The values of C1 and L2 are calculated from the amount of distance that was travelled on the imaginary curve to cut the unit circle, and then from there to the centre of the graph gives the value of L2.
Along with that we need to know the reflection coefficient at the place where the current reaches antenna itself.
ZL = 51.774 – j1.5524 Zo = 50 Ohms
So,
And As VSWR = 1 + IrLI/1 - IrLI Thus ,VSWR = 1.047
We have to get rid of this reflection coefficient, it is already too low but to completely put it to zero we need to move from the point of admittance on the smith chart to the auxiliary, and from there we can follow the auxiliary circle to the centre of the smith chart.
51
3.3 Testing with ReaderIt was about time that we would have had the reader equipment to connect these circuits above for testing. On 28th May we received the reader equipment, next day we switched the external antenna to ENA, this external antenna was accompanying the reader equipment. Comparison of the antenna made by skyetech and the antennas are show below
Figure 3.3.1 shows, the external antenna from skyetek to the left and the antenna to the right is the one made in Fontys.
Figure 3.3.1
-2.6103db at 13.5456 MHzIIIII-43.198db at 13.5456 MHz
When a Tag :- I-code SL1,SL2 1K-bit was brought close to the antennas we saw these results.
Figure 3.3.2
When our antenna was tested with skyetek reader, it was able to detect almost all common RFID tags available in the market including these
52
Mifare-1k DAC Mifare Desfire I-Code SL1, SL2 (1k-bits)
In the similar fashion, we tested every tag with both of the antennas first on the network analyzer to see whether the tag causes any change to antennas’ log-magnitude response. Then the antenna was attached to the skyetek reader to see the tag detection on the PC. The reader equipment has an interface for PC USB or Serial port, and software with the name skyware needs to be installed on the corresponding machine.
We have measurements results we saw with microsensys tag
Figure 3.3.3 Figure 3.3.4
It should be noted here that the external antenna from skyetek was unable to show any response to the microsensys tag and the antenna we built in the lab detects the tag on the Network Analyzer’s log-magnitude graphical view but it doesn’t detect if used with skyetek reader.
3.3.1 ResultsFinally after testing and making all possible changes to circuit that could be make in the terms of attaching SMD components and decreasing the size of the antenna, we can say that if it is not really impossible to track the animal through RFID, then it is really difficult. One has to put more time and resources to make it possible. Microsensys are solving the same problem on a commercial scale; they should have had a feasibility to put finances into this project. The design they have proposed for reader antenna resembles our antenna design, in terms of using multiple RFID small sized antenna.
53
3.4 ObservationsAntenna
In the wireless world, antennas are used to transmit radio frequency energy from location A to location B in the most efficient manner. That is they do radiate the power that is fed to them. If we were dealing with UHF RFID systems, this hypothesis would be true. However, at 13.56MHz, the picture is quite different. The wavelength in free space at 13.56 MHz is 22.12 meters.
A standard ground plane antenna has a length of one quarter of the wavelength which is 5.53 meters. It has a radiation resistance close to 50 ohms. In the world of 13.56 MHz RFID systems, we are unlikely to come close to such dimensions. And even if we do, the amount of radiated power will remain quite small. Let us consider an example. Say that we have a loop antenna and that its area is one square meter. The radiation resistance is given by:
RR =31200*[A/lambda2]2
In our case, this yields RR=130 milliohms and we probably have used 4 meters of wire to construct the loop, assuming a square shape… So, if we do not radiate energy, how do we transfer it to the tag we intend to communicate with ? The answer is magnetic coupling. Some people refer to RFID base stations as “couplers”. This terminology is certainly quite appropriate in our case. We have indeed to consider the RFID system, antenna plus tag, as a loosely coupled transformer, with the base station antenna acting as the primary of this transformer. This concept is of paramount importance for the system designer. One must always remember it. The tag AND the base station “antenna” constitute THE system, and cannot be studied separately.
The other point to remember is that if we feed five Watts to a loop RFID “antenna”, these five watts, being NOT radiated, will have to be dissipated somewhere…
Minimum bandwidth requirements from the tag point of view
In our case we have no idea about what the inductance of the tag antenna, how it is coupled with our antenna. When should the tag give best quality factor? All what we knew about the tag was that it follows ISO 15693 protocol. Through research we came to know that the this protocol has sub carrier along at 423 KHz, possibly ON/OFF keyed if we use the single sub carrier modulation at a data rate of 27 kBits/sec. To cater these side bands and, not to clip them from top more than 3db we have to keep the quality factor in the middle. If we make it too large we’ll completely lose information and if we let it go we won’t be able to sense anything (sensitvity).
54
The coupling factor (k) & the quality factor (Q)Within the given circumstances we have another thing to worry about. This was something totally unexpected, we consider that if RFID uses inductive coupling, just like a transformer, then the better these inductors are coupled the better connection we have the better data rate can be achieved and maybe better range too. But, the case is a little different this came to my attention when I saw the reader antenna from skyetek giving following responses:
Figure 3.4.1
Now when the tag is brought close to the antenna
Figure 3.4.2
The graph is expected to shift left, yes it does but along with that shift we see as the we bring them close the unexpected reverse dip goes even deeper.
55
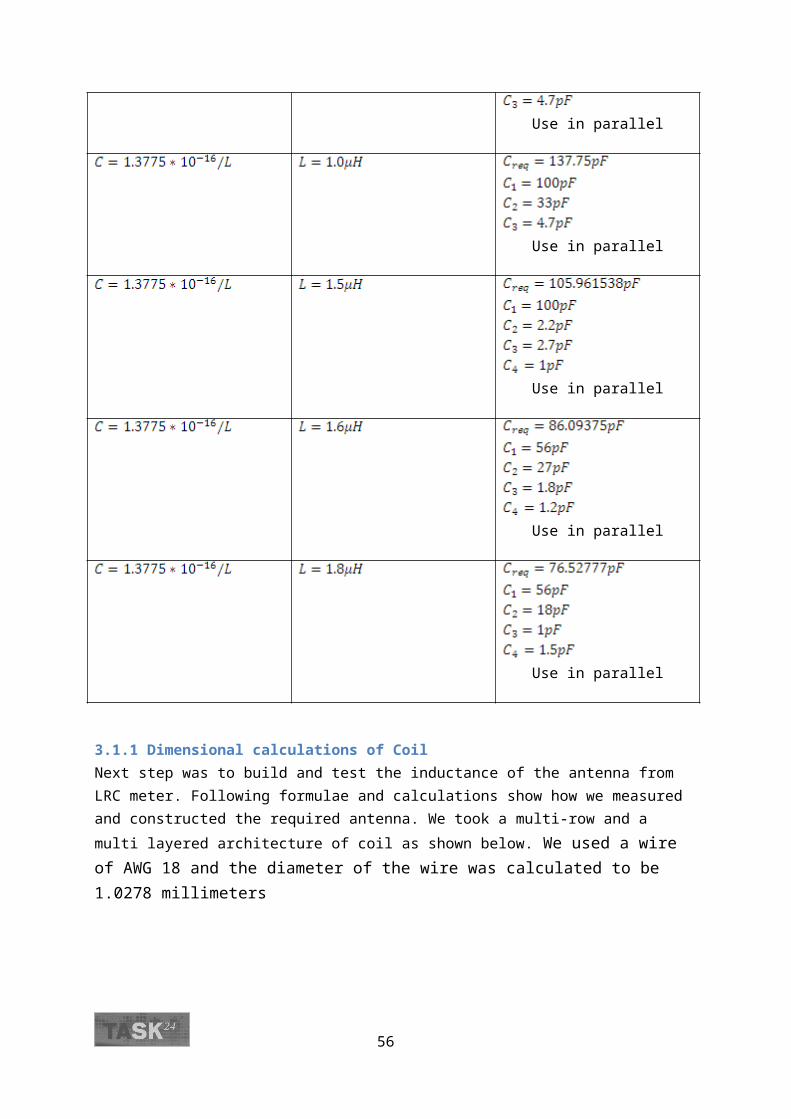
Figure 3.4.3
Yes if the coupling factor is too high then we have two resonant frequencies, to reduce this effect engineers use RF amplifiers (reader equipment) and improve the quality factor to reduce this effect but it is almost in evitable. We can also see a response from our own antennas reaching to this kind of response in figures above. But, we don’t see any kind of extra dip or even a hint of it when microsensys tag is brought to proximity. Do we have a required coupling factor with microsensys tag who knows, we have no information about its inductance to calculate using following criteria
How to calculate the coupling factor:
The nice thing is that the coupling factor depends only on geometrical parameters. The inductance values, the coils number of turns, are not involved. Let us consider the following oversimplified representation of a base station antenna coil and a tag antenna coil:
Figure 3.4.4On the left, we have the base station antenna coil, with a diameter d1=2 x r1. On the right, we have the tag antenna coil, with a diameter d2=2 x r2, tilted along the axis by an angle a. The coupling factor can be expressed as:
Of course, this equation is valid only for circular coils, but the design guidelines we are going to infer from it are valid whatever the shape. From the equation above, it is obvious that the coupling factor will be maximum when r1 = r2.
56

From more sources we came to know that geometry requirements are not the only one to be met before we calculate the coupling factor it also requires more information.
The coupling factor is determined by the distance between the inductors and their relative size. It is further determined by the shape of the coils and the angle between them. If coils are axially aligned, a displacement causes a decrease of k. Figure 6 shows this effect for an exemplary arrangement of planar coils with 30 mm diameter. It shows the measured and calculated coupling factor for parallel coils at different misalignment distances at the horizontal axis. Coupling factors in the range of 0.3 to 0.6 are typical. Note that a negative coupling factor means that the receiver captures the magnetic flux “from behind. The definition of the coupling factor is given by
Note: This coupling factor and quality factor conflict or clash, suggests clearly that we cannot consider reader or tag separately, we have to thing them as a system.
57
3.5 Cost AnalysisBefore we calculate the total cost, we have to consider following quantities as requirements per system (one system/hive).
1 U.S. dollar = 0.725320955 Euros 40 antennas per hive 10 Switching ICs per hive 1 Reader per Hive
Equipment Cost/ Unit Cost/Hive
PIC Controller 0.5 euros 0.5 euros
Skyetek Reader 850 euros 850 euros
ADG904BCP-R-REEL (RF Switch IC) 2.15 $ = 1.55 euros 21.5$ = 15.5 euors
Antenna 0.5$ = 0.362 euros 20 $ = 14.5
Total Cost/Hive 880.5 euros
58

3.6 Problem Faced and TackledAlthough at every step and every level of this project, the report explains the hurdles we faced and the solutions we chose to solve the corresponding problems, we picked the most time taking and important problems and described them as under:
a. In the start we had to select the frequency of communication. We decided to use 13.56 MHz for two main reasons. Bee is paralyzed at higher frequencies and microsensys tag is the only tag that could be attached to a bee which resonates on 13.56 MHz.
b. The LCR meter measures the inductance on 1 KHz, inductances change with frequencies. So we had to gamble with the antenna and go with 15 turns first then by repeated measurements on Network Analyzer, increasing or decreasing the turns we tuned the circuit to required frequency.
c. Initially we were required to build antenna with high quality factor, but under given equipments and the design we selected we could not achieve Q factor more than 9. While we were struggling with 2.34. So we used ferrite cores and built the circuit again and again to place components close to the ground. We could also try to reduce the skin effect but that needed Litz wires. Another way of improving quality factor we need to decrease our bandwidth, that depends on the components used and we were limited in these terms as well.
d. Calculating the impedance matching circuit from the smith chart is a tedious and lengthy process. To save time we used some applets from the internet and software for smith chart simulations.
e. Initially finding the required set of capacitors was a difficult task, we have limited set of capacitance values available in a lab. So we made the capacitance constant at 100 pF and made all the changes in inductor required for resonance.
59
ConclusionsAfter four and a half months of experience we are around the end of project time, under the given circumstances the main goals of project were not achieved. Mic3 microsensys tag was not detected by our antenna design. But it was made clear the proposed designed does work with RFID and has the capability to detect other renowned tags. There might be several hundred reasons for failure but to my sheer understanding I have following conclusions. This project doesn’t only require a telecom engineer to make it completely possible. As
far is antenna design is concerned, my antenna clearly detects the microsensys tags on Network Analyzer, so there might be some problem with reader sensitivity.
We can even say that right reader was not selected if it is unable to sense the tag. But the situation in which reader was ordered and the time that was given to work with the reader was not enough to be 3 weeks only.
Simultaneously, we cannot just put the blame on reader equipment, as I have communicated on both ends personally; I think there´s a big chance that mic 3 tag doesn´t completely follow ISO 15693 protocol.
If someone else has to continue the project, I would suggest him/her to communicate with as many companies as possible. I had to wait for a prototype of reader design which they (Microsensys) promised to hand over in May, their maja reader (from the new prototype) follows the same principle as I used for my antenna design. Microsensys response wasted too much time and kept us miss directed, as I suppose we would have arranged the same reader (Skyetek) equipment far earlier if microsensys would have given us a clear picture.
Antenna design and then testing requires at least two months for a graduation trainee student I believe, while I had to perform same duty in one month.
We cannot take reader and tag separately, together they make up the whole system, and we need to know the inductance and quality factor of tag antenna. This has been one of the biggest pull back. There was no information given on the tag other than it follows a protocol ISO 15693.
The quality factor selection, coupling factor and size of antenna are the most crucial aspect of this project, they should never be neglected.
60
RecommendationsFor students, looking to take this project forward after me, have to work in following fields The antenna size should be decreased to such an extent that size of this reader antenna should
become comparable to tag, keeping the fact in mind that the antenna should be able to have least insertion loss and could be compatible with the reader circuit in terms input power.
If reader sensitivity is improved somehow, it would greatly enhance the detection capability. Before someone else takes on to microsensys tag, he/she should have more information about
the tag, for instance the inductance of tag antenna, and how could we increase its inductive coupling with reader antenna?
They should also investigate about the protocol ISO15693, and see its power distributions in the air on different antenna designs and implement the best one.
Study RFID Antennas
61

ReferencesMost of the references are given at the spot in this report but still there is a lot of work that has been banked and helped by following search results, my research mainly comes from these web-links and books
http://news.bbc.co.uk/2/hi/science/nature/7258822.stm http://networks.silicon.com/mobile/0,39024665,39170213,00.htm http://rfid-handbook.com http://users.rcn.com/jkimball.ma.ultranet/BiologyPages/B/BeeDances.html http://www.enigmatic-consulting.com/Communications_articles/RFID/Link_budgets.html http://www.electrocom.com.au/rfid_uhf.htm http://www.fuzing.com/qrx/rfid-uhf Radio Basics for UHF RFID from the Book, The RF in RFID: Passive UHF RFID in Practice by
Daniel M. Dobkin. http://www.rfid-in-action.eu/rfid-referencemodel RFID Coil Antenna Design Microchip Melexis: 13.56 MHz RFID systems and antennas design guide
62

AppendixBelow are the links for the readers from the internet, respectively from the report.
http://nl.rs-online.com/web/search/searchBrowseAction.html? method=getProduct&R=0182278
http://nl.rs-online.com/web/search/searchBrowseAction.html? method=getProduct&R=0182206
http://fnjudy.en.busytrade.com/products/info/864488/ Hf_Rfid_Middle_Range_Reader_With_External_Antenna.html
http://www.rfidglobal.org/product/ 2007_12/15693_rfid_long_range_reader_writer_with_multiple_external_antenna.html
http://www.skyetex.com/ProductsServices/EmbeddedRFIDReaders/SkyeModuleM2/ tabid/207/Default.aspx
http://www.zixsys.com/en/products_zrw.html
Below link gives the applets demos used in the report
http://www.amanogawa.com/archive/LMatch/LMatch.html http://www.amanogawa.com/archive/transmissionA.html http://www.dxzone.com/cgi-bin/dir/jump2.cgi?ID=18635
Below links give access to RF Switch ICs from different sources
http://parts.digikey.com/1/parts/638134-ic-sw-sp4t-4-1-refl-mux-20lfcsp-adg904bcp-r- reel.html
http://www.datasheetcatalog.com/datasheets_pdf/N/J/G/1/NJG1519KC1.shtml http://www.spectrummicrowave.com/xref.asp?xn=anzac
63
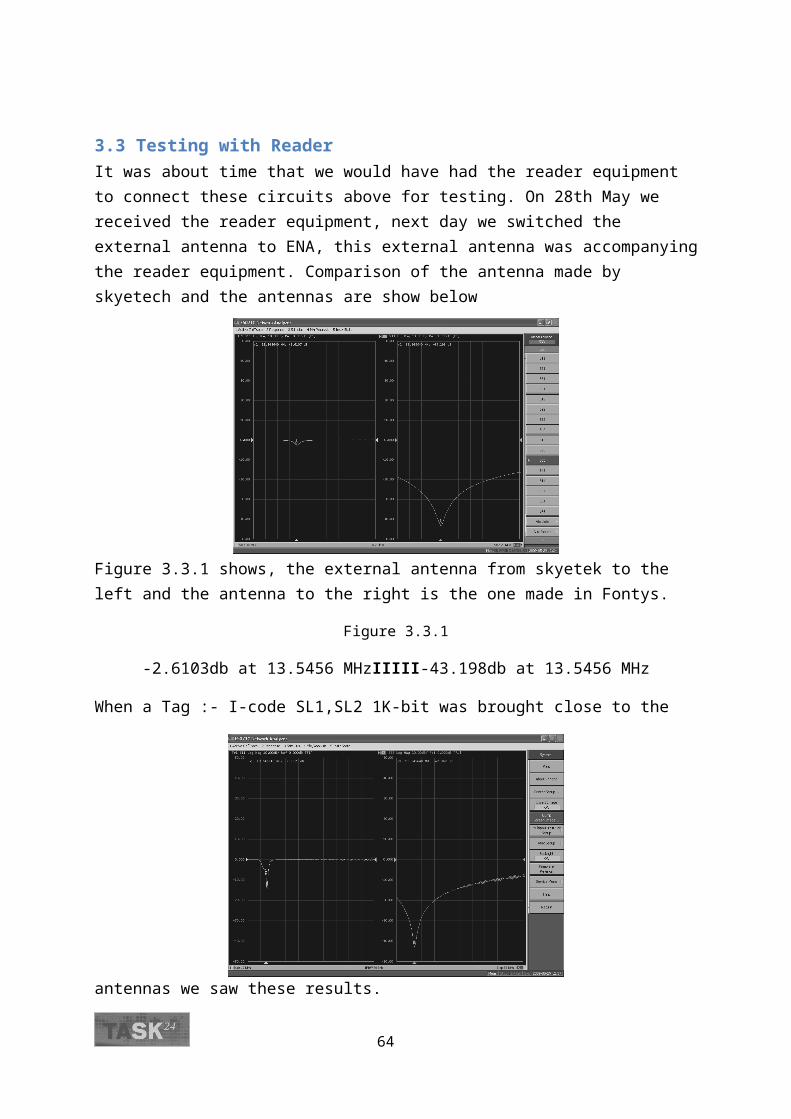
Glossary Drones : Male Bees CCD : Colony Collapse Disorder RFID : Radio Frequency Identification PLC : Programmable Logic Controller VSWR : Voltage Standing Wave Ratio HF : High Frequency, a band in radio frequencies UHF : Ultra High Frequency, a higher frequency band in radio frequency band VHF : Very High Frequency, a band of frequency in radio band RF : Radio Frequency IC : Integrated Circuit ASK : Amplitude Shift Keying PSK : Phase Shift Keying FSK : Frequency Shift Keying SMD : Surface Mount Device, a very small circuit component. SWR : Standing Wave Ratio Hive : Home for bees Acoustic : Audible Piezoelectric features : sensitive to electromagnetic waves ENA : Enhanced Network Analyzer SA : Spectrum Analyzer TG : Tracking Generator
64

Annex A-1Project BEE Tracking
Plan of Approach
Proposed plan of design and implementation of the communication system for bee tracking is created after keen ponder and analysis of the problem, plan states itself as follows:
Contents
Project Phases Background Information Formulation of objectives or definition of the problem Project Scope Scheduling Risk Analysis Drawing up a project pictorial plan
Phases
The project has been divided into following phases
1. Design and assembly of detection system.
2. Implementation of the detection system.
3. GSM based communication system design.
4. Closing report and final presentation.
Background Information
Only for the sake of background information and complete understanding of the project, the whole topic of RFID was studied during past six weeks. The research along with meeting with Mentors concluded many fruitful results. The emphasis of research lies on following agendas
1. RFID communication basic
2. RFID components.
3. RFID frequency analysis
4. RFID hardware design.
5. RFID Antenna Design.
6. RFID research papers for different fields of life
7. Bee behavior and natural traits
65
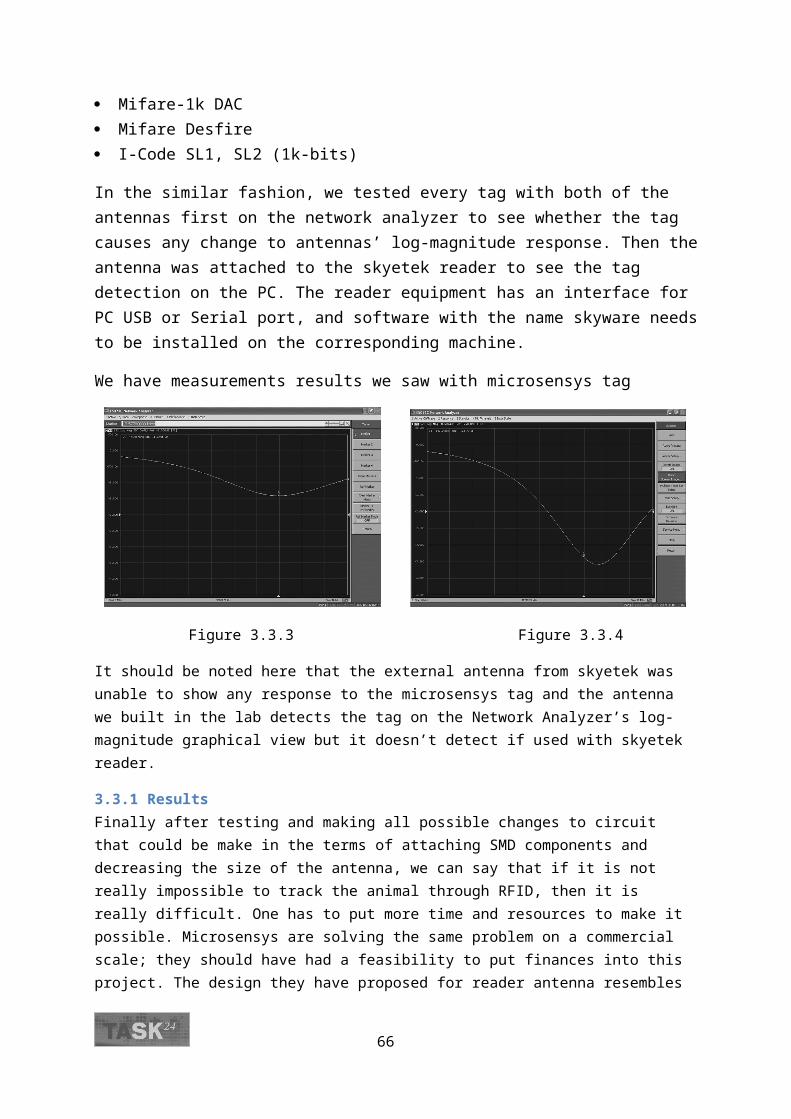
Formulation of objectives or definition of the problem
The objective is that whenever a bee enters or leaves the facility (HIVE), it is registered. The goal is to track the bees through a proposed communication system of RFID and GSM. The problem statement mainly comprises of finding out a way to tag the bees and to detect their entrance through a detection system of antenna and reader module. Moreover problem continues to emphasize on communication system that includes a GSM system which enables the data of incoming and outgoing bees to be transferred to a main server station.
Project Scope
Scope of the project stays within the circle of communication system and antenna design
Scheduling
Exactly corresponding to project phases a tentative schedule has been established as under
1. Design and assembly of detection system.
Sub phases Purpose Time spanCommunication with microsensys and J.Roodt
Protocol information, connection establishment procedures, inquire if they have a suitable reader module for us?
1 week
Reader Module Research and testing 2 weeksAntenna Design for Reader module only for detection purposes
To see if the system works before we use the system on site.
2 weeks
2. Implementation of the detection system.
Sub phases Purpose Time spanPosting tags on bees, glue analysis
To see practically if tags fulfill the physical conditions
1 week
Fabrication of Antenna in the Bee hive
To see if the proposed and designed antenna really works on bee hive
2 weeks
3. GSM based communication system design.
Sub phases Purpose Time spanStudy /Research on GSM modules
To see how do they work, to arrange data transfer from bee hive to server
2 weeks
Assembly of 4 working module along with one server to collect and process their data.
To build the final part of communication system
2 weeks
4. Closing report and final presentation.
Task Purpose Time spanReporting and Presentation To put all the work on record and
in black and white.1 week ( starting on 9th June)
66

Note: The schedule starts from 16th March 2009 and last till 9th June 2009.
Risk Analysis
Each step and each phase has its own risks and loop holes, risks can never be abolished completely but their probability can be minimized through efficient approach of solution. Corresponding to each step and phase, hunch and risk are stated as under:
Phase-1: Design and assembly of detection system.
While designing the reader for the micro-sensys tag, wee need to know what protocol does microsensys use, if the protocol is used by some other reader we can use those too, but if the microsensys have their special protocol for connection establishment then we will have to order a reader from them. Even if we find the right reader for our corresponding tag, antenna design is still a fragile process, its matching includes many attributes to make it ambiguous like electromagnetic inductance and production of eddy currents.
Phase-2: Implementation of the detection system.
Posting tags and fabricating antenna on the hive would cause great changes in the system that has already been tested for detection (and is seen working perfectly well before we use the system in bee hive), factors like metallic materials in the surroundings affect the matching and tuning a lot.
Phase-3: GSM based communication system design.
Establishment of both RFID and GSM system may be easier but here these system not only communicate independently but also that they communicate with each-other, this is one of the blind corners of project till now and needs to be looked down upon during the whole process.
67
Drawing up the project pictorial plan
NOTE: Each hive would have around 20 tagged bees initially.
68
Annex A-2Data Sheets
69
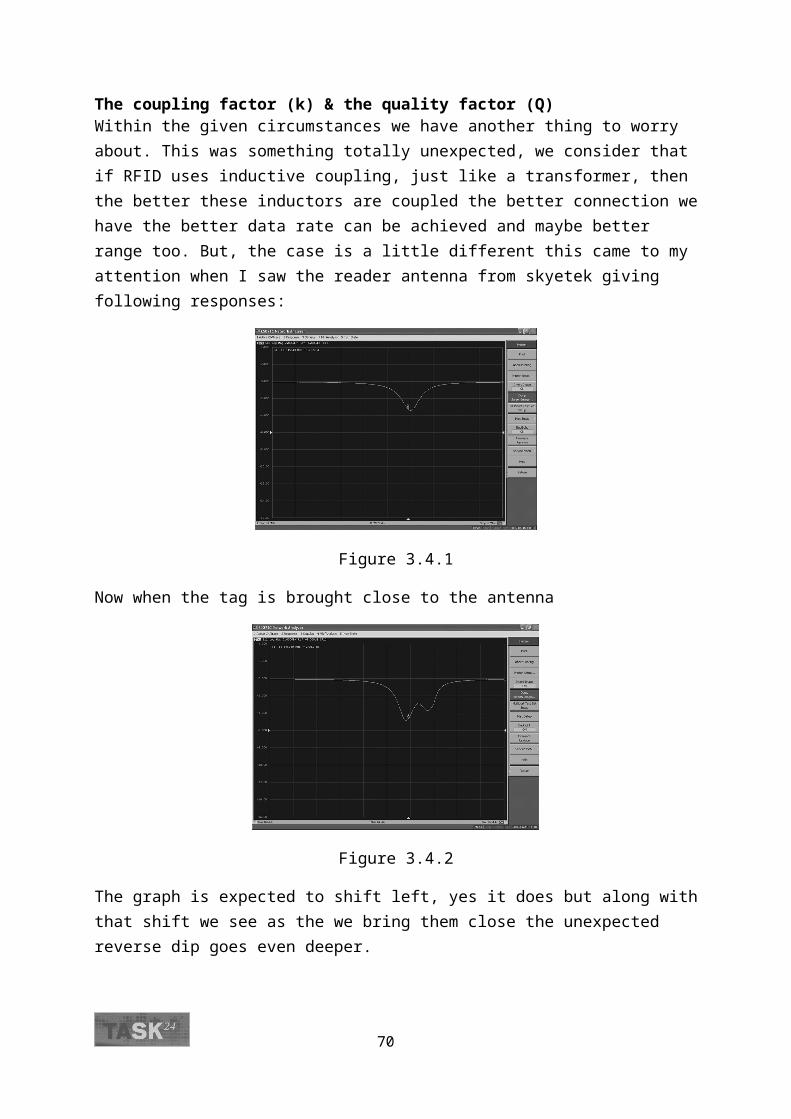
70
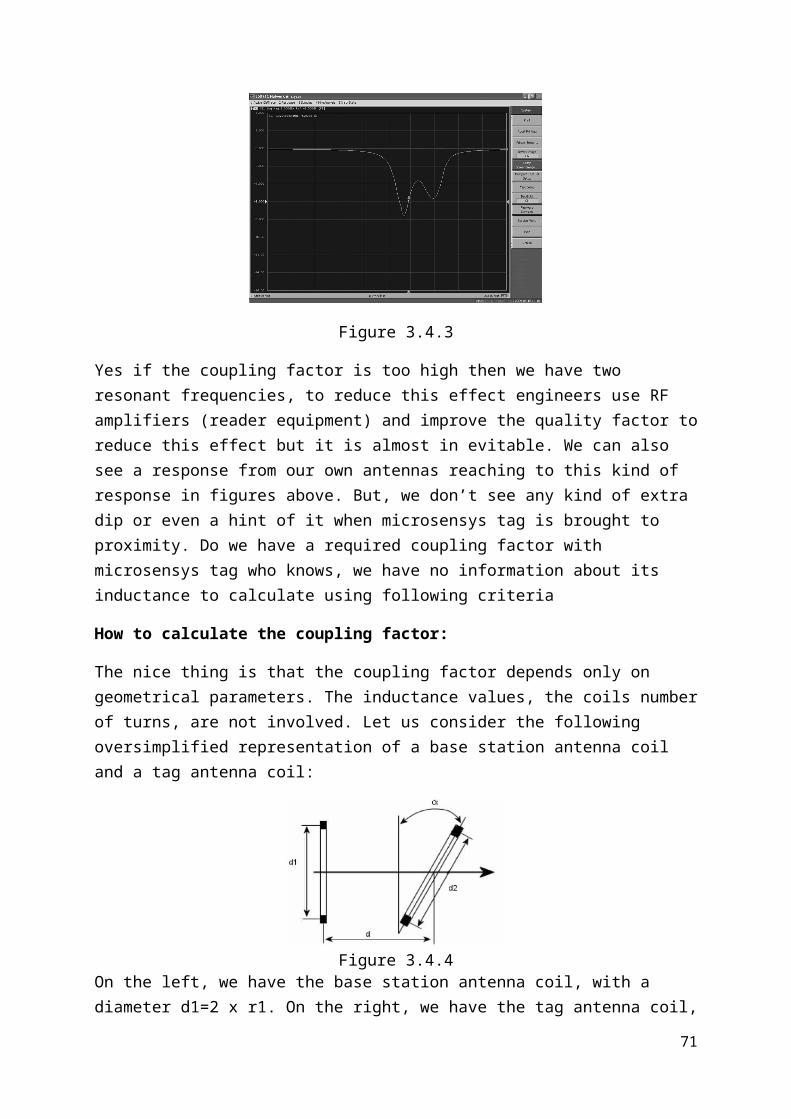
71
Related Documents