Asiamoney’s 2013 Best Domestic Equity House 11 December 2013 Disclosure: Bahana Securities does and seeks to do business with companies covered in its research reports. Investors should consider this report as only a single factor in making their investment decision. THIS RESEARCH REPORT IS NOT TO BE DISTRIBUTED TO ANY INVESTORS OR OTHER PERSONS IN THE UNITED STATES. IF ANY INVESTOR OR OTHER PERSON IN THE UNITED STATES MISTAKENLY RECEIVES OR OTHERWISE COMES INTO POSSESSION OF THIS RESEARCH REPORT, NONE OF DAIWA SECURITIES CO. LTD., PT. BAHANA SECURIITES OR ANY OF THEIR AFFIILIATES SHALL HAVE ANY RESPONSIBILITY FOR THE CONTENTS HEREOF OR FOR ANY SUBSEQUENT TRANSACTIONS EXECUTED IN RELIANCE HEREON. Beacon Indonesia Morning Brief IDX: 4,275.7 (+1.5%) Turnover: IDR4.3t (+29.3%) Foreign net buy: IDR54b (-42.3%) CORPORATE FLASH For details please refer to our separate report(s) Electronic City Indonesia - Company visit notes: Electric but expensive relative to peers (ECII IJ-NOT RATED) Analyst: Aditya Eka Prakasa Indonesia’s largest electronic retail store by end 2014 Future growth support from innovation and partners Higher margin on labor-cost sharing and improved trading terms Outlook & valuation: Not without risks; 27x 2013F PE above peers To see the full version of this report, please click here TODAY’S NEWS ECONOMICS Govt: 4Q13 GDP growth to reach 5.6%-5.8% y-y Indonesia’s October M2 growth slowed to 13% y-y BOURSE LEAD: A new listing today INDUSTRY Cabotage law to be implemented by 2013 for 3 type of vessels Malaysia CPO inventories gained the most in 14 months CORPORATE TLKM to allocate IDR15t capex for TSEL’s ICBP to launch Ichi Ocha 2014 capex plan of ACES IJ Astra office tower project to be finished in 2017 Fendalton exit BWPT IJ INDICES Asia Last Chg% ytd % y-y % Hang Seng (HK) 23,744.2 (0.3) 4.8 6.6 IDX (Indonesia) 4,275.7 1.5 (1.0) (0.6) KLCI (Malaysia) 1,843.9 0.1 9.2 13.0 KOSPI (Korea) 1,993.5 (0.3) (0.2) 1.8 Nikkei (Japan) 15,611.3 (0.2) 50.2 63.7 PCOMP (Phil.) 5,886.4 (2.0) 1.3 2.2 SENSEX (India) 21,255.3 (0.3) 9.4 9.5 SET (Thailand) 1,367.4 0.4 (1.8) 2.4 SHCOMP (China) 2,237.5 (0.0) (1.4) 7.4 Shenzhen (China) 1,066.3 (0.0) 21.0 33.6 STI (Singapore) 3,081.7 (1.0) (2.7) (1.0) TWSE (Taiwan) 8,443.4 (0.0) 9.7 11.0 VNI (Vietnam) 511.6 0.1 23.7 32.3 Europe, USA and SA CAC 40 (France) 4,091.1 (1.0) 12.4 13.3 DAX (Germany) 9,114.4 (0.9) 19.7 21.0 Dow Jones (USA) 15,973.1 (0.3) 21.9 21.3 FTSE 100 (UK) 6,523.3 (0.6) 10.6 10.2 IBOV (Brazil) 50,993.0 (0.3) (16.3 ) (13.9) NASDAQ (USA) 4,060.5 (0.2) 34.5 35.9 RTSI (Russia) 1,411.8 0.1 (7.5) (4.7) S&P 500 (USA) 1,802.6 (0.3) 26.4 27.1 ETF, ADRS & COMMODITIES Last Chg% ytd % y-y % EIDO US (USD) 23.2 1.8 (23.5) (23.1) TLK US (IDR) 2,042 (1.3) (7.3) (9.2) BUMI LN (IDR) 37,839 (6.7) (30.2) (29.5) Coal (USD/t) 85.2 (0.1) (9.1) (8.5) Corn (USD/mtn) 165 (0.5) (38.4) (41.0) Coffee (USD/t) 2,262 0.1 (20.7) (23.8) Copper (USD/t) 7,164 0.4 (9.4) (11.6) Cotton (USD/t) 1,779 0.4 7.4 9.9 CPO (USD/t-MPOB) 820 0.5 17.8 27.4 Broiler<1kg (IDR/kg) 15,900 0.0 (14.5) 13.6 Gold (USD/oz.) 1,261 1.8 (24.8) (26.3) Iron ore (USD/mtn) 139 0.0 (3.8) 13.0 Milk (USD/t) 421 (0.1) 5.4 5.9 Nickel (USD/t) 13,872 (0.2) (18.4) (21.7) Oil (USD/barrel) 98.8 1.4 4.7 8.0 Rice (IDR/kg) 8,400 0.0 (1.2) 0.6 Rubber (USD/t) 2,320 (0.6) (22.4) (18.8) Soybean oil (USD/t) 880 (0.3) (18.8) (21.5) Steel (USD/t) 573 0.1 (12.5) (10.8) Sugar (USD/t) 454 (0.2) (13.4) (14.4) Tins (USD/t) 22,427 (3.5) (4.1) (2.9) Wheat (USD/t) 235 (1.8) (23.2) (28.6) Source: Bloomberg, Pinsar ECONOMIC INDICATORS MARKET DATA 12A 13F 14F 12A 13F 14F Cur acc bal (%GDP) (2.7) (3.4) (2.6) Op.prof.gwt.(%) 13.7 6.1 10.8 Fiscal bal (%GDP) (2.2) (2.5) (2.0) Op.prof.gwt. exc. coal 15.7 6.1 11.6 GDP growth (%y-y) 6.2 5.7 5.2 EPS growth (%) 4.9 (2.1) 15.3 Private spending (%) 5.3 5.8 5.8 EPS gwt exc. coal (%) 10.8 5.7 14.7 Investment (%y-y) 11.5 10.5 11.7 P/E (x) 19.2 19.3 16.2 Total exports (%y-y) 1.3 7.3 10.4 P/E exc. coal (x) 20.0 18.8 16.3 Total imports (%y-y) 9.5 11.7 12.5 PEG (x) 3.9 (9.0) 1.1 Inflation (%y-y) 4.3 8.8 5.6 PEG exc. coal (x) 1.8 3.3 1.1 IDR/USD 9,679 12,000 11,300 EV/EBITDA (x) 9.7 8.9 7.9 BI rate (% p.a.) 5.75 7.75 8.50 P/BV (x) 7.2 6.0 5.3 Brent Oil (Usd/bbl) 111.1 103.0 105.0 Div. Yield (%) 2.6 2.4 2.7 FX reserve (USDb) 112.0 98.0 100.5 ROE (%) 32.4 28.9 28.6 Source: Bahana estimates Source: Bahana estimates CURRENCIES & RATES Last Prev. Ytd % y-y % AUD/USD 0.914 0.909 12.0 13.1 USD/EUR 1.376 1.374 (4.3) (5.8) IDR/USD 11,985 11,973 24.4 24.0 JPY/USD 102.860 103.230 18.6 (24.6) SGD/USD 1.249 1.249 (2.2) (2.2) JIBOR (%) 5.93 5.93 1.7 1.8 BI rate (%) 7.50 7.50 1.8 1.8 TD – 1 month (%) 6.50 6.54 1.2 1.2 CDS (bps) 216.0 225.0 58.8 72.8 Source: Bloomberg

Welcome message from author
This document is posted to help you gain knowledge. Please leave a comment to let me know what you think about it! Share it to your friends and learn new things together.
Transcript
Asiamoney’s
2013
Best Domestic
Equity House
11 December 2013
Disclosure: Bahana Securities does and seeks to do business with companies covered in its research reports. Investors should consider this report as only a single factor
in making their investment decision.
THIS RESEARCH REPORT IS NOT TO BE DISTRIBUTED TO ANY INVESTORS OR OTHER PERSONS IN THE UNITED STATES. IF ANY INVESTOR OR OTHER PERSON IN THE UNITED STATES
MISTAKENLY RECEIVES OR OTHERWISE COMES INTO POSSESSION OF THIS RESEARCH REPORT, NONE OF DAIWA SECURITIES CO. LTD., PT. BAHANA SECURIITES OR ANY OF THEIR
AFFIILIATES SHALL HAVE ANY RESPONSIBILITY FOR THE CONTENTS HEREOF OR FOR ANY SUBSEQUENT TRANSACTIONS EXECUTED IN RELIANCE HEREON.
Beacon Indonesia Morning Brief
IDX: 4,275.7 (+1.5%) Turnover: IDR4.3t (+29.3%)
Foreign net buy: IDR54b (-42.3%)
CORPORATE FLASH For details please refer to our separate report(s)
Electronic City Indonesia - Company visit notes: Electric but
expensive relative to peers
(ECII IJ-NOT RATED)
Analyst: Aditya Eka Prakasa
Indonesia’s largest electronic retail store by end 2014
Future growth support from innovation and partners
Higher margin on labor-cost sharing and improved trading terms
Outlook & valuation: Not without risks; 27x 2013F PE above peers
To see the full version of this report, please click here
TODAY’S NEWS
ECONOMICS
Govt: 4Q13 GDP growth to reach 5.6%-5.8% y-y
Indonesia’s October M2 growth slowed to 13% y-y
BOURSE
LEAD: A new listing today
INDUSTRY
Cabotage law to be implemented by 2013 for 3 type of vessels
Malaysia CPO inventories gained the most in 14 months
CORPORATE
TLKM to allocate IDR15t capex for TSEL’s
ICBP to launch Ichi Ocha
2014 capex plan of ACES IJ
Astra office tower project to be finished in 2017
Fendalton exit BWPT IJ
INDICES Asia Last Chg% ytd % y-y %
Hang Seng (HK) 23,744.2 (0.3) 4.8 6.6
IDX (Indonesia) 4,275.7 1.5 (1.0) (0.6)
KLCI (Malaysia) 1,843.9 0.1 9.2 13.0
KOSPI (Korea) 1,993.5 (0.3) (0.2) 1.8
Nikkei (Japan) 15,611.3 (0.2) 50.2 63.7
PCOMP (Phil.) 5,886.4 (2.0) 1.3 2.2
SENSEX (India) 21,255.3 (0.3) 9.4 9.5
SET (Thailand) 1,367.4 0.4 (1.8) 2.4
SHCOMP (China) 2,237.5 (0.0) (1.4) 7.4
Shenzhen (China) 1,066.3 (0.0) 21.0 33.6
STI (Singapore) 3,081.7 (1.0) (2.7) (1.0)
TWSE (Taiwan) 8,443.4 (0.0) 9.7 11.0
VNI (Vietnam) 511.6 0.1 23.7 32.3
Europe, USA and SA
CAC 40 (France) 4,091.1 (1.0) 12.4 13.3
DAX (Germany) 9,114.4 (0.9) 19.7 21.0
Dow Jones (USA) 15,973.1 (0.3) 21.9 21.3
FTSE 100 (UK) 6,523.3 (0.6) 10.6 10.2
IBOV (Brazil) 50,993.0 (0.3) (16.3)
(13.9)
NASDAQ (USA) 4,060.5 (0.2) 34.5 35.9
RTSI (Russia) 1,411.8 0.1 (7.5) (4.7)
S&P 500 (USA) 1,802.6 (0.3) 26.4 27.1
ETF, ADRS & COMMODITIES Last Chg% ytd % y-y %
EIDO US (USD) 23.2 1.8 (23.5) (23.1)
TLK US (IDR) 2,042 (1.3) (7.3) (9.2)
BUMI LN (IDR) 37,839 (6.7) (30.2) (29.5)
Coal (USD/t) 85.2 (0.1) (9.1) (8.5)
Corn (USD/mtn) 165 (0.5) (38.4) (41.0)
Coffee (USD/t) 2,262 0.1 (20.7) (23.8)
Copper (USD/t) 7,164 0.4 (9.4) (11.6)
Cotton (USD/t) 1,779 0.4 7.4 9.9
CPO (USD/t-MPOB) 820 0.5 17.8 27.4
Broiler<1kg (IDR/kg) 15,900 0.0 (14.5) 13.6
Gold (USD/oz.) 1,261 1.8 (24.8) (26.3)
Iron ore (USD/mtn) 139 0.0 (3.8) 13.0
Milk (USD/t) 421 (0.1) 5.4 5.9
Nickel (USD/t) 13,872 (0.2) (18.4) (21.7)
Oil (USD/barrel) 98.8 1.4 4.7 8.0
Rice (IDR/kg) 8,400 0.0 (1.2) 0.6
Rubber (USD/t) 2,320 (0.6) (22.4) (18.8)
Soybean oil (USD/t) 880 (0.3) (18.8) (21.5)
Steel (USD/t) 573 0.1 (12.5) (10.8)
Sugar (USD/t) 454 (0.2) (13.4) (14.4)
Tins (USD/t) 22,427 (3.5) (4.1) (2.9)
Wheat (USD/t) 235 (1.8) (23.2) (28.6) Source: Bloomberg, Pinsar
ECONOMIC INDICATORS MARKET DATA
12A 13F 14F
12A 13F 14F
Cur acc bal (%GDP) (2.7) (3.4) (2.6) Op.prof.gwt.(%) 13.7 6.1 10.8
Fiscal bal (%GDP) (2.2) (2.5) (2.0) Op.prof.gwt. exc. coal 15.7 6.1 11.6
GDP growth (%y-y) 6.2 5.7 5.2 EPS growth (%) 4.9 (2.1) 15.3
Private spending (%) 5.3 5.8 5.8 EPS gwt exc. coal (%) 10.8 5.7 14.7
Investment (%y-y) 11.5 10.5 11.7 P/E (x) 19.2 19.3 16.2
Total exports (%y-y) 1.3 7.3 10.4 P/E exc. coal (x) 20.0 18.8 16.3
Total imports (%y-y) 9.5 11.7 12.5 PEG (x) 3.9 (9.0) 1.1
Inflation (%y-y) 4.3 8.8 5.6 PEG exc. coal (x) 1.8 3.3 1.1
IDR/USD 9,679 12,000 11,300 EV/EBITDA (x) 9.7 8.9 7.9
BI rate (% p.a.) 5.75 7.75 8.50 P/BV (x) 7.2 6.0 5.3
Brent Oil (Usd/bbl) 111.1 103.0 105.0 Div. Yield (%) 2.6 2.4 2.7
FX reserve (USDb) 112.0 98.0 100.5 ROE (%) 32.4 28.9 28.6 Source: Bahana estimates Source: Bahana estimates
CURRENCIES & RATES Last Prev. Ytd % y-y %
AUD/USD 0.914 0.909 12.0 13.1
USD/EUR 1.376 1.374 (4.3) (5.8)
IDR/USD 11,985 11,973 24.4 24.0
JPY/USD 102.860 103.230 18.6 (24.6)
SGD/USD 1.249 1.249 (2.2) (2.2)
JIBOR (%) 5.93 5.93 1.7 1.8
BI rate (%) 7.50 7.50 1.8 1.8
TD – 1 month (%) 6.50 6.54 1.2 1.2
CDS (bps) 216.0 225.0 58.8 72.8
Source: Bloomberg
PT Bahana Securities – Equity Research – Bahana Beacon - The Daily 2
Asiamoney’s
2013
Best Domestic
Equity House
ECONOMICS
Govt: 4Q13 GDP growth to reach 5.6%-5.8% y-y
On the back of higher disbursement of government expenditures, the government expects 4Q13 GDP
growth to remain solid, reaching 5.6-5.8% y-y. This translates to 2013 full-year government’s GDP growth
target of 5.8%, lower compared to 2012’s level of 6.2%. (Indonesia Finance Today) Bahana comment: We
beg to differ with the government’s expectation as we see 4Q13 GDP growth further decelerating to 5.2% y-
y from 3Q13’s level 5.6% due to slower domestic demand as well as investments. Hence, we expect 2013
full-year GDP growth to drop to 5.65%.
Indonesia’s October M2 growth slowed to 13% y-y
Bank Indonesia (BI) stated that Indonesia’s October broad money supply (M2) growth slightly decelerated to
13% y-y compared to previous month level of 14.6% due to slower loan growth as a result of its tight
monetary policy. (Kompas)
BOURSE
LEAD IJ: A new listing today
Logindo Samudramakmur (LEAD IJ – NOT RATED), a sea freight transportation services for passengers and
goods, focus on supporting ships for offshore transportation in the oil and gas industry, will list today on the
IDX with an offering price of IDR2,800 per share (IPO price range: IDR2,800 – IDR3,700), raising IDR357b
(USD29.7m). The company had offered 127.4m shares (19.77% stake). UOB Kay Hian Securities and RHB
OSK Securities Indonesia are the lead underwriters. (IDX)
INDUSTRY
Cabotage law to be implemented by 2013 for three types of vessels
Indonesian Ministry of Transportation has mandated 3 types of vessels that are required to implement
cabotage law by the end of 2013, through either a consortium or a fully-owned Indonesian company. The
vessels are: offshore construction vessel, dredging vessels and salvaging and underwater work related
vessel. (Bisnis Indonesia)
Malaysia CPO inventories gained the most in 14 months
Malaysia CPO inventories climbed the most in 14 months in November as exports decreased more than
analysts’ forecast. Inventories advanced 7.2% m-m to 1.98mMT, the biggest gain since September 2012,
while exports lost 8.7% to 1.52m tons, the largest drop since February. The median of estimates in a
Bloomberg survey was 1.96m tons for reserves and 1.57m tons for exports. Production fell 5.6% to 1.86m
tons, the first drop since February and compared with 1.92m ton prediction in the survey. (Bloomberg)
CORPORATE
TLKM IJ to allocate IDR15t capex for TSEL’s
Telekomunikasi Indonesia (TLKM IJ-BUY-IDR2,025-TP:IDR2,900) plans to allocate IDR15t for Telkomsel’s
(TSEL) 2014 capex. Rizkan Chandra, TLKM’s IT and Network Director, stated that the capex will be focused
on modernizing and expanding TSEL’s network hardware. Additionally, he also stated that TLKM will also
focus on backbone infrastructure, spending at least IDR9t. Separately, Arif Prabowo, TLKM’s Public
Relations VP, stated that the company will postpone its plan to divest Mitratel, TLKM’s tower subsidiary, to
2015 due to the House of Representative disapproval. (Indonesia Finance Today, Bisnis Indonesia)
PT Bahana Securities – Equity Research – Bahana Beacon - The Daily 3
Asiamoney’s
2013
Best Domestic
Equity House
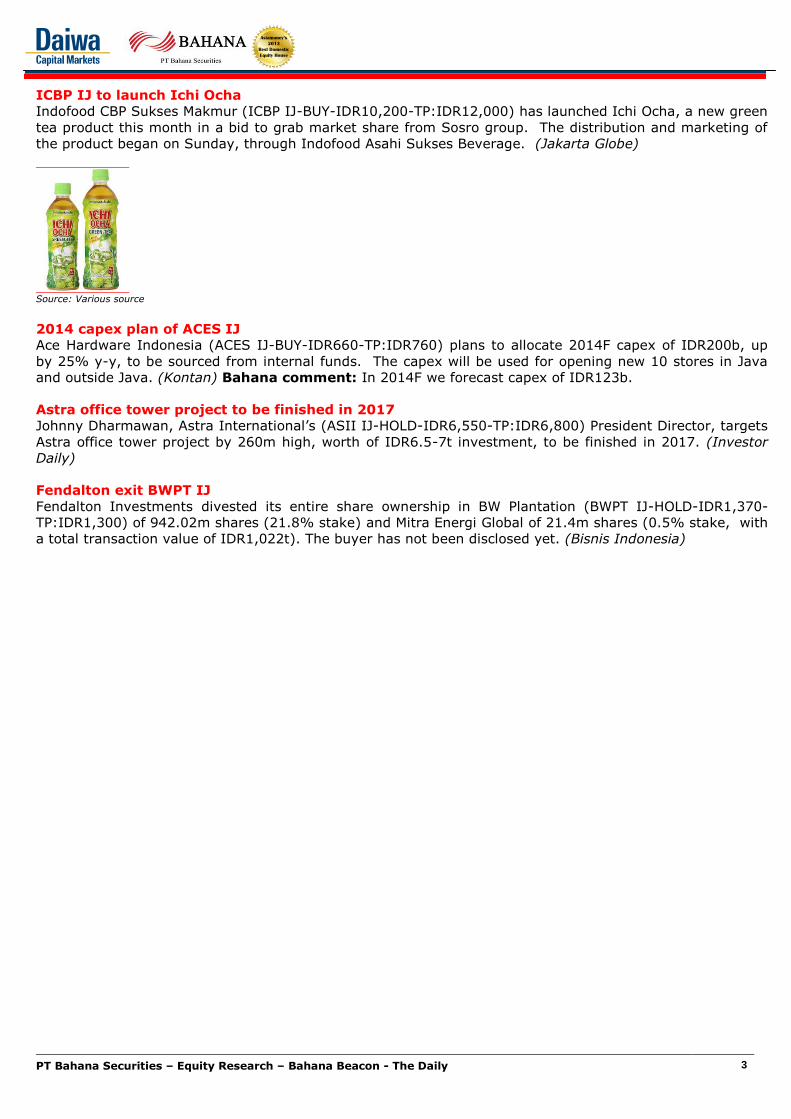
ICBP IJ to launch Ichi Ocha
Indofood CBP Sukses Makmur (ICBP IJ-BUY-IDR10,200-TP:IDR12,000) has launched Ichi Ocha, a new green
tea product this month in a bid to grab market share from Sosro group. The distribution and marketing of
the product began on Sunday, through Indofood Asahi Sukses Beverage. (Jakarta Globe)
Source: Various source
2014 capex plan of ACES IJ
Ace Hardware Indonesia (ACES IJ-BUY-IDR660-TP:IDR760) plans to allocate 2014F capex of IDR200b, up
by 25% y-y, to be sourced from internal funds. The capex will be used for opening new 10 stores in Java
and outside Java. (Kontan) Bahana comment: In 2014F we forecast capex of IDR123b.
Astra office tower project to be finished in 2017
Johnny Dharmawan, Astra International’s (ASII IJ-HOLD-IDR6,550-TP:IDR6,800) President Director, targets
Astra office tower project by 260m high, worth of IDR6.5-7t investment, to be finished in 2017. (Investor
Daily)
Fendalton exit BWPT IJ
Fendalton Investments divested its entire share ownership in BW Plantation (BWPT IJ-HOLD-IDR1,370-
TP:IDR1,300) of 942.02m shares (21.8% stake) and Mitra Energi Global of 21.4m shares (0.5% stake, with
a total transaction value of IDR1,022t). The buyer has not been disclosed yet. (Bisnis Indonesia)
PT Bahana Securities – Equity Research – Bahana Beacon - The Daily 4
Asiamoney’s
2013
Best Domestic
Equity House
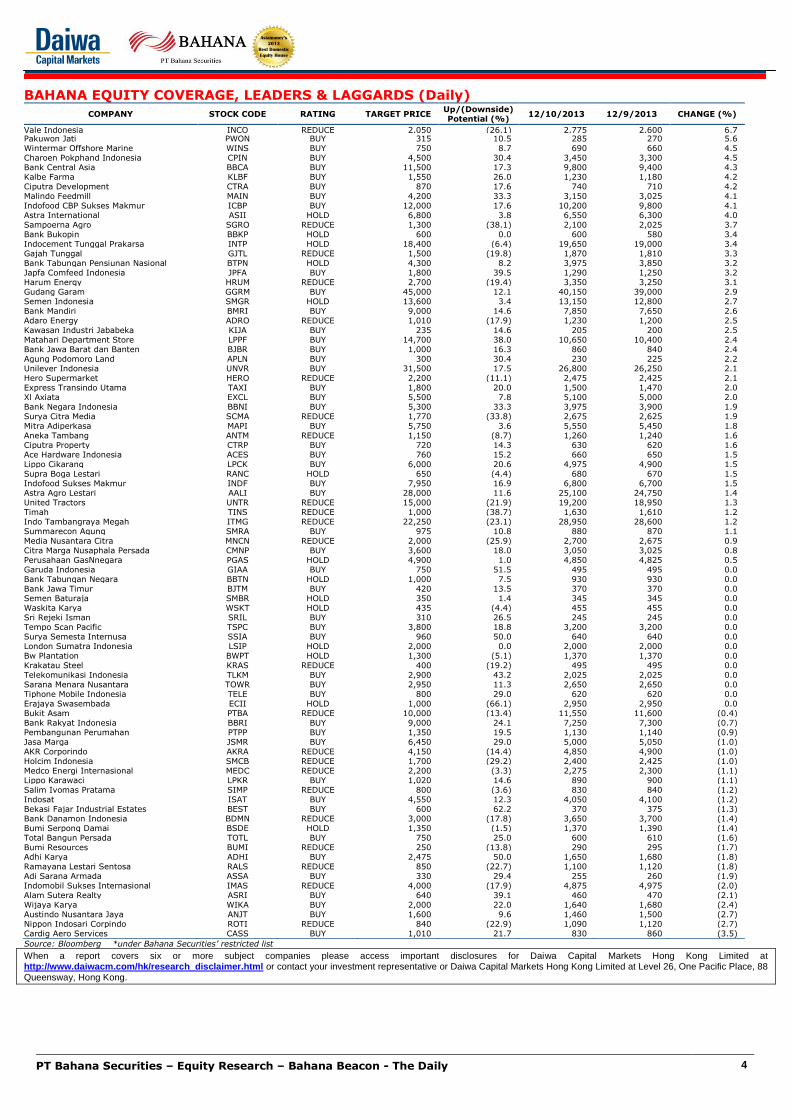
BAHANA EQUITY COVERAGE, LEADERS & LAGGARDS (Daily)
COMPANY STOCK CODE RATING TARGET PRICE Up/(Downside) Potential (%)
12/10/2013 12/9/2013 CHANGE (%)
Vale Indonesia INCO REDUCE 2,050 (26.1) 2,775 2,600 6.7 Pakuwon Jati PWON BUY 315 10.5 285 270 5.6 Wintermar Offshore Marine WINS BUY 750 8.7 690 660 4.5 Charoen Pokphand Indonesia CPIN BUY 4,500 30.4 3,450 3,300 4.5 Bank Central Asia BBCA BUY 11,500 17.3 9,800 9,400 4.3 Kalbe Farma KLBF BUY 1,550 26.0 1,230 1,180 4.2 Ciputra Development CTRA BUY 870 17.6 740 710 4.2 Malindo Feedmill MAIN BUY 4,200 33.3 3,150 3,025 4.1 Indofood CBP Sukses Makmur ICBP BUY 12,000 17.6 10,200 9,800 4.1 Astra International ASII HOLD 6,800 3.8 6,550 6,300 4.0 Sampoerna Agro SGRO REDUCE 1,300 (38.1) 2,100 2,025 3.7 Bank Bukopin BBKP HOLD 600 0.0 600 580 3.4 Indocement Tunggal Prakarsa INTP HOLD 18,400 (6.4) 19,650 19,000 3.4 Gajah Tunggal GJTL REDUCE 1,500 (19.8) 1,870 1,810 3.3 Bank Tabungan Pensiunan Nasional BTPN HOLD 4,300 8.2 3,975 3,850 3.2 Japfa Comfeed Indonesia JPFA BUY 1,800 39.5 1,290 1,250 3.2 Harum Energy HRUM REDUCE 2,700 (19.4) 3,350 3,250 3.1 Gudang Garam GGRM BUY 45,000 12.1 40,150 39,000 2.9 Semen Indonesia SMGR HOLD 13,600 3.4 13,150 12,800 2.7 Bank Mandiri BMRI BUY 9,000 14.6 7,850 7,650 2.6 Adaro Energy ADRO REDUCE 1,010 (17.9) 1,230 1,200 2.5 Kawasan Industri Jababeka KIJA BUY 235 14.6 205 200 2.5 Matahari Department Store LPPF BUY 14,700 38.0 10,650 10,400 2.4 Bank Jawa Barat dan Banten BJBR BUY 1,000 16.3 860 840 2.4 Agung Podomoro Land APLN BUY 300 30.4 230 225 2.2 Unilever Indonesia UNVR BUY 31,500 17.5 26,800 26,250 2.1 Hero Supermarket HERO REDUCE 2,200 (11.1) 2,475 2,425 2.1 Express Transindo Utama TAXI BUY 1,800 20.0 1,500 1,470 2.0 Xl Axiata EXCL BUY 5,500 7.8 5,100 5,000 2.0 Bank Negara Indonesia BBNI BUY 5,300 33.3 3,975 3,900 1.9 Surya Citra Media SCMA REDUCE 1,770 (33.8) 2,675 2,625 1.9 Mitra Adiperkasa MAPI BUY 5,750 3.6 5,550 5,450 1.8 Aneka Tambang ANTM REDUCE 1,150 (8.7) 1,260 1,240 1.6 Ciputra Property CTRP BUY 720 14.3 630 620 1.6 Ace Hardware Indonesia ACES BUY 760 15.2 660 650 1.5 Lippo Cikarang LPCK BUY 6,000 20.6 4,975 4,900 1.5 Supra Boga Lestari RANC HOLD 650 (4.4) 680 670 1.5 Indofood Sukses Makmur INDF BUY 7,950 16.9 6,800 6,700 1.5 Astra Agro Lestari AALI BUY 28,000 11.6 25,100 24,750 1.4 United Tractors UNTR REDUCE 15,000 (21.9) 19,200 18,950 1.3 Timah TINS REDUCE 1,000 (38.7) 1,630 1,610 1.2 Indo Tambangraya Megah ITMG REDUCE 22,250 (23.1) 28,950 28,600 1.2 Summarecon Agung SMRA BUY 975 10.8 880 870 1.1 Media Nusantara Citra MNCN REDUCE 2,000 (25.9) 2,700 2,675 0.9 Citra Marga Nusaphala Persada CMNP BUY 3,600 18.0 3,050 3,025 0.8 Perusahaan GasNnegara PGAS HOLD 4,900 1.0 4,850 4,825 0.5 Garuda Indonesia GIAA BUY 750 51.5 495 495 0.0 Bank Tabungan Negara BBTN HOLD 1,000 7.5 930 930 0.0 Bank Jawa Timur BJTM BUY 420 13.5 370 370 0.0 Semen Baturaja SMBR HOLD 350 1.4 345 345 0.0 Waskita Karya WSKT HOLD 435 (4.4) 455 455 0.0 Sri Rejeki Isman SRIL BUY 310 26.5 245 245 0.0 Tempo Scan Pacific TSPC BUY 3,800 18.8 3,200 3,200 0.0 Surya Semesta Internusa SSIA BUY 960 50.0 640 640 0.0 London Sumatra Indonesia LSIP HOLD 2,000 0.0 2,000 2,000 0.0 Bw Plantation BWPT HOLD 1,300 (5.1) 1,370 1,370 0.0 Krakatau Steel KRAS REDUCE 400 (19.2) 495 495 0.0 Telekomunikasi Indonesia TLKM BUY 2,900 43.2 2,025 2,025 0.0 Sarana Menara Nusantara TOWR BUY 2,950 11.3 2,650 2,650 0.0 Tiphone Mobile Indonesia TELE BUY 800 29.0 620 620 0.0 Erajaya Swasembada ECII HOLD 1,000 (66.1) 2,950 2,950 0.0 Bukit Asam PTBA REDUCE 10,000 (13.4) 11,550 11,600 (0.4) Bank Rakyat Indonesia BBRI BUY 9,000 24.1 7,250 7,300 (0.7) Pembangunan Perumahan PTPP BUY 1,350 19.5 1,130 1,140 (0.9) Jasa Marga JSMR BUY 6,450 29.0 5,000 5,050 (1.0) AKR Corporindo AKRA REDUCE 4,150 (14.4) 4,850 4,900 (1.0) Holcim Indonesia SMCB REDUCE 1,700 (29.2) 2,400 2,425 (1.0) Medco Energi Internasional MEDC REDUCE 2,200 (3.3) 2,275 2,300 (1.1) Lippo Karawaci LPKR BUY 1,020 14.6 890 900 (1.1) Salim Ivomas Pratama SIMP REDUCE 800 (3.6) 830 840 (1.2) Indosat ISAT BUY 4,550 12.3 4,050 4,100 (1.2) Bekasi Fajar Industrial Estates BEST BUY 600 62.2 370 375 (1.3) Bank Danamon Indonesia BDMN REDUCE 3,000 (17.8) 3,650 3,700 (1.4) Bumi Serpong Damai BSDE HOLD 1,350 (1.5) 1,370 1,390 (1.4) Total Bangun Persada TOTL BUY 750 25.0 600 610 (1.6) Bumi Resources BUMI REDUCE 250 (13.8) 290 295 (1.7) Adhi Karya ADHI BUY 2,475 50.0 1,650 1,680 (1.8) Ramayana Lestari Sentosa RALS REDUCE 850 (22.7) 1,100 1,120 (1.8) Adi Sarana Armada ASSA BUY 330 29.4 255 260 (1.9) Indomobil Sukses Internasional IMAS REDUCE 4,000 (17.9) 4,875 4,975 (2.0) Alam Sutera Realty ASRI BUY 640 39.1 460 470 (2.1) Wijaya Karya WIKA BUY 2,000 22.0 1,640 1,680 (2.4) Austindo Nusantara Jaya ANJT BUY 1,600 9.6 1,460 1,500 (2.7) Nippon Indosari Corpindo ROTI REDUCE 840 (22.9) 1,090 1,120 (2.7) Cardig Aero Services CASS BUY 1,010 21.7 830 860 (3.5)
Source: Bloomberg *under Bahana Securities’ restricted list
When a report covers six or more subject companies please access important disclosures for Daiwa Capital Markets Hong Kong Limited at http://www.daiwacm.com/hk/research_disclaimer.html or contact your investment representative or Daiwa Capital Markets Hong Kong Limited at Level 26, One Pacific Place, 88
Queensway, Hong Kong.
PT Bahana Securities – Equity Research – Bahana Beacon - The Daily 5
Asiamoney’s
2013
Best Domestic
Equity House
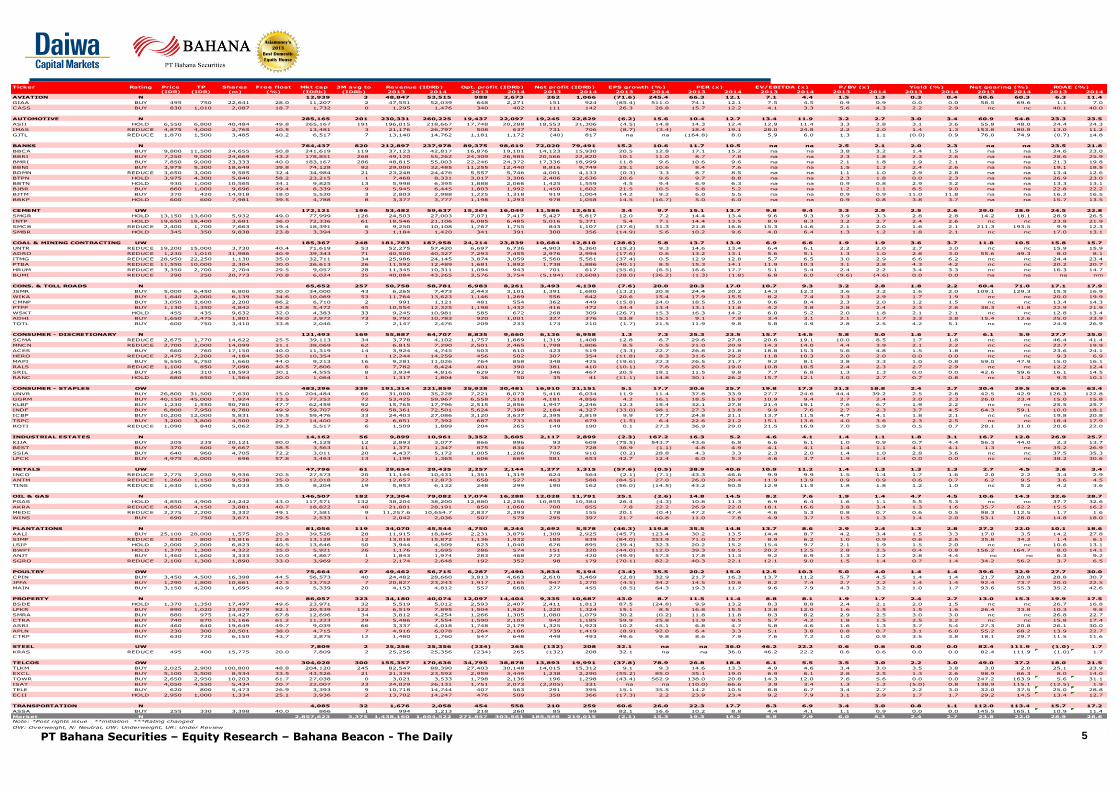
Ticker Rating Price TP Shares Free float Mkt cap 3M avg to
(IDR) (IDR) (m) (%) (IDRb) (IDRb) 2013 2014 2013 2014 2013 2014 2013 2014 2013 2014 2013 2014 2013 2014 2013 2014 2013 2014 2013 2014
AVIATION N 12,939 3 48,847 53,515 988 2,673 262 1,066 (71.6) 245.4 66.3 12.1 7.1 4.4 1.5 1.3 0.3 0.4 50.6 60.3 6.3 11.4
GIAA BUY 495 750 22,641 28.0 11,207 2 47,551 52,039 648 2,271 151 924 (85.4) 511.0 74.1 12.1 7.5 4.5 0.9 0.9 0.0 0.0 58.5 69.6 1.1 7.0
CASS BUY 830 1,010 2,087 18.7 1,732 0 1,295 1,476 340 402 111 142 26.3 28.8 15.7 12.2 4.1 3.3 5.6 4.3 2.2 2.9 nc nc 40.1 40.0
AUTOMOTIVE N 285,165 201 230,331 260,225 19,437 22,097 19,245 22,829 (6.2) 15.6 10.4 12.7 13.4 11.9 3.2 2.7 3.0 3.4 60.9 54.8 23.3 23.5
ASII HOLD 6,550 6,800 40,484 49.8 265,167 191 196,015 218,667 17,748 20,288 18,553 21,306 (4.5) 14.8 14.3 12.4 12.9 11.4 3.3 2.8 3.1 3.6 55.8 48.0 24.4 24.3
IMAS REDUCE 4,875 4,000 2,765 10.5 13,481 3 21,176 26,797 508 637 731 706 (8.7) (3.4) 18.4 19.1 28.0 24.8 2.2 2.0 1.4 1.3 153.8 180.8 13.0 11.2
GJTL REDUCE 1,870 1,500 3,485 40.2 6,517 7 13,140 14,762 1,181 1,172 (40) 817 na na (164.8) 8.0 5.9 6.0 1.3 1.1 (0.0) 0.9 76.0 74.9 (0.7) 14.8
BANKS N 764,437 820 212,897 237,978 89,375 98,619 72,020 79,491 15.2 10.6 11.7 10.5 na na 2.5 2.1 2.0 2.3 na na 23.5 21.8
BBCA BUY 9,800 11,500 24,655 50.8 241,619 119 37,123 42,817 16,876 19,101 14,123 15,930 20.5 12.8 17.1 15.2 na na 3.8 3.2 1.4 1.5 na na 24.6 23.0
BBRI BUY 7,250 9,000 24,669 43.2 178,851 268 49,120 55,262 24,309 26,985 20,566 22,820 10.1 11.0 8.7 7.8 na na 2.3 1.8 2.3 2.6 na na 28.6 25.9
BMRI BUY 7,850 9,000 23,333 40.0 183,167 286 48,815 55,003 22,246 24,372 17,336 18,999 11.8 9.6 10.6 9.6 na na 2.1 1.8 1.9 2.1 na na 21.3 19.8
BBNI BUY 3,975 5,300 18,649 39.8 74,128 92 29,000 32,485 11,255 12,440 8,816 9,749 25.1 10.6 8.4 7.6 na na 1.5 1.3 2.4 2.6 na na 19.1 18.5
BDMN REDUCE 3,650 3,000 9,585 32.4 34,984 21 23,248 24,476 5,557 5,746 4,001 4,133 (0.3) 3.3 8.7 8.5 na na 1.1 1.0 2.9 2.8 na na 13.4 12.6
BTPN HOLD 3,975 4,300 5,840 58.2 23,215 1 7,468 8,331 3,017 3,306 2,406 2,636 20.6 9.6 9.7 8.8 na na 2.3 1.8 0.0 2.3 na na 26.9 23.0
BBTN HOLD 930 1,000 10,565 34.1 9,825 13 5,998 6,395 1,888 2,066 1,425 1,559 4.5 9.4 6.9 6.3 na na 0.9 0.8 2.9 3.2 na na 13.3 13.1
BJBR BUY 860 1,000 9,696 49.4 8,339 9 5,945 6,445 1,803 1,992 1,450 1,602 21.5 10.5 5.8 5.2 na na 1.2 1.1 8.5 9.0 na na 22.8 22.2
BJTM BUY 370 420 14,918 18.0 5,520 3 2,803 2,988 1,225 1,318 919 1,004 14.2 9.2 6.0 5.5 na na 0.9 0.9 11.0 11.8 na na 16.2 16.5
BBKP HOLD 600 600 7,981 39.5 4,788 8 3,377 3,777 1,198 1,293 978 1,058 14.5 (16.7) 5.0 6.0 na na 0.9 0.8 3.8 3.7 na na 15.7 13.5
CEMENT UW 172,121 196 53,482 59,637 15,264 16,049 11,586 12,651 3.4 9.7 15.1 13.7 9.8 9.4 3.3 2.9 2.5 2.6 29.0 28.9 24.5 22.8
SMGR HOLD 13,150 13,600 5,932 49.0 77,999 126 24,503 27,003 7,071 7,417 5,427 5,817 12.0 7.2 14.4 13.4 9.6 9.3 3.9 3.3 2.8 2.8 14.2 18.1 28.9 26.5
INTP HOLD 19,650 18,400 3,681 36.0 72,336 61 18,546 21,106 6,085 6,485 5,016 5,371 5.4 7.1 14.4 13.5 8.9 8.3 3.2 2.7 2.4 2.6 nc nc 23.8 21.9
SMCB REDUCE 2,400 1,700 7,663 19.4 18,391 6 9,250 10,108 1,767 1,755 843 1,107 (37.6) 31.3 21.8 16.6 15.3 14.6 2.1 2.0 1.6 2.1 211.3 193.5 9.9 12.3
SMBR HOLD 345 350 9,838 23.8 3,394 3 1,184 1,420 341 391 300 356 (14.9) 5.6 10.2 9.6 4.0 6.4 1.3 1.2 1.8 2.1 nc nc 17.0 13.1
COAL & MINING CONTRACTING UW 185,367 248 181,783 187,958 24,214 23,839 10,684 12,810 (28.6) 5.8 13.7 13.0 6.9 6.6 1.9 1.9 3.6 3.7 11.8 10.5 15.8 15.7
UNTR REDUCE 19,200 15,000 3,730 40.4 71,619 53 52,275 57,420 6,697 6,736 4,903 5,360 (15.2) 9.3 14.6 13.4 6.4 6.1 2.2 2.0 2.7 3.0 nc nc 15.9 15.9
ADRO REDUCE 1,230 1,010 31,986 40.9 39,343 71 40,500 40,327 7,293 7,455 2,976 2,994 (17.6) 0.6 13.2 13.1 5.6 5.1 1.3 1.0 2.8 3.0 55.6 49.3 8.0 8.1
ITMG REDUCE 28,950 22,250 1,130 35.0 32,711 34 25,986 24,145 3,874 3,059 5,560 5,561 (37.4) 0.5 12.9 12.8 5.7 6.5 3.0 2.9 6.6 6.2 nc nc 24.4 23.4
PTBA REDUCE 11,550 10,000 2,304 30.0 26,613 26 11,592 12,489 1,681 1,892 1,738 1,886 (40.1) 8.5 15.3 14.1 11.9 10.3 3.1 2.8 4.3 4.2 nc nc 20.2 20.7
HRUM REDUCE 3,350 2,700 2,704 29.5 9,057 28 11,345 10,311 1,094 943 701 617 (55.6) (6.5) 16.6 17.7 5.1 5.4 2.4 2.2 3.4 3.3 nc nc 16.3 14.7
BUMI REDUCE 290 250 20,773 70.8 6,024 35 40,084 43,265 3,576 3,754 (5,194) (3,608) (28.0) (26.2) (1.3) (1.8) 6.8 6.0 (9.6) (4.6) 0.0 0.0 na na na nm
CONS. & TOLL ROADS N 65,652 257 50,758 58,781 6,983 8,261 3,493 4,138 (7.6) 20.0 20.3 17.0 10.7 9.3 3.2 2.8 1.8 2.2 60.4 71.0 17.1 17.9
JSMR BUY 5,000 6,450 6,800 30.0 34,000 43 6,265 7,473 2,443 3,101 1,391 1,680 (13.2) 20.8 24.4 20.2 14.3 12.3 3.6 3.2 1.6 2.0 109.1 129.3 15.5 16.9
WIKA BUY 1,640 2,000 6,139 34.6 10,069 53 11,764 13,623 1,146 1,269 556 642 20.6 15.4 17.9 15.5 8.2 7.4 3.3 2.9 1.7 1.9 nc nc 20.0 19.9
CMNP BUY 3,050 3,600 2,200 86.2 6,710 2 991 1,121 481 554 362 449 (15.8) 24.0 18.5 15.0 9.6 8.4 2.3 2.0 1.2 1.5 nc nc 13.4 14.3
PTPP BUY 1,130 1,350 4,842 42.8 5,472 45 10,554 12,325 1,198 1,432 416 472 34.4 13.4 13.1 11.6 4.2 3.8 2.8 2.4 2.3 2.6 38.3 41.8 22.9 21.9
WSKT HOLD 455 435 9,632 32.0 4,383 33 9,245 10,981 585 672 268 309 (26.7) 15.3 16.3 14.2 6.0 5.2 2.0 1.8 2.1 2.1 nc nc 12.8 13.4
ADHI BUY 1,650 2,475 1,801 49.0 2,972 73 9,792 10,783 920 1,001 327 376 53.8 15.1 9.1 7.9 3.4 3.1 2.1 1.7 3.3 3.8 15.4 12.6 25.0 23.9
TOTL BUY 600 750 3,410 33.8 2,046 7 2,147 2,476 209 233 173 210 (1.7) 21.5 11.9 9.8 5.8 4.9 2.8 2.5 4.2 5.1 nc nc 24.9 26.9
CONSUMER - DISCRETIONARY N 121,493 169 55,887 64,707 8,835 9,660 6,136 6,958 1.3 7.3 25.3 23.5 15.7 14.5 5.8 5.0 1.6 1.7 6.1 5.9 27.7 25.0
SCMA REDUCE 2,675 1,770 14,622 25.5 39,113 34 3,778 4,102 1,757 1,869 1,319 1,408 12.8 6.7 29.6 27.8 20.6 19.1 10.0 8.5 1.7 1.8 nc nc 46.4 41.4
MNCN REDUCE 2,700 2,000 14,099 31.1 38,069 62 6,815 7,290 2,501 2,465 1,798 1,806 8.5 0.5 21.0 20.9 14.3 14.0 4.4 3.9 2.1 2.2 nc nc 22.7 19.9
ACES BUY 660 760 17,150 40.0 11,319 14 3,924 4,745 503 610 423 519 (3.3) 22.7 26.8 21.8 18.8 15.3 5.6 4.8 1.5 1.8 nc nc 23.6 24.1
HERO REDUCE 2,475 2,200 4,184 35.0 10,354 1 12,244 14,259 456 502 307 354 (11.8) 8.3 31.6 29.2 11.8 10.3 2.0 2.0 0.0 0.0 nc nc 9.3 6.9
MAPI BUY 5,550 5,750 1,660 44.0 9,213 16 9,281 11,026 764 858 348 425 (19.6) 22.3 26.5 21.7 9.2 8.1 3.8 3.3 1.0 0.8 59.0 47.9 15.0 16.1
RALS REDUCE 1,100 850 7,096 40.5 7,806 6 7,782 8,424 401 390 381 410 (10.1) 7.6 20.5 19.0 10.8 10.5 2.4 2.3 2.7 2.9 nc nc 12.2 12.4
SRIL BUY 245 310 18,593 30.1 4,555 8 3,934 4,816 629 792 346 467 20.5 18.1 11.5 9.8 7.7 6.8 1.3 1.3 0.0 0.0 42.6 59.6 16.1 14.5
RANC HOLD 680 650 1,564 20.0 1,064 1 1,317 1,804 36 50 35 41 (11.1) 14.8 30.1 26.2 15.7 12.1 3.0 2.7 0.7 0.8 nc 1.2 9.5 10.1
CONSUMER - STAPLES OW 483,296 339 191,314 221,859 25,928 30,481 16,910 21,151 5.1 17.7 30.6 25.7 19.8 17.3 21.3 18.8 2.4 2.7 30.4 29.5 63.6 63.4
UNVR BUY 26,800 31,500 7,630 15.0 204,484 66 31,000 35,228 7,221 8,073 5,416 6,034 11.9 11.4 37.8 33.9 27.7 24.6 44.4 39.2 2.5 2.8 42.5 42.9 126.3 122.8
GGRM BUY 40,150 45,000 1,924 23.5 77,252 72 53,425 59,967 6,558 7,518 4,181 4,856 4.2 16.1 18.5 15.9 10.9 9.4 2.7 2.4 2.0 2.3 26.0 23.4 15.0 15.8
KLBF BUY 1,230 1,550 50,780 47.7 62,459 92 15,765 17,796 2,515 2,856 1,947 2,246 12.3 15.4 32.1 27.8 21.4 19.1 7.6 6.7 1.9 2.2 nc nc 25.5 25.7
INDF BUY 6,800 7,950 8,780 49.9 59,707 69 58,361 72,501 5,624 7,398 2,184 4,327 (33.0) 98.1 27.3 13.8 9.9 7.6 2.7 2.3 3.7 4.5 64.3 59.1 10.0 18.1
ICBP BUY 10,200 12,000 5,831 19.5 59,476 33 24,403 27,086 3,120 3,637 2,395 2,819 9.9 17.7 24.8 21.1 13.7 11.5 4.7 4.1 1.8 2.1 nc nc 19.8 20.8
TSPC BUY 3,200 3,800 4,500 22.7 14,400 2 6,851 7,392 687 733 638 679 (1.5) 6.4 22.6 21.2 15.1 13.6 4.0 3.6 2.3 2.5 nc nc 18.4 17.9
ROTI REDUCE 1,090 840 5,062 29.3 5,517 6 1,509 1,889 204 265 149 190 0.1 27.3 36.9 29.0 21.5 16.9 7.0 5.9 0.5 0.7 28.1 31.0 20.6 22.0
INDUSTRIAL ESTATES N 14,162 56 9,899 10,961 3,352 3,605 2,117 2,899 (2.3) 167.2 16.3 5.2 4.6 4.1 1.4 1.1 1.8 3.1 16.7 12.8 26.9 25.7
KIJA BUY 205 235 20,121 80.0 4,125 12 2,893 3,077 866 896 93 609 (75.5) 543.7 43.6 6.8 6.6 6.1 1.0 0.9 0.7 4.4 56.3 44.0 2.3 13.7
BEST BUY 370 600 9,667 38.5 3,563 11 1,371 1,347 875 834 737 728 36.9 (1.1) 4.8 4.9 4.1 4.1 1.4 1.1 4.1 4.1 1.3 nc 35.2 26.9
SSIA BUY 640 960 4,705 72.2 3,011 20 4,437 5,172 1,005 1,206 706 910 (0.2) 28.8 4.3 3.3 2.3 2.0 1.4 1.0 2.8 3.6 nc nc 37.5 35.3
LPCK BUY 4,975 6,000 696 57.8 3,463 13 1,199 1,365 606 669 581 653 42.7 12.4 6.0 5.3 4.6 3.7 1.9 1.4 0.0 0.0 nc nc 38.2 30.6
METALS UW 47,796 61 29,654 29,435 2,257 2,144 1,277 1,315 (57.6) (0.5) 38.9 40.6 10.9 11.2 1.4 1.3 1.3 1.3 2.7 4.5 3.6 3.4
INCO REDUCE 2,775 2,050 9,936 20.5 27,573 20 11,144 10,431 1,351 1,319 624 564 (2.1) (7.1) 43.3 46.6 9.9 9.9 1.5 1.4 1.7 1.6 2.0 2.2 3.4 2.9
ANTM REDUCE 1,260 1,150 9,538 35.0 12,018 22 12,657 12,873 658 527 463 588 (84.5) 27.0 26.0 20.4 11.9 13.9 0.9 0.9 0.6 0.7 6.2 9.5 3.6 4.5
TINS REDUCE 1,630 1,000 5,033 35.0 8,204 19 5,853 6,132 248 299 190 162 (56.0) (14.5) 43.2 50.5 12.9 11.5 1.8 1.8 1.2 1.0 nc 5.2 4.2 3.6
OIL & GAS N 146,507 182 73,304 79,082 17,074 16,288 12,028 11,791 25.1 (2.6) 14.8 14.5 8.2 7.6 1.9 1.4 4.7 4.5 10.6 14.3 32.6 28.7
PGAS HOLD 4,850 4,900 24,242 43.0 117,571 132 38,204 38,200 12,880 12,256 10,855 10,384 26.4 (4.3) 10.8 11.3 6.9 6.4 1.6 1.1 5.5 5.3 nc nc 37.7 32.6
AKRA REDUCE 4,850 4,150 3,881 40.7 18,822 40 21,801 28,191 850 1,060 700 855 7.8 22.2 26.9 22.0 18.1 16.6 3.8 3.4 1.3 1.6 35.7 62.2 15.5 16.2
MEDC REDUCE 2,275 2,200 3,332 49.1 7,581 9 11,257.6 10,654.7 2,837 2,393 178 155 20.1 (0.4) 47.2 47.4 4.6 5.3 0.8 0.7 0.6 0.5 98.3 112.5 1.7 1.6
WINS BUY 690 750 3,671 29.5 2,533 1 2,042 2,036 507 579 295 397 21.7 40.8 11.0 7.8 4.9 3.7 1.5 1.3 1.4 2.0 53.1 28.0 14.8 18.0
PLANTATIONS N 81,056 119 34,070 45,544 4,750 8,244 2,692 5,578 (46.3) 119.8 35.5 14.8 13.7 8.6 2.9 2.4 1.3 2.8 27.2 22.0 10.1 18.6
AALI BUY 25,100 28,000 1,575 20.3 39,526 28 11,915 18,846 2,231 3,879 1,309 2,925 (45.7) 123.4 30.2 13.5 14.4 8.7 4.2 3.4 1.5 3.3 17.0 3.5 14.2 27.8
SIMP REDUCE 830 800 15,816 21.6 13,128 12 13,018 15,872 1,136 1,932 185 839 (84.0) 353.9 71.0 15.7 8.9 6.2 1.0 0.9 0.6 2.6 35.8 34.2 1.4 6.1
LSIP HOLD 2,000 2,000 6,823 40.5 13,646 50 3,944 4,509 623 1,040 676 895 (39.4) 32.3 20.2 15.2 15.4 9.7 2.1 1.9 1.5 2.0 nc nc 10.6 13.1
BWPT HOLD 1,370 1,300 4,322 35.0 5,921 26 1,176 1,695 286 574 151 320 (44.0) 112.0 39.3 18.5 20.2 12.5 2.8 2.5 0.4 0.8 156.2 164.7 8.0 14.1
ANJT BUY 1,460 1,600 3,333 10.0 4,867 1 1,843 1,974 283 468 272 420 (49.9) 57.3 17.8 11.3 9.2 6.9 1.3 1.2 2.8 4.4 nc nc 6.3 9.2
SGRO REDUCE 2,100 1,300 1,890 33.0 3,969 2 2,174 2,648 192 352 98 179 (70.1) 82.2 40.3 22.1 12.1 9.0 1.5 1.4 0.7 1.4 34.2 56.2 3.7 6.5
POULTRY OW 75,664 67 49,462 56,715 6,287 7,496 3,834 5,194 (3.4) 35.5 20.2 15.0 12.5 10.3 5.0 4.0 1.4 1.4 39.6 32.9 27.7 30.0
CPIN BUY 3,450 4,500 16,398 44.5 56,573 40 24,482 28,660 3,813 4,663 2,610 3,469 (2.8) 32.9 21.7 16.3 13.7 11.2 5.7 4.5 1.4 1.4 21.7 20.8 28.8 30.7
JPFA BUY 1,290 1,800 10,661 42.5 13,752 7 20,827 23,243 1,917 2,165 947 1,270 (4.5) 34.2 14.5 10.8 8.2 7.4 2.7 2.2 1.4 1.4 92.4 73.7 20.0 22.5
MAIN BUY 3,150 4,200 1,695 40.9 5,339 20 4,153 4,812 557 668 277 455 (8.5) 64.3 19.3 11.7 9.6 7.9 4.3 3.2 1.0 1.7 93.6 55.3 35.2 42.6
PROPERTY N 86,057 323 34,180 40,074 12,097 14,404 9,335 10,687 43.0 8.7 11.5 11.4 8.8 8.1 1.9 1.7 2.4 2.7 13.0 15.3 19.9 17.5
BSDE HOLD 1,370 1,350 17,497 49.6 23,971 32 5,519 5,012 2,593 2,407 2,411 1,813 87.5 (24.8) 9.9 13.2 8.3 8.8 2.4 2.1 2.0 1.5 nc nc 26.7 16.8
LPKR BUY 890 1,020 23,078 82.1 20,539 122 6,519 7,895 1,504 1,826 1,220 1,324 15.1 8.5 16.8 15.5 13.8 12.0 1.6 1.5 1.5 1.6 26.4 33.8 10.3 9.8
SMRA BUY 880 975 14,427 67.8 12,696 34 3,812 4,254 1,266 1,305 1,080 1,079 30.2 (0.2) 11.8 11.8 8.3 8.2 2.9 2.5 3.0 3.0 nc nc 26.8 22.7
CTRA BUY 740 870 15,166 61.2 11,223 29 5,486 7,554 1,590 2,102 942 1,185 59.9 25.8 11.9 9.5 5.7 4.2 1.8 1.5 2.5 3.2 nc nc 15.8 17.4
ASRI BUY 460 640 19,649 49.7 9,039 66 3,337 4,018 1,748 2,179 1,325 1,923 10.2 45.1 6.8 4.7 5.8 4.6 1.6 1.3 3.7 5.4 27.3 20.8 26.1 30.0
APLN BUY 230 300 20,501 38.0 4,715 7 4,916 6,078 1,264 2,186 739 1,419 (8.9) 92.0 6.4 3.3 5.1 3.8 0.8 0.7 3.1 6.0 55.2 68.2 13.9 22.7
CTRP BUY 630 720 6,150 43.7 3,875 12 1,480 1,760 547 648 449 493 49.6 9.8 8.6 7.9 7.6 7.2 1.0 0.9 3.5 3.8 18.1 29.7 11.5 11.6
STEEL UW 7,809 2 25,256 25,356 (234) 265 (132) 208 32.1 na na 36.0 46.2 22.2 0.6 0.6 0.0 0.0 82.4 111.9 (1.0) 1.7
KRAS REDUCE 495 400 15,775 20.0 7,809 2 25,256 25,356 (234) 265 (132) 208 32.1 na na 36.0 46.2 22.2 0.6 0.6 0.0 0.0 82.4 111.9 (1.0) 1.7
TELCOS OW 304,020 300 155,357 170,636 34,795 38,878 13,893 19,991 (37.8) 78.9 26.8 18.8 6.1 5.5 3.5 3.0 2.2 3.0 49.0 37.2 18.0 21.5
TLKM BUY 2,025 2,900 100,800 48.8 204,120 245 82,547 88,390 27,403 30,148 14,015 15,312 9.1 9.3 14.6 13.3 4.9 4.6 3.4 3.0 3.5 3.8 3.0 2.0 25.1 23.9
EXCL BUY 5,100 5,500 8,534 33.5 43,526 21 21,339 23,592 2,959 3,449 1,238 2,290 (55.2) 85.0 35.1 19.0 6.9 6.1 2.8 2.5 1.3 2.6 98.9 86.3 8.0 14.0
TOWR BUY 2,650 2,950 10,203 61.7 27,038 0 3,021 3,533 1,798 2,136 196 1,298 (43.4) 562.9 138.0 20.8 14.3 12.0 7.6 5.6 0.0 0.0 247.2 163.9 5.6 31.1
ISAT BUY 4,050 4,550 5,434 20.7 22,007 23 24,029 26,131 1,751 2,073 (2,205) 331 na na (10.0) 66.6 3.9 3.4 1.3 1.2 (5.0) 0.8 138.9 115.1 (12.5) 1.9
TELE BUY 620 800 5,473 26.9 3,393 9 10,718 14,744 407 563 291 395 15.1 35.5 14.2 10.5 8.8 6.7 3.4 2.7 2.2 3.0 32.0 37.5 25.0 28.8
ECII HOLD 2,950 1,000 1,334 25.1 3,936 2 13,702 14,247 476 509 358 366 (17.3) 2.2 23.9 23.4 9.2 7.9 3.1 2.9 1.7 1.7 29.2 14.5 13.4 12.7
TRANSPORTATION N 4,085 32 1,676 2,058 454 558 210 259 60.6 26.0 22.3 17.7 8.3 6.9 3.4 3.0 0.8 1.1 112.0 113.4 15.7 17.2
ASSA BUY 255 330 3,398 40.0 866 1 994 1,213 218 260 85 99 82.1 16.6 10.2 8.8 4.4 4.1 1.1 0.9 0.0 0.0 145.5 165.1 10.9 11.4
Market N 2,857,623 3,375 1,438,160 1,604,522 271,857 303,561 185,589 219,015 (2.1) 15.3 19.3 16.2 8.9 7.9 6.0 5.3 2.4 2.7 23.8 22.0 28.9 28.6
Note: *Post rights issue **initiation ***Rating changed
OW: Overweight, N: Neutral, UW: Underweight, UR: Under Review
P/BV (x) Yield (%) Net gearing (%) ROAE (%)Revenue (IDRb) Opt. profit (IDRb) Net profit (IDRb) EPS growth (%) PER (x) EV/EBITDA (x)
PT Bahana Securities – Equity Research – Bahana Beacon - The Daily 6
Asiamoney’s
2013
Best Domestic
Equity House
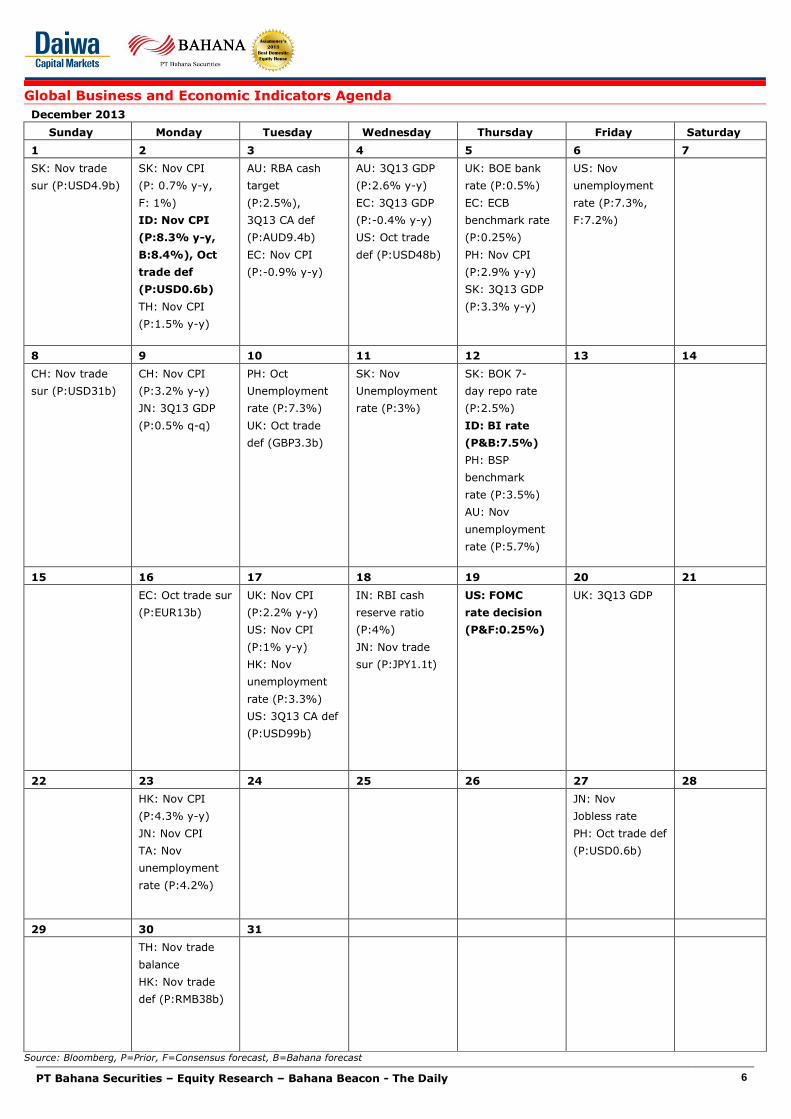
Global Business and Economic Indicators Agenda
December 2013
Sunday Monday Tuesday Wednesday Thursday Friday Saturday
1 2 3 4 5 6 7
SK: Nov trade
sur (P:USD4.9b)
SK: Nov CPI
(P: 0.7% y-y,
F: 1%)
ID: Nov CPI
(P:8.3% y-y,
B:8.4%), Oct
trade def
(P:USD0.6b)
TH: Nov CPI
(P:1.5% y-y)
AU: RBA cash
target
(P:2.5%),
3Q13 CA def
(P:AUD9.4b)
EC: Nov CPI
(P:-0.9% y-y)
AU: 3Q13 GDP
(P:2.6% y-y)
EC: 3Q13 GDP
(P:-0.4% y-y)
US: Oct trade
def (P:USD48b)
UK: BOE bank
rate (P:0.5%)
EC: ECB
benchmark rate
(P:0.25%)
PH: Nov CPI
(P:2.9% y-y)
SK: 3Q13 GDP
(P:3.3% y-y)
US: Nov
unemployment
rate (P:7.3%,
F:7.2%)
8 9 10 11 12 13 14
CH: Nov trade
sur (P:USD31b)
CH: Nov CPI
(P:3.2% y-y)
JN: 3Q13 GDP
(P:0.5% q-q)
PH: Oct
Unemployment
rate (P:7.3%)
UK: Oct trade
def (GBP3.3b)
SK: Nov
Unemployment
rate (P:3%)
SK: BOK 7-
day repo rate
(P:2.5%)
ID: BI rate
(P&B:7.5%)
PH: BSP
benchmark
rate (P:3.5%)
AU: Nov
unemployment
rate (P:5.7%)
15 16 17 18 19 20 21
EC: Oct trade sur
(P:EUR13b)
UK: Nov CPI
(P:2.2% y-y)
US: Nov CPI
(P:1% y-y)
HK: Nov
unemployment
rate (P:3.3%)
US: 3Q13 CA def
(P:USD99b)
IN: RBI cash
reserve ratio
(P:4%)
JN: Nov trade
sur (P:JPY1.1t)
US: FOMC
rate decision
(P&F:0.25%)
UK: 3Q13 GDP
22 23 24 25 26 27 28
HK: Nov CPI
(P:4.3% y-y)
JN: Nov CPI
TA: Nov
unemployment
rate (P:4.2%)
JN: Nov
Jobless rate
PH: Oct trade def
(P:USD0.6b)
29 30 31
TH: Nov trade
balance
HK: Nov trade
def (P:RMB38b)
Source: Bloomberg, P=Prior, F=Consensus forecast, B=Bahana forecast
PT Bahana Securities – Equity Research – Bahana Beacon - The Daily 7
Asiamoney’s
2013
Best Domestic
Equity House
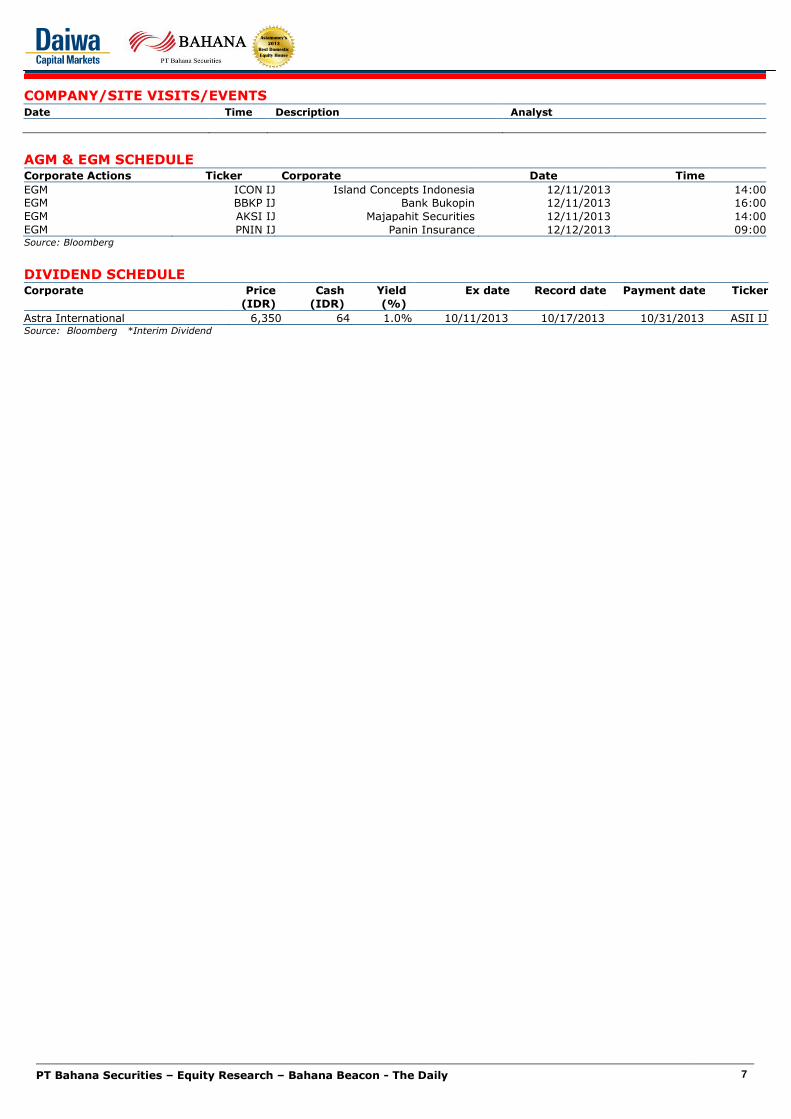
COMPANY/SITE VISITS/EVENTS Date Time Description Analyst
AGM & EGM SCHEDULE Corporate Actions Ticker Corporate Date Time
EGM ICON IJ Island Concepts Indonesia 12/11/2013 14:00
EGM BBKP IJ Bank Bukopin 12/11/2013 16:00
EGM AKSI IJ Majapahit Securities 12/11/2013 14:00
EGM PNIN IJ Panin Insurance 12/12/2013 09:00 Source: Bloomberg
DIVIDEND SCHEDULE Corporate Price Cash Yield Ex date Record date Payment date Ticker
(IDR) (IDR) (%)
Astra International 6,350 64 1.0% 10/11/2013 10/17/2013 10/31/2013 ASII IJ Source: Bloomberg *Interim Dividend
PT Bahana Securities – Equity Research – Bahana Beacon - The Daily 8
Asiamoney’s
2013
Best Domestic
Equity House
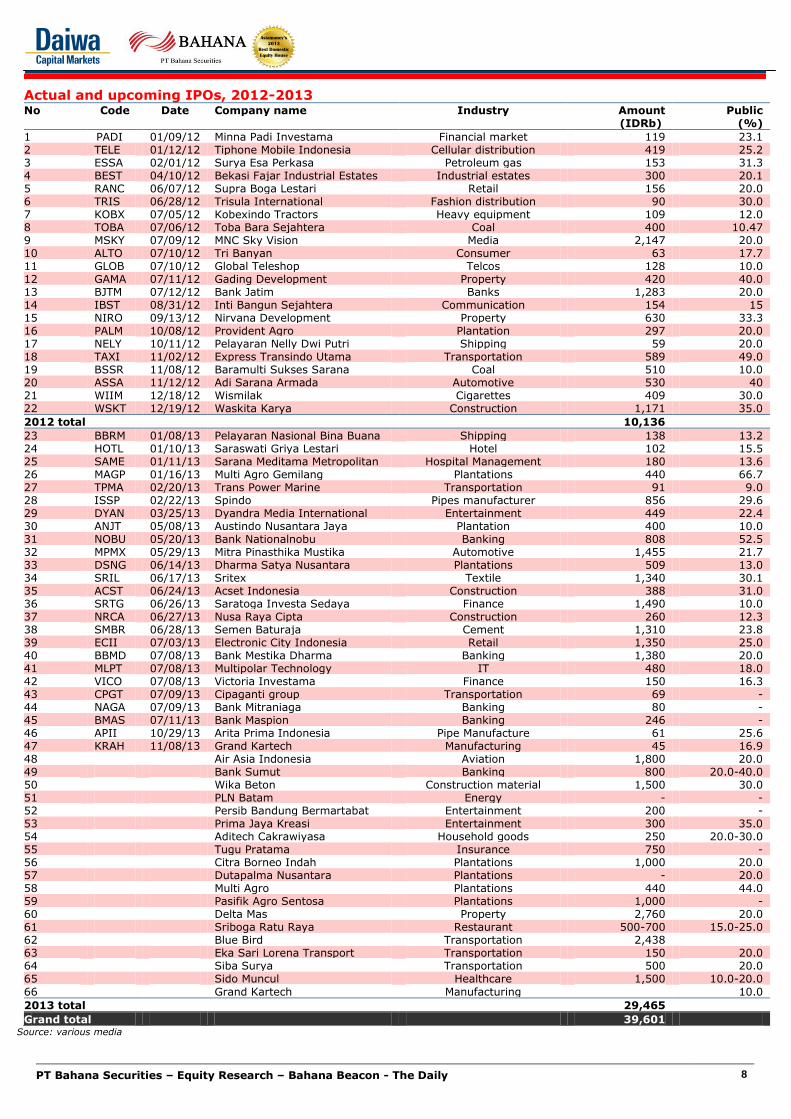
Actual and upcoming IPOs, 2012-2013
No Code Date Company name Industry Amount Public (IDRb) (%)
1 PADI 01/09/12 Minna Padi Investama Financial market 119 23.1 2 TELE 01/12/12 Tiphone Mobile Indonesia Cellular distribution 419 25.2 3 ESSA 02/01/12 Surya Esa Perkasa Petroleum gas 153 31.3 4 BEST 04/10/12 Bekasi Fajar Industrial Estates Industrial estates 300 20.1 5 RANC 06/07/12 Supra Boga Lestari Retail 156 20.0 6 TRIS 06/28/12 Trisula International Fashion distribution 90 30.0 7 KOBX 07/05/12 Kobexindo Tractors Heavy equipment 109 12.0 8 TOBA 07/06/12 Toba Bara Sejahtera Coal 400 10.47 9 MSKY 07/09/12 MNC Sky Vision Media 2,147 20.0 10 ALTO 07/10/12 Tri Banyan Consumer 63 17.7 11 GLOB 07/10/12 Global Teleshop Telcos 128 10.0 12 GAMA 07/11/12 Gading Development Property 420 40.0 13 BJTM 07/12/12 Bank Jatim Banks 1,283 20.0 14 IBST 08/31/12 Inti Bangun Sejahtera Communication 154 15 15 NIRO 09/13/12 Nirvana Development Property 630 33.3 16 PALM 10/08/12 Provident Agro Plantation 297 20.0 17 NELY 10/11/12 Pelayaran Nelly Dwi Putri Shipping 59 20.0 18 TAXI 11/02/12 Express Transindo Utama Transportation 589 49.0 19 BSSR 11/08/12 Baramulti Sukses Sarana Coal 510 10.0 20 ASSA 11/12/12 Adi Sarana Armada Automotive 530 40 21 WIIM 12/18/12 Wismilak Cigarettes 409 30.0 22 WSKT 12/19/12 Waskita Karya Construction 1,171 35.0
2012 total 10,136
23 BBRM 01/08/13 Pelayaran Nasional Bina Buana Shipping 138 13.2 24 HOTL 01/10/13 Saraswati Griya Lestari Hotel 102 15.5 25 SAME 01/11/13 Sarana Meditama Metropolitan Hospital Management 180 13.6 26 MAGP 01/16/13 Multi Agro Gemilang Plantations 440 66.7 27 TPMA 02/20/13 Trans Power Marine Transportation 91 9.0 28 ISSP 02/22/13 Spindo Pipes manufacturer 856 29.6 29 DYAN 03/25/13 Dyandra Media International Entertainment 449 22.4 30 ANJT 05/08/13 Austindo Nusantara Jaya Plantation 400 10.0 31 NOBU 05/20/13 Bank Nationalnobu Banking 808 52.5 32 MPMX 05/29/13 Mitra Pinasthika Mustika Automotive 1,455 21.7 33 DSNG 06/14/13 Dharma Satya Nusantara Plantations 509 13.0 34 SRIL 06/17/13 Sritex Textile 1,340 30.1 35 ACST 06/24/13 Acset Indonesia Construction 388 31.0 36 SRTG 06/26/13 Saratoga Investa Sedaya Finance 1,490 10.0 37 NRCA 06/27/13 Nusa Raya Cipta Construction 260 12.3 38 SMBR 06/28/13 Semen Baturaja Cement 1,310 23.8 39 ECII 07/03/13 Electronic City Indonesia Retail 1,350 25.0 40 BBMD 07/08/13 Bank Mestika Dharma Banking 1,380 20.0 41 MLPT 07/08/13 Multipolar Technology IT 480 18.0 42 VICO 07/08/13 Victoria Investama Finance 150 16.3 43 CPGT 07/09/13 Cipaganti group Transportation 69 - 44 NAGA 07/09/13 Bank Mitraniaga Banking 80 - 45 BMAS 07/11/13 Bank Maspion Banking 246 - 46 APII 10/29/13 Arita Prima Indonesia Pipe Manufacture 61 25.6 47 KRAH 11/08/13 Grand Kartech Manufacturing 45 16.9 48 Air Asia Indonesia Aviation 1,800 20.0 49 Bank Sumut Banking 800 20.0-40.0 50 Wika Beton Construction material 1,500 30.0 51 PLN Batam Energy - - 52 Persib Bandung Bermartabat Entertainment 200 - 53 Prima Jaya Kreasi Entertainment 300 35.0 54 Aditech Cakrawiyasa Household goods 250 20.0-30.0 55 Tugu Pratama Insurance 750 - 56 Citra Borneo Indah Plantations 1,000 20.0 57 Dutapalma Nusantara Plantations - 20.0 58 Multi Agro Plantations 440 44.0 59 Pasifik Agro Sentosa Plantations 1,000 - 60 Delta Mas Property 2,760 20.0 61 Sriboga Ratu Raya Restaurant 500-700 15.0-25.0 62 Blue Bird Transportation 2,438 63 Eka Sari Lorena Transport Transportation 150 20.0 64 Siba Surya Transportation 500 20.0 65 Sido Muncul Healthcare 1,500 10.0-20.0
66 Grand Kartech Manufacturing 10.0
2013 total 29,465
Grand total 39,601 Source: various media
PT Bahana Securities – Equity Research – Bahana Beacon - The Daily 9
Asiamoney’s
2013
Best Domestic
Equity House
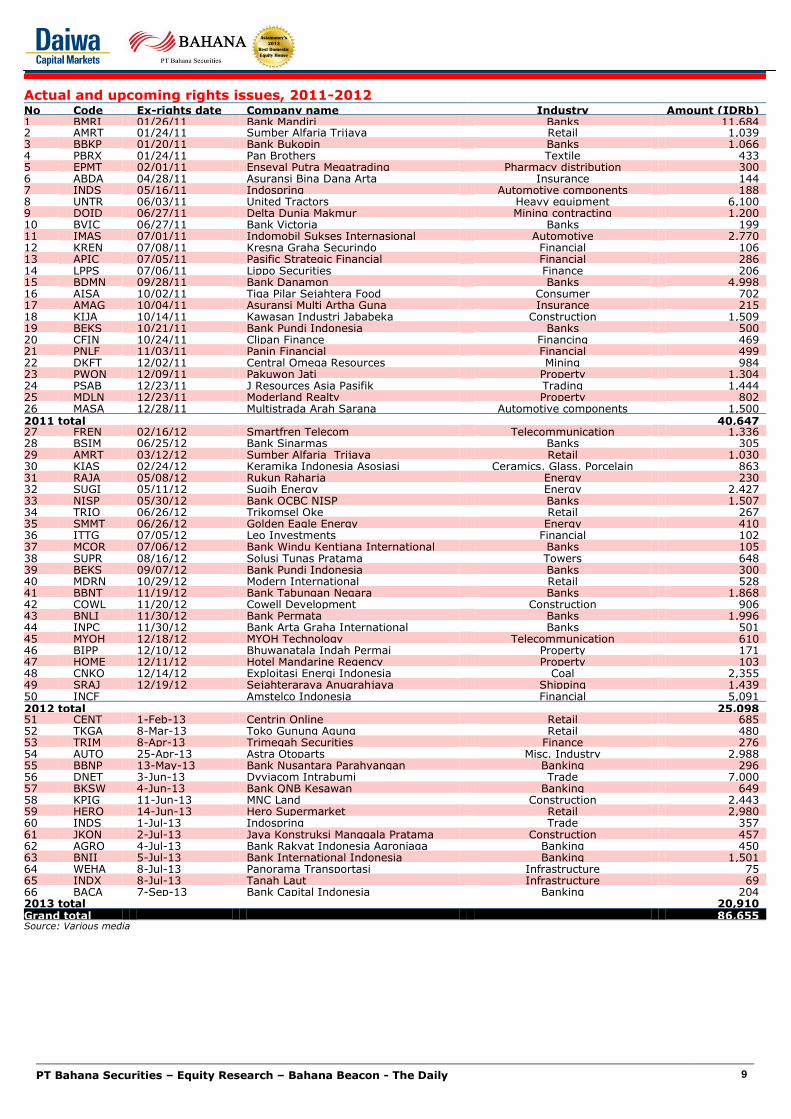
Actual and upcoming rights issues, 2011-2012 No Code Ex-rights date Company name Industry Amount (IDRb) 1 BMRI 01/26/11 Bank Mandiri Banks 11,684 2 AMRT 01/24/11 Sumber Alfaria Trijaya Retail 1,039 3 BBKP 01/20/11 Bank Bukopin Banks 1,066 4 PBRX 01/24/11 Pan Brothers Textile 433 5 EPMT 02/01/11 Enseval Putra Megatrading Pharmacy distribution 300 6 ABDA 04/28/11 Asuransi Bina Dana Arta Insurance 144 7 INDS 05/16/11 Indospring Automotive components 188 8 UNTR 06/03/11 United Tractors Heavy equipment 6,100 9 DOID 06/27/11 Delta Dunia Makmur Mining contracting 1,200 10 BVIC 06/27/11 Bank Victoria Banks 199 11 IMAS 07/01/11 Indomobil Sukses Internasional Automotive 2,770 12 KREN 07/08/11 Kresna Graha Securindo Financial 106 13 APIC 07/05/11 Pasific Strategic Financial Financial 286 14 LPPS 07/06/11 Lippo Securities Finance 206 15 BDMN 09/28/11 Bank Danamon Banks 4,998 16 AISA 10/02/11 Tiga Pilar Sejahtera Food Consumer 702 17 AMAG 10/04/11 Asuransi Multi Artha Guna Insurance 215 18 KIJA 10/14/11 Kawasan Industri Jababeka Construction 1,509 19 BEKS 10/21/11 Bank Pundi Indonesia Banks 500 20 CFIN 10/24/11 Clipan Finance Financing 469 21 PNLF 11/03/11 Panin Financial Financial 499 22 DKFT 12/02/11 Central Omega Resources Mining 984 23 PWON 12/09/11 Pakuwon Jati Property 1,304 24 PSAB 12/23/11 J Resources Asia Pasifik Trading 1,444 25 MDLN 12/23/11 Moderland Realty Property 802 26 MASA 12/28/11 Multistrada Arah Sarana Automotive components 1,500 2011 total 40,647 27 FREN 02/16/12 Smartfren Telecom Telecommunication 1,336 28 BSIM 06/25/12 Bank Sinarmas Banks 305 29 AMRT 03/12/12 Sumber Alfaria Trijaya Retail 1,030 30 KIAS 02/24/12 Keramika Indonesia Asosiasi Ceramics, Glass, Porcelain 863 31 RAJA 05/08/12 Rukun Raharja Energy 230 32 SUGI 05/11/12 Sugih Energy Energy 2,427 33 NISP 05/30/12 Bank OCBC NISP Banks 1,507 34 TRIO 06/26/12 Trikomsel Oke Retail 267 35 SMMT 06/26/12 Golden Eagle Energy Energy 410 36 ITTG 07/05/12 Leo Investments Financial 102 37 MCOR 07/06/12 Bank Windu Kentjana International Banks 105 38 SUPR 08/16/12 Solusi Tunas Pratama Towers 648 39 BEKS 09/07/12 Bank Pundi Indonesia Banks 300 40 MDRN 10/29/12 Modern International Retail 528 41 BBNT 11/19/12 Bank Tabungan Negara Banks 1,868 42 COWL 11/20/12 Cowell Development Construction 906 43 BNLI 11/30/12 Bank Permata Banks 1,996 44 INPC 11/30/12 Bank Arta Graha International Banks 501 45 MYOH 12/18/12 MYOH Technology Telecommunication 610 46 BIPP 12/10/12 Bhuwanatala Indah Permai Property 171 47 HOME 12/11/12 Hotel Mandarine Regency Property 103 48 CNKO 12/14/12 Exploitasi Energi Indonesia Coal 2,355 49 SRAJ 12/19/12 Sejahteraraya Anugrahjaya Shipping 1,439 50 INCF Amstelco Indonesia Financial 5,091 2012 total 25,098 51 CENT 1-Feb-13 Centrin Online Retail 685 52 TKGA 8-Mar-13 Toko Gunung Agung Retail 480 53 TRIM 8-Apr-13 Trimegah Securities Finance 276 54 AUTO 25-Apr-13 Astra Otoparts Misc. Industry 2,988 55 BBNP 13-May-13 Bank Nusantara Parahyangan Banking 296 56 DNET 3-Jun-13 Dyviacom Intrabumi Trade 7,000 57 BKSW 4-Jun-13 Bank QNB Kesawan Banking 649 58 KPIG 11-Jun-13 MNC Land Construction 2,443 59 HERO 14-Jun-13 Hero Supermarket Retail 2,980 60 INDS 1-Jul-13 Indospring Trade 357 61 JKON 2-Jul-13 Jaya Konstruksi Manggala Pratama Construction 457 62 AGRO 4-Jul-13 Bank Rakyat Indonesia Agroniaga Banking 450 63 BNII 5-Jul-13 Bank International Indonesia Banking 1,501 64 WEHA 8-Jul-13 Panorama Transportasi Infrastructure 75 65 INDX 8-Jul-13 Tanah Laut Infrastructure 69 66 BACA 7-Sep-13 Bank Capital Indonesia Banking 204 2013 total 20,910 Grand total 86,655 Source: Various media
PT Bahana Securities – Equity Research – Bahana Beacon - The Daily 10
Asiamoney’s
2013
Best Domestic
Equity House
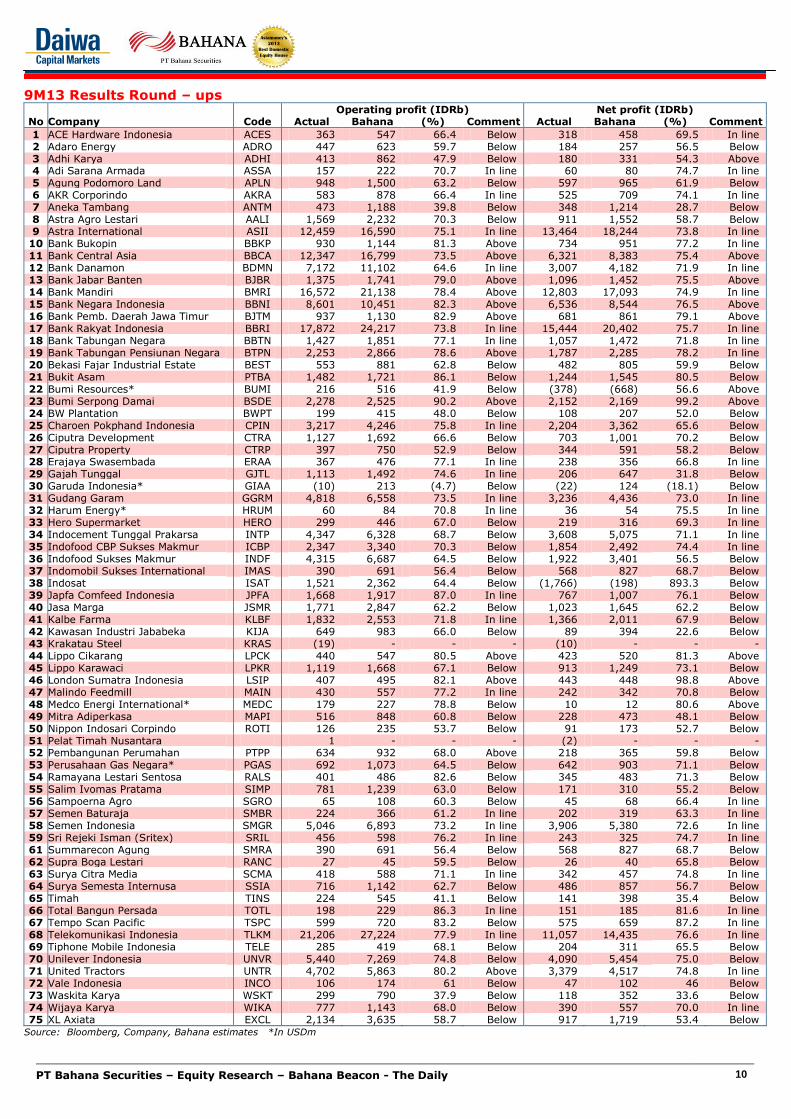
9M13 Results Round – ups Operating profit (IDRb) Net profit (IDRb)
No Company Code Actual Bahana (%) Comment Actual Bahana (%) Comment
1 ACE Hardware Indonesia ACES 363 547 66.4 Below 318 458 69.5 In line 2 Adaro Energy ADRO 447 623 59.7 Below 184 257 56.5 Below 3 Adhi Karya ADHI 413 862 47.9 Below 180 331 54.3 Above 4 Adi Sarana Armada ASSA 157 222 70.7 In line 60 80 74.7 In line 5 Agung Podomoro Land APLN 948 1,500 63.2 Below 597 965 61.9 Below 6 AKR Corporindo AKRA 583 878 66.4 In line 525 709 74.1 In line 7 Aneka Tambang ANTM 473 1,188 39.8 Below 348 1,214 28.7 Below 8 Astra Agro Lestari AALI 1,569 2,232 70.3 Below 911 1,552 58.7 Below 9 Astra International ASII 12,459 16,590 75.1 In line 13,464 18,244 73.8 In line
10 Bank Bukopin BBKP 930 1,144 81.3 Above 734 951 77.2 In line 11 Bank Central Asia BBCA 12,347 16,799 73.5 Above 6,321 8,383 75.4 Above 12 Bank Danamon BDMN 7,172 11,102 64.6 In line 3,007 4,182 71.9 In line 13 Bank Jabar Banten BJBR 1,375 1,741 79.0 Above 1,096 1,452 75.5 Above 14 Bank Mandiri BMRI 16,572 21,138 78.4 Above 12,803 17,093 74.9 In line 15 Bank Negara Indonesia BBNI 8,601 10,451 82.3 Above 6,536 8,544 76.5 Above 16 Bank Pemb. Daerah Jawa Timur BJTM 937 1,130 82.9 Above 681 861 79.1 Above 17 Bank Rakyat Indonesia BBRI 17,872 24,217 73.8 In line 15,444 20,402 75.7 In line 18 Bank Tabungan Negara BBTN 1,427 1,851 77.1 In line 1,057 1,472 71.8 In line 19 Bank Tabungan Pensiunan Negara BTPN 2,253 2,866 78.6 Above 1,787 2,285 78.2 In line 20 Bekasi Fajar Industrial Estate BEST 553 881 62.8 Below 482 805 59.9 Below 21 Bukit Asam PTBA 1,482 1,721 86.1 Below 1,244 1,545 80.5 Below 22 Bumi Resources* BUMI 216 516 41.9 Below (378) (668) 56.6 Above 23 Bumi Serpong Damai BSDE 2,278 2,525 90.2 Above 2,152 2,169 99.2 Above 24 BW Plantation BWPT 199 415 48.0 Below 108 207 52.0 Below 25 Charoen Pokphand Indonesia CPIN 3,217 4,246 75.8 In line 2,204 3,362 65.6 Below 26 Ciputra Development CTRA 1,127 1,692 66.6 Below 703 1,001 70.2 Below 27 Ciputra Property CTRP 397 750 52.9 Below 344 591 58.2 Below 28 Erajaya Swasembada ERAA 367 476 77.1 In line 238 356 66.8 In line 29 Gajah Tunggal GJTL 1,113 1,492 74.6 In line 206 647 31.8 Below 30 Garuda Indonesia* GIAA (10) 213 (4.7) Below (22) 124 (18.1) Below 31 Gudang Garam GGRM 4,818 6,558 73.5 In line 3,236 4,436 73.0 In line 32 Harum Energy* HRUM 60 84 70.8 In line 36 54 75.5 In line 33 Hero Supermarket HERO 299 446 67.0 Below 219 316 69.3 In line 34 Indocement Tunggal Prakarsa INTP 4,347 6,328 68.7 Below 3,608 5,075 71.1 In line 35 Indofood CBP Sukses Makmur ICBP 2,347 3,340 70.3 Below 1,854 2,492 74.4 In line 36 Indofood Sukses Makmur INDF 4,315 6,687 64.5 Below 1,922 3,401 56.5 Below 37 Indomobil Sukses International IMAS 390 691 56.4 Below 568 827 68.7 Below 38 Indosat ISAT 1,521 2,362 64.4 Below (1,766) (198) 893.3 Below 39 Japfa Comfeed Indonesia JPFA 1,668 1,917 87.0 In line 767 1,007 76.1 Below 40 Jasa Marga JSMR 1,771 2,847 62.2 Below 1,023 1,645 62.2 Below 41 Kalbe Farma KLBF 1,832 2,553 71.8 In line 1,366 2,011 67.9 Below 42 Kawasan Industri Jababeka KIJA 649 983 66.0 Below 89 394 22.6 Below 43 Krakatau Steel KRAS (19) - - - (10) - - - 44 Lippo Cikarang LPCK 440 547 80.5 Above 423 520 81.3 Above 45 Lippo Karawaci LPKR 1,119 1,668 67.1 Below 913 1,249 73.1 Below 46 London Sumatra Indonesia LSIP 407 495 82.1 Above 443 448 98.8 Above 47 Malindo Feedmill MAIN 430 557 77.2 In line 242 342 70.8 Below 48 Medco Energi International* MEDC 179 227 78.8 Below 10 12 80.6 Above 49 Mitra Adiperkasa MAPI 516 848 60.8 Below 228 473 48.1 Below 50 Nippon Indosari Corpindo ROTI 126 235 53.7 Below 91 173 52.7 Below 51 Pelat Timah Nusantara 1 - - - (2) - - - 52 Pembangunan Perumahan PTPP 634 932 68.0 Above 218 365 59.8 Below 53 Perusahaan Gas Negara* PGAS 692 1,073 64.5 Below 642 903 71.1 Below 54 Ramayana Lestari Sentosa RALS 401 486 82.6 Below 345 483 71.3 Below 55 Salim Ivomas Pratama SIMP 781 1,239 63.0 Below 171 310 55.2 Below 56 Sampoerna Agro SGRO 65 108 60.3 Below 45 68 66.4 In line 57 Semen Baturaja SMBR 224 366 61.2 In line 202 319 63.3 In line 58 Semen Indonesia SMGR 5,046 6,893 73.2 In line 3,906 5,380 72.6 In line 59 Sri Rejeki Isman (Sritex) SRIL 456 598 76.2 In line 243 325 74.7 In line 61 Summarecon Agung SMRA 390 691 56.4 Below 568 827 68.7 Below 62 Supra Boga Lestari RANC 27 45 59.5 Below 26 40 65.8 Below 63 Surya Citra Media SCMA 418 588 71.1 In line 342 457 74.8 In line 64 Surya Semesta Internusa SSIA 716 1,142 62.7 Below 486 857 56.7 Below 65 Timah TINS 224 545 41.1 Below 141 398 35.4 Below 66 Total Bangun Persada TOTL 198 229 86.3 In line 151 185 81.6 In line 67 Tempo Scan Pacific TSPC 599 720 83.2 Below 575 659 87.2 In line 68 Telekomunikasi Indonesia TLKM 21,206 27,224 77.9 In line 11,057 14,435 76.6 In line 69 Tiphone Mobile Indonesia TELE 285 419 68.1 Below 204 311 65.5 Below 70 Unilever Indonesia UNVR 5,440 7,269 74.8 Below 4,090 5,454 75.0 Below 71 United Tractors UNTR 4,702 5,863 80.2 Above 3,379 4,517 74.8 In line 72 Vale Indonesia INCO 106 174 61 Below 47 102 46 Below 73 Waskita Karya WSKT 299 790 37.9 Below 118 352 33.6 Below 74 Wijaya Karya WIKA 777 1,143 68.0 Below 390 557 70.0 In line 75 XL Axiata EXCL 2,134 3,635 58.7 Below 917 1,719 53.4 Below
Source: Bloomberg, Company, Bahana estimates *In USDm

PT Bahana Securities – Equity Research – Bahana Beacon - The Daily 11
Asiamoney’s
2013
Best Domestic
Equity House
Keterangan:
Research Associate Junior analyst wannabe
Research Assistant Do administrative things
Research Executive Kayak Isna
Reynard [email protected]
Equity Salesext 2528
Suwardi Widjaja [email protected]
Equity Salesext 2548
Ricardo Silaen, [email protected]
Equity Salesext 2524
Harry [email protected]
Senior Associate DirectorHead of Equities & Research
Strategy, Consumerext 3600
direct: +62 21 250 5735
Dealing Room: +62 21 527 0808 (Foreign Institutional)
Research: +62 21 250 5081
+62 21 250 5508 (Domestic Institutional) +62 31 535 2788 (Surabaya Branch)
Teguh [email protected]
Associate DirectorDeputy Head of Research
Banks, Cementext 3610
Leonardo Henry [email protected]
Senior Research ManagerAuto, Plantations, Heavy equipment,
Property, Industrial estateext 3608
Arga [email protected]
Economistext 3602
Aditya Eka [email protected]
Research AnalystPoultry, Telco, Aviation
ext 3603
Salman Fajari [email protected]
Research AnalystProperty, Industrial estate, Steel,
Cement, Toll roadsext 3605
Jennifer Frederika [email protected]
Research AnalystCoal, Oil and gas, Metals
ext 3606
Chandra [email protected] Analyst, Transportation
ext 3609
Maxi [email protected] Analyst
Auto, Construction, Consumer, Mediaext 3615
Nuriah [email protected] Executive
ext 3001
Nurul [email protected]
Equity Salesext 2543
Siti Fathia Maisa [email protected]
Equity Salesext 2547
Ashish [email protected]
Vice PresidentInstitutional Equity Sales
ext 2550 / 2553
Reynard [email protected]
Equity Salesext 2528
John M. [email protected]
Equity Salesext 2549
Yohanes Adhi [email protected]
Manager, Surabaya Branchext 7250
Angky [email protected]
Sales Traderext 2525
Suwardi Widjaja [email protected]
Equity Salesext 2548
Ricardo Silaen, [email protected]
Vice PresidentInstitutional Equity Sales
ext 2524
Nurul [email protected]
Equity Salesext 2543
Amelia [email protected]
Vice PresidentInstitutional Equity Sales
ext 2552
Jonathan Gregorius [email protected]
Research Associateext 3613
Made Ayu [email protected]
Research Executiveext 3607
Laurensius [email protected]
Research Associateext 3601
Nico [email protected] Associate
ext 3614
Zefanya Angeline [email protected]
Research Associateext 3612
Giovanni [email protected]
Senior Research Associateext 3604
Head Office Surabaya Branch
Graha Niaga, 19th Floor Wisma BII, Ground Floor
Jl. Jend. Sudirman Kav. 58 Jl. Pemuda 60-70
Jakarta 12190 Surabaya 60271
Indonesia Indonesia
Tel. 62 21 250 5081 Tel. 62 31 535 2788
Fax. 62 21 522 6049 http://www.bahana.co.id Fax. 62 31 546 1157
PT Bahana Securities – Equity Research – Bahana Beacon - The Daily 12
Asiamoney’s
2013
Best Domestic
Equity House
Disclaimer This publication is prepared by PT.Bahana Securities and reviewed by Daiwa Securities Group Inc. and/or its non-U.S. affiliates, and distributed outside Indonesia by Daiwa Securities Group Inc. and/or its non-U.S. affiliates, except to the extent expressly provided herein. Certain copies of this publication may be distributed inside and outside of Indonesia by PT. Bahana Securities in accordance with relevant laws and regulations. This publication and the contents hereof are intended for information purposes only, and may be subject to change without further notice. Any use, disclosure, distribution, dissemination, copying, printing or reliance on this publication for any other purpose without our prior consent or approval is strictly prohibited. Neither Daiwa Securities Group Inc. nor any of its respective parent, holding, subsidiaries or affiliates, nor any of its respective directors, officers, servants and employees, represent nor warrant the accuracy or completeness of the information contained herein or as to the existence of other facts which might be significant, and will not accept any responsibility or liability whatsoever for any use of or reliance upon this publication or any of the contents hereof. Neither this publication, nor any content hereof, constitute, or are to be construed as, an offer or solicitation of an offer to buy or sell any of the securit ies or investments mentioned herein in any country or jurisdiction nor, unless expressly provided, any recommendation or investment opinion or advice. Any view, recommendation, opinion or advice expressed in this publication constitutes the views of the analyst(s) named herein and does not necessarily reflect those of Daiwa Securities Group Inc. and/or its affiliates nor any of its respective directors, officers, servants and employees except where the publication states otherwise. This research report is not to be relied upon by any person in making any investment decision or otherwise advising with respect to, or dealing in, the securities mentioned, as it does not take into account the specific investment objectives, financial situation and particular needs of any person.
Neither Daiwa Securities Group Inc. nor any of its affiliates is licensed to undertake any business within the Republic of Indonesia. Any display of any trade name or logo of the Daiwa Securities Group Inc. on this publication shall not be deemed to be an undertaking of any business within the Republic of Indonesia.
Daiwa Securities Group Inc., its subsidiaries or affiliates, or its or their respective directors, officers and employees from time to time have trades as principals, or have positions in, or have other interests in the securities of the company under research including derivatives in respect of such securities or may have also performed investment banking and other services for the issuer of such securities. The following are additional disclosures.
Japan
Daiwa Securities Co. Ltd. and Daiwa Securities Group Inc.
Daiwa Securities Co. Ltd. is a subsidiary of Daiwa Securities Group Inc.
Investment Banking Relationship
Within the preceding 12 months, The subsidiaries and/or affiliates of Daiwa Securities Group Inc. * has lead-managed public offerings and/or secondary offerings (excluding straight bonds) of the securities of the following companies: Chaowei Power Holdings Limited (951 HK); CITIC Securities Company Limited (6030 HK); China Outfitters Holdings Limited (1146 HK); The People's Insurance Company (Group) of China Limited (1339 HK); China Precious Metal Resources Holdings Company Limited (1194 HK); Jiangnan Group Limited (1366 HK); Blackgold International Holdings Ltd (BGG AU); Tosei Corporation (8923 JP); Modern Land (China) Co. Ltd (1107 HK).
*Subsidiaries of Daiwa Securities Group Inc. for the purposes of this section shall mean any one or more of:
• Daiwa Capital Markets Hong Kong Limited
• Daiwa Capital Markets Singapore Limited
• Daiwa Capital Markets Australia Limited
• Daiwa Capital Markets India Private Limited
• Daiwa-Cathay Capital Markets Co., Ltd.
• Daiwa Securities Capital Markets Korea Co., Ltd
Disclosure of Interest of Bahana Securities
Investment Banking Relationship
Within the preceding 12 months, Bahana Securities has lead-managed public offerings and/or secondary offerings (excluding straight bonds) of the securities of the following companies: Sri Rejeki Isman Tbk PT (SRIL IJ); Semen Baturaja (Persero) Tbk PT (SMBR IJ); Waskita Karya (Persero) Tbk PT (WSKT IJ); Tiphone Mobile Indonesia Tbk PT (TELE IJ); Austindo Nusantara Jaya Tbk PT (ANJT IJ); Telekomunikasi Indonesia (Persero) Tbk PT (TLKM IJ); Garuda Indonesia (Persero) Tbk PT (GIAA IJ)
Hong Kong
This research is distributed in Hong Kong by Daiwa Capital Markets Hong Kong Limited (“DHK”) which is regulated by the Hong Kong Securities and Futures Commission. Recipients of this research in Hong Kong may contact DHK in respect of any matter arising from or in connection with this research.
Ownership of Securities
For “Ownership of Securities” information, please visit BlueMatrix disclosure Link at https://daiwa3.bluematrix.com/sellside/Disclosures.action.
Investment Banking Relationship
For “Investment Banking Relationship”, please visit BlueMatrix disclosure Link at https://daiwa3.bluematrix.com/sellside/Disclosures.action.
Relevant Relationship (DHK)
DHK may from time to time have an individual employed by or associated with it serves as an officer of any of the companies under its research coverage.
DHK market making
DHK may from time to time make a market in the securities covered by this research.
Singapore
This research is distributed in Singapore by Daiwa Capital Markets Singapore Limited and it may only be distributed in Singapore to accredited investors, expert investors and institutional investors as defined in the Financial Advisers Regulations and the Securities and Futures Act (Chapter 289), as amended from time to time. By virtue of distribution to these category of investors, Daiwa Capital Markets Singapore Limited and its representatives are not required to comply with Section 36 of the Financial Advisers Act (Chapter 110) (Section 36 relates to disclosure of Daiwa Capital Markets Singapore Limited’s interest and/or its representative’s interest in securities). Recipients of this research in Singapore may contact Daiwa Capital Markets Singapore Limited in respect of any matter arising from or in connection with the research.
Australia
This research is distributed in Australia by Daiwa Capital Markets Stockbroking Limited and it may only be distributed in Australia to wholesale investors within the meaning of the Corporations Act. Recipients of this research in Australia may contact Daiwa Capital Markets Stockbroking Limited in respect of any matter arising from or in connection with the research.
Ownership of Securities
For “Ownership of Securities” information, please visit BlueMatrix disclosure Link at https://daiwa3.bluematrix.com/sellside/Disclosures.action.
India
This research is distributed by Daiwa Capital Markets India Private Limited (DAIWA) which is an intermediary registered with Securities & Exchange Board of India. This report is not to be considered as an offer or solicitation for any dealings in securities. While the information in this report has been compiled by DAIWA in good faith from sources believed to be reliable, no representation or warranty, express of implied, is made or given as to its accuracy, completeness or correctness. DAIWA its officers, employees, representatives and agents accept no liability whatsoever for any loss or damage whether direct,
PT Bahana Securities – Equity Research – Bahana Beacon - The Daily 13
Asiamoney’s
2013
Best Domestic
Equity House
indirect, consequential or otherwise howsoever arising (whether in negligence or otherwise) out of or in connection with or from any use of or reliance on the contents of and/or omissions from this document. Consequently DAIWA expressly disclaims any and all liability for, or based on or relating to any such information contained in or errors in or omissions in this report. Accordingly, you are recommended to seek your own legal, tax or other advice and should rely solely on your own judgment, review and analysis, in evaluating the information in this document. The data contained in this document is subject to change without any prior notice DAIWA reserves its right to modify this report as maybe required from time to time. DAIWA is committed to providing independent recommendations to its Clients and would be happy to provide any information in response to any query from its Clients. This report is strictly confidential and is being furnished to you solely for your information. The information contained in this document should not be reproduced (in whole or in part) or redistributed in any form to any other person. We and our group companies, affiliates, officers, directors and employees may from time to time, have long or short positions, in and buy sell the securities thereof, of company(ies) mentioned herein or be engaged in any other transactions involving such securities and earn brokerage or other compensation or act as advisor or have the potential conflict of interest with respect to any recommendation and related information or opinion. DAIWA prohibits its analyst and their family members from maintaining a financial interest in the securities or derivatives of any companies that the analyst cover. This report is not intended or directed for distribution to ,or use by any person, citizen or entity which is resident or located in any state or country or jurisdiction where such publication, distribution or use would be contrary to any statutory legislation, or regulation which would require DAIWA and its affiliates/ group companies to any registration or licensing requirements. The views expressed in the report accurately reflect the analyst’s personal views about the securities and issuers that are subject of the Report, and that no part of the analyst’s compensation was, is or will be directly or indirectly, related to the recommendations or views expressed in the Report. This report does not recommend to US recipients the use of Daiwa Capital Markets India Private Limited or any of its non – US affiliates to effect trades in any securities and is not supplied with any understanding that US recipients will direct commission business to Daiwa Capital Markets India Private Limited.
Taiwan
This research is distributed in Taiwan by Daiwa-Cathay Capital Markets Co., Ltd and it may only be distributed in Taiwan to institutional investors or specific investors who have signed recommendation contracts with Daiwa-Cathay Capital Markets Co., Ltd in accordance with the Operational Regulations Governing Securities Firms Recommending Trades in Securities to Customers. Recipients of this research in Taiwan may contact Daiwa-Cathay Capital Markets Co., Ltd in respect of any matter arising from or in connection with the research.
Philippines
This research is distributed in the Philippines by DBP-Daiwa Capital Markets Philippines, Inc. which is regulated by the Philippines Securities and Exchange Commission and the Philippines Stock Exchange, Inc. Recipients of this research in the Philippines may contact DBP-Daiwa Capital Markets Philippines, Inc.
in respect of any matter arising from or in connection with the research. DBP-Daiwa Capital Markets Philippines, Inc. recommends that investors
independently assess, with a professional advisor, the specific financial risks as well as the legal, regulatory, tax, accounting, and other consequences of a
proposed transaction. DBP-Daiwa Capital Markets Philippines, Inc. may have positions or may be materially interested in the securities in any of the markets
mentioned in the publication or may have performed other services for the issuers of such securities.
For relevant securities and trading rules please visit SEC and PSE Link at http://www.sec.gov.ph/irr/AmendedIRRfinalversion.pdf and
http://www.pse.com.ph/ respectively.
United Kingdom
This research report is produced by Daiwa Capital Markets Europe Limited and/or its affiliates and is distributed in the European Union, Iceland, Liechtenstein, Norway and Switzerland. Daiwa Capital Markets Europe Limited is authorised and regulated by The Financial Conduct Authority (“FCA”) and is a member of the London Stock Exchange, Eurex and NYSE Liffe. Daiwa Capital Markets Europe Limited and/or its affiliates may, from time to time, to the extent permitted by law, participate or invest in other financing transactions with the issuers of the securities referred to herein (the “Securities”), perform services for or solicit business from such issuers, and/or have a position or effect transactions in the Securities or options thereof and/or may have acted as an underwriter during the past twelve months for the issuer of such securities. In addition, employees of Daiwa Capital Markets Europe Limited and/or its affiliates may have positions and effect transactions in such securities or options and may serve as Directors of such issuers. Daiwa Capital Markets Europe Limited may, to the extent permitted by applicable UK law and other applicable law or regulation, effect transactions in the Securities before this material is published to recipients.
This publication is intended for investors who are not Retail Clients in the United Kingdom within the meaning of the Rules of the FCA and should not therefore be distributed to such Retail Clients in the United Kingdom. Should you enter into investment business with Daiwa Capital Markets Europe’s affiliates outside the United Kingdom, we are obliged to advise that the protection afforded by the United Kingdom regulatory system may not apply; in particular, the benefits of the Financial Services Compensation Scheme may not be available.
Daiwa Capital Markets Europe Limited has in place organisational arrangements for the prevention and avoidance of conflicts of interest. Our conflict management policy is available at http://www.uk.daiwacm.com/about-us/corporate-governance-and-regulatory. Regulatory disclosures of investment banking relationships are available at https://daiwa3.bluematrix.com/sellside/Disclosures.action.
Germany
This document has been approved by Daiwa Capital Markets Europe Limited and is distributed in Germany by Daiwa Capital Markets Europe Limited, Niederlassung Frankfurt which is regulated by BaFin (Bundesanstalt fuer Finanzdienstleistungsaufsicht) for the conduct of business in Germany.
Bahrain
This research material is issued/compiled by Daiwa Capital Markets Europe Limited, Bahrain Branch, regulated by The Central Bank of Bahrain and holds Investment Business Firm – Category 2 license and having its official place of business at the Bahrain World Trade Centre, South Tower, 7th floor, P.O. Box 30069, Manama, Kingdom of Bahrain. Tel No. +973 17534452 Fax No. +973 535113
This material is provided as a reference for making investment decisions and is not intended to be a solicitation for investment. Investment decisions should be made at your own discretion and risk. Accordingly, no representation or warranty, express or implied, is made as to and no reliance should be placed on the fairness, accuracy, completeness or correctness of the information and opinions contained in this document, Content herein is based on information available at the time the research material was prepared and may be amended or otherwise changed in the future without notice. All information is intended for the private use of the person to whom it is provided without any liability whatsoever on the part of Daiwa Capital Markets Europe Limited, Bahrain Branch, any associated company or the employees thereof. If you are in doubt about the suitability of the product or the research material itself, please consult your own financial adviser. Daiwa Capital Markets Europe Limited, Bahrain Branch retains all rights related to the content of this material, which may not be redistributed or otherwise transmitted without prior consent.
For stocks and sectors in Indonesia covered by Bahana Securities, the following rating system is in effect:
Stock ratings are based on absolute upside or downside, which is the difference between the target price and the current market price. Unless otherwise specified, these ratings are set with a 12-month horizon. It is possible that future price volatility may cause a temporary mismatch between upside/downside for a stock based on the market price and the formal rating. "Buy": the price of the security is expected to increase by 10% or more. "Hold": the price of the security is expected to range from an increase of less than 10% to a decline of less than 5%. "Reduce": the price of the security is expected to decline by 5% or more.
Sector ratings are based on fundamentals for the sector as a whole. Hence, a sector may be rated “Overweight” even though its constituent stocks are all rated “Reduce”; and a sector may be rated “Underweight” even though its constituent stocks are all rated “Buy”. “Overweight”: positive fundamentals for the sector. “Neutral”: neither positive nor negative fundamentals for the sector. “Underweight”: negative fundamentals for the sector.
Ownership of Securities For “Ownership of Securities” information, please visit BlueMatrix disclosure Link at https://daiwa3.bluematrix.com/sellside/Disclosures.action .
Investment Banking Relationships
PT Bahana Securities – Equity Research – Bahana Beacon - The Daily 14
Asiamoney’s
2013
Best Domestic
Equity House
For “Investment Banking Relationship”, please visit BlueMatrix disclosure Link at https://daiwa3.bluematrix.com/sellside/Disclosures.action .
Relevant Relationships (Bahana Securities) Bahana Securities may from time to time have an individual employed by or associated with it serves as an officer of any of the companies under its research coverage.
Bahana Securities market making Bahana Securities may from time to time make a market in securities covered by this research.
Additional information may be available upon request.
Japan - additional notification items pursuant to Article 37 of the Financial Instruments and Exchange Law
(This Notification is only applicable where report is distributed by Daiwa Securities Co. Ltd.)
If you decide to enter into a business arrangement with us based on the information described in materials presented along with this document, we ask you to pay close attention to the following items.
In addition to the purchase price of a financial instrument, we will collect a trading commission* for each transaction as agreed beforehand with you. Since
commissions may be included in the purchase price or may not be charged for certain transactions, we recommend that you confirm the commission for
each transaction.
In some cases, we may also charge a maximum of ¥ 2 million (including tax) per year as a standing proxy fee for our deposit of your securities, if you are
a non-resident of Japan.
For derivative and margin transactions etc., we may require collateral or margin requirements in accordance with an agreement made beforehand with
you. Ordinarily in such cases, the amount of the transaction will be in excess of the required collateral or margin requirements.
There is a risk that you will incur losses on your transactions due to changes in the market price of financial instruments based on fluctuations in interest
rates, exchange rates, stock prices, real estate prices, commodity prices, and others. In addition, depending on the content of the transaction, the loss could exceed the amount of the collateral or margin requirements.
There may be a difference between bid price etc. and ask price etc. of OTC derivatives handled by us.
Before engaging in any trading, please thoroughly confirm accounting and tax treatments regarding your trading in financial instruments with such experts
as certified public accountants.
*The amount of the trading commission cannot be stated here in advance because it will be determined between our company and you based on current market conditions and the content of each transaction etc.
When making an actual transaction, please be sure to carefully read the materials presented to you prior to the execution of agreement, and to take responsibility for your own decisions regarding the signing of the agreement with us.
Corporate Name: Daiwa Securities Co. Ltd.
Financial instruments firm: chief of Kanto Local Finance Bureau (Kin-sho) No.108
Memberships: Japan Securities Dealers Association, Financial Futures Association of Japan
Japan Securities Investment Advisers Association
Type II Financial Instruments Firms Association
Related Documents