Beach Road Drainage Improvements Feasibility Study Beach Road Drainage Improvements Feasibility Study Final Report Prepared for: Water Resources 1001 Sarasota Center Boulevard Sarasota, Florida 34240 Prepared by: and December 2005

Welcome message from author
This document is posted to help you gain knowledge. Please leave a comment to let me know what you think about it! Share it to your friends and learn new things together.
Transcript

Beach Road Drainage Improvements Feasibility Study
Beach Road Drainage Improvements Feasibility Study
Final Report
Prepared for:
Water Resources 1001 Sarasota Center Boulevard
Sarasota, Florida 34240
Prepared by:
and
December 2005
Beach Road Drainage Improvements Feasibility Study
ii
Drainage Improvements Feasibility Study
Final Report
for
Beach Road
Prepared for:
Water Resources 1001 Sarasota Center Boulevard
Sarasota, Florida 34240
Prepared by:
6900 Professional Parkway East
Sarasota, Florida 34240
and
2803 Fruitville Road
Suite 130 Sarasota, Florida 34237

Beach Road Drainage Improvements Feasibility Study
iii
Table of Contents Page
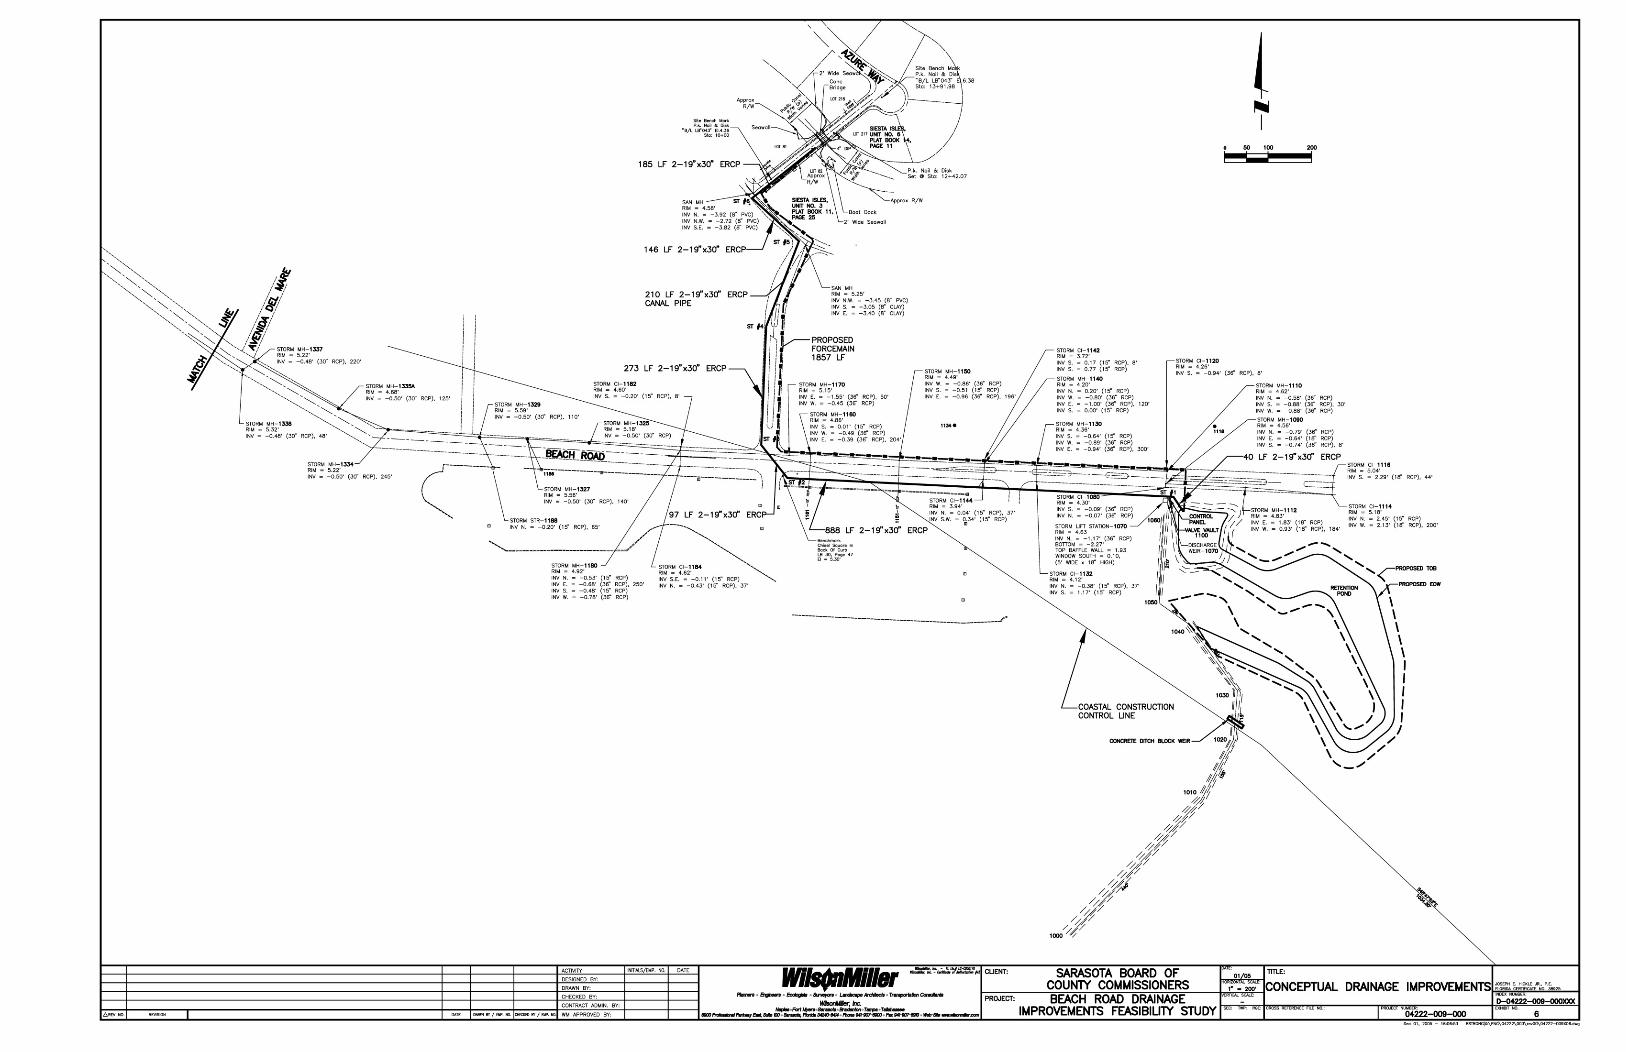
FOREWORD.............................................................................................................................. i ACKNOWLEDGEMENTS .......................................................................................................... i EXECUTIVE SUMMARY .......................................................................................................... ii 1.0 Introduction ......................................................................................................................... 1 2.0 Existing System Description ............................................................................................... 3 3.0 Development of Stormwater Treatment Alternatives ........................................................ 14 4.0 Alternatives Analysis......................................................................................................... 15 5.0 Recommendations ............................................................................................................ 28 6.0 References........................................................................................................................ 29 Appendices Appendix A - Beach Road Drainage Project Vicinity Map Appendix B - Study Area Map Appendix C - Drainage Basin Map Appendix D - Link Node Schematic Appendix E - WWTPs Using UV Disinfection in Florida Appendix F - Newspaper Article - Siesta Key Beach Water Quality Appendix G - Public Meeting Minutes - Healthy Beaches Appendix H - Wet Detention Pond Conceptual Designs and Equipment Appendix I - Stormwater Modeling Scenarios and Results Appendix J - SWFWMD Pre-Application Meeting Minutes Appendix K - Sarasota County Draft Report Review Comments Exhibits 1 Vicinity Map 2 Study Area Map 3 Drainage Basin Map 4 & 5 Link Node Schematic 6 Conceptual Drainage Improvement Plan Figures E-1 Project Decision Tree 1 Beach Advisory Rainfall 2 Project Location Map 3 Historical Aerial Map 4 Bacteria Removal 5 Project Decision Tree 6 Bird Contact at the Beach 7 Human Contact at the Beach 8 Grand Canal Fecal Coliform Sampling 9 Sarasota County Sampling Stations 10 Stormwater Pipe Sediment and Debris 11 Beach Ditch Fecal Coliform Concentrations

Beach Road Drainage Improvements Feasibility Study
iv
Tables 1 Flow Rates 2 Pollutant Removal Efficiencies 3 Treatment Pond Acreage Estimates 4 Cost Comparisons
Beach Road Drainage Improvements Feasibility Study
i
FOREWORD
This report was prepared for Sarasota County by WilsonMiller and Post, Buckley, Schuh & Jernigan (PBS&J) under contract number 2001-192.
ACKNOWLEDGEMENTS
Several staff from Sarasota County provided significant support and guidance to this project including: Ms. Theresa Connor, Mr. Bruce Maloney, Ms. Kathy Meaux, and Mr. Peter Peduzzi.

EXECUTIVE SUMMARY
Beach Road Drainage Improvements Feasibility Study
ii
EXECUTIVE SUMMARY On April 12, 2004, concentrations of the fecal indicator bacteria groups Enterococcus and fecal coliforms were above state-mandated limits in the gulf, causing recreational water quality to be rated “poor,” and a “no swim” advisory to be issued for Siesta Key Beach. Sarasota County staff immediately began comprehensive water quality monitoring at several locations upstream of the beach area that received the advisory. However, since the coliform bacteria tests only serve as an indicator of fecal contamination, a definitive source for the high bacteria counts could not be determined. A study was initiated to determine the cause of the elevated bacterial counts. A storm sewer survey of the area identified an underground system of inlets and pipes that delivers stormwater to an underground vault, from which the first flush of stormwater is pumped to a retention pond. Subsurface flow from the retention pond along with excess runoff from the road flow to a ditch that discharges at Siesta Key Beach and empties near the Florida Department of Health (DOH) recreational beach monitoring site. Although the stormwater pipe system should not contain sewage, the observation of high bacterial counts during storm events called this assumption into question. Smoke tests and inspections of the wastewater force main system by Siesta Key Utilities Authority (SKUA) did not reveal any leaks into the stormwater conveyance system. High levels of indicator bacteria (fecal coliforms and enterococci) in the stormwater/vault/drain-age ditch suggested that these might be environmental reservoirs of indicator bacteria. No human-specific signals were obtained from the polymerase chain reaction (PCR) tests during either sample event, suggesting that no relationship exists between fecal indicator bacteria in the stormwater system and existing wastewater conveyance systems. Analysis of the Enterococcus fingerprints showed that during the rain event, populations in beach water and sediments were similar to populations in the ditch sediments and ditch water, as well as to populations in vault water and water in the stormwater pipe system. Similar results were found for E. coli populations. Based on the results of the source tracking study, a feasibility study to evaluate various options for disinfection and diversion of stormwater from Siesta Key Beach was conducted. Sarasota County retained WilsonMiller and PBS&J to prepare a feasibility study for drainage improvements to Beach Road in the vicinity of Siesta Beach. WilsonMiller staff evaluated alternatives for a different discharge location for the Beach Road drainage system other than the Gulf of Mexico. PBS&J staff evaluated treatment and disinfection alternatives to improve water quality prior to discharge. A “treatment train” approach was recommended to treat and disinfect both baseflow and stormwater runoff. Prior to the selection of a preferred alternative, the project team developed a decision tree to assist in the logical selection of optimal treatment alternatives, water delivery methods, and discharge locations. The decision tree is presented in Figure E-1 on the following page. Considerations that influenced alternative selections in the decision tree included identification of an alternative discharge location. An alternative discharge location is necessary since the existing freshwater baseflow from the ditch to the beach attracts large flocks of wading and shorebirds. This creates a secondary source of fecal loading to the beach and could pose a health risk to recreational users in or near this outfall. Discharge options included:
Beach Road Drainage Improvements Feasibility Study
ii
1. Maintaining the existing discharge in the current configuration
2. Construction of an offshore outfall via a subsurface pipe
3. Directing the existing baseflow and stormwater runoff away from the beach and allowing only infrequent high flows caused by major storm events (e.g., hurricanes) to continue to pass through to the beach.
A cost benefit analysis was performed to determine the preferred alternative for treating and discharging stormwater at the Siesta Key Beach site. Since Alternatives 1 and 2 had fatal flaws; in that the water quality discharged from either alternative would not likely meet water quality standards consistently at the discharge, only Alternative 3 was evaluated with a discharge location to the Grand Canal compared for cost and feasibility based on gravity sewer and pumping/force main options. The preliminary cost analysis was prepared for a gravity alternative to the Grand Canal at $1.8 million and a pumping alternative to the Grand Canal at $1.4 million. The recommendation is to proceed with a Preliminary Design Report phase to further define project design components, costs of construction, and operation and maintenance costs.

Beach Road Drainage Improvements Feasibility Study
ii
Figure E-1. Decision tree used to select the preferred stormwater treatment alternative for Siesta Key Beach.

1.0 INTRODUCTION

Beach Road Drainage Improvements Feasibility Study 1
1.0 Introduction Siesta Key Beach is located on a barrier island on the west coast of Florida in Sarasota County. It has been consistently listed among the top beaches in the United States and the world. On April 12, 2004, immediately following a significant rainfall event (Figure 1), fecal indicator bacteria levels at Siesta Key Beach were found to be elevated, causing water quality to be rated “poor” for both Enterococcus and fecal coliform parameters. As a result, a “no swim” advisory was issued for the recreational beach area. Sarasota County staff have sampled several locations upstream of the beach area that received the advisory. The existing stormwater drainage system on Beach Road drains to a low point at which a stormwater pump station can discharge accumulated water in the pipe into a small retention pond. The pond discharges through side bank filtration into a ditch/swale system draining to the Gulf of Mexico and Siesta Key Beach. Discharge from the pipe system can also enter the Grand Canal via pipes along Calle De Siesta and Plaza De Las Palmas streets. Local residents report street flooding from a relatively small amount of rainfall. See Vicinity Map Exhibit 1 – Appendix A. Sample results from the County monitoring effort showed very high concentrations (above Class III Recreational Water Quality Standards) of both total and fecal coliform bacteria at numerous locations in the ditch and stormwater pipe drainage system that discharged to Siesta Key Beach. A follow-up study was conducted by the project team consisting of PBS&J, the University of South Florida, and Biological Consulting Services of North Florida Inc., to assess the source(s) of bacterial contamination at the beach (Harwood et al., 2005). Although no evidence of a human source was found for the indicator bacteria within the stormwater system, there was evidence that the stormwater conveyance system is acting as a reservoir, or “breeding ground” for indicator bacteria. Rainfall flushes high bacterial loads through the system, and probably resuspends bacteria living in the sediments of the stormwater pipe, a vault structure, and drainage ditch, further elevating the load to receiving waters at the beach. The microbial pollution delivered to Siesta Key Beach via the stormwater system does not carry the same level of risk that it would if the pollution were from human sewage. However, members of the enterococci, including Enterococcus faecium and Enterococcus faecalis, are opportunistic pathogens, and elevated levels could conceivably pose a risk for the very young or immunocompromised. One of the final recommendations from this study was that the diversion of the drainage ditch from the beach should decrease or stop the intermittent observations of high bacterial levels at the beach. However, treatment of the diverted runoff should be considered if it will be discharged to other surface waters that would have human contact. Sarasota County retained WilsonMiller and PBS&J to prepare a feasibility study for drainage improvements to Beach Road in the vicinity of Siesta Beach. WilsonMiller staff evaluated alternatives for a different discharge location for the Beach Road drainage system other than the Gulf of Mexico. PBS&J staff evaluated treatment and disinfection alternatives to improve water quality prior to discharge.

Beach Road Drainage Improvements Feasibility Study
2
Rainfall at Siesta Key BeachSWFWMD ROMP Station 566
0
0.5
1
1.5
2
2.5
4/5/
2004
4/6/
2004
4/7/
2004
4/8/
2004
4/9/
2004
4/10
/200
4
4/11
/200
4
4/12
/200
4
4/13
/200
4
4/14
/200
4
4/15
/200
4
4/16
/200
4
4/17
/200
4
4/18
/200
4
4/19
/200
4
4/20
/200
4
Rai
nfal
l (in
ches
)
Figure 1. Rainfall, in inches, during the beach advisory at Siesta Key Beach.
The purpose of this feasibility study is to determine if a different discharge route for stormwater runoff is plausible after the discharge is treated or disinfected to enhance water quality. A treatment train approach was considered based on the existing site conditions, potential to treat other stormwater-related contaminants, and cost.

2.0 EXISTING SYSTEM DESCRIPTION
Beach Road Drainage Improvements Feasibility Study
3
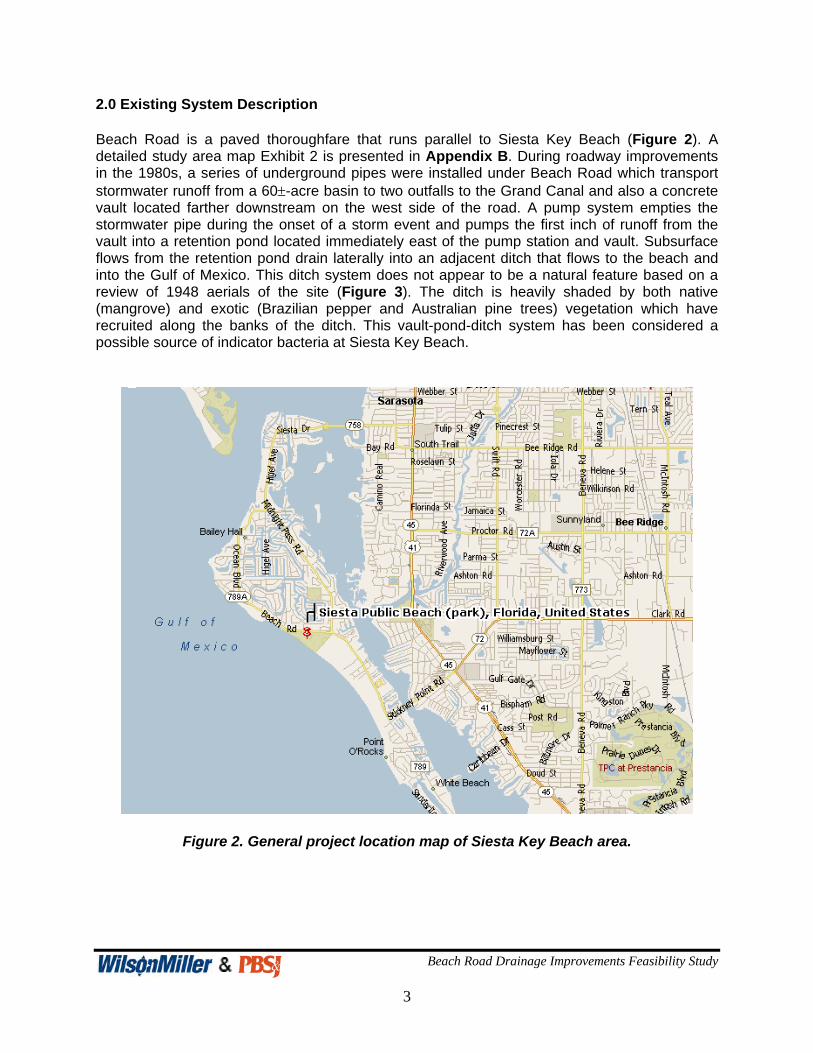
2.0 Existing System Description Beach Road is a paved thoroughfare that runs parallel to Siesta Key Beach (Figure 2). A detailed study area map Exhibit 2 is presented in Appendix B. During roadway improvements in the 1980s, a series of underground pipes were installed under Beach Road which transport stormwater runoff from a 60±-acre basin to two outfalls to the Grand Canal and also a concrete vault located farther downstream on the west side of the road. A pump system empties the stormwater pipe during the onset of a storm event and pumps the first inch of runoff from the vault into a retention pond located immediately east of the pump station and vault. Subsurface flows from the retention pond drain laterally into an adjacent ditch that flows to the beach and into the Gulf of Mexico. This ditch system does not appear to be a natural feature based on a review of 1948 aerials of the site (Figure 3). The ditch is heavily shaded by both native (mangrove) and exotic (Brazilian pepper and Australian pine trees) vegetation which have recruited along the banks of the ditch. This vault-pond-ditch system has been considered a possible source of indicator bacteria at Siesta Key Beach.
Figure 2. General project location map of Siesta Key Beach area.

Beach Road Drainage Improvements Feasibility Study
4
Figure 3. Historical aerial of the Siesta Key Beach area.

Beach Road Drainage Improvements Feasibility Study
5
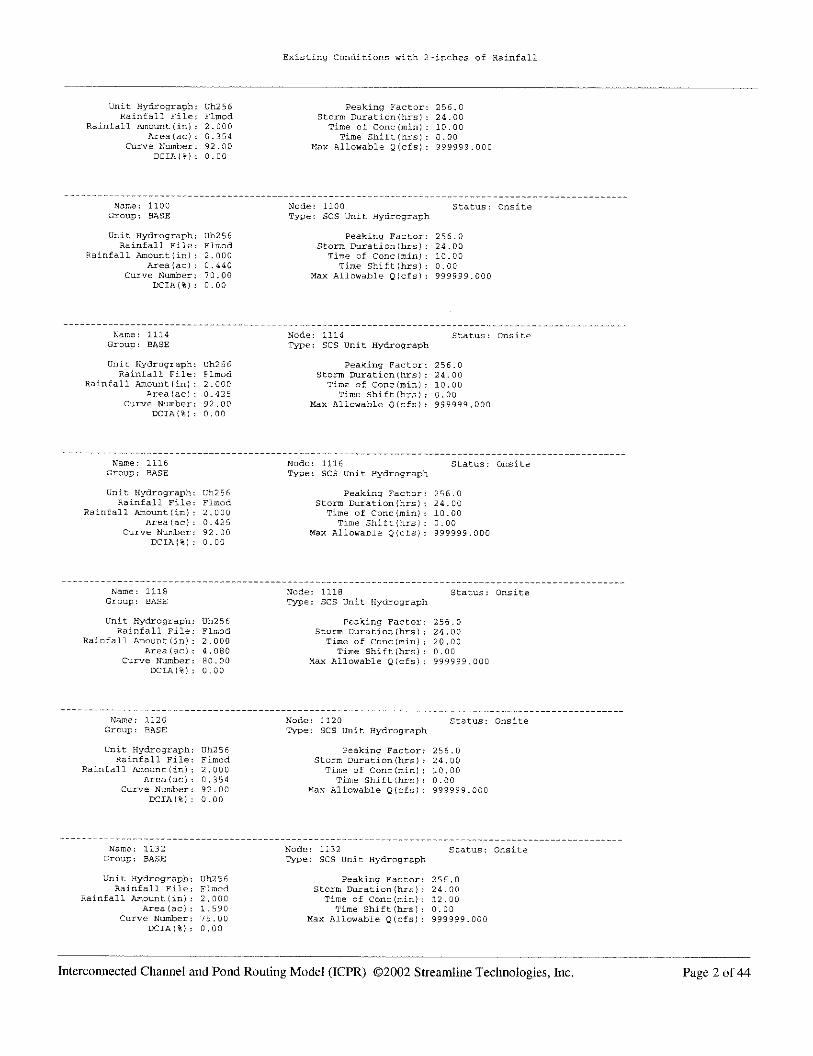
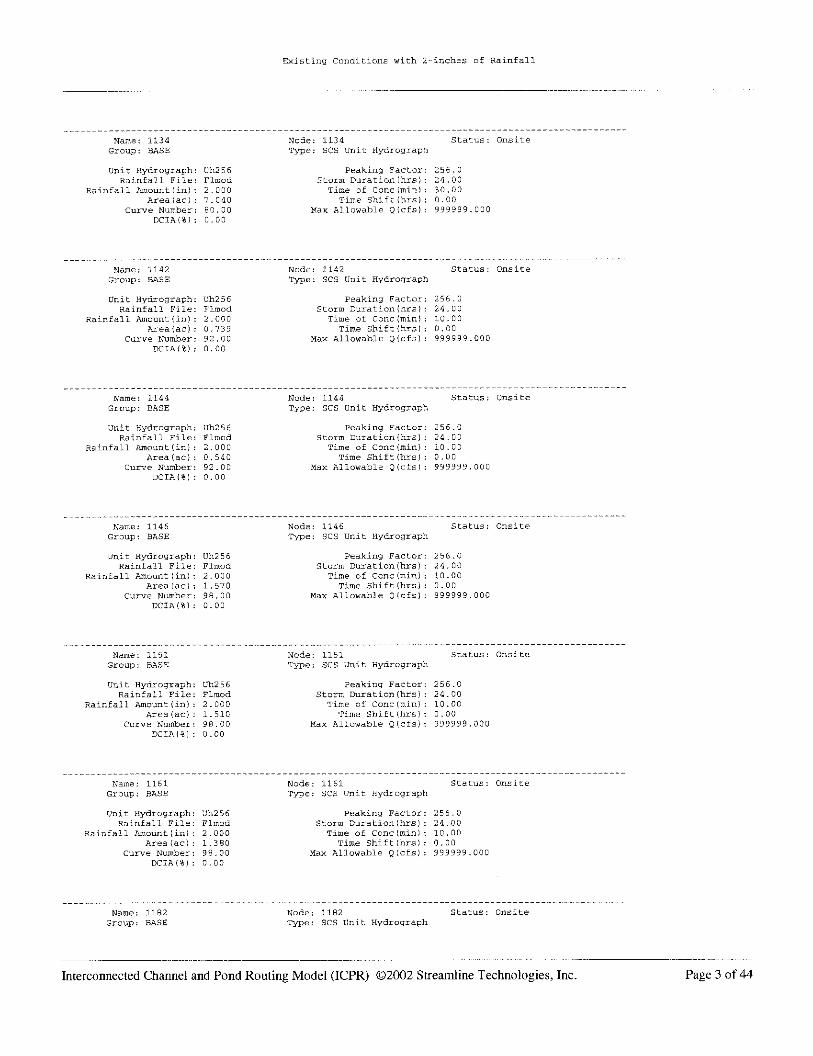
2.1 Development of Stormwater Model Knowledge of runoff flow rates and volumes is critical to any stormwater design project, especially for those requiring specialized stormwater treatment systems including disinfection devices and pumping systems. To determine this information, drainage basins were developed from aerial photography, field observations and from record drawings of the Beach Road storm sewer system. This information is shown on the Drainage Basin Map, Exhibit 3 – Appendix C. An existing stormwater system ICPR computer model was created from both surveyed pipe elevations and from County Record Drawings. Model nodal schematic drawings Exhibits 4 and 5 are presented in Appendix D. Drainage basin curve numbers (CN) and times of concentration were assigned based on a complete urban build-out average condition CN and a relatively short time of concentration of ten minutes. An expected flooding level of service provided by an older storm sewer system is typically a few inches of rain per day. This model was used to determine the existing level of service (LOS) from street flooding for a varying amount of rainfall. Table 1 shows the total volume of stormwater runoff predicted for various rainfall amounts ranging from 1 to 5 inches over a 24-hour period. Simulating the existing retention pond with the beach outfall and the two existing gravity outfall pipes to the Grand Canal, it was determined that no street flooding occurs from a 2-inch rainfall but street flooding occurs from a 3-inch rainfall. All computer modeling simulations accounted for a high tide of elevation 1.10. This defines the LOS that the existing stormwater system can provide. Runoff from more than two inches of rainfall cannot pass through the stormwater system without causing street flooding. This defines a target of an amount of rainfall that should be considered in the design of water quality improvements including both gravity and force main scenarios.

Beach Road Drainage Improvements Feasibility Study
6
Table 1. Beach Road Design Flow Rates RAINFALL RAINFALL RAINFALL RAINFALL RAINFALL RAINFALL RAINFALL RAINFALL RAINFALL RAINFALL P" P" P" P" P" P" P" P" P" P" S 1 1 2 2 3 3 4 4 5 5
BASIN CN AREA 1000/ RUNOFF VOLUME RUNOFF VOLUME RUNOFF VOLUME RUNOFF VOLUME RUNOFF VOLUME NO. AC CN-10 Q" CF Q" CF Q" CF Q" CF Q" CF
1000 68 1.90 4.71 0.00 5.01 0.19 1341.31 0.63 4321.65 1.20 8310.82 1.88 12963.531010 68 0.97 0.87 0.40 517.16 1.24 4355.69 2.16 7609.54 3.12 10977.21 4.09 14398.761020 68 5.61 4.71 0.00 14.79 0.19 3960.40 0.63 12760.24 1.20 24538.80 1.88 38276.521030 68 4.58 4.71 0.00 12.07 0.19 3233.27 0.63 10417.45 1.20 20033.46 1.88 31248.931040 68 0.56 4.71 0.00 1.48 0.19 395.33 0.63 1273.75 1.20 2449.51 1.88 3820.831050 68 1.47 4.71 0.00 3.88 0.19 1037.75 0.63 3343.59 1.20 6429.95 1.88 10029.681080 92 0.35 0.87 0.40 517.16 1.24 1589.60 2.16 2777.09 3.12 4006.12 4.09 5254.811100 70 0.44 4.29 0.00 7.36 0.24 384.29 0.71 1140.86 1.33 2123.75 2.04 3252.411114 92 0.43 0.87 0.40 620.88 1.24 1908.42 2.16 3334.08 3.12 4809.60 4.09 6308.741116 92 0.43 0.87 0.40 620.88 1.24 1908.42 2.16 3334.08 3.12 4809.60 4.09 6308.741118 80 4.08 2.50 0.08 1234.20 0.56 8330.85 1.25 18513.00 2.04 30237.90 2.89 42844.371120 92 0.35 0.87 0.40 517.16 1.24 1589.60 2.16 2777.09 3.12 4006.12 4.09 5254.811132 75 1.59 3.33 0.03 174.90 0.38 2198.74 0.96 5545.36 1.67 9619.50 2.45 14136.481134 80 7.04 2.50 0.08 2129.60 0.56 14374.80 1.25 31944.00 2.04 52175.20 2.89 73927.541142 92 0.74 0.87 0.40 1079.61 1.24 3318.41 2.16 5797.37 3.12 8363.05 4.09 10969.781144 92 0.54 0.87 0.40 788.89 1.24 2424.82 2.16 4236.24 3.12 6111.03 4.09 8015.811161 98 1.38 0.20 0.79 3961.96 1.77 8888.45 2.77 13867.36 3.77 18860.92 4.76 23860.621182 80 1.58 2.50 0.08 477.95 0.56 3226.16 1.25 7169.25 2.04 11709.78 2.89 16591.691184 92 0.97 0.87 0.40 1417.08 1.24 4355.69 2.16 7609.54 3.12 10977.21 4.09 14398.761186 98 2.33 0.20 0.79 6689.40 1.77 15007.32 2.77 23413.74 3.77 31844.89 4.76 40286.401188 98 0.62 0.20 0.79 1780.01 1.77 3993.36 2.77 6230.27 3.77 8473.75 4.76 10719.991151 98 1.51 0.20 0.79 4335.19 1.77 9725.77 2.77 15173.71 3.77 20637.68 4.76 26108.361146 98 1.57 0.20 0.79 4507.45 1.77 10112.23 2.77 15776.64 3.77 21457.72 4.76 27145.771329 80 1.91 2.50 0.08 577.78 0.56 3899.98 1.25 8666.63 2.04 14155.49 2.89 20057.051337 80 3.91 2.50 0.08 1182.78 0.56 7983.73 1.25 17741.63 2.04 28977.99 2.89 41059.19
1347A 80 2.40 2.50 0.08 726.00 0.56 4900.50 1.25 10890.00 2.04 17787.00 2.89 25202.571357 80 1.60 2.50 0.08 484.00 0.56 3267.00 1.25 7260.00 2.04 11858.00 2.89 16801.711360 80 2.16 2.50 0.08 653.40 0.56 4410.45 1.25 9801.00 2.04 16008.30 2.89 22682.311368 80 1.20 2.50 0.08 363.00 0.56 2450.25 1.25 5445.00 2.04 8893.50 2.89 12601.291372 80 2.43 2.50 0.08 735.08 0.56 4961.76 1.25 11026.13 2.04 18009.34 2.89 25517.601382 80 2.90 2.50 0.08 877.25 0.56 5921.44 1.25 13158.75 2.04 21492.63 2.89 30453.11
1" 2" 3" 4" 5" TOTALS CF 37013.35 145455.83 292355.01 460145.80 640498.15 AF 0.85 3.34 6.71 10.56 14.70 GALS 276896.86 1088155.0
92187107.8
0 3442350.7
5 4791566.64
* GPM 192.29 755.66 1518.82 2390.52 3327.48 6" gpm 500.00 8" gpm 1000.00 10" gpm 1500.00 12" gpm 2000.00 * volume pumping rate in gpm over 24 hours

Beach Road Drainage Improvements Feasibility Study
7
2.2 Evaluation of Disinfection Alternatives Since disinfection technologies have been utilized extensively in the water and wastewater industry, a review of current data was performed to determine if any emerging techniques could be transferred to the Siesta Key Beach scenario. The majority of domestic water and wastewater treatment facilities in Florida use chlorination for disinfection. The significant concerns associated with chlorination include:
• Production of potentially hazardous byproducts (chlorinated organic compounds, total tahalomethanes (TTHM) and Haloacetic Acids (HAA5).
• Toxicity concerns from chlorine residual for the biota in the receiving surface waters. Chemical dechlorination would be required.
• Inefficiency of chlorine in inactivation of pathogens
• Potential hazards associated with handling of chlorine in a gas or liquid form Several alternative disinfection techniques have been developed to address some of these concerns. These include the following: Chlorine Dioxide Chlorine dioxide has had extensive use as a water disinfectant in Europe and the U.S. but has yet to be used as a wastewater disinfectant. It is both a powerful bactericide and virucide even at high pH levels and has an important advantage over chlorine in that it does not appear to produce THMs. Chlorine dioxide is a yellow explosive gas produced in situ from the reaction of sodium chlorite with either chlorine gas or hydrochloric acid. Although THMs are not formed, chlorine dioxide can react with organics to yield other potentially hazardous chlorinated or unchlorinated by-products, some of which are known carcinogens. Toxicity concerns from residual concentrations discharged to receiving waters would likely preclude the use of this chemical. Removal of this disinfectant (dechlorination) would be required prior to discharge. Chloramines Chloramines are composed of three chemicals formed when chlorine and ammonia-nitrogen are combined in water: monochloramine (NH2Cl), dichloramine (NHCl2), and trichloramine, or nitrogen trichloride (NCl3). Monochloramine is preferred because of its biocidal properties and minimal taste and odor. Monochloramine is created by controlling the chlorine-to-ammonia ratio to a value generally less than 5:1 by weight or 1:1 on a molar basis. Chloramines play a major role in disinfecting pathogens, controlling tastes and odors, oxidizing inorganics and organics, and suppressing microbiological growth in water distribution systems. For utilities with extensive distribution systems and long detention times, chloramines aid in maintaining disinfectant residuals. Chloramines also have been found to produce fewer total trihalomethanes (TTHMs) than free chlorine.

Beach Road Drainage Improvements Feasibility Study
8
Because they are more stable and less reactive than free chlorine, chloramines as secondary disinfectants help maintain a detectable residual throughout the water distribution system. Although chloramines are weaker disinfectants and require greater contact times than chlorine, utilities that experience bacterial regrowth in their distribution systems and switch to chloramines find that chloramines apparently penetrate deeper into the biofilm layer to inactivate microorganisms and inhibit their growth. Because chloramines produce fewer TTHM disinfection by-products, the US Environmental Protection Agency has suggested the use of chloramines to replace free chlorine as a disinfectant. Case studies indicate common TTHM reductions of 40 to 80 percent when free chlorine is replaced by chloramines. Although Haloacetic Acids are present in lower concentrations with chloramination than with chlorination, research shows that, under certain circumstances, dihaloacetic acids and dissolved organic halogen are not well controlled by the use of chloramines. Research results imply that many unreported DBPs are created by chloramines. Generally, DBP formation decreases as pH increases and the chlorine-to-ammonia ratio decreases. Changing these two operating variables can significantly impact DBP formation. Research has found that two-thirds of medium and large systems in the U.S. that chloraminate experience nitrification to some degree. With this two-step microbial process, ammonia is converted to nitrite and then to nitrate. The intermediate stage-nitrite--depletes the chloramine residual and increases heterotrophic bacteria. Two groups of factors influence nitrification and methods of control: water quality factors (pH, temperature, chloramine residual, ammonia concentration, chlorine-to-ammonia ratio, and concentrations of organic compounds) and distribution factors (detention time, reservoir design and operation, sediment, tuberculation in piping, biofilm, and absence of sunlight). Increased chloramines also lead to accelerated corrosion and degradation of elastomers (i.e., gaskets) and some metals in distribution systems. Toxicity concerns from residual concentrations discharged to receiving waters would likely preclude the use of this chemical. Removal of this disinfectant (dechlorination) would be required prior to discharge. Peracetic Acid Peracetic Acid (PAA) exists as an equilibrium mixture with hydrogen peroxide, acetic acid and water. It is suitable for disinfection and is an efficient bactericide at concentrations of 15 to 20 mg/L PAA and 2 minutes' contact time but is less effective as a virucide. PAA does not form THMs. The chemical has not reached production stage to allow trucking of bulk quantities, but its use will increase in the next 5 to 10 years as the market grows. Again, toxicity concerns from residual concentrations discharged to receiving waters would likely preclude the use of this chemical. Removal of this disinfectant would be required prior to discharge.

Beach Road Drainage Improvements Feasibility Study
9
Since a chemical additive is not likely to be permittable due to potential adverse affects to biological communities in the receiving waters of the discharge (Bay or Gulf of Mexico), several additional alternative disinfection methods were evaluated including ozone and ultraviolet light (UV) treatment. Ozone Ozone has been used as a disinfectant for almost as long as chlorine, although primarily for treating drinking water. Ozone disinfection is the least-used method in the U.S. although this technology has been widely accepted in Europe for decades. Ozone treatment has the ability to achieve higher levels of disinfection than either chlorine or UV; however, the capital costs as well as maintenance expenditures are not competitive with available alternatives. Also, because ozone is generally more expensive to produce and must be generated on-site and used immediately, it has been considered to be a less attractive alternative to chlorine than UV disinfection. Ozone is an unstable gas, which is generated on-site by a high-voltage electrical discharge through air or oxygen. The resulting electrical discharge produces ozone (O3). This reaction results in substantial quantities of heat that must be quickly removed to keep the ozone from decomposing back to oxygen. To reduce the heat, most commercial ozone generators are water-cooled. Ozone decomposes rapidly in aqueous solution and under alkaline conditions hydrolyses to form the OH radical, which is a powerful oxidant. Ozone is both an efficient bactericide and virucide. Though ozone appears not to produce THMs and may even destroy a number of THM precursors, it oxidizes a wide range of natural organics in wastewater and can lead to significant changes in the nature and concentrations of certain organic compounds. Ozone destroys most of the nonvolatile organic constituents in wastewater but produces others; concentrations of mutagenic micropollutants can be increased by ozonation. Advantages:
• Ozone is more effective than chlorine in destroying viruses and bacteria.
• The ozonation process utilizes a short contact time (approximately 10 to 30 minutes).
• There are no harmful residuals that need to be removed after ozonation because ozone decomposes rapidly.
• Ozone is generated on-site, and thus, there are fewer safety problems associated with shipping and handling.
• Ozonation elevates the dissolved oxygen (DO) concentration of the effluent.
• THM formation is avoided.

Beach Road Drainage Improvements Feasibility Study
10
Disadvantages:
• Operation and maintenance costs remain high because of the ozone generation process's more complex technology.
• Ozone must be produced on-site and used immediately.
• Ozone is very reactive and corrosive.
• Ozone is extremely irritating and possibly toxic, so off-gases from the contactor must be destroyed to prevent worker exposure.
• The cost of treatment can be relatively high in capital and in power intensiveness. Ultraviolet (UV) The State of Florida FDEP accepts ultraviolet (UV) disinfection as an alternative disinfection method that can effectively and safely be used to disinfect wastewater, reclaimed water, and drinking water. UV irradiation is the most popular alternative method, has long been recognized as an effective disinfectant and UV, unlike chlorine, does not produce disinfection byproducts, toxicity, or hazardous concerns. A list of Florida domestic wastewater treatment facilities presently using UV is listed in Appendix E. UV disinfection uses special UV lamps to produce UV radiation at optimum germicidal wavelength of 250 to 265 nanometers which inactivates the organism through changes in the cells' deoxyribonucleic acid (DNA). This effectively inactivates the pathogens by interfering with their ability to replicate. Advantages:
• UV disinfection is environmentally positive -- no chemicals are added to the effluent stream; therefore, there are no detrimental effects to aquatic life.
• This technology offers shorter treatment times. UV disinfection requires a six-to-10-second contact time, compared to a five-to-10-minute contact time for ozone and a 15-to-30-minute contact time for chlorine.
• There is no trihalomethane (THM) formation.
• Quartz surface cleaning is a key element of operation and maintenance. However, improvements are being made with self-cleaning wipers.
• The process leaves no residual to prevent regrowth. Disadvantages:
• Operation and maintenance costs remain high because of substantial electrical usage.
Beach Road Drainage Improvements Feasibility Study
11
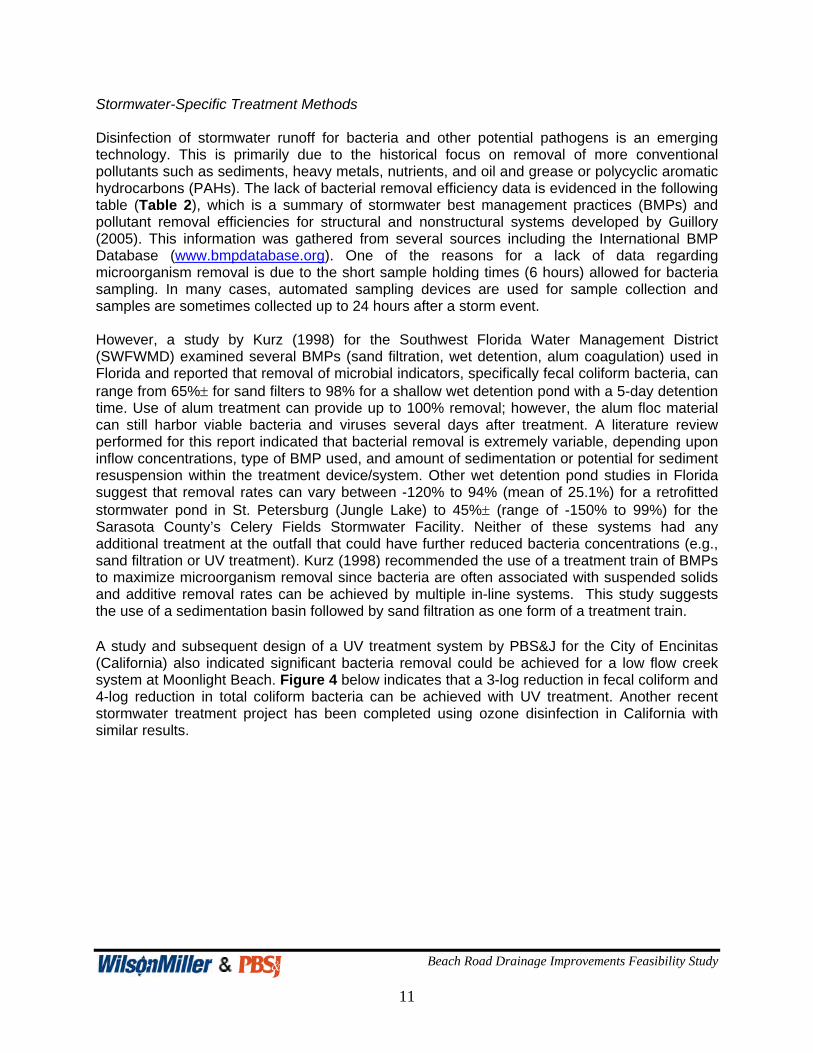
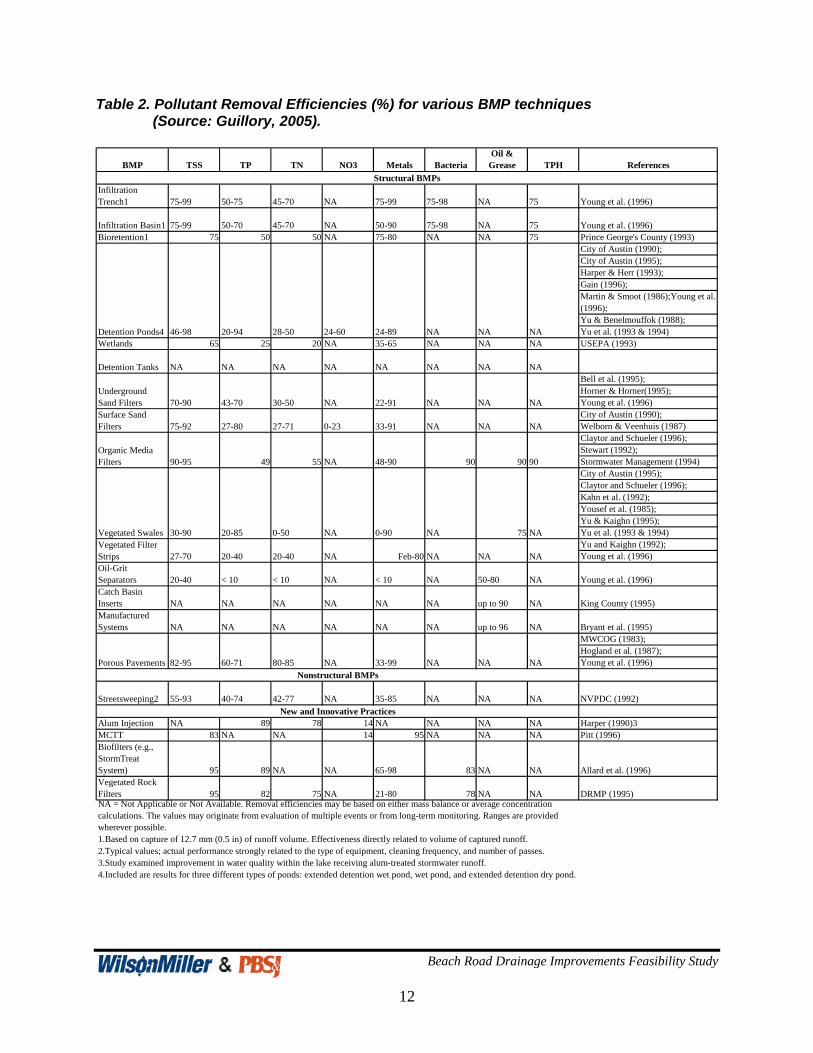
Stormwater-Specific Treatment Methods Disinfection of stormwater runoff for bacteria and other potential pathogens is an emerging technology. This is primarily due to the historical focus on removal of more conventional pollutants such as sediments, heavy metals, nutrients, and oil and grease or polycyclic aromatic hydrocarbons (PAHs). The lack of bacterial removal efficiency data is evidenced in the following table (Table 2), which is a summary of stormwater best management practices (BMPs) and pollutant removal efficiencies for structural and nonstructural systems developed by Guillory (2005). This information was gathered from several sources including the International BMP Database (www.bmpdatabase.org). One of the reasons for a lack of data regarding microorganism removal is due to the short sample holding times (6 hours) allowed for bacteria sampling. In many cases, automated sampling devices are used for sample collection and samples are sometimes collected up to 24 hours after a storm event. However, a study by Kurz (1998) for the Southwest Florida Water Management District (SWFWMD) examined several BMPs (sand filtration, wet detention, alum coagulation) used in Florida and reported that removal of microbial indicators, specifically fecal coliform bacteria, can range from 65%± for sand filters to 98% for a shallow wet detention pond with a 5-day detention time. Use of alum treatment can provide up to 100% removal; however, the alum floc material can still harbor viable bacteria and viruses several days after treatment. A literature review performed for this report indicated that bacterial removal is extremely variable, depending upon inflow concentrations, type of BMP used, and amount of sedimentation or potential for sediment resuspension within the treatment device/system. Other wet detention pond studies in Florida suggest that removal rates can vary between -120% to 94% (mean of 25.1%) for a retrofitted stormwater pond in St. Petersburg (Jungle Lake) to 45%± (range of -150% to 99%) for the Sarasota County’s Celery Fields Stormwater Facility. Neither of these systems had any additional treatment at the outfall that could have further reduced bacteria concentrations (e.g., sand filtration or UV treatment). Kurz (1998) recommended the use of a treatment train of BMPs to maximize microorganism removal since bacteria are often associated with suspended solids and additive removal rates can be achieved by multiple in-line systems. This study suggests the use of a sedimentation basin followed by sand filtration as one form of a treatment train. A study and subsequent design of a UV treatment system by PBS&J for the City of Encinitas (California) also indicated significant bacteria removal could be achieved for a low flow creek system at Moonlight Beach. Figure 4 below indicates that a 3-log reduction in fecal coliform and 4-log reduction in total coliform bacteria can be achieved with UV treatment. Another recent stormwater treatment project has been completed using ozone disinfection in California with similar results.
Beach Road Drainage Improvements Feasibility Study
12
Table 2. Pollutant Removal Efficiencies (%) for various BMP techniques (Source: Guillory, 2005).
BMP TSS TP TN NO3 Metals BacteriaOil &
Grease TPH References
Infiltration Trench1 75-99 50-75 45-70 NA 75-99 75-98 NA 75 Young et al. (1996)
Infiltration Basin1 75-99 50-70 45-70 NA 50-90 75-98 NA 75 Young et al. (1996)Bioretention1 75 50 50 NA 75-80 NA NA 75 Prince George's County (1993)
City of Austin (1990);City of Austin (1995);Harper & Herr (1993);Gain (1996);Martin & Smoot (1986);Young et al. (1996);Yu & Benelmouffok (1988);Yu et al. (1993 & 1994)
Wetlands 65 25 20 NA 35-65 NA NA NA USEPA (1993)
Detention Tanks NA NA NA NA NA NA NA NABell et al. (1995);Horner & Horner(1995);Young et al. (1996)City of Austin (1990);Welborn & Veenhuis (1987)Claytor and Schueler (1996);Stewart (1992);Stormwater Management (1994)City of Austin (1995);Claytor and Schueler (1996);Kahn et al. (1992);Yousef et al. (1985);Yu & Kaighn (1995);Yu et al. (1993 & 1994)Yu and Kaighn (1992);Young et al. (1996)
Oil-Grit Separators 20-40 < 10 < 10 NA < 10 NA 50-80 NA Young et al. (1996)Catch Basin Inserts NA NA NA NA NA NA up to 90 NA King County (1995)Manufactured Systems NA NA NA NA NA NA up to 96 NA Bryant et al. (1995)
MWCOG (1983);Hogland et al. (1987);Young et al. (1996)
Streetsweeping2 55-93 40-74 42-77 NA 35-85 NA NA NA NVPDC (1992)
Alum Injection NA 89 78 14 NA NA NA NA Harper (1990)3MCTT 83 NA NA 14 95 NA NA NA Pitt (1996)Biofilters (e.g., StormTreat System) 95 89 NA NA 65-98 83 NA NA Allard et al. (1996)Vegetated Rock Filters 95 82 75 NA 21-80 78 NA NA DRMP (1995)
2.Typical values; actual performance strongly related to the type of equipment, cleaning frequency, and number of passes. 3.Study examined improvement in water quality within the lake receiving alum-treated stormwater runoff. 4.Included are results for three different types of ponds: extended detention wet pond, wet pond, and extended detention dry pond.
Nonstructural BMPs
New and Innovative Practices
NA = Not Applicable or Not Available. Removal efficiencies may be based on either mass balance or average concentration calculations. The values may originate from evaluation of multiple events or from long-term monitoring. Ranges are provided wherever possible. 1.Based on capture of 12.7 mm (0.5 in) of runoff volume. Effectiveness directly related to volume of captured runoff.
NA
Porous Pavements 82-95 60-71 80-85 NA 33-99 NA NA NA
NA Feb-80 NA NAVegetated Filter Strips 27-70 20-40 20-40
90
Vegetated Swales 30-90 20-85 0-50 NA 0-90 NA 75 NA
NA 48-90 90 90Organic Media Filters 90-95 49 55
NASurface Sand Filters 75-92 27-80 27-71 0-23 33-91 NA NA NA
Underground Sand Filters 70-90 43-70 30-50 NA 22-91 NA NA
NA
Structural BMPs
24-60 24-89 NA NADetention Ponds4 46-98 20-94 28-50

Beach Road Drainage Improvements Feasibility Study
13
Figure 4. Bacteria removal during ambient conditions at the Moonlight Beach Urban Runoff UV Treatment Facility (September 3 through November 26, 2002). Values represent geometric means of daily data.

3.0 DEVELOPMENT OF STORMWATER TREATMENT ALTERNATIVES

Beach Road Drainage Improvements Feasibility Study
14
3.0 DEVELOPMENT OF STORMWATER TREATMENT ALTERNATIVES Based on the information developed in Section 2.0, several treatment alternatives were developed which considered the unique characteristics of the project location. These factors included: the spatial and temporal distribution of bacterial contamination, disinfection system advantages and disadvantages, site space constraints, topography, tidal influence on drainage flow rates and water stage, existing ditch systems and potential wetland impacts, the existing stormwater treatment pond, and future master plan needs for the park. Due to these constraints, options were evaluated that involved treating stormwater runoff from rainfall events that were similar in magnitude (or smaller) than the event that caused the “no swim” advisory. The alternatives evaluated were based on utilizing the existing 36-in storm water pipe system which currently discharges into a control structure located near the maintenance buildings at the Siesta Key Beach Park. The control structure/junction box contains an overflow weir and a small duplex pump station which transfers a portion of the stormwater to an on-site pond. The pond discharges via side bank filtration and also an overflow pipe into the adjacent ditch, which then flows to Siesta Key Beach. The following alternatives were evaluated through a decision matrix (discussed in the next Section) to determine if water quality standards could be met through treatment and disinfection at either the existing beach outfall or an alternative discharge point:
• Alternative 1 – Storm sewer maintenance cleaning with beach discharge
• Alternative 2 – Storm sewer disinfection with a pumped recirculation disinfection system and with beach discharge
• Alternative 3 – Stormwater disinfection by pond treatment system plus additional treatment and disinfection with pumped discharge to alternative receiving water (e.g., Grand Canal)
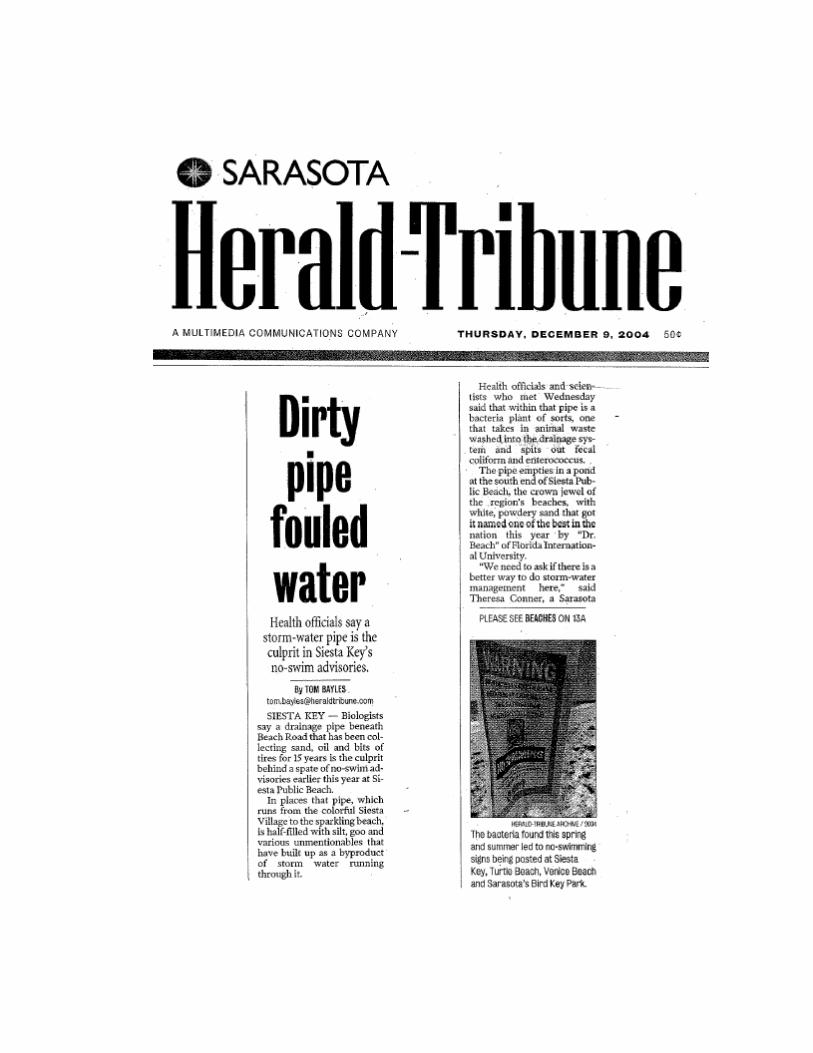
Public Interest A newspaper article was published regarding the outfall to the beach on December 9, 2004 (Appendix F). Due to the potential public interest in the project, an early coordination meeting was held with the public on December 16, 2004. The minutes of the meeting are presented in Appendix G. Several issues related to the lack of greenspace and native vegetation at the park, the location of the outfall to the beach, and poor water quality were raised at the meeting. Another coordination meeting was held with County staff and a representative of the local homeowner’s association (Mr. Deet Jonker) on March 24, 2005. Mr. Jonker indicated that the local residents would likely view the discharge to the Grand Canal favorably if the water quality were not made worse by the discharge. In fact, the discharge into the canal could have a positive benefit of helping to flush the canal. The issues raised from the various public involvement forums were incorporated, as feasible, into the evaluation and development of alternative treatment solutions.

4.0 ALTERNATIVES ANALYSIS
Beach Road Drainage Improvements Feasibility Study
15
4.0 ALTERNATIVES ANALYSIS Prior to the selection of a preferred alternative, the project team developed a decision tree to assist in the logical selection of optimal treatment alternatives, water delivery methods, and discharge locations. The decision tree is presented in Figure 5 on the following page. Considerations that influenced alternative selections in the decision tree included identification of an alternative discharge location since the existing freshwater baseflow from the ditch to the beach attracts large flocks of wading and shorebirds which appears to be a secondary source of fecal loading to the beach (Figure 6) and could pose a health risk to recreational users in or near this outfall (Figure 7). Discharge options included:
1. Maintaining the existing discharge in the current configuration
2. Construction of an offshore outfall via a subsurface pipe
3. Directing the existing baseflow and stormwater runoff away from the beach and allowing only infrequent high flows caused by major storm events (e.g., hurricanes) to continue to pass through to the beach.
Option 1 would not be acceptable since the existing flows to the beach are creating a potential health risk by attracting large flocks of birds that could be a source of fecal contamination to the beach. Option 2 would be costly, require extensive permitting, and may still result in contamination of the recreational beach area depending upon inshore-offshore currents from the Gulf. Option 3 appears to be an acceptable alternative; however, if an alternative discharge location were selected, an assessment of receiving waters would be necessary. Sarasota County staff implemented a special water quality monitoring program to assess background bacteria concentrations in both the stormwater management system and also in the Grand Canal, located north of the project site, which had been identified as a potential receiving waterbody for the rerouted discharge. The Grand Canal is an artificial waterway that was constructed for boat access to the interior portions of Siesta Key; it connects to Roberts Bay to the east. Bacteria concentrations from the canal exceeded the state standard at all stations, and were greatest at stations S and T (Figures 8 and 9), which receive discharges from the existing Beach Road stormwater system. It was assumed that if these discharge points could be routed to the proposed treatment system, water quality should improve in this portion of the Grand Canal; however, there may be other stormwater inputs to this canal which may continue to cause high fecal coliform concentrations to occur in the future. The closest distance from the beach to the Grand Canal within County right-of-way would be at the bridge at Azure Way. Water quality at this location was also not within state standards (station Q) and should also be improved with the addition of disinfected flow from the Beach Road drainage system.

Beach Road Drainage Improvements Feasibility Study
16
Figure 5. Decision tree used to select the preferred stormwater treatment alternative for Siesta Key Beach.

Beach Road Drainage Improvements Feasibility Study
17
Figure 6. Bird usage of the ditch outfall to Siesta Key Beach.
Figure 7. Human contact at the ditch outfall to the beach.

Beach Road Drainage Improvements Feasibility Study
18
Grand Canal Samples
0
1000
2000
3000
4000
5000
6000
8/2/2004
Date
Feca
l Col
iform
(cfu
/100
ml)
P-Grand Canal, Contento Bridge(SW side)R-Grand Canal, 5215 Cape Leyte
Q-Grand Canal, Azure Bridge (SWside)S-Grand Canal, Calle Florida
T-Grand Canal, 679 Avenida delNorteClass 3 Max.
Figure 8. Fecal coliform bacteria concentrations from one of several sampling events for the Grand Canal. All samples exceeded the state standard of 400 cfu/100 ml.

Beach Road Drainage Improvements Feasibility Study
19
Figure 9. County sampling station locations in the Grand Canal and stormwater system.
Beach Road Drainage Improvements Feasibility Study
20
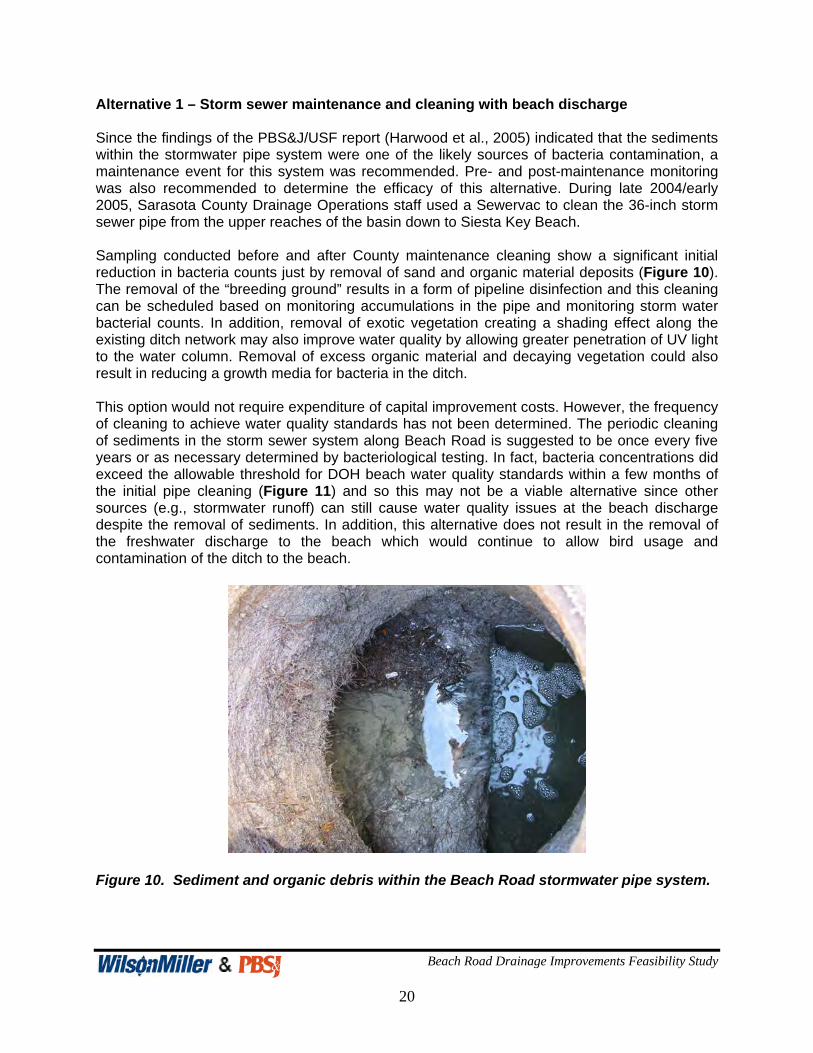
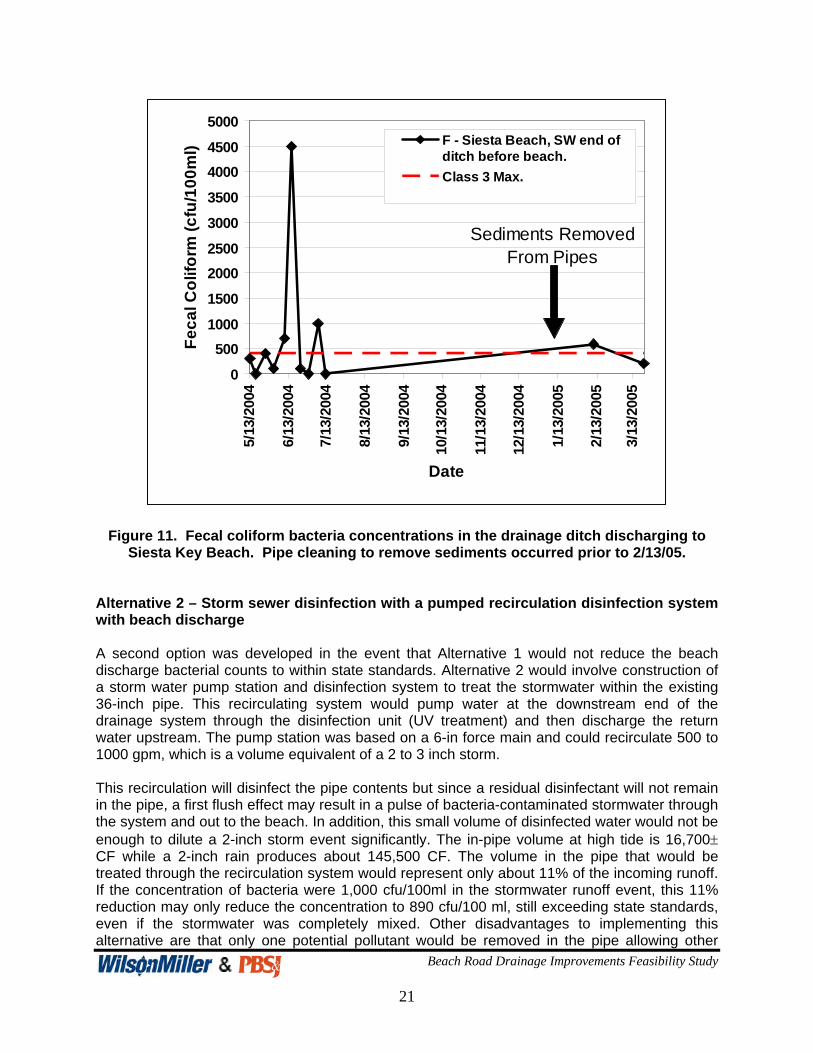
Alternative 1 – Storm sewer maintenance and cleaning with beach discharge Since the findings of the PBS&J/USF report (Harwood et al., 2005) indicated that the sediments within the stormwater pipe system were one of the likely sources of bacteria contamination, a maintenance event for this system was recommended. Pre- and post-maintenance monitoring was also recommended to determine the efficacy of this alternative. During late 2004/early 2005, Sarasota County Drainage Operations staff used a Sewervac to clean the 36-inch storm sewer pipe from the upper reaches of the basin down to Siesta Key Beach. Sampling conducted before and after County maintenance cleaning show a significant initial reduction in bacteria counts just by removal of sand and organic material deposits (Figure 10). The removal of the “breeding ground” results in a form of pipeline disinfection and this cleaning can be scheduled based on monitoring accumulations in the pipe and monitoring storm water bacterial counts. In addition, removal of exotic vegetation creating a shading effect along the existing ditch network may also improve water quality by allowing greater penetration of UV light to the water column. Removal of excess organic material and decaying vegetation could also result in reducing a growth media for bacteria in the ditch. This option would not require expenditure of capital improvement costs. However, the frequency of cleaning to achieve water quality standards has not been determined. The periodic cleaning of sediments in the storm sewer system along Beach Road is suggested to be once every five years or as necessary determined by bacteriological testing. In fact, bacteria concentrations did exceed the allowable threshold for DOH beach water quality standards within a few months of the initial pipe cleaning (Figure 11) and so this may not be a viable alternative since other sources (e.g., stormwater runoff) can still cause water quality issues at the beach discharge despite the removal of sediments. In addition, this alternative does not result in the removal of the freshwater discharge to the beach which would continue to allow bird usage and contamination of the ditch to the beach.
Figure 10. Sediment and organic debris within the Beach Road stormwater pipe system.
Beach Road Drainage Improvements Feasibility Study
21
0
5001000
1500
20002500
3000
3500
40004500
5000
5/13
/200
4
6/13
/200
4
7/13
/200
4
8/13
/200
4
9/13
/200
4
10/1
3/20
04
11/1
3/20
04
12/1
3/20
04
1/13
/200
5
2/13
/200
5
3/13
/200
5
Date
Feca
l Col
iform
(cfu
/100
ml) F - Siesta Beach, SW end of
ditch before beach.Class 3 Max.
Sediments RemovedFrom Pipes
Figure 11. Fecal coliform bacteria concentrations in the drainage ditch discharging to Siesta Key Beach. Pipe cleaning to remove sediments occurred prior to 2/13/05.
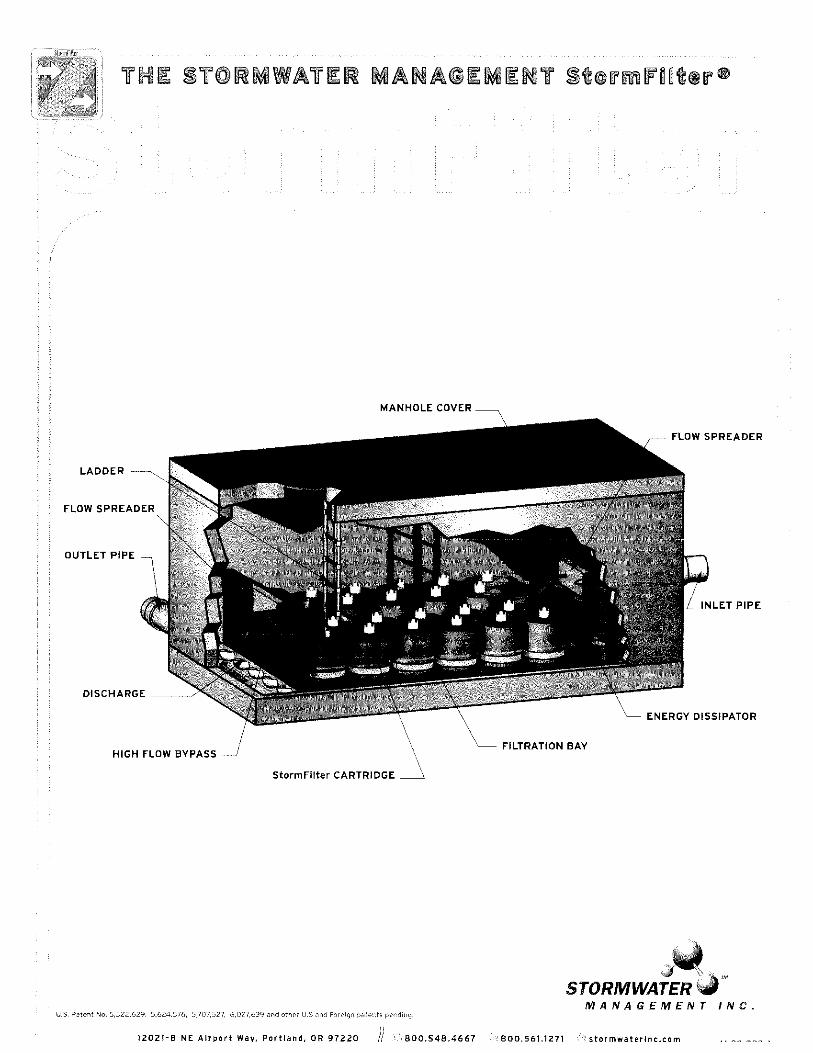
Alternative 2 – Storm sewer disinfection with a pumped recirculation disinfection system with beach discharge A second option was developed in the event that Alternative 1 would not reduce the beach discharge bacterial counts to within state standards. Alternative 2 would involve construction of a storm water pump station and disinfection system to treat the stormwater within the existing 36-inch pipe. This recirculating system would pump water at the downstream end of the drainage system through the disinfection unit (UV treatment) and then discharge the return water upstream. The pump station was based on a 6-in force main and could recirculate 500 to 1000 gpm, which is a volume equivalent of a 2 to 3 inch storm. This recirculation will disinfect the pipe contents but since a residual disinfectant will not remain in the pipe, a first flush effect may result in a pulse of bacteria-contaminated stormwater through the system and out to the beach. In addition, this small volume of disinfected water would not be enough to dilute a 2-inch storm event significantly. The in-pipe volume at high tide is 16,700± CF while a 2-inch rain produces about 145,500 CF. The volume in the pipe that would be treated through the recirculation system would represent only about 11% of the incoming runoff. If the concentration of bacteria were 1,000 cfu/100ml in the stormwater runoff event, this 11% reduction may only reduce the concentration to 890 cfu/100 ml, still exceeding state standards, even if the stormwater was completely mixed. Other disadvantages to implementing this alternative are that only one potential pollutant would be removed in the pipe allowing other

Beach Road Drainage Improvements Feasibility Study
22
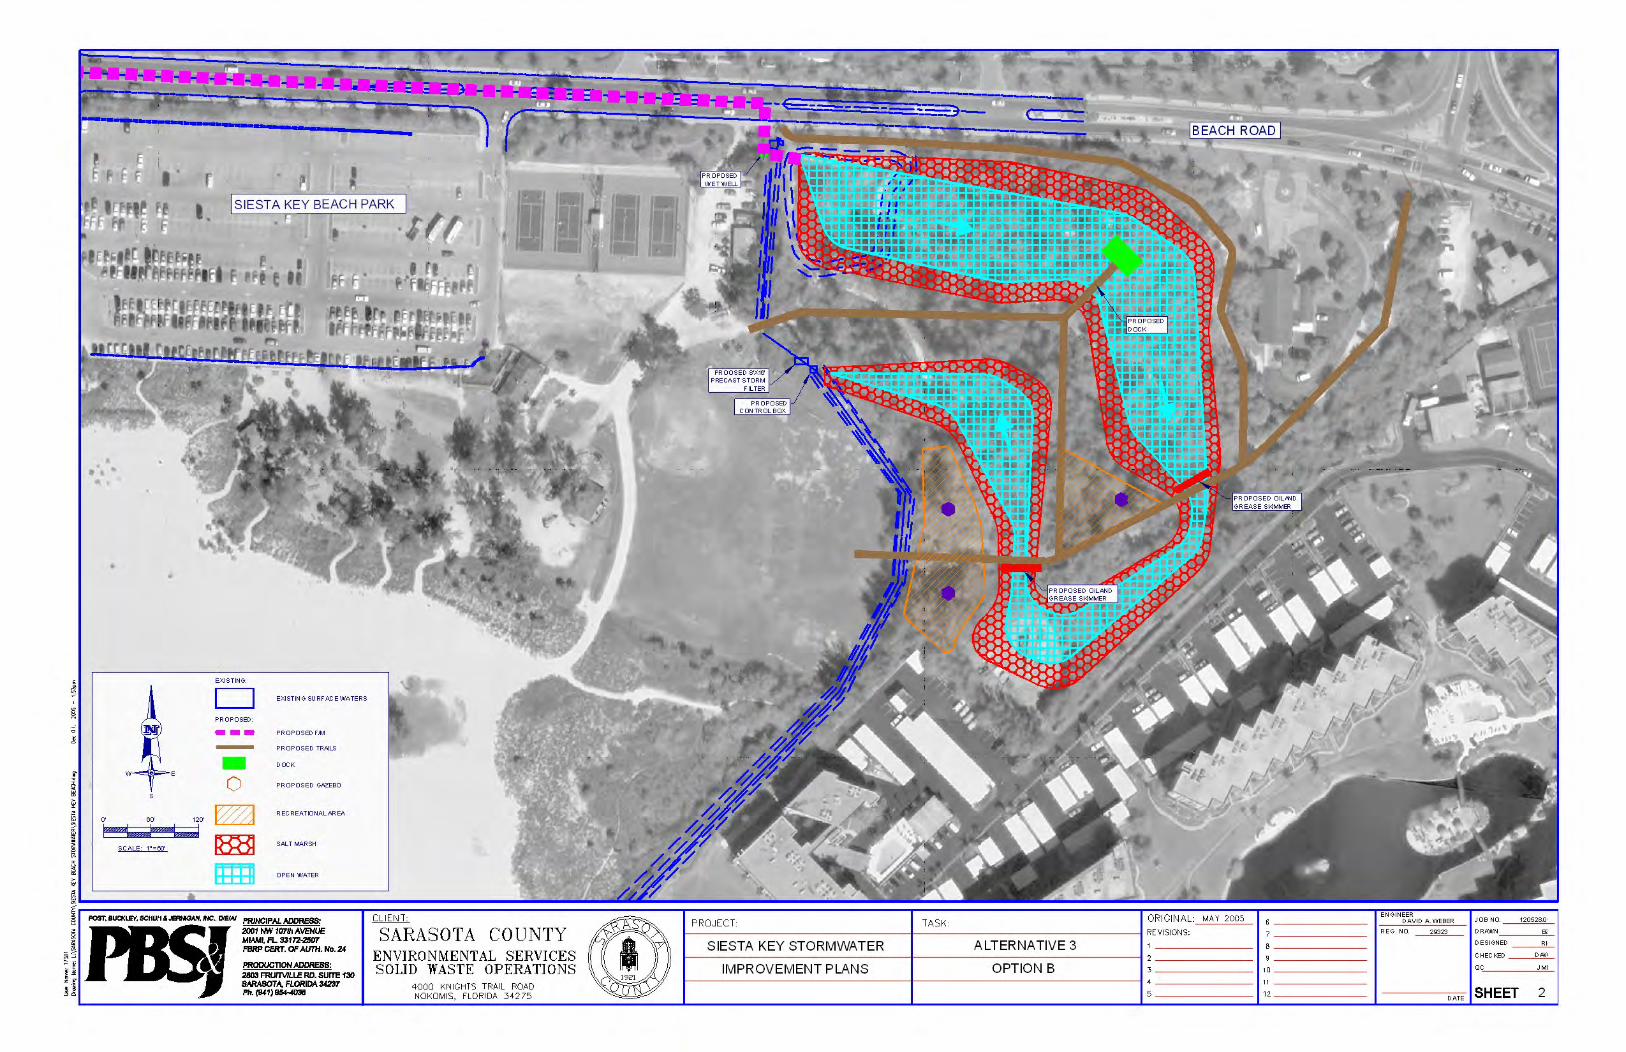
contaminants such as heavy metals, oil and grease (PAHs), and suspended solids to be discharged at the beach; and also the discharge at the beach would continue to allow bird usage and contamination of the ditch to the beach. Alternative 3 – Stormwater disinfection using a phased treatment train with pumped discharge to Grand Canal The third alternative is to construct a phased treatment train using wet detention, oil and grease skimmers, media (e.g., disc or sand) filtration, and UV disinfection. This alternative would be constructed within eight± acres of the County park property southeast of the existing storm water pond. The site is currently vegetated primarily by invasive exotic species including Brazilian pepper and Australian pine. Small pockets of native vegetation are present; however, the site currently provides minimal habitat value. Historically, the site was comprised of a sand dune system that has since been graded to form relatively flat topography and further necessitating the ditch network to drain surface water runoff to the Gulf. Recreational improvements are limited to a walking paths and a minimally utilized exercise trail. As a result of its current condition and proximity to the public beach, opportunities exist to better utilize the property to address storm water concerns and also improve its recreational value to the public. By reconfiguring the existing storm water pond and expanding it to the southeast into a longer flow path comprised of deep and shallow pools and tidal marshes, the site will provide increased storage capacity and treatment for the majority of rainfall events that occur in this region. A meandering flow way would extend the attenuation time, allow greater UV penetration to cause bacterial die-off, and incorporates several phases of water quality treatment for other pollutants such as oil and grease (through the construction of skimmers), suspended solids, sediments, nutrients, and heavy metals. The planting of tidal marsh vegetation will effectively improve water quality through the trapping of fine particles and soluble pollutants. Deeper open water features would allow for sunlight penetration, previously shown to reduce bacteria concentrations. See Appendix H for two site options of different land use for trails and parking. In addition to excavating portions of the site, a ditch block constructed within the southerly outfall ditch to the beach would reduce the frequency of discharges into the gulf while increase the storm water volume and attenuation time on site. The resulting system would also result in secondary benefits including wildlife habitat and the reduction of invasive exotic vegetation. The outfall to the beach would also be eliminated except during major storm events, such as hurricanes, and so the persistent bird utilization and contamination of beach waters would be eliminated. Any bird usage in the created pond system would be treated by disinfection at the outfall. Areas not utilized for stormwater treatment could be designed to improve the recreational value of the site. Hiking trails, gazebos, picnic tables, and boardwalks incorporated into the remaining uplands would maximize the utility of the property. Additional parking was also incorporated into the site to encourage utilization of the additional amenities, or to act as overflow parking for beachgoers. Two separate subalternatives were developed with one maximizing pond size area (Larger Pond) and one maximizing park recreational features (Smaller Pond); the dimensions of these alternatives are shown in Table 3. Schematics of the two designs are shown in Appendix H, along with Exhibit 6 indicating an alternative discharge route.

Beach Road Drainage Improvements Feasibility Study
23
The conceptual layouts of the retention pond area are suggestions of how the County could utilize this area as part of a master parks and recreational area along the beach. The layouts can change to be consistent with a future developed master park plan by the County. The conceptual retention pond layouts can hopefully be used by the County’s Parks and Recreation Department as a starting point of how the area could be developed. Any modifications to existing beach ditch systems previously permitted through the FDEP are believed to be able to be handled as permit revisions allowing for a more comprehensive creation of wetland systems in the treatment lagoon.
Table 3. Acreage estimates for the treatment pond alternatives.
Smaller Pond Area (sq. ft.) Acres Open Water 65,700.00 1.51 Wetland Marsh 115,000.00 2.64 Recreational Area 77,400.00 1.78 Trail Length (linear feet) 2,480.00 Larger Pond Area (sq. ft.) Acres Open Water 100,340.00 2.30 Wetland Marsh 171,340.00 3.93 Recreational Area 26,400.00 0.61 Trail Length (linear feet) 2,620.00
This alternative could be constructed in two phases. Phase 1 would include the wet detention system, oil and grease skimmers, and the construction of a discharge to the Grand Canal (either gravity or pump station and force main). Monitoring of the outflow of this system would be conducted over a series of storm events to determine if water quality standards for fecal coliform bacteria are able to be met by the wet detention system alone. In addition, sampling for total suspended solids and turbidity would also be performed to determine the need for additional filtration prior to construction of an in-line UV disinfection system. Once these analyses were conducted, selection of the optimal configuration for Phase 2 could take place with the subsequent construction of the media filter and UV disinfection system. Further monitoring would be required to confirm that the discharge meets state water quality standards. Alternative 3a - Gravity Solution WilsonMiller used the created stormwater model to simulate various scenarios of a new gravity outfall pipe to the Grand Canal along with the two existing discharge pipes to the canal as being open or closed. The approximate flow capacity of the incoming existing 36-inch pipe to the retention pond would have to be provided by a gravity outfall pipe. Due to burial depth limitations underneath existing sanitary sewers on Cape Leyte Drive, two 19”x30” elliptical pipes were simulated as a new gravity outfall pipe. The route for this canal outfall pipe would be from the retention pond north on Beach Road, east on Beach Way Drive, north on Cape Leyte Drive and then east on Azure Way to the Grand Canal. A length of this gravity outfall is 1,800± feet.

Beach Road Drainage Improvements Feasibility Study
24
An advantage in disconnecting the Beach Road drainage to the two pipe outfalls to the Grand Canal would be to capture all runoff from this magnitude of storm along Beach Road so that the entirety of the runoff could be treated prior to discharge. If the stormwater retention pond could be expanded to provide more storage volume, disconnection of these two existing outfall pipes may be possible. Installing a new gravity outfall pipe, disconnection of the two existing outfall pipes to the Grand Canal from Beach Road and blocking the Gulf discharge ditch with a concrete ditch-block structure would maintain the current 2-inch rainfall dry street condition. However, closing the storm sewer pipes to the canal worsens the already flooded street in the existing condition during a 3-inch rainfall. Consequently closing the side street outfalls from Beach Road may be desirable relative to water quality but not be desirable from a street flooding perspective. Generally the suggested gravity outfall system would reduce street flooding from the 3-inch rainfall compared to existing conditions if the side street weirs were to remain conveying runoff to the canal. With an expanded retention pond the 2-inch rainfall produces no street flooding if the two existing canal outfall pipes remain open or are closed. For the 3-inch rainfall, minor street flooding would result if the two outfall pipes remain open but more significant street flooding results if these outfalls were to be closed. Weirs that direct some street runoff down the two side streets could be raised to only allow high flow from excessive rainfall greater than two inches to enter the canal. Raising these weirs within existing drainage structures to just under the inlet grate elevation may be difficult to construct. Since side street weir closure causes increased street flooding from excessive rainfall, the two side street outfall systems should remain open to convey local runoff to the Grand Canal. Simulating the existing Beach Road storm sewer system for a 2-inch rainfall with no outfall and discharging into the existing stormwater pond produces a maximum stage of 3.77 ft. and causes street flooding. This indicates that the volume of the retention pond will have to be expanded if all of a 2-inch rainfall runoff from Beach Road were to be collected and treated prior to discharge. The existing stormwater pond along Beach Road may be considered to be moved and expanded into a treatment lagoon system. This lagoon would collect all runoff from the storm sewer system and allow it to be circulated through a salt marsh thereby improving the water quality. Excess rainfall events greater than two inches would overflow the improved discharge control structures and continue to flow to the beach. The tidal affect on the storm sewer system is significant. High tide negatively affects the performance of the gravity outfall pipe and also reduces the peak water level of the storm in the pond and allows water to bypass through the system reducing the treatment time. Appendix I contains a table of computer stormwater modeling scenarios and results. Alternative 3b - Pumped Solution The pumping scenario involved the collection of stormwater in an expanded, shallow stormwater treatment pond followed by further treatment in a preconstructed filter treated with ultra-violet (UV) light prior to discharge. If UV or chemical treatment of the stormwater discharge would be necessary, it would be easier to disinfect the stormwater in a small condensed flow stream in a pressurized pipe system.

Beach Road Drainage Improvements Feasibility Study
25
The runoff volumes in Table 1 were also converted to a gallon per minute (gpm) pumping rate. These pumping rates allow estimating how much stormwater runoff could be reasonably handled by a pumping system. Different possible pumping rates and discharge line sizes are shown below: Force main GPM
6” 500 8” 1000 10” 1500 12” 2000 The runoff volume from either a 2- or 3-inch, 24-hour rainfall event is approximately the capacity of a 6- to 8-inch force main if this volume were to be pumped within one day. Once runoff is collected, a design decision has to be made as to how long this water should remain in the treatment pond. Our engineering judgment is that this water should be evacuated to the discharge point within twenty-four hours. The cost for such a stormwater pumping facility would be significantly less than if a 10- to 12-inch force main system is envisioned to handle a higher rainfall amount. From Table 1, if a 2-inch and 3-inch storm requires a daily force main pumping rate of 755 and 1518 gpm respectively, we interpolate that an 8-inch force main system can pump the accumulated runoff volume from a 2.3-inch rainfall at an average daily flow rate of 1000 gpm. Under such a scenario all runoff would be collected in a retention pond treated and pumped through an 8-inch force main to the discharge point in the Grand Canal following the same route as a gravity outfall. So since disconnecting the two side street weirs to the canal does not exacerbate the 2-inch storm street flooding and if the pond could be expanded, then a pumping system could handle the storm runoff. Excess rainfall could be discharged to the beach over the proposed ditch-block. Weirs that direct some street runoff down the two side streets could be raised to only allow high flow from excessive rainfall to enter the canal. Raising these weirs within existing drainage structures to just under the inlet grate elevation may be difficult to construct. Consequently, blocking the incoming pipe from the intersection may be more practicable. The two side street outfall systems could remain open to convey local runoff from only the side streets to the Grand Canal. The most viable option would be to collect all of the street runoff into an expanded stormwater pond and pump the water with improved water quality to a desired discharge point. Site Availability The County’s Parks and Recreation Department must approve the layout of the proposed treatment pond and disinfection system prior to implementation of the project. The project team has met with Parks staff and understand that the County's Beach Improvement Plan may require the land currently utilized for the existing stormwater pond for other park facility purposes. As a result, the treatment pond expansion may require relocation farther to the south. Developing a stormwater treatment pond on this site would be an improvement to the existing park environment and offer the County the opportunity to expand its recreational parks system, provide environmental education opportunities, enhanced trail and open space areas, and, possibly, additional parking.

Beach Road Drainage Improvements Feasibility Study
26
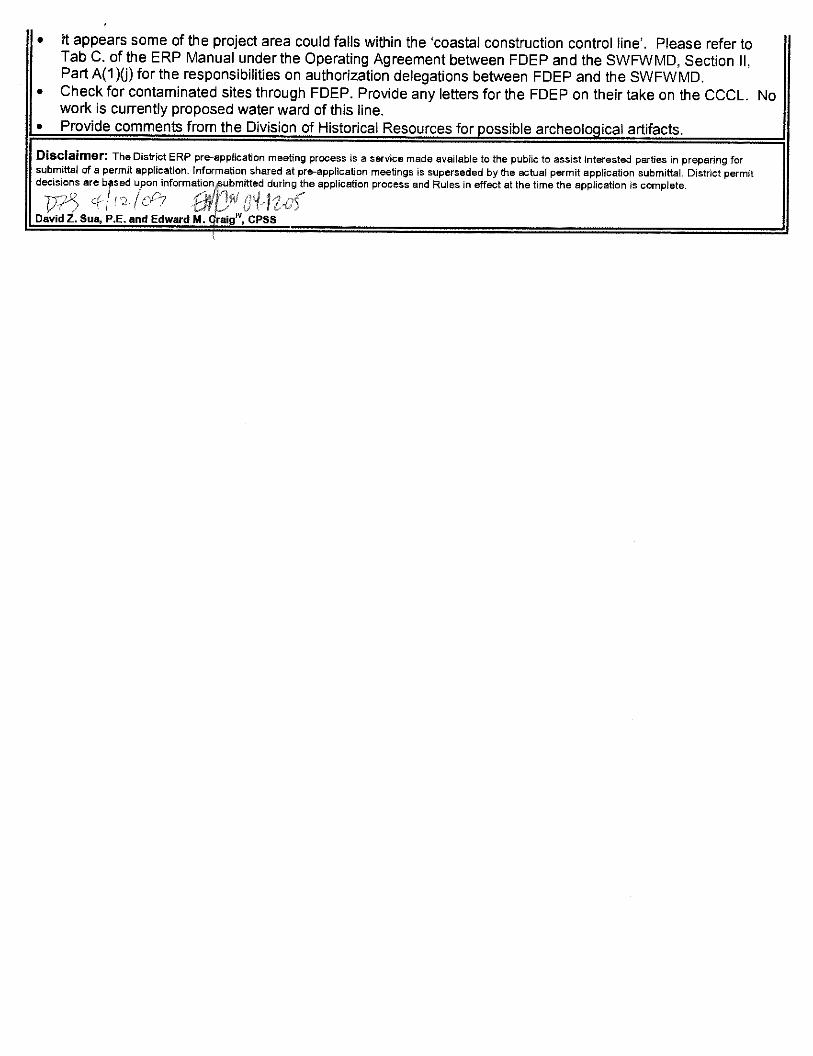
Environmental Permitting Florida Department of Environmental Protection Contact with the Florida Department of Environmental Protection (FDEP) was made to discuss the permitting of any site improvements waterward of the Coastal Construction Control Line (CCCL). The possibility of blocking site runoff to the beach could be viewed favorably by the FDEP from a beach erosion perspective. Should a ditch block be installed in the channel downstream of the retention pond to block low flow to the beach this work could be landward of the CCCL and not requiring a permit. Some ditch bank improvements would be necessary at the selected location of the ditch block. These improvements would address erosion and stability of the ditch block and would be included in a subsequent final design. Southwest Florida Water Management District A preapplication meeting was held with the Southwest Florida Water Management District (SWFWMD) to discuss the proposed water quality improvements of the project and the permitting of different discharge options on April 12, 2005. Minutes of the meeting are presented in Appendix J. SWFWMD staff indicated that a pumped stormwater solution to the Grand Canal would likely be permittable if water quality standards were not exceeded by the discharge. Similarly a gravity piped outfall from Beach Road to the canal would be permittable if water quality was not adversely impacted by the project. Staff recommended that a monitoring program be implemented to determine the effectiveness of the treatment system. The monitoring program could be discontinued once the project was determined to be successful. Cost Benefit Analysis A cost benefit analysis was performed to determine the preferred alternative for treating and discharging stormwater at the Siesta Key Beach site. Since Alternatives 1 and 2 had fatal flaws, in that the water quality discharged from either alternative would not likely meet water quality standards consistently at the discharge, only Alternative 3 was evaluated with the discharge location to the Grand Canal based on gravity storm sewer and pumping/force main options.

Beach Road Drainage Improvements Feasibility Study
27
Table 4. Comparison of costs for Alternatives 3a and 3b for the Siesta Key Beach discharge. GRAVITY ALTERNATIVE DESCRIPTION QUANTITY UNIT UNIT PRICE COST STORM MANHOLES 8 EA $4,500 $36,000 CONFLICT MANHOLE 3 EA $5,500 $16,500 19"X30" ERCP 3600 LF $65 $234,000 PAVEMENT REPAIR 2000 SY $25 $50,000 POND CLEARING/EROSION CONTROL 1 LS $65,800 $65,800 POND EXCAVATION 20000 CY $6 $120,000 POND PLANTINGS 1 LS $50,000 $50,000 OIL/GREASE SKIMMERS 2 EA $2,000 $4,000 DITCH BLOCK 1 EA $2,500 $2,500 PRECAST FILTERS 4 EA $60,000 $240,000 UV DISINFECTION 2 EA $250,000 $500,000 CONTRACTOR OVERHEAD & PROFIT 15% $200,000 GRAVITY SUBTOTAL $1,518,800 Administrative and Contingency (20%) $303,760 GRAVITY TOTAL COST ESTIMATE $1,822,560 PUMPING ALTERNATIVE DESCRIPTION QUANTITY UNIT UNIT PRICE COST PAVEMENT REPAIR 200 SY $25 $5,000 POND CLEARING/EROSION CONTROL 1 LS $65,800 $65,800 POND EXCAVATION 20000 CY $6 $120,000 POND PLANTINGS 1 LS $50,000 $50,000 OIL/GREASE SKIMMERS 2 EA $2,000 $4,000 DITCH BLOCK 1 EA $2,500 $2,500 PUMP STATION 1 LS $150,000 $150,000 8" FORCE MAIN (DIRECTIONAL DRILL) 1800 LF $100 $180,000 DISC FILTERS 2 EA $75,000 $150,000 UV DISINFECTION 2 EA $150,000 $300,000 CONTRACTOR OVERHEAD & PROFIT 15% $154,000 PUMP SUBTOTAL $1,181,300 Administrative and Contingency (20%) $236,260 PUMP TOTAL COST ESTIMATE $1,417,560
Based on the development of probable costs for either of the two discharge location options, the pumped discharge alternative is also less costly and more hydraulically reliable than the construction of a gravity system and is therefore the preferred alternative.

5.0 RECOMMENDATIONS

Beach Road Drainage Improvements Feasibility Study
28
5.0 RECOMMENDATIONS Based on the results of this feasibility study, stormwater runoff from the Beach Road drainage area could be treated in an expanded retention pond along Beach Road to acceptable water quality standards prior to discharge to the Grand Canal. Ambient water quality for fecal coliform bacteria in the Grand Canal have been found to occasionally exceed the State’s Class 3 water quality standards and so treated discharges from Beach Road should not adversely impact surface water quality at the point of discharge. In fact, some dilution may be provided with this higher-quality freshwater input that may reduce fecal coliform concentrations. Two existing outfalls to the Grand Canal that may be contributing bacterial loads would also be diverted to the treatment system, further enhancing water quality in the Grand Canal. Logistically, pumping accumulated stormwater runoff from an expanded retention pond to the Grand Canal is a more hydraulically reliable system as opposed to a gravity outfall system due to the possibility of a high tide causing backflow during a rainfall event. This alternative is also less costly than the construction of a gravity system. The exact location and size of the proposed stormwater retention pond within the Siesta Key Beach Park will need to be further discussed with County Parks Department staff. The Park Master Plan is currently being updated and so the inclusion of this system within the updated plan should be conducted as soon as possible so that other park enhancements, such as additional parking, trails, boardwalks, etc., can be coordinated with the proposed water quality enhancement project. The stormwater improvement project has been developed using a treatment train approach with each component of the train having a bacterial removal component. If the project is implemented, it is recommended that the construction be phased and reevaluated after each treatment component is constructed. For example, the first two components (Phase 1) that should be constructed are the stormwater detention pond/wetland system, oil and grease skimmers, the weir to reduce discharges to the beach, and the pump station force main to the Grand Canal. Once this system has been constructed, monitoring of the inflow and outflow should be conducted to determine if water quality standards (fecal coliform bacteria concentrations <400 cfu/100 ml, enterococcus concentrations <103 cfu/100 ml) are being met. If the thresholds for the “no swim” advisory are not met at the discharge point of the treatment system, then the prefabricated media filter and the UV treatment system should be constructed to further enhance bacteria disinfection processes and meet state standards. Continuous maintenance should also be conducted regularly to remove excess sediments within the pipe system; this has shown to be effective on reducing bacteria concentrations in the discharge based on monitoring before and after sediment removal. In order to further define the above recommendations, the project should proceed to a more detailed Preliminary Design phase to further select equipment, construction costs, operation and maintenance costs, filtration and pump station design parameters.

6.0 REFERENCES

Beach Road Drainage Improvements Feasibility Study
29
6.0 REFERENCES Harwood, V., S. Shehane, M. Brownwell, M. Dontchev, and R. Kurz. 2005. Siesta Key Beach
water quality sampling to determine sources of fecal indicator bacteria. Final Report to Sarasota County Water Resources.
Kurz, R. C. 1998. A comparison of rapid sand filtration, alum treatment, and wet detention for
the removal of bacteria, viruses, and a protozoan surrogate from stormwater. Technical Report. Southwest Florida Water Management District.
APPENDIX A
BEACH ROAD DRAINAGE PROJECT VICINITY MAP


APPENDIX B
STUDY AREA MAP

APPENDIX C
DRAINAGE BASIN MAP

APPENDIX D
LINK NODE SCHEMATIC


APPENDIX E
WWTPS USING UV DISINFECTION IN FLORIDA

Summary of UV Disinfection in Florida
Treatment Facility
County
DEP Distr.
Disinf. Level
WWTP Capacity
(mgd)
Backup System
Discharge to
Notes Bay County Regional Bay NW Inter. &
High 7.0 0.4
No Surface &Reuse
Part III Reuse uses Cl2 for disinfection Operation began in 1999
City of Lynn Haven Bay NW Inter. 2.5 Yes Surface water Began operation in 1999 Backup is dual train UV with 2 separate modules per train
Panama City - Millville Bay NW Inter. 5.0 No Surface water Began operation in 1999 Panama City Beach Bay NW Inter. &
High 10 Yes Surface water UV under construction, Part III reuse uses
Cl2 for disinfection Backup is Cl2
Blountstown Calhoun NW Basic 1.5 No Surface water Began operation in 1999 Homestead Dade SE High 6.0 No Rapid-rate Began operation in 1999 Atlantic Dry Dock Duval NE Basic 0.06 Yes Surface water Baldwin Duval NE Basic 0.4 Yes Surface water Wedeco system, vertical lamps, began
operation in 1990 Buckman (JEA) Duval NE Basic 52.0 No Surface water Began operation December 2000 Northeast (fka District II) (JEA) Duval NE Basic 10 No Surface water Began operation in 2001 Southwest (JEA) Duval NE Basic 10 No Surface water Began operation in 2001 Jacksonville - Mandarin Duval NE Basic 7.5 No Surface water Began operation in 2000 Monterey (UWF) Duval NE Basic 3.6 No Surface water Bayou Marcous Escambia NW Basic 8.2 Yes Wetlands Began operation in 1998
Backup is dual train UV with 3 separate modules per train
ECUA - Pensacola Beach Escambia NW Inter. 2.4 No Surface water UV under construction ECUA - Main Street Escambia NW Basic 20 Yes Surface water Began operation June 2000
Backup is dual train UV with 2 separate modules per train
Pebble Creek Hillsborough SW High 0.4 No Surface water & reuse
Infilco Degremont, closed channel, horizontal lamps, 2 units installed in 1986, added 3rd unit in 1993, use Cl2 for reuse
Waterway Estates Lee South Basic 1.5 No Surface water & reuse
Infilco Degremont, closed channel, horizontal lamps, began operation in 1991, use Cl2 for reuse system
UV Disinfection Summary Page 1 of 2 Use it Again, Florida! November 27, 2002

UV Disinfection Summary Page 2 of 2 Use it Again, Florida! November 27, 2002
Treatment Facility
County
DEP Distr.
Disinf. Level
WWTP Capacity
(mgd)
Backup System
Discharge to
Notes Key Colony Beach Monroe South Basic 0.34 Yes Injection to
Class V well
East Central Regional Palm Beach SE High 6.0 Yes Surface Water Will begin operation in 2004 Auburndale - Allred Polk SW Basic 1.4 No Surface water &
citrus irrigation Aquionics, closed channel, horizontal lamps, began operation in 1993
Auburndale - Westside Polk SW Basic 1.6 Yes Reuse Aquionics, closed channel, horizontal lamps Hastings St. Johns NE Basic 0.12 Yes Surface water Infilco Degremont, open channel, vertical
lamps, began operation in 1992. Due to problems w/ UV system, chlorine is primary disnfection method.
Ponte Vedra (UWF) St. Johns NE High 0.5 No Surface water & Reuse
Permit issued. Single channel, 9 banks in series. 140 mW-s/cm2 at peak flow.
Daytona Beach - Bethune Point Volusia Central High 13.0 No Surface water & reuse
Trojan, open channel, medium pressure system began operation in 1999

APPENDIX F
NEWSPAPER ARTICLE - SIESTA KEY BEACH WATER QUALITY


APPENDIX G
PUBLIC MEETING MINUTES - HEALTHY BEACHES

Healthy Beaches Public Workshop December 16, 2004 7:00 PM Public Comments/Questions
1) Resident has lived here for 25 years and for as long as she can remember brown water has been coming out of the pipe onto the beach.
2) Why were the Australian pines taken down? The place looks terrible now.
3) The recreational area around the beach should be moved. The tennis courts
need to be moved. More green space is needed.
4) There is a need for natural filtration. Get rid of the parking lot.
5) Why are RVs allowed to park in the parking lot? They take up 2 to 3 spaces.
6) What is the source of the Turtle Beach problem?
7) The parking lot is an eyesore. The area needs a more pleasant appearance. There is a need for more shade.
8) The County should use more Florida native or Florida friendly plants.
9) Why are we dumping stormwater into the Gulf of Mexico?
10) The County needs to look at the zoning regulations. Is there a limit on
impervious surfaces?
11) Has the Parks Department conducted any wildlife surveys? There is a need for more green space.
12) During rain events, is the effluent tested and reported?

APPENDIX H
WET DETENTION POND CONCEPTUAL DESIGNS
AND EQUIPMENT


APPENDIX I
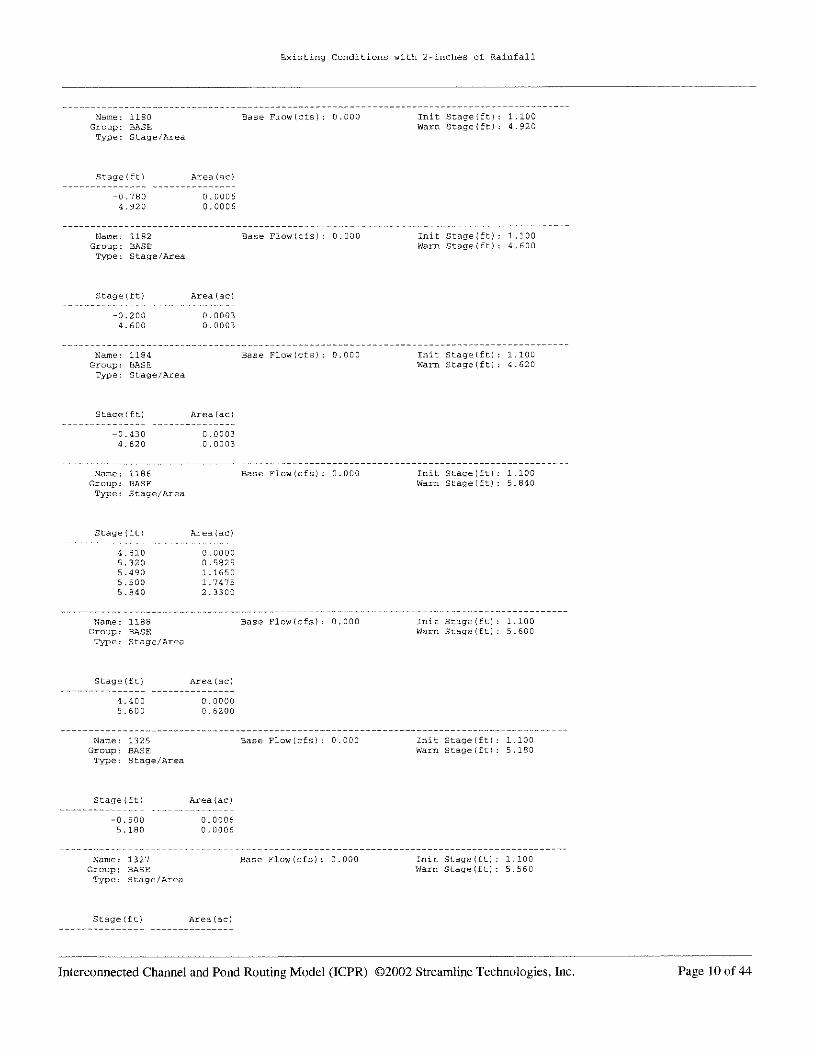
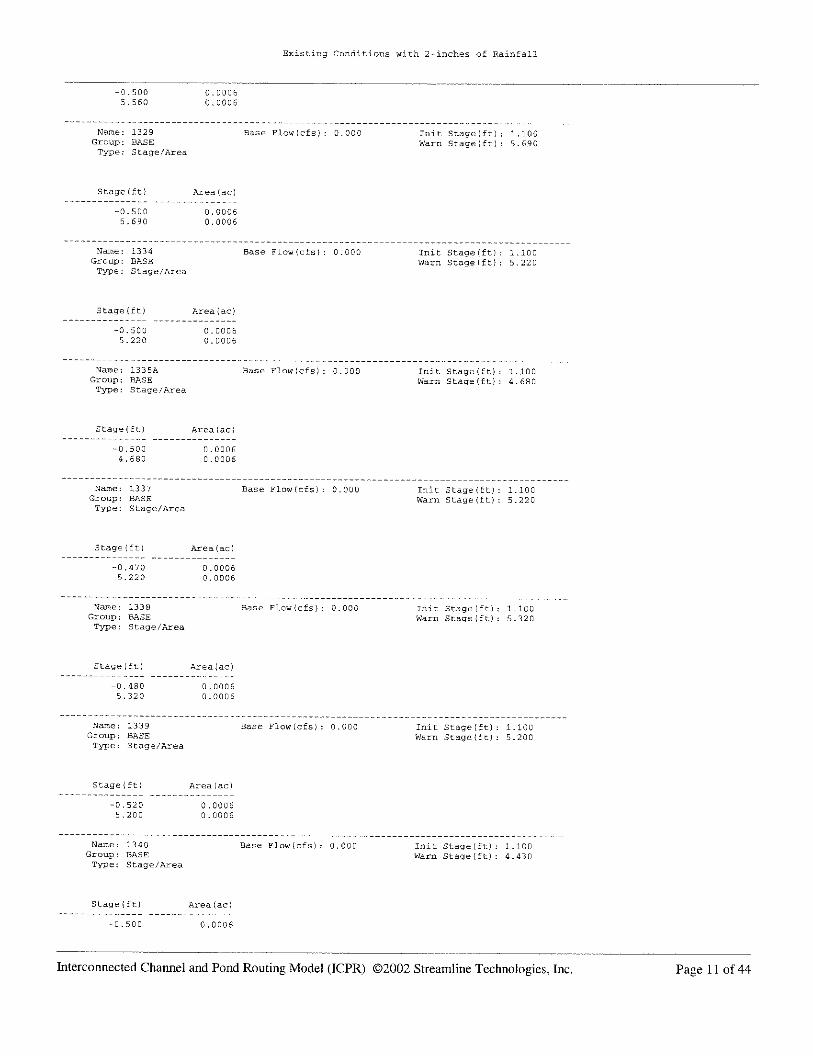
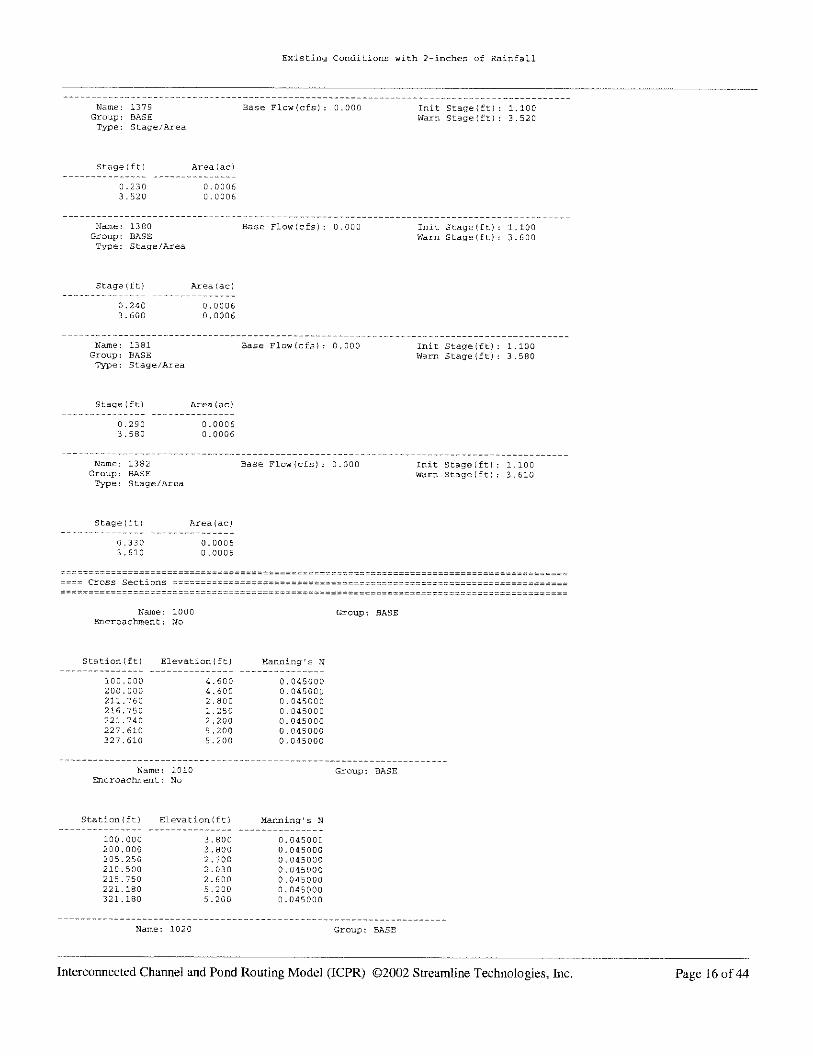
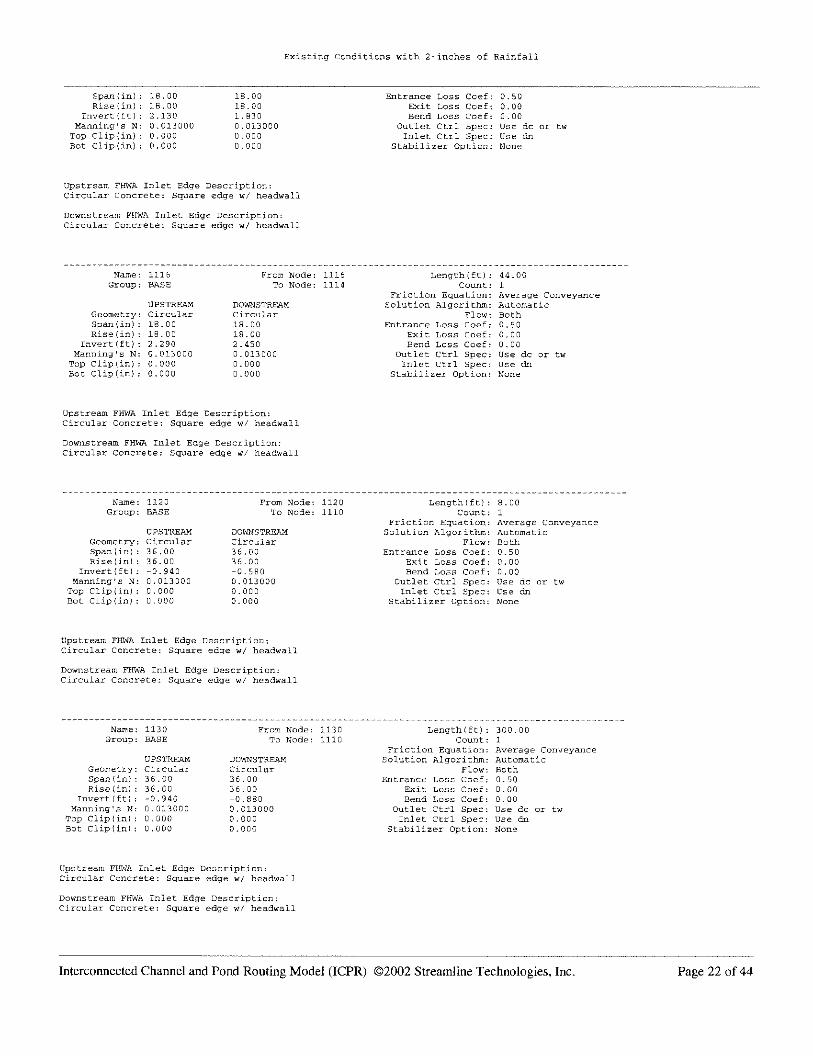
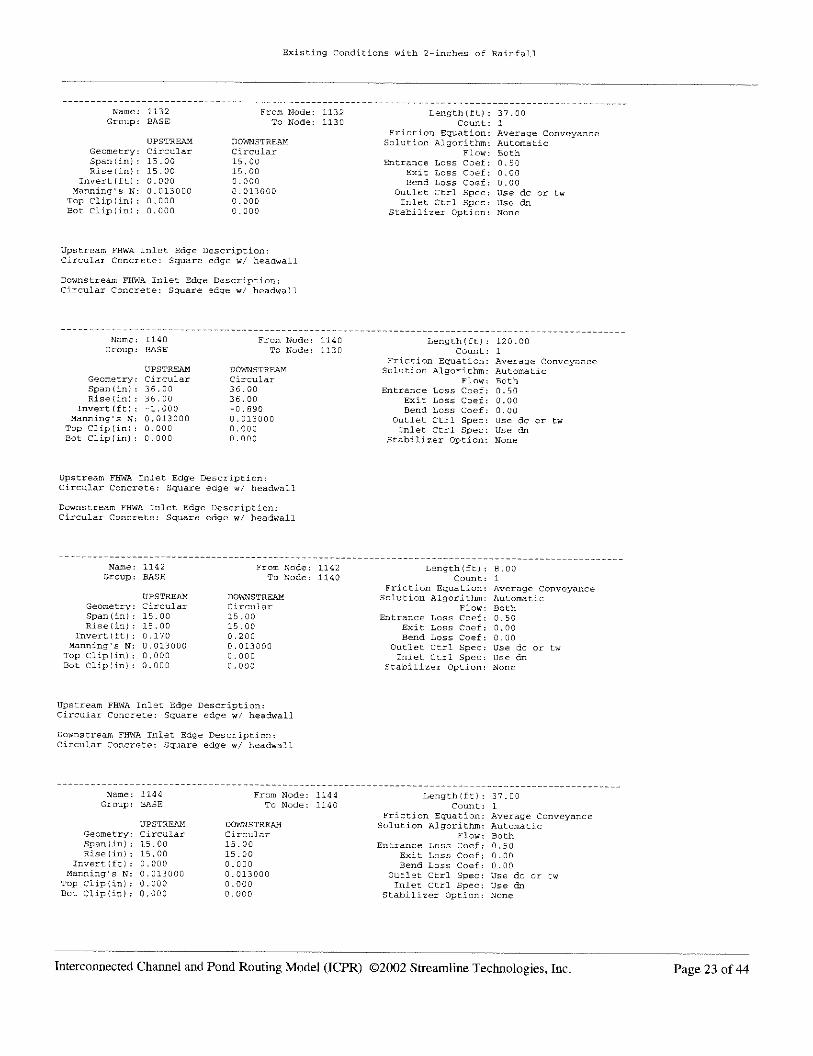
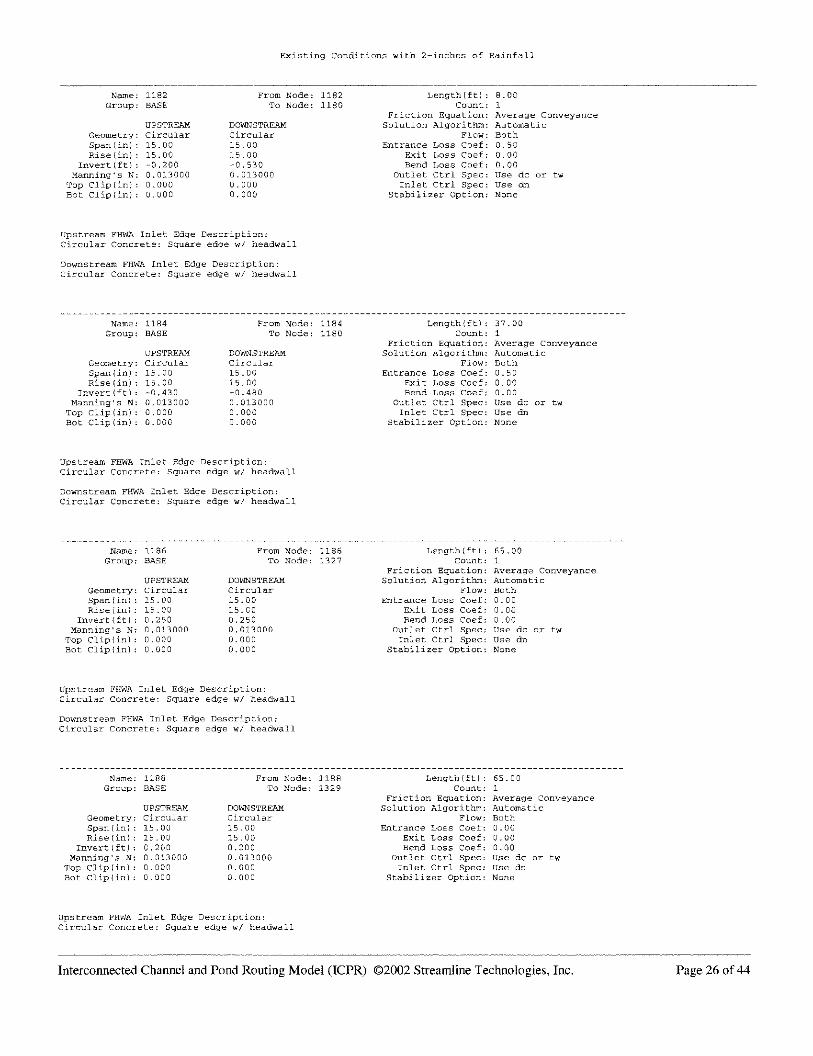
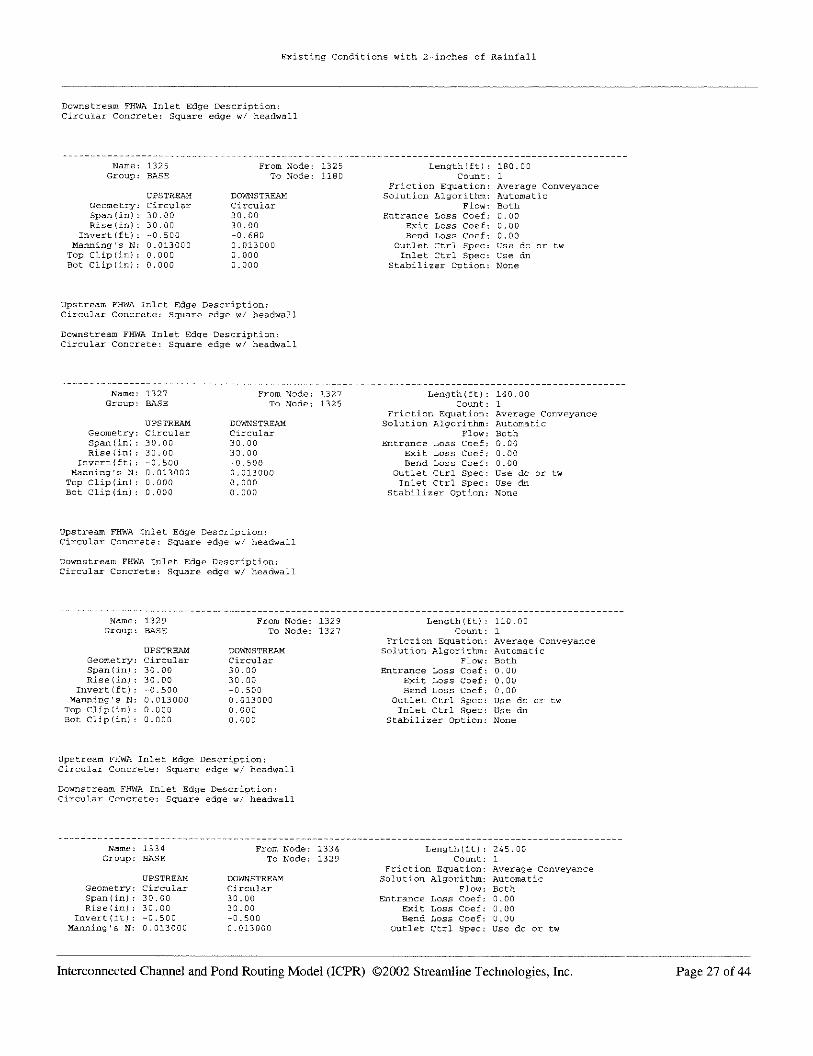
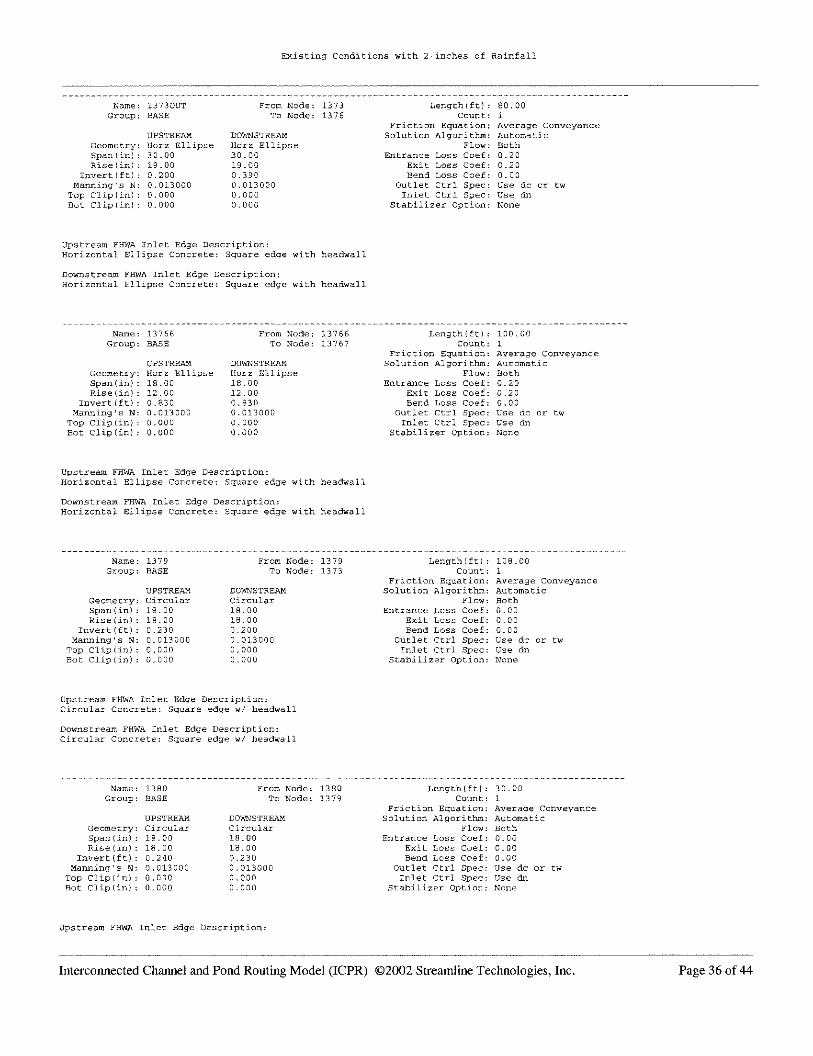
STORMWATER MODELING SCENARIOS AND RESULTS

EXISTING CONDITIONS INPUT


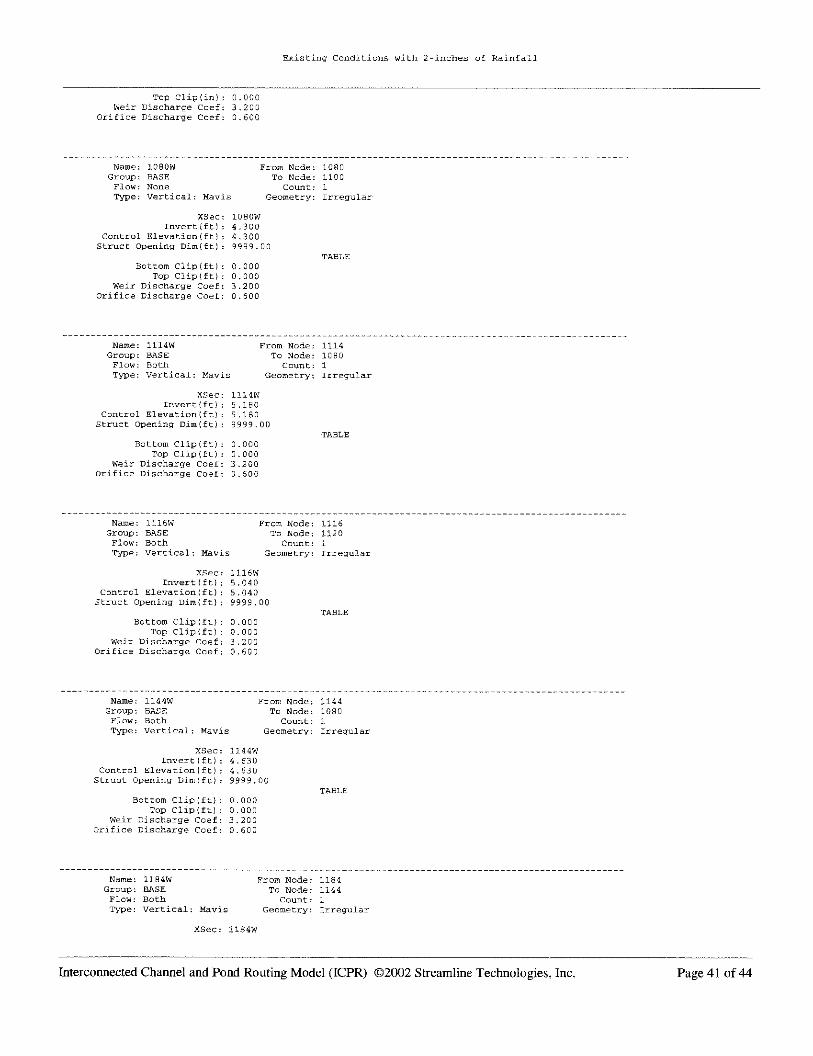


EXISTING CONDITIONS OUTPUT


PROPOSED CONDITIONS INPUT


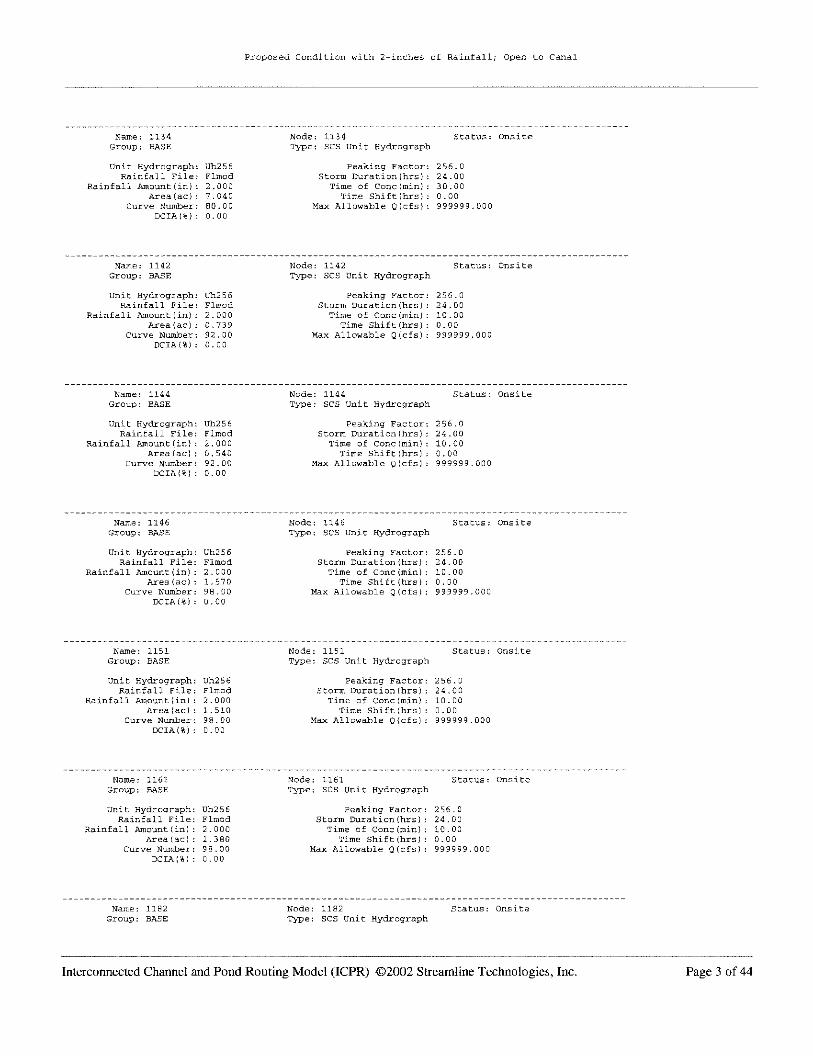


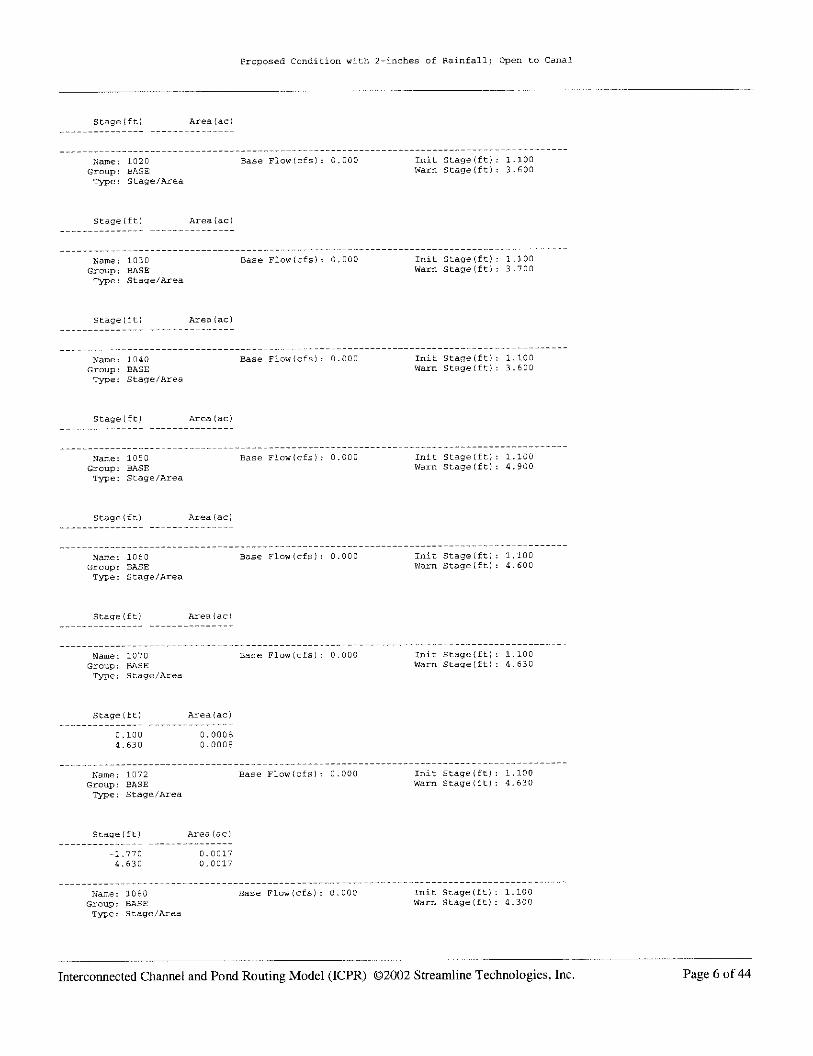


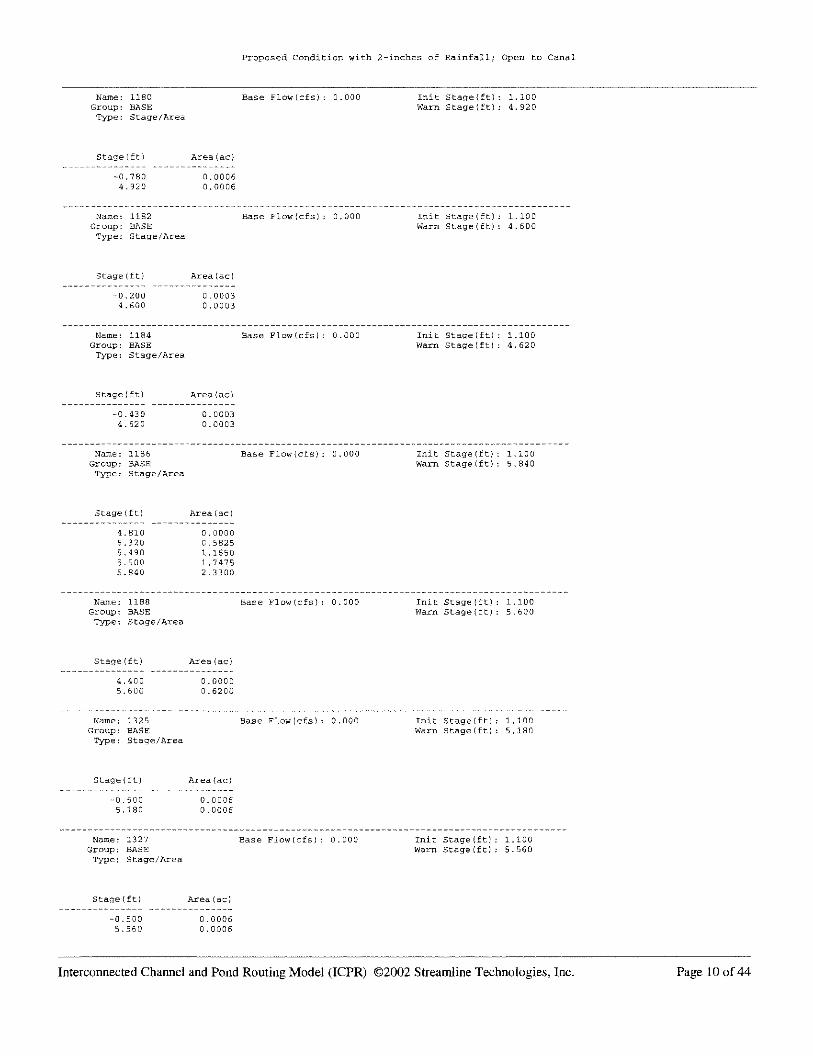


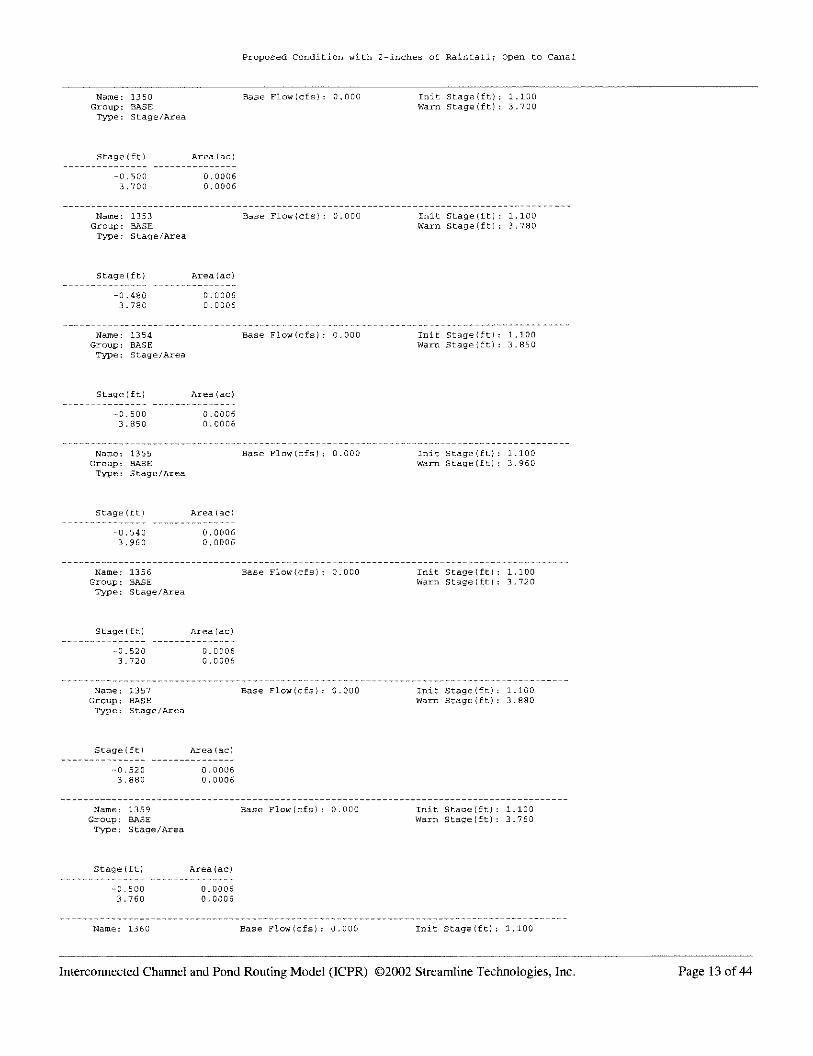
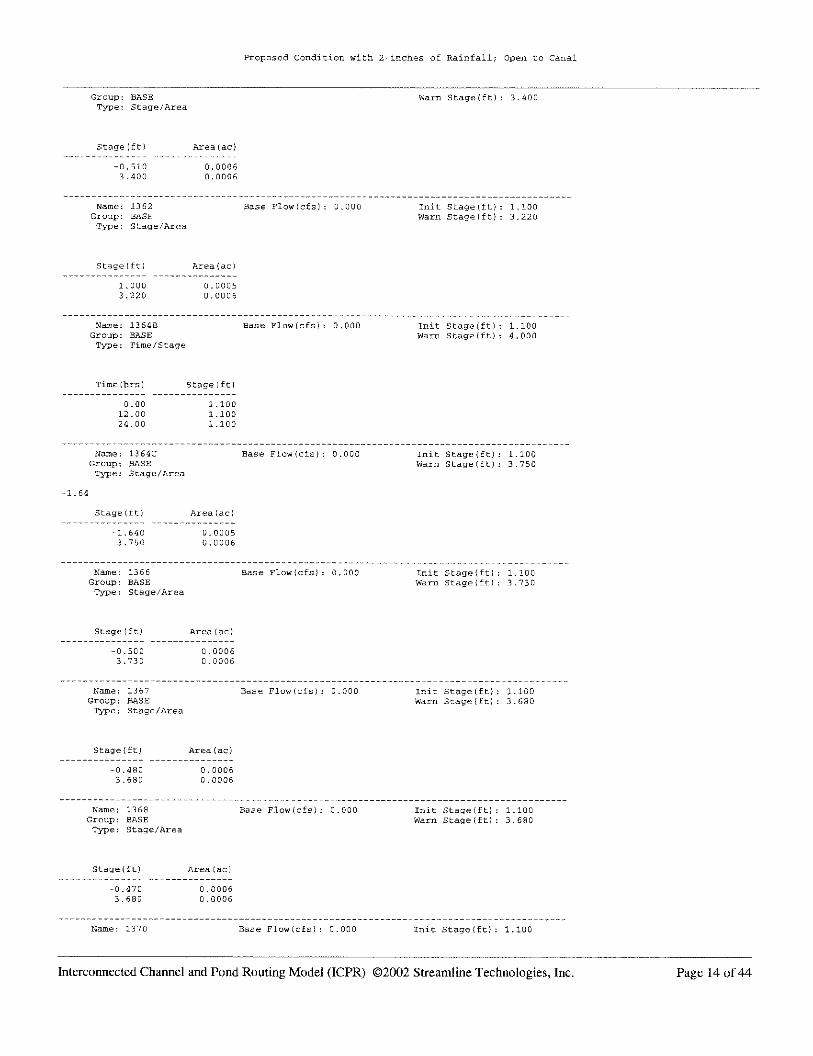


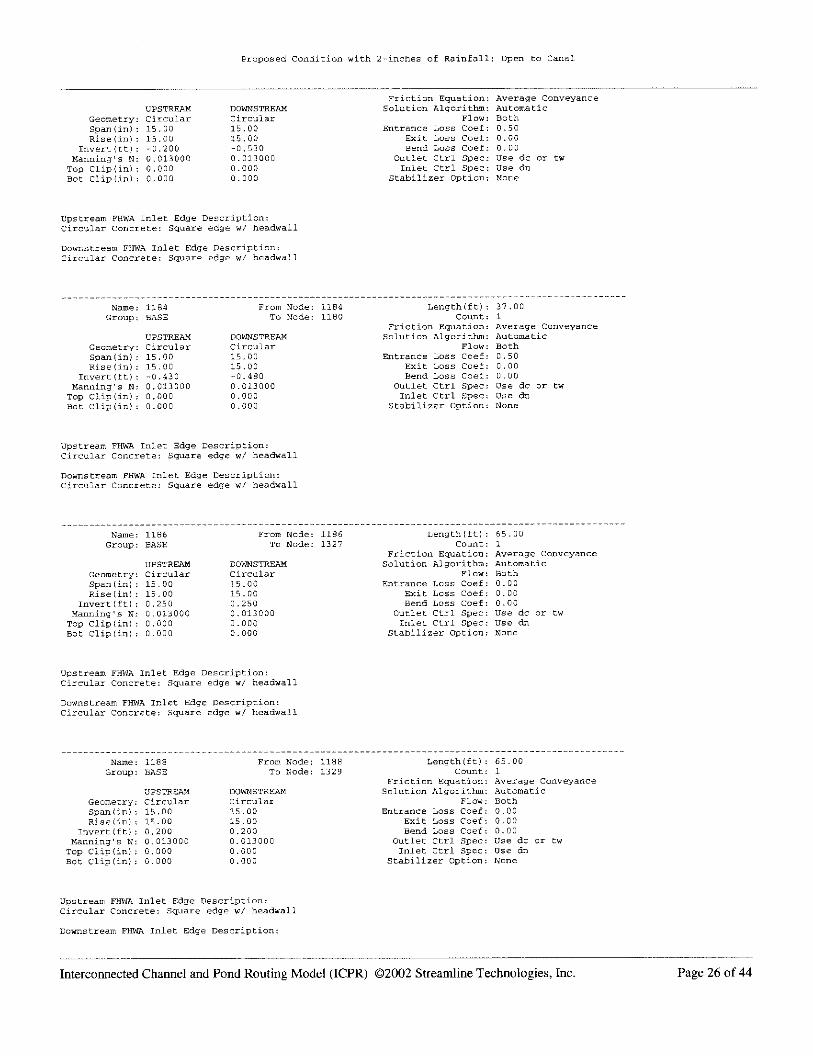


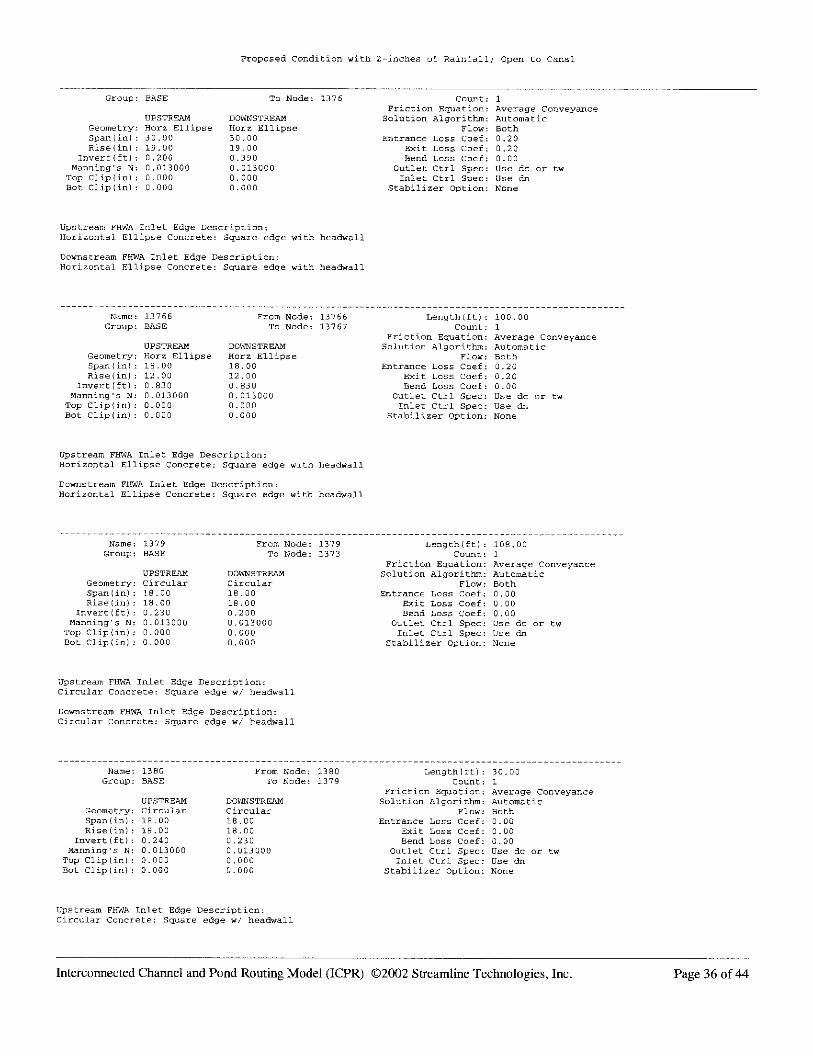


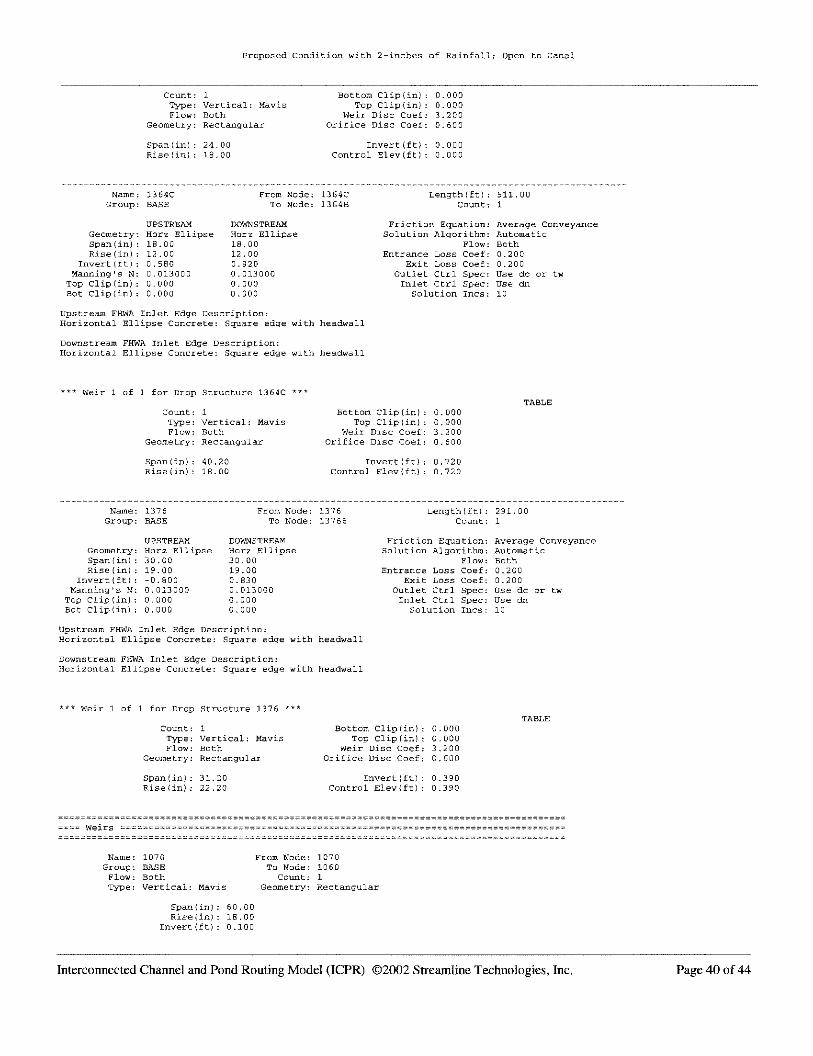
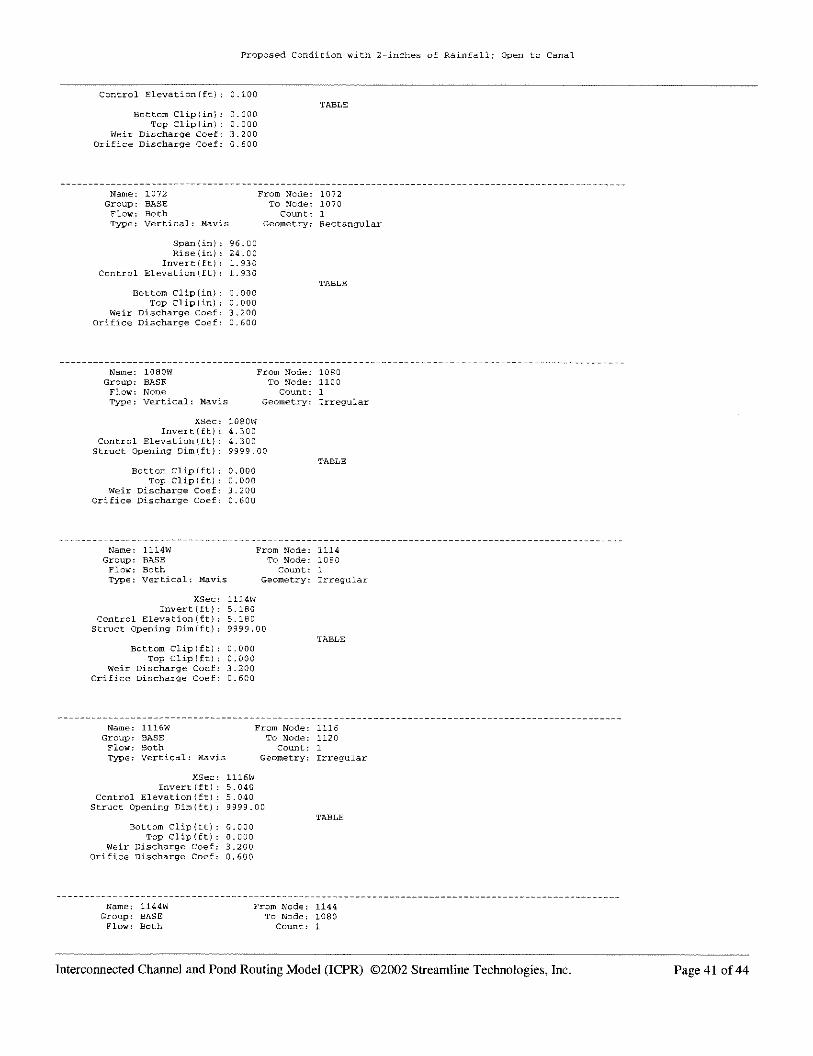
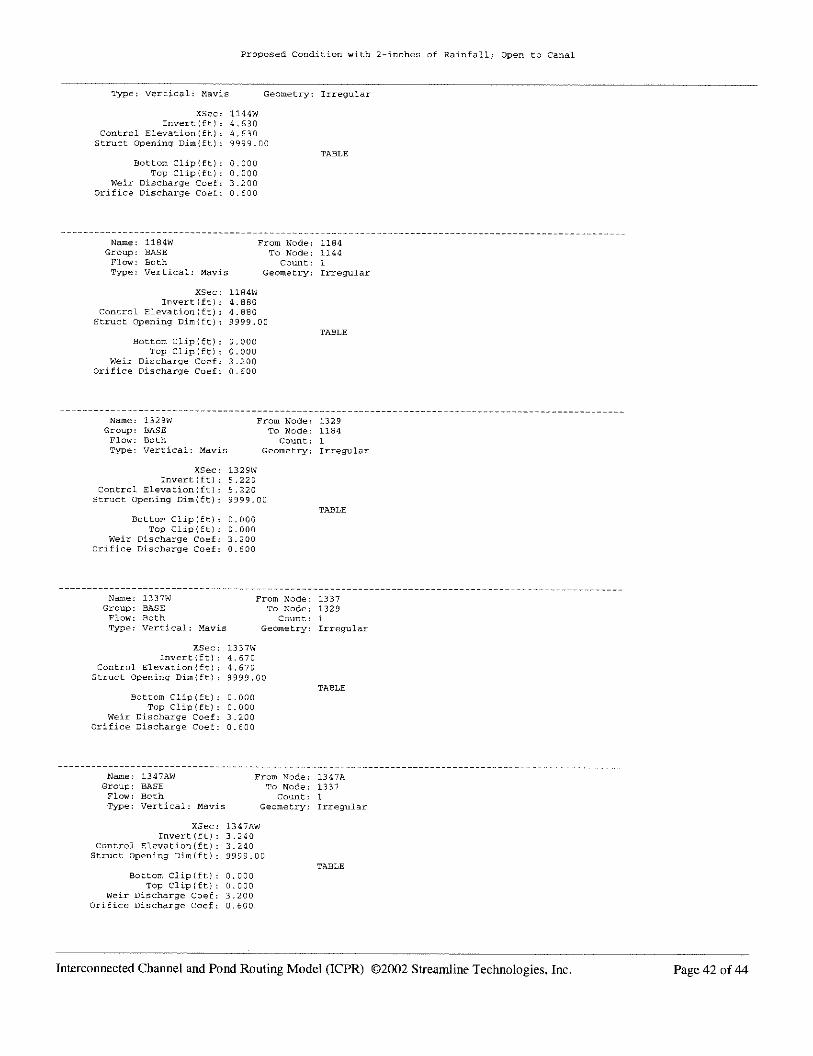


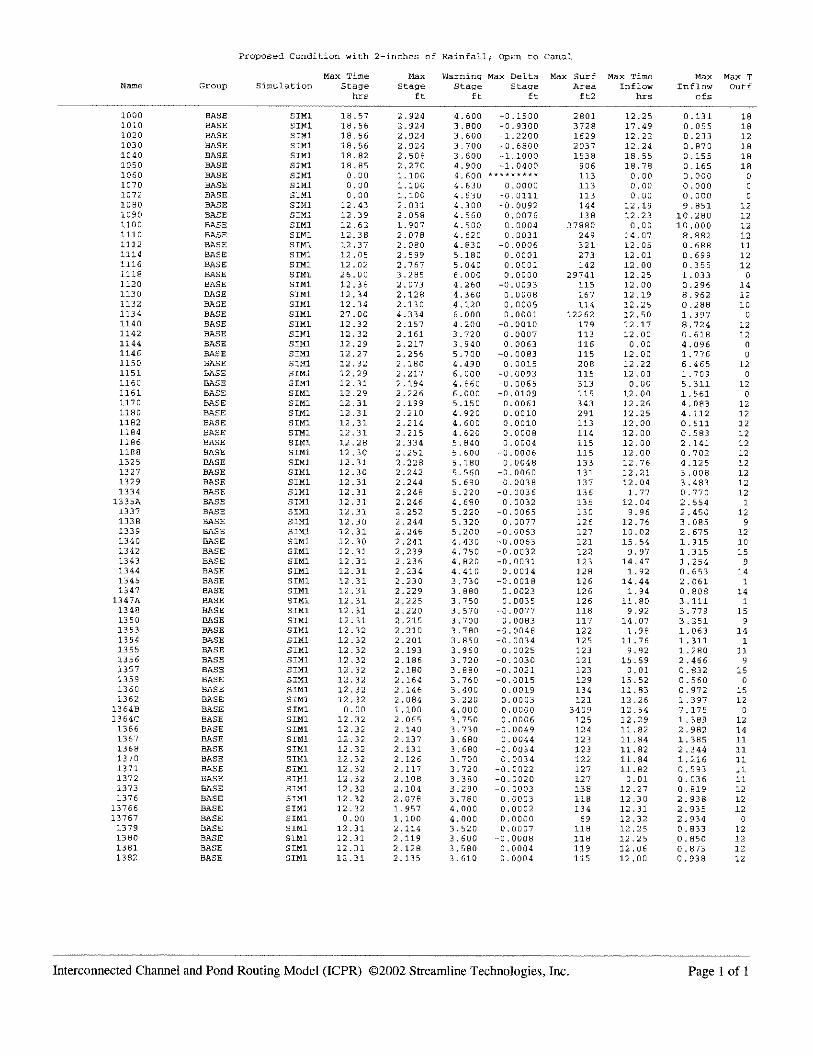
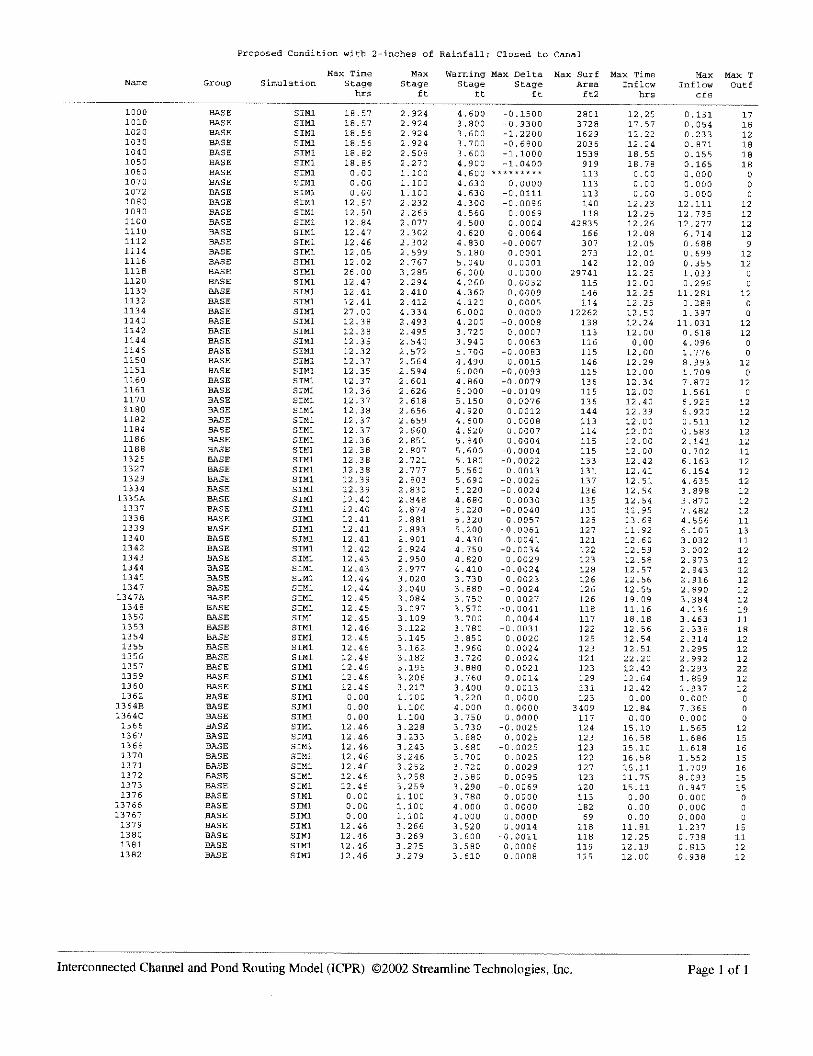
PROPOSED CONDITIONS OUTPUT


APPENDIX J
SWFWMD PRE-APPLICATION MEETING MINUTES


APPENDIX K
SARASOTA COUNTY DRAFT REPORT REVIEW COMMENTS


Related Documents