BD FACSDiva Software Quick Reference Guide for BD FACSAria Cell Sorters Workflow Overview The following figure shows the steps for daily workflow using BD FACSDiva software. Before starting your daily workflow, ensure that your lab’s software administrator has performed all the necessary tasks to set up the software for your use. This guide shows a workflow that uses application settings. Start Up System Check Performance Set Up Experiment Record Data Analyze Data Shut Down System t t t t t Starting Up the System Turn on the cytometer main power. Start up the computer, start BD FACSDiva software, and log in. Check fluid levels in the Cytometer window. Verify that the appropriate sort setup is selected and perform fluidics startup. Optimize the breakoff. Checking Cytometer Performance Turn off the Sweet Spot and select Cytometer > CST. Run the BD ™ Cytometer Setup and Tracking beads. View the Cytometer Performance Report. Close the Cytometer Setup and Tracking window. Verify that the breakoff is stable and turn on the Sweet Spot. 23-9546-00 This guide contains instructions for using BD FACSDiva ™ software version 6.0 with BD FACSAria ™ cell sorters. Verify the Cytometer Configuration and bead Lot ID. If needed, select a different configuration or bead lot ID. selected sort setup If needed, select a different sort setup from the Sort menu. 1 1 2 3 4 5 1 5 4 3 2

Welcome message from author
This document is posted to help you gain knowledge. Please leave a comment to let me know what you think about it! Share it to your friends and learn new things together.
Transcript
BD FACSDiva Software Quick Reference Guidefor BD FACSAria Cell Sorters
Workflow OverviewThe following figure shows the steps for daily workflow using BD FACSDiva software.
Before starting your daily workflow, ensure that your lab’ssoftware administrator has performed all the necessary tasksto set up the software for your use. This guide shows aworkflow that uses application settings.
Start UpSystem
CheckPerformance
Set UpExperiment
RecordData
AnalyzeData
Shut DownSystem
t tt t t
Starting Up the System
Turn on the cytometer main power.
Start up the computer, start BD FACSDiva software, and log in.
Check fluid levels in the Cytometer window.
Verify that the appropriate sort setup is selected and perform fluidics startup.
Optimize the breakoff.
Checking Cytometer Performance
Turn off the Sweet Spot and select Cytometer > CST.
Run the BD™ Cytometer Setup and Tracking beads.
View the Cytometer Performance Report.
Close the Cytometer Setup and Tracking window.
Verify that the breakoff is stable and turn on the Sweet Spot.
23-9546-00
This guide contains instructions for using BD FACSDiva™ software version 6.0 with BD FACSAria™ cell sorters.
Verify the CytometerConfiguration andbead Lot ID. If needed, select a
different configurationor bead lot ID.
Com
pens
atio
n
selected sort setup
If needed, select adifferent sort setupfrom the Sort menu.
1
1
2
3
4
5
1
5
4
3
2
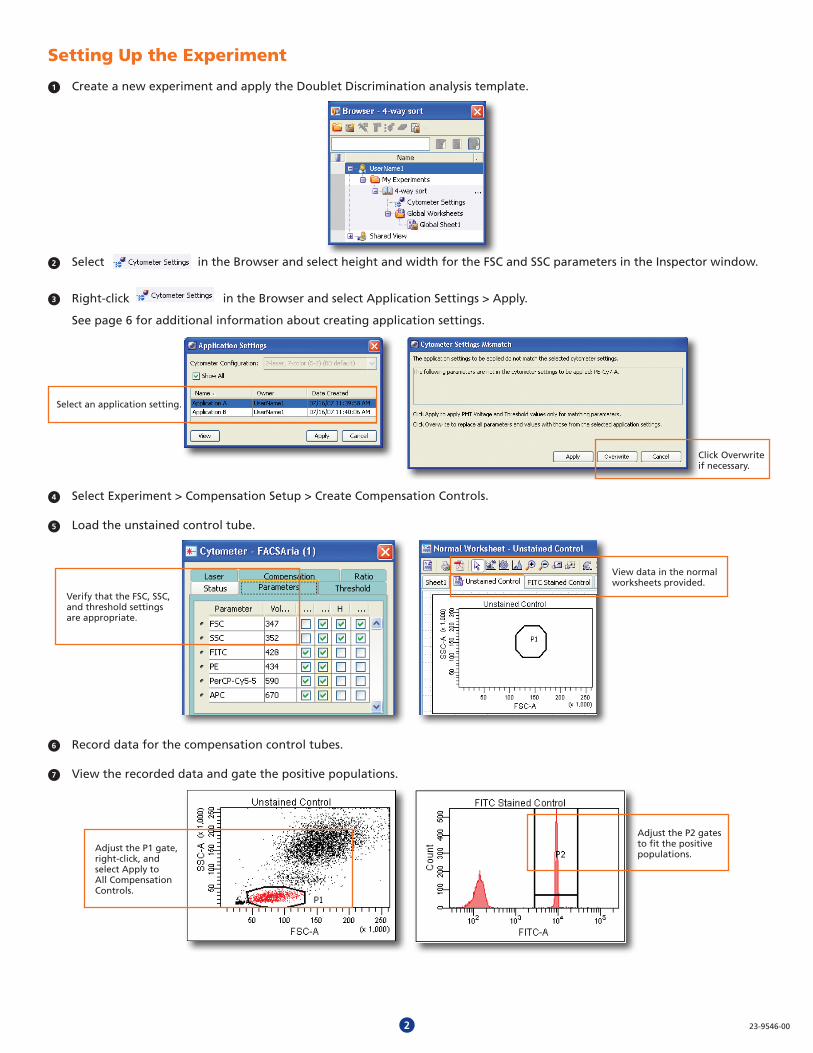
Setting Up the Experiment
Create a new experiment and apply the Doublet Discrimination analysis template.
Select in the Browser and select height and width for the FSC and SSC parameters in the Inspector window.
Right-click in the Browser and select Application Settings > Apply. See page 6 for additional information about creating application settings.
Select Experiment > Compensation Setup > Create Compensation Controls.
Load the unstained control tube.
Record data for the compensation control tubes.
View the recorded data and gate the positive populations.
23-9546-00
Select an application setting.
Click Overwriteif necessary.
View data in the normalworksheets provided.
Adjust the P1 gate,right-click, andselect Apply toAll CompensationControls.
Adjust the P2 gatesto fit the positivepopulations.
Verify that the FSC, SSC, and threshold settingsare appropriate.
1
2
3
4
5
6
7
2
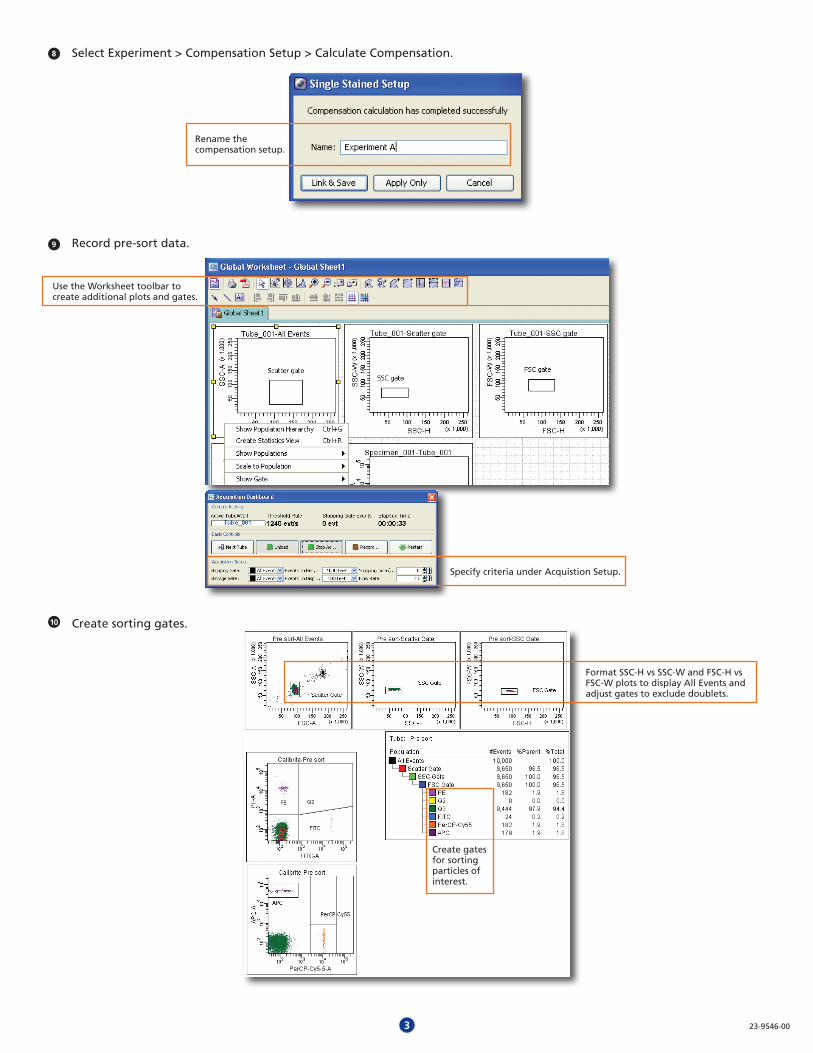
Select Experiment > Compensation Setup > Calculate Compensation.
Record pre-sort data.
Create sorting gates.
23-9546-00
Rename thecompensation setup.
Use the Worksheet toolbar tocreate additional plots and gates.
Format SSC-H vs SSC-W and FSC-H vsFSC-W plots to display All Events and adjust gates to exclude doublets.
10
Specify criteria under Acquistion Setup.
Create gates for sorting particles of interest.
3
8
9
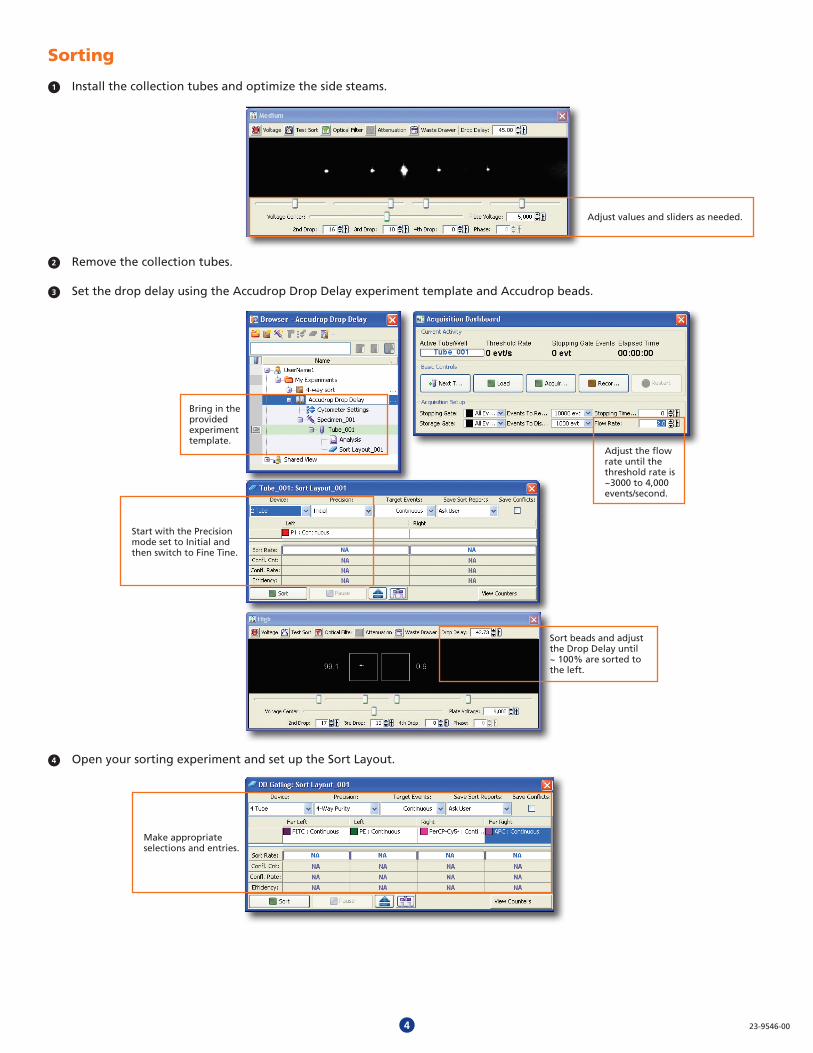
Sorting
Install the collection tubes and optimize the side steams.
Remove the collection tubes.
Set the drop delay using the Accudrop Drop Delay experiment template and Accudrop beads.
Open your sorting experiment and set up the Sort Layout.
23-9546-00
Adjust values and sliders as needed.
Bring in theprovidedexperimenttemplate.
Adjust the flow rate until the threshold rate is ~3000 to 4,000 events/second.
Start with the Precision mode set to Initial and then switch to Fine Tine.
Sort beads and adjust the Drop Delay until ~ 100% are sorted to the left.
Make appropriate selections and entries.
4
1
2
3
4
Install the collection tubes, start the sort, and monitor the stream during sorting.
Troubleshoot as needed using the following table as a guide.
Stop the sort and save a copy of the sort report.
Analyzing Data
Record post-sort data.
Check the sort purity.
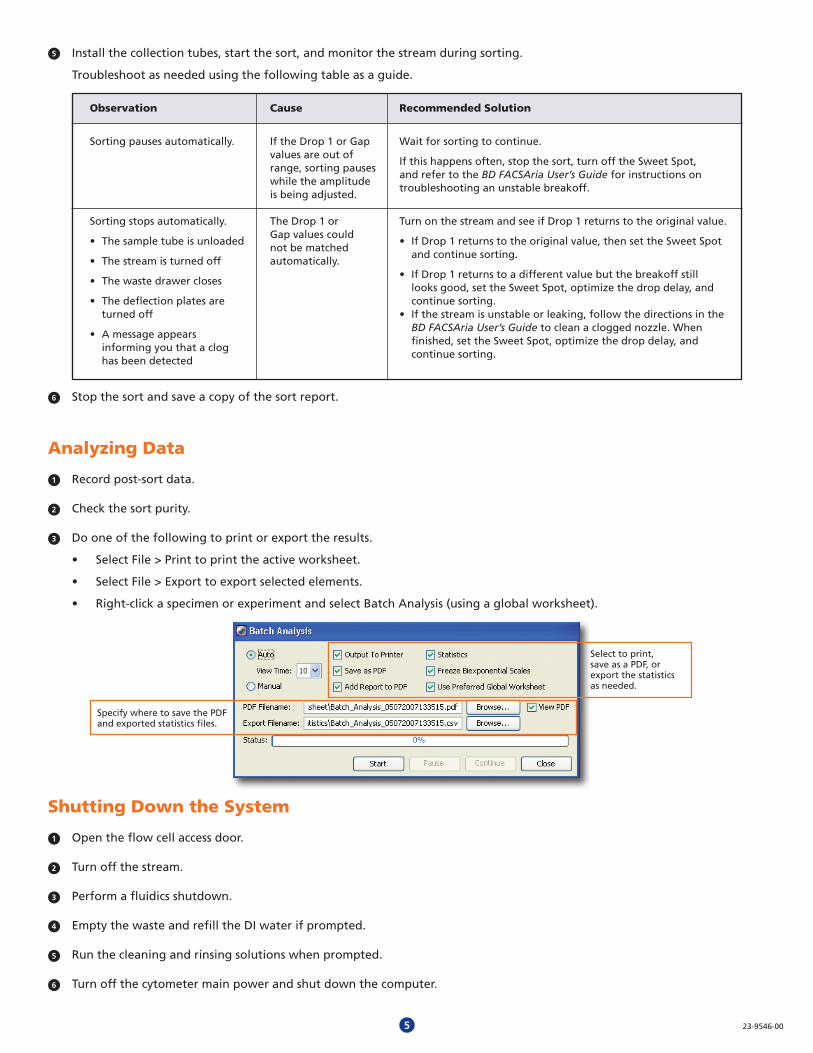
Do one of the following to print or export the results.
• SelectFile>Printtoprinttheactiveworksheet.
• SelectFile>Exporttoexportselectedelements.
• Right-clickaspecimenorexperimentandselectBatchAnalysis(usingaglobalworksheet).
Shutting Down the System
Open the flow cell access door. Turn off the stream. Perform a fluidics shutdown. Empty the waste and refill the DI water if prompted. Run the cleaning and rinsing solutions when prompted. Turn off the cytometer main power and shut down the computer.
Specify where to save the PDF and exported statistics files.
Select to print,save as a PDF, or export the statistics as needed.
Observation
Sorting pauses automatically.
Sorting stops automatically.
• Thesampletubeisunloaded
•Thestreamisturnedoff
•Thewastedrawercloses
•Thedeflectionplatesare turned off
•Amessageappears informing you that a clog has been detected
Cause
If the Drop 1 or Gap values are out of range, sorting pauses while the amplitudeis being adjusted.
The Drop 1 orGap values couldnot be matchedautomatically.
Recommended Solution
Wait for sorting to continue.
If this happens often, stop the sort, turn off the Sweet Spot,and refer to the BD FACSAria User’s Guide for instructions on troubleshooting an unstable breakoff.
Turn on the stream and see if Drop 1 returns to the original value.
• IfDrop1returnstotheoriginalvalue,thensettheSweetSpot and continue sorting.
•IfDrop1returnstoadifferentvaluebutthebreakoffstill looks good, set the Sweet Spot, optimize the drop delay, and continue sorting.•Ifthestreamisunstableorleaking,followthedirectionsinthe BD FACSAria User’s Guide to clean a clogged nozzle. When finished, set the Sweet Spot, optimize the drop delay, and continue sorting.
23-9546-005
5
6
1
2
3
1
2
3
4
5
6
23-9546-00
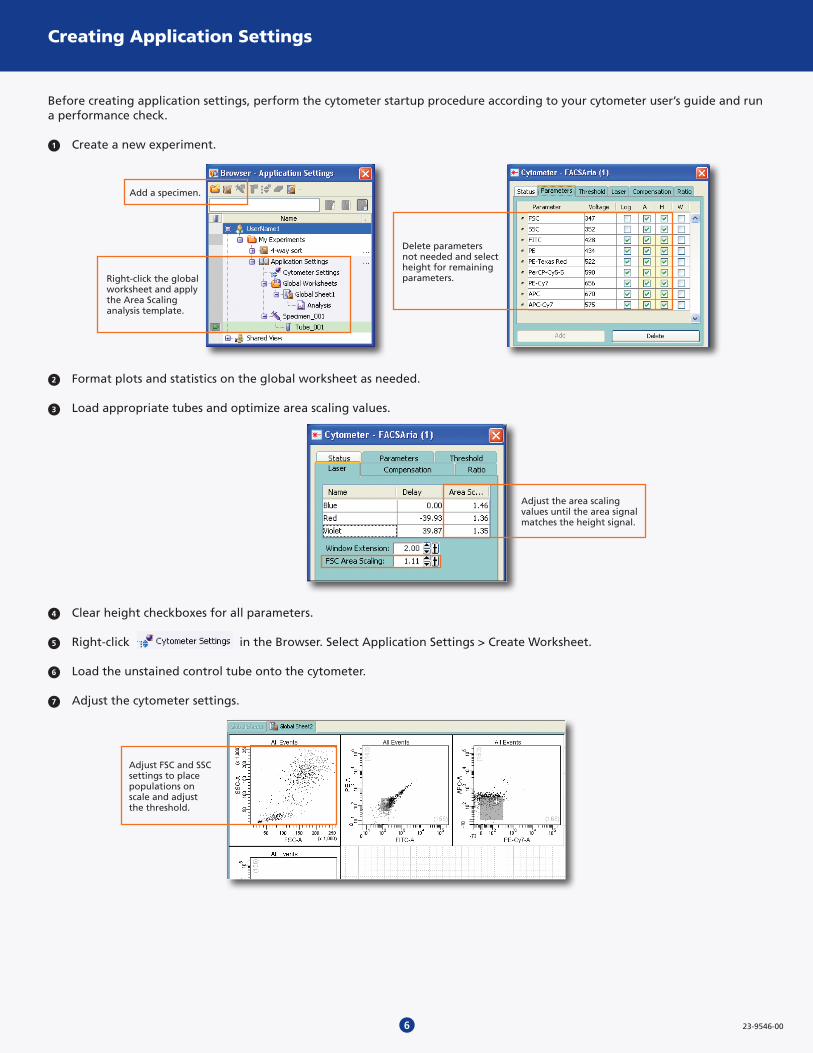
Creating Application Settings
Before creating application settings, perform the cytometer startup procedure according to your cytometer user’s guide and run a performance check.
Create a new experiment.
Format plots and statistics on the global worksheet as needed.
Load appropriate tubes and optimize area scaling values.
Clear height checkboxes for all parameters.
Right-click in the Browser. Select Application Settings > Create Worksheet. Load the unstained control tube onto the cytometer. Adjust the cytometer settings.
Add a specimen.
Right-click the globalworksheet and applythe Area Scalinganalysis template.
Delete parametersnot needed and select height for remaining parameters.
Adjust FSC and SSC settings to place populations onscale and adjustthe threshold.
Adjust the area scaling values until the area signal matches the height signal.
6
1
7
2
3
4
5
6
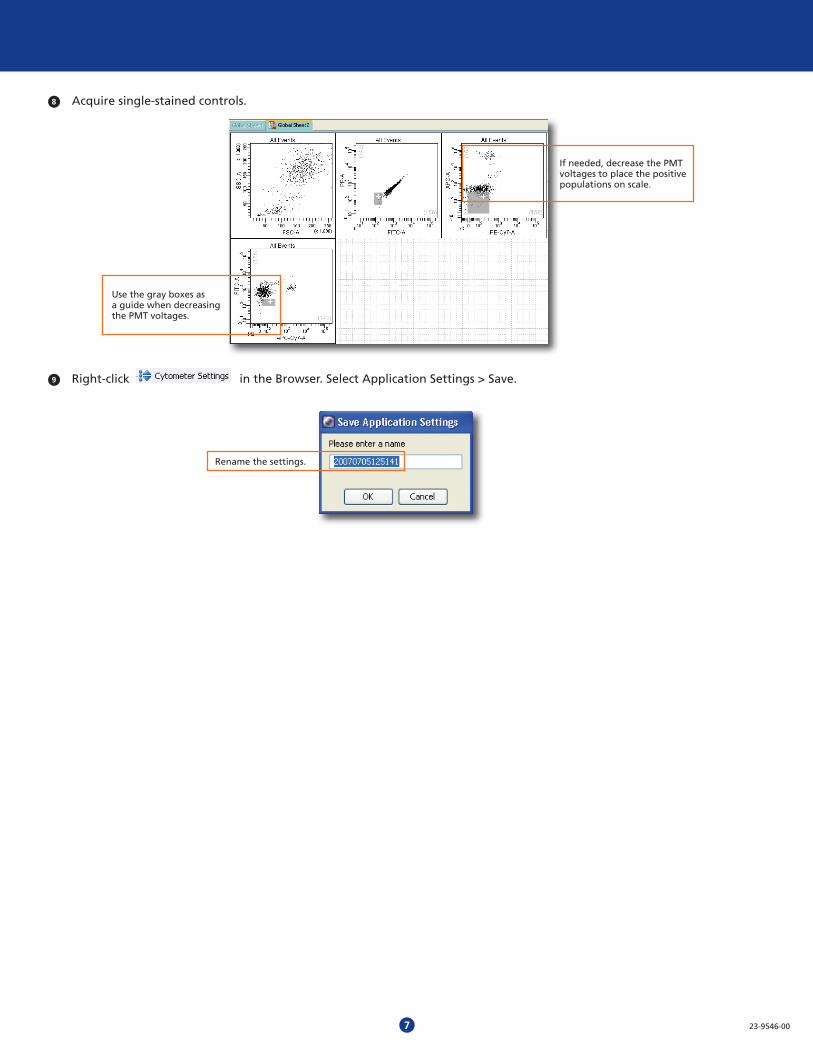
Acquire single-stained controls.
Right-click in the Browser. Select Application Settings > Save.
23-9546-00
If needed, decrease the PMT voltages to place the positive populations on scale.
Use the gray boxes asa guide when decreasingthe PMT voltages.
Rename the settings.
7
8
9
23-9546-00
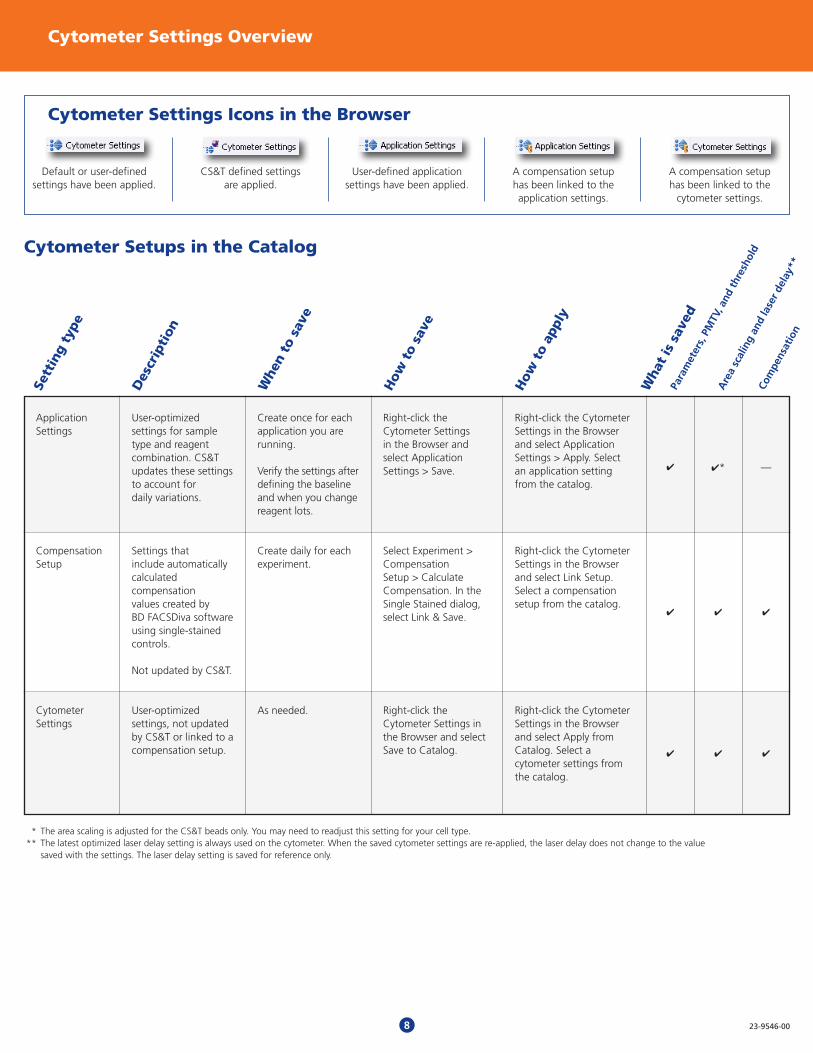
Cytometer Settings Overview
Default or user-definedsettings have been applied.
CS&T defined settingsare applied.
User-defined applicationsettings have been applied.
A compensation setuphas been linked to theapplication settings.
A compensation setuphas been linked to the
cytometer settings.
Cytometer Settings Icons in the Browser
The area scaling is adjusted for the CS&T beads only. You may need to readjust this setting for your cell type.The latest optimized laser delay setting is always used on the cytometer. When the saved cytometer settings are re-applied, the laser delay does not change to the value saved with the settings. The laser delay setting is saved for reference only.
***
ApplicationSettings
CompensationSetup
CytometerSettings
Para
met
ers,
PM
TV, a
nd th
resh
old
Are
a sc
alin
g an
d la
ser d
elay
**
Com
pens
atio
n
User-optimized settings for sample type and reagent combination. CS&T updates these settings to account fordaily variations.
Settings thatinclude automaticallycalculatedcompensationvalues created byBD FACSDiva software using single-stainedcontrols.
Not updated by CS&T.
User-optimizedsettings, not updated by CS&T or linked to a compensation setup.
Create once for eachapplication you are running.
Verify the settings after defining the baseline and when you change reagent lots.
Create daily for eachexperiment.
As needed.
Right-click theCytometer Settingsin the Browser and select ApplicationSettings > Save.
Select Experiment >CompensationSetup > Calculate Compensation. In the Single Stained dialog, select Link & Save.
Right-click theCytometer Settings in the Browser and select Save to Catalog.
Cytometer Setups in the Catalog
Sett
ing
type
Des
crip
tion
Whe
n to
sav
e
How
to
save
How
to
appl
y
Wha
t is
sav
ed
4 4 4
4 4 4
4 4* —
Right-click the Cytometer Settings in the Browser and select Application Settings > Apply. Select an application setting from the catalog.
Right-click the Cytometer Settings in the Browserand select Link Setup.Select a compensation setup from the catalog.
Right-click the Cytometer Settings in the Browser and select Apply from Catalog. Select acytometer settings from the catalog.
8
Related Documents