New Mexico’s Economy: Current Situation and Outlook BBER Data Users Conference November 2017

Welcome message from author
This document is posted to help you gain knowledge. Please leave a comment to let me know what you think about it! Share it to your friends and learn new things together.
Transcript

New Mexico’s Economy: Current Situation and Outlook
BBER Data Users ConferenceNovember 2017

DATA DASHBOARDS
• WHAT IS IT • A web-based data visualization
and communication tool• A subscription service
• HOW ITS USED • Used to communicate
complicated data • Used to keep those an
organization serves informed
• WHAT YOU GET • Customized package to
subscribers needs• Visual digital graphics• Constant maintenance and
updates • Customized database EDUCATION
HOUSING
FOR-UNM• WHAT IS IT
• A tool for decision makers in the public sector
• A subscription service
• HOW ITS USED • Used to understand
economic trends Nationally and Locally
• Used to guide future decision making and budget planning processes
• WHAT YOU GET • Quarterly Economic
Forecasts, Analysis of US, NM and Regional economies, Quarterly Forecast Meetings
EMPLOYMENT GROWTH
MIGRATION

RESEARCH
• BBER has the expertise to understand the big picture economic indicators and trends
• BBER can apply this big picture knowledge to smaller more
focused topics
• BBER offers tailored and detailed research to individual cities, towns, counties and organizations

Job Growth, 2011-2016
Source: US Bureau of Labor Statistics, CES

State to State Migration, 2011-2015
< 63
63-80
81-110
111-149
150+
Number leaving for 100 entering
Source: US Census Bureau
New Mexico net migration
(-42,000)
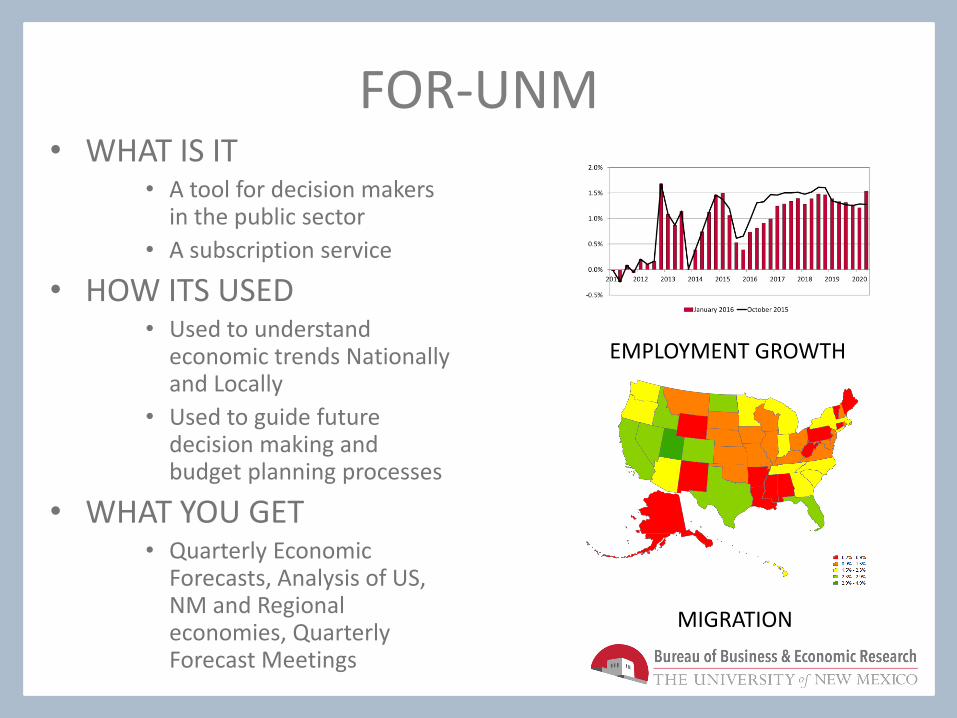
State to State Migration, 2005-2010
< 63
63-80
81-110
111-149
150+
Number leaving for 100 entering
Source: US Census Bureau
New Mexico net migration
39,500

No easy answers, but several observations.

Out-migration from NM beyond our neighbors.
< 6363-8081-110111-149150+
Number who leave NM per 100 who enter NM
2005-2010(+39,500)
2011-2016(-42,000)
Source: US Census Bureau

Out-migration of young families and seniors, while older working age population remains
Source: US Census Bureau
(13,938)
(9,330) (9,288)
(156)
(9,271)
(16,000)
(14,000)
(12,000)
(10,000)
(8,000)
(6,000)
(4,000)
(2,000)
01
1 to 17 years18 to 29 years30 to 44 years45 to 64 years65 years and over

Out-migration of Associate’s & Bachelor’s Degrees (25 y/o+)
Source: US Census Bureau
(1,954)
415
(8,632)
(16,947)
1,570
(20,000)
(16,000)
(12,000)
(8,000)
(4,000)
0
4,000
Less than high school graduate
High school graduate (includes equivalency)
Some college or associate's degree
Bachelor's degree
Graduate or professional degree

New Mexico has lost its early advantage in higher education.
21
13
4
9
16
21
25
35
39
-
5
10
15
20
25
30
35
40
451940 1950 1960 1970 1980 1990 2000 2010 2016
(4.5%)
(7.1%)
(12.7%)
(17.6%)
(20.4%)
(23.5%)
(25.0%)
(27.2%)
(9.8%)
Source: US Census Bureau
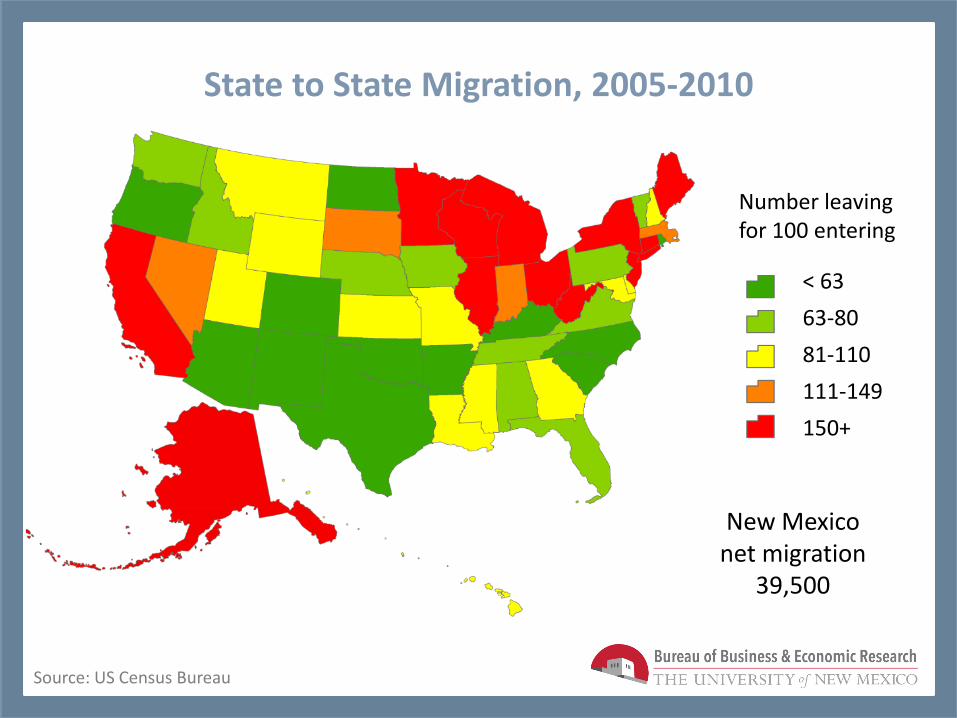
Professional jobs have driven job growth. Recent losses in oil state more than offset earlier gains.
Sources: Bureau of Labor Statistics, CES..Analysis by BBER.
Job growth ----- ----- 47
Prof & Business Svrs (%/Jobs) 46% 0.001 48
Financial Services (%/Jobs) 41% 0.003 45
Government (%/Jobs) -40% 0.004 3
Mining (%/Jobs) -37% 0.008 6
Data for September 2010 – September 2017

Source: US Bureau of Labor Statistics, CES
Professional & Business Services has driven US job growth, but NM ranks 48th

Wages have neither driven nor followed job growth.Young, large working age population are important.
Sources: US Census Bureau; BLS.Analysis by BBER.
Correlation
(R)
Significance
(P)
New
Mexico's
Rank
Job growth ----- ----- 47
Wages, Average Weekly 15% 0.301 43
Age 24-44 y/o (%/population) 45% 0.001 35
Median Age -33% 0.018 34
Data for 2016.

Tax rates are not correlated with job growth.
Correlation
(R)
Significance
(P)
New
Mexico's
Rank
Job growth ----- ----- 47
Total Taxes (% Income) -1% 0.938 14
Property Taxes -37% 0.008 1
Sales Taxes (GRT) 21% 0.149 42
Income Taxes 1% 0.41 35
Corporate Taxes -6% 0.683 25
Government debt -9% 0.549 26
1=Lowest Rate
Sources: Tax Foundation, 2017 Report.Analysis by BBER.
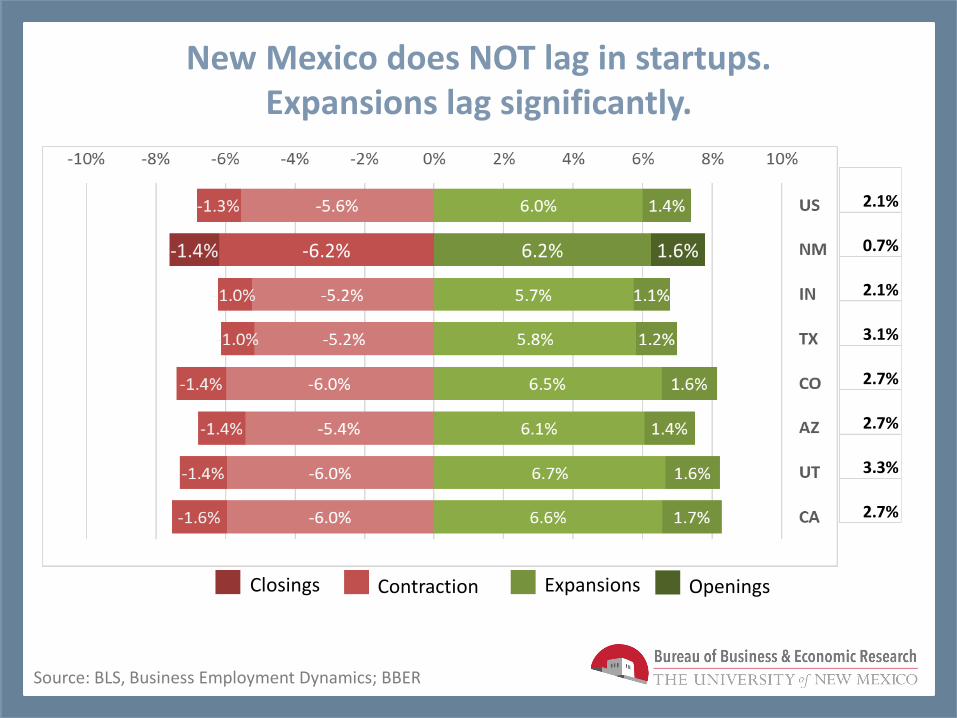
New Mexico does NOT lag in startups. Expansions lag significantly.
Source: BLS, Business Employment Dynamics; BBER
ExpansionsClosings Openings Contraction
2.1%
0.7%
2.1%
3.1%
2.7%
2.7%
3.3%
2.7%
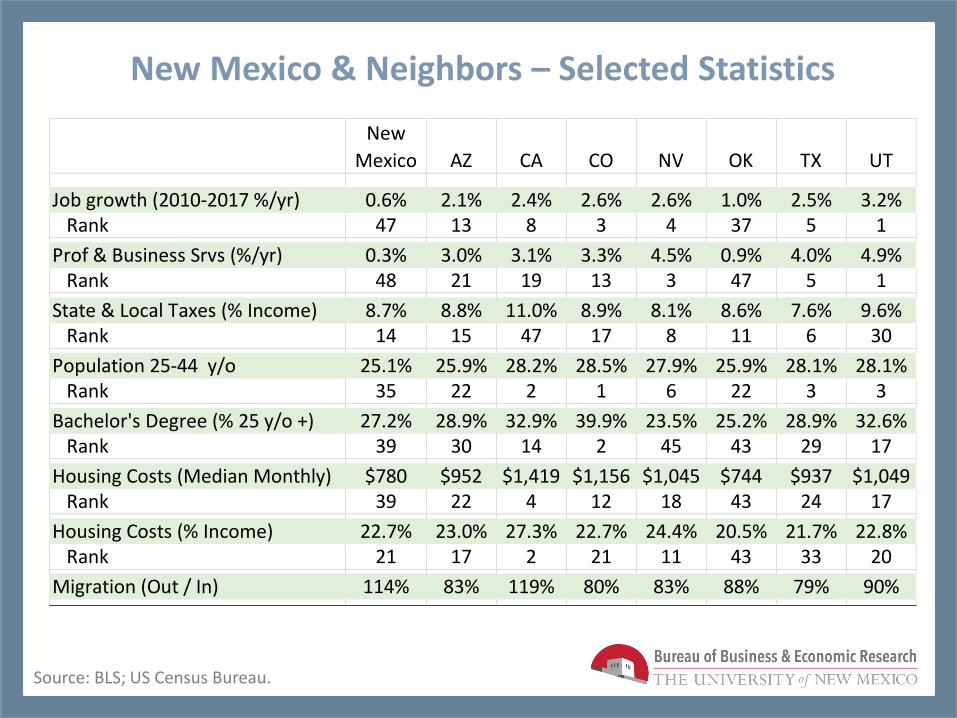
New Mexico & Neighbors – Selected Statistics
Source: BLS; US Census Bureau.
New
Mexico AZ CA CO NV OK TX UT
Job growth (2010-2017 %/yr) 0.6% 2.1% 2.4% 2.6% 2.6% 1.0% 2.5% 3.2% Rank 47 13 8 3 4 37 5 1
Prof & Business Srvs (%/yr) 0.3% 3.0% 3.1% 3.3% 4.5% 0.9% 4.0% 4.9% Rank 48 21 19 13 3 47 5 1
State & Local Taxes (% Income) 8.7% 8.8% 11.0% 8.9% 8.1% 8.6% 7.6% 9.6% Rank 14 15 47 17 8 11 6 30
Population 25-44 y/o 25.1% 25.9% 28.2% 28.5% 27.9% 25.9% 28.1% 28.1% Rank 35 22 2 1 6 22 3 3
Bachelor's Degree (% 25 y/o +) 27.2% 28.9% 32.9% 39.9% 23.5% 25.2% 28.9% 32.6% Rank 39 30 14 2 45 43 29 17
Housing Costs (Median Monthly) $780 $952 $1,419 $1,156 $1,045 $744 $937 $1,049 Rank 39 22 4 12 18 43 24 17
Housing Costs (% Income) 22.7% 23.0% 27.3% 22.7% 24.4% 20.5% 21.7% 22.8% Rank 21 17 2 21 11 43 33 20
Migration (Out / In) 114% 83% 119% 80% 83% 88% 79% 90%

Current Economic Situation
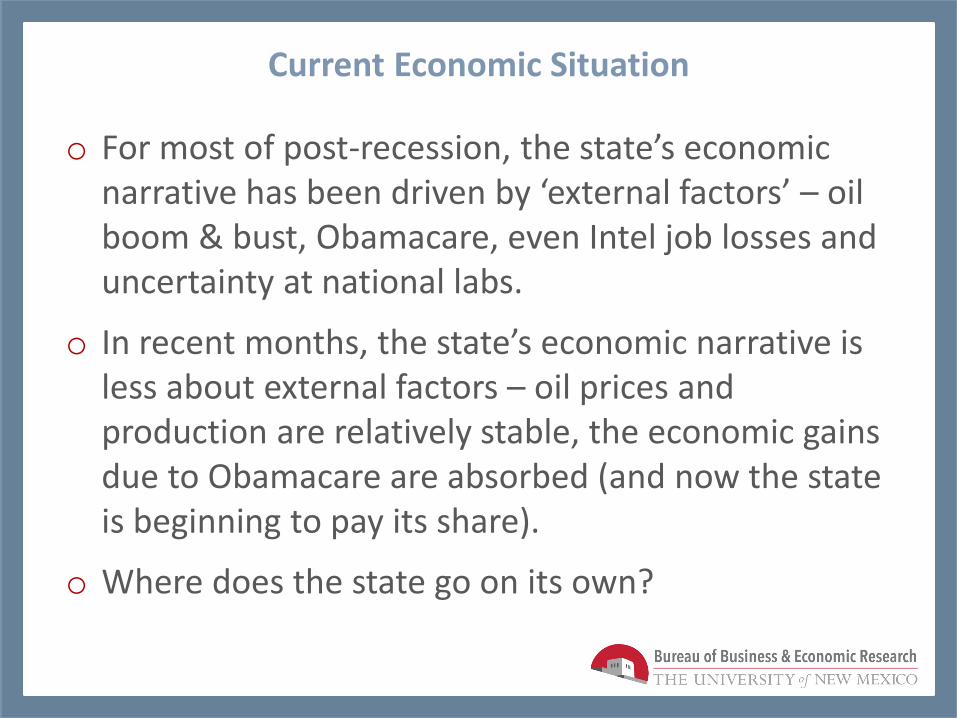
Current Economic Situation
o For most of post-recession, the state’s economic narrative has been driven by ‘external factors’ – oil boom & bust, Obamacare, even Intel job losses and uncertainty at national labs.
o In recent months, the state’s economic narrative is less about external factors – oil prices and production are relatively stable, the economic gains due to Obamacare are absorbed (and now the state is beginning to pay its share).
o Where does the state go on its own?

New Mexico Economic Current Situation
o NM lost 537 jobs (-0.1%) in 2017Q1 after a loss of 2,500 (-0.3%), first loss in two consecutive quarters since 2010.
o BBER estimates 1,250 jobs (0.2%) in 2017Q2 and Q3.
o Changing pattern– in 2017Q1 mining -1,390 jobs, healthcare +1,480 (in 2016, mining -5,700 jobs and healthcare +4,625 jobs).
o Improvement in Business & Prof. Services – 3.8% job growth in 2017Q1 (QCEW); 3.0% in 2017Q3 (CES).
o Public finances are much improved from a year ago – Gross Receipts tax collections up 12% in 2017Q2; oil prices & production up.
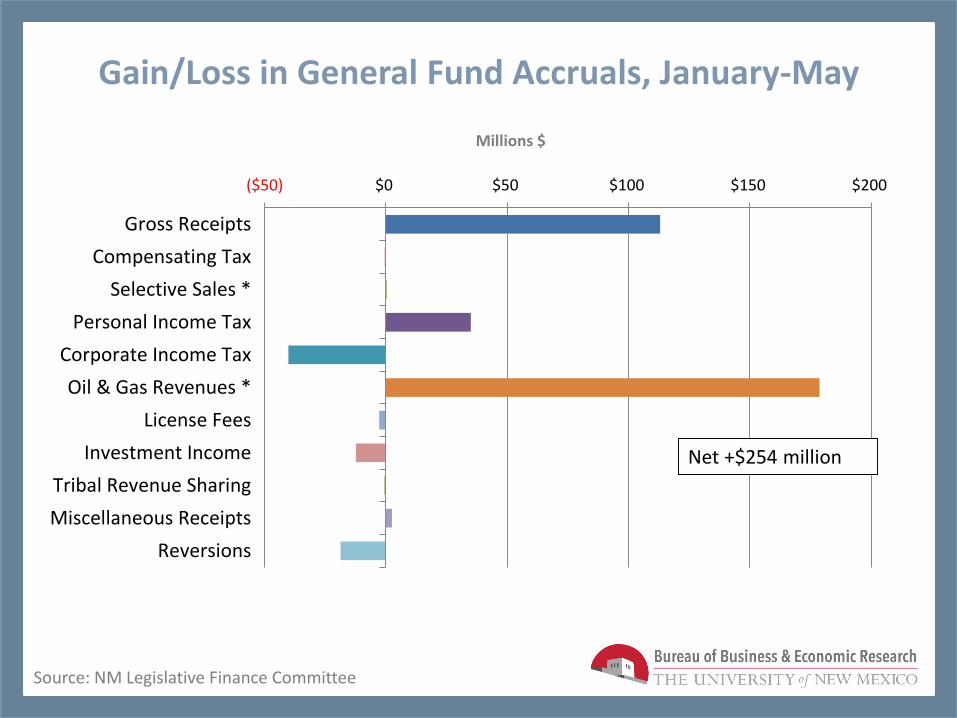
Gain/Loss in General Fund Accruals, January-May
Source: NM Legislative Finance Committee
($50) $0 $50 $100 $150 $200
Gross Receipts
Compensating Tax
Selective Sales *
Personal Income Tax
Corporate Income Tax
Oil & Gas Revenues *
License Fees
Investment Income
Tribal Revenue Sharing
Miscellaneous Receipts
Reversions
Millions $
Net +$254 million

Gross Receipts & Taxes by County: 2017Q2 vs. 2016Q2
Source: NM Taxation & Revenue Department, RP-80s
(15,000) 0 15,000 30,000
San JuanOteroRio ArribaCibolaColfaxTaosSanta FeCurrySan MiguelLunaTorranceChavesValencia
Remaining Counties
Los AlamosEddyLeaBernalillo
Net $106 million, 12%
(150,000) 150,000 450,000 750,000
OTEROCHAVES
RIO ARRIBATAOS
LINCOLNSAN MIGUELROOSEVELTDONA ANA
QUAY
Other 17 Cos
SAN JUANUNCLASSIFIED
SANTA FETORRANCEVALENCIA
EDDYLEA
BERNALILLO
Net $1.8 billion 6.8%
Gross Receipts Gross Taxes

Gross Receipts & Taxes by County: 2017Q2 vs. 2016Q2
Source: NM Taxation & Revenue Department, RP-80s
Net $106 million, 12%
Gross Receipts Gross Taxes
-$100,000,000 $900,000,000
Utilities
Mgt of Companies
Private Education Srvs
Public Administration
Arts, Entertainment,…
Agriculture
Information
Adminitrative Services
Hospitality
Finance & Insurance
Healthcare
Profession & Tech
Other Services
Real Estate
Wholesale
Construction
Transportation
Manufacturing
Mining
-$50,000,000 $0 $50,000,000
Unclassified
Agriculture
Arts, Entertainment,…
Public Administration
Private Education Srvs
Transportation
Manufacturing
Adminitrative Services
Mgt of Companies
Retail
Finance & Insurance
Hospitality
Utilities
Real Estate
Wholesale
Other Services
Healthcare
Mining
Profession & Tech
Construction
Net $1.8 billion 6.8%

Oil Rigs, Production and Price
Source: EIA, Baker Hughes, ONGARD, IHS Global Insight
0
20
40
60
80
100
120
0
50
100
150
200
250
300
Dri
ll R
igs
& W
TI P
rice
/Bar
rel
Pro
du
ctio
n In
dex
Oil Production Index Drill Rigs (Right) WTI Price (Right)
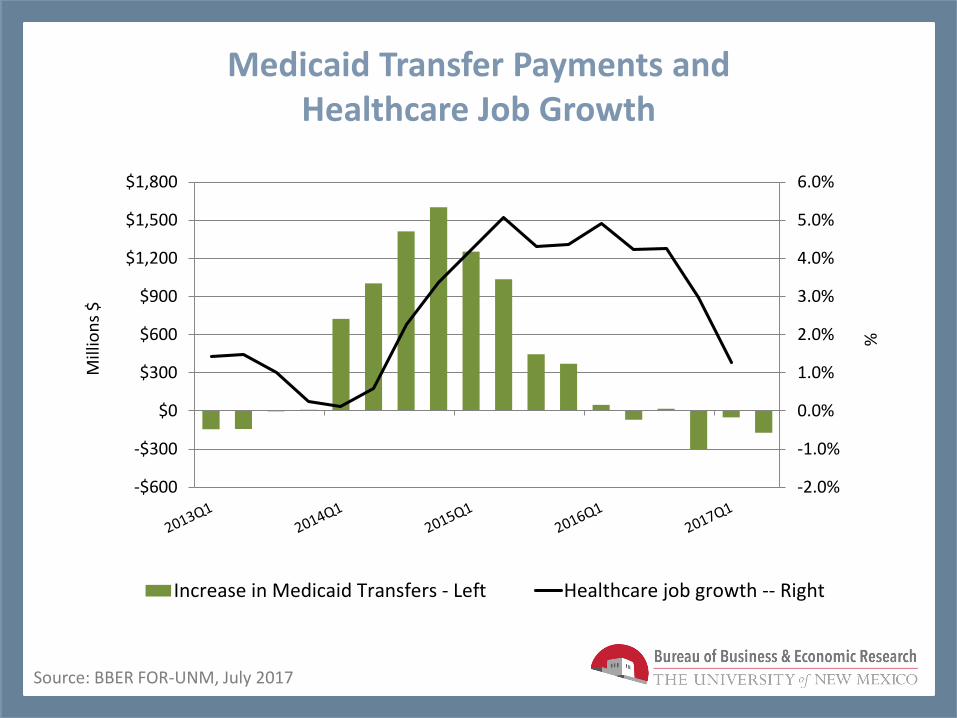
Medicaid Transfer Payments and Healthcare Job Growth
Source: BBER FOR-UNM, July 2017
-2.0%
-1.0%
0.0%
1.0%
2.0%
3.0%
4.0%
5.0%
6.0%
-$600
-$300
$0
$300
$600
$900
$1,200
$1,500
$1,800
%
Mill
ion
s $
Increase in Medicaid Transfers - Left Healthcare job growth -- Right

2017Q3 Housing Sales by Region and Building Permits
Source: NM Realtors Association; BBER
-
500
1,000
1,500
2,000
2,500
-
1,000
2,000
3,000
4,000
5,000
6,000
7,000
2010 2011 2012 2013 2014 2015 2016 2017
Bernalillo Co Santa Fe Co Dona Ana Co San Juan Co
Oil Patch Other Permits
New Mexico Economic Outlook

New Mexico Economic Outlook: 2018-2022
o Weaker near term forecast due to disappointing 2017Q1 QCEW employment data slow single family housing construction,
and weaker IHS Global Insight forecast, especially for incomes.
o Jobs forecast gain 4,500 (0.6%) jobs in 2017Q4, closing the year +1,750 jobs (0.2%).
o Jobs forecast gain 6,900 jobs (0.9%) 2018, and 8,725/yr (1.1%) in 2019-2022.
o Weak income growth – 2.7% in 2018, average 4.2% in 2019-2022.
o Oil production to increase gradually, given slightly weaker price outlook.
o Impacts of pessimistic (20%) greater than optimistic (15%) scenario.

Employment Growth: History and Forecast
-0.5%
0.0%
0.5%
1.0%
1.5%
2.0%
2012 2013 2014 2015 2016 2017 2018 2019 2020 2021
October 2017 July 2017
Source: BBER FOR-UNM, October & July 2017

Job Creation by Sector, 2018-2020
(1,000) 0 1,000 2,000 3,000 4,000 5,000 6,000 7,000 8,000 9,000
Fed. Govt. State Govt. Local Govt.
Accom. & Food Svs.Arts & Recreation
Healthcare & Soc. Asst.Educ. Svs.
Admin. & Waste Mgmt.Prof.& Tech. Svs.
Real Estate & LeasingFinance & Insurance
InformationTransport. & Warehsng.
Retail TradeWholesale Trade
ManufacturingConstruction
Mining
Source: BBER FOR-UNM, October 2017
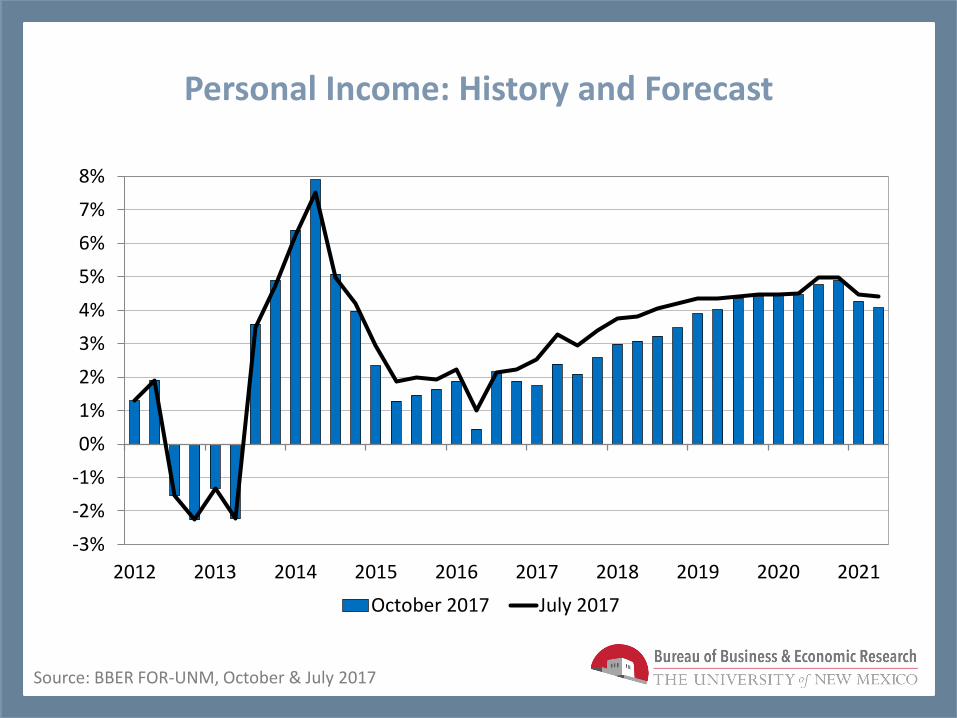
Personal Income: History and Forecast
-3%
-2%
-1%
0%
1%
2%
3%
4%
5%
6%
7%
8%
2012 2013 2014 2015 2016 2017 2018 2019 2020 2021
October 2017 July 2017
Source: BBER FOR-UNM, October & July 2017

Forecast Job Growth by Region, 2018-2022
(4,000)
(2,000)
0
2,000
4,000
6,000
8,000
10,000
12,000
2017 2018 2019 2020 2021 2022
Albuquerque Farmington Las Cruces Santa Fe Non-Metro
Source: BBER FOR-UNM, October 2017
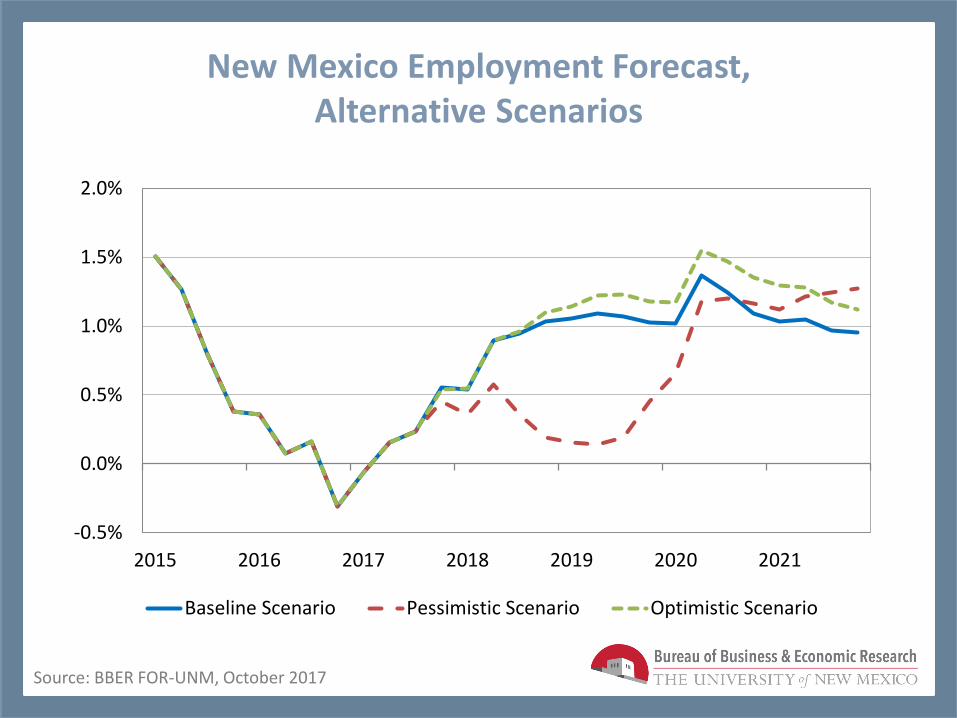
New Mexico Employment Forecast, Alternative Scenarios
-0.5%
0.0%
0.5%
1.0%
1.5%
2.0%
2015 2016 2017 2018 2019 2020 2021
Baseline Scenario Pessimistic Scenario Optimistic Scenario
Source: BBER FOR-UNM, October 2017

Concluding Comments
o Absent external factors (oil, Obamacare, etc.) NM’s economy has moved sideways, lacking an internal driver.
o NM has missed the professional services-based economic recovery; out-migration of college-educated labor force is a cause and an effect.
o Near-term is better than recent past – modest recovery of oil will continue to support state finances.
o To avoid continued boom and bust, leadership must take the long view.
o Principal economic challenges are education and stabilization of public finances (Gross receipts, Rainy Day fund).

BBER Provides New Mexico –
o Economic forecasts and analysis
o Customized data access and visualization tools
o Contract research
JEFF MITCHELLDirector
JENNIFER ESQUIVEL505.277.8300
@UNMBBER

New Mexico Leadership
Related Documents