Bayesian modelling and ROC analysis to predict placebo responders using clinical score measured in the initial weeks of treatment in depression trials Roberto Gomeni & Emilio Merlo-Pich 1 CPK/Modelling & Simulation and 1 Experimental Medical Science, Clinical Pharmacology Discovery Medicine, GlaxoSmithKline, Verona, Italy OnlineOpen: This article is available free online at www.blackwell-synergy.com What is already known about this subject • In major depressive disorder an appreciable percentage (40%) of patients in antidepressant trials will have a placebo response. • In these trials, early changes (i.e. within the first 4 weeks) of the clinical score scale (e.g. HAMD-17) are associated with response at end-point. • Unpredictable placebo response is one of the major reasons for clinical trial failure in the evaluation of antidepressant drugs. What this study adds • Provides a model to describe the time course of individual and population placebo response. • Provides a methodology to forecast the individual probability to be placebo responder based on early HAMD-17 measurements with an assessment of the prognostic power. • Provides a methodological framework to implement a population enrichment strategy in the design of clinical trials for the assessment of novel antidepressant drugs. Correspondence Roberto Gomeni, Clinical PK/Modelling & Simulation, GlaxoSmithKline, Via A. Fleming 4, 37135 Verona, Italy. Tel.: + 39 34 8531 7802 E-mail: [email protected] ............................................................................................................................. Keywords Bayesian hierarchical model, enrichment strategy, modelling placebo response, posterior probability, ROC curve analysis ............................................................................................................................. Received 4 May 2006 Accepted 4 September 2006 Published OnlineOpen 15 November 2006 Aims To develop a probabilistic and longitudinal model describing the time course of Hamilton’s Rating Scale for Depression (HAMD-17) total score in patients with major depressive disorders treated with placebo and to develop predictive models to estimate the response at end-point given HAMD-17 measurements at weeks 2 and 4. Methods Patients (n = 691) from seven clinical trials were analysed in WinBUGS using a Bayesian approach. The whole dataset was randomly split in a learning (359 patients for model definition) and a test dataset (332 patients for assessment of model predictive performance). The analysis of the learning dataset assumed uninformative priors, whereas the analysis of the test dataset used the posterior parameter estimates of the learning dataset as priors. ROC curve analysis estimated the optimal sensitivity/ specificity cut-off between false-negative and false-positive rates and determined the prognostic allocation rule for patients to responder and nonresponder groups. Results A Weibull/linear model accurately described the population and individual HAMD-17 time course. The total area under the ROC curve, ranging from 0.76 (logistic model with data at week 2) to 0.86 (longitudinal model with data at week 4), provided a measure of the prognostic discriminatory power of early HAMD-17 measures using the two models. The best placebo-responder classification score (86.32% true and 13.68% false positive) was associated with the longitudinal model with HAMD-17 measures at week 4. Conclusion Results showed the relevance of the Bayesian approach to predict HAMD-17 score at study end and to classify a patient as a placebo responder given the uncertainty in parameters derived from historical data and early HAMD-17 measurements. DOI:10.1111/j.1365-2125.2006.02815.x British Journal of Clinical Pharmacology © 2006 GlaxoSmithKline S.p.A. Br J Clin Pharmacol 63:5 595–613 595

Welcome message from author
This document is posted to help you gain knowledge. Please leave a comment to let me know what you think about it! Share it to your friends and learn new things together.
Transcript
Bayesian modelling and ROC analysis to predict placeboresponders using clinical score measured in the initialweeks of treatment in depression trials
Roberto Gomeni & Emilio Merlo-Pich1
CPK/Modelling & Simulation and 1Experimental Medical Science, Clinical Pharmacology Discovery Medicine, GlaxoSmithKline, Verona,Italy
OnlineOpen: This article is available free online at www.blackwell-synergy.com
What is already known about this subject• In major depressive disorder an appreciable percentage
(40%) of patients in antidepressant trials will have aplacebo response.
• In these trials, early changes (i.e. within the first 4 weeks)of the clinical score scale (e.g. HAMD-17) are associatedwith response at end-point.
• Unpredictable placebo response is one of the majorreasons for clinical trial failure in the evaluation ofantidepressant drugs.
What this study adds• Provides a model to describe the time course of individual
and population placebo response.• Provides a methodology to forecast the individual probability
to be placebo responder based on early HAMD-17measurements with an assessment of the prognostic power.
• Provides a methodological framework to implement apopulation enrichment strategy in the design of clinical trialsfor the assessment of novel antidepressant drugs.
CorrespondenceRoberto Gomeni, ClinicalPK/Modelling & Simulation,GlaxoSmithKline, Via A. Fleming 4,37135 Verona, Italy.Tel.: + 39 34 8531 7802E-mail: [email protected]
.............................................................................................................................
KeywordsBayesian hierarchical model,enrichment strategy, modellingplacebo response, posteriorprobability, ROC curve analysis
.............................................................................................................................
Received4 May 2006Accepted4 September 2006Published OnlineOpen15 November 2006
AimsTo develop a probabilistic and longitudinal model describing the time course ofHamilton’s Rating Scale for Depression (HAMD-17) total score in patients with majordepressive disorders treated with placebo and to develop predictive models to estimatethe response at end-point given HAMD-17 measurements at weeks 2 and 4.
MethodsPatients (n = 691) from seven clinical trials were analysed in WinBUGS using a Bayesianapproach. The whole dataset was randomly split in a learning (359 patients for modeldefinition) and a test dataset (332 patients for assessment of model predictiveperformance). The analysis of the learning dataset assumed uninformative priors,whereas the analysis of the test dataset used the posterior parameter estimates of thelearning dataset as priors. ROC curve analysis estimated the optimal sensitivity/specificity cut-off between false-negative and false-positive rates and determined theprognostic allocation rule for patients to responder and nonresponder groups.
ResultsA Weibull/linear model accurately described the population and individual HAMD-17time course. The total area under the ROC curve, ranging from 0.76 (logistic model withdata at week 2) to 0.86 (longitudinal model with data at week 4), provided a measureof the prognostic discriminatory power of early HAMD-17 measures using the twomodels. The best placebo-responder classification score (86.32% true and 13.68%false positive) was associated with the longitudinal model with HAMD-17 measures atweek 4.
ConclusionResults showed the relevance of the Bayesian approach to predict HAMD-17 score atstudy end and to classify a patient as a placebo responder given the uncertainty inparameters derived from historical data and early HAMD-17 measurements.
DOI:10.1111/j.1365-2125.2006.02815.x British Journal of Clinical Pharmacology
© 2006 GlaxoSmithKline S.p.A. Br J Clin Pharmacol 63:5 595–613 595
IntroductionA recognized problem in using randomized, double-blind, placebo-controlled trials to assess the clinicalproperties of novel antidepressants for treatment ofmajor depressive disorder (MDD) is the frequent occur-rence of failed trials [1, 2]. For example, an analysis ofthe five antidepressants marketed in the USA in the1990s indicated that only 14% of 39 trials used forregulatory filing proved capable of significant differen-tiation from placebo in both primary and secondary end-points [3]. Among the various contributing factors to theproblem so far identified, placebo response stands out asone of the most relevant [4].
Traditionally, placebo response is defined as theimprovement in clinical condition of patients randomlyassigned to the placebo treatment group [1]. The fact thatthe rate of placebo response in clinical trials has pro-gressively increased over the last 30 years has renewedinterest in a better understanding of this phenomenon[5].
This interest has been channelled into two mainresearch areas, namely the neurobiology of placeboresponse [6, 7] and the identification of better assaysensitivity and study design [4, 8–10]. The first approachfocuses on recent advances in the fields of neuroimag-ing, electrophysiology and pharmacogenetics, currentlyconsidered highly exploratory and rarely implementedin clinical trial for novel compounds (NCEs). Thesecond approach is based on the availability of clinicaldatabases, where reliable information obtained fromrandomized, double-blind, placebo-controlled trials isstored and made available for meta-analyses and math-ematical modelling.
Both approaches aim to find parameters that willbe used to identify placebo responders and to buildthe appropriate control group for delivering anefficient clinical trial design for novel antidepressanttreatments.
In general, the probability of an overall clinicalresponse, for a subject treated with an active drug, can befactored as the probability of responding to placebo andthe probability of observing a drug-related clinicalresponse. By definition, there is no chance of showingdrug efficacy for subjects with a 100% placebo response.As a consequence, the lower the placebo response, thehigher will be the probability of demonstrating a drugeffect.
It is recognized that, independently of individual sus-ceptibility to respond to placebo, treatment can alwaysresult in a relative improvement of the clinical condition.However, when the probability of responding to placebois already high at study entry, the addictive effect of drug
treatment is small. The present approach was aimed atmaximizing the possibility of detecting a clinically rel-evant signal by selecting those subjects who can delivergreater signs of drug activity when the assay sensitivityis low as in MDD trials [10].
In MDD clinical research, ‘responders’ are generallydefined as those subjects that improve their clinical scoreby 50% at the end of the trial (i.e. at 6–12 weeks) inrespect to the initial baseline score. Responder analysisis dichotomous, labelling subjects as ‘clinicallyimproved’ or ‘not improved’ according to a threshold.On these assumptions, a ‘placebo responder’ is a subjectwho already has a high probability of ending the trialwith a �50% improvement on the baseline score. Theadditive contribution of the drug treatment can stillaffect the numeric value of the final score, but it will notaffect the overall assessment of drug efficacy based onresponder analysis.
Therefore, labelling or excluding subjects identifiedas ‘placebo responders’ at the beginning of a trial wouldhelp in the selection of a study population that respondprimarily to the pharmacological effects of the drug,reducing the confounding influence of placebo response.This approach is of particular value in MDD clinicaltrials when the assay sensitivity is low, when the relativeimprovements of clinical score between 50% and 100%are of less clinical relevance, and when NCEs with inno-vative mechanisms are explored.
In other words, these departures from an unselectedpopulation will help to identify subjects who are likelyto become a ‘better’ assay population, representing anenrichment of the study population.
The enrichment approach has been used or proposedto identify responders to drug or placebo treatment instudies implementing sequential design [4, 11]. In thesestudies, selection is performed in a first double-blind,placebo-controlled, parallel-group study, identifyingindividuals with a high probability of being placebononresponders. These subjects are then randomized tothe second phase of the study and allocated to drug orplacebo treatments in order to establish efficacy. Onebenefit of the enrichment concept is that the likelihoodof trial success is improved, i.e. by reducing the placeboresponse rate and sample size. Another appreciatedaspect is the focus on a subpopulation whose treatmentneeds are of higher clinical relevance and with moredifficult management.
The drawback of the enrichment strategy is that themore a population is enriched the less representative it isof the target patient population. However, enrichmenthas value when the main objective of a study is thedetection of the first relevant clinical signal in the target
R. Gomeni & E. Merlo-Pich
596 63:5 Br J Clin Pharmacol
population, in particular, when compounds with a com-pletely novel mechanism of action are under investiga-tion (e.g. Phase IIA).
Several reports have indicated that clinical improve-ment during the first 2 weeks of antidepressant treatmentis highly predictive of sustained clinical response at end-point [12–18]. Some data indicate that these predictionscan also apply to the placebo treatment group. Quitkinand collaborators have suggested that a typical feature ofplacebo response in antidepressant trials is the antici-pated response sometime defined as ‘placebo initialresponse pattern’, present also in subjects taking drugtreatment with moderately delayed effects [9, 19]. Evi-dence that anticipated response is associated with sus-tained response and low relapse rate when treatment isplacebo suggests that this ‘early pattern’ can identify apopulation of placebo responders [12].
Therefore, it is reasonable to suggest the possibility oflinking clinical measurements in the early phase of atrial and the response profile at the end of the study forplacebo treatment.
The aim of this study was to develop mathematicalmodels describing the placebo response in MDD sub-jects and to assess the relationship between earlychanges in the clinical score measured using the 17-itemHamilton’s Rating Scale for Depression (HAMD-17) atdifferent time points (i.e. at week 2 or 4) and theHAMD-17 score at study end (i.e. at 8 weeks).HAMD-17 is a well-established clinical scale recog-nized by regulatory agencies as valid end-points forfiling claims about antidepressant effects of NCEs [20,21].
The predictive performance of the early HAMD-17measurements to identify ‘placebo responders’ vs.‘placebo nonresponders’ and its accuracy were assessedusing pooled data of 7 different clinical trials. Assess-ment for possible heterogeneity-related subgroup differ-ences were considered, i.e. the differences between eachclinical trial mostly related to the year of their execution,and the relevance of high vs. low HAMD-17 at baseline,and of high vs. low observed response expressed aspercentage HAMD-17 changes from baseline.
A Bayesian analysis approach is proposed to estimatethe expected HAMD-17 scores at week 8 given theHAMD-17 scores at weeks 2 and 4. At variance from thestandard maximum likelihood estimation procedure, in aBayesian analysis the posterior distributions of theparameters (i.e. those associated with new patients enter-ing the study) are determined by a combination of theprior distributions of the parameters (i.e. the one esti-mated on historical data within the same trial) and thelikelihood of the data. The receiver–operating character-
istic (ROC) curve is then used to measure the accuracyof the prediction in identifying ‘placebo responders’during the early phase of the trial.
MethodsThe basic premise of the analysis was the assumptionthat early HAMD-17 measurements (i.e. collected in theinitial 4 weeks of treatment) could be considered as aprognostic factor to inform decisions on the expectedresponse after 8 weeks of treatment with placebo. Twoindependent modelling approaches were evaluated: thefirst was based on a longitudinal model describing thetime course of the HAMD-17 scores and the second wasbased on the estimate of the probability that a patientwould respond (% HAMD-17 reduction from baselinevalue of at least 50%) at week 8, conditional on the %HAMD-17 change from baseline observed either atweek 2 or at week 4.
Prognostic models are used to discriminate betweengroups of patients likely to experience better or worseoutcomes and to give predictions of extent of clinicalresponse [21, 22]. The possibility of using these modelsis conditional on the effectiveness of the predictionsderived from them. To evaluate the predictive perfor-mances of these models a data-splitting methodologywas used. This procedure consists of splitting the origi-nal database into two parts, one used to define the modelstructure and to estimate model parameter distribution(learning dataset) and the other to test the predictiveperformance of the model (test dataset).
One of the main advantages of this approach is thecomplete independence of the learning and test datasetswhich mimic newly collected data on which alone thepredictivity of the model can be evaluated.
Data were derived from the GlaxoSmithKline clinicaldatabase on paroxetine [GlaxoSmithKline ClinicalTrial Register (http://ctr.gsk.co.uk/Summary/paroxetine/studylist.asp)], considering only patients with MDD,receiving placebo treatment and with HAMD-17 scoresmeasured at least at baseline, week 2, week 4 and week8. The following clinical trials conducted between 1991and 2004 were retained: 128 [year 1991, code MY-1045/BRL-029060/1(PAR128)], 449 (year 1997, code 29060/449), 448 (year 1997, code 29060/448), 487 (year 1997,code 29060/487), 810 (year 2002, code 29060/810),NKD2006 (year 2003, code NKD2006) and 874 (year2004, code BRL-29060/874), for a total of 691 patients.All clinical trials were randomized, double-blind,placebo-controlled, parallel-group studies.
The whole database was stratified by year and ran-domly split into the learning and test sets as:
Bayesian modelling of placebo response in depression
Br J Clin Pharmacol 63:5 597
Learning set: trials 128, 449, NKD2006 and 810 for atotal of 359 patients.
Test set: trials 448, 487 and 874 for a total of 332patients.
The flexibility of the longitudinal model in accountingfor possible data heterogeneity in the learning set wasexplored by evaluating model performances by studyand intensity of observed responses at week 8 expressedas percentage HAMD-17 changes from baseline. TheMDD subjects were classified into three groups: (i) low% HAMD-17 changes <30%; (ii) medium % HAMD-17changes from 30 to 60%; and (iii) high % HAMD-17changes >60%. Using these criteria, 31%, 30% and39%, respectively, of total subjects in the learningdataset were allocated to the three groups.
Possible data heterogeneity in the model predictabil-ity properties was also explored by factoring the test setmodel outcome by study and by HAMD-17 scores atbaseline. MDD subjects were classified into threegroups: (i) subjects with a low HAMD-17 score at base-line �20; (ii) subjects with a medium HAMD-17 scoreat baseline ranging from 20 to 23; and (iii) subjects witha HAMD-17 score at baseline >23. Using these criteria,30%, 35% and 35%, respectively, of total subjects in thetest dataset were allocated to the three groups.
Bayesian analysisBayesian analysis is an inferential approach in which allthe uncertain parameters are interpreted in terms ofprobability. Data analysis starts with the formulation ofa model with unknown parameters. Then a prior distri-bution is given to the unknown parameters of the modelwhich represent our beliefs or guesses or prior studyinformation about the parameters before we observe ourdata. After conducting a study and observing some data,Bayes’ Rule is applied to calculate the posterior distri-bution for these unknowns. This will provide an updatedbelief on the model parameter distributions.
Prior mean and precision (the inverse of the variance)of the parameter distribution need to be defined in aBayesian analysis. Priors with high precision are calledinformative and priors with very low precision are calleduninformative. When uninformative priors are used, theinformation in the data alone will in principle determinethe posterior distribution. One of the advantages of aBayesian approach is its ability to capitalize on the infor-mation generated in one analysis by computing the pos-terior distribution of the parameters (combining priorsand likelihood for the current data) and use this infor-mation as historical belief of the parameter distribution(informative prior). The analysis of the learning dataset
assumed uninformative priors, whereas the analysis ofthe test dataset used the posterior parameter estimates ofthe learning dataset as priors.
The Bayesian parameter and error estimation was per-formed using a Markov Chain Monte Carlo (MCMC)algorithm as implemented in the WinBUGS softwarepackage [23].
Probabilistic modelA binary score defined as success (i.e. change frombaseline HAMD-17 score �50% at week 8) or failure(otherwise) was attributed to each patient receivingplacebo. The probability that a success occurred as afunction of the % HAMD-17 change observed at weeks2 and 4 was then estimated using a logistic model. Theprobability P of being a responder is described by themodel:
λ θ θ= + ⋅1 2 17% HAMD- (1)
Pe
e=
+
λ
λ1(2)
where q1 is the intercept of the logistic function and q2 isthe slope of the logistic function.
The logistic model was fitted to the learning datasetusing the fractional change in HAMD-17 either at week2 or at week 4 as predictor of the response observed atweek 8.
Longitudinal modelThe time course of clinical response in depression isusually measured by scoring values estimated using theHAMD-17 rating scale. These curves generally shownonlinear behaviour over time, with an initial drop fromsome baseline values, maximal change and, in somecases, late recovery toward the baseline.
Alternative models were investigated to describe thelongitudinal placebo response time course:
(i) an inverse Bateman function [24]:
f t A B e ek t k t( ) = − ⋅ −( )− −on rec (3)
were A is the baseline HAMD-17 score, B is a parameterassociated with the maximal change from baseline, kon
and krec the first-order rate constants for the onset and therecovery of the effect;
(ii) a polynomial function [25]:
f t A a t b t( ) = + ⋅ + ⋅ 2 (4)
were A is the baseline HAMD-17 score, a and b are theslope and the quadratic coefficient;
(iii) a mixed exponential and linear function:
f t Ae h tk t( ) = +− onrec (5)
R. Gomeni & E. Merlo-Pich
598 63:5 Br J Clin Pharmacol
were A is the baseline HAMD-17 score, kon is the first-order onset rate and hrec the recovery rate;
(iv) a mixed Weibull and linear function:
f t Ae h tt td b( ) = +−( )
rec (6)
were A is the baseline HAMD-17 score, td is the timecorresponding to 63.2% change from baseline, b is therate of change in the placebo response and hrec is therecovery rate. In addition to the model parameters A, td,b and hrec, the change from baseline (CH8) at week 8(with its posterior distribution) was computed for eachsubject i as:
CH rec88 8
ii i
i
i it td
i
i
A f
A
A A e h
A
ibi
= − ( )=
− +{ }−( )
(7)
Bayesian hierarchical approachA general three-stage hierarchical modelling approachwas used to estimate parameters of the longitudinalmodel. Suppose we have a number (ni) of measurementsmade on each of N individuals, who are indexed by i(such as the HAMD-17 scores over time). Denote the jth
measurement for individual i by yij and the associatedtime by tij.) Further, denote as qi the p-dimensionalvector of model parameters for individual i and theresidual error variance by s2. The Bayesian model wasdefined according to a general three-stage hierarchicalmodel:
Structural model y , ijij i ijf t= ( ) +θ ε
1st stage measurement error model N , Tc( ) ( )−: ε ∼ 0 1
2nd stage population dispersion model LN , T( ) ( )−: θ μ∼ 1
3rd stage prior : T N a, b , Tc N d, e , N(m, n)t t( ) ( ) ( )∼ ∼ ∼μ
where f() is the nonlinear structural model, eij is aresidual error; N, Nt, and LN are the normal, normalcensored and log-normal distributions, respectively; �and �c are the precision (inverse of variance); m is avector of the mean values of the distribution of the qs;a, b, c and d are the parameters for the uncertainty of� and �c; m and n are the mean value vector and pre-cision of the uncertainty distribution of m, respectively.The parameters a, b, c, d, m and n represent theprior probability distribution, often called simply theprior, of the model parameters qs and measurementerror eij.
Longitudinal models comparisonA natural way to compare models and the influence ofalternative option on parameter distribution is to usecriteria based on a trade-off between the fit of the data to
the model and the corresponding complexity of themodel. In the Bayesian framework, a criterion has beenproposed based on the Deviance Information Criterion(DIC) to compare alternative models [26]. This criterionaccounts for the goodness of fit and the measure of thecomplexity of the model.
The goodness of fit D(q) is defined by -2 log-likelihood(data|q) and the complexity measured pD isdefined as the posterior mean deviance minus devianceevaluated at the posterior mean of the parameters. DICcriteria, which can be considered as a generalization ofAkaike’s Information Criterion (AIC) [27], can be esti-mated as:
DIC D pD= ( ) +θ 2 (8)
Models with smaller DIC are better supported by thedata.
Predicting responders at week 8 from earlyHAMD-17 measuresThe posterior probability of response (Equation 2) wascomputed for each patient in the test set using the %HAMD-17 change from baseline at weeks 2 and 4 withthe posterior estimate of the logistical model parameters(q1 and q2) estimated in the learning set analysis.
For the longitudinal model, the posterior probabilityof response was estimated as the probability thatCH8 � 0.5 (Equation 7), given the partial data and theprior parameter distribution estimated in the learning setanalysis.
When the individual probability exceeded a pre-defined threshold (cut-off value), the patient was classi-fied as responder. The predicted responders were thencross-tabulated with the actual outcomes to determinethe ‘sensitivity’ (percentage of true positives) and ‘speci-ficity’ (percent of true negatives) for cut-off valuesvarying from 0 to 1.
Measure of predictive performance of the modelsROC curve was developed as a measure of the accuracyof diagnostic tests in medicine and other fields. ROCcurves display the relationship between [sensitivity](true-positive rate) and [1 - specificity] (false-negativerate) across all possible cut-off values defining theresponse to a treatment. The cut-off value is used toallocate a patient in the group of responders or nonre-sponders at week 8 given the early HAMD-17 measure-ment and the associated probability of being a responderderived from the two modelling approaches. The sensi-tivity and specificity, and therefore the performance ofthe system, vary with the selected cut-off.
The global performance of early HAMD-17 measure-
Bayesian modelling of placebo response in depression
Br J Clin Pharmacol 63:5 599
ment as predictor is generally characterized by the areaunder the ROC curve that summarizes the inherentcapacity of an early HAMD readout for discriminating aresponder from a nonresponder patient [28, 29].
The larger is the area the better is the predictive per-formance. The area of 1.0 is associated with the idealpredictor because it achieves both 100% sensitivity and100% specificity. The area of 0.5 is associated with apredictor with 50% sensitivity and 50% specificity. Thisis a test that is no better than flipping a coin. In practice,a reliable predictor should have an area somewherebetween these two extremes. The closer the area is to1.0, the better the predictor, and the closer the area is to0.5, the worse the predictor.
The area under the curve has one important directinterpretation: this value equals the unconditional prob-ability of correct classification (responder or nonre-sponder) [30]. Furthermore, appropriate methodologieshave also been applied to estimate its variance and to testwhether the estimated area is greater that the referencevalue of 0.5 [31].
The ROC curve is generally used to select the cut-offpoint that best suits the investigator’s purpose. That is, ifone wished to eliminate false positives, one wouldchoose a leftward cut-off which minimizes false posi-tives (high specificity and therefore lower sensitivity). If,on the other hand, one wished to eliminate false nega-tives, a more rightward cut-off which minimizes falsenegatives would be chosen (high sensitivity and there-fore lower specificity).
The determination of an ‘ideal’ cut-off value is almostalways a trade-off between sensitivity (true positives)and specificity (true negatives). For the purpose of thepresent analysis, two different criteria were evaluated:the optimal and the best performing. The optimal cut-offvalue is that which maximizes the overall efficiency as afunction of the varying cut-off values (c). This value canbe estimated by maximizing the index J [32], defined as:
J sensitivity c specificity c= ( ) + ( ) −[max ]1 (9)
The alternative best-performing cut-off point can be esti-mated as the point which minimizes the absolute differ-ence (distance) D between the sensitivity and specificitycurves:
D sensitivity c specificity c= ( ) − ( )[min ] (10)
This best-performing cut-off point corresponds to theprobability threshold with the closest rate of true posi-tive and true negative and corresponds to the point wherespecificity and sensitivity curves vs. cut-off values cross.This point is characterized by the highest true-positive/negative with the lowest false-positive/negative rates.Ideally, the optimal and the best performing cut-offpoints should coincide in the case of symmetrical ROCcurves.
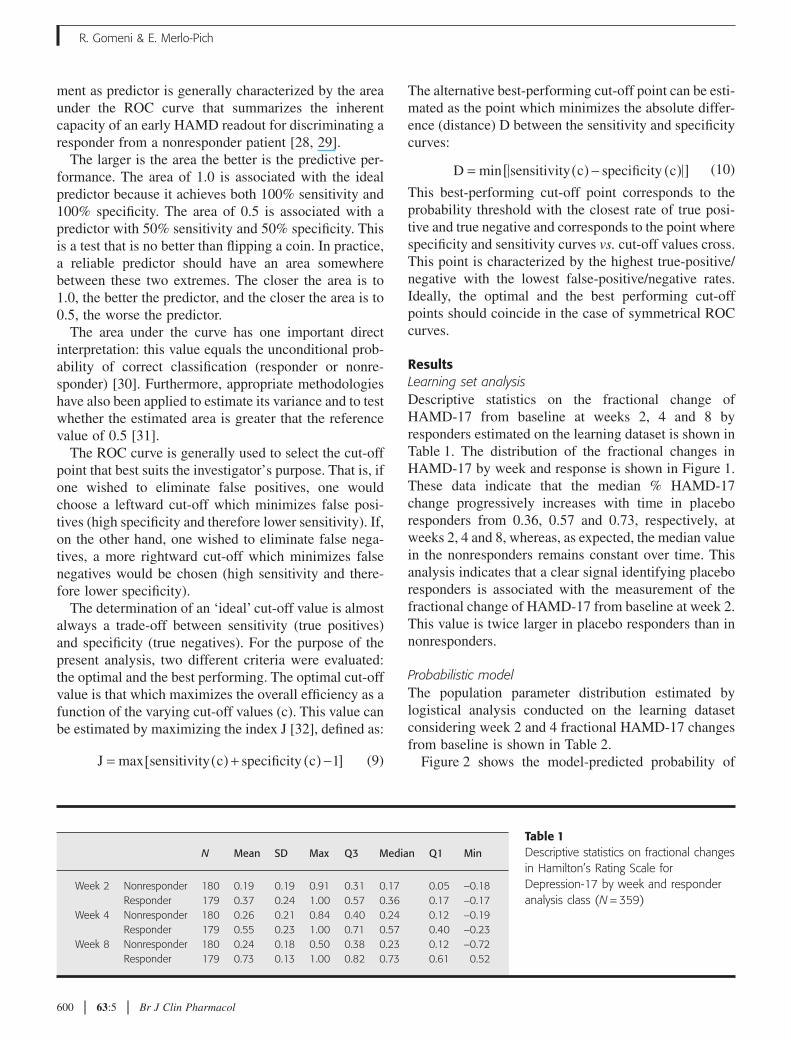
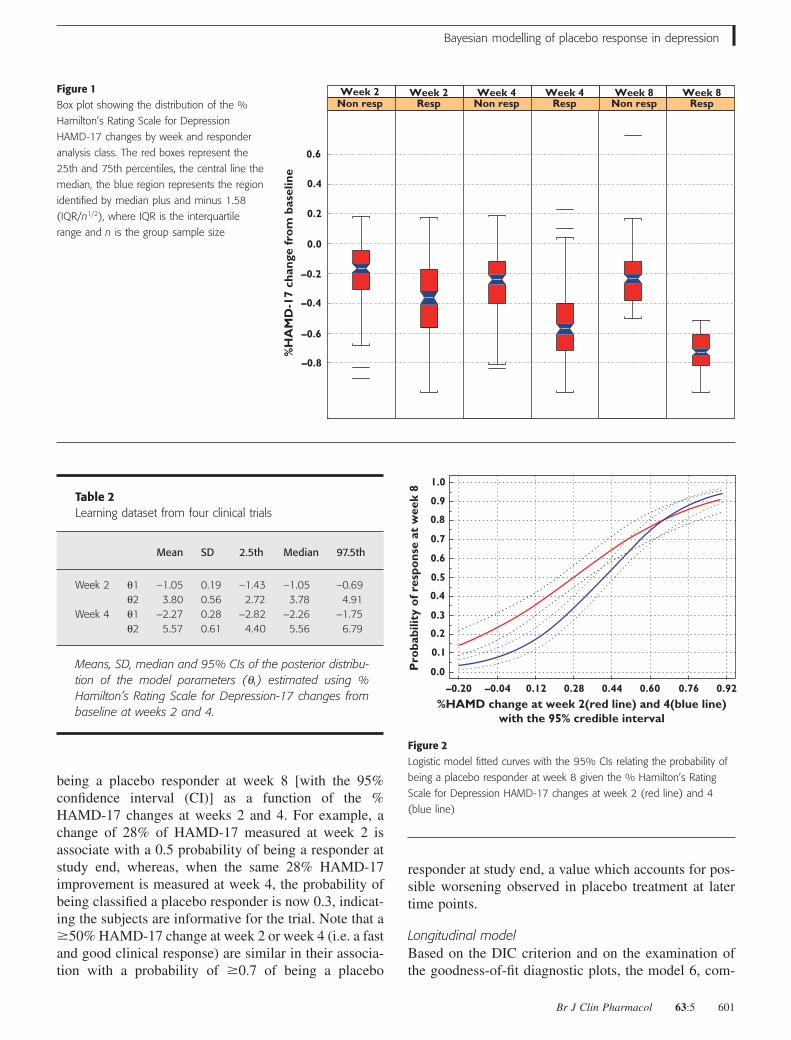
ResultsLearning set analysisDescriptive statistics on the fractional change ofHAMD-17 from baseline at weeks 2, 4 and 8 byresponders estimated on the learning dataset is shown inTable 1. The distribution of the fractional changes inHAMD-17 by week and response is shown in Figure 1.These data indicate that the median % HAMD-17change progressively increases with time in placeboresponders from 0.36, 0.57 and 0.73, respectively, atweeks 2, 4 and 8, whereas, as expected, the median valuein the nonresponders remains constant over time. Thisanalysis indicates that a clear signal identifying placeboresponders is associated with the measurement of thefractional change of HAMD-17 from baseline at week 2.This value is twice larger in placebo responders than innonresponders.
Probabilistic modelThe population parameter distribution estimated bylogistical analysis conducted on the learning datasetconsidering week 2 and 4 fractional HAMD-17 changesfrom baseline is shown in Table 2.
Figure 2 shows the model-predicted probability of
Table 1Descriptive statistics on fractional changesin Hamilton’s Rating Scale forDepression-17 by week and responderanalysis class (N = 359)
N Mean SD Max Q3 Median Q1 Min
Week 2 Nonresponder 180 0.19 0.19 0.91 0.31 0.17 0.05 -0.18Responder 179 0.37 0.24 1.00 0.57 0.36 0.17 -0.17
Week 4 Nonresponder 180 0.26 0.21 0.84 0.40 0.24 0.12 -0.19Responder 179 0.55 0.23 1.00 0.71 0.57 0.40 -0.23
Week 8 Nonresponder 180 0.24 0.18 0.50 0.38 0.23 0.12 -0.72Responder 179 0.73 0.13 1.00 0.82 0.73 0.61 0.52
R. Gomeni & E. Merlo-Pich
600 63:5 Br J Clin Pharmacol
being a placebo responder at week 8 [with the 95%confidence interval (CI)] as a function of the %HAMD-17 changes at weeks 2 and 4. For example, achange of 28% of HAMD-17 measured at week 2 isassociate with a 0.5 probability of being a responder atstudy end, whereas, when the same 28% HAMD-17improvement is measured at week 4, the probability ofbeing classified a placebo responder is now 0.3, indicat-ing the subjects are informative for the trial. Note that a�50% HAMD-17 change at week 2 or week 4 (i.e. a fastand good clinical response) are similar in their associa-tion with a probability of �0.7 of being a placebo
responder at study end, a value which accounts for pos-sible worsening observed in placebo treatment at latertime points.
Longitudinal modelBased on the DIC criterion and on the examination ofthe goodness-of-fit diagnostic plots, the model 6, com-
Figure 1Box plot showing the distribution of the %
Hamilton’s Rating Scale for Depression
HAMD-17 changes by week and responder
analysis class. The red boxes represent the
25th and 75th percentiles, the central line the
median, the blue region represents the region
identified by median plus and minus 1.58
(IQR/n1/2), where IQR is the interquartile
range and n is the group sample size
–0.8
–0.6
–0.4
–0.2
0.0
0.2
0.4
0.6
%H
AM
D-1
7 ch
ange
fro
m b
asel
ine
Non resp Resp Non resp Resp Non resp RespWeek 2 Week 2 Week 4 Week 4 Week 8 Week 8
Table 2Learning dataset from four clinical trials
Mean SD 2.5th Median 97.5th
Week 2 q1 -1.05 0.19 -1.43 -1.05 -0.69q2 3.80 0.56 2.72 3.78 4.91
Week 4 q1 -2.27 0.28 -2.82 -2.26 -1.75q2 5.57 0.61 4.40 5.56 6.79
Means, SD, median and 95% CIs of the posterior distribu-tion of the model parameters (qi) estimated using %Hamilton’s Rating Scale for Depression-17 changes frombaseline at weeks 2 and 4.
Pro
babi
lity
of r
espo
nse
at w
eek
8
–0.20
0.0
0.1
0.2
0.3
0.4
0.5
0.6
0.7
0.8
0.9
1.0
–0.04 0.12
%HAMD change at week 2(red line) and 4(blue line)with the 95% credible interval
0.28 0.44 0.60 0.76 0.92
Figure 2Logistic model fitted curves with the 95% CIs relating the probability of
being a placebo responder at week 8 given the % Hamilton’s Rating
Scale for Depression HAMD-17 changes at week 2 (red line) and 4
(blue line)
Bayesian modelling of placebo response in depression
Br J Clin Pharmacol 63:5 601
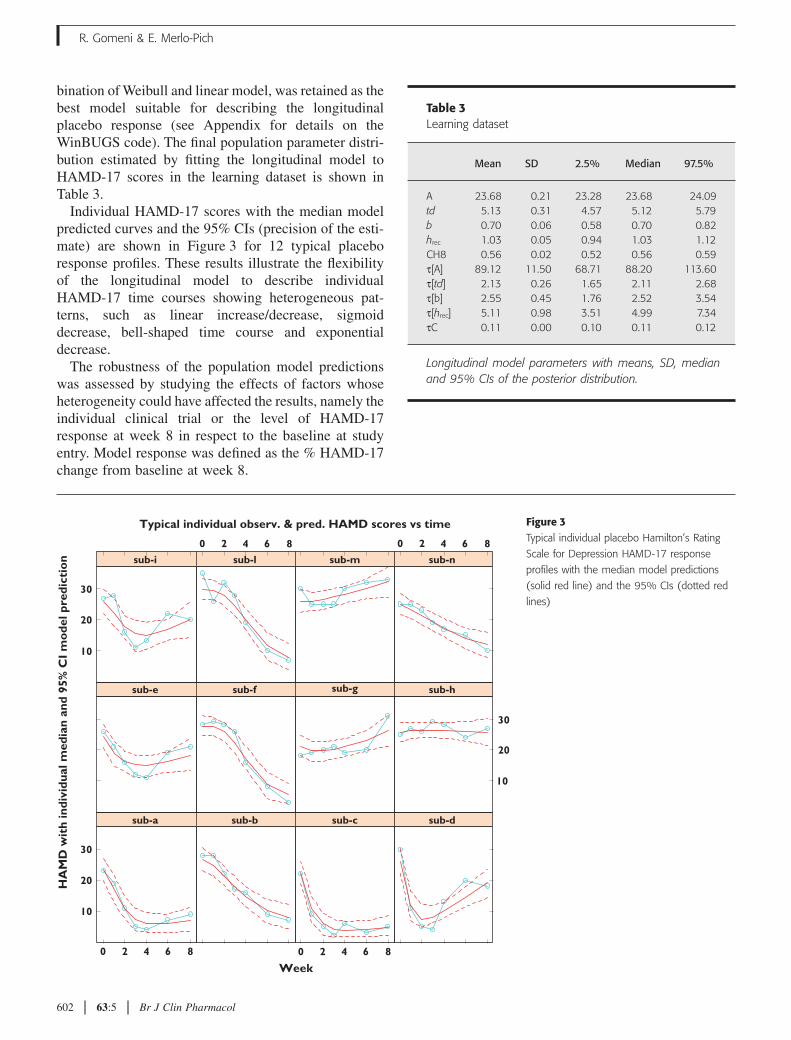
bination of Weibull and linear model, was retained as thebest model suitable for describing the longitudinalplacebo response (see Appendix for details on theWinBUGS code). The final population parameter distri-bution estimated by fitting the longitudinal model toHAMD-17 scores in the learning dataset is shown inTable 3.
Individual HAMD-17 scores with the median modelpredicted curves and the 95% CIs (precision of the esti-mate) are shown in Figure 3 for 12 typical placeboresponse profiles. These results illustrate the flexibilityof the longitudinal model to describe individualHAMD-17 time courses showing heterogeneous pat-terns, such as linear increase/decrease, sigmoiddecrease, bell-shaped time course and exponentialdecrease.
The robustness of the population model predictionswas assessed by studying the effects of factors whoseheterogeneity could have affected the results, namely theindividual clinical trial or the level of HAMD-17response at week 8 in respect to the baseline at studyentry. Model response was defined as the % HAMD-17change from baseline at week 8.
Figure 3Typical individual placebo Hamilton’s Rating
Scale for Depression HAMD-17 response
profiles with the median model predictions
(solid red line) and the 95% CIs (dotted red
lines)
Typical individual observ. & pred. HAMD scores vs time
Week
HA
MD
wit
h in
divi
dual
med
ian
and
95%
CI
mo
del p
redi
ctio
n
10
20
30
0 2 4 6 8
0 2 4 6 8 0 2 4 6 8
0 2 4 6 8
sub-a sub-b sub-c sub-d
sub-e sub-f sub-g
10
20
30
sub-h
10
20
30
sub-i sub-l sub-m sub-n
Table 3Learning dataset
Mean SD 2.5% Median 97.5%
A 23.68 0.21 23.28 23.68 24.09td 5.13 0.31 4.57 5.12 5.79b 0.70 0.06 0.58 0.70 0.82hrec 1.03 0.05 0.94 1.03 1.12CH8 0.56 0.02 0.52 0.56 0.59t[A] 89.12 11.50 68.71 88.20 113.60t[td] 2.13 0.26 1.65 2.11 2.68t[b] 2.55 0.45 1.76 2.52 3.54t[hrec] 5.11 0.98 3.51 4.99 7.34tC 0.11 0.00 0.10 0.11 0.12
Longitudinal model parameters with means, SD, medianand 95% CIs of the posterior distribution.
R. Gomeni & E. Merlo-Pich
602 63:5 Br J Clin Pharmacol
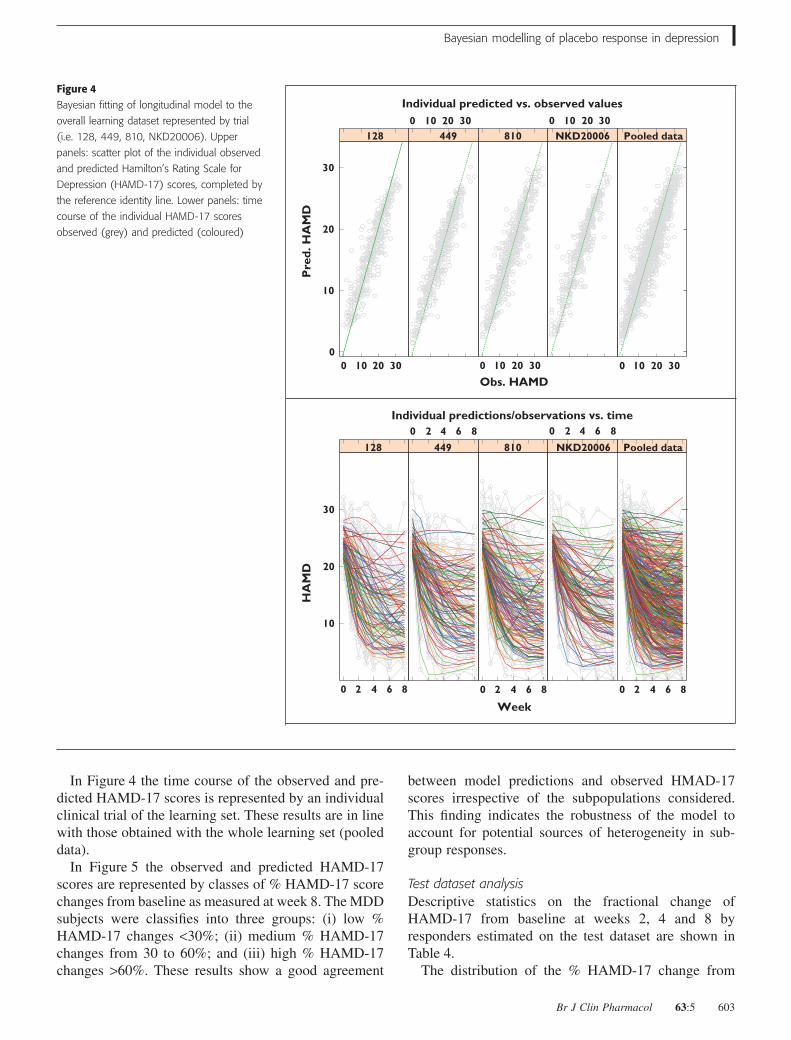
In Figure 4 the time course of the observed and pre-dicted HAMD-17 scores is represented by an individualclinical trial of the learning set. These results are in linewith those obtained with the whole learning set (pooleddata).
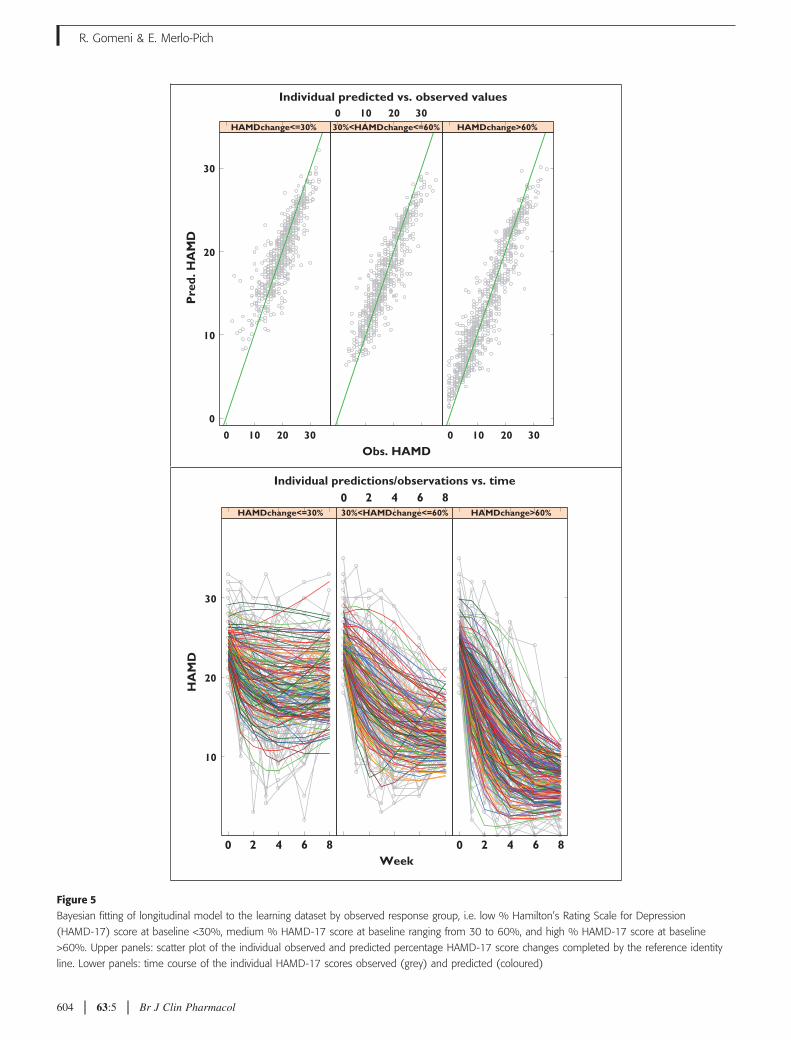
In Figure 5 the observed and predicted HAMD-17scores are represented by classes of % HAMD-17 scorechanges from baseline as measured at week 8. The MDDsubjects were classifies into three groups: (i) low %HAMD-17 changes <30%; (ii) medium % HAMD-17changes from 30 to 60%; and (iii) high % HAMD-17changes >60%. These results show a good agreement
between model predictions and observed HMAD-17scores irrespective of the subpopulations considered.This finding indicates the robustness of the model toaccount for potential sources of heterogeneity in sub-group responses.
Test dataset analysisDescriptive statistics on the fractional change ofHAMD-17 from baseline at weeks 2, 4 and 8 byresponders estimated on the test dataset are shown inTable 4.
The distribution of the % HAMD-17 change from
Figure 4Bayesian fitting of longitudinal model to the
overall learning dataset represented by trial
(i.e. 128, 449, 810, NKD20006). Upper
panels: scatter plot of the individual observed
and predicted Hamilton’s Rating Scale for
Depression (HAMD-17) scores, completed by
the reference identity line. Lower panels: time
course of the individual HAMD-17 scores
observed (grey) and predicted (coloured)
Individual predicted vs. observed values
Obs. HAMD
Pre
d. H
AM
D
0
10
20
30
128 449 810 NKD20006 Pooled data
Individual predictions/observations vs. time
Week
HA
MD
10
20
30
128 449 810 NKD20006 Pooled data
0 10 20 30 0 10 20 30
0 10 20 30 0 10 20 30 0 10 20 30
0 2 4 6 8
0 2 4 6 8 0 2 4 6 8
0 2 4 6 8 0 2 4 6 8
Bayesian modelling of placebo response in depression
Br J Clin Pharmacol 63:5 603
Individual predicted vs. observed values
Obs. HAMD
0 10 20 30
0 10 20 30
0 2 4 6 8 0 2 4 6 8
0 2 4 6 8
0 10 20 30
Pre
d. H
AM
D
0
10
20
30
HAMDchange<=30% 30%<HAMDchange<=60% HAMDchange>60%
Individual predictions/observations vs. time
Week
HA
MD
10
20
30
HAMDchange<=30% 30%<HAMDchange<=60% HAMDchange>60%
Figure 5Bayesian fitting of longitudinal model to the learning dataset by observed response group, i.e. low % Hamilton’s Rating Scale for Depression
(HAMD-17) score at baseline <30%, medium % HAMD-17 score at baseline ranging from 30 to 60%, and high % HAMD-17 score at baseline
>60%. Upper panels: scatter plot of the individual observed and predicted percentage HAMD-17 score changes completed by the reference identity
line. Lower panels: time course of the individual HAMD-17 scores observed (grey) and predicted (coloured)
R. Gomeni & E. Merlo-Pich
604 63:5 Br J Clin Pharmacol
baseline by week and placebo response class in the testand learning datasets (Table 1) shows very consistentbehaviour. This finding indicates that it would be pos-sible to establish typical values of the HAMD-17 scorefor subjects classified as placebo responders and placebononresponders at different time points.
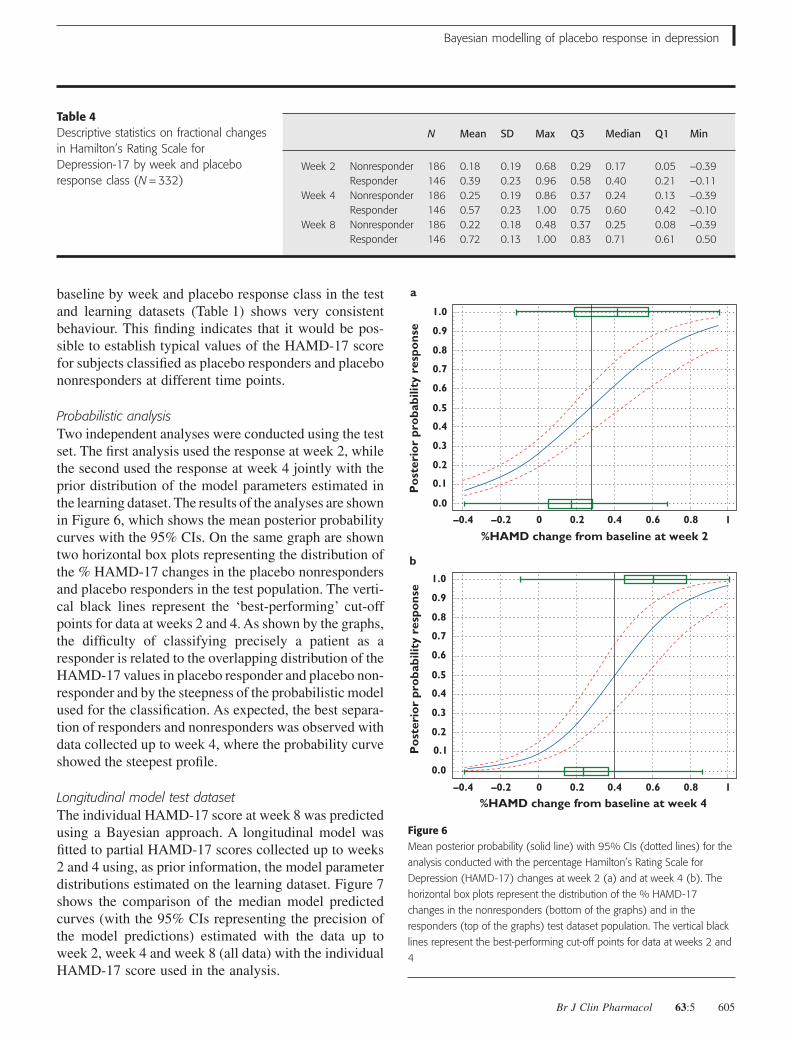
Probabilistic analysisTwo independent analyses were conducted using the testset. The first analysis used the response at week 2, whilethe second used the response at week 4 jointly with theprior distribution of the model parameters estimated inthe learning dataset. The results of the analyses are shownin Figure 6, which shows the mean posterior probabilitycurves with the 95% CIs. On the same graph are showntwo horizontal box plots representing the distribution ofthe % HAMD-17 changes in the placebo nonrespondersand placebo responders in the test population. The verti-cal black lines represent the ‘best-performing’ cut-offpoints for data at weeks 2 and 4. As shown by the graphs,the difficulty of classifying precisely a patient as aresponder is related to the overlapping distribution of theHAMD-17 values in placebo responder and placebo non-responder and by the steepness of the probabilistic modelused for the classification. As expected, the best separa-tion of responders and nonresponders was observed withdata collected up to week 4, where the probability curveshowed the steepest profile.
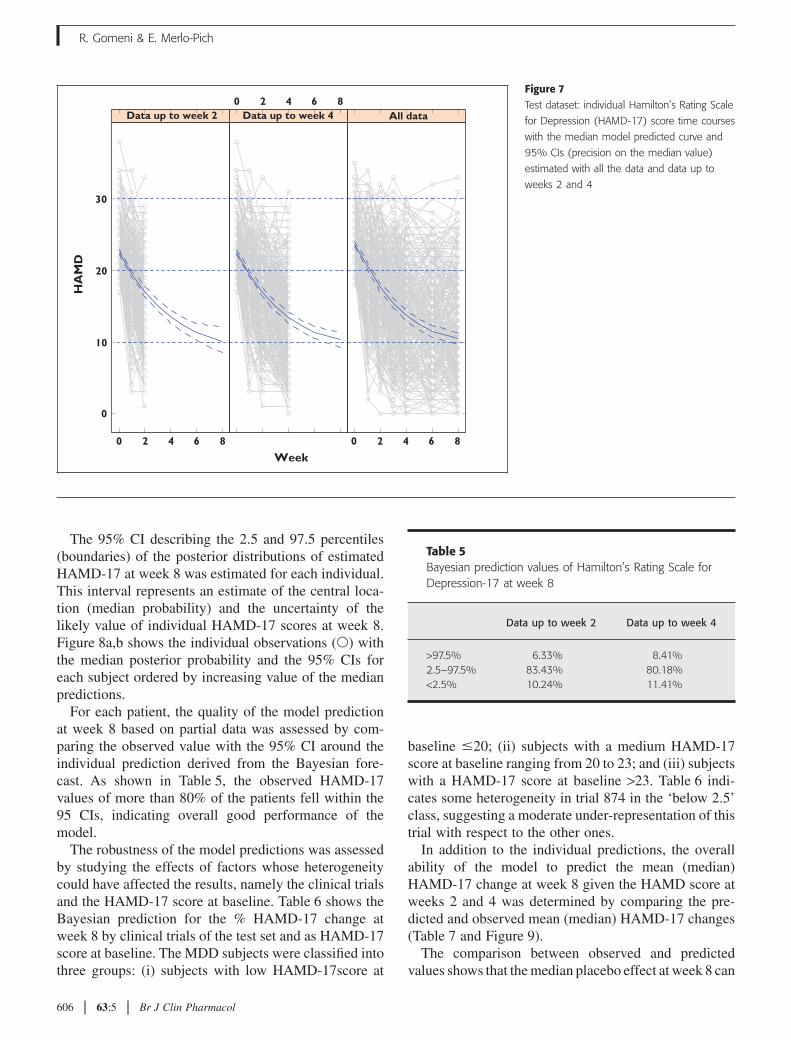
Longitudinal model test datasetThe individual HAMD-17 score at week 8 was predictedusing a Bayesian approach. A longitudinal model wasfitted to partial HAMD-17 scores collected up to weeks2 and 4 using, as prior information, the model parameterdistributions estimated on the learning dataset. Figure 7shows the comparison of the median model predictedcurves (with the 95% CIs representing the precision ofthe model predictions) estimated with the data up toweek 2, week 4 and week 8 (all data) with the individualHAMD-17 score used in the analysis.
Table 4Descriptive statistics on fractional changesin Hamilton’s Rating Scale forDepression-17 by week and placeboresponse class (N = 332)
N Mean SD Max Q3 Median Q1 Min
Week 2 Nonresponder 186 0.18 0.19 0.68 0.29 0.17 0.05 -0.39Responder 146 0.39 0.23 0.96 0.58 0.40 0.21 -0.11
Week 4 Nonresponder 186 0.25 0.19 0.86 0.37 0.24 0.13 -0.39Responder 146 0.57 0.23 1.00 0.75 0.60 0.42 -0.10
Week 8 Nonresponder 186 0.22 0.18 0.48 0.37 0.25 0.08 -0.39Responder 146 0.72 0.13 1.00 0.83 0.71 0.61 0.50
1.0
a
0.9
0.8
0.7
0.6
0.5
0.4
0.3
0.2
0.1
0.0
–0.4 –0.2 0
%HAMD change from baseline at week 2
Po
ster
ior
pro
babi
lity
resp
ons
e
0.2 0.4 0.6 0.8 1
1.0
b
0.9
0.8
0.7
0.6
0.5
0.4
0.3
0.2
0.1
0.0
–0.4 –0.2 0
%HAMD change from baseline at week 4
Po
ster
ior
pro
babi
lity
resp
ons
e
0.2 0.4 0.6 0.8 1
Figure 6Mean posterior probability (solid line) with 95% CIs (dotted lines) for the
analysis conducted with the percentage Hamilton’s Rating Scale for
Depression (HAMD-17) changes at week 2 (a) and at week 4 (b). The
horizontal box plots represent the distribution of the % HAMD-17
changes in the nonresponders (bottom of the graphs) and in the
responders (top of the graphs) test dataset population. The vertical black
lines represent the best-performing cut-off points for data at weeks 2 and
4
Bayesian modelling of placebo response in depression
Br J Clin Pharmacol 63:5 605
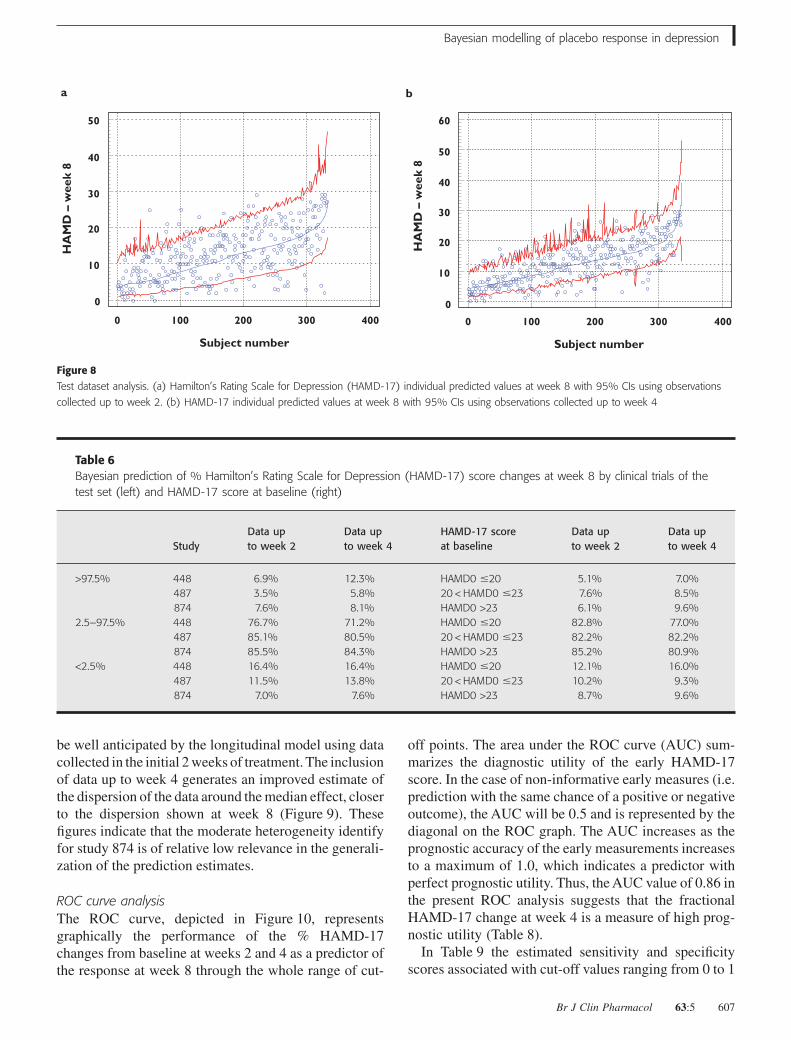
The 95% CI describing the 2.5 and 97.5 percentiles(boundaries) of the posterior distributions of estimatedHAMD-17 at week 8 was estimated for each individual.This interval represents an estimate of the central loca-tion (median probability) and the uncertainty of thelikely value of individual HAMD-17 scores at week 8.Figure 8a,b shows the individual observations (�) withthe median posterior probability and the 95% CIs foreach subject ordered by increasing value of the medianpredictions.
For each patient, the quality of the model predictionat week 8 based on partial data was assessed by com-paring the observed value with the 95% CI around theindividual prediction derived from the Bayesian fore-cast. As shown in Table 5, the observed HAMD-17values of more than 80% of the patients fell within the95 CIs, indicating overall good performance of themodel.
The robustness of the model predictions was assessedby studying the effects of factors whose heterogeneitycould have affected the results, namely the clinical trialsand the HAMD-17 score at baseline. Table 6 shows theBayesian prediction for the % HAMD-17 change atweek 8 by clinical trials of the test set and as HAMD-17score at baseline. The MDD subjects were classified intothree groups: (i) subjects with low HAMD-17score at
baseline �20; (ii) subjects with a medium HAMD-17score at baseline ranging from 20 to 23; and (iii) subjectswith a HAMD-17 score at baseline >23. Table 6 indi-cates some heterogeneity in trial 874 in the ‘below 2.5’class, suggesting a moderate under-representation of thistrial with respect to the other ones.
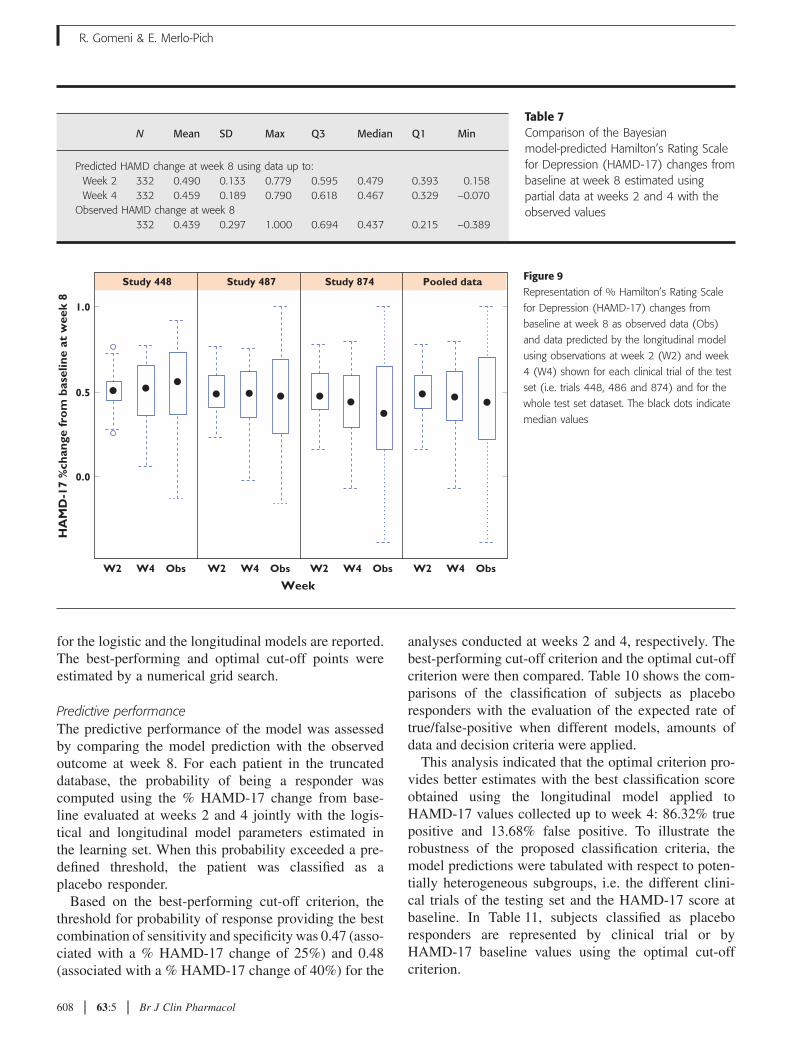
In addition to the individual predictions, the overallability of the model to predict the mean (median)HAMD-17 change at week 8 given the HAMD score atweeks 2 and 4 was determined by comparing the pre-dicted and observed mean (median) HAMD-17 changes(Table 7 and Figure 9).
The comparison between observed and predictedvalues shows that the median placebo effect at week 8 can
Figure 7Test dataset: individual Hamilton’s Rating Scale
for Depression (HAMD-17) score time courses
with the median model predicted curve and
95% CIs (precision on the median value)
estimated with all the data and data up to
weeks 2 and 4
Week
HA
MD
0
10
20
30
Data up to week 20 2 4 6 8
0 2 4 6 8 0 2 4 6 8
All dataData up to week 4
Table 5Bayesian prediction values of Hamilton’s Rating Scale forDepression-17 at week 8
Data up to week 2 Data up to week 4
>97.5% 6.33% 8.41%2.5–97.5% 83.43% 80.18%<2.5% 10.24% 11.41%
R. Gomeni & E. Merlo-Pich
606 63:5 Br J Clin Pharmacol
be well anticipated by the longitudinal model using datacollected in the initial 2 weeks of treatment. The inclusionof data up to week 4 generates an improved estimate ofthe dispersion of the data around the median effect, closerto the dispersion shown at week 8 (Figure 9). Thesefigures indicate that the moderate heterogeneity identifyfor study 874 is of relative low relevance in the generali-zation of the prediction estimates.
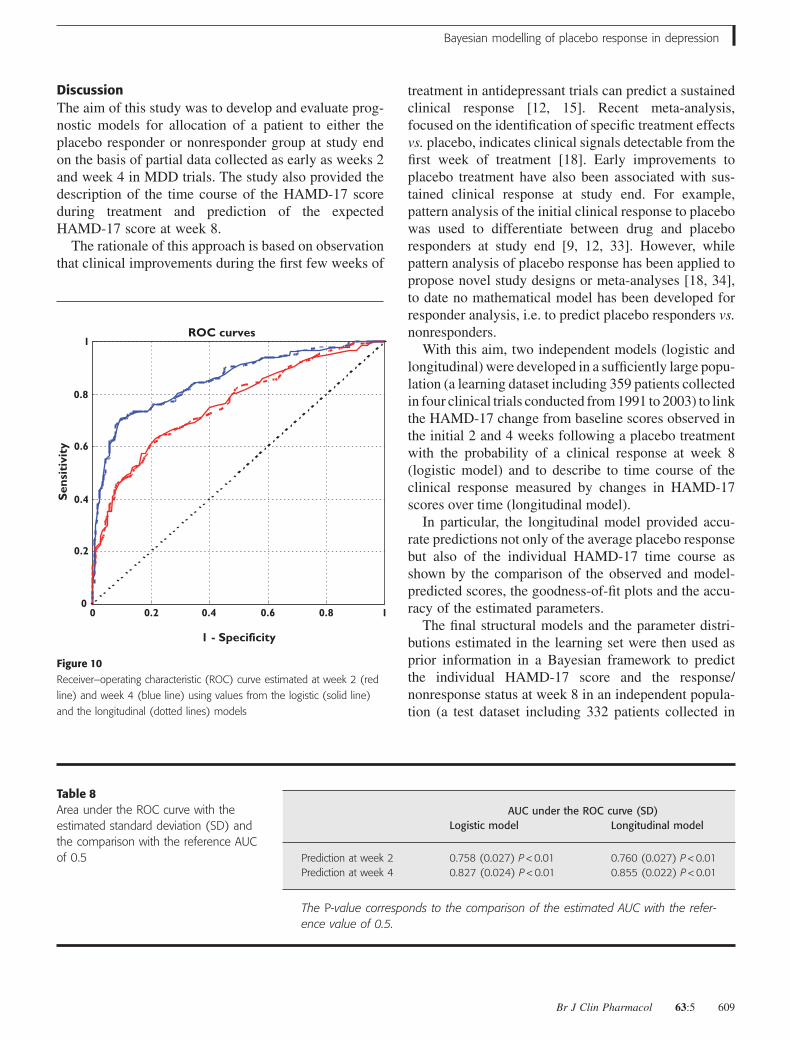
ROC curve analysisThe ROC curve, depicted in Figure 10, representsgraphically the performance of the % HAMD-17changes from baseline at weeks 2 and 4 as a predictor ofthe response at week 8 through the whole range of cut-
off points. The area under the ROC curve (AUC) sum-marizes the diagnostic utility of the early HAMD-17score. In the case of non-informative early measures (i.e.prediction with the same chance of a positive or negativeoutcome), the AUC will be 0.5 and is represented by thediagonal on the ROC graph. The AUC increases as theprognostic accuracy of the early measurements increasesto a maximum of 1.0, which indicates a predictor withperfect prognostic utility. Thus, the AUC value of 0.86 inthe present ROC analysis suggests that the fractionalHAMD-17 change at week 4 is a measure of high prog-nostic utility (Table 8).
In Table 9 the estimated sensitivity and specificityscores associated with cut-off values ranging from 0 to 1
0
0
10
20
30
40
50
100 200
Subject number
HA
MD
– w
eek
8
300 400 0
10
0
20
30
40
50
60
a b
100 200
Subject number
HA
MD
– w
eek
8
300 400
Figure 8Test dataset analysis. (a) Hamilton’s Rating Scale for Depression (HAMD-17) individual predicted values at week 8 with 95% CIs using observations
collected up to week 2. (b) HAMD-17 individual predicted values at week 8 with 95% CIs using observations collected up to week 4
Table 6Bayesian prediction of % Hamilton’s Rating Scale for Depression (HAMD-17) score changes at week 8 by clinical trials of thetest set (left) and HAMD-17 score at baseline (right)
StudyData upto week 2
Data upto week 4
HAMD-17 scoreat baseline
Data upto week 2
Data upto week 4
>97.5% 448 6.9% 12.3% HAMD0 �20 5.1% 7.0%487 3.5% 5.8% 20 < HAMD0 �23 7.6% 8.5%874 7.6% 8.1% HAMD0 >23 6.1% 9.6%
2.5–97.5% 448 76.7% 71.2% HAMD0 �20 82.8% 77.0%487 85.1% 80.5% 20 < HAMD0 �23 82.2% 82.2%874 85.5% 84.3% HAMD0 >23 85.2% 80.9%
<2.5% 448 16.4% 16.4% HAMD0 �20 12.1% 16.0%487 11.5% 13.8% 20 < HAMD0 �23 10.2% 9.3%874 7.0% 7.6% HAMD0 >23 8.7% 9.6%
Bayesian modelling of placebo response in depression
Br J Clin Pharmacol 63:5 607
for the logistic and the longitudinal models are reported.The best-performing and optimal cut-off points wereestimated by a numerical grid search.
Predictive performanceThe predictive performance of the model was assessedby comparing the model prediction with the observedoutcome at week 8. For each patient in the truncateddatabase, the probability of being a responder wascomputed using the % HAMD-17 change from base-line evaluated at weeks 2 and 4 jointly with the logis-tical and longitudinal model parameters estimated inthe learning set. When this probability exceeded a pre-defined threshold, the patient was classified as aplacebo responder.
Based on the best-performing cut-off criterion, thethreshold for probability of response providing the bestcombination of sensitivity and specificity was 0.47 (asso-ciated with a % HAMD-17 change of 25%) and 0.48(associated with a % HAMD-17 change of 40%) for the
analyses conducted at weeks 2 and 4, respectively. Thebest-performing cut-off criterion and the optimal cut-offcriterion were then compared. Table 10 shows the com-parisons of the classification of subjects as placeboresponders with the evaluation of the expected rate oftrue/false-positive when different models, amounts ofdata and decision criteria were applied.
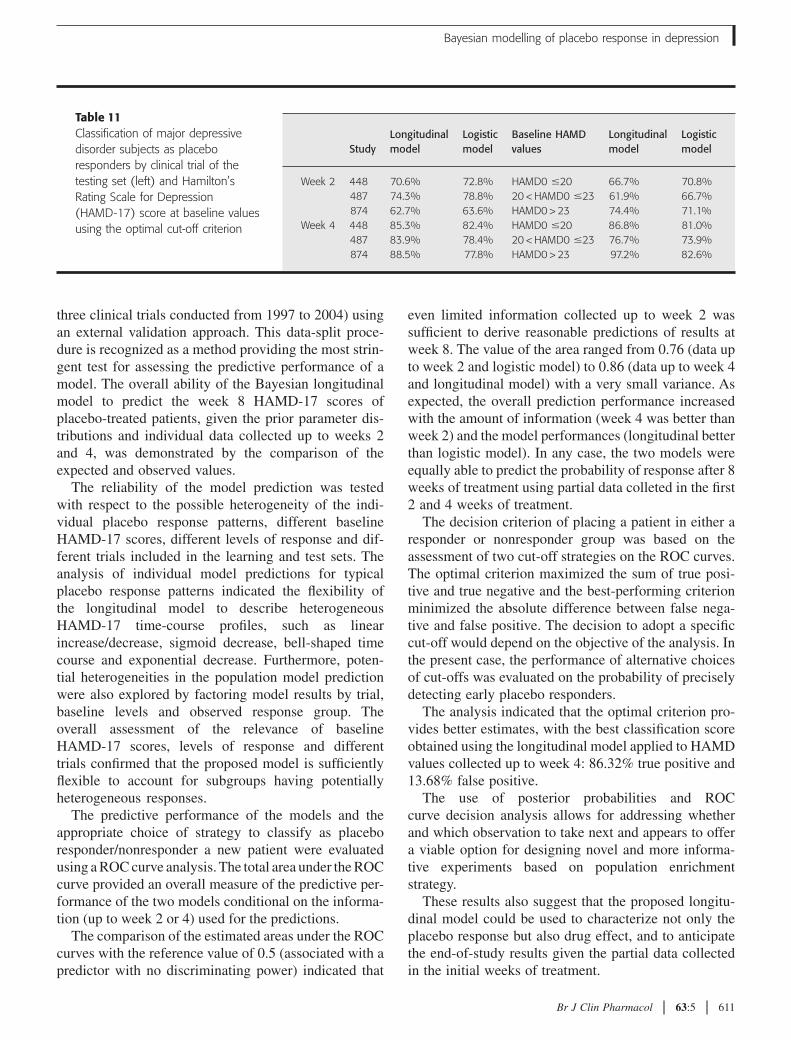
This analysis indicated that the optimal criterion pro-vides better estimates with the best classification scoreobtained using the longitudinal model applied toHAMD-17 values collected up to week 4: 86.32% truepositive and 13.68% false positive. To illustrate therobustness of the proposed classification criteria, themodel predictions were tabulated with respect to poten-tially heterogeneous subgroups, i.e. the different clini-cal trials of the testing set and the HAMD-17 score atbaseline. In Table 11, subjects classified as placeboresponders are represented by clinical trial or byHAMD-17 baseline values using the optimal cut-offcriterion.
Table 7Comparison of the Bayesianmodel-predicted Hamilton’s Rating Scalefor Depression (HAMD-17) changes frombaseline at week 8 estimated usingpartial data at weeks 2 and 4 with theobserved values
N Mean SD Max Q3 Median Q1 Min
Predicted HAMD change at week 8 using data up to:Week 2 332 0.490 0.133 0.779 0.595 0.479 0.393 0.158Week 4 332 0.459 0.189 0.790 0.618 0.467 0.329 -0.070
Observed HAMD change at week 8332 0.439 0.297 1.000 0.694 0.437 0.215 -0.389
Figure 9Representation of % Hamilton’s Rating Scale
for Depression (HAMD-17) changes from
baseline at week 8 as observed data (Obs)
and data predicted by the longitudinal model
using observations at week 2 (W2) and week
4 (W4) shown for each clinical trial of the test
set (i.e. trials 448, 486 and 874) and for the
whole test set dataset. The black dots indicate
median values
1.0
Study 448 Study 487 Study 874 Pooled data
0.5
0.0
W2 W4 Obs W2 W4 Obs
Week
HA
MD
-17
%ch
ange
fro
m b
asel
ine
at w
eek
8
W2 W4 Obs W2 W4 Obs
R. Gomeni & E. Merlo-Pich
608 63:5 Br J Clin Pharmacol
DiscussionThe aim of this study was to develop and evaluate prog-nostic models for allocation of a patient to either theplacebo responder or nonresponder group at study endon the basis of partial data collected as early as weeks 2and week 4 in MDD trials. The study also provided thedescription of the time course of the HAMD-17 scoreduring treatment and prediction of the expectedHAMD-17 score at week 8.
The rationale of this approach is based on observationthat clinical improvements during the first few weeks of
treatment in antidepressant trials can predict a sustainedclinical response [12, 15]. Recent meta-analysis,focused on the identification of specific treatment effectsvs. placebo, indicates clinical signals detectable from thefirst week of treatment [18]. Early improvements toplacebo treatment have also been associated with sus-tained clinical response at study end. For example,pattern analysis of the initial clinical response to placebowas used to differentiate between drug and placeboresponders at study end [9, 12, 33]. However, whilepattern analysis of placebo response has been applied topropose novel study designs or meta-analyses [18, 34],to date no mathematical model has been developed forresponder analysis, i.e. to predict placebo responders vs.nonresponders.
With this aim, two independent models (logistic andlongitudinal) were developed in a sufficiently large popu-lation (a learning dataset including 359 patients collectedin four clinical trials conducted from 1991 to 2003) to linkthe HAMD-17 change from baseline scores observed inthe initial 2 and 4 weeks following a placebo treatmentwith the probability of a clinical response at week 8(logistic model) and to describe to time course of theclinical response measured by changes in HAMD-17scores over time (longitudinal model).
In particular, the longitudinal model provided accu-rate predictions not only of the average placebo responsebut also of the individual HAMD-17 time course asshown by the comparison of the observed and model-predicted scores, the goodness-of-fit plots and the accu-racy of the estimated parameters.
The final structural models and the parameter distri-butions estimated in the learning set were then used asprior information in a Bayesian framework to predictthe individual HAMD-17 score and the response/nonresponse status at week 8 in an independent popula-tion (a test dataset including 332 patients collected in
ROC curves
0
0.2
0.4
0.6
0.8
1
0 0.2 0.4
1 - Specificity
Sen
siti
vity
0.6 0.8 1
Figure 10Receiver–operating characteristic (ROC) curve estimated at week 2 (red
line) and week 4 (blue line) using values from the logistic (solid line)
and the longitudinal (dotted lines) models
Table 8Area under the ROC curve with theestimated standard deviation (SD) andthe comparison with the reference AUCof 0.5
AUC under the ROC curve (SD)Logistic model Longitudinal model
Prediction at week 2 0.758 (0.027) P < 0.01 0.760 (0.027) P < 0.01Prediction at week 4 0.827 (0.024) P < 0.01 0.855 (0.022) P < 0.01
The P-value corresponds to the comparison of the estimated AUC with the refer-ence value of 0.5.
Bayesian modelling of placebo response in depression
Br J Clin Pharmacol 63:5 609
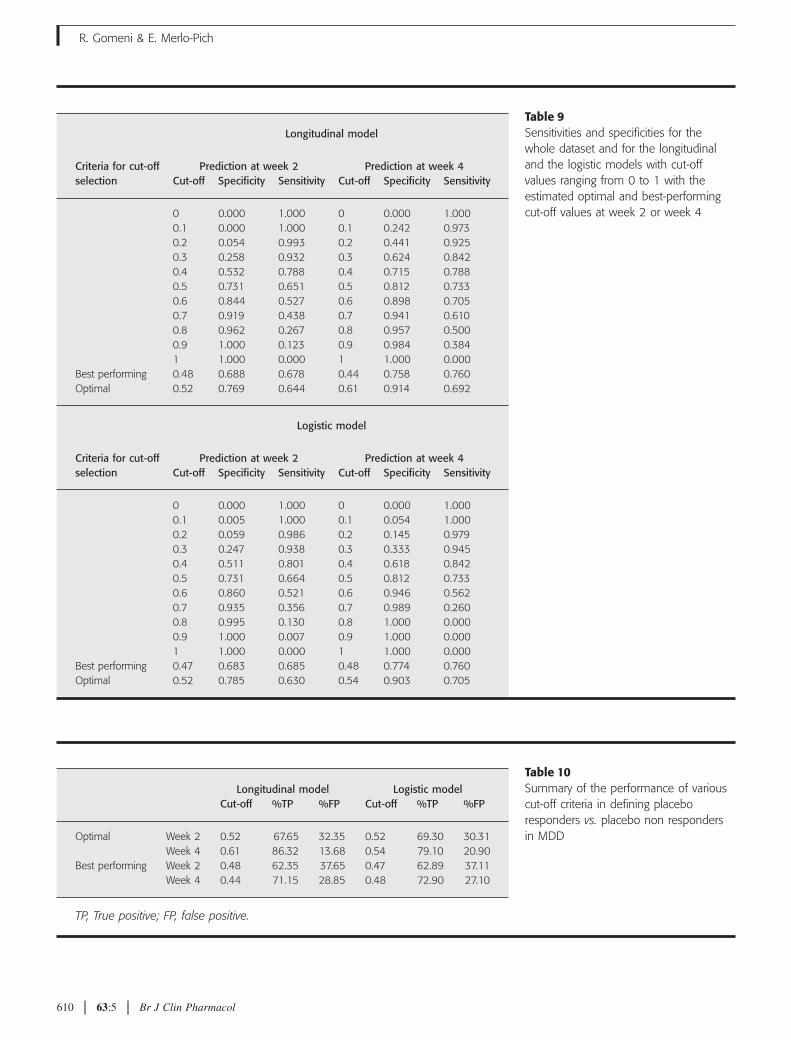
Table 9Sensitivities and specificities for thewhole dataset and for the longitudinaland the logistic models with cut-offvalues ranging from 0 to 1 with theestimated optimal and best-performingcut-off values at week 2 or week 4
Criteria for cut-offselection
Longitudinal model
Prediction at week 2 Prediction at week 4Cut-off Specificity Sensitivity Cut-off Specificity Sensitivity
0 0.000 1.000 0 0.000 1.0000.1 0.000 1.000 0.1 0.242 0.9730.2 0.054 0.993 0.2 0.441 0.9250.3 0.258 0.932 0.3 0.624 0.8420.4 0.532 0.788 0.4 0.715 0.7880.5 0.731 0.651 0.5 0.812 0.7330.6 0.844 0.527 0.6 0.898 0.7050.7 0.919 0.438 0.7 0.941 0.6100.8 0.962 0.267 0.8 0.957 0.5000.9 1.000 0.123 0.9 0.984 0.3841 1.000 0.000 1 1.000 0.000
Best performing 0.48 0.688 0.678 0.44 0.758 0.760Optimal 0.52 0.769 0.644 0.61 0.914 0.692
Criteria for cut-offselection
Logistic model
Prediction at week 2 Prediction at week 4Cut-off Specificity Sensitivity Cut-off Specificity Sensitivity
0 0.000 1.000 0 0.000 1.0000.1 0.005 1.000 0.1 0.054 1.0000.2 0.059 0.986 0.2 0.145 0.9790.3 0.247 0.938 0.3 0.333 0.9450.4 0.511 0.801 0.4 0.618 0.8420.5 0.731 0.664 0.5 0.812 0.7330.6 0.860 0.521 0.6 0.946 0.5620.7 0.935 0.356 0.7 0.989 0.2600.8 0.995 0.130 0.8 1.000 0.0000.9 1.000 0.007 0.9 1.000 0.0001 1.000 0.000 1 1.000 0.000
Best performing 0.47 0.683 0.685 0.48 0.774 0.760Optimal 0.52 0.785 0.630 0.54 0.903 0.705
Table 10Summary of the performance of variouscut-off criteria in defining placeboresponders vs. placebo non respondersin MDD
Longitudinal model Logistic modelCut-off %TP %FP Cut-off %TP %FP
Optimal Week 2 0.52 67.65 32.35 0.52 69.30 30.31Week 4 0.61 86.32 13.68 0.54 79.10 20.90
Best performing Week 2 0.48 62.35 37.65 0.47 62.89 37.11Week 4 0.44 71.15 28.85 0.48 72.90 27.10
TP, True positive; FP, false positive.
R. Gomeni & E. Merlo-Pich
610 63:5 Br J Clin Pharmacol
three clinical trials conducted from 1997 to 2004) usingan external validation approach. This data-split proce-dure is recognized as a method providing the most strin-gent test for assessing the predictive performance of amodel. The overall ability of the Bayesian longitudinalmodel to predict the week 8 HAMD-17 scores ofplacebo-treated patients, given the prior parameter dis-tributions and individual data collected up to weeks 2and 4, was demonstrated by the comparison of theexpected and observed values.
The reliability of the model prediction was testedwith respect to the possible heterogeneity of the indi-vidual placebo response patterns, different baselineHAMD-17 scores, different levels of response and dif-ferent trials included in the learning and test sets. Theanalysis of individual model predictions for typicalplacebo response patterns indicated the flexibility ofthe longitudinal model to describe heterogeneousHAMD-17 time-course profiles, such as linearincrease/decrease, sigmoid decrease, bell-shaped timecourse and exponential decrease. Furthermore, poten-tial heterogeneities in the population model predictionwere also explored by factoring model results by trial,baseline levels and observed response group. Theoverall assessment of the relevance of baselineHAMD-17 scores, levels of response and differenttrials confirmed that the proposed model is sufficientlyflexible to account for subgroups having potentiallyheterogeneous responses.
The predictive performance of the models and theappropriate choice of strategy to classify as placeboresponder/nonresponder a new patient were evaluatedusing a ROC curve analysis. The total area under the ROCcurve provided an overall measure of the predictive per-formance of the two models conditional on the informa-tion (up to week 2 or 4) used for the predictions.
The comparison of the estimated areas under the ROCcurves with the reference value of 0.5 (associated with apredictor with no discriminating power) indicated that
even limited information collected up to week 2 wassufficient to derive reasonable predictions of results atweek 8. The value of the area ranged from 0.76 (data upto week 2 and logistic model) to 0.86 (data up to week 4and longitudinal model) with a very small variance. Asexpected, the overall prediction performance increasedwith the amount of information (week 4 was better thanweek 2) and the model performances (longitudinal betterthan logistic model). In any case, the two models wereequally able to predict the probability of response after 8weeks of treatment using partial data colleted in the first2 and 4 weeks of treatment.
The decision criterion of placing a patient in either aresponder or nonresponder group was based on theassessment of two cut-off strategies on the ROC curves.The optimal criterion maximized the sum of true posi-tive and true negative and the best-performing criterionminimized the absolute difference between false nega-tive and false positive. The decision to adopt a specificcut-off would depend on the objective of the analysis. Inthe present case, the performance of alternative choicesof cut-offs was evaluated on the probability of preciselydetecting early placebo responders.
The analysis indicated that the optimal criterion pro-vides better estimates, with the best classification scoreobtained using the longitudinal model applied to HAMDvalues collected up to week 4: 86.32% true positive and13.68% false positive.
The use of posterior probabilities and ROCcurve decision analysis allows for addressing whetherand which observation to take next and appears to offera viable option for designing novel and more informa-tive experiments based on population enrichmentstrategy.
These results also suggest that the proposed longitu-dinal model could be used to characterize not only theplacebo response but also drug effect, and to anticipatethe end-of-study results given the partial data collectedin the initial weeks of treatment.
Table 11Classification of major depressivedisorder subjects as placeboresponders by clinical trial of thetesting set (left) and Hamilton’sRating Scale for Depression(HAMD-17) score at baseline valuesusing the optimal cut-off criterion
StudyLongitudinalmodel
Logisticmodel
Baseline HAMDvalues
Longitudinalmodel
Logisticmodel
Week 2 448 70.6% 72.8% HAMD0 �20 66.7% 70.8%487 74.3% 78.8% 20 < HAMD0 �23 61.9% 66.7%874 62.7% 63.6% HAMD0 > 23 74.4% 71.1%
Week 4 448 85.3% 82.4% HAMD0 �20 86.8% 81.0%487 83.9% 78.4% 20 < HAMD0 �23 76.7% 73.9%874 88.5% 77.8% HAMD0 > 23 97.2% 82.6%
Bayesian modelling of placebo response in depression
Br J Clin Pharmacol 63:5 611
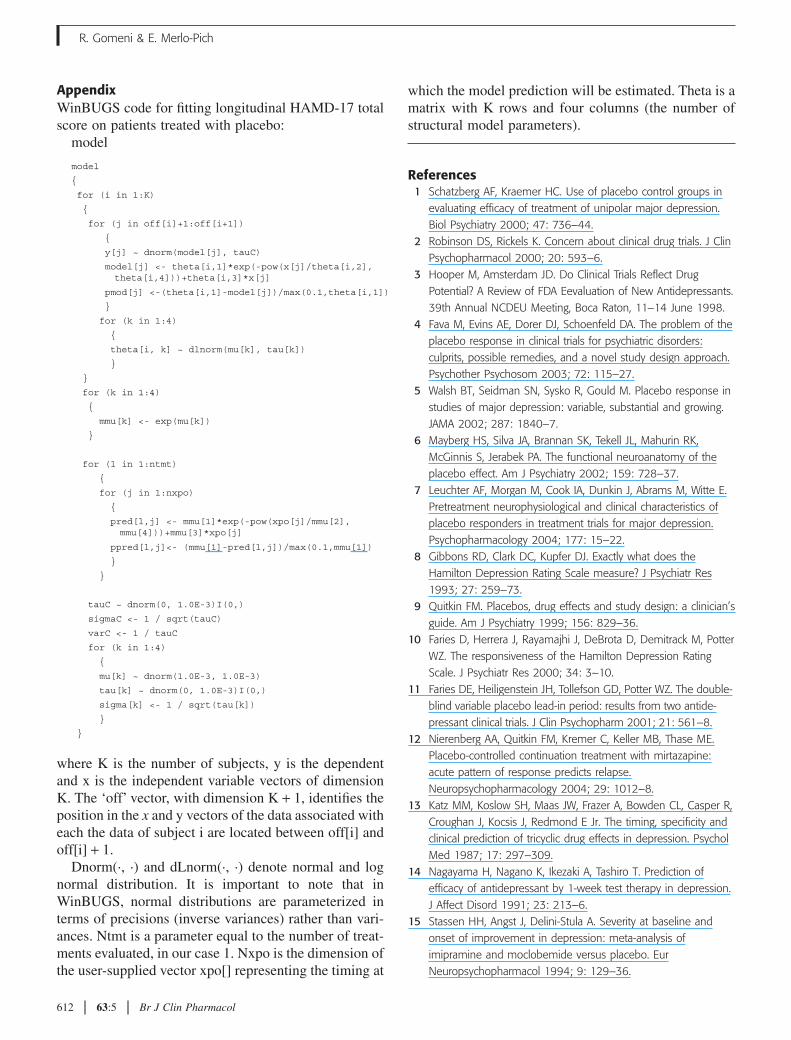
AppendixWinBUGS code for fitting longitudinal HAMD-17 totalscore on patients treated with placebo:
model
model
{
for (i in 1:K)
{
for (j in off[i]+1:off[i+1])
{
y[j] ~ dnorm(model[j], tauC)
model[j] <- theta[i,1]*exp(-pow(x[j]/theta[i,2], theta[i,4]))+theta[i,3]*x[j]
pmod[j] <-(theta[i,1]-model[j])/max(0.1,theta[i,1])
}
for (k in 1:4)
{
theta[i, k] ~ dlnorm(mu[k], tau[k])
}
}
for (k in 1:4)
{
mmu[k] <- exp(mu[k])
}
for (l in 1:ntmt)
{
for (j in 1:nxpo)
{
pred[l,j] <- mmu[1]*exp(-pow(xpo[j]/mmu[2], mmu[4]))+mmu[3]*xpo[j]
ppred[l,j]<- (mmu[1]-pred[l,j])/max(0.1,mmu[1])
}
}
tauC ~ dnorm(0, 1.0E-3)I(0,)
sigmaC <- 1 / sqrt(tauC)
varC <- 1 / tauC
for (k in 1:4)
{
mu[k] ~ dnorm(1.0E-3, 1.0E-3)
tau[k] ~ dnorm(0, 1.0E-3)I(0,)
sigma[k] <- 1 / sqrt(tau[k])
}
}
where K is the number of subjects, y is the dependentand x is the independent variable vectors of dimensionK. The ‘off’ vector, with dimension K + 1, identifies theposition in the x and y vectors of the data associated witheach the data of subject i are located between off[i] andoff[i] + 1.
Dnorm(·, ·) and dLnorm(·, ·) denote normal and lognormal distribution. It is important to note that inWinBUGS, normal distributions are parameterized interms of precisions (inverse variances) rather than vari-ances. Ntmt is a parameter equal to the number of treat-ments evaluated, in our case 1. Nxpo is the dimension ofthe user-supplied vector xpo[] representing the timing at
which the model prediction will be estimated. Theta is amatrix with K rows and four columns (the number ofstructural model parameters).
References1 Schatzberg AF, Kraemer HC. Use of placebo control groups in
evaluating efficacy of treatment of unipolar major depression.Biol Psychiatry 2000; 47: 736–44.
2 Robinson DS, Rickels K. Concern about clinical drug trials. J ClinPsychopharmacol 2000; 20: 593–6.
3 Hooper M, Amsterdam JD. Do Clinical Trials Reflect DrugPotential? A Review of FDA Eevaluation of New Antidepressants.39th Annual NCDEU Meeting, Boca Raton, 11–14 June 1998.
4 Fava M, Evins AE, Dorer DJ, Schoenfeld DA. The problem of theplacebo response in clinical trials for psychiatric disorders:culprits, possible remedies, and a novel study design approach.Psychother Psychosom 2003; 72: 115–27.
5 Walsh BT, Seidman SN, Sysko R, Gould M. Placebo response instudies of major depression: variable, substantial and growing.JAMA 2002; 287: 1840–7.
6 Mayberg HS, Silva JA, Brannan SK, Tekell JL, Mahurin RK,McGinnis S, Jerabek PA. The functional neuroanatomy of theplacebo effect. Am J Psychiatry 2002; 159: 728–37.
7 Leuchter AF, Morgan M, Cook IA, Dunkin J, Abrams M, Witte E.Pretreatment neurophysiological and clinical characteristics ofplacebo responders in treatment trials for major depression.Psychopharmacology 2004; 177: 15–22.
8 Gibbons RD, Clark DC, Kupfer DJ. Exactly what does theHamilton Depression Rating Scale measure? J Psychiatr Res1993; 27: 259–73.
9 Quitkin FM. Placebos, drug effects and study design: a clinician’sguide. Am J Psychiatry 1999; 156: 829–36.
10 Faries D, Herrera J, Rayamajhi J, DeBrota D, Demitrack M, PotterWZ. The responsiveness of the Hamilton Depression RatingScale. J Psychiatr Res 2000; 34: 3–10.
11 Faries DE, Heiligenstein JH, Tollefson GD, Potter WZ. The double-blind variable placebo lead-in period: results from two antide-pressant clinical trials. J Clin Psychopharm 2001; 21: 561–8.
12 Nierenberg AA, Quitkin FM, Kremer C, Keller MB, Thase ME.Placebo-controlled continuation treatment with mirtazapine:acute pattern of response predicts relapse.Neuropsychopharmacology 2004; 29: 1012–8.
13 Katz MM, Koslow SH, Maas JW, Frazer A, Bowden CL, Casper R,Croughan J, Kocsis J, Redmond E Jr. The timing, specificity andclinical prediction of tricyclic drug effects in depression. PsycholMed 1987; 17: 297–309.
14 Nagayama H, Nagano K, Ikezaki A, Tashiro T. Prediction ofefficacy of antidepressant by 1-week test therapy in depression.J Affect Disord 1991; 23: 213–6.
15 Stassen HH, Angst J, Delini-Stula A. Severity at baseline andonset of improvement in depression: meta-analysis ofimipramine and moclobemide versus placebo. EurNeuropsychopharmacol 1994; 9: 129–36.
R. Gomeni & E. Merlo-Pich
612 63:5 Br J Clin Pharmacol
16 Nierenberg AA, McLean NE, Alpert JE, Worthington JJ,Rosenbaum JF, Fava M. Early nonresponse to fluoxetine as apredictor of poor 8-week outcome. Am J Psychiatry 1995; 152:1500–3.
17 Szegedi A, Muller MJ, Anghelescu I, Klawe C, Kohnen R, BenkertO. Early improvement under mirtazapine and paroxetinepredicts later stable response and remission with high sensitivityin patients with major depression. J Clin Psychiatry 2003; 64:413–20.
18 Papakostas GI, Perlis RH, Scalia MJ, Petersen TJ, Fava M. Ameta-analysis of early-sustained response rates betweenantidepressants and placebo for the treatment of majordepressive disorder. J Clin Psychopharmacol 2006; 26: 56–60.
19 Quitkin FM, Rabkin JD, Markowitz JM, Stewart JW, McGrath PJ,Harrison W. Use of pattern analysis to identify true drugresponse. A replication. Arch Gen Psychiatry 1987; 44: 259–64.
20 Hamilton M.: a rating scale for depression. J Neurol NeurosurgPsychiatry 1960; 23: 56–62.
21 Hamilton M. Development of a rating scale for primarydepressive illness. Br J Soc Clin Psychol 1967; 6: 278–96.
22 Harrell FE, Lee KL, Mark DB. Multivariable prognostic models:issues in developing models, evaluating assumptions andadequacy, and measuring and reducing errors. Stat Med 1996;15: 361–87.
23 Spiegelhalter DJ, Thomas A, Best NG, Lunn D. WinBUGS, Version1.4, User Manual. Cambridge: MRC Biostatistics Unit 2001.
24 Holford NHG, Li J, Benincosa L, Birath M. Population DiseaseProgress Models for the Time Course of HAMD Score inDepressed Patients Receiving Placebo in Anti-DepressantClinical Trials. Abstract 311. 2002: 11. Available at
http://www.page-meeting.org/?abstract=311 (last accessed: 31October 2006).
25 Gex-Fabry M, Balant-Gorgia AE, Balant LP, Rudaz S, Veuthey JL,Bertschy G. Time course of clinical response to venlafaxine:relevance of plasma level and chirality. Eur J Clin Pharmacol2004; 59: 883–91.
26 Bozdogan H. Model selection and Akaike’s information criterion(AIC): the general theory and its analytical extensions.Psychometrika 1987; 52: 345–70.
27 Spiegelhalter DJ, Best NG, Carlin BP, van der Linde A. Bayesianmeasures of model complexity and fit (with discussion). J RoyStatist Soc B 2002; 64: 583–640.
28 Hanley JA, McNeil BJ. The meaning and use of the area undera receiver operating characteristic (ROC) curve. Radiology 1982;143: 29–36.
29 Lee WC, Hsiao CK. Alternative summary indices for the receiveroperating characteristic curve. Epidemiology 1996; 7: 605–11.
30 Pepe MS. An interpretation for the ROC curve and inferenceusing GLM procedures. Biometrics 2000; 56: 352–9.
31 Liu H, Li G, Cumberland WG, Wu T. Testing statisticalsignificance of the area under a receiving operatingcharacteristics curve for repeated measures design withbootstrapping. J Data Sci 2005; 3: 257–78.
32 Youden WJ. An index for rating diagnostic tests. Cancer 1950; 3:32–5.
33 Rothschild R, Quitkin FM. Review of the use of pattern analysisto differentiate true drug and placebo responses. PsychotherapyPsychosomatics 1992; 58: 170–7.
34 Donald RC, Quitkin FM, Klein DF. A typological model forestimation of drug and placebo effects in depression. J ClinPsychopharmacol 2002; 22: 414–8.
Bayesian modelling of placebo response in depression
Br J Clin Pharmacol 63:5 613
Related Documents