BioMed Central Page 1 of 20 (page number not for citation purposes) BMC Bioinformatics Open Access FFResearch article Bayesian hierarchical model for transcriptional module discovery by jointly modeling gene expression and ChIP-chip data Xiangdong Liu 1,2 , Walter J Jessen 2 , Siva Sivaganesan 3 , Bruce J Aronow 2 and Mario Medvedovic* 1,2 Address: 1 Department of Environmental Health, University of Cincinnati, 3223 Eden Ave. ML 56, Cincinnati, Ohio 45267, USA, 2 Division of Biomedical Informatics, Cincinnati Children's Hospital Medical Center, Cincinnati, Ohio 45229, USA and 3 Mathematical Sciences Department, University of Cincinnati, Cincinnati, OH 45221, USA Email: Xiangdong Liu - [email protected]; Walter J Jessen - [email protected]; Siva Sivaganesan - [email protected]; Bruce J Aronow - [email protected]; Mario Medvedovic* - [email protected] * Corresponding author Abstract Background: Transcriptional modules (TM) consist of groups of co-regulated genes and transcription factors (TF) regulating their expression. Two high-throughput (HT) experimental technologies, gene expression microarrays and Chromatin Immuno-Precipitation on Chip (ChIP- chip), are capable of producing data informative about expression regulatory mechanism on a genome scale. The optimal approach to joint modeling of data generated by these two complementary biological assays, with the goal of identifying and characterizing TMs, is an important open problem in computational biomedicine. Results: We developed and validated a novel probabilistic model and related computational procedure for identifying TMs by jointly modeling gene expression and ChIP-chip binding data. We demonstrate an improved functional coherence of the TMs produced by the new method when compared to either analyzing expression or ChIP-chip data separately or to alternative approaches for joint analysis. We also demonstrate the ability of the new algorithm to identify novel regulatory relationships not revealed by ChIP-chip data alone. The new computational procedure can be used in more or less the same way as one would use simple hierarchical clustering without performing any special transformation of data prior to the analysis. The R and C-source code for implementing our algorithm is incorporated within the R package gimmR which is freely available at http:// eh3.uc.edu/gimm. Conclusion: Our results indicate that, whenever available, ChIP-chip and expression data should be analyzed within the unified probabilistic modeling framework, which will likely result in improved clusters of co-regulated genes and improved ability to detect meaningful regulatory relationships. Given the good statistical properties and the ease of use, the new computational procedure offers a worthy new tool for reconstructing transcriptional regulatory networks. Published: 3 August 2007 BMC Bioinformatics 2007, 8:283 doi:10.1186/1471-2105-8-283 Received: 14 January 2007 Accepted: 3 August 2007 This article is available from: http://www.biomedcentral.com/1471-2105/8/283 © 2007 Liu et al; licensee BioMed Central Ltd. This is an Open Access article distributed under the terms of the Creative Commons Attribution License (http://creativecommons.org/licenses/by/2.0 ), which permits unrestricted use, distribution, and reproduction in any medium, provided the original work is properly cited.

Welcome message from author
This document is posted to help you gain knowledge. Please leave a comment to let me know what you think about it! Share it to your friends and learn new things together.
Transcript

BioMed CentralBMC Bioinformatics
ss
Open AcceFFResearch articleBayesian hierarchical model for transcriptional module discovery by jointly modeling gene expression and ChIP-chip dataXiangdong Liu1,2, Walter J Jessen2, Siva Sivaganesan3, Bruce J Aronow2 and Mario Medvedovic*1,2Address: 1Department of Environmental Health, University of Cincinnati, 3223 Eden Ave. ML 56, Cincinnati, Ohio 45267, USA, 2Division of Biomedical Informatics, Cincinnati Children's Hospital Medical Center, Cincinnati, Ohio 45229, USA and 3Mathematical Sciences Department, University of Cincinnati, Cincinnati, OH 45221, USA
Email: Xiangdong Liu - [email protected]; Walter J Jessen - [email protected]; Siva Sivaganesan - [email protected]; Bruce J Aronow - [email protected]; Mario Medvedovic* - [email protected]
* Corresponding author
AbstractBackground: Transcriptional modules (TM) consist of groups of co-regulated genes andtranscription factors (TF) regulating their expression. Two high-throughput (HT) experimentaltechnologies, gene expression microarrays and Chromatin Immuno-Precipitation on Chip (ChIP-chip), are capable of producing data informative about expression regulatory mechanism on agenome scale. The optimal approach to joint modeling of data generated by these twocomplementary biological assays, with the goal of identifying and characterizing TMs, is animportant open problem in computational biomedicine.
Results: We developed and validated a novel probabilistic model and related computationalprocedure for identifying TMs by jointly modeling gene expression and ChIP-chip binding data. Wedemonstrate an improved functional coherence of the TMs produced by the new method whencompared to either analyzing expression or ChIP-chip data separately or to alternative approachesfor joint analysis. We also demonstrate the ability of the new algorithm to identify novel regulatoryrelationships not revealed by ChIP-chip data alone. The new computational procedure can be usedin more or less the same way as one would use simple hierarchical clustering without performingany special transformation of data prior to the analysis. The R and C-source code for implementingour algorithm is incorporated within the R package gimmR which is freely available at http://eh3.uc.edu/gimm.
Conclusion: Our results indicate that, whenever available, ChIP-chip and expression data shouldbe analyzed within the unified probabilistic modeling framework, which will likely result in improvedclusters of co-regulated genes and improved ability to detect meaningful regulatory relationships.Given the good statistical properties and the ease of use, the new computational procedure offersa worthy new tool for reconstructing transcriptional regulatory networks.
Published: 3 August 2007
BMC Bioinformatics 2007, 8:283 doi:10.1186/1471-2105-8-283
Received: 14 January 2007Accepted: 3 August 2007
This article is available from: http://www.biomedcentral.com/1471-2105/8/283
© 2007 Liu et al; licensee BioMed Central Ltd. This is an Open Access article distributed under the terms of the Creative Commons Attribution License (http://creativecommons.org/licenses/by/2.0), which permits unrestricted use, distribution, and reproduction in any medium, provided the original work is properly cited.
Page 1 of 20(page number not for citation purposes)
BMC Bioinformatics 2007, 8:283 http://www.biomedcentral.com/1471-2105/8/283
BackgroundTranscriptional regula tion is one of the crucial mecha-nisms used by living systems to maintain homeostasis.Disregulation of gene expression underlies toxic effects ofmany chemicals [1], and gene expression changes areoften reliable markers of a disease [2]. The specificity oftranscriptional initiation of a eukaryotic gene is main-tained through a complex interaction of one or moresequence-specific transcription factors, regulatory DNAregions harboring corresponding DNA regulatory motifs,chromatin-remodeling proteins and the basal transcrip-tional machinery [3]. While not all modes of expressionregulatory controls are known, it has been shown that inmany important biological processes the initiation oftranscription requires binding of one or more transcrip-tional factors to their cognate regulatory motifs withinregulatory DNA regions. Two key high-throughput (HT)experimental technologies are capable of producing dataoffering insights into the expression regulatory mecha-nism on a genome scale. The first technology are expres-sion microarrays facilitating simultaneous monitoringexpression of virtually all genes in a genome [3-5]. Thesecond technology is the Chromatin Immuno-Precipita-tion on Chip (ChIP-chip) technology facilitating assess-ment of transcription factor binding events on a genomicscale [6,7]. Optimal joint modeling of data generated bythese two complementary biological assays, with the goalof identifying and characterizing TMs, is an importantopen problem in computational biomedicine.
Earliest applications of microarray technology includedattempts at discovering shared regulatory motifs and cor-responding transcription factors within groups of co-expressed genes identified by cluster analysis [8]. Groupsof co-expressed genes were first identified by clusteringgene expression profiles. Putative regulatory motifs induc-ing the co-expression were then identified de-novo usingthe MEME algorithm [9]. The inefficiency of procedures inwhich different data-types (e.g. expression data and pro-moter sequences) are analyzed separately is due to the ina-bility of patterns in different data-types to re-enforce eachother. For example, due to the noise in microarray data,the correlation between expression levels of two co-regu-lated genes could be too weak to be detected by clusteringexpression data alone. However, if evidence exists thatpromoters of these two genes are bound by the same TF,this information could enforce the weak signal in theexpression data and allow us to identify these two genesas being parts of the same TM. In the traditional two-stepapproach such co-regulation will be lost since the secondstep regulatory motif analysis is conditional on co-expres-sion of the two genes.
Several heuristic algorithms have been developed for con-structing TMs by integrated analysis of gene expression
and binding (ChIP-chip) data. Genetic Regulatory Mod-ules (GRAM) algorithm [10] uses binding data to identifya gene set bound to common TFs (p-value < 0.001). Itthen searches for other genes at a lower level of signifi-cance (p-value < 0.01) that are bound by those TFs andhave similar expression levels to the initial gene set core (d< d0). ReMoDiscovery [11] follows similar stringent andrelaxed two step procedures and infers TMs from Chip-chip, motif and expression data. Module Finding Algo-rithm (MOFA) also uses two level p-values, but additionalcriteria for selecting genes regulated by a specific TF is thecorrelation between expression levels of such genes andexpression level of the TF [12]. Statistical-AlgorithmicMethod for Bicluster Analysis (SAMBA) algorithm [13]transforms expression and binding data items to proper-ties of genes/genes or genes/proteins, then generates agenes-properties bipartite graph. The algorithm aims atdiscovering sets of genes with statistically significant com-mon properties. SAMBA requires discretization of inher-ently continuous gene expression and binding data basedon more or less ad-hoc cut-offs which will almost cer-tainly reduce the information content of the data.
In a model-based approach to find TMs based on geneexpression and TF binding data, one postulates the prob-abilistic model of all data and then estimates parametersof the model which define TM membership. Three suchmodels based on Bayesian networks have been proposed.In the first approach [14] both gene expression and ChIP-chip data are directly modeled within the same Bayesianhierarchical model. In the other model, ChIP-chip data isused to calculate prior probabilities of TM memberships[15] based on an extension of the Bayesian module net-works model [16]. In both of these models, the number ofthe modules has to be first be estimated from the data (orguessed) and all inference is valid conditional on thenumber of modules being correct. Since both of thesemodels can also be thought of as extensions of the basicfinite-mixture model, it is very likely that they will shareinherent instability with respect to misspecification of the"correct" number of modules [17,18]. Earlier, a Bayesiancasual network inferred from discretized expression datawas used to describe the gene regulatory network with thebinding data used to establish the constraints for the net-work structure [19]. The number of genes participating inthe network construction is limited because of the com-plexity of model search. COGRIM [20] algorithm uses aBayesian hierarchical framework to fit a gene-by-gene lin-ear regression model of a gene's expression levels as func-tion of is a quadratic function of all TFs' expression levelsand their pair-wise interactions. The ChIP-chip bindingdata and the TF binding motif scores based on predefinedPosition Weight Matrices (PWM) are integrated as theprior information in the model. Genes are grouped intosame TMs if they are regulated by the same set of TFs.
Page 2 of 20(page number not for citation purposes)

BMC Bioinformatics 2007, 8:283 http://www.biomedcentral.com/1471-2105/8/283
We developed a novel Expression-ChIP Infinite Mixture(ECIM) model for identifying TMs by jointly modelinggene expression and TF binding data. The model is con-structed by extending the context-specific infinite mixturemodel (CSIMM) [21] in such a way that expression andbinding data are represented by two separate contextswith different probabilistic models. We also constructed anovel probabilistic representation for the ChIP-chip datathat seems to capture all relevant information from thisdata and use it within the binding-context of the model.The overall approach makes use of the Bayesian infinitemixture framework [17,18] to circumvent the issue ofidentifying the 'correct' number of global and local pat-terns in the data. Context-specificity not only allows theuse of different probabilistic models to represent expres-sion and binding data, but it also allows for discordancesbetween patterns of co-expression and co-regulation. Pos-terior distribution of model parameters is estimated usingGibbs sampling [22]. TMs are formed based on PosteriorPairwise Probabilities (PPPs) of co-membership and Pos-terior Binding Probabilities (PBPs). It has been previouslyshown that PPPs can be directly interpreted as measures ofstatistical significance of co-membership [18,21].
The new computational procedure can be used in more orless the same way as one would use simple hierarchicalclustering without need to perform any special transfor-mation of data prior to the analysis. In the results sectionwe show that PBPs are able to identify binding relation-ships not revealed by CHIP-chip binding data alone. Wedemonstrate the ability of this procedure to integrateinformation from gene expression and TF binding data byassessing the functional coherence of TMs constructedfrom real-world datasets.
Results and DiscussionData preparationWe constructed four expression-binding datasets to exam-ine the performance of ECIM and alternative methods.For each dataset, binding data consisted of ChIP-Chipdata assessing binding affinities for 106 TFs to promotersof 6270 genes [6]. Expression datasets we used were thesporulation data set consisting of gene expression meas-urements throughout the sporulation process for the yeaststrain SK1 [8]; the sporulation data set consisting of geneexpression measurements during sporulation for the yeaststrains SK1 and W303y [23]; the cell cycle data set consist-ing of gene expression measurements spanning two com-plete yeast cell cycles [24]; and the combined sporulation-cell cycle dataset which we previously used to validate theCSIMM model [21]. Dual channel data [8] was processedby: (i) adjusting for background signal intensities; (ii) cal-culating log-intensity ratios of intensities in two channels;(iii) adjusting log-ratios using local regression of log-ratios on average log-intensities in two channels; and (iv)
centering each gene's log-ratios by subtracting the gene-specific average log-ratio. Affymetrix data [23,24] wasprocessed by: (i) setting any measurement below one toone; (ii) log-transforming measurements; and (iii) center-ing each gene's log-measurements by subtracting thegene-specific average log-measurement. Genes with themaximum signal strength of less than 100 were excludedfrom the analysis. To make results comparable across dif-ferent datasets, we used only data for genes represented onall microarray platforms (4980 genes).
Sensitivity and specificity of co-memembership in TMsUsing the Gibbs sampler, we generated a sequence of TMsapproximating the marginal posterior distribution of TMsgiven data. This distribution was summarized by calculat-ing PPPs of two genes belonging to the same TM, and PBPof a specific TF binding to the promoter of a specific gene.For each dataset we constructed an Expression-ChIP Infi-nite Mixture (ECIM) based hierarchical clustering of genesusing PPPs as the similarity measure with the average-linkage principle. The precision of such analysis was com-pared to results obtained by using alternative analyticalapproaches and by using the equivalent models with onlyexpression or only binding data. Following are descrip-tions of all methods compared:
ECIM Expression and BindingHierarchical clustering based on PPPs derived from ECIManalysis of both expression and binding data.
ECIM ExpressionHierarchical clustering based on PPPs derived from ECIManalysis of expression data.
ECIM BindingHierarchical clustering based on PPPs derived from ECIManalysis of binding data.
Binding P-ValuesTM's formed based on p-values of binding calculated inthe original publication[6].
Binding PBPTMs formed based on PBPs from ECIM analysis of expres-sion and binding data.
Euclidian DistanceHierarchical clustering based on Euclidian distances ofexpression data.
GRAMTMs formed using the GRAM algorithm with defaultparameters, expression and binding data.
Page 3 of 20(page number not for citation purposes)
BMC Bioinformatics 2007, 8:283 http://www.biomedcentral.com/1471-2105/8/283
SAMBATMs formed using the SAMBA algorithm with defaultparameters and expression data only.
ROC curves were constructed by correlating results for the949 KEGG-associated genes where "functional clusters"are based on the co-membership of these 949 geneswithin any KEGG [25] pathway. It is obvious that this isnot the perfect "gold standard" as some co-regulatedgenes will not be categorized to belong to a commonpathway and vice versa. However, the assumption behindusing membership in specific pathways as a gold stand-ard, which is that co-regulated genes are more likely toparticipate in the same pathway than randomly groupedgenes, is reasonable. Other well-known annotation data-bases, such as GO [26] or MIPS [27], are more compli-cated to use since they are hierarchically structured andresults would depend on the level of specificity used toconstruct functional grouping.
ROC for hierarchical TMs based on hierarchical clustering using PPPs and Euclidian distanceThe tree was cut at different depths to create clusteringwith every possible number of clusters. For a fixed numberof clusters a pair of genes (from the 949 genes assigned toat least one pathway) belonging to the same cluster wasassumed to be a "true positive" if the two genes bothbelonged to at least one specific KEGG pathway, and itwas considered to be a "false positive" if they did not sharea single KEGG pathway. True and false positive rates werethen obtained by dividing the number of true/false posi-tives with the total number of gene pairs sharing a com-mon KEGG pathway and total number of gene pairs notsharing a KEGG pathway respectively. When the numberof clusters is equal to the number of genes and all genesare placed in their own individual clusters, both true andfalse positive rates are equal to zero. A ROC curve isdefined when we reduce the number of clusters and bothtrue and false positive rates increase. At the extreme whenall genes are placed in the same cluster, both true and falsepositive rates are equal to one.
ROC curves for ECIMs based on binding p-values and PBPThe significance cut-off was varied between 0 and 1. Foreach cut-off level, two genes were considered to be co-reg-ulated if they were bound by at least one common TF atthis significance level. True and false positive rates wereestablished in the same way as for the clusters formed byhierarchical clustering with KEGG "gold standard".
GRAM and SAMBATrue and false positive rates for TMs produced by the twoalgorithms with default parameters were calculated in thesame way as for the previous two situations. There was norecommended way to vary specificity and sensitivity of
these two algorithms so we report only a single true andfalse positive rate for each algorithm.
Since just 5% of gene-pairs annotated in KEGG shared thesame pathway, only when the True Positive Rate (TPR) isat least 20 times higher than the False Positive Rate (FPR)do true positive pairs outnumber the false positives.Therefore we only show ROC curves for each dataset/method combination for statistically relevant false-posi-tive rates (less than 0.05). The FPRs achieved by GRAMand SAMBA are around or less than 0.001, thus we plottedleft most part of ROC curves (less than 0.0025) to make aclear comparison (Figure 1). ROC curves on the expendedrage of FPRs (less than 0.05) are shown Figure 2.
ECIM-derived TMs based on the expression and bindingdata clearly outperformed all other approaches. In allthree datasets, ECIM framework was able to successfullyintegrate information from both data types and signifi-cantly improve precision of analysis over individuallyanalyzing any one of two data types. When using onlybinding data, it made no difference whether we simplyuse p-values to construct modules or apply ECIM proce-dure using only the binding data context, which wasexpected since the binding data was the only informationsource even we use different processing methods. On theother hand, TMs constructed by either hierarchically clus-tering genes using PPPs or using PBPs derived from thesame analysis, were equally precise. This suggests thateither PPP or PBP summarizes the posterior distributionof TMs generated by the ECIM analysis of two data typesand carries all the meaningful information about theunderlying TM structure.
To demonstrate the seamless integration of ECIM frame-work with more sophisticated expression data models were-analyzed the combined sporulation-cellcycle data setwe previously described [21] using CSIMM model formultiple expression data contexts (Figure 2 and Figure3D). As expected, the ECIM with CSIMM expression datacontexts outperformed all other approaches, indicatingthe ability of the CSIMM model to effectively integrateinformation from different expression data sets and theability of the ECIM model to integrate further such com-plex expression data with ChIP-Chip binding data.
The performance of two previously described computa-tional procedures for constructing TMs based on jointanalysis of expression and binding data was relativelypoor. Points defined by single pairs of true/false positiverates for both methods with default parameters fall belowall ROC curves including the one that uses only bindingp-values. For the combined sporulation-cellcycle datasetwe manipulated the parameters for the two algorithmwith the goal of obtaining ROC points for a range of false
Page 4 of 20(page number not for citation purposes)
BMC Bioinformatics 2007, 8:283 http://www.biomedcentral.com/1471-2105/8/283
positive rates. Detailed tables of parameters used andresulting FPRs and TPRs are shown in SupplementalTables 1 and 2, (see Additional files 2 and 3 ). ROC pointsobtained by these two algorithms with non-defaultparameters are depicted by smaller dots in Figures 2 and3D. While we managed to expand the range of FPRs, theoverall conclusions did not change.
In the case of SAMBA we used only expression databecause we could not establish with certainty the appro-priate transformation for the binding data used in theoriginal study [13]. This is appropriate because the statis-tical procedure implemented in SAMBA is same for boththe gene expression and appropriately transformed ChIP-
chip data. Furthermore, SAMBA has been originallydescribed in the context of clustering gene expression dataalone and the web page manual describes only this kindof use. However, it is important to emphasize thatSAMBA's performance should be compared to results ofother procedures that use only gene expression data (Euc-lidian Distance and ECIM Expression). Given the poorprecision of TMs generated by SAMBA when compared toECIM using only expression data, we conjecture that add-ing binding data is unlikely to improve SAMBA's results tothe point of performing better than ECIM using both datatypes. For the sporulation data in Figure 1A both SAMBAand GRAM failed to identify any TMs. Same was the casefor GRAM with cell-cycle data in Figure 1C.
ROC curves for 8 different algorithms using three different yeast gene expression datasetsFigure 1ROC curves for 8 different algorithms using three different yeast gene expression datasets. A) Chu,1998, sporulation; B) Primig,2000, sporulation;C) Cho,1998, cellCycle and the ChIP-chip data of Lee, 2002. KEGG pathways were used as the gold standard. ECIM utilizing both expression and binding data dominated all other algorithms. ROC "spots" for GRAM and SAMBA algorithms were obtained by applying the algorithms using the default parameters.
A B
C
ECIM Expression and BindingECIM ExpressionECIM BindingBinding P-ValueBinding PBPEuclidean DistanceGRAMSAMBARandom
0.0000 0.0005 0.0010 0.0015 0.0020 0.0025
0.00
0.05
0.10
0.15
False Postivie Rate
Tru
e P
ositi
ve R
ate
0.0000 0.0005 0.0010 0.0015 0.0020 0.0025
0.00
0.05
0.10
0.15
False Positive Rate
Tru
e P
ositi
ve R
ate
SAMBA
GRAM
SAMBA
0.0000 0.0005 0.0010 0.0015 0.0020 0.0025
0.00
0.05
0.10
0.15
False Positive Rate
Tru
e P
ositi
ve R
ate
Page 5 of 20(page number not for citation purposes)

BMC Bioinformatics 2007, 8:283 http://www.biomedcentral.com/1471-2105/8/283
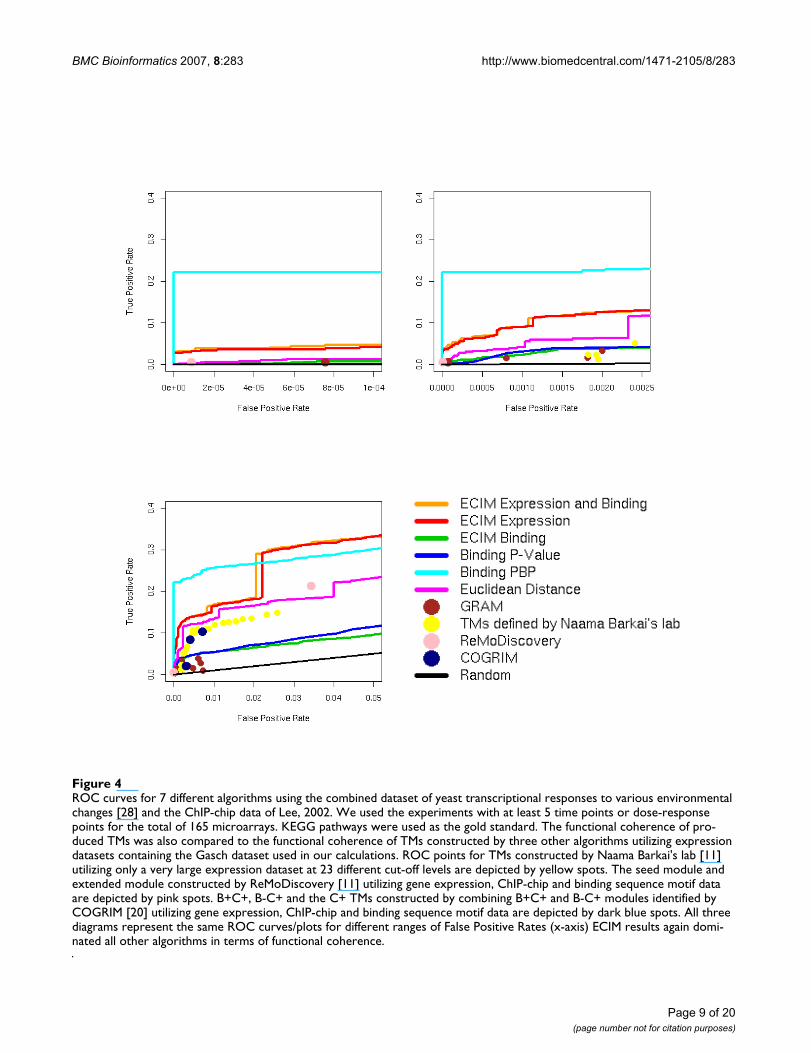
In the original publications, both SAMBA and GRAM wereused to analyze larger expression datasets than we usedhere. To assess the scalability of results presented here wealso analyzed a significantly larger dataset with 165microarray experiments assessing yeast transcriptionalresponses to various environmental perturbations [28].The functional coherence of produced TMs was also com-pared to the functional coherence of TMs previously con-structed using a large scale gene expression data analysis[29] for 23 different cut levels provided by authors, andtwo latest algorithms (ReMoDiscovery and COGRIM)[11,20] for constructing TMs from jointly analyzing geneexpression data, ChIP-chip data and DNA motif scoresobtained by scanning gene promoters using predefinedPWM. The comparisons to ReMoDiscovery and COGRIM
were based on results published in original publicationsdescribing these two algorithms. These results were basedon analyzing the gene expression datasets that containedthe Gasch dataset [28], and on the same TF binding data-set we used in our analyses (Lee's ChIP-chip data [6]). Wedownloaded module definitions from the respective sup-port web sites and constructed ROC points using againKEGG pathways as the gold standard. For ReMoDiscoverywe used two modules definitions discussed in the paper(seed module and extended module). For COGRIM weused two modules defined by authors (B+C+ correspond-ing to modules defined by COGRIM and supported bybinding data alone and B-C+ corresponding to modulesdefined by COGRIM but not supported by binding dataalone) and the combined module corresponding to allmodules constructed by COGRIM. Unfortunately, aftermultiple attempts we were not able to construct TMs usingSAMBA on this dataset. This could be a consequence ofthe large number of missing values in this dataset or ourinability to correctly format missing values. We againmanipulated GRAM parameters (details in SupplementalTable 1, (see Additional file 2) to expand the range of falsepositive rates.
Basic conclusion still held and all algorithms we testedproduced improved ROC results when compared to thesmaller expression datasets (Figure 4). However, althoughECIM performed as well or better than any other algo-rithm, significant improvements in precision from addingChIP-chip data were visible only when PBP's are used toconstruct the modules. This could be the consequence ofthe additional noise in the algorithm for constructinghierarchical clustering from PPPs. ECIM also outper-formed TMs constructed by the large gene expressiondatasets alone [26] as well as two algorithms that useexpression, binding and DNA sequence motif informa-tion to infer TMs [11,20] despite the dramatically smallernumber of data points used in the analysis. COGRIM out-performed GRAM and matched the functional coherenceof modules that were based on a much larger gene expres-sion dataset alone. This could be due to the additional reg-ulation information used in the analysis or simply due tothe more efficient use of the expression data alone.
Finally, we performed additional comparisons betweenTMs produced by GRAM and ECIM using Gene Ontolo-gies as the gold standard [26]. In this comparison, we con-structed TMs by cutting the hierarchical tree constructedby the ECIM algorithm so that the total number of genesin resulting TMs was about the same as the number ofgenes implicated by GRAM (740 unique genes in 98 TMs).For each gene-pair we identify the most specific GO cate-gory to which both of them belong by defining the specif-icity as I = [1-log2(S/2)/log2(N/2)] where S is the numberof genes annotated in this GO item and N is the total
ROC curves for 8 different algorithms using the combined sporulation and cell-cycle gene expression dataset and the ChIP-chip data of Lee, 2002Figure 2ROC curves for 8 different algorithms using the combined sporulation and cell-cycle gene expression dataset and the ChIP-chip data of Lee, 2002. KEGG pathways were used as the gold standard. ECIM utilizing both expression and binding data dominated all other algorithms. ROC "spots" for GRAM and SAMBA algorithms were obtained by applying the algo-rithms using the default parameters. Smaller ROC "spots" for SAMBA were obtained by systematically manipulating algo-rithm's parameters.
GRAMSAMBA
Page 6 of 20(page number not for citation purposes)

BMC Bioinformatics 2007, 8:283 http://www.biomedcentral.com/1471-2105/8/283
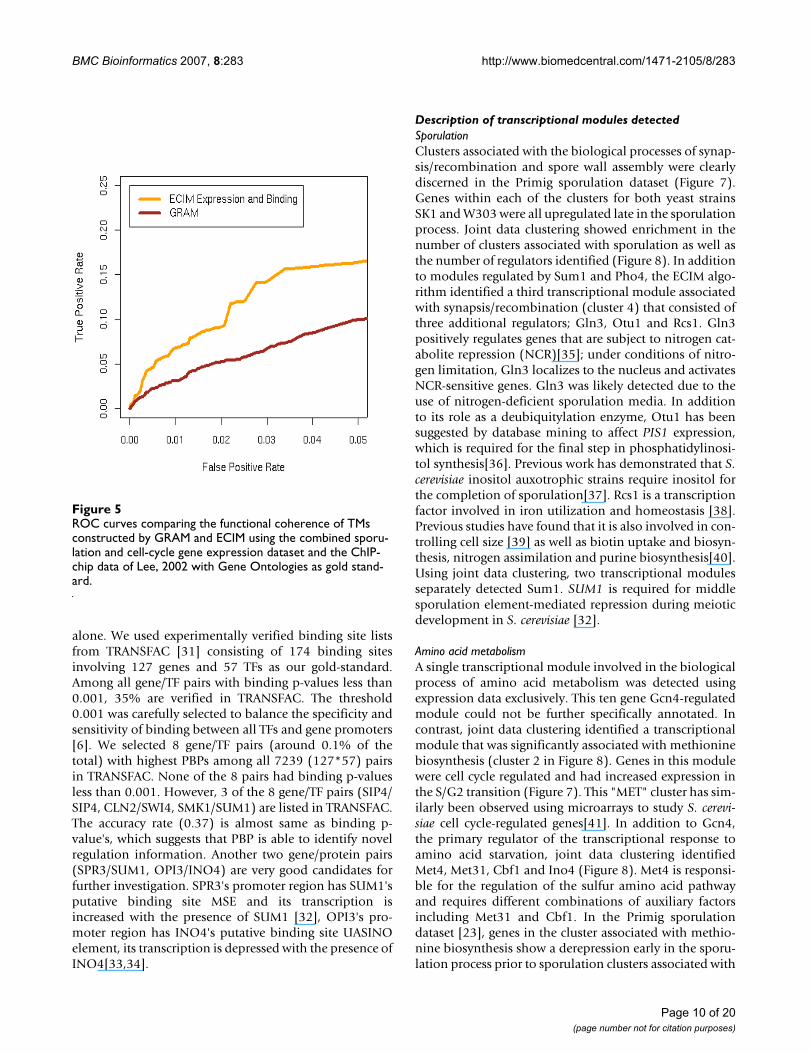
number of genes annotated in GO. It has been shown thatsuch a measure of specificity is a good way to represent thelevel of information about functional relationshipbetween genes based on GO groupings [30]. For a specificcut-off i, a pair of genes is True Positive if the correspond-ing I>i and are placed in at least one common TM. A pairof genes is False Positive if I>i, but the two genes do notshare a commong TM. ROC curves in Figure 5 are con-structed by systematically changing the threshold i andcalculating corresponding true and false positive rates forTMs constructed by GRAM and those constructed byECIM. Results of this analysis are concordant with resultsobtained by using KEGG pathways as the gold standard.
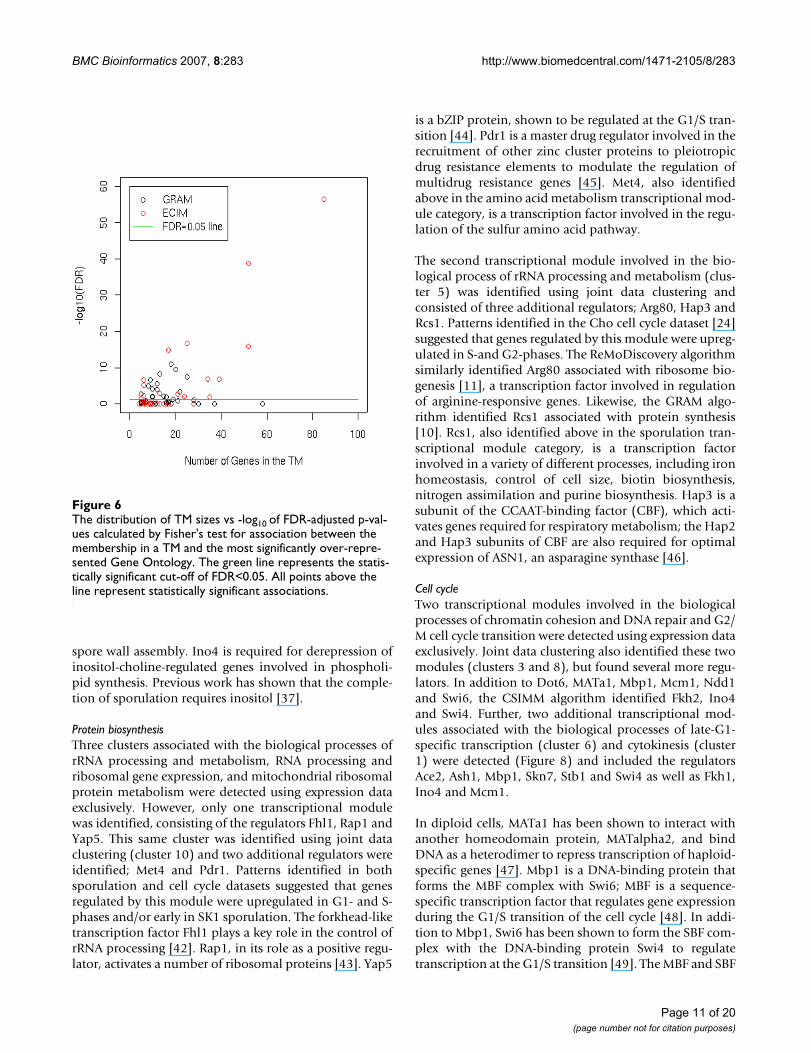
In addition to constructing ROC curves we examined thecoherence of TMs identified in this analysis in terms ofstatistical significances of over-represented Gene Ontolo-gies. For each TM, we identified the most over-representedGene Ontology as measured by the p-value of the Fisher'sexact test. The distribution of TM sizes and the statisticalsignificances of most over-represented Gene Ontologies isdepicted in Figure 6. Assuming that the false discovery rateof 0.05 to be statistically significant, the results of theanalysis are summarized in Table 1. Overall, the higherproportion of TMs constructed by ECIM (15 out of 51 vs15 out of 94) were statistically significantly associatedwith at least on Gene Ontology. The number of genes instatistically significant TMs constructed by ECIM was
ROC curves from Figures 1 and 2 with expanded range for FPRFigure 3ROC curves from Figures 1 and 2 with expanded range for FPR. ROC curves for 8 different algorithms using four different yeast gene expression datasets. A) Chu,1998, sporulation; B) Primig,2000, sporulation;C) Cho,1998, cellCycle, D) combined sporulation and cell-cycle dataset Liu,2006, and the ChIP-chip data of Lee, 2002. KEGG pathways were used as the gold stand-ard. ECIM utilizing both expression and binding data dominated all other algorithms. Large ROC "spots" for GRAM and SAMBA algorithms were obtained by applying the algorithms using the default parameters. Smaller ROC "spots" for GRAM and SAMBA were obtained by systematically manipulating algorithm's parameters.
SAMBA
GRAM
SAMBA
GRAM
SAMBA
A B
C D
Page 7 of 20(page number not for citation purposes)
BMC Bioinformatics 2007, 8:283 http://www.biomedcentral.com/1471-2105/8/283
more than twice the number of genes in statistically signif-icant TMs constructed by GRAM.
The comparison of Gene Ontologies significantly associ-ated with TMs constructed by ECIM and GRAM (Table 2)reveals that several key Gene Ontologies were implicatedby both algorithms (protein biosynthesis, Sporulation,sulfur metabolism, mitosis and amino acid metabolism).On the other hand, 8 out of 15 ECIM modules and 5 out15 GRAM modules were algorithm specific. All of these 13algorithm specific categories could be linked in one wayor another to the two basic process investigated by expres-sion data (sporulation and cell cycle). Consequently, itseems that both algorithms are identifying relevant TMs,it is just that ECIM is assigning a greater number relevantgenes to these TMs. The list of all TMs along with the asso-ciated Gene Ontologies is given in the SupplementalTable 3, (see Additional file 4).
Constructing TM's and identification of associated regulatorsTo demonstrate the simplicity of use and interpretation ofECIM results we constructed TMs based on results of the
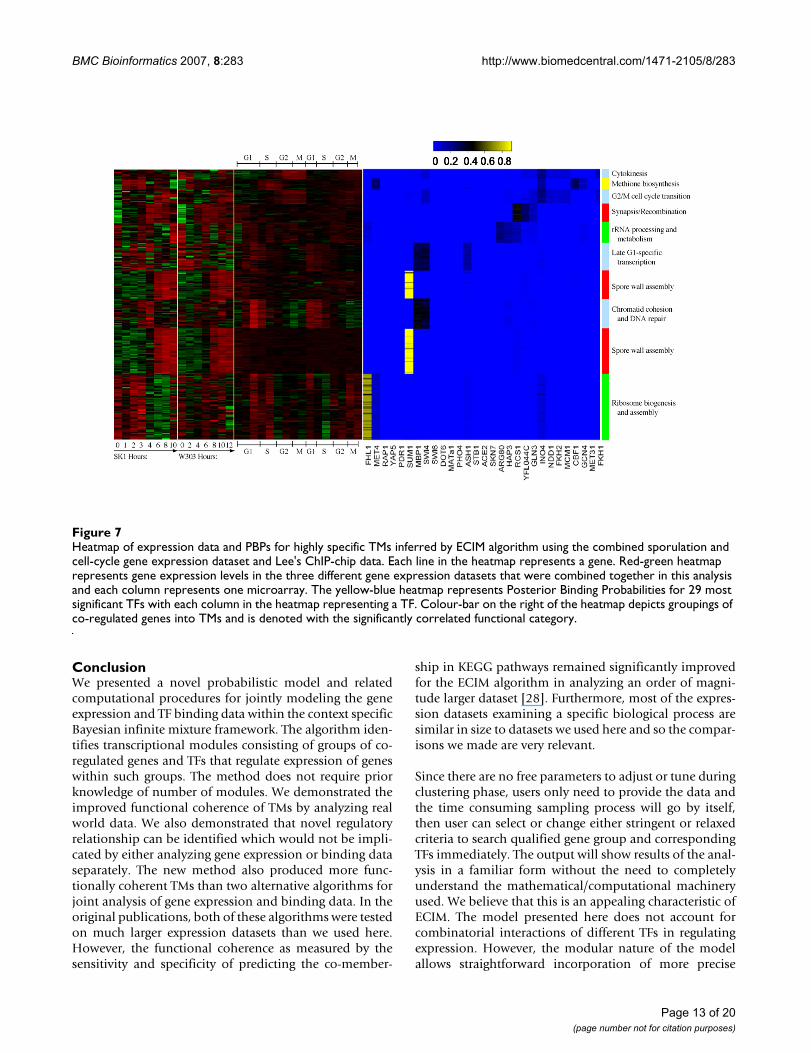
combined sporulation-cell cycle dataset. 294 genes wereselected based on the fact that their average linkage dis-tance based on ECIM-derived PPPs to at least one othergene or group of genes was below 0.1 and their cluster sizeis larger than 10. Previously we demonstrated that suchaverage linkage distance cut-offs have direct interpreta-tions in terms of statistical significance of implicated asso-ciations [21]. The heatmap in Figure 7 depicts clusters ofco-regulated genes and their associated TFs as well as thestrength of this association based on PBPs. On the righthand side of the heat-map, are gene ontologies most sig-nificantly associated with each TM. All TFs associated withdifferent TM's (Figure 8) are identified based on either thehigh PBPs between individual genes and individual TFs,or by over-representation of genes with statistically signif-icant binding p-values (<0.001) for a TF in the ChIP-chipexperiment (see methods). Descriptions of resulting TMsare given in the Supplementary Table 4, (see Additionalfile 5). The biological meaning of identified TMs is dis-cussed in the next section.
We also investigate the utility of PBPs in identifying novelregulatory relationships not implicated by ChIP-chip data
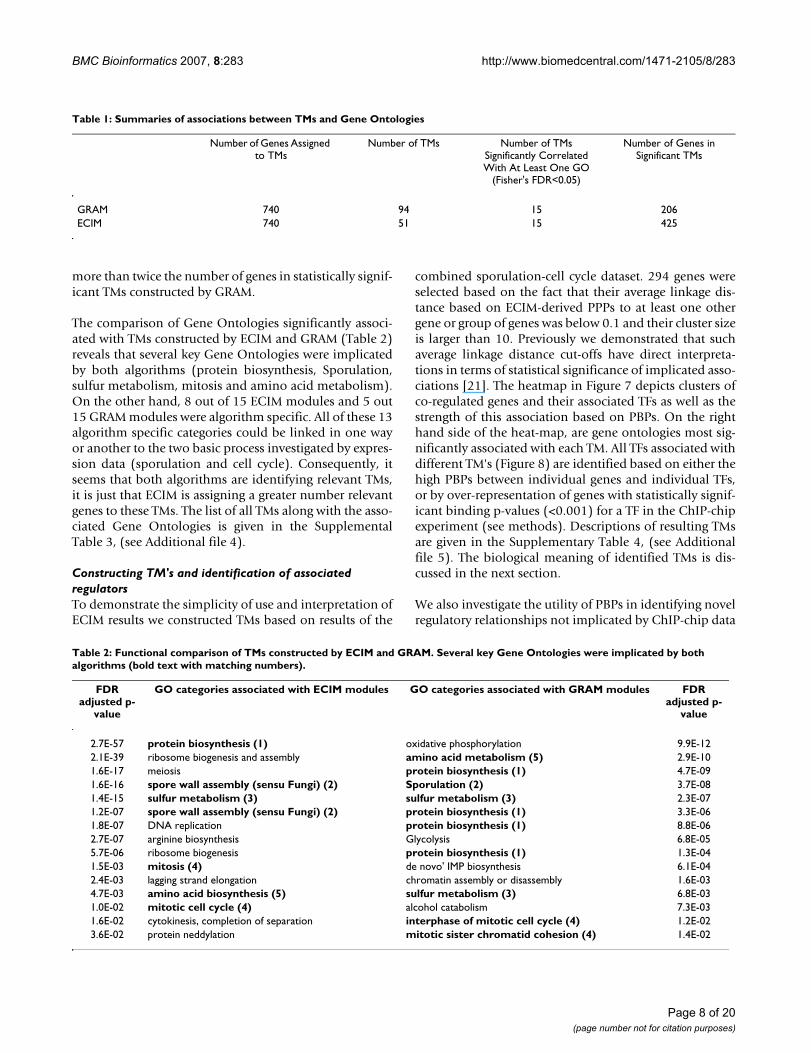
Table 1: Summaries of associations between TMs and Gene Ontologies
Number of Genes Assigned to TMs
Number of TMs Number of TMs Significantly Correlated With At Least One GO
(Fisher's FDR<0.05)
Number of Genes in Significant TMs
GRAM 740 94 15 206ECIM 740 51 15 425
Table 2: Functional comparison of TMs constructed by ECIM and GRAM. Several key Gene Ontologies were implicated by both algorithms (bold text with matching numbers).
FDR adjusted p-
value
GO categories associated with ECIM modules GO categories associated with GRAM modules FDR adjusted p-
value
2.7E-57 protein biosynthesis (1) oxidative phosphorylation 9.9E-122.1E-39 ribosome biogenesis and assembly amino acid metabolism (5) 2.9E-101.6E-17 meiosis protein biosynthesis (1) 4.7E-091.6E-16 spore wall assembly (sensu Fungi) (2) Sporulation (2) 3.7E-081.4E-15 sulfur metabolism (3) sulfur metabolism (3) 2.3E-071.2E-07 spore wall assembly (sensu Fungi) (2) protein biosynthesis (1) 3.3E-061.8E-07 DNA replication protein biosynthesis (1) 8.8E-062.7E-07 arginine biosynthesis Glycolysis 6.8E-055.7E-06 ribosome biogenesis protein biosynthesis (1) 1.3E-041.5E-03 mitosis (4) de novo' IMP biosynthesis 6.1E-042.4E-03 lagging strand elongation chromatin assembly or disassembly 1.6E-034.7E-03 amino acid biosynthesis (5) sulfur metabolism (3) 6.8E-031.0E-02 mitotic cell cycle (4) alcohol catabolism 7.3E-031.6E-02 cytokinesis, completion of separation interphase of mitotic cell cycle (4) 1.2E-023.6E-02 protein neddylation mitotic sister chromatid cohesion (4) 1.4E-02
Page 8 of 20(page number not for citation purposes)
BMC Bioinformatics 2007, 8:283 http://www.biomedcentral.com/1471-2105/8/283
Page 9 of 20(page number not for citation purposes)
ROC curves for 7 different algorithms using the combined dataset of yeast transcriptional responses to various environmental changes [28] and the ChIP-chip data of Lee, 2002Figure 4ROC curves for 7 different algorithms using the combined dataset of yeast transcriptional responses to various environmental changes [28] and the ChIP-chip data of Lee, 2002. We used the experiments with at least 5 time points or dose-response points for the total of 165 microarrays. KEGG pathways were used as the gold standard. The functional coherence of pro-duced TMs was also compared to the functional coherence of TMs constructed by three other algorithms utilizing expression datasets containing the Gasch dataset used in our calculations. ROC points for TMs constructed by Naama Barkai's lab [11] utilizing only a very large expression dataset at 23 different cut-off levels are depicted by yellow spots. The seed module and extended module constructed by ReMoDiscovery [11] utilizing gene expression, ChIP-chip and binding sequence motif data are depicted by pink spots. B+C+, B-C+ and the C+ TMs constructed by combining B+C+ and B-C+ modules identified by COGRIM [20] utilizing gene expression, ChIP-chip and binding sequence motif data are depicted by dark blue spots. All three diagrams represent the same ROC curves/plots for different ranges of False Positive Rates (x-axis) ECIM results again domi-nated all other algorithms in terms of functional coherence.
BMC Bioinformatics 2007, 8:283 http://www.biomedcentral.com/1471-2105/8/283
alone. We used experimentally verified binding site listsfrom TRANSFAC [31] consisting of 174 binding sitesinvolving 127 genes and 57 TFs as our gold-standard.Among all gene/TF pairs with binding p-values less than0.001, 35% are verified in TRANSFAC. The threshold0.001 was carefully selected to balance the specificity andsensitivity of binding between all TFs and gene promoters[6]. We selected 8 gene/TF pairs (around 0.1% of thetotal) with highest PBPs among all 7239 (127*57) pairsin TRANSFAC. None of the 8 pairs had binding p-valuesless than 0.001. However, 3 of the 8 gene/TF pairs (SIP4/SIP4, CLN2/SWI4, SMK1/SUM1) are listed in TRANSFAC.The accuracy rate (0.37) is almost same as binding p-value's, which suggests that PBP is able to identify novelregulation information. Another two gene/protein pairs(SPR3/SUM1, OPI3/INO4) are very good candidates forfurther investigation. SPR3's promoter region has SUM1'sputative binding site MSE and its transcription isincreased with the presence of SUM1 [32], OPI3's pro-moter region has INO4's putative binding site UASINOelement, its transcription is depressed with the presence ofINO4[33,34].
Description of transcriptional modules detectedSporulationClusters associated with the biological processes of synap-sis/recombination and spore wall assembly were clearlydiscerned in the Primig sporulation dataset (Figure 7).Genes within each of the clusters for both yeast strainsSK1 and W303 were all upregulated late in the sporulationprocess. Joint data clustering showed enrichment in thenumber of clusters associated with sporulation as well asthe number of regulators identified (Figure 8). In additionto modules regulated by Sum1 and Pho4, the ECIM algo-rithm identified a third transcriptional module associatedwith synapsis/recombination (cluster 4) that consisted ofthree additional regulators; Gln3, Otu1 and Rcs1. Gln3positively regulates genes that are subject to nitrogen cat-abolite repression (NCR)[35]; under conditions of nitro-gen limitation, Gln3 localizes to the nucleus and activatesNCR-sensitive genes. Gln3 was likely detected due to theuse of nitrogen-deficient sporulation media. In additionto its role as a deubiquitylation enzyme, Otu1 has beensuggested by database mining to affect PIS1 expression,which is required for the final step in phosphatidylinosi-tol synthesis[36]. Previous work has demonstrated that S.cerevisiae inositol auxotrophic strains require inositol forthe completion of sporulation[37]. Rcs1 is a transcriptionfactor involved in iron utilization and homeostasis [38].Previous studies have found that it is also involved in con-trolling cell size [39] as well as biotin uptake and biosyn-thesis, nitrogen assimilation and purine biosynthesis[40].Using joint data clustering, two transcriptional modulesseparately detected Sum1. SUM1 is required for middlesporulation element-mediated repression during meioticdevelopment in S. cerevisiae [32].
Amino acid metabolismA single transcriptional module involved in the biologicalprocess of amino acid metabolism was detected usingexpression data exclusively. This ten gene Gcn4-regulatedmodule could not be further specifically annotated. Incontrast, joint data clustering identified a transcriptionalmodule that was significantly associated with methioninebiosynthesis (cluster 2 in Figure 8). Genes in this modulewere cell cycle regulated and had increased expression inthe S/G2 transition (Figure 7). This "MET" cluster has sim-ilarly been observed using microarrays to study S. cerevi-siae cell cycle-regulated genes[41]. In addition to Gcn4,the primary regulator of the transcriptional response toamino acid starvation, joint data clustering identifiedMet4, Met31, Cbf1 and Ino4 (Figure 8). Met4 is responsi-ble for the regulation of the sulfur amino acid pathwayand requires different combinations of auxiliary factorsincluding Met31 and Cbf1. In the Primig sporulationdataset [23], genes in the cluster associated with methio-nine biosynthesis show a derepression early in the sporu-lation process prior to sporulation clusters associated with
ROC curves comparing the functional coherence of TMs constructed by GRAM and ECIM using the combined sporu-lation and cell-cycle gene expression dataset and the ChIP-chip data of Lee, 2002 with Gene Ontologies as gold stand-ardFigure 5ROC curves comparing the functional coherence of TMs constructed by GRAM and ECIM using the combined sporu-lation and cell-cycle gene expression dataset and the ChIP-chip data of Lee, 2002 with Gene Ontologies as gold stand-ard.
Page 10 of 20(page number not for citation purposes)
BMC Bioinformatics 2007, 8:283 http://www.biomedcentral.com/1471-2105/8/283
spore wall assembly. Ino4 is required for derepression ofinositol-choline-regulated genes involved in phospholi-pid synthesis. Previous work has shown that the comple-tion of sporulation requires inositol [37].
Protein biosynthesisThree clusters associated with the biological processes ofrRNA processing and metabolism, RNA processing andribosomal gene expression, and mitochondrial ribosomalprotein metabolism were detected using expression dataexclusively. However, only one transcriptional modulewas identified, consisting of the regulators Fhl1, Rap1 andYap5. This same cluster was identified using joint dataclustering (cluster 10) and two additional regulators wereidentified; Met4 and Pdr1. Patterns identified in bothsporulation and cell cycle datasets suggested that genesregulated by this module were upregulated in G1- and S-phases and/or early in SK1 sporulation. The forkhead-liketranscription factor Fhl1 plays a key role in the control ofrRNA processing [42]. Rap1, in its role as a positive regu-lator, activates a number of ribosomal proteins [43]. Yap5
is a bZIP protein, shown to be regulated at the G1/S tran-sition [44]. Pdr1 is a master drug regulator involved in therecruitment of other zinc cluster proteins to pleiotropicdrug resistance elements to modulate the regulation ofmultidrug resistance genes [45]. Met4, also identifiedabove in the amino acid metabolism transcriptional mod-ule category, is a transcription factor involved in the regu-lation of the sulfur amino acid pathway.
The second transcriptional module involved in the bio-logical process of rRNA processing and metabolism (clus-ter 5) was identified using joint data clustering andconsisted of three additional regulators; Arg80, Hap3 andRcs1. Patterns identified in the Cho cell cycle dataset [24]suggested that genes regulated by this module were upreg-ulated in S-and G2-phases. The ReMoDiscovery algorithmsimilarly identified Arg80 associated with ribosome bio-genesis [11], a transcription factor involved in regulationof arginine-responsive genes. Likewise, the GRAM algo-rithm identified Rcs1 associated with protein synthesis[10]. Rcs1, also identified above in the sporulation tran-scriptional module category, is a transcription factorinvolved in a variety of different processes, including ironhomeostasis, control of cell size, biotin biosynthesis,nitrogen assimilation and purine biosynthesis. Hap3 is asubunit of the CCAAT-binding factor (CBF), which acti-vates genes required for respiratory metabolism; the Hap2and Hap3 subunits of CBF are also required for optimalexpression of ASN1, an asparagine synthase [46].
Cell cycleTwo transcriptional modules involved in the biologicalprocesses of chromatin cohesion and DNA repair and G2/M cell cycle transition were detected using expression dataexclusively. Joint data clustering also identified these twomodules (clusters 3 and 8), but found several more regu-lators. In addition to Dot6, MATa1, Mbp1, Mcm1, Ndd1and Swi6, the CSIMM algorithm identified Fkh2, Ino4and Swi4. Further, two additional transcriptional mod-ules associated with the biological processes of late-G1-specific transcription (cluster 6) and cytokinesis (cluster1) were detected (Figure 8) and included the regulatorsAce2, Ash1, Mbp1, Skn7, Stb1 and Swi4 as well as Fkh1,Ino4 and Mcm1.
In diploid cells, MATa1 has been shown to interact withanother homeodomain protein, MATalpha2, and bindDNA as a heterodimer to repress transcription of haploid-specific genes [47]. Mbp1 is a DNA-binding protein thatforms the MBF complex with Swi6; MBF is a sequence-specific transcription factor that regulates gene expressionduring the G1/S transition of the cell cycle [48]. In addi-tion to Mbp1, Swi6 has been shown to form the SBF com-plex with the DNA-binding protein Swi4 to regulatetranscription at the G1/S transition [49]. The MBF and SBF
The distribution of TM sizes vs -log10 of FDR-adjusted p-val-ues calculated by Fisher's test for association between the membership in a TM and the most significantly over-repre-sented Gene OntologyFigure 6The distribution of TM sizes vs -log10 of FDR-adjusted p-val-ues calculated by Fisher's test for association between the membership in a TM and the most significantly over-repre-sented Gene Ontology. The green line represents the statis-tically significant cut-off of FDR<0.05. All points above the line represent statistically significant associations.
Page 11 of 20(page number not for citation purposes)
BMC Bioinformatics 2007, 8:283 http://www.biomedcentral.com/1471-2105/8/283
complexes regulate late-G1-specific transcription.Although Skn7 is required for induction of heat-shockgenes by oxidative stress [50], it has recently been shownto associate with Mbp1, forming a transcription factorindependent of MBF that may be involved in the bud-emergence process [51]. Stb1 binds to Swi6 and has a rolein the regulation of MBP-specific transcription [52].Mcm1 has been shown to be required for the coordina-tion of G2-specific transcription [53]. Ndd1 is essential forthe expression of a set of late-S-phase-specific genes [54].Fkh1 and Fkh2 are transcription factors of the forkhead
family that regulate the cell cycle [55]. Ace2 has beenshown to activate the expression of early-G1-specificgenes [56]. Dot6 is a protein of unknown functioninvolved in telomeric silencing [57] and filamentation[58]. Ino4, also identified above using joint expressionand binding data clustering in the amino acid metabolismtranscriptional module category, is a transcription factorthat regulated genes involved in phospholipid synthesis.In diploid cells deprived of nitrogen, Ash1 has beenshown to be asymmetrically localized to the nuclei ofdaughter cells during pseudohyphal growth [59].
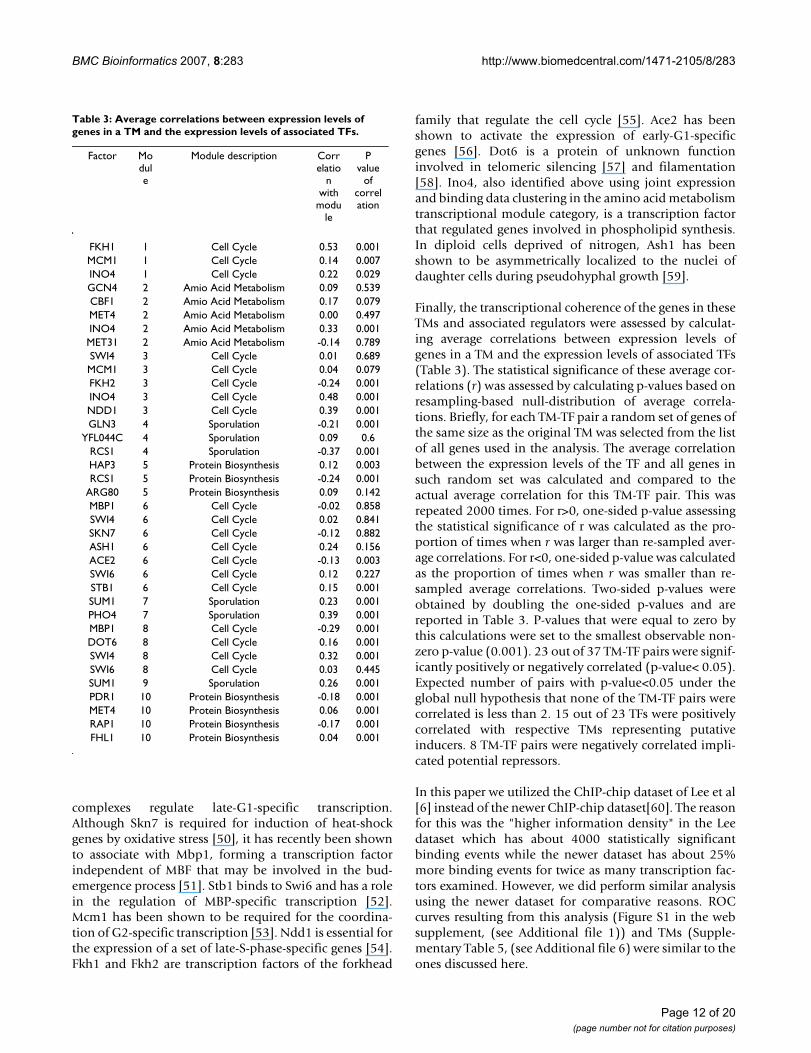
Finally, the transcriptional coherence of the genes in theseTMs and associated regulators were assessed by calculat-ing average correlations between expression levels ofgenes in a TM and the expression levels of associated TFs(Table 3). The statistical significance of these average cor-relations (r) was assessed by calculating p-values based onresampling-based null-distribution of average correla-tions. Briefly, for each TM-TF pair a random set of genes ofthe same size as the original TM was selected from the listof all genes used in the analysis. The average correlationbetween the expression levels of the TF and all genes insuch random set was calculated and compared to theactual average correlation for this TM-TF pair. This wasrepeated 2000 times. For r>0, one-sided p-value assessingthe statistical significance of r was calculated as the pro-portion of times when r was larger than re-sampled aver-age correlations. For r<0, one-sided p-value was calculatedas the proportion of times when r was smaller than re-sampled average correlations. Two-sided p-values wereobtained by doubling the one-sided p-values and arereported in Table 3. P-values that were equal to zero bythis calculations were set to the smallest observable non-zero p-value (0.001). 23 out of 37 TM-TF pairs were signif-icantly positively or negatively correlated (p-value< 0.05).Expected number of pairs with p-value<0.05 under theglobal null hypothesis that none of the TM-TF pairs werecorrelated is less than 2. 15 out of 23 TFs were positivelycorrelated with respective TMs representing putativeinducers. 8 TM-TF pairs were negatively correlated impli-cated potential repressors.
In this paper we utilized the ChIP-chip dataset of Lee et al[6] instead of the newer ChIP-chip dataset[60]. The reasonfor this was the "higher information density" in the Leedataset which has about 4000 statistically significantbinding events while the newer dataset has about 25%more binding events for twice as many transcription fac-tors examined. However, we did perform similar analysisusing the newer dataset for comparative reasons. ROCcurves resulting from this analysis (Figure S1 in the websupplement, (see Additional file 1)) and TMs (Supple-mentary Table 5, (see Additional file 6) were similar to theones discussed here.
Table 3: Average correlations between expression levels of genes in a TM and the expression levels of associated TFs.
Factor Module
Module description Correlatio
n with
module
P value
of correlation
FKH1 1 Cell Cycle 0.53 0.001MCM1 1 Cell Cycle 0.14 0.007INO4 1 Cell Cycle 0.22 0.029GCN4 2 Amio Acid Metabolism 0.09 0.539CBF1 2 Amio Acid Metabolism 0.17 0.079MET4 2 Amio Acid Metabolism 0.00 0.497INO4 2 Amio Acid Metabolism 0.33 0.001MET31 2 Amio Acid Metabolism -0.14 0.789SWI4 3 Cell Cycle 0.01 0.689MCM1 3 Cell Cycle 0.04 0.079FKH2 3 Cell Cycle -0.24 0.001INO4 3 Cell Cycle 0.48 0.001NDD1 3 Cell Cycle 0.39 0.001GLN3 4 Sporulation -0.21 0.001
YFL044C 4 Sporulation 0.09 0.6RCS1 4 Sporulation -0.37 0.001HAP3 5 Protein Biosynthesis 0.12 0.003RCS1 5 Protein Biosynthesis -0.24 0.001
ARG80 5 Protein Biosynthesis 0.09 0.142MBP1 6 Cell Cycle -0.02 0.858SWI4 6 Cell Cycle 0.02 0.841SKN7 6 Cell Cycle -0.12 0.882ASH1 6 Cell Cycle 0.24 0.156ACE2 6 Cell Cycle -0.13 0.003SWI6 6 Cell Cycle 0.12 0.227STB1 6 Cell Cycle 0.15 0.001SUM1 7 Sporulation 0.23 0.001PHO4 7 Sporulation 0.39 0.001MBP1 8 Cell Cycle -0.29 0.001DOT6 8 Cell Cycle 0.16 0.001SWI4 8 Cell Cycle 0.32 0.001SWI6 8 Cell Cycle 0.03 0.445SUM1 9 Sporulation 0.26 0.001PDR1 10 Protein Biosynthesis -0.18 0.001MET4 10 Protein Biosynthesis 0.06 0.001RAP1 10 Protein Biosynthesis -0.17 0.001FHL1 10 Protein Biosynthesis 0.04 0.001
Page 12 of 20(page number not for citation purposes)
BMC Bioinformatics 2007, 8:283 http://www.biomedcentral.com/1471-2105/8/283
ConclusionWe presented a novel probabilistic model and relatedcomputational procedures for jointly modeling the geneexpression and TF binding data within the context specificBayesian infinite mixture framework. The algorithm iden-tifies transcriptional modules consisting of groups of co-regulated genes and TFs that regulate expression of geneswithin such groups. The method does not require priorknowledge of number of modules. We demonstrated theimproved functional coherence of TMs by analyzing realworld data. We also demonstrated that novel regulatoryrelationship can be identified which would not be impli-cated by either analyzing gene expression or binding dataseparately. The new method also produced more func-tionally coherent TMs than two alternative algorithms forjoint analysis of gene expression and binding data. In theoriginal publications, both of these algorithms were testedon much larger expression datasets than we used here.However, the functional coherence as measured by thesensitivity and specificity of predicting the co-member-
ship in KEGG pathways remained significantly improvedfor the ECIM algorithm in analyzing an order of magni-tude larger dataset [28]. Furthermore, most of the expres-sion datasets examining a specific biological process aresimilar in size to datasets we used here and so the compar-isons we made are very relevant.
Since there are no free parameters to adjust or tune duringclustering phase, users only need to provide the data andthe time consuming sampling process will go by itself,then user can select or change either stringent or relaxedcriteria to search qualified gene group and correspondingTFs immediately. The output will show results of the anal-ysis in a familiar form without the need to completelyunderstand the mathematical/computational machineryused. We believe that this is an appealing characteristic ofECIM. The model presented here does not account forcombinatorial interactions of different TFs in regulatingexpression. However, the modular nature of the modelallows straightforward incorporation of more precise
Heatmap of expression data and PBPs for highly specific TMs inferred by ECIM algorithm using the combined sporulation and cell-cycle gene expression dataset and Lee's ChIP-chip dataFigure 7Heatmap of expression data and PBPs for highly specific TMs inferred by ECIM algorithm using the combined sporulation and cell-cycle gene expression dataset and Lee's ChIP-chip data. Each line in the heatmap represents a gene. Red-green heatmap represents gene expression levels in the three different gene expression datasets that were combined together in this analysis and each column represents one microarray. The yellow-blue heatmap represents Posterior Binding Probabilities for 29 most significant TFs with each column in the heatmap representing a TF. Colour-bar on the right of the heatmap depicts groupings of co-regulated genes into TMs and is denoted with the significantly correlated functional category.
0 0.2 0.4 0.6 0.80 0.2 0.4 0.6 0.80 0.2 0.4 0.6 0.8
Page 13 of 20(page number not for citation purposes)
BMC Bioinformatics 2007, 8:283 http://www.biomedcentral.com/1471-2105/8/283
Page 14 of 20(page number not for citation purposes)
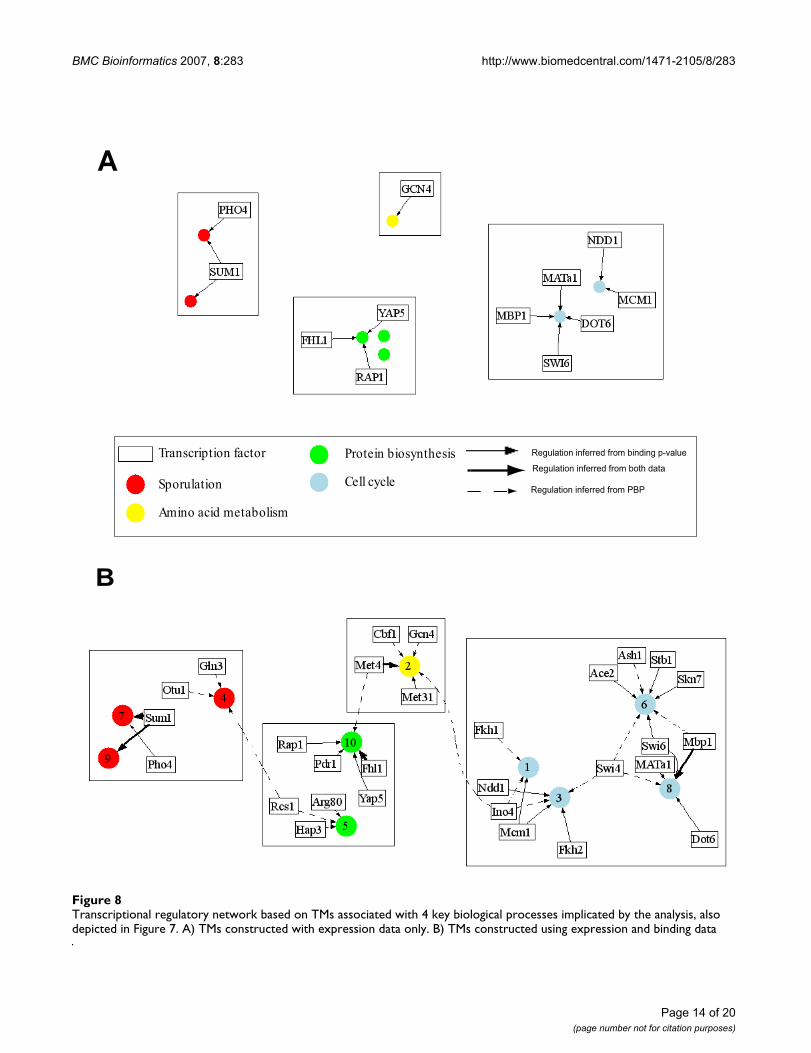
Transcriptional regulatory network based on TMs associated with 4 key biological processes implicated by the analysis, also depicted in Figure 7Figure 8Transcriptional regulatory network based on TMs associated with 4 key biological processes implicated by the analysis, also depicted in Figure 7. A) TMs constructed with expression data only. B) TMs constructed using expression and binding data
A
B
Protein biosynthesis
Cell cycle
Amino acid metabolism
Sporulation
Transcription factor Regulation inferred from binding p-value
Regulation inferred from both data
Regulation inferred from PBP
BMC Bioinformatics 2007, 8:283 http://www.biomedcentral.com/1471-2105/8/283
Page 15 of 20(page number not for citation purposes)
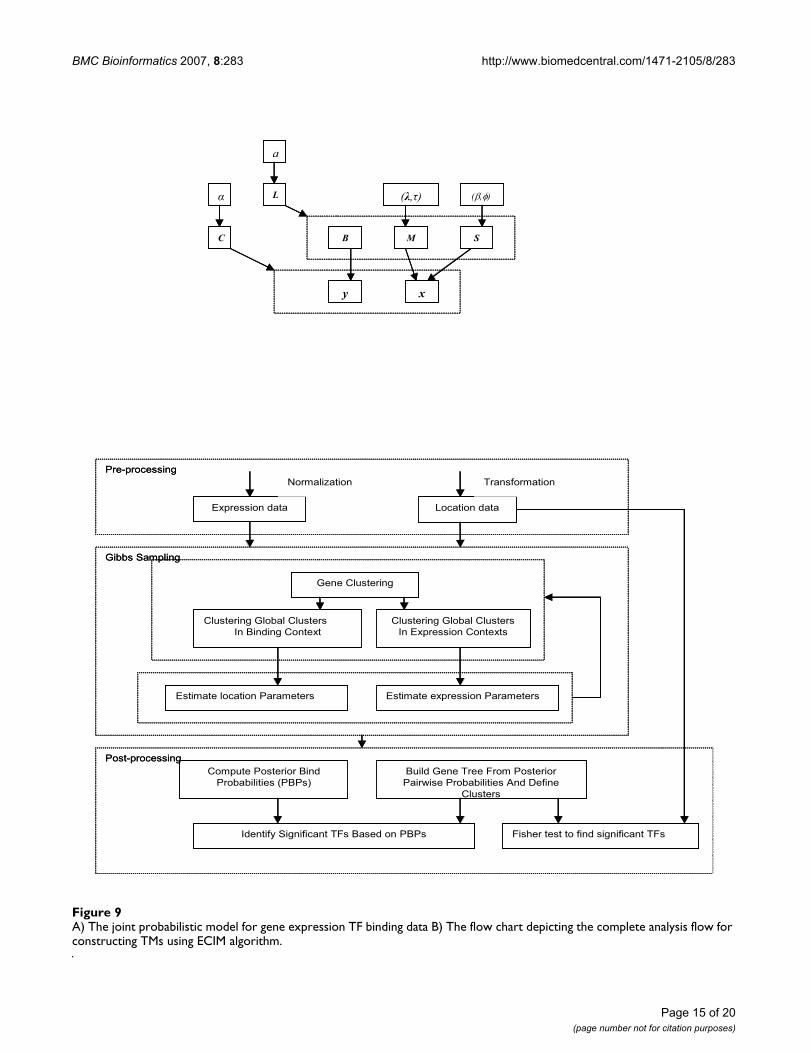
A) The joint probabilistic model for gene expression TF binding data B) The flow chart depicting the complete analysis flow for constructing TMs using ECIM algorithmFigure 9A) The joint probabilistic model for gene expression TF binding data B) The flow chart depicting the complete analysis flow for constructing TMs using ECIM algorithm.
Location dataExpression data
TransformationNormalization
Gene Clustering
Clustering Global Clusters
In Binding Context
Clustering Global Clusters
In Expression Contexts
Estimate location Parameters Estimate expression Parameters
Pre-processing
Gibbs Sampling
Build Gene Tree From Posterior
Pairwise Probabilities And Define
Clusters
Compute Posterior Bind
Probabilities (PBPs)
Identify Significant TFs Based on PBPs Fisher test to find significant TFs
Post-processing
C
a
L ( , )
M
( , )
S
xy
BC
a
L ( , )
M S
xy
B
( , )
BMC Bioinformatics 2007, 8:283 http://www.biomedcentral.com/1471-2105/8/283
models for ChIP-chip data which will most likely furtherimprove the performance of the method.
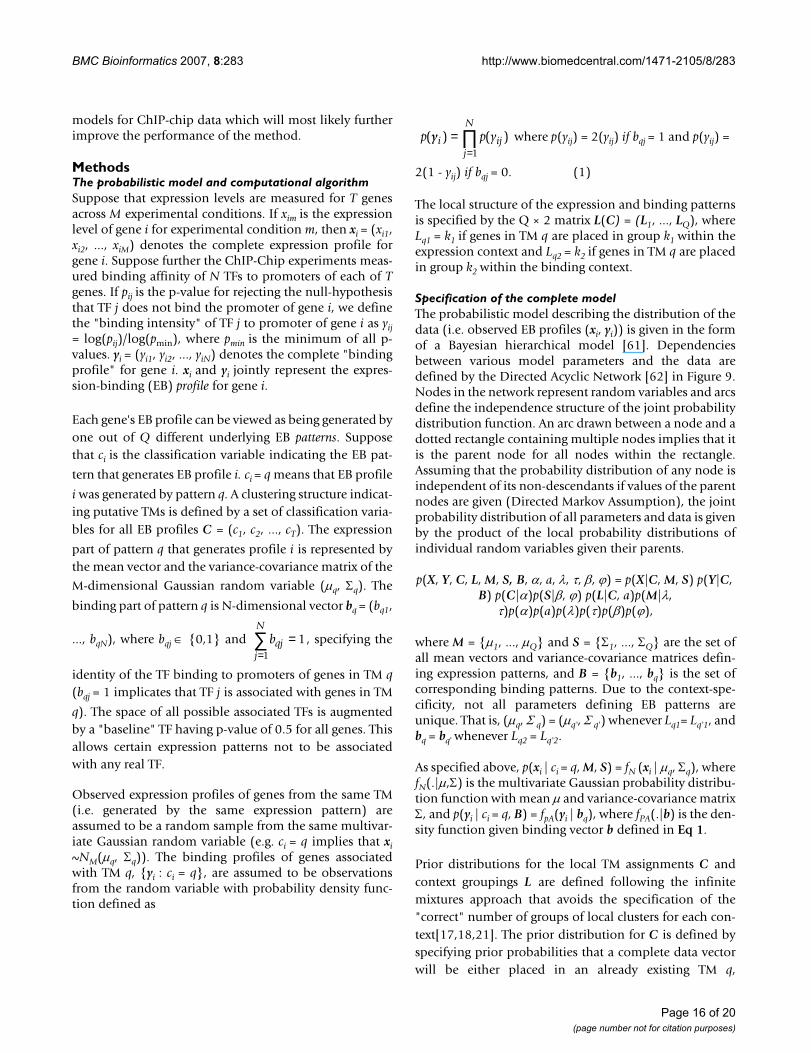
MethodsThe probabilistic model and computational algorithmSuppose that expression levels are measured for T genesacross M experimental conditions. If xim is the expressionlevel of gene i for experimental condition m, then xi = (xi1,xi2, ..., xiM) denotes the complete expression profile forgene i. Suppose further the ChIP-Chip experiments meas-ured binding affinity of N TFs to promoters of each of Tgenes. If pij is the p-value for rejecting the null-hypothesisthat TF j does not bind the promoter of gene i, we definethe "binding intensity" of TF j to promoter of gene i as yij= log(pij)/log(pmin), where pmin is the minimum of all p-values. yi = (yi1, yi2, ..., yiN) denotes the complete "bindingprofile" for gene i. xi and yi jointly represent the expres-sion-binding (EB) profile for gene i.
Each gene's EB profile can be viewed as being generated byone out of Q different underlying EB patterns. Supposethat ci is the classification variable indicating the EB pat-
tern that generates EB profile i. ci = q means that EB profile
i was generated by pattern q. A clustering structure indicat-ing putative TMs is defined by a set of classification varia-bles for all EB profiles C = (c1, c2, ..., cT). The expression
part of pattern q that generates profile i is represented bythe mean vector and the variance-covariance matrix of the
M-dimensional Gaussian random variable (µq, Σq). The
binding part of pattern q is N-dimensional vector bq = (bq1,
..., bqN), where bqj ∈ {0,1} and , specifying the
identity of the TF binding to promoters of genes in TM q(bqj = 1 implicates that TF j is associated with genes in TM
q). The space of all possible associated TFs is augmentedby a "baseline" TF having p-value of 0.5 for all genes. Thisallows certain expression patterns not to be associatedwith any real TF.
Observed expression profiles of genes from the same TM(i.e. generated by the same expression pattern) areassumed to be a random sample from the same multivar-iate Gaussian random variable (e.g. ci = q implies that xi~NM(µq, Σq)). The binding profiles of genes associatedwith TM q, {yi : ci = q}, are assumed to be observationsfrom the random variable with probability density func-tion defined as
where p(yij) = 2(yij) if bqj = 1 and p(yij) =
2(1 - yij) if bqj = 0. (1)
The local structure of the expression and binding patternsis specified by the Q × 2 matrix L(C) = (L1, ..., LQ), whereLq1 = k1 if genes in TM q are placed in group k1 within theexpression context and Lq2 = k2 if genes in TM q are placedin group k2 within the binding context.
Specification of the complete modelThe probabilistic model describing the distribution of thedata (i.e. observed EB profiles (xi, yi)) is given in the formof a Bayesian hierarchical model [61]. Dependenciesbetween various model parameters and the data aredefined by the Directed Acyclic Network [62] in Figure 9.Nodes in the network represent random variables and arcsdefine the independence structure of the joint probabilitydistribution function. An arc drawn between a node and adotted rectangle containing multiple nodes implies that itis the parent node for all nodes within the rectangle.Assuming that the probability distribution of any node isindependent of its non-descendants if values of the parentnodes are given (Directed Markov Assumption), the jointprobability distribution of all parameters and data is givenby the product of the local probability distributions ofindividual random variables given their parents.
p(X, Y, C, L, M, S, B, α, a, λ, τ, β, ϕ) = p(X|C, M, S) p(Y|C, B) p(C|α)p(S|β, ϕ) p(L|C, a)p(M|λ,
τ)p(α)p(a)p(λ)p(τ)p(β)p(ϕ),
where M = {µ1, ..., µQ} and S = {Σ1, ..., ΣQ} are the set ofall mean vectors and variance-covariance matrices defin-ing expression patterns, and B = {b1, ..., bq} is the set ofcorresponding binding patterns. Due to the context-spe-cificity, not all parameters defining EB patterns areunique. That is, (µq, Σ q) = (µq', Σ q') whenever Lq1= Lq'1, andbq = bq' whenever Lq2 = Lq'2.
As specified above, p(xi | ci = q, M, S) = fN (xi | µq, Σq), wherefN(.|µ,Σ) is the multivariate Gaussian probability distribu-tion function with mean µ and variance-covariance matrixΣ, and p(yi | ci = q, B) = fpA(yi | bq), where fPA(.|b) is the den-sity function given binding vector b defined in Eq 1.
Prior distributions for the local TM assignments C andcontext groupings L are defined following the infinitemixtures approach that avoids the specification of the"correct" number of groups of local clusters for each con-text[17,18,21]. The prior distribution for C is defined byspecifying prior probabilities that a complete data vectorwill be either placed in an already existing TM q,
bqjj
N
=∑ =
1
1
p p yi ijj
N( ) ( )y =
=∏
1
Page 16 of 20(page number not for citation purposes)

BMC Bioinformatics 2007, 8:283 http://www.biomedcentral.com/1471-2105/8/283
, or that a new TM is created
, where C-i = (c1, c2,
..., ci-1, ci+1, ..., cT), n-i,q is the number of profiles generated
by EB pattern q without counting EB profile i, and α is thehyper-parameter. Similarly, local structure priors are spec-ified by the probability that expression or binding profilesfrom TM q are further grouped together within the corre-sponding context. The probability of assigning TM q to analready existing group of TMs t within context f (f = 1 forthe expression context and 2 for the binding context), is
, where n-qft is the number of
TMs currently placed in local grouping t within context fwithout counting TM q and a is the hyper-parameter. Theprobability of assigning TM q to a new local group is
. Hyper-parameters a
and α are further modeled and estimated from the dataand don't have to be specified in the analysis[21,63]. Con-ditional distributions for all other parameters in themodel given their parent nodes in the DAG are the sameas previously described [17,18,21] and are given in theweb supplement (see Addtional file 1).
The goal of the analysis is to estimate the posterior distri-bution of parameters in the model given data p(C,L, M, S,B, α, a, λ, τ, β, ϕ | X, Y) in the traditional sense of Bayesianstatistical analysis. More specifically, we are interested inthe marginal distribution of C, L and B given (X, Y)obtained by integrating out all other parameters p(C, L,B|X, Y) = ∫p(C, L, M, S, B, α, a, λ, τ, β, ϕ|X, Y)d(M, S, α, a,λ, τ, β, ϕ|X, Y)
Fitting the modelThe joint posterior distribution of all parameters in themodel given data is estimated using Gibbs sampler. Gibbssampler [22] is a general procedure for sampling observa-tions from a multivariate distribution. It proceeds by iter-atively drawing observations from complete conditionaldistributions of all components given the current valuesof all other components. Under mild condition, the distri-bution of generated multivariate observations convergesto the target multivariate distribution. The Gibbs sampleremployed here is derived from previously described algo-rithms for fitting infinite mixture models.
The posterior probability of placing EB profile i into anexisting TM q, given all other parameters is
, and the posterior probability of placing EB profile i intonew TM is
Similarly, the posterior probability of placing TM q withinthe expression data context into an existing cluster of TMst is
where
. and within the binding data context it is
. Posterior
probabilities of placing TMs into new clusters of TMswithin each context are similarly derived as for EB profileclassification variables C.
All other conditional posterior distributions are similar tothe simple infinite mixture models [21]. The Gibbs sam-pler proceeds to sample first EB profile classification vari-ables C, then local groupings of TMs within the expressionand binding contexts C, and then the rest of the parame-ters in the model. To alleviate the problem of "slow mix-ing", we apply heuristic annealing adjustment [18,21].Previously, we demonstrated that such modifications pre-serve the topology of the posterior distribution of cluster-ings [18]. TMs are then formed based on the marginalposterior distributions of the classification variables Cand L(C). Summarizing the posterior distribution of Cand L(C) generated by the Gibbs sampler is generally anon-trivial problem due to the label switching[64,65]. Wecircumvent this problem by summarizing posterior distri-butions of C and L(C) in terms of Posterior Pairwise Prob-abilities (PPPs) and Posterior Binding Probabilities(PBPs). Given the sequence of parameters (Cg, Lg, Bg) afterB burn in iterations, g = B + 1, ..., G, generated by theGibbs sampler, for each pair of genes, PPP is the propor-tion of Gibbs samples after burn-in in which the twogenes are placed in the same TM. For each gene-TF pair,PBP is the proportion of Gibbs samples after burn-in inwhich the specific TF is associated with the TM that con-tains the specific gene.
p c qn
Ti ii q
( | , ),
= =+
−C− −
αα1
p c c j i CTi j i( | , ) ≠ ∀ ≠ =
+− −α α
α1
p L t an
Q aqfqft
( | )= ∝+
−
−1
p L L q q aa
Q aqf q f( , ’ | )’≠ ∀ ≠ ∝+−1
p c qn
Tf fi i i i
i qN i q q PA i q( | , , , ) ( | , ) ( |
,= ∝+
−C x M S,y ,B x y b− −1 α
µµ ΣΣ ))
p c c i i
Tf
i i i i i
N
( ’ | , , , )
(
’ ,
≠ ∀ ≠ ∝
+
C x M S,y ,B
x
−
−α
α1 ii q q PA i q q q q q q qf p p d| , ) ( | ) ( , | , , , ) ( ) ( , , )µµ µµ λλ µµΣΣ ΣΣ ΣΣy b b b∫ τ β φ
p L t an
Q af
nqq t
Nq
tt
q( | , , ) ( | , )1
1
1= ∝
+X xΣΣ
ΣΣ
−
−µµ
x
xq
ic q
q
i
n= =
∑
p L t an
Q afq
q tPA q
c qi
( | , ) ( | )22
1= ∝
+ =∏B y b
−
− i
Page 17 of 20(page number not for citation purposes)

BMC Bioinformatics 2007, 8:283 http://www.biomedcentral.com/1471-2105/8/283
Inferring transcription factors from PBP and binding p-valueOnce we select gene clusters based on average PPP dis-tance and proper Gene Ontology annotations we can inferassociated TFs by either PBP or binding p-values. The firstmethod transformed binding p-value to a boolean valuebased on the p-value cut-off threshold (0.001). Each TFwas then examined to determine if it was significantlybound to the promoters of the gene cluster using a Fisherexact test (p-value <= 0.005). The second method calcu-lated the average PBP between gene clusters and each TF.Those TFs with PBP >= 0.1 were considered significant.The selection of thresholds for significance is establishedempirically to balance the sensitivity and specificity ofcandidate TFs. This is the same cut-off threshold as used inthe original publication [6]. The PBP threshold was cho-sen by examining the distribution of all PBPs to select thecut-off with pretty much the same level of specificity thatwas achieved by the p-value cut-off. Cluster size of 10 wassomewhat ad-hoc cut-off aimed at getting reasonable levelof statistical power to detect significant Gene Ontologiescorrelating with TMs.
It is important to emphasize that ROC curves presentedbefore are completely independent of these thresholdselections. These thresholds are only used when finallyconstructing TM's based on the posterior distribution gen-erated by the Gibbs sampler. ROC's are designed to sys-tematically compare true and false positive results usingall possible ways to automatically construct TM's from theGibbs sampler output.
AbbreviationsContext Specific Infinite Mixture Model (CSIMM)
Transcription Factor (TF)
Transcriptional Module (TM)
Position Weight Matrix (PWM)
Receiver Operating Characteristic (ROC)
true positive rate (TPR)
false positive rate (FPR)
Chromatin Immuno-Precipitation on Chip (ChIP-chip)
Posterior Pairwise Probabilities (PPP)
Posterior Binding Probabilities (PBP)
Expression-ChIP Infinite Mixture (ECIM)
Availability and requirementsWe have implemented ECIM algorithm within the R pack-age gimmR which can be downloaded our website http://eh3.uc.edu/gimm.
Authors' contributionsXL developed the statistical model, wrote appropriatecomputer programs, performed all analyses, interpretedresults and drafted the manuscript. MM conceived themethodology and provided guidance in the development,design, analysis, interpretation of results, and drafting ofthe manuscript, and SS contributed to the statisticaldetails of the method. WJJ assisted with interpretation ofidentified TMs and BJA provided overall guidance on bio-logical interpretation of results.
Additional material
Additional file 1Liu-et-al-TranscriptionalModuleDiscovery-WebSupplement4.doc. Addi-tional data analysis results and remaining prior and posterior conditional probability distribution formulas.Click here for file[http://www.biomedcentral.com/content/supplementary/1471-2105-8-283-S1.xls]
Additional file 2SupplementalTable1_GRAM_parameters.xls. lists of GRAM's parameters and corresponding true and false positive rates.Click here for file[http://www.biomedcentral.com/content/supplementary/1471-2105-8-283-S2.xls]
Additional file 3SupplementalTable2_SAMBA_parameters.xls. lists of SAMBA's parame-ters and corresponding true and false positive rates.Click here for file[http://www.biomedcentral.com/content/supplementary/1471-2105-8-283-S3.xls]
Additional file 4SupplementalTable3_GRAM_ECIM_GO.xls. The comparison of TMs generated by GRAM and ECIM using the Sporulation-CellCycle expres-sion datasets used in Figures 2.Click here for file[http://www.biomedcentral.com/content/supplementary/1471-2105-8-283-S4.xls]
Additional file 5SupplementalTable4_TMs.xls. Details of all Sporulation-CellCycle mod-ules depicted in Figures 7 and 8B in the main text.Click here for file[http://www.biomedcentral.com/content/supplementary/1471-2105-8-283-S5.xls]
Page 18 of 20(page number not for citation purposes)

BMC Bioinformatics 2007, 8:283 http://www.biomedcentral.com/1471-2105/8/283
AcknowledgementsThe development of models and algorithms presented here was supported by the grant 1R03LM008248 from National Library of Medicine and the grant 1R01HG003749 from the National Human Genome Research Insti-tute.
References1. Puga A, Maier A, Medvedovic M: The transcriptional signature of
dioxin in human hepatoma HepG2 cells. Biochem Pharmacol2000, 60(8):1129-1142.
2. Buyse M, Loi S, van't Veer L, Viale G, Delorenzi M, Glas AM, d'Assig-nies MS, Bergh J, Lidereau R, Ellis P, Harris A, Bogaerts J, Therasse P,Floore A, Amakrane M, Piette F, Rutgers E, Sotiriou C, Cardoso F,Piccart MJ: Validation and clinical utility of a 70-gene prognos-tic signature for women with node-negative breast cancer. JNatl Cancer Inst 2006, 98(17):1183-1192.
3. Locker J: Transcription Factors. San Diego , Academic Press;2001.
4. DeRisi JL, Iyer VR, Brown PO: Exploring the metabolic andgenetic control of gene expression on a genomic scale. Sci-ence 1997, 278(5338):680-686.
5. Hughes TR, Mao M, Jones AR, Burchard J, Marton MJ, Shannon KW,Lefkowitz SM, Ziman M, Schelter JM, Meyer MR, Kobayashi S, DavisC, Dai H, He YD, Stephaniants SB, Cavet G, Walker WL, West A,Coffey E, Shoemaker DD, Stoughton R, Blanchard AP, Friend SH, Lin-sley PS: Expression profiling using microarrays fabricated byan ink-jet oligonucleotide synthesizer. Nat Biotechnol 2001,19(4):342-347.
6. Lee TI, Rinaldi NJ, Robert F, Odom DT, Bar-Joseph Z, Gerber GK,Hannett NM, Harbison CT, Thompson CM, Simon I, Zeitlinger J, Jen-nings EG, Murray HL, Gordon DB, Ren B, Wyrick JJ, Tagne JB, VolkertTL, Fraenkel E, Gifford DK, Young RA: Transcriptional regulatorynetworks in Saccharomyces cerevisiae. Science 2002,298(5594):799-804.
7. Ren B, Robert F, Wyrick JJ, Aparicio O, Jennings EG, Simon I, Zeitlin-ger J, Schreiber J, Hannett N, Kanin E, Volkert TL, Wilson CJ, Bell SP,Young RA: Genome-wide location and function of DNA bind-ing proteins. Science 2000, 290(5500):2306-2309.
8. Chu S, DeRisi J, Eisen M, Mulholland J, Botstein D, Brown PO, Her-skowitz I: The transcriptional program of sporulation in bud-ding yeast. Science 1998, 282(5389):699-705.
9. Bailey TL, Elkan C: Unsupervised Learning of Multiple Motifs inBiopolymers Using Expectation Maximization. Machine Learn-ing 1995, 21:51-80.
10. Bar-Joseph Z, Gerber GK, Lee TI, Rinaldi NJ, Yoo JY, Robert F, Gor-don DB, Fraenkel E, Jaakkola TS, Young RA, Gifford DK: Computa-tional discovery of gene modules and regulatory networks.Nat Biotechnol 2003, 21(11):1337-1342.
11. Lemmens K, Dhollander T, De Bie T, Monsieurs P, Engelen K, SmetsB, Winderickx J, De Moor B, Marchal K: Inferring transcriptionalmodules from ChIP-chip, motif and microarray data. GenomeBiol 2006, 7(5):R37.
12. Wu WS, Li WH, Chen BS: Computational reconstruction oftranscriptional regulatory modules of the yeast cell cycle.BMC Bioinformatics 2006, 7:421.
13. Tanay A, Sharan R, Kupiec M, Shamir R: Revealing modularity andorganization in the yeast molecular network by integratedanalysis of highly heterogeneous genomewide data. Proc NatlAcad Sci U S A 2004, 101(9):2981-2986.
14. Segal E, Yelensky R, Koller D: Genome-wide discovery of tran-scriptional modules from DNA sequence and gene expres-sion. Bioinformatics 2003, 19 Suppl 1:i273-82.
15. Xu X, Wang L, Ding D: Learning module networks fromgenome-wide location and expression data. FEBS Lett 2004,578(3):297-304.
16. Segal E, Shapira M, Regev A, Pe'er D, Botstein D, Koller D, FriedmanN: Module networks: identifying regulatory modules andtheir condition-specific regulators from gene expressiondata. Nat Genet 2003, 34(2):166-176.
17. Medvedovic M, Sivaganesan S: Bayesian infinite mixture modelbased clustering of gene expression profiles. Bioinformatics2002, 18(9):1194-1206.
18. Medvedovic M, Yeung KY, Bumgarner RE: Bayesian mixturemodel based clustering of replicated microarray data. Bioin-formatics 2004, 20(8):1222-1232.
19. Hartemink AJ: combining location and expression data forprincipled discovery of genetic regulatory network models.Pacific Symposium on Biocomputing 2002.
20. Chen G, Jensen ST, Stoeckert CJ Jr.: Clustering of genes into reg-ulons using integrated modeling-COGRIM. Genome Biol 2007,8(1):R4.
21. Liu X, Sivaganesan S, Yeung KY, Guo J, Bumgarner RE, Medvedovic M:Context-specific infinite mixture for clustering gene expres-sion profiles across diverse microarray dataset. Bioinformatics2006, In Press:.
22. Gelfand EA, Smith FMA: Sampling-Based Approaches to Calcu-lating Marginal Densities. Journal of The American Statistical Associ-ation 1990, 85:398-409.
23. Primig M, Williams RM, Winzeler EA, Tevzadze GG, Conway AR,Hwang SY, Davis RW, Esposito RE: The core meiotic transcrip-tome in budding yeasts. Nat Genet 2000, 26(4):415-423.
24. Cho RJ, Campbell MJ, Winzeler EA, Steinmetz L, Conway A, WodickaL, Wolfsberg TG, Gabrielian AE, Landsman D, Lockhart DJ, DavisRW: A genome-wide transcriptional analysis of the mitoticcell cycle. Mol Cell 1998, 2(1):65-73.
25. Kanehisa M, Goto S, Kawashima S, Okuno Y, Hattori M: The KEGGresource for deciphering the genome. Nucleic Acids Res 2004,32(Database issue):D277-80.
26. Ashburner M, Ball CA, Blake JA, Botstein D, Butler H, Cherry JM,Davis AP, Dolinski K, Dwight SS, Eppig JT, Harris MA, Hill DP, Issel-Tarver L, Kasarskis A, Lewis S, Matese JC, Richardson JE, Ringwald M,Rubin GM, Sherlock G: Gene ontology: tool for the unificationof biology. The Gene Ontology Consortium. Nat Genet 2000,25(1):25-29.
27. Guldener U, Munsterkotter M, Kastenmuller G, Strack N, van HeldenJ, Lemer C, Richelles J, Wodak SJ, Garcia-Martinez J, Perez-Ortin JE,Michael H, Kaps A, Talla E, Dujon B, Andre B, Souciet JL, De MontignyJ, Bon E, Gaillardin C, Mewes HW: CYGD: the ComprehensiveYeast Genome Database. Nucleic Acids Res 2005, 33(Databaseissue):D364-8.
28. Gasch AP, Spellman PT, Kao CM, Carmel-Harel O, Eisen MB, StorzG, Botstein D, Brown PO: Genomic expression programs in theresponse of yeast cells to environmental changes. Mol Biol Cell2000, 11(12):4241-4257.
29. Ihmels J, Bergmann S, Barkai N: Defining transcription modulesusing large-scale gene expression data. Bioinformatics 2004,20(13):1993-2003.
30. Guo X, Liu R, Shriver CD, Hu H, Liebman MN: Assessing semanticsimilarity measures for the characterization of human regu-latory pathways. Bioinformatics 2006, 22(8):967-973.
31. Wingender E, Chen X, Fricke E, Geffers R, Hehl R, Liebich I, Krull M,Matys V, Michael H, Ohnhauser R, Pruss M, Schacherer F, Thiele S,Urbach S: The TRANSFAC system on gene expression regu-lation. Nucleic Acids Res 2001, 29(1):281-283.
32. Xie J, Pierce M, Gailus-Durner V, Wagner M, Winter E, Vershon AK:Sum1 and Hst1 repress middle sporulation-specific geneexpression during mitosis in Saccharomyces cerevisiae.Embo J 1999, 18(22):6448-6454.
33. Greenberg ML, Lopes JM: Genetic regulation of phospholipidbiosynthesis in Saccharomyces cerevisiae. Microbiol Rev 1996,60(1):1-20.
34. Koipally J, Ashburner BP, Bachhawat N, Gill T, Hung G, Henry SA,Lopes JM: Functional characterization of the repeatedUASINO element in the promoters of the INO1 and CHO2genes of yeast. Yeast 1996, 12(7):653-665.
Additional file 6SupplementalTable5_TMs_Harbinson.xls. Details of all Sporulation-Cell-Cycle modules Identified using Sporulation-CellCycle dataset and the Harbinson ChIP-chip dataset[60].Click here for file[http://www.biomedcentral.com/content/supplementary/1471-2105-8-283-S6.doc]
Page 19 of 20(page number not for citation purposes)
http://www.ncbi.nlm.nih.gov/entrez/query.fcgi?cmd=Retrieve&db=PubMed&dopt=Abstract&list_uids=9381177
http://www.ncbi.nlm.nih.gov/entrez/query.fcgi?cmd=Retrieve&db=PubMed&dopt=Abstract&list_uids=9381177
http://www.ncbi.nlm.nih.gov/entrez/query.fcgi?cmd=Retrieve&db=PubMed&dopt=Abstract&list_uids=9784122
http://www.ncbi.nlm.nih.gov/entrez/query.fcgi?cmd=Retrieve&db=PubMed&dopt=Abstract&list_uids=9784122
http://www.ncbi.nlm.nih.gov/entrez/query.fcgi?cmd=Retrieve&db=PubMed&dopt=Abstract&list_uids=9702192
http://www.ncbi.nlm.nih.gov/entrez/query.fcgi?cmd=Retrieve&db=PubMed&dopt=Abstract&list_uids=9702192
http://www.ncbi.nlm.nih.gov/entrez/query.fcgi?cmd=Retrieve&db=PubMed&dopt=Abstract&list_uids=8852893
http://www.ncbi.nlm.nih.gov/entrez/query.fcgi?cmd=Retrieve&db=PubMed&dopt=Abstract&list_uids=8852893
http://www.ncbi.nlm.nih.gov/entrez/query.fcgi?cmd=Retrieve&db=PubMed&dopt=Abstract&list_uids=8810039
http://www.ncbi.nlm.nih.gov/entrez/query.fcgi?cmd=Retrieve&db=PubMed&dopt=Abstract&list_uids=8810039
BMC Bioinformatics 2007, 8:283 http://www.biomedcentral.com/1471-2105/8/283
Publish with BioMed Central and every scientist can read your work free of charge
"BioMed Central will be the most significant development for disseminating the results of biomedical research in our lifetime."
Sir Paul Nurse, Cancer Research UK
Your research papers will be:
available free of charge to the entire biomedical community
peer reviewed and published immediately upon acceptance
cited in PubMed and archived on PubMed Central
yours — you keep the copyright
Submit your manuscript here:http://www.biomedcentral.com/info/publishing_adv.asp
BioMedcentral
35. Courchesne WE, Magasanik B: Regulation of nitrogen assimila-tion in Saccharomyces cerevisiae: roles of the URE2 andGLN3 genes. J Bacteriol 1988, 170(2):708-713.
36. Gardocki ME, Jani N, Lopes JM: Phosphatidylinositol biosynthe-sis: biochemistry and regulation. Biochim Biophys Acta 2005,1735(2):89-100.
37. Schroeder R, Breitenbach M: Metabolism of myo-inositol duringsporulation of myo-inositol-requiring Saccharomyces cerevi-siae. J Bacteriol 1981, 146(2):775-783.
38. Yamaguchi-Iwai Y, Dancis A, Klausner RD: AFT1: a mediator ofiron regulated transcriptional control in Saccharomyces cer-evisiae. Embo J 1995, 14(6):1231-1239.
39. Gil R, Zueco J, Sentandreu R, Herrero E: RCS1, a gene involved incontrolling cell size in Saccharomyces cerevisiae. Yeast 1991,7(1):1-14.
40. Shakoury-Elizeh M, Tiedeman J, Rashford J, Ferea T, Demeter J, Gar-cia E, Rolfes R, Brown PO, Botstein D, Philpott CC: Transcriptionalremodeling in response to iron deprivation in Saccharomy-ces cerevisiae. Mol Biol Cell 2004, 15(3):1233-1243.
41. Spellman PT, Sherlock G, Zhang MQ, Iyer VR, Anders K, Eisen MB,Brown PO, Botstein D, Futcher B: Comprehensive identificationof cell cycle-regulated genes of the yeast Saccharomyces cer-evisiae by microarray hybridization. Mol Biol Cell 1998,9(12):3273-3297.
42. Hermann-Le Denmat S, Werner M, Sentenac A, Thuriaux P: Sup-pression of yeast RNA polymerase III mutations by FHL1, agene coding for a fork head protein involved in rRNAprocessing. Mol Cell Biol 1994, 14(5):2905-2913.
43. Lieb JD, Liu X, Botstein D, Brown PO: Promoter-specific bindingof Rap1 revealed by genome-wide maps of protein-DNAassociation. Nat Genet 2001, 28(4):327-334.
44. Horak CE, Luscombe NM, Qian J, Bertone P, Piccirrillo S, Gerstein M,Snyder M: Complex transcriptional circuitry at the G1/S tran-sition in Saccharomyces cerevisiae. Genes Dev 2002,16(23):3017-3033.
45. Akache B, MacPherson S, Sylvain MA, Turcotte B: Complex inter-play among regulators of drug resistance genes in Saccharo-myces cerevisiae. J Biol Chem 2004, 279(27):27855-27860.
46. Dang VD, Valens M, Bolotin-Fukuhara M, Daignan-Fornier B: Clon-ing of the ASN1 and ASN2 genes encoding asparagine syn-thetases in Saccharomyces cerevisiae: differential regulationby the CCAAT-box-binding factor. Mol Microbiol 1996,22(4):681-692.
47. Dranginis AM: Binding of yeast a1 and alpha 2 as a het-erodimer to the operator DNA of a haploid-specific gene.Nature 1990, 347(6294):682-685.
48. Koch C, Moll T, Neuberg M, Ahorn H, Nasmyth K: A role for thetranscription factors Mbp1 and Swi4 in progression from G1to S phase. Science 1993, 261(5128):1551-1557.
49. Dirick L, Moll T, Auer H, Nasmyth K: A central role for SWI6 inmodulating cell cycle Start-specific transcription in yeast.Nature 1992, 357(6378):508-513.
50. Raitt DC, Johnson AL, Erkine AM, Makino K, Morgan B, Gross DS,Johnston LH: The Skn7 response regulator of Saccharomycescerevisiae interacts with Hsf1 in vivo and is required for theinduction of heat shock genes by oxidative stress. Mol Biol Cell2000, 11(7):2335-2347.
51. Bouquin N, Johnson AL, Morgan BA, Johnston LH: Association ofthe cell cycle transcription factor Mbp1 with the Skn7response regulator in budding yeast. Mol Biol Cell 1999,10(10):3389-3400.
52. Ho Y, Costanzo M, Moore L, Kobayashi R, Andrews BJ: Regulationof transcription at the Saccharomyces cerevisiae start tran-sition by Stb1, a Swi6-binding protein. Mol Cell Biol 1999,19(8):5267-5278.
53. Althoefer H, Schleiffer A, Wassmann K, Nordheim A, Ammerer G:Mcm1 is required to coordinate G2-specific transcription inSaccharomyces cerevisiae. Mol Cell Biol 1995, 15(11):5917-5928.
54. Loy CJ, Lydall D, Surana U: NDD1, a high-dosage suppressor ofcdc28-1N, is essential for expression of a subset of late-S-phase-specific genes in Saccharomyces cerevisiae. Mol Cell Biol1999, 19(5):3312-3327.
55. Hollenhorst PC, Bose ME, Mielke MR, Muller U, Fox CA: Forkheadgenes in transcriptional silencing, cell morphology and thecell cycle. Overlapping and distinct functions for FKH1 and
FKH2 in Saccharomyces cerevisiae. Genetics 2000,154(4):1533-1548.
56. McBride HJ, Yu Y, Stillman DJ: Distinct regions of the Swi5 andAce2 transcription factors are required for specific gene acti-vation. J Biol Chem 1999, 274(30):21029-21036.
57. Singer MS, Kahana A, Wolf AJ, Meisinger LL, Peterson SE, Goggin C,Mahowald M, Gottschling DE: Identification of high-copy disrup-tors of telomeric silencing in Saccharomyces cerevisiae.Genetics 1998, 150(2):613-632.
58. Lorenz MC, Heitman J: Regulators of pseudohyphal differentia-tion in Saccharomyces cerevisiae identified through multi-copy suppressor analysis in ammonium permease mutantstrains. Genetics 1998, 150(4):1443-1457.
59. Chandarlapaty S, Errede B: Ash1, a daughter cell-specific pro-tein, is required for pseudohyphal growth of Saccharomycescerevisiae. Mol Cell Biol 1998, 18(5):2884-2891.
60. Harbison CT, Gordon DB, Lee TI, Rinaldi NJ, Macisaac KD, DanfordTW, Hannett NM, Tagne JB, Reynolds DB, Yoo J, Jennings EG, Zei-tlinger J, Pokholok DK, Kellis M, Rolfe PA, Takusagawa KT, Lander ES,Gifford DK, Fraenkel E, Young RA: Transcriptional regulatorycode of a eukaryotic genome. Nature 2004, 431(7004):99-104.
61. Gelman A, Carlin JC, Stern HS, Rubin DB: Bayesian Data Analysis.New York , CRC Press; 2003.
62. Cowell RG, Dawid PA, Lauritzen SL, Spiegelhalter DJ: ProbabilisticNetworks and Expert Systems . New York , Springer; 1999.
63. Rasmussen CA: The Infinite Gaussian Mixture Model. Advancesin Neural Information Processing Systems 2000, 12:554-560.
64. Celeux G, Hurn M, Robert CP: Computational and InferentialDifficulties With Mixture Posterior Distributions. JASA 2000,95:957-970.
65. Stephens M: Dealing With Label Switching in Mixture Models.Journal of the Royal Statistical Society 2000, Series B 62:795-809.
Page 20 of 20(page number not for citation purposes)
http://www.ncbi.nlm.nih.gov/entrez/query.fcgi?cmd=Retrieve&db=PubMed&dopt=Abstract&list_uids=2892826
http://www.ncbi.nlm.nih.gov/entrez/query.fcgi?cmd=Retrieve&db=PubMed&dopt=Abstract&list_uids=2892826
http://www.ncbi.nlm.nih.gov/entrez/query.fcgi?cmd=Retrieve&db=PubMed&dopt=Abstract&list_uids=2892826
http://www.ncbi.nlm.nih.gov/entrez/query.fcgi?cmd=Retrieve&db=PubMed&dopt=Abstract&list_uids=7012138
http://www.ncbi.nlm.nih.gov/entrez/query.fcgi?cmd=Retrieve&db=PubMed&dopt=Abstract&list_uids=7012138
http://www.ncbi.nlm.nih.gov/entrez/query.fcgi?cmd=Retrieve&db=PubMed&dopt=Abstract&list_uids=7012138
http://www.ncbi.nlm.nih.gov/entrez/query.fcgi?cmd=Retrieve&db=PubMed&dopt=Abstract&list_uids=7720713
http://www.ncbi.nlm.nih.gov/entrez/query.fcgi?cmd=Retrieve&db=PubMed&dopt=Abstract&list_uids=7720713
http://www.ncbi.nlm.nih.gov/entrez/query.fcgi?cmd=Retrieve&db=PubMed&dopt=Abstract&list_uids=7720713
http://www.ncbi.nlm.nih.gov/entrez/query.fcgi?cmd=Retrieve&db=PubMed&dopt=Abstract&list_uids=2021081
http://www.ncbi.nlm.nih.gov/entrez/query.fcgi?cmd=Retrieve&db=PubMed&dopt=Abstract&list_uids=2021081
http://www.ncbi.nlm.nih.gov/entrez/query.fcgi?cmd=Retrieve&db=PubMed&dopt=Abstract&list_uids=9843569
http://www.ncbi.nlm.nih.gov/entrez/query.fcgi?cmd=Retrieve&db=PubMed&dopt=Abstract&list_uids=9843569
http://www.ncbi.nlm.nih.gov/entrez/query.fcgi?cmd=Retrieve&db=PubMed&dopt=Abstract&list_uids=9843569
http://www.ncbi.nlm.nih.gov/entrez/query.fcgi?cmd=Retrieve&db=PubMed&dopt=Abstract&list_uids=8164651
http://www.ncbi.nlm.nih.gov/entrez/query.fcgi?cmd=Retrieve&db=PubMed&dopt=Abstract&list_uids=8164651
http://www.ncbi.nlm.nih.gov/entrez/query.fcgi?cmd=Retrieve&db=PubMed&dopt=Abstract&list_uids=8164651
http://www.ncbi.nlm.nih.gov/entrez/query.fcgi?cmd=Retrieve&db=PubMed&dopt=Abstract&list_uids=8951815
http://www.ncbi.nlm.nih.gov/entrez/query.fcgi?cmd=Retrieve&db=PubMed&dopt=Abstract&list_uids=8951815
http://www.ncbi.nlm.nih.gov/entrez/query.fcgi?cmd=Retrieve&db=PubMed&dopt=Abstract&list_uids=8951815
http://www.ncbi.nlm.nih.gov/entrez/query.fcgi?cmd=Retrieve&db=PubMed&dopt=Abstract&list_uids=1977088
http://www.ncbi.nlm.nih.gov/entrez/query.fcgi?cmd=Retrieve&db=PubMed&dopt=Abstract&list_uids=1977088
http://www.ncbi.nlm.nih.gov/entrez/query.fcgi?cmd=Retrieve&db=PubMed&dopt=Abstract&list_uids=8372350
http://www.ncbi.nlm.nih.gov/entrez/query.fcgi?cmd=Retrieve&db=PubMed&dopt=Abstract&list_uids=8372350
http://www.ncbi.nlm.nih.gov/entrez/query.fcgi?cmd=Retrieve&db=PubMed&dopt=Abstract&list_uids=8372350
http://www.ncbi.nlm.nih.gov/entrez/query.fcgi?cmd=Retrieve&db=PubMed&dopt=Abstract&list_uids=1608451
http://www.ncbi.nlm.nih.gov/entrez/query.fcgi?cmd=Retrieve&db=PubMed&dopt=Abstract&list_uids=1608451
http://www.ncbi.nlm.nih.gov/entrez/query.fcgi?cmd=Retrieve&db=PubMed&dopt=Abstract&list_uids=7565744
http://www.ncbi.nlm.nih.gov/entrez/query.fcgi?cmd=Retrieve&db=PubMed&dopt=Abstract&list_uids=7565744
http://www.ncbi.nlm.nih.gov/entrez/query.fcgi?cmd=Retrieve&db=PubMed&dopt=Abstract&list_uids=7565744
http://www.ncbi.nlm.nih.gov/entrez/query.fcgi?cmd=Retrieve&db=PubMed&dopt=Abstract&list_uids=9755194
http://www.ncbi.nlm.nih.gov/entrez/query.fcgi?cmd=Retrieve&db=PubMed&dopt=Abstract&list_uids=9755194
http://www.ncbi.nlm.nih.gov/entrez/query.fcgi?cmd=Retrieve&db=PubMed&dopt=Abstract&list_uids=9832522
http://www.ncbi.nlm.nih.gov/entrez/query.fcgi?cmd=Retrieve&db=PubMed&dopt=Abstract&list_uids=9832522
http://www.ncbi.nlm.nih.gov/entrez/query.fcgi?cmd=Retrieve&db=PubMed&dopt=Abstract&list_uids=9832522
http://www.ncbi.nlm.nih.gov/entrez/query.fcgi?cmd=Retrieve&db=PubMed&dopt=Abstract&list_uids=9566907
http://www.ncbi.nlm.nih.gov/entrez/query.fcgi?cmd=Retrieve&db=PubMed&dopt=Abstract&list_uids=9566907
Related Documents