GAS COMPANIES The Commonwealth of Massachusetts RETURN OF THE BAY STATE GAS COMPANY d/b/a COLUMBIA GAS OF MASSACHUSETTS TO THE DEPARTMENT OF PUBLIC UTILITIES OF MASSACHUSETTS FOR THE YEAR ENDED DECEMBER 31, 2017

Welcome message from author
This document is posted to help you gain knowledge. Please leave a comment to let me know what you think about it! Share it to your friends and learn new things together.
Transcript
GAS COMPANIES
The Commonwealth of Massachusetts
RETURN
OF THE
BAY STATE GAS COMPANY d/b/a COLUMBIA GAS OF MASSACHUSETTS
TO THE
DEPARTMENT OF PUBLIC UTILITIES
OF MASSACHUSETTS
FOR THE YEAR ENDED DECEMBER 31,
2017

THIS PAGE INTENTIONALLY LEFT BLANK
C1
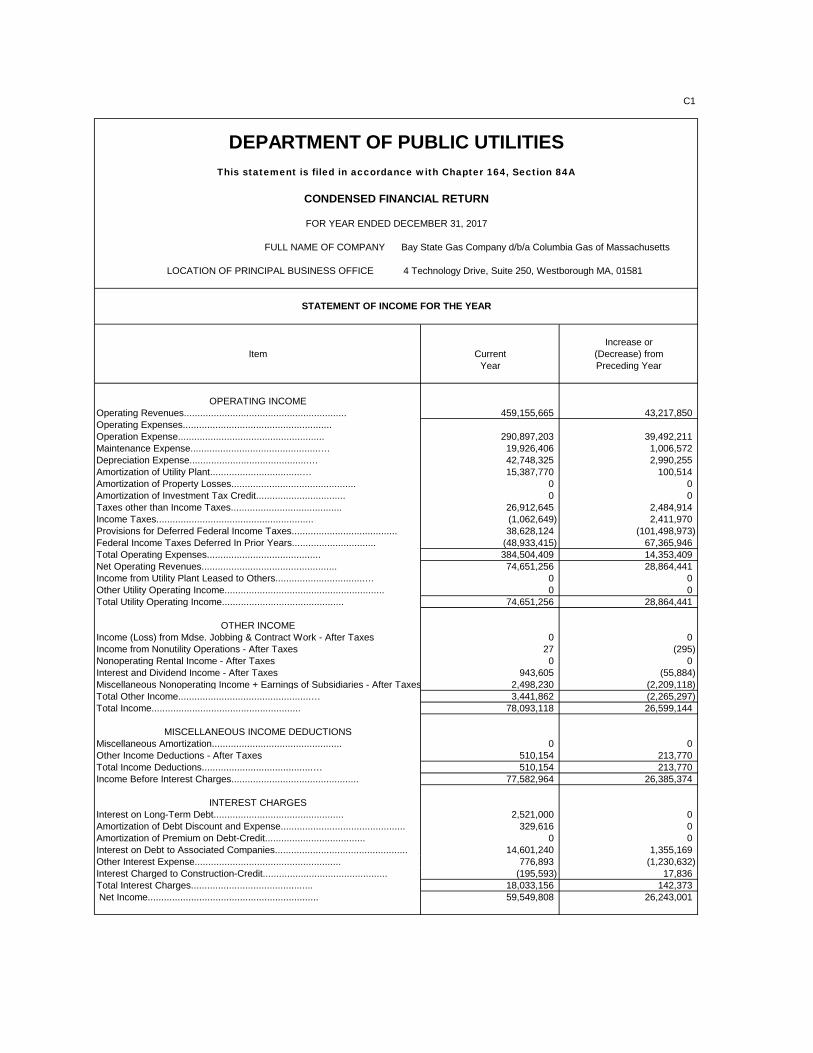
DEPARTMENT OF PUBLIC UTILITIESThis statement is filed in accordance with Chapter 164, Section 84A
CONDENSED FINANCIAL RETURN
FOR YEAR ENDED DECEMBER 31, 2017
FULL NAME OF COMPANY Bay State Gas Company d/b/a Columbia Gas of Massachusetts
LOCATION OF PRINCIPAL BUSINESS OFFICE 4 Technology Drive, Suite 250, Westborough MA, 01581
STATEMENT OF INCOME FOR THE YEAR
Increase orItem Current (Decrease) from
Year Preceding Year
OPERATING INCOMEOperating Revenues............................................................ 459,155,665 43,217,850Operating Expenses.......................................................Operation Expense...................................................... 290,897,203 39,492,211Maintenance Expense................................................… 19,926,406 1,006,572Depreciation Expense............................................… 42,748,325 2,990,255Amortization of Utility Plant..................................… 15,387,770 100,514Amortization of Property Losses.............................................. 0 0Amortization of Investment Tax Credit................................. 0 0Taxes other than Income Taxes......................................... 26,912,645 2,484,914Income Taxes.......................................................... (1,062,649) 2,411,970Provisions for Deferred Federal Income Taxes....................................... 38,628,124 (101,498,973)Federal Income Taxes Deferred In Prior Years............................... (48,933,415) 67,365,946Total Operating Expenses.......................................... 384,504,409 14,353,409Net Operating Revenues.................................................. 74,651,256 28,864,441Income from Utility Plant Leased to Others.................................… 0 0Other Utility Operating Income........................................................... 0 0Total Utility Operating Income............................................. 74,651,256 28,864,441
OTHER INCOMEIncome (Loss) from Mdse. Jobbing & Contract Work - After Taxes 0 0Income from Nonutility Operations - After Taxes 27 (295)Nonoperating Rental Income - After Taxes 0 0Interest and Dividend Income - After Taxes 943,605 (55,884)Miscellaneous Nonoperating Income + Earnings of Subsidiaries - After Taxes 2,498,230 (2,209,118)Total Other Income.................................................… 3,441,862 (2,265,297)Total Income....................................................... 78,093,118 26,599,144
MISCELLANEOUS INCOME DEDUCTIONSMiscellaneous Amortization................................................ 0 0Other Income Deductions - After Taxes 510,154 213,770Total Income Deductions.........................................… 510,154 213,770Income Before Interest Charges............................................... 77,582,964 26,385,374
INTEREST CHARGESInterest on Long-Term Debt................................................ 2,521,000 0Amortization of Debt Discount and Expense.............................................. 329,616 0Amortization of Premium on Debt-Credit..................................... 0 0Interest on Debt to Associated Companies................................................. 14,601,240 1,355,169Other Interest Expense...................................................... 776,893 (1,230,632)Interest Charged to Construction-Credit.............................................. (195,593) 17,836Total Interest Charges............................................. 18,033,156 142,373 Net Income............................................................... 59,549,808 26,243,001
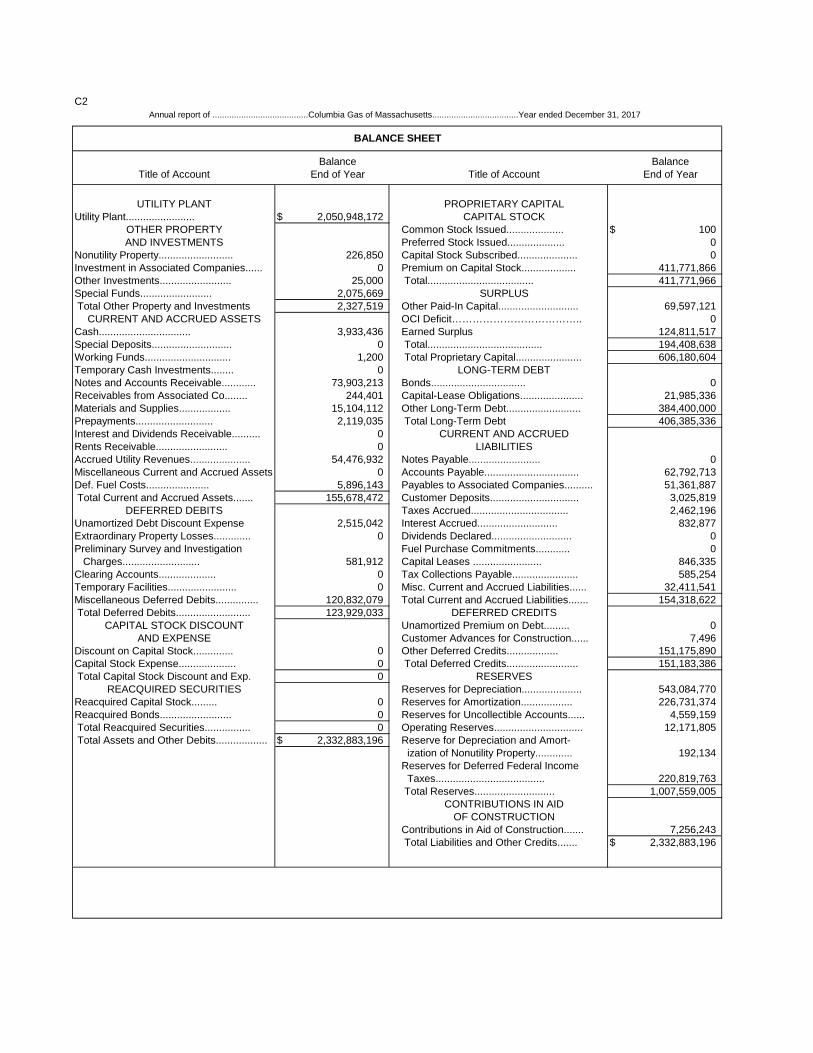
C2Annual report of ........................................Columbia Gas of Massachusetts....................................Year ended December 31, 2017
BALANCE SHEET
Balance BalanceTitle of Account End of Year Title of Account End of Year
UTILITY PLANT PROPRIETARY CAPITALUtility Plant........................ $ 2,050,948,172 CAPITAL STOCK
OTHER PROPERTY Common Stock Issued.................... $ 100AND INVESTMENTS Preferred Stock Issued.................... 0
Nonutility Property.......................... 226,850 Capital Stock Subscribed..................... 0Investment in Associated Companies...... 0 Premium on Capital Stock................... 411,771,866Other Investments......................... 25,000 Total..................................... 411,771,966Special Funds......................... 2,075,669 SURPLUS Total Other Property and Investments 2,327,519 Other Paid-In Capital............................ 69,597,121
CURRENT AND ACCRUED ASSETS OCI Deficit……………………………….. 0Cash................................ 3,933,436 Earned Surplus 124,811,517Special Deposits............................ 0 Total........................................ 194,408,638Working Funds.............................. 1,200 Total Proprietary Capital....................... 606,180,604Temporary Cash Investments........ 0 LONG-TERM DEBTNotes and Accounts Receivable............ 73,903,213 Bonds................................. 0Receivables from Associated Co........ 244,401 Capital-Lease Obligations...................... 21,985,336Materials and Supplies.................. 15,104,112 Other Long-Term Debt.......................... 384,400,000Prepayments........................... 2,119,035 Total Long-Term Debt 406,385,336Interest and Dividends Receivable.......... 0 CURRENT AND ACCRUEDRents Receivable......................... 0 LIABILITIESAccrued Utility Revenues..................... 54,476,932 Notes Payable......................... 0Miscellaneous Current and Accrued Assets 0 Accounts Payable................................. 62,792,713Def. Fuel Costs...................... 5,896,143 Payables to Associated Companies.......... 51,361,887 Total Current and Accrued Assets....... 155,678,472 Customer Deposits............................... 3,025,819
DEFERRED DEBITS Taxes Accrued.................................. 2,462,196Unamortized Debt Discount Expense 2,515,042 Interest Accrued............................ 832,877Extraordinary Property Losses............. 0 Dividends Declared............................ 0Preliminary Survey and Investigation Fuel Purchase Commitments............ 0 Charges........................... 581,912 Capital Leases ........................ 846,335Clearing Accounts.................... 0 Tax Collections Payable....................... 585,254Temporary Facilities........................ 0 Misc. Current and Accrued Liabilities...... 32,411,541Miscellaneous Deferred Debits............... 120,832,079 Total Current and Accrued Liabilities....... 154,318,622 Total Deferred Debits.......................... 123,929,033 DEFERRED CREDITS
CAPITAL STOCK DISCOUNT Unamortized Premium on Debt......... 0AND EXPENSE Customer Advances for Construction...... 7,496
Discount on Capital Stock.............. 0 Other Deferred Credits.................. 151,175,890Capital Stock Expense.................... 0 Total Deferred Credits......................... 151,183,386 Total Capital Stock Discount and Exp. 0 RESERVES
REACQUIRED SECURITIES Reserves for Depreciation..................... 543,084,770Reacquired Capital Stock......... 0 Reserves for Amortization.................. 226,731,374Reacquired Bonds......................... 0 Reserves for Uncollectible Accounts...... 4,559,159 Total Reacquired Securities................ 0 Operating Reserves............................... 12,171,805 Total Assets and Other Debits.................. $ 2,332,883,196 Reserve for Depreciation and Amort-
ization of Nonutility Property............. 192,134Reserves for Deferred Federal Income Taxes...................................... 220,819,763 Total Reserves............................ 1,007,559,005
CONTRIBUTIONS IN AIDOF CONSTRUCTION
Contributions in Aid of Construction....... 7,256,243 Total Liabilities and Other Credits....... $ 2,332,883,196
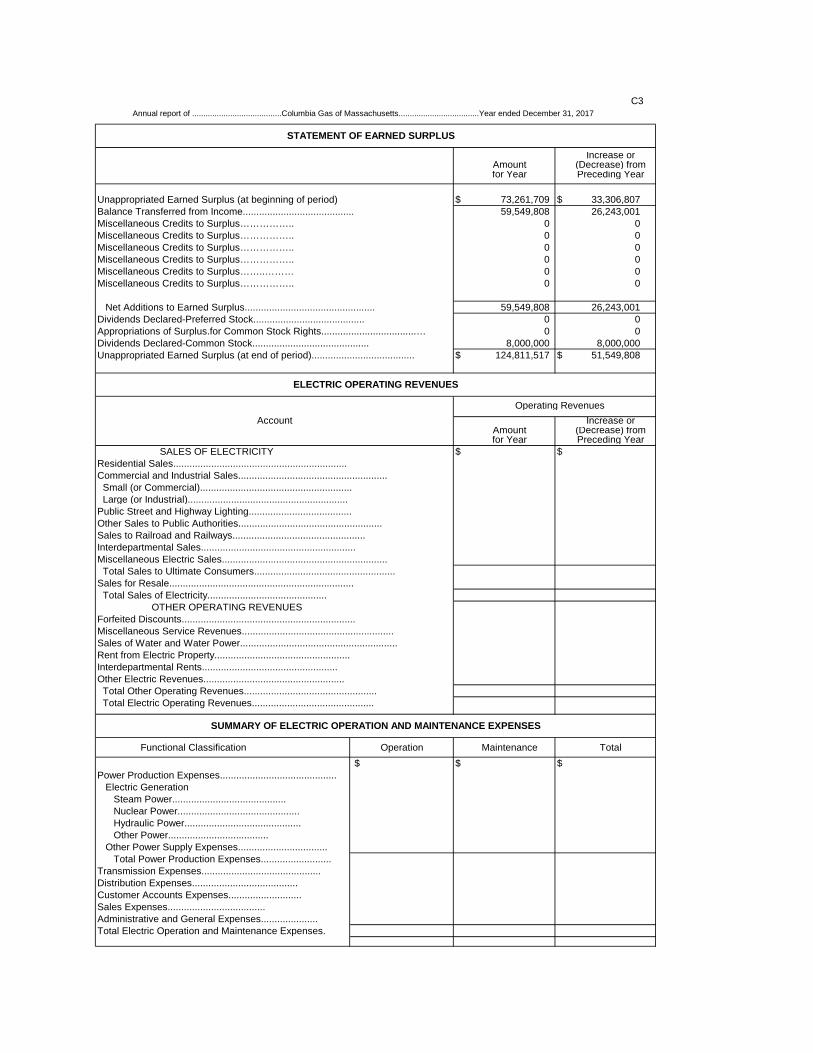
C3 Annual report of ........................................Columbia Gas of Massachusetts....................................Year ended December 31, 2017
STATEMENT OF EARNED SURPLUS
Increase orAmount (Decrease) fromfor Year Preceding Year
Unappropriated Earned Surplus (at beginning of period) $ 73,261,709 $ 33,306,807Balance Transferred from Income......................................... 59,549,808 26,243,001Miscellaneous Credits to Surplus…………….. 0 0Miscellaneous Credits to Surplus…………….. 0 0Miscellaneous Credits to Surplus…………….. 0 0Miscellaneous Credits to Surplus…………….. 0 0Miscellaneous Credits to Surplus……..……… 0 0Miscellaneous Credits to Surplus…………….. 0 0
Net Additions to Earned Surplus................................................ 59,549,808 26,243,001Dividends Declared-Preferred Stock......................................... 0 0Appropriations of Surplus.for Common Stock Rights...................................… 0 0Dividends Declared-Common Stock........................................... 8,000,000 8,000,000Unappropriated Earned Surplus (at end of period)...................................... $ 124,811,517 $ 51,549,808
ELECTRIC OPERATING REVENUES
Operating RevenuesAccount Increase or
Amount (Decrease) fromfor Year Preceding Year
SALES OF ELECTRICITY $ $Residential Sales................................................................Commercial and Industrial Sales....................................................... Small (or Commercial)........................................................ Large (or Industrial)...........................................................Public Street and Highway Lighting......................................Other Sales to Public Authorities.....................................................Sales to Railroad and Railways.................................................Interdepartmental Sales.........................................................Miscellaneous Electric Sales............................................................. Total Sales to Ultimate Consumers.................................................... Sales for Resale.................................................................... Total Sales of Electricity............................................ OTHER OPERATING REVENUESForfeited Discounts................................................................Miscellaneous Service Revenues........................................................Sales of Water and Water Power..........................................................Rent from Electric Property..................................................Interdepartmental Rents..................................................Other Electric Revenues.................................................... Total Other Operating Revenues................................................. Total Electric Operating Revenues.............................................
SUMMARY OF ELECTRIC OPERATION AND MAINTENANCE EXPENSES
Functional Classification Operation Maintenance Total $ $ $
Power Production Expenses........................................... Electric Generation Steam Power.......................................... Nuclear Power............................................. Hydraulic Power........................................... Other Power..................................... Other Power Supply Expenses................................. Total Power Production Expenses.......................... Transmission Expenses............................................ Distribution Expenses....................................... Customer Accounts Expenses........................... Sales Expenses.................................... Administrative and General Expenses..................... Total Electric Operation and Maintenance Expenses.
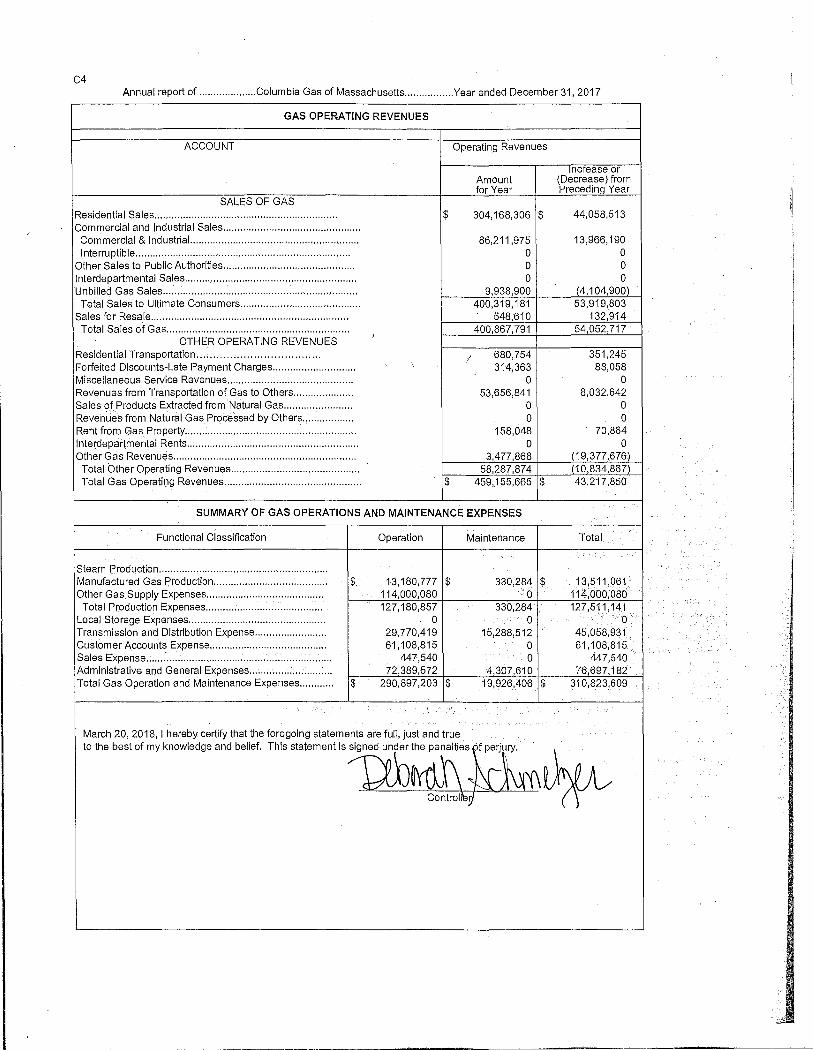
C4 Annual report of .................... Columbia Gas of Massachusetts ................. Year ended December 31, 2017
GAS OPERATING REVENUES
ACCOUNT Operating Revenues
increase or Amount (Decrease) from for Year Preceding Year
SALES OF GAS Residential Sales ................................................................ $ 304,168,306 $ 44,058,513 Commercial and Industrial Sales ................................................
Commercial & Industrial... ........................................................ 86,211,975 13,966,190 Interruptible ..... , ..................................................................... 0 0
Other Sales to Public Authorities .............................................. 0 0 Interdepartmental S_ales ............................................................ 0 0 Unbilled Gas Sales .................................................................... 9,938,900 (4,104,900)
Total Sales to Ultimate Consumers .......................................... 400,319,181 53,919,803 Sales for Resale ..................................................................... 548,610 132,914
Total Sales of Gas ................................................................ 400,867,791 54,052,717 OTHER OPERATING REVENUES ·'
Residential Transportation ........... , ...................... , .. I 680,754 351,245 Forfeited Discounts-Late Payment Charges ............................. 314,363 88,058 Miscellaneous SeNice Revenues ............................................ 0 0 Revenues from Transportation of Gas to Others ..................... 53,656,841 8,032,642 Sales of Products Extracted from Natural Gas ........................ 0 0 Revenues from Natural Gas Processed by Others .................. 0 0 Rent from Gas Property ................. , .......................................... 158,048 70,864 lnterdepar\mental Rents ............................................................ 0 0 Other Gas Revenues ................................................................ 3,477,868 (19,377,676)
Total Other Operating Revenues ............................................. 58,287,874 (10,834,867) Total Gas Operating Revenues ................................................ $ 459,155,665 $ 43,217,850
SUMMARY OF GAS OPERATIONS AND MAINTENANCE EXPENSES
Functional Classification Operation Maintenance Total
Steam Production ........................................................... Manufactured Gas Production ..................................... , .. $ 13,180,777 $ 330,284 $ 13,511,061 Other Gas Supply Expenses ......................................... 114,000,080 0 114:000,oso
Total Production Expenses ......................................... 127,180,857 330,284 127,511,141 Local Storage Expenses ................................................ 0 0 0 Transmission and Distribution Expense ......................... 29,770,419 15,288,512 45,058,931 Customer Accounts Expense ......................................... 61,108,815 0 61,108,815 Sales Expense ................................................................. 447,540 0 447,540 Administrative and General Expenses ............................. 72,389,572 4,307,610 76,697,182 Total Gas Operation and Maintenance Expenses ............ $ 290,897,203 $ 19,926,406 $ 310,823,609
March 20, 2018, I hereby certify that the foregoing statements are full, just and true to the best of my knowledge and belief.
This srat,meot Is 15£~\\s,~k~ Controlrer
Name of Company D/B/A
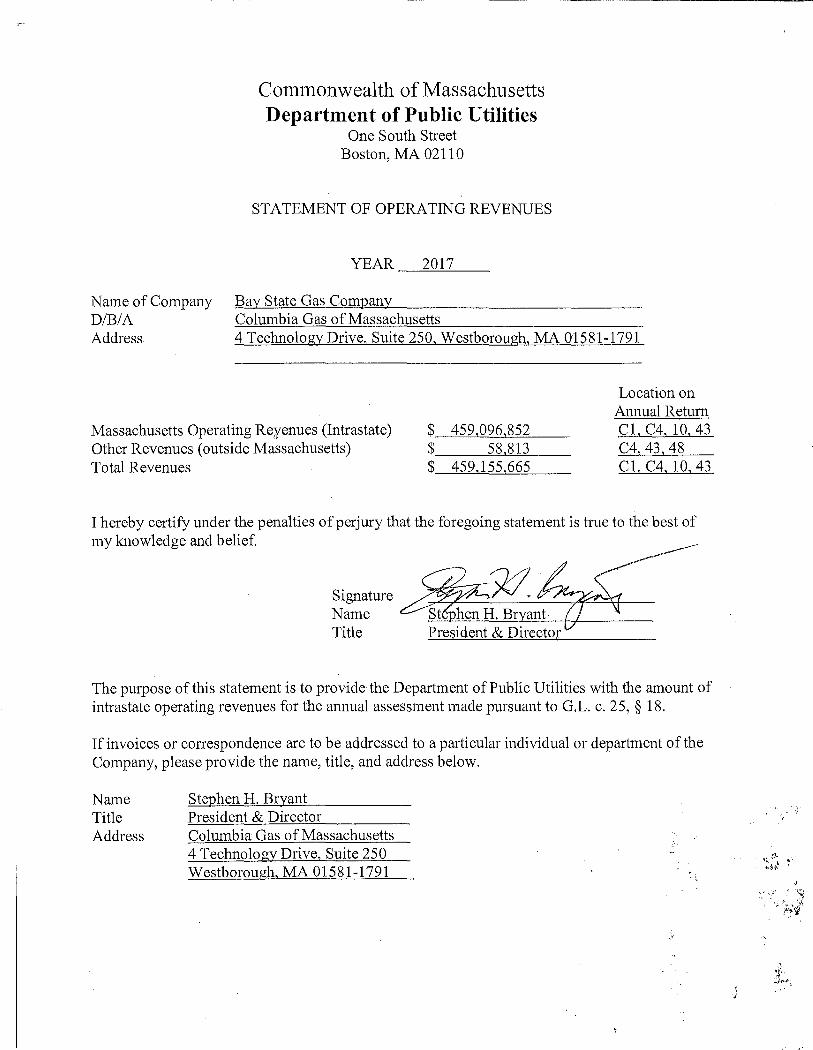
Commonwealth of Massachusetts Department of Public Utilities
One South Street Boston, MA 02110
STATEMENT OF OPERATING REVENUES
YEAR 2017
Bay State Gas Company Columbia Gas of Massachusetts
Address 4 Technology Drive, Suite 250, Westborough, MA 01581-1791
Massachusetts Operating Reyenues (Intrastate) Other Revenues ( outside Massachusetts) Total Revenues
$ 459,096,852 $ 58 813 $ 459,155,665
Location on Annual Return Cl, C4, 10, 43 C4 43 48 Cl, C4, 10, 43
I hereby certify under the penalties of perjury that the foregoing statement is trne to the best of my knowledge and belief.
Signature Name Title
The purpose of this statement is to provide the Department of Public Utilities with the amount of intrastate operating revenues for the annual assessment made pursuant to G.L. c. 25, § 18.
If invoices or correspondence are to be addressed to a particular individual or department of the Company, please provide the name, title, and address below.
Name Title Address
Stephen H. Bryant President & Director Columbia Gas of Massachusetts 4 Technology Drive, Suite 250 Westborough, MA 01581-1791
j
::\'.;i

THIS PAGE INTENTIONALLY LEFT BLANK[NEXT PAGE IS R2]
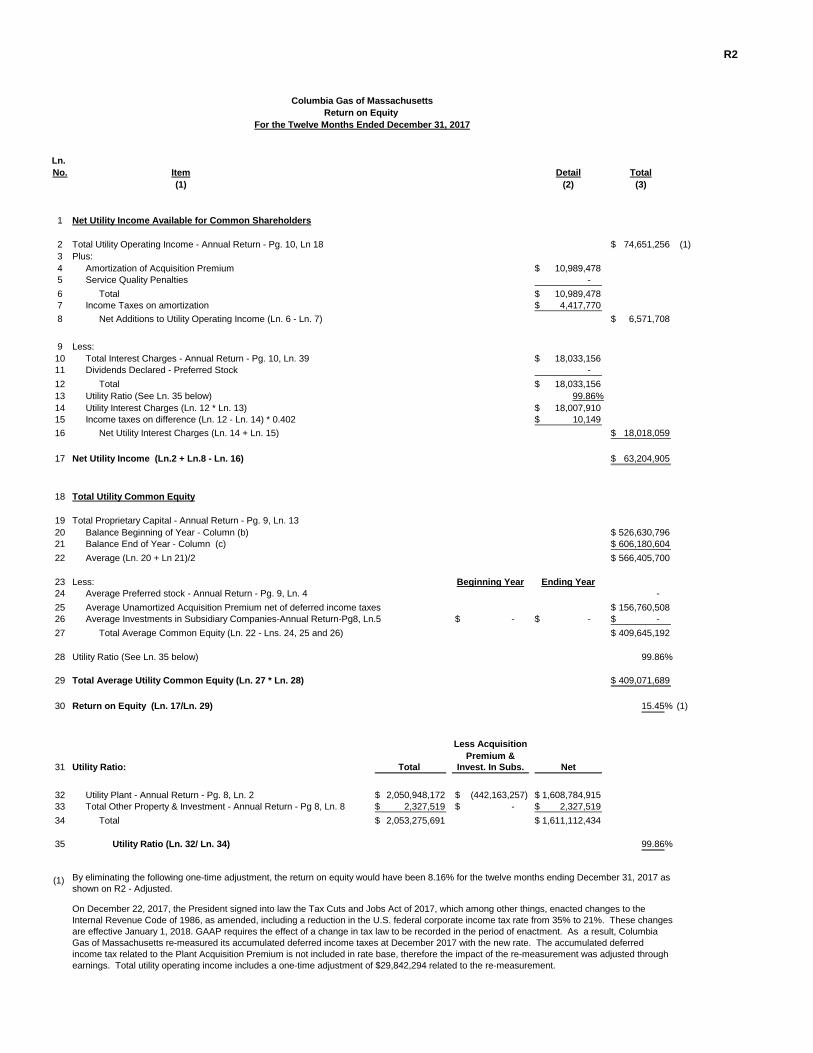
R2
Ln. No. Detail Total
(2) (3)
1 Net Utility Income Available for Common Shareholders
2 Total Utility Operating Income - Annual Return - Pg. 10, Ln 18 74,651,256$ (1)3 Plus:4 Amortization of Acquisition Premium 10,989,478$ 5 Service Quality Penalties - 6 Total 10,989,478$ 7 Income Taxes on amortization 4,417,770$ 8 Net Additions to Utility Operating Income (Ln. 6 - Ln. 7) 6,571,708$
9 Less:10 Total Interest Charges - Annual Return - Pg. 10, Ln. 39 18,033,156$ 11 Dividends Declared - Preferred Stock - 12 Total 18,033,156$ 13 Utility Ratio (See Ln. 35 below) 99.86%14 Utility Interest Charges (Ln. 12 * Ln. 13) 18,007,910$ 15 Income taxes on difference (Ln. 12 - Ln. 14) * 0.402 10,149$ 16 Net Utility Interest Charges (Ln. 14 + Ln. 15) 18,018,059$
17 Net Utility Income (Ln.2 + Ln.8 - Ln. 16) 63,204,905$
18 Total Utility Common Equity
19 Total Proprietary Capital - Annual Return - Pg. 9, Ln. 1320 Balance Beginning of Year - Column (b) 526,630,796$ 21 Balance End of Year - Column (c) 606,180,604$ 22 Average (Ln. 20 + Ln 21)/2 566,405,700$
23 Less: Beginning Year Ending Year24 Average Preferred stock - Annual Return - Pg. 9, Ln. 4 - 25 Average Unamortized Acquisition Premium net of deferred income taxes 156,760,508$ 26 Average Investments in Subsidiary Companies-Annual Return-Pg8, Ln.5 -$ -$ -$ 27 Total Average Common Equity (Ln. 22 - Lns. 24, 25 and 26) 409,645,192$
28 Utility Ratio (See Ln. 35 below) 99.86%
29 Total Average Utility Common Equity (Ln. 27 * Ln. 28) 409,071,689$
30 Return on Equity (Ln. 17/Ln. 29) 15.45% (1)
Less AcquisitionPremium &
31 Utility Ratio: Total Invest. In Subs. Net
32 Utility Plant - Annual Return - Pg. 8, Ln. 2 2,050,948,172$ (442,163,257)$ 1,608,784,915$ 33 Total Other Property & Investment - Annual Return - Pg 8, Ln. 8 2,327,519$ -$ 2,327,519$ 34 Total 2,053,275,691$ 1,611,112,434$
35 Utility Ratio (Ln. 32/ Ln. 34) 99.86%
(1)
On December 22, 2017, the President signed into law the Tax Cuts and Jobs Act of 2017, which among other things, enacted changes to the Internal Revenue Code of 1986, as amended, including a reduction in the U.S. federal corporate income tax rate from 35% to 21%. These changes are effective January 1, 2018. GAAP requires the effect of a change in tax law to be recorded in the period of enactment. As a result, Columbia Gas of Massachusetts re-measured its accumulated deferred income taxes at December 2017 with the new rate. The accumulated deferred income tax related to the Plant Acquisition Premium is not included in rate base, therefore the impact of the re-measurement was adjusted through earnings. Total utility operating income includes a one-time adjustment of $29,842,294 related to the re-measurement.
Columbia Gas of MassachusettsReturn on Equity
For the Twelve Months Ended December 31, 2017
Item(1)
By eliminating the following one-time adjustment, the return on equity would have been 8.16% for the twelve months ending December 31, 2017 as shown on R2 - Adjusted.
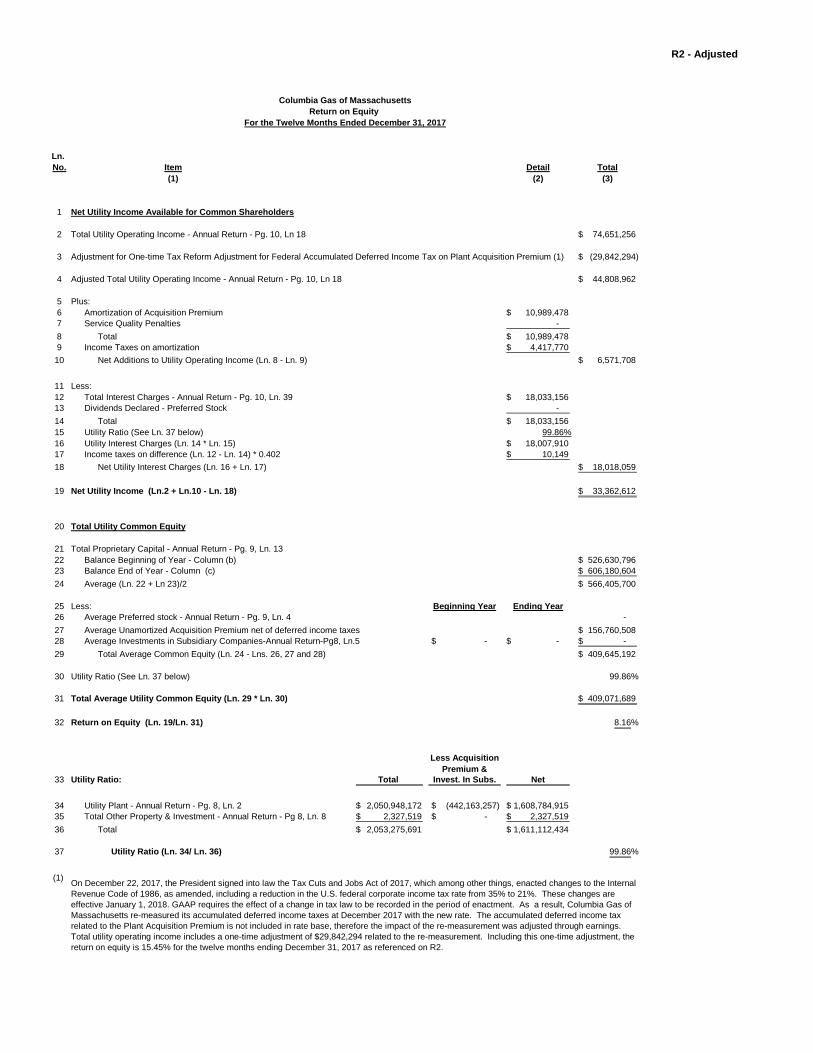
R2 - Adjusted
Ln. No. Detail Total
(2) (3)
1 Net Utility Income Available for Common Shareholders
2 Total Utility Operating Income - Annual Return - Pg. 10, Ln 18 74,651,256$
3 Adjustment for One-time Tax Reform Adjustment for Federal Accumulated Deferred Income Tax on Plant Acquisition Premium (1) (29,842,294)$
4 Adjusted Total Utility Operating Income - Annual Return - Pg. 10, Ln 18 44,808,962$
5 Plus:6 Amortization of Acquisition Premium 10,989,478$ 7 Service Quality Penalties - 8 Total 10,989,478$ 9 Income Taxes on amortization 4,417,770$ 10 Net Additions to Utility Operating Income (Ln. 8 - Ln. 9) 6,571,708$
11 Less:12 Total Interest Charges - Annual Return - Pg. 10, Ln. 39 18,033,156$ 13 Dividends Declared - Preferred Stock - 14 Total 18,033,156$ 15 Utility Ratio (See Ln. 37 below) 99.86%16 Utility Interest Charges (Ln. 14 * Ln. 15) 18,007,910$ 17 Income taxes on difference (Ln. 12 - Ln. 14) * 0.402 10,149$ 18 Net Utility Interest Charges (Ln. 16 + Ln. 17) 18,018,059$
19 Net Utility Income (Ln.2 + Ln.10 - Ln. 18) 33,362,612$
20 Total Utility Common Equity
21 Total Proprietary Capital - Annual Return - Pg. 9, Ln. 1322 Balance Beginning of Year - Column (b) 526,630,796$ 23 Balance End of Year - Column (c) 606,180,604$ 24 Average (Ln. 22 + Ln 23)/2 566,405,700$
25 Less: Beginning Year Ending Year26 Average Preferred stock - Annual Return - Pg. 9, Ln. 4 - 27 Average Unamortized Acquisition Premium net of deferred income taxes 156,760,508$ 28 Average Investments in Subsidiary Companies-Annual Return-Pg8, Ln.5 -$ -$ -$ 29 Total Average Common Equity (Ln. 24 - Lns. 26, 27 and 28) 409,645,192$
30 Utility Ratio (See Ln. 37 below) 99.86%
31 Total Average Utility Common Equity (Ln. 29 * Ln. 30) 409,071,689$
32 Return on Equity (Ln. 19/Ln. 31) 8.16%
Less AcquisitionPremium &
33 Utility Ratio: Total Invest. In Subs. Net
34 Utility Plant - Annual Return - Pg. 8, Ln. 2 2,050,948,172$ (442,163,257)$ 1,608,784,915$ 35 Total Other Property & Investment - Annual Return - Pg 8, Ln. 8 2,327,519$ -$ 2,327,519$ 36 Total 2,053,275,691$ 1,611,112,434$
37 Utility Ratio (Ln. 34/ Ln. 36) 99.86%
(1) On December 22, 2017, the President signed into law the Tax Cuts and Jobs Act of 2017, which among other things, enacted changes to the Internal Revenue Code of 1986, as amended, including a reduction in the U.S. federal corporate income tax rate from 35% to 21%. These changes are effective January 1, 2018. GAAP requires the effect of a change in tax law to be recorded in the period of enactment. As a result, Columbia Gas of Massachusetts re-measured its accumulated deferred income taxes at December 2017 with the new rate. The accumulated deferred income tax related to the Plant Acquisition Premium is not included in rate base, therefore the impact of the re-measurement was adjusted through earnings. Total utility operating income includes a one-time adjustment of $29,842,294 related to the re-measurement. Including this one-time adjustment, the return on equity is 15.45% for the twelve months ending December 31, 2017 as referenced on R2.
Columbia Gas of MassachusettsReturn on Equity
For the Twelve Months Ended December 31, 2017
Item(1)
2
Annual report of ................Columbia Gas of Massachusetts..........Year ended December 31, 2017
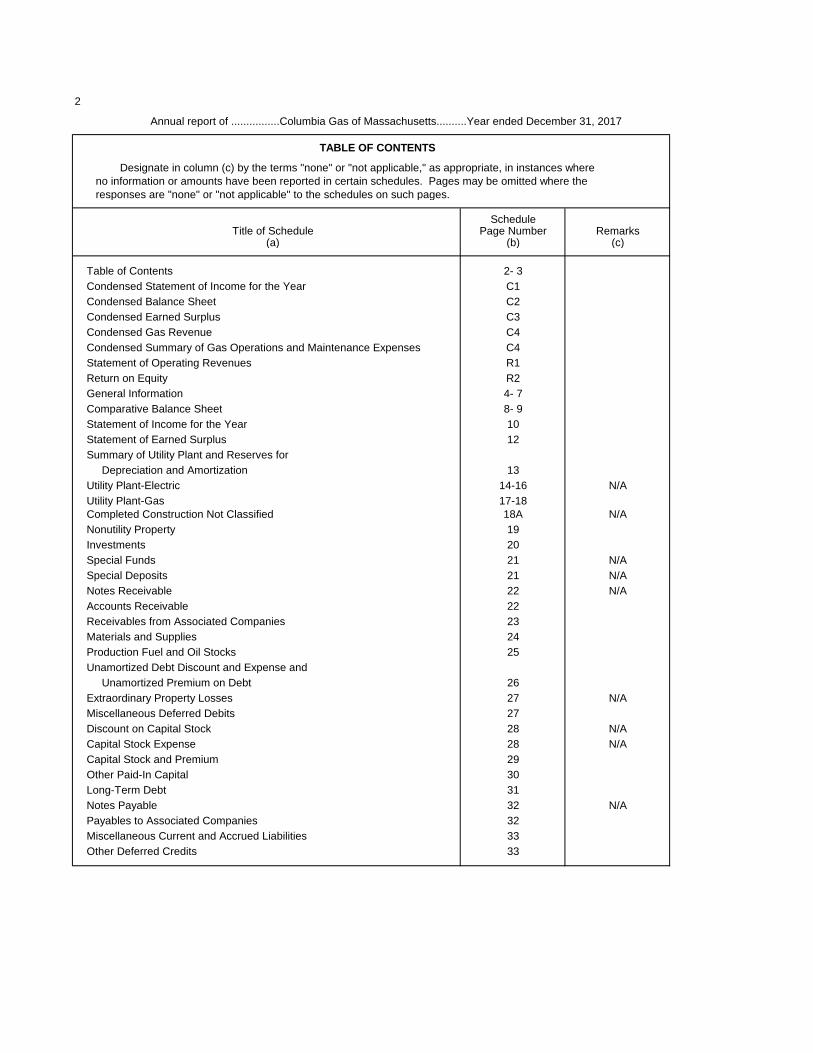
TABLE OF CONTENTS
Designate in column (c) by the terms "none" or "not applicable," as appropriate, in instances where no information or amounts have been reported in certain schedules. Pages may be omitted where the responses are "none" or "not applicable" to the schedules on such pages.
ScheduleTitle of Schedule Page Number Remarks
(a) (b) (c)
Table of Contents 2- 3Condensed Statement of Income for the Year C1Condensed Balance Sheet C2Condensed Earned Surplus C3Condensed Gas Revenue C4Condensed Summary of Gas Operations and Maintenance Expenses C4Statement of Operating Revenues R1Return on Equity R2General Information 4- 7Comparative Balance Sheet 8- 9Statement of Income for the Year 10Statement of Earned Surplus 12Summary of Utility Plant and Reserves for Depreciation and Amortization 13Utility Plant-Electric 14-16 N/AUtility Plant-Gas 17-18Completed Construction Not Classified 18A N/ANonutility Property 19Investments 20Special Funds 21 N/ASpecial Deposits 21 N/ANotes Receivable 22 N/AAccounts Receivable 22Receivables from Associated Companies 23Materials and Supplies 24Production Fuel and Oil Stocks 25Unamortized Debt Discount and Expense and Unamortized Premium on Debt 26Extraordinary Property Losses 27 N/AMiscellaneous Deferred Debits 27Discount on Capital Stock 28 N/ACapital Stock Expense 28 N/ACapital Stock and Premium 29Other Paid-In Capital 30Long-Term Debt 31Notes Payable 32 N/APayables to Associated Companies 32Miscellaneous Current and Accrued Liabilities 33Other Deferred Credits 33
3
Annual report of ................Columbia Gas of Massachusetts..........Year ended December 31, 2017
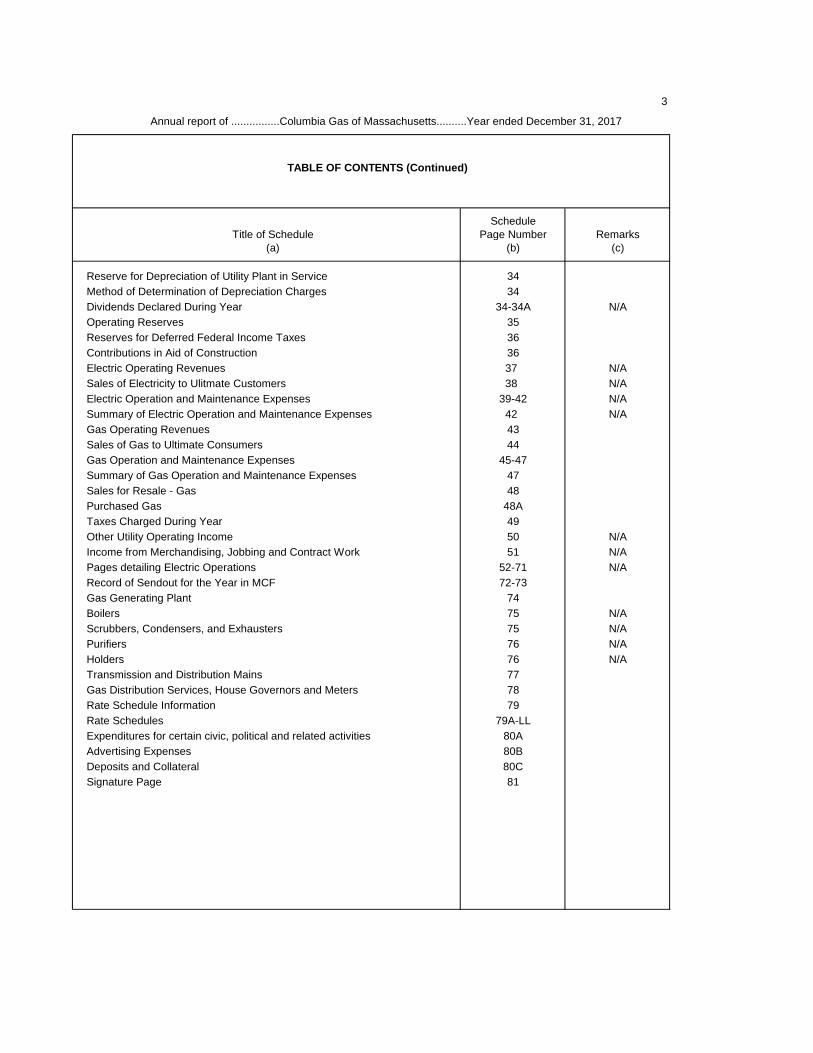
TABLE OF CONTENTS (Continued)
ScheduleTitle of Schedule Page Number Remarks
(a) (b) (c)
Reserve for Depreciation of Utility Plant in Service 34Method of Determination of Depreciation Charges 34Dividends Declared During Year 34-34A N/AOperating Reserves 35Reserves for Deferred Federal Income Taxes 36Contributions in Aid of Construction 36Electric Operating Revenues 37 N/ASales of Electricity to Ulitmate Customers 38 N/AElectric Operation and Maintenance Expenses 39-42 N/ASummary of Electric Operation and Maintenance Expenses 42 N/AGas Operating Revenues 43Sales of Gas to Ultimate Consumers 44Gas Operation and Maintenance Expenses 45-47Summary of Gas Operation and Maintenance Expenses 47Sales for Resale - Gas 48Purchased Gas 48ATaxes Charged During Year 49Other Utility Operating Income 50 N/AIncome from Merchandising, Jobbing and Contract Work 51 N/APages detailing Electric Operations 52-71 N/ARecord of Sendout for the Year in MCF 72-73Gas Generating Plant 74Boilers 75 N/AScrubbers, Condensers, and Exhausters 75 N/APurifiers 76 N/AHolders 76 N/ATransmission and Distribution Mains 77Gas Distribution Services, House Governors and Meters 78Rate Schedule Information 79Rate Schedules 79A-LLExpenditures for certain civic, political and related activities 80AAdvertising Expenses 80BDeposits and Collateral 80CSignature Page 81
4
Annual report of…………...…….………......Columbia Gas of Massachusetts……………………..…….......Year ended December 31, 2017
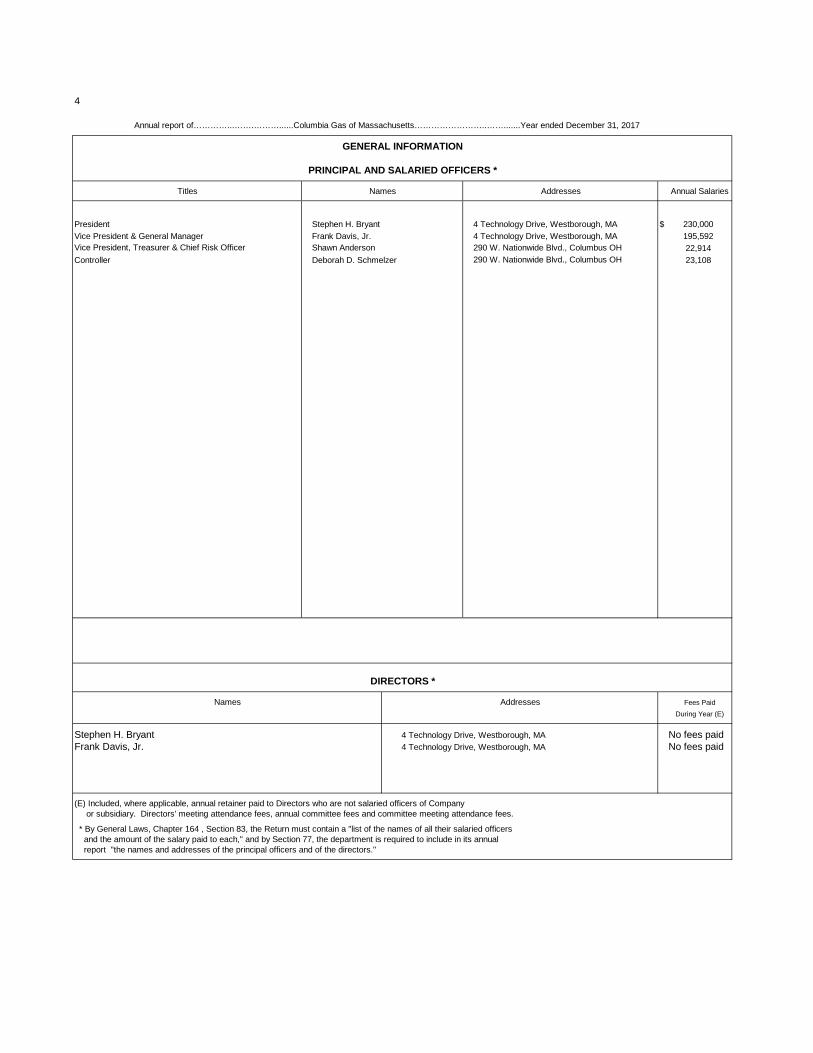
GENERAL INFORMATION
PRINCIPAL AND SALARIED OFFICERS *
Titles Names Addresses Annual Salaries
President Stephen H. Bryant 4 Technology Drive, Westborough, MA $ 230,000Vice President & General Manager Frank Davis, Jr. 4 Technology Drive, Westborough, MA 195,592Vice President, Treasurer & Chief Risk Officer Shawn Anderson 290 W. Nationwide Blvd., Columbus OH 22,914Controller Deborah D. Schmelzer 290 W. Nationwide Blvd., Columbus OH 23,108
DIRECTORS *
Names Addresses Fees PaidDuring Year (E)
Stephen H. Bryant 4 Technology Drive, Westborough, MA No fees paidFrank Davis, Jr. 4 Technology Drive, Westborough, MA No fees paid
(E) Included, where applicable, annual retainer paid to Directors who are not salaried officers of Company or subsidiary. Directors' meeting attendance fees, annual committee fees and committee meeting attendance fees.
* By General Laws, Chapter 164 , Section 83, the Return must contain a "list of the names of all their salaried officers and the amount of the salary paid to each," and by Section 77, the department is required to include in its annual report "the names and addresses of the principal officers and of the directors."
5
Annual report of.…….....…….......................Columbia Gas of Massachusetts..…….......……..…........Year ended December 31, 2017
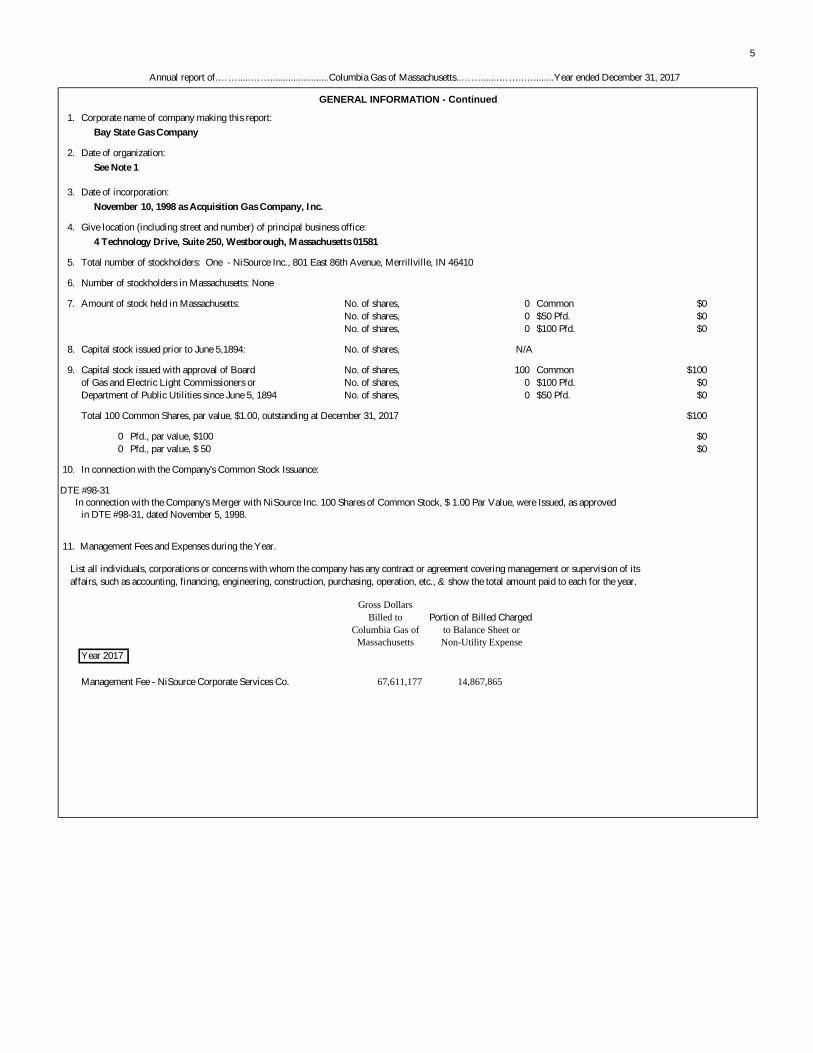
GENERAL INFORMATION - Continued
1. Corporate name of company making this report: Bay State Gas Company
2. Date of organization: See Note 1
3. Date of incorporation: November 10, 1998 as Acquisition Gas Company, Inc.
4. Give location (including street and number) of principal business office: 4 Technology Drive, Suite 250, Westborough, Massachusetts 01581
5. Total number of stockholders: One - NiSource Inc., 801 East 86th Avenue, Merrillville, IN 46410
6. Number of stockholders in Massachusetts: None
7. Amount of stock held in Massachusetts: No. of shares, 0 Common $0No. of shares, 0 $50 Pfd. $0No. of shares, 0 $100 Pfd. $0
8. Capital stock issued prior to June 5,1894: No. of shares, N/A
9. Capital stock issued with approval of Board No. of shares, 100 Common $100of Gas and Electric Light Commissioners or No. of shares, 0 $100 Pfd. $0Department of Public Utilities since June 5, 1894 No. of shares, 0 $50 Pfd. $0
Total 100 Common Shares, par value, $1.00, outstanding at December 31, 2017 $100
0 Pfd., par value, $100 $00 Pfd., par value, $ 50 $0
10. In connection with the Company's Common Stock Issuance:
DTE #98-31 In connection with the Company's Merger with NiSource Inc. 100 Shares of Common Stock, $ 1.00 Par Value, were Issued, as approved
in DTE #98-31, dated November 5, 1998.
11. Management Fees and Expenses during the Year.
List all individuals, corporations or concerns with whom the company has any contract or agreement covering management or supervision of its affairs, such as accounting, financing, engineering, construction, purchasing, operation, etc., & show the total amount paid to each for the year.
Gross DollarsBilled to Portion of Billed Charged
Columbia Gas of to Balance Sheet orMassachusetts Non-Utility Expense
Year 2017
Management Fee - NiSource Corporate Services Co. 67,611,177 14,867,865
6
GENERAL INFORMATION - Continued
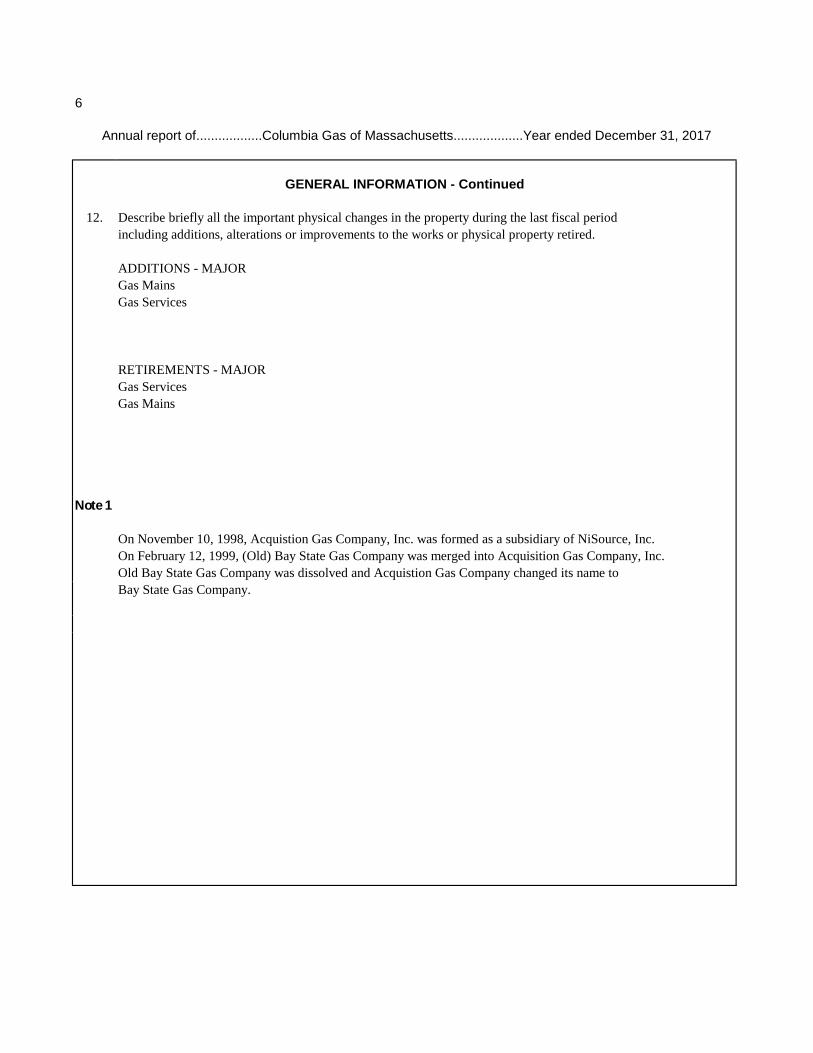
12. Describe briefly all the important physical changes in the property during the last fiscal periodincluding additions, alterations or improvements to the works or physical property retired.
ADDITIONS - MAJORGas MainsGas Services
RETIREMENTS - MAJORGas ServicesGas Mains
Note 1
On November 10, 1998, Acquistion Gas Company, Inc. was formed as a subsidiary of NiSource, Inc.On February 12, 1999, (Old) Bay State Gas Company was merged into Acquisition Gas Company, Inc.Old Bay State Gas Company was dissolved and Acquistion Gas Company changed its name toBay State Gas Company.
Annual report of..................Columbia Gas of Massachusetts...................Year ended December 31, 2017
7
Annual report of .........................Columbia Gas of Massachusetts.....................Year ended December 31, 2017
GENERAL INFORMATION - Continued
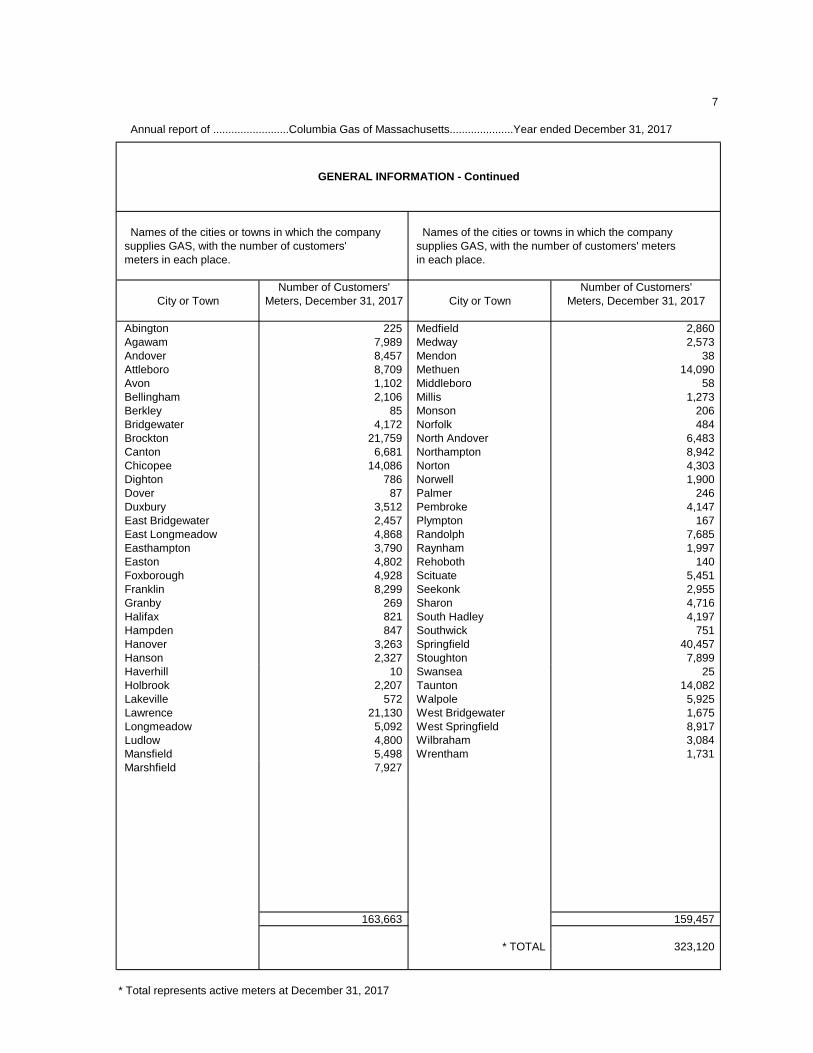
Names of the cities or towns in which the company Names of the cities or towns in which the company supplies GAS, with the number of customers' supplies GAS, with the number of customers' meters meters in each place. in each place.
Number of Customers' Number of Customers'City or Town Meters, December 31, 2017 City or Town Meters, December 31, 2017
Abington 225 Medfield 2,860 Agawam 7,989 Medway 2,573 Andover 8,457 Mendon 38 Attleboro 8,709 Methuen 14,090 Avon 1,102 Middleboro 58 Bellingham 2,106 Millis 1,273 Berkley 85 Monson 206 Bridgewater 4,172 Norfolk 484 Brockton 21,759 North Andover 6,483 Canton 6,681 Northampton 8,942 Chicopee 14,086 Norton 4,303 Dighton 786 Norwell 1,900 Dover 87 Palmer 246 Duxbury 3,512 Pembroke 4,147 East Bridgewater 2,457 Plympton 167 East Longmeadow 4,868 Randolph 7,685 Easthampton 3,790 Raynham 1,997 Easton 4,802 Rehoboth 140 Foxborough 4,928 Scituate 5,451 Franklin 8,299 Seekonk 2,955 Granby 269 Sharon 4,716 Halifax 821 South Hadley 4,197 Hampden 847 Southwick 751 Hanover 3,263 Springfield 40,457 Hanson 2,327 Stoughton 7,899 Haverhill 10 Swansea 25 Holbrook 2,207 Taunton 14,082 Lakeville 572 Walpole 5,925 Lawrence 21,130 West Bridgewater 1,675 Longmeadow 5,092 West Springfield 8,917 Ludlow 4,800 Wilbraham 3,084 Mansfield 5,498 Wrentham 1,731 Marshfield 7,927
163,663 159,457
* TOTAL 323,120
* Total represents active meters at December 31, 2017
8
Annual report of............................................Columbia Gas of Massachusetts............................................Year ended December 31, 2017
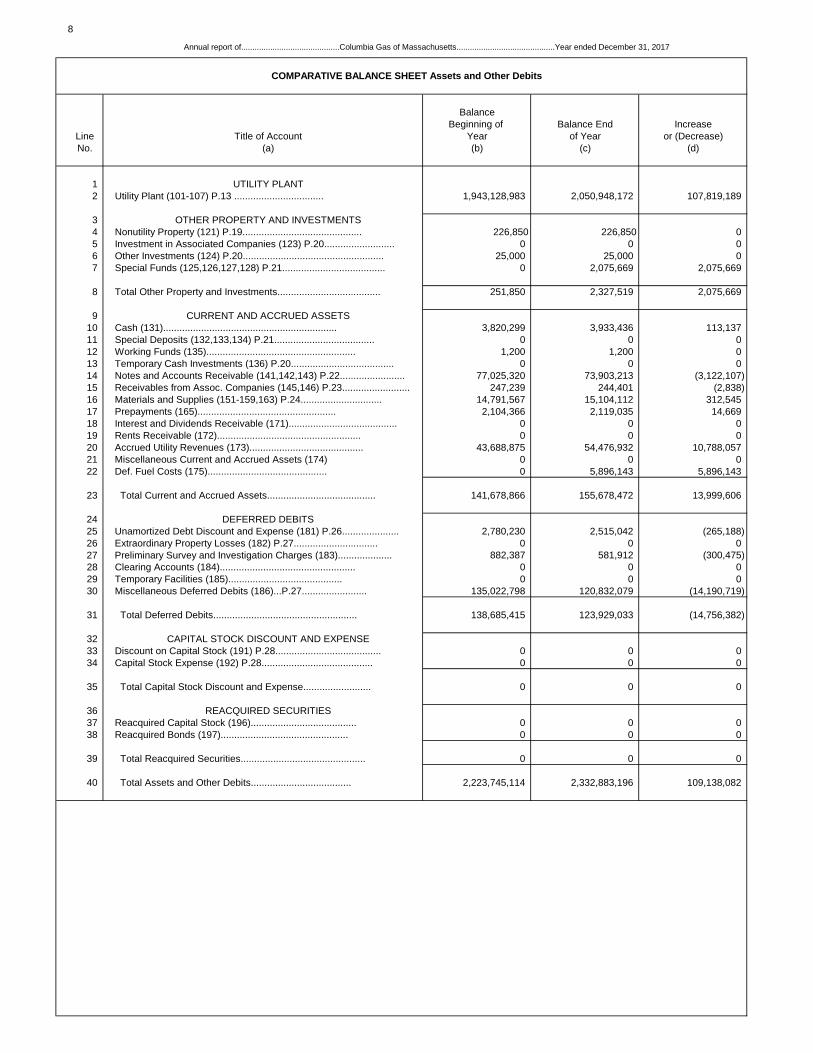
COMPARATIVE BALANCE SHEET Assets and Other Debits
BalanceBeginning of Balance End Increase
Line Title of Account Year of Year or (Decrease)No. (a) (b) (c) (d)
1 UTILITY PLANT2 Utility Plant (101-107) P.13 ................................. 1,943,128,983 2,050,948,172 107,819,189
3 OTHER PROPERTY AND INVESTMENTS4 Nonutility Property (121) P.19............................................ 226,850 226,850 05 Investment in Associated Companies (123) P.20.......................... 0 0 06 Other Investments (124) P.20.................................................... 25,000 25,000 07 Special Funds (125,126,127,128) P.21...................................... 0 2,075,669 2,075,669
8 Total Other Property and Investments...................................... 251,850 2,327,519 2,075,669
9 CURRENT AND ACCRUED ASSETS10 Cash (131)................................................................ 3,820,299 3,933,436 113,13711 Special Deposits (132,133,134) P.21..................................... 0 0 012 Working Funds (135)....................................................... 1,200 1,200 013 Temporary Cash Investments (136) P.20...................................... 0 0 014 Notes and Accounts Receivable (141,142,143) P.22........................ 77,025,320 73,903,213 (3,122,107)15 Receivables from Assoc. Companies (145,146) P.23......................... 247,239 244,401 (2,838)16 Materials and Supplies (151-159,163) P.24.............................. 14,791,567 15,104,112 312,54517 Prepayments (165)................................................... 2,104,366 2,119,035 14,66918 Interest and Dividends Receivable (171)........................................ 0 0 019 Rents Receivable (172)..................................................... 0 0 020 Accrued Utility Revenues (173).......................................... 43,688,875 54,476,932 10,788,05721 Miscellaneous Current and Accrued Assets (174) 0 0 022 Def. Fuel Costs (175)............................................ 0 5,896,143 5,896,143
23 Total Current and Accrued Assets........................................ 141,678,866 155,678,472 13,999,606
24 DEFERRED DEBITS25 Unamortized Debt Discount and Expense (181) P.26..................... 2,780,230 2,515,042 (265,188)26 Extraordinary Property Losses (182) P.27............................... 0 0 027 Preliminary Survey and Investigation Charges (183).................... 882,387 581,912 (300,475)28 Clearing Accounts (184).................................................. 0 0 029 Temporary Facilities (185).......................................... 0 0 030 Miscellaneous Deferred Debits (186)...P.27........................ 135,022,798 120,832,079 (14,190,719)
31 Total Deferred Debits..................................................... 138,685,415 123,929,033 (14,756,382)
32 CAPITAL STOCK DISCOUNT AND EXPENSE33 Discount on Capital Stock (191) P.28....................................... 0 0 034 Capital Stock Expense (192) P.28......................................... 0 0 0
35 Total Capital Stock Discount and Expense......................... 0 0 0
36 REACQUIRED SECURITIES37 Reacquired Capital Stock (196)....................................... 0 0 038 Reacquired Bonds (197)............................................... 0 0 0
39 Total Reacquired Securities.............................................. 0 0 0
40 Total Assets and Other Debits..................................... 2,223,745,114 2,332,883,196 109,138,082
9
Annual report of...................................Columbia Gas of Massachusetts............................Year ended December 31, 2017
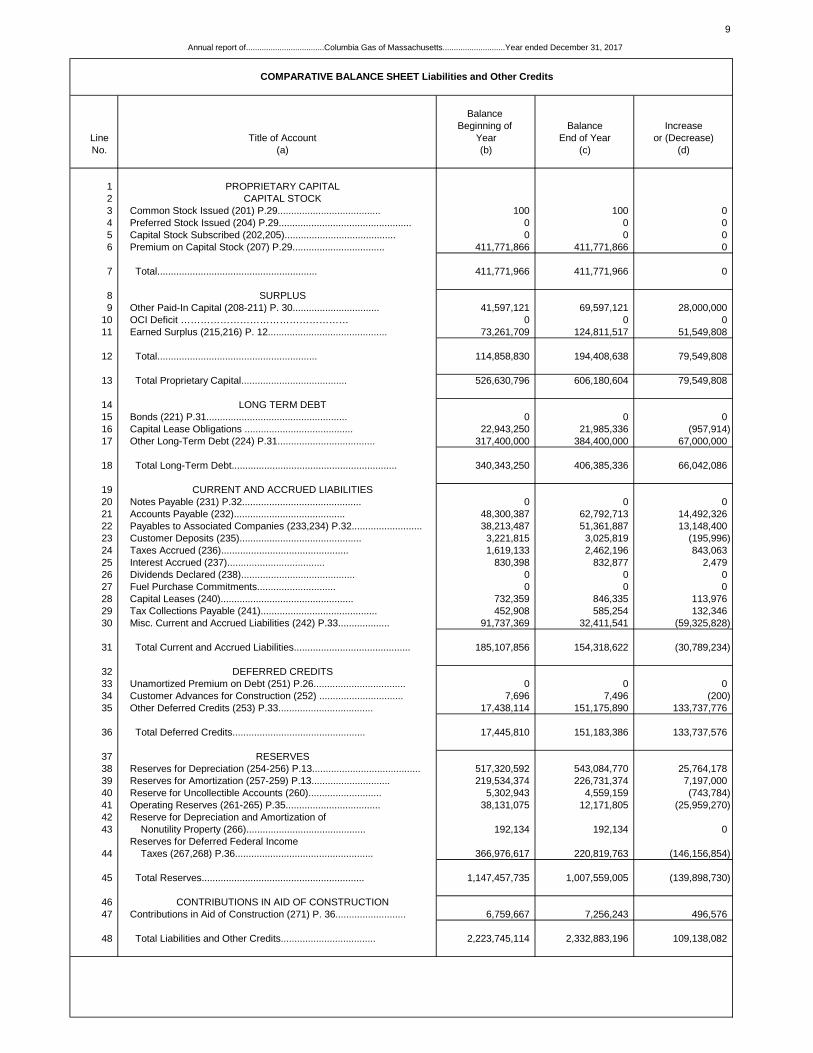
COMPARATIVE BALANCE SHEET Liabilities and Other Credits
Balance Beginning of Balance Increase
Line Title of Account Year End of Year or (Decrease)No. (a) (b) (c) (d)
1 PROPRIETARY CAPITAL2 CAPITAL STOCK3 Common Stock Issued (201) P.29...................................... 100 100 04 Preferred Stock Issued (204) P.29................................................. 0 0 05 Capital Stock Subscribed (202,205)......................................... 0 0 06 Premium on Capital Stock (207) P.29.................................. 411,771,866 411,771,866 0
7 Total........................................................... 411,771,966 411,771,966 0
8 SURPLUS9 Other Paid-In Capital (208-211) P. 30................................ 41,597,121 69,597,121 28,000,000
10 OCI Deficit …………………………………………… 0 0 011 Earned Surplus (215,216) P. 12............................................ 73,261,709 124,811,517 51,549,808
12 Total........................................................... 114,858,830 194,408,638 79,549,808
13 Total Proprietary Capital....................................... 526,630,796 606,180,604 79,549,808
14 LONG TERM DEBT15 Bonds (221) P.31.................................................... 0 0 016 Capital Lease Obligations ........................................ 22,943,250 21,985,336 (957,914)17 Other Long-Term Debt (224) P.31.................................... 317,400,000 384,400,000 67,000,000
18 Total Long-Term Debt............................................................. 340,343,250 406,385,336 66,042,086
19 CURRENT AND ACCRUED LIABILITIES20 Notes Payable (231) P.32............................................ 0 0 021 Accounts Payable (232)......................................... 48,300,387 62,792,713 14,492,32622 Payables to Associated Companies (233,234) P.32.......................... 38,213,487 51,361,887 13,148,40023 Customer Deposits (235)............................................. 3,221,815 3,025,819 (195,996)24 Taxes Accrued (236)............................................... 1,619,133 2,462,196 843,06325 Interest Accrued (237).................................... 830,398 832,877 2,47926 Dividends Declared (238).......................................... 0 0 027 Fuel Purchase Commitments............................. 0 0 028 Capital Leases (240)................................................. 732,359 846,335 113,97629 Tax Collections Payable (241)........................................... 452,908 585,254 132,34630 Misc. Current and Accrued Liabilities (242) P.33................... 91,737,369 32,411,541 (59,325,828)
31 Total Current and Accrued Liabilities........................................... 185,107,856 154,318,622 (30,789,234)
32 DEFERRED CREDITS33 Unamortized Premium on Debt (251) P.26.................................. 0 0 034 Customer Advances for Construction (252) ............................... 7,696 7,496 (200)35 Other Deferred Credits (253) P.33................................... 17,438,114 151,175,890 133,737,776
36 Total Deferred Credits................................................. 17,445,810 151,183,386 133,737,576
37 RESERVES38 Reserves for Depreciation (254-256) P.13........................................ 517,320,592 543,084,770 25,764,17839 Reserves for Amortization (257-259) P.13............................. 219,534,374 226,731,374 7,197,00040 Reserve for Uncollectible Accounts (260)........................... 5,302,943 4,559,159 (743,784)41 Operating Reserves (261-265) P.35................................... 38,131,075 12,171,805 (25,959,270)42 Reserve for Depreciation and Amortization of43 Nonutility Property (266)............................................ 192,134 192,134 0
Reserves for Deferred Federal Income44 Taxes (267,268) P.36................................................... 366,976,617 220,819,763 (146,156,854)
45 Total Reserves............................................................ 1,147,457,735 1,007,559,005 (139,898,730)
46 CONTRIBUTIONS IN AID OF CONSTRUCTION47 Contributions in Aid of Construction (271) P. 36.......................... 6,759,667 7,256,243 496,576
48 Total Liabilities and Other Credits................................... 2,223,745,114 2,332,883,196 109,138,082
10
Annual report of...............................Columbia Gas of Massachusetts............................Year ended December 31, 2017
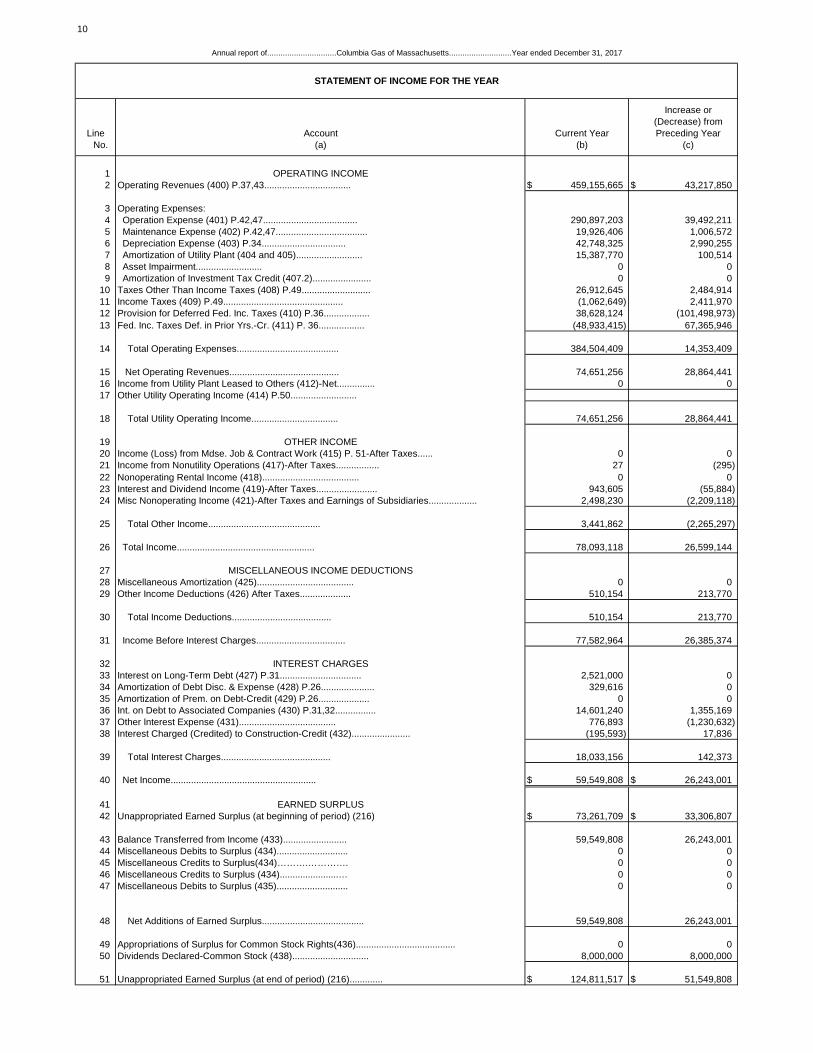
STATEMENT OF INCOME FOR THE YEAR
Increase or(Decrease) from
Line Account Current Year Preceding YearNo. (a) (b) (c)
1 OPERATING INCOME 2 Operating Revenues (400) P.37,43.................................. $ 459,155,665 $ 43,217,850
3 Operating Expenses:4 Operation Expense (401) P.42,47..................................... 290,897,203 39,492,2115 Maintenance Expense (402) P.42,47.................................... 19,926,406 1,006,5726 Depreciation Expense (403) P.34................................. 42,748,325 2,990,2557 Amortization of Utility Plant (404 and 405).......................... 15,387,770 100,5148 Asset Impairment.......................... 0 09 Amortization of Investment Tax Credit (407.2)....................... 0 0
10 Taxes Other Than Income Taxes (408) P.49........................... 26,912,645 2,484,91411 Income Taxes (409) P.49............................................... (1,062,649) 2,411,97012 Provision for Deferred Fed. Inc. Taxes (410) P.36.................. 38,628,124 (101,498,973)13 Fed. Inc. Taxes Def. in Prior Yrs.-Cr. (411) P. 36.................. (48,933,415) 67,365,946
14 Total Operating Expenses........................................ 384,504,409 14,353,409
15 Net Operating Revenues........................................... 74,651,256 28,864,44116 Income from Utility Plant Leased to Others (412)-Net............... 0 017 Other Utility Operating Income (414) P.50..........................
18 Total Utility Operating Income.................................. 74,651,256 28,864,441
19 OTHER INCOME20 Income (Loss) from Mdse. Job & Contract Work (415) P. 51-After Taxes...... 0 021 Income from Nonutility Operations (417)-After Taxes................. 27 (295)22 Nonoperating Rental Income (418)...................................... 0 023 Interest and Dividend Income (419)-After Taxes........................ 943,605 (55,884)24 Misc Nonoperating Income (421)-After Taxes and Earnings of Subsidiaries................... 2,498,230 (2,209,118)
25 Total Other Income............................................ 3,441,862 (2,265,297)
26 Total Income...................................................... 78,093,118 26,599,144
27 MISCELLANEOUS INCOME DEDUCTIONS28 Miscellaneous Amortization (425)...................................... 0 029 Other Income Deductions (426) After Taxes.................... 510,154 213,770
30 Total Income Deductions....................................... 510,154 213,770
31 Income Before Interest Charges................................... 77,582,964 26,385,374
32 INTEREST CHARGES33 Interest on Long-Term Debt (427) P.31................................ 2,521,000 034 Amortization of Debt Disc. & Expense (428) P.26..................... 329,616 035 Amortization of Prem. on Debt-Credit (429) P.26.................... 0 036 Int. on Debt to Associated Companies (430) P.31,32................ 14,601,240 1,355,16937 Other Interest Expense (431)...................................... 776,893 (1,230,632)38 Interest Charged (Credited) to Construction-Credit (432)....................... (195,593) 17,836
39 Total Interest Charges........................................... 18,033,156 142,373
40 Net Income......................................................... $ 59,549,808 $ 26,243,001
41 EARNED SURPLUS42 Unappropriated Earned Surplus (at beginning of period) (216) $ 73,261,709 $ 33,306,807
43 Balance Transferred from Income (433)......................... 59,549,808 26,243,00144 Miscellaneous Debits to Surplus (434)............................ 0 045 Miscellaneous Credits to Surplus(434)……….…………. 0 046 Miscellaneous Credits to Surplus (434).......................… 0 047 Miscellaneous Debits to Surplus (435)............................ 0 0
48 Net Additions of Earned Surplus........................................ 59,549,808 26,243,001
49 Appropriations of Surplus for Common Stock Rights(436)....................................... 0 050 Dividends Declared-Common Stock (438).............................. 8,000,000 8,000,000
51 Unappropriated Earned Surplus (at end of period) (216)............. $ 124,811,517 $ 51,549,808
12
Annual report of..................................Columbia Gas of Massachusetts..............................Year ended December 31, 2017
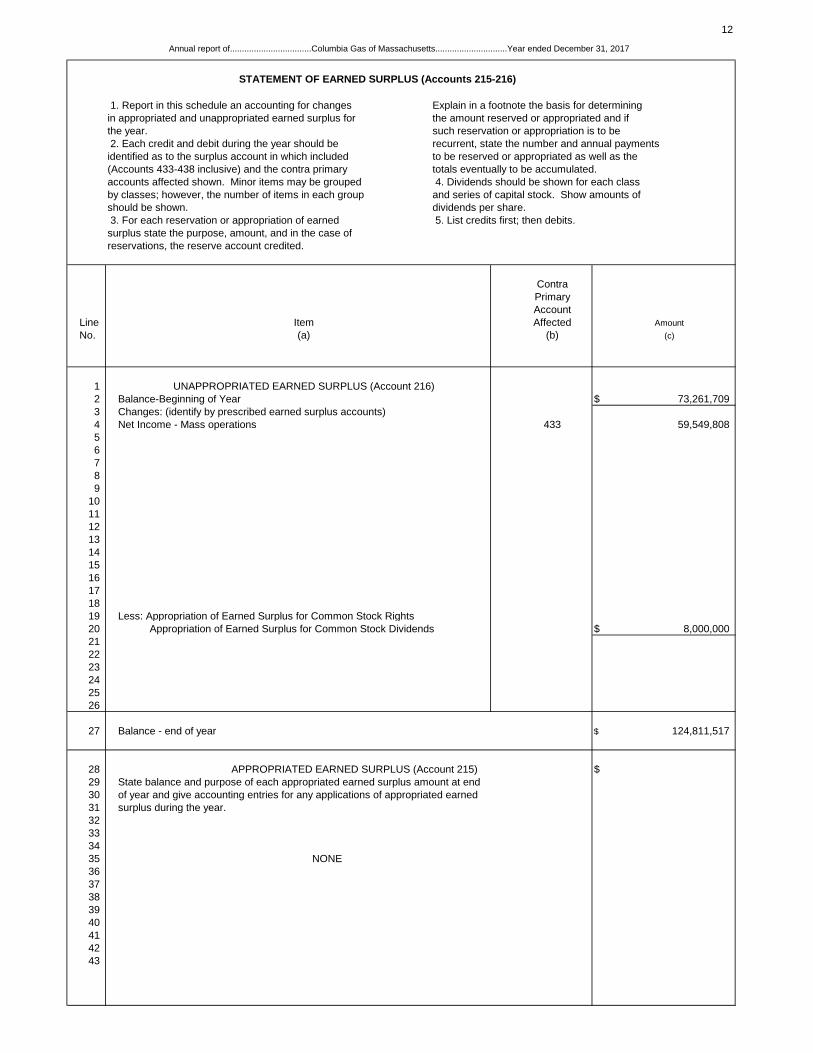
STATEMENT OF EARNED SURPLUS (Accounts 215-216)
1. Report in this schedule an accounting for changes Explain in a footnote the basis for determiningin appropriated and unappropriated earned surplus for the amount reserved or appropriated and ifthe year. such reservation or appropriation is to be 2. Each credit and debit during the year should be recurrent, state the number and annual payments identified as to the surplus account in which included to be reserved or appropriated as well as the(Accounts 433-438 inclusive) and the contra primary totals eventually to be accumulated.accounts affected shown. Minor items may be grouped 4. Dividends should be shown for each classby classes; however, the number of items in each group and series of capital stock. Show amounts ofshould be shown. dividends per share. 3. For each reservation or appropriation of earned 5. List credits first; then debits.surplus state the purpose, amount, and in the case ofreservations, the reserve account credited.
ContraPrimaryAccount
Line Item Affected AmountNo. (a) (b) (c)
1 UNAPPROPRIATED EARNED SURPLUS (Account 216)2 Balance-Beginning of Year $ 73,261,7093 Changes: (identify by prescribed earned surplus accounts)4 Net Income - Mass operations 433 59,549,80856789
10111213141516171819 Less: Appropriation of Earned Surplus for Common Stock Rights20 Appropriation of Earned Surplus for Common Stock Dividends $ 8,000,000212223242526
27 Balance - end of year $ 124,811,517
28 APPROPRIATED EARNED SURPLUS (Account 215) $29 State balance and purpose of each appropriated earned surplus amount at end 30 of year and give accounting entries for any applications of appropriated earned 31 surplus during the year.32333435 NONE3637383940414243
13
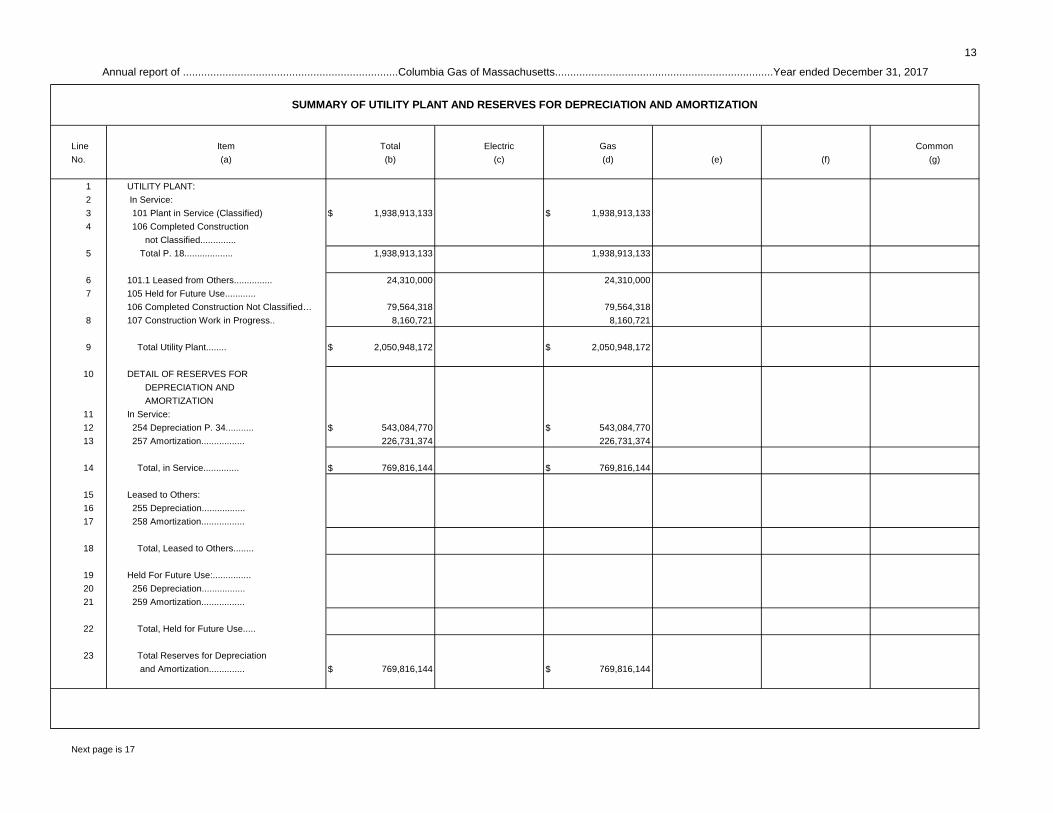
SUMMARY OF UTILITY PLANT AND RESERVES FOR DEPRECIATION AND AMORTIZATION
Line Item Total Electric Gas CommonNo. (a) (b) (c) (d) (e) (f) (g)
1 UTILITY PLANT:2 In Service:3 101 Plant in Service (Classified) $ 1,938,913,133 $ 1,938,913,1334 106 Completed Construction
not Classified..............5 Total P. 18................... 1,938,913,133 1,938,913,133
6 101.1 Leased from Others............... 24,310,000 24,310,0007 105 Held for Future Use............
106 Completed Construction Not Classified… 79,564,318 79,564,3188 107 Construction Work in Progress.. 8,160,721 8,160,721
9 Total Utility Plant........ $ 2,050,948,172 $ 2,050,948,172
10 DETAIL OF RESERVES FOR DEPRECIATION AND AMORTIZATION
11 In Service:12 254 Depreciation P. 34........... $ 543,084,770 $ 543,084,77013 257 Amortization................. 226,731,374 226,731,374
14 Total, in Service.............. $ 769,816,144 $ 769,816,144
15 Leased to Others:16 255 Depreciation.................17 258 Amortization.................
18 Total, Leased to Others........
19 Held For Future Use:...............20 256 Depreciation.................21 259 Amortization.................
22 Total, Held for Future Use.....
23 Total Reserves for Depreciation and Amortization.............. $ 769,816,144 $ 769,816,144
Next page is 17
Annual report of .......................................................................Columbia Gas of Massachusetts........................................................................Year ended December 31, 2017
17
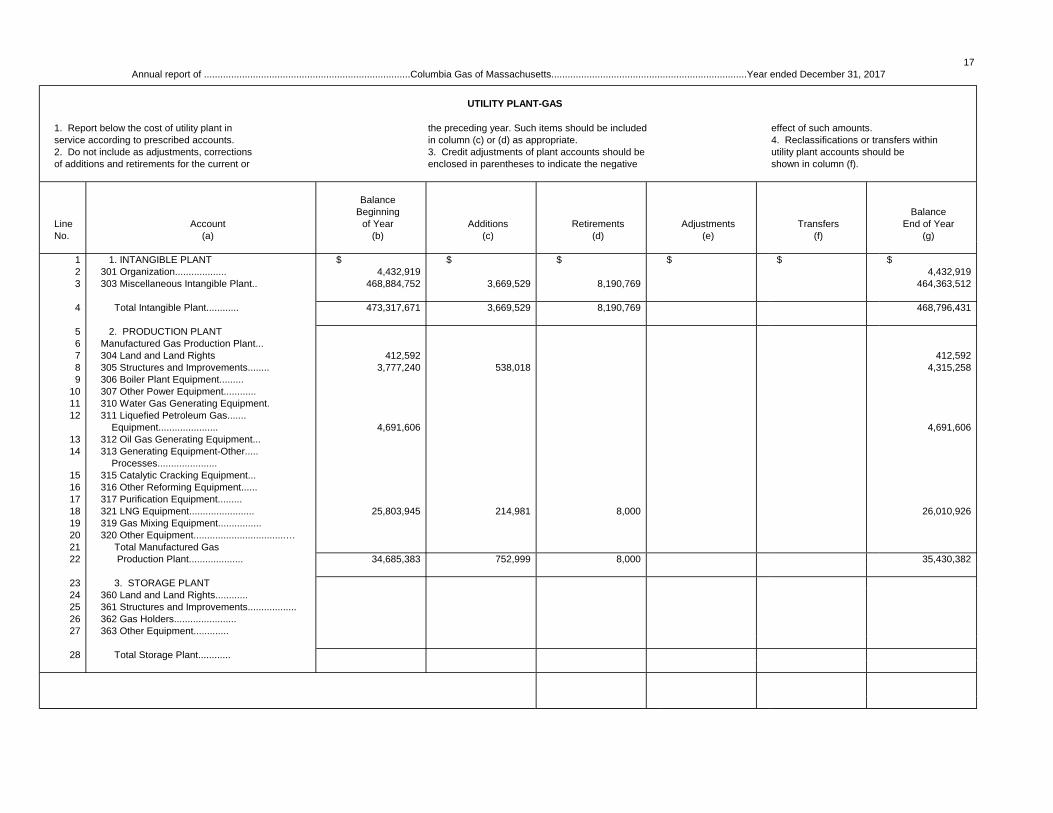
UTILITY PLANT-GAS
1. Report below the cost of utility plant in the preceding year. Such items should be included effect of such amounts.service according to prescribed accounts. in column (c) or (d) as appropriate. 4. Reclassifications or transfers within2. Do not include as adjustments, corrections 3. Credit adjustments of plant accounts should be utility plant accounts should beof additions and retirements for the current or enclosed in parentheses to indicate the negative shown in column (f).
BalanceBeginning Balance
Line Account of Year Additions Retirements Adjustments Transfers End of YearNo. (a) (b) (c) (d) (e) (f) (g)
1 1. INTANGIBLE PLANT $ $ $ $ $ $2 301 Organization................... 4,432,919 4,432,9193 303 Miscellaneous Intangible Plant.. 468,884,752 3,669,529 8,190,769 464,363,512
4 Total Intangible Plant............ 473,317,671 3,669,529 8,190,769 468,796,431
5 2. PRODUCTION PLANT6 Manufactured Gas Production Plant...7 304 Land and Land Rights 412,592 412,5928 305 Structures and Improvements........ 3,777,240 538,018 4,315,2589 306 Boiler Plant Equipment.........
10 307 Other Power Equipment............11 310 Water Gas Generating Equipment.12 311 Liquefied Petroleum Gas.......
Equipment...................... 4,691,606 4,691,60613 312 Oil Gas Generating Equipment...14 313 Generating Equipment-Other.....
Processes......................15 315 Catalytic Cracking Equipment...16 316 Other Reforming Equipment......17 317 Purification Equipment.........18 321 LNG Equipment........................ 25,803,945 214,981 8,000 26,010,92619 319 Gas Mixing Equipment................20 320 Other Equipment..................................…21 Total Manufactured Gas22 Production Plant.................... 34,685,383 752,999 8,000 35,430,382
23 3. STORAGE PLANT24 360 Land and Land Rights............25 361 Structures and Improvements..................26 362 Gas Holders.......................27 363 Other Equipment.............
28 Total Storage Plant............
Annual report of ............................................................................Columbia Gas of Massachusetts........................................................................Year ended December 31, 2017
18
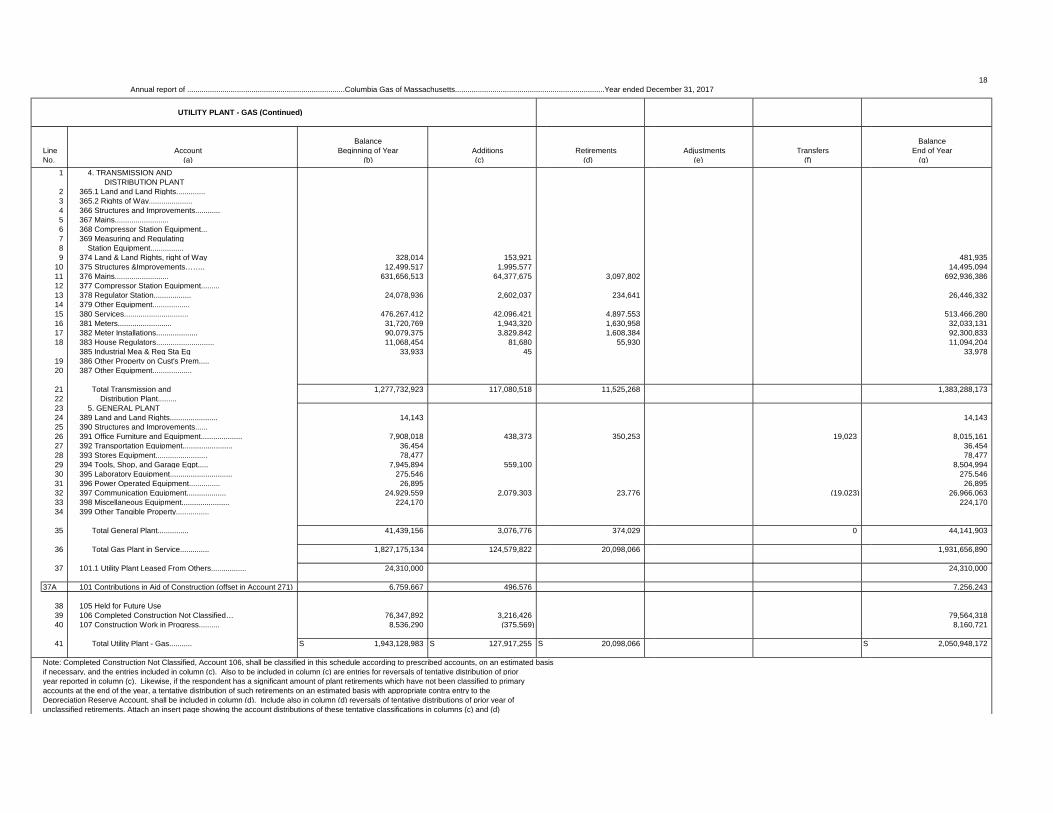
UTILITY PLANT - GAS (Continued)
Balance BalanceLine Account Beginning of Year Additions Retirements Adjustments Transfers End of YearNo. (a) (b) (c) (d) (e) (f) (g)
1 4. TRANSMISSION AND DISTRIBUTION PLANT
2 365.1 Land and Land Rights..............3 365.2 Rights of Way.....................4 366 Structures and Improvements............5 367 Mains..........................6 368 Compressor Station Equipment...7 369 Measuring and Regulating8 Station Equipment................9 374 Land & Land Rights, right of Way 328,014 153,921 481,935
10 375 Structures &Improvements…….. 12,499,517 1,995,577 14,495,09411 376 Mains.......................... 631,656,513 64,377,675 3,097,802 692,936,38612 377 Compressor Station Equipment.........13 378 Regulator Station.................. 24,078,936 2,602,037 234,641 26,446,33214 379 Other Equipment..................15 380 Services............................... 476,267,412 42,096,421 4,897,553 513,466,28016 381 Meters.......................... 31,720,769 1,943,320 1,630,958 32,033,13117 382 Meter Installations.................... 90,079,375 3,829,842 1,608,384 92,300,83318 383 House Regulators............................ 11,068,454 81,680 55,930 11,094,204
385 Industrial Mea & Reg Sta Eq 33,933 45 33,97819 386 Other Property on Cust's Prem.....20 387 Other Equipment...................
21 Total Transmission and 1,277,732,923 117,080,518 11,525,268 1,383,288,17322 Distribution Plant.........23 5. GENERAL PLANT24 389 Land and Land Rights....................... 14,143 14,14325 390 Structures and Improvements......26 391 Office Furniture and Equipment.................... 7,908,018 438,373 350,253 19,023 8,015,16127 392 Transportation Equipment........................ 36,454 36,45428 393 Stores Equipment......................... 78,477 78,47729 394 Tools, Shop, and Garage Eqpt..... 7,945,894 559,100 8,504,99430 395 Laboratory Equipment.............................. 275,546 275,54631 396 Power Operated Equipment............... 26,895 26,89532 397 Communication Equipment................... 24,929,559 2,079,303 23,776 (19,023) 26,966,06333 398 Miscellaneous Equipment....................... 224,170 224,17034 399 Other Tangible Property................
35 Total General Plant............... 41,439,156 3,076,776 374,029 0 44,141,903
36 Total Gas Plant in Service.............. 1,827,175,134 124,579,822 20,098,066 1,931,656,890
37 101.1 Utility Plant Leased From Others................. 24,310,000 24,310,000
37A 101 Contributions in Aid of Construction (offset in Account 271) 6,759,667 496,576 7,256,243
38 105 Held for Future Use 39 106 Completed Construction Not Classified… 76,347,892 3,216,426 79,564,31840 107 Construction Work in Progress.......... 8,536,290 (375,569) 8,160,721
41 Total Utility Plant - Gas........... S 1,943,128,983 S 127,917,255 S 20,098,066 S 2,050,948,172
Note: Completed Construction Not Classified, Account 106, shall be classified in this schedule according to prescribed accounts, on an estimated basisif necessary, and the entries included in column (c). Also to be included in column (c) are entries for reversals of tentative distribution of prioryear reported in column (c). Likewise, if the respondent has a significant amount of plant retirements which have not been classified to primary accounts at the end of the year, a tentative distribution of such retirements on an estimated basis with appropriate contra entry to theDepreciation Reserve Account, shall be included in column (d). Include also in column (d) reversals of tentative distributions of prior year of unclassified retirements. Attach an insert page showing the account distributions of these tentative classifications in columns (c) and (d)
Annual report of ............................................................................Columbia Gas of Massachusetts........................................................................Year ended December 31, 2017
I
19
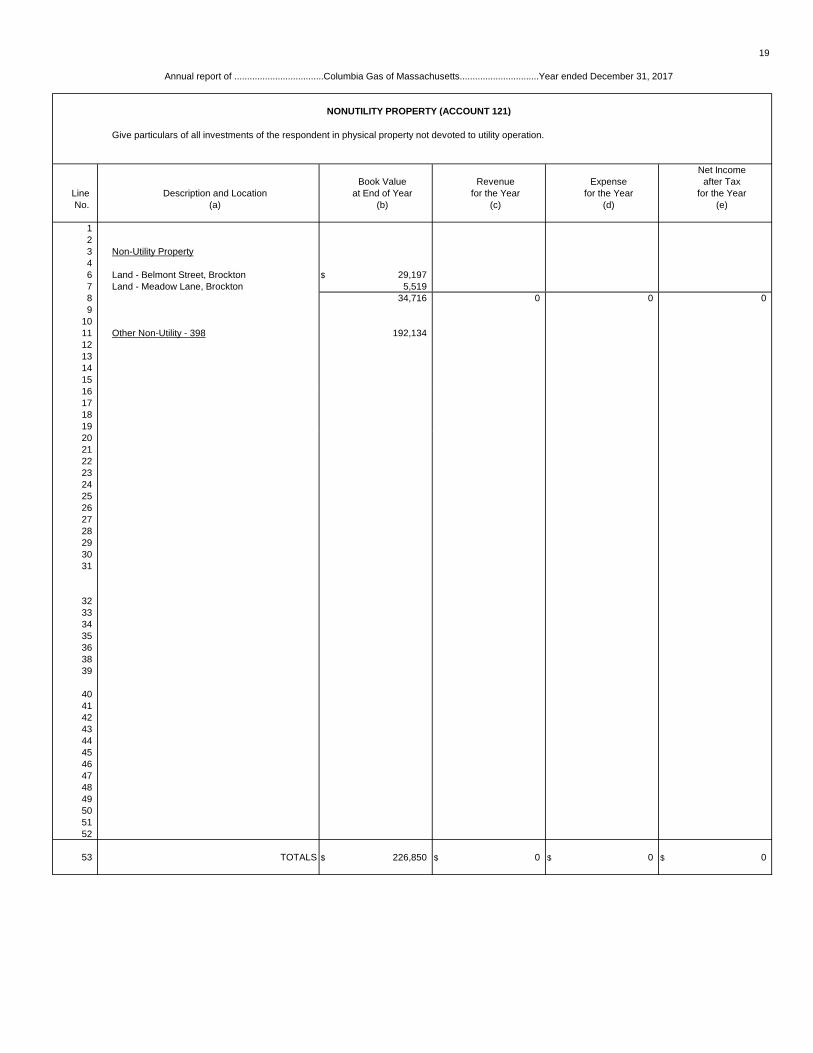
NONUTILITY PROPERTY (ACCOUNT 121)
Give particulars of all investments of the respondent in physical property not devoted to utility operation.
Net IncomeBook Value Revenue Expense after Tax
Line Description and Location at End of Year for the Year for the Year for the YearNo. (a) (b) (c) (d) (e)
123 Non-Utility Property46 Land - Belmont Street, Brockton $ 29,1977 Land - Meadow Lane, Brockton 5,5198 34,716 0 0 09
1011 Other Non-Utility - 398 192,1341213141516171819202122232425262728293031
32333435363839
40414243444546474849505152
53 TOTALS $ 226,850 $ 0 $ 0 $ 0
Annual report of ...................................Columbia Gas of Massachusetts...............................Year ended December 31, 2017
20
Annual report of...........................Columbia Gas of Massachusetts...........................Year ended December 31, 2017
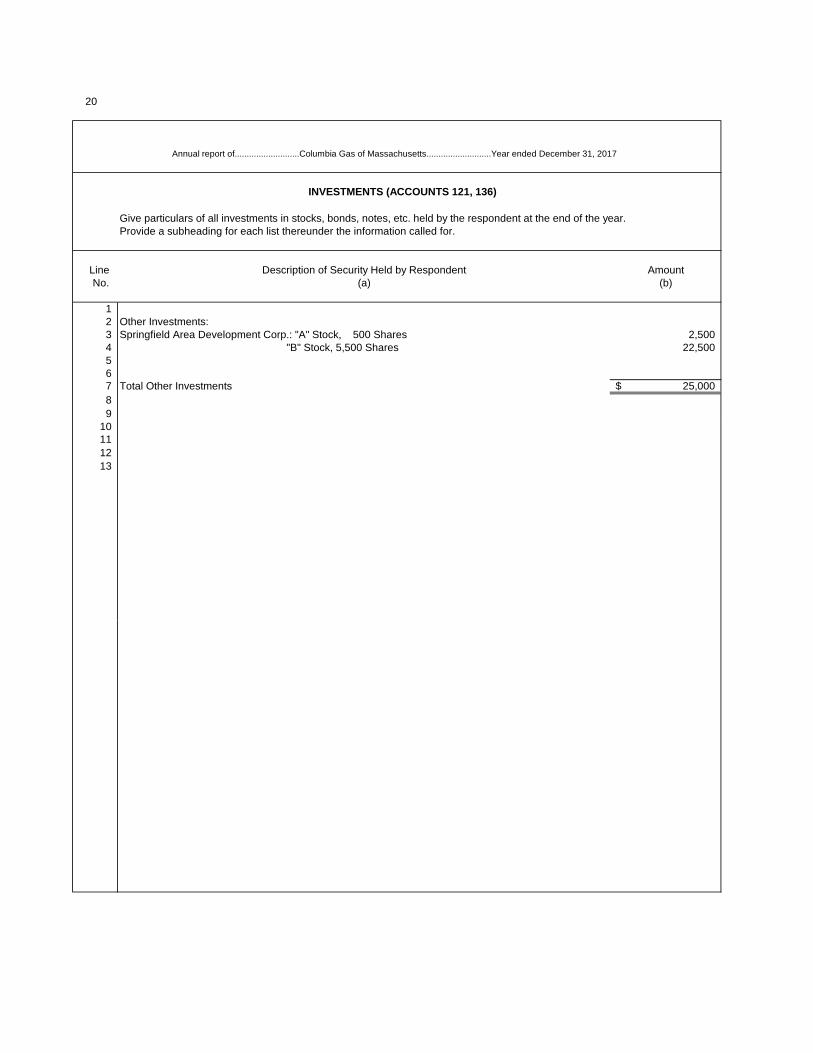
INVESTMENTS (ACCOUNTS 121, 136)
Give particulars of all investments in stocks, bonds, notes, etc. held by the respondent at the end of the year.Provide a subheading for each list thereunder the information called for.
Line Description of Security Held by Respondent AmountNo. (a) (b)
12 Other Investments:3 Springfield Area Development Corp.: "A" Stock, 500 Shares 2,5004 "B" Stock, 5,500 Shares 22,500567 Total Other Investments 25,000$ 89
10111213
21Annual report of.........................Columbia Gas of Massachusetts.........................Year ended December 31, 2017
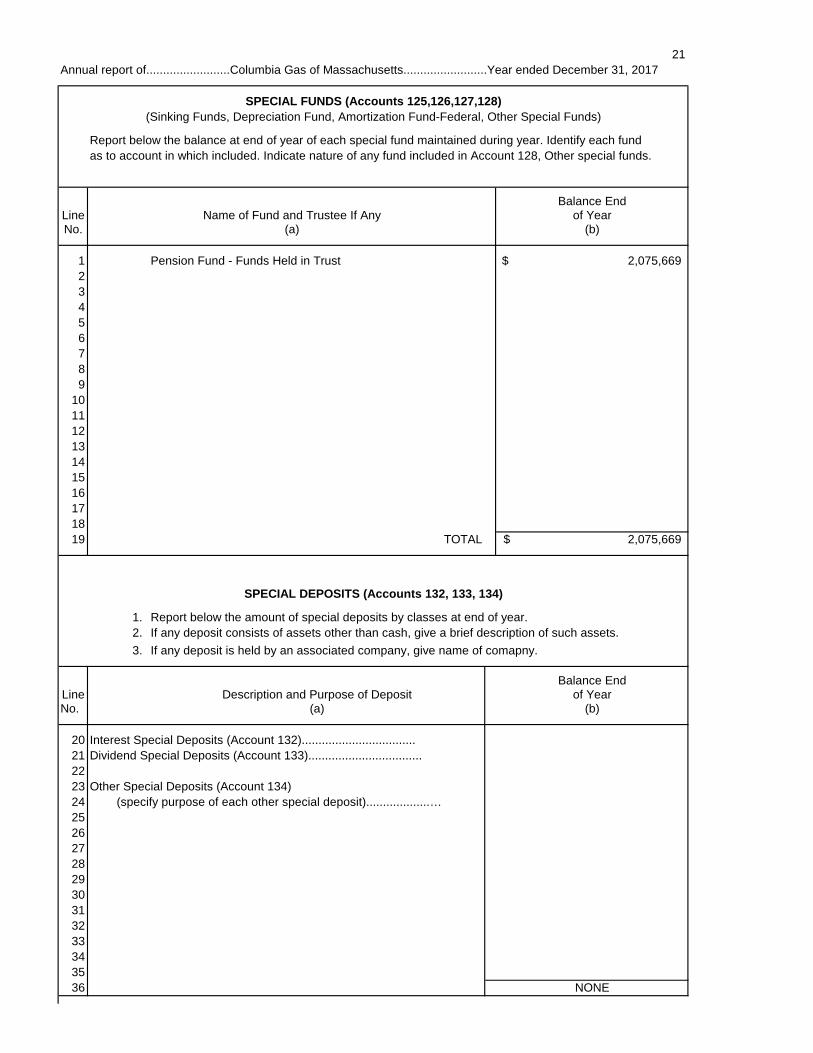
SPECIAL FUNDS (Accounts 125,126,127,128)(Sinking Funds, Depreciation Fund, Amortization Fund-Federal, Other Special Funds)
Report below the balance at end of year of each special fund maintained during year. Identify each fund as to account in which included. Indicate nature of any fund included in Account 128, Other special funds.
Balance EndLine Name of Fund and Trustee If Any of YearNo. (a) (b)
1 Pension Fund - Funds Held in Trust 2,075,669$ 23456789
10111213141516171819 TOTAL 2,075,669$
SPECIAL DEPOSITS (Accounts 132, 133, 134)
1. Report below the amount of special deposits by classes at end of year.2. If any deposit consists of assets other than cash, give a brief description of such assets.3. If any deposit is held by an associated company, give name of comapny.
Balance EndLine Description and Purpose of Deposit of YearNo. (a) (b)
20 Interest Special Deposits (Account 132)..................................21 Dividend Special Deposits (Account 133)..................................2223 Other Special Deposits (Account 134)24 (specify purpose of each other special deposit)...................…252627282930313233343536 NONE
22
Annual report of........................................Columbia Gas of Massachusetts........................................Year ended December 31, 2017
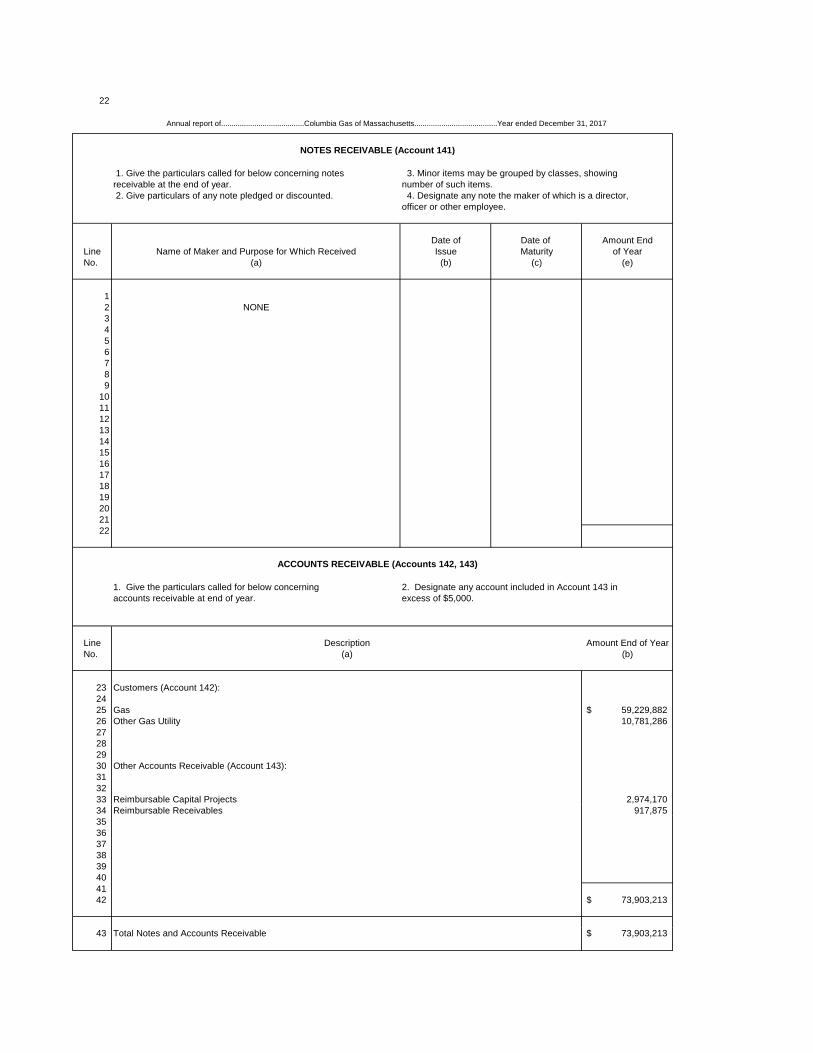
NOTES RECEIVABLE (Account 141)
1. Give the particulars called for below concerning notes 3. Minor items may be grouped by classes, showingreceivable at the end of year. number of such items. 2. Give particulars of any note pledged or discounted. 4. Designate any note the maker of which is a director,
officer or other employee.
Date of Date of Amount EndLine Name of Maker and Purpose for Which Received Issue Maturity of YearNo. (a) (b) (c) (e)
12 NONE3456789
10111213141516171819202122
ACCOUNTS RECEIVABLE (Accounts 142, 143)
1. Give the particulars called for below concerning 2. Designate any account included in Account 143 in accounts receivable at end of year. excess of $5,000.
Line Description Amount End of YearNo. (a) (b)
23 Customers (Account 142):24 25 Gas 59,229,882$ 26 Other Gas Utility 10,781,286 27282930 Other Accounts Receivable (Account 143):313233 Reimbursable Capital Projects 2,974,170 34 Reimbursable Receivables 917,875 3536373839404142 73,903,213$
43 Total Notes and Accounts Receivable 73,903,213$
23
Annual report of........................................Columbia Gas of Massachusetts........................................Year ended December 31, 2017
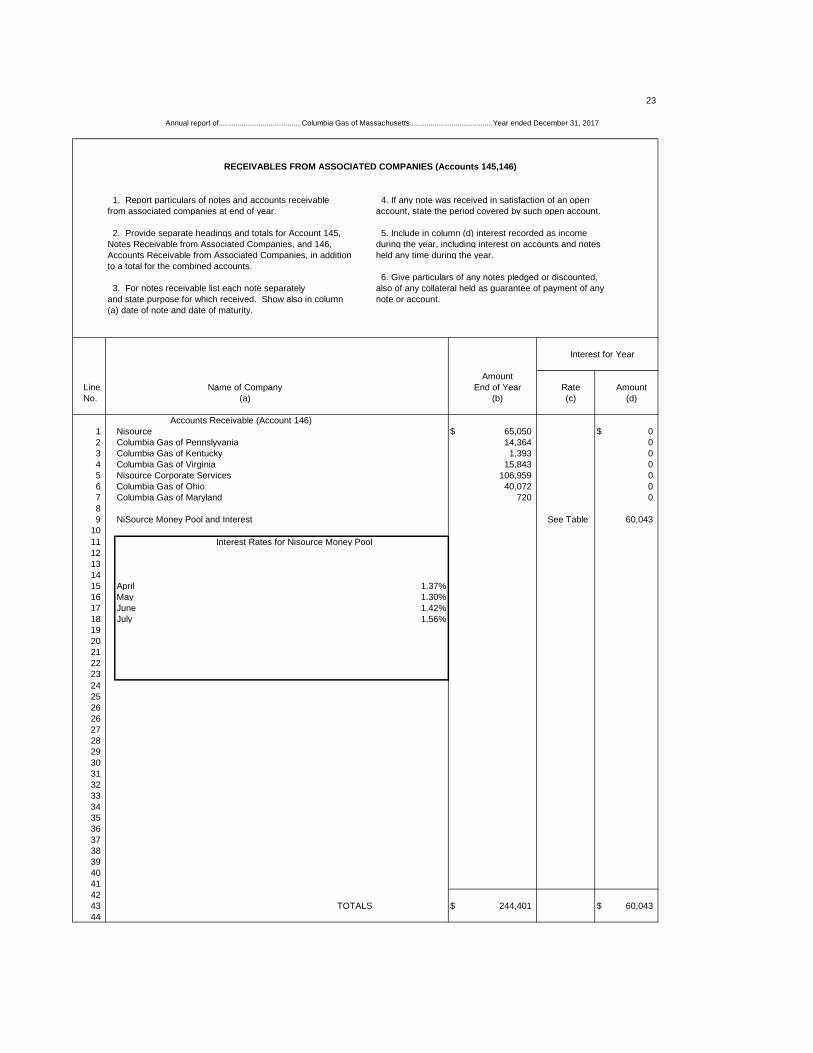
RECEIVABLES FROM ASSOCIATED COMPANIES (Accounts 145,146)
1. Report particulars of notes and accounts receivable 4. If any note was received in satisfaction of an openfrom associated companies at end of year. account, state the period covered by such open account.
2. Provide separate headings and totals for Account 145, 5. Include in column (d) interest recorded as incomeNotes Receivable from Associated Companies, and 146, during the year, including interest on accounts and notesAccounts Receivable from Associated Companies, in addition held any time during the year.to a total for the combined accounts.
6. Give particulars of any notes pledged or discounted, 3. For notes receivable list each note separately also of any collateral held as guarantee of payment of anyand state purpose for which received. Show also in column note or account.(a) date of note and date of maturity.
Interest for Year
AmountLine Name of Company End of Year Rate AmountNo. (a) (b) (c) (d)
Accounts Receivable (Account 146)1 Nisource $ 65,050 $ 02 Columbia Gas of Pennslyvania 14,364 03 Columbia Gas of Kentucky 1,393 04 Columbia Gas of Virginia 15,843 05 Nisource Corporate Services 106,959 06 Columbia Gas of Ohio 40,072 07 Columbia Gas of Maryland 720 089 NiSource Money Pool and Interest See Table 60,043
1011 Interest Rates for Nisource Money Pool12131415 April 1.37%16 May 1.30%17 June 1.42%18 July 1.56%1920212223242526262728293031323334353637383940414243 TOTALS $ 244,401 $ 60,04344
24
Annual report of.............................Columbia Gas of Massachusetts..........................Year ended December 31, 2017
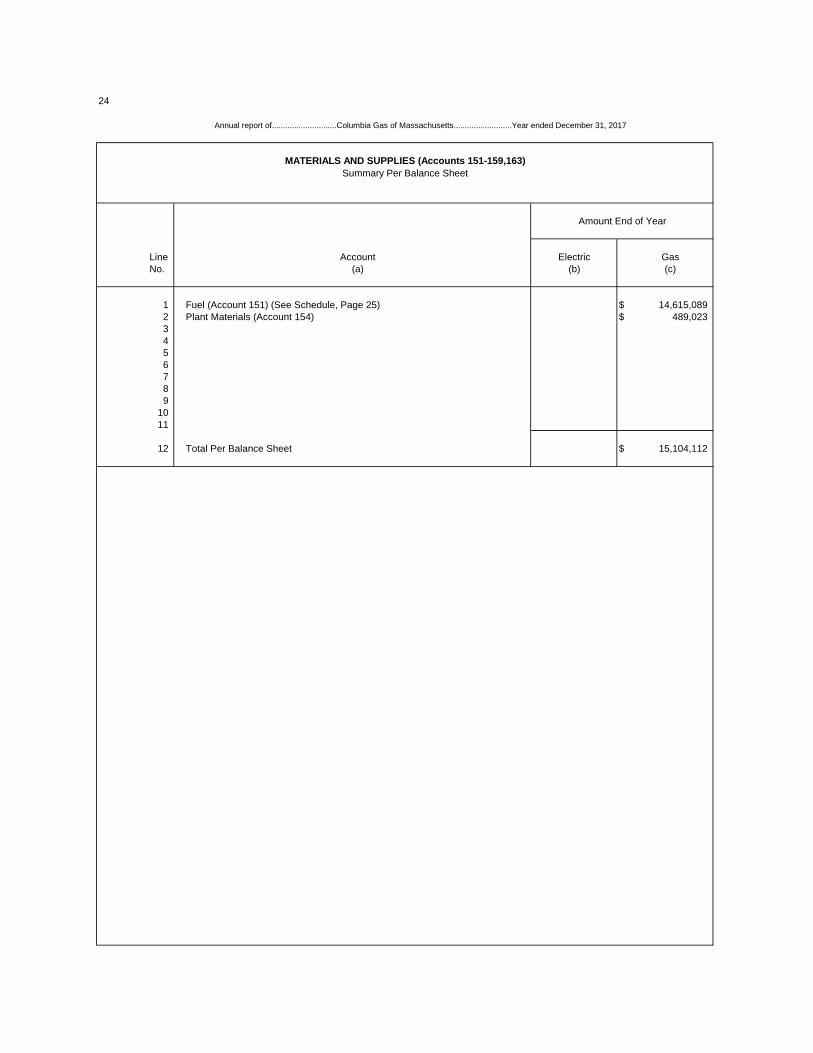
MATERIALS AND SUPPLIES (Accounts 151-159,163)Summary Per Balance Sheet
Amount End of Year
Line Account Electric GasNo. (a) (b) (c)
1 Fuel (Account 151) (See Schedule, Page 25) $ 14,615,0892 Plant Materials (Account 154) $ 489,0233 456 7 8 9
1011
12 Total Per Balance Sheet $ 15,104,112
25 Annual report of ……………..……..Columbia Gas of Massachusetts……………..……..Year ended December 31, 2017
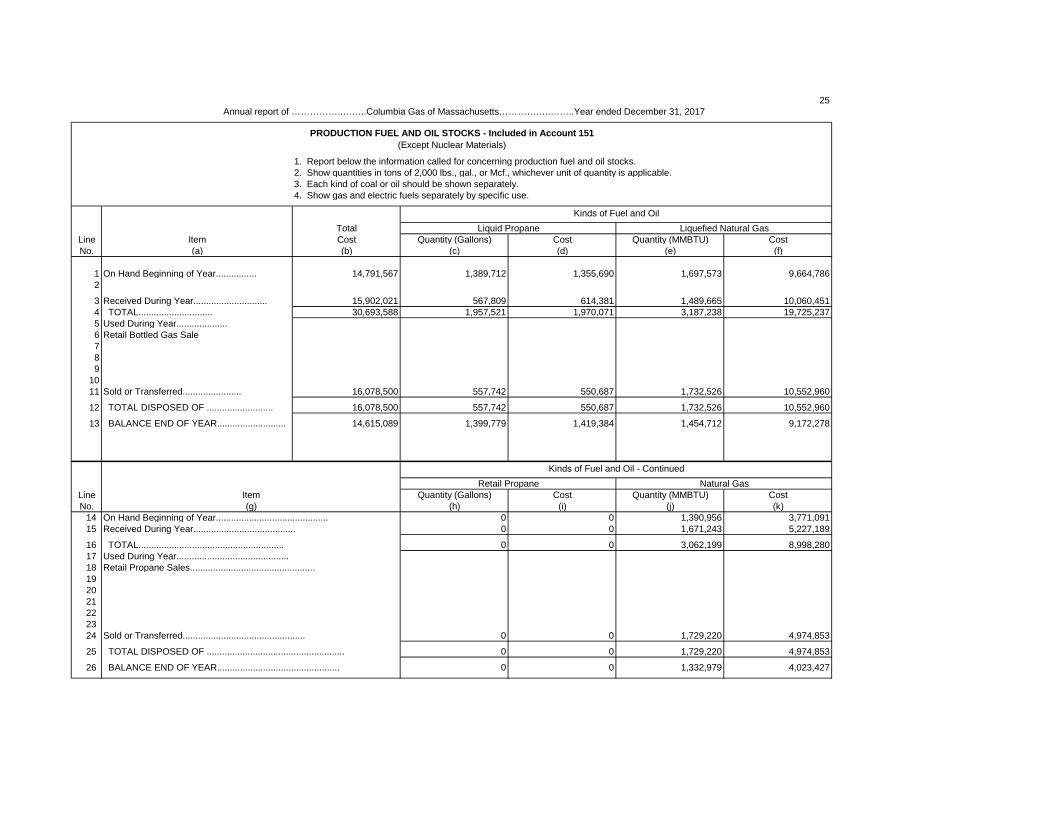
PRODUCTION FUEL AND OIL STOCKS - Included in Account 151(Except Nuclear Materials)
1. Report below the information called for concerning production fuel and oil stocks.2. Show quantities in tons of 2,000 lbs., gal., or Mcf., whichever unit of quantity is applicable.3. Each kind of coal or oil should be shown separately.4. Show gas and electric fuels separately by specific use.
Kinds of Fuel and OilTotal Liquid Propane Liquefied Natural Gas
Line Item Cost Quantity (Gallons) Cost Quantity (MMBTU) CostNo. (a) (b) (c) (d) (e) (f)
1 On Hand Beginning of Year................ 14,791,567 1,389,712 1,355,690 1,697,573 9,664,7862
3 Received During Year............................. 15,902,021 567,809 614,381 1,489,665 10,060,4514 TOTAL............................. 30,693,588 1,957,521 1,970,071 3,187,238 19,725,2375 Used During Year....................6 Retail Bottled Gas Sale789
1011 Sold or Transferred....................... 16,078,500 557,742 550,687 1,732,526 10,552,960
12 TOTAL DISPOSED OF .......................... 16,078,500 557,742 550,687 1,732,526 10,552,960
13 BALANCE END OF YEAR........................... 14,615,089 1,399,779 1,419,384 1,454,712 9,172,278
Kinds of Fuel and Oil - ContinuedRetail Propane Natural Gas
Line Item Quantity (Gallons) Cost Quantity (MMBTU) CostNo. (g) (h) (i) (j) (k)
14 On Hand Beginning of Year............................................ 0 0 1,390,956 3,771,09115 Received During Year........................................ 0 0 1,671,243 5,227,189
16 TOTAL......................................................... 0 0 3,062,199 8,998,28017 Used During Year............................................18 Retail Propane Sales.................................................192021222324 Sold or Transferred................................................ 0 0 1,729,220 4,974,853
25 TOTAL DISPOSED OF ...................................................... 0 0 1,729,220 4,974,853
26 BALANCE END OF YEAR................................................ 0 0 1,332,979 4,023,427
26
Annual report of .................……………....................................Columbia Gas of Massachusetts.............………………................Year ended December 31, 2017
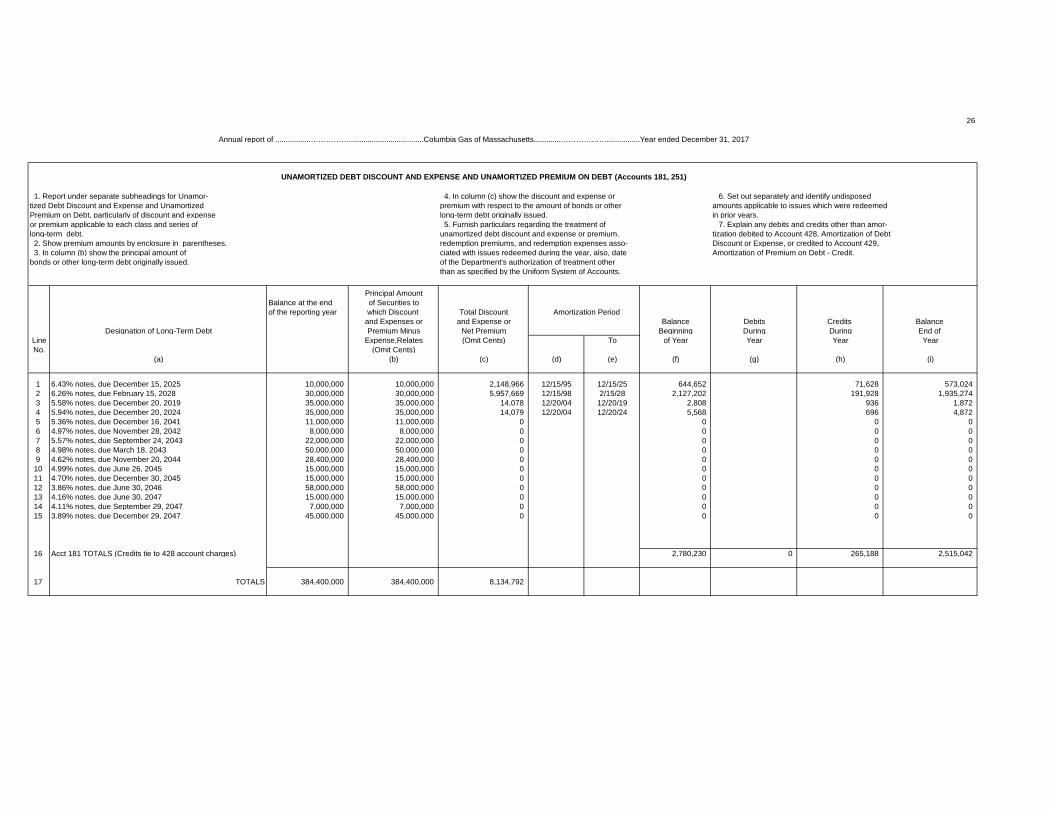
UNAMORTIZED DEBT DISCOUNT AND EXPENSE AND UNAMORTIZED PREMIUM ON DEBT (Accounts 181, 251)
1. Report under separate subheadings for Unamor- 4. In column (c) show the discount and expense or 6. Set out separately and identify undisposedtized Debt Discount and Expense and Unamortized premium with respect to the amount of bonds or other amounts applicable to issues which were redeemedPremium on Debt, particularly of discount and expense long-term debt originally issued. in prior years.or premium applicable to each class and series of 5. Furnish particulars regarding the treatment of 7. Explain any debits and credits other than amor-long-term debt. unamortized debt discount and expense or premium, tization debited to Account 428, Amortization of Debt 2. Show premium amounts by enclosure in parentheses. redemption premiums, and redemption expenses asso- Discount or Expense, or credited to Account 429, 3. In column (b) show the principal amount of ciated with issues redeemed during the year, also, date Amortization of Premium on Debt - Credit.bonds or other long-term debt originally issued. of the Department's authorization of treatment other
than as specified by the Uniform System of Accounts.
Principal AmountBalance at the end of Securities toof the reporting year which Discount Total Discount
and Expenses or and Expense or Balance Debits Credits Balance Designation of Long-Term Debt Premium Minus Net Premium Beginning During During End of
Line Expense,Relates (Omit Cents) To of Year Year Year YearNo. (Omit Cents)
(a) (b) (c) (d) (e) (f) (g) (h) (i)
1 6.43% notes, due December 15, 2025 10,000,000 10,000,000 2,148,966 12/15/95 12/15/25 644,652 71,628 573,0242 6.26% notes, due February 15, 2028 30,000,000 30,000,000 5,957,669 12/15/98 2/15/28 2,127,202 191,928 1,935,2743 5.58% notes, due December 20, 2019 35,000,000 35,000,000 14,078 12/20/04 12/20/19 2,808 936 1,8724 5.94% notes, due December 20, 2024 35,000,000 35,000,000 14,079 12/20/04 12/20/24 5,568 696 4,8725 5.36% notes, due December 16, 2041 11,000,000 11,000,000 0 0 0 06 4.97% notes, due November 28, 2042 8,000,000 8,000,000 0 0 0 07 5.57% notes, due September 24, 2043 22,000,000 22,000,000 0 0 0 08 4.98% notes, due March 18, 2043 50,000,000 50,000,000 0 0 0 09 4.62% notes, due November 20, 2044 28,400,000 28,400,000 0 0 0 010 4.99% notes, due June 26, 2045 15,000,000 15,000,000 0 0 0 011 4.70% notes, due December 30, 2045 15,000,000 15,000,000 0 0 0 012 3.86% notes, due June 30, 2046 58,000,000 58,000,000 0 0 0 013 4.16% notes, due June 30, 2047 15,000,000 15,000,000 0 0 0 014 4.11% notes, due September 29, 2047 7,000,000 7,000,000 0 0 0 015 3.89% notes, due December 29, 2047 45,000,000 45,000,000 0 0 0 0
16 Acct 181 TOTALS (Credits tie to 428 account charges) 2,780,230 0 265,188 2,515,042
17 TOTALS 384,400,000 384,400,000 8,134,792
Amortization Period
27
Annual report of ................................Columbia Gas of Massachusetts.......................................Year ended December 31, 2017
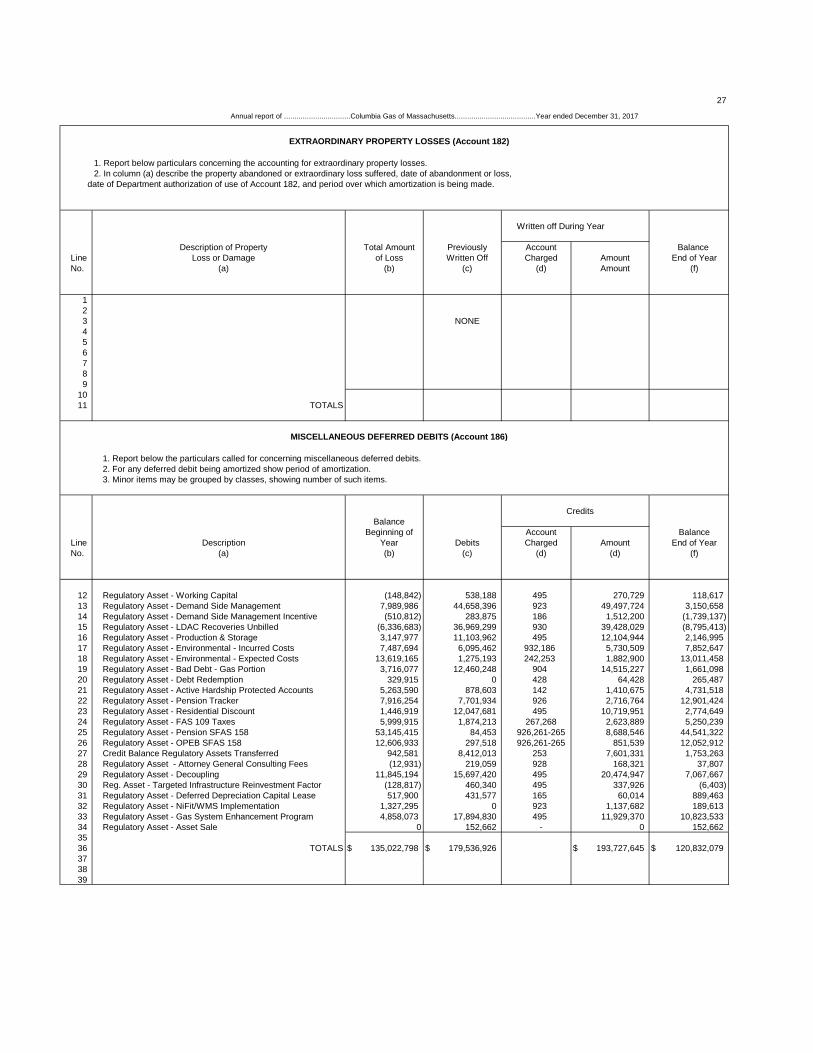
EXTRAORDINARY PROPERTY LOSSES (Account 182)
1. Report below particulars concerning the accounting for extraordinary property losses.2. In column (a) describe the property abandoned or extraordinary loss suffered, date of abandonment or loss,
date of Department authorization of use of Account 182, and period over which amortization is being made.
Written off During Year
Description of Property Total Amount Previously Account Balance Line Loss or Damage of Loss Written Off Charged Amount End of YearNo. (a) (b) (c) (d) Amount (f)
123 NONE456789
1011 TOTALS
MISCELLANEOUS DEFERRED DEBITS (Account 186)
1. Report below the particulars called for concerning miscellaneous deferred debits.2. For any deferred debit being amortized show period of amortization.3. Minor items may be grouped by classes, showing number of such items.
CreditsBalance
Beginning of Account BalanceLine Description Year Debits Charged Amount End of YearNo. (a) (b) (c) (d) (d) (f)
12 Regulatory Asset - Working Capital (148,842) 538,188 495 270,729 118,61713 Regulatory Asset - Demand Side Management 7,989,986 44,658,396 923 49,497,724 3,150,65814 Regulatory Asset - Demand Side Management Incentive (510,812) 283,875 186 1,512,200 (1,739,137)15 Regulatory Asset - LDAC Recoveries Unbilled (6,336,683) 36,969,299 930 39,428,029 (8,795,413)16 Regulatory Asset - Production & Storage 3,147,977 11,103,962 495 12,104,944 2,146,99517 Regulatory Asset - Environmental - Incurred Costs 7,487,694 6,095,462 932,186 5,730,509 7,852,64718 Regulatory Asset - Environmental - Expected Costs 13,619,165 1,275,193 242,253 1,882,900 13,011,45819 Regulatory Asset - Bad Debt - Gas Portion 3,716,077 12,460,248 904 14,515,227 1,661,09820 Regulatory Asset - Debt Redemption 329,915 0 428 64,428 265,48721 Regulatory Asset - Active Hardship Protected Accounts 5,263,590 878,603 142 1,410,675 4,731,51822 Regulatory Asset - Pension Tracker 7,916,254 7,701,934 926 2,716,764 12,901,42423 Regulatory Asset - Residential Discount 1,446,919 12,047,681 495 10,719,951 2,774,64924 Regulatory Asset - FAS 109 Taxes 5,999,915 1,874,213 267,268 2,623,889 5,250,23925 Regulatory Asset - Pension SFAS 158 53,145,415 84,453 926,261-265 8,688,546 44,541,32226 Regulatory Asset - OPEB SFAS 158 12,606,933 297,518 926,261-265 851,539 12,052,91227 Credit Balance Regulatory Assets Transferred 942,581 8,412,013 253 7,601,331 1,753,26328 Regulatory Asset - Attorney General Consulting Fees (12,931) 219,059 928 168,321 37,80729 Regulatory Asset - Decoupling 11,845,194 15,697,420 495 20,474,947 7,067,66730 Reg. Asset - Targeted Infrastructure Reinvestment Factor (128,817) 460,340 495 337,926 (6,403)31 Regulatory Asset - Deferred Depreciation Capital Lease 517,900 431,577 165 60,014 889,46332 Regulatory Asset - NiFit/WMS Implementation 1,327,295 0 923 1,137,682 189,61333 Regulatory Asset - Gas System Enhancement Program 4,858,073 17,894,830 495 11,929,370 10,823,53334 Regulatory Asset - Asset Sale 0 152,662 - 0 152,6623536 TOTALS $ 135,022,798 $ 179,536,926 $ 193,727,645 $ 120,832,079373839

THIS PAGE INTENTIONALLY LEFT BLANK[NEXT PAGE IS 29]
29
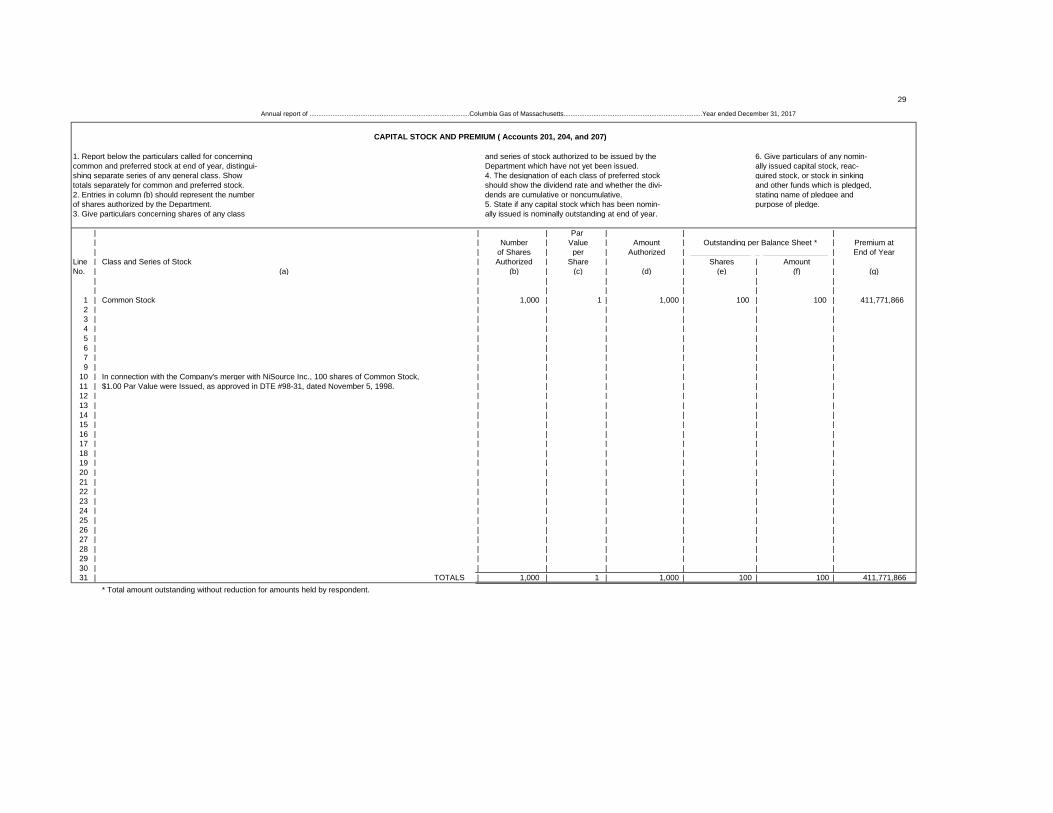
CAPITAL STOCK AND PREMIUM ( Accounts 201, 204, and 207)
1. Report below the particulars called for concerning and series of stock authorized to be issued by the 6. Give particulars of any nomin-common and preferred stock at end of year, distingui- Department which have not yet been issued. ally issued capital stock, reac-shing separate series of any general class. Show 4. The designation of each class of preferred stock quired stock, or stock in sinkingtotals separately for common and preferred stock. should show the dividend rate and whether the divi- and other funds which is pledged,2. Entries in column (b) should represent the number dends are cumulative or noncumulative. stating name of pledgee andof shares authorized by the Department. 5. State if any capital stock which has been nomin- purpose of pledge.3. Give particulars concerning shares of any class ally issued is nominally outstanding at end of year.
| | | Par | | || | Number | Value | Amount | Outstanding per Balance Sheet * | Premium at| | of Shares | per | Authorized | ______________ _ _______________ | End of Year
Line | Class and Series of Stock | Authorized | Share | | Shares | Amount |No. | (a) | (b) | (c) | (d) | (e) | (f) | (g)
| | | | | | |____ | ____________________________________________________________________________________ _ | _____________ | ___________ | _______________ | ______________ | _______________ | _______________ _
1 | Common Stock | 1,000 | 1 | 1,000 | 100 | 100 | 411,771,8662 | | | | | | |3 | | | | | | |4 | | | | | | |5 | | | | | | |6 | | | | | | |7 | | | | | | |9 | | | | | | |
10 | In connection with the Company's merger with NiSource Inc., 100 shares of Common Stock, | | | | | |11 | $1.00 Par Value were Issued, as approved in DTE #98-31, dated November 5, 1998. | | | | | |12 | | | | | | |13 | | | | | | |14 | | | | | | |15 | | | | | | |16 | | | | | | |17 | | | | | | |18 | | | | | | |19 | | | | | | |20 | | | | | | |21 | | | | | | |22 | | | | | | |23 | | | | | | |24 | | | | | | |25 | | | | | | |26 | | | | | | |27 | | | | | | |28 | | | | | | |29 | | | | | | |30 | | | | | | |31 | TOTALS | 1,000 | 1 | 1,000 | 100 | 100 | 411,771,866
* Total amount outstanding without reduction for amounts held by respondent.
Annual report of ...........................................................................................Columbia Gas of Massachusetts...............................................................................Year ended December 31, 2017
30
Annual report of .....................................................Columbia Gas of Massachusetts.....................................................Year ended December 31, 2017
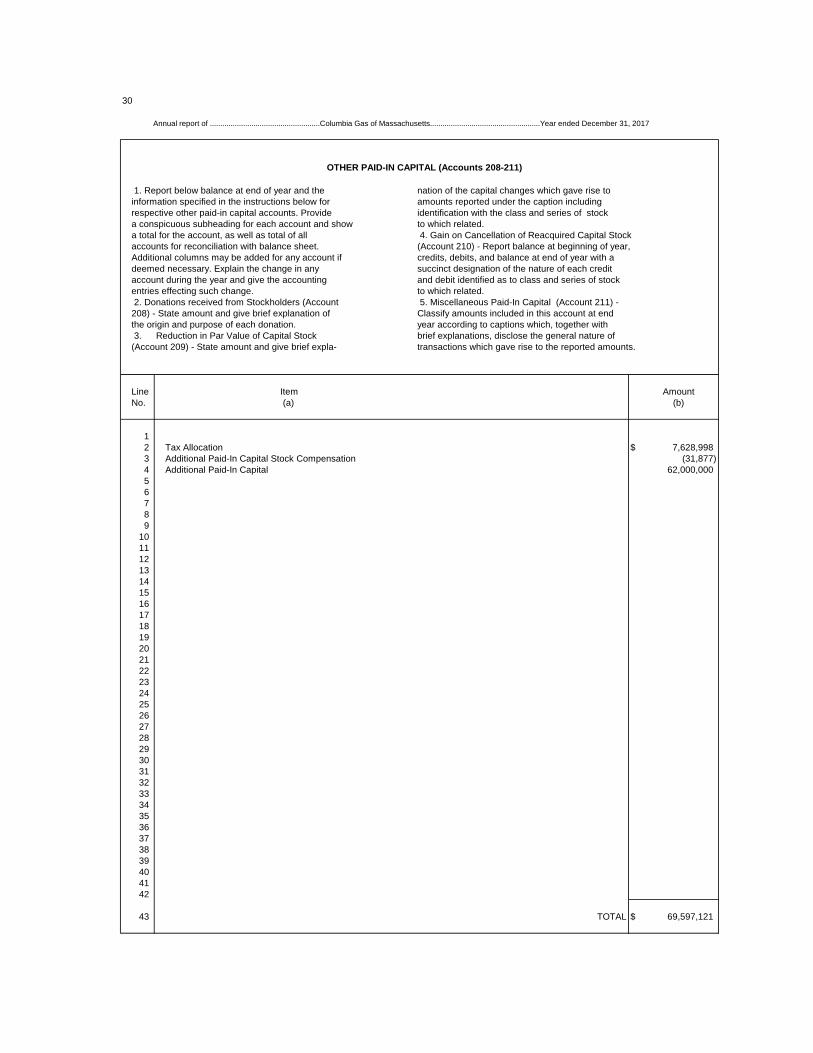
OTHER PAID-IN CAPITAL (Accounts 208-211)
1. Report below balance at end of year and the nation of the capital changes which gave rise toinformation specified in the instructions below for amounts reported under the caption includingrespective other paid-in capital accounts. Provide identification with the class and series of stocka conspicuous subheading for each account and show to which related.a total for the account, as well as total of all 4. Gain on Cancellation of Reacquired Capital Stockaccounts for reconciliation with balance sheet. (Account 210) - Report balance at beginning of year,Additional columns may be added for any account if credits, debits, and balance at end of year with a deemed necessary. Explain the change in any succinct designation of the nature of each creditaccount during the year and give the accounting and debit identified as to class and series of stock entries effecting such change. to which related. 2. Donations received from Stockholders (Account 5. Miscellaneous Paid-In Capital (Account 211) - 208) - State amount and give brief explanation of Classify amounts included in this account at end the origin and purpose of each donation. year according to captions which, together with 3. Reduction in Par Value of Capital Stock brief explanations, disclose the general nature of(Account 209) - State amount and give brief expla- transactions which gave rise to the reported amounts.
Line Item AmountNo. (a) (b)
12 Tax Allocation $ 7,628,9983 Additional Paid-In Capital Stock Compensation (31,877)4 Additional Paid-In Capital 62,000,00056789
101112131415161718192021222324252627282930313233343536373839404142
43 TOTAL $ 69,597,121
31
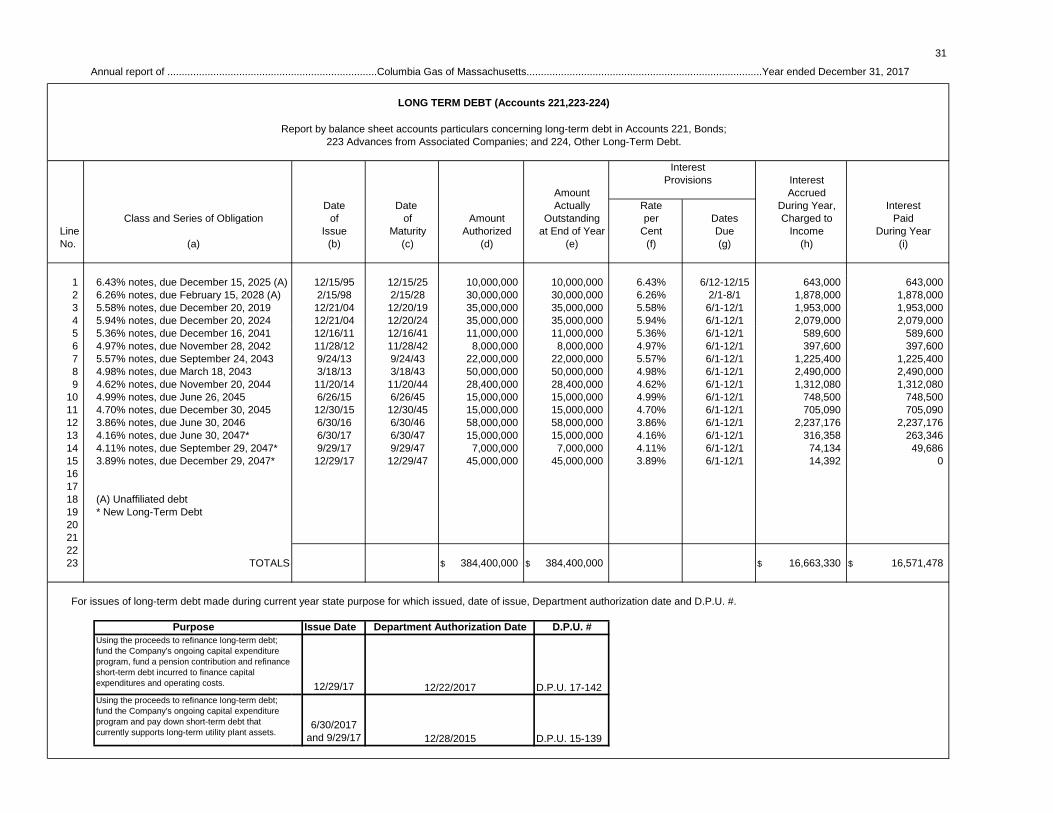
LONG TERM DEBT (Accounts 221,223-224)
Report by balance sheet accounts particulars concerning long-term debt in Accounts 221, Bonds;223 Advances from Associated Companies; and 224, Other Long-Term Debt.
Interest Provisions Interest Amount Accrued
Date Date Actually Rate During Year, InterestClass and Series of Obligation of of Amount Outstanding per Dates Charged to Paid
Line Issue Maturity Authorized at End of Year Cent Due Income During YearNo. (a) (b) (c) (d) (e) (f) (g) (h) (i)
1 6.43% notes, due December 15, 2025 (A) 12/15/95 12/15/25 10,000,000 10,000,000 6.43% 6/12-12/15 643,000 643,0002 6.26% notes, due February 15, 2028 (A) 2/15/98 2/15/28 30,000,000 30,000,000 6.26% 2/1-8/1 1,878,000 1,878,0003 5.58% notes, due December 20, 2019 12/21/04 12/20/19 35,000,000 35,000,000 5.58% 6/1-12/1 1,953,000 1,953,0004 5.94% notes, due December 20, 2024 12/21/04 12/20/24 35,000,000 35,000,000 5.94% 6/1-12/1 2,079,000 2,079,0005 5.36% notes, due December 16, 2041 12/16/11 12/16/41 11,000,000 11,000,000 5.36% 6/1-12/1 589,600 589,6006 4.97% notes, due November 28, 2042 11/28/12 11/28/42 8,000,000 8,000,000 4.97% 6/1-12/1 397,600 397,6007 5.57% notes, due September 24, 2043 9/24/13 9/24/43 22,000,000 22,000,000 5.57% 6/1-12/1 1,225,400 1,225,4008 4.98% notes, due March 18, 2043 3/18/13 3/18/43 50,000,000 50,000,000 4.98% 6/1-12/1 2,490,000 2,490,0009 4.62% notes, due November 20, 2044 11/20/14 11/20/44 28,400,000 28,400,000 4.62% 6/1-12/1 1,312,080 1,312,080
10 4.99% notes, due June 26, 2045 6/26/15 6/26/45 15,000,000 15,000,000 4.99% 6/1-12/1 748,500 748,50011 4.70% notes, due December 30, 2045 12/30/15 12/30/45 15,000,000 15,000,000 4.70% 6/1-12/1 705,090 705,09012 3.86% notes, due June 30, 2046 6/30/16 6/30/46 58,000,000 58,000,000 3.86% 6/1-12/1 2,237,176 2,237,17613 4.16% notes, due June 30, 2047* 6/30/17 6/30/47 15,000,000 15,000,000 4.16% 6/1-12/1 316,358 263,34614 4.11% notes, due September 29, 2047* 9/29/17 9/29/47 7,000,000 7,000,000 4.11% 6/1-12/1 74,134 49,68615 3.89% notes, due December 29, 2047* 12/29/17 12/29/47 45,000,000 45,000,000 3.89% 6/1-12/1 14,392 0161718 (A) Unaffiliated debt 19 * New Long-Term Debt 20212223 TOTALS $ 384,400,000 $ 384,400,000 $ 16,663,330 $ 16,571,478
For issues of long-term debt made during current year state purpose for which issued, date of issue, Department authorization date and D.P.U. #.
Purpose Issue Date D.P.U. #Using the proceeds to refinance long-term debt; fund the Company's ongoing capital expenditure program, fund a pension contribution and refinance short-term debt incurred to finance capital expenditures and operating costs. 12/29/17 D.P.U. 17-142Using the proceeds to refinance long-term debt; fund the Company's ongoing capital expenditure program and pay down short-term debt that currently supports long-term utility plant assets.
6/30/2017 and 9/29/17 D.P.U. 15-139
Department Authorization Date
12/22/2017
12/28/2015
Annual report of .........................................................................Columbia Gas of Massachusetts..................................................................................Year ended December 31, 2017
32
Annual report of............................................Columbia Gas of Massachusetts.........................................Year ended December 31, 2017
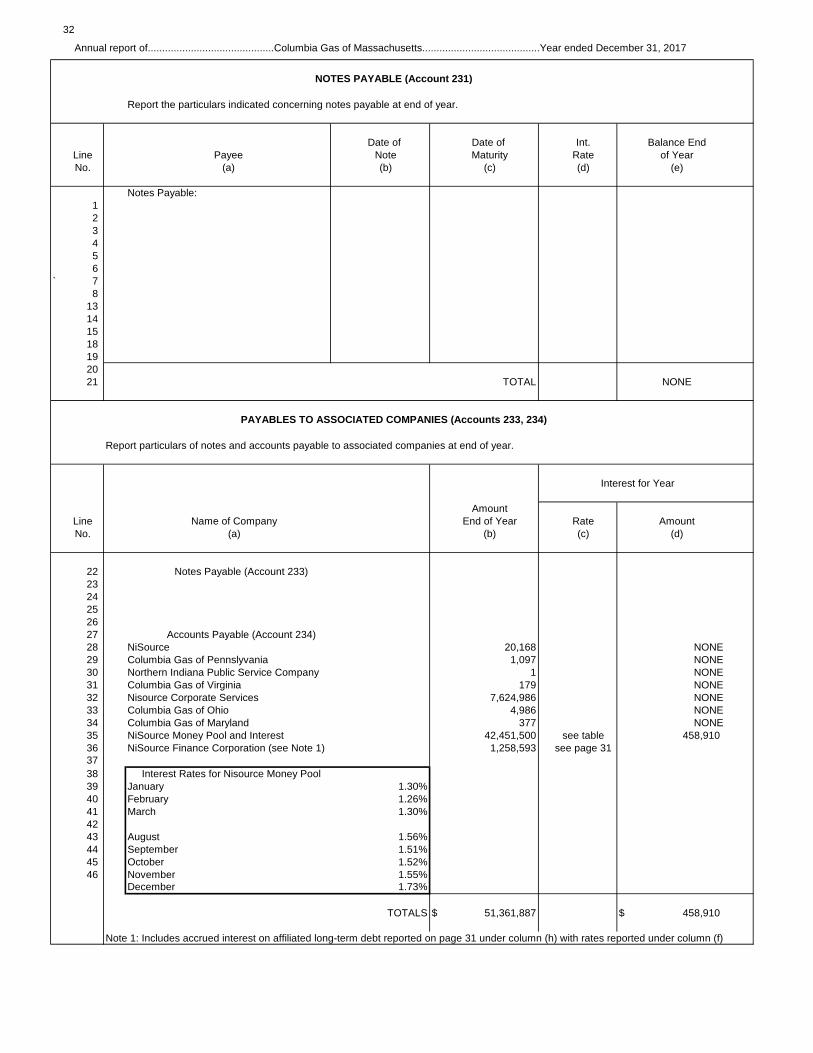
NOTES PAYABLE (Account 231)
Report the particulars indicated concerning notes payable at end of year.
Date of Date of Int. Balance EndLine Payee Note Maturity Rate of YearNo. (a) (b) (c) (d) (e)
Notes Payable:123456
` 78
13141518192021 TOTAL NONE
PAYABLES TO ASSOCIATED COMPANIES (Accounts 233, 234)
Report particulars of notes and accounts payable to associated companies at end of year.
Interest for Year
AmountLine Name of Company End of Year Rate AmountNo. (a) (b) (c) (d)
22 Notes Payable (Account 233)2324252627 Accounts Payable (Account 234)28 NiSource 20,168 NONE29 Columbia Gas of Pennslyvania 1,097 NONE30 Northern Indiana Public Service Company 1 NONE31 Columbia Gas of Virginia 179 NONE32 Nisource Corporate Services 7,624,986 NONE33 Columbia Gas of Ohio 4,986 NONE34 Columbia Gas of Maryland 377 NONE35 NiSource Money Pool and Interest 42,451,500 see table 458,91036 NiSource Finance Corporation (see Note 1) 1,258,593 see page 3137 38 Interest Rates for Nisource Money Pool 39 January 1.30% 40 February 1.26%41 March 1.30%4243 August 1.56%44 September 1.51%45 October 1.52%46 November 1.55%
December 1.73%
TOTALS $ 51,361,887 $ 458,910
Note 1: Includes accrued interest on affiliated long-term debt reported on page 31 under column (h) with rates reported under column (f)
33
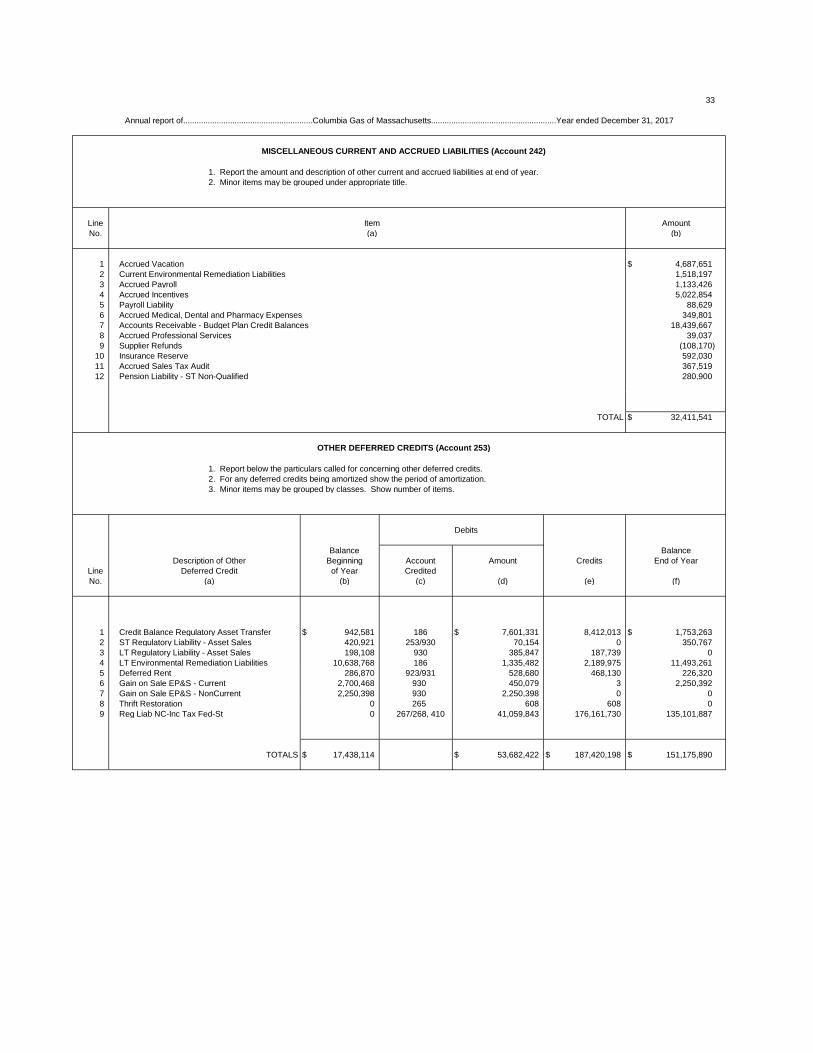
MISCELLANEOUS CURRENT AND ACCRUED LIABILITIES (Account 242)
1. Report the amount and description of other current and accrued liabilities at end of year. 2. Minor items may be grouped under appropriate title.
Line Item AmountNo. (a) (b)
1 Accrued Vacation $ 4,687,6512 Current Environmental Remediation Liabilities 1,518,1973 Accrued Payroll 1,133,4264 Accrued Incentives 5,022,8545 Payroll Liability 88,6296 Accrued Medical, Dental and Pharmacy Expenses 349,8017 Accounts Receivable - Budget Plan Credit Balances 18,439,6678 Accrued Professional Services 39,0379 Supplier Refunds (108,170)
10 Insurance Reserve 592,03011 Accrued Sales Tax Audit 367,51912 Pension Liability - ST Non-Qualified 280,900
TOTAL $ 32,411,541
OTHER DEFERRED CREDITS (Account 253)
1. Report below the particulars called for concerning other deferred credits. 2. For any deferred credits being amortized show the period of amortization. 3. Minor items may be grouped by classes. Show number of items.
Debits
Balance BalanceDescription of Other Beginning Account Amount Credits End of Year
Line Deferred Credit of Year CreditedNo. (a) (b) (c) (d) (e) (f)
1 Credit Balance Regulatory Asset Transfer $ 942,581 186 $ 7,601,331 8,412,013 $ 1,753,2632 ST Regulatory Liability - Asset Sales 420,921 253/930 70,154 0 350,7673 LT Regulatory Liability - Asset Sales 198,108 930 385,847 187,739 04 LT Environmental Remediation Liabilities 10,638,768 186 1,335,482 2,189,975 11,493,2615 Deferred Rent 286,870 923/931 528,680 468,130 226,3206 Gain on Sale EP&S - Current 2,700,468 930 450,079 3 2,250,3927 Gain on Sale EP&S - NonCurrent 2,250,398 930 2,250,398 0 08 Thrift Restoration 0 265 608 608 09 Reg Liab NC-Inc Tax Fed-St 0 267/268, 410 41,059,843 176,161,730 135,101,887
TOTALS $ 17,438,114 $ 53,682,422 $ 187,420,198 $ 151,175,890
Annual report of..........................................................Columbia Gas of Massachusetts........................................................Year ended December 31, 2017
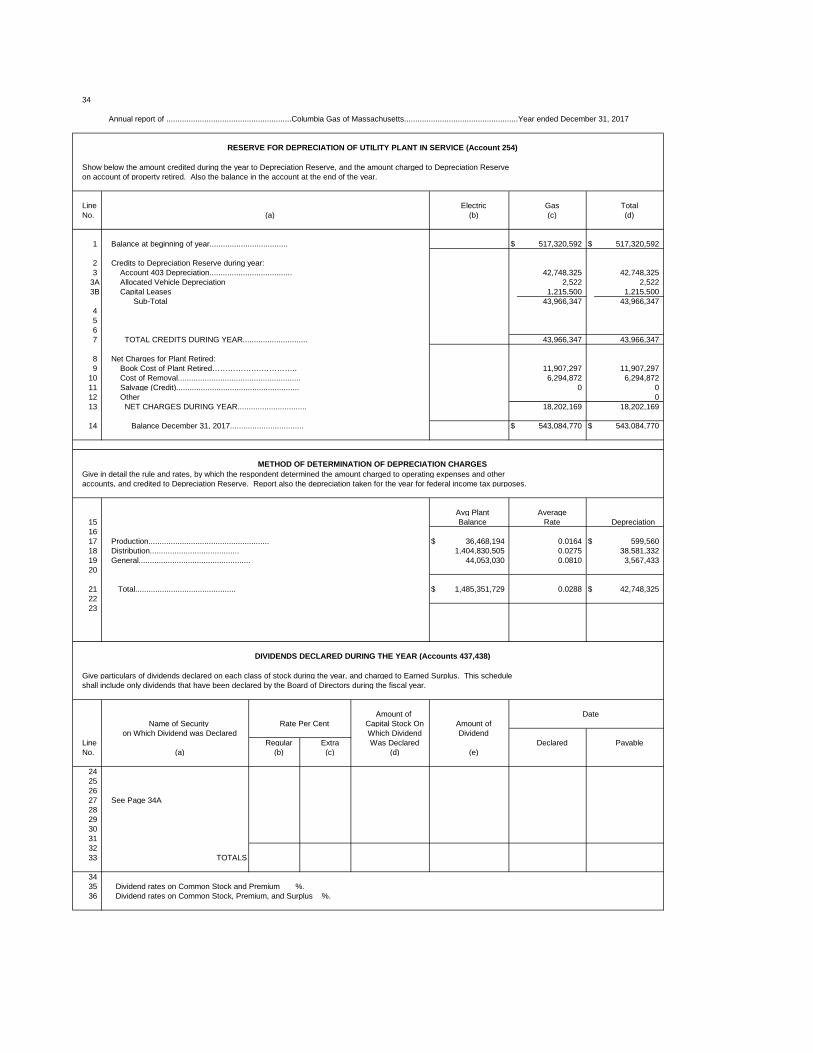
34
RESERVE FOR DEPRECIATION OF UTILITY PLANT IN SERVICE (Account 254)
Show below the amount credited during the year to Depreciation Reserve, and the amount charged to Depreciation Reserveon account of property retired. Also the balance in the account at the end of the year.
Line Electric Gas TotalNo. (a) (b) (c) (d)
1 Balance at beginning of year................................... $ 517,320,592 $ 517,320,592
2 Credits to Depreciation Reserve during year:3 Account 403 Depreciation..................................... 42,748,325 42,748,325
3A Allocated Vehicle Depreciation 2,522 2,5223B Capital Leases 1,215,500 1,215,500
Sub-Total 43,966,347 43,966,3474 56 7 TOTAL CREDITS DURING YEAR............................. 43,966,347 43,966,347
8 Net Charges for Plant Retired:9 Book Cost of Plant Retired……………….………….. 11,907,297 11,907,297
10 Cost of Removal....................................................... 6,294,872 6,294,87211 Salvage (Credit)....................................................... 0 012 Other 013 NET CHARGES DURING YEAR............................... 18,202,169 18,202,169
14 Balance December 31, 2017................................. $ 543,084,770 $ 543,084,770
METHOD OF DETERMINATION OF DEPRECIATION CHARGES
Give in detail the rule and rates, by which the respondent determined the amount charged to operating expenses and otheraccounts, and credited to Depreciation Reserve. Report also the depreciation taken for the year for federal income tax purposes.
Avg Plant Average15 Balance Rate Depreciation1617 Production...................................................... $ 36,468,194 0.0164 $ 599,560 18 Distribution........................................ 1,404,830,505 0.0275 38,581,332 19 General.................................................. 44,053,030 0.0810 3,567,433 20
21 Total............................................. $ 1,485,351,729 0.0288 $ 42,748,325 2223
DIVIDENDS DECLARED DURING THE YEAR (Accounts 437,438)
Give particulars of dividends declared on each class of stock during the year, and charged to Earned Surplus. This scheduleshall include only dividends that have been declared by the Board of Directors during the fiscal year.
Amount of DateName of Security Rate Per Cent Capital Stock On Amount of
on Which Dividend was Declared Which Dividend Dividend Line Regular Extra Was Declared Declared PayableNo. (a) (b) (c) (d) (e)
24252627 See Page 34A282930313233 TOTALS
3435 Dividend rates on Common Stock and Premium %. 36 Dividend rates on Common Stock, Premium, and Surplus %.
Annual report of ........................................................Columbia Gas of Massachusetts...................................................Year ended December 31, 2017
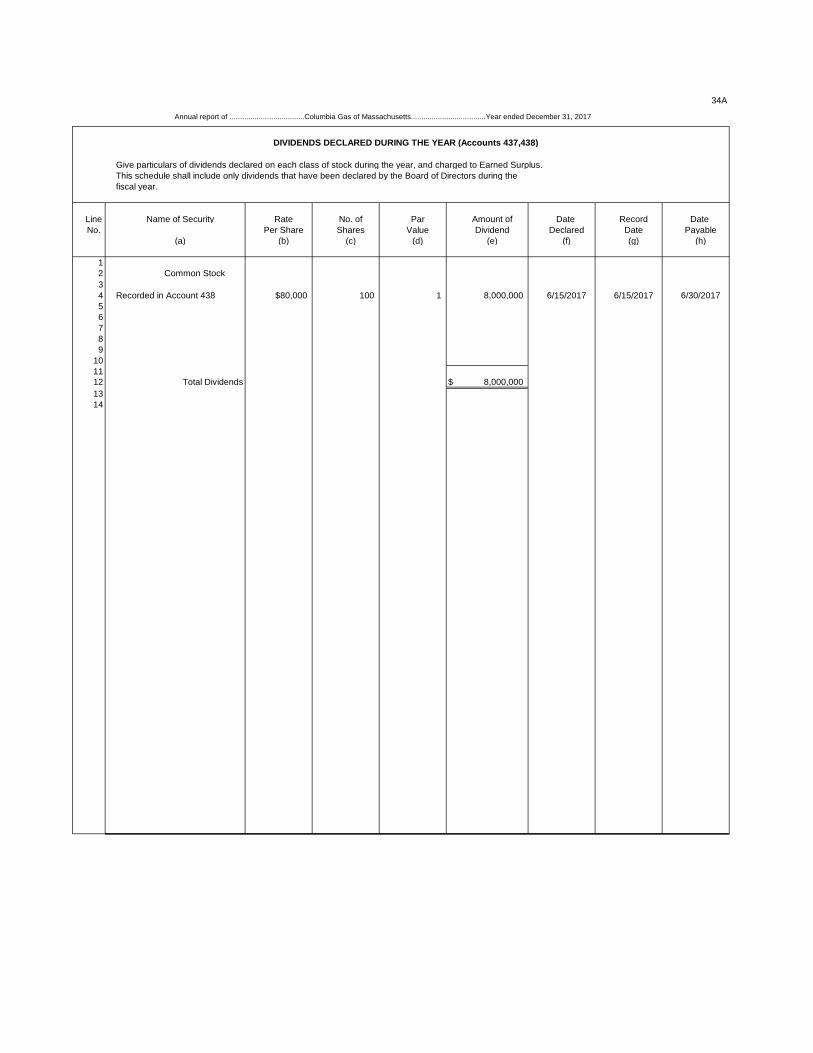
34A
Annual report of ....................................Columbia Gas of Massachusetts....................................Year ended December 31, 2017
DIVIDENDS DECLARED DURING THE YEAR (Accounts 437,438)
Give particulars of dividends declared on each class of stock during the year, and charged to Earned Surplus. This schedule shall include only dividends that have been declared by the Board of Directors during the fiscal year.
Line Name of Security Rate No. of Par Amount of Date Record Date No. Per Share Shares Value Dividend Declared Date Payable
(a) (b) (c) (d) (e) (f) (g) (h)
12 Common Stock34 Recorded in Account 438 $80,000 100 1 8,000,000 6/15/2017 6/15/2017 6/30/201756789
101112 Total Dividends $ 8,000,0001314
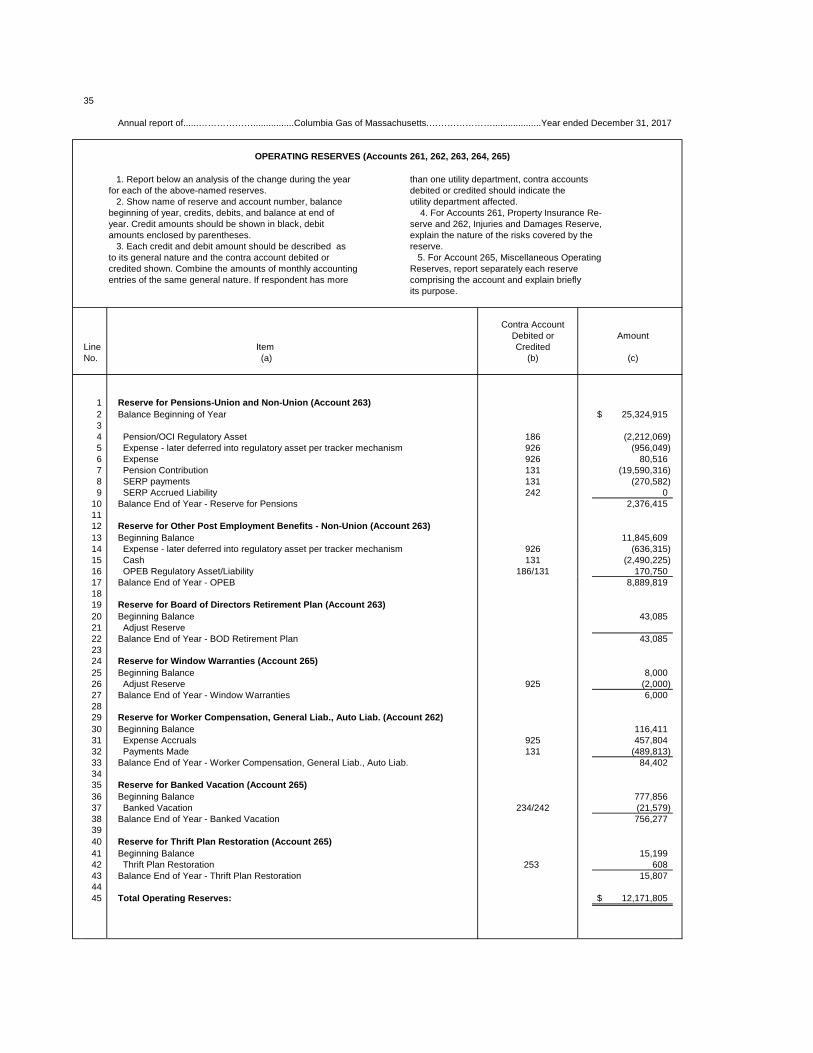
35
Annual report of......………………................Columbia Gas of Massachusetts.…………………...................Year ended December 31, 2017
OPERATING RESERVES (Accounts 261, 262, 263, 264, 265)
1. Report below an analysis of the change during the year than one utility department, contra accountsfor each of the above-named reserves. debited or credited should indicate the 2. Show name of reserve and account number, balance utility department affected.beginning of year, credits, debits, and balance at end of 4. For Accounts 261, Property Insurance Re-year. Credit amounts should be shown in black, debit serve and 262, Injuries and Damages Reserve,amounts enclosed by parentheses. explain the nature of the risks covered by the 3. Each credit and debit amount should be described as reserve.to its general nature and the contra account debited or 5. For Account 265, Miscellaneous Operatingcredited shown. Combine the amounts of monthly accounting Reserves, report separately each reserveentries of the same general nature. If respondent has more comprising the account and explain briefly
its purpose.
Contra AccountDebited or Amount
Line Item CreditedNo. (a) (b) (c)
1 Reserve for Pensions-Union and Non-Union (Account 263)2 Balance Beginning of Year 25,324,915$ 34 Pension/OCI Regulatory Asset 186 (2,212,069)5 Expense - later deferred into regulatory asset per tracker mechanism 926 (956,049)6 Expense 926 80,5167 Pension Contribution 131 (19,590,316)8 SERP payments 131 (270,582)9 SERP Accrued Liability 242 0
10 Balance End of Year - Reserve for Pensions 2,376,4151112 Reserve for Other Post Employment Benefits - Non-Union (Account 263)13 Beginning Balance 11,845,60914 Expense - later deferred into regulatory asset per tracker mechanism 926 (636,315)15 Cash 131 (2,490,225)16 OPEB Regulatory Asset/Liability 186/131 170,75017 Balance End of Year - OPEB 8,889,8191819 Reserve for Board of Directors Retirement Plan (Account 263)20 Beginning Balance 43,08521 Adjust Reserve22 Balance End of Year - BOD Retirement Plan 43,0852324 Reserve for Window Warranties (Account 265)25 Beginning Balance 8,00026 Adjust Reserve 925 (2,000)27 Balance End of Year - Window Warranties 6,0002829 Reserve for Worker Compensation, General Liab., Auto Liab. (Account 262)30 Beginning Balance 116,41131 Expense Accruals 925 457,80432 Payments Made 131 (489,813)33 Balance End of Year - Worker Compensation, General Liab., Auto Liab. 84,4023435 Reserve for Banked Vacation (Account 265)36 Beginning Balance 777,85637 Banked Vacation 234/242 (21,579)38 Balance End of Year - Banked Vacation 756,2773940 Reserve for Thrift Plan Restoration (Account 265)41 Beginning Balance 15,19942 Thrift Plan Restoration 253 60843 Balance End of Year - Thrift Plan Restoration 15,80744 45 Total Operating Reserves: 12,171,805$
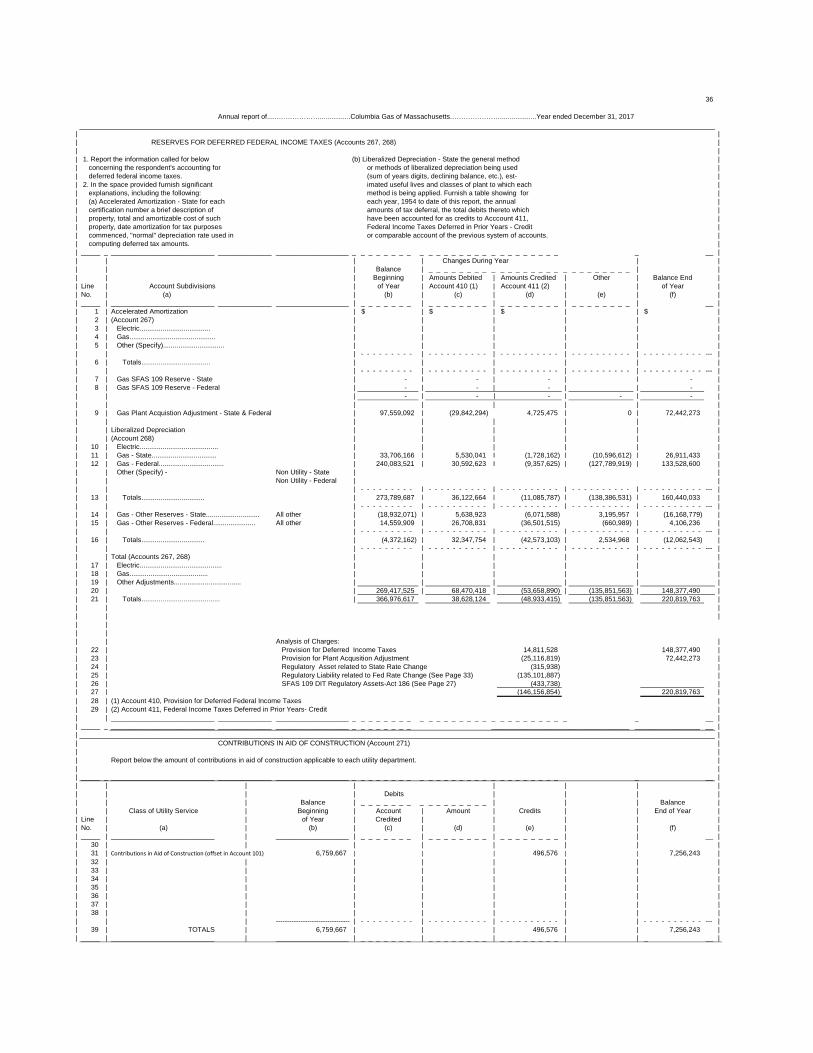
36
Annual report of......………………................Columbia Gas of Massachusetts.…………………...................Year ended December 31, 2017
| || RESERVES FOR DEFERRED FEDERAL INCOME TAXES (Accounts 267, 268) || || 1. Report the information called for below (b) Liberalized Depreciation - State the general method || concerning the respondent's accounting for or methods of liberalized depreciation being used || deferred federal income taxes. (sum of years digits, declining balance, etc.), est- || 2. In the space provided furnish significant imated useful lives and classes of plant to which each || explanations, including the following: method is being applied. Furnish a table showing for || (a) Accelerated Amortization - State for each each year, 1954 to date of this report, the annual || certification number a brief description of amounts of tax deferral, the total debits thereto which || property, total and amortizable cost of such have been accounted for as credits to Acccount 411, || property, date amortization for tax purposes Federal Income Taxes Deferred in Prior Years - Credit || commenced, "normal" depreciation rate used in or comparable account of the previous system of accounts. || computing deferred tax amounts. || _____ _ ___________________________ ______________ ___________________ _ _ _ _ _ _ _ _ _ _ _ _ _ _ _ _ _ _ _ _ _ _ _ _ _ _ __________________ _ _ _ _ _ _ _ _ _ __ || | | | Changes During Year | || | | Balance | _ _ _ _ _ _ _ _ _ _ _ _ _ _ _ _ _ _ _ _ _ _ _ _ _ _ | || | | Beginning | Amounts Debited | Amounts Credited | Other | Balance End || Line | Account Subdivisions | of Year | Account 410 (1) | Account 411 (2) | | of Year || No. | (a) | (b) | (c) | (d) | (e) | (f) || _____ | ___________________________ ______________ ___________________ | _ _ _ _ _ _ _ | _ _ _ _ _ _ _ _ | _ _ _ _ _ _ _ _ | _ _ _ _ _ _ _ _ | _ _ _ _ _ _ _ _ __ || 1 | Accelerated Amortization | $ | $ | $ | | $ || 2 | (Account 267) | | | | | || 3 | Electric..................................... | | | | | || 4 | Gas............................................. | | | | | || 5 | Other (Specify)................................ | | | | | || | | - - - - - - - - - | - - - - - - - - - - | - - - - - - - - - - | - - - - - - - - - - | - - - - - - - - - - --- || 6 | Totals.................................... | | | | | || | | - - - - - - - - - | - - - - - - - - - - | - - - - - - - - - - | - - - - - - - - - - | - - - - - - - - - - --- || 7 | Gas SFAS 109 Reserve - State | - | - | - | | - || 8 | Gas SFAS 109 Reserve - Federal | - | - | - | | - || | | - | - | - | - | - || | | | | | | || 9 | Gas Plant Acquistion Adjustment - State & Federal | 97,559,092 | (29,842,294) 4,725,475 | 0 | 72,442,273 || | | | | | | || | Liberalized Depreciation | | | | | || | (Account 268) | | | | | || 10 | Electric......................................... | | | | | || 11 | Gas - State.................................. | 33,706,166 | 5,530,041 I (1,728,162) | (10,596,612) | 26,911,433 || 12 | Gas - Federal.................................. | 240,083,521 | 30,592,623 I (9,357,625) | (127,789,919) | 133,528,600 || | Other (Specify) - Non Utility - State | || | Non Utility - Federal | || | | - - - - - - - - - | - - - - - - - - - - | - - - - - - - - - - | - - - - - - - - - - | - - - - - - - - - - --- || 13 | Totals................................. | 273,789,687 | 36,122,664 | (11,085,787) | (138,386,531) | 160,440,033 || | | - - - - - - - - - | - - - - - - - - - - | - - - - - - - - - - | - - - - - - - - - - | - - - - - - - - - - --- || 14 | Gas - Other Reserves - State............................ All other | (18,932,071) | 5,638,923 (6,071,588) 3,195,957 | (16,168,779) || 15 | Gas - Other Reserves - Federal...................... All other | 14,559,909 | 26,708,831 (36,501,515) (660,989) | 4,106,236 || | | - - - - - - - - - | - - - - - - - - - - | - - - - - - - - - - | - - - - - - - - - - | - - - - - - - - - - --- || 16 | Totals................................. | (4,372,162) | 32,347,754 | (42,573,103) | 2,534,968 | (12,062,543) || | | - - - - - - - - - | - - - - - - - - - - | - - - - - - - - - - | - - - - - - - - - - | - - - - - - - - - - --- || | Total (Accounts 267, 268) | | | | | || 17 | Electric........................................... | | | | | || 18 | Gas......................................... | | | | | || 19 | Other Adjustments................................... | | | | | || 20 | | 269,417,525 | 68,470,418 | (53,658,890) | (135,851,563) | 148,377,490 || 21 | Totals......................................... | 366,976,617 38,628,124 (48,933,415) (135,851,563) 220,819,763 || | || | || || || | Analysis of Charges: || 22 | Provision for Deferred Income Taxes 14,811,528 148,377,490 || 23 | Provision for Plant Acqusition Adjustment (25,116,819) 72,442,273 || 24 | Regulatory Asset related to State Rate Change (315,938) || 25 | Regulatory Liability related to Fed Rate Change (See Page 33) (135,101,887) || 26 | SFAS 109 DIT Regulatory Assets-Act 186 (See Page 27) (433,738) || 27 | (146,156,854) 220,819,763 || 28 | (1) Account 410, Provision for Deferred Federal Income Taxes || 29 | (2) Account 411, Federal Income Taxes Deferred in Prior Years- Credit || | ___________________________ ______________ ___________________ _ _ _ _ _ _ _ _ _ _ _ _ _ _ _ _ _ _ _ _ _ _ _ _ _ _ _ _ __ || _____ _ ___________________________ ______________ ___________________ _ _ _ _ _ _ _ _ __________________ ____________________________________ _________________ __ || || CONTRIBUTIONS IN AID OF CONSTRUCTION (Account 271) || || Report below the amount of contributions in aid of construction applicable to each utility department. || || _____ _ ___________________________ ______________ ___________________ _ _ _ _ _ _ _ _ _ _ _ _ _ _ _ _ _ _ _ _ _ _ _ _ _ _ __________________ _ _ _ _ _ _ _ _ _ __ || | | | | | | || | | | Debits | | | || | | Balance | _ _ _ _ _ _ _ _ _ _ _ _ _ _ _ _ | | | Balance || | Class of Utility Service | Beginning | Account | Amount | Credits | | End of Year || Line | | of Year | Credited | | | | || No. | (a) | (b) | (c) | (d) | (e) | | (f) || _____ | ___________________________ | ___________________ | _ _ _ _ _ _ _ | _ _ _ _ _ _ _ _ | _ _ _ _ _ _ _ _ | | _ _ _ _ _ _ _ _ __ || 30 | | | | | | | || 31 | Contributions in Aid of Construction (offset in Account 101) 6,759,667 | | | 496,576 | | 7,256,243 || 32 | | | | | | | || 33 | | | | | | | || 34 | | | | | | | || 35 | | | | | | | || 36 | | | | | | | || 37 | | | | | | | || 38 | | | | | | | || | | --------------------------------- | - - - - - - - - - | - - - - - - - - - - | - - - - - - - - - - | | - - - - - - - - - - --- || 39 | TOTALS | 6,759,667 | | | 496,576 | | 7,256,243 || _____ | ___________________________ | ___________________ | _ _ _ _ _ _ _ | _ _ _ _ _ _ _ _ | _ _ _ _ _ _ _ _ | | _ __ |
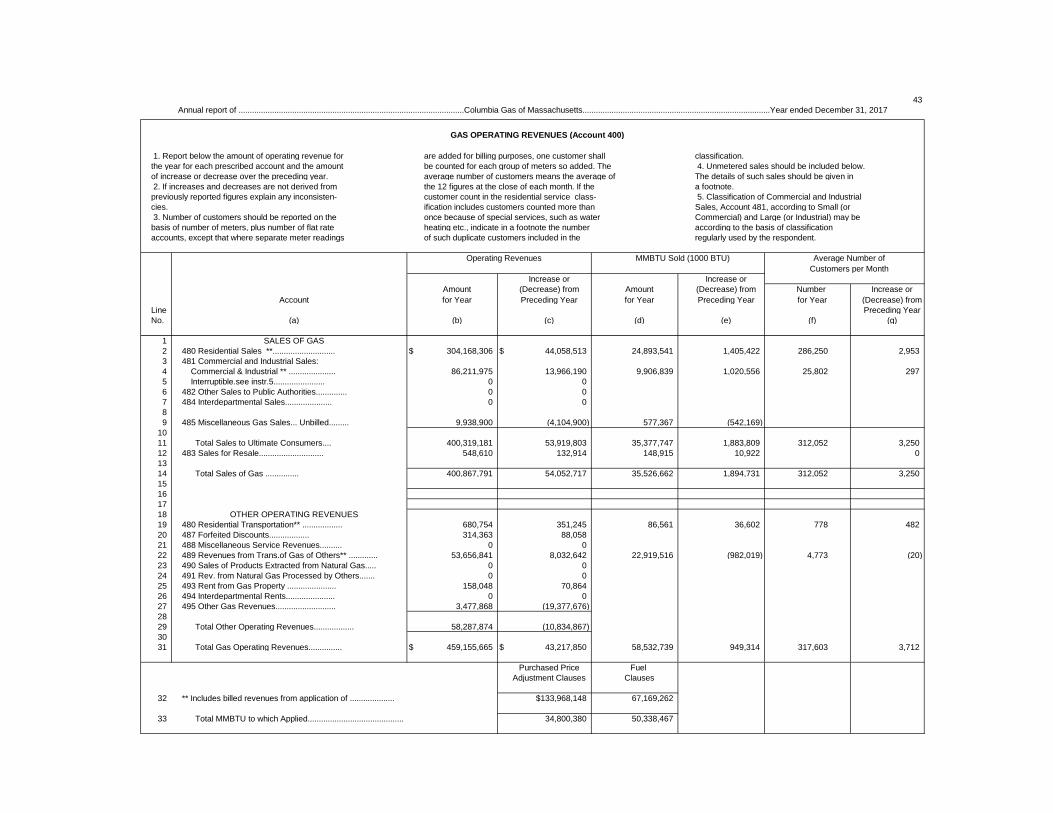
43
GAS OPERATING REVENUES (Account 400)
1. Report below the amount of operating revenue for are added for billing purposes, one customer shall classification.the year for each prescribed account and the amount be counted for each group of meters so added. The 4. Unmetered sales should be included below.of increase or decrease over the preceding year. average number of customers means the average of The details of such sales should be given in 2. If increases and decreases are not derived from the 12 figures at the close of each month. If the a footnote.previously reported figures explain any inconsisten- customer count in the residential service class- 5. Classification of Commercial and Industrialcies. ification includes customers counted more than Sales, Account 481, according to Small (or 3. Number of customers should be reported on the once because of special services, such as water Commercial) and Large (or Industrial) may be basis of number of meters, plus number of flat rate heating etc., indicate in a footnote the number according to the basis of classificationaccounts, except that where separate meter readings of such duplicate customers included in the regularly used by the respondent.
Operating Revenues MMBTU Sold (1000 BTU) Average Number ofCustomers per Month
Increase or Increase orAmount (Decrease) from Amount (Decrease) from Number Increase or
Account for Year Preceding Year for Year Preceding Year for Year (Decrease) fromLine Preceding YearNo. (a) (b) (c) (d) (e) (f) (g)
1 SALES OF GAS2 480 Residential Sales **............................ $ 304,168,306 $ 44,058,513 24,893,541 1,405,422 286,250 2,9533 481 Commercial and Industrial Sales:4 Commercial & Industrial ** ..................... 86,211,975 13,966,190 9,906,839 1,020,556 25,802 2975 Interruptible.see instr.5....................... 0 06 482 Other Sales to Public Authorities.............. 0 07 484 Interdepartmental Sales..................... 0 089 485 Miscellaneous Gas Sales... Unbilled......... 9,938,900 (4,104,900) 577,367 (542,169)
1011 Total Sales to Ultimate Consumers.... 400,319,181 53,919,803 35,377,747 1,883,809 312,052 3,25012 483 Sales for Resale............................. 548,610 132,914 148,915 10,922 01314 Total Sales of Gas ............... 400,867,791 54,052,717 35,526,662 1,894,731 312,052 3,25015161718 OTHER OPERATING REVENUES 19 480 Residential Transportation** .................. 680,754 351,245 86,561 36,602 778 48220 487 Forfeited Discounts.................. 314,363 88,05821 488 Miscellaneous Service Revenues.......... 0 022 489 Revenues from Trans.of Gas of Others** ............. 53,656,841 8,032,642 22,919,516 (982,019) 4,773 (20)23 490 Sales of Products Extracted from Natural Gas..... 0 024 491 Rev. from Natural Gas Processed by Others....... 0 025 493 Rent from Gas Property ...................... 158,048 70,86426 494 Interdepartmental Rents...................... 0 027 495 Other Gas Revenues........................... 3,477,868 (19,377,676)2829 Total Other Operating Revenues.................. 58,287,874 (10,834,867)3031 Total Gas Operating Revenues............... $ 459,155,665 $ 43,217,850 58,532,739 949,314 317,603 3,712
Purchased Price Fuel Adjustment Clauses Clauses
32 ** Includes billed revenues from application of .................... $133,968,148 67,169,262
33 Total MMBTU to which Applied........................................... 34,800,380 50,338,467
Annual report of .....................................................................................................Columbia Gas of Massachusetts....................................................................................Year ended December 31, 2017
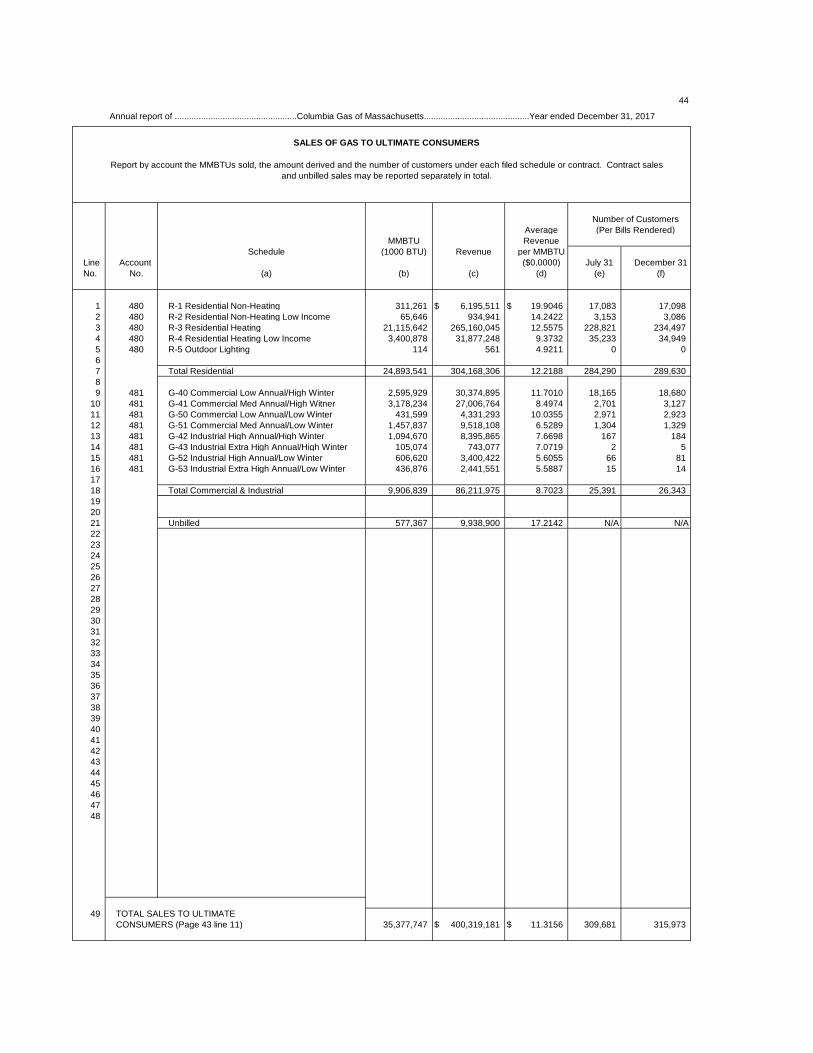
44
SALES OF GAS TO ULTIMATE CONSUMERS
Report by account the MMBTUs sold, the amount derived and the number of customers under each filed schedule or contract. Contract salesand unbilled sales may be reported separately in total.
Number of CustomersAverage (Per Bills Rendered)
MMBTU RevenueSchedule (1000 BTU) Revenue per MMBTU
Line Account ($0.0000) July 31 December 31No. No. (a) (b) (c) (d) (e) (f)
1 480 R-1 Residential Non-Heating 311,261 $ 6,195,511 $ 19.9046 17,083 17,0982 480 R-2 Residential Non-Heating Low Income 65,646 934,941 14.2422 3,153 3,0863 480 R-3 Residential Heating 21,115,642 265,160,045 12.5575 228,821 234,4974 480 R-4 Residential Heating Low Income 3,400,878 31,877,248 9.3732 35,233 34,9495 480 R-5 Outdoor Lighting 114 561 4.9211 0 067 Total Residential 24,893,541 304,168,306 12.2188 284,290 289,63089 481 G-40 Commercial Low Annual/High Winter 2,595,929 30,374,895 11.7010 18,165 18,680
10 481 G-41 Commercial Med Annual/High Witner 3,178,234 27,006,764 8.4974 2,701 3,12711 481 G-50 Commercial Low Annual/Low Winter 431,599 4,331,293 10.0355 2,971 2,92312 481 G-51 Commercial Med Annual/Low Winter 1,457,837 9,518,108 6.5289 1,304 1,32913 481 G-42 Industrial High Annual/High Winter 1,094,670 8,395,865 7.6698 167 18414 481 G-43 Industrial Extra High Annual/High Winter 105,074 743,077 7.0719 2 515 481 G-52 Industrial High Annual/Low Winter 606,620 3,400,422 5.6055 66 8116 481 G-53 Industrial Extra High Annual/Low Winter 436,876 2,441,551 5.5887 15 141718 Total Commercial & Industrial 9,906,839 86,211,975 8.7023 25,391 26,3431920 21 Unbilled 577,367 9,938,900 17.2142 N/A N/A22 23 24 25 26 27 28 29 30 31 32 33 34 35 36 37 38 39 40 41 42 43 44 45 46 47 48
49 TOTAL SALES TO ULTIMATECONSUMERS (Page 43 line 11) 35,377,747 $ 400,319,181 $ 11.3156 309,681 315,973
Annual report of ...................................................Columbia Gas of Massachusetts............................................Year ended December 31, 2017
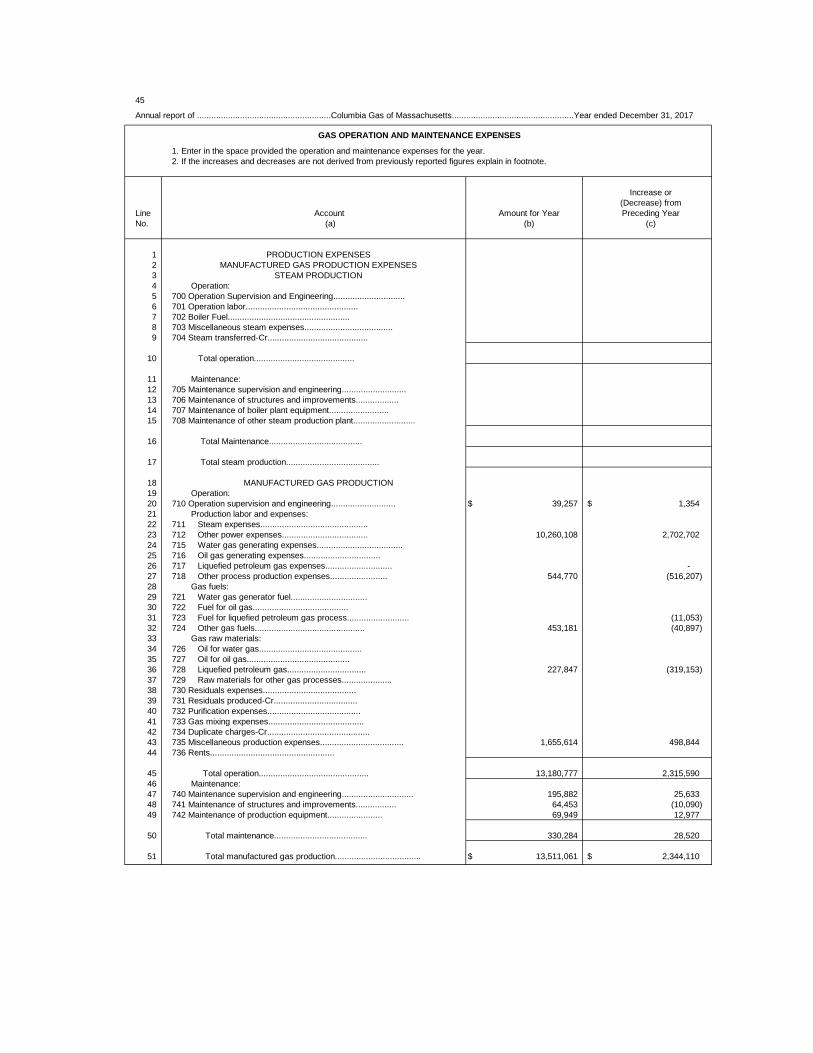
45
Annual report of ........................................................Columbia Gas of Massachusetts...................................................Year ended December 31, 2017
GAS OPERATION AND MAINTENANCE EXPENSES
1. Enter in the space provided the operation and maintenance expenses for the year.2. If the increases and decreases are not derived from previously reported figures explain in footnote.
Increase or(Decrease) from
Line Account Amount for Year Preceding YearNo. (a) (b) (c)
1 PRODUCTION EXPENSES2 MANUFACTURED GAS PRODUCTION EXPENSES3 STEAM PRODUCTION4 Operation:5 700 Operation Supervision and Engineering..............................6 701 Operation labor...............................................7 702 Boiler Fuel...................................................8 703 Miscellaneous steam expenses.....................................9 704 Steam transferred-Cr..........................................
10 Total operation..........................................
11 Maintenance:12 705 Maintenance supervision and engineering...........................13 706 Maintenance of structures and improvements..................14 707 Maintenance of boiler plant equipment.........................15 708 Maintenance of other steam production plant..........................
16 Total Maintenance.......................................
17 Total steam production.......................................
18 MANUFACTURED GAS PRODUCTION19 Operation:20 710 Operation supervision and engineering........................... $ 39,257 $ 1,354 21 Production labor and expenses:22 711 Steam expenses.............................................23 712 Other power expenses.................................... 10,260,108 2,702,702 24 715 Water gas generating expenses....................................25 716 Oil gas generating expenses................................26 717 Liquefied petroleum gas expenses............................ - 27 718 Other process production expenses........................ 544,770 (516,207) 28 Gas fuels:29 721 Water gas generator fuel................................30 722 Fuel for oil gas........................................31 723 Fuel for liquefied petroleum gas process.......................... (11,053) 32 724 Other gas fuels.............................................. 453,181 (40,897) 33 Gas raw materials:34 726 Oil for water gas...........................................35 727 Oil for oil gas...........................................36 728 Liquefied petroleum gas................................. 227,847 (319,153) 37 729 Raw materials for other gas processes.....................38 730 Residuals expenses.......................................39 731 Residuals produced-Cr...................................40 732 Purification expenses.......................................41 733 Gas mixing expenses........................................42 734 Duplicate charges-Cr...........................................43 735 Miscellaneous production expenses................................... 1,655,614 498,844 44 736 Rents....................................................
45 Total operation.............................................. 13,180,777 2,315,590 46 Maintenance:47 740 Maintenance supervision and engineering.............................. 195,882 25,633 48 741 Maintenance of structures and improvements................. 64,453 (10,090) 49 742 Maintenance of production equipment....................... 69,949 12,977
50 Total maintenance....................................... 330,284 28,520
51 Total manufactured gas production.................................... $ 13,511,061 $ 2,344,110
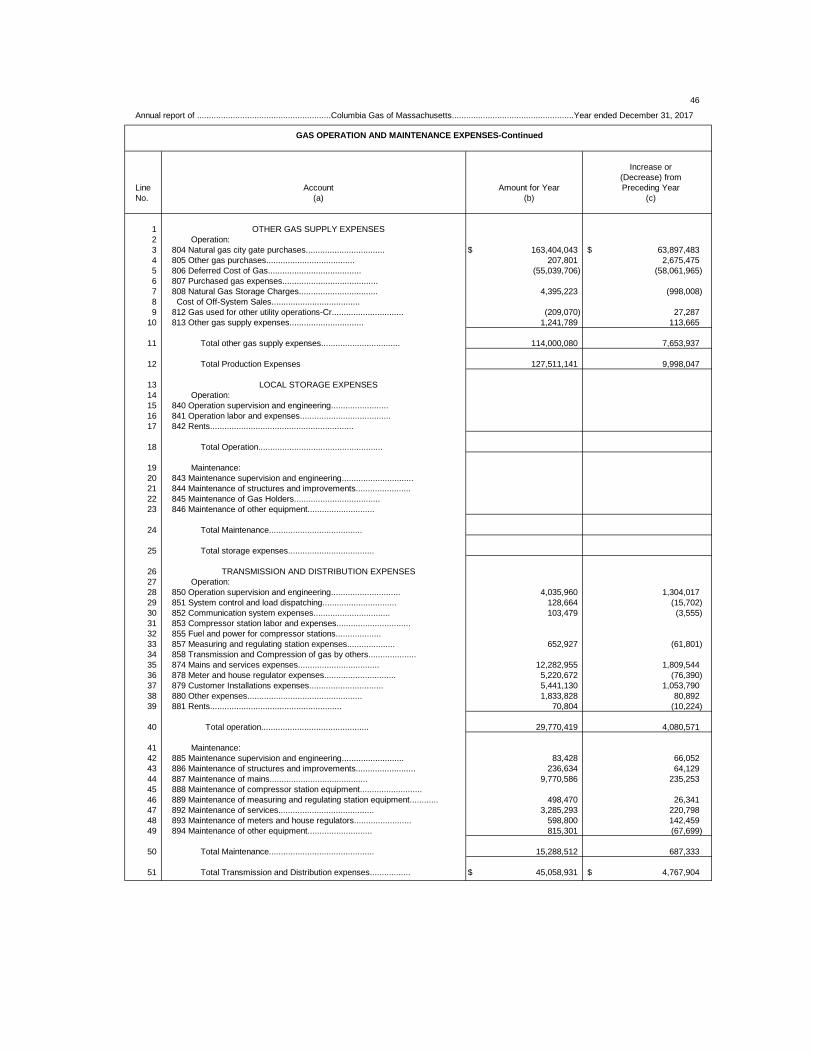
46
Annual report of ........................................................Columbia Gas of Massachusetts...................................................Year ended December 31, 2017
GAS OPERATION AND MAINTENANCE EXPENSES-Continued
Increase or(Decrease) from
Line Account Amount for Year Preceding YearNo. (a) (b) (c)
1 OTHER GAS SUPPLY EXPENSES2 Operation:3 804 Natural gas city gate purchases................................. $ 163,404,043 $ 63,897,483 4 805 Other gas purchases..................................... 207,801 2,675,475 5 806 Deferred Cost of Gas....................................... (55,039,706) (58,061,965) 6 807 Purchased gas expenses........................................7 808 Natural Gas Storage Charges................................. 4,395,223 (998,008) 8 Cost of Off-System Sales.....................................9 812 Gas used for other utility operations-Cr.............................. (209,070) 27,287
10 813 Other gas supply expenses............................... 1,241,789 113,665
11 Total other gas supply expenses................................. 114,000,080 7,653,937
12 Total Production Expenses 127,511,141 9,998,047
13 LOCAL STORAGE EXPENSES14 Operation:15 840 Operation supervision and engineering........................16 841 Operation labor and expenses......................................17 842 Rents............................................................
18 Total Operation....................................................
19 Maintenance:20 843 Maintenance supervision and engineering..............................21 844 Maintenance of structures and improvements.......................22 845 Maintenance of Gas Holders....................................23 846 Maintenance of other equipment............................
24 Total Maintenance.......................................
25 Total storage expenses....................................
26 TRANSMISSION AND DISTRIBUTION EXPENSES27 Operation:28 850 Operation supervision and engineering............................. 4,035,960 1,304,017 29 851 System control and load dispatching............................... 128,664 (15,702) 30 852 Communication system expenses................................ 103,479 (3,555) 31 853 Compressor station labor and expenses...............................32 855 Fuel and power for compressor stations...................33 857 Measuring and regulating station expenses.................... 652,927 (61,801) 34 858 Transmission and Compression of gas by others....................35 874 Mains and services expenses.................................. 12,282,955 1,809,544 36 878 Meter and house regulator expenses.............................. 5,220,672 (76,390) 37 879 Customer Installations expenses............................... 5,441,130 1,053,790 38 880 Other expenses................................................ 1,833,828 80,892 39 881 Rents....................................................... 70,804 (10,224)
40 Total operation............................................. 29,770,419 4,080,571
41 Maintenance:42 885 Maintenance supervision and engineering.......................... 83,428 66,052 43 886 Maintenance of structures and improvements......................... 236,634 64,129 44 887 Maintenance of mains......................................... 9,770,586 235,253 45 888 Maintenance of compressor station equipment..........................46 889 Maintenance of measuring and regulating station equipment............ 498,470 26,341 47 892 Maintenance of services........................................ 3,285,293 220,798 48 893 Maintenance of meters and house regulators........................ 598,800 142,459 49 894 Maintenance of other equipment........................... 815,301 (67,699)
50 Total Maintenance............................................ 15,288,512 687,333
51 Total Transmission and Distribution expenses................. $ 45,058,931 $ 4,767,904
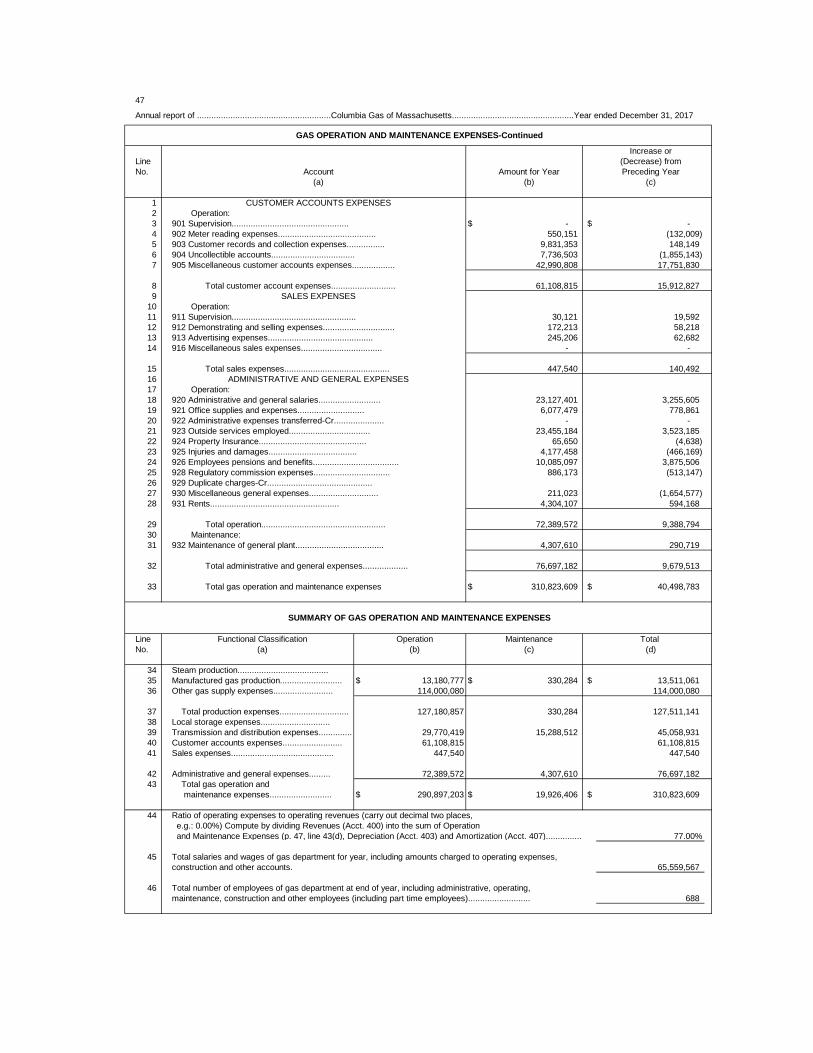
47 Annual report of ........................................................Columbia Gas of Massachusetts...................................................Year ended December 31, 2017
GAS OPERATION AND MAINTENANCE EXPENSES-Continued
Increase orLine (Decrease) fromNo. Account Amount for Year Preceding Year
(a) (b) (c)
1 CUSTOMER ACCOUNTS EXPENSES2 Operation:3 901 Supervision................................................. $ - $ - 4 902 Meter reading expenses......................................... 550,151 (132,009) 5 903 Customer records and collection expenses................ 9,831,353 148,149 6 904 Uncollectible accounts................................... 7,736,503 (1,855,143) 7 905 Miscellaneous customer accounts expenses.................. 42,990,808 17,751,830
8 Total customer account expenses........................... 61,108,815 15,912,827 9 SALES EXPENSES
10 Operation:11 911 Supervision.................................................... 30,121 19,592 12 912 Demonstrating and selling expenses.............................. 172,213 58,218 13 913 Advertising expenses............................................ 245,206 62,682 14 916 Miscellaneous sales expenses.................................. - -
15 Total sales expenses............................................ 447,540 140,492 16 ADMINISTRATIVE AND GENERAL EXPENSES17 Operation:18 920 Administrative and general salaries.......................... 23,127,401 3,255,605 19 921 Office supplies and expenses............................ 6,077,479 778,861 20 922 Administrative expenses transferred-Cr..................... - - 21 923 Outside services employed.................................. 23,455,184 3,523,185 22 924 Property Insurance............................................. 65,650 (4,638) 23 925 Injuries and damages..................................... 4,177,458 (466,169) 24 926 Employees pensions and benefits.................................... 10,085,097 3,875,506 25 928 Regulatory commission expenses................................ 886,173 (513,147) 26 929 Duplicate charges-Cr............................................27 930 Miscellaneous general expenses............................. 211,023 (1,654,577) 28 931 Rents...................................................... 4,304,107 594,168
29 Total operation.................................................... 72,389,572 9,388,794 30 Maintenance:31 932 Maintenance of general plant..................................... 4,307,610 290,719
32 Total administrative and general expenses................... 76,697,182 9,679,513
33 Total gas operation and maintenance expenses $ 310,823,609 $ 40,498,783
SUMMARY OF GAS OPERATION AND MAINTENANCE EXPENSES
Line Functional Classification Operation Maintenance Total No. (a) (b) (c) (d)
34 Steam production......................................35 Manufactured gas production.......................... $ 13,180,777 $ 330,284 $ 13,511,061 36 Other gas supply expenses......................... 114,000,080 114,000,080
37 Total production expenses............................. 127,180,857 330,284 127,511,141 38 Local storage expenses.............................39 Transmission and distribution expenses.............. 29,770,419 15,288,512 45,058,931 40 Customer accounts expenses......................... 61,108,815 61,108,815 41 Sales expenses........................................... 447,540 447,540
42 Administrative and general expenses......... 72,389,572 4,307,610 76,697,182 43 Total gas operation and
maintenance expenses.......................... $ 290,897,203 $ 19,926,406 $ 310,823,609
44 Ratio of operating expenses to operating revenues (carry out decimal two places, e.g.: 0.00%) Compute by dividing Revenues (Acct. 400) into the sum of Operation
and Maintenance Expenses (p. 47, line 43(d), Depreciation (Acct. 403) and Amortization (Acct. 407)............... 77.00%
45 Total salaries and wages of gas department for year, including amounts charged to operating expenses,construction and other accounts. 65,559,567
46 Total number of employees of gas department at end of year, including administrative, operating,maintenance, construction and other employees (including part time employees).......................... 688
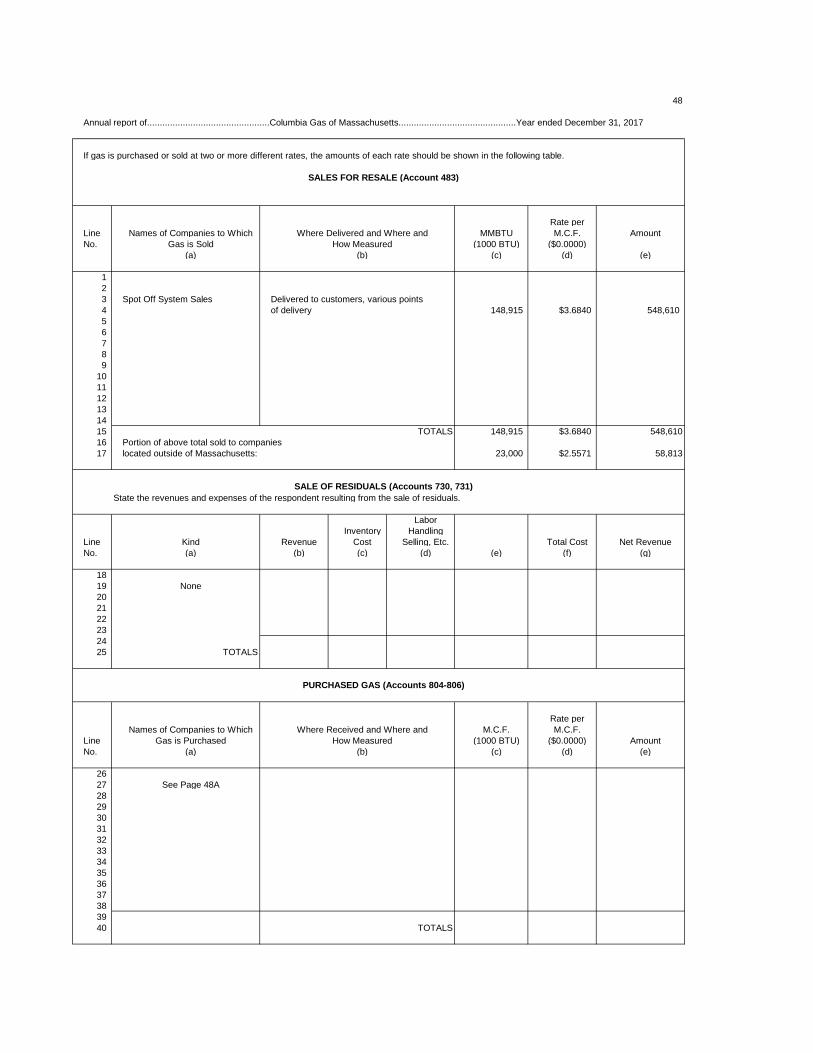
48
Annual report of................................................Columbia Gas of Massachusetts..............................................Year ended December 31, 2017
If gas is purchased or sold at two or more different rates, the amounts of each rate should be shown in the following table.
SALES FOR RESALE (Account 483)
Rate perLine Names of Companies to Which Where Delivered and Where and MMBTU M.C.F. AmountNo. Gas is Sold How Measured (1000 BTU) ($0.0000)
(a) (b) (c) (d) (e)
123 Spot Off System Sales Delivered to customers, various points4 of delivery 148,915 $3.6840 548,610 567 8 9
101112131415 TOTALS 148,915 $3.6840 548,61016 Portion of above total sold to companies17 located outside of Massachusetts: 23,000 $2.5571 58,813
SALE OF RESIDUALS (Accounts 730, 731)State the revenues and expenses of the respondent resulting from the sale of residuals.
LaborInventory Handling
Line Kind Revenue Cost Selling, Etc. Total Cost Net RevenueNo. (a) (b) (c) (d) (e) (f) (g)
1819 None202122232425 TOTALS
PURCHASED GAS (Accounts 804-806)
Rate perNames of Companies to Which Where Received and Where and M.C.F. M.C.F.
Line Gas is Purchased How Measured (1000 BTU) ($0.0000) AmountNo. (a) (b) (c) (d) (e)
2627 See Page 48A28293031323334353637383940 TOTALS
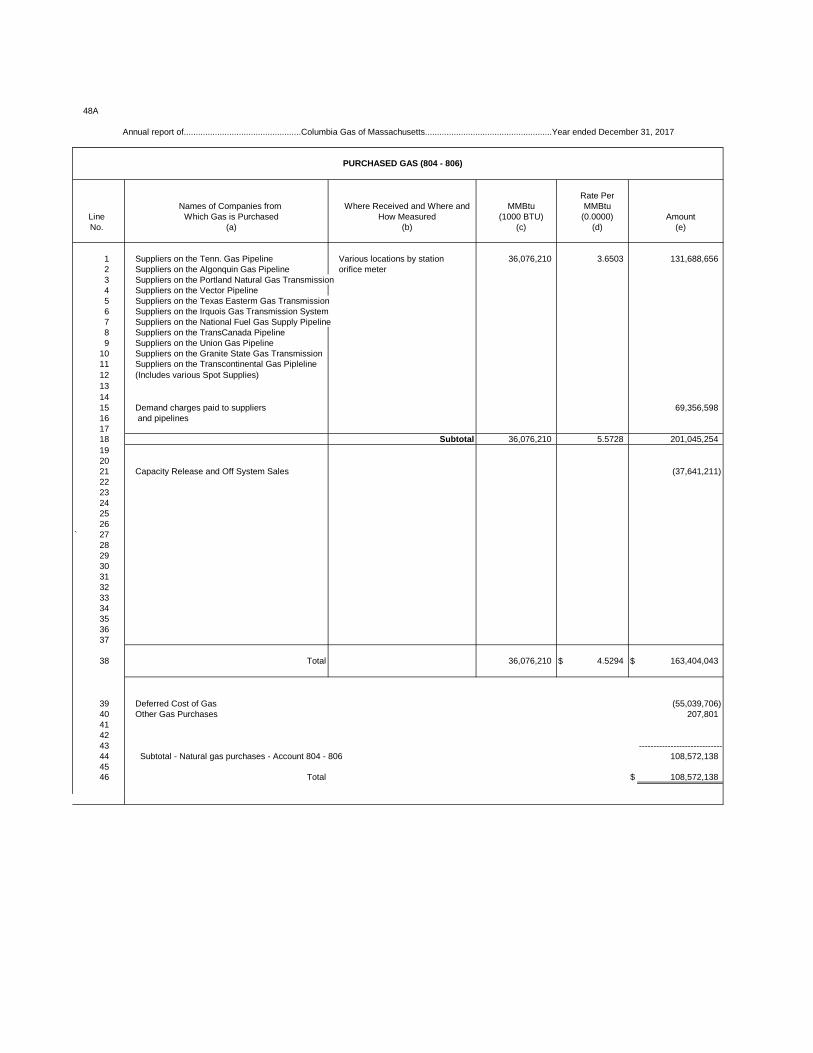
48A
PURCHASED GAS (804 - 806)
Rate PerNames of Companies from Where Received and Where and MMBtu MMBtu
Line Which Gas is Purchased How Measured (1000 BTU) (0.0000) AmountNo. (a) (b) (c) (d) (e)
1 Suppliers on the Tenn. Gas Pipeline Various locations by station 36,076,210 3.6503 131,688,6562 Suppliers on the Algonquin Gas Pipeline orifice meter 3 Suppliers on the Portland Natural Gas Transmission4 Suppliers on the Vector Pipeline5 Suppliers on the Texas Easterm Gas Transmission6 Suppliers on the Irquois Gas Transmission System7 Suppliers on the National Fuel Gas Supply Pipeline8 Suppliers on the TransCanada Pipeline9 Suppliers on the Union Gas Pipeline
10 Suppliers on the Granite State Gas Transmission11 Suppliers on the Transcontinental Gas Pipleline12 (Includes various Spot Supplies) 131415 Demand charges paid to suppliers 69,356,59816 and pipelines1718 Subtotal 36,076,210 5.5728 201,045,254192021 Capacity Release and Off System Sales (37,641,211)2223242526
` 2728293031323334353637
38 Total 36,076,210 $ 4.5294 $ 163,404,043
39 Deferred Cost of Gas (55,039,706)40 Other Gas Purchases 207,801414243 -----------------------------44 Subtotal - Natural gas purchases - Account 804 - 806 108,572,13845 46 Total $ 108,572,138
Annual report of.................................................Columbia Gas of Massachusetts.....................................................Year ended December 31, 2017
I
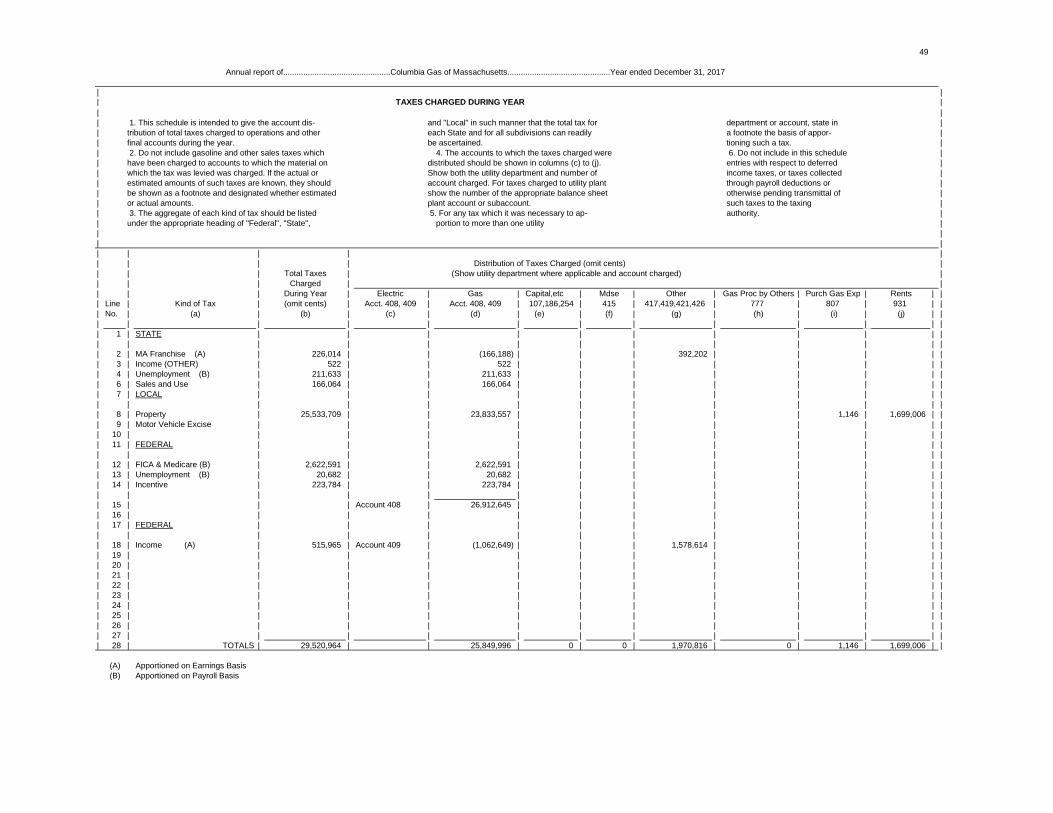
49
Annual report of................................................Columbia Gas of Massachusetts..............................................Year ended December 31, 2017 | || TAXES CHARGED DURING YEAR || || 1. This schedule is intended to give the account dis- and "Local" in such manner that the total tax for department or account, state in || tribution of total taxes charged to operations and other each State and for all subdivisions can readily a footnote the basis of appor- || final accounts during the year. be ascertained. tioning such a tax. || 2. Do not include gasoline and other sales taxes which 4. The accounts to which the taxes charged were 6. Do not include in this schedule || have been charged to accounts to which the material on distributed should be shown in columns (c) to (j). entries with respect to deferred || which the tax was levied was charged. If the actual or Show both the utility department and number of income taxes, or taxes collected || estimated amounts of such taxes are known, they should account charged. For taxes charged to utility plant through payroll deductions or || be shown as a footnote and designated whether estimated show the number of the appropriate balance sheet otherwise pending transmittal of || or actual amounts. plant account or subaccount. such taxes to the taxing || 3. The aggregate of each kind of tax should be listed 5. For any tax which it was necessary to ap- authority. || under the appropriate heading of "Federal", "State", portion to more than one utility || || || | | | || | | | Distribution of Taxes Charged (omit cents) || | | Total Taxes | (Show utility department where applicable and account charged) || | | Charged | || | | During Year | Electric | Gas | Capital,etc | Mdse | Other | Gas Proc by Others | Purch Gas Exp | Rents | || Line | Kind of Tax | (omit cents) | Acct. 408, 409 | Acct. 408, 409 | 107,186,254 | 415 | 417,419,421,426 | 777 | 807 | 931 | || No. | (a) | (b) | (c) | (d) | (e) | (f) | (g) | (h) | (i) | (j) | || | | | | | | | | | | | || 1 | STATE | | | | | | | | | | || | | | | | | | | | | | || 2 | MA Franchise (A) | 226,014 | | (166,188) | | | 392,202 | | | | || 3 | Income (OTHER) | 522 | | 522 | | | | | | | || 4 | Unemployment (B) | 211,633 | | 211,633 | | | | | | | || 6 | Sales and Use | 166,064 | | 166,064 | | | | | | | || 7 | LOCAL | | | | | | | | | | || | | | | | | | | | | | || 8 | Property | 25,533,709 | | 23,833,557 | | | | | 1,146 | 1,699,006 | || 9 | Motor Vehicle Excise | | | | | | | | | | || 10 | | | | | | | | | | | || 11 | FEDERAL | | | | | | | | | | || | | | | | | | | | | | || 12 | FICA & Medicare (B) | 2,622,591 | | 2,622,591 | | | | | | | || 13 | Unemployment (B) | 20,682 | | 20,682 | | | | | | | || 14 | Incentive | 223,784 | | 223,784 | | | | | | | || | | | | | | | | | | | || 15 | | | Account 408 | 26,912,645 | | | | | | | || 16 | | | | | | | | | | | || 17 | FEDERAL | | | | | | | | | | || | | | | | | | | | | | || 18 | Income (A) | 515,965 | Account 409 | (1,062,649) | | | 1,578,614 | | | | || 19 | | | | | | | | | | | || 20 | | | | | | | | | | | || 21 | | | | | | | | | | | || 22 | | | | | | | | | | | || 23 | | | | | | | | | | | || 24 | | | | | | | | | | | || 25 | | | | | | | | | | | || 26 | | | | | | | | | | | || 27 | | | | | | | | | | | || 28 | TOTALS | 29,520,964 | | 25,849,996 | 0 | 0 | 1,970,816 | 0 | 1,146 | 1,699,006 | |
(A) Apportioned on Earnings Basis(B) Apportioned on Payroll Basis
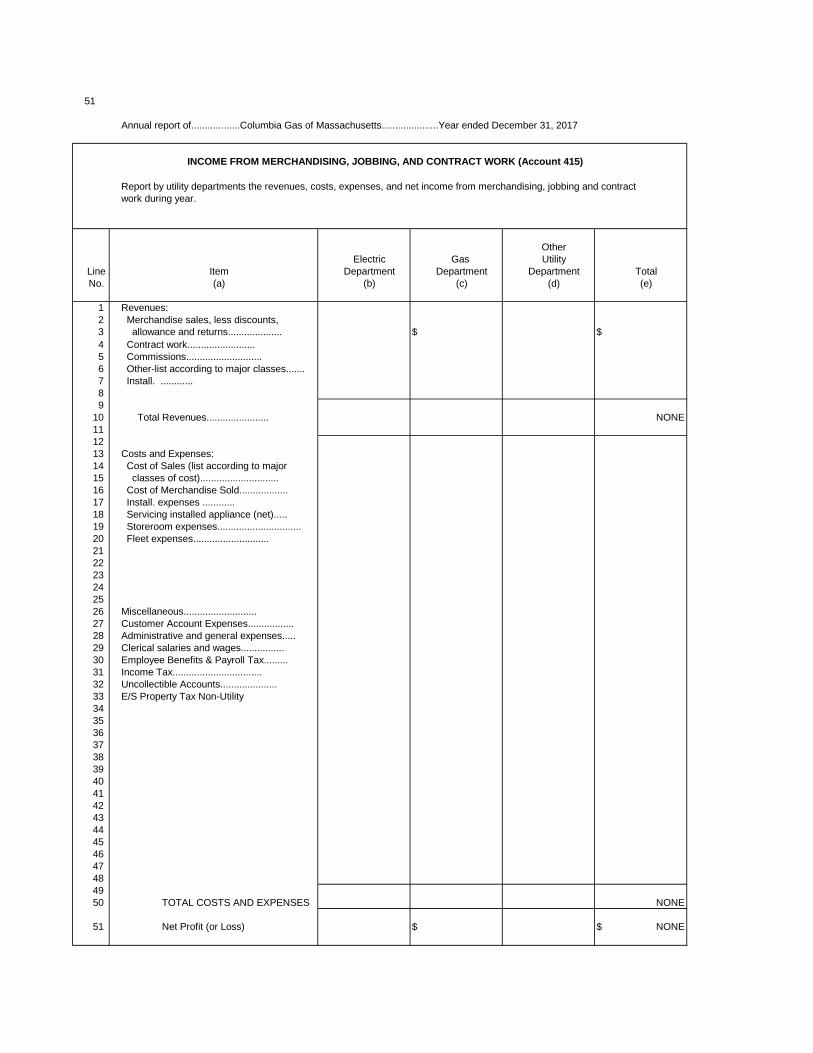
51
Annual report of..................Columbia Gas of Massachusetts.....................Year ended December 31, 2017
INCOME FROM MERCHANDISING, JOBBING, AND CONTRACT WORK (Account 415)
Report by utility departments the revenues, costs, expenses, and net income from merchandising, jobbing and contractwork during year.
OtherElectric Gas Utility
Line Item Department Department Department TotalNo. (a) (b) (c) (d) (e)
1 Revenues:2 Merchandise sales, less discounts,3 allowance and returns.................... $ $4 Contract work.........................5 Commissions............................6 Other-list according to major classes.......7 Install. ............89
10 Total Revenues....................... NONE111213 Costs and Expenses:14 Cost of Sales (list according to major15 classes of cost).............................16 Cost of Merchandise Sold..................17 Install. expenses ............18 Servicing installed appliance (net).....19 Storeroom expenses...............................20 Fleet expenses............................21 2223242526 Miscellaneous...........................27 Customer Account Expenses.................28 Administrative and general expenses.....29 Clerical salaries and wages................30 Employee Benefits & Payroll Tax.........31 Income Tax.................................32 Uncollectible Accounts.....................33 E/S Property Tax Non-Utility3435363738394041424344454647484950 TOTAL COSTS AND EXPENSES NONE
51 Net Profit (or Loss) $ $ NONE

THIS PAGE INTENTIONALLY LEFT BLANK[NEXT PAGE IS 72]
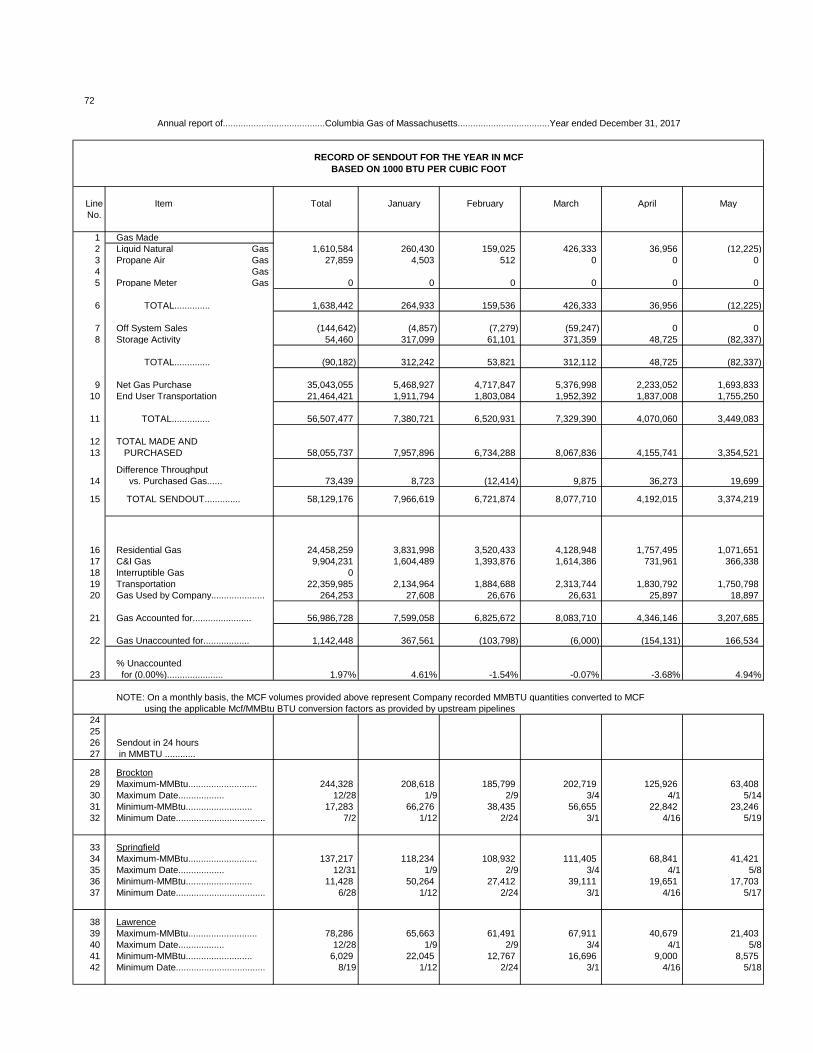
72
Line Item Total January February March April MayNo.
1 Gas Made2 Liquid Natural Gas 1,610,584 260,430 159,025 426,333 36,956 (12,225)3 Propane Air Gas 27,859 4,503 512 0 0 04 Gas 5 Propane Meter Gas 0 0 0 0 0 0
6 TOTAL.............. 1,638,442 264,933 159,536 426,333 36,956 (12,225)
7 Off System Sales (144,642) (4,857) (7,279) (59,247) 0 08 Storage Activity 54,460 317,099 61,101 371,359 48,725 (82,337)
TOTAL.............. (90,182) 312,242 53,821 312,112 48,725 (82,337)
9 Net Gas Purchase 35,043,055 5,468,927 4,717,847 5,376,998 2,233,052 1,693,83310 End User Transportation 21,464,421 1,911,794 1,803,084 1,952,392 1,837,008 1,755,250
11 TOTAL............... 56,507,477 7,380,721 6,520,931 7,329,390 4,070,060 3,449,083
12 TOTAL MADE AND13 PURCHASED 58,055,737 7,957,896 6,734,288 8,067,836 4,155,741 3,354,521
Difference Throughput14 vs. Purchased Gas...... 73,439 8,723 (12,414) 9,875 36,273 19,699
15 TOTAL SENDOUT.............. 58,129,176 7,966,619 6,721,874 8,077,710 4,192,015 3,374,219
16 Residential Gas 24,458,259 3,831,998 3,520,433 4,128,948 1,757,495 1,071,65117 C&I Gas 9,904,231 1,604,489 1,393,876 1,614,386 731,961 366,33818 Interruptible Gas 019 Transportation 22,359,985 2,134,964 1,884,688 2,313,744 1,830,792 1,750,79820 Gas Used by Company..................... 264,253 27,608 26,676 26,631 25,897 18,897
21 Gas Accounted for....................... 56,986,728 7,599,058 6,825,672 8,083,710 4,346,146 3,207,685
22 Gas Unaccounted for.................. 1,142,448 367,561 (103,798) (6,000) (154,131) 166,534
% Unaccounted23 for (0.00%)...................... 1.97% 4.61% -1.54% -0.07% -3.68% 4.94%
NOTE: On a monthly basis, the MCF volumes provided above represent Company recorded MMBTU quantities converted to MCF using the applicable Mcf/MMBtu BTU conversion factors as provided by upstream pipelines
242526 Sendout in 24 hours27 in MMBTU ............
28 Brockton29 Maximum-MMBtu........................... 244,328 208,618 185,799 202,719 125,926 63,40830 Maximum Date.................. 12/28 1/9 2/9 3/4 4/1 5/1431 Minimum-MMBtu.......................... 17,283 66,276 38,435 56,655 22,842 23,24632 Minimum Date................................... 7/2 1/12 2/24 3/1 4/16 5/19
33 Springfield34 Maximum-MMBtu........................... 137,217 118,234 108,932 111,405 68,841 41,42135 Maximum Date.................. 12/31 1/9 2/9 3/4 4/1 5/836 Minimum-MMBtu.......................... 11,428 50,264 27,412 39,111 19,651 17,70337 Minimum Date................................... 6/28 1/12 2/24 3/1 4/16 5/17
38 Lawrence39 Maximum-MMBtu........................... 78,286 65,663 61,491 67,911 40,679 21,40340 Maximum Date.................. 12/28 1/9 2/9 3/4 4/1 5/841 Minimum-MMBtu.......................... 6,029 22,045 12,767 16,696 9,000 8,57542 Minimum Date................................... 8/19 1/12 2/24 3/1 4/16 5/18
Annual report of........................................Columbia Gas of Massachusetts....................................Year ended December 31, 2017
RECORD OF SENDOUT FOR THE YEAR IN MCFBASED ON 1000 BTU PER CUBIC FOOT
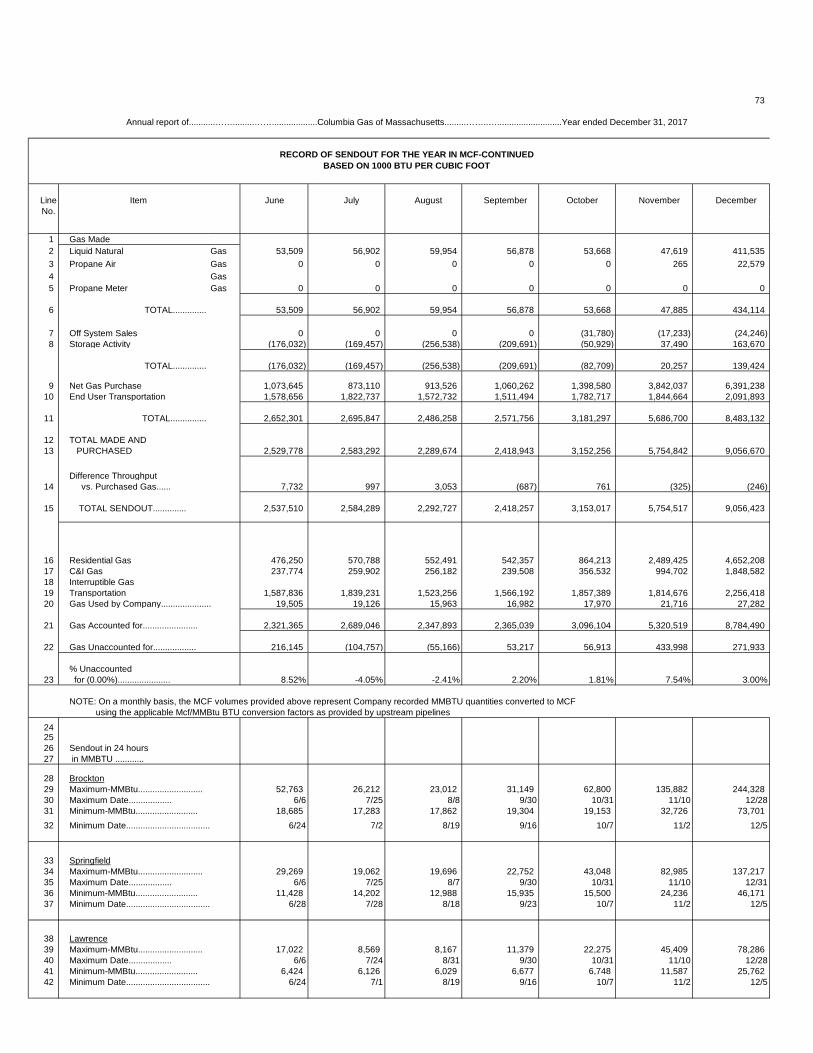
73
Line Item June July August September October November DecemberNo.
1 Gas Made2 Liquid Natural Gas 53,509 56,902 59,954 56,878 53,668 47,619 411,5353 Propane Air Gas 0 0 0 0 0 265 22,5794 Gas 5 Propane Meter Gas 0 0 0 0 0 0 0
6 TOTAL.............. 53,509 56,902 59,954 56,878 53,668 47,885 434,114
7 Off System Sales 0 0 0 0 (31,780) (17,233) (24,246)8 Storage Activity (176,032) (169,457) (256,538) (209,691) (50,929) 37,490 163,670
TOTAL.............. (176,032) (169,457) (256,538) (209,691) (82,709) 20,257 139,424
9 Net Gas Purchase 1,073,645 873,110 913,526 1,060,262 1,398,580 3,842,037 6,391,23810 End User Transportation 1,578,656 1,822,737 1,572,732 1,511,494 1,782,717 1,844,664 2,091,893
11 TOTAL............... 2,652,301 2,695,847 2,486,258 2,571,756 3,181,297 5,686,700 8,483,132
12 TOTAL MADE AND13 PURCHASED 2,529,778 2,583,292 2,289,674 2,418,943 3,152,256 5,754,842 9,056,670
Difference Throughput14 vs. Purchased Gas...... 7,732 997 3,053 (687) 761 (325) (246)
15 TOTAL SENDOUT.............. 2,537,510 2,584,289 2,292,727 2,418,257 3,153,017 5,754,517 9,056,423
16 Residential Gas 476,250 570,788 552,491 542,357 864,213 2,489,425 4,652,20817 C&I Gas 237,774 259,902 256,182 239,508 356,532 994,702 1,848,58218 Interruptible Gas19 Transportation 1,587,836 1,839,231 1,523,256 1,566,192 1,857,389 1,814,676 2,256,41820 Gas Used by Company..................... 19,505 19,126 15,963 16,982 17,970 21,716 27,282
21 Gas Accounted for....................... 2,321,365 2,689,046 2,347,893 2,365,039 3,096,104 5,320,519 8,784,490
22 Gas Unaccounted for.................. 216,145 (104,757) (55,166) 53,217 56,913 433,998 271,933
% Unaccounted23 for (0.00%)...................... 8.52% -4.05% -2.41% 2.20% 1.81% 7.54% 3.00%
NOTE: On a monthly basis, the MCF volumes provided above represent Company recorded MMBTU quantities converted to MCF using the applicable Mcf/MMBtu BTU conversion factors as provided by upstream pipelines
2425 26 Sendout in 24 hours27 in MMBTU ............
28 Brockton29 Maximum-MMBtu........................... 52,763 26,212 23,012 31,149 62,800 135,882 244,32830 Maximum Date.................. 6/6 7/25 8/8 9/30 10/31 11/10 12/2831 Minimum-MMBtu.......................... 18,685 17,283 17,862 19,304 19,153 32,726 73,70132 Minimum Date................................... 6/24 7/2 8/19 9/16 10/7 11/2 12/5
33 Springfield34 Maximum-MMBtu........................... 29,269 19,062 19,696 22,752 43,048 82,985 137,21735 Maximum Date.................. 6/6 7/25 8/7 9/30 10/31 11/10 12/3136 Minimum-MMBtu.......................... 11,428 14,202 12,988 15,935 15,500 24,236 46,17137 Minimum Date................................... 6/28 7/28 8/18 9/23 10/7 11/2 12/5
38 Lawrence39 Maximum-MMBtu........................... 17,022 8,569 8,167 11,379 22,275 45,409 78,28640 Maximum Date.................. 6/6 7/24 8/31 9/30 10/31 11/10 12/2841 Minimum-MMBtu.......................... 6,424 6,126 6,029 6,677 6,748 11,587 25,76242 Minimum Date................................... 6/24 7/1 8/19 9/16 10/7 11/2 12/5
Annual report of...........…….........……...................Columbia Gas of Massachusetts.........……..…...........................Year ended December 31, 2017
RECORD OF SENDOUT FOR THE YEAR IN MCF-CONTINUEDBASED ON 1000 BTU PER CUBIC FOOT
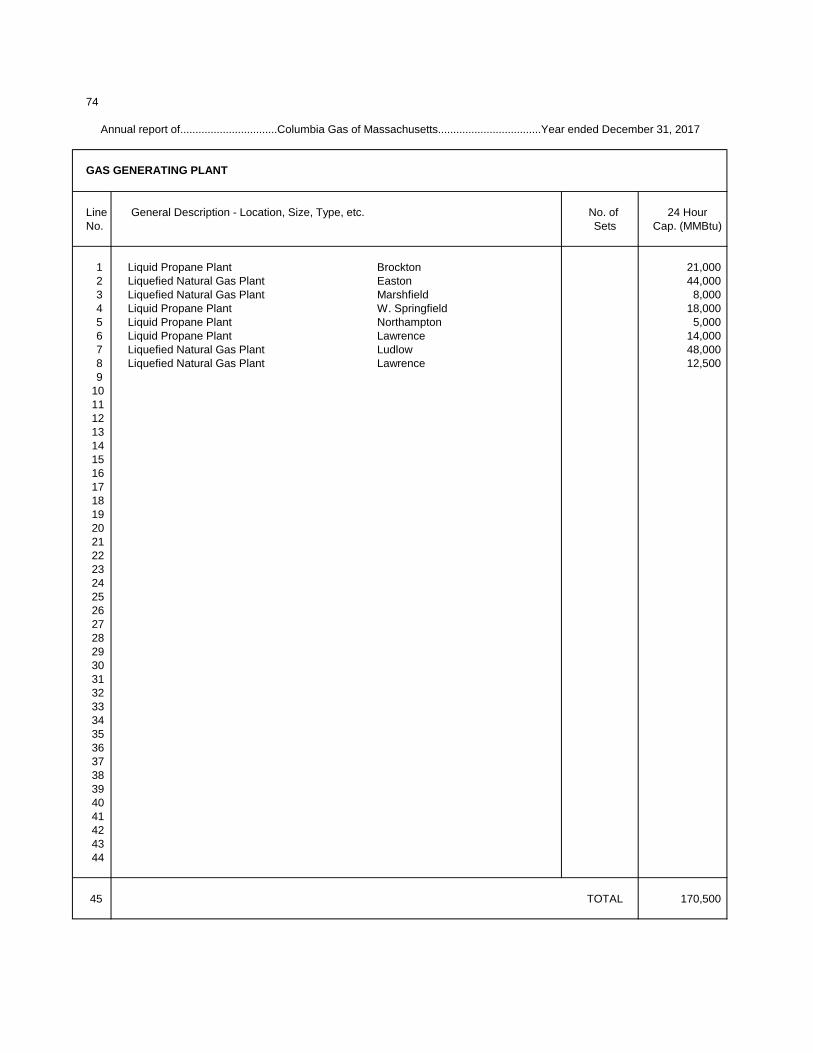
74
GAS GENERATING PLANT
Line General Description - Location, Size, Type, etc. No. of 24 HourNo. Sets Cap. (MMBtu)
1 Liquid Propane Plant Brockton 21,000 2 Liquefied Natural Gas Plant Easton 44,000 3 Liquefied Natural Gas Plant Marshfield 8,000 4 Liquid Propane Plant W. Springfield 18,000 5 Liquid Propane Plant Northampton 5,000 6 Liquid Propane Plant Lawrence 14,000 7 Liquefied Natural Gas Plant Ludlow 48,000 8 Liquefied Natural Gas Plant Lawrence 12,500 91011121314151617181920212223242526272829303132333435363738394041424344
45 TOTAL 170,500
Annual report of................................Columbia Gas of Massachusetts..................................Year ended December 31, 2017
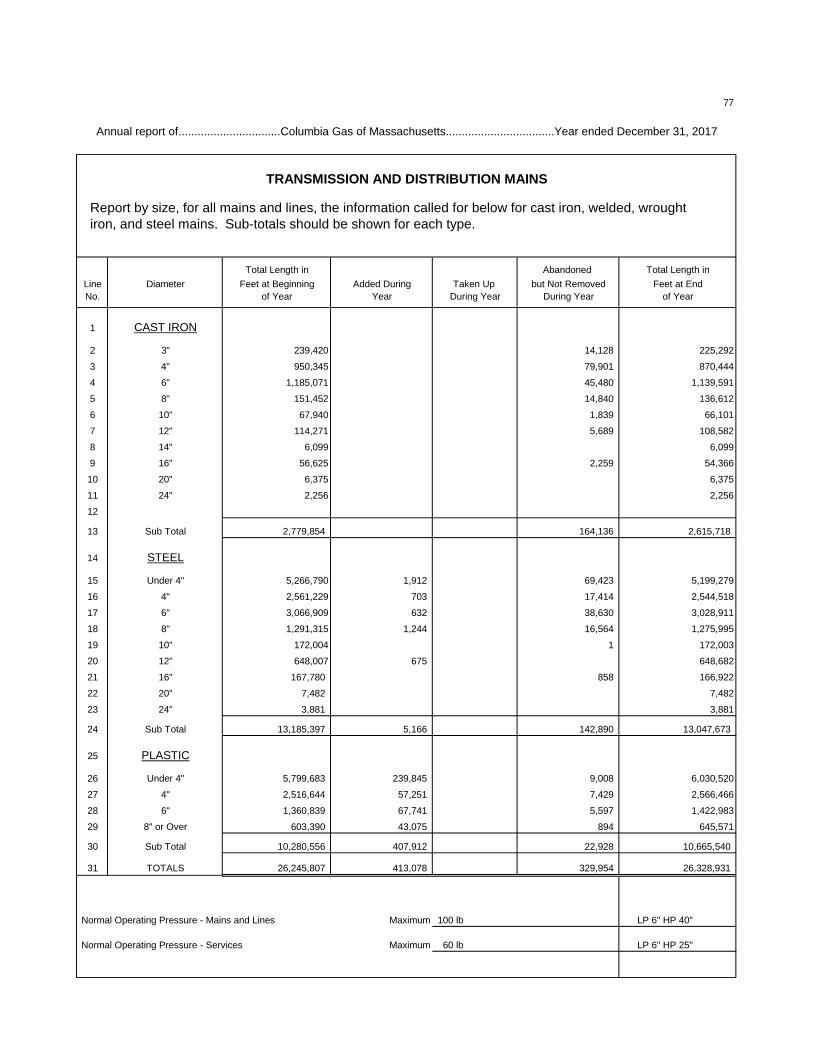
77
TRANSMISSION AND DISTRIBUTION MAINS
Report by size, for all mains and lines, the information called for below for cast iron, welded, wrought iron, and steel mains. Sub-totals should be shown for each type.
Total Length in Abandoned Total Length inLine Diameter Feet at Beginning Added During Taken Up but Not Removed Feet at EndNo. of Year Year During Year During Year of Year
1 CAST IRON
2 3" 239,420 14,128 225,292
3 4" 950,345 79,901 870,444
4 6" 1,185,071 45,480 1,139,591
5 8" 151,452 14,840 136,612
6 10" 67,940 1,839 66,101
7 12" 114,271 5,689 108,582
8 14" 6,099 6,099
9 16" 56,625 2,259 54,366
10 20" 6,375 6,375
11 24" 2,256 2,256
12
13 Sub Total 2,779,854 164,136 2,615,718
14 STEEL
15 Under 4" 5,266,790 1,912 69,423 5,199,279
16 4" 2,561,229 703 17,414 2,544,518
17 6" 3,066,909 632 38,630 3,028,911
18 8" 1,291,315 1,244 16,564 1,275,995
19 10" 172,004 1 172,003
20 12" 648,007 675 648,682
21 16" 167,780 858 166,922
22 20" 7,482 7,482
23 24" 3,881 3,881
24 Sub Total 13,185,397 5,166 142,890 13,047,673
25 PLASTIC
26 Under 4" 5,799,683 239,845 9,008 6,030,520
27 4" 2,516,644 57,251 7,429 2,566,466
28 6" 1,360,839 67,741 5,597 1,422,983
29 8" or Over 603,390 43,075 894 645,571
30 Sub Total 10,280,556 407,912 22,928 10,665,540
31 TOTALS 26,245,807 413,078 329,954 26,328,931
Normal Operating Pressure - Mains and Lines Maximum 100 lb LP 6" HP 40"
Normal Operating Pressure - Services Maximum 60 lb LP 6" HP 25"
Annual report of................................Columbia Gas of Massachusetts..................................Year ended December 31, 2017
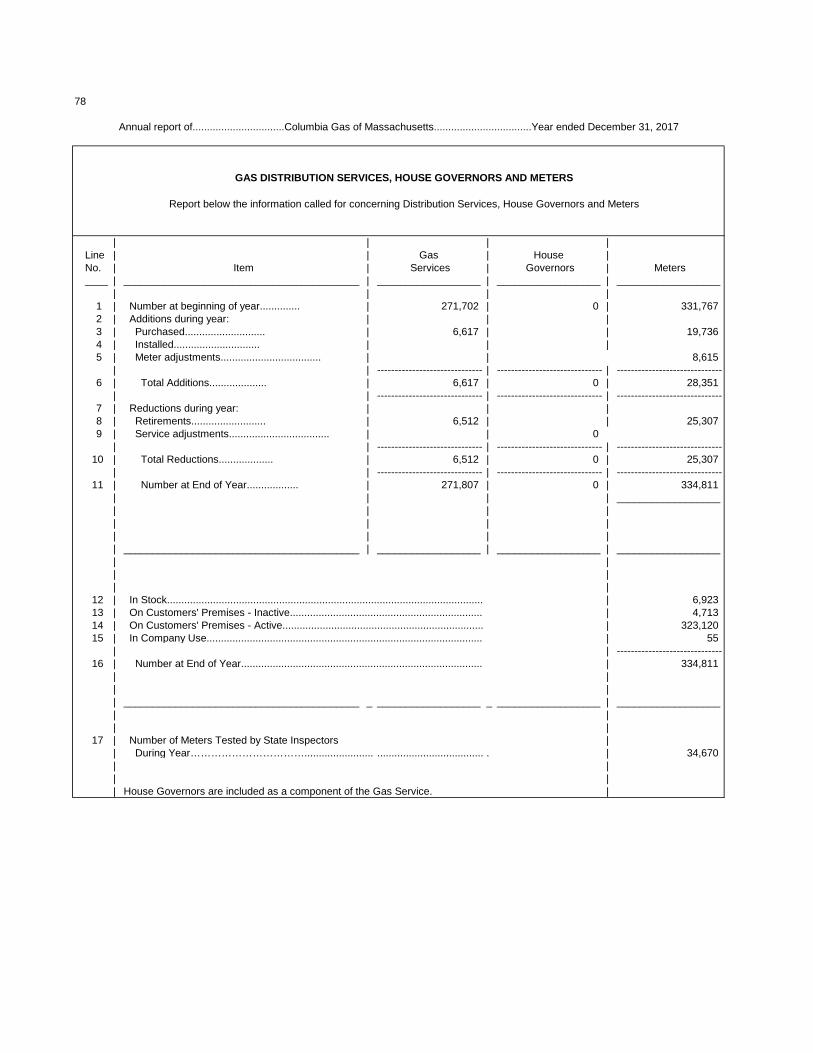
78
GAS DISTRIBUTION SERVICES, HOUSE GOVERNORS AND METERS
Report below the information called for concerning Distribution Services, House Governors and Meters
| | | |Line | | Gas | House |No. | Item | Services | Governors | Meters____ | _________________________________________ | __________________ | __________________ | __________________
| | | | 1 | Number at beginning of year.............. | 271,702 | 0 | 331,767 2 | Additions during year: | | | 3 | Purchased............................ | 6,617 | | 19,736 4 | Installed.............................. | | | 5 | Meter adjustments................................... | | 8,615
| | ------------------------------ | ------------------------------ | ------------------------------ 6 | Total Additions.................... | 6,617 | 0 | 28,351
| | ------------------------------ | ------------------------------ | ------------------------------ 7 | Reductions during year: | | | 8 | Retirements.......................... | 6,512 | | 25,307 9 | Service adjustments................................... | | 0
| | ------------------------------ | ------------------------------ | ------------------------------10 | Total Reductions................... | 6,512 | 0 | 25,307
| | ------------------------------ | ------------------------------ | ------------------------------11 | Number at End of Year.................. | 271,807 | 0 | 334,811
| | | | __________________| | | || | | || | | || _________________________________________ | __________________ | __________________ | __________________| || || |
12 | In Stock.............................................................................................................. | 6,92313 | On Customers' Premises - Inactive.................................................................... | 4,71314 | On Customers' Premises - Active...................................................................... | 323,12015 | In Company Use................................................................................................. | 55
| | ------------------------------16 | Number at End of Year..................................................................................... | 334,811
| || || _________________________________________ _ __________________ _ __________________ | __________________| || |
17 | Number of Meters Tested by State Inspectors || During Year……………………………......................... ..................................... . | 34,670| || || House Governors are included as a component of the Gas Service. |
Annual report of................................Columbia Gas of Massachusetts..................................Year ended December 31, 2017
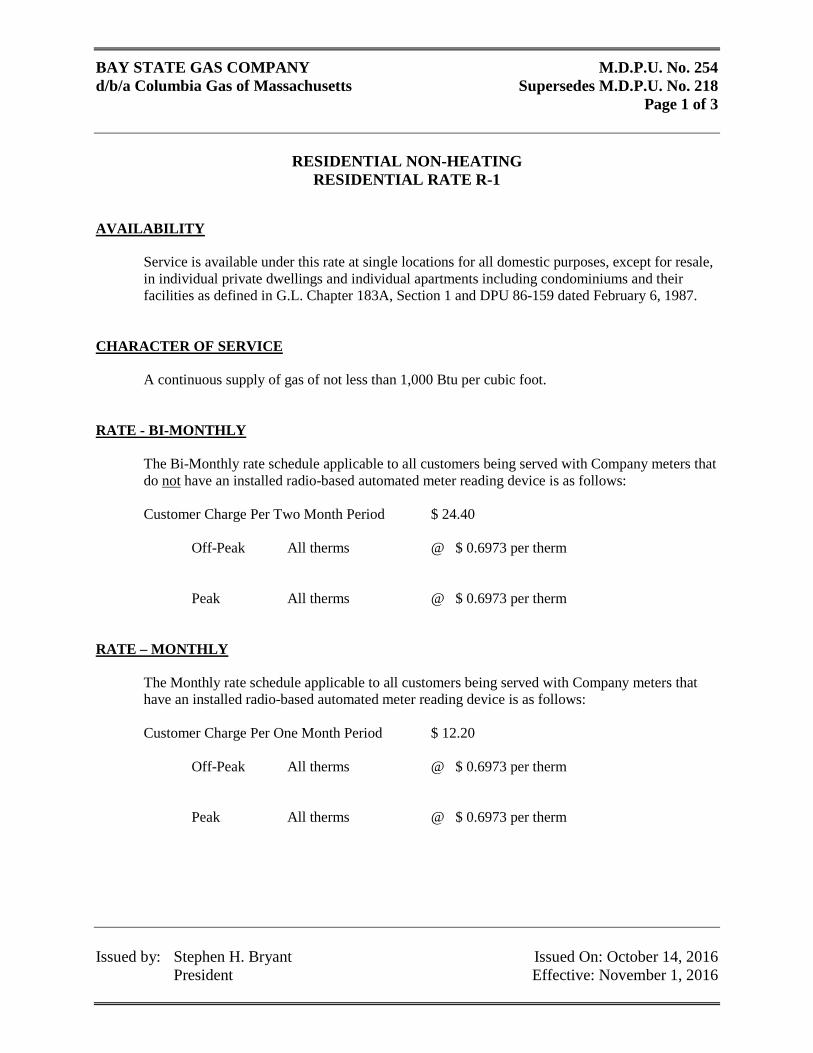
BAY STATE GAS COMPANY M.D.P.U. No. 254 d/b/a Columbia Gas of Massachusetts Supersedes M.D.P.U. No. 218
Page 1 of 3
RESIDENTIAL NON-HEATING
RESIDENTIAL RATE R-1
Issued by: Stephen H. Bryant Issued On: October 14, 2016 President Effective: November 1, 2016
AVAILABILITY
Service is available under this rate at single locations for all domestic purposes, except for resale, in individual private dwellings and individual apartments including condominiums and their facilities as defined in G.L. Chapter 183A, Section 1 and DPU 86-159 dated February 6, 1987.
CHARACTER OF SERVICE A continuous supply of gas of not less than 1,000 Btu per cubic foot. RATE - BI-MONTHLY The Bi-Monthly rate schedule applicable to all customers being served with Company meters that
do not have an installed radio-based automated meter reading device is as follows: Customer Charge Per Two Month Period $ 24.40 Off-Peak All therms @ $ 0.6973 per therm Peak All therms @ $ 0.6973 per therm RATE – MONTHLY The Monthly rate schedule applicable to all customers being served with Company meters that
have an installed radio-based automated meter reading device is as follows: Customer Charge Per One Month Period $ 12.20 Off-Peak All therms @ $ 0.6973 per therm Peak All therms @ $ 0.6973 per therm
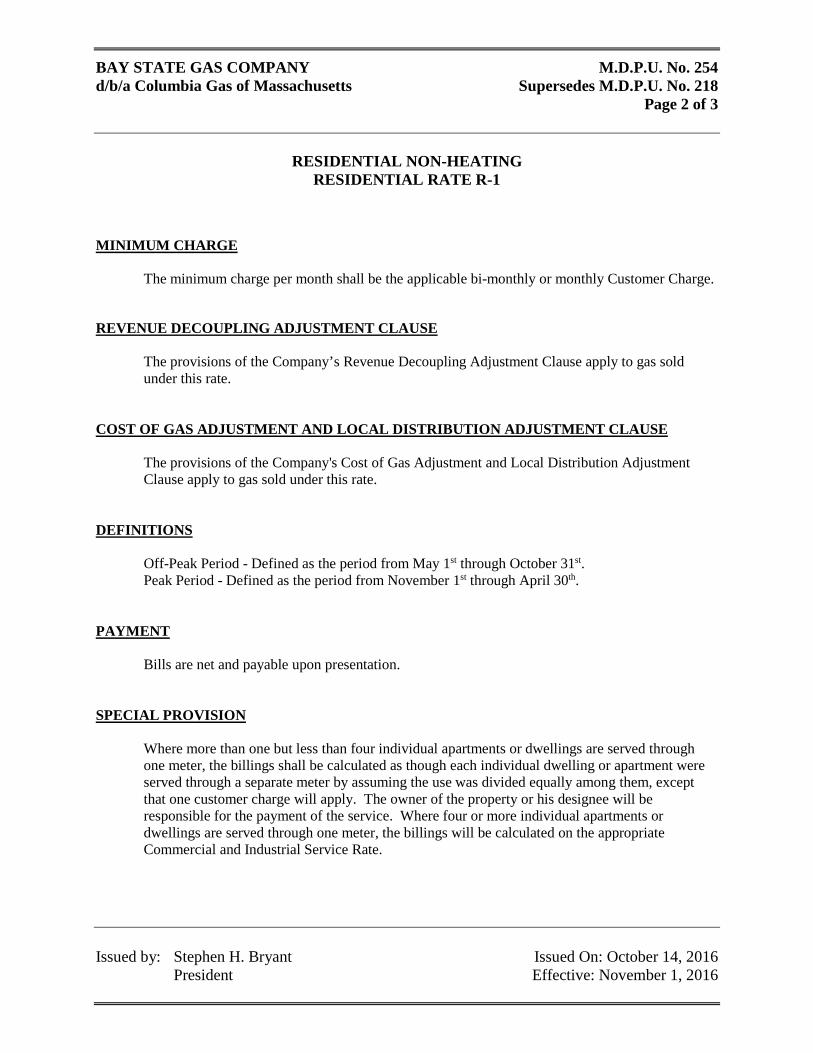
BAY STATE GAS COMPANY M.D.P.U. No. 254 d/b/a Columbia Gas of Massachusetts Supersedes M.D.P.U. No. 218
Page 2 of 3
RESIDENTIAL NON-HEATING
RESIDENTIAL RATE R-1
Issued by: Stephen H. Bryant Issued On: October 14, 2016 President Effective: November 1, 2016
MINIMUM CHARGE The minimum charge per month shall be the applicable bi-monthly or monthly Customer Charge. REVENUE DECOUPLING ADJUSTMENT CLAUSE
The provisions of the Company’s Revenue Decoupling Adjustment Clause apply to gas sold under this rate.
COST OF GAS ADJUSTMENT AND LOCAL DISTRIBUTION ADJUSTMENT CLAUSE
The provisions of the Company's Cost of Gas Adjustment and Local Distribution Adjustment Clause apply to gas sold under this rate.
DEFINITIONS
Off-Peak Period - Defined as the period from May 1st through October 31st. Peak Period - Defined as the period from November 1st through April 30th.
PAYMENT Bills are net and payable upon presentation. SPECIAL PROVISION
Where more than one but less than four individual apartments or dwellings are served through one meter, the billings shall be calculated as though each individual dwelling or apartment were served through a separate meter by assuming the use was divided equally among them, except that one customer charge will apply. The owner of the property or his designee will be responsible for the payment of the service. Where four or more individual apartments or dwellings are served through one meter, the billings will be calculated on the appropriate Commercial and Industrial Service Rate.
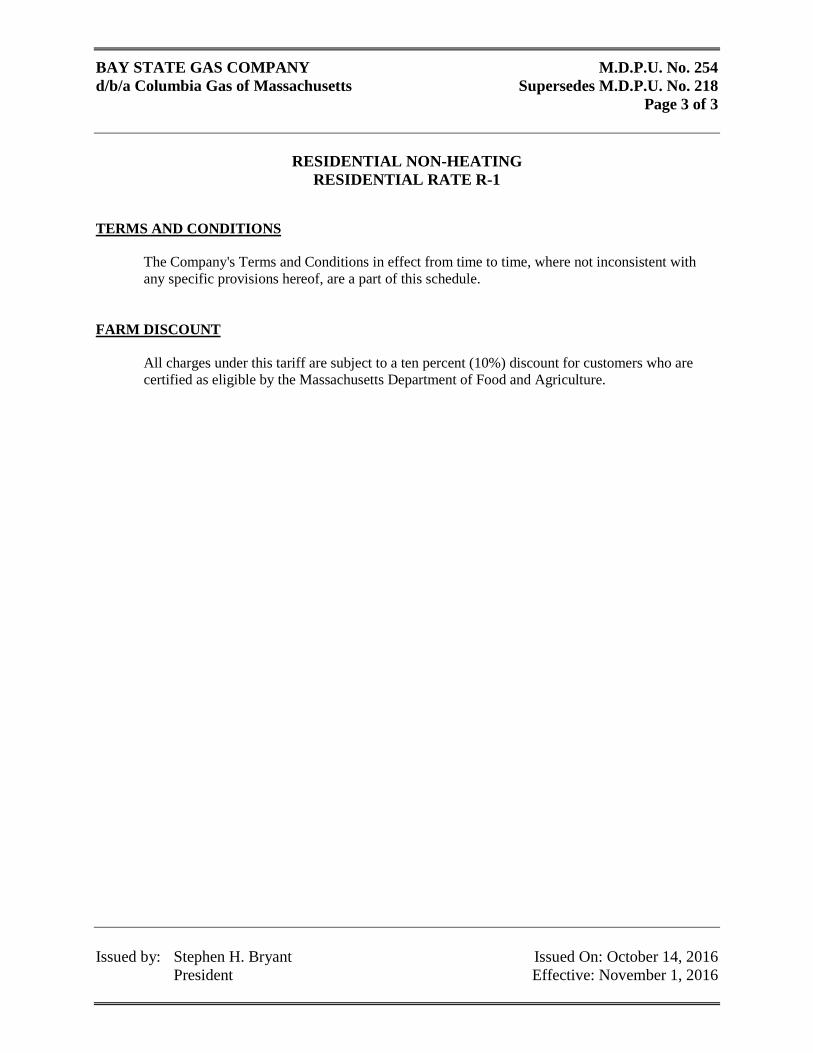
BAY STATE GAS COMPANY M.D.P.U. No. 254 d/b/a Columbia Gas of Massachusetts Supersedes M.D.P.U. No. 218
Page 3 of 3
RESIDENTIAL NON-HEATING
RESIDENTIAL RATE R-1
Issued by: Stephen H. Bryant Issued On: October 14, 2016 President Effective: November 1, 2016
TERMS AND CONDITIONS
The Company's Terms and Conditions in effect from time to time, where not inconsistent with any specific provisions hereof, are a part of this schedule.
FARM DISCOUNT
All charges under this tariff are subject to a ten percent (10%) discount for customers who are certified as eligible by the Massachusetts Department of Food and Agriculture.
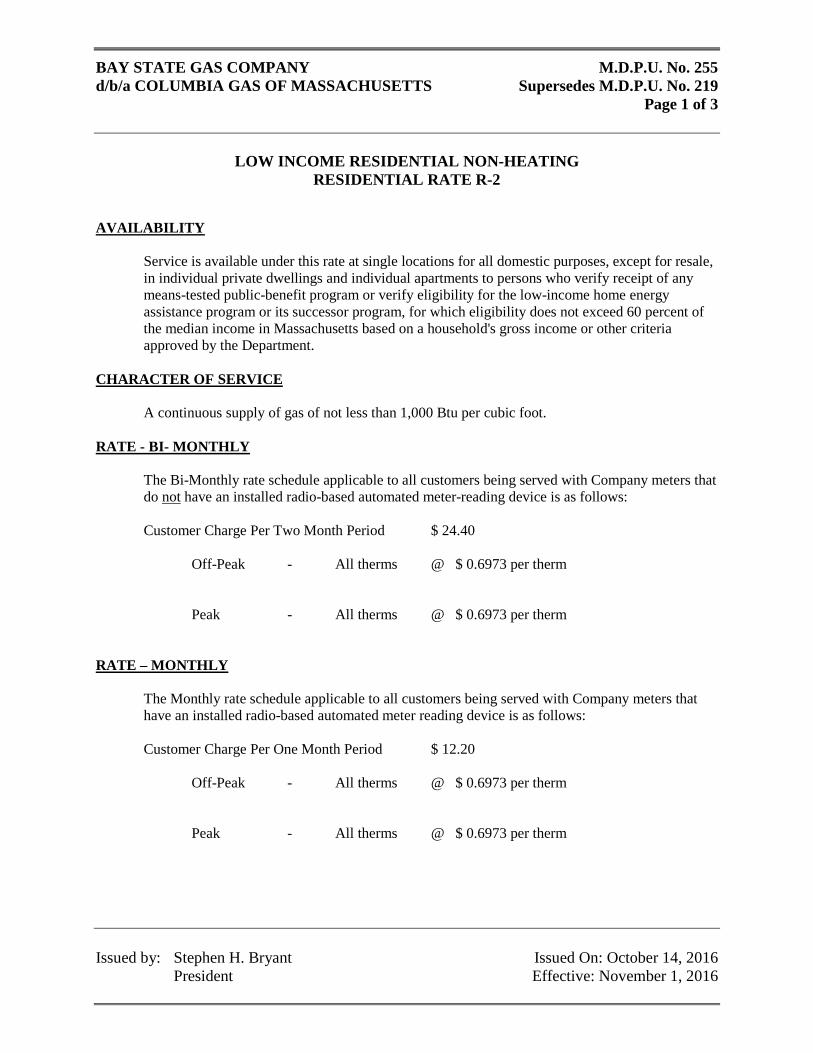
BAY STATE GAS COMPANY M.D.P.U. No. 255 d/b/a COLUMBIA GAS OF MASSACHUSETTS Supersedes M.D.P.U. No. 219
Page 1 of 3
LOW INCOME RESIDENTIAL NON-HEATING
RESIDENTIAL RATE R-2
Issued by: Stephen H. Bryant Issued On: October 14, 2016 President Effective: November 1, 2016
AVAILABILITY
Service is available under this rate at single locations for all domestic purposes, except for resale, in individual private dwellings and individual apartments to persons who verify receipt of any means-tested public-benefit program or verify eligibility for the low-income home energy assistance program or its successor program, for which eligibility does not exceed 60 percent of the median income in Massachusetts based on a household's gross income or other criteria approved by the Department.
CHARACTER OF SERVICE A continuous supply of gas of not less than 1,000 Btu per cubic foot. RATE - BI- MONTHLY
The Bi-Monthly rate schedule applicable to all customers being served with Company meters that do not have an installed radio-based automated meter-reading device is as follows:
Customer Charge Per Two Month Period $ 24.40 Off-Peak - All therms @ $ 0.6973 per therm Peak - All therms @ $ 0.6973 per therm RATE – MONTHLY The Monthly rate schedule applicable to all customers being served with Company meters that
have an installed radio-based automated meter reading device is as follows: Customer Charge Per One Month Period $ 12.20 Off-Peak - All therms @ $ 0.6973 per therm Peak - All therms @ $ 0.6973 per therm
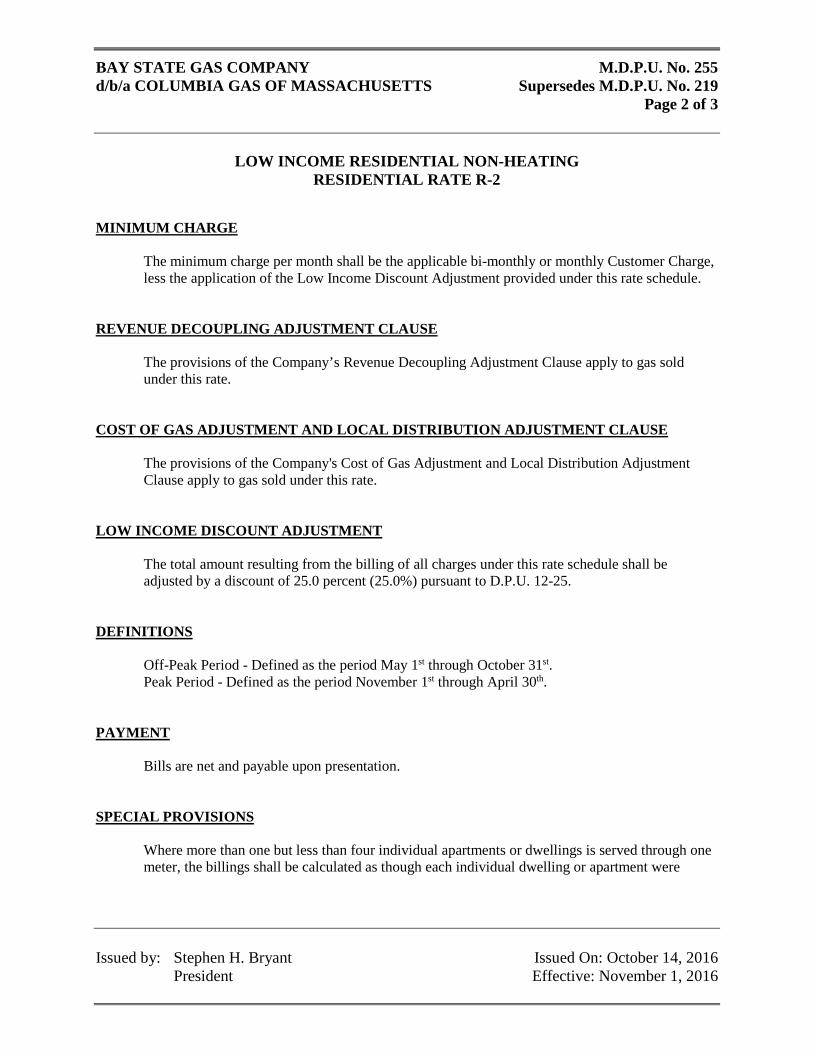
BAY STATE GAS COMPANY M.D.P.U. No. 255 d/b/a COLUMBIA GAS OF MASSACHUSETTS Supersedes M.D.P.U. No. 219
Page 2 of 3
LOW INCOME RESIDENTIAL NON-HEATING
RESIDENTIAL RATE R-2
Issued by: Stephen H. Bryant Issued On: October 14, 2016 President Effective: November 1, 2016
MINIMUM CHARGE The minimum charge per month shall be the applicable bi-monthly or monthly Customer Charge,
less the application of the Low Income Discount Adjustment provided under this rate schedule. REVENUE DECOUPLING ADJUSTMENT CLAUSE
The provisions of the Company’s Revenue Decoupling Adjustment Clause apply to gas sold under this rate.
COST OF GAS ADJUSTMENT AND LOCAL DISTRIBUTION ADJUSTMENT CLAUSE
The provisions of the Company's Cost of Gas Adjustment and Local Distribution Adjustment Clause apply to gas sold under this rate.
LOW INCOME DISCOUNT ADJUSTMENT
The total amount resulting from the billing of all charges under this rate schedule shall be adjusted by a discount of 25.0 percent (25.0%) pursuant to D.P.U. 12-25.
DEFINITIONS
Off-Peak Period - Defined as the period May 1st through October 31st. Peak Period - Defined as the period November 1st through April 30th.
PAYMENT Bills are net and payable upon presentation. SPECIAL PROVISIONS
Where more than one but less than four individual apartments or dwellings is served through one meter, the billings shall be calculated as though each individual dwelling or apartment were
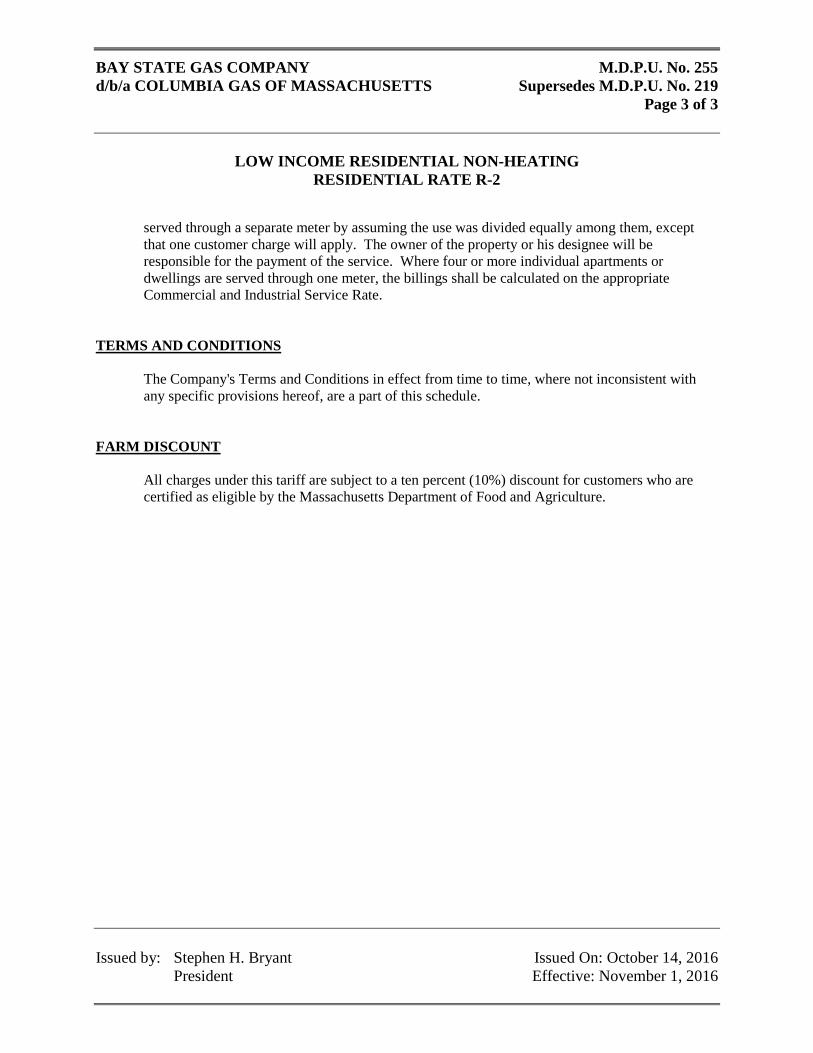
BAY STATE GAS COMPANY M.D.P.U. No. 255 d/b/a COLUMBIA GAS OF MASSACHUSETTS Supersedes M.D.P.U. No. 219
Page 3 of 3
LOW INCOME RESIDENTIAL NON-HEATING
RESIDENTIAL RATE R-2
Issued by: Stephen H. Bryant Issued On: October 14, 2016 President Effective: November 1, 2016
served through a separate meter by assuming the use was divided equally among them, except that one customer charge will apply. The owner of the property or his designee will be responsible for the payment of the service. Where four or more individual apartments or dwellings are served through one meter, the billings shall be calculated on the appropriate Commercial and Industrial Service Rate.
TERMS AND CONDITIONS
The Company's Terms and Conditions in effect from time to time, where not inconsistent with any specific provisions hereof, are a part of this schedule.
FARM DISCOUNT
All charges under this tariff are subject to a ten percent (10%) discount for customers who are certified as eligible by the Massachusetts Department of Food and Agriculture.
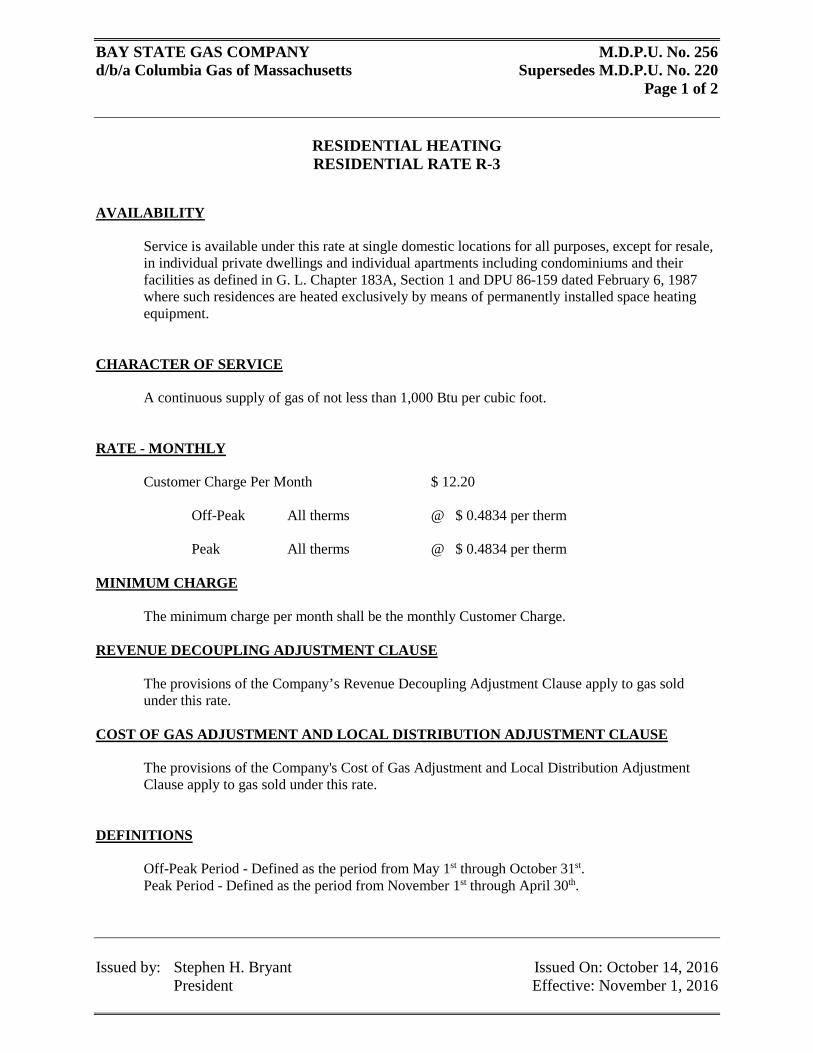
BAY STATE GAS COMPANY M.D.P.U. No. 256 d/b/a Columbia Gas of Massachusetts Supersedes M.D.P.U. No. 220
Page 1 of 2
RESIDENTIAL HEATING RESIDENTIAL RATE R-3
Issued by: Stephen H. Bryant Issued On: October 14, 2016 President Effective: November 1, 2016
AVAILABILITY
Service is available under this rate at single domestic locations for all purposes, except for resale, in individual private dwellings and individual apartments including condominiums and their facilities as defined in G. L. Chapter 183A, Section 1 and DPU 86-159 dated February 6, 1987 where such residences are heated exclusively by means of permanently installed space heating equipment.
CHARACTER OF SERVICE A continuous supply of gas of not less than 1,000 Btu per cubic foot. RATE - MONTHLY Customer Charge Per Month $ 12.20 Off-Peak All therms @ $ 0.4834 per therm Peak All therms @ $ 0.4834 per therm MINIMUM CHARGE The minimum charge per month shall be the monthly Customer Charge. REVENUE DECOUPLING ADJUSTMENT CLAUSE
The provisions of the Company’s Revenue Decoupling Adjustment Clause apply to gas sold under this rate.
COST OF GAS ADJUSTMENT AND LOCAL DISTRIBUTION ADJUSTMENT CLAUSE
The provisions of the Company's Cost of Gas Adjustment and Local Distribution Adjustment Clause apply to gas sold under this rate.
DEFINITIONS
Off-Peak Period - Defined as the period from May 1st through October 31st. Peak Period - Defined as the period from November 1st through April 30th.
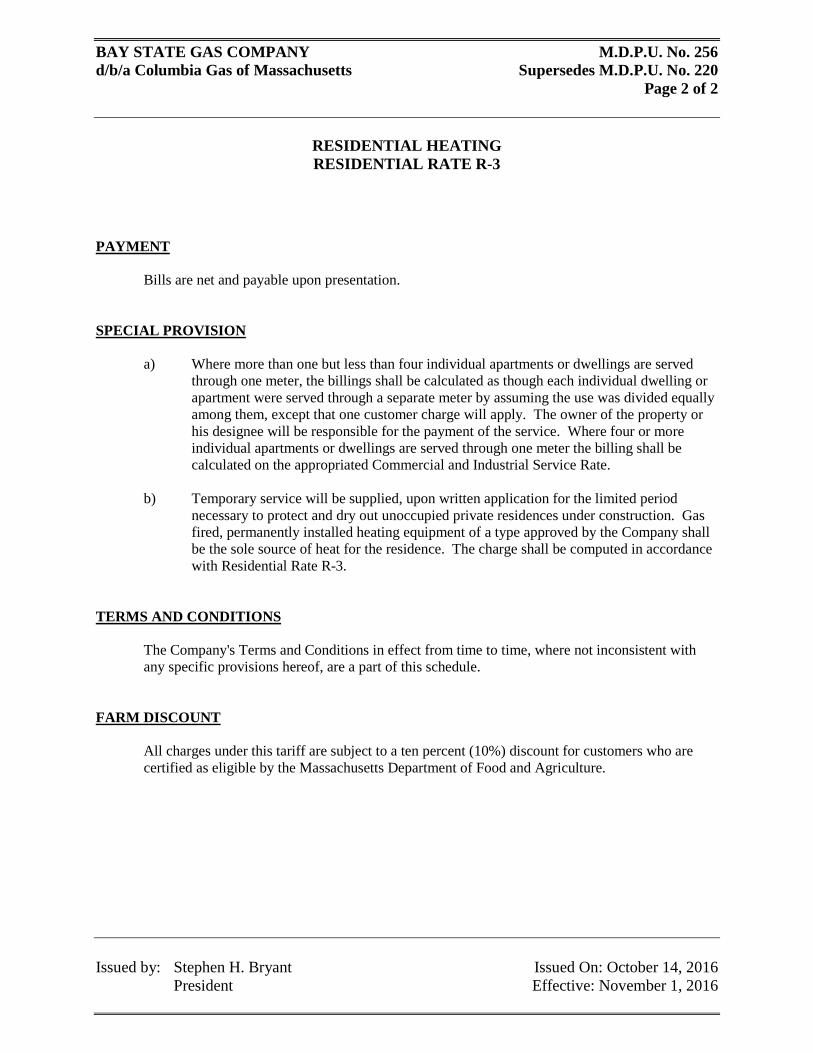
BAY STATE GAS COMPANY M.D.P.U. No. 256 d/b/a Columbia Gas of Massachusetts Supersedes M.D.P.U. No. 220
Page 2 of 2
RESIDENTIAL HEATING RESIDENTIAL RATE R-3
Issued by: Stephen H. Bryant Issued On: October 14, 2016 President Effective: November 1, 2016
PAYMENT Bills are net and payable upon presentation. SPECIAL PROVISION
a) Where more than one but less than four individual apartments or dwellings are served through one meter, the billings shall be calculated as though each individual dwelling or apartment were served through a separate meter by assuming the use was divided equally among them, except that one customer charge will apply. The owner of the property or his designee will be responsible for the payment of the service. Where four or more individual apartments or dwellings are served through one meter the billing shall be calculated on the appropriated Commercial and Industrial Service Rate.
b) Temporary service will be supplied, upon written application for the limited period
necessary to protect and dry out unoccupied private residences under construction. Gas fired, permanently installed heating equipment of a type approved by the Company shall be the sole source of heat for the residence. The charge shall be computed in accordance with Residential Rate R-3.
TERMS AND CONDITIONS
The Company's Terms and Conditions in effect from time to time, where not inconsistent with any specific provisions hereof, are a part of this schedule.
FARM DISCOUNT
All charges under this tariff are subject to a ten percent (10%) discount for customers who are certified as eligible by the Massachusetts Department of Food and Agriculture.
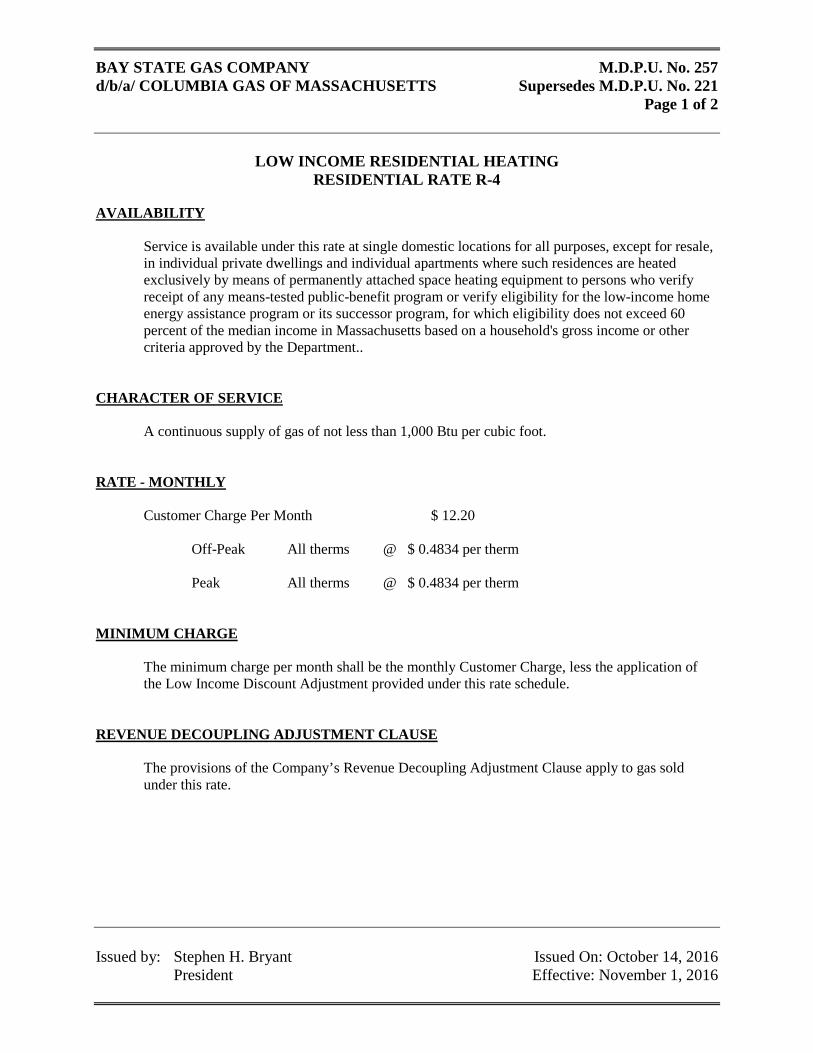
BAY STATE GAS COMPANY M.D.P.U. No. 257 d/b/a/ COLUMBIA GAS OF MASSACHUSETTS Supersedes M.D.P.U. No. 221
Page 1 of 2
LOW INCOME RESIDENTIAL HEATING
RESIDENTIAL RATE R-4
Issued by: Stephen H. Bryant Issued On: October 14, 2016 President Effective: November 1, 2016
AVAILABILITY
Service is available under this rate at single domestic locations for all purposes, except for resale, in individual private dwellings and individual apartments where such residences are heated exclusively by means of permanently attached space heating equipment to persons who verify receipt of any means-tested public-benefit program or verify eligibility for the low-income home energy assistance program or its successor program, for which eligibility does not exceed 60 percent of the median income in Massachusetts based on a household's gross income or other criteria approved by the Department..
CHARACTER OF SERVICE A continuous supply of gas of not less than 1,000 Btu per cubic foot. RATE - MONTHLY Customer Charge Per Month $ 12.20 Off-Peak All therms @ $ 0.4834 per therm Peak All therms @ $ 0.4834 per therm MINIMUM CHARGE The minimum charge per month shall be the monthly Customer Charge, less the application of
the Low Income Discount Adjustment provided under this rate schedule. REVENUE DECOUPLING ADJUSTMENT CLAUSE
The provisions of the Company’s Revenue Decoupling Adjustment Clause apply to gas sold under this rate.
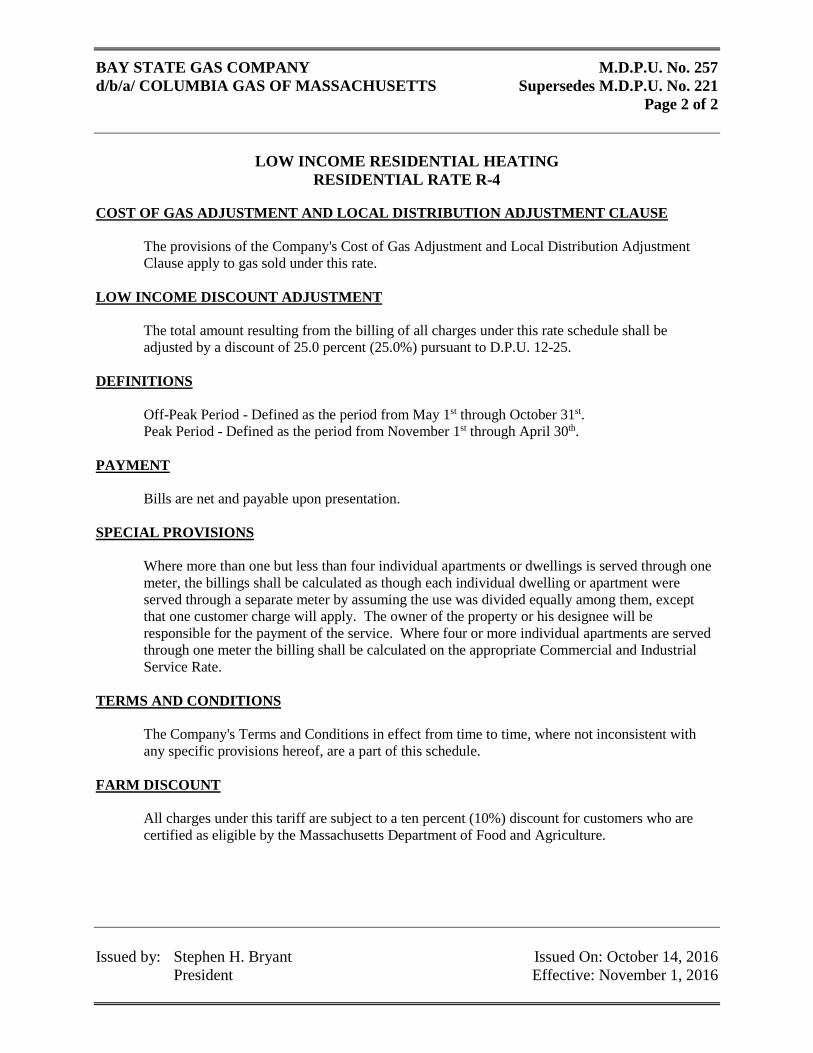
BAY STATE GAS COMPANY M.D.P.U. No. 257 d/b/a/ COLUMBIA GAS OF MASSACHUSETTS Supersedes M.D.P.U. No. 221
Page 2 of 2
LOW INCOME RESIDENTIAL HEATING
RESIDENTIAL RATE R-4
Issued by: Stephen H. Bryant Issued On: October 14, 2016 President Effective: November 1, 2016
COST OF GAS ADJUSTMENT AND LOCAL DISTRIBUTION ADJUSTMENT CLAUSE
The provisions of the Company's Cost of Gas Adjustment and Local Distribution Adjustment Clause apply to gas sold under this rate.
LOW INCOME DISCOUNT ADJUSTMENT
The total amount resulting from the billing of all charges under this rate schedule shall be adjusted by a discount of 25.0 percent (25.0%) pursuant to D.P.U. 12-25.
DEFINITIONS
Off-Peak Period - Defined as the period from May 1st through October 31st. Peak Period - Defined as the period from November 1st through April 30th.
PAYMENT Bills are net and payable upon presentation. SPECIAL PROVISIONS
Where more than one but less than four individual apartments or dwellings is served through one meter, the billings shall be calculated as though each individual dwelling or apartment were served through a separate meter by assuming the use was divided equally among them, except that one customer charge will apply. The owner of the property or his designee will be responsible for the payment of the service. Where four or more individual apartments are served through one meter the billing shall be calculated on the appropriate Commercial and Industrial Service Rate.
TERMS AND CONDITIONS
The Company's Terms and Conditions in effect from time to time, where not inconsistent with any specific provisions hereof, are a part of this schedule.
FARM DISCOUNT
All charges under this tariff are subject to a ten percent (10%) discount for customers who are certified as eligible by the Massachusetts Department of Food and Agriculture.
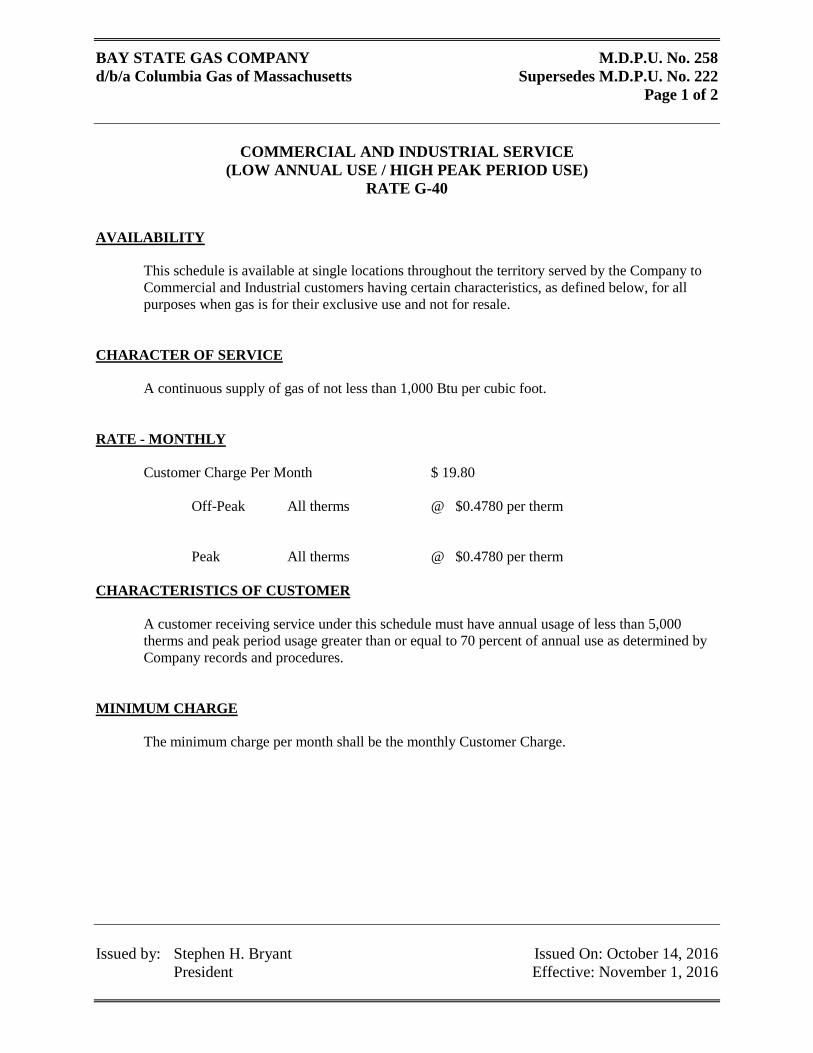
BAY STATE GAS COMPANY M.D.P.U. No. 258 d/b/a Columbia Gas of Massachusetts Supersedes M.D.P.U. No. 222
Page 1 of 2
COMMERCIAL AND INDUSTRIAL SERVICE
(LOW ANNUAL USE / HIGH PEAK PERIOD USE) RATE G-40
Issued by: Stephen H. Bryant Issued On: October 14, 2016 President Effective: November 1, 2016
AVAILABILITY
This schedule is available at single locations throughout the territory served by the Company to Commercial and Industrial customers having certain characteristics, as defined below, for all purposes when gas is for their exclusive use and not for resale.
CHARACTER OF SERVICE A continuous supply of gas of not less than 1,000 Btu per cubic foot. RATE - MONTHLY Customer Charge Per Month $ 19.80 Off-Peak All therms @ $0.4780 per therm Peak All therms @ $0.4780 per therm CHARACTERISTICS OF CUSTOMER
A customer receiving service under this schedule must have annual usage of less than 5,000 therms and peak period usage greater than or equal to 70 percent of annual use as determined by Company records and procedures.
MINIMUM CHARGE
The minimum charge per month shall be the monthly Customer Charge.
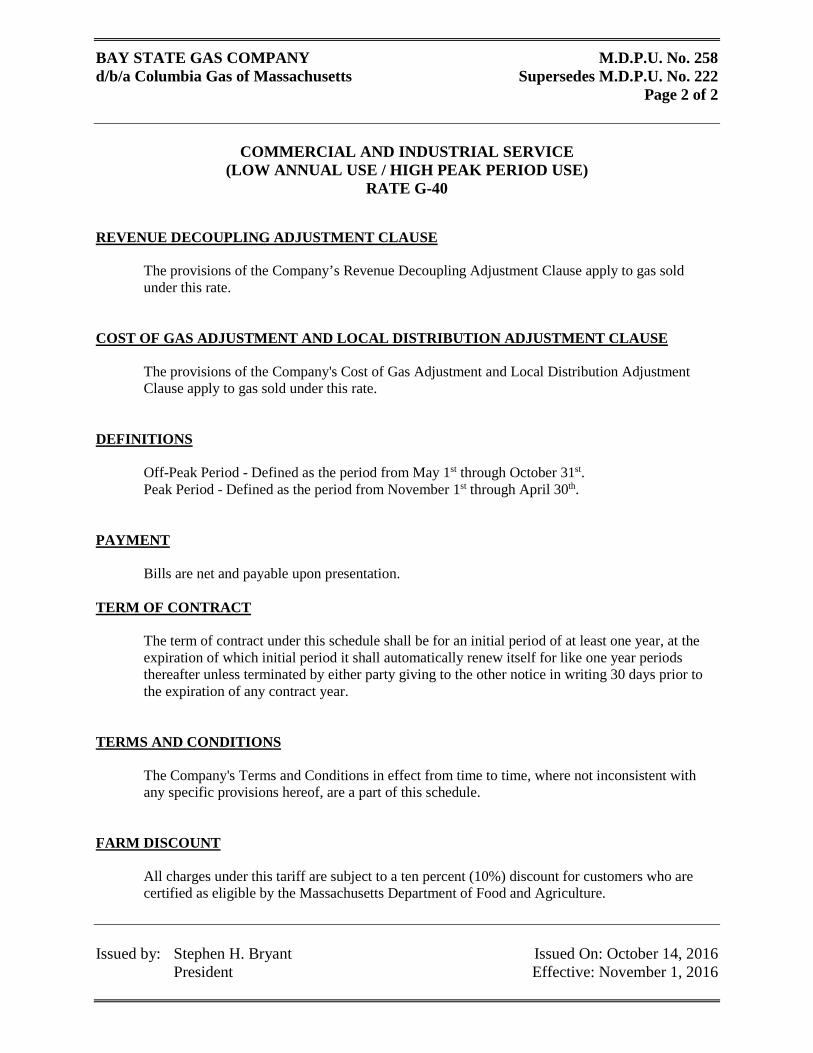
BAY STATE GAS COMPANY M.D.P.U. No. 258 d/b/a Columbia Gas of Massachusetts Supersedes M.D.P.U. No. 222
Page 2 of 2
COMMERCIAL AND INDUSTRIAL SERVICE
(LOW ANNUAL USE / HIGH PEAK PERIOD USE) RATE G-40
Issued by: Stephen H. Bryant Issued On: October 14, 2016 President Effective: November 1, 2016
REVENUE DECOUPLING ADJUSTMENT CLAUSE
The provisions of the Company’s Revenue Decoupling Adjustment Clause apply to gas sold under this rate.
COST OF GAS ADJUSTMENT AND LOCAL DISTRIBUTION ADJUSTMENT CLAUSE
The provisions of the Company's Cost of Gas Adjustment and Local Distribution Adjustment Clause apply to gas sold under this rate.
DEFINITIONS
Off-Peak Period - Defined as the period from May 1st through October 31st. Peak Period - Defined as the period from November 1st through April 30th.
PAYMENT Bills are net and payable upon presentation. TERM OF CONTRACT
The term of contract under this schedule shall be for an initial period of at least one year, at the expiration of which initial period it shall automatically renew itself for like one year periods thereafter unless terminated by either party giving to the other notice in writing 30 days prior to the expiration of any contract year.
TERMS AND CONDITIONS
The Company's Terms and Conditions in effect from time to time, where not inconsistent with any specific provisions hereof, are a part of this schedule.
FARM DISCOUNT
All charges under this tariff are subject to a ten percent (10%) discount for customers who are certified as eligible by the Massachusetts Department of Food and Agriculture.
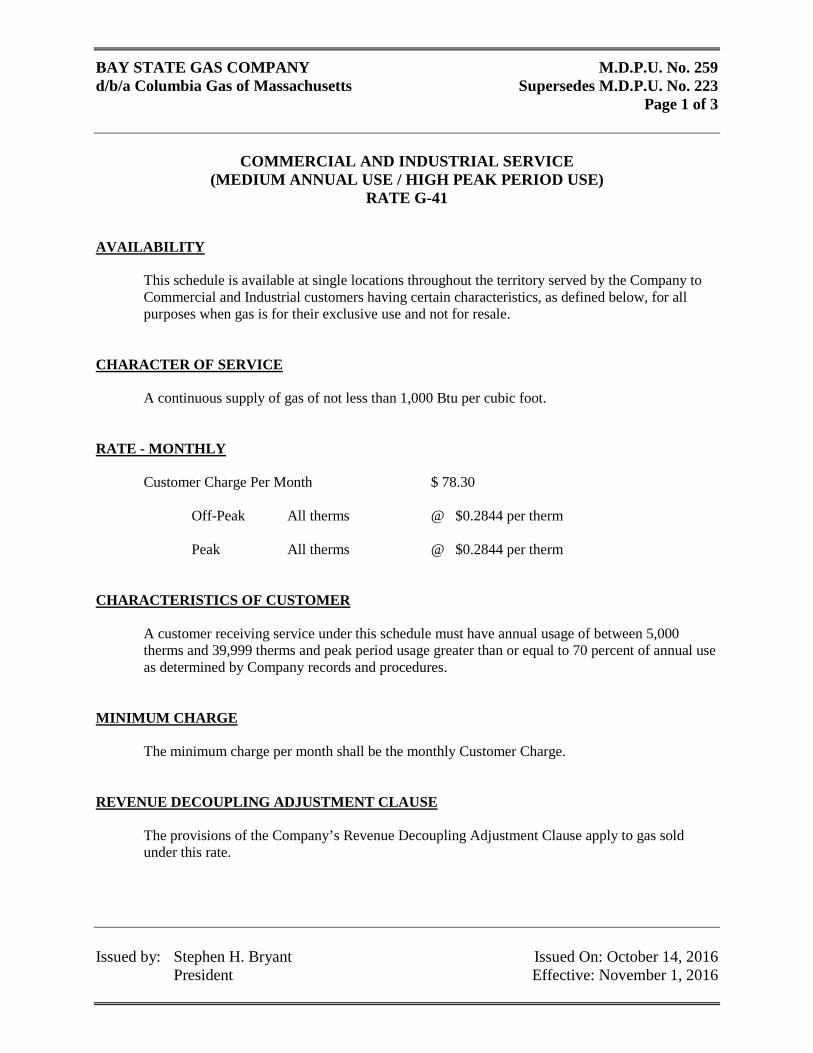
BAY STATE GAS COMPANY M.D.P.U. No. 259 d/b/a Columbia Gas of Massachusetts Supersedes M.D.P.U. No. 223
Page 1 of 3
COMMERCIAL AND INDUSTRIAL SERVICE
(MEDIUM ANNUAL USE / HIGH PEAK PERIOD USE) RATE G-41
Issued by: Stephen H. Bryant Issued On: October 14, 2016 President Effective: November 1, 2016
AVAILABILITY
This schedule is available at single locations throughout the territory served by the Company to Commercial and Industrial customers having certain characteristics, as defined below, for all purposes when gas is for their exclusive use and not for resale.
CHARACTER OF SERVICE A continuous supply of gas of not less than 1,000 Btu per cubic foot. RATE - MONTHLY Customer Charge Per Month $ 78.30 Off-Peak All therms @ $0.2844 per therm Peak All therms @ $0.2844 per therm CHARACTERISTICS OF CUSTOMER
A customer receiving service under this schedule must have annual usage of between 5,000 therms and 39,999 therms and peak period usage greater than or equal to 70 percent of annual use as determined by Company records and procedures.
MINIMUM CHARGE
The minimum charge per month shall be the monthly Customer Charge. REVENUE DECOUPLING ADJUSTMENT CLAUSE
The provisions of the Company’s Revenue Decoupling Adjustment Clause apply to gas sold under this rate.
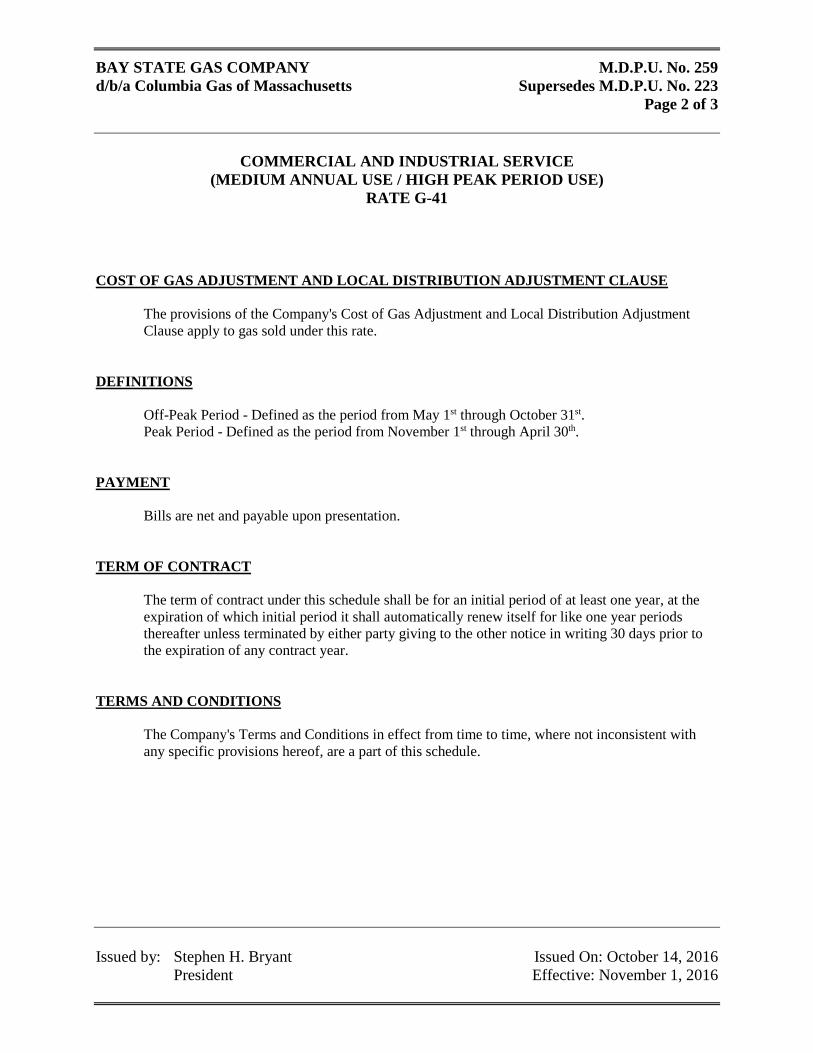
BAY STATE GAS COMPANY M.D.P.U. No. 259 d/b/a Columbia Gas of Massachusetts Supersedes M.D.P.U. No. 223
Page 2 of 3
COMMERCIAL AND INDUSTRIAL SERVICE
(MEDIUM ANNUAL USE / HIGH PEAK PERIOD USE) RATE G-41
Issued by: Stephen H. Bryant Issued On: October 14, 2016 President Effective: November 1, 2016
COST OF GAS ADJUSTMENT AND LOCAL DISTRIBUTION ADJUSTMENT CLAUSE
The provisions of the Company's Cost of Gas Adjustment and Local Distribution Adjustment Clause apply to gas sold under this rate.
DEFINITIONS Off-Peak Period - Defined as the period from May 1st through October 31st. Peak Period - Defined as the period from November 1st through April 30th. PAYMENT Bills are net and payable upon presentation. TERM OF CONTRACT
The term of contract under this schedule shall be for an initial period of at least one year, at the expiration of which initial period it shall automatically renew itself for like one year periods thereafter unless terminated by either party giving to the other notice in writing 30 days prior to the expiration of any contract year.
TERMS AND CONDITIONS
The Company's Terms and Conditions in effect from time to time, where not inconsistent with any specific provisions hereof, are a part of this schedule.
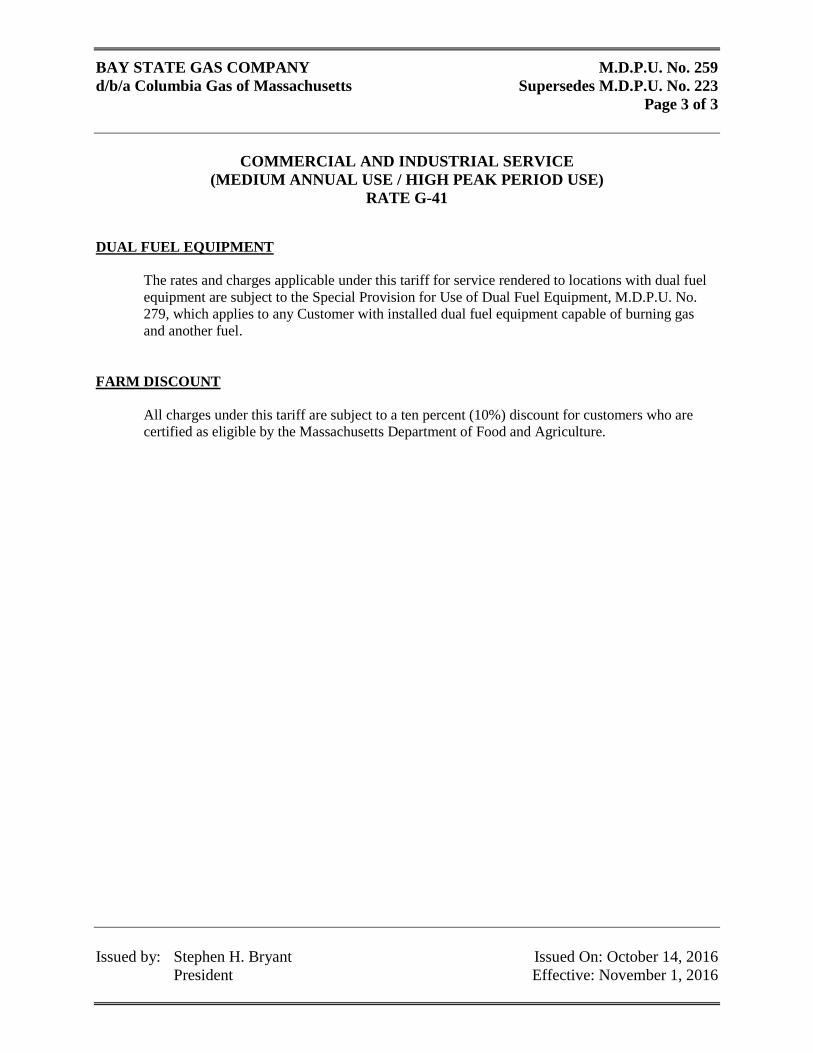
BAY STATE GAS COMPANY M.D.P.U. No. 259 d/b/a Columbia Gas of Massachusetts Supersedes M.D.P.U. No. 223
Page 3 of 3
COMMERCIAL AND INDUSTRIAL SERVICE
(MEDIUM ANNUAL USE / HIGH PEAK PERIOD USE) RATE G-41
Issued by: Stephen H. Bryant Issued On: October 14, 2016 President Effective: November 1, 2016
DUAL FUEL EQUIPMENT
The rates and charges applicable under this tariff for service rendered to locations with dual fuel equipment are subject to the Special Provision for Use of Dual Fuel Equipment, M.D.P.U. No. 279, which applies to any Customer with installed dual fuel equipment capable of burning gas and another fuel.
FARM DISCOUNT
All charges under this tariff are subject to a ten percent (10%) discount for customers who are certified as eligible by the Massachusetts Department of Food and Agriculture.
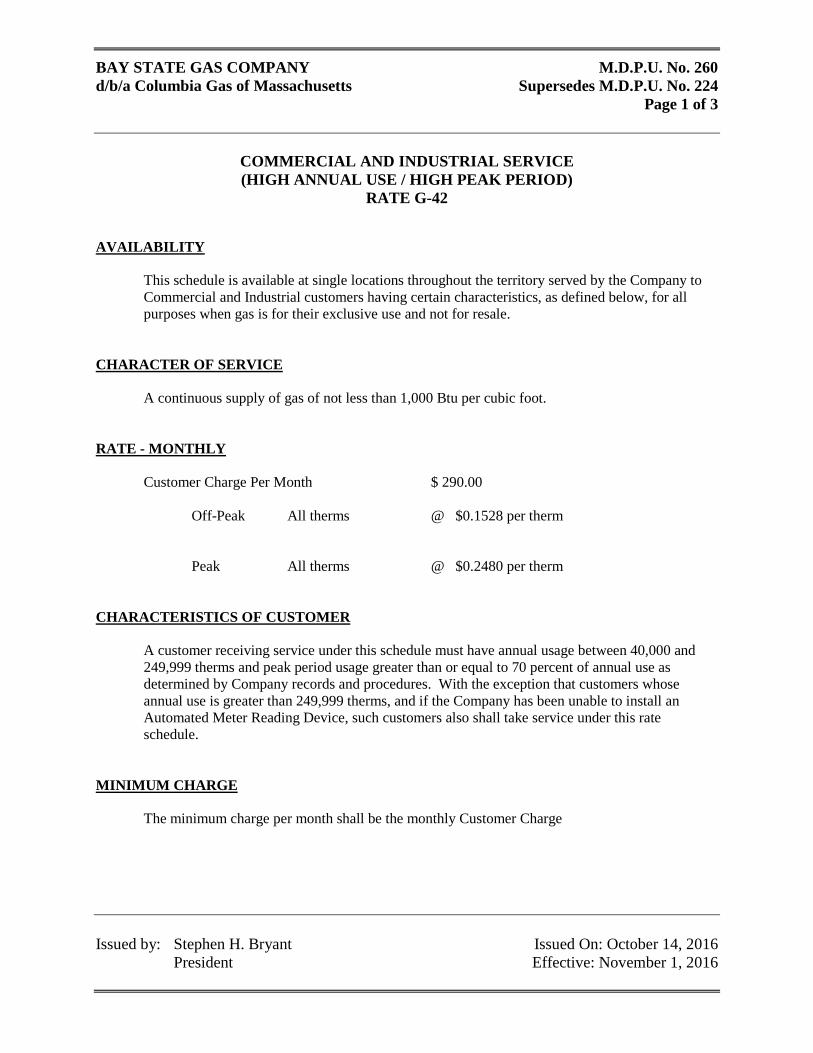
BAY STATE GAS COMPANY M.D.P.U. No. 260 d/b/a Columbia Gas of Massachusetts Supersedes M.D.P.U. No. 224
Page 1 of 3
COMMERCIAL AND INDUSTRIAL SERVICE (HIGH ANNUAL USE / HIGH PEAK PERIOD)
RATE G-42
Issued by: Stephen H. Bryant Issued On: October 14, 2016 President Effective: November 1, 2016
AVAILABILITY
This schedule is available at single locations throughout the territory served by the Company to Commercial and Industrial customers having certain characteristics, as defined below, for all purposes when gas is for their exclusive use and not for resale.
CHARACTER OF SERVICE A continuous supply of gas of not less than 1,000 Btu per cubic foot. RATE - MONTHLY Customer Charge Per Month $ 290.00 Off-Peak All therms @ $0.1528 per therm Peak All therms @ $0.2480 per therm CHARACTERISTICS OF CUSTOMER
A customer receiving service under this schedule must have annual usage between 40,000 and 249,999 therms and peak period usage greater than or equal to 70 percent of annual use as determined by Company records and procedures. With the exception that customers whose annual use is greater than 249,999 therms, and if the Company has been unable to install an Automated Meter Reading Device, such customers also shall take service under this rate schedule.
MINIMUM CHARGE
The minimum charge per month shall be the monthly Customer Charge

BAY STATE GAS COMPANY M.D.P.U. No. 260 d/b/a Columbia Gas of Massachusetts Supersedes M.D.P.U. No. 224
Page 2 of 3
COMMERCIAL AND INDUSTRIAL SERVICE (HIGH ANNUAL USE / HIGH PEAK PERIOD)
RATE G-42
Issued by: Stephen H. Bryant Issued On: October 14, 2016 President Effective: November 1, 2016
REVENUE DECOUPLING ADJUSTMENT CLAUSE
The provisions of the Company’s Revenue Decoupling Adjustment Clause apply to gas sold under this rate.
COST OF GAS ADJUSTMENT AND LOCAL DISTRIBUTION ADJUSTMENT CLAUSE
The provisions of the Company's Cost of Gas Adjustment and Local Distribution Adjustment Clause apply to gas sold under this rate.
DEFINITIONS
Off-Peak Period - Defined as the period from May 1st through October 31st. Peak Period - Defined as the period from November 1st through April 30th.
PAYMENT Bills are net and payable upon presentation. TERM OF CONTRACT
The term of contract under this schedule shall be for an initial period of at least one year, at the expiration of which initial period it shall automatically renew itself for like one year periods thereafter unless terminated by either party giving to the other notice in writing 30 days prior to the expiration of any contract year.
TERMS AND CONDITIONS
The Company's Terms and Conditions in effect from time to time, where not inconsistent with any specific provisions hereof, are a part of this schedule.
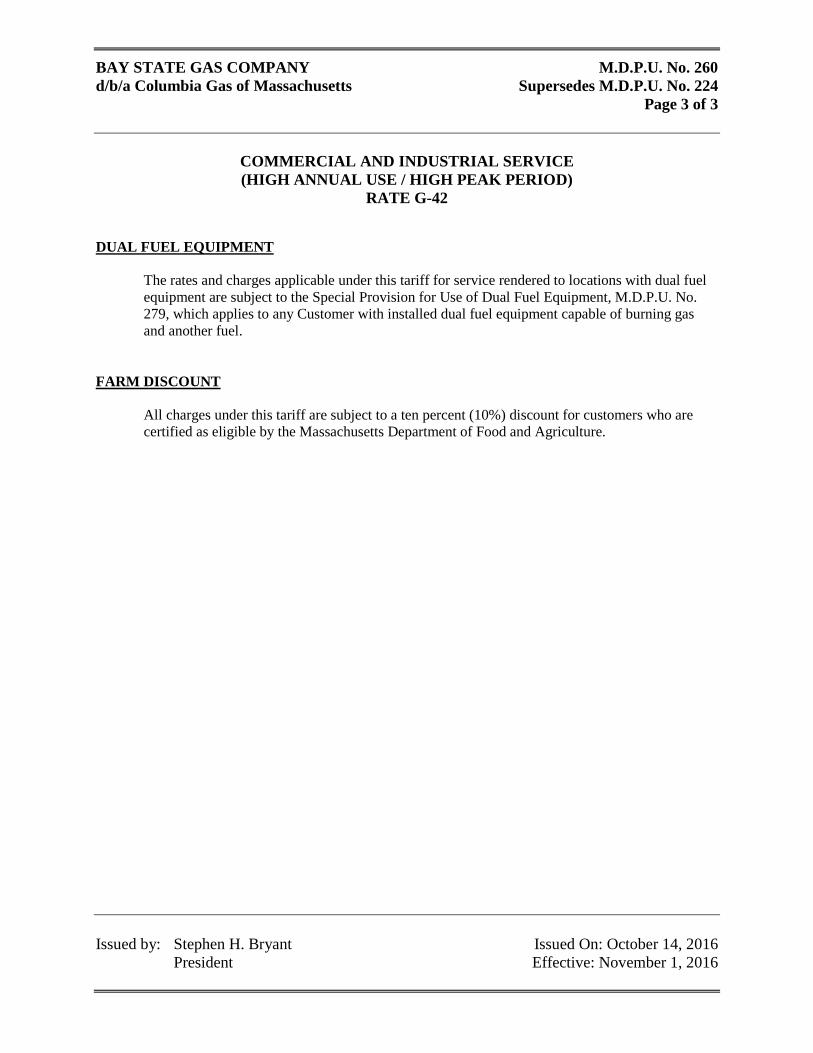
BAY STATE GAS COMPANY M.D.P.U. No. 260 d/b/a Columbia Gas of Massachusetts Supersedes M.D.P.U. No. 224
Page 3 of 3
COMMERCIAL AND INDUSTRIAL SERVICE (HIGH ANNUAL USE / HIGH PEAK PERIOD)
RATE G-42
Issued by: Stephen H. Bryant Issued On: October 14, 2016 President Effective: November 1, 2016
DUAL FUEL EQUIPMENT
The rates and charges applicable under this tariff for service rendered to locations with dual fuel equipment are subject to the Special Provision for Use of Dual Fuel Equipment, M.D.P.U. No. 279, which applies to any Customer with installed dual fuel equipment capable of burning gas and another fuel.
FARM DISCOUNT
All charges under this tariff are subject to a ten percent (10%) discount for customers who are certified as eligible by the Massachusetts Department of Food and Agriculture.
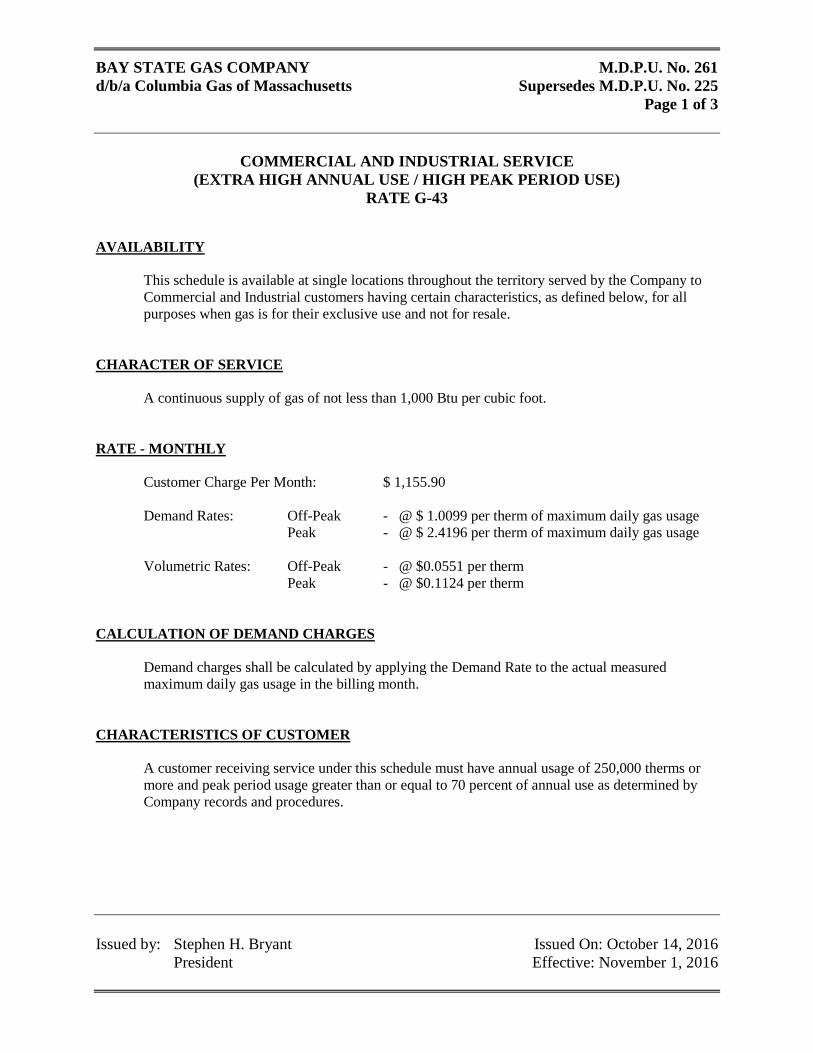
BAY STATE GAS COMPANY M.D.P.U. No. 261 d/b/a Columbia Gas of Massachusetts Supersedes M.D.P.U. No. 225
Page 1 of 3
COMMERCIAL AND INDUSTRIAL SERVICE
(EXTRA HIGH ANNUAL USE / HIGH PEAK PERIOD USE) RATE G-43
Issued by: Stephen H. Bryant Issued On: October 14, 2016 President Effective: November 1, 2016
AVAILABILITY
This schedule is available at single locations throughout the territory served by the Company to Commercial and Industrial customers having certain characteristics, as defined below, for all purposes when gas is for their exclusive use and not for resale.
CHARACTER OF SERVICE A continuous supply of gas of not less than 1,000 Btu per cubic foot. RATE - MONTHLY Customer Charge Per Month: $ 1,155.90 Demand Rates: Off-Peak - @ $ 1.0099 per therm of maximum daily gas usage Peak - @ $ 2.4196 per therm of maximum daily gas usage Volumetric Rates: Off-Peak - @ $0.0551 per therm Peak - @ $0.1124 per therm CALCULATION OF DEMAND CHARGES
Demand charges shall be calculated by applying the Demand Rate to the actual measured maximum daily gas usage in the billing month.
CHARACTERISTICS OF CUSTOMER
A customer receiving service under this schedule must have annual usage of 250,000 therms or more and peak period usage greater than or equal to 70 percent of annual use as determined by Company records and procedures.
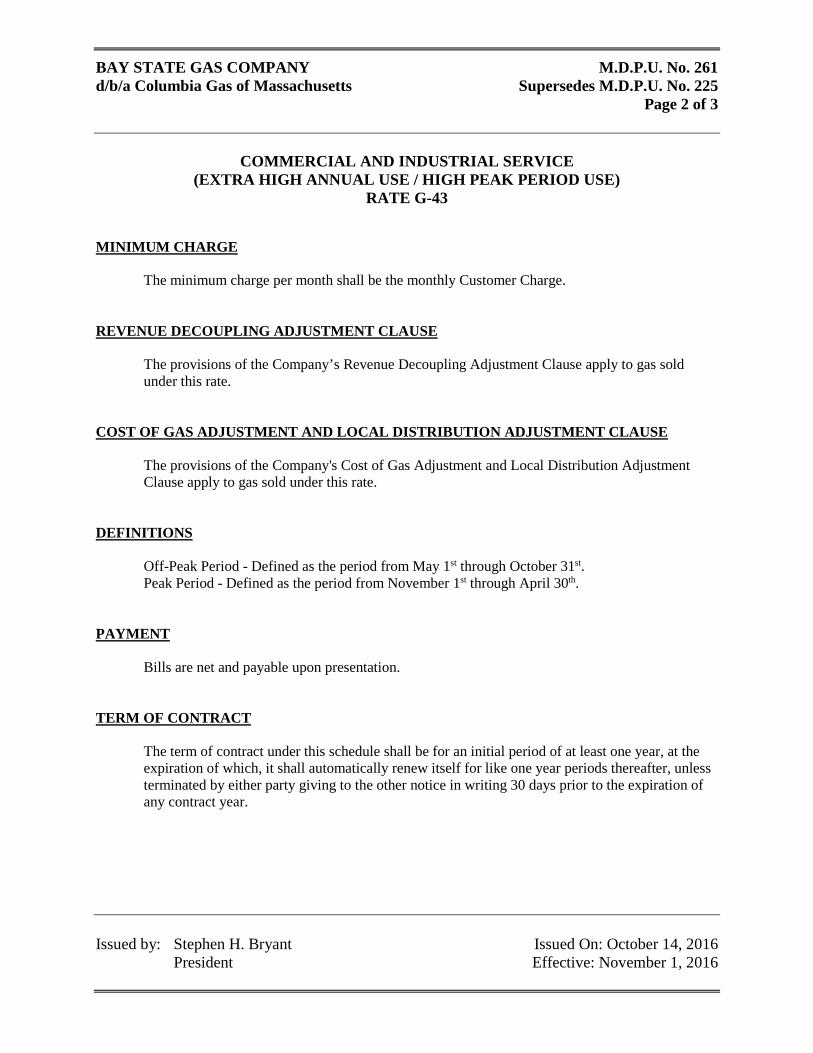
BAY STATE GAS COMPANY M.D.P.U. No. 261 d/b/a Columbia Gas of Massachusetts Supersedes M.D.P.U. No. 225
Page 2 of 3
COMMERCIAL AND INDUSTRIAL SERVICE
(EXTRA HIGH ANNUAL USE / HIGH PEAK PERIOD USE) RATE G-43
Issued by: Stephen H. Bryant Issued On: October 14, 2016 President Effective: November 1, 2016
MINIMUM CHARGE
The minimum charge per month shall be the monthly Customer Charge.
REVENUE DECOUPLING ADJUSTMENT CLAUSE
The provisions of the Company’s Revenue Decoupling Adjustment Clause apply to gas sold under this rate.
COST OF GAS ADJUSTMENT AND LOCAL DISTRIBUTION ADJUSTMENT CLAUSE
The provisions of the Company's Cost of Gas Adjustment and Local Distribution Adjustment Clause apply to gas sold under this rate.
DEFINITIONS
Off-Peak Period - Defined as the period from May 1st through October 31st. Peak Period - Defined as the period from November 1st through April 30th.
PAYMENT Bills are net and payable upon presentation. TERM OF CONTRACT
The term of contract under this schedule shall be for an initial period of at least one year, at the expiration of which, it shall automatically renew itself for like one year periods thereafter, unless terminated by either party giving to the other notice in writing 30 days prior to the expiration of any contract year.
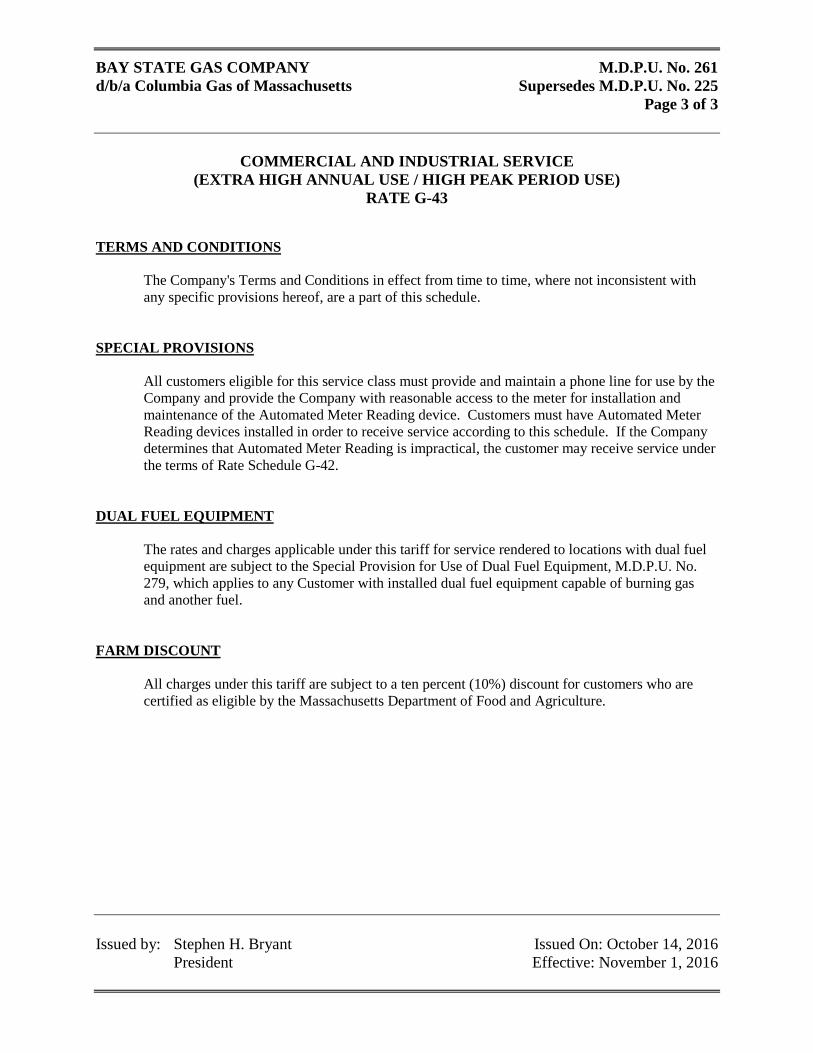
BAY STATE GAS COMPANY M.D.P.U. No. 261 d/b/a Columbia Gas of Massachusetts Supersedes M.D.P.U. No. 225
Page 3 of 3
COMMERCIAL AND INDUSTRIAL SERVICE
(EXTRA HIGH ANNUAL USE / HIGH PEAK PERIOD USE) RATE G-43
Issued by: Stephen H. Bryant Issued On: October 14, 2016 President Effective: November 1, 2016
TERMS AND CONDITIONS
The Company's Terms and Conditions in effect from time to time, where not inconsistent with any specific provisions hereof, are a part of this schedule.
SPECIAL PROVISIONS All customers eligible for this service class must provide and maintain a phone line for use by the Company and provide the Company with reasonable access to the meter for installation and maintenance of the Automated Meter Reading device. Customers must have Automated Meter Reading devices installed in order to receive service according to this schedule. If the Company determines that Automated Meter Reading is impractical, the customer may receive service under the terms of Rate Schedule G-42.
DUAL FUEL EQUIPMENT
The rates and charges applicable under this tariff for service rendered to locations with dual fuel equipment are subject to the Special Provision for Use of Dual Fuel Equipment, M.D.P.U. No. 279, which applies to any Customer with installed dual fuel equipment capable of burning gas and another fuel.
FARM DISCOUNT
All charges under this tariff are subject to a ten percent (10%) discount for customers who are certified as eligible by the Massachusetts Department of Food and Agriculture.
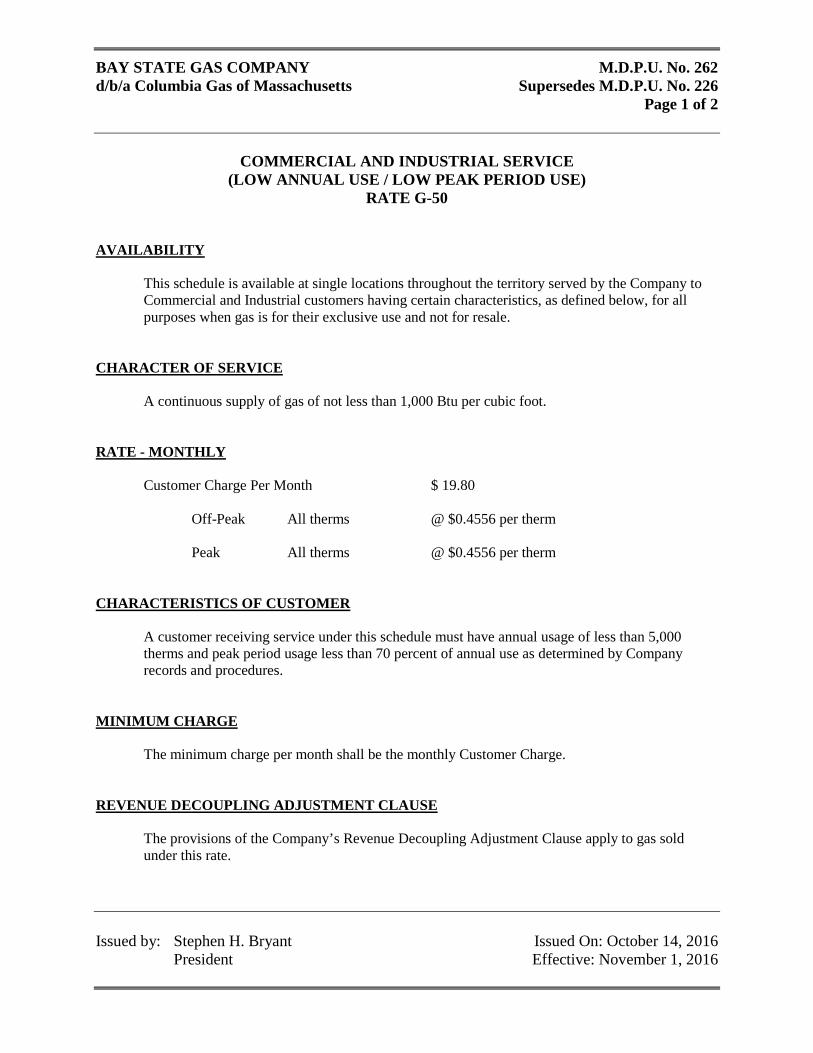
BAY STATE GAS COMPANY M.D.P.U. No. 262 d/b/a Columbia Gas of Massachusetts Supersedes M.D.P.U. No. 226
Page 1 of 2
COMMERCIAL AND INDUSTRIAL SERVICE
(LOW ANNUAL USE / LOW PEAK PERIOD USE) RATE G-50
Issued by: Stephen H. Bryant Issued On: October 14, 2016 President Effective: November 1, 2016
AVAILABILITY
This schedule is available at single locations throughout the territory served by the Company to Commercial and Industrial customers having certain characteristics, as defined below, for all purposes when gas is for their exclusive use and not for resale.
CHARACTER OF SERVICE
A continuous supply of gas of not less than 1,000 Btu per cubic foot. RATE - MONTHLY Customer Charge Per Month $ 19.80 Off-Peak All therms @ $0.4556 per therm Peak All therms @ $0.4556 per therm CHARACTERISTICS OF CUSTOMER
A customer receiving service under this schedule must have annual usage of less than 5,000 therms and peak period usage less than 70 percent of annual use as determined by Company records and procedures.
MINIMUM CHARGE
The minimum charge per month shall be the monthly Customer Charge. REVENUE DECOUPLING ADJUSTMENT CLAUSE
The provisions of the Company’s Revenue Decoupling Adjustment Clause apply to gas sold under this rate.
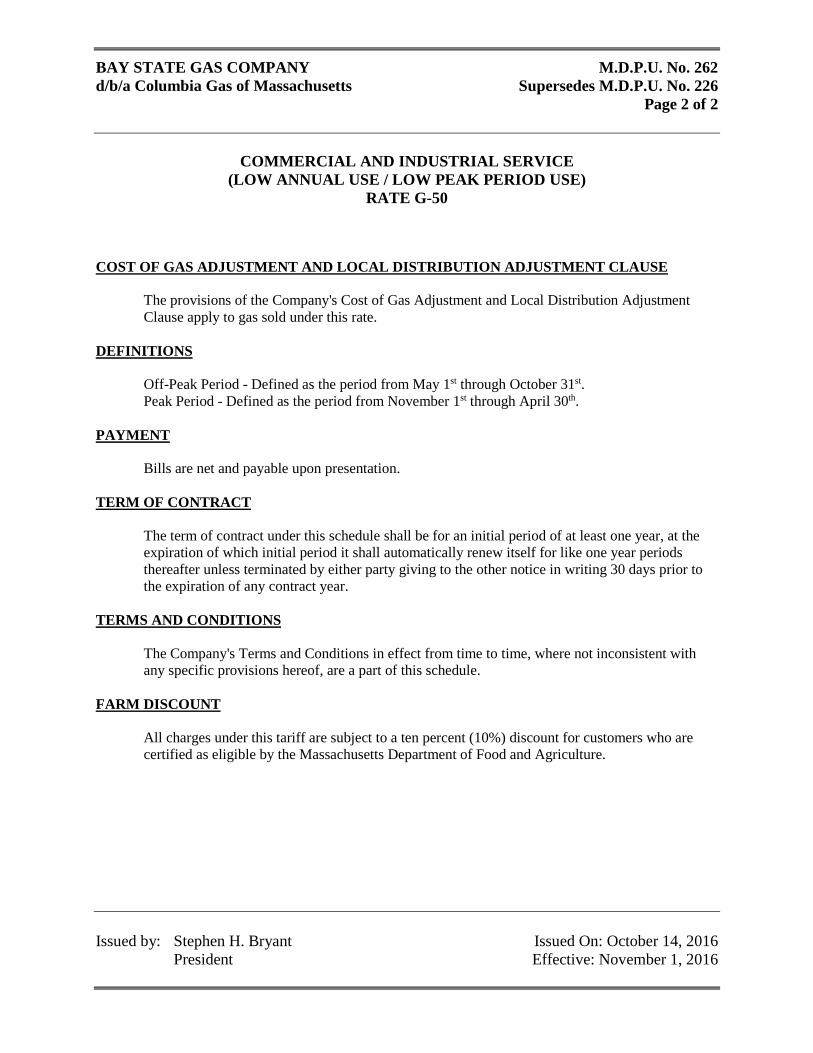
BAY STATE GAS COMPANY M.D.P.U. No. 262 d/b/a Columbia Gas of Massachusetts Supersedes M.D.P.U. No. 226
Page 2 of 2
COMMERCIAL AND INDUSTRIAL SERVICE
(LOW ANNUAL USE / LOW PEAK PERIOD USE) RATE G-50
Issued by: Stephen H. Bryant Issued On: October 14, 2016 President Effective: November 1, 2016
COST OF GAS ADJUSTMENT AND LOCAL DISTRIBUTION ADJUSTMENT CLAUSE
The provisions of the Company's Cost of Gas Adjustment and Local Distribution Adjustment Clause apply to gas sold under this rate.
DEFINITIONS
Off-Peak Period - Defined as the period from May 1st through October 31st. Peak Period - Defined as the period from November 1st through April 30th.
PAYMENT Bills are net and payable upon presentation. TERM OF CONTRACT
The term of contract under this schedule shall be for an initial period of at least one year, at the expiration of which initial period it shall automatically renew itself for like one year periods thereafter unless terminated by either party giving to the other notice in writing 30 days prior to the expiration of any contract year.
TERMS AND CONDITIONS
The Company's Terms and Conditions in effect from time to time, where not inconsistent with any specific provisions hereof, are a part of this schedule.
FARM DISCOUNT
All charges under this tariff are subject to a ten percent (10%) discount for customers who are certified as eligible by the Massachusetts Department of Food and Agriculture.
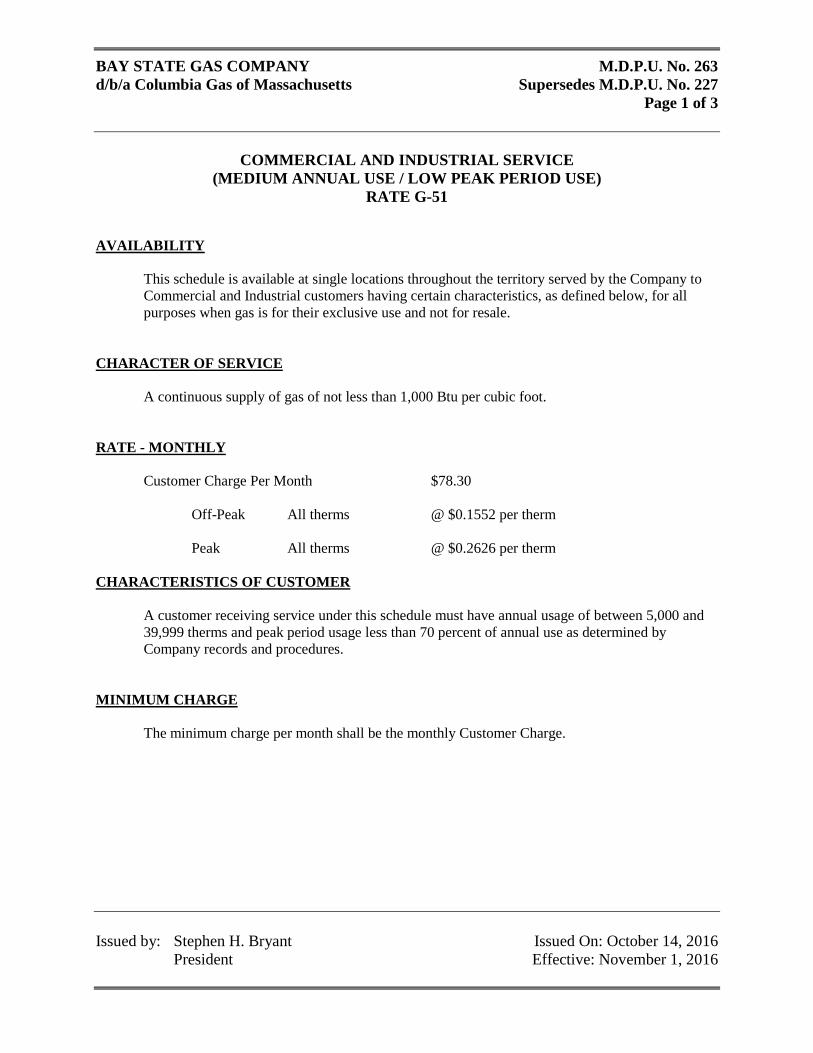
BAY STATE GAS COMPANY M.D.P.U. No. 263 d/b/a Columbia Gas of Massachusetts Supersedes M.D.P.U. No. 227
Page 1 of 3
COMMERCIAL AND INDUSTRIAL SERVICE
(MEDIUM ANNUAL USE / LOW PEAK PERIOD USE) RATE G-51
Issued by: Stephen H. Bryant Issued On: October 14, 2016 President Effective: November 1, 2016
AVAILABILITY
This schedule is available at single locations throughout the territory served by the Company to Commercial and Industrial customers having certain characteristics, as defined below, for all purposes when gas is for their exclusive use and not for resale.
CHARACTER OF SERVICE A continuous supply of gas of not less than 1,000 Btu per cubic foot. RATE - MONTHLY Customer Charge Per Month $78.30 Off-Peak All therms @ $0.1552 per therm Peak All therms @ $0.2626 per therm CHARACTERISTICS OF CUSTOMER
A customer receiving service under this schedule must have annual usage of between 5,000 and 39,999 therms and peak period usage less than 70 percent of annual use as determined by Company records and procedures.
MINIMUM CHARGE
The minimum charge per month shall be the monthly Customer Charge.
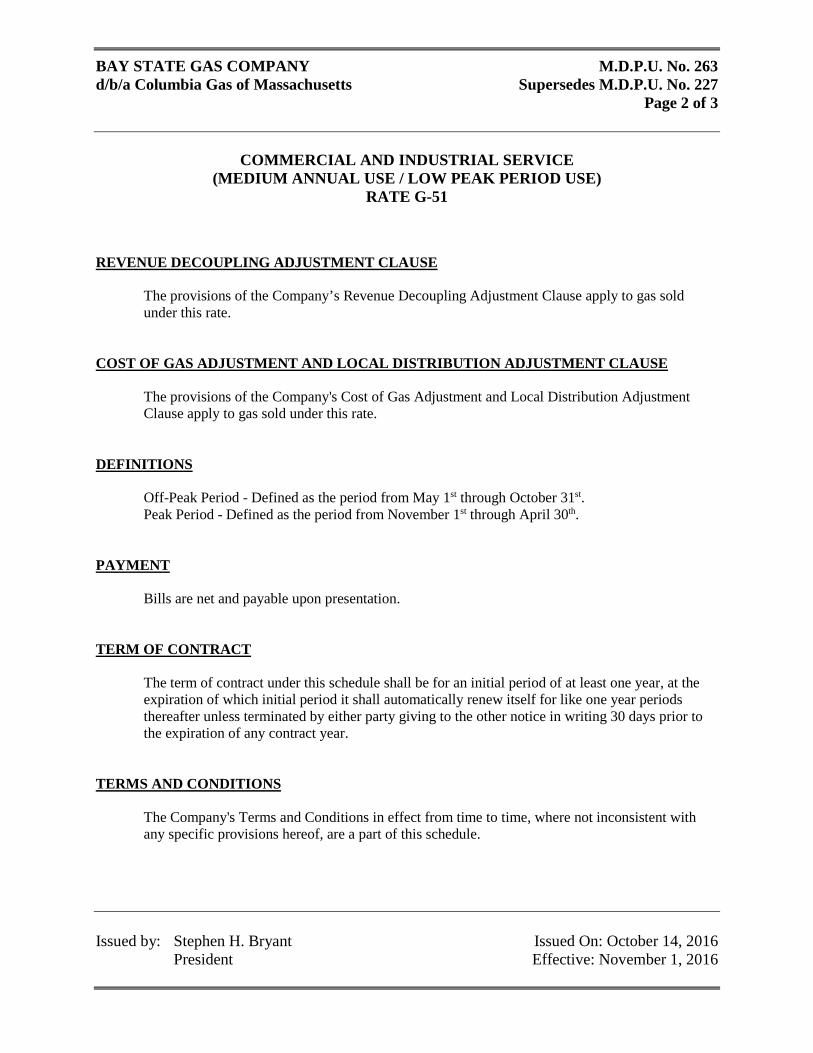
BAY STATE GAS COMPANY M.D.P.U. No. 263 d/b/a Columbia Gas of Massachusetts Supersedes M.D.P.U. No. 227
Page 2 of 3
COMMERCIAL AND INDUSTRIAL SERVICE
(MEDIUM ANNUAL USE / LOW PEAK PERIOD USE) RATE G-51
Issued by: Stephen H. Bryant Issued On: October 14, 2016 President Effective: November 1, 2016
REVENUE DECOUPLING ADJUSTMENT CLAUSE
The provisions of the Company’s Revenue Decoupling Adjustment Clause apply to gas sold under this rate.
COST OF GAS ADJUSTMENT AND LOCAL DISTRIBUTION ADJUSTMENT CLAUSE
The provisions of the Company's Cost of Gas Adjustment and Local Distribution Adjustment Clause apply to gas sold under this rate.
DEFINITIONS
Off-Peak Period - Defined as the period from May 1st through October 31st. Peak Period - Defined as the period from November 1st through April 30th.
PAYMENT Bills are net and payable upon presentation. TERM OF CONTRACT
The term of contract under this schedule shall be for an initial period of at least one year, at the expiration of which initial period it shall automatically renew itself for like one year periods thereafter unless terminated by either party giving to the other notice in writing 30 days prior to the expiration of any contract year.
TERMS AND CONDITIONS
The Company's Terms and Conditions in effect from time to time, where not inconsistent with any specific provisions hereof, are a part of this schedule.
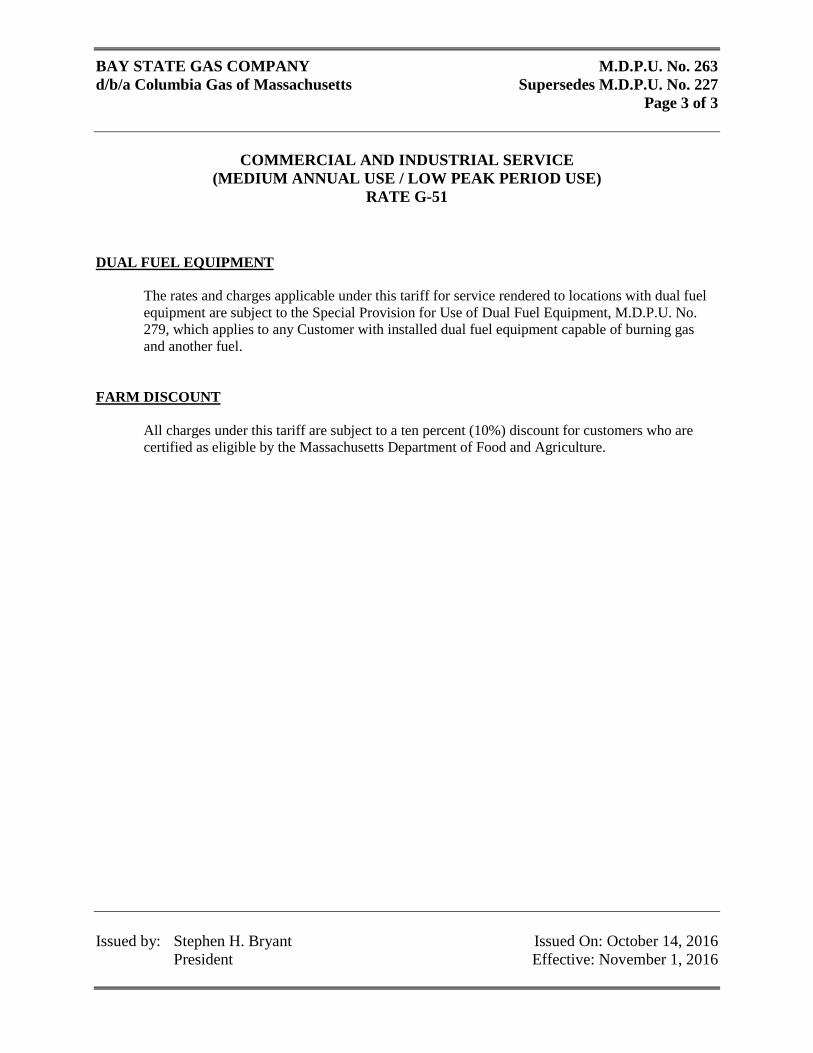
BAY STATE GAS COMPANY M.D.P.U. No. 263 d/b/a Columbia Gas of Massachusetts Supersedes M.D.P.U. No. 227
Page 3 of 3
COMMERCIAL AND INDUSTRIAL SERVICE
(MEDIUM ANNUAL USE / LOW PEAK PERIOD USE) RATE G-51
Issued by: Stephen H. Bryant Issued On: October 14, 2016 President Effective: November 1, 2016
DUAL FUEL EQUIPMENT
The rates and charges applicable under this tariff for service rendered to locations with dual fuel equipment are subject to the Special Provision for Use of Dual Fuel Equipment, M.D.P.U. No. 279, which applies to any Customer with installed dual fuel equipment capable of burning gas and another fuel.
FARM DISCOUNT
All charges under this tariff are subject to a ten percent (10%) discount for customers who are certified as eligible by the Massachusetts Department of Food and Agriculture.
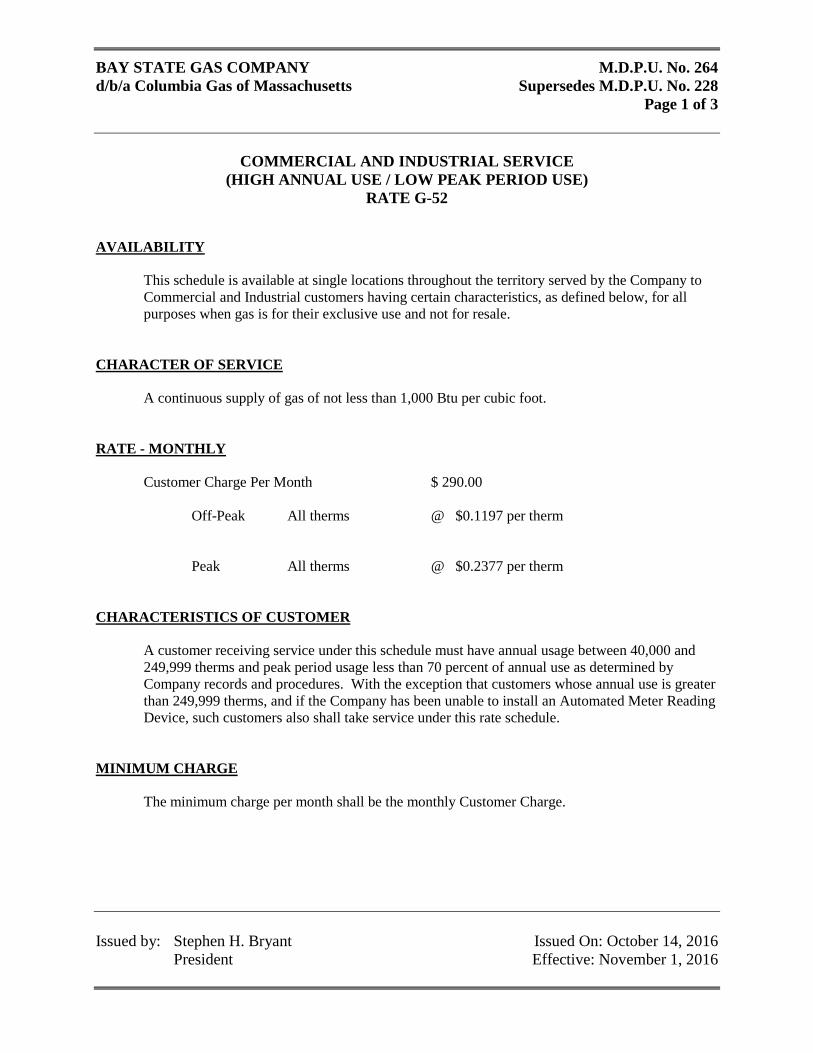
BAY STATE GAS COMPANY M.D.P.U. No. 264 d/b/a Columbia Gas of Massachusetts Supersedes M.D.P.U. No. 228
Page 1 of 3
COMMERCIAL AND INDUSTRIAL SERVICE
(HIGH ANNUAL USE / LOW PEAK PERIOD USE) RATE G-52
Issued by: Stephen H. Bryant Issued On: October 14, 2016 President Effective: November 1, 2016
AVAILABILITY
This schedule is available at single locations throughout the territory served by the Company to Commercial and Industrial customers having certain characteristics, as defined below, for all purposes when gas is for their exclusive use and not for resale.
CHARACTER OF SERVICE A continuous supply of gas of not less than 1,000 Btu per cubic foot. RATE - MONTHLY Customer Charge Per Month $ 290.00 Off-Peak All therms @ $0.1197 per therm Peak All therms @ $0.2377 per therm CHARACTERISTICS OF CUSTOMER
A customer receiving service under this schedule must have annual usage between 40,000 and 249,999 therms and peak period usage less than 70 percent of annual use as determined by Company records and procedures. With the exception that customers whose annual use is greater than 249,999 therms, and if the Company has been unable to install an Automated Meter Reading Device, such customers also shall take service under this rate schedule.
MINIMUM CHARGE
The minimum charge per month shall be the monthly Customer Charge.

BAY STATE GAS COMPANY M.D.P.U. No. 264 d/b/a Columbia Gas of Massachusetts Supersedes M.D.P.U. No. 228
Page 2 of 3
COMMERCIAL AND INDUSTRIAL SERVICE
(HIGH ANNUAL USE / LOW PEAK PERIOD USE) RATE G-52
Issued by: Stephen H. Bryant Issued On: October 14, 2016 President Effective: November 1, 2016
REVENUE DECOUPLING ADJUSTMENT CLAUSE
The provisions of the Company’s Revenue Decoupling Adjustment Clause apply to gas sold under this rate.
COST OF GAS ADJUSTMENT AND LOCAL DISTRIBUTION ADJUSTMENT CLAUSE
The provisions of the Company's Cost of Gas Adjustment and Local Distribution Adjustment Clause apply to gas sold under this rate.
DEFINITIONS
Off-Peak Period - Defined as the period from May 1st through October 31st. Peak Period - Defined as the period from November 1st through April 30th.
PAYMENT Bills are net and payable upon presentation. TERM OF CONTRACT
The term of contract under this schedule shall be for an initial period of at least one year, at the expiration of which initial period it shall automatically renew itself for like one year periods thereafter unless terminated by either party giving to the other notice in writing 30 days prior to the expiration of any contract year.
TERMS AND CONDITIONS
The Company's Terms and Conditions in effect from time to time, where not inconsistent with any specific provisions hereof, are a part of this schedule.
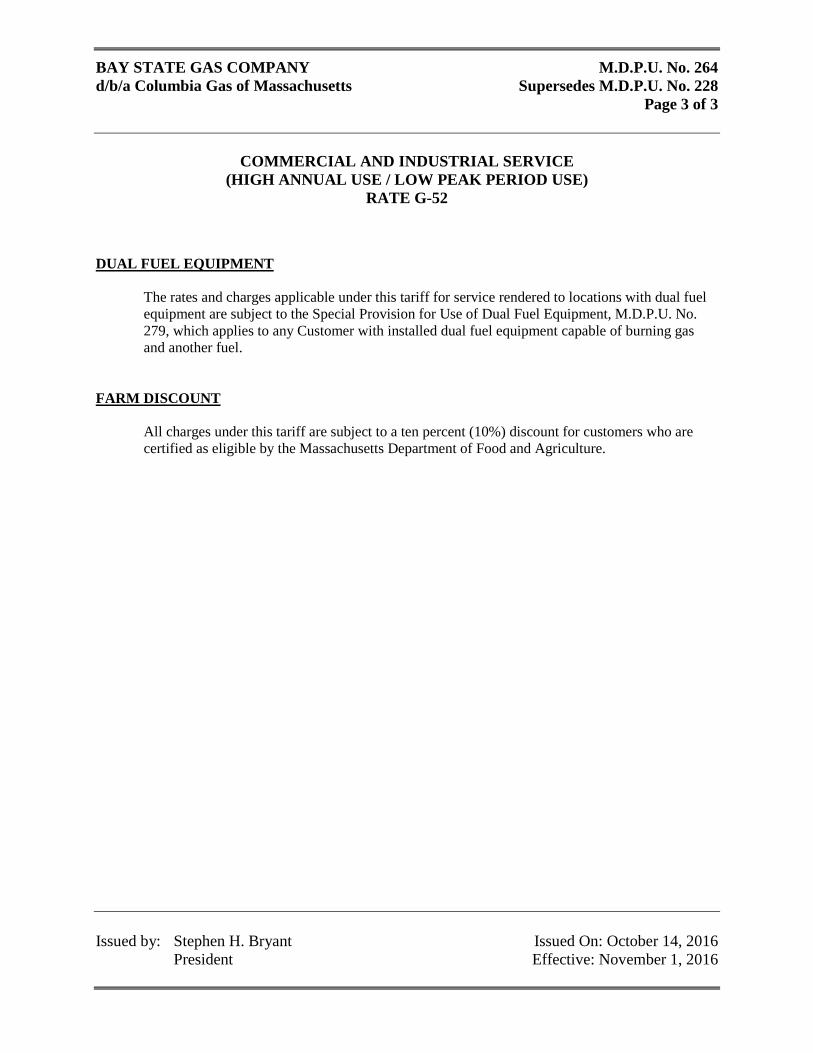
BAY STATE GAS COMPANY M.D.P.U. No. 264 d/b/a Columbia Gas of Massachusetts Supersedes M.D.P.U. No. 228
Page 3 of 3
COMMERCIAL AND INDUSTRIAL SERVICE
(HIGH ANNUAL USE / LOW PEAK PERIOD USE) RATE G-52
Issued by: Stephen H. Bryant Issued On: October 14, 2016 President Effective: November 1, 2016
DUAL FUEL EQUIPMENT
The rates and charges applicable under this tariff for service rendered to locations with dual fuel equipment are subject to the Special Provision for Use of Dual Fuel Equipment, M.D.P.U. No. 279, which applies to any Customer with installed dual fuel equipment capable of burning gas and another fuel.
FARM DISCOUNT
All charges under this tariff are subject to a ten percent (10%) discount for customers who are certified as eligible by the Massachusetts Department of Food and Agriculture.
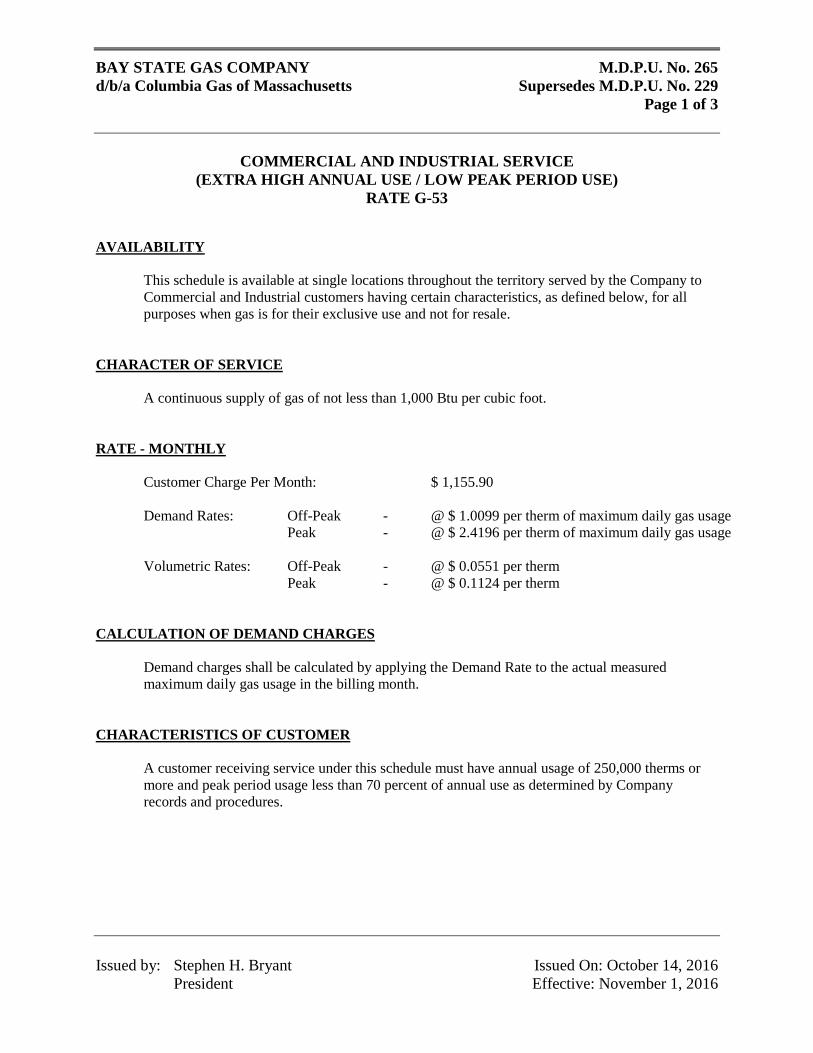
BAY STATE GAS COMPANY M.D.P.U. No. 265 d/b/a Columbia Gas of Massachusetts Supersedes M.D.P.U. No. 229
Page 1 of 3
COMMERCIAL AND INDUSTRIAL SERVICE
(EXTRA HIGH ANNUAL USE / LOW PEAK PERIOD USE) RATE G-53
Issued by: Stephen H. Bryant Issued On: October 14, 2016 President Effective: November 1, 2016
AVAILABILITY
This schedule is available at single locations throughout the territory served by the Company to Commercial and Industrial customers having certain characteristics, as defined below, for all purposes when gas is for their exclusive use and not for resale.
CHARACTER OF SERVICE A continuous supply of gas of not less than 1,000 Btu per cubic foot. RATE - MONTHLY Customer Charge Per Month: $ 1,155.90 Demand Rates: Off-Peak - @ $ 1.0099 per therm of maximum daily gas usage Peak - @ $ 2.4196 per therm of maximum daily gas usage Volumetric Rates: Off-Peak - @ $ 0.0551 per therm Peak - @ $ 0.1124 per therm CALCULATION OF DEMAND CHARGES
Demand charges shall be calculated by applying the Demand Rate to the actual measured maximum daily gas usage in the billing month.
CHARACTERISTICS OF CUSTOMER
A customer receiving service under this schedule must have annual usage of 250,000 therms or more and peak period usage less than 70 percent of annual use as determined by Company records and procedures.
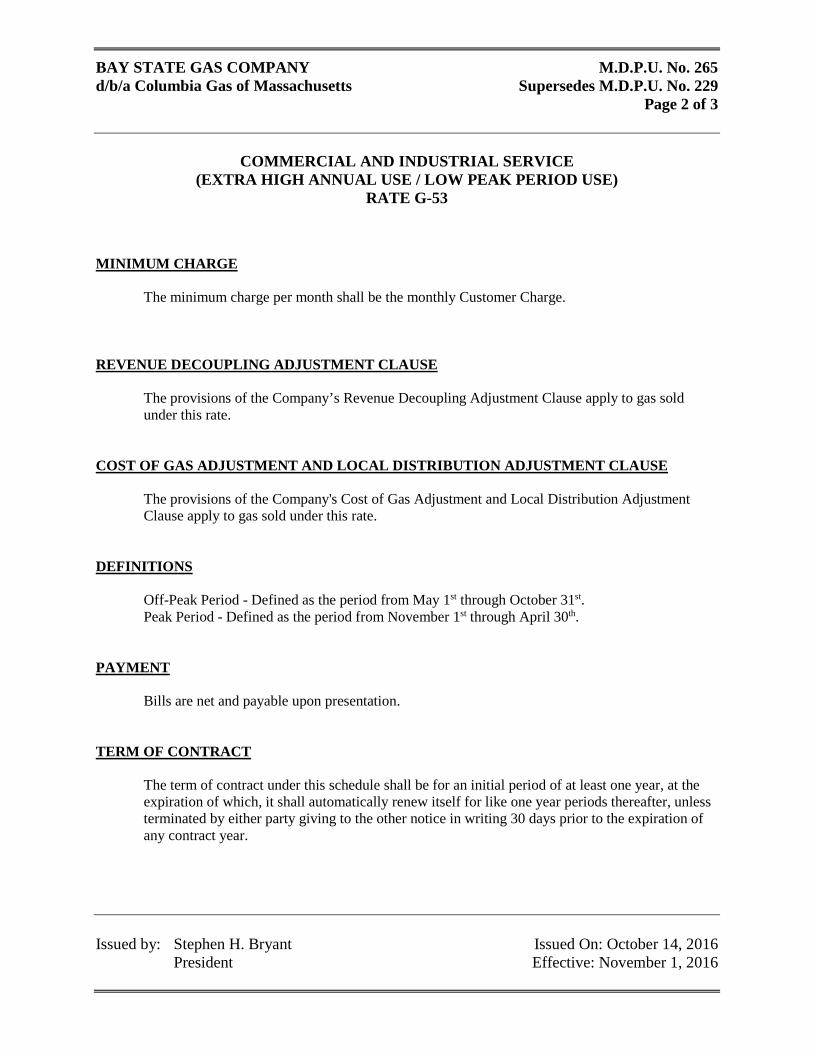
BAY STATE GAS COMPANY M.D.P.U. No. 265 d/b/a Columbia Gas of Massachusetts Supersedes M.D.P.U. No. 229
Page 2 of 3
COMMERCIAL AND INDUSTRIAL SERVICE
(EXTRA HIGH ANNUAL USE / LOW PEAK PERIOD USE) RATE G-53
Issued by: Stephen H. Bryant Issued On: October 14, 2016 President Effective: November 1, 2016
MINIMUM CHARGE
The minimum charge per month shall be the monthly Customer Charge. REVENUE DECOUPLING ADJUSTMENT CLAUSE
The provisions of the Company’s Revenue Decoupling Adjustment Clause apply to gas sold under this rate.
COST OF GAS ADJUSTMENT AND LOCAL DISTRIBUTION ADJUSTMENT CLAUSE
The provisions of the Company's Cost of Gas Adjustment and Local Distribution Adjustment Clause apply to gas sold under this rate.
DEFINITIONS
Off-Peak Period - Defined as the period from May 1st through October 31st. Peak Period - Defined as the period from November 1st through April 30th.
PAYMENT Bills are net and payable upon presentation. TERM OF CONTRACT
The term of contract under this schedule shall be for an initial period of at least one year, at the expiration of which, it shall automatically renew itself for like one year periods thereafter, unless terminated by either party giving to the other notice in writing 30 days prior to the expiration of any contract year.
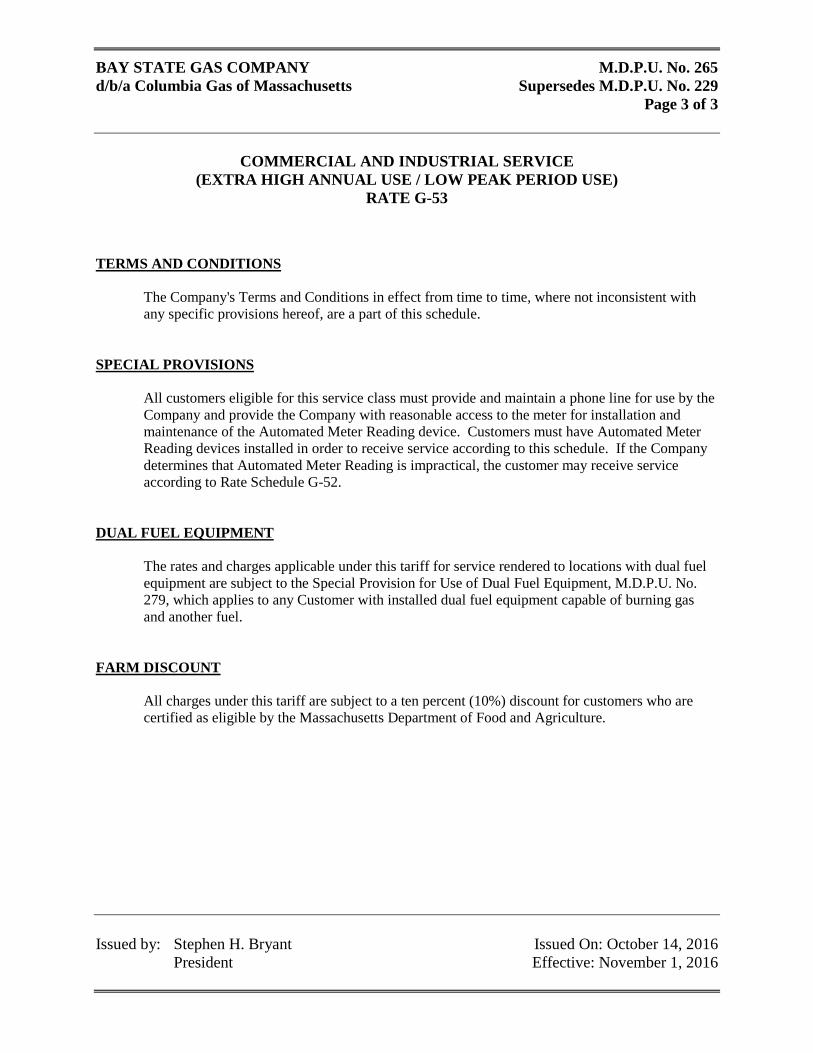
BAY STATE GAS COMPANY M.D.P.U. No. 265 d/b/a Columbia Gas of Massachusetts Supersedes M.D.P.U. No. 229
Page 3 of 3
COMMERCIAL AND INDUSTRIAL SERVICE
(EXTRA HIGH ANNUAL USE / LOW PEAK PERIOD USE) RATE G-53
Issued by: Stephen H. Bryant Issued On: October 14, 2016 President Effective: November 1, 2016
TERMS AND CONDITIONS
The Company's Terms and Conditions in effect from time to time, where not inconsistent with any specific provisions hereof, are a part of this schedule.
SPECIAL PROVISIONS All customers eligible for this service class must provide and maintain a phone line for use by the Company and provide the Company with reasonable access to the meter for installation and maintenance of the Automated Meter Reading device. Customers must have Automated Meter Reading devices installed in order to receive service according to this schedule. If the Company determines that Automated Meter Reading is impractical, the customer may receive service according to Rate Schedule G-52.
DUAL FUEL EQUIPMENT
The rates and charges applicable under this tariff for service rendered to locations with dual fuel equipment are subject to the Special Provision for Use of Dual Fuel Equipment, M.D.P.U. No. 279, which applies to any Customer with installed dual fuel equipment capable of burning gas and another fuel.
FARM DISCOUNT
All charges under this tariff are subject to a ten percent (10%) discount for customers who are certified as eligible by the Massachusetts Department of Food and Agriculture.
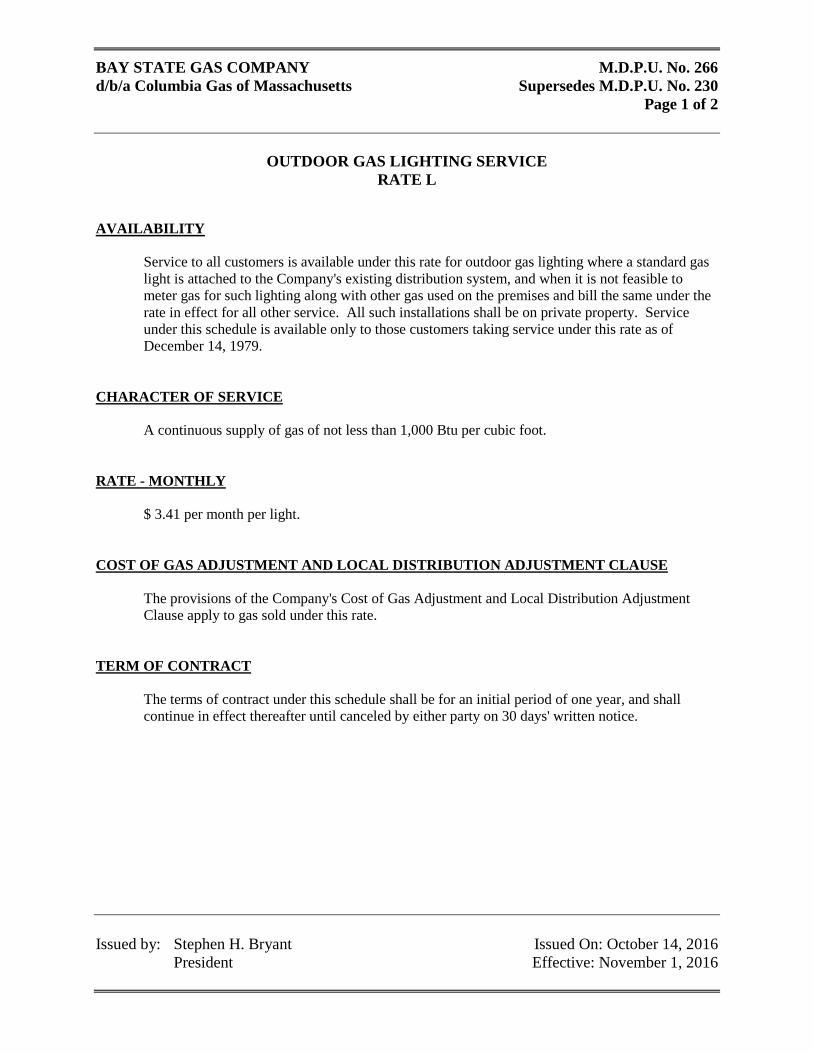
BAY STATE GAS COMPANY M.D.P.U. No. 266 d/b/a Columbia Gas of Massachusetts Supersedes M.D.P.U. No. 230
Page 1 of 2
OUTDOOR GAS LIGHTING SERVICE
RATE L
Issued by: Stephen H. Bryant Issued On: October 14, 2016 President Effective: November 1, 2016
AVAILABILITY
Service to all customers is available under this rate for outdoor gas lighting where a standard gas light is attached to the Company's existing distribution system, and when it is not feasible to meter gas for such lighting along with other gas used on the premises and bill the same under the rate in effect for all other service. All such installations shall be on private property. Service under this schedule is available only to those customers taking service under this rate as of December 14, 1979.
CHARACTER OF SERVICE
A continuous supply of gas of not less than 1,000 Btu per cubic foot. RATE - MONTHLY $ 3.41 per month per light. COST OF GAS ADJUSTMENT AND LOCAL DISTRIBUTION ADJUSTMENT CLAUSE
The provisions of the Company's Cost of Gas Adjustment and Local Distribution Adjustment Clause apply to gas sold under this rate.
TERM OF CONTRACT
The terms of contract under this schedule shall be for an initial period of one year, and shall continue in effect thereafter until canceled by either party on 30 days' written notice.
BAY STATE GAS COMPANY M.D.P.U. No. 266 d/b/a Columbia Gas of Massachusetts Supersedes M.D.P.U. No. 230
Page 2 of 2
OUTDOOR GAS LIGHTING SERVICE
RATE L
Issued by: Stephen H. Bryant Issued On: October 14, 2016 President Effective: November 1, 2016
PAYMENT Bills are net and payable upon presentation. SPECIAL PROVISIONS
The customer shall own and maintain all equipment necessary for such lighting, including any necessary additional piping. The customer shall replace at his expense any mantles from time to time. All original or replacement equipment shall be approved by the Company.
RULES AND REGULATIONS
The Company's Rules and Regulations in effect from time to time, where not inconsistent with any specific provisions hereof, are a part of this schedule.
FARM DISCOUNT
All charges under this tariff are subject to a ten percent (10%) discount for customers who are certified as eligible by the Massachusetts Department of Food and Agriculture.
BAY STATE GAS COMPANY M.D.P.U. No. 267 d/b/a Columbia Gas of Massachusetts Supersedes M.D.P.U. No. 231
Page 1 of 3
NON-HEATING FIRM TRANSPORTATION SERVICE
RESIDENTIAL RATE T-R1
Issued by: Stephen H. Bryant Issued On: October 14, 2016 President Effective: November 1, 2016
AVAILABILITY
Service is available under this rate at single domestic locations throughout the territory served by the Company for transportation of supplier-owned gas used in individual private dwellings and individual apartments including condominiums and their facilities as defined in G. L. Chapter 183A, Section 1 and DPU 86-159 dated February 6, 1987.
CHARACTER OF SERVICE A continuous supply of gas of not less than 1,000 Btu per cubic foot. RATE - BI-MONTHLY
The Bi-Monthly rate schedule applicable to all customers being served with Company meters that do not have an installed radio-based automated meter reading device is as follows:
Customer Charge Per Two Month Period $ 24.40 Off-Peak - All therms @ $0.6973 per therm Peak - All therms @ $0.6973 per therm RATE – MONTHLY The Monthly rate schedule applicable to all customers being served with Company meters that
have an installed radio-based automated meter reading device is as follows: Customer Charge Per One Month Period $ 12.20 Off-Peak - All therms @ $0.6973 per therm Peak - All therms @ $0.6973 per therm
BAY STATE GAS COMPANY M.D.P.U. No. 267 d/b/a Columbia Gas of Massachusetts Supersedes M.D.P.U. No. 231
Page 2 of 3
NON-HEATING FIRM TRANSPORTATION SERVICE
RESIDENTIAL RATE T-R1
Issued by: Stephen H. Bryant Issued On: October 14, 2016 President Effective: November 1, 2016
MINIMUM CHARGE
The minimum charge per month shall be the applicable bi-monthly or monthly Customer Charge. REVENUE DECOUPLING ADJUSTMENT CLAUSE
The provisions of the Company’s Revenue Decoupling Adjustment Clause apply to gas transported under this rate.
LOCAL DISTRIBUTION ADJUSTMENT CLAUSE
The provisions of the Company's Local Distribution Adjustment Clause apply to gas transported under this rate.
DEFINITIONS
Off-Peak Period - Defined as the period from May 1st through October 31st. Peak Period - Defined as the period from November 1st through April 30th.
PAYMENT Bills are net and payable upon presentation. SPECIAL PROVISION
Where more than one but less than four individual apartments or dwellings are served through one meter, the billings shall be calculated as though each individual dwelling or apartment were served through a separate meter by assuming the use was divided equally among them, except that one customer charge will apply. The owner of the property or his designee will be responsible for the payment of the service. Where four or more individual apartments or dwellings are served through one meter, the billings will be calculated on the appropriate Commercial and Industrial Service Rate.
BAY STATE GAS COMPANY M.D.P.U. No. 267 d/b/a Columbia Gas of Massachusetts Supersedes M.D.P.U. No. 231
Page 3 of 3
NON-HEATING FIRM TRANSPORTATION SERVICE
RESIDENTIAL RATE T-R1
Issued by: Stephen H. Bryant Issued On: October 14, 2016 President Effective: November 1, 2016
TERMS AND CONDITIONS
The Company's Terms and Conditions in effect from time to time, where not inconsistent with any specific provisions hereof, or other arrangements between Customers and Suppliers operating pursuant to the Company's Supplier Service Agreement Terms and Conditions, are a part of this schedule.
FARM DISCOUNT
All charges under this tariff are subject to a ten percent (10%) discount for customers who are certified as eligible by the Massachusetts Department of Food and Agriculture.
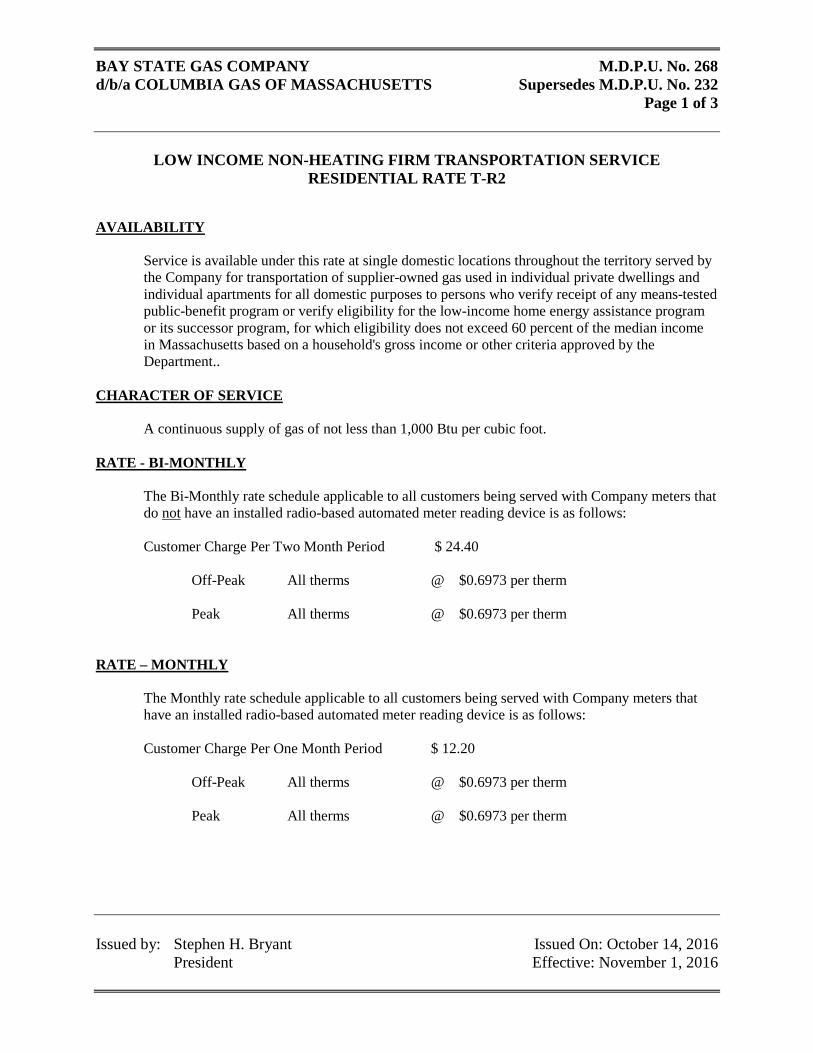
BAY STATE GAS COMPANY M.D.P.U. No. 268 d/b/a COLUMBIA GAS OF MASSACHUSETTS Supersedes M.D.P.U. No. 232
Page 1 of 3
LOW INCOME NON-HEATING FIRM TRANSPORTATION SERVICE
RESIDENTIAL RATE T-R2
Issued by: Stephen H. Bryant Issued On: October 14, 2016 President Effective: November 1, 2016
AVAILABILITY
Service is available under this rate at single domestic locations throughout the territory served by the Company for transportation of supplier-owned gas used in individual private dwellings and individual apartments for all domestic purposes to persons who verify receipt of any means-tested public-benefit program or verify eligibility for the low-income home energy assistance program or its successor program, for which eligibility does not exceed 60 percent of the median income in Massachusetts based on a household's gross income or other criteria approved by the Department..
CHARACTER OF SERVICE A continuous supply of gas of not less than 1,000 Btu per cubic foot. RATE - BI-MONTHLY
The Bi-Monthly rate schedule applicable to all customers being served with Company meters that do not have an installed radio-based automated meter reading device is as follows:
Customer Charge Per Two Month Period $ 24.40 Off-Peak All therms @ $0.6973 per therm Peak All therms @ $0.6973 per therm RATE – MONTHLY The Monthly rate schedule applicable to all customers being served with Company meters that
have an installed radio-based automated meter reading device is as follows: Customer Charge Per One Month Period $ 12.20 Off-Peak All therms @ $0.6973 per therm Peak All therms @ $0.6973 per therm
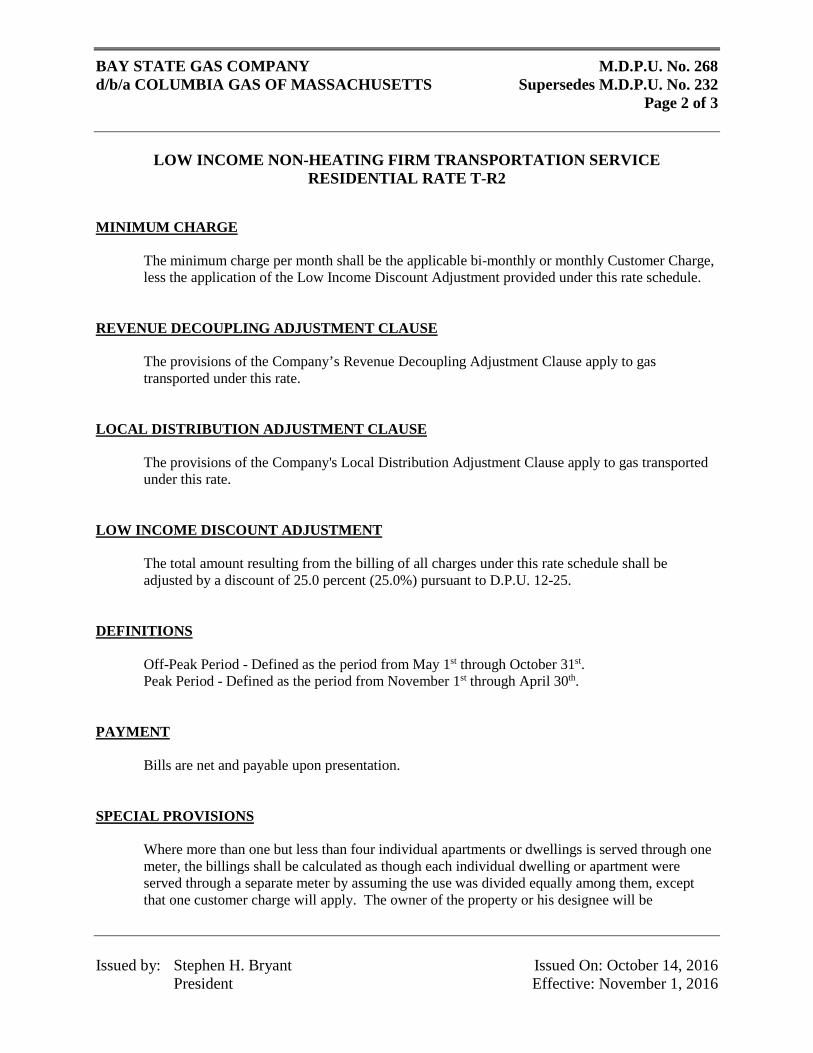
BAY STATE GAS COMPANY M.D.P.U. No. 268 d/b/a COLUMBIA GAS OF MASSACHUSETTS Supersedes M.D.P.U. No. 232
Page 2 of 3
LOW INCOME NON-HEATING FIRM TRANSPORTATION SERVICE
RESIDENTIAL RATE T-R2
Issued by: Stephen H. Bryant Issued On: October 14, 2016 President Effective: November 1, 2016
MINIMUM CHARGE
The minimum charge per month shall be the applicable bi-monthly or monthly Customer Charge, less the application of the Low Income Discount Adjustment provided under this rate schedule.
REVENUE DECOUPLING ADJUSTMENT CLAUSE
The provisions of the Company’s Revenue Decoupling Adjustment Clause apply to gas transported under this rate.
LOCAL DISTRIBUTION ADJUSTMENT CLAUSE
The provisions of the Company's Local Distribution Adjustment Clause apply to gas transported under this rate.
LOW INCOME DISCOUNT ADJUSTMENT
The total amount resulting from the billing of all charges under this rate schedule shall be adjusted by a discount of 25.0 percent (25.0%) pursuant to D.P.U. 12-25.
DEFINITIONS
Off-Peak Period - Defined as the period from May 1st through October 31st. Peak Period - Defined as the period from November 1st through April 30th.
PAYMENT Bills are net and payable upon presentation. SPECIAL PROVISIONS
Where more than one but less than four individual apartments or dwellings is served through one meter, the billings shall be calculated as though each individual dwelling or apartment were served through a separate meter by assuming the use was divided equally among them, except that one customer charge will apply. The owner of the property or his designee will be
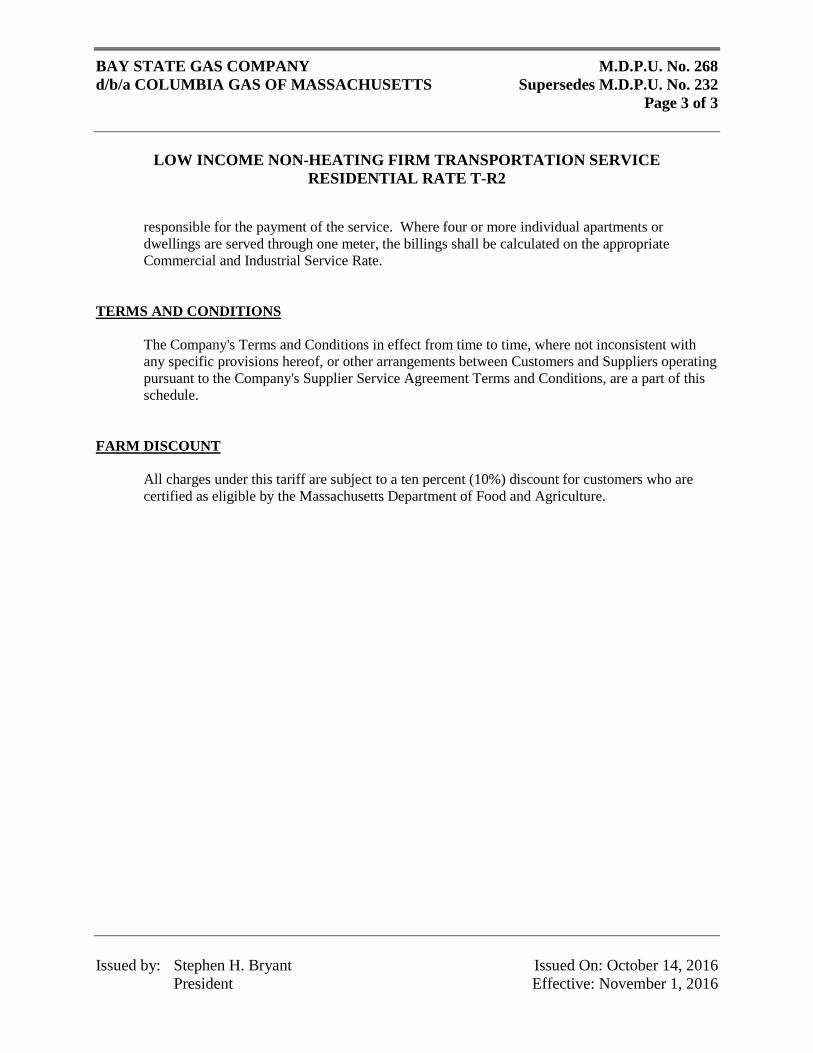
BAY STATE GAS COMPANY M.D.P.U. No. 268 d/b/a COLUMBIA GAS OF MASSACHUSETTS Supersedes M.D.P.U. No. 232
Page 3 of 3
LOW INCOME NON-HEATING FIRM TRANSPORTATION SERVICE
RESIDENTIAL RATE T-R2
Issued by: Stephen H. Bryant Issued On: October 14, 2016 President Effective: November 1, 2016
responsible for the payment of the service. Where four or more individual apartments or dwellings are served through one meter, the billings shall be calculated on the appropriate Commercial and Industrial Service Rate.
TERMS AND CONDITIONS
The Company's Terms and Conditions in effect from time to time, where not inconsistent with any specific provisions hereof, or other arrangements between Customers and Suppliers operating pursuant to the Company's Supplier Service Agreement Terms and Conditions, are a part of this schedule.
FARM DISCOUNT
All charges under this tariff are subject to a ten percent (10%) discount for customers who are certified as eligible by the Massachusetts Department of Food and Agriculture.
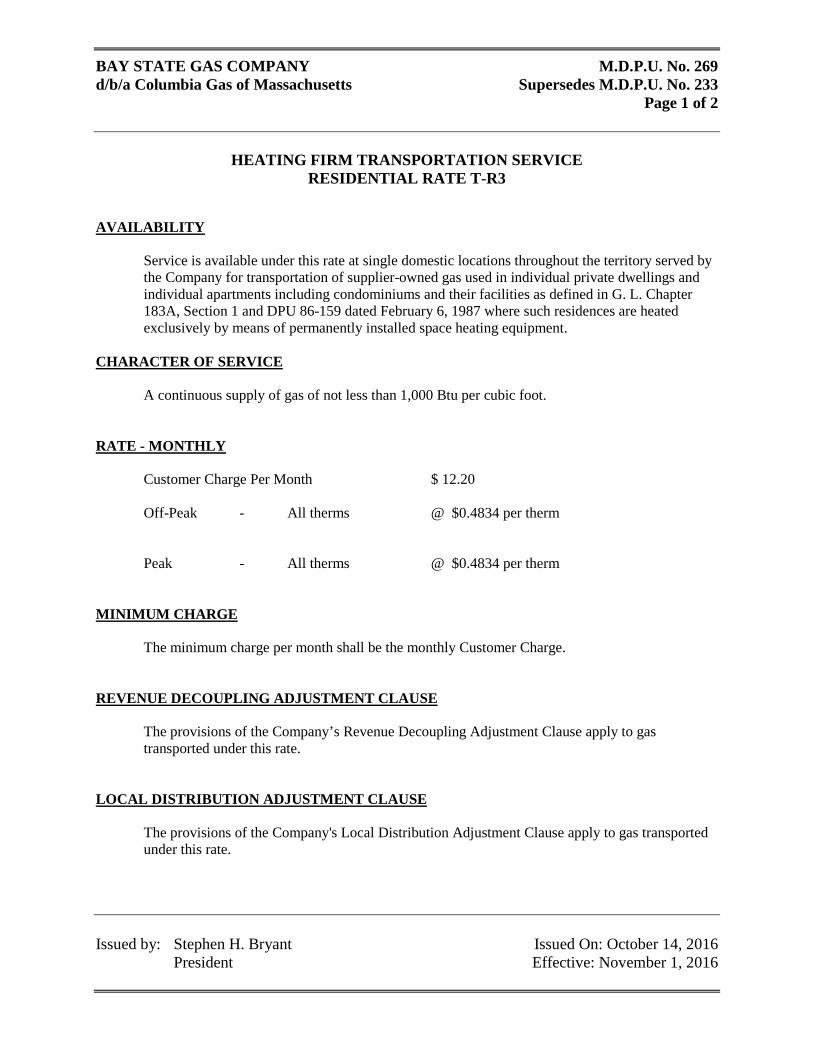
BAY STATE GAS COMPANY M.D.P.U. No. 269 d/b/a Columbia Gas of Massachusetts Supersedes M.D.P.U. No. 233
Page 1 of 2
HEATING FIRM TRANSPORTATION SERVICE
RESIDENTIAL RATE T-R3
Issued by: Stephen H. Bryant Issued On: October 14, 2016 President Effective: November 1, 2016
AVAILABILITY Service is available under this rate at single domestic locations throughout the territory served by the Company for transportation of supplier-owned gas used in individual private dwellings and individual apartments including condominiums and their facilities as defined in G. L. Chapter 183A, Section 1 and DPU 86-159 dated February 6, 1987 where such residences are heated exclusively by means of permanently installed space heating equipment.
CHARACTER OF SERVICE A continuous supply of gas of not less than 1,000 Btu per cubic foot. RATE - MONTHLY Customer Charge Per Month $ 12.20 Off-Peak - All therms @ $0.4834 per therm Peak - All therms @ $0.4834 per therm MINIMUM CHARGE
The minimum charge per month shall be the monthly Customer Charge. REVENUE DECOUPLING ADJUSTMENT CLAUSE
The provisions of the Company’s Revenue Decoupling Adjustment Clause apply to gas transported under this rate.
LOCAL DISTRIBUTION ADJUSTMENT CLAUSE
The provisions of the Company's Local Distribution Adjustment Clause apply to gas transported under this rate.
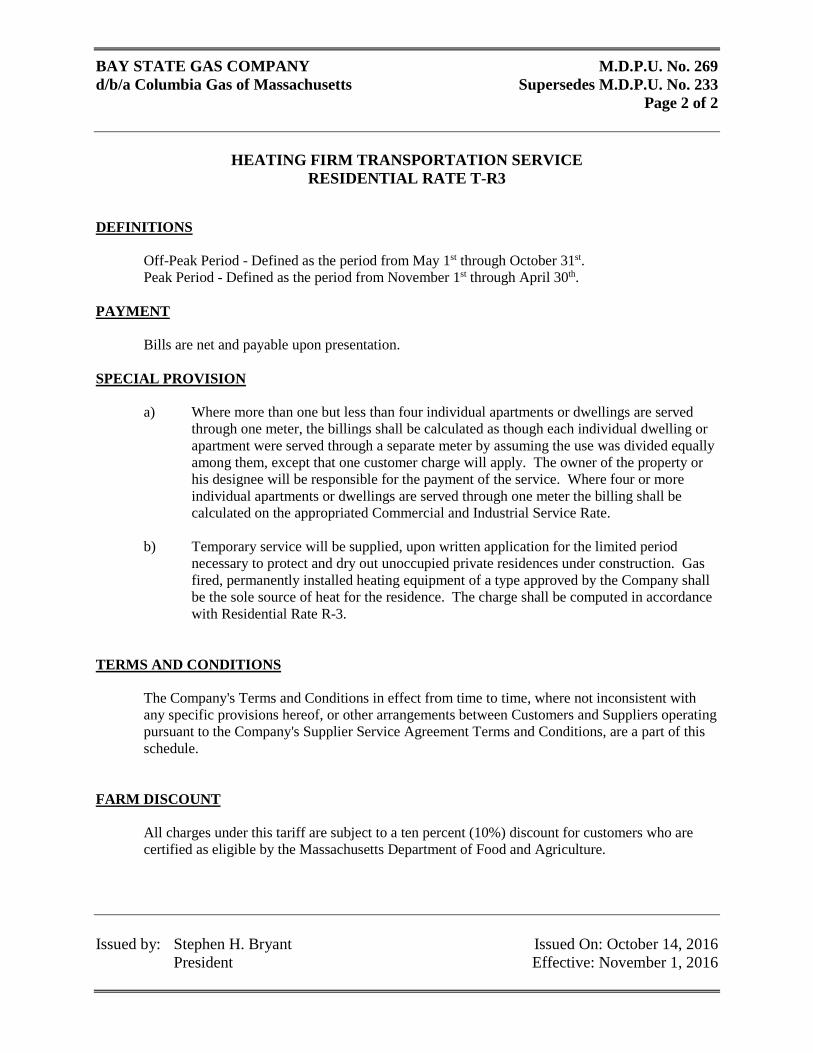
BAY STATE GAS COMPANY M.D.P.U. No. 269 d/b/a Columbia Gas of Massachusetts Supersedes M.D.P.U. No. 233
Page 2 of 2
HEATING FIRM TRANSPORTATION SERVICE
RESIDENTIAL RATE T-R3
Issued by: Stephen H. Bryant Issued On: October 14, 2016 President Effective: November 1, 2016
DEFINITIONS
Off-Peak Period - Defined as the period from May 1st through October 31st. Peak Period - Defined as the period from November 1st through April 30th.
PAYMENT Bills are net and payable upon presentation. SPECIAL PROVISION
a) Where more than one but less than four individual apartments or dwellings are served through one meter, the billings shall be calculated as though each individual dwelling or apartment were served through a separate meter by assuming the use was divided equally among them, except that one customer charge will apply. The owner of the property or his designee will be responsible for the payment of the service. Where four or more individual apartments or dwellings are served through one meter the billing shall be calculated on the appropriated Commercial and Industrial Service Rate.
b) Temporary service will be supplied, upon written application for the limited period
necessary to protect and dry out unoccupied private residences under construction. Gas fired, permanently installed heating equipment of a type approved by the Company shall be the sole source of heat for the residence. The charge shall be computed in accordance with Residential Rate R-3.
TERMS AND CONDITIONS
The Company's Terms and Conditions in effect from time to time, where not inconsistent with any specific provisions hereof, or other arrangements between Customers and Suppliers operating pursuant to the Company's Supplier Service Agreement Terms and Conditions, are a part of this schedule.
FARM DISCOUNT
All charges under this tariff are subject to a ten percent (10%) discount for customers who are certified as eligible by the Massachusetts Department of Food and Agriculture.
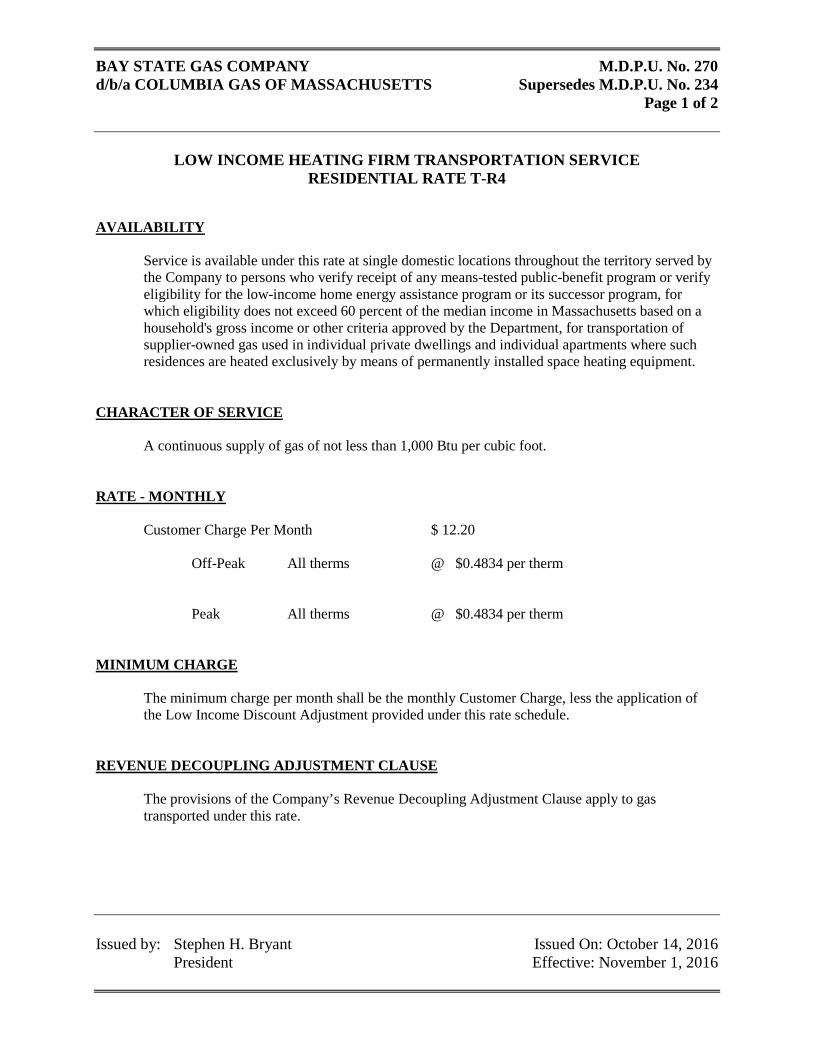
BAY STATE GAS COMPANY M.D.P.U. No. 270 d/b/a COLUMBIA GAS OF MASSACHUSETTS Supersedes M.D.P.U. No. 234
Page 1 of 2
LOW INCOME HEATING FIRM TRANSPORTATION SERVICE
RESIDENTIAL RATE T-R4
Issued by: Stephen H. Bryant Issued On: October 14, 2016 President Effective: November 1, 2016
AVAILABILITY
Service is available under this rate at single domestic locations throughout the territory served by the Company to persons who verify receipt of any means-tested public-benefit program or verify eligibility for the low-income home energy assistance program or its successor program, for which eligibility does not exceed 60 percent of the median income in Massachusetts based on a household's gross income or other criteria approved by the Department, for transportation of supplier-owned gas used in individual private dwellings and individual apartments where such residences are heated exclusively by means of permanently installed space heating equipment.
CHARACTER OF SERVICE A continuous supply of gas of not less than 1,000 Btu per cubic foot. RATE - MONTHLY Customer Charge Per Month $ 12.20 Off-Peak All therms @ $0.4834 per therm Peak All therms @ $0.4834 per therm MINIMUM CHARGE
The minimum charge per month shall be the monthly Customer Charge, less the application of the Low Income Discount Adjustment provided under this rate schedule.
REVENUE DECOUPLING ADJUSTMENT CLAUSE
The provisions of the Company’s Revenue Decoupling Adjustment Clause apply to gas transported under this rate.
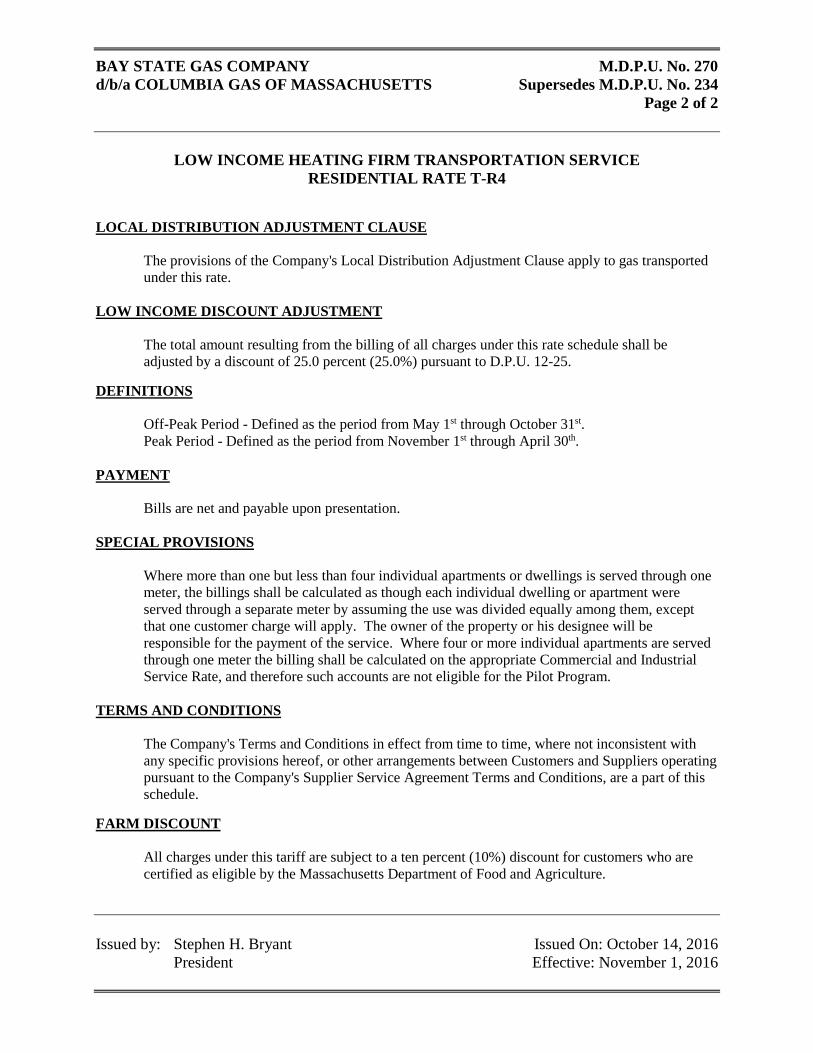
BAY STATE GAS COMPANY M.D.P.U. No. 270 d/b/a COLUMBIA GAS OF MASSACHUSETTS Supersedes M.D.P.U. No. 234
Page 2 of 2
LOW INCOME HEATING FIRM TRANSPORTATION SERVICE
RESIDENTIAL RATE T-R4
Issued by: Stephen H. Bryant Issued On: October 14, 2016 President Effective: November 1, 2016
LOCAL DISTRIBUTION ADJUSTMENT CLAUSE
The provisions of the Company's Local Distribution Adjustment Clause apply to gas transported under this rate.
LOW INCOME DISCOUNT ADJUSTMENT
The total amount resulting from the billing of all charges under this rate schedule shall be adjusted by a discount of 25.0 percent (25.0%) pursuant to D.P.U. 12-25.
DEFINITIONS
Off-Peak Period - Defined as the period from May 1st through October 31st. Peak Period - Defined as the period from November 1st through April 30th.
PAYMENT Bills are net and payable upon presentation. SPECIAL PROVISIONS
Where more than one but less than four individual apartments or dwellings is served through one meter, the billings shall be calculated as though each individual dwelling or apartment were served through a separate meter by assuming the use was divided equally among them, except that one customer charge will apply. The owner of the property or his designee will be responsible for the payment of the service. Where four or more individual apartments are served through one meter the billing shall be calculated on the appropriate Commercial and Industrial Service Rate, and therefore such accounts are not eligible for the Pilot Program.
TERMS AND CONDITIONS
The Company's Terms and Conditions in effect from time to time, where not inconsistent with any specific provisions hereof, or other arrangements between Customers and Suppliers operating pursuant to the Company's Supplier Service Agreement Terms and Conditions, are a part of this schedule.
FARM DISCOUNT
All charges under this tariff are subject to a ten percent (10%) discount for customers who are certified as eligible by the Massachusetts Department of Food and Agriculture.
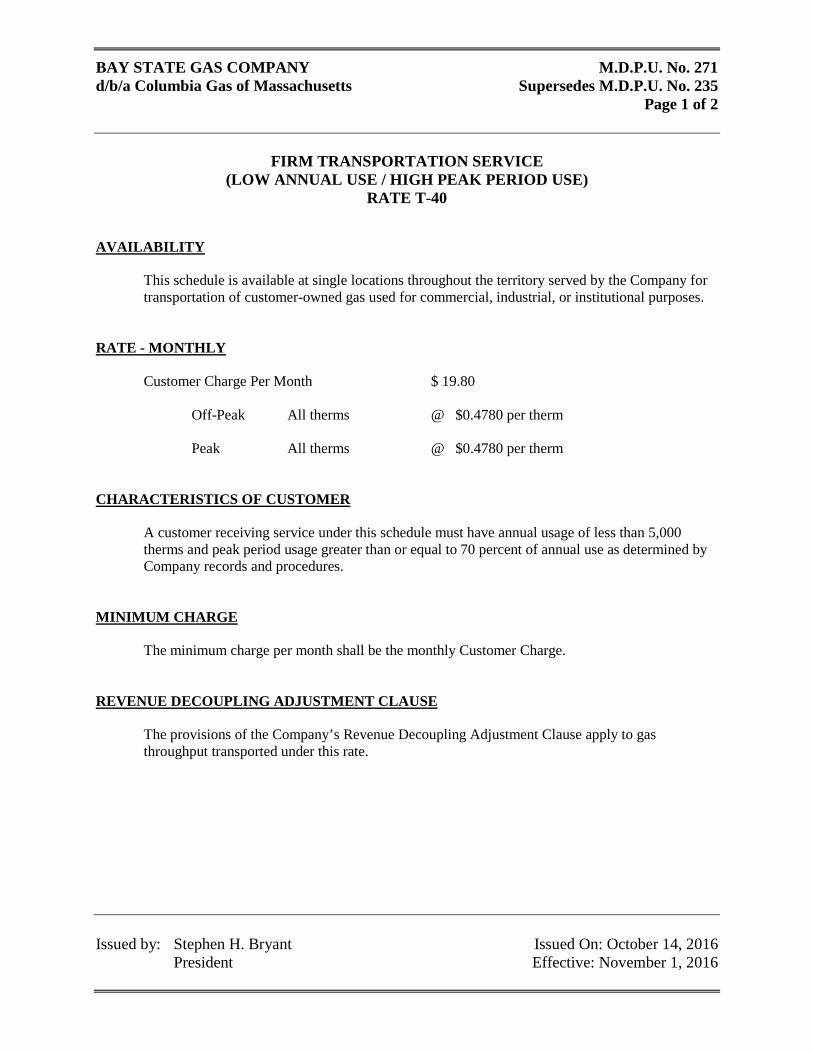
BAY STATE GAS COMPANY M.D.P.U. No. 271 d/b/a Columbia Gas of Massachusetts Supersedes M.D.P.U. No. 235
Page 1 of 2
FIRM TRANSPORTATION SERVICE
(LOW ANNUAL USE / HIGH PEAK PERIOD USE) RATE T-40
Issued by: Stephen H. Bryant Issued On: October 14, 2016 President Effective: November 1, 2016
AVAILABILITY
This schedule is available at single locations throughout the territory served by the Company for transportation of customer-owned gas used for commercial, industrial, or institutional purposes.
RATE - MONTHLY Customer Charge Per Month $ 19.80 Off-Peak All therms @ $0.4780 per therm Peak All therms @ $0.4780 per therm CHARACTERISTICS OF CUSTOMER
A customer receiving service under this schedule must have annual usage of less than 5,000 therms and peak period usage greater than or equal to 70 percent of annual use as determined by Company records and procedures.
MINIMUM CHARGE
The minimum charge per month shall be the monthly Customer Charge. REVENUE DECOUPLING ADJUSTMENT CLAUSE
The provisions of the Company’s Revenue Decoupling Adjustment Clause apply to gas throughput transported under this rate.

BAY STATE GAS COMPANY M.D.P.U. No. 271 d/b/a Columbia Gas of Massachusetts Supersedes M.D.P.U. No. 235
Page 2 of 2
FIRM TRANSPORTATION SERVICE
(LOW ANNUAL USE / HIGH PEAK PERIOD USE) RATE T-40
Issued by: Stephen H. Bryant Issued On: October 14, 2016 President Effective: November 1, 2016
LOCAL DISTRIBUTION ADJUSTMENT CLAUSE
The provisions of the Company's Local Distribution Adjustment Clause apply to gas throughput transported under this rate.
DEFINITIONS
Off-Peak Period - Defined as the period from May 1st through October 31st. Peak Period - Defined as the period from November 1st through April 30th.
PAYMENT Bills are net and payable upon presentation. TERM OF CONTRACT
The term of contract under this schedule shall be for an initial period of at least one year, at the expiration of which initial period it shall automatically renew itself for like one year periods thereafter unless terminated by either party giving to the other notice in writing 30 days prior to the expiration of any contract year.
TERMS AND CONDITIONS
The Company's Terms and Conditions in effect from time to time, where not inconsistent with any specific provisions hereof, are a part of this schedule.
FARM DISCOUNT
All charges under this tariff are subject to a ten percent (10%) discount for customers who are certified as eligible by the Massachusetts Department of Food and Agriculture.
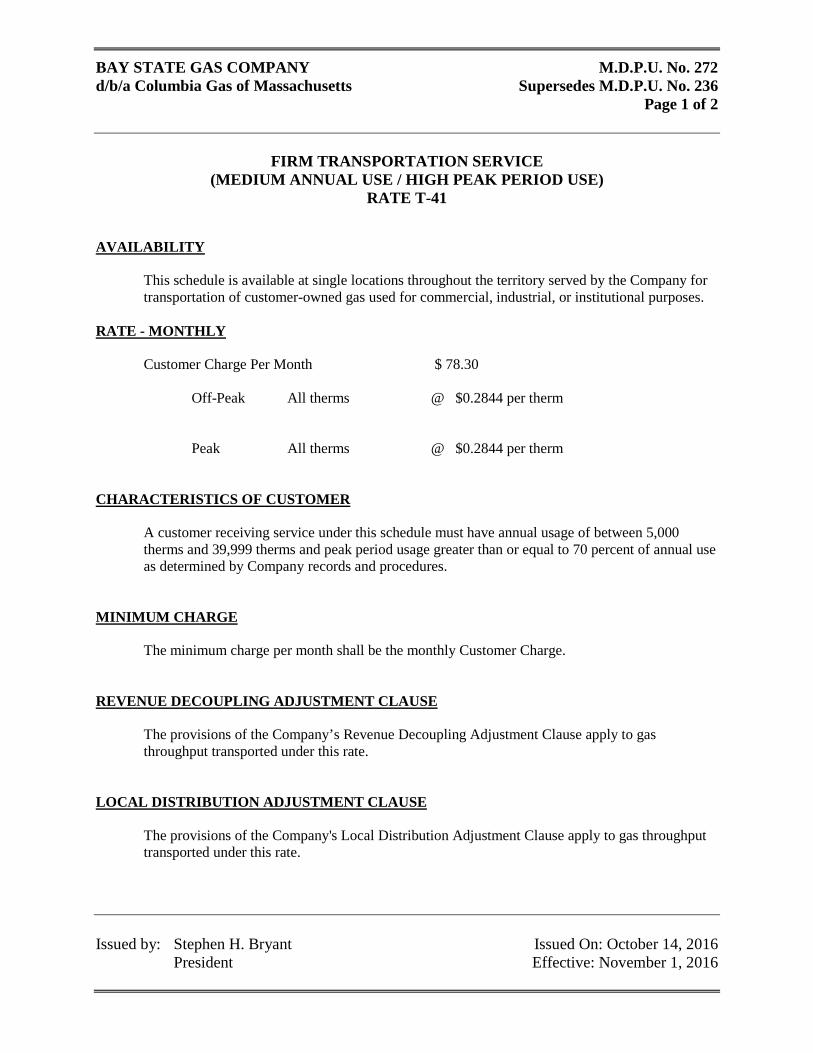
BAY STATE GAS COMPANY M.D.P.U. No. 272 d/b/a Columbia Gas of Massachusetts Supersedes M.D.P.U. No. 236
Page 1 of 2
FIRM TRANSPORTATION SERVICE
(MEDIUM ANNUAL USE / HIGH PEAK PERIOD USE) RATE T-41
Issued by: Stephen H. Bryant Issued On: October 14, 2016 President Effective: November 1, 2016
AVAILABILITY
This schedule is available at single locations throughout the territory served by the Company for transportation of customer-owned gas used for commercial, industrial, or institutional purposes.
RATE - MONTHLY Customer Charge Per Month $ 78.30 Off-Peak All therms @ $0.2844 per therm Peak All therms @ $0.2844 per therm CHARACTERISTICS OF CUSTOMER
A customer receiving service under this schedule must have annual usage of between 5,000 therms and 39,999 therms and peak period usage greater than or equal to 70 percent of annual use as determined by Company records and procedures.
MINIMUM CHARGE
The minimum charge per month shall be the monthly Customer Charge. REVENUE DECOUPLING ADJUSTMENT CLAUSE
The provisions of the Company’s Revenue Decoupling Adjustment Clause apply to gas throughput transported under this rate.
LOCAL DISTRIBUTION ADJUSTMENT CLAUSE
The provisions of the Company's Local Distribution Adjustment Clause apply to gas throughput transported under this rate.
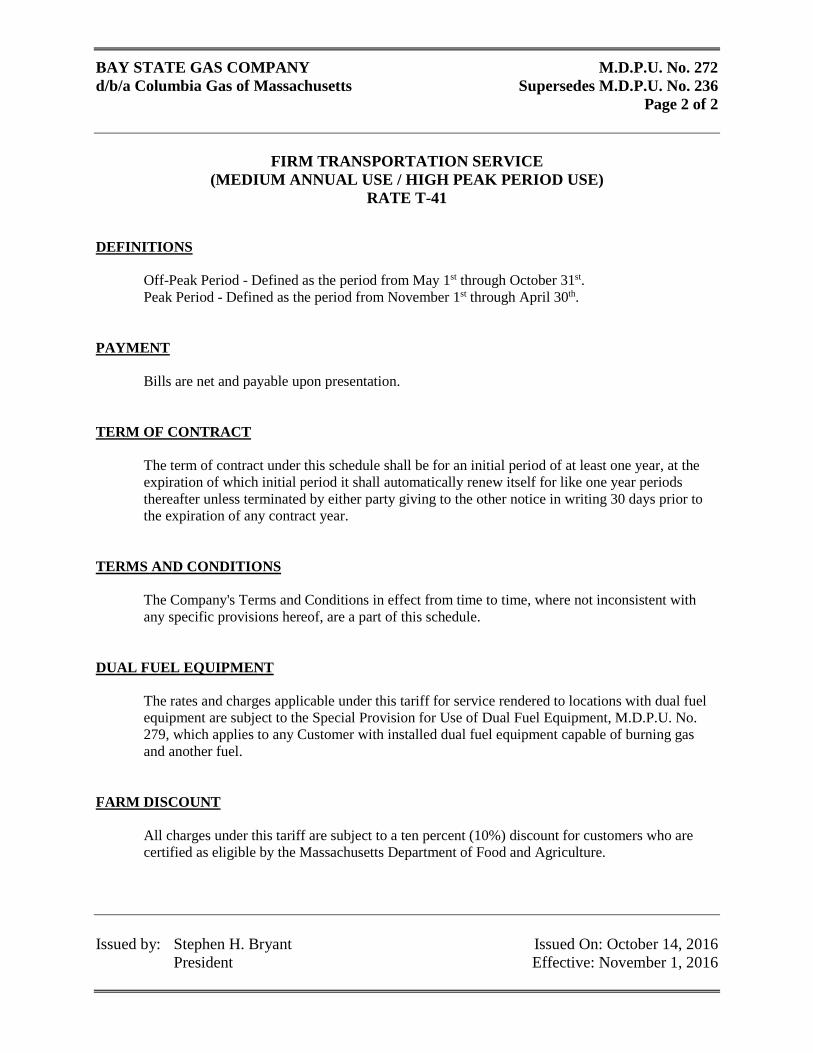
BAY STATE GAS COMPANY M.D.P.U. No. 272 d/b/a Columbia Gas of Massachusetts Supersedes M.D.P.U. No. 236
Page 2 of 2
FIRM TRANSPORTATION SERVICE
(MEDIUM ANNUAL USE / HIGH PEAK PERIOD USE) RATE T-41
Issued by: Stephen H. Bryant Issued On: October 14, 2016 President Effective: November 1, 2016
DEFINITIONS
Off-Peak Period - Defined as the period from May 1st through October 31st. Peak Period - Defined as the period from November 1st through April 30th.
PAYMENT Bills are net and payable upon presentation. TERM OF CONTRACT
The term of contract under this schedule shall be for an initial period of at least one year, at the expiration of which initial period it shall automatically renew itself for like one year periods thereafter unless terminated by either party giving to the other notice in writing 30 days prior to the expiration of any contract year.
TERMS AND CONDITIONS
The Company's Terms and Conditions in effect from time to time, where not inconsistent with any specific provisions hereof, are a part of this schedule.
DUAL FUEL EQUIPMENT
The rates and charges applicable under this tariff for service rendered to locations with dual fuel equipment are subject to the Special Provision for Use of Dual Fuel Equipment, M.D.P.U. No. 279, which applies to any Customer with installed dual fuel equipment capable of burning gas and another fuel.
FARM DISCOUNT
All charges under this tariff are subject to a ten percent (10%) discount for customers who are certified as eligible by the Massachusetts Department of Food and Agriculture.
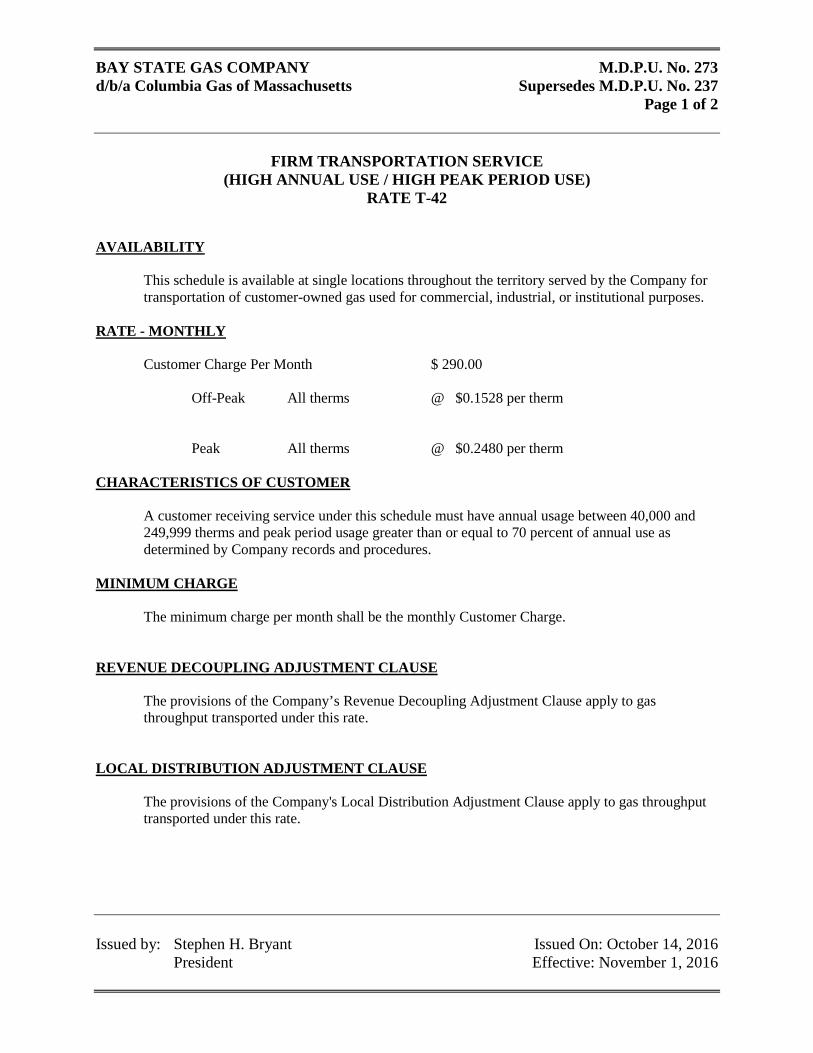
BAY STATE GAS COMPANY M.D.P.U. No. 273 d/b/a Columbia Gas of Massachusetts Supersedes M.D.P.U. No. 237
Page 1 of 2
FIRM TRANSPORTATION SERVICE
(HIGH ANNUAL USE / HIGH PEAK PERIOD USE) RATE T-42
Issued by: Stephen H. Bryant Issued On: October 14, 2016 President Effective: November 1, 2016
AVAILABILITY
This schedule is available at single locations throughout the territory served by the Company for transportation of customer-owned gas used for commercial, industrial, or institutional purposes.
RATE - MONTHLY Customer Charge Per Month $ 290.00 Off-Peak All therms @ $0.1528 per therm Peak All therms @ $0.2480 per therm CHARACTERISTICS OF CUSTOMER
A customer receiving service under this schedule must have annual usage between 40,000 and 249,999 therms and peak period usage greater than or equal to 70 percent of annual use as determined by Company records and procedures.
MINIMUM CHARGE
The minimum charge per month shall be the monthly Customer Charge. REVENUE DECOUPLING ADJUSTMENT CLAUSE
The provisions of the Company’s Revenue Decoupling Adjustment Clause apply to gas throughput transported under this rate.
LOCAL DISTRIBUTION ADJUSTMENT CLAUSE
The provisions of the Company's Local Distribution Adjustment Clause apply to gas throughput transported under this rate.
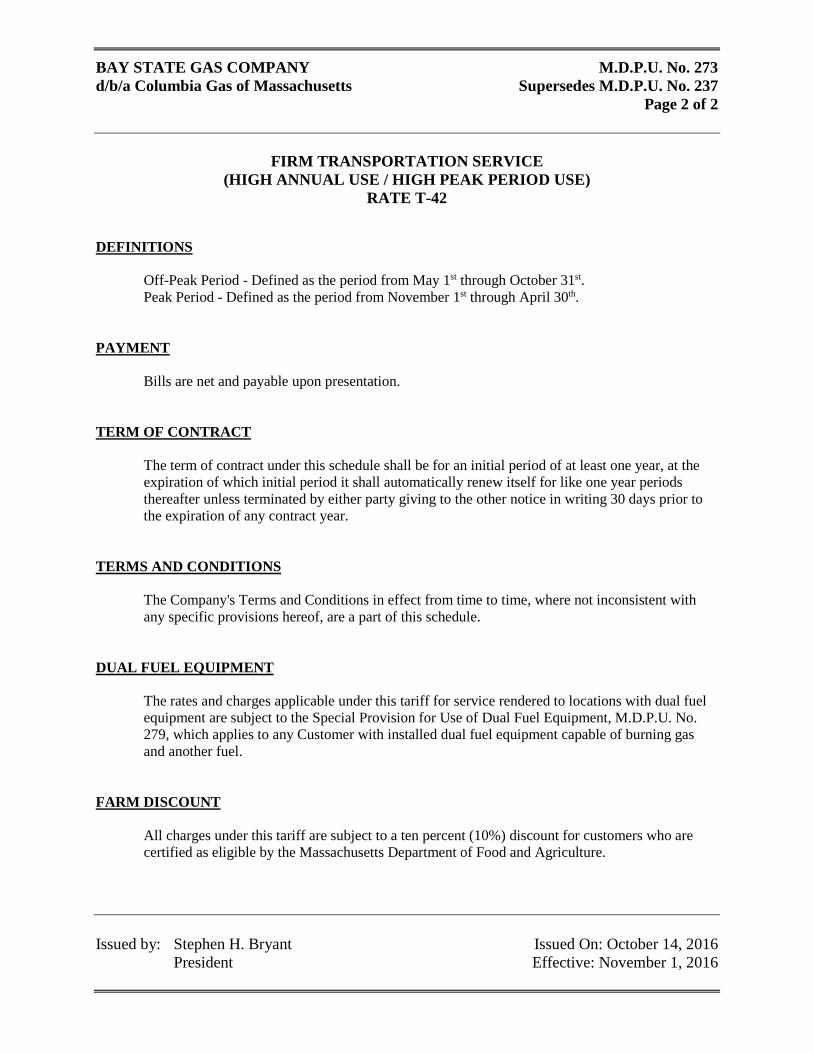
BAY STATE GAS COMPANY M.D.P.U. No. 273 d/b/a Columbia Gas of Massachusetts Supersedes M.D.P.U. No. 237
Page 2 of 2
FIRM TRANSPORTATION SERVICE
(HIGH ANNUAL USE / HIGH PEAK PERIOD USE) RATE T-42
Issued by: Stephen H. Bryant Issued On: October 14, 2016 President Effective: November 1, 2016
DEFINITIONS
Off-Peak Period - Defined as the period from May 1st through October 31st. Peak Period - Defined as the period from November 1st through April 30th.
PAYMENT Bills are net and payable upon presentation. TERM OF CONTRACT
The term of contract under this schedule shall be for an initial period of at least one year, at the expiration of which initial period it shall automatically renew itself for like one year periods thereafter unless terminated by either party giving to the other notice in writing 30 days prior to the expiration of any contract year.
TERMS AND CONDITIONS
The Company's Terms and Conditions in effect from time to time, where not inconsistent with any specific provisions hereof, are a part of this schedule.
DUAL FUEL EQUIPMENT
The rates and charges applicable under this tariff for service rendered to locations with dual fuel equipment are subject to the Special Provision for Use of Dual Fuel Equipment, M.D.P.U. No. 279, which applies to any Customer with installed dual fuel equipment capable of burning gas and another fuel.
FARM DISCOUNT
All charges under this tariff are subject to a ten percent (10%) discount for customers who are certified as eligible by the Massachusetts Department of Food and Agriculture.
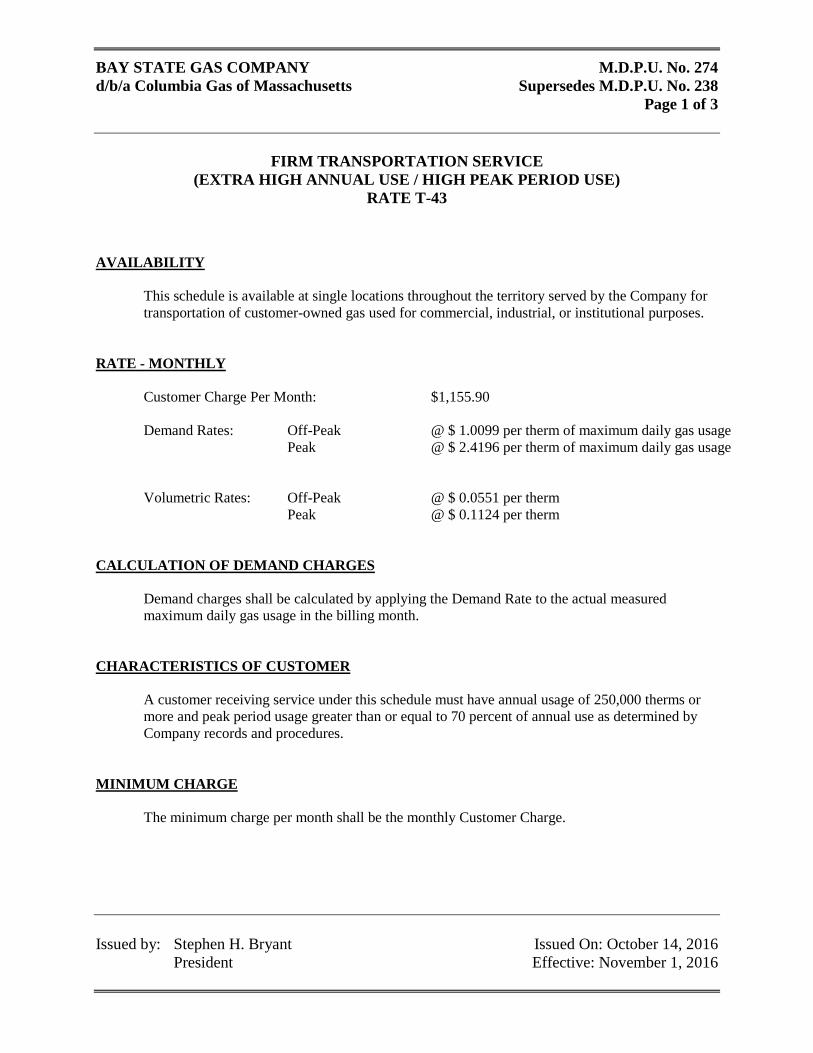
BAY STATE GAS COMPANY M.D.P.U. No. 274 d/b/a Columbia Gas of Massachusetts Supersedes M.D.P.U. No. 238
Page 1 of 3
FIRM TRANSPORTATION SERVICE
(EXTRA HIGH ANNUAL USE / HIGH PEAK PERIOD USE) RATE T-43
Issued by: Stephen H. Bryant Issued On: October 14, 2016 President Effective: November 1, 2016
AVAILABILITY
This schedule is available at single locations throughout the territory served by the Company for transportation of customer-owned gas used for commercial, industrial, or institutional purposes.
RATE - MONTHLY Customer Charge Per Month: $1,155.90 Demand Rates: Off-Peak @ $ 1.0099 per therm of maximum daily gas usage Peak @ $ 2.4196 per therm of maximum daily gas usage Volumetric Rates: Off-Peak @ $ 0.0551 per therm Peak @ $ 0.1124 per therm CALCULATION OF DEMAND CHARGES
Demand charges shall be calculated by applying the Demand Rate to the actual measured maximum daily gas usage in the billing month.
CHARACTERISTICS OF CUSTOMER
A customer receiving service under this schedule must have annual usage of 250,000 therms or more and peak period usage greater than or equal to 70 percent of annual use as determined by Company records and procedures.
MINIMUM CHARGE
The minimum charge per month shall be the monthly Customer Charge.
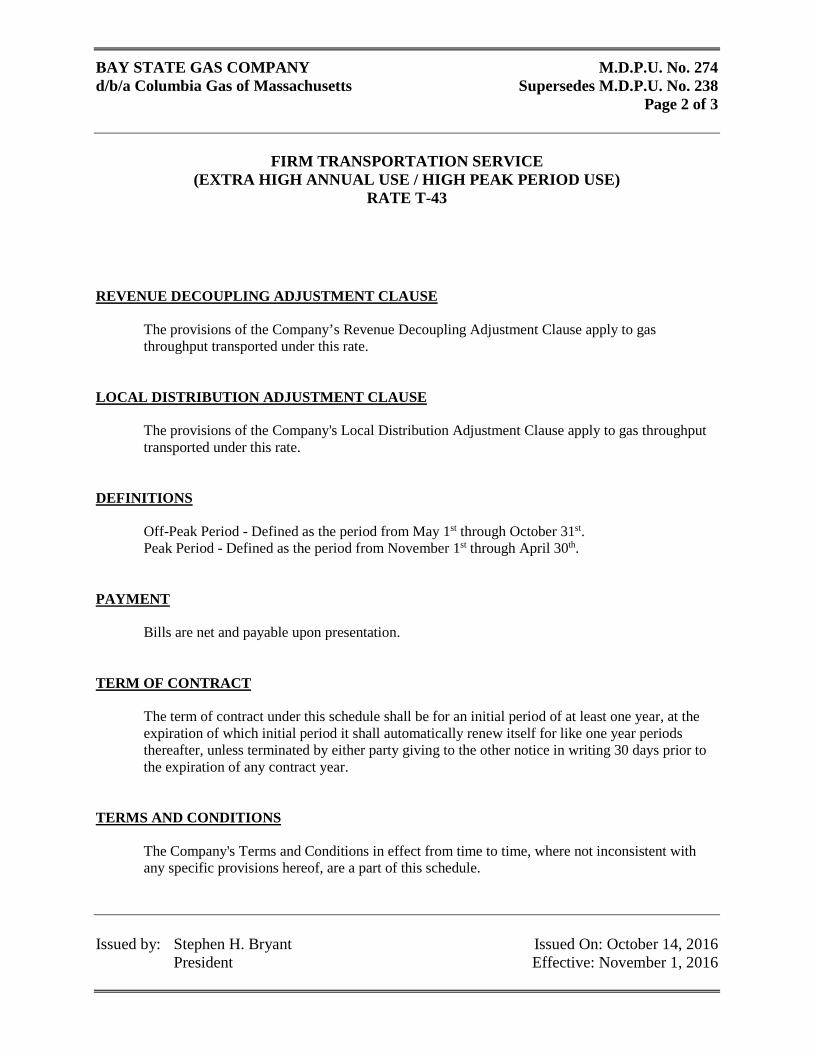
BAY STATE GAS COMPANY M.D.P.U. No. 274 d/b/a Columbia Gas of Massachusetts Supersedes M.D.P.U. No. 238
Page 2 of 3
FIRM TRANSPORTATION SERVICE
(EXTRA HIGH ANNUAL USE / HIGH PEAK PERIOD USE) RATE T-43
Issued by: Stephen H. Bryant Issued On: October 14, 2016 President Effective: November 1, 2016
REVENUE DECOUPLING ADJUSTMENT CLAUSE
The provisions of the Company’s Revenue Decoupling Adjustment Clause apply to gas throughput transported under this rate.
LOCAL DISTRIBUTION ADJUSTMENT CLAUSE
The provisions of the Company's Local Distribution Adjustment Clause apply to gas throughput transported under this rate.
DEFINITIONS
Off-Peak Period - Defined as the period from May 1st through October 31st. Peak Period - Defined as the period from November 1st through April 30th.
PAYMENT Bills are net and payable upon presentation. TERM OF CONTRACT
The term of contract under this schedule shall be for an initial period of at least one year, at the expiration of which initial period it shall automatically renew itself for like one year periods thereafter, unless terminated by either party giving to the other notice in writing 30 days prior to the expiration of any contract year.
TERMS AND CONDITIONS
The Company's Terms and Conditions in effect from time to time, where not inconsistent with any specific provisions hereof, are a part of this schedule.
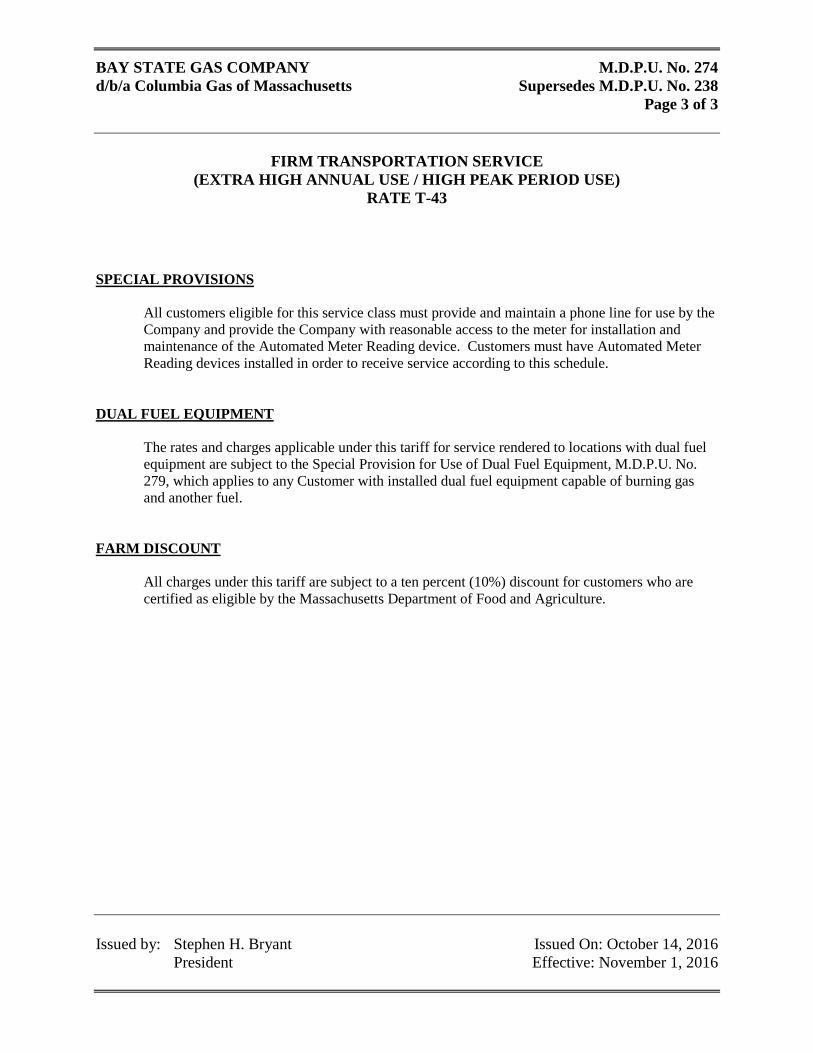
BAY STATE GAS COMPANY M.D.P.U. No. 274 d/b/a Columbia Gas of Massachusetts Supersedes M.D.P.U. No. 238
Page 3 of 3
FIRM TRANSPORTATION SERVICE
(EXTRA HIGH ANNUAL USE / HIGH PEAK PERIOD USE) RATE T-43
Issued by: Stephen H. Bryant Issued On: October 14, 2016 President Effective: November 1, 2016
SPECIAL PROVISIONS
All customers eligible for this service class must provide and maintain a phone line for use by the Company and provide the Company with reasonable access to the meter for installation and maintenance of the Automated Meter Reading device. Customers must have Automated Meter Reading devices installed in order to receive service according to this schedule.
DUAL FUEL EQUIPMENT
The rates and charges applicable under this tariff for service rendered to locations with dual fuel equipment are subject to the Special Provision for Use of Dual Fuel Equipment, M.D.P.U. No. 279, which applies to any Customer with installed dual fuel equipment capable of burning gas and another fuel.
FARM DISCOUNT
All charges under this tariff are subject to a ten percent (10%) discount for customers who are certified as eligible by the Massachusetts Department of Food and Agriculture.
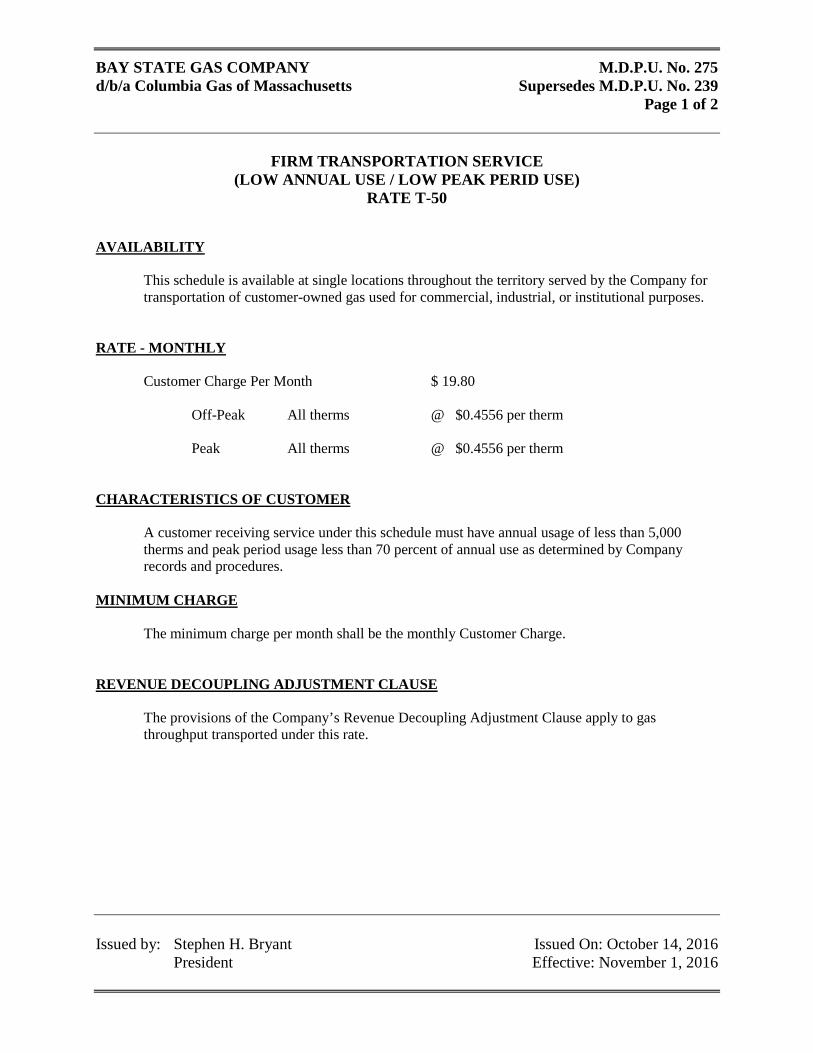
BAY STATE GAS COMPANY M.D.P.U. No. 275 d/b/a Columbia Gas of Massachusetts Supersedes M.D.P.U. No. 239
Page 1 of 2
FIRM TRANSPORTATION SERVICE
(LOW ANNUAL USE / LOW PEAK PERID USE) RATE T-50
Issued by: Stephen H. Bryant Issued On: October 14, 2016 President Effective: November 1, 2016
AVAILABILITY
This schedule is available at single locations throughout the territory served by the Company for transportation of customer-owned gas used for commercial, industrial, or institutional purposes.
RATE - MONTHLY Customer Charge Per Month $ 19.80 Off-Peak All therms @ $0.4556 per therm Peak All therms @ $0.4556 per therm CHARACTERISTICS OF CUSTOMER
A customer receiving service under this schedule must have annual usage of less than 5,000 therms and peak period usage less than 70 percent of annual use as determined by Company records and procedures.
MINIMUM CHARGE
The minimum charge per month shall be the monthly Customer Charge. REVENUE DECOUPLING ADJUSTMENT CLAUSE
The provisions of the Company’s Revenue Decoupling Adjustment Clause apply to gas throughput transported under this rate.
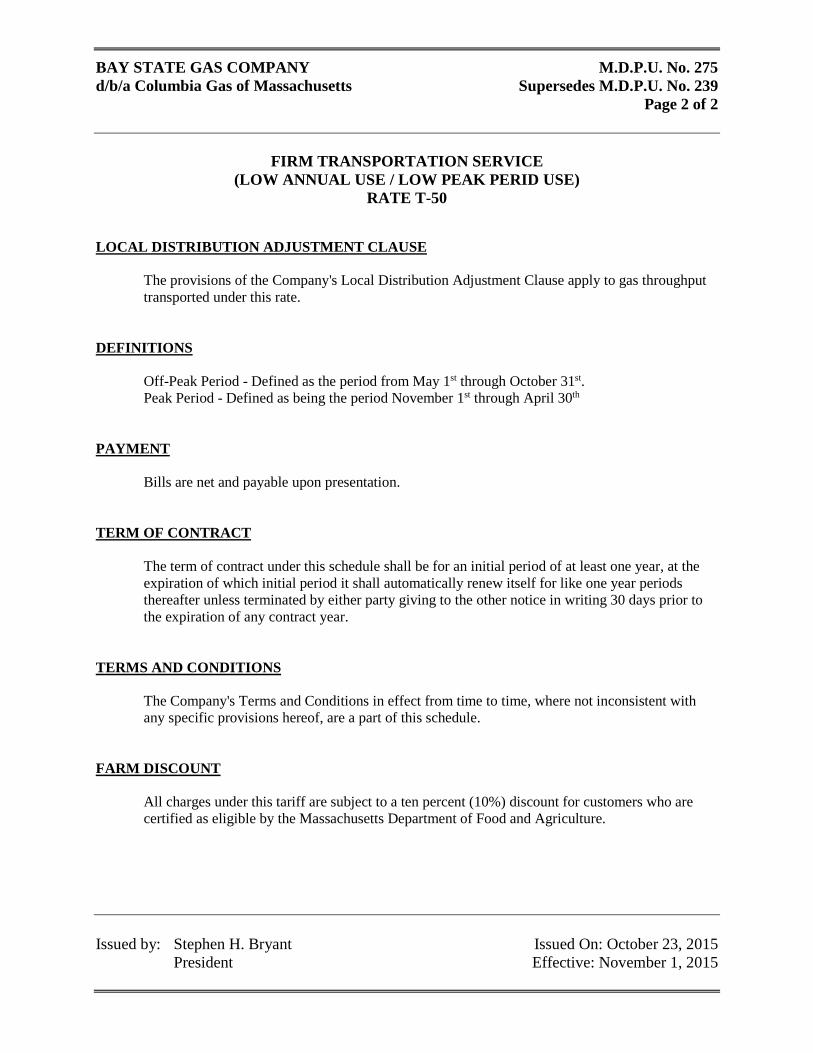
BAY STATE GAS COMPANY M.D.P.U. No. 275 d/b/a Columbia Gas of Massachusetts Supersedes M.D.P.U. No. 239
Page 2 of 2
FIRM TRANSPORTATION SERVICE
(LOW ANNUAL USE / LOW PEAK PERID USE) RATE T-50
Issued by: Stephen H. Bryant Issued On: October 23, 2015 President Effective: November 1, 2015
LOCAL DISTRIBUTION ADJUSTMENT CLAUSE
The provisions of the Company's Local Distribution Adjustment Clause apply to gas throughput transported under this rate.
DEFINITIONS
Off-Peak Period - Defined as the period from May 1st through October 31st. Peak Period - Defined as being the period November 1st through April 30th PAYMENT Bills are net and payable upon presentation. TERM OF CONTRACT
The term of contract under this schedule shall be for an initial period of at least one year, at the expiration of which initial period it shall automatically renew itself for like one year periods thereafter unless terminated by either party giving to the other notice in writing 30 days prior to the expiration of any contract year.
TERMS AND CONDITIONS
The Company's Terms and Conditions in effect from time to time, where not inconsistent with any specific provisions hereof, are a part of this schedule.
FARM DISCOUNT
All charges under this tariff are subject to a ten percent (10%) discount for customers who are certified as eligible by the Massachusetts Department of Food and Agriculture.
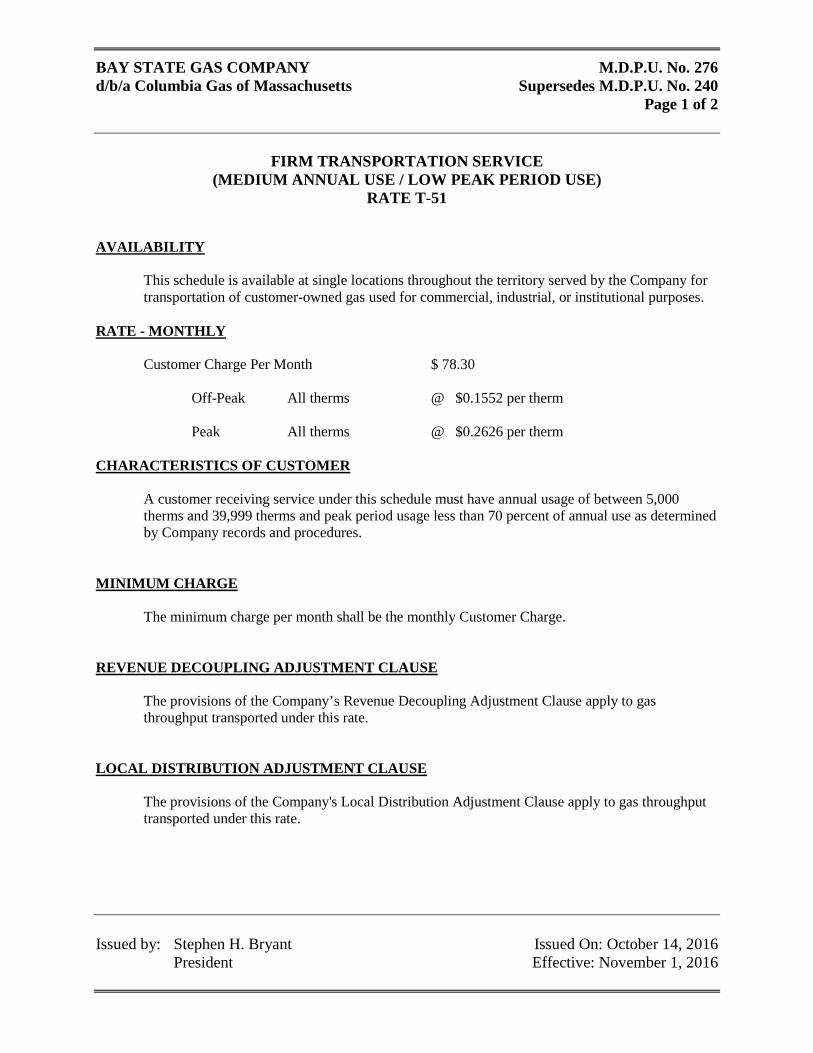
BAY STATE GAS COMPANY M.D.P.U. No. 276 d/b/a Columbia Gas of Massachusetts Supersedes M.D.P.U. No. 240
Page 1 of 2
FIRM TRANSPORTATION SERVICE
(MEDIUM ANNUAL USE / LOW PEAK PERIOD USE) RATE T-51
Issued by: Stephen H. Bryant Issued On: October 14, 2016 President Effective: November 1, 2016
AVAILABILITY
This schedule is available at single locations throughout the territory served by the Company for transportation of customer-owned gas used for commercial, industrial, or institutional purposes.
RATE - MONTHLY Customer Charge Per Month $ 78.30 Off-Peak All therms @ $0.1552 per therm Peak All therms @ $0.2626 per therm CHARACTERISTICS OF CUSTOMER
A customer receiving service under this schedule must have annual usage of between 5,000 therms and 39,999 therms and peak period usage less than 70 percent of annual use as determined by Company records and procedures.
MINIMUM CHARGE
The minimum charge per month shall be the monthly Customer Charge.
REVENUE DECOUPLING ADJUSTMENT CLAUSE
The provisions of the Company’s Revenue Decoupling Adjustment Clause apply to gas throughput transported under this rate.
LOCAL DISTRIBUTION ADJUSTMENT CLAUSE
The provisions of the Company's Local Distribution Adjustment Clause apply to gas throughput transported under this rate.
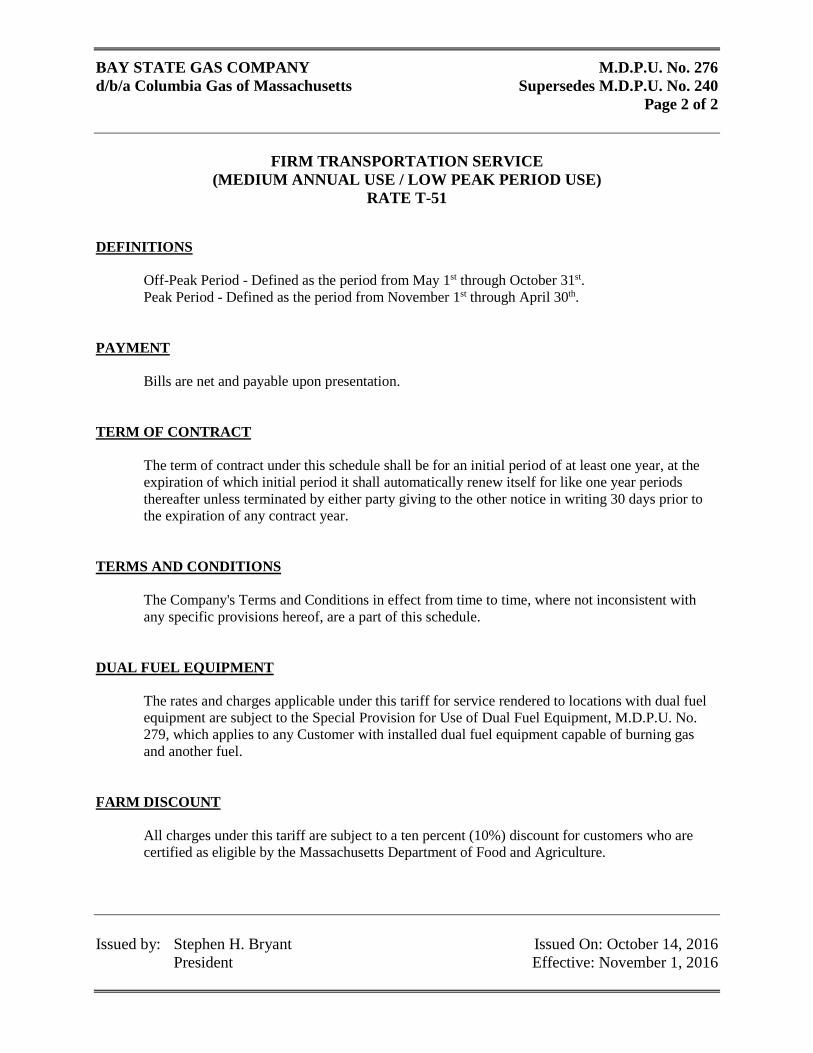
BAY STATE GAS COMPANY M.D.P.U. No. 276 d/b/a Columbia Gas of Massachusetts Supersedes M.D.P.U. No. 240
Page 2 of 2
FIRM TRANSPORTATION SERVICE
(MEDIUM ANNUAL USE / LOW PEAK PERIOD USE) RATE T-51
Issued by: Stephen H. Bryant Issued On: October 14, 2016 President Effective: November 1, 2016
DEFINITIONS
Off-Peak Period - Defined as the period from May 1st through October 31st. Peak Period - Defined as the period from November 1st through April 30th.
PAYMENT Bills are net and payable upon presentation. TERM OF CONTRACT
The term of contract under this schedule shall be for an initial period of at least one year, at the expiration of which initial period it shall automatically renew itself for like one year periods thereafter unless terminated by either party giving to the other notice in writing 30 days prior to the expiration of any contract year.
TERMS AND CONDITIONS
The Company's Terms and Conditions in effect from time to time, where not inconsistent with any specific provisions hereof, are a part of this schedule.
DUAL FUEL EQUIPMENT
The rates and charges applicable under this tariff for service rendered to locations with dual fuel equipment are subject to the Special Provision for Use of Dual Fuel Equipment, M.D.P.U. No. 279, which applies to any Customer with installed dual fuel equipment capable of burning gas and another fuel.
FARM DISCOUNT
All charges under this tariff are subject to a ten percent (10%) discount for customers who are certified as eligible by the Massachusetts Department of Food and Agriculture.
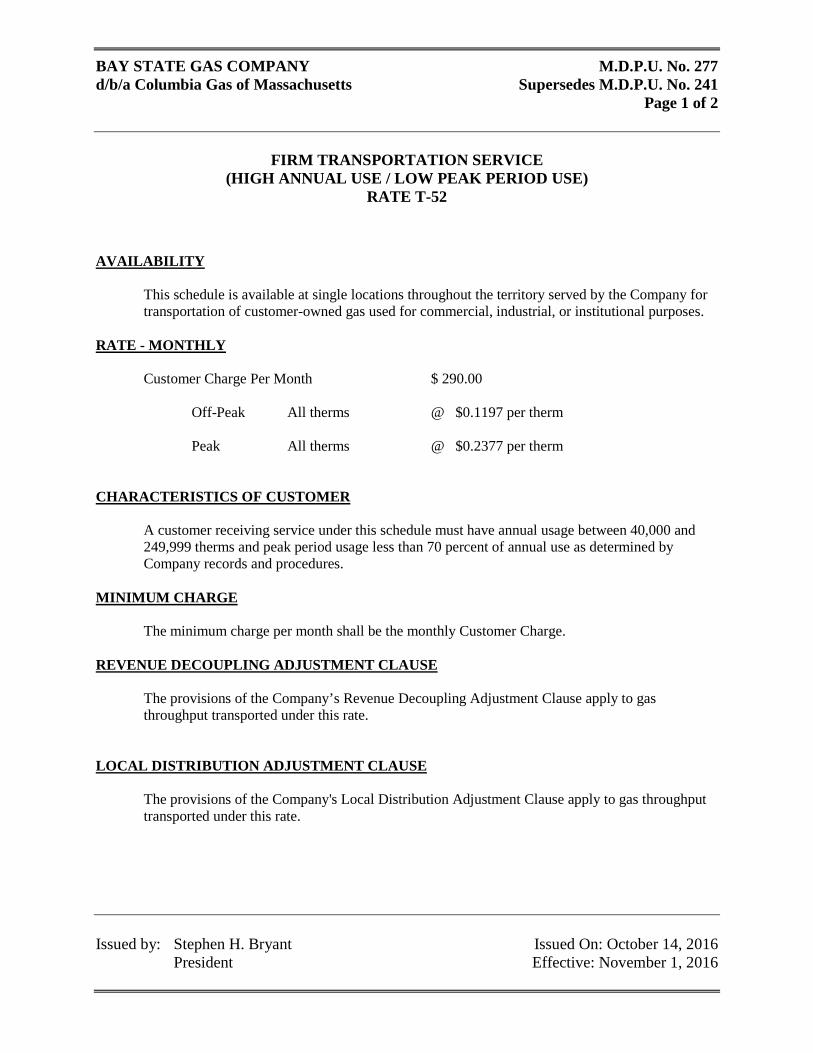
BAY STATE GAS COMPANY M.D.P.U. No. 277 d/b/a Columbia Gas of Massachusetts Supersedes M.D.P.U. No. 241
Page 1 of 2
FIRM TRANSPORTATION SERVICE
(HIGH ANNUAL USE / LOW PEAK PERIOD USE) RATE T-52
Issued by: Stephen H. Bryant Issued On: October 14, 2016 President Effective: November 1, 2016
AVAILABILITY
This schedule is available at single locations throughout the territory served by the Company for transportation of customer-owned gas used for commercial, industrial, or institutional purposes.
RATE - MONTHLY Customer Charge Per Month $ 290.00 Off-Peak All therms @ $0.1197 per therm Peak All therms @ $0.2377 per therm CHARACTERISTICS OF CUSTOMER
A customer receiving service under this schedule must have annual usage between 40,000 and 249,999 therms and peak period usage less than 70 percent of annual use as determined by Company records and procedures.
MINIMUM CHARGE
The minimum charge per month shall be the monthly Customer Charge. REVENUE DECOUPLING ADJUSTMENT CLAUSE
The provisions of the Company’s Revenue Decoupling Adjustment Clause apply to gas throughput transported under this rate.
LOCAL DISTRIBUTION ADJUSTMENT CLAUSE
The provisions of the Company's Local Distribution Adjustment Clause apply to gas throughput transported under this rate.
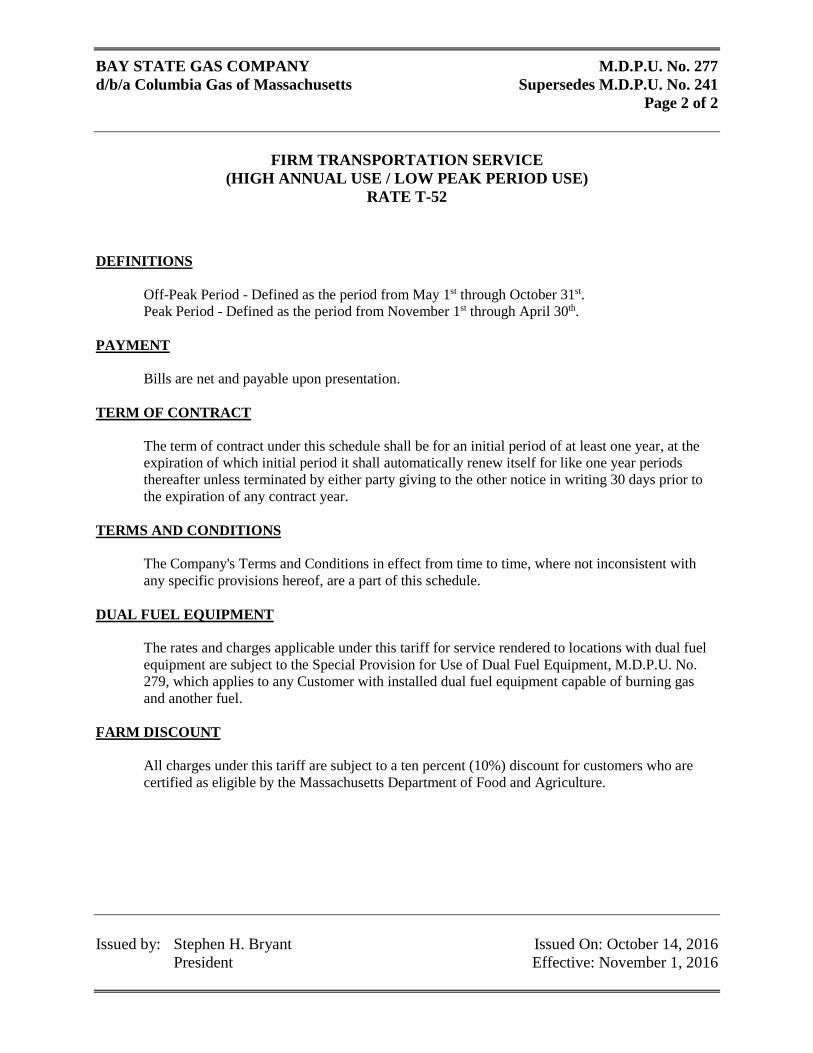
BAY STATE GAS COMPANY M.D.P.U. No. 277 d/b/a Columbia Gas of Massachusetts Supersedes M.D.P.U. No. 241
Page 2 of 2
FIRM TRANSPORTATION SERVICE
(HIGH ANNUAL USE / LOW PEAK PERIOD USE) RATE T-52
Issued by: Stephen H. Bryant Issued On: October 14, 2016 President Effective: November 1, 2016
DEFINITIONS
Off-Peak Period - Defined as the period from May 1st through October 31st. Peak Period - Defined as the period from November 1st through April 30th.
PAYMENT Bills are net and payable upon presentation. TERM OF CONTRACT
The term of contract under this schedule shall be for an initial period of at least one year, at the expiration of which initial period it shall automatically renew itself for like one year periods thereafter unless terminated by either party giving to the other notice in writing 30 days prior to the expiration of any contract year.
TERMS AND CONDITIONS
The Company's Terms and Conditions in effect from time to time, where not inconsistent with any specific provisions hereof, are a part of this schedule.
DUAL FUEL EQUIPMENT
The rates and charges applicable under this tariff for service rendered to locations with dual fuel equipment are subject to the Special Provision for Use of Dual Fuel Equipment, M.D.P.U. No. 279, which applies to any Customer with installed dual fuel equipment capable of burning gas and another fuel.
FARM DISCOUNT
All charges under this tariff are subject to a ten percent (10%) discount for customers who are certified as eligible by the Massachusetts Department of Food and Agriculture.
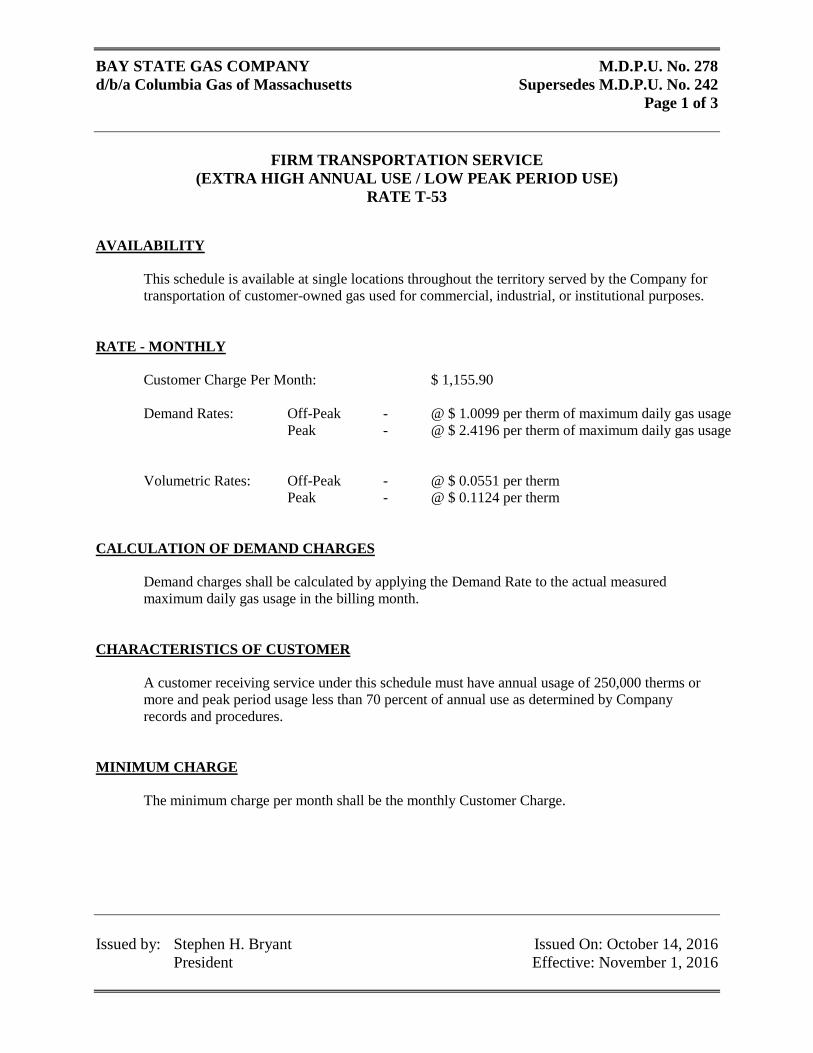
BAY STATE GAS COMPANY M.D.P.U. No. 278 d/b/a Columbia Gas of Massachusetts Supersedes M.D.P.U. No. 242
Page 1 of 3
FIRM TRANSPORTATION SERVICE
(EXTRA HIGH ANNUAL USE / LOW PEAK PERIOD USE) RATE T-53
Issued by: Stephen H. Bryant Issued On: October 14, 2016 President Effective: November 1, 2016
AVAILABILITY
This schedule is available at single locations throughout the territory served by the Company for transportation of customer-owned gas used for commercial, industrial, or institutional purposes.
RATE - MONTHLY Customer Charge Per Month: $ 1,155.90 Demand Rates: Off-Peak - @ $ 1.0099 per therm of maximum daily gas usage Peak - @ $ 2.4196 per therm of maximum daily gas usage Volumetric Rates: Off-Peak - @ $ 0.0551 per therm Peak - @ $ 0.1124 per therm CALCULATION OF DEMAND CHARGES
Demand charges shall be calculated by applying the Demand Rate to the actual measured maximum daily gas usage in the billing month.
CHARACTERISTICS OF CUSTOMER
A customer receiving service under this schedule must have annual usage of 250,000 therms or more and peak period usage less than 70 percent of annual use as determined by Company records and procedures.
MINIMUM CHARGE
The minimum charge per month shall be the monthly Customer Charge.
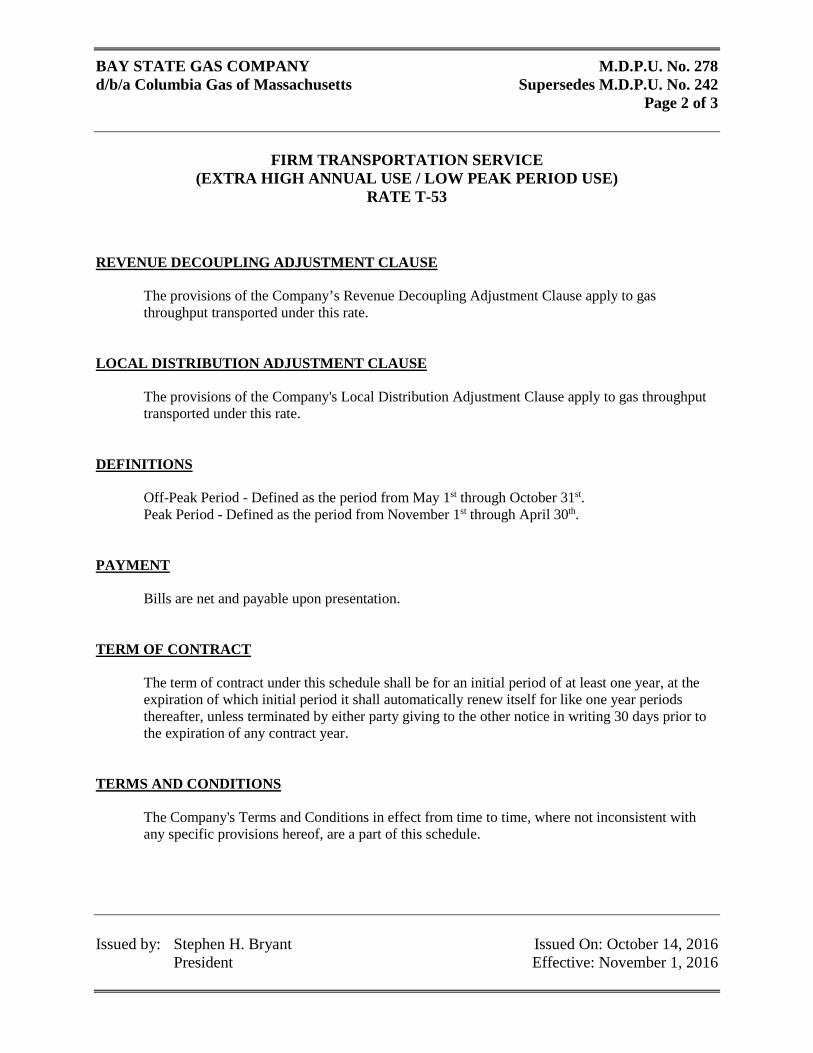
BAY STATE GAS COMPANY M.D.P.U. No. 278 d/b/a Columbia Gas of Massachusetts Supersedes M.D.P.U. No. 242
Page 2 of 3
FIRM TRANSPORTATION SERVICE
(EXTRA HIGH ANNUAL USE / LOW PEAK PERIOD USE) RATE T-53
Issued by: Stephen H. Bryant Issued On: October 14, 2016 President Effective: November 1, 2016
REVENUE DECOUPLING ADJUSTMENT CLAUSE
The provisions of the Company’s Revenue Decoupling Adjustment Clause apply to gas throughput transported under this rate.
LOCAL DISTRIBUTION ADJUSTMENT CLAUSE
The provisions of the Company's Local Distribution Adjustment Clause apply to gas throughput transported under this rate.
DEFINITIONS
Off-Peak Period - Defined as the period from May 1st through October 31st. Peak Period - Defined as the period from November 1st through April 30th.
PAYMENT Bills are net and payable upon presentation. TERM OF CONTRACT
The term of contract under this schedule shall be for an initial period of at least one year, at the expiration of which initial period it shall automatically renew itself for like one year periods thereafter, unless terminated by either party giving to the other notice in writing 30 days prior to the expiration of any contract year.
TERMS AND CONDITIONS
The Company's Terms and Conditions in effect from time to time, where not inconsistent with any specific provisions hereof, are a part of this schedule.
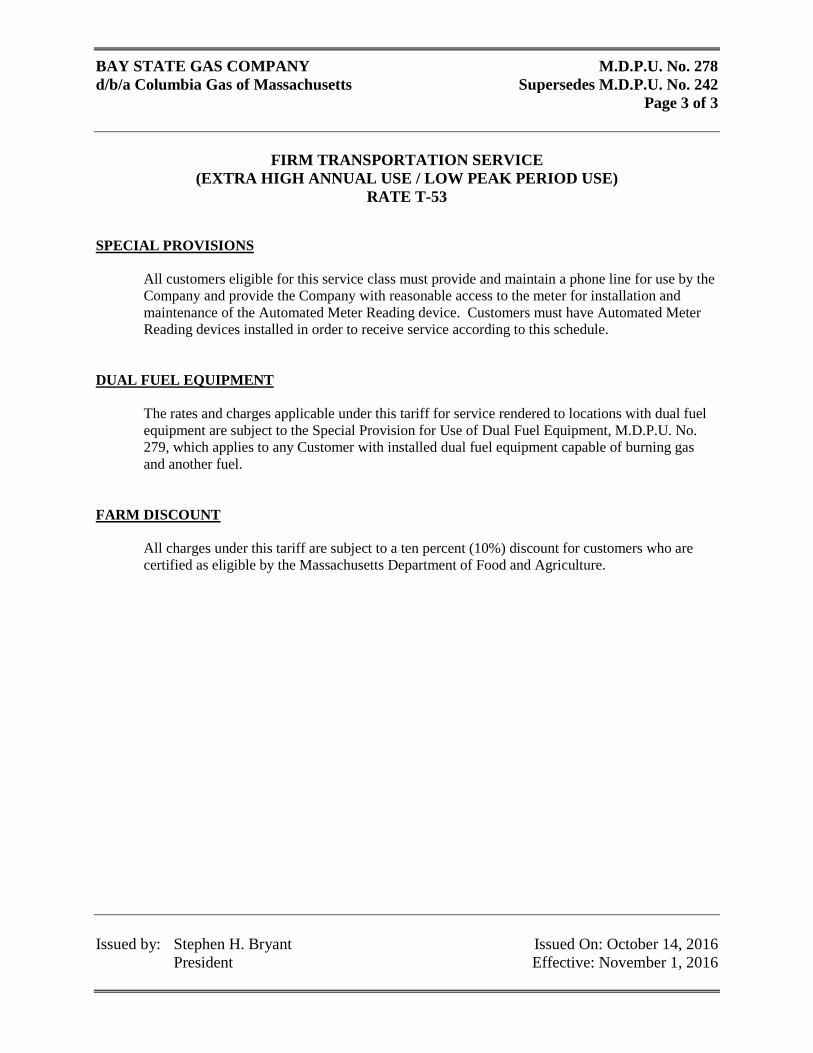
BAY STATE GAS COMPANY M.D.P.U. No. 278 d/b/a Columbia Gas of Massachusetts Supersedes M.D.P.U. No. 242
Page 3 of 3
FIRM TRANSPORTATION SERVICE
(EXTRA HIGH ANNUAL USE / LOW PEAK PERIOD USE) RATE T-53
Issued by: Stephen H. Bryant Issued On: October 14, 2016 President Effective: November 1, 2016
SPECIAL PROVISIONS
All customers eligible for this service class must provide and maintain a phone line for use by the Company and provide the Company with reasonable access to the meter for installation and maintenance of the Automated Meter Reading device. Customers must have Automated Meter Reading devices installed in order to receive service according to this schedule.
DUAL FUEL EQUIPMENT
The rates and charges applicable under this tariff for service rendered to locations with dual fuel equipment are subject to the Special Provision for Use of Dual Fuel Equipment, M.D.P.U. No. 279, which applies to any Customer with installed dual fuel equipment capable of burning gas and another fuel.
FARM DISCOUNT
All charges under this tariff are subject to a ten percent (10%) discount for customers who are certified as eligible by the Massachusetts Department of Food and Agriculture.
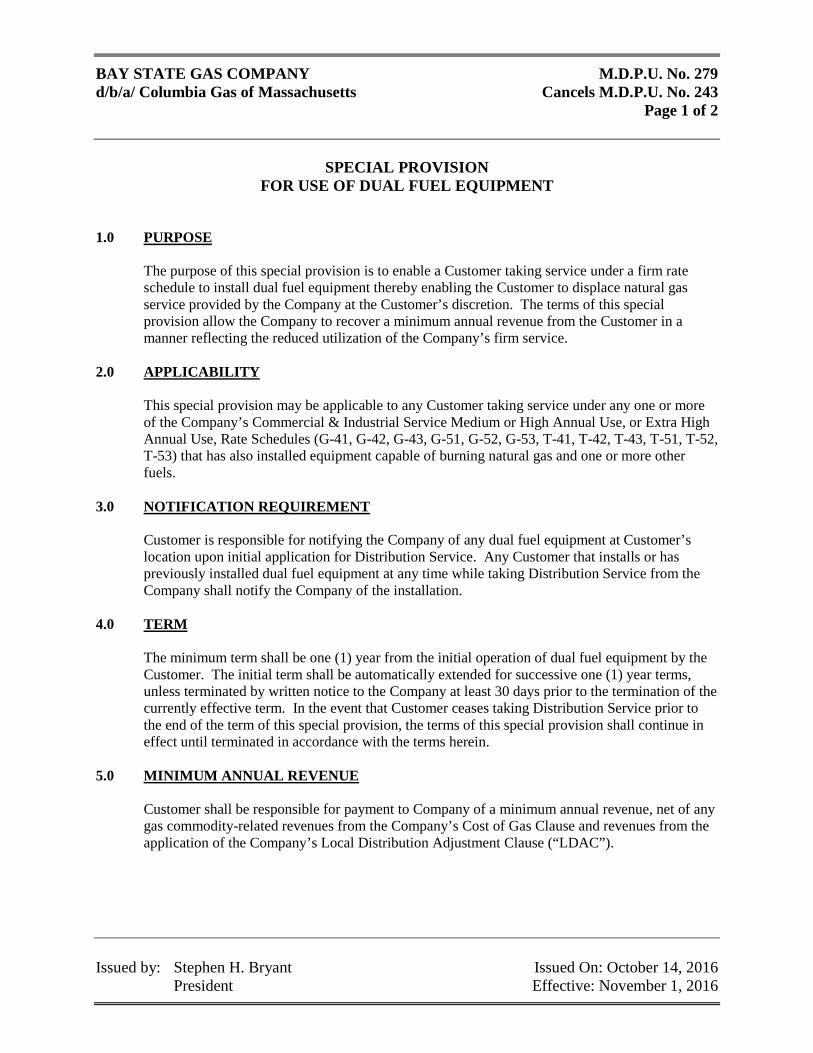
BAY STATE GAS COMPANY M.D.P.U. No. 279 d/b/a/ Columbia Gas of Massachusetts Cancels M.D.P.U. No. 243 Page 1 of 2
SPECIAL PROVISION FOR USE OF DUAL FUEL EQUIPMENT
Issued by: Stephen H. Bryant Issued On: October 14, 2016 President Effective: November 1, 2016
1.0 PURPOSE
The purpose of this special provision is to enable a Customer taking service under a firm rate schedule to install dual fuel equipment thereby enabling the Customer to displace natural gas service provided by the Company at the Customer’s discretion. The terms of this special provision allow the Company to recover a minimum annual revenue from the Customer in a manner reflecting the reduced utilization of the Company’s firm service.
2.0 APPLICABILITY
This special provision may be applicable to any Customer taking service under any one or more of the Company’s Commercial & Industrial Service Medium or High Annual Use, or Extra High Annual Use, Rate Schedules (G-41, G-42, G-43, G-51, G-52, G-53, T-41, T-42, T-43, T-51, T-52, T-53) that has also installed equipment capable of burning natural gas and one or more other fuels.
3.0 NOTIFICATION REQUIREMENT
Customer is responsible for notifying the Company of any dual fuel equipment at Customer’s location upon initial application for Distribution Service. Any Customer that installs or has previously installed dual fuel equipment at any time while taking Distribution Service from the Company shall notify the Company of the installation.
4.0 TERM
The minimum term shall be one (1) year from the initial operation of dual fuel equipment by the Customer. The initial term shall be automatically extended for successive one (1) year terms, unless terminated by written notice to the Company at least 30 days prior to the termination of the currently effective term. In the event that Customer ceases taking Distribution Service prior to the end of the term of this special provision, the terms of this special provision shall continue in effect until terminated in accordance with the terms herein.
5.0 MINIMUM ANNUAL REVENUE Customer shall be responsible for payment to Company of a minimum annual revenue, net of any
gas commodity-related revenues from the Company’s Cost of Gas Clause and revenues from the application of the Company’s Local Distribution Adjustment Clause (“LDAC”).
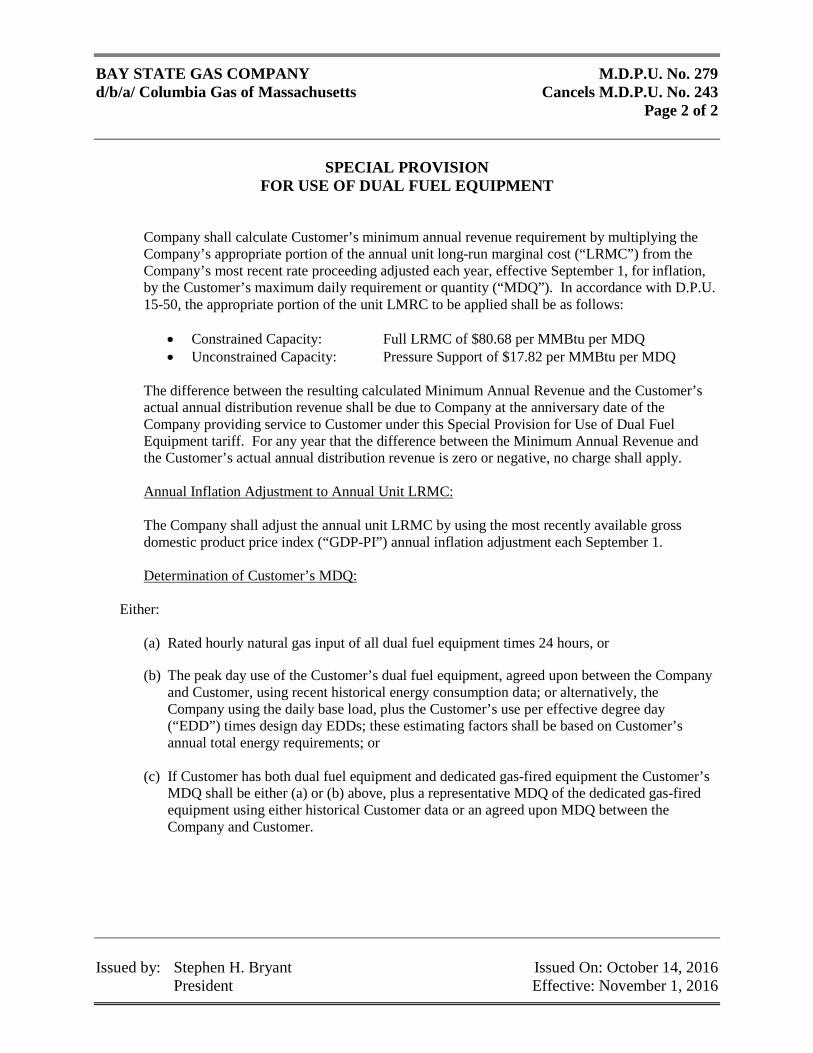
BAY STATE GAS COMPANY M.D.P.U. No. 279 d/b/a/ Columbia Gas of Massachusetts Cancels M.D.P.U. No. 243 Page 2 of 2
SPECIAL PROVISION FOR USE OF DUAL FUEL EQUIPMENT
Issued by: Stephen H. Bryant Issued On: October 14, 2016 President Effective: November 1, 2016
Company shall calculate Customer’s minimum annual revenue requirement by multiplying the Company’s appropriate portion of the annual unit long-run marginal cost (“LRMC”) from the Company’s most recent rate proceeding adjusted each year, effective September 1, for inflation, by the Customer’s maximum daily requirement or quantity (“MDQ”). In accordance with D.P.U. 15-50, the appropriate portion of the unit LMRC to be applied shall be as follows:
• Constrained Capacity: Full LRMC of $80.68 per MMBtu per MDQ • Unconstrained Capacity: Pressure Support of $17.82 per MMBtu per MDQ
The difference between the resulting calculated Minimum Annual Revenue and the Customer’s actual annual distribution revenue shall be due to Company at the anniversary date of the Company providing service to Customer under this Special Provision for Use of Dual Fuel Equipment tariff. For any year that the difference between the Minimum Annual Revenue and the Customer’s actual annual distribution revenue is zero or negative, no charge shall apply.
Annual Inflation Adjustment to Annual Unit LRMC: The Company shall adjust the annual unit LRMC by using the most recently available gross
domestic product price index (“GDP-PI”) annual inflation adjustment each September 1. Determination of Customer’s MDQ:
Either: (a) Rated hourly natural gas input of all dual fuel equipment times 24 hours, or (b) The peak day use of the Customer’s dual fuel equipment, agreed upon between the Company
and Customer, using recent historical energy consumption data; or alternatively, the Company using the daily base load, plus the Customer’s use per effective degree day (“EDD”) times design day EDDs; these estimating factors shall be based on Customer’s annual total energy requirements; or
(c) If Customer has both dual fuel equipment and dedicated gas-fired equipment the Customer’s
MDQ shall be either (a) or (b) above, plus a representative MDQ of the dedicated gas-fired equipment using either historical Customer data or an agreed upon MDQ between the Company and Customer.
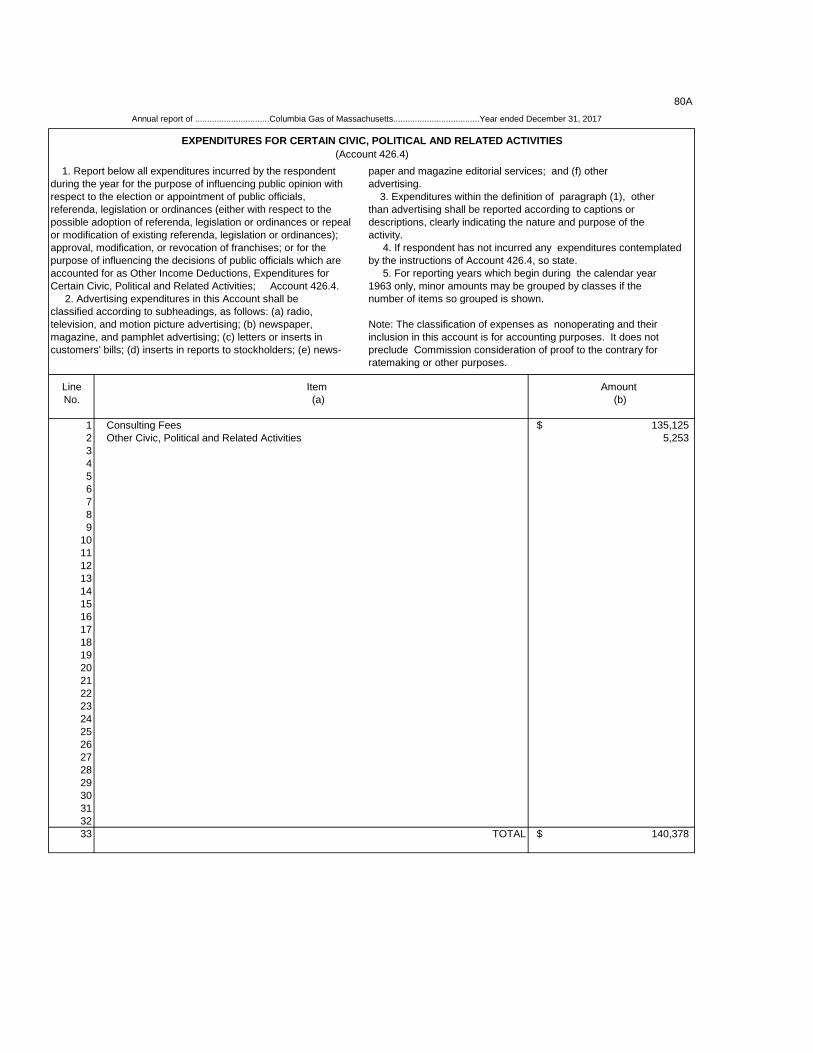
80A Annual report of ...............................Columbia Gas of Massachusetts....................................Year ended December 31, 2017
EXPENDITURES FOR CERTAIN CIVIC, POLITICAL AND RELATED ACTIVITIES(Account 426.4)
1. Report below all expenditures incurred by the respondent paper and magazine editorial services; and (f) otherduring the year for the purpose of influencing public opinion with advertising.respect to the election or appointment of public officials, 3. Expenditures within the definition of paragraph (1), otherreferenda, legislation or ordinances (either with respect to the than advertising shall be reported according to captions orpossible adoption of referenda, legislation or ordinances or repeal descriptions, clearly indicating the nature and purpose of theor modification of existing referenda, legislation or ordinances); activity.approval, modification, or revocation of franchises; or for the 4. If respondent has not incurred any expenditures contemplatedpurpose of influencing the decisions of public officials which are by the instructions of Account 426.4, so state.accounted for as Other Income Deductions, Expenditures for 5. For reporting years which begin during the calendar yearCertain Civic, Political and Related Activities; Account 426.4. 1963 only, minor amounts may be grouped by classes if the 2. Advertising expenditures in this Account shall be number of items so grouped is shown.classified according to subheadings, as follows: (a) radio,television, and motion picture advertising; (b) newspaper, Note: The classification of expenses as nonoperating and theirmagazine, and pamphlet advertising; (c) letters or inserts in inclusion in this account is for accounting purposes. It does notcustomers' bills; (d) inserts in reports to stockholders; (e) news- preclude Commission consideration of proof to the contrary for
ratemaking or other purposes.
Line Item Amount No. (a) (b)
1 Consulting Fees $ 135,1252 Other Civic, Political and Related Activities 5,2533456789
101112131415161718192021222324252627282930313233 TOTAL $ 140,378
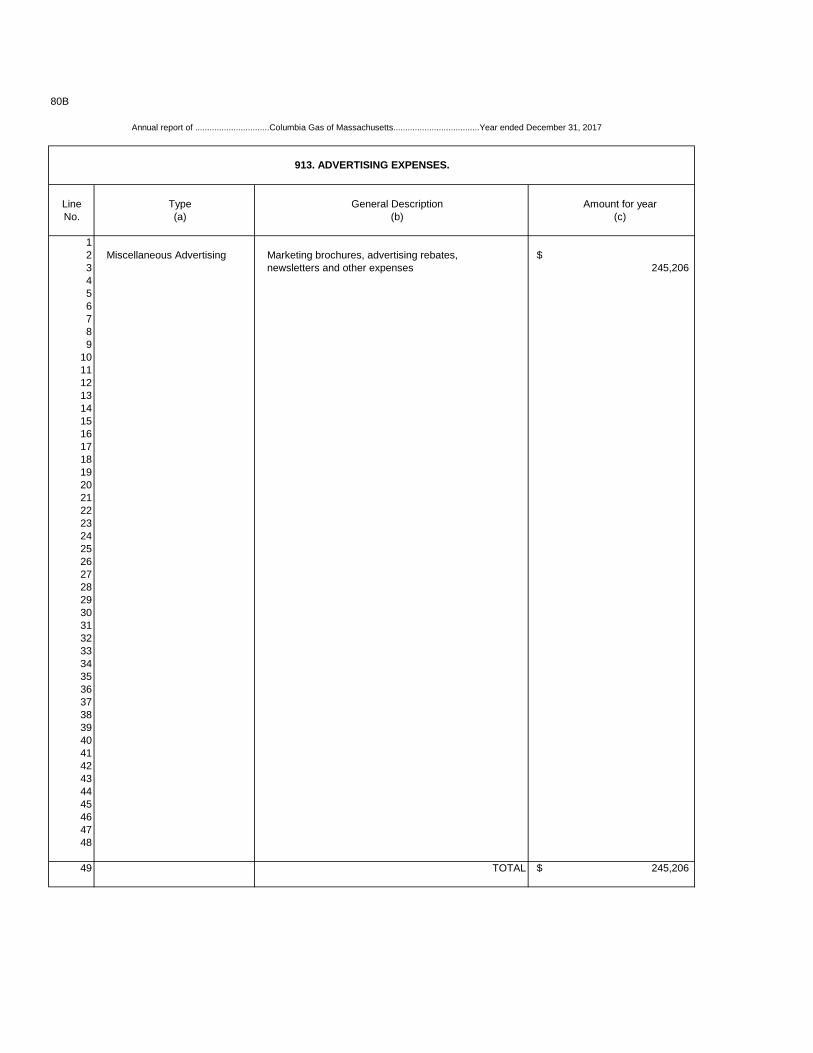
80B
Annual report of ...............................Columbia Gas of Massachusetts....................................Year ended December 31, 2017
913. ADVERTISING EXPENSES.
Line Type General Description Amount for yearNo. (a) (b) (c)
12 Miscellaneous Advertising Marketing brochures, advertising rebates, $3 newsletters and other expenses 245,206456789
1011121314 1516 17 18 19 2021222324252627282930313233343536373839404142434445464748
49 TOTAL $ 245,206
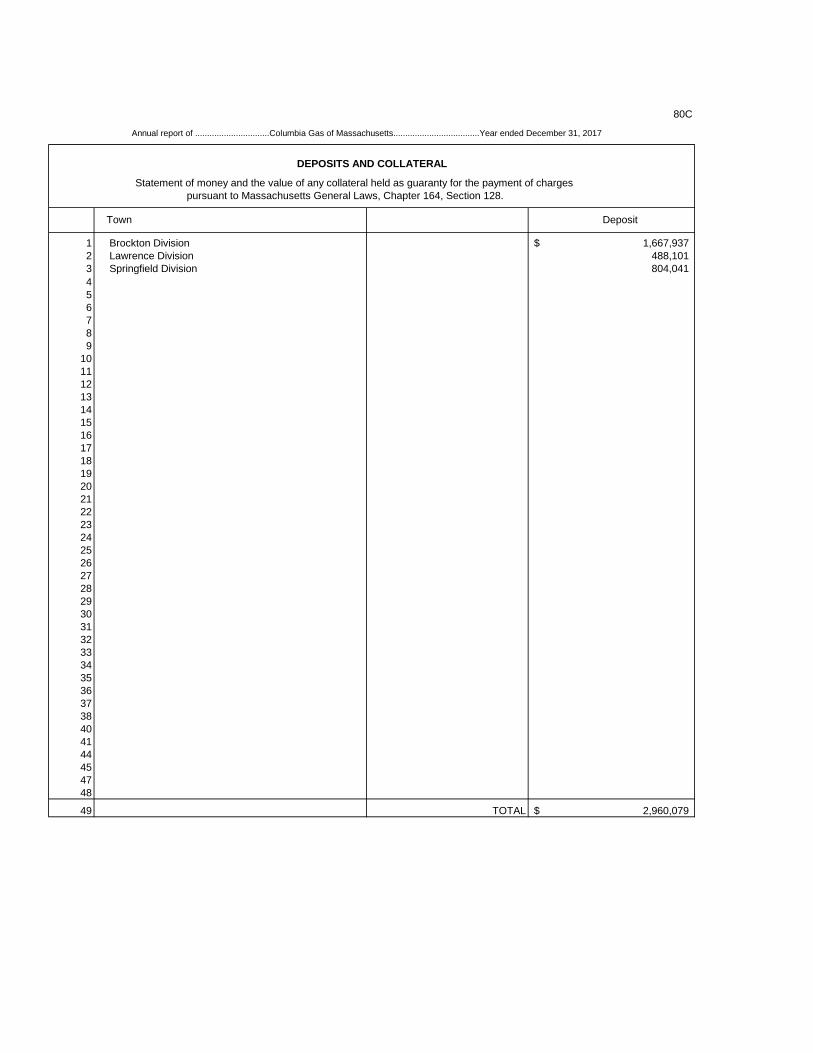
80C
Annual report of ...............................Columbia Gas of Massachusetts....................................Year ended December 31, 2017
DEPOSITS AND COLLATERAL
Statement of money and the value of any collateral held as guaranty for the payment of charges pursuant to Massachusetts General Laws, Chapter 164, Section 128.
Town Deposit
1 Brockton Division $ 1,667,9372 Lawrence Division 488,1013 Springfield Division 804,04145 6 7 89
1011121314151617181920212223242526272829303132333435363738404144454748
49 TOTAL $ 2,960,079
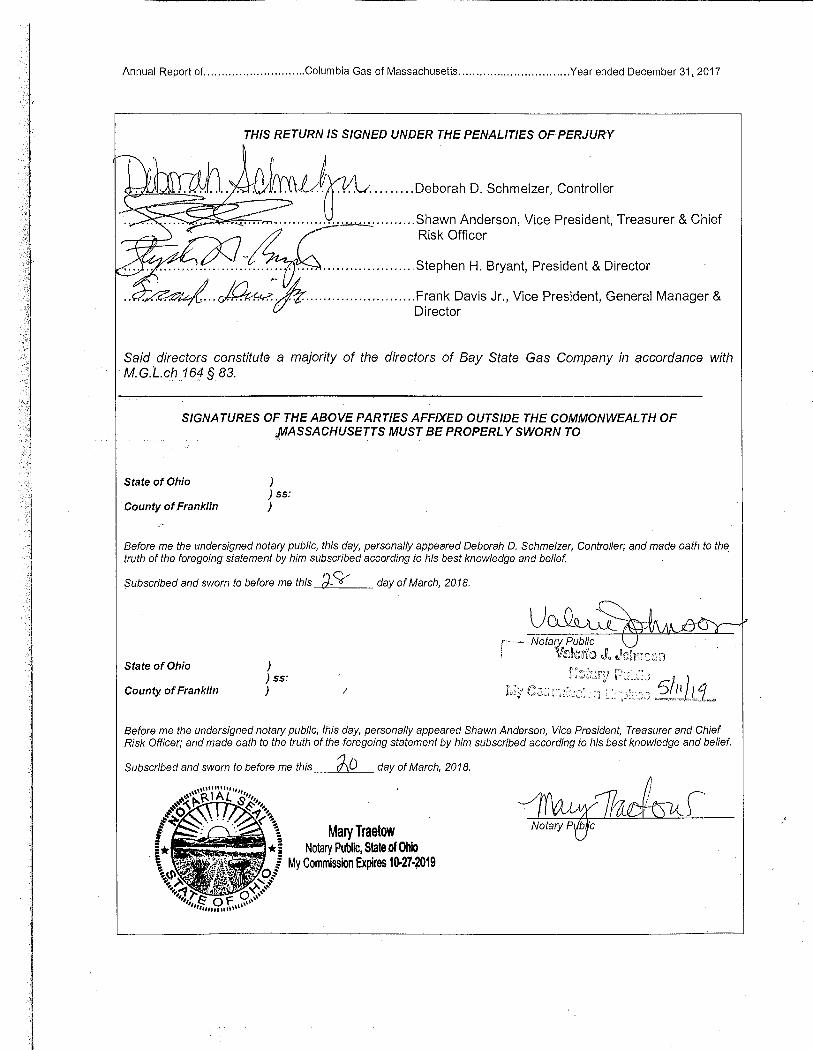
Annual Report of ............................. Columbia Gas of Massachusetts ............... , ................ Year ended December 31, 2017
THIS RETURN IS SIGNED UNDER THE PENAL/TIES OF PERJURY
~::::=:~~g;~t-s·-· _· -::6:::.=>~+- ........ Deborah D. Schmelzer, Controller
~~~~.-,.-; .. -,., .. -,.., .. ~, ............................... Shawn Anderson, Vice President, Treasurer & Chief Risk Officer
......................................................... Stephen H. Bryant, President & Director
..... ~-1?J. .. A.;: ~ ......................... Frank Davis Jr., Vice President, General Manager & cJ" ;t,. Director
Said directors constitute a majority of the directors of Bay State Gas Company in accordance with M.G.L.ch 164 § 83.
SIGNATURES OF THE ABOVE PARTIES AFFIXED OUTSIDE THE COMMONWEALTH OF FfASSACHUSETTS MUST BE PROPERLY SWORN TO
State of Ohio ) ) ss:
County of Franklin )
Before me the undersigned notary public, this day, personally appeared Deborah D. Schmelzer, Contro!ler; and made oath to the truth of the foregoing statement by him subscribed according to his best knowledge and belief. ·
Subscribed and sworn to before me this d-V day of March, 2018.
State of Ohio
County of Franklin
) ) ss: ) I
Before me the undersigned notary public, this day, personally appeared Shawn Anderson, Vice President, Treasurer and Chief Risk Officer; and made oath to the truth of the foregoing statement by him subscribed according to his best knowledge and belief.
,70 Subscribed and sworn to before me this _~!l:'i~- day of March, 2018.
Mary Traetow
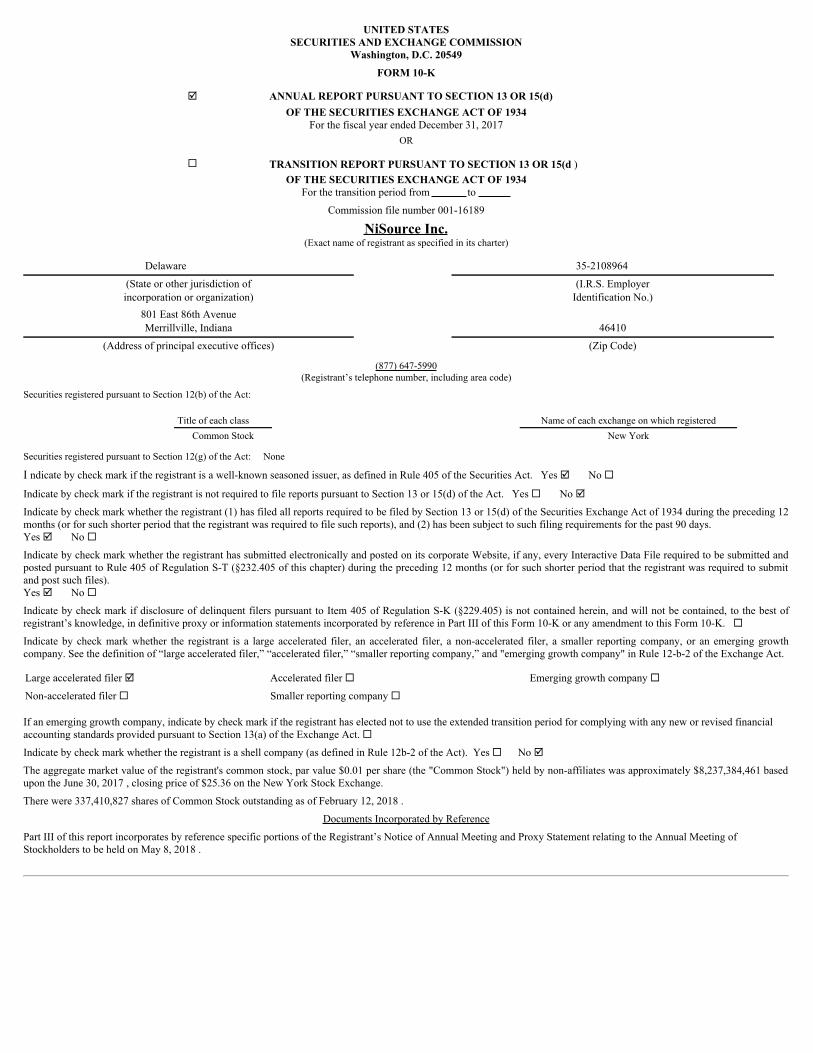
UNITED STATESSECURITIES AND EXCHANGE COMMISSION
Washington, D.C. 20549
FORM 10-K
þ ANNUAL REPORT PURSUANT TO SECTION 13 OR 15(d) OF THE SECURITIES EXCHANGE ACT OF 1934
For the fiscal year ended December 31, 2017OR
¨ TRANSITION REPORT PURSUANT TO SECTION 13 OR 15(d ) OF THE SECURITIES EXCHANGE ACT OF 1934
For the transition period from to
Commission file number 001-16189
NiSource Inc.(Exact name of registrant as specified in its charter)
Delaware 35-2108964
(State or other jurisdiction ofincorporation or organization)
(I.R.S. EmployerIdentification No.)
801 East 86th AvenueMerrillville, Indiana 46410
(Address of principal executive offices) (Zip Code)
(877) 647-5990(Registrant’s telephone number, including area code)
Securities registered pursuant to Section 12(b) of the Act:
Title of each class Name of each exchange on which registered Common Stock New York
Securities registered pursuant to Section 12(g) of the Act: None
I ndicate by check mark if the registrant is a well-known seasoned issuer, as defined in Rule 405 of the Securities Act. Yes þ No ¨
Indicate by check mark if the registrant is not required to file reports pursuant to Section 13 or 15(d) of the Act. Yes ¨ No þ
Indicate by check mark whether the registrant (1) has filed all reports required to be filed by Section 13 or 15(d) of the Securities Exchange Act of 1934 during the preceding 12months (or for such shorter period that the registrant was required to file such reports), and (2) has been subject to such filing requirements for the past 90 days.Yes þ No ¨
Indicate by check mark whether the registrant has submitted electronically and posted on its corporate Website, if any, every Interactive Data File required to be submitted andposted pursuant to Rule 405 of Regulation S-T (§232.405 of this chapter) during the preceding 12 months (or for such shorter period that the registrant was required to submitand post such files).Yes þ No ¨
Indicate by check mark if disclosure of delinquent filers pursuant to Item 405 of Regulation S-K (§229.405) is not contained herein, and will not be contained, to the best ofregistrant’s knowledge, in definitive proxy or information statements incorporated by reference in Part III of this Form 10-K or any amendment to this Form 10-K. ¨
Indicate by check mark whether the registrant is a large accelerated filer, an accelerated filer, a non-accelerated filer, a smaller reporting company, or an emerging growthcompany. See the definition of “large accelerated filer,” “accelerated filer,” “smaller reporting company,” and "emerging growth company" in Rule 12-b-2 of the Exchange Act.
Large accelerated filer þ Accelerated filer ¨ Emerging growth company ¨
Non-accelerated filer ¨ Smaller reporting company ¨
If an emerging growth company, indicate by check mark if the registrant has elected not to use the extended transition period for complying with any new or revised financialaccounting standards provided pursuant to Section 13(a) of the Exchange Act. ¨
Indicate by check mark whether the registrant is a shell company (as defined in Rule 12b-2 of the Act). Yes ¨ No þ
The aggregate market value of the registrant's common stock, par value $0.01 per share (the "Common Stock") held by non-affiliates was approximately $8,237,384,461 basedupon the June 30, 2017 , closing price of $25.36 on the New York Stock Exchange.
There were 337,410,827 shares of Common Stock outstanding as of February 12, 2018 .
Documents Incorporated by Reference
Part III of this report incorporates by reference specific portions of the Registrant’s Notice of Annual Meeting and Proxy Statement relating to the Annual Meeting ofStockholders to be held on May 8, 2018 .
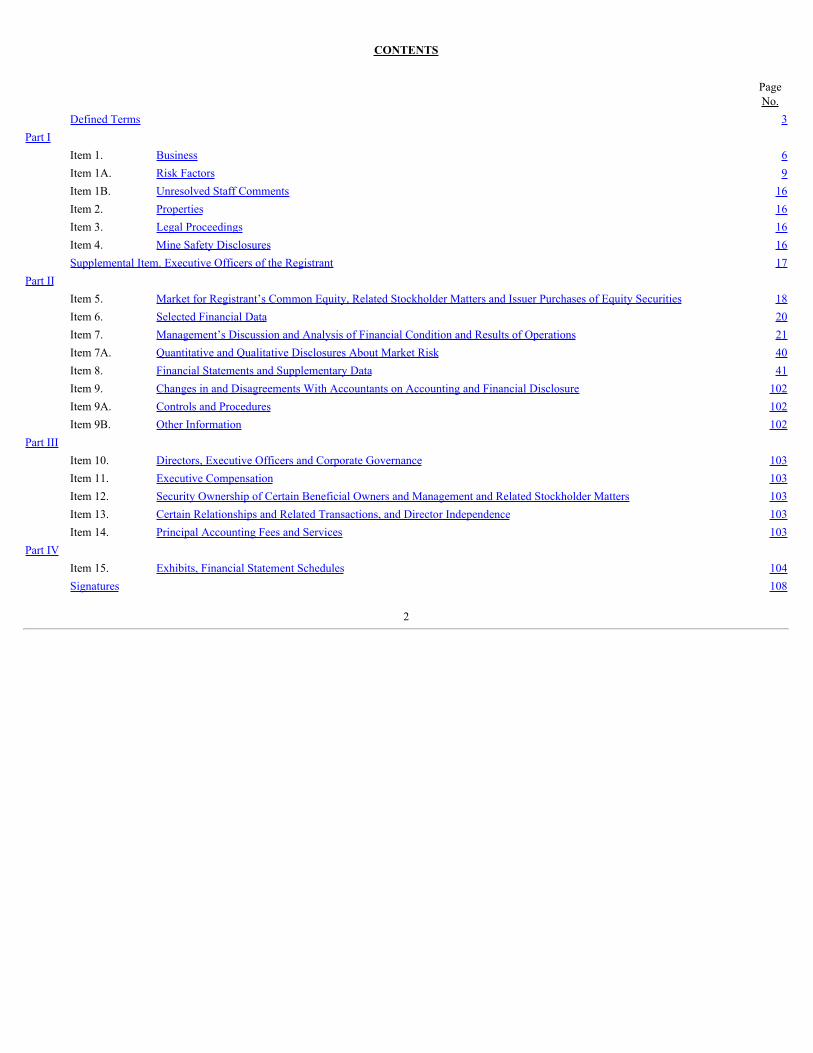
CONTENTS
PageNo.
Defined Terms 3Part I
Item 1. Business 6Item 1A. Risk Factors 9Item 1B. Unresolved Staff Comments 16Item 2. Properties 16Item 3. Legal Proceedings 16Item 4. Mine Safety Disclosures 16Supplemental Item. Executive Officers of the Registrant 17
Part II Item 5. Market for Registrant’s Common Equity, Related Stockholder Matters and Issuer Purchases of Equity Securities 18Item 6. Selected Financial Data 20Item 7. Management’s Discussion and Analysis of Financial Condition and Results of Operations 21Item 7A. Quantitative and Qualitative Disclosures About Market Risk 40Item 8. Financial Statements and Supplementary Data 41Item 9. Changes in and Disagreements With Accountants on Accounting and Financial Disclosure 102Item 9A. Controls and Procedures 102Item 9B. Other Information 102
Part III Item 10. Directors, Executive Officers and Corporate Governance 103Item 11. Executive Compensation 103Item 12. Security Ownership of Certain Beneficial Owners and Management and Related Stockholder Matters 103Item 13. Certain Relationships and Related Transactions, and Director Independence 103Item 14. Principal Accounting Fees and Services 103
Part IV Item 15. Exhibits, Financial Statement Schedules 104Signatures 108
2
Table of Contents
DEFINED TERMS
The following is a list of abbreviations or acronyms that are used in this report:
NiSource Subsidiaries, Affiliates and Former Subsidiaries Capital Markets NiSource Capital Markets, Inc.Columbia Columbia Energy GroupColumbia of Kentucky Columbia Gas of Kentucky, Inc.Columbia of Maryland Columbia Gas of Maryland, Inc.Columbia of Massachusetts Bay State Gas CompanyColumbia of Ohio Columbia Gas of Ohio, Inc.Columbia of Pennsylvania Columbia Gas of Pennsylvania, Inc.Columbia of Virginia Columbia Gas of Virginia, Inc.Company
NiSource Inc. and its subsidiaries, unless otherwise indicated by the context
CPG Columbia Pipeline Group, Inc.
CPPL Columbia Pipeline Partners LPCPRC Columbia Gas of Pennsylvania Receivables CorporationNIPSCO Northern Indiana Public Service Company LLCNiSource NiSource Inc.NiSource Corporate Services NiSource Corporate Services CompanyNiSource Finance NiSource Finance Corporation
Abbreviations AFUDC Allowance for funds used during constructionAMRP Accelerated Main Replacement ProgramAOCI Accumulated Other Comprehensive IncomeASC Accounting Standards CodificationASU Accounting Standards UpdateATM At-the-marketBoard Board of DirectorsCAA Clean Air ActCCGT Combined Cycle Gas TurbineCCRs Coal Combustion ResidualsCEP Capital Expenditure ProgramCERCLA
Comprehensive Environmental Response Compensation and Liability Act (alsoknown as Superfund)
CO 2 Carbon DioxideColumbia OpCo CPG OpCo LPCPP Clean Power PlanDPU Department of Public UtilitiesDSM Demand Side ManagementECR Environmental Cost RecoveryECT Environmental Cost TrackerEERM Environmental Expense Recovery MechanismEGUs Electric utility steam generating unitELG Effluence limitations guidelines
3
Table of Contents
DEFINED TERMSEPA United States Environmental Protection AgencyEPS Earnings per shareFAC Fuel adjustment clauseFASB Financial Accounting Standards BoardFERC Federal Energy Regulatory CommissionFTRs Financial Transmission RightsGAAP Generally Accepted Accounting PrinciplesGCA Gas cost adjustmentGCR Gas cost recoveryGHG Greenhouse gasesGSEP Gas System Enhancement Programgwh Gigawatt hoursIBM International Business Machines Corp.IPO Initial Public OfferingIRP Infrastructure Replacement ProgramIRS Internal Revenue ServiceIURC Indiana Utility Regulatory CommissionLDCs Local distribution companiesLIFO Last-in, first-outMGP Manufactured Gas PlantMISO Midcontinent Independent System OperatorMizuho Mizuho Corporate Bank Ltd.MMDth Million dekathermsMPSC Maryland Public Service Commissionmw Megawattsmwh Megawatt hoursNAAQS National Ambient Air Quality StandardsNOL Net Operating LossNYMEX The New York Mercantile ExchangeNYSE The New York Stock ExchangeOCC Ohio Consumers' CounselOPEB Other Postretirement and Postemployment BenefitsPATH Protecting Americans from Tax Hikes Act of 2015PCB Polychlorinated biphenylsPHMSA
U.S. Department of Transportation Pipeline and Hazardous Materials SafetyAdministration
PISCC Post-in-service carrying chargesPNC PNC Bank N.A.ppb Parts per billionPSC Public Service CommissionPUC Public Utility CommissionPUCO Public Utilities Commission of OhioRCRA Resource Conservation and Recovery ActRDAF Revenue decoupling adjustment factor
4
Table of Contents
DEFINED TERMSSeparation
The separation of NiSource's natural gas pipeline, midstream and storagebusiness from NiSource's natural gas and electric utility business accomplishedthrough the pro rata distribution by NiSource to holders of its outstandingcommon stock of all the outstanding shares of common stock of CPG. Theseparation was completed on July 1, 2015.
SEC Securities and Exchange CommissionSugar Creek Sugar Creek electric generating plantTCJA Tax Cuts and Jobs Act of 2017TDSIC Transmission, Distribution and Storage System Improvement ChargeTUAs Transmission Upgrade AgreementsVIE Variable Interest EntityVSCC Virginia State Corporation Commission
Noteregardingforward-lookingstatementsThis Annual Report on Form 10-K contains “forward-looking statements,” within the meaning of Section 27A of the Securities Act of 1933, as amended (the"Securities Act"), and Section 21E of the Securities Exchange Act of 1934, as amended (the "Exchange Act"). Investors and prospective investors shouldunderstand that many factors govern whether any forward-looking statement contained herein will be or can be realized. Any one of those factors could causeactual results to differ materially from those projected. These forward-looking statements include, but are not limited to, statements concerning NiSource’s plans,strategies, objectives, expected performance, expenditures, recovery of expenditures through rates, stated on either a consolidated or segment basis, and any and allunderlying assumptions and other statements that are other than statements of historical fact. All forward-looking statements are based on assumptions thatmanagement believes to be reasonable; however, there can be no assurance that actual results will not differ materially.
Factors that could cause actual results to differ materially from the projections, forecasts, estimates and expectations discussed in this Annual Report on Form 10-Kinclude, among other things, NiSource’s debt obligations; any changes to the credit rating of NiSource or certain of its subsidiaries; NiSource’s ability to executeits growth strategy; changes in general economic, capital and commodity market conditions; pension funding obligations; economic regulation and the impact ofregulatory rate reviews; NiSource's ability to obtain expected financial or regulatory outcomes; any damage to NiSource's reputation; compliance withenvironmental laws and the costs of associated liabilities; fluctuations in demand from residential and commercial customers; economic conditions of certainindustries; the success of NIPSCO's electric generation strategy; the price of energy commodities and related transportation costs; the reliability of customers andsuppliers to fulfill their payment and contractual obligations; potential impairments of goodwill or definite-lived intangible assets; changes in taxation andaccounting principles; potential incidents and other operating risks associated with NiSource's business; the impact of an aging infrastructure; the impact of climatechange; potential cyber-attacks; construction risks and natural gas costs and supply risks; extreme weather conditions; the attraction and retention of a qualifiedworkforce; advances in technology; the ability of NiSource's subsidiaries to generate cash; uncertainties related to the expected benefits of the Separation; theability of NiSource to manage new initiatives and organizational changes; the performance of certain third-party suppliers upon which NiSource relies; NiSource'sability to obtain sufficient insurance coverage; and other matters set forth in Item 1A, “Risk Factors” of this report, many of which risks are beyond the control ofNiSource. In addition, the relative contributions to profitability by each business segment, and the assumptions underlying the forward-looking statements relatingthereto, may change over time.
All forward-looking statements are expressly qualified in their entirety by the foregoing cautionary statements. NiSource undertakes no obligation to, and expresslydisclaims any such obligation to, update or revise any forward-looking statements to reflect changed assumptions, the occurrence of anticipated or unanticipatedevents or changes to the future results over time or otherwise, except as required by law.
5
Table of Contents
ITEM 1. BUSINESS
N I S OURCE I NC .
NiSource Inc. is an energy holding company under the Public Utility Holding Company Act of 2005 whose subsidiaries are fully regulated natural gas and electricutility companies serving approximately 3.9 million customers in seven states. NiSource is the successor to an Indiana corporation organized in 1987 under thename of NIPSCO Industries, Inc., which changed its name to NiSource on April 14, 1999.
NiSource is one of the nation’s largest natural gas distribution companies, as measured by number of customers. NiSource’s principal subsidiaries includeNiSource Gas Distribution Group, Inc., a natural gas distribution holding company, and NIPSCO, a gas and electric company. NiSource derives substantially all ofits revenues and earnings from the operating results of these rate-regulated businesses.
On July 1, 2015, NiSource completed the Separation of CPG from NiSource. CPG's operations consisted of all of NiSource's Columbia Pipeline Group Operationssegment prior to the Separation. Following the Separation, NiSource retained no ownership interest in CPG.
NiSource’s reportable segments are: Gas Distribution Operations and Electric Operations. The following is a summary of the business for each reporting segment.Refer to Item 7, “Management’s Discussion and Analysis of Financial Condition and Results of Operations” and Note 22 , "Segments of Business," in the Notes toConsolidated Financial Statements for additional information for each segment.
Gas Distribution OperationsNiSource’s natural gas distribution operations serve approximately 3.5 million customers in seven states and operate approximately 60,000 miles of pipelinelocated in our service areas described below. Through its wholly-owned subsidiary NiSource Gas Distribution Group, Inc., NiSource owns six distributionsubsidiaries that provide natural gas to approximately 2.6 million residential, commercial and industrial customers in Ohio, Pennsylvania, Virginia, Kentucky,Maryland and Massachusetts. Additionally, NiSource also distributes natural gas to approximately 830,000 customers in northern Indiana through its wholly-owned subsidiary NIPSCO.
Electric OperationsNiSource generates, transmits and distributes electricity through its subsidiary NIPSCO to approximately 469,000 customers in 20 counties in the northern part ofIndiana and engages in wholesale and transmission transactions. NIPSCO owns and operates three coal-fired electric generating stations: four units at R.M.Schahfer located in Wheatfield, IN, two units at Bailly located in Chesterton, IN and one unit at Michigan City located in Michigan City, IN. The three operatingfacilities have a net capability of 2,540 mw. NIPSCO also owns and operates Sugar Creek, a CCGT plant located in West Terre Haute, IN with net capability of535 mw, three gas-fired generating units located at NIPSCO’s coal-fired electric generating stations with a net capability of 196 mw and two hydroelectricgenerating plants with a net capability of 10 mw: Oakdale located at Lake Freeman in Carroll County, IN and Norway located at Lake Schahfer in White County,IN. These facilities provide for a total system operating net capability of 3,281 mw.
Refer to Note 18, "Other Commitments and Contingencies," and Note 25, "Subsequent Event," in the Notes to Consolidated Financial Statements for additionalinformation on NIPSCO's long-term generation strategy.
NIPSCO’s transmission system, with voltages from 69,000 to 345,000 volts, consists of 2,843 circuit miles. NIPSCO is interconnected with five neighboringelectric utilities. During the year ended December 31, 2017, NIPSCO generated 65.2% and purchased 34.8% of its electric requirements.
NIPSCO participates in the MISO transmission service and wholesale energy market. The MISO is a nonprofit organization created in compliance with FERCregulations to improve the flow of electricity in the regional marketplace and to enhance electric reliability. Additionally, the MISO is responsible for managingenergy markets, transmission constraints and the day-ahead, real-time, FTR and ancillary markets. NIPSCO transferred functional control of its electrictransmission assets to the MISO, and transmission service for NIPSCO occurs under the MISO Open Access Transmission Tariff.
Business StrategyNiSource focuses its business strategy on its core, rate-regulated asset-based businesses with most of its operating income generated from the rate-regulatedbusinesses. NiSource’s utilities continue to move forward on core infrastructure and environmental investment programs supported by complementary regulatoryand customer initiatives across all seven states in which it operates. NiSource’s goal is to develop strategies that benefit all stakeholders as it addresses changingcustomer conservation patterns, develops more contemporary pricing structures, and embarks on long-term investment programs. These strategies are intended toimprove reliability and safety, enhance customer services and reduce emissions while generating sustainable returns.
6
Table of Contents
ITEM 1. BUSINESS
N I S OURCE I NC .
Competition and Changes in the Regulatory EnvironmentThe regulatory frameworks applicable to NiSource’s operations, at both the state and federal levels, continue to evolve. These changes have had and will continueto have an impact on NiSource’s operations, structure and profitability. Management continually seeks new ways to be more competitive and profitable in thisenvironment.
The Gas Distribution Operations companies have pursued non-traditional revenue sources within the evolving natural gas marketplace. These efforts include thesale of products and services upstream of the companies’ service territory, the sale of products and services in the companies’ service territories, and gas supplycost incentive mechanisms for service to their core markets. The upstream products are made up of transactions that occur between an individual Gas DistributionOperations company and a buyer for the sales of unbundled or rebundled gas supply and capacity. The on-system services are offered by NiSource to customersand include products such as the transportation and balancing of gas on the Gas Distribution Operations company system. The incentive mechanisms give the GasDistribution Operations companies an opportunity to share in the savings created from such situations as gas purchase prices paid below an agreed uponbenchmark and their ability to reduce pipeline capacity charges with their customers.
Increased efficiency of natural gas appliances and improvements in home building codes and standards has contributed to a long-term trend of declining averageuse per customer. Residential usage for the year ended December 31, 2017 decreased primarily due to warmer weather in the Company's operating area comparedto the prior year. While historically rate design at the distribution level has been structured such that a large portion of cost recovery is based upon throughputrather than in a fixed charge, operating costs are largely incurred on a fixed basis and do not fluctuate due to changes in customer usage. As a result, GasDistribution Operations have pursued changes in rate design to more effectively match recoveries with costs incurred. Each of the states in which Gas DistributionOperations operate has different requirements regarding the procedure for establishing changes to rate design. Columbia of Ohio restructured its rate designthrough a base rate proceeding and has adopted a “de-coupled” rate design which more closely links the recovery of fixed costs with fixed charges. Columbia ofMassachusetts received regulatory approval of a decoupling mechanism which adjusts revenues to an approved benchmark level through a volumetric adjustmentfactor. Columbia of Maryland and Columbia of Virginia have regulatory approval for a revenue normalization adjustment for certain customer classes, adecoupling mechanism whereby monthly revenues that exceed or fall short of approved levels are reconciled in subsequent months. In a prior base rate proceeding,Columbia of Pennsylvania implemented a pilot residential weather normalization adjustment. Columbia of Maryland, Columbia of Virginia and Columbia ofKentucky have had approval for a weather normalization adjustment for many years. In a prior base rate proceeding, NIPSCO implemented a higher fixedcustomer charge for residential and small customer classes moving toward full straight fixed variable rate design.
NaturalGasCompetition. Open access to natural gas supplies over interstate pipelines and the deregulation of the commodity price of gas has led to tremendouschange in the energy markets. LDC customers and marketers can purchase gas directly from producers and marketers as an open, competitive market for gassupplies has emerged. This separation or “unbundling” of the transportation and other services offered by pipelines and LDCs allows customers to purchase thecommodity independent of services provided by the pipelines and LDCs. The LDCs continue to purchase gas and recover the associated costs from theircustomers. NiSource’s Gas Distribution Operations’ subsidiaries are involved in programs that provide customers the opportunity to purchase their natural gasrequirements from third parties and use the NiSource Gas Distribution Operations’ subsidiaries for transportation services.
Gas Distribution Operations competes with investor-owned, municipal, and cooperative electric utilities throughout its service areas as well as other regulated andunregulated natural gas intra and interstate pipelines and other alternate fuels, such as propane and fuel oil. Gas Distribution Operations continues to be a strongcompetitor in the energy market as a result of strong customer preference for natural gas. Competition with providers of electricity has traditionally been thestrongest in the residential and commercial markets of Kentucky, southern Ohio, central Pennsylvania and western Virginia due to comparatively low electric rates.Natural gas competes with fuel oil and propane in the Massachusetts market mainly due to the installed base of fuel oil and propane-based heating which hascomprised a declining percentage of the overall market over the last few years. However, fuel oil and propane are more viable in today’s oil market.
ElectricCompetition. Indiana electric utilities generally have exclusive service areas under Indiana regulations, and retail electric customers in Indiana do nothave the ability to choose their electric supplier. NIPSCO faces non-utility competition from other energy sources, such as self-generation by large industrialcustomers and other distributed energy sources.
SeasonalityA significant portion of NiSource's operations is subject to seasonal fluctuations in sales. During the heating season, which is primarily from November throughMarch, revenues from gas sales are more significant, and during the cooling season, which is primarily June through September, revenues from electric sales aremore significant, than in other months.
7
Table of Contents
ITEM 1. BUSINESS
N I S OURCE I NC .
Other Relevant Business InformationNiSource’s customer base is broadly diversified, with no single customer accounting for a significant portion of revenues.
As of December 31, 2017, NiSource had 8,175 employees of whom 3,199 were subject to collective bargaining agreements. Collective bargaining agreements for189 employees are set to expire within one year.
For a listing of certain subsidiaries of NiSource refer to Exhibit 21.
NiSource electronically files various reports with the Securities and Exchange Commission (SEC), including annual reports on Form 10-K, quarterly reports onForm 10-Q, current reports on Form 8-K and amendments to such reports, as well as NiSource's proxy statements for the Company's annual meetings ofstockholders. The public may read and copy any materials that NiSource files with the SEC at the SEC’s Public Reference Room at 100 F Street, N.E.,Washington, D.C. 20549. The public may obtain information on the operation of the Public Reference Room by calling the SEC at 1-800-SEC-0330. The SEC alsomaintains an Internet site that contains reports and information statements, and other information regarding issuers that file electronically with the SEC athttp://www.sec.gov. NiSource makes all SEC filings available without charge to the public on its web site at http://www.nisource.com.
8
Table of Contents
ITEM 1A. RISK FACTORS
N I S OURCE I NC .
Our operations and financial results are subject to various risks and uncertainties, including those described below, that could adversely affect our business,financial condition, results of operations, cash flows, and the trading price of our common stock.
We have substantial indebtedness which could adversely affect our financial condition.
Our businesses are capital intensive and we rely significantly on long-term debt to fund a portion of our capital expenditures and repay outstanding debt, and onshort-term borrowings to fund a portion of day-to-day business operations. We had total consolidated indebtedness of $9,002.2 million outstanding as ofDecember 31, 2017 . Our substantial indebtedness could have important consequences. For example, it could:
• limit our ability to borrow additional funds or increase the cost of borrowing additional funds;
• reduce the availability of cash flow from operations to fund working capital, capital expenditures and other general corporate purposes;
• limit our flexibility in planning for, or reacting to, changes in the business and the industries in which we operate;
• lead parties with whom we do business to require additional credit support, such as letters of credit, in order for us to transact such business;
• place us at a competitive disadvantage compared to competitors that are less leveraged;
• increase vulnerability to general adverse economic and industry conditions; and
• limit our ability to execute on our growth strategy, which is dependent upon access to capital to fund our substantial infrastructure investment program.
Some of our debt obligations contain financial covenants related to debt-to-capital ratios and cross-default provisions. Our failure to comply with any of thesecovenants could result in an event of default, which, if not cured or waived, could result in the acceleration of outstanding debt obligations.
A drop in our credit ratings could adversely impact our cash flows, results of operation, financial condition and liquidity.
The availability and cost of credit for our businesses may be greatly affected by credit ratings. The credit rating agencies periodically review our ratings, takinginto account factors such as our capital structure and earnings profile. In 2017, Moody’s affirmed the NiSource senior unsecured rating of Baa2 and its commercialpaper rating of P-2, with stable outlooks. Moody’s also affirmed NIPSCO’s Baa1 rating and Columbia of Massachusetts’s Baa2 rating, with stable outlooks. In2017, Standard & Poor’s affirmed the BBB+ senior unsecured ratings of NiSource and its subsidiaries and affirmed NiSource’s commercial paper rating of A-2,with stable outlooks. In 2017, Fitch affirmed the long-term issuer default ratings of NiSource and NIPSCO to BBB and affirmed the commercial paper rating of F3,with stable outlooks. A credit rating is not a recommendation to buy, sell or hold securities, and may be subject to revision or withdrawal at any time by theassigning rating organization.
We are committed to maintaining investment grade credit ratings, however, there is no assurance we will be able to do so in the future. Our credit ratings could belowered or withdrawn entirely by a rating agency if, in its judgment, the circumstances warrant. Any negative rating action could adversely affect our ability toaccess capital at rates and on terms that are attractive. A negative rating action could also adversely impact our business relationships with suppliers and operatingpartners.
Certain NiSource subsidiaries have agreements that contain “ratings triggers” that require increased collateral in the form of cash, a letter of credit or other formsof security for new and existing transactions if the credit ratings of NiSource or certain of its subsidiaries are dropped below investment grade. These agreementsare primarily for insurance purposes and for the physical purchase or sale of gas or power. As of December 31, 2017, the collateral requirement that would berequired in the event of a downgrade below the ratings trigger levels would amount to approximately $46.1 million . In addition to agreements with ratings triggers,there are other agreements that contain “adequate assurance” or “material adverse change” provisions that could necessitate additional credit support such as lettersof credit and cash collateral to transact business. If the credit ratings of NiSource or certain of its subsidiaries were downgraded, especially below investmentgrade, financing costs and the principal amount of borrowings would likely increase due to the additional risk of our debt and because certain counterparties mayrequire additional credit support as described above. Such amounts may be material and could adversely affect our cash flows, results of operations and financialcondition.
9
Table of Contents
ITEM 1A. RISK FACTORS
N I S OURCE I NC .
We may not be able to execute our business plan or growth strategy, including utility infrastructure investments.
Business or regulatory conditions may result in us not being able to execute our business plan or growth strategy, including identified, planned and other utilityinfrastructure investments. Our customer and regulatory initiatives may not achieve planned results. Utility infrastructure investments may not materialize, maycease to be achievable or economically viable and may not be successfully completed. Natural gas may cease to be viewed as an economically and environmentallyattractive fuel. Certain groups may oppose natural gas delivery and infrastructure investments because of perceived environmental impacts associated with thenatural gas supply chain and end use. Energy conservation, energy efficiency, distributed generation, energy storage and other factors may reduce energy demand.Any of these developments could adversely affect our results of operations and growth prospects.
Adverse economic and market conditions or increases in interest rates could materially and adversely affect our results of operations, cash flows,financial condition and liquidity.
While the national economy is experiencing modest growth, we cannot predict how robust future growth will be or whether or not it will be sustained.Deteriorating or sluggish economic conditions in our operating jurisdictions could adversely impact our ability to maintain or grow our customer base and collectrevenues from customers, which could reduce revenue growth and increase operating costs.
We rely on access to the capital markets to finance our liquidity and long-term capital requirements, including expenditures for our utility infrastructure and tocomply with future regulatory requirements, to the extent not satisfied by the cash flow generated by our operations. We have historically relied on long-term debtto fund a portion of our capital expenditures and repay outstanding debt, and on short-term borrowings to fund a portion of day-to-day business operations.Successful implementation of our long-term business strategies, including capital investment, is dependent upon our ability to access the capital and credit markets,including the banking and commercial paper markets, on competitive terms and rates. An economic downturn or uncertainty, market turmoil, changes in tax policy,challenges faced by financial institutions, changes in our credit ratings, or a change in investor sentiment toward us or the utilities industry generally couldadversely affect our ability to raise additional capital or refinance debt. Reduced access to capital markets and/or increased borrowing costs could reduce future netincome and cash flows. Refer to Note 14 , “Long-Term Debt,” in the Notes to Consolidated Financial Statements for information related to outstanding long-termdebt and maturities of that debt. In addition, if any of these risks or uncertainties limit our access to the credit and capital markets or significantly increase our costof capital, it could limit our ability to implement, or increase the costs of implementing, our business plan, which, in turn, could materially and adversely affect ourresults of operations, cash flows, financial condition and liquidity.
Capital market performance and other factors may decrease the value of benefit plan assets, which then could require significant additional funding andimpact earnings.
The performance of the capital markets affects the value of the assets that are held in trust to satisfy future obligations under defined benefit pension and otherpostretirement benefit plans. We have significant obligations in these areas and hold significant assets in these trusts. These assets are subject to marketfluctuations and may yield uncertain returns, which fall below our projected rates of return. A decline in the market value of assets may increase the fundingrequirements of the obligations under the defined benefit pension and other postretirement benefit plans. Additionally, changes in interest rates affect the liabilitiesunder these benefit plans; as interest rates decrease, the liabilities increase, which could potentially increase funding requirements. Further, the fundingrequirements of the obligations related to these benefits plans may increase due to changes in governmental regulations and participant demographics, includingincreased numbers of retirements or changes in life expectancy assumptions. Ultimately, significant funding requirements and increased pension or otherpostretirement benefit plan expense could negatively impact our results of operations and financial position.
The majority of our revenues are subject to economic regulation and are exposed to the impact of regulatory rate reviews and proceedings.
Most of our revenues are subject to economic regulation at either the federal or state level. As such, the revenues generated by us are subject to regulatory reviewby the applicable federal or state authority. These rate reviews determine the rates charged to customers and directly impact revenues. Our financial results aredependent on frequent regulatory proceedings in order to ensure timely recovery of costs. Additionally, the costs of complying with future changes inenvironmental and federal pipeline safety laws and regulations are expected to be significant, and their recovery through rates will be contingent on regulatoryapproval.
10
Table of Contents
ITEM 1A. RISK FACTORS
N I S OURCE I NC .
As a result of efforts to introduce market-based competition in certain markets where the regulated businesses conduct operations, we may compete withindependent marketers for customers. This competition exposes us to the risk that certain infrastructure investments may not be recoverable and may affect resultsof our growth strategy and financial position.
Failure to adapt to advances in technology could make us less competitive.
A key element of our business model is that generating power at central station power plants achieves economies of scale and produces power at a competitivecost. Research and development activities are ongoing for new technologies that produce power or reduce power consumption. These technologies includerenewable energy, distributed generation, energy storage, and energy efficiency. Advances in technology or changes in laws or regulations could reduce the cost ofthese or other alternative methods of producing power to a level that is competitive with that of most central station power electric production or result in smaller-scale, more fuel efficient, and/or more cost effective distributed generation. This could cause power sales to decline and the value of our generating facilities todecline. In addition, a failure by us to effectively adapt to changes in technology could harm our ability to remain competitive in the marketplace for our products,services and processes.
We are exposed to significant reputational risks, which make us vulnerable to a loss of cost recovery, increased litigation and negative public perception.
As a utility company, we are subject to adverse publicity focused on the reliability of our services, the speed with which we are able to respond effectively toelectric outages, natural gas leaks and similar interruptions caused by storm damage or other unanticipated events, as well as our own or third parties' actions orfailure to act. We are also subject to adverse publicity related to perceived environmental impacts. If customers, legislators, or regulators have or develop anegative opinion of us, this could result in less favorable legislative and regulatory outcomes or increased regulatory oversight, increased litigation and negativepublic perception. The imposition of any of the foregoing could have a material adverse effect on our business, results of operations, cash flow and financialcondition.
Our businesses are regulated under numerous environmental laws. The cost of compliance with these laws, and changes to or additions to, orreinterpretations of the laws, could be significant. Liability from the failure to comply with existing or changed laws could have a material adverse effecton our business, results of operations, cash flows and financial condition.
Our businesses are subject to extensive federal, state and local environmental laws and rules that regulate, among other things, air emissions, water usage anddischarges, and waste products such as coal combustion residuals. Compliance with these legal obligations require us to make expenditures for installation ofpollution control equipment, remediation, environmental monitoring, emissions fees, and permits at many of our facilities. These expenditures are significant, andwe expect that they will continue to be significant in the future. Furthermore, if we fail to comply with environmental laws and regulations or are found to havecaused damage to the environment or persons, even if caused by factors beyond our control, that failure or harm may result in the assessment of civil or criminalpenalties and damages against us and injunctions to remedy the failure or harm.
Existing environmental laws and regulations may be revised and new laws and regulations seeking to change environmental regulation of the energy industry maybe adopted or become applicable to us. Revised or additional laws and regulations may result in significant additional expense and operating restrictions on ourfacilities or increased compliance costs, which may not be fully recoverable from customers through regulated rates and could, therefore, impact our financialposition, financial results and cash flow. Moreover, such costs could materially affect the continued economic viability of one or more of our facilities.
An area of significant uncertainty and risk are the laws concerning emission of GHG. While we continue to reduce GHG emissions through electric generationwith lower carbon intensity, priority pipeline replacement, energy efficiency, leak detection, and other programs, GHG emissions are an expected aspect of theelectric and natural gas business. Revised or additional future GHG legislation and/or regulation related to the generation of electricity or the extraction,production, distribution and end use of natural gas could materially impact our financial position, financial results and cash flows.
Even in instances where legal and regulatory requirements are already known or anticipated, the original cost estimates for environmental capital projects,remediation of past harm, or the costs of operating pollution reduction strategies or equipment can differ materially from the amount ultimately expended. Theactual future expenditures depend on many factors, including the nature and extent of impact, the method of cleanup, the cost of raw materials, contractor costs,and the availability of cost recovery. Changes in costs and the ability to recover under regulatory mechanisms could affect our financial position, financial resultsand cash flows.
11
Table of Contents
ITEM 1A. RISK FACTORS
N I S OURCE I NC .
A significant portion of the gas and electricity we sell is used by residential and commercial customers for heating and air conditioning. Accordingly,fluctuations in weather, gas and electricity commodity costs and economic conditions impact demand of our customers and our operating results.
Energy sales are sensitive to variations in weather. Forecasts of energy sales are based on “normal” weather, which represents a long-term historical average.Significant variations from normal weather could have, and have had, a material impact on energy sales. Additionally, residential usage, and to some degreecommercial usage, is sensitive to fluctuations in commodity costs for gas and electricity, whereby usage declines with increased costs, thus affecting our financialresults. Lastly, residential and commercial customers’ usage is sensitive to economic conditions and factors such as unemployment, consumption and consumerconfidence. Therefore, prevailing economic conditions may affect our financial results.
Our business operations are subject to economic conditions in certain industries.
Business operations throughout our service territories have been and may continue to be adversely affected by economic events at the national and local levelwhere it operates. In particular, sales to large industrial customers, such as those in the steel, oil refining, industrial gas and related industries, may be impacted byeconomic downturns. The U.S. manufacturing industry continues to adjust to changing market conditions including international competition, increasing costs, andfluctuating demand for its products.
The implementation of NIPSCO’s electric generation strategy, including the retirement of its coal generation units, may not achieve intended results.
On November 1, 2016, NIPSCO submitted its Integrated Resource Plan with the IURC setting forth its short- and long-term electric generation plans in an effort tomaintain affordability while providing reliable, flexible and cleaner sources of power. However, there are inherent risks and uncertainties, including changes inmarket conditions, environmental regulations, commodity costs and customer expectations, which may impede NIPSCO’s ability to achieve these intended results.In addition, the Integrated Resource Plan included an intention to retire the Bailly coal generation units (Units 7 and 8) as soon as mid-2018 and two units (Units17 and 18) at the R.M. Schahfer Generating Station by the end of 2023. The MISO subsequently approved NIPSCO’s plan to retire the two Bailly coal generationunits by May 31, 2018. On February 1, 2018, NIPSCO commenced a four-month outage of Bailly Generating Station Unit 8 to begin work on converting the unitto a synchronous condenser (a piece of equipment designed to maintain voltage to ensure continued reliability on the transmission system). NIPSCO expects tocomplete the retirement of Units 7 and 8 by May 31, 2018. NIPSCO’s electric generation strategy could require significant future capital expenditures, operatingcosts and charges to earnings that may negatively impact our financial position, financial results and cash flows.
Fluctuations in the price of energy commodities or their related transportation costs or an inability to obtain an adequate, reliable and cost-effective fuelsupply to meet customer demands may have a negative impact on our financial results.
Our electric generating fleet is dependent on coal and natural gas for fuel, and our gas distribution operations purchase and resell much of the natural gas wedeliver. These energy commodities are vulnerable to price fluctuations and fluctuations in associated transportation costs. From time to time, we have used hedgingin order to offset fluctuations in commodity supply prices. We rely on regulatory recovery mechanisms in the various jurisdictions in order to fully recover thecommodity costs incurred in operations. However, while we have historically been successful in recovery of costs related to such commodity prices, there can beno assurance that such costs will be fully recovered through rates in a timely manner.
In addition, we depend on electric transmission lines, natural gas pipelines, and other transportation facilities owned and operated by third parties to deliver theelectricity and natural gas we sell to wholesale markets, supply natural gas to our gas storage and electric generation facilities, and provide retail energy services tocustomers. If transportation is disrupted, or if capacity is inadequate, we may be unable to sell and deliver our gas and electric services to some or all of ourcustomers. As a result, we may be required to procure additional or alternative electricity and/or natural gas supplies at then-current market rates, which, ifdisallowed, could have a material adverse effect on our businesses, financial condition, cash flows, results of operations and/or prospects.
We are exposed to risk that customers will not remit payment for delivered energy or services, and that suppliers or counterparties will not performunder various financial or operating agreements.
Our extension of credit is governed by a Corporate Credit Risk Policy, involves considerable judgment and is based on an evaluation of a customer orcounterparty’s financial condition, credit history and other factors. We monitor our credit risk exposure by obtaining credit reports and updated financialinformation for customers and suppliers, and by evaluating the financial status of our banking partners and other counterparties by reference to market-basedmetrics such as credit default swap pricing levels, and to traditional
12
Table of Contents
ITEM 1A. RISK FACTORS
N I S OURCE I NC .
credit ratings provided by the major credit rating agencies. Adverse economic conditions could result in an increase in defaults by customers, suppliers andcounterparties.
We have significant goodwill and definite-lived intangible assets. An impairment of goodwill or definite-lived intangible assets could result in a significantcharge to earnings and negatively impact our compliance with certain covenants under financing agreements.
In accordance with GAAP, we test goodwill for impairment at least annually and review our definite-lived intangible assets for impairment when events or changesin circumstances indicate the carrying value may not be recoverable. Goodwill also is tested for impairment when factors, examples of which include reduced cashflow estimates, a sustained decline in stock price or market capitalization below book value, indicate that the carrying value may not be recoverable. We would berequired to record a charge in our financial statements for the period in which any impairment of the goodwill or definite-lived intangible assets is determined,negatively impacting the results of operations. A significant charge could impact the capitalization ratio covenant under certain financing agreements. We aresubject to a financial covenant under our five-year revolving credit facility, which requires us to maintain a debt to capitalization ratio that does not exceed 70%. Asimilar covenant in a 2005 private placement note purchase agreement requires us to maintain a debt to capitalization ratio that does not exceed 75%. As ofDecember 31, 2017, the ratio was 67.6% .
Changes in taxation and the ability to quantify such changes could adversely affect our financial results.
We are subject to taxation by the various taxing authorities at the federal, state and local levels where we do business. Legislation or regulation which could affectour tax burden could be enacted by any of these governmental authorities. For example, on December 22, 2017, President Trump signed into law the TCJA, whichincludes numerous provisions that will affect businesses, including changes to U.S. corporate tax rates, business-related exclusions, and deductions and credits. Theoutcome of regulatory proceedings regarding the extent to which the effect of reduced corporate tax rate will be shared with customers and the time period overwhich it will be shared could significantly impact future earnings and cash flows. Separately, a challenge by a taxing authority, our ability to utilize tax benefitssuch as carryforwards or tax credits, or a deviation from other tax-related assumptions may cause actual financial results to deviate from previous estimates.
Changes in accounting principles may adversely affect our financial results.
Future changes in accounting rules and associated changes in regulatory accounting may negatively impact the way we record revenues, expenses, assets andliabilities. These changes in accounting standards may adversely affect our financial condition and results of operations.
Distribution of natural gas, and the generation, transmission and distribution of electricity involve numerous risks that may result in incidents and otheroperating risks and costs.
Our gas distribution activities, as well as generation, transmission, and distribution of electricity, involve a variety of inherent hazards and operating risks, such asgas leaks, downed power lines, other incidents, third-party damages, large scale outages, and mechanical problems, which could cause substantial financial losses.In addition, these risks could result in serious injury or loss of life to employees and the general public, significant damage to property, environmental pollution,impairment of our operations, adverse regulatory rulings and reputational harm, which in turn could lead to substantial losses for us. The location of pipelinefacilities, or generation, transmission, substation and distribution facilities near populated areas, including residential areas, commercial business centers andindustrial sites, could increase the level of damages resulting from such events. These activities may subject us to litigation or administrative proceedings fromtime to time, which could result in substantial monetary judgments, fines, or penalties against us, or be resolved on unfavorable terms. The occurrence of suchevents could adversely affect our financial position and results of operations. In accordance with customary industry practice, we maintain insurance against some,but not all, of these risks and losses.
Aging infrastructure may lead to disruptions in operations and increased capital expenditures and maintenance costs, all of which could negativelyimpact our financial results.
We have risks associated with aging infrastructure assets. The age of these assets may result in a need for replacement, a higher level of maintenance costs andunscheduled outages despite efforts by us to properly maintain or upgrade these assets through inspection, scheduled maintenance and capital investment. Thefailure to operate these assets as desired could result in gas leaks and other incidents and in our inability to meet firm service obligations, which could adverselyimpact revenues, and could also result in increased capital expenditures and maintenance costs, which, if not fully recovered from customers, could negativelyimpact our financial results.
13
Table of Contents
ITEM 1A. RISK FACTORS
N I S OURCE I NC .
The impacts of climate change, natural disasters, acts of terrorism or other catastrophic events may disrupt operations and reduce the ability to servicecustomers.
A disruption or failure of natural gas distribution systems, or within electric generation, transmission or distribution systems, in the event of a major hurricane,tornado, terrorist attack or other catastrophic event could cause delays in completing sales, providing services, or performing other critical functions. We haveexperienced disruptions in the past from hurricanes and tornadoes and other events of this nature. The occurrence of such events could adversely affect ourfinancial position and results of operations. In accordance with customary industry practice, we maintain insurance against some, but not all, of these risks andlosses. There is also a concern that climate change may exacerbate the risks to physical infrastructure. Such risks include heat stresses to power lines, storms thatdamage infrastructure, lake and sea level changes that damage the manner in which services are currently provided, droughts or other stresses on water used tosupply services, and other extreme weather conditions. Climate change and the costs that may be associated with its impacts have the potential to affect ourbusiness in many ways, including increasing the cost we incur in providing our products and services, impacting the demand for and consumption of our productsand services (due to change in both costs and weather patterns), and affecting the economic health of the regions in which we operate.
A cyber-attack on any of our or certain third-party computer systems upon which we rely may adversely affect our ability to operate.
We are reliant on technology to run our business, which is dependent upon financial and operational computer systems to process critical information necessary toconduct various elements of our business, including the generation, transmission and distribution of electricity, operation of our gas pipeline facilities and therecording and reporting of commercial and financial transactions to regulators, investors and other stakeholders. In addition to general information and cyber risksthat all large corporations face ( e.g., malware, malicious intent by insiders and inadvertent disclosure of sensitive information), the utility industry faces evolvingcybersecurity risks associated with protecting sensitive and confidential customer information, electric grid infrastructure, and natural gas infrastructure. Increasinglarge-scale corporate attacks in conjunction with more sophisticated threats continue to challenge power and utility companies. Any failure of our computersystems, or those of our customers, suppliers or others with whom we do business, could materially disrupt our ability to operate our business and could result in afinancial loss and possibly do harm to our reputation.
Additionally, our information systems experience ongoing, often sophisticated, cyber-attacks by a variety of sources with the apparent aim to breach our cyber-defenses. Although we attempt to maintain adequate defenses to these attacks and works through industry groups and trade associations to identify common threatsand assess our countermeasures, a security breach of our information systems could (i) impact the reliability of our generation, transmission and distributionsystems and potentially negatively impact our compliance with certain mandatory reliability standards, (ii) subject us to harm associated with theft or inappropriaterelease of certain types of information such as system operating information or information, personal or otherwise, relating to our customers or employees, and/or(iii) impact our ability to manage our businesses.
Our capital projects and programs subject us to construction risks and natural gas costs and supply risks.
Our business requires substantial capital expenditures for investments in, among other things, capital improvements to our electric generating facilities, electric andnatural gas distribution infrastructure, natural gas storage, and other projects, including projects for environmental compliance. We are engaged in intrastate naturalgas pipeline modernization programs to maintain system integrity and enhance service reliability and flexibility. NIPSCO also is currently engaged in a number ofcapital projects, including environmental improvements to its electric generating stations, as well as the construction of new transmission facilities. As weundertake these projects and programs, we may not be able to complete them on schedule or at the anticipated costs. Additionally, we may construct or purchasesome of these projects and programs to capture anticipated future growth in natural gas production, which may not materialize, and may cause the construction tooccur over an extended period of time. We also may not receive the anticipated increases in revenue and cash flows resulting from such projects and programs untilafter their completion. To the extent that delays occur, costs become unrecoverable, or we otherwise become unable to effectively manage and complete our capitalprojects, our results of operations, cash flows, and financial condition may be adversely affected.
Sustained extreme weather conditions may negatively impact our operations.
We conduct our operations across a wide geographic area subject to varied and potentially extreme weather conditions, which may from time to time persist forsustained periods of time. Despite preventative maintenance efforts, persistent weather related stress on our infrastructure may reveal weaknesses in our systemsnot previously known to us or otherwise present various operational challenges across all business segments. Further, adverse weather may affect our ability toconduct operations in a manner that satisfies customer expectations or contractual obligations, including by causing service disruptions.
14
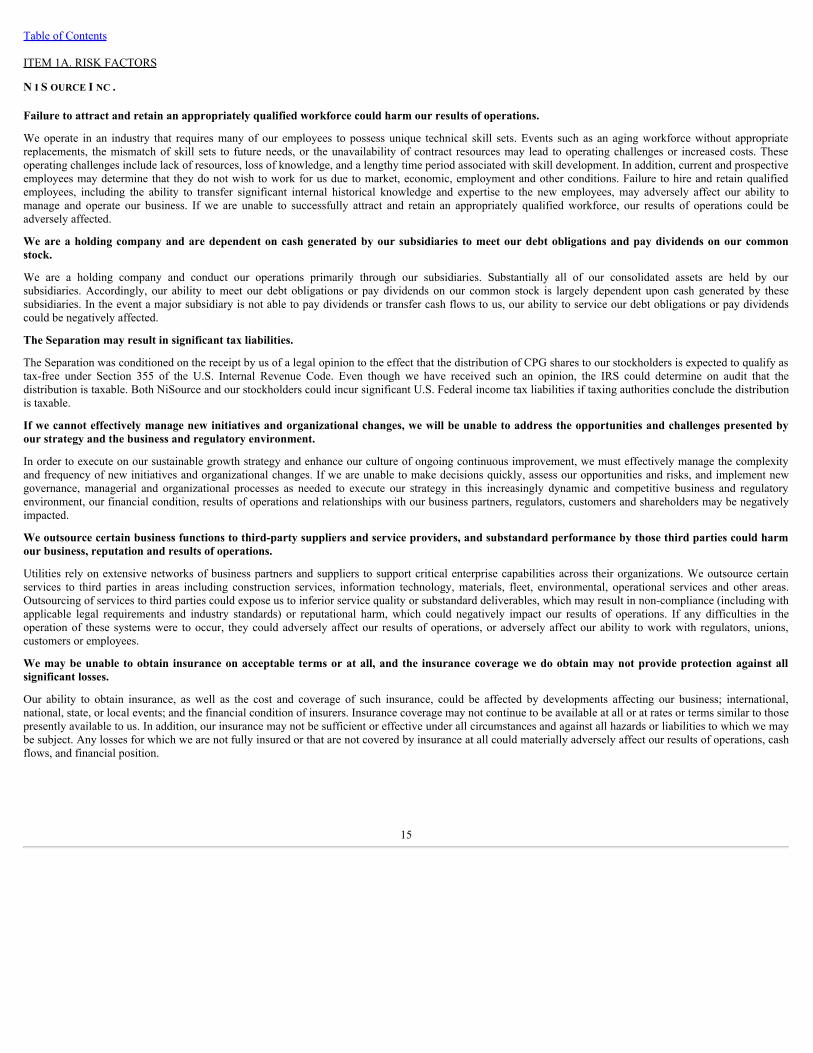
Table of Contents
ITEM 1A. RISK FACTORS
N I S OURCE I NC .
Failure to attract and retain an appropriately qualified workforce could harm our results of operations.
We operate in an industry that requires many of our employees to possess unique technical skill sets. Events such as an aging workforce without appropriatereplacements, the mismatch of skill sets to future needs, or the unavailability of contract resources may lead to operating challenges or increased costs. Theseoperating challenges include lack of resources, loss of knowledge, and a lengthy time period associated with skill development. In addition, current and prospectiveemployees may determine that they do not wish to work for us due to market, economic, employment and other conditions. Failure to hire and retain qualifiedemployees, including the ability to transfer significant internal historical knowledge and expertise to the new employees, may adversely affect our ability tomanage and operate our business. If we are unable to successfully attract and retain an appropriately qualified workforce, our results of operations could beadversely affected.
We are a holding company and are dependent on cash generated by our subsidiaries to meet our debt obligations and pay dividends on our commonstock.
We are a holding company and conduct our operations primarily through our subsidiaries. Substantially all of our consolidated assets are held by oursubsidiaries. Accordingly, our ability to meet our debt obligations or pay dividends on our common stock is largely dependent upon cash generated by thesesubsidiaries. In the event a major subsidiary is not able to pay dividends or transfer cash flows to us, our ability to service our debt obligations or pay dividendscould be negatively affected.
The Separation may result in significant tax liabilities.
The Separation was conditioned on the receipt by us of a legal opinion to the effect that the distribution of CPG shares to our stockholders is expected to qualify astax-free under Section 355 of the U.S. Internal Revenue Code. Even though we have received such an opinion, the IRS could determine on audit that thedistribution is taxable. Both NiSource and our stockholders could incur significant U.S. Federal income tax liabilities if taxing authorities conclude the distributionis taxable.
If we cannot effectively manage new initiatives and organizational changes, we will be unable to address the opportunities and challenges presented byour strategy and the business and regulatory environment.
In order to execute on our sustainable growth strategy and enhance our culture of ongoing continuous improvement, we must effectively manage the complexityand frequency of new initiatives and organizational changes. If we are unable to make decisions quickly, assess our opportunities and risks, and implement newgovernance, managerial and organizational processes as needed to execute our strategy in this increasingly dynamic and competitive business and regulatoryenvironment, our financial condition, results of operations and relationships with our business partners, regulators, customers and shareholders may be negativelyimpacted.
We outsource certain business functions to third-party suppliers and service providers, and substandard performance by those third parties could harmour business, reputation and results of operations.
Utilities rely on extensive networks of business partners and suppliers to support critical enterprise capabilities across their organizations. We outsource certainservices to third parties in areas including construction services, information technology, materials, fleet, environmental, operational services and other areas.Outsourcing of services to third parties could expose us to inferior service quality or substandard deliverables, which may result in non-compliance (including withapplicable legal requirements and industry standards) or reputational harm, which could negatively impact our results of operations. If any difficulties in theoperation of these systems were to occur, they could adversely affect our results of operations, or adversely affect our ability to work with regulators, unions,customers or employees.
We may be unable to obtain insurance on acceptable terms or at all, and the insurance coverage we do obtain may not provide protection against allsignificant losses.
Our ability to obtain insurance, as well as the cost and coverage of such insurance, could be affected by developments affecting our business; international,national, state, or local events; and the financial condition of insurers. Insurance coverage may not continue to be available at all or at rates or terms similar to thosepresently available to us. In addition, our insurance may not be sufficient or effective under all circumstances and against all hazards or liabilities to which we maybe subject. Any losses for which we are not fully insured or that are not covered by insurance at all could materially adversely affect our results of operations, cashflows, and financial position.
15
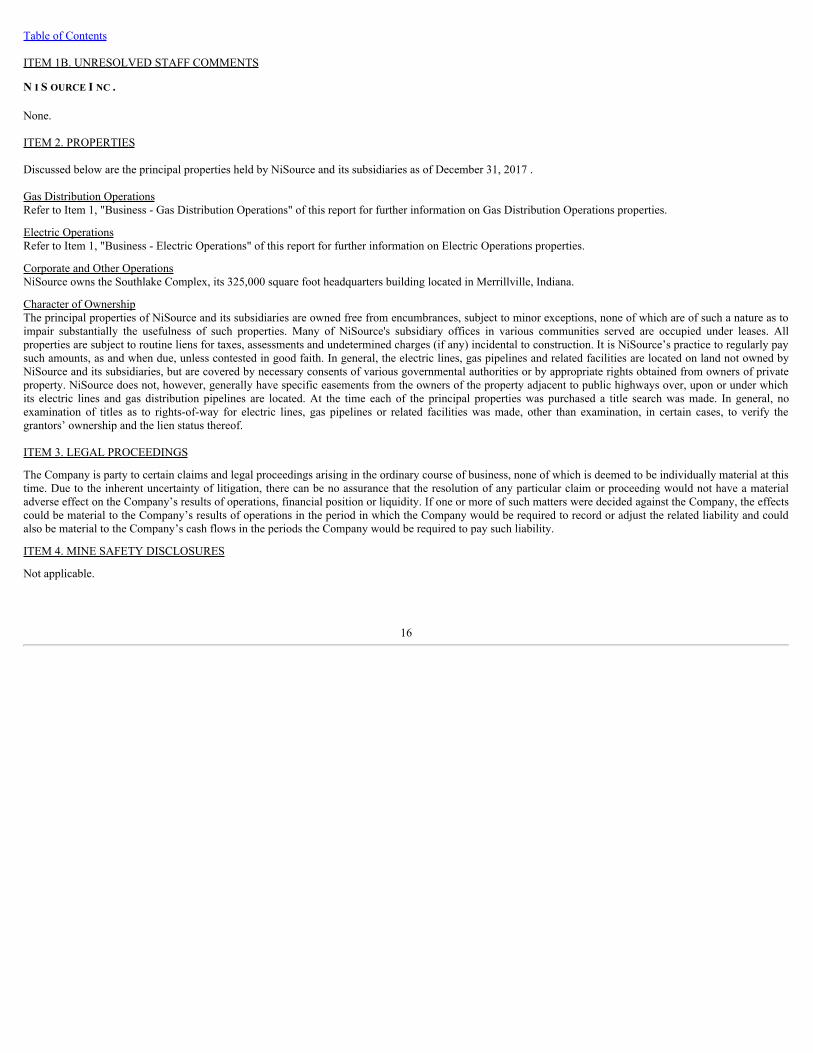
Table of Contents
ITEM 1B. UNRESOLVED STAFF COMMENTS
N I S OURCE I NC .
None.
ITEM 2. PROPERTIES
Discussed below are the principal properties held by NiSource and its subsidiaries as of December 31, 2017 .
Gas Distribution OperationsRefer to Item 1, "Business - Gas Distribution Operations" of this report for further information on Gas Distribution Operations properties.
Electric OperationsRefer to Item 1, "Business - Electric Operations" of this report for further information on Electric Operations properties.
Corporate and Other OperationsNiSource owns the Southlake Complex, its 325,000 square foot headquarters building located in Merrillville, Indiana.
Character of OwnershipThe principal properties of NiSource and its subsidiaries are owned free from encumbrances, subject to minor exceptions, none of which are of such a nature as toimpair substantially the usefulness of such properties. Many of NiSource's subsidiary offices in various communities served are occupied under leases. Allproperties are subject to routine liens for taxes, assessments and undetermined charges (if any) incidental to construction. It is NiSource’s practice to regularly paysuch amounts, as and when due, unless contested in good faith. In general, the electric lines, gas pipelines and related facilities are located on land not owned byNiSource and its subsidiaries, but are covered by necessary consents of various governmental authorities or by appropriate rights obtained from owners of privateproperty. NiSource does not, however, generally have specific easements from the owners of the property adjacent to public highways over, upon or under whichits electric lines and gas distribution pipelines are located. At the time each of the principal properties was purchased a title search was made. In general, noexamination of titles as to rights-of-way for electric lines, gas pipelines or related facilities was made, other than examination, in certain cases, to verify thegrantors’ ownership and the lien status thereof.
ITEM 3. LEGAL PROCEEDINGS
The Company is party to certain claims and legal proceedings arising in the ordinary course of business, none of which is deemed to be individually material at thistime. Due to the inherent uncertainty of litigation, there can be no assurance that the resolution of any particular claim or proceeding would not have a materialadverse effect on the Company’s results of operations, financial position or liquidity. If one or more of such matters were decided against the Company, the effectscould be material to the Company’s results of operations in the period in which the Company would be required to record or adjust the related liability and couldalso be material to the Company’s cash flows in the periods the Company would be required to pay such liability.
ITEM 4. MINE SAFETY DISCLOSURES
Not applicable.
16
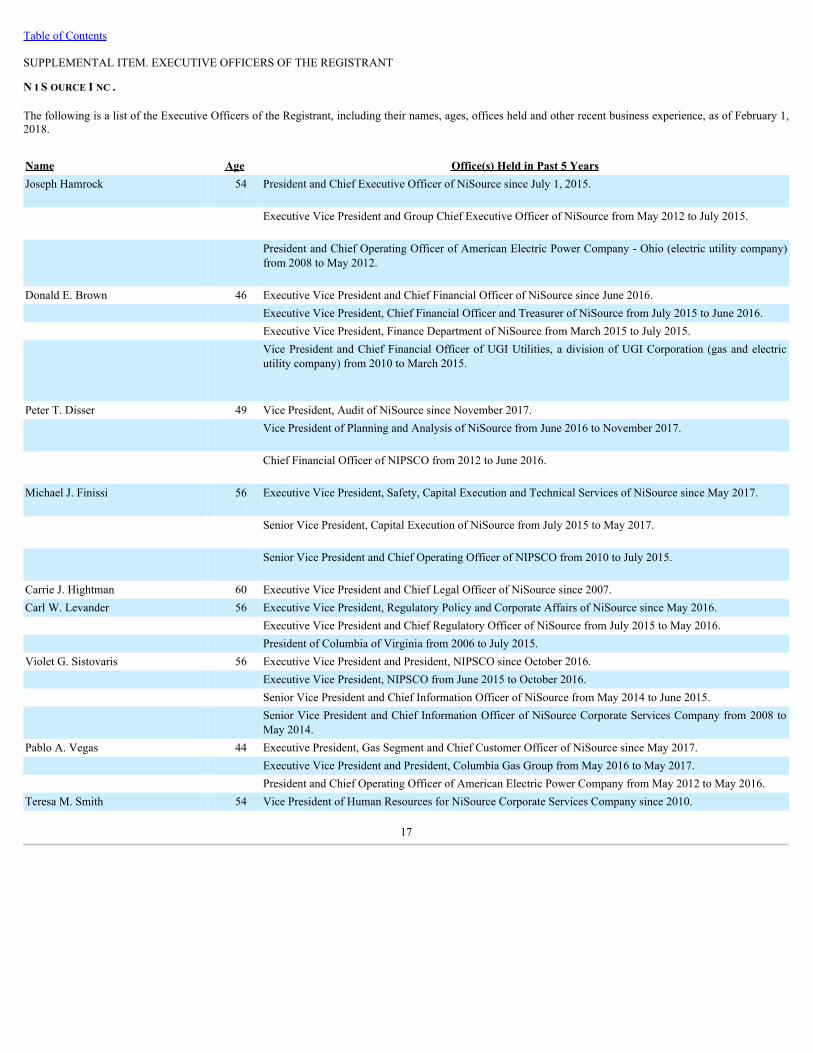
Table of Contents
SUPPLEMENTAL ITEM. EXECUTIVE OFFICERS OF THE REGISTRANT
N I S OURCE I NC .
The following is a list of the Executive Officers of the Registrant, including their names, ages, offices held and other recent business experience, as of February 1,2018.
Name Age Office(s) Held in Past 5 YearsJoseph Hamrock
54
President and Chief Executive Officer of NiSource since July 1, 2015.
Executive Vice President and Group Chief Executive Officer of NiSource from May 2012 to July 2015.
President and Chief Operating Officer of American Electric Power Company - Ohio (electric utility company)from 2008 to May 2012.
Donald E. Brown 46 Executive Vice President and Chief Financial Officer of NiSource since June 2016. Executive Vice President, Chief Financial Officer and Treasurer of NiSource from July 2015 to June 2016. Executive Vice President, Finance Department of NiSource from March 2015 to July 2015.
Vice President and Chief Financial Officer of UGI Utilities, a division of UGI Corporation (gas and electricutility company) from 2010 to March 2015.
Peter T. Disser 49 Vice President, Audit of NiSource since November 2017.
Vice President of Planning and Analysis of NiSource from June 2016 to November 2017.
Chief Financial Officer of NIPSCO from 2012 to June 2016.
Michael J. Finissi
56 Executive Vice President, Safety, Capital Execution and Technical Services of NiSource since May 2017.
Senior Vice President, Capital Execution of NiSource from July 2015 to May 2017.
Senior Vice President and Chief Operating Officer of NIPSCO from 2010 to July 2015.
Carrie J. Hightman 60 Executive Vice President and Chief Legal Officer of NiSource since 2007.Carl W. Levander 56 Executive Vice President, Regulatory Policy and Corporate Affairs of NiSource since May 2016. Executive Vice President and Chief Regulatory Officer of NiSource from July 2015 to May 2016. President of Columbia of Virginia from 2006 to July 2015.Violet G. Sistovaris 56 Executive Vice President and President, NIPSCO since October 2016. Executive Vice President, NIPSCO from June 2015 to October 2016. Senior Vice President and Chief Information Officer of NiSource from May 2014 to June 2015.
Senior Vice President and Chief Information Officer of NiSource Corporate Services Company from 2008 toMay 2014.
Pablo A. Vegas 44 Executive President, Gas Segment and Chief Customer Officer of NiSource since May 2017. Executive Vice President and President, Columbia Gas Group from May 2016 to May 2017. President and Chief Operating Officer of American Electric Power Company from May 2012 to May 2016.Teresa M. Smith 54 Vice President of Human Resources for NiSource Corporate Services Company since 2010.
17
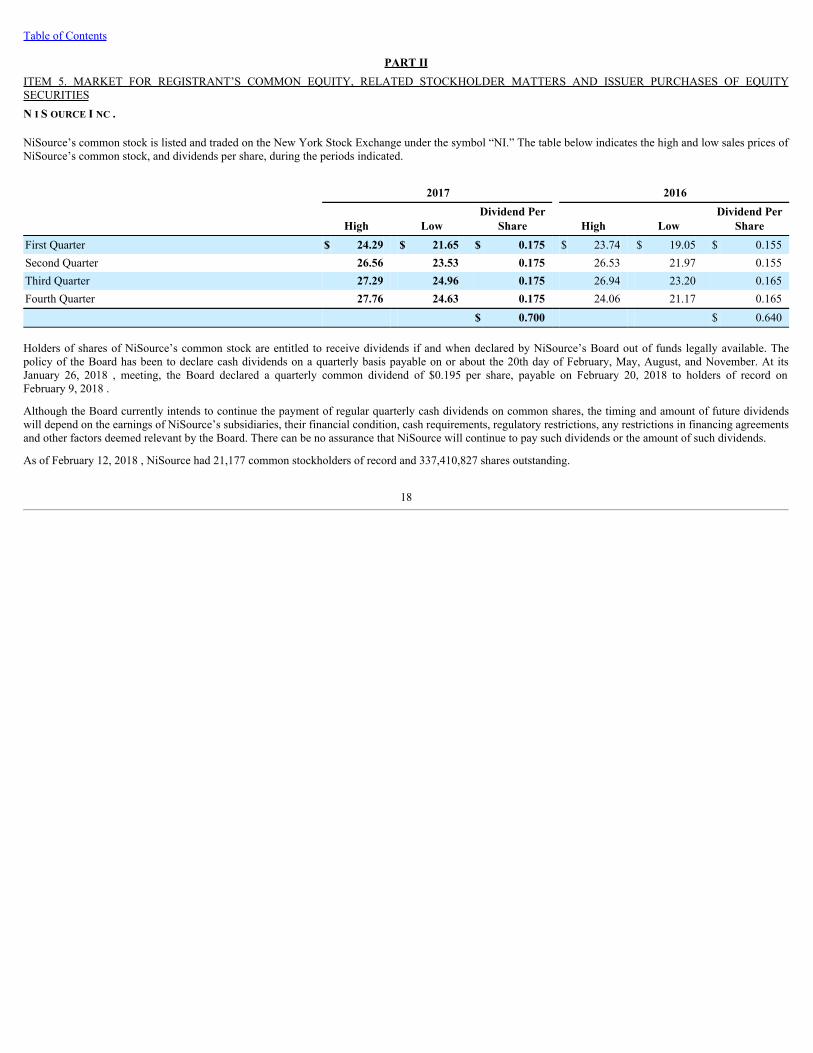
Table of Contents
PART IIITEM 5. MARKET FOR REGISTRANT’S COMMON EQUITY, RELATED STOCKHOLDER MATTERS AND ISSUER PURCHASES OF EQUITYSECURITIESN I S OURCE I NC .
NiSource’s common stock is listed and traded on the New York Stock Exchange under the symbol “NI.” The table below indicates the high and low sales prices ofNiSource’s common stock, and dividends per share, during the periods indicated.
2017 2016
High Low Dividend Per
Share High Low Dividend Per
ShareFirst Quarter $ 24.29 $ 21.65 $ 0.175 $ 23.74 $ 19.05 $ 0.155Second Quarter 26.56 23.53 0.175 26.53 21.97 0.155Third Quarter 27.29 24.96 0.175 26.94 23.20 0.165Fourth Quarter 27.76 24.63 0.175 24.06 21.17 0.165 $ 0.700 $ 0.640
Holders of shares of NiSource’s common stock are entitled to receive dividends if and when declared by NiSource’s Board out of funds legally available. Thepolicy of the Board has been to declare cash dividends on a quarterly basis payable on or about the 20th day of February, May, August, and November. At itsJanuary 26, 2018 , meeting, the Board declared a quarterly common dividend of $0.195 per share, payable on February 20, 2018 to holders of record onFebruary 9, 2018 .
Although the Board currently intends to continue the payment of regular quarterly cash dividends on common shares, the timing and amount of future dividendswill depend on the earnings of NiSource’s subsidiaries, their financial condition, cash requirements, regulatory restrictions, any restrictions in financing agreementsand other factors deemed relevant by the Board. There can be no assurance that NiSource will continue to pay such dividends or the amount of such dividends.
As of February 12, 2018 , NiSource had 21,177 common stockholders of record and 337,410,827 shares outstanding.
18
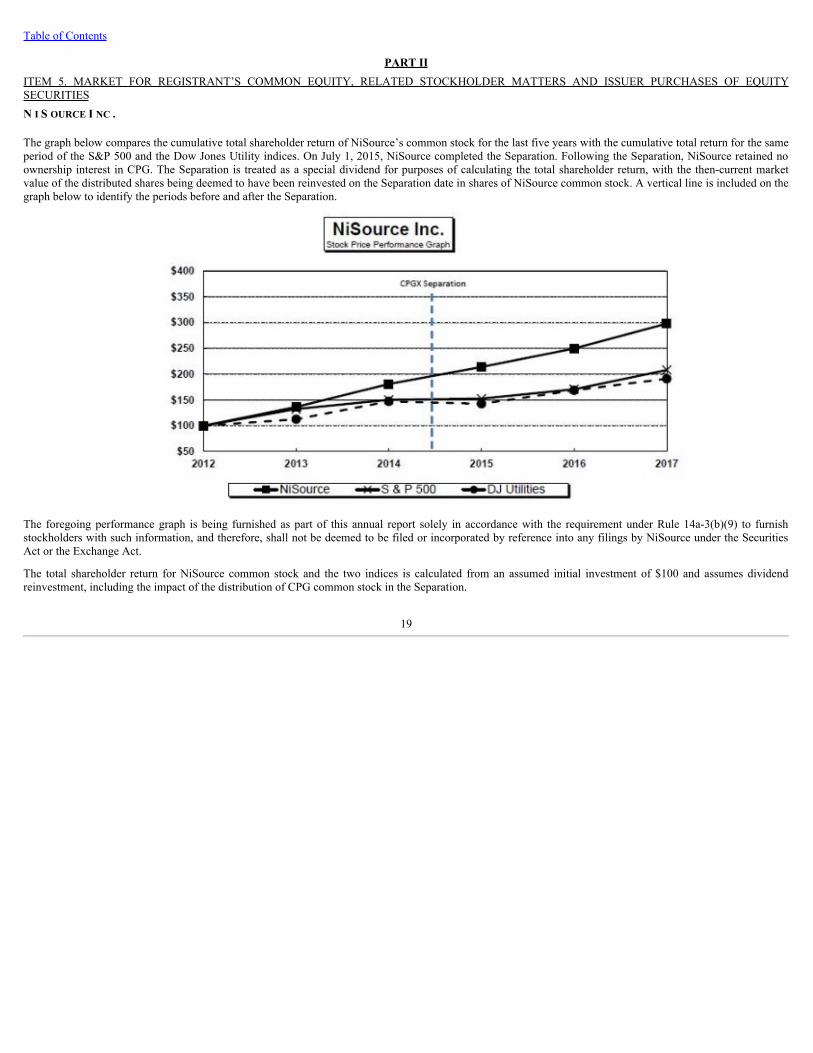
Table of Contents
PART IIITEM 5. MARKET FOR REGISTRANT’S COMMON EQUITY, RELATED STOCKHOLDER MATTERS AND ISSUER PURCHASES OF EQUITYSECURITIESN I S OURCE I NC .
The graph below compares the cumulative total shareholder return of NiSource’s common stock for the last five years with the cumulative total return for the sameperiod of the S&P 500 and the Dow Jones Utility indices. On July 1, 2015, NiSource completed the Separation. Following the Separation, NiSource retained noownership interest in CPG. The Separation is treated as a special dividend for purposes of calculating the total shareholder return, with the then-current marketvalue of the distributed shares being deemed to have been reinvested on the Separation date in shares of NiSource common stock. A vertical line is included on thegraph below to identify the periods before and after the Separation.
The foregoing performance graph is being furnished as part of this annual report solely in accordance with the requirement under Rule 14a-3(b)(9) to furnishstockholders with such information, and therefore, shall not be deemed to be filed or incorporated by reference into any filings by NiSource under the SecuritiesAct or the Exchange Act.
The total shareholder return for NiSource common stock and the two indices is calculated from an assumed initial investment of $100 and assumes dividendreinvestment, including the impact of the distribution of CPG common stock in the Separation.
19
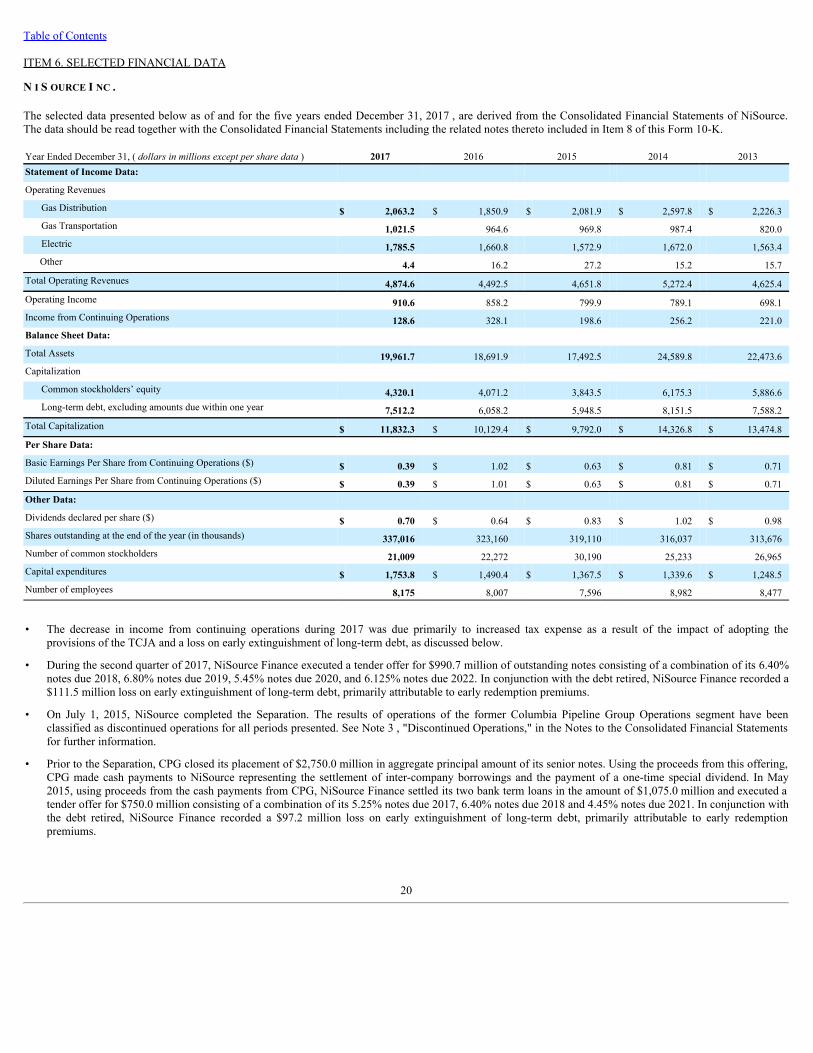
Table of Contents
ITEM 6. SELECTED FINANCIAL DATA
N I S OURCE I NC .
The selected data presented below as of and for the five years ended December 31, 2017 , are derived from the Consolidated Financial Statements of NiSource.The data should be read together with the Consolidated Financial Statements including the related notes thereto included in Item 8 of this Form 10-K.
Year Ended December 31, ( dollarsinmillionsexceptpersharedata) 2017 2016 2015 2014 2013Statement of Income Data: Operating Revenues
Gas Distribution $ 2,063.2 $ 1,850.9 $ 2,081.9 $ 2,597.8 $ 2,226.3Gas Transportation 1,021.5 964.6 969.8 987.4 820.0Electric 1,785.5 1,660.8 1,572.9 1,672.0 1,563.4
Other 4.4 16.2 27.2 15.2 15.7Total Operating Revenues 4,874.6 4,492.5 4,651.8 5,272.4 4,625.4Operating Income 910.6 858.2 799.9 789.1 698.1Income from Continuing Operations 128.6 328.1 198.6 256.2 221.0Balance Sheet Data: Total Assets 19,961.7 18,691.9 17,492.5 24,589.8 22,473.6Capitalization
Common stockholders’ equity 4,320.1 4,071.2 3,843.5 6,175.3 5,886.6Long-term debt, excluding amounts due within one year 7,512.2 6,058.2 5,948.5 8,151.5 7,588.2
Total Capitalization $ 11,832.3 $ 10,129.4 $ 9,792.0 $ 14,326.8 $ 13,474.8Per Share Data: Basic Earnings Per Share from Continuing Operations ($) $ 0.39 $ 1.02 $ 0.63 $ 0.81 $ 0.71Diluted Earnings Per Share from Continuing Operations ($) $ 0.39 $ 1.01 $ 0.63 $ 0.81 $ 0.71Other Data: Dividends declared per share ($) $ 0.70 $ 0.64 $ 0.83 $ 1.02 $ 0.98Shares outstanding at the end of the year (in thousands) 337,016 323,160 319,110 316,037 313,676Number of common stockholders 21,009 22,272 30,190 25,233 26,965Capital expenditures $ 1,753.8 $ 1,490.4 $ 1,367.5 $ 1,339.6 $ 1,248.5Number of employees 8,175 8,007 7,596 8,982 8,477
• The decrease in income from continuing operations during 2017 was due primarily to increased tax expense as a result of the impact of adopting theprovisions of the TCJA and a loss on early extinguishment of long-term debt, as discussed below.
• During the second quarter of 2017, NiSource Finance executed a tender offer for $990.7 million of outstanding notes consisting of a combination of its 6.40%notes due 2018, 6.80% notes due 2019, 5.45% notes due 2020, and 6.125% notes due 2022. In conjunction with the debt retired, NiSource Finance recorded a$111.5 million loss on early extinguishment of long-term debt, primarily attributable to early redemption premiums.
• On July 1, 2015, NiSource completed the Separation. The results of operations of the former Columbia Pipeline Group Operations segment have beenclassified as discontinued operations for all periods presented. See Note 3 , "Discontinued Operations," in the Notes to the Consolidated Financial Statementsfor further information.
• Prior to the Separation, CPG closed its placement of $2,750.0 million in aggregate principal amount of its senior notes. Using the proceeds from this offering,CPG made cash payments to NiSource representing the settlement of inter-company borrowings and the payment of a one-time special dividend. In May2015, using proceeds from the cash payments from CPG, NiSource Finance settled its two bank term loans in the amount of $1,075.0 million and executed atender offer for $750.0 million consisting of a combination of its 5.25% notes due 2017, 6.40% notes due 2018 and 4.45% notes due 2021. In conjunction withthe debt retired, NiSource Finance recorded a $97.2 million loss on early extinguishment of long-term debt, primarily attributable to early redemptionpremiums.
20
Table of Contents
ITEM 7. MANAGEMENT’S DISCUSSION AND ANALYSIS OF FINANCIAL CONDITION AND RESULTS OF OPERATIONS
N I S OURCE I NC .
Index PageExecutive Summary 21
Summary of Consolidated Financial Results 21Results and Discussion of Segment Operations 25
Gas Distribution Operations 26Electric Operations 29
Liquidity and Capital Resources 33Off Balance Sheet Arrangements 36Market Risk Disclosures 37Other Information 38
EXECUTIVE SUMMARY
This Management’s Discussion and Analysis of Financial Condition and Results of Operations (Management’s Discussion) analyzes the financial condition, resultsof operations and cash flows of NiSource and its subsidiaries. It also includes management’s analysis of past financial results and certain potential factors that mayaffect future results, potential future risks and approaches that may be used to manage those risks. See "Note regarding forward-looking statements" at thebeginning of this report for a list of factors that may cause results to differ materially.
Management’s Discussion is designed to provide an understanding of NiSource's operations and financial performance and should be read in conjunction with theCompany's Consolidated Financial Statements and related Notes to Consolidated Financial Statements in this annual report.
NiSource is an energy holding company under the Public Utility Holding Company Act of 2005 whose subsidiaries are fully regulated natural gas and electricutility companies serving customers in seven states. NiSource generates substantially all of its operating income through these rate-regulated businesses which aresummarized for financial reporting purposes into two primary reportable segments: Gas Distribution Operations and Electric Operations.
Refer to the “Business” section under Item 1 of this annual report and Note 22, "Segments of Business," in the Notes to the Consolidated Financial Statements forfurther discussion of NiSource's regulated utility business segments.
NiSource’s goal is to develop strategies that benefit all stakeholders as it addresses changing customer conservation patterns, develops more contemporary pricingstructures and embarks on long-term infrastructure investment programs. These strategies are intended to improve reliability and safety, enhance customer servicesand reduce emissions while generating sustainable returns. Additionally, NiSource continues to pursue regulatory and legislative initiatives that will allowresidential customers not currently on NiSource's system to obtain gas service in a cost effective manner.
Summary of Consolidated Financial Results
NiSource's operations are affected by the cost of sales. Cost of sales for the Gas Distribution Operations segment is principally comprised of the cost of natural gasused while providing transportation and distribution services to customers. Cost of sales for the Electric Operations segment is comprised of the cost of coal,related handling costs, natural gas purchased for the internal generation of electricity at NIPSCO and the cost of power purchased from third-party generators ofelectricity.
The majority of the cost of sales are tracked costs that are passed through directly to the customer resulting in an equal and offsetting amount reflected in operatingrevenues. As a result, NiSource believes net revenues, a non-GAAP financial measure defined as operating revenues less cost of sales (excluding depreciation andamortization), provides management and investors a useful measure to analyze profitability. The presentation of net revenues herein is intended to providesupplemental information for investors regarding operating performance. Net revenues do not intend to represent operating income, the most comparable GAAPmeasure, as an indicator of operating performance and is not necessarily comparable to similarly titled measures reported by other companies.
21
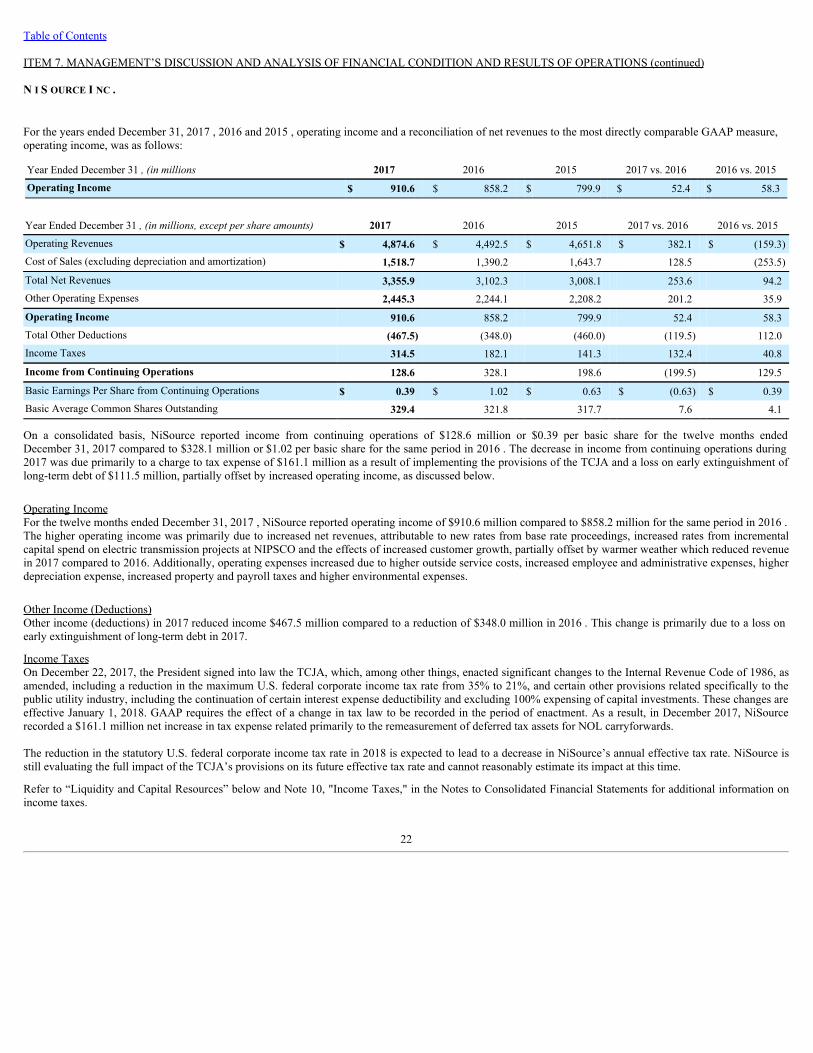
Table of Contents
ITEM 7. MANAGEMENT’S DISCUSSION AND ANALYSIS OF FINANCIAL CONDITION AND RESULTS OF OPERATIONS (continued)
N I S OURCE I NC .
For the years ended December 31, 2017 , 2016 and 2015 , operating income and a reconciliation of net revenues to the most directly comparable GAAP measure,operating income, was as follows:
Year Ended December 31 ,(inmillions 2017 2016 2015 2017 vs. 2016 2016 vs. 2015
Operating Income $ 910.6 $ 858.2 $ 799.9 $ 52.4 $ 58.3
Year Ended December 31 ,(inmillions,exceptpershareamounts) 2017 2016 2015 2017 vs. 2016 2016 vs. 2015
Operating Revenues $ 4,874.6 $ 4,492.5 $ 4,651.8 $ 382.1 $ (159.3)Cost of Sales (excluding depreciation and amortization) 1,518.7 1,390.2 1,643.7 128.5 (253.5)
Total Net Revenues 3,355.9 3,102.3 3,008.1 253.6 94.2Other Operating Expenses 2,445.3 2,244.1 2,208.2 201.2 35.9
Operating Income 910.6 858.2 799.9 52.4 58.3Total Other Deductions (467.5) (348.0) (460.0) (119.5) 112.0Income Taxes 314.5 182.1 141.3 132.4 40.8
Income from Continuing Operations 128.6 328.1 198.6 (199.5) 129.5
Basic Earnings Per Share from Continuing Operations $ 0.39 $ 1.02 $ 0.63 $ (0.63) $ 0.39Basic Average Common Shares Outstanding 329.4 321.8 317.7 7.6 4.1
On a consolidated basis, NiSource reported income from continuing operations of $128.6 million or $0.39 per basic share for the twelve months endedDecember 31, 2017 compared to $328.1 million or $1.02 per basic share for the same period in 2016 . The decrease in income from continuing operations during2017 was due primarily to a charge to tax expense of $161.1 million as a result of implementing the provisions of the TCJA and a loss on early extinguishment oflong-term debt of $111.5 million, partially offset by increased operating income, as discussed below.
Operating IncomeFor the twelve months ended December 31, 2017 , NiSource reported operating income of $910.6 million compared to $858.2 million for the same period in 2016 .The higher operating income was primarily due to increased net revenues, attributable to new rates from base rate proceedings, increased rates from incrementalcapital spend on electric transmission projects at NIPSCO and the effects of increased customer growth, partially offset by warmer weather which reduced revenuein 2017 compared to 2016. Additionally, operating expenses increased due to higher outside service costs, increased employee and administrative expenses, higherdepreciation expense, increased property and payroll taxes and higher environmental expenses.
Other Income (Deductions)Other income (deductions) in 2017 reduced income $467.5 million compared to a reduction of $348.0 million in 2016 . This change is primarily due to a loss onearly extinguishment of long-term debt in 2017.
Income TaxesOn December 22, 2017, the President signed into law the TCJA, which, among other things, enacted significant changes to the Internal Revenue Code of 1986, asamended, including a reduction in the maximum U.S. federal corporate income tax rate from 35% to 21%, and certain other provisions related specifically to thepublic utility industry, including the continuation of certain interest expense deductibility and excluding 100% expensing of capital investments. These changes areeffective January 1, 2018. GAAP requires the effect of a change in tax law to be recorded in the period of enactment. As a result, in December 2017, NiSourcerecorded a $161.1 million net increase in tax expense related primarily to the remeasurement of deferred tax assets for NOL carryforwards.
The reduction in the statutory U.S. federal corporate income tax rate in 2018 is expected to lead to a decrease in NiSource’s annual effective tax rate. NiSource isstill evaluating the full impact of the TCJA’s provisions on its future effective tax rate and cannot reasonably estimate its impact at this time.
Refer to “Liquidity and Capital Resources” below and Note 10, "Income Taxes," in the Notes to Consolidated Financial Statements for additional information onincome taxes.
22
Table of Contents
ITEM 7. MANAGEMENT’S DISCUSSION AND ANALYSIS OF FINANCIAL CONDITION AND RESULTS OF OPERATIONS (continued)
N I S OURCE I NC .
Capital InvestmentIn 2017 , NiSource invested approximately $1.7 billion in cash capital expenditures across its gas and electric utilities. These expenditures were primarily aimed atfurthering the safety and reliability of the Company's gas distribution system, construction of new electric transmission assets and maintaining NiSource’s existingelectric generation fleet. NiSource continues to execute on an estimated $30 billion in total projected long-term regulated utility infrastructure investments andexpects to invest approximately $1.7 to $1.8 billion in capital during 2018 to continue to modernize and improve its system across all seven states.
LiquidityAs discussed in further detail below in “Liquidity and Capital Resources,” the enactment of the TCJA will have an unfavorable impact on NiSource’s liquiditybeginning in 2018; however, NiSource believes that through income generated from operating activities, amounts available under its short-term revolving creditfacility, commercial paper program, accounts receivable securitization facilities, long-term debt agreements and NiSource’s ability to access the capital markets,there is adequate capital available to fund its operating activities and capital expenditures in 2018 and beyond. At December 31, 2017 and 2016 , NiSource hadapproximately $998.9 million and $683.7 million , respectively, of net liquidity available, consisting of cash and available capacity under credit facilities.
These factors and other impacts to the financial results are discussed in more detail within the following discussions of “Results and Discussion of SegmentOperations” and “Liquidity and Capital Resources.”
Regulatory DevelopmentsIn 2017 , NiSource continued to move forward on core infrastructure and environmental investment programs supported by complementary regulatory andcustomer initiatives across all seven states of its operating area. The discussion below summarizes significant regulatory developments that transpired during 2017:
GasDistributionOperations.
• NIPSCO's base rate case remains pending before the IURC. The request, which seeks NIPSCO's first natural gas base rate increase in more than 25 years,supports continued investment in system upgrades, technology improvements and other measures to increase pipeline safety and system reliability.Inclusive of various tracker programs, the case seeks an annual revenue increase of $117.9 million, which includes the impact of federal tax reform. Anorder is expected in the second half of 2018.
• Columbia of Ohio's pending settlement agreement to continue its IRP for a five-year extension was approved by the PUCO on January 31, 2018. Thiswell-established pipeline replacement program covers replacement of priority mainline pipe and targeted customer service lines.
• NIPSCO continues to execute on its seven-year, $850 million gas infrastructure modernization program to further improve system reliability and safety.On December 28, 2017 the IURC approved the latest tracker update request, covering $59.0 million of investments made in the first half of 2017.
• New rates went into effect on October 27, 2017 following approval of Columbia of Maryland's base rate case settlement by the MPSC. The settlementsupports continued accelerated replacement of aging pipe as well as adoption of additional pipeline safety upgrades and increases annual revenue by $2.4million.
• On October 31, 2017, Columbia of Massachusetts filed its GSEP for the 2018 construction year. Columbia of Massachusetts is proposing to recoverincremental revenue of $9.7 million including a waiver to collect the $3.1 million revenue requirement in excess of the GSEP cap provision. If the waiveris not approved, the revenue requirement will be $6.6 million. An order is expected from the Massachusetts DPU in the second quarter of 2018, with newrates effective May 1, 2018.
• On March 17, 2017 the VSCC, by final order, approved a settlement agreement without modification in Columbia of Virginia's 2016 base rate case. Thesettlement allows for a $28.5 million annual revenue increase and for Columbia of Virginia to recover investments that improve the overall safety andreliability of its distribution system. The case also supported the growth of Columbia of Virginia's system driven by increased customer demand forservice. Columbia of Virginia implemented interim base rates, subject to refund, on September 28, 2016. Under the terms of the final order, during 2017Columbia of Virginia refunded the difference between the interim customer rates implemented in 2016 and the rates approved by the final order.
23
Table of Contents
ITEM 7. MANAGEMENT’S DISCUSSION AND ANALYSIS OF FINANCIAL CONDITION AND RESULTS OF OPERATIONS (continued)
N I S OURCE I NC .
• On April 26, 2017 the PUCO approved Columbia of Ohio's annual IRP rider adjustment. This order supports the continuation of significant infrastructureinvestment and allows for $31.5 million in increased annual revenues on $235.9 million of investment.
ElectricOperations.
• NIPSCO continues to execute on its seven-year electric infrastructure modernization program, which includes enhancements to its electric transmissionand distribution system designed to further improve system safety and reliability. The IURC-approved program represents approximately $1.25 billion ofelectric infrastructure investments expected to be made through 2022. On October 31, 2017 the IURC approved NIPSCO's latest tracker update request,covering $133.6 million in investments from May 2016 through April 2017.
• On December 13, 2017, the IURC approved a settlement in NIPSCO's November 2016 request to invest in environmental upgrades at its Michigan CityUnit 12 and R.M. Schahfer Units 14 and 15 generating facilities. The settlement included authority and cost recovery for the Company's approximately$193 million of CCR projects.
• As part of its 2016 IRP, NIPSCO remains on schedule with its planned May 2018 retirement of Bailly Generating Station units 7 and 8. The retirement ispart of NIPSCO’s plan to retire 50 percent of its coal-fired generating fleet by the end of 2023.
Refer to Note 8 , “Regulatory Matters” and Note 18 -E, "Other Matters," in the Notes to Consolidated Financial Statements for a complete discussion of keyregulatory developments that transpired during 2017 .
24

Table of Contents
RESULTS AND DISCUSSION OF SEGMENT OPERATIONS
Presentation of Segment InformationNiSource’s operations are divided into two primary reportable segments: Gas Distribution Operations and Electric Operations.
25
Table of Contents
ITEM 7. MANAGEMENT’S DISCUSSION AND ANALYSIS OF FINANCIAL CONDITION AND RESULTS OF OPERATIONS (continued)
N I S OURCE I NC .Gas Distribution Operations
For the years ended December 31, 2017 , 2016 and 2015 , operating income and a reconciliation of net revenues to the most directly comparable GAAP measure,operating income, was as follows:
Year Ended December 31 ,(inmillions 2017 2016 2015 2017 vs. 2016 2016 vs. 2015
Operating Income $ 545.6 $ 574.0 $ 555.8 $ (28.4) $ 18.2
Year Ended December 31, (dollarsinmillions) 2017 2016 2015 2017 vs. 2016 2016 vs. 2015
Net Revenues Operating revenues $ 3,102.1 $ 2,830.6 $ 3,069.1 $ 271.5 $ (238.5)Less: Cost of sales (excluding depreciation and amortization) 1,005.0 895.4 1,155.5 109.6 (260.1)
Net Revenues 2,097.1 1,935.2 1,913.6 161.9 21.6
Operating Expenses Operation and maintenance 1,095.3 937.2 945.3 158.1 (8.1)Depreciation and amortization 269.3 252.9 232.6 16.4 20.3Loss on sale of assets and impairments, net 2.8 — 0.8 2.8 (0.8)Other taxes 184.1 171.1 179.1 13.0 (8.0)
Total Operating Expenses 1,551.5 1,361.2 1,357.8 190.3 3.4
Operating Income $ 545.6 $ 574.0 $ 555.8 $ (28.4) $ 18.2
Revenues Residential $ 2,029.4 $ 1,823.4 $ 2,055.2 $ 206.0 $ (231.8)Commercial 669.4 588.1 691.4 81.3 (103.3)Industrial 217.5 194.3 217.6 23.2 (23.3)Off-System 111.8 94.4 87.3 17.4 7.1Other 74.0 130.4 17.6 (56.4) 112.8
Total $ 3,102.1 $ 2,830.6 $ 3,069.1 $ 271.5 $ (238.5)
Sales and Transportation (MMDth) Residential 247.1 248.9 262.0 (1.8) (13.1)Commercial 169.3 165.6 171.5 3.7 (5.9)Industrial 517.5 517.7 522.7 (0.2) (5.0)Off-System 39.0 39.6 32.7 (0.6) 6.9Other 0.3 (0.1) (0.2) 0.4 0.1
Total 973.2 971.7 988.7 1.5 (17.0)
Heating Degree Days 4,927 5,148 5,459 (221) (311)Normal Heating Degree Days 5,610 5,642 5,610 (32) 32% Warmer than Normal (12)% (9)% (3)% Gas Distribution Customers
Residential 3,168,516 3,141,736 3,113,337 26,780 28,399Commercial 280,362 279,556 277,239 806 2,317Industrial 6,228 6,240 6,465 (12) (225)Other 4 — — 4 —
Total 3,455,110 3,427,532 3,397,041 27,578 30,491
26
Table of Contents
ITEM 7. MANAGEMENT’S DISCUSSION AND ANALYSIS OF FINANCIAL CONDITION AND RESULTS OF OPERATIONS (continued)
N I S OURCE I NC .Gas Distribution Operations (continued)
Comparability of line item operating results may be impacted by regulatory, tax and depreciation trackers (other than those for cost of sales) that allow for therecovery in rates of certain costs. Therefore, increases in these tracked operating expenses are offset by increases in net revenues and have essentially no impact onincome from continuing operations.
2017 vs. 2016 Operating IncomeFor 2017 , Gas Distribution Operations reported operating income of $545.6 million , a decrease of $28.4 million from the comparable 2016 period.
Net revenues for 2017 were $2,097.1 million , an increase of $161.9 million from the same period in 2016 . The change in net revenues was primarily driven by:
• New rates from base-rate proceedings and infrastructure replacement programs of $124.2 million.• Higher regulatory, tax and depreciation trackers, which are offset in expense, of $26.9 million.• The effects of increased customer growth of $10.3 million.• Higher revenues from increased industrial usage of $5.8 million.
Operating expenses were $190.3 million higher in 2017 compared to 2016 . This change was primarily driven by:
• Increased employee and administrative expenses of $62.2 million.• Higher outside service costs of $52.8 million due to IT service provider transition costs, increased spend on strategic initiatives to enhance safety,
reliability and customer value and higher pipeline maintenance expenses.• Increased regulatory, tax and depreciation trackers, which are offset in net revenues, of $26.9 million.• Higher depreciation of $15.2 million due to increased capital expenditures placed in service.• Increased property taxes of $8.1 million due to higher capital expenditures placed in service and an accrual adjustment recorded in 2016.• Higher environmental costs of $4.7 million.• Increased materials and supplies expenses of $3.4 million from maintenance-related activities.
2016 vs. 2015 Operating IncomeFor 2016 , Gas Distribution Operations reported operating income of $574.0 million , an increase of $18.2 million from the comparable 2015 period.
Net revenues for 2016 were $1,935.2 million, an increase of $21.6 million from the same period in 2015 . The change in net revenues was primarily driven by:
• New rates from base-rate proceedings and infrastructure replacement programs of $95.1 million.• The effects of increased customer count of $9.6 million.
Partially offset by:
• Lower regulatory, tax and depreciation trackers, which are offset in expense, of $52.8 million.• The effects of warmer weather of $12.4 million.• Decreased commercial, industrial and residential usage of $8.8 million.• Lower forfeited discount and late payment collections of $3.9 million.
Operating expenses were $3.4 million higher in 2016 compared to 2015 . This change was primarily driven by:
• Increased employee and administrative expenses of $26.1 million.• Higher depreciation of $19.8 million due to increased capital expenditures placed in service.• Increased outside service costs of $13.4 million.• Higher rental expense of $2.6 million.
Partially offset by:
• Lower regulatory, tax and depreciation trackers, which are offset in net revenues, of $52.8 million.• Decreased gross receipts taxes of $2.8 million.
27
Table of Contents
ITEM 7. MANAGEMENT’S DISCUSSION AND ANALYSIS OF FINANCIAL CONDITION AND RESULTS OF OPERATIONS (continued)
N I S OURCE I NC .Gas Distribution Operations (continued)
WeatherIn general, NiSource calculates the weather-related revenue variance based on changing customer demand driven by weather variance from normal heating degreedays. NiSource's composite heating degree days reported do not directly correlate to the weather-related dollar impact on the results of Gas DistributionOperations. Heating degree days experienced during different times of the year or in different operating locations may have more or less impact on volume anddollars depending on when and where they occur. When the detailed results are combined for reporting, there may be weather-related dollar impacts on operationswhen there is not an apparent or significant change in the aggregated NiSource composite heating degree day comparison.
Weather in the Gas Distribution Operations service territories for 2017 was about 12% warmer than normal and about 4% warmer than 2016 , decreasing netrevenues $1.7 million for the year ended December 31, 2017 compared to 2016 .
Weather in the Gas Distribution Operations service territories for 2016 was about 9% warmer than normal and about 6% warmer than 2015 , decreasing netrevenues $12.4 million for the year ended December 31, 2016 compared to 2015 .
ThroughputTotal volumes sold and transported for the year ended December 31, 2017 were 973.2 MMDth, compared to 971.7 MMDth for 2016 .
Total volumes sold and transported for the year ended December 31, 2016 were 971.7 MMDth, compared to 988.7 MMDth for 2015 . This decrease is primarilyattributable to warmer weather experienced in 2016 compared to 2015 .
Economic ConditionsAll NiSource Gas Distribution Operations companies have state-approved recovery mechanisms that provide a means for full recovery of prudently incurred gascosts. As noted above, gas costs are treated as pass-through costs and have no impact on the net revenues recorded in the period. The gas costs included in revenuesare matched with the gas cost expense recorded in the period and the difference is recorded on the Consolidated Balance Sheets as under-recovered or over-recovered gas cost to be included in future customer billings.
At NIPSCO, sales revenues and customer billings are adjusted for amounts related to under and over-recovered purchased gas costs from prior periods perregulatory order. These amounts are primarily reflected in the “Other” operating revenues statistic provided at the beginning of this segment discussion. Theadjustments to other operating revenues for the twelve months ended December 31, 2017 , 2016 and 2015 were a revenue decrease of $4.8 million, a revenueincrease of $43.3 million and a revenue decrease of $68.0 million, respectively.
Certain Gas Distribution Operations companies continue to offer choice opportunities, where customers can choose to purchase gas from a third-party supplier,through regulatory initiatives in their respective jurisdictions. These programs serve to further reduce NiSource's exposure to gas prices.
28
Table of Contents
ITEM 7. MANAGEMENT’S DISCUSSION AND ANALYSIS OF FINANCIAL CONDITION AND RESULTS OF OPERATIONS (continued)
N I S OURCE I NC .Electric Operations
For the years ended December 31, 2017 , 2016 and 2015 , operating income and a reconciliation of net revenues to the most directly comparable GAAP measure,operating income, was as follows:
Year Ended December 31 ,(inmillions 2017 2016 2015 2017 vs. 2016 2016 vs. 2015
Operating Income $ 364.8 $ 291.4 $ 264.4 $ 73.4 $ 27.0
Year Ended December 31, (dollarsinmillions) 2017 2016 2015 2017 vs. 2016 2016 vs. 2015
Net Revenues Operating revenues $ 1,786.5 $ 1,661.6 $ 1,574.4 $ 124.9 $ 87.2Less: Cost of sales (excluding depreciation and amortization) 513.9 495.0 488.4 18.9 6.6
Net Revenues 1,272.6 1,166.6 1,086.0 106.0 80.6
Operating Expenses Operation and maintenance 568.2 538.8 490.1 29.4 48.7Depreciation and amortization 277.8 274.5 267.7 3.3 6.8Loss on sale of assets and impairments, net 1.9 — — 1.9 —Other taxes 59.9 61.9 63.8 (2.0) (1.9)
Total Operating Expenses 907.8 875.2 821.6 32.6 53.6
Operating Income $ 364.8 $ 291.4 $ 264.4 $ 73.4 $ 27.0
Revenues Residential $ 476.9 $ 457.4 $ 427.1 $ 19.5 $ 30.3Commercial 501.2 456.6 445.4 44.6 11.2Industrial 698.1 631.6 646.3 66.5 (14.7)Wholesale 11.6 11.6 16.4 — (4.8)Other 98.7 104.4 39.2 (5.7) 65.2
Total $ 1,786.5 $ 1,661.6 $ 1,574.4 $ 124.9 $ 87.2
Sales (Gigawatt Hours) Residential 3,301.7 3,514.8 3,309.9 (213.1) 204.9Commercial 3,793.5 3,878.7 3,866.8 (85.2) 11.9Industrial 9,469.7 9,281.8 9,249.1 187.9 32.7Wholesale 32.5 19.0 194.8 13.5 (175.8)Other 128.2 136.9 137.7 (8.7) (0.8)
Total 16,725.6 16,831.2 16,758.3 (105.6) 72.9
Cooling Degree Days 837 988 762 (151) 226Normal Cooling Degree Days 806 806 806 — —% Warmer (Cooler) than Normal 4% 23% (5)% Electric Customers
Residential 409,401 407,268 404,889 2,133 2,379Commercial 56,134 55,605 55,053 529 552Industrial 2,305 2,313 2,343 (8) (30)Wholesale 739 744 743 (5) 1Other 2 2 6 — (4)
Total 468,581 465,932 463,034 2,649 2,898
29
Table of Contents
ITEM 7. MANAGEMENT’S DISCUSSION AND ANALYSIS OF FINANCIAL CONDITION AND RESULTS OF OPERATIONS (continued)
N I S OURCE I NC .Electric Operations (continued)
Comparability of line item operating results may be impacted by regulatory and depreciation trackers (other than those for cost of sales) that allow for the recoveryin rates of certain costs. Therefore, increases in these tracked operating expenses are offset by increases in net revenues and have essentially no impact on incomefrom continuing operations.
2017 vs. 2016 Operating IncomeFor 2017 , Electric Operations reported operating income of $364.8 million , an increase of $73.4 million from the comparable 2016 period.
Net revenues for 2017 were $1,272.6 million , an increase of $106.0 million from the same period in 2016 . The change in net revenues was primarily driven by:
• New rates from base-rate proceedings of $63.6 million.• Increased rates from incremental capital spend on electric transmission projects of $24.2 million.• Higher regulatory and depreciation trackers, which are offset in expense, of $18.0 million.• New rates from infrastructure replacement programs of $6.0 million.• The effects of increased customer count of $3.4 million.
Partially offset by:
• The effects of cooler weather of $16.1 million.
Operating expenses were $32.6 million higher in 2017 than 2016 . This change was primarily driven by:
• Higher outside service costs of $20.1 million, primarily due to increased spend on strategic initiatives to enhance safety, reliability and customer value,generation-related maintenance, IT service provider transition costs and vegetation management activities.
• Increased regulatory and depreciation trackers, which are offset in net revenues, of $18.0 million.• Higher employee and administrative expenses of $11.9 million.• Increased depreciation of $5.6 million due to higher capital expenditures placed in service.• Higher materials and supplies expenses of $4.5 million driven by generation-related maintenance.
Partially offset by:
• Plant retirement costs of $22.1 million in 2016.• Decreased amortization of regulatory assets of $10.8 million.
2016 vs. 2015 Operating IncomeFor 2016 , Electric Operations reported operating income of $291.4 million , an increase of $27.0 million from the comparable 2015 period.
Net revenues for 2016 were $1,166.6 million , an increase of $80.6 million from the same period in 2015 . The change in net revenues was primarily driven by:
• New rates from base-rate proceedings of $36.3 million.• Increased regulatory and depreciation trackers, which are offset in expense, of $30.2 million.• Increased rates from incremental capital spend on electric transmission projects of $17.8 million.• The effects of warmer weather of $15.6 million.
Partially offset by:
• The absence of regulatory-deferred MISO cost amortization of $10.2 million.• Increased fuel handling costs of $7.8 million.
Operating expenses were $53.6 million higher in 2016 compared to 2015 . This change was primarily driven by:
• Increased regulatory and depreciation trackers, which are offset in net revenues, of $30.2 million.• Higher outside service costs of $24.4 million, primarily due to generation-related maintenance.
30
Table of Contents
ITEM 7. MANAGEMENT’S DISCUSSION AND ANALYSIS OF FINANCIAL CONDITION AND RESULTS OF OPERATIONS (continued)
N I S OURCE I NC .Electric Operations (continued)
• Plant retirement costs of $22.1 million.
Partially offset by:
• Lower environmental costs of $10.7 million.• Decreased amortization expense of $9.6 million.
WeatherIn general, NiSource calculates the weather-related revenue variance based on changing customer demand driven by weather variance from normal heating orcooling degree days. NiSource's composite heating or cooling degree days reported do not directly correlate to the weather-related dollar impact on the results ofElectric Operations. Heating or cooling degree days experienced during different times of the year may have more or less impact on volume and dollars dependingon when they occur. When the detailed results are combined for reporting, there may be weather-related dollar impacts on operations when there is not an apparentor significant change in the aggregated NiSource composite heating or cooling degree day comparison.
Weather in the Electric Operations’ territories for the twelve months ended December 31, 2017 was 4% warmer than normal and 15% cooler than the same periodin 2016 , leading to a decrease in net revenues of approximately $16.1 million for the twelve months ended December 31, 2017 compared to 2016 .
Weather in the Electric Operations’ territories for the twelve months ended December 31, 2016 was 23% warmer than normal and 30% warmer than the sameperiod in 2015 , leading to an increase in net revenues of approximately $15.6 million for the twelve months ended December 31, 2016 compared to 2015 .
SalesElectric Operations sales were 16,725.6 gwh for 2017 , a decrease of 105.6 gwh, or 0.6% compared to 2016 .
Electric Operations sales were 16,831.2 gwh for 2016 , a increase of 72.9 gwh, or 0.4% compared to 2015 .
Economic ConditionsNIPSCO has a state-approved recovery mechanism that provides a means for full recovery of prudently incurred fuel costs. As noted above, fuel costs are treatedas pass-through costs and have no impact on the net revenues recorded in the period. The fuel costs included in revenues are matched with the fuel cost expenserecorded in the period and the difference is recorded on the Consolidated Balance Sheets as under-recovered or over-recovered fuel cost to be included in futurecustomer billings.
At NIPSCO, sales revenues and customer billings are adjusted for amounts related to under and over-recovered purchased fuel costs from prior periods perregulatory order. These amounts are primarily reflected in the “Other” operating revenues statistic provided at the beginning of this segment discussion. Theadjustments to other operating revenues for the twelve months ended December 31, 2017 , 2016 and 2015 were a revenue decrease of $5.2 million, a revenueincrease of $33.1 million and a revenue decrease of $11.6 million, respectively.
NIPSCO's performance remains closely linked to the performance of the steel industry. NIPSCO’s mwh sales to steel-related industries accounted forapproximately 54.5% and 52.3% of the total industrial mwh sales for the years ended December 31, 2017 and 2016 , respectively.
Electric SupplyNIPSCO2016IntegratedResourcePlan.Environmental, regulatory and economic factors, including low natural gas prices and aging coal-fired units, have ledNIPSCO to pursue modification of its current electric generation supply mix to include less coal-fired generation. Due to enacted CCR and ELG (subsequentlypostponed) regulations, NIPSCO would expect to have incurred over $1 billion in operating, maintenance, environmental and other costs if the current fleet ofcoal-fired generating units were to remain operational.
On November 1, 2016, NIPSCO submitted its 2016 Integrated Resource Plan with the IURC. The plan evaluated demand-side and supply-side resourcealternatives to reliably and cost effectively meet NIPSCO customers' future energy requirements over the ensuing 20 years. The 2016 Integrated Resource Planindicates that the most viable option for customers and NIPSCO involves the retirement of Bailly Generating Station (Units 7 and 8) as soon as mid-2018 and twounits (Units 17 and 18) at the R.M. Schahfer Generating Station by the end of 2023. It is projected over the long term that the cost to customers to retire these unitsat these dates will be lower than maintaining and upgrading them for continuing generation.
31
Table of Contents
ITEM 7. MANAGEMENT’S DISCUSSION AND ANALYSIS OF FINANCIAL CONDITION AND RESULTS OF OPERATIONS (continued)
N I S OURCE I NC .Electric Operations (continued)
NiSource and NIPSCO committed to the retirement of the Bailly Generating Station units in connection with the filing of the 2016 Integrated Resource Plan,pending approval by the MISO. In the fourth quarter of 2016, the MISO approved NIPSCO's plan to retire the Bailly Generating Station units by May 31, 2018. Inaccordance with ASC 980-360, the remaining net book value of the Bailly Generating Station units was reclassified from "Net utility plant" to "Other property, atcost, less accumulated depreciation" on the Consolidated Balance Sheets.
In connection with the MISO's approval of NIPSCO's planned retirement of the Bailly Generating Station units, NiSource recorded $22.1 million of plantretirement-related charges in the fourth quarter of 2016. These charges were comprised of contract termination charges related to NIPSCO's capital lease with PureAir, voluntary employee severance benefits, and write downs of certain materials and supplies inventory balances. These charges are presented within "Operationand maintenance" on the Statements of Consolidated Income.
On February 1, 2018, as previously approved by the MISO, NIPSCO commenced a four-month outage of Bailly Generating Station Unit 8 in order to begin workon converting the unit to a synchronous condenser (a piece of equipment designed to maintain voltage to ensure continued reliability on the transmission system).Approximately $15 million of net book value of Unit 8 remained in “Net Utility Plant” as it is expected to remain used and useful upon completion of thesynchronous condenser, while the remaining net book value of approximately $143 million was reclassified to “Regulatory assets (noncurrent)” on theConsolidated Balance Sheets. These amounts continue to be amortized at a rate consistent with their inclusion in customer rates. NIPSCO expects to complete theretirement of Units 7 and 8 by May 31, 2018. Refer to Note 18 -E, "Other Matters," in the Notes to Consolidated Financial Statements for information.
32
Table of Contents
ITEM 7. MANAGEMENT’S DISCUSSION AND ANALYSIS OF FINANCIAL CONDITION AND RESULTS OF OPERATIONS (continued)
N I S OURCE I NC .
Liquidity and Capital Resources
Operating ActivitiesNet cash from operating activities from continuing operations for the year ended December 31, 2017 was $742.1 million , a decrease of $62.0 million from 2016 .This decrease was driven by $282.3 million of pension plan contributions in 2017, partially offset by a combination of changes in weather, gas prices and therelated approved rates for recovery, which significantly impacted regulatory assets and regulatory liabilities between the two periods as discussed further below.
Net cash from operating activities from continuing operations for the year ended December 31, 2016 was $804.1 million , a decrease of $359.3 million from 2015.This decrease was driven by a combination of changes in weather, gas prices and the related approved rates for recovery, which significantly impacted regulatoryassets, regulatory liabilities and working capital between the two periods. During 2015, natural gas prices were declining faster than the gas cost adjustments beingcollected from customers, resulting in an associated source of cash from working capital. During 2016, these over-collected gas costs from 2015 were returned tocustomers, resulting in a use of working capital.
RegulatoryAssetsandLiabilities.During the year ended December 31, 2016, over-collected gas costs from 2015 were returned to customers resulting in a use ofcash. In 2017, less cash was required to be returned to customers because the balance of over-collected gas costs from 2016 was smaller than in 2015.
Pension and Other Postretirement Plan Funding . In 2017, NiSource contributed $282.3 million to its pension plans (including a $277 million discretionarycontribution made during the third quarter of 2017) and $31.6 million to its other postretirement benefit plans. The return on assets related to the discretionarypension contribution is expected to result in a decrease to net periodic benefit costs beginning in 2018. However, due to increasing workforce retirements, certainNiSource pension plans are expected to trigger settlement accounting annually for the foreseeable future. The resulting charges from settlement accounting, ifrealized, are expected to partially offset this decrease in periodic benefits costs.
In 2018, NiSource expects to make contributions of $2.9 million to its pension plans and $25.0 million to its postretirement medical and life plans. Given thecurrent funded status of the pension plans, and barring unforeseen market volatility that may negatively impact the valuation of its plan assets, NiSource does notbelieve additional material contributions to its pension plans will be required for the foreseeable future.
Income Taxes.Rates for NiSource’s regulated customers include provisions for the collection of U.S. federal income taxes. The reduction in the U.S. federalcorporate income tax rate as a result of the TCJA is expected to lead to a decrease in the amount billed to customers through rates, ultimately resulting in lowercash collections from operating activities. NiSource is currently working to estimate the impact of this revenue reduction.
In addition, NiSource will be required to pass back to customers “excess deferred taxes” which represent amounts collected from customers in the past to coverdeferred tax liabilities which, as a result of the passage of the TCJA, are now expected to be less than the originally billed amounts. Approximately $1.5 billion ofexcess deferred taxes related to implementation of the TCJA are presented within "Regulatory liabilities (noncurrent)" on the Consolidated Balance Sheets as ofDecember 31, 2017. The majority of this balance relates to temporary book-to-tax differences on utility property protected by IRS normalization rules. NiSourceexpects this portion of the balance will be passed back to customers over the remaining average useful life of the associated property. The pass back period for theremainder of this balance will be determined by NiSource's state utility commissions in future proceedings. NiSource’s estimate of the amount and pass-backperiod of excess deferred taxes is subject to change pending final review by the utility commissions of the states in which NiSource operates.
As of December 31, 2017 , NiSource has a recorded deferred tax asset of $508.5 million related to a Federal NOL carryforward. As a result of being in an NOLposition, NiSource was not required to make any cash payments for Federal income tax purposes during the years ended December 31, 2017 , 2016 or 2015. ForNiSource NOLs generated before December 31, 2017, the NOL carryforward expires in 2037, however, NiSource expects to fully utilize the carryforward benefitprior to its expiration.
Per the TCJA, utilization of NOL carryforwards generated after December 31, 2017 is limited to 80% of current year taxable income. Accordingly, NiSource maybe required to make cash payments for Federal income taxes in future years despite having NOL carryforwards in excess of current taxes payable.
33
Table of Contents
ITEM 7. MANAGEMENT’S DISCUSSION AND ANALYSIS OF FINANCIAL CONDITION AND RESULTS OF OPERATIONS (continued)
N I S OURCE I NC .
Investing ActivitiesNiSource's cash used for investing activities varies year over year primarily as a result of changes in the level of annual capital expenditures. The table belowreflects capital expenditures and certain other investing activities by segment for 2017 , 2016 and 2015 .
(inmillions) 2017 2016 2015Gas Distribution Operations System Growth and Tracker $ 909.2 $ 835.0 $ 729.6Maintenance 216.4 219.4 187.4
Total Gas Distribution Operations 1,125.6 1,054.4 917.0Electric Operations System Growth and Tracker 435.3 314.1 274.8Maintenance 157.1 106.5 125.5
Total Electric Operations 592.4 420.6 400.3Corporate and Other Operations - Maintenance 35.8 15.4 50.2Total (1) $ 1,753.8 $ 1,490.4 $ 1,367.5(1) Amounts differ from those presented on the Statements of Consolidated Cash Flows primarily due to the inclusion of capital expenditures included in current liabilities and AFUDC Equity.
For 2017 , capital expenditures and certain other investing activities were $1,753.8 million , which was $263.4 million higher than the 2016 capital program. Thisincreased spending is mainly due to electric transmission projects, environmental investments and system modernization projects.
For 2016 , capital expenditures and certain other investing activities were $1,490.4 million , which was $122.9 million higher than the 2015 capital program. Thisincreased spending is mainly due to modernization projects and segment growth at the Gas Distribution Operations segment.
For 2018 , NiSource projects to invest approximately $1.7 to $1.8 billion in its capital program. This projected level of spend is consistent with 2017 spend levelsand is expected to focus primarily on the continuation of the modernization projects, segment growth across the Gas Distribution Operations segment, and TDSICspend.
Financing ActivitiesShort-termDebt.Refer to Note 15 , “Short-Term Borrowings,” in the Notes to Consolidated Financial Statements for information on short-term debt.
Long-termDebt.Refer to Note 14 , “Long-Term Debt,” in the Notes to Consolidated Financial Statements for information on long-term debt.
NetAvailableLiquidity.As of December 31, 2017 , an aggregate of $998.9 million of net liquidity was available. Net available liquidity includes cash and creditavailable under the revolving credit facility and accounts receivable securitization programs.
34
Table of Contents
ITEM 7. MANAGEMENT’S DISCUSSION AND ANALYSIS OF FINANCIAL CONDITION AND RESULTS OF OPERATIONS (continued)
N I S OURCE I NC .
The following table displays NiSource's liquidity position as of December 31, 2017 and 2016 :
Year Ended December 31, (inmillions) 2017 2016Current Liquidity
Revolving Credit Facility $ 1,850.0 $ 1,850.0Accounts Receivable Program (1) 336.7 310.0
Less: Drawn on Revolving Credit Facility — —Commercial Paper 869.0 1,178.0Accounts Receivable Program Utilized 336.7 310.0Letters of Credit Outstanding Under Credit Facility 11.1 14.7
Add: Cash and Cash Equivalents 29.0 26.4
Net Available Liquidity $ 998.9 $ 683.7(1) Represents the lesser of the seasonal limit or maximum borrowings supportable by the underlying receivables.
The change in net available liquidity between 2017 and 2016 was driven by lower utilization of short-term debt in the current year as a result of cash proceeds fromother forms of financing.
DebtCovenants. NiSource is subject to a financial covenant under its revolving credit facility which requires NiSource to maintain a debt to capitalization ratiothat does not exceed 70% . A similar covenant in a 2005 private placement note purchase agreement requires NiSource to maintain a debt to capitalization ratiothat does not exceed 75% . As of December 31, 2017 , the ratio was 67.6% .
SaleofTradeAccountsReceivables. Refer to Note 17 , “Transfers of Financial Assets,” in the Notes to Consolidated Financial Statements for information on thesale of trade accounts receivable.
CreditRatings. The credit rating agencies periodically review the Company’s ratings, taking into account factors such as its capital structure and earnings profile.The following table includes NiSource's and certain subsidiaries' credit ratings and ratings outlook as of December 31, 2017 . There were no changes to creditratings or outlooks since December 31, 2016. A credit rating is not a recommendation to buy, sell or hold securities, and may be subject to revision or withdrawalat any time by the assigning rating organization.
S&P Moody's Fitch Rating Outlook Rating Outlook Rating OutlookNiSource BBB+ Stable Baa2 Stable BBB StableNIPSCO BBB+ Stable Baa1 Stable BBB StableColumbia of Massachusetts BBB+ Stable Baa2 Stable Not rated Not ratedCommercial Paper A-2 Stable P-2 Stable F3 Stable
Certain NiSource subsidiaries have agreements that contain “ratings triggers” that require increased collateral if the credit ratings of NiSource or certain of itssubsidiaries are below investment grade. These agreements are primarily for insurance purposes and for the physical purchase or sale of power. As ofDecember 31, 2017 , the collateral requirement that would be required in the event of a downgrade below the ratings trigger levels would amount to approximately$46.1 million . In addition to agreements with ratings triggers, there are other agreements that contain “adequate assurance” or “material adverse change”provisions that could necessitate additional credit support such as letters of credit and cash collateral to transact business.
Equity.The authorized capital stock of NiSource consists of 420,000,000 shares, $0.01 par value, of which 400,000,000 are common stock and 20,000,000 arepreferred stock. As of December 31, 2017 , 337,015,806 shares of common stock were outstanding. NiSource has no preferred stock outstanding as ofDecember 31, 2017 .
35
Table of Contents
ITEM 7. MANAGEMENT’S DISCUSSION AND ANALYSIS OF FINANCIAL CONDITION AND RESULTS OF OPERATIONS (continued)
N I S OURCE I NC .
Contractual Obligations . NiSource has certain contractual obligations requiring payments at specified periods. The obligations include long-term debt, leaseobligations, energy commodity contracts and obligations for various services including pipeline capacity and outsourcing of IT services. The total contractualobligations in existence at December 31, 2017 and their maturities were:
(inmillions) Total 2018 2019 2020 2021 2022 AfterLong-term debt (1) $ 7,714.9 $ 275.1 $ 296.1 $ 325.1 $ 63.6 $ 710.0 $ 6,045.0Capital leases (2) 254.4 18.1 15.7 15.4 15.5 15.5 174.2Interest payments on long-term debt 6,701.2 364.4 344.4 334.6 316.8 307.7 5,033.3Operating leases (3) 57.2 13.8 10.2 7.3 6.2 4.4 15.3Energy commodity contracts 216.7 102.5 57.3 56.9 — — —Service obligations:
Pipeline service obligations 2,649.9 538.9 520.5 390.7 344.7 331.0 524.1IT service obligations 311.5 88.3 71.5 63.5 50.7 37.5 —Other service obligations 178.2 48.3 43.3 43.3 43.3 — —
Other liabilities 28.7 28.7 — — — — —Total contractual obligations $ 18,112.7 $ 1,478.1 $ 1,359.0 $ 1,236.8 $ 840.8 $ 1,406.1 $ 11,791.9(1) Long-term debt balance excludes unamortized issuance costs and discounts of $71.5 million.(2) Capital lease payments shown above are inclusive of interest totaling $91.9 million.(3) Operating lease balances do not include amounts for fleet leases that can be renewed beyond the initial lease term. The Company anticipates renewing the leases beyond the initial term, butthe anticipated payments associated with the renewals do not meet the definition of expected minimum lease payments and therefore are not included above. Expected payments are $29.3million in 2018, $27.5 million in 2019, $19.7 million in 2020, $13.9 million in 2021, $9.6 million in 2022 and $7.4 million thereafter.
NiSource calculated estimated interest payments for long-term debt based on the stated coupon and payment dates. For 2018 , NiSource projects that it will berequired to make interest payments of approximately $388.1 million, which includes $364.4 million of interest payments related to its long-term debt outstandingas of December 31, 2017 . At December 31, 2017 , NiSource had $1,205.7 million in short-term borrowings outstanding.
NiSource’s expected payments included within “Other liabilities” in the table of contractual commitments above contains employer contributions to pension andother postretirement benefits plans expected to be made in 2018 . Plan contributions beyond 2018 are dependent upon a number of factors, including actual returnson plan assets, which cannot be reliably estimated at this time. In 2018 , NiSource expects to make contributions of approximately $2.9 million to its pension plansand approximately $25.0 million to its postretirement medical and life plans. Refer to Note 11 , “Pension and Other Postretirement Benefits,” in the Notes toConsolidated Financial Statements for more information.
NiSource cannot reasonably estimate the settlement amounts or timing of cash flows related to long-term obligations classified as “Total Other Liabilities” on theConsolidated Balance Sheets, other than those described above.
NiSource also has obligations associated with income, property, gross receipts, franchise, payroll, sales and use, and various other taxes and expects to make taxpayments of approximately $222.1 million in 2018 , which are not included in the table above.
Refer to Note 18 -A, “Contractual Obligations,” in the Notes to Consolidated Financial Statements for further information.
Off-Balance Sheet Arrangements
As a part of normal business, NiSource and certain subsidiaries enter into various agreements providing financial or performance assurance to third parties onbehalf of certain subsidiaries. Such agreements include guarantees and stand-by letters of credit.
Refer to Note 18 , “Other Commitments and Contingencies,” in the Notes to Consolidated Financial Statements for additional information about NiSource’s off-balance sheet arrangements.
36
Table of Contents
ITEM 7. MANAGEMENT’S DISCUSSION AND ANALYSIS OF FINANCIAL CONDITION AND RESULTS OF OPERATIONS (continued)
N I S OURCE I NC .
Market Risk Disclosures
Risk is an inherent part of NiSource’s businesses. The extent to which NiSource properly and effectively identifies, assesses, monitors and manages each of thevarious types of risk involved in its businesses is critical to its profitability. NiSource seeks to identify, assess, monitor and manage, in accordance with definedpolicies and procedures, the following principal market risks that are involved in NiSource’s businesses: commodity price risk, interest rate risk and credit risk.Risk management at NiSource is a multi-faceted process with oversight by the Risk Management Committee that requires constant communication, judgment andknowledge of specialized products and markets. NiSource’s senior management takes an active role in the risk management process and has developed policies andprocedures that require specific administrative and business functions to assist in the identification, assessment and control of various risks. These may include butare not limited to market, operational, financial, compliance and strategic risk types. In recognition of the increasingly varied and complex nature of the energybusiness, NiSource’s risk management process, policies and procedures continue to evolve and are subject to ongoing review and modification.
Commodity Price RiskNiSource is exposed to commodity price risk as a result of its subsidiaries’ operations involving natural gas and power. To manage this market risk, NiSource’ssubsidiaries use derivatives, including commodity futures contracts, swaps, forwards and options. NiSource does not participate in speculative energy tradingactivity.
Commodity price risk resulting from derivative activities at NiSource’s rate-regulated subsidiaries is limited, since regulations allow recovery of prudentlyincurred purchased power, fuel and gas costs through the ratemaking process, including gains or losses on these derivative instruments. If states should exploreadditional regulatory reform, these subsidiaries may begin providing services without the benefit of the traditional ratemaking process and may be more exposed tocommodity price risk.
NiSource subsidiaries are required to make cash margin deposits with their brokers to cover actual and potential losses in the value of outstanding exchange tradedderivative contracts. The amount of these deposits, which are reflected in NiSource’s restricted cash balance, may fluctuate significantly during periods of highvolatility in the energy commodity markets.
Refer to Note 9 , "Risk Management Activities," in the Notes to the Consolidated Financial Statements for further information on NiSource's commodity price riskassets and liabilities as of December 31, 2017 and 2016 .
Interest Rate RiskNiSource is exposed to interest rate risk as a result of changes in interest rates on borrowings under its revolving credit agreement, commercial paper program andaccounts receivable programs, which have interest rates that are indexed to short-term market interest rates. Based upon average borrowings and debt obligationssubject to fluctuations in short-term market interest rates, an increase (or decrease) in short-term interest rates of 100 basis points (1%) would have increased (ordecreased) interest expense by $15.8 million and $11.7 million for 2017 and 2016 , respectively. NiSource is also exposed to interest rate risk as a result of changesin benchmark rates that can influence the interest rates of future debt issuances. NiSource and its subsidiaries manage interest rate risk on long-term debt throughforward starting interest rate swaps that hedge the interest rate risk related to forecasted issuances.
Refer to Note 9 , "Risk Management Activities," in the Notes to Consolidated Financial Statements for further information on NiSource's interest rate risk assetsand liabilities as of December 31, 2017 and 2016 .
Credit RiskDue to the nature of the industry, credit risk is embedded in many of NiSource’s business activities. NiSource’s extension of credit is governed by a CorporateCredit Risk Policy. In addition, Risk Management Committee guidelines are in place which document management approval levels for credit limits, evaluation ofcreditworthiness, and credit risk mitigation efforts. Exposures to credit risks are monitored by the risk management function which is independent of commercialoperations. Credit risk arises due to the possibility that a customer, supplier or counterparty will not be able or willing to fulfill its obligations on a transaction on orbefore the settlement date. For derivative-related contracts, credit risk arises when counterparties are obligated to deliver or purchase defined commodity units ofgas or power to NiSource at a future date per execution of contractual terms and conditions. Exposure to credit risk is measured in terms of both current obligationsand the market value of forward positions net of any posted collateral such as cash and letters of credit.
NiSource closely monitors the financial status of its banking credit providers. NiSource evaluates the financial status of its banking partners through the use ofmarket-based metrics such as credit default swap pricing levels, and also through traditional credit ratings provided by major credit rating agencies.
37
Table of Contents
ITEM 7. MANAGEMENT’S DISCUSSION AND ANALYSIS OF FINANCIAL CONDITION AND RESULTS OF OPERATIONS (continued)
N I S OURCE I NC .
Other Information
Critical Accounting PoliciesNiSource applies certain accounting policies based on the accounting requirements discussed below that have had, and may continue to have, significant impactson NiSource’s results of operations and Consolidated Financial Statements.
BasisofAccountingforRate-RegulatedSubsidiaries.ASC Topic 980, RegulatedOperations , provides that rate-regulated subsidiaries account for and reportassets and liabilities consistent with the economic effect of the way in which regulators establish rates, if the rates established are designed to recover the costs ofproviding the regulated service and if the competitive environment makes it probable that such rates can be charged and collected. Certain expenses and creditssubject to utility regulation or rate determination normally reflected in income are deferred on the Consolidated Balance Sheets and are recognized in income as therelated amounts are included in service rates and recovered from or refunded to customers. The total amounts of regulatory assets and liabilities reflected on theConsolidated Balance Sheets were $1,801.2 million and $2,795.6 million at December 31, 2017 , and $1,885.4 million and $1,381.8 million at December 31, 2016, respectively. For additional information, refer to Note 8 , “Regulatory Matters,” in the Notes to Consolidated Financial Statements.
In the event that regulation significantly changes the opportunity for NiSource to recover its costs in the future, all or a portion of NiSource’s regulated operationsmay no longer meet the criteria for the application of ASC Topic 980, RegulatedOperations. In such event, a write-down of all or a portion of NiSource’s existingregulatory assets and liabilities could result. If transition cost recovery is approved by the appropriate regulatory bodies that would meet the requirements underGAAP for continued accounting as regulatory assets and liabilities during such recovery period, the regulatory assets and liabilities would be reported at therecoverable amounts. If unable to continue to apply the provisions of ASC Topic 980, RegulatedOperations, NiSource would be required to apply the provisionsof ASC Topic 980-20, DiscontinuationofRate-RegulatedAccounting. In management’s opinion, NiSource’s regulated subsidiaries will be subject to ASC Topic980, RegulatedOperationsfor the foreseeable future.
Certain of the regulatory assets reflected on NiSource’s Consolidated Balance Sheets require specific regulatory action in order to be included in future servicerates. Although recovery of these amounts is not guaranteed, NiSource believes that these costs meet the requirements for deferral as regulatory assets. Regulatoryassets requiring specific regulatory action amounted to $398.4 million at December 31, 2017 . If NiSource determined that the amounts included as regulatoryassets were not recoverable, a charge to income would immediately be required to the extent of the unrecoverable amounts.
The passage of the TCJA into law necessitated the remeasurement of NiSource’s deferred income tax balances to reflect the new U.S. corporate income tax rate of21%. For NiSource’s regulated entities, substantially all of the impact of this remeasurement was recorded to a regulatory asset or regulatory liability, asappropriate, until such time that NiSource receives final regulatory orders prescribing the required accounting treatment and related impact on future customerrates. To the extent final regulatory orders received prescribe accounting treatment different from what is currently reflected in NiSource’s financial statements,NiSource’s results of operations could be impacted.
PensionandPostretirementBenefits.NiSource has defined benefit plans for both pension and other postretirement benefits. The calculation of the net obligationsand annual expense related to the plans requires a significant degree of judgment regarding the discount rates to be used in bringing the liabilities to present value,expected long-term rates of return on plan assets, health care trend rates, and mortality rates, among other assumptions. Due to the size of the plans and the long-term nature of the associated liabilities, changes in the assumptions used in the actuarial estimates could have material impacts on the measurement of the netobligations and annual expense recognition. Differences between actuarial assumptions and actual plan results are deferred into AOCI or a regulatory balance sheetaccount, depending on the jurisdiction of the NiSource entity. These deferred gains or losses are then amortized into the income statement when the accumulateddifferences exceed 10% of the greater of the projected benefit obligation or the fair value of plan assets (known in GAAP as the “corridor” method) or whensettlement accounting is triggered.
The discount rates, expected long-term rates of return on plan assets, health care cost trend rates and mortality rates are critical assumptions. Methods used todevelop these assumptions are described below. While a third party actuarial firm assists with the development of many of these assumptions, NiSource isultimately responsible for selecting the final assumptions.
The discount rate is utilized principally in calculating the actuarial present value of pension and other postretirement benefit obligations and netperiodic pension and other postretirement benefit plan costs. NiSource’s discount rates for both pension and other postretirement benefits are determined using spotrates along an AA-rated above median yield curve with cash flows matching the expected duration of benefit payments to be made to plan participants.
The expected long-term rate of return on plan assets is a component utilized in calculating annual pension and other postretirement
38
Table of Contents
ITEM 7. MANAGEMENT’S DISCUSSION AND ANALYSIS OF FINANCIAL CONDITION AND RESULTS OF OPERATIONS (continued)
N I S OURCE I NC .
benefit plan costs. NiSource estimates the expected return on plan assets by evaluating expected bond returns, equity risk premiums, target asset allocations, theeffects of active plan management, the impact of periodic plan asset rebalancing and historical performance. NiSource also considers the guidance from itsinvestment advisors in making a final determination of its expected rate of return on assets.
For measurement of 2018 net periodic benefit cost, NiSource selected an expected pre-tax long-term rate of return of 7.00% and 5.80% for its pension and otherpostretirement benefit plan assets, respectively.
NiSource estimates the assumed health care cost trend rate, which is used in determining the Company's other postretirement benefit net expense, based upon itsactual health care cost experience, the effects of recently enacted legislation, third-party actuarial surveys and general economic conditions.
NiSource uses the Society of Actuaries’ most recently published mortality data in developing a best estimate of mortality as part of the calculation ofthe pension and other postretirement benefit obligations.
The following tables illustrate the effects of changes in these actuarial assumptions while holding all other assumptions constant:
Impact on December 31, 2017 Projected Benefit Obligation Increase/(Decrease)Change in Assumptions (inmillions) Pension Benefits Other Postretirement Benefits+50 basis points change in discount rate $ (94.8) $ (28.7)-50 basis points change in discount rate 103.0 31.5+50 basis points change in health care trend rates 14.9-50 basis points change in health care trend rates (12.9)
Impact on 2017 Expense Increase/(Decrease) (1)
Change in Assumptions (inmillions) Pension Benefits Other Postretirement Benefits+50 basis points change in discount rate $ (2.3) $ (0.7)-50 basis points change in discount rate 2.5 0.6+50 basis points change in expected long-term rate of return on plan assets (8.5) (1.1)-50 basis points change in expected long-term rate of return on plan assets 8.5 1.1+50 basis points change in health care trend rates 0.5-50 basis points change in health care trend rates (0.5)(1) Before labor capitalization and regulatory deferrals.
In January 2017, NiSource changed the method used to estimate the service and interest components of net periodic benefit cost for pension and otherpostretirement benefits. This change, compared to the previous method, resulted in a decrease in the actuarially-determined service and interest cost components.Historically, NiSource estimated service and interest cost utilizing a single weighted-average discount rate derived from the yield curve used to measure the benefitobligation at the beginning of the period. For fiscal 2017 and beyond, NiSource now utilizes a full yield curve approach to estimate these components by applyingthe specific spot rates along the yield curve used in the determination of the benefit obligation to the relevant projected cash flows. For further discussion ofNiSource’s pension and other postretirement benefits, see Note 11 , “Pension and Other Postretirement Benefits,” in the Notes to Consolidated FinancialStatements.
Goodwill.NiSource has seven goodwill reporting units, comprised of the seven state operating companies within the Gas Distribution Operations reportablesegment. NiSource’s goodwill assets at December 31, 2017 were $1,690.7 million , most of which resulted from the acquisition of Columbia on November 1,2000.
As required by GAAP, NiSource tests for impairment of goodwill on an annual basis and on an interim basis when events or circumstances indicate that a potentialimpairment may exist. NiSource’s annual goodwill test takes place in the second quarter of each year and was most recently finalized as of May 1, 2017.
NiSource completed a quantitative ("step 1") fair value measurement of its reporting units during the May 1, 2016 goodwill test.
39

Table of Contents
ITEM 7. MANAGEMENT’S DISCUSSION AND ANALYSIS OF FINANCIAL CONDITION AND RESULTS OF OPERATIONS (continued)
N I S OURCE I NC .
Consistent with NiSource’s historical impairment testing of goodwill, fair value of the reporting units was determined based on a weighting of income and marketapproaches. These approaches require significant judgments including appropriate long-term growth rates and discount rates for the income approach andappropriate multiples of earnings for peer companies and control premiums for the market approach. A qualitative ("step 0") test was completed on May 1, 2017.NiSource assessed various assumptions, events and circumstances that would have affected the estimated fair value of the reporting units in its baseline May 1,2016 test. The results of this assessment indicated that it is not more likely than not that its reporting unit fair values are less than the reporting unit carrying valuesand no impairments are necessary.
The discount rates were derived using peer company data compiled with the assistance of a third party valuation services firm. The discount rates used are subjectto change based on changes in tax rates at both the state and federal level, debt and equity ratios at each reporting unit and general economic conditions.
The long-term growth rate was derived by evaluating historic growth rates, new business and investment opportunities beyond the near term horizon. The long-term growth rate is subject to change depending on inflationary impacts to the U.S. economy and the individual business environments in which each reporting unitoperates.
The May 1, 2016 test indicated the fair value of each of the reporting units that carry or are allocated goodwill exceeded their carrying values, indicating that noimpairment existed under the step 1 annual impairment test. If the estimates of free cash flow used in this step 1 analysis had been 10% lower, the resulting fairvalues would have still been greater than the carrying value for each of the reporting units tested, holding all other assumptions constant.
RevenueRecognition.Revenue is recorded as products and services are delivered. Utility revenues are billed to customers monthly on a cycle basis. Revenues arerecorded on the accrual basis and include estimates for electricity and gas delivered but not billed. Refer to Note 1 -I, “Revenue Recognition,” in the Notes toConsolidated Financial Statements.
NiSource adopted the provisions of ASC 606 beginning on January 1, 2018 using a modified retrospective method, which was applied to all contracts. No materialadjustments were made to January 1, 2018 opening balances as a result of the adoption and NiSource does not anticipate material changes in the amount or timingof future revenue recognition as a result of the adoption of ASC 606.
Recently Issued Accounting PronouncementsRefer to Note 2 , "Recent Accounting Pronouncements," in the Notes to Consolidated Financial Statements.
ITEM 7A. QUANTITATIVE AND QUALITATIVE DISCLOSURES ABOUT MARKET RISK
Quantitative and Qualitative Disclosures about Market Risk are reported in Item 7. “Management’s Discussion and Analysis of Financial Condition and Results ofOperations – Market Risk Disclosures.”
40
Table of Contents
ITEM 8. FINANCIAL STATEMENTS AND SUPPLEMENTARY DATA
N I S OURCE I NC .
Index PageReport of Independent Registered Public Accounting Firm 42Statements of Consolidated Income 44Statements of Consolidated Comprehensive Income 45Consolidated Balance Sheets 46Statements of Consolidated Cash Flows 48Statements of Consolidated Common Stockholders’ Equity 49Notes to Consolidated Financial Statements 51
1. Nature of Operations and Summary of Significant Accounting Policies 512. Recent Accounting Pronouncements 543. Discontinued Operations 574. Earnings Per Share 585. Property, Plant and Equipment 596. Goodwill and Other Intangible Assets 597. Asset Retirement Obligations 608. Regulatory Matters 619. Risk Management Activities 6610. Income Taxes 6711. Pension and Other Postretirement Benefits 7012. Common Stock 8213. Share-Based Compensation 8314. Long-Term Debt 8615. Short-Term Borrowings 8816. Fair Value 8917. Transfers of Financial Assets 9118. Other Commitments and Contingencies 9219. Accumulated Other Comprehensive Loss 9620. Other, Net 9721. Interest Expense, Net 9722. Segments of Business 9723. Quarterly Financial Data (Unaudited) 9924. Supplemental Cash Flow Information 10025. Subsequent Event 100
Schedule II 101
41
Table of Contents
ITEM 8. FINANCIAL STATEMENTS AND SUPPLEMENTARY DATA (continued)
N I S OURCE I NC .
REPORT OF INDEPENDENT REGISTERED PUBLIC ACCOUNTING FIRM
To the stockholders and the Board of Directors of NiSource Inc.
Opinion on the Financial Statements
We have audited the accompanying consolidated balance sheets of NiSource Inc. and subsidiaries (the "Company") as of December 31, 2017 and 2016, the relatedstatements of consolidated income, comprehensive income, common stockholders' equity, and cash flows for each of the three years in the period ended December31, 2017, and the related notes and the schedule listed in the Index at item 15 (collectively referred to as the "financial statements"). In our opinion, the financialstatements present fairly, in all material respects, the financial position of the Company as of December 31, 2017 and 2016, and the results of its operations and itscash flows for each of the three years in the period ended December 31, 2017, in conformity with accounting principles generally accepted in the United States ofAmerica.
We have also audited, in accordance with the standards of the Public Company Accounting Oversight Board (United States) (PCAOB), the Company's internalcontrol over financial reporting as of December 31, 2017, based on criteria established in InternalControl-IntegratedFramework(2013)issued by the Committeeof Sponsoring Organizations of the Treadway Commission and our report dated February 20, 2018, expressed an unqualified opinion on the Company's internalcontrol over financial reporting.
Emphasis of a Matter
As discussed in Note 3 to the consolidated financial statements, on July 1, 2015 the Company completed the spin-off of its subsidiary Columbia Pipeline Group,Inc.
Basis for Opinion
These financial statements are the responsibility of the Company's management. Our responsibility is to express an opinion on the Company's financial statementsbased on our audits. We are a public accounting firm registered with the PCAOB and are required to be independent with respect to the Company in accordancewith the U.S. federal securities laws and the applicable rules and regulations of the Securities and Exchange Commission and the PCAOB.
We conducted our audits in accordance with the standards of the PCAOB. Those standards require that we plan and perform the audit to obtain reasonableassurance about whether the financial statements are free of material misstatement, whether due to error or fraud. Our audits included performing procedures toassess the risks of material misstatement of the financial statements, whether due to error or fraud, and performing procedures that respond to those risks. Suchprocedures included examining, on a test basis, evidence regarding the amounts and disclosures in the financial statements. Our audits also included evaluating theaccounting principles used and significant estimates made by management, as well as evaluating the overall presentation of the financial statements. We believethat our audits provide a reasonable basis for our opinion.
/s/ DELOITTE & TOUCHE LLPColumbus, OhioFebruary 20, 2018
We have served as the Company's auditor since 2002.
42
Table of Contents
ITEM 8. FINANCIAL STATEMENTS AND SUPPLEMENTARY DATA (continued)
N I S OURCE I NC .
REPORT OF INDEPENDENT REGISTERED PUBLIC ACCOUNTING FIRM
To the stockholders and the Board of Directors of NiSource Inc.
Opinion on Internal Control over Financial Reporting
We have audited the internal control over financial reporting of NiSource Inc. and subsidiaries (the “Company”) as of December 31, 2017, based on criteriaestablished in InternalControl-IntegratedFramework(2013)issued by the Committee of Sponsoring Organizations of the Treadway Commission (COSO). Inour opinion, the Company maintained, in all material respects, effective internal control over financial reporting as of December 31, 2017, based on criteriaestablished in InternalControl-IntegratedFramework(2013)issued by COSO.
We have also audited, in accordance with the standards of the Public Company Accounting Oversight Board (United States) (PCAOB), the financial statements asof and for year ended December 31, 2017, of the Company and our report dated February 20, 2018, expressed an unqualified opinion on those financial statementsand included an explanatory paragraph related to the Company's spin-off of its subsidiary Columbia Pipeline Group, Inc. on July 1, 2015.
Basis for Opinion
The Company’s management is responsible for maintaining effective internal control over financial reporting and for its assessment of the effectiveness of internalcontrol over financial reporting, included in the accompanying Management's Report on Internal Control Over Financial Reporting. Our responsibility is to expressan opinion on the Company’s internal control over financial reporting based on our audit. We are a public accounting firm registered with the PCAOB and arerequired to be independent with respect to the Company in accordance with the U.S. federal securities laws and the applicable rules and regulations of theSecurities and Exchange Commission and the PCAOB.
We conducted our audit in accordance with the standards of the PCAOB. Those standards require that we plan and perform the audit to obtain reasonable assuranceabout whether effective internal control over financial reporting was maintained in all material respects. Our audit included obtaining an understanding of internalcontrol over financial reporting, assessing the risk that a material weakness exists, testing and evaluating the design and operating effectiveness of internal controlbased on the assessed risk, and performing such other procedures as we considered necessary in the circumstances. We believe that our audit provides a reasonablebasis for our opinion.
Definition and Limitations of Internal Control over Financial Reporting
A company’s internal control over financial reporting is a process designed to provide reasonable assurance regarding the reliability of financial reporting and thepreparation of financial statements for external purposes in accordance with generally accepted accounting principles. A company’s internal control over financialreporting includes those policies and procedures that (1) pertain to the maintenance of records that, in reasonable detail, accurately and fairly reflect thetransactions and dispositions of the assets of the company; (2) provide reasonable assurance that transactions are recorded as necessary to permit preparation offinancial statements in accordance with generally accepted accounting principles, and that receipts and expenditures of the company are being made only inaccordance with authorizations of management and directors of the company; and (3) provide reasonable assurance regarding prevention or timely detection ofunauthorized acquisition, use, or disposition of the company’s assets that could have a material effect on the financial statements.
Because of its inherent limitations, internal control over financial reporting may not prevent or detect misstatements. Also, projections of any evaluation ofeffectiveness to future periods are subject to the risk that controls may become inadequate because of changes in conditions, or that the degree of compliance withthe policies or procedures may deteriorate.
/s/ DELOITTE & TOUCHE LLPColumbus, OhioFebruary 20, 2018
43
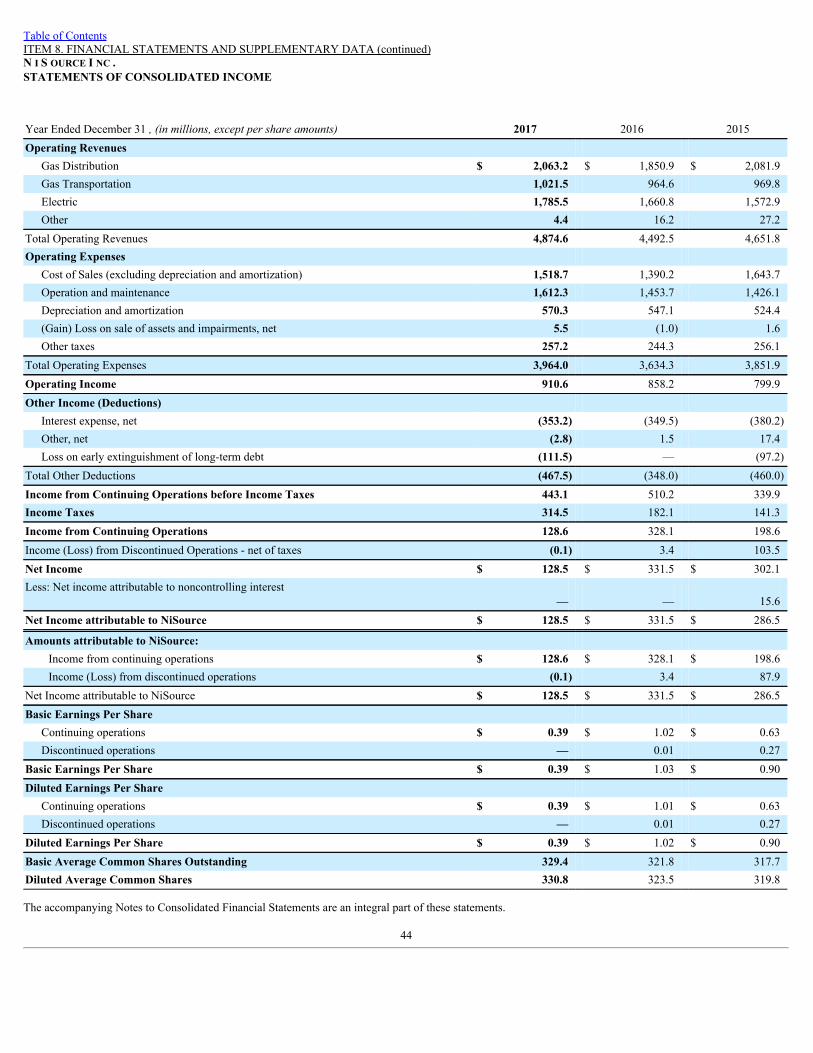
Table of ContentsITEM 8. FINANCIAL STATEMENTS AND SUPPLEMENTARY DATA (continued)N I S OURCE I NC .STATEMENTS OF CONSOLIDATED INCOME
Year Ended December 31 ,(inmillions,exceptpershareamounts) 2017 2016 2015Operating Revenues
Gas Distribution $ 2,063.2 $ 1,850.9 $ 2,081.9Gas Transportation 1,021.5 964.6 969.8Electric 1,785.5 1,660.8 1,572.9Other 4.4 16.2 27.2
Total Operating Revenues 4,874.6 4,492.5 4,651.8Operating Expenses
Cost of Sales (excluding depreciation and amortization) 1,518.7 1,390.2 1,643.7Operation and maintenance 1,612.3 1,453.7 1,426.1Depreciation and amortization 570.3 547.1 524.4(Gain) Loss on sale of assets and impairments, net 5.5 (1.0) 1.6Other taxes 257.2 244.3 256.1
Total Operating Expenses 3,964.0 3,634.3 3,851.9Operating Income 910.6 858.2 799.9Other Income (Deductions)
Interest expense, net (353.2) (349.5) (380.2)Other, net (2.8) 1.5 17.4Loss on early extinguishment of long-term debt (111.5) — (97.2)
Total Other Deductions (467.5) (348.0) (460.0)Income from Continuing Operations before Income Taxes 443.1 510.2 339.9Income Taxes 314.5 182.1 141.3Income from Continuing Operations 128.6 328.1 198.6Income (Loss) from Discontinued Operations - net of taxes (0.1) 3.4 103.5Net Income $ 128.5 $ 331.5 $ 302.1Less: Net income attributable to noncontrolling interest
— — 15.6Net Income attributable to NiSource $ 128.5 $ 331.5 $ 286.5
Amounts attributable to NiSource: Income from continuing operations $ 128.6 $ 328.1 $ 198.6Income (Loss) from discontinued operations (0.1) 3.4 87.9
Net Income attributable to NiSource $ 128.5 $ 331.5 $ 286.5Basic Earnings Per Share
Continuing operations $ 0.39 $ 1.02 $ 0.63Discontinued operations — 0.01 0.27
Basic Earnings Per Share $ 0.39 $ 1.03 $ 0.90Diluted Earnings Per Share
Continuing operations $ 0.39 $ 1.01 $ 0.63Discontinued operations — 0.01 0.27
Diluted Earnings Per Share $ 0.39 $ 1.02 $ 0.90Basic Average Common Shares Outstanding 329.4 321.8 317.7Diluted Average Common Shares 330.8 323.5 319.8
The accompanying Notes to Consolidated Financial Statements are an integral part of these statements.
44
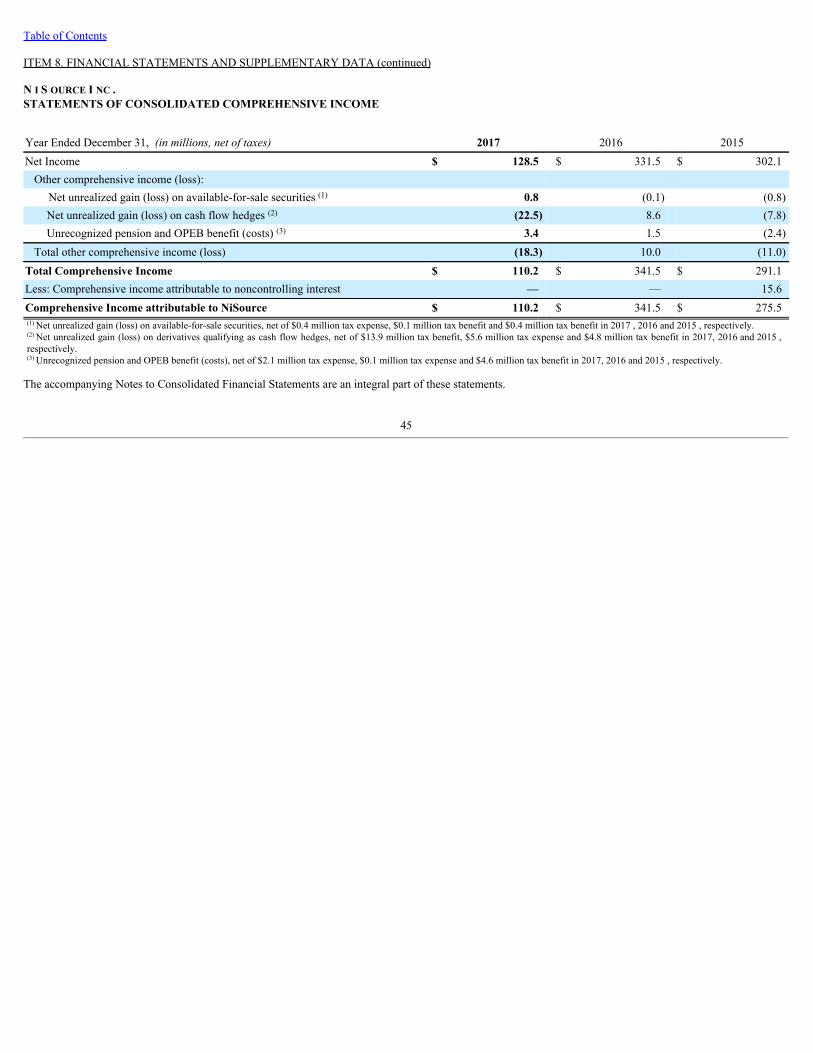
Table of Contents
ITEM 8. FINANCIAL STATEMENTS AND SUPPLEMENTARY DATA (continued)
N I S OURCE I NC .STATEMENTS OF CONSOLIDATED COMPREHENSIVE INCOME
Year Ended December 31, (inmillions,netoftaxes) 2017 2016 2015Net Income $ 128.5 $ 331.5 $ 302.1Other comprehensive income (loss):
Net unrealized gain (loss) on available-for-sale securities (1) 0.8 (0.1) (0.8)Net unrealized gain (loss) on cash flow hedges (2) (22.5) 8.6 (7.8)Unrecognized pension and OPEB benefit (costs) (3) 3.4 1.5 (2.4)
Total other comprehensive income (loss) (18.3) 10.0 (11.0)Total Comprehensive Income $ 110.2 $ 341.5 $ 291.1Less: Comprehensive income attributable to noncontrolling interest — — 15.6Comprehensive Income attributable to NiSource $ 110.2 $ 341.5 $ 275.5(1) Net unrealized gain (loss) on available-for-sale securities, net of $0.4 million tax expense, $0.1 million tax benefit and $0.4 million tax benefit in 2017 , 2016 and 2015 , respectively.(2) Net unrealized gain (loss) on derivatives qualifying as cash flow hedges, net of $13.9 million tax benefit, $5.6 million tax expense and $4.8 million tax benefit in 2017, 2016 and 2015 ,respectively.(3) Unrecognized pension and OPEB benefit (costs), net of $2.1 million tax expense, $0.1 million tax expense and $4.6 million tax benefit in 2017, 2016 and 2015 , respectively.
The accompanying Notes to Consolidated Financial Statements are an integral part of these statements.
45
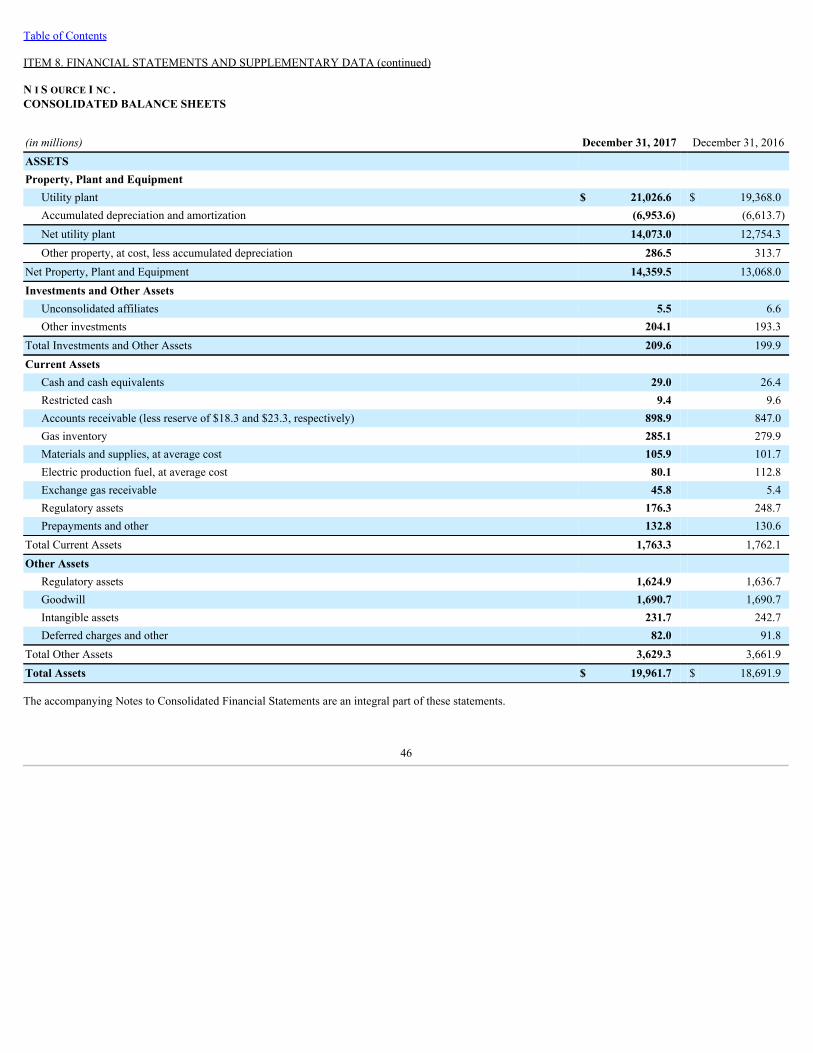
Table of Contents
ITEM 8. FINANCIAL STATEMENTS AND SUPPLEMENTARY DATA (continued)
N I S OURCE I NC .CONSOLIDATED BALANCE SHEETS
(inmillions) December 31, 2017 December 31, 2016ASSETS Property, Plant and Equipment
Utility plant $ 21,026.6 $ 19,368.0Accumulated depreciation and amortization (6,953.6) (6,613.7)Net utility plant 14,073.0 12,754.3Other property, at cost, less accumulated depreciation 286.5 313.7
Net Property, Plant and Equipment 14,359.5 13,068.0Investments and Other Assets
Unconsolidated affiliates 5.5 6.6Other investments 204.1 193.3
Total Investments and Other Assets 209.6 199.9Current Assets
Cash and cash equivalents 29.0 26.4Restricted cash 9.4 9.6Accounts receivable (less reserve of $18.3 and $23.3, respectively) 898.9 847.0Gas inventory 285.1 279.9Materials and supplies, at average cost 105.9 101.7Electric production fuel, at average cost 80.1 112.8Exchange gas receivable 45.8 5.4Regulatory assets 176.3 248.7Prepayments and other 132.8 130.6
Total Current Assets 1,763.3 1,762.1Other Assets
Regulatory assets 1,624.9 1,636.7Goodwill 1,690.7 1,690.7Intangible assets 231.7 242.7Deferred charges and other 82.0 91.8
Total Other Assets 3,629.3 3,661.9Total Assets $ 19,961.7 $ 18,691.9
The accompanying Notes to Consolidated Financial Statements are an integral part of these statements.
46
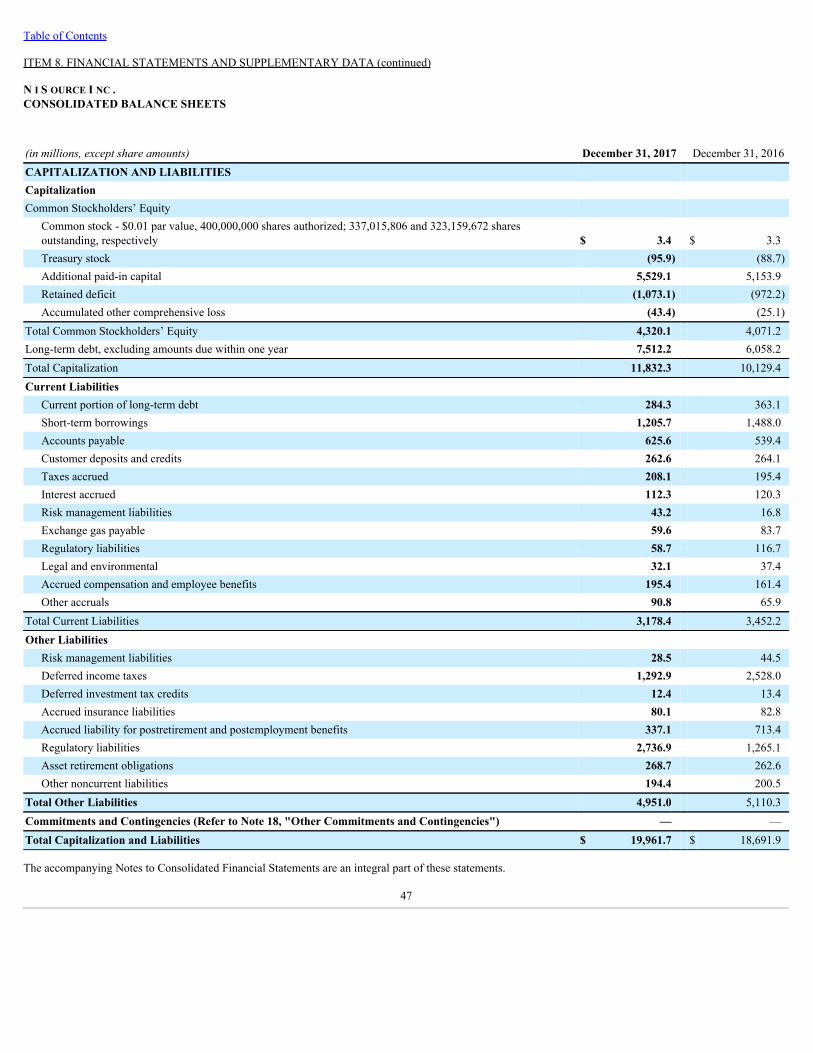
Table of Contents
ITEM 8. FINANCIAL STATEMENTS AND SUPPLEMENTARY DATA (continued)
N I S OURCE I NC .CONSOLIDATED BALANCE SHEETS
(inmillions,exceptshareamounts) December 31, 2017 December 31, 2016CAPITALIZATION AND LIABILITIES Capitalization Common Stockholders’ Equity
Common stock - $0.01 par value, 400,000,000 shares authorized; 337,015,806 and 323,159,672 sharesoutstanding, respectively $ 3.4 $ 3.3Treasury stock (95.9) (88.7)Additional paid-in capital 5,529.1 5,153.9Retained deficit (1,073.1) (972.2)Accumulated other comprehensive loss (43.4) (25.1)
Total Common Stockholders’ Equity 4,320.1 4,071.2Long-term debt, excluding amounts due within one year 7,512.2 6,058.2Total Capitalization 11,832.3 10,129.4Current Liabilities
Current portion of long-term debt 284.3 363.1Short-term borrowings 1,205.7 1,488.0Accounts payable 625.6 539.4Customer deposits and credits 262.6 264.1Taxes accrued 208.1 195.4Interest accrued 112.3 120.3Risk management liabilities 43.2 16.8Exchange gas payable 59.6 83.7Regulatory liabilities 58.7 116.7Legal and environmental 32.1 37.4Accrued compensation and employee benefits 195.4 161.4Other accruals 90.8 65.9
Total Current Liabilities 3,178.4 3,452.2Other Liabilities
Risk management liabilities 28.5 44.5Deferred income taxes 1,292.9 2,528.0Deferred investment tax credits 12.4 13.4Accrued insurance liabilities 80.1 82.8Accrued liability for postretirement and postemployment benefits 337.1 713.4Regulatory liabilities 2,736.9 1,265.1Asset retirement obligations 268.7 262.6Other noncurrent liabilities 194.4 200.5
Total Other Liabilities 4,951.0 5,110.3Commitments and Contingencies (Refer to Note 18, "Other Commitments and Contingencies") — —Total Capitalization and Liabilities $ 19,961.7 $ 18,691.9
The accompanying Notes to Consolidated Financial Statements are an integral part of these statements.
47
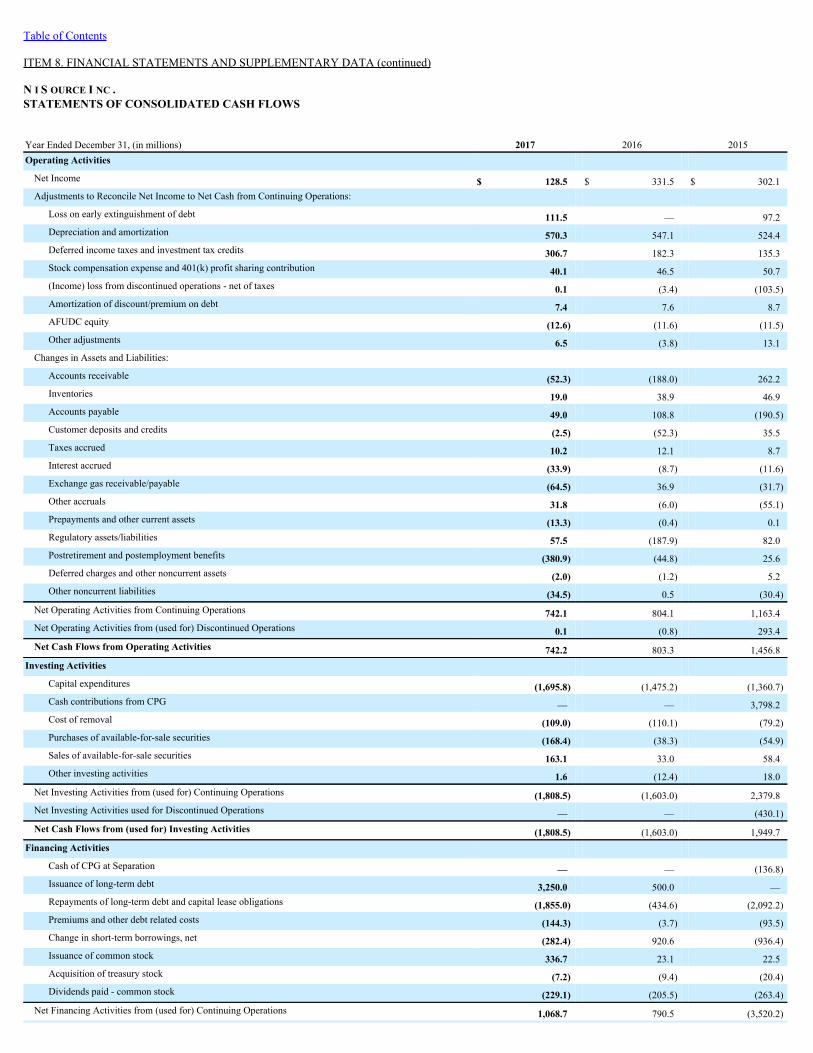
Table of Contents
ITEM 8. FINANCIAL STATEMENTS AND SUPPLEMENTARY DATA (continued)
N I S OURCE I NC .STATEMENTS OF CONSOLIDATED CASH FLOWS
Year Ended December 31, (in millions) 2017 2016 2015Operating Activities Net Income $ 128.5 $ 331.5 $ 302.1Adjustments to Reconcile Net Income to Net Cash from Continuing Operations:
Loss on early extinguishment of debt 111.5 — 97.2Depreciation and amortization 570.3 547.1 524.4Deferred income taxes and investment tax credits 306.7 182.3 135.3Stock compensation expense and 401(k) profit sharing contribution 40.1 46.5 50.7(Income) loss from discontinued operations - net of taxes 0.1 (3.4) (103.5)Amortization of discount/premium on debt 7.4 7.6 8.7AFUDC equity (12.6) (11.6) (11.5)Other adjustments 6.5 (3.8) 13.1
Changes in Assets and Liabilities: Accounts receivable (52.3) (188.0) 262.2Inventories 19.0 38.9 46.9Accounts payable 49.0 108.8 (190.5)Customer deposits and credits (2.5) (52.3) 35.5Taxes accrued 10.2 12.1 8.7Interest accrued (33.9) (8.7) (11.6)Exchange gas receivable/payable (64.5) 36.9 (31.7)Other accruals 31.8 (6.0) (55.1)Prepayments and other current assets (13.3) (0.4) 0.1Regulatory assets/liabilities 57.5 (187.9) 82.0Postretirement and postemployment benefits (380.9) (44.8) 25.6Deferred charges and other noncurrent assets (2.0) (1.2) 5.2Other noncurrent liabilities (34.5) 0.5 (30.4)
Net Operating Activities from Continuing Operations 742.1 804.1 1,163.4Net Operating Activities from (used for) Discontinued Operations 0.1 (0.8) 293.4Net Cash Flows from Operating Activities 742.2 803.3 1,456.8
Investing Activities Capital expenditures (1,695.8) (1,475.2) (1,360.7)Cash contributions from CPG — — 3,798.2Cost of removal (109.0) (110.1) (79.2)Purchases of available-for-sale securities (168.4) (38.3) (54.9)Sales of available-for-sale securities 163.1 33.0 58.4Other investing activities 1.6 (12.4) 18.0
Net Investing Activities from (used for) Continuing Operations (1,808.5) (1,603.0) 2,379.8Net Investing Activities used for Discontinued Operations — — (430.1)Net Cash Flows from (used for) Investing Activities (1,808.5) (1,603.0) 1,949.7
Financing Activities Cash of CPG at Separation — — (136.8)Issuance of long-term debt 3,250.0 500.0 —Repayments of long-term debt and capital lease obligations (1,855.0) (434.6) (2,092.2)Premiums and other debt related costs (144.3) (3.7) (93.5)Change in short-term borrowings, net (282.4) 920.6 (936.4)Issuance of common stock 336.7 23.1 22.5Acquisition of treasury stock (7.2) (9.4) (20.4)Dividends paid - common stock (229.1) (205.5) (263.4)
Net Financing Activities from (used for) Continuing Operations 1,068.7 790.5 (3,520.2)
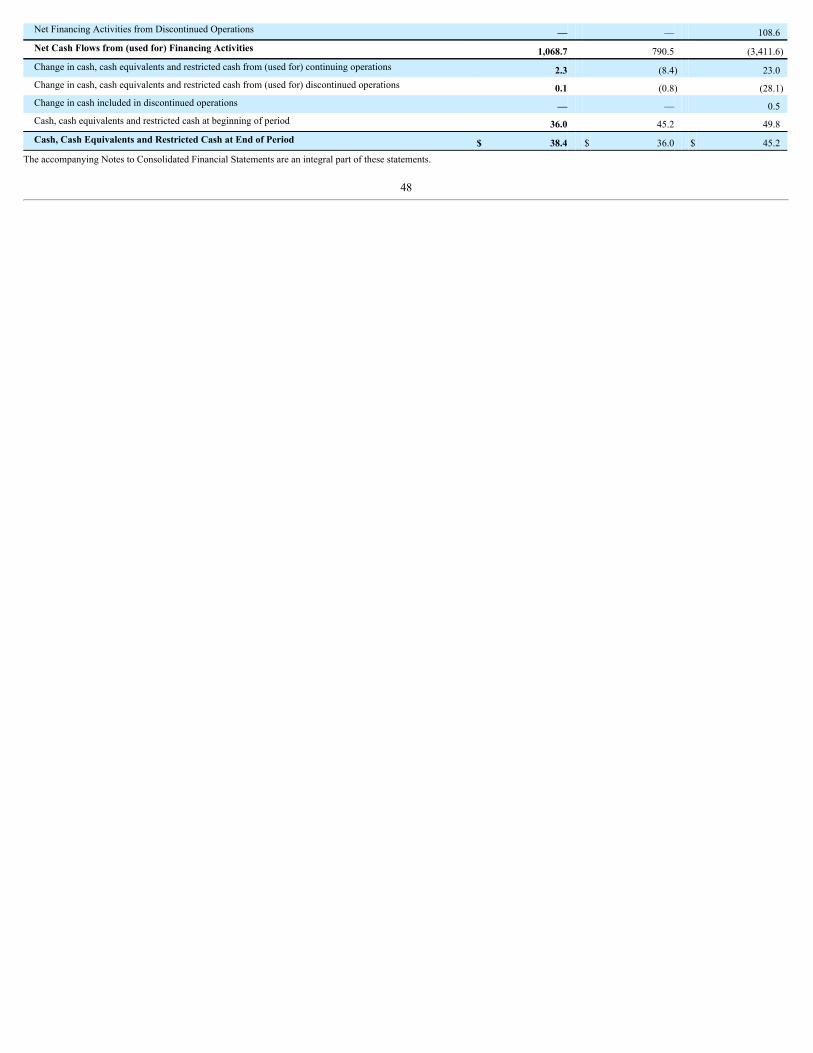
Net Financing Activities from Discontinued Operations — — 108.6Net Cash Flows from (used for) Financing Activities 1,068.7 790.5 (3,411.6)Change in cash, cash equivalents and restricted cash from (used for) continuing operations 2.3 (8.4) 23.0Change in cash, cash equivalents and restricted cash from (used for) discontinued operations 0.1 (0.8) (28.1)Change in cash included in discontinued operations — — 0.5Cash, cash equivalents and restricted cash at beginning of period 36.0 45.2 49.8Cash, Cash Equivalents and Restricted Cash at End of Period $ 38.4 $ 36.0 $ 45.2
The accompanying Notes to Consolidated Financial Statements are an integral part of these statements.
48
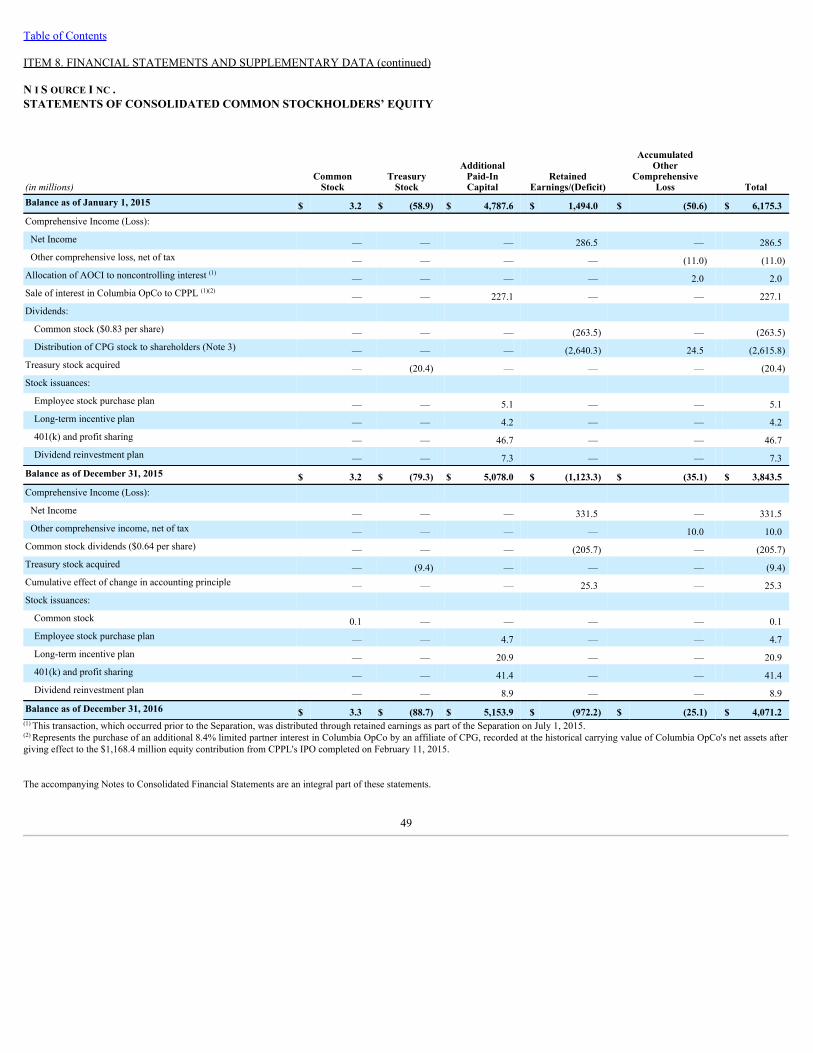
Table of Contents
ITEM 8. FINANCIAL STATEMENTS AND SUPPLEMENTARY DATA (continued)
N I S OURCE I NC .STATEMENTS OF CONSOLIDATED COMMON STOCKHOLDERS’ EQUITY
(inmillions)Common
Stock Treasury
Stock
AdditionalPaid-InCapital
RetainedEarnings/(Deficit)
AccumulatedOther
ComprehensiveLoss Total
Balance as of January 1, 2015 $ 3.2 $ (58.9) $ 4,787.6 $ 1,494.0 $ (50.6) $ 6,175.3Comprehensive Income (Loss): Net Income — — — 286.5 — 286.5Other comprehensive loss, net of tax — — — — (11.0) (11.0)Allocation of AOCI to noncontrolling interest (1) — — — — 2.0 2.0Sale of interest in Columbia OpCo to CPPL (1)(2) — — 227.1 — — 227.1Dividends: Common stock ($0.83 per share) — — — (263.5) — (263.5)Distribution of CPG stock to shareholders (Note 3) — — — (2,640.3) 24.5 (2,615.8)
Treasury stock acquired — (20.4) — — — (20.4)Stock issuances: Employee stock purchase plan — — 5.1 — — 5.1Long-term incentive plan — — 4.2 — — 4.2401(k) and profit sharing — — 46.7 — — 46.7Dividend reinvestment plan — — 7.3 — — 7.3
Balance as of December 31, 2015 $ 3.2 $ (79.3) $ 5,078.0 $ (1,123.3) $ (35.1) $ 3,843.5Comprehensive Income (Loss): Net Income — — — 331.5 — 331.5Other comprehensive income, net of tax — — — — 10.0 10.0Common stock dividends ($0.64 per share) — — — (205.7) — (205.7)Treasury stock acquired — (9.4) — — — (9.4)Cumulative effect of change in accounting principle — — — 25.3 — 25.3Stock issuances: Common stock 0.1 — — — — 0.1Employee stock purchase plan — — 4.7 — — 4.7Long-term incentive plan — — 20.9 — — 20.9401(k) and profit sharing — — 41.4 — — 41.4Dividend reinvestment plan — — 8.9 — — 8.9
Balance as of December 31, 2016 $ 3.3 $ (88.7) $ 5,153.9 $ (972.2) $ (25.1) $ 4,071.2(1) This transaction, which occurred prior to the Separation, was distributed through retained earnings as part of the Separation on July 1, 2015.(2) Represents the purchase of an additional 8.4% limited partner interest in Columbia OpCo by an affiliate of CPG, recorded at the historical carrying value of Columbia OpCo's net assets aftergiving effect to the $1,168.4 million equity contribution from CPPL's IPO completed on February 11, 2015.
The accompanying Notes to Consolidated Financial Statements are an integral part of these statements.
49
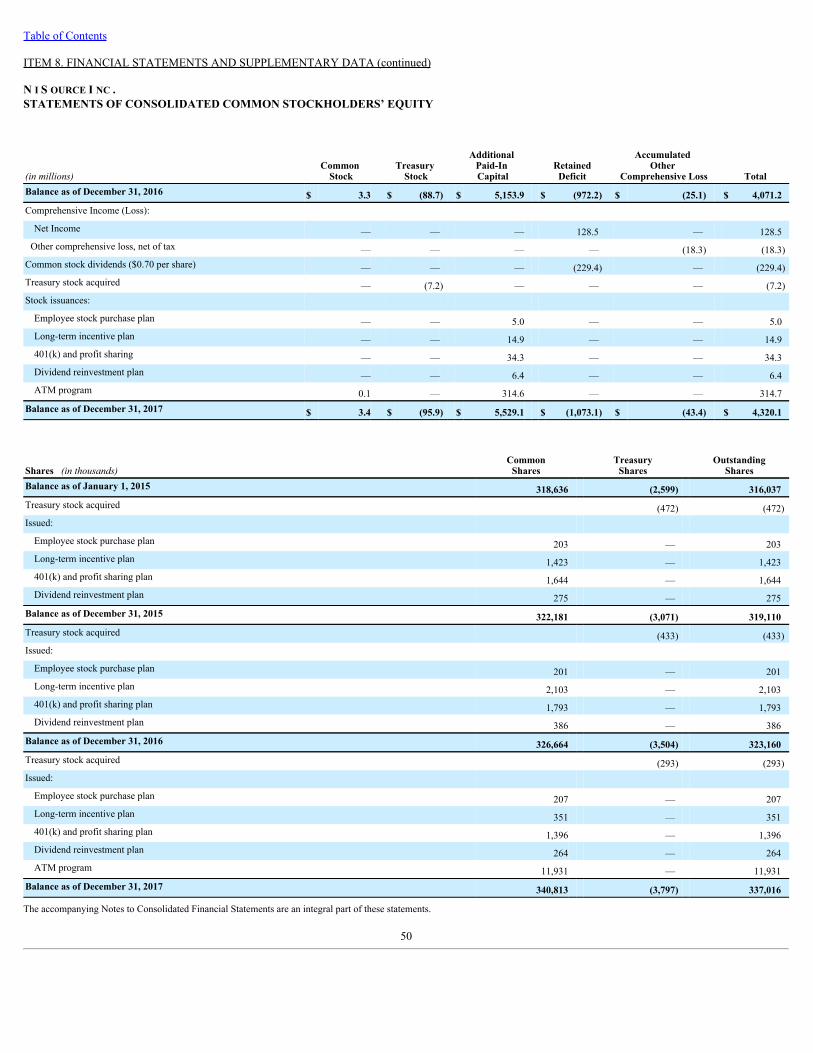
Table of Contents
ITEM 8. FINANCIAL STATEMENTS AND SUPPLEMENTARY DATA (continued)
N I S OURCE I NC .STATEMENTS OF CONSOLIDATED COMMON STOCKHOLDERS’ EQUITY
(inmillions)Common
Stock Treasury
Stock
Additional Paid-In Capital
RetainedDeficit
Accumulated Other
Comprehensive Loss TotalBalance as of December 31, 2016 $ 3.3 $ (88.7) $ 5,153.9 $ (972.2) $ (25.1) $ 4,071.2Comprehensive Income (Loss): Net Income — — — 128.5 — 128.5Other comprehensive loss, net of tax — — — — (18.3) (18.3)Common stock dividends ($0.70 per share) — — — (229.4) — (229.4)Treasury stock acquired — (7.2) — — — (7.2)Stock issuances: Employee stock purchase plan — — 5.0 — — 5.0Long-term incentive plan — — 14.9 — — 14.9401(k) and profit sharing — — 34.3 — — 34.3Dividend reinvestment plan — — 6.4 — — 6.4ATM program 0.1 — 314.6 — — 314.7
Balance as of December 31, 2017 $ 3.4 $ (95.9) $ 5,529.1 $ (1,073.1) $ (43.4) $ 4,320.1
Shares (inthousands)Common
Shares Treasury
Shares Outstanding
SharesBalance as of January 1, 2015 318,636 (2,599) 316,037Treasury stock acquired (472) (472)Issued: Employee stock purchase plan 203 — 203Long-term incentive plan 1,423 — 1,423401(k) and profit sharing plan 1,644 — 1,644Dividend reinvestment plan 275 — 275
Balance as of December 31, 2015 322,181 (3,071) 319,110Treasury stock acquired (433) (433)Issued: Employee stock purchase plan 201 — 201Long-term incentive plan 2,103 — 2,103401(k) and profit sharing plan 1,793 — 1,793Dividend reinvestment plan 386 — 386
Balance as of December 31, 2016 326,664 (3,504) 323,160Treasury stock acquired (293) (293)Issued: Employee stock purchase plan 207 — 207Long-term incentive plan 351 — 351401(k) and profit sharing plan 1,396 — 1,396Dividend reinvestment plan 264 — 264ATM program 11,931 — 11,931
Balance as of December 31, 2017 340,813 (3,797) 337,016
The accompanying Notes to Consolidated Financial Statements are an integral part of these statements.
50
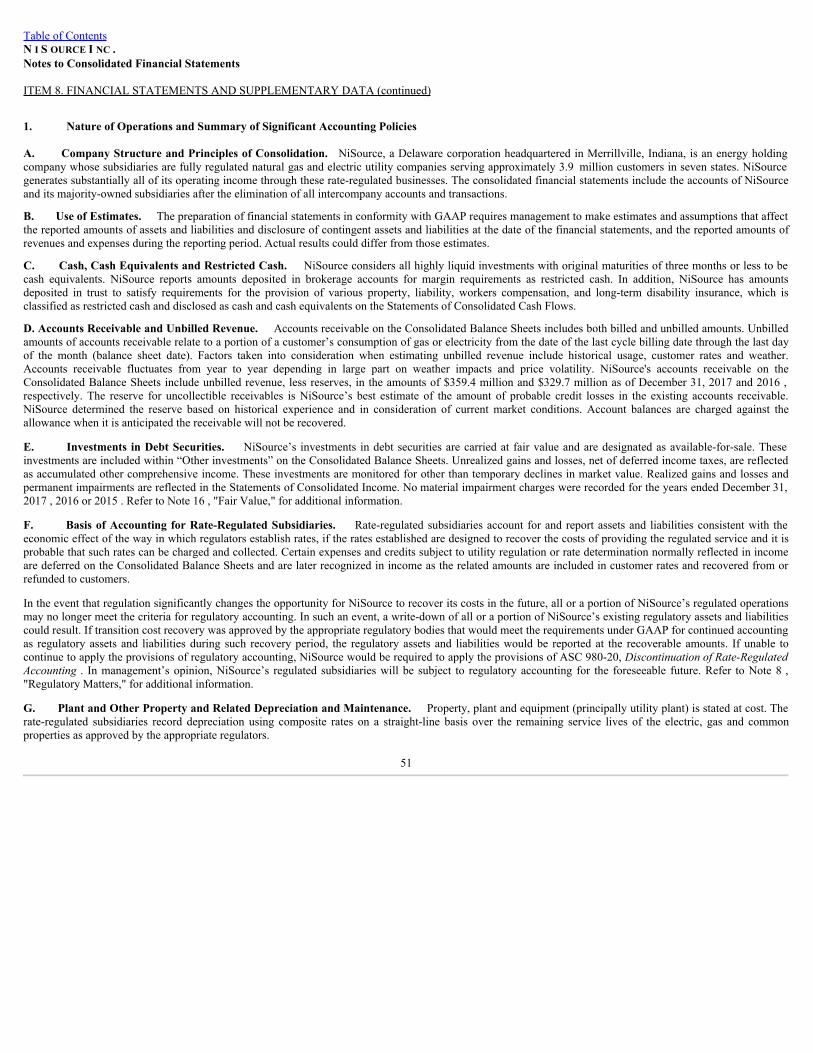
Table of ContentsN I S OURCE I NC .Notes to Consolidated Financial Statements
ITEM 8. FINANCIAL STATEMENTS AND SUPPLEMENTARY DATA (continued)
1. Nature of Operations and Summary of Significant Accounting Policies
A. Company Structure and Principles of Consolidation. NiSource, a Delaware corporation headquartered in Merrillville, Indiana, is an energy holdingcompany whose subsidiaries are fully regulated natural gas and electric utility companies serving approximately 3.9 million customers in seven states. NiSourcegenerates substantially all of its operating income through these rate-regulated businesses. The consolidated financial statements include the accounts of NiSourceand its majority-owned subsidiaries after the elimination of all intercompany accounts and transactions.
B. Use of Estimates. The preparation of financial statements in conformity with GAAP requires management to make estimates and assumptions that affectthe reported amounts of assets and liabilities and disclosure of contingent assets and liabilities at the date of the financial statements, and the reported amounts ofrevenues and expenses during the reporting period. Actual results could differ from those estimates.
C. Cash, Cash Equivalents and Restricted Cash. NiSource considers all highly liquid investments with original maturities of three months or less to becash equivalents. NiSource reports amounts deposited in brokerage accounts for margin requirements as restricted cash. In addition, NiSource has amountsdeposited in trust to satisfy requirements for the provision of various property, liability, workers compensation, and long-term disability insurance, which isclassified as restricted cash and disclosed as cash and cash equivalents on the Statements of Consolidated Cash Flows.
D. Accounts Receivable and Unbilled Revenue. Accounts receivable on the Consolidated Balance Sheets includes both billed and unbilled amounts. Unbilledamounts of accounts receivable relate to a portion of a customer’s consumption of gas or electricity from the date of the last cycle billing date through the last dayof the month (balance sheet date). Factors taken into consideration when estimating unbilled revenue include historical usage, customer rates and weather.Accounts receivable fluctuates from year to year depending in large part on weather impacts and price volatility. NiSource's accounts receivable on theConsolidated Balance Sheets include unbilled revenue, less reserves, in the amounts of $359.4 million and $329.7 million as of December 31, 2017 and 2016 ,respectively. The reserve for uncollectible receivables is NiSource’s best estimate of the amount of probable credit losses in the existing accounts receivable.NiSource determined the reserve based on historical experience and in consideration of current market conditions. Account balances are charged against theallowance when it is anticipated the receivable will not be recovered.
E. Investments in Debt Securities. NiSource’s investments in debt securities are carried at fair value and are designated as available-for-sale. Theseinvestments are included within “Other investments” on the Consolidated Balance Sheets. Unrealized gains and losses, net of deferred income taxes, are reflectedas accumulated other comprehensive income. These investments are monitored for other than temporary declines in market value. Realized gains and losses andpermanent impairments are reflected in the Statements of Consolidated Income. No material impairment charges were recorded for the years ended December 31,2017 , 2016 or 2015 . Refer to Note 16 , "Fair Value," for additional information.
F. Basis of Accounting for Rate-Regulated Subsidiaries. Rate-regulated subsidiaries account for and report assets and liabilities consistent with theeconomic effect of the way in which regulators establish rates, if the rates established are designed to recover the costs of providing the regulated service and it isprobable that such rates can be charged and collected. Certain expenses and credits subject to utility regulation or rate determination normally reflected in incomeare deferred on the Consolidated Balance Sheets and are later recognized in income as the related amounts are included in customer rates and recovered from orrefunded to customers.
In the event that regulation significantly changes the opportunity for NiSource to recover its costs in the future, all or a portion of NiSource’s regulated operationsmay no longer meet the criteria for regulatory accounting. In such an event, a write-down of all or a portion of NiSource’s existing regulatory assets and liabilitiescould result. If transition cost recovery was approved by the appropriate regulatory bodies that would meet the requirements under GAAP for continued accountingas regulatory assets and liabilities during such recovery period, the regulatory assets and liabilities would be reported at the recoverable amounts. If unable tocontinue to apply the provisions of regulatory accounting, NiSource would be required to apply the provisions of ASC 980-20, DiscontinuationofRate-RegulatedAccounting . In management’s opinion, NiSource’s regulated subsidiaries will be subject to regulatory accounting for the foreseeable future. Refer to Note 8 ,"Regulatory Matters," for additional information.
G. Plant and Other Property and Related Depreciation and Maintenance. Property, plant and equipment (principally utility plant) is stated at cost. Therate-regulated subsidiaries record depreciation using composite rates on a straight-line basis over the remaining service lives of the electric, gas and commonproperties as approved by the appropriate regulators.
51
Table of ContentsN I S OURCE I NC .Notes to Consolidated Financial Statements
ITEM 8. FINANCIAL STATEMENTS AND SUPPLEMENTARY DATA (continued)
Non-utility property is generally depreciated on a straight-line basis over the life of the associated asset. Refer to Note 5 , "Property, Plant and Equipment," foradditional information related to depreciation expense at Units 7 and 8 at Bailly Generating Station.
For rate-regulated companies, AFUDC is capitalized on all classes of property except organization costs, land, autos, office equipment, tools and other generalproperty purchases. The allowance is applied to construction costs for that period of time between the date of the expenditure and the date on which such project isplaced in service. The pre-tax rate for AFUDC was 4.0% in 2017 , 4.5% in 2016 and 4.7% in 2015 .
Generally, NiSource’s subsidiaries follow the practice of charging maintenance and repairs, including the cost of removal of minor items of property, to expense asincurred. When NiSource’s subsidiaries retire regulated property, plant and equipment, original cost plus the cost of retirement, less salvage value, is charged toaccumulated depreciation. However, when it becomes probable a regulated asset will be retired substantially in advance of its original expected useful life or isabandoned, the cost of the asset and the corresponding accumulated depreciation is recognized as a separate asset. If the asset is still in operation, the net amount isclassified as "Other property, at cost, less accumulated depreciation" on the Consolidated Balance Sheets. If the asset is no longer operating, the net amount isclassified in "Regulatory assets" on the Consolidated Balance Sheets. If NiSource is able to recover a full return of and on investment, the carrying value of theasset is based on historical cost. If NiSource is not able to recover a full return on investment, a loss on impairment is recognized to the extent the net book value ofthe asset exceeds the present value of future revenues discounted at the incremental borrowing rate.
When NiSource’s subsidiaries sell entire regulated operating units, or retire or sell nonregulated properties, the original cost and accumulated depreciation andamortization balances are removed from "Property, Plant and Equipment" on the Consolidated Balance Sheets. Any gain or loss is recorded in earnings, unlessotherwise required by the applicable regulatory body. Refer to Note 5 , "Property, Plant and Equipment," for further information.
External and internal costs associated with computer software developed for internal use are capitalized. Capitalization of such costs commences upon thecompletion of the preliminary stage of each project. Once the installed software is ready for its intended use, such capitalized costs are amortized on a straight-linebasis generally over a period of five years, except for certain significant enterprise-wide technology investments which are amortized over a ten-year period.
H. Goodwill and Other Intangible Assets. Substantially all of NiSource's goodwill relates to the excess of cost over the fair value of the net assetsacquired in the Columbia acquisition on November 1, 2000. NiSource tests its goodwill for impairment annually as of May 1, or more frequently if events andcircumstances indicate that goodwill might be impaired. Fair value of NiSource's reporting units is determined using a combination of income and marketapproaches.
NiSource has other intangible assets consisting primarily of franchise rights apart from goodwill that were identified as part of the purchase price allocationsassociated with the acquisition of Columbia of Massachusetts which is being amortized on a straight-line basis over forty years from the date of acquisition. SeeNote 6 , "Goodwill and Other Intangible Assets," for additional information.
I. Revenue Recognition. Revenue is recorded as products and services are delivered. Utility revenues are billed to customers monthly on a cycle basis.Revenues are recorded on the accrual basis and also include estimates for electricity and gas delivered but not billed. The accruals for unbilled revenues arereversed in the subsequent accounting period when meters are actually read and customers are billed.
On occasion, NiSource's regulated subsidiaries are permitted to implement new rates that have not been formally approved by their state regulatory commissions,which are subject to refund. As permitted by accounting principles generally accepted in the United States, each regulated subsidiary recognizes this revenue andestablishes a reserve for amounts that could be refunded based on its experience for the jurisdiction in which the rates were implemented. In connection with suchrevenues, estimated rate refund liabilities are recorded which reflect management’s current judgment of the ultimate outcomes of the proceedings. No provisionsare made when, in the opinion of management, the facts and circumstances preclude a reasonable estimate of the outcome.
J. Accounts Receivable Transfer Program. Certain of NiSource’s subsidiaries have agreements with third parties to sell certain accounts receivablewithout recourse. These transfers of accounts receivable are accounted for as secured borrowings. The entire gross receivables balance remains on theDecember 31, 2017 and 2016 Consolidated Balance Sheets and short-term debt is recorded in the amount of proceeds received from the purchasers involved in thetransactions. Refer to Note 17 , "Transfers of Financial Assets," for further information.
52
Table of ContentsN I S OURCE I NC .Notes to Consolidated Financial Statements
ITEM 8. FINANCIAL STATEMENTS AND SUPPLEMENTARY DATA (continued)
K. Gas Cost and Fuel Adjustment Clause. NiSource’s regulated subsidiaries defer most differences between gas and fuel purchase costs and the recoveryof such costs in revenues, and adjust future billings for such deferrals on a basis consistent with applicable state-approved tariff provisions. These deferred balancesare recorded as "Regulatory assets" or "Regulatory liabilities," as appropriate, on the Consolidated Balance Sheets. Refer to Note 8 , "Regulatory Matters," foradditional information.
L. Inventory. Both the LIFO inventory methodology and the weighted average cost methodology are used to value natural gas in storage, as approved byregulators for all of NiSource’s regulated subsidiaries. Inventory valued using LIFO was $45.5 million and $46.1 million at December 31, 2017 and 2016 ,respectively. Based on the average cost of gas using the LIFO method, the estimated replacement cost of gas in storage was less than the stated LIFO cost by $17.4million and $9.4 million at December 31, 2017 and 2016 , respectively. Gas inventory valued using the weighted average cost methodology was $239.6 million atDecember 31, 2017 and $233.8 million at December 31, 2016 .
Electric production fuel is valued using the weighted average cost inventory methodology, as approved by NIPSCO's regulator.
Materials and supplies are valued using the weighted average cost inventory methodology.
M. Accounting for Exchange and Balancing Arrangements of Natural Gas. NiSource’s Gas Distribution Operations segment enters into balancing andexchange arrangements of natural gas as part of its operations and off-system sales programs. NiSource records a receivable or payable for any of its respectivecumulative gas imbalances, as well as for any gas inventory borrowed or lent under a Gas Distribution Operations exchange agreement. Exchange gas is valuedbased on individual regulatory jurisdiction requirements (for example, historical spot rate, spot at the beginning of the month). These receivables and payables arerecorded as “Exchange gas receivable” or “Exchange gas payable” on NiSource’s Consolidated Balance Sheets, as appropriate.
N. Accounting for Risk Management Activities. NiSource accounts for its derivatives and hedging activities in accordance with ASC 815. NiSourcerecognizes all derivatives as either assets or liabilities on the Consolidated Balance Sheets at fair value, unless such contracts are exempted as a normal purchasenormal sale under the provisions of the standard. The accounting for changes in the fair value of a derivative depends on the intended use of the derivative andresulting designation.
NiSource has elected not to net fair value amounts for any of its derivative instruments or the fair value amounts recognized for its right to receive cash collateralor obligation to pay cash collateral arising from those derivative instruments recognized at fair value, which are executed with the same counterparty under amaster netting arrangement. See Note 9 , "Risk Management Activities," for additional information.
O. Income Taxes and Investment Tax Credits. NiSource records income taxes to recognize full interperiod tax allocations. Under the asset and liabilitymethod, deferred income taxes are provided for the tax consequences of temporary differences by applying enacted statutory tax rates applicable to future years todifferences between the financial statement carrying amount and the tax basis of existing assets and liabilities. Previously recorded investment tax credits of theregulated subsidiaries were deferred on the balance sheet and are being amortized to book income over the regulatory life of the related properties to conform toregulatory policy.
To the extent certain deferred income taxes of the regulated companies are recoverable or payable through future rates, regulatory assets and liabilities have beenestablished. Regulatory assets for income taxes are primarily attributable to property-related tax timing differences for which deferred taxes had not been providedin the past, when regulators did not recognize such taxes as costs in the ratemaking process. Regulatory liabilities for income taxes are primarily attributable to theregulated companies’ obligation to refund to ratepayers deferred income taxes provided at rates higher than the current Federal income tax rate. Such property-related amounts are credited to ratepayers using either the average rate assumption method or the reverse South Georgia method. Non property-related amounts arecredited to ratepayers consistent with state utility commission direction.
Pursuant to the U.S. Internal Revenue Code and relevant state taxing authorities, NiSource and its subsidiaries file consolidated income tax returns for Federal andcertain state jurisdictions. NiSource and its subsidiaries are parties to an agreement (the “Intercompany Income Tax Allocation Agreement”) that provides for theallocation of consolidated tax liabilities. The Intercompany Income Tax Allocation Agreement generally provides that each party is allocated an amount of taxsimilar to that which would be owed had the party been separately subject to tax.
P. Environmental Expenditures. NiSource accrues for costs associated with environmental remediation obligations when the incurrence of such costs isprobable and the amounts can be reasonably estimated, regardless of when the expenditures are actually made. The undiscounted estimated future expenditures arebased on currently enacted laws and regulations, existing
53
Table of ContentsN I S OURCE I NC .Notes to Consolidated Financial Statements
ITEM 8. FINANCIAL STATEMENTS AND SUPPLEMENTARY DATA (continued)
technology and estimated site-specific costs where assumptions may be made about the nature and extent of site contamination, the extent of cleanup efforts, costsof alternative cleanup methods and other variables. The liability is adjusted as further information is discovered or circumstances change. The reserves forestimated environmental expenditures are recorded on the Consolidated Balance Sheets in “Legal and environmental” for short-term portions of these liabilitiesand “Other noncurrent liabilities” for the respective long-term portions of these liabilities. Rate-regulated subsidiaries applying regulatory accounting establishregulatory assets on the Consolidated Balance Sheets to the extent that future recovery of environmental remediation costs is probable through the regulatoryprocess. Refer to Note 18 , "Other Commitments and Contingencies," for further information.
Q. Excise Taxes. NiSource accounts for excise taxes that are customer liabilities by separately stating on its invoices the tax to its customers and recordingamounts invoiced as liabilities payable to the applicable taxing jurisdiction. Such balances are presented within "Other accruals" on the Consolidated BalanceSheets. These types of taxes collected from customers, comprised largely of sales taxes, are presented on a net basis affecting neither revenues nor cost of sales.NiSource accounts for excise taxes for which it is liable by recording a liability for the expected tax with a corresponding charge to “Other taxes” expense on theStatements of Consolidated Income.
R. Accrued Insurance Liabilities. NiSource accrues for insurance costs related to workers compensation, automobile, property, general and employmentpractices liabilities based on the most probable value of each claim. Claim values are determined by professional, licensed loss adjusters who consider the facts ofthe claim, anticipated indemnification and legal expenses, and respective state rules. Claims are reviewed by NiSource at least quarterly and an adjustment is madeto the accrual based on the most current information. NiSource’s actual exposure to liability is minimal due to coverage from its wholly-owned captive insurer whothen transfers risk to third party insurance providers for the majority of costs paid to claimants above NiSource's deductible.
2. Recent Accounting Pronouncements
Recently Issued Accounting Pronouncements
NiSource is currently evaluating the impact of certain ASUs on its Consolidated Financial Statements or Notes to Consolidated Financial Statements, which aredescribed below:
Standard Description Effective DateEffect on the financial statements or other
significant mattersASU 2016-13, FinancialInstruments-CreditLosses(Topic326)
The pronouncement changes the impairmentmodel for most financial assets, replacing thecurrent "incurred loss" model. ASU 2016-13will require the use of an "expected loss" modelfor instruments measured at amortized cost andwill also require entities to record allowancesfor available-for-sale debt securities rather thanreduce the carrying amount.
Annual periods beginningafter December 15, 2019,including interim periodstherein. Early adoption ispermitted for annual orinterim periods beginningafter December 15, 2018.
NiSource is currently evaluating the impact ofadoption, if any, on the Consolidated FinancialStatements and Notes to Consolidated FinancialStatements.
54
Table of ContentsN I S OURCE I NC .Notes to Consolidated Financial Statements
ITEM 8. FINANCIAL STATEMENTS AND SUPPLEMENTARY DATA (continued)
Standard Description Effective DateEffect on the financial statements or other
significant mattersASU 2018-01, Leases(Topic842):LandEasementPracticalExpedientforTransitiontoTopic842
The pronouncement offers a practical expedientfor accounting for land easements under ASU2016-02. This practical expedient allows anentity the option of not evaluating existing landeasements under ASC 842. New or modifiedland easements will still require evaluationunder ASC 842 on a prospective basisbeginning on the date of adoption.
Annual periods beginningafter December 15, 2018,including interim periodstherein. Early adoption ispermitted.
NiSource has formed an internal stakeholder groupthat meets periodically to share information andgather data related to leasing activity at NiSource.This includes compiling a list of all contracts thatcould meet the definition of a lease under the newstandard and evaluating the accounting for thesecontracts under the new standard to determine theultimate impact the new standard will have onNiSource’s financial statements. Also, thisprocedure has identified process improvements toensure data from newly initiated leases is capturedto comply with the new standard. This workincluded the assistance of a third-party advisoryfirm. NiSource maintains a substantial number ofeasements and expects ASU 2018-01 will ease theprocess of implementation of ASC 842. NiSourceplans to adopt these standards effective January 1,2019.
ASU 2016-02, Leases(Topic842)
The pronouncement introduces a lessee modelthat brings most leases on the balance sheet.The standard requires that lessees recognize thefollowing for all leases (with the exception ofshort-term leases, as that term is defined in thestandard) at the lease commencement date: (1)a lease liability, which is a lessee’s obligationto make lease payments arising from a lease,measured on a discounted basis; and (2) a right-of-use asset, which is an asset that representsthe lessee’s right to use, or control the use of, aspecified asset for the lease term.
ASU 2018-02, IncomeStatement-ReportingComprehensiveIncome(Topic220):ReclassificationofCertainTaxEffectsfromAccumulatedOtherComprehensiveIncome
The pronouncement permits entities the optionto reclassify tax effects that are stranded inaccumulated other comprehensive income as aresult of the implementation of the TCJA toretained earnings.
Annual periods beginningafter December 15, 2018,including interim periodstherein. Early adoption ispermitted for interim periodsbeginning after December 15,2017.
NiSource is currently evaluating theimpact of adoption on theConsolidated Financial Statements andNotes to Consolidated FinancialStatements.
Recently Adopted Accounting Pronouncements
Standard AdoptionASU 2017-12, DerivativesandHedging(Topic815):TargetedImprovementstoaccountingforHedgingActivities
NiSource elected to adopt this ASU effective September 30, 2017. As a result, NiSource is no longer required to separatelymeasure and report hedge ineffectiveness. The guidance also eases the requirements related to ongoing hedge effectivenessassessments at NiSource. The adoption of this standard did not have a material impact on the Consolidated Financial Statementsor Notes to Consolidated Financial Statements.
55
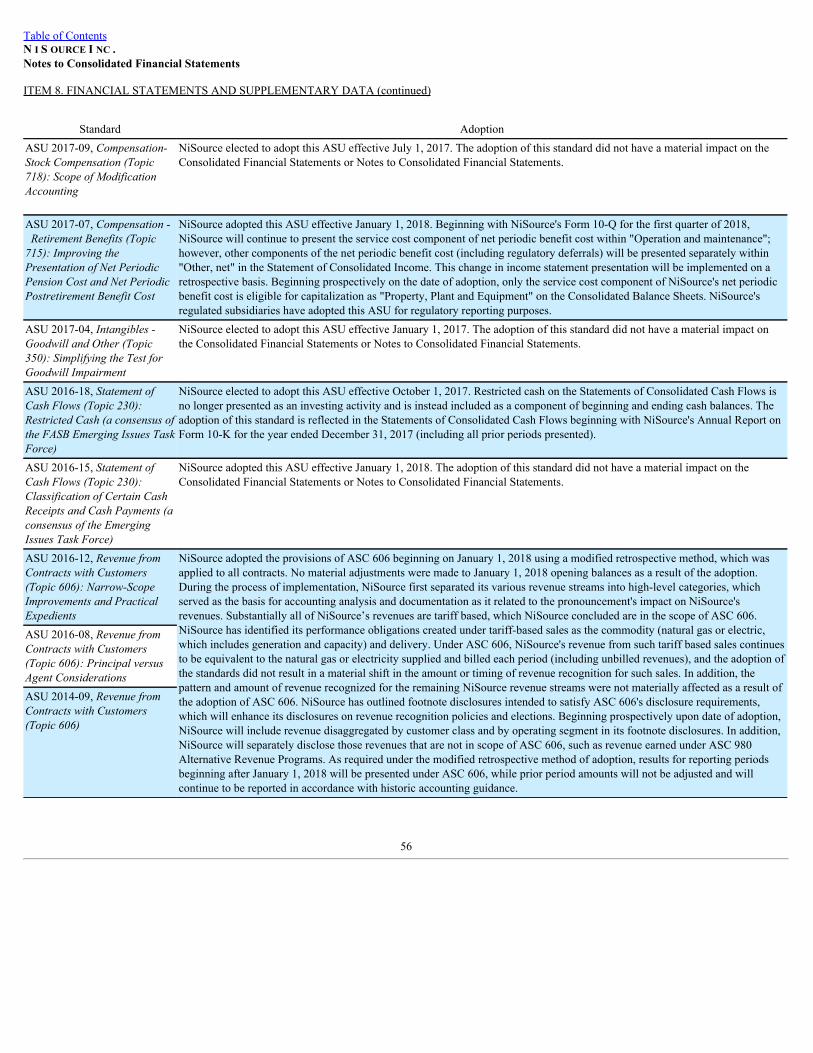
Table of ContentsN I S OURCE I NC .Notes to Consolidated Financial Statements
ITEM 8. FINANCIAL STATEMENTS AND SUPPLEMENTARY DATA (continued)
Standard AdoptionASU 2017-09, Compensation-StockCompensation(Topic718):ScopeofModificationAccounting
NiSource elected to adopt this ASU effective July 1, 2017. The adoption of this standard did not have a material impact on theConsolidated Financial Statements or Notes to Consolidated Financial Statements.
ASU 2017-07, Compensation- RetirementBenefits(Topic715):ImprovingthePresentationofNetPeriodicPensionCostandNetPeriodicPostretirementBenefitCost
NiSource adopted this ASU effective January 1, 2018. Beginning with NiSource's Form 10-Q for the first quarter of 2018,NiSource will continue to present the service cost component of net periodic benefit cost within "Operation and maintenance";however, other components of the net periodic benefit cost (including regulatory deferrals) will be presented separately within"Other, net" in the Statement of Consolidated Income. This change in income statement presentation will be implemented on aretrospective basis. Beginning prospectively on the date of adoption, only the service cost component of NiSource's net periodicbenefit cost is eligible for capitalization as "Property, Plant and Equipment" on the Consolidated Balance Sheets. NiSource'sregulated subsidiaries have adopted this ASU for regulatory reporting purposes.
ASU 2017-04, Intangibles-GoodwillandOther(Topic350):SimplifyingtheTestforGoodwillImpairment
NiSource elected to adopt this ASU effective January 1, 2017. The adoption of this standard did not have a material impact onthe Consolidated Financial Statements or Notes to Consolidated Financial Statements.
ASU 2016-18, StatementofCashFlows(Topic230):RestrictedCash(aconsensusoftheFASBEmergingIssuesTaskForce)
NiSource elected to adopt this ASU effective October 1, 2017. Restricted cash on the Statements of Consolidated Cash Flows isno longer presented as an investing activity and is instead included as a component of beginning and ending cash balances. Theadoption of this standard is reflected in the Statements of Consolidated Cash Flows beginning with NiSource's Annual Report onForm 10-K for the year ended December 31, 2017 (including all prior periods presented).
ASU 2016-15, StatementofCashFlows(Topic230):ClassificationofCertainCashReceiptsandCashPayments(aconsensusoftheEmergingIssuesTaskForce)
NiSource adopted this ASU effective January 1, 2018. The adoption of this standard did not have a material impact on theConsolidated Financial Statements or Notes to Consolidated Financial Statements.
ASU 2016-12, RevenuefromContractswithCustomers(Topic606):Narrow-ScopeImprovementsandPracticalExpedients
NiSource adopted the provisions of ASC 606 beginning on January 1, 2018 using a modified retrospective method, which wasapplied to all contracts. No material adjustments were made to January 1, 2018 opening balances as a result of the adoption.During the process of implementation, NiSource first separated its various revenue streams into high-level categories, whichserved as the basis for accounting analysis and documentation as it related to the pronouncement's impact on NiSource'srevenues. Substantially all of NiSource’s revenues are tariff based, which NiSource concluded are in the scope of ASC 606.NiSource has identified its performance obligations created under tariff-based sales as the commodity (natural gas or electric,which includes generation and capacity) and delivery. Under ASC 606, NiSource's revenue from such tariff based sales continuesto be equivalent to the natural gas or electricity supplied and billed each period (including unbilled revenues), and the adoption ofthe standards did not result in a material shift in the amount or timing of revenue recognition for such sales. In addition, thepattern and amount of revenue recognized for the remaining NiSource revenue streams were not materially affected as a result ofthe adoption of ASC 606. NiSource has outlined footnote disclosures intended to satisfy ASC 606's disclosure requirements,which will enhance its disclosures on revenue recognition policies and elections. Beginning prospectively upon date of adoption,NiSource will include revenue disaggregated by customer class and by operating segment in its footnote disclosures. In addition,NiSource will separately disclose those revenues that are not in scope of ASC 606, such as revenue earned under ASC 980Alternative Revenue Programs. As required under the modified retrospective method of adoption, results for reporting periodsbeginning after January 1, 2018 will be presented under ASC 606, while prior period amounts will not be adjusted and willcontinue to be reported in accordance with historic accounting guidance.
ASU 2016-08, RevenuefromContractswithCustomers(Topic606):PrincipalversusAgentConsiderationsASU 2014-09, RevenuefromContractswithCustomers(Topic606)
56
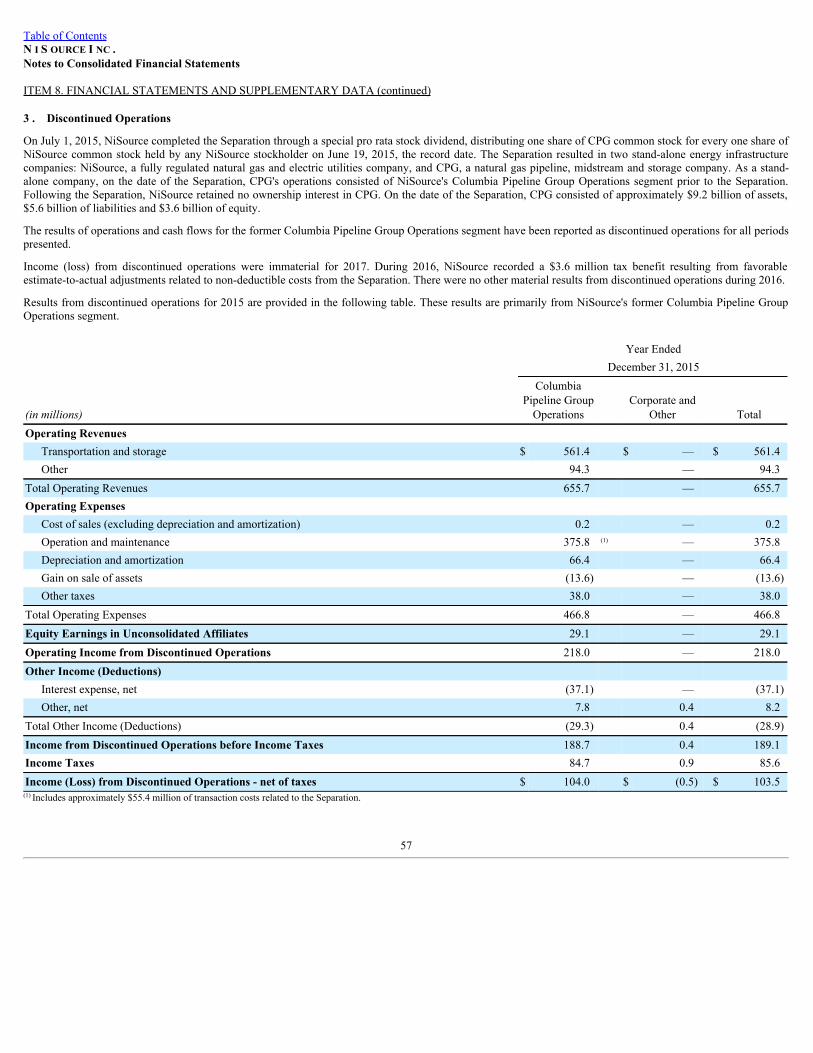
Table of ContentsN I S OURCE I NC .Notes to Consolidated Financial Statements
ITEM 8. FINANCIAL STATEMENTS AND SUPPLEMENTARY DATA (continued)
3 . Discontinued Operations
On July 1, 2015, NiSource completed the Separation through a special pro rata stock dividend, distributing one share of CPG common stock for every one share ofNiSource common stock held by any NiSource stockholder on June 19, 2015, the record date. The Separation resulted in two stand-alone energy infrastructurecompanies: NiSource, a fully regulated natural gas and electric utilities company, and CPG, a natural gas pipeline, midstream and storage company. As a stand-alone company, on the date of the Separation, CPG's operations consisted of NiSource's Columbia Pipeline Group Operations segment prior to the Separation.Following the Separation, NiSource retained no ownership interest in CPG. On the date of the Separation, CPG consisted of approximately $9.2 billion of assets,$5.6 billion of liabilities and $3.6 billion of equity.
The results of operations and cash flows for the former Columbia Pipeline Group Operations segment have been reported as discontinued operations for all periodspresented.
Income (loss) from discontinued operations were immaterial for 2017. During 2016, NiSource recorded a $3.6 million tax benefit resulting from favorableestimate-to-actual adjustments related to non-deductible costs from the Separation. There were no other material results from discontinued operations during 2016.
Results from discontinued operations for 2015 are provided in the following table. These results are primarily from NiSource's former Columbia Pipeline GroupOperations segment.
Year Ended December 31, 2015
(inmillions)
ColumbiaPipeline GroupOperations
Corporate andOther Total
Operating Revenues Transportation and storage $ 561.4 $ — $ 561.4Other 94.3 — 94.3
Total Operating Revenues 655.7 — 655.7Operating Expenses
Cost of sales (excluding depreciation and amortization) 0.2 — 0.2Operation and maintenance 375.8 (1) — 375.8Depreciation and amortization 66.4 — 66.4Gain on sale of assets (13.6) — (13.6)Other taxes 38.0 — 38.0
Total Operating Expenses 466.8 — 466.8Equity Earnings in Unconsolidated Affiliates 29.1 — 29.1Operating Income from Discontinued Operations 218.0 — 218.0Other Income (Deductions)
Interest expense, net (37.1) — (37.1)Other, net 7.8 0.4 8.2
Total Other Income (Deductions) (29.3) 0.4 (28.9)Income from Discontinued Operations before Income Taxes 188.7 0.4 189.1Income Taxes 84.7 0.9 85.6Income (Loss) from Discontinued Operations - net of taxes $ 104.0 $ (0.5) $ 103.5(1) Includes approximately $55.4 million of transaction costs related to the Separation.
57
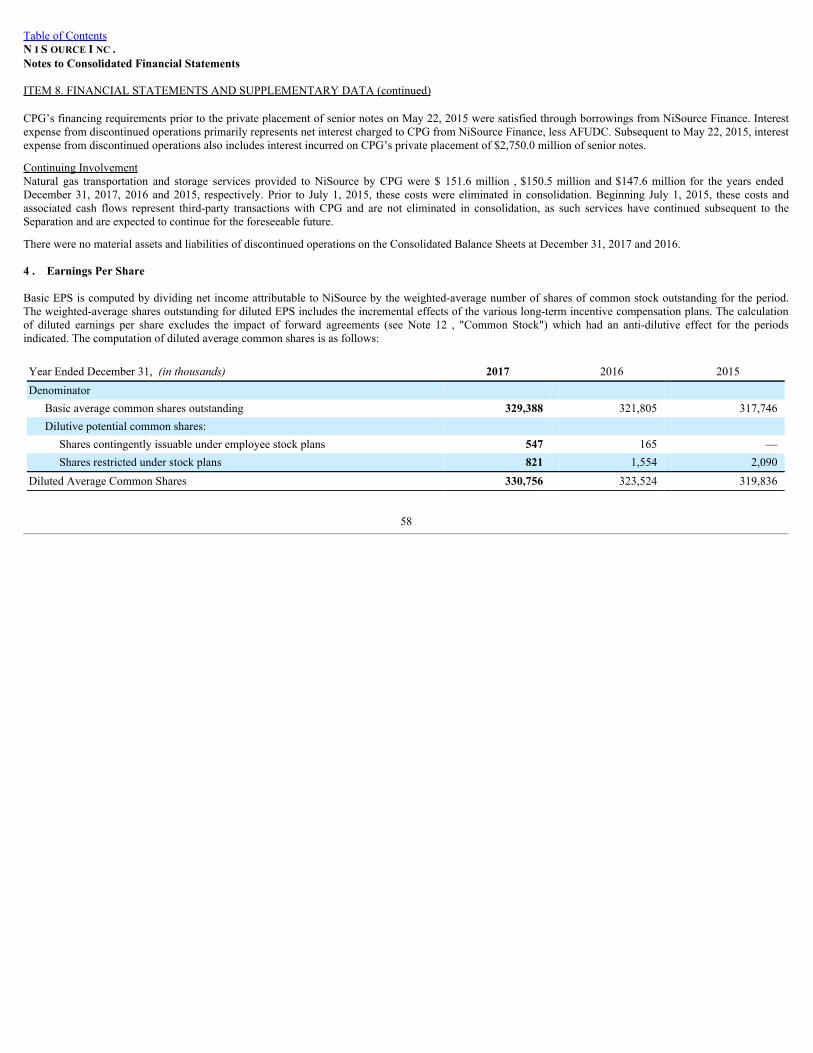
Table of ContentsN I S OURCE I NC .Notes to Consolidated Financial Statements
ITEM 8. FINANCIAL STATEMENTS AND SUPPLEMENTARY DATA (continued)
CPG’s financing requirements prior to the private placement of senior notes on May 22, 2015 were satisfied through borrowings from NiSource Finance. Interestexpense from discontinued operations primarily represents net interest charged to CPG from NiSource Finance, less AFUDC. Subsequent to May 22, 2015, interestexpense from discontinued operations also includes interest incurred on CPG’s private placement of $2,750.0 million of senior notes.
Continuing InvolvementNatural gas transportation and storage services provided to NiSource by CPG were $ 151.6 million , $150.5 million and $147.6 million for the years endedDecember 31, 2017, 2016 and 2015, respectively. Prior to July 1, 2015, these costs were eliminated in consolidation. Beginning July 1, 2015, these costs andassociated cash flows represent third-party transactions with CPG and are not eliminated in consolidation, as such services have continued subsequent to theSeparation and are expected to continue for the foreseeable future.
There were no material assets and liabilities of discontinued operations on the Consolidated Balance Sheets at December 31, 2017 and 2016.
4 . Earnings Per Share
Basic EPS is computed by dividing net income attributable to NiSource by the weighted-average number of shares of common stock outstanding for the period.The weighted-average shares outstanding for diluted EPS includes the incremental effects of the various long-term incentive compensation plans. The calculationof diluted earnings per share excludes the impact of forward agreements (see Note 12 , "Common Stock") which had an anti-dilutive effect for the periodsindicated. The computation of diluted average common shares is as follows:
Year Ended December 31, (inthousands) 2017 2016 2015Denominator
Basic average common shares outstanding 329,388 321,805 317,746Dilutive potential common shares:
Shares contingently issuable under employee stock plans 547 165 —Shares restricted under stock plans 821 1,554 2,090
Diluted Average Common Shares 330,756 323,524 319,836
58
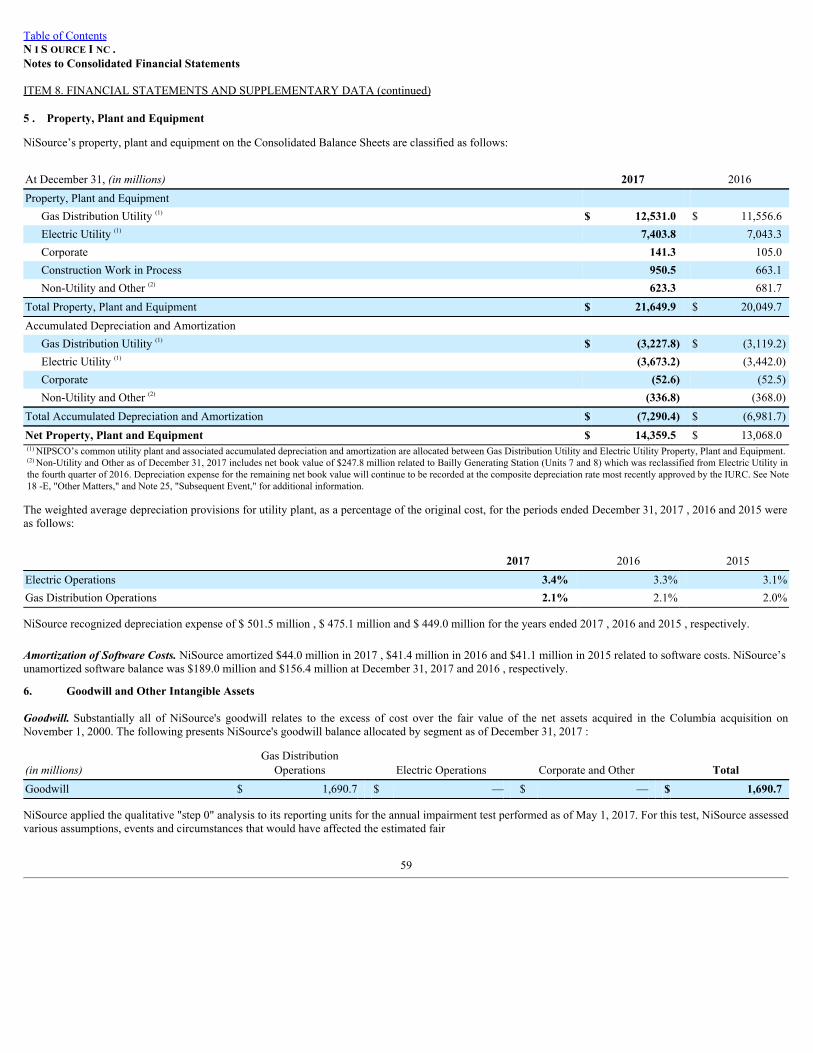
Table of ContentsN I S OURCE I NC .Notes to Consolidated Financial Statements
ITEM 8. FINANCIAL STATEMENTS AND SUPPLEMENTARY DATA (continued)
5 . Property, Plant and Equipment
NiSource’s property, plant and equipment on the Consolidated Balance Sheets are classified as follows:
At December 31, (inmillions) 2017 2016Property, Plant and Equipment
Gas Distribution Utility (1) $ 12,531.0 $ 11,556.6Electric Utility (1) 7,403.8 7,043.3Corporate 141.3 105.0Construction Work in Process 950.5 663.1Non-Utility and Other (2) 623.3 681.7
Total Property, Plant and Equipment $ 21,649.9 $ 20,049.7Accumulated Depreciation and Amortization
Gas Distribution Utility (1) $ (3,227.8) $ (3,119.2)Electric Utility (1) (3,673.2) (3,442.0)Corporate (52.6) (52.5)Non-Utility and Other (2) (336.8) (368.0)
Total Accumulated Depreciation and Amortization $ (7,290.4) $ (6,981.7)Net Property, Plant and Equipment $ 14,359.5 $ 13,068.0(1) NIPSCO’s common utility plant and associated accumulated depreciation and amortization are allocated between Gas Distribution Utility and Electric Utility Property, Plant and Equipment.(2) Non-Utility and Other as of December 31, 2017 includes net book value of $247.8 million related to Bailly Generating Station (Units 7 and 8) which was reclassified from Electric Utility inthe fourth quarter of 2016. Depreciation expense for the remaining net book value will continue to be recorded at the composite depreciation rate most recently approved by the IURC. See Note18 -E, "Other Matters," and Note 25, "Subsequent Event," for additional information.
The weighted average depreciation provisions for utility plant, as a percentage of the original cost, for the periods ended December 31, 2017 , 2016 and 2015 wereas follows:
2017 2016 2015Electric Operations 3.4% 3.3% 3.1%Gas Distribution Operations 2.1% 2.1% 2.0%
NiSource recognized depreciation expense of $ 501.5 million , $ 475.1 million and $ 449.0 million for the years ended 2017 , 2016 and 2015 , respectively.
AmortizationofSoftwareCosts.NiSource amortized $44.0 million in 2017 , $41.4 million in 2016 and $41.1 million in 2015 related to software costs. NiSource’sunamortized software balance was $189.0 million and $156.4 million at December 31, 2017 and 2016 , respectively.
6. Goodwill and Other Intangible Assets
Goodwill.Substantially all of NiSource's goodwill relates to the excess of cost over the fair value of the net assets acquired in the Columbia acquisition onNovember 1, 2000. The following presents NiSource's goodwill balance allocated by segment as of December 31, 2017 :
(inmillions) Gas DistributionOperations Electric Operations Corporate and Other Total
Goodwill $ 1,690.7 $ — $ — $ 1,690.7
NiSource applied the qualitative "step 0" analysis to its reporting units for the annual impairment test performed as of May 1, 2017. For this test, NiSource assessedvarious assumptions, events and circumstances that would have affected the estimated fair
59
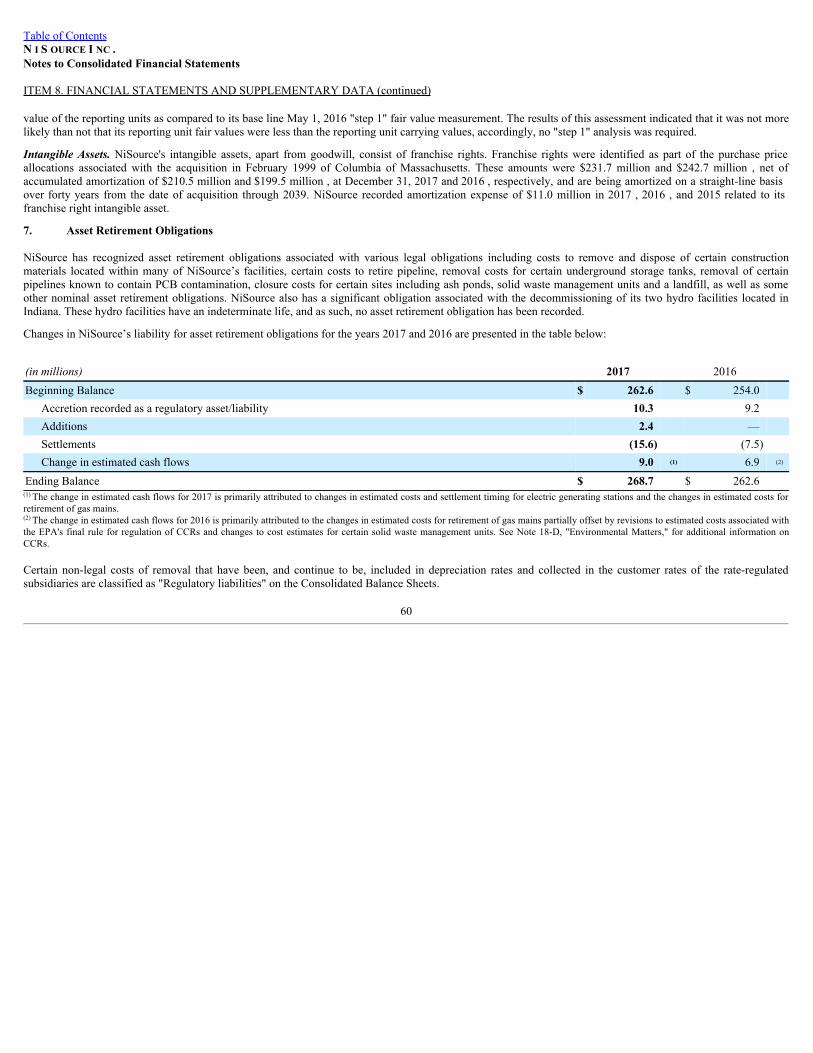
Table of ContentsN I S OURCE I NC .Notes to Consolidated Financial Statements
ITEM 8. FINANCIAL STATEMENTS AND SUPPLEMENTARY DATA (continued)
value of the reporting units as compared to its base line May 1, 2016 "step 1" fair value measurement. The results of this assessment indicated that it was not morelikely than not that its reporting unit fair values were less than the reporting unit carrying values, accordingly, no "step 1" analysis was required.
Intangible Assets.NiSource's intangible assets, apart from goodwill, consist of franchise rights. Franchise rights were identified as part of the purchase priceallocations associated with the acquisition in February 1999 of Columbia of Massachusetts. These amounts were $231.7 million and $242.7 million , net ofaccumulated amortization of $210.5 million and $199.5 million , at December 31, 2017 and 2016 , respectively, and are being amortized on a straight-line basisover forty years from the date of acquisition through 2039. NiSource recorded amortization expense of $11.0 million in 2017 , 2016 , and 2015 related to itsfranchise right intangible asset.
7. Asset Retirement Obligations
NiSource has recognized asset retirement obligations associated with various legal obligations including costs to remove and dispose of certain constructionmaterials located within many of NiSource’s facilities, certain costs to retire pipeline, removal costs for certain underground storage tanks, removal of certainpipelines known to contain PCB contamination, closure costs for certain sites including ash ponds, solid waste management units and a landfill, as well as someother nominal asset retirement obligations. NiSource also has a significant obligation associated with the decommissioning of its two hydro facilities located inIndiana. These hydro facilities have an indeterminate life, and as such, no asset retirement obligation has been recorded.
Changes in NiSource’s liability for asset retirement obligations for the years 2017 and 2016 are presented in the table below:
(inmillions) 2017 2016 Beginning Balance $ 262.6 $ 254.0
Accretion recorded as a regulatory asset/liability 10.3 9.2 Additions 2.4 — Settlements (15.6) (7.5) Change in estimated cash flows 9.0 (1) 6.9 (2)
Ending Balance $ 268.7 $ 262.6 (1) The change in estimated cash flows for 2017 is primarily attributed to changes in estimated costs and settlement timing for electric generating stations and the changes in estimated costs forretirement of gas mains.(2) The change in estimated cash flows for 2016 is primarily attributed to the changes in estimated costs for retirement of gas mains partially offset by revisions to estimated costs associated withthe EPA's final rule for regulation of CCRs and changes to cost estimates for certain solid waste management units. See Note 18-D, "Environmental Matters," for additional information onCCRs.
Certain non-legal costs of removal that have been, and continue to be, included in depreciation rates and collected in the customer rates of the rate-regulatedsubsidiaries are classified as "Regulatory liabilities" on the Consolidated Balance Sheets.
60
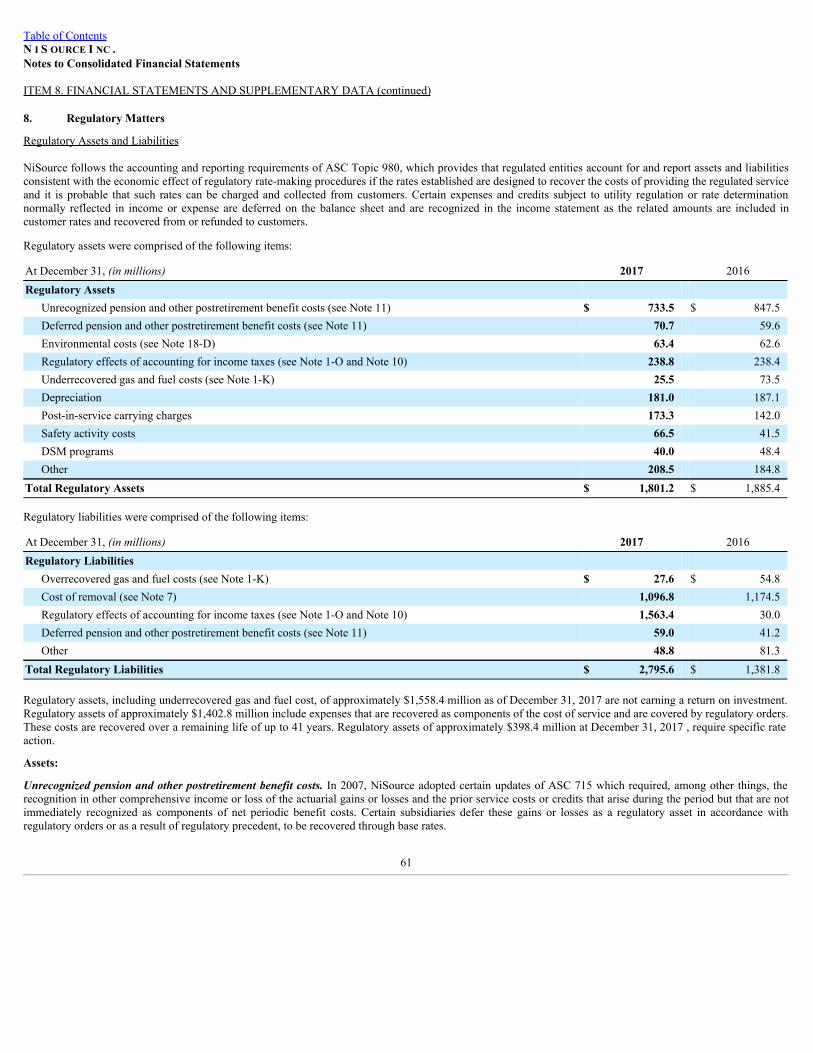
Table of ContentsN I S OURCE I NC .Notes to Consolidated Financial Statements
ITEM 8. FINANCIAL STATEMENTS AND SUPPLEMENTARY DATA (continued)
8. Regulatory Matters
Regulatory Assets and Liabilities
NiSource follows the accounting and reporting requirements of ASC Topic 980, which provides that regulated entities account for and report assets and liabilitiesconsistent with the economic effect of regulatory rate-making procedures if the rates established are designed to recover the costs of providing the regulated serviceand it is probable that such rates can be charged and collected from customers. Certain expenses and credits subject to utility regulation or rate determinationnormally reflected in income or expense are deferred on the balance sheet and are recognized in the income statement as the related amounts are included incustomer rates and recovered from or refunded to customers.
Regulatory assets were comprised of the following items:
At December 31, (inmillions) 2017 2016Regulatory Assets
Unrecognized pension and other postretirement benefit costs (see Note 11) $ 733.5 $ 847.5Deferred pension and other postretirement benefit costs (see Note 11) 70.7 59.6Environmental costs (see Note 18-D) 63.4 62.6Regulatory effects of accounting for income taxes (see Note 1-O and Note 10) 238.8 238.4Underrecovered gas and fuel costs (see Note 1-K) 25.5 73.5Depreciation 181.0 187.1Post-in-service carrying charges 173.3 142.0Safety activity costs 66.5 41.5DSM programs 40.0 48.4Other 208.5 184.8
Total Regulatory Assets $ 1,801.2 $ 1,885.4 Regulatory liabilities were comprised of the following items:
At December 31, (inmillions) 2017 2016Regulatory Liabilities
Overrecovered gas and fuel costs (see Note 1-K) $ 27.6 $ 54.8Cost of removal (see Note 7) 1,096.8 1,174.5Regulatory effects of accounting for income taxes (see Note 1-O and Note 10) 1,563.4 30.0Deferred pension and other postretirement benefit costs (see Note 11) 59.0 41.2Other 48.8 81.3
Total Regulatory Liabilities $ 2,795.6 $ 1,381.8
Regulatory assets, including underrecovered gas and fuel cost, of approximately $1,558.4 million as of December 31, 2017 are not earning a return on investment.Regulatory assets of approximately $1,402.8 million include expenses that are recovered as components of the cost of service and are covered by regulatory orders.These costs are recovered over a remaining life of up to 41 years. Regulatory assets of approximately $398.4 million at December 31, 2017 , require specific rateaction.
Assets:
Unrecognizedpensionandotherpostretirementbenefitcosts.In 2007, NiSource adopted certain updates of ASC 715 which required, among other things, therecognition in other comprehensive income or loss of the actuarial gains or losses and the prior service costs or credits that arise during the period but that are notimmediately recognized as components of net periodic benefit costs. Certain subsidiaries defer these gains or losses as a regulatory asset in accordance withregulatory orders or as a result of regulatory precedent, to be recovered through base rates.
61
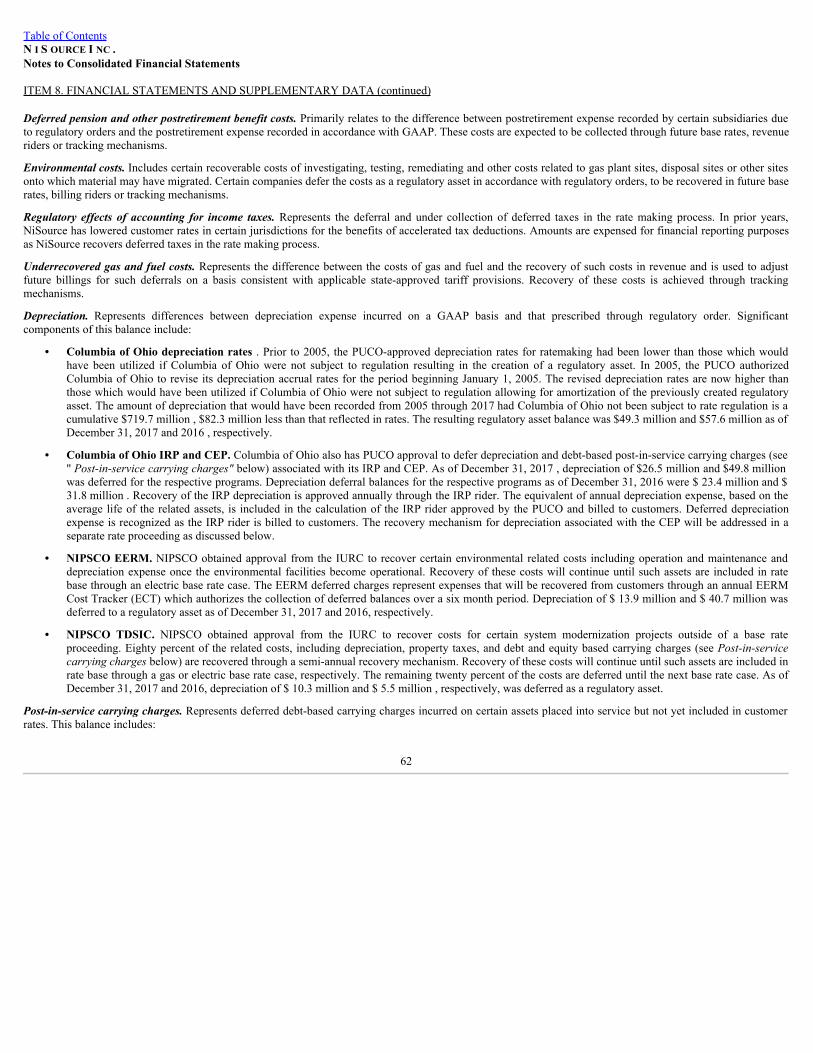
Table of ContentsN I S OURCE I NC .Notes to Consolidated Financial Statements
ITEM 8. FINANCIAL STATEMENTS AND SUPPLEMENTARY DATA (continued)
Deferredpensionandotherpostretirementbenefitcosts.Primarily relates to the difference between postretirement expense recorded by certain subsidiaries dueto regulatory orders and the postretirement expense recorded in accordance with GAAP. These costs are expected to be collected through future base rates, revenueriders or tracking mechanisms.
Environmentalcosts.Includes certain recoverable costs of investigating, testing, remediating and other costs related to gas plant sites, disposal sites or other sitesonto which material may have migrated. Certain companies defer the costs as a regulatory asset in accordance with regulatory orders, to be recovered in future baserates, billing riders or tracking mechanisms.
Regulatory effects of accounting for income taxes.Represents the deferral and under collection of deferred taxes in the rate making process. In prior years,NiSource has lowered customer rates in certain jurisdictions for the benefits of accelerated tax deductions. Amounts are expensed for financial reporting purposesas NiSource recovers deferred taxes in the rate making process.
Underrecoveredgasandfuelcosts.Represents the difference between the costs of gas and fuel and the recovery of such costs in revenue and is used to adjustfuture billings for such deferrals on a basis consistent with applicable state-approved tariff provisions. Recovery of these costs is achieved through trackingmechanisms.
Depreciation. Represents differences between depreciation expense incurred on a GAAP basis and that prescribed through regulatory order. Significantcomponents of this balance include:
• Columbia of Ohio depreciation rates . Prior to 2005, the PUCO-approved depreciation rates for ratemaking had been lower than those which wouldhave been utilized if Columbia of Ohio were not subject to regulation resulting in the creation of a regulatory asset. In 2005, the PUCO authorizedColumbia of Ohio to revise its depreciation accrual rates for the period beginning January 1, 2005. The revised depreciation rates are now higher thanthose which would have been utilized if Columbia of Ohio were not subject to regulation allowing for amortization of the previously created regulatoryasset. The amount of depreciation that would have been recorded from 2005 through 2017 had Columbia of Ohio not been subject to rate regulation is acumulative $719.7 million , $82.3 million less than that reflected in rates. The resulting regulatory asset balance was $49.3 million and $57.6 million as ofDecember 31, 2017 and 2016 , respectively.
• Columbia of Ohio IRP and CEP. Columbia of Ohio also has PUCO approval to defer depreciation and debt-based post-in-service carrying charges (see" Post-in-servicecarryingcharges"below) associated with its IRP and CEP. As of December 31, 2017 , depreciation of $26.5 million and $49.8 millionwas deferred for the respective programs. Depreciation deferral balances for the respective programs as of December 31, 2016 were $ 23.4 million and $31.8 million . Recovery of the IRP depreciation is approved annually through the IRP rider. The equivalent of annual depreciation expense, based on theaverage life of the related assets, is included in the calculation of the IRP rider approved by the PUCO and billed to customers. Deferred depreciationexpense is recognized as the IRP rider is billed to customers. The recovery mechanism for depreciation associated with the CEP will be addressed in aseparate rate proceeding as discussed below.
• NIPSCO EERM. NIPSCO obtained approval from the IURC to recover certain environmental related costs including operation and maintenance anddepreciation expense once the environmental facilities become operational. Recovery of these costs will continue until such assets are included in ratebase through an electric base rate case. The EERM deferred charges represent expenses that will be recovered from customers through an annual EERMCost Tracker (ECT) which authorizes the collection of deferred balances over a six month period. Depreciation of $ 13.9 million and $ 40.7 million wasdeferred to a regulatory asset as of December 31, 2017 and 2016, respectively.
• NIPSCO TDSIC. NIPSCO obtained approval from the IURC to recover costs for certain system modernization projects outside of a base rateproceeding. Eighty percent of the related costs, including depreciation, property taxes, and debt and equity based carrying charges (see Post-in-servicecarryingchargesbelow) are recovered through a semi-annual recovery mechanism. Recovery of these costs will continue until such assets are included inrate base through a gas or electric base rate case, respectively. The remaining twenty percent of the costs are deferred until the next base rate case. As ofDecember 31, 2017 and 2016, depreciation of $ 10.3 million and $ 5.5 million , respectively, was deferred as a regulatory asset.
Post-in-servicecarryingcharges.Represents deferred debt-based carrying charges incurred on certain assets placed into service but not yet included in customerrates. This balance includes:
62
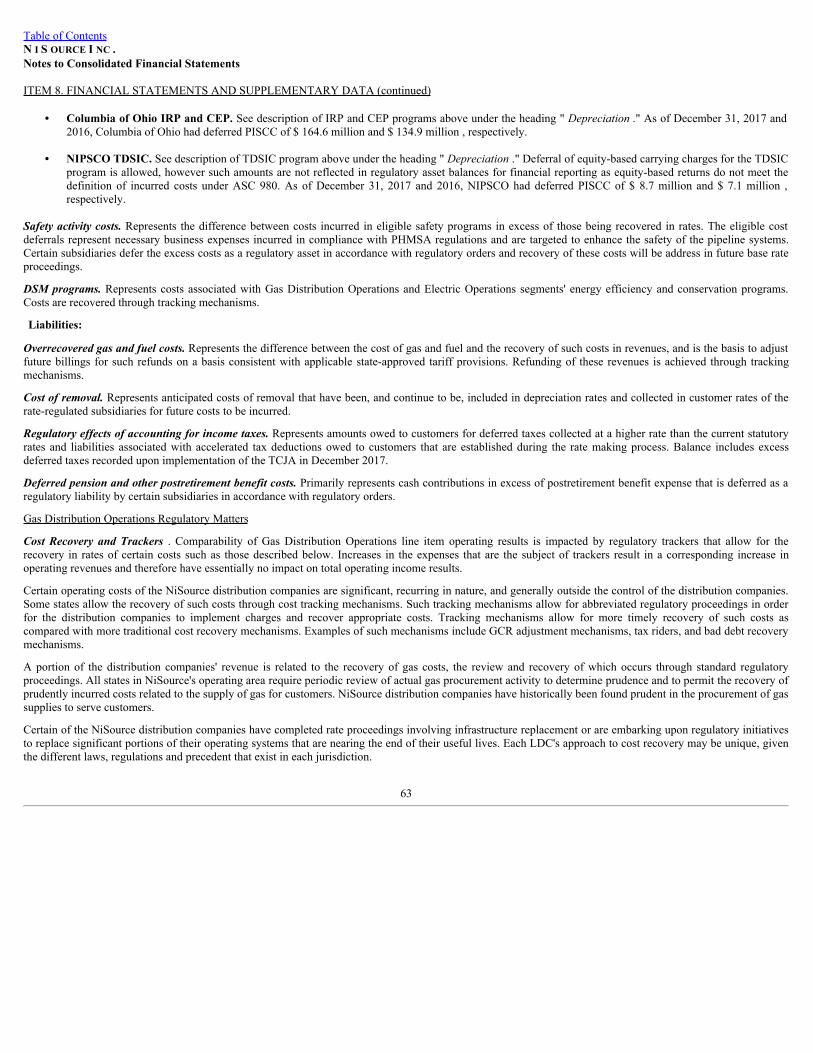
Table of ContentsN I S OURCE I NC .Notes to Consolidated Financial Statements
ITEM 8. FINANCIAL STATEMENTS AND SUPPLEMENTARY DATA (continued)
• Columbia of Ohio IRP and CEP. See description of IRP and CEP programs above under the heading " Depreciation." As of December 31, 2017 and2016, Columbia of Ohio had deferred PISCC of $ 164.6 million and $ 134.9 million , respectively.
• NIPSCO TDSIC. See description of TDSIC program above under the heading " Depreciation." Deferral of equity-based carrying charges for the TDSICprogram is allowed, however such amounts are not reflected in regulatory asset balances for financial reporting as equity-based returns do not meet thedefinition of incurred costs under ASC 980. As of December 31, 2017 and 2016, NIPSCO had deferred PISCC of $ 8.7 million and $ 7.1 million ,respectively.
Safetyactivitycosts.Represents the difference between costs incurred in eligible safety programs in excess of those being recovered in rates. The eligible costdeferrals represent necessary business expenses incurred in compliance with PHMSA regulations and are targeted to enhance the safety of the pipeline systems.Certain subsidiaries defer the excess costs as a regulatory asset in accordance with regulatory orders and recovery of these costs will be address in future base rateproceedings.
DSMprograms.Represents costs associated with Gas Distribution Operations and Electric Operations segments' energy efficiency and conservation programs.Costs are recovered through tracking mechanisms.
Liabilities:
Overrecoveredgasandfuelcosts.Represents the difference between the cost of gas and fuel and the recovery of such costs in revenues, and is the basis to adjustfuture billings for such refunds on a basis consistent with applicable state-approved tariff provisions. Refunding of these revenues is achieved through trackingmechanisms.
Costofremoval.Represents anticipated costs of removal that have been, and continue to be, included in depreciation rates and collected in customer rates of therate-regulated subsidiaries for future costs to be incurred.
Regulatoryeffectsofaccountingforincometaxes.Represents amounts owed to customers for deferred taxes collected at a higher rate than the current statutoryrates and liabilities associated with accelerated tax deductions owed to customers that are established during the rate making process. Balance includes excessdeferred taxes recorded upon implementation of the TCJA in December 2017.
Deferredpensionandotherpostretirementbenefitcosts.Primarily represents cash contributions in excess of postretirement benefit expense that is deferred as aregulatory liability by certain subsidiaries in accordance with regulatory orders.
Gas Distribution Operations Regulatory Matters
Cost Recovery and Trackers . Comparability of Gas Distribution Operations line item operating results is impacted by regulatory trackers that allow for therecovery in rates of certain costs such as those described below. Increases in the expenses that are the subject of trackers result in a corresponding increase inoperating revenues and therefore have essentially no impact on total operating income results.
Certain operating costs of the NiSource distribution companies are significant, recurring in nature, and generally outside the control of the distribution companies.Some states allow the recovery of such costs through cost tracking mechanisms. Such tracking mechanisms allow for abbreviated regulatory proceedings in orderfor the distribution companies to implement charges and recover appropriate costs. Tracking mechanisms allow for more timely recovery of such costs ascompared with more traditional cost recovery mechanisms. Examples of such mechanisms include GCR adjustment mechanisms, tax riders, and bad debt recoverymechanisms.
A portion of the distribution companies' revenue is related to the recovery of gas costs, the review and recovery of which occurs through standard regulatoryproceedings. All states in NiSource's operating area require periodic review of actual gas procurement activity to determine prudence and to permit the recovery ofprudently incurred costs related to the supply of gas for customers. NiSource distribution companies have historically been found prudent in the procurement of gassupplies to serve customers.
Certain of the NiSource distribution companies have completed rate proceedings involving infrastructure replacement or are embarking upon regulatory initiativesto replace significant portions of their operating systems that are nearing the end of their useful lives. Each LDC's approach to cost recovery may be unique, giventhe different laws, regulations and precedent that exist in each jurisdiction.
63
Table of ContentsN I S OURCE I NC .Notes to Consolidated Financial Statements
ITEM 8. FINANCIAL STATEMENTS AND SUPPLEMENTARY DATA (continued)
Columbia of Ohio. On November 28, 2012, the PUCO approved Columbia of Ohio’s application to extend its IRP for an additional five years (2013-2017),allowing Columbia of Ohio to continue to invest and recover on its accelerated main replacements. Columbia of Ohio filed its most recent application to adjustrates associated with its IRP and DSM Riders on February 27, 2017, which requested authority to increase annual revenues by approximately $31.5 million thatincludes recovery of and return on approximately $ 235.9 million of incremental IRP capital investments in 2016. On March 23, 2017, the PUCO Staff filedcomments which recommended approval of the application with only minor revisions. The PUCO issued an order on April 26, 2017, approving Columbia of Ohio'sapplication. New rates went into effect on May 1, 2017.
On February 27, 2017, Columbia of Ohio also filed an application requesting authority to extend its IRP for an additional five years (2018-2022). On July 10,2017, the PUCO Staff recommended approval of Columbia of Ohio's IRP for the additional five years, with modifications to Columbia of Ohio's proposed IRPrates for the five-year period. A joint stipulation and recommendation, outlining annual maximum IRP rates for the five-year period, was filed on August 18, 2017and was supported or not opposed by all parties except the OCC. A hearing on the stipulation was held on October 2, 2017 and briefing was completed onNovember 7, 2017. On January 31, 2018, the PUCO issued an order that approved the stipulation.
On December 1, 2017, Columbia of Ohio filed an application that requested authority to implement a rider to begin recovering plant and associated deferralsrelated to the CEP. The application requested authority to increase annual revenues, through the requested rider, by approximately $ 29 million in 2018, withbiennial increases up to approximately $ 98 million in 2022. The filing is pending at the PUCO and no procedural schedule has been established. The CEP wasestablished in 2011 and allows for deferral of interest, depreciation and property taxes on certain plant investments not recovered through its IRP modernizationtracker.
NIPSCO Gas. On September 27, 2017, NIPSCO filed a base rate case with the IURC, seeking an annual revenue increase of $ 143.5 million (inclusive of amountsbeing recovered through various tracker programs). As part of this filing and among other items, NIPSCO proposed to update base rates for ongoing infrastructureimprovements, revised depreciation rates and ongoing level of expenses to reflect the current costs of providing natural gas service. An order is expected in thesecond half of 2018. A supplemental filing to the base rate case was submitted on January 26, 2018 to reflect the impact of the TCJA, seeking a revised annualrevenue increase of $ 117.9 million .
On April 30, 2013, then Indiana Governor Pence signed Senate Enrolled Act 560, the TDSIC statute, into law. Among other provisions, this legislation providesfor cost recovery outside of a base rate proceeding for new or replacement electric and gas transmission, distribution, and storage projects that a public utilityundertakes for the purposes of safety, reliability, system modernization, or economic development. Provisions of the TDSIC statute require that, among otherthings, requests for recovery include a seven-year plan of eligible investments. Once the plan is approved by the IURC, eighty percent of eligible costs can berecovered using a periodic rate adjustment mechanism. The cost recovery mechanism is referred to as a TDSIC mechanism. Recoverable costs include a return on,and of, the investment, including AFUDC, post-in-service carrying charges, operation and maintenance expenses, depreciation and property taxes. The remainingtwenty percent of recoverable costs are to be deferred for future recovery in the public utility’s next general rate case. The periodic rate adjustment mechanism iscapped at an annual increase of no more than two percent of total retail revenues. On August 31, 2017, NIPSCO filed TDSIC-7 requesting to recover anincremental increase to revenue of $ 3.5 million associated with incremental capital investment of $ 59.0 million made in the first half of 2017. An order approvingNIPSCO's filing was received from the IURC on December 28, 2017, and new rates went into effect on January 1, 2018.
On November 8, 2017, NIPSCO filed a petition with the IURC seeking approval of NIPSCO’s federally mandated pipeline safety compliance plan. The four yearcompliance plan includes a total estimated $91 million of capital costs and $23 million of expected operating and maintenance costs. NIPSCO is requesting allassociated accounting and ratemaking relief, including establishment of a periodic rate adjustment mechanism.
Columbia of Massachusetts. On July 7, 2014, the Governor of Massachusetts signed into law Chapter 149 of the Acts of 2014, An Act Relative to Natural GasLeaks (“the Act”). The Act authorizes natural gas distribution companies to file gas infrastructure replacement plans with the Massachusetts DPU to address thereplacement of aging natural gas pipeline infrastructure. In addition, the Act provides that the Massachusetts DPU may, after review of the plans, allow theproposed estimated costs of the plan into rates as of May 1 of the subsequent year. On October 31, 2016, Columbia of Massachusetts filed its GSEP for the 2017construction year. Columbia of Massachusetts proposed to recover incremental revenue of $ 8.1 million associated with incremental capital investment of $ 72.9million made during calendar year 2017. An order was received from the Massachusetts DPU on April 28, 2017 approving the filing and rates went into effect onMay 1, 2017. On October 31, 2017, Columbia of Massachusetts filed its GSEP for the 2018 construction year. Columbia of Massachusetts is proposing to recoverincremental revenue of $ 9.7 million associated with incremental capital investment of $ 83.9 million to be made during calendar year 2018. The filing included arequest
64
Table of ContentsN I S OURCE I NC .Notes to Consolidated Financial Statements
ITEM 8. FINANCIAL STATEMENTS AND SUPPLEMENTARY DATA (continued)
for a waiver to allow collection of the $ 3.1 million revenue requirement that exceeds the GSEP cap provision as previously calculated. If the waiver is notapproved, the incremental revenue will be $ 6.6 million . An order is expected from the Massachusetts DPU in the second quarter of 2018, with new rates effectiveMay 1, 2018.
Columbia of Virginia. On April 29, 2016, Columbia of Virginia filed a request with the VSCC, seeking an annual revenue increase of $ 37.0 million . OnSeptember 28, 2016, Columbia of Virginia implemented updated interim base rates subject to refund. On January 17, 2017, Columbia of Virginia presented astipulation and proposed recommendation, representing a settlement by all parties to the proceeding that included a base revenue increase of $ 28.5 million . OnMarch 17, 2017, by final order, the VSCC approved the settlement agreement without modification. In accordance with the terms of the final order, during 2017,Columbia of Virginia completed its refund of the difference between the interim customer rates implemented in 2016 and the rates approved by the final order.
Columbia Gas of Kentucky. On October 13, 2017, Columbia of Kentucky filed its application to adjust rates associated with its AMRP, requesting authority toincrease annual revenues by $ 4.5 million associated with incremental capital investment of $ 24.0 million to be made during calendar year 2018. On December 22,2017, the Kentucky PSC issued an order approving Columbia of Kentucky’s request as filed, with rates effective January 2, 2018.
Columbia of Maryland. On April 14, 2017, Columbia of Maryland filed a request with the MPSC to adjust base rates. On July 28, 2017, all parties filed asettlement agreement with the MPSC, under which Columbia of Maryland will receive an annual revenue increase of $ 2.4 million . The MPSC approved thesettlement on September 19, 2017 and rates went into effect on October 27, 2017.
Electric Operations Regulatory Matters
CostRecoveryandTrackers . Comparability of Electric Operations line item operating results is impacted by regulatory trackers that allow for the recovery inrates of certain costs such as those described below. Increases in the expenses that are the subject of trackers result in a corresponding increase in operatingrevenues and therefore have essentially no impact on total operating income results.
Certain operating costs of the Electric Operations are significant, recurring in nature, and generally outside the control of NIPSCO. The IURC allows for recoveryof such costs through cost tracking mechanisms. Such tracking mechanisms allow for abbreviated regulatory proceedings in order for NIPSCO to implementcharges and recover appropriate costs. Tracking mechanisms allow for more timely recovery of such costs as compared with more traditional cost recoverymechanisms. Examples of such mechanisms include electric energy efficiency programs, MISO non-fuel costs and revenues, resource capacity charges, federallymandated costs and environmental related costs.
A portion of NIPSCO's revenue is related to the recovery of fuel costs to generate power and the fuel costs related to purchased power. These costs are recoveredthrough a FAC, a quarterly regulatory proceeding in Indiana.
NIPSCO made a TDSIC-2 rate adjustment mechanism filing on June 30, 2017 requesting revenues of $ 12.8 million to be billed over eight months, associated with$ 133.6 million of incremental capital expenditures from May 2016 through April 2017. An order approving the request was received from the IURC on October31, 2017 and new rates went into effect with the first billing cycle of November 2017.
NIPSCO made a TDSIC-3 rate adjustment mechanism filing on January 30, 2018 requesting a revenue decrease of $ 2.0 million to be billed over six months,associated with $ 75.0 million of incremental capital expenditures made from May 1, 2017 to November 30, 2017. This decreased revenue request reflects impactsof the TCJA. An order approving the request is expected in May 2018 with new rates expected to go into effect with the first billing cycle of June 2018.
On November 1, 2016, NIPSCO filed a petition with the IURC for relief regarding the construction of additional environmental projects required to comply withthe final rules for regulation of CCRs and the ELG. On June 9, 2017, a settlement agreement was filed with the IURC regarding the CCR projects and treatment ofassociated costs. An order approving the settlement agreement was received on December 13, 2017. Given the current postponement of the ELG rule, NIPSCO hasagreed, with the settling parties, that the ELG projects and related costs would be addressed in a later proceeding. Refer to Note 18-D, “Environmental Matters,”for more information.
65
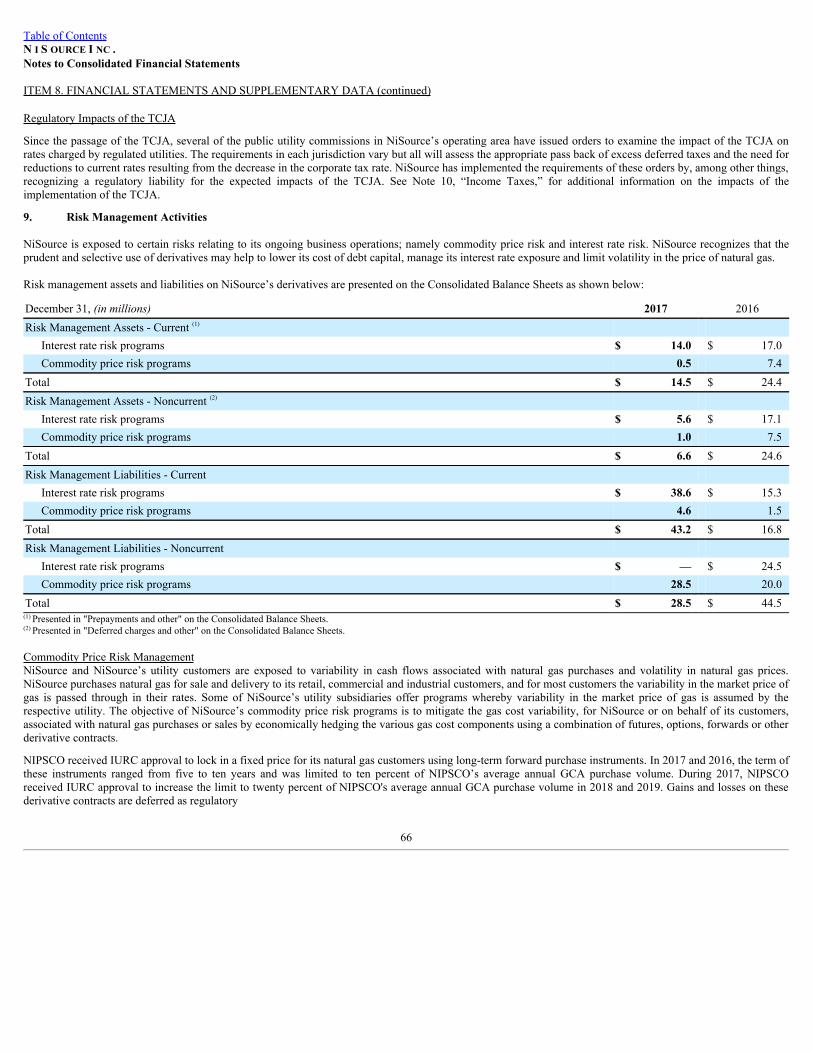
Table of ContentsN I S OURCE I NC .Notes to Consolidated Financial Statements
ITEM 8. FINANCIAL STATEMENTS AND SUPPLEMENTARY DATA (continued)
Regulatory Impacts of the TCJA
Since the passage of the TCJA, several of the public utility commissions in NiSource’s operating area have issued orders to examine the impact of the TCJA onrates charged by regulated utilities. The requirements in each jurisdiction vary but all will assess the appropriate pass back of excess deferred taxes and the need forreductions to current rates resulting from the decrease in the corporate tax rate. NiSource has implemented the requirements of these orders by, among other things,recognizing a regulatory liability for the expected impacts of the TCJA. See Note 10, “Income Taxes,” for additional information on the impacts of theimplementation of the TCJA.
9. Risk Management Activities
NiSource is exposed to certain risks relating to its ongoing business operations; namely commodity price risk and interest rate risk. NiSource recognizes that theprudent and selective use of derivatives may help to lower its cost of debt capital, manage its interest rate exposure and limit volatility in the price of natural gas.
Risk management assets and liabilities on NiSource’s derivatives are presented on the Consolidated Balance Sheets as shown below:
December 31, (inmillions) 2017 2016Risk Management Assets - Current (1)
Interest rate risk programs $ 14.0 $ 17.0Commodity price risk programs 0.5 7.4
Total $ 14.5 $ 24.4Risk Management Assets - Noncurrent (2)
Interest rate risk programs $ 5.6 $ 17.1Commodity price risk programs 1.0 7.5
Total $ 6.6 $ 24.6Risk Management Liabilities - Current
Interest rate risk programs $ 38.6 $ 15.3Commodity price risk programs 4.6 1.5
Total $ 43.2 $ 16.8Risk Management Liabilities - Noncurrent
Interest rate risk programs $ — $ 24.5Commodity price risk programs 28.5 20.0
Total $ 28.5 $ 44.5(1) Presented in "Prepayments and other" on the Consolidated Balance Sheets.(2) Presented in "Deferred charges and other" on the Consolidated Balance Sheets.
Commodity Price Risk ManagementNiSource and NiSource’s utility customers are exposed to variability in cash flows associated with natural gas purchases and volatility in natural gas prices.NiSource purchases natural gas for sale and delivery to its retail, commercial and industrial customers, and for most customers the variability in the market price ofgas is passed through in their rates. Some of NiSource’s utility subsidiaries offer programs whereby variability in the market price of gas is assumed by therespective utility. The objective of NiSource’s commodity price risk programs is to mitigate the gas cost variability, for NiSource or on behalf of its customers,associated with natural gas purchases or sales by economically hedging the various gas cost components using a combination of futures, options, forwards or otherderivative contracts.
NIPSCO received IURC approval to lock in a fixed price for its natural gas customers using long-term forward purchase instruments. In 2017 and 2016, the term ofthese instruments ranged from five to ten years and was limited to ten percent of NIPSCO’s average annual GCA purchase volume. During 2017, NIPSCOreceived IURC approval to increase the limit to twenty percent of NIPSCO's average annual GCA purchase volume in 2018 and 2019. Gains and losses on thesederivative contracts are deferred as regulatory
66
Table of ContentsN I S OURCE I NC .Notes to Consolidated Financial Statements
ITEM 8. FINANCIAL STATEMENTS AND SUPPLEMENTARY DATA (continued)
liabilities or assets and are remitted to or collected from customers through NIPSCO’s quarterly GCA mechanism. These instruments are not designated asaccounting hedges.
Interest Rate Risk ManagementAs of December 31, 2017 , NiSource has forward-starting interest rate swaps with an aggregate notional value totaling $ 1.0 billion to hedge the variability in cashflows attributable to changes in the benchmark interest rate during the periods from the effective dates of the swaps to the anticipated dates of forecasted debtissuances, which are expected to take place by the end of 2019. These interest rate swaps are designated as cash flow hedges. The effective portions of the gainsand losses related to these swaps are recorded to AOCI and are recognized in earnings concurrently with the recognition of interest expense on the associated debt,once issued. If it becomes probable that a hedged forecasted transaction will no longer occur, the accumulated gains or losses on the derivative will be recognizedcurrently in earnings.
On May 11, 2017, NiSource Finance settled $ 950.0 million of forward-starting interest rate swap agreements contemporaneously with the issuance of $ 2.0 billionof 3.49% and 4.375% senior notes, maturing in 2027 and 2047, respectively. These derivative contracts were accounted for as cash flow hedges. As part of thetransaction, the associated net unrealized loss position of $ 6.9 million is being amortized from accumulated other comprehensive loss into interest expense overthe term of the associated interest payments.
On September 5, 2017, NiSource Finance settled $ 750.0 million of treasury lock agreements contemporaneously with the issuance of $ 750.0 million of 3.95%senior notes, maturing in 2048. These derivative contracts were accounted for as cash flow hedges. As part of the transaction, the associated net unrealized lossposition of $ 19.0 million is being amortized from accumulated other comprehensive loss into interest expense over the term of the associated interest payments.
On November 8, 2017, NiSource Finance settled $250.0 million of treasury lock agreements contemporaneously with the issuance of $500.0 million of 2.65%senior notes, maturing in 2022. These derivative contracts were accounted for as a cash flow hedges. NiSource Finance recognized an immaterial gain associatedwith this transaction.
Cash associated with payments to settle interest rate swaps and treasury lock agreements are reflected within operating activities within the Statements ofConsolidated Cash Flows for the year ended December 31, 2017 .
Realized gains and losses from NiSource’s interest rate cash flow hedges are presented in “Interest expense, net” on the Statements of Consolidated Income. Therewere no amounts excluded from effectiveness testing for derivatives in cash flow hedging relationships at December 31, 2017 , 2016 and 2015.
NiSource’s derivative instruments measured at fair value as of December 31, 2017 and 2016 do not contain any credit-risk-related contingent features.
10. Income Taxes
On December 22, 2017, the President signed into law the TCJA, which, among other things, enacted significant changes to the Internal Revenue Code of 1986, asamended, including a reduction in the maximum U.S. federal corporate income tax rate from 35% to 21% , and certain other provisions related specifically to thepublic utility industry, including the continuation of certain interest expense deductibility. These changes are effective January 1, 2018. Under GAAP, the effectsof a change in tax law are recorded as a discrete item in the period of enactment.
Rates for NiSource’s regulated customers include provisions for the collection of U.S. federal income taxes. Accordingly, accounting effects related to changes intax rates at NiSource that would normally be recognized as a component of income tax expense may instead be deferred as a regulatory asset or liability andreflected in future ratemaking. In December 2017, NiSource remeasured its deferred tax assets and liabilities to the new federal corporate income tax rate. Theresult of this remeasurement was a reduction in the net deferred tax liability of approximately $1.3 billion , including approximately $0.4 billion of regulatory"gross up" to account for over-collection of past taxes from customers. Offsetting the reduction in net deferred tax liabilities was an increase in regulatory liabilitiesof approximately $1.5 billion and an increase in income tax expense of $0.2 billion . These changes are discussed in further detail below.
On December 22, 2017, the SEC issued Staff Accounting Bulletin 118 (“SAB 118”), which provides guidance on accounting for tax effects of the TCJA. SAB 118provides a measurement period that should not extend beyond one year from the TCJA enactment date for companies to complete the accounting under ASC 740.In accordance with SAB 118, a company must reflect the income tax effects of those aspects of the TCJA for which the accounting under ASC 740 is complete. Tothe extent that a company’s
67
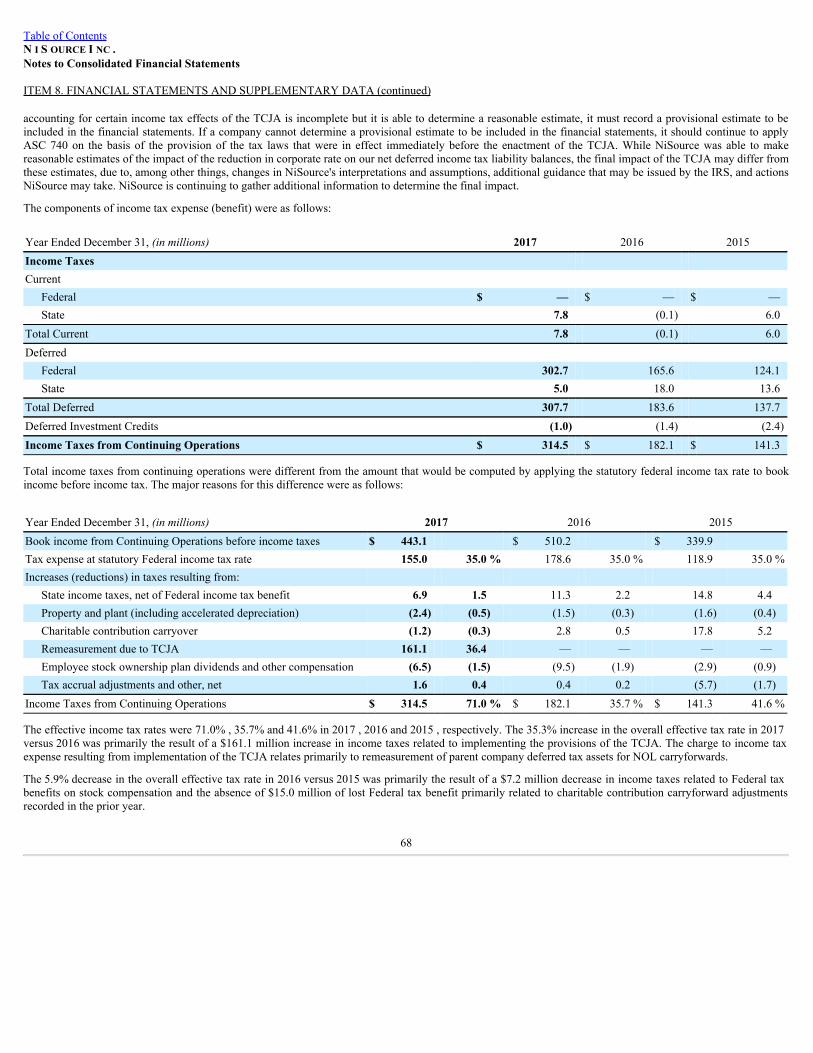
Table of ContentsN I S OURCE I NC .Notes to Consolidated Financial Statements
ITEM 8. FINANCIAL STATEMENTS AND SUPPLEMENTARY DATA (continued)
accounting for certain income tax effects of the TCJA is incomplete but it is able to determine a reasonable estimate, it must record a provisional estimate to beincluded in the financial statements. If a company cannot determine a provisional estimate to be included in the financial statements, it should continue to applyASC 740 on the basis of the provision of the tax laws that were in effect immediately before the enactment of the TCJA. While NiSource was able to makereasonable estimates of the impact of the reduction in corporate rate on our net deferred income tax liability balances, the final impact of the TCJA may differ fromthese estimates, due to, among other things, changes in NiSource's interpretations and assumptions, additional guidance that may be issued by the IRS, and actionsNiSource may take. NiSource is continuing to gather additional information to determine the final impact.
The components of income tax expense (benefit) were as follows:
Year Ended December 31, (inmillions) 2017 2016 2015Income Taxes Current
Federal $ — $ — $ —State 7.8 (0.1) 6.0
Total Current 7.8 (0.1) 6.0Deferred
Federal 302.7 165.6 124.1State 5.0 18.0 13.6
Total Deferred 307.7 183.6 137.7Deferred Investment Credits (1.0) (1.4) (2.4)Income Taxes from Continuing Operations $ 314.5 $ 182.1 $ 141.3
Total income taxes from continuing operations were different from the amount that would be computed by applying the statutory federal income tax rate to bookincome before income tax. The major reasons for this difference were as follows:
Year Ended December 31, (inmillions) 2017 2016 2015Book income from Continuing Operations before income taxes $ 443.1 $ 510.2 $ 339.9 Tax expense at statutory Federal income tax rate 155.0 35.0 % 178.6 35.0 % 118.9 35.0 %Increases (reductions) in taxes resulting from:
State income taxes, net of Federal income tax benefit 6.9 1.5 11.3 2.2 14.8 4.4Property and plant (including accelerated depreciation) (2.4) (0.5) (1.5) (0.3) (1.6) (0.4)Charitable contribution carryover (1.2) (0.3) 2.8 0.5 17.8 5.2Remeasurement due to TCJA 161.1 36.4 — — — —Employee stock ownership plan dividends and other compensation (6.5) (1.5) (9.5) (1.9) (2.9) (0.9)Tax accrual adjustments and other, net 1.6 0.4 0.4 0.2 (5.7) (1.7)
Income Taxes from Continuing Operations $ 314.5 71.0 % $ 182.1 35.7 % $ 141.3 41.6 %
The effective income tax rates were 71.0% , 35.7% and 41.6% in 2017 , 2016 and 2015 , respectively. The 35.3% increase in the overall effective tax rate in 2017versus 2016 was primarily the result of a $161.1 million increase in income taxes related to implementing the provisions of the TCJA. The charge to income taxexpense resulting from implementation of the TCJA relates primarily to remeasurement of parent company deferred tax assets for NOL carryforwards.
The 5.9% decrease in the overall effective tax rate in 2016 versus 2015 was primarily the result of a $7.2 million decrease in income taxes related to Federal taxbenefits on stock compensation and the absence of $15.0 million of lost Federal tax benefit primarily related to charitable contribution carryforward adjustmentsrecorded in the prior year.
68
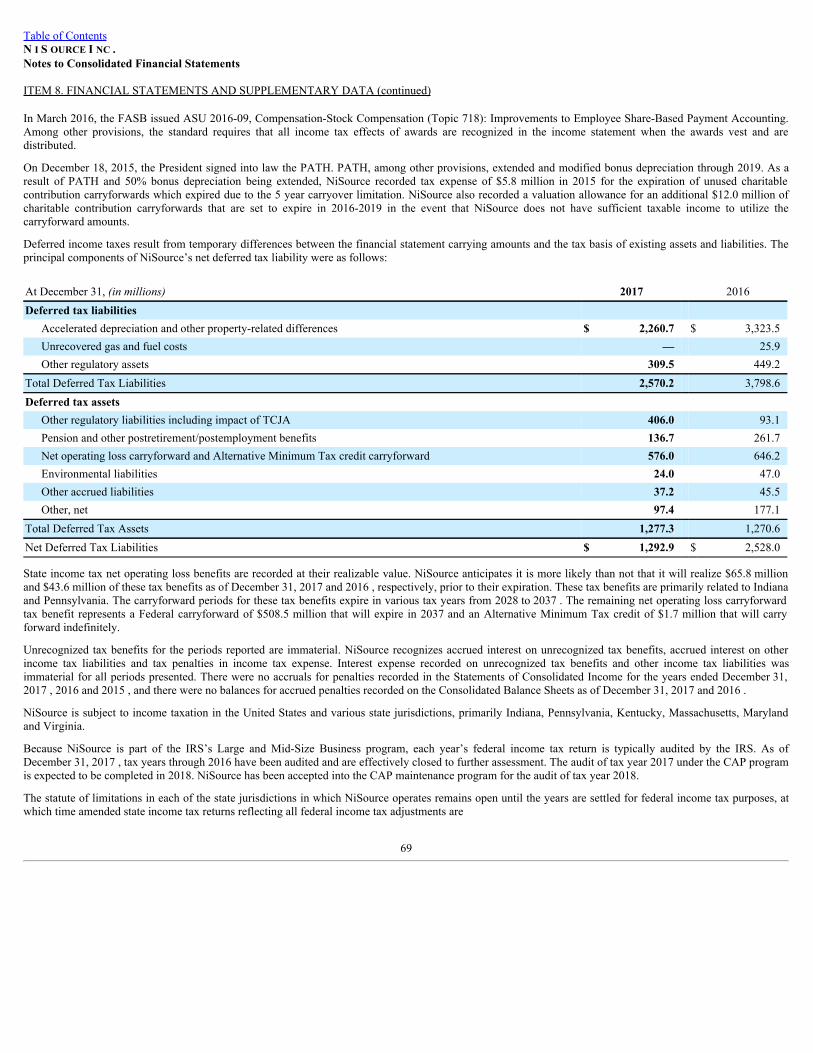
Table of ContentsN I S OURCE I NC .Notes to Consolidated Financial Statements
ITEM 8. FINANCIAL STATEMENTS AND SUPPLEMENTARY DATA (continued)
In March 2016, the FASB issued ASU 2016-09, Compensation-Stock Compensation (Topic 718): Improvements to Employee Share-Based Payment Accounting.Among other provisions, the standard requires that all income tax effects of awards are recognized in the income statement when the awards vest and aredistributed.
On December 18, 2015, the President signed into law the PATH. PATH, among other provisions, extended and modified bonus depreciation through 2019. As aresult of PATH and 50% bonus depreciation being extended, NiSource recorded tax expense of $5.8 million in 2015 for the expiration of unused charitablecontribution carryforwards which expired due to the 5 year carryover limitation. NiSource also recorded a valuation allowance for an additional $12.0 million ofcharitable contribution carryforwards that are set to expire in 2016-2019 in the event that NiSource does not have sufficient taxable income to utilize thecarryforward amounts.
Deferred income taxes result from temporary differences between the financial statement carrying amounts and the tax basis of existing assets and liabilities. Theprincipal components of NiSource’s net deferred tax liability were as follows:
At December 31, (inmillions) 2017 2016Deferred tax liabilities
Accelerated depreciation and other property-related differences $ 2,260.7 $ 3,323.5Unrecovered gas and fuel costs — 25.9Other regulatory assets 309.5 449.2
Total Deferred Tax Liabilities 2,570.2 3,798.6Deferred tax assets
Other regulatory liabilities including impact of TCJA 406.0 93.1Pension and other postretirement/postemployment benefits 136.7 261.7Net operating loss carryforward and Alternative Minimum Tax credit carryforward 576.0 646.2Environmental liabilities 24.0 47.0Other accrued liabilities 37.2 45.5Other, net 97.4 177.1
Total Deferred Tax Assets 1,277.3 1,270.6Net Deferred Tax Liabilities $ 1,292.9 $ 2,528.0
State income tax net operating loss benefits are recorded at their realizable value. NiSource anticipates it is more likely than not that it will realize $65.8 millionand $43.6 million of these tax benefits as of December 31, 2017 and 2016 , respectively, prior to their expiration. These tax benefits are primarily related to Indianaand Pennsylvania. The carryforward periods for these tax benefits expire in various tax years from 2028 to 2037 . The remaining net operating loss carryforwardtax benefit represents a Federal carryforward of $508.5 million that will expire in 2037 and an Alternative Minimum Tax credit of $1.7 million that will carryforward indefinitely.
Unrecognized tax benefits for the periods reported are immaterial. NiSource recognizes accrued interest on unrecognized tax benefits, accrued interest on otherincome tax liabilities and tax penalties in income tax expense. Interest expense recorded on unrecognized tax benefits and other income tax liabilities wasimmaterial for all periods presented. There were no accruals for penalties recorded in the Statements of Consolidated Income for the years ended December 31,2017 , 2016 and 2015 , and there were no balances for accrued penalties recorded on the Consolidated Balance Sheets as of December 31, 2017 and 2016 .
NiSource is subject to income taxation in the United States and various state jurisdictions, primarily Indiana, Pennsylvania, Kentucky, Massachusetts, Marylandand Virginia.
Because NiSource is part of the IRS’s Large and Mid-Size Business program, each year’s federal income tax return is typically audited by the IRS. As ofDecember 31, 2017 , tax years through 2016 have been audited and are effectively closed to further assessment. The audit of tax year 2017 under the CAP programis expected to be completed in 2018. NiSource has been accepted into the CAP maintenance program for the audit of tax year 2018.
The statute of limitations in each of the state jurisdictions in which NiSource operates remains open until the years are settled for federal income tax purposes, atwhich time amended state income tax returns reflecting all federal income tax adjustments are
69
Table of ContentsN I S OURCE I NC .Notes to Consolidated Financial Statements
ITEM 8. FINANCIAL STATEMENTS AND SUPPLEMENTARY DATA (continued)
filed. As of December 31, 2017 , there were no state income tax audits in progress that would have a material impact on the consolidated financial statements.
11. Pension and Other Postretirement Benefits
NiSource provides defined contribution plans and noncontributory defined benefit retirement plans that cover certain of its employees. Benefits under the definedbenefit retirement plans reflect the employees’ compensation, years of service and age at retirement. Additionally, NiSource provides health care and life insurancebenefits for certain retired employees. The majority of employees may become eligible for these benefits if they reach retirement age while working for NiSource.The expected cost of such benefits is accrued during the employees’ years of service. Current rates of rate-regulated companies include postretirement benefitcosts, including amortization of the regulatory assets that arose prior to inclusion of these costs in rates. For most plans, cash contributions are remitted to grantortrusts.
NiSourcePensionandOtherPostretirementBenefitPlans’AssetManagement. NiSource employs a liability-driven investing strategy for the pension plan, asnoted below. While the majority of assets continue in a total return investment approach, a glide path has been implemented. A mix of equities and fixed incomeinvestments are used to maximize the long-term return of plan assets and hedge the liabilities at a prudent level of risk. NiSource utilizes a total return investmentapproach for the other postretirement benefit plans. Risk tolerance is established through careful consideration of plan liabilities, plan funded status, and asset classvolatility. The investment portfolio contains a diversified blend of equity and fixed income investments. Furthermore, equity investments are diversified acrossU.S. and non-U.S. stocks, as well as growth, value, small and large capitalizations. Other assets such as private equity funds are used judiciously to enhance long-term returns while improving portfolio diversification. Derivatives may be used to gain market exposure in an efficient and timely manner; however, derivativesmay not be used to leverage the portfolio beyond the market value of the underlying assets. Investment risk is measured and monitored on an ongoing basisthrough quarterly investment portfolio reviews, annual liability measurements, and periodic asset/liability studies.
NiSource utilizes a building block approach with proper consideration of diversification and rebalancing in determining the long-term rate of return for plan assets.Historical markets are studied and long-term historical relationships between equities and fixed income are analyzed to ensure that they are consistent with thewidely accepted capital market principle that assets with higher volatility generate greater return over the long run. Current market factors, such as inflation andinterest rates, are evaluated before long-term capital market assumptions are determined. Peer data and historical returns are reviewed to check for reasonabilityand appropriateness.
The most important component of an investment strategy is the portfolio asset mix, or the allocation between the various classes of securities available to thepension and other postretirement benefit plans for investment purposes. The asset mix and acceptable minimum and maximum ranges established for the NiSourceplan assets represents a long-term view and are listed in the table below.
In 2012, a dynamic asset allocation policy for the pension fund was approved. This policy calls for a gradual reduction in the allocation of return-seeking assets(equities, real estate and private equity) and a corresponding increase in the allocation of liability-hedging assets (fixed income) as the funded status of the plansincrease above 90% (as measured by the market value of qualified pension plan assets divided by the projected benefit obligations of the qualified pension plans).In 2016, a study was conducted and approved resulting in the addition of new asset classes in the return-seeking portfolio allocation (core real estate, diversifiedcredit) and a shift in the hedging allocation (fixed income). Planned implementation of the new asset classes began in 2017. During 2017, a $277 milliondiscretionary contribution was made and further implementation of new asset classes is under review while a new asset-liability study is completed.
70
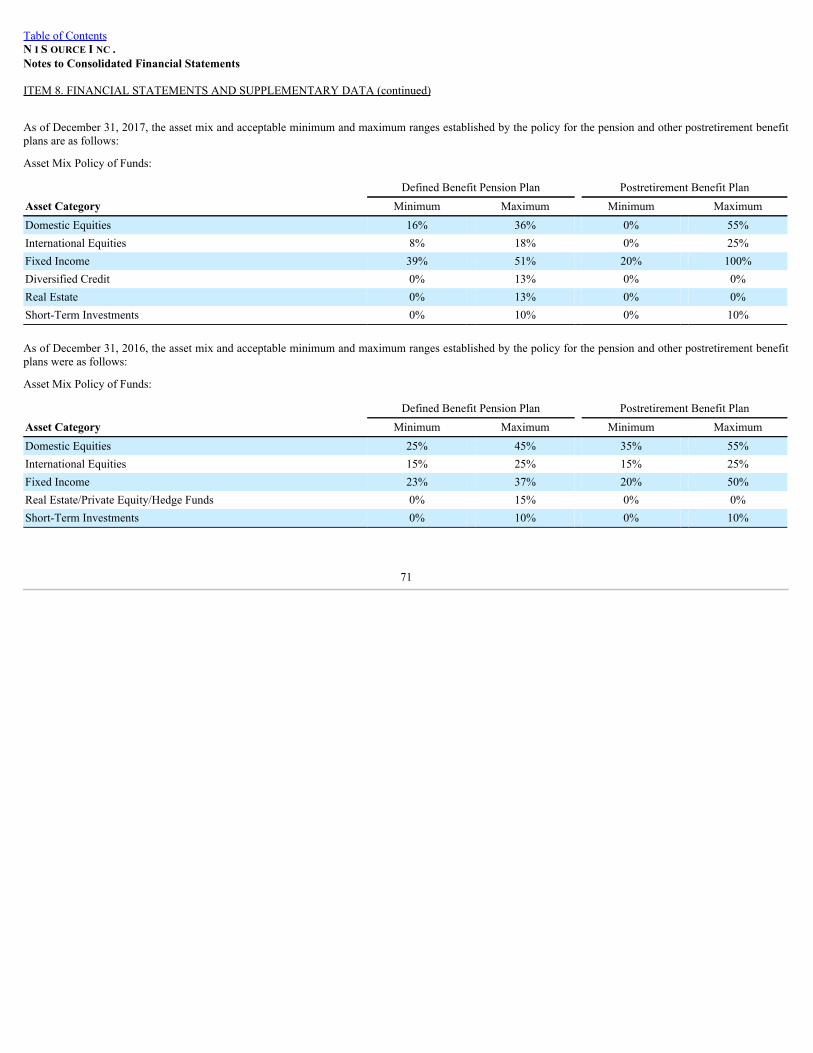
Table of ContentsN I S OURCE I NC .Notes to Consolidated Financial Statements
ITEM 8. FINANCIAL STATEMENTS AND SUPPLEMENTARY DATA (continued)
As of December 31, 2017, the asset mix and acceptable minimum and maximum ranges established by the policy for the pension and other postretirement benefitplans are as follows:
Asset Mix Policy of Funds:
Defined Benefit Pension Plan Postretirement Benefit PlanAsset Category Minimum Maximum Minimum MaximumDomestic Equities 16% 36% 0% 55%International Equities 8% 18% 0% 25%Fixed Income 39% 51% 20% 100%Diversified Credit 0% 13% 0% 0%Real Estate 0% 13% 0% 0%Short-Term Investments 0% 10% 0% 10%
As of December 31, 2016, the asset mix and acceptable minimum and maximum ranges established by the policy for the pension and other postretirement benefitplans were as follows:
Asset Mix Policy of Funds:
Defined Benefit Pension Plan Postretirement Benefit PlanAsset Category Minimum Maximum Minimum MaximumDomestic Equities 25% 45% 35% 55%International Equities 15% 25% 15% 25%Fixed Income 23% 37% 20% 50%Real Estate/Private Equity/Hedge Funds 0% 15% 0% 0%Short-Term Investments 0% 10% 0% 10%
71
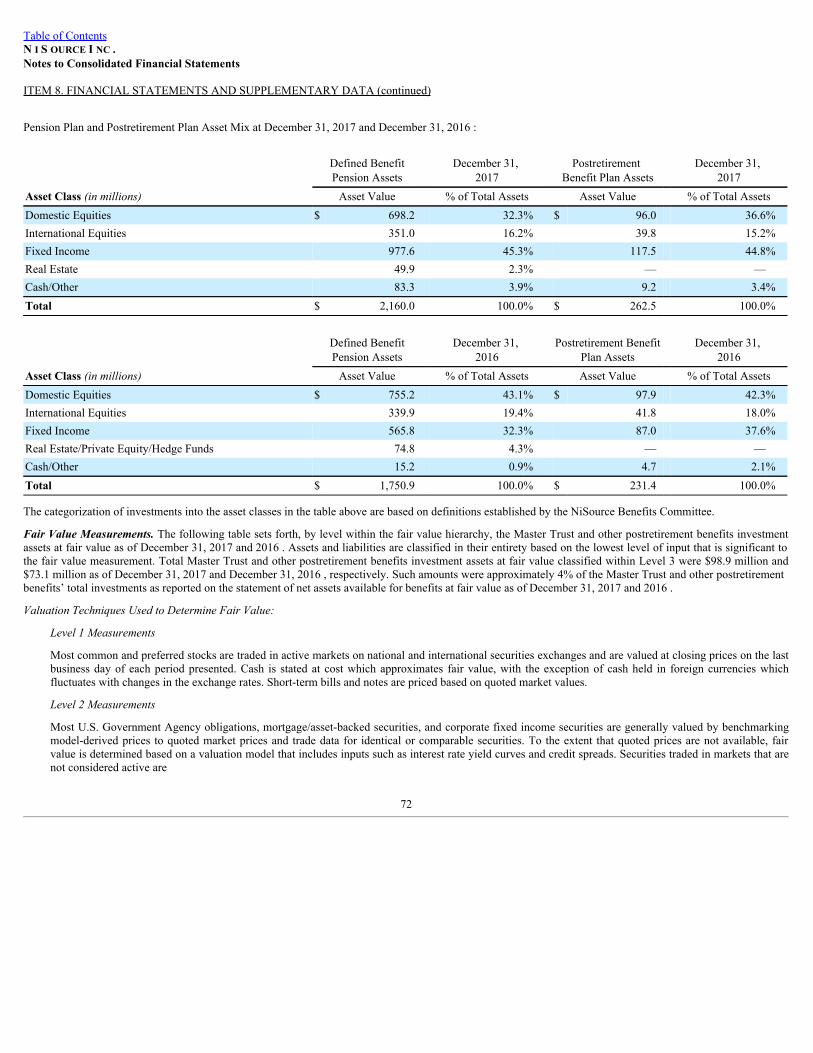
Table of ContentsN I S OURCE I NC .Notes to Consolidated Financial Statements
ITEM 8. FINANCIAL STATEMENTS AND SUPPLEMENTARY DATA (continued)
Pension Plan and Postretirement Plan Asset Mix at December 31, 2017 and December 31, 2016 :
Defined BenefitPension Assets
December 31, 2017
Postretirement Benefit Plan Assets
December 31, 2017
Asset Class (inmillions) Asset Value % of Total Assets Asset Value % of Total AssetsDomestic Equities $ 698.2 32.3% $ 96.0 36.6%International Equities 351.0 16.2% 39.8 15.2%Fixed Income 977.6 45.3% 117.5 44.8%Real Estate 49.9 2.3% — —Cash/Other 83.3 3.9% 9.2 3.4%Total $ 2,160.0 100.0% $ 262.5 100.0%
Defined BenefitPension Assets
December 31, 2016
Postretirement BenefitPlan Assets
December 31, 2016
Asset Class (inmillions) Asset Value % of Total Assets Asset Value % of Total AssetsDomestic Equities $ 755.2 43.1% $ 97.9 42.3%International Equities 339.9 19.4% 41.8 18.0%Fixed Income 565.8 32.3% 87.0 37.6%Real Estate/Private Equity/Hedge Funds 74.8 4.3% — —Cash/Other 15.2 0.9% 4.7 2.1%Total $ 1,750.9 100.0% $ 231.4 100.0%
The categorization of investments into the asset classes in the table above are based on definitions established by the NiSource Benefits Committee.
FairValueMeasurements.The following table sets forth, by level within the fair value hierarchy, the Master Trust and other postretirement benefits investmentassets at fair value as of December 31, 2017 and 2016 . Assets and liabilities are classified in their entirety based on the lowest level of input that is significant tothe fair value measurement. Total Master Trust and other postretirement benefits investment assets at fair value classified within Level 3 were $98.9 million and$73.1 million as of December 31, 2017 and December 31, 2016 , respectively. Such amounts were approximately 4% of the Master Trust and other postretirementbenefits’ total investments as reported on the statement of net assets available for benefits at fair value as of December 31, 2017 and 2016 .
ValuationTechniquesUsedtoDetermineFairValue:
Level1Measurements
Most common and preferred stocks are traded in active markets on national and international securities exchanges and are valued at closing prices on the lastbusiness day of each period presented. Cash is stated at cost which approximates fair value, with the exception of cash held in foreign currencies whichfluctuates with changes in the exchange rates. Short-term bills and notes are priced based on quoted market values.
Level2Measurements
Most U.S. Government Agency obligations, mortgage/asset-backed securities, and corporate fixed income securities are generally valued by benchmarkingmodel-derived prices to quoted market prices and trade data for identical or comparable securities. To the extent that quoted prices are not available, fairvalue is determined based on a valuation model that includes inputs such as interest rate yield curves and credit spreads. Securities traded in markets that arenot considered active are
72
Table of ContentsN I S OURCE I NC .Notes to Consolidated Financial Statements
ITEM 8. FINANCIAL STATEMENTS AND SUPPLEMENTARY DATA (continued)
valued based on quoted market prices, broker or dealer quotations, or alternative pricing sources with reasonable levels of price transparency. Other fixedincome includes futures and options which are priced on bid valuation or settlement pricing.
Level3Measurements
Private equity investment strategies include buy-out, venture capital, growth equity, distressed debt, and mezzanine debt. Private equity investments are heldthrough limited partnerships.
Limited partnerships are valued at estimated fair market value based on their proportionate share of the partnership's fair value as recorded in thepartnerships' audited financial statements. Partnership interests represent ownership interests in private equity funds and real estate funds. Real estatepartnerships invest in natural resources, commercial real estate and distressed real estate. The fair value of these investments is determined by reference to thefunds' underlying assets, which are principally securities, private businesses, and real estate properties. The value of interests held in limited partnerships,other than securities, is determined by the general partner, based upon third-party appraisals of the underlying assets, which include inputs such as cost,operating results, discounted cash flows and market based comparable data. Private equity and real estate limited partnerships typically call capital over athree to five year period and pay out distributions as the underlying investments are liquidated. The typical expected life of these limited partnerships is 10-15years and these investments typically cannot be redeemed prior to liquidation.
NotClassified
Commingled funds that hold underlying investments that have prices which are derived from the quoted prices in active markets are not classified within thefair value hierarchy. Instead, these assets are measured at estimated fair value using the net asset value per share of the investments. The funds' underlyingassets are principally marketable equity and fixed income securities. Units held in commingled funds are valued at the unit value as reported by theinvestment managers.
For the year ended December 31, 2017 , there were no significant changes to valuation techniques to determine the fair value of NiSource's pension and otherpostretirement benefits' assets.
73
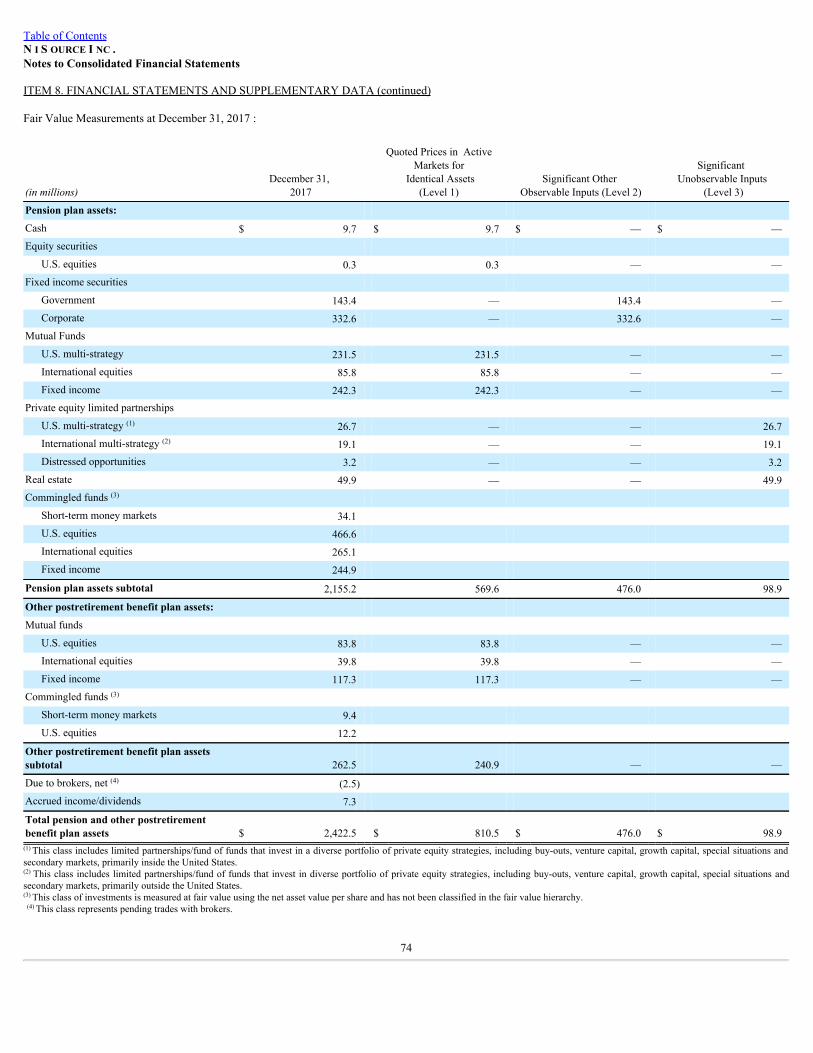
Table of ContentsN I S OURCE I NC .Notes to Consolidated Financial Statements
ITEM 8. FINANCIAL STATEMENTS AND SUPPLEMENTARY DATA (continued)
Fair Value Measurements at December 31, 2017 :
(inmillions)December 31,
2017
Quoted Prices in ActiveMarkets for
Identical Assets(Level 1)
Significant Other Observable Inputs (Level 2)
Significant Unobservable Inputs
(Level 3)
Pension plan assets: Cash $ 9.7 $ 9.7 $ — $ —Equity securities
U.S. equities 0.3 0.3 — —Fixed income securities
Government 143.4 — 143.4 —Corporate 332.6 — 332.6 —
Mutual Funds U.S. multi-strategy 231.5 231.5 — —International equities 85.8 85.8 — —Fixed income 242.3 242.3 — —
Private equity limited partnerships U.S. multi-strategy (1) 26.7 — — 26.7International multi-strategy (2) 19.1 — — 19.1Distressed opportunities 3.2 — — 3.2
Real estate 49.9 — — 49.9Commingled funds (3)
Short-term money markets 34.1 U.S. equities 466.6 International equities 265.1 Fixed income 244.9
Pension plan assets subtotal 2,155.2 569.6 476.0 98.9
Other postretirement benefit plan assets: Mutual funds
U.S. equities 83.8 83.8 — —International equities 39.8 39.8 — —Fixed income 117.3 117.3 — —
Commingled funds (3) Short-term money markets 9.4 U.S. equities 12.2
Other postretirement benefit plan assetssubtotal 262.5 240.9 — —
Due to brokers, net (4) (2.5) Accrued income/dividends 7.3 Total pension and other postretirementbenefit plan assets $ 2,422.5 $ 810.5 $ 476.0 $ 98.9(1) This class includes limited partnerships/fund of funds that invest in a diverse portfolio of private equity strategies, including buy-outs, venture capital, growth capital, special situations andsecondary markets, primarily inside the United States. (2) This class includes limited partnerships/fund of funds that invest in diverse portfolio of private equity strategies, including buy-outs, venture capital, growth capital, special situations andsecondary markets, primarily outside the United States.(3) This class of investments is measured at fair value using the net asset value per share and has not been classified in the fair value hierarchy.(4) This class represents pending trades with brokers.
74
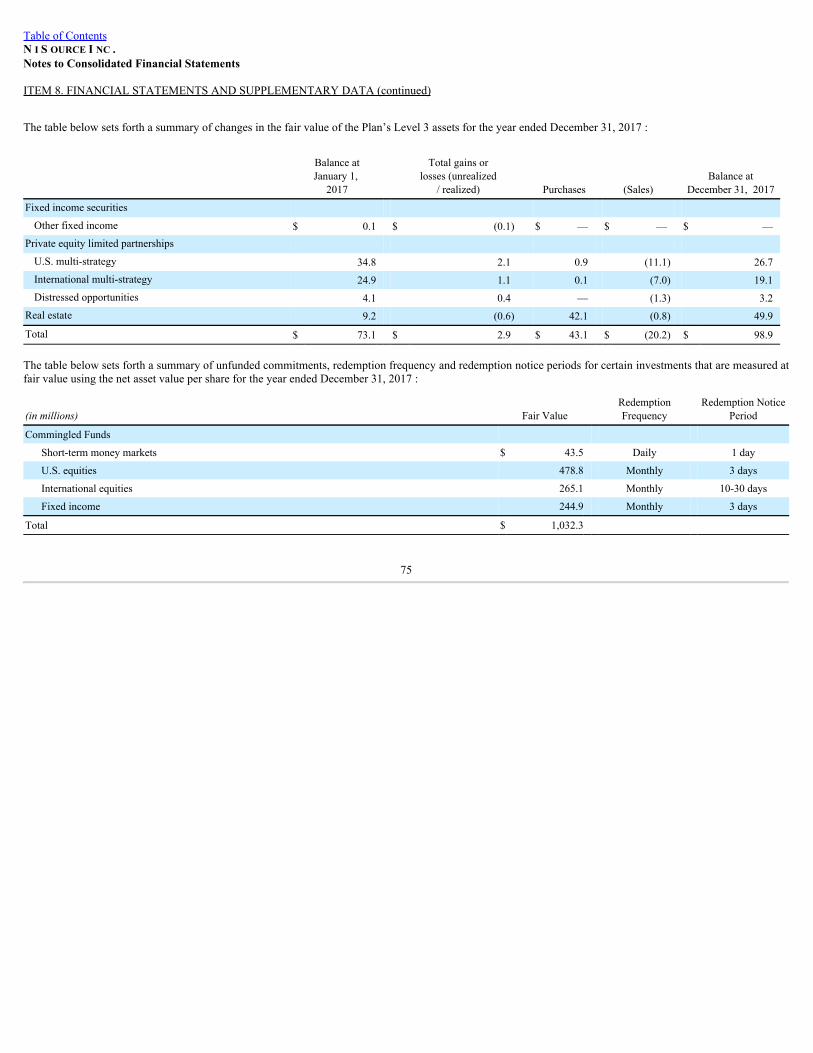
Table of ContentsN I S OURCE I NC .Notes to Consolidated Financial Statements
ITEM 8. FINANCIAL STATEMENTS AND SUPPLEMENTARY DATA (continued)
The table below sets forth a summary of changes in the fair value of the Plan’s Level 3 assets for the year ended December 31, 2017 :
Balance atJanuary 1,
2017
Total gains orlosses (unrealized
/ realized) Purchases (Sales) Balance at
December 31, 2017
Fixed income securities Other fixed income $ 0.1 $ (0.1) $ — $ — $ —
Private equity limited partnerships U.S. multi-strategy 34.8 2.1 0.9 (11.1) 26.7International multi-strategy 24.9 1.1 0.1 (7.0) 19.1Distressed opportunities 4.1 0.4 — (1.3) 3.2
Real estate 9.2 (0.6) 42.1 (0.8) 49.9
Total $ 73.1 $ 2.9 $ 43.1 $ (20.2) $ 98.9
The table below sets forth a summary of unfunded commitments, redemption frequency and redemption notice periods for certain investments that are measured atfair value using the net asset value per share for the year ended December 31, 2017 :
(inmillions) Fair Value RedemptionFrequency
Redemption NoticePeriod
Commingled Funds Short-term money markets $ 43.5 Daily 1 day
U.S. equities 478.8 Monthly 3 days
International equities 265.1 Monthly 10-30 days
Fixed income 244.9 Monthly 3 days
Total $ 1,032.3
75
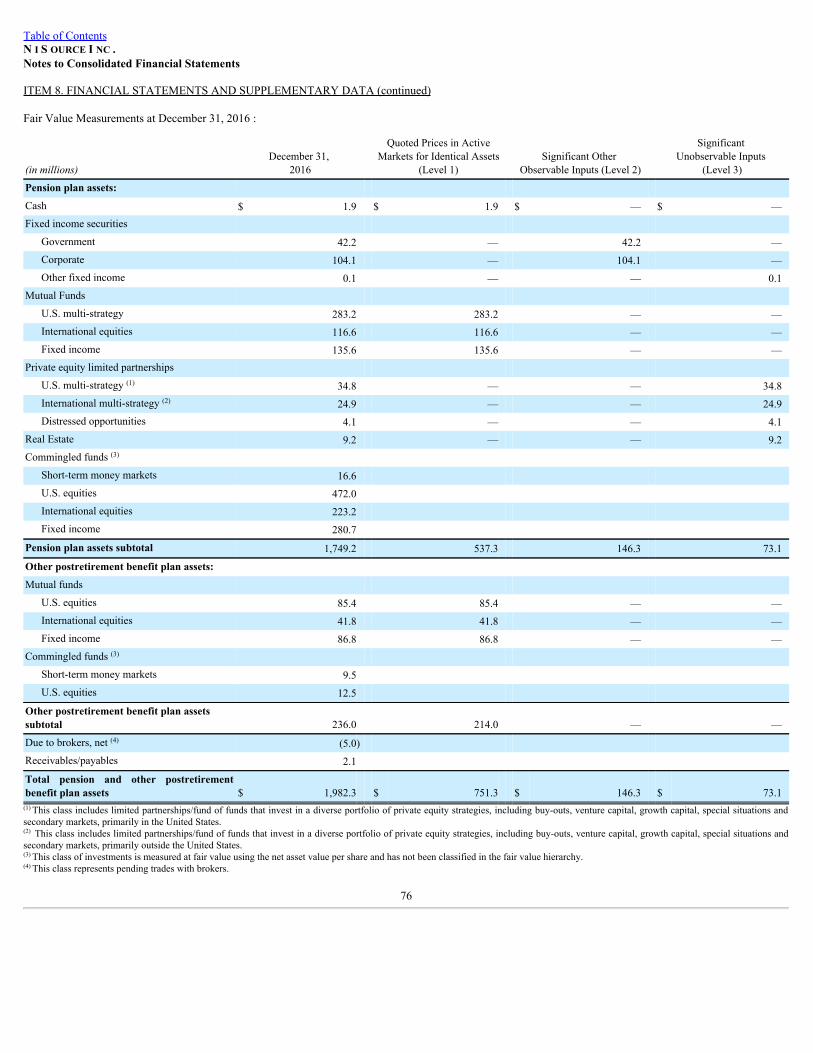
Table of ContentsN I S OURCE I NC .Notes to Consolidated Financial Statements
ITEM 8. FINANCIAL STATEMENTS AND SUPPLEMENTARY DATA (continued)
Fair Value Measurements at December 31, 2016 :
(inmillions)December 31,
2016
Quoted Prices in ActiveMarkets for Identical Assets
(Level 1) Significant Other
Observable Inputs (Level 2)
Significant Unobservable Inputs
(Level 3)
Pension plan assets: Cash $ 1.9 $ 1.9 $ — $ —Fixed income securities
Government 42.2 — 42.2 —Corporate 104.1 — 104.1 —Other fixed income 0.1 — — 0.1
Mutual Funds U.S. multi-strategy 283.2 283.2 — —International equities 116.6 116.6 — —Fixed income 135.6 135.6 — —
Private equity limited partnerships U.S. multi-strategy (1) 34.8 — — 34.8International multi-strategy (2) 24.9 — — 24.9Distressed opportunities 4.1 — — 4.1
Real Estate 9.2 — — 9.2Commingled funds (3)
Short-term money markets 16.6 U.S. equities 472.0 International equities 223.2 Fixed income 280.7
Pension plan assets subtotal 1,749.2 537.3 146.3 73.1
Other postretirement benefit plan assets: Mutual funds
U.S. equities 85.4 85.4 — —International equities 41.8 41.8 — —Fixed income 86.8 86.8 — —
Commingled funds (3) Short-term money markets 9.5 U.S. equities 12.5
Other postretirement benefit plan assetssubtotal 236.0 214.0 — —
Due to brokers, net (4) (5.0) Receivables/payables 2.1 Total pension and other postretirementbenefit plan assets $ 1,982.3 $ 751.3 $ 146.3 $ 73.1(1) This class includes limited partnerships/fund of funds that invest in a diverse portfolio of private equity strategies, including buy-outs, venture capital, growth capital, special situations andsecondary markets, primarily in the United States.(2) This class includes limited partnerships/fund of funds that invest in a diverse portfolio of private equity strategies, including buy-outs, venture capital, growth capital, special situations andsecondary markets, primarily outside the United States.(3) This class of investments is measured at fair value using the net asset value per share and has not been classified in the fair value hierarchy.(4) This class represents pending trades with brokers.
76
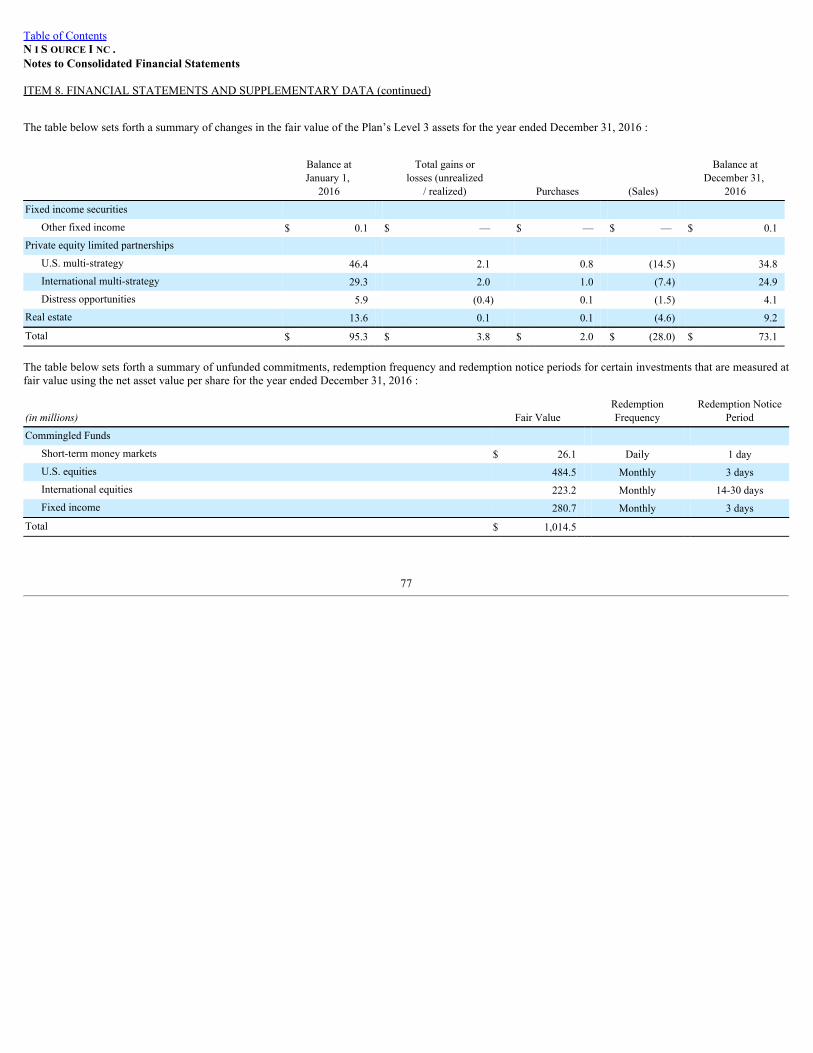
Table of ContentsN I S OURCE I NC .Notes to Consolidated Financial Statements
ITEM 8. FINANCIAL STATEMENTS AND SUPPLEMENTARY DATA (continued)
The table below sets forth a summary of changes in the fair value of the Plan’s Level 3 assets for the year ended December 31, 2016 :
Balance atJanuary 1,
2016
Total gains orlosses (unrealized
/ realized) Purchases (Sales)
Balance atDecember 31,
2016
Fixed income securities Other fixed income $ 0.1 $ — $ — $ — $ 0.1
Private equity limited partnerships U.S. multi-strategy 46.4 2.1 0.8 (14.5) 34.8International multi-strategy 29.3 2.0 1.0 (7.4) 24.9Distress opportunities 5.9 (0.4) 0.1 (1.5) 4.1
Real estate 13.6 0.1 0.1 (4.6) 9.2
Total $ 95.3 $ 3.8 $ 2.0 $ (28.0) $ 73.1
The table below sets forth a summary of unfunded commitments, redemption frequency and redemption notice periods for certain investments that are measured atfair value using the net asset value per share for the year ended December 31, 2016 :
(inmillions) Fair Value RedemptionFrequency
Redemption NoticePeriod
Commingled Funds Short-term money markets $ 26.1 Daily 1 dayU.S. equities 484.5 Monthly 3 daysInternational equities 223.2 Monthly 14-30 daysFixed income 280.7 Monthly 3 days
Total $ 1,014.5
77
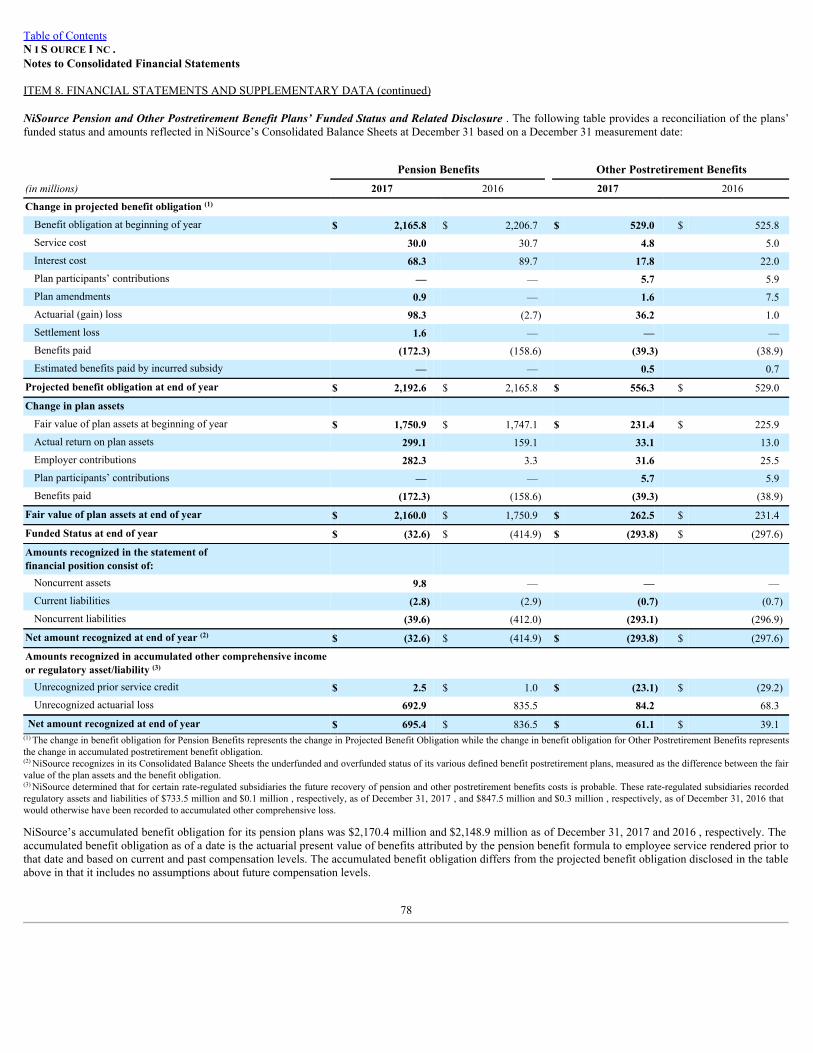
Table of ContentsN I S OURCE I NC .Notes to Consolidated Financial Statements
ITEM 8. FINANCIAL STATEMENTS AND SUPPLEMENTARY DATA (continued)
NiSourcePensionandOtherPostretirementBenefitPlans’FundedStatusandRelatedDisclosure. The following table provides a reconciliation of the plans’funded status and amounts reflected in NiSource’s Consolidated Balance Sheets at December 31 based on a December 31 measurement date:
Pension Benefits Other Postretirement Benefits(inmillions) 2017 2016 2017 2016
Change in projected benefit obligation (1) Benefit obligation at beginning of year $ 2,165.8 $ 2,206.7 $ 529.0 $ 525.8Service cost 30.0 30.7 4.8 5.0Interest cost 68.3 89.7 17.8 22.0Plan participants’ contributions — — 5.7 5.9Plan amendments 0.9 — 1.6 7.5Actuarial (gain) loss 98.3 (2.7) 36.2 1.0Settlement loss 1.6 — — —Benefits paid (172.3) (158.6) (39.3) (38.9)Estimated benefits paid by incurred subsidy — — 0.5 0.7
Projected benefit obligation at end of year $ 2,192.6 $ 2,165.8 $ 556.3 $ 529.0
Change in plan assets Fair value of plan assets at beginning of year $ 1,750.9 $ 1,747.1 $ 231.4 $ 225.9Actual return on plan assets 299.1 159.1 33.1 13.0Employer contributions 282.3 3.3 31.6 25.5Plan participants’ contributions — — 5.7 5.9Benefits paid (172.3) (158.6) (39.3) (38.9)
Fair value of plan assets at end of year $ 2,160.0 $ 1,750.9 $ 262.5 $ 231.4
Funded Status at end of year $ (32.6) $ (414.9) $ (293.8) $ (297.6)
Amounts recognized in the statement offinancial position consist of: Noncurrent assets 9.8 — — —Current liabilities (2.8) (2.9) (0.7) (0.7)Noncurrent liabilities (39.6) (412.0) (293.1) (296.9)
Net amount recognized at end of year (2) $ (32.6) $ (414.9) $ (293.8) $ (297.6)
Amounts recognized in accumulated other comprehensive incomeor regulatory asset/liability (3) Unrecognized prior service credit $ 2.5 $ 1.0 $ (23.1) $ (29.2)Unrecognized actuarial loss 692.9 835.5 84.2 68.3
Net amount recognized at end of year $ 695.4 $ 836.5 $ 61.1 $ 39.1(1) The change in benefit obligation for Pension Benefits represents the change in Projected Benefit Obligation while the change in benefit obligation for Other Postretirement Benefits representsthe change in accumulated postretirement benefit obligation.(2) NiSource recognizes in its Consolidated Balance Sheets the underfunded and overfunded status of its various defined benefit postretirement plans, measured as the difference between the fairvalue of the plan assets and the benefit obligation.(3) NiSource determined that for certain rate-regulated subsidiaries the future recovery of pension and other postretirement benefits costs is probable. These rate-regulated subsidiaries recordedregulatory assets and liabilities of $733.5 million and $0.1 million , respectively, as of December 31, 2017 , and $847.5 million and $0.3 million , respectively, as of December 31, 2016 thatwould otherwise have been recorded to accumulated other comprehensive loss.
NiSource’s accumulated benefit obligation for its pension plans was $2,170.4 million and $2,148.9 million as of December 31, 2017 and 2016 , respectively. Theaccumulated benefit obligation as of a date is the actuarial present value of benefits attributed by the pension benefit formula to employee service rendered prior tothat date and based on current and past compensation levels. The accumulated benefit obligation differs from the projected benefit obligation disclosed in the tableabove in that it includes no assumptions about future compensation levels.
78
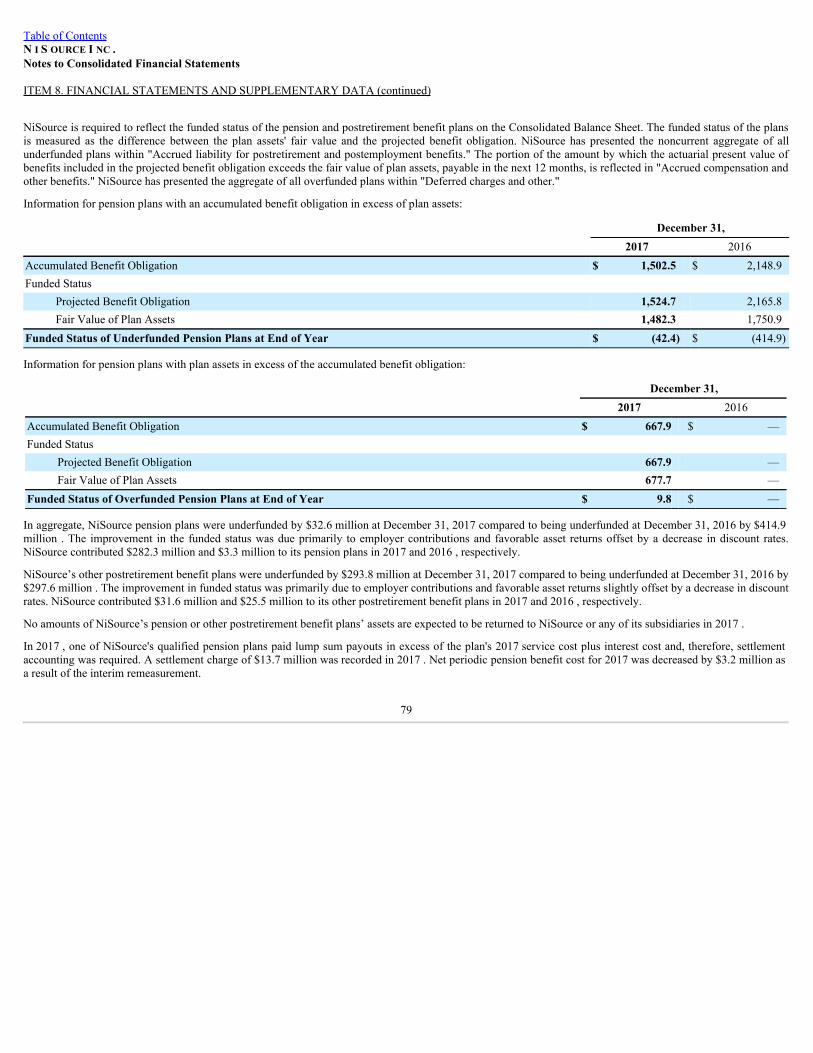
Table of ContentsN I S OURCE I NC .Notes to Consolidated Financial Statements
ITEM 8. FINANCIAL STATEMENTS AND SUPPLEMENTARY DATA (continued)
NiSource is required to reflect the funded status of the pension and postretirement benefit plans on the Consolidated Balance Sheet. The funded status of the plansis measured as the difference between the plan assets' fair value and the projected benefit obligation. NiSource has presented the noncurrent aggregate of allunderfunded plans within "Accrued liability for postretirement and postemployment benefits." The portion of the amount by which the actuarial present value ofbenefits included in the projected benefit obligation exceeds the fair value of plan assets, payable in the next 12 months, is reflected in "Accrued compensation andother benefits." NiSource has presented the aggregate of all overfunded plans within "Deferred charges and other."
Information for pension plans with an accumulated benefit obligation in excess of plan assets:
December 31, 2017 2016Accumulated Benefit Obligation $ 1,502.5 $ 2,148.9Funded Status
Projected Benefit Obligation 1,524.7 2,165.8Fair Value of Plan Assets 1,482.3 1,750.9
Funded Status of Underfunded Pension Plans at End of Year $ (42.4) $ (414.9)
Information for pension plans with plan assets in excess of the accumulated benefit obligation:
December 31, 2017 2016Accumulated Benefit Obligation $ 667.9 $ —Funded Status
Projected Benefit Obligation 667.9 —Fair Value of Plan Assets 677.7 —
Funded Status of Overfunded Pension Plans at End of Year $ 9.8 $ —
In aggregate, NiSource pension plans were underfunded by $32.6 million at December 31, 2017 compared to being underfunded at December 31, 2016 by $414.9million . The improvement in the funded status was due primarily to employer contributions and favorable asset returns offset by a decrease in discount rates.NiSource contributed $282.3 million and $3.3 million to its pension plans in 2017 and 2016 , respectively.
NiSource’s other postretirement benefit plans were underfunded by $293.8 million at December 31, 2017 compared to being underfunded at December 31, 2016 by$297.6 million . The improvement in funded status was primarily due to employer contributions and favorable asset returns slightly offset by a decrease in discountrates. NiSource contributed $31.6 million and $25.5 million to its other postretirement benefit plans in 2017 and 2016 , respectively.
No amounts of NiSource’s pension or other postretirement benefit plans’ assets are expected to be returned to NiSource or any of its subsidiaries in 2017 .
In 2017 , one of NiSource's qualified pension plans paid lump sum payouts in excess of the plan's 2017 service cost plus interest cost and, therefore, settlementaccounting was required. A settlement charge of $13.7 million was recorded in 2017 . Net periodic pension benefit cost for 2017 was decreased by $3.2 million asa result of the interim remeasurement.
79
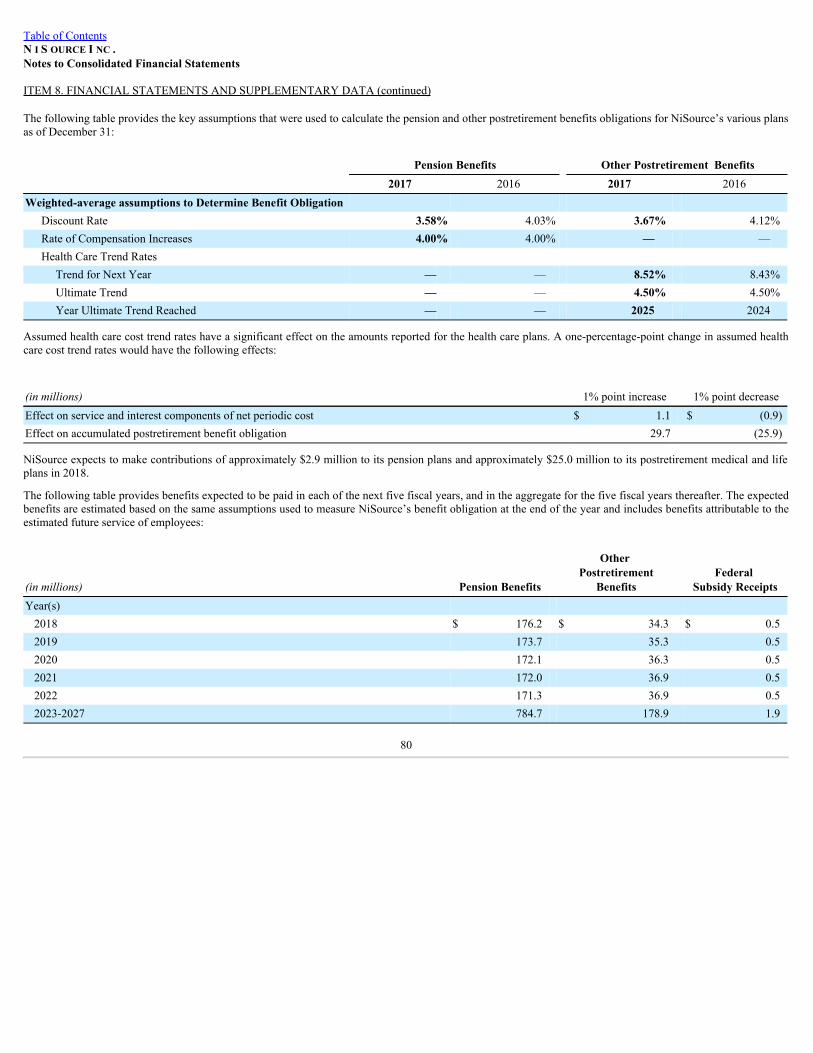
Table of ContentsN I S OURCE I NC .Notes to Consolidated Financial Statements
ITEM 8. FINANCIAL STATEMENTS AND SUPPLEMENTARY DATA (continued)
The following table provides the key assumptions that were used to calculate the pension and other postretirement benefits obligations for NiSource’s various plansas of December 31:
Pension Benefits Other Postretirement Benefits 2017 2016 2017 2016Weighted-average assumptions to Determine Benefit Obligation
Discount Rate 3.58% 4.03% 3.67% 4.12%Rate of Compensation Increases 4.00% 4.00% — —Health Care Trend Rates
Trend for Next Year — — 8.52% 8.43%Ultimate Trend — — 4.50% 4.50%Year Ultimate Trend Reached — — 2025 2024
Assumed health care cost trend rates have a significant effect on the amounts reported for the health care plans. A one-percentage-point change in assumed healthcare cost trend rates would have the following effects:
(inmillions) 1% point increase 1% point decreaseEffect on service and interest components of net periodic cost $ 1.1 $ (0.9)Effect on accumulated postretirement benefit obligation 29.7 (25.9)
NiSource expects to make contributions of approximately $2.9 million to its pension plans and approximately $25.0 million to its postretirement medical and lifeplans in 2018.
The following table provides benefits expected to be paid in each of the next five fiscal years, and in the aggregate for the five fiscal years thereafter. The expectedbenefits are estimated based on the same assumptions used to measure NiSource’s benefit obligation at the end of the year and includes benefits attributable to theestimated future service of employees:
(inmillions) Pension Benefits
Other Postretirement
Benefits Federal
Subsidy ReceiptsYear(s) 2018 $ 176.2 $ 34.3 $ 0.52019 173.7 35.3 0.52020 172.1 36.3 0.52021 172.0 36.9 0.52022 171.3 36.9 0.52023-2027 784.7 178.9 1.9
80
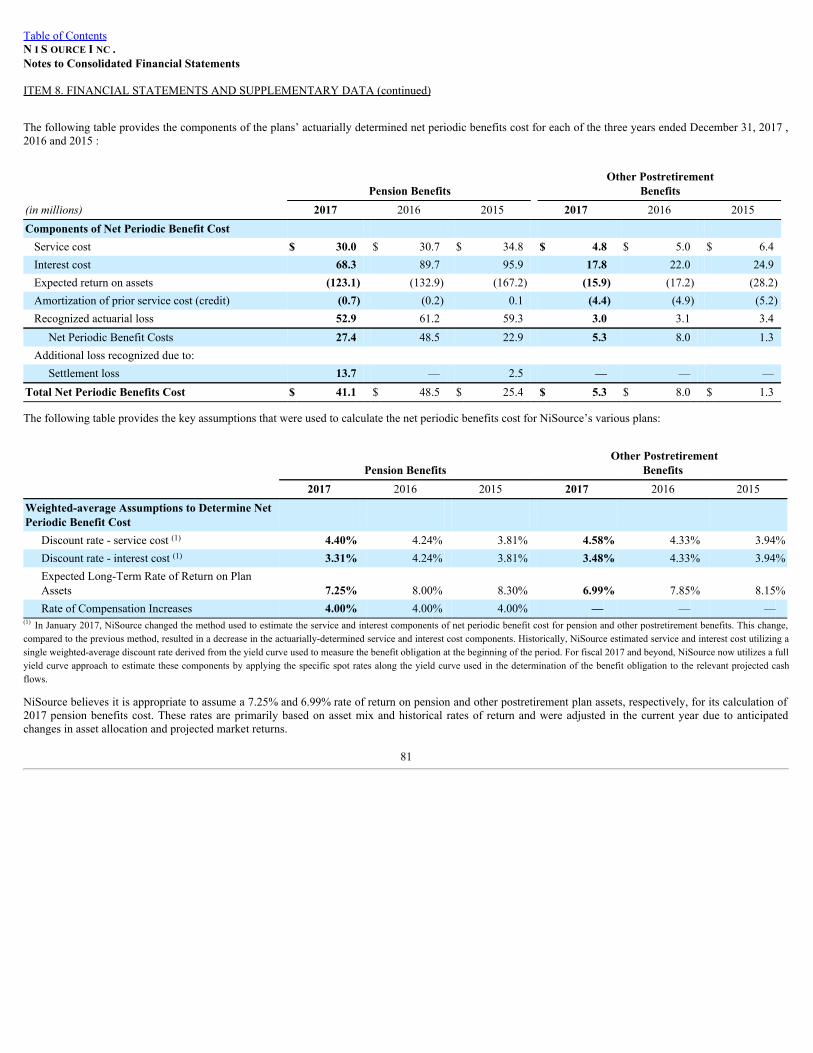
Table of ContentsN I S OURCE I NC .Notes to Consolidated Financial Statements
ITEM 8. FINANCIAL STATEMENTS AND SUPPLEMENTARY DATA (continued)
The following table provides the components of the plans’ actuarially determined net periodic benefits cost for each of the three years ended December 31, 2017 ,2016 and 2015 :
Pension Benefits Other Postretirement
Benefits(inmillions) 2017 2016 2015 2017 2016 2015Components of Net Periodic Benefit Cost Service cost $ 30.0 $ 30.7 $ 34.8 $ 4.8 $ 5.0 $ 6.4Interest cost 68.3 89.7 95.9 17.8 22.0 24.9Expected return on assets (123.1) (132.9) (167.2) (15.9) (17.2) (28.2)Amortization of prior service cost (credit) (0.7) (0.2) 0.1 (4.4) (4.9) (5.2)Recognized actuarial loss 52.9 61.2 59.3 3.0 3.1 3.4
Net Periodic Benefit Costs 27.4 48.5 22.9 5.3 8.0 1.3Additional loss recognized due to:
Settlement loss 13.7 — 2.5 — — —Total Net Periodic Benefits Cost $ 41.1 $ 48.5 $ 25.4 $ 5.3 $ 8.0 $ 1.3
The following table provides the key assumptions that were used to calculate the net periodic benefits cost for NiSource’s various plans:
Pension Benefits Other Postretirement
Benefits 2017 2016 2015 2017 2016 2015Weighted-average Assumptions to Determine NetPeriodic Benefit Cost
Discount rate - service cost (1) 4.40% 4.24% 3.81% 4.58% 4.33% 3.94%Discount rate - interest cost (1) 3.31% 4.24% 3.81% 3.48% 4.33% 3.94%Expected Long-Term Rate of Return on PlanAssets 7.25% 8.00% 8.30% 6.99% 7.85% 8.15%Rate of Compensation Increases 4.00% 4.00% 4.00% — — —
(1) In January 2017, NiSource changed the method used to estimate the service and interest components of net periodic benefit cost for pension and other postretirement benefits. This change,compared to the previous method, resulted in a decrease in the actuarially-determined service and interest cost components. Historically, NiSource estimated service and interest cost utilizing asingle weighted-average discount rate derived from the yield curve used to measure the benefit obligation at the beginning of the period. For fiscal 2017 and beyond, NiSource now utilizes a fullyield curve approach to estimate these components by applying the specific spot rates along the yield curve used in the determination of the benefit obligation to the relevant projected cashflows.
NiSource believes it is appropriate to assume a 7.25% and 6.99% rate of return on pension and other postretirement plan assets, respectively, for its calculation of2017 pension benefits cost. These rates are primarily based on asset mix and historical rates of return and were adjusted in the current year due to anticipatedchanges in asset allocation and projected market returns.
81
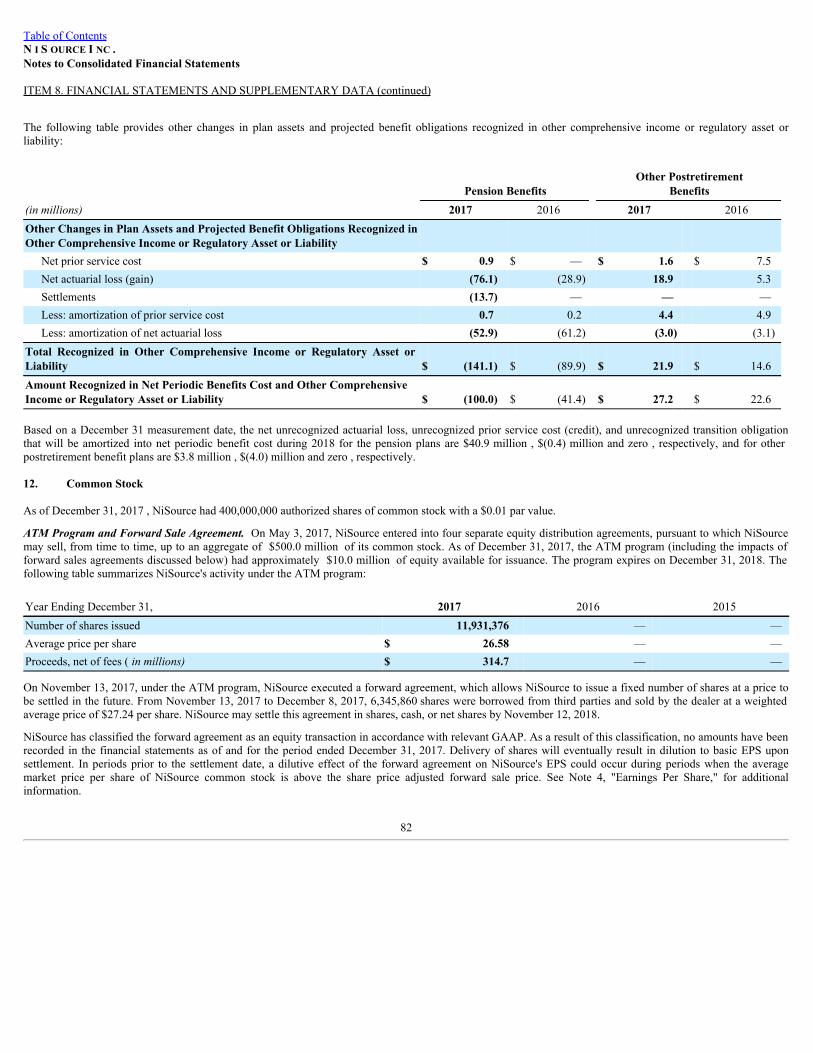
Table of ContentsN I S OURCE I NC .Notes to Consolidated Financial Statements
ITEM 8. FINANCIAL STATEMENTS AND SUPPLEMENTARY DATA (continued)
The following table provides other changes in plan assets and projected benefit obligations recognized in other comprehensive income or regulatory asset orliability:
Pension Benefits Other Postretirement
Benefits(inmillions) 2017 2016 2017 2016Other Changes in Plan Assets and Projected Benefit Obligations Recognized inOther Comprehensive Income or Regulatory Asset or Liability
Net prior service cost $ 0.9 $ — $ 1.6 $ 7.5Net actuarial loss (gain) (76.1) (28.9) 18.9 5.3Settlements (13.7) — — —Less: amortization of prior service cost 0.7 0.2 4.4 4.9Less: amortization of net actuarial loss (52.9) (61.2) (3.0) (3.1)
Total Recognized in Other Comprehensive Income or Regulatory Asset or Liability $ (141.1) $ (89.9) $ 21.9 $ 14.6Amount Recognized in Net Periodic Benefits Cost and Other ComprehensiveIncome or Regulatory Asset or Liability $ (100.0) $ (41.4) $ 27.2 $ 22.6
Based on a December 31 measurement date, the net unrecognized actuarial loss, unrecognized prior service cost (credit), and unrecognized transition obligationthat will be amortized into net periodic benefit cost during 2018 for the pension plans are $40.9 million , $(0.4) million and zero , respectively, and for otherpostretirement benefit plans are $3.8 million , $(4.0) million and zero , respectively.
12. Common Stock
As of December 31, 2017 , NiSource had 400,000,000 authorized shares of common stock with a $0.01 par value.
ATMProgramandForwardSaleAgreement.On May 3, 2017, NiSource entered into four separate equity distribution agreements, pursuant to which NiSourcemay sell, from time to time, up to an aggregate of $500.0 million of its common stock. As of December 31, 2017, the ATM program (including the impacts offorward sales agreements discussed below) had approximately $10.0 million of equity available for issuance. The program expires on December 31, 2018. Thefollowing table summarizes NiSource's activity under the ATM program:
Year Ending December 31, 2017 2016 2015Number of shares issued 11,931,376 — —Average price per share $ 26.58 — —Proceeds, net of fees ( inmillions) $ 314.7 — —
On November 13, 2017, under the ATM program, NiSource executed a forward agreement, which allows NiSource to issue a fixed number of shares at a price tobe settled in the future. From November 13, 2017 to December 8, 2017, 6,345,860 shares were borrowed from third parties and sold by the dealer at a weightedaverage price of $27.24 per share. NiSource may settle this agreement in shares, cash, or net shares by November 12, 2018.
NiSource has classified the forward agreement as an equity transaction in accordance with relevant GAAP. As a result of this classification, no amounts have beenrecorded in the financial statements as of and for the period ended December 31, 2017. Delivery of shares will eventually result in dilution to basic EPS uponsettlement. In periods prior to the settlement date, a dilutive effect of the forward agreement on NiSource's EPS could occur during periods when the averagemarket price per share of NiSource common stock is above the share price adjusted forward sale price. See Note 4, "Earnings Per Share," for additionalinformation.
82
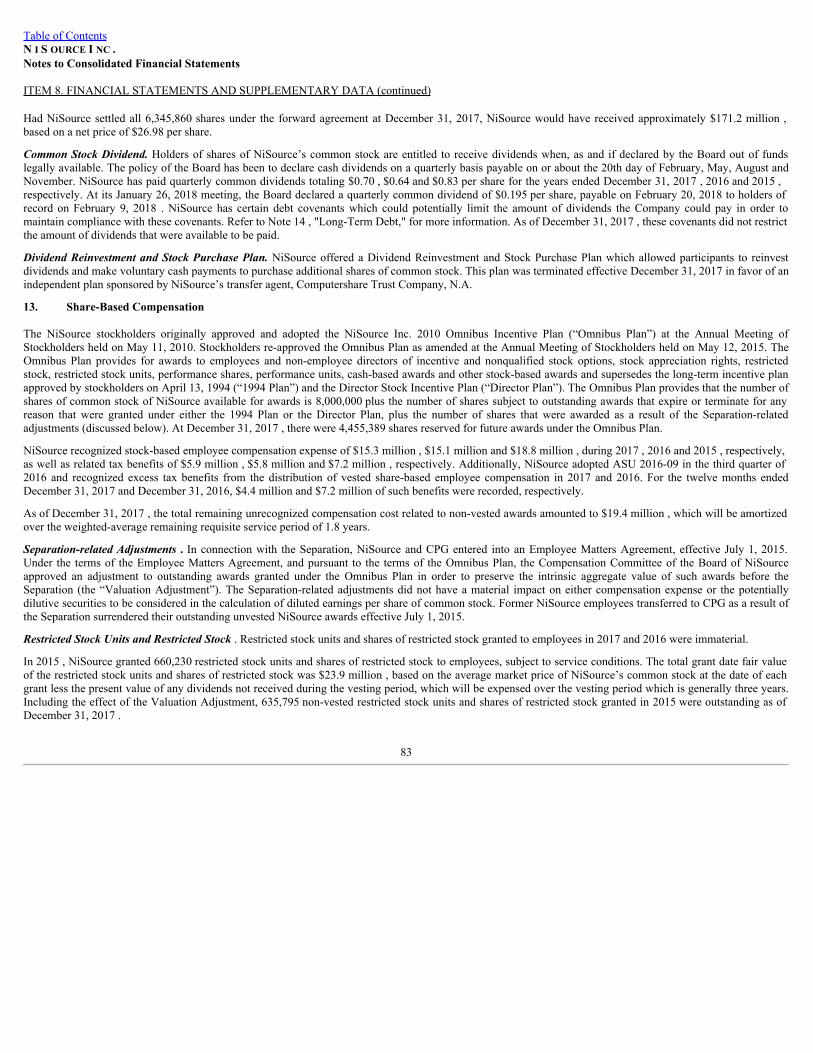
Table of ContentsN I S OURCE I NC .Notes to Consolidated Financial Statements
ITEM 8. FINANCIAL STATEMENTS AND SUPPLEMENTARY DATA (continued)
Had NiSource settled all 6,345,860 shares under the forward agreement at December 31, 2017, NiSource would have received approximately $171.2 million ,based on a net price of $26.98 per share.
CommonStockDividend.Holders of shares of NiSource’s common stock are entitled to receive dividends when, as and if declared by the Board out of fundslegally available. The policy of the Board has been to declare cash dividends on a quarterly basis payable on or about the 20th day of February, May, August andNovember. NiSource has paid quarterly common dividends totaling $0.70 , $0.64 and $0.83 per share for the years ended December 31, 2017 , 2016 and 2015 ,respectively. At its January 26, 2018 meeting, the Board declared a quarterly common dividend of $0.195 per share, payable on February 20, 2018 to holders ofrecord on February 9, 2018 . NiSource has certain debt covenants which could potentially limit the amount of dividends the Company could pay in order tomaintain compliance with these covenants. Refer to Note 14 , "Long-Term Debt," for more information. As of December 31, 2017 , these covenants did not restrictthe amount of dividends that were available to be paid.
DividendReinvestment andStockPurchasePlan.NiSource offered a Dividend Reinvestment and Stock Purchase Plan which allowed participants to reinvestdividends and make voluntary cash payments to purchase additional shares of common stock. This plan was terminated effective December 31, 2017 in favor of anindependent plan sponsored by NiSource’s transfer agent, Computershare Trust Company, N.A.
13. Share-Based Compensation
The NiSource stockholders originally approved and adopted the NiSource Inc. 2010 Omnibus Incentive Plan (“Omnibus Plan”) at the Annual Meeting ofStockholders held on May 11, 2010. Stockholders re-approved the Omnibus Plan as amended at the Annual Meeting of Stockholders held on May 12, 2015. TheOmnibus Plan provides for awards to employees and non-employee directors of incentive and nonqualified stock options, stock appreciation rights, restrictedstock, restricted stock units, performance shares, performance units, cash-based awards and other stock-based awards and supersedes the long-term incentive planapproved by stockholders on April 13, 1994 (“1994 Plan”) and the Director Stock Incentive Plan (“Director Plan”). The Omnibus Plan provides that the number ofshares of common stock of NiSource available for awards is 8,000,000 plus the number of shares subject to outstanding awards that expire or terminate for anyreason that were granted under either the 1994 Plan or the Director Plan, plus the number of shares that were awarded as a result of the Separation-relatedadjustments (discussed below). At December 31, 2017 , there were 4,455,389 shares reserved for future awards under the Omnibus Plan.
NiSource recognized stock-based employee compensation expense of $15.3 million , $15.1 million and $18.8 million , during 2017 , 2016 and 2015 , respectively,as well as related tax benefits of $5.9 million , $5.8 million and $7.2 million , respectively. Additionally, NiSource adopted ASU 2016-09 in the third quarter of2016 and recognized excess tax benefits from the distribution of vested share-based employee compensation in 2017 and 2016. For the twelve months endedDecember 31, 2017 and December 31, 2016, $4.4 million and $7.2 million of such benefits were recorded, respectively.
As of December 31, 2017 , the total remaining unrecognized compensation cost related to non-vested awards amounted to $19.4 million , which will be amortizedover the weighted-average remaining requisite service period of 1.8 years.
Separation-relatedAdjustments . In connection with the Separation, NiSource and CPG entered into an Employee Matters Agreement, effective July 1, 2015.Under the terms of the Employee Matters Agreement, and pursuant to the terms of the Omnibus Plan, the Compensation Committee of the Board of NiSourceapproved an adjustment to outstanding awards granted under the Omnibus Plan in order to preserve the intrinsic aggregate value of such awards before theSeparation (the “Valuation Adjustment”). The Separation-related adjustments did not have a material impact on either compensation expense or the potentiallydilutive securities to be considered in the calculation of diluted earnings per share of common stock. Former NiSource employees transferred to CPG as a result ofthe Separation surrendered their outstanding unvested NiSource awards effective July 1, 2015.
RestrictedStockUnitsandRestrictedStock. Restricted stock units and shares of restricted stock granted to employees in 2017 and 2016 were immaterial.
In 2015 , NiSource granted 660,230 restricted stock units and shares of restricted stock to employees, subject to service conditions. The total grant date fair valueof the restricted stock units and shares of restricted stock was $23.9 million , based on the average market price of NiSource’s common stock at the date of eachgrant less the present value of any dividends not received during the vesting period, which will be expensed over the vesting period which is generally three years.Including the effect of the Valuation Adjustment, 635,795 non-vested restricted stock units and shares of restricted stock granted in 2015 were outstanding as ofDecember 31, 2017 .
83
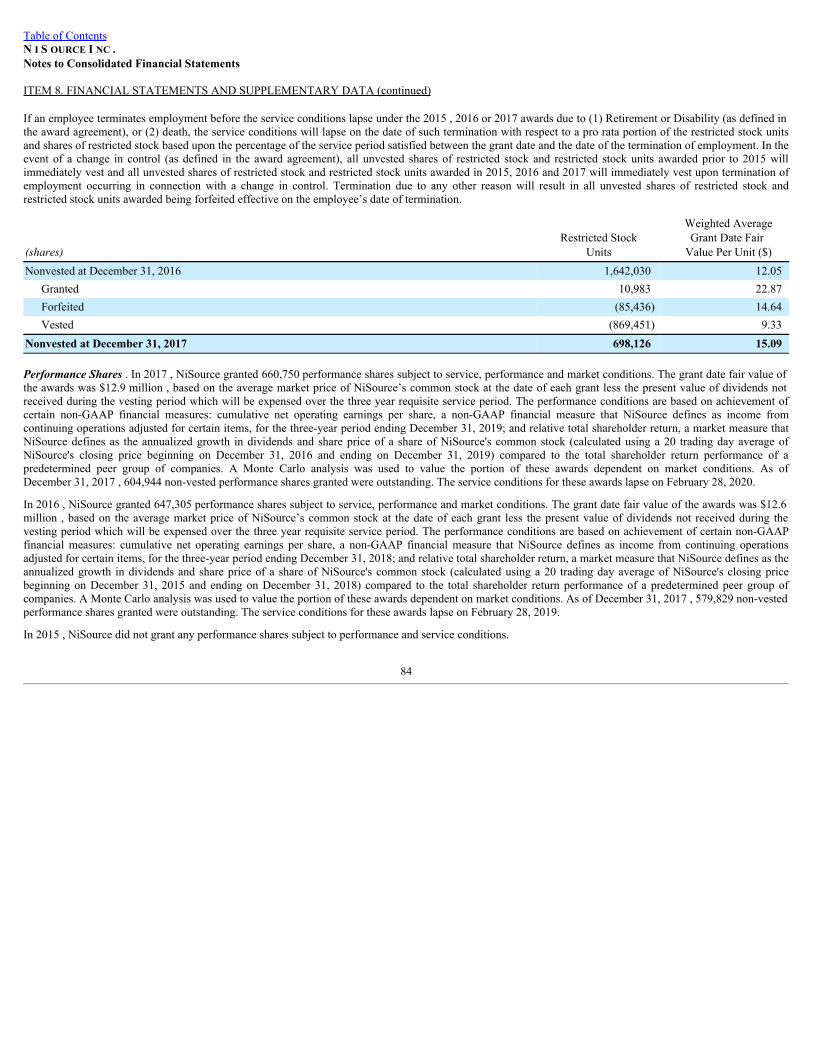
Table of ContentsN I S OURCE I NC .Notes to Consolidated Financial Statements
ITEM 8. FINANCIAL STATEMENTS AND SUPPLEMENTARY DATA (continued)
If an employee terminates employment before the service conditions lapse under the 2015 , 2016 or 2017 awards due to (1) Retirement or Disability (as defined inthe award agreement), or (2) death, the service conditions will lapse on the date of such termination with respect to a pro rata portion of the restricted stock unitsand shares of restricted stock based upon the percentage of the service period satisfied between the grant date and the date of the termination of employment. In theevent of a change in control (as defined in the award agreement), all unvested shares of restricted stock and restricted stock units awarded prior to 2015 willimmediately vest and all unvested shares of restricted stock and restricted stock units awarded in 2015, 2016 and 2017 will immediately vest upon termination ofemployment occurring in connection with a change in control. Termination due to any other reason will result in all unvested shares of restricted stock andrestricted stock units awarded being forfeited effective on the employee’s date of termination.
(shares)Restricted Stock
Units
Weighted AverageGrant Date Fair Value Per Unit ($)
Nonvested at December 31, 2016 1,642,030 12.05Granted 10,983 22.87Forfeited (85,436) 14.64Vested (869,451) 9.33
Nonvested at December 31, 2017 698,126 15.09
PerformanceShares. In 2017 , NiSource granted 660,750 performance shares subject to service, performance and market conditions. The grant date fair value ofthe awards was $12.9 million , based on the average market price of NiSource’s common stock at the date of each grant less the present value of dividends notreceived during the vesting period which will be expensed over the three year requisite service period. The performance conditions are based on achievement ofcertain non-GAAP financial measures: cumulative net operating earnings per share, a non-GAAP financial measure that NiSource defines as income fromcontinuing operations adjusted for certain items, for the three-year period ending December 31, 2019; and relative total shareholder return, a market measure thatNiSource defines as the annualized growth in dividends and share price of a share of NiSource's common stock (calculated using a 20 trading day average ofNiSource's closing price beginning on December 31, 2016 and ending on December 31, 2019) compared to the total shareholder return performance of apredetermined peer group of companies. A Monte Carlo analysis was used to value the portion of these awards dependent on market conditions. As ofDecember 31, 2017 , 604,944 non-vested performance shares granted were outstanding. The service conditions for these awards lapse on February 28, 2020.
In 2016 , NiSource granted 647,305 performance shares subject to service, performance and market conditions. The grant date fair value of the awards was $12.6million , based on the average market price of NiSource’s common stock at the date of each grant less the present value of dividends not received during thevesting period which will be expensed over the three year requisite service period. The performance conditions are based on achievement of certain non-GAAPfinancial measures: cumulative net operating earnings per share, a non-GAAP financial measure that NiSource defines as income from continuing operationsadjusted for certain items, for the three-year period ending December 31, 2018; and relative total shareholder return, a market measure that NiSource defines as theannualized growth in dividends and share price of a share of NiSource's common stock (calculated using a 20 trading day average of NiSource's closing pricebeginning on December 31, 2015 and ending on December 31, 2018) compared to the total shareholder return performance of a predetermined peer group ofcompanies. A Monte Carlo analysis was used to value the portion of these awards dependent on market conditions. As of December 31, 2017 , 579,829 non-vestedperformance shares granted were outstanding. The service conditions for these awards lapse on February 28, 2019.
In 2015 , NiSource did not grant any performance shares subject to performance and service conditions.
84
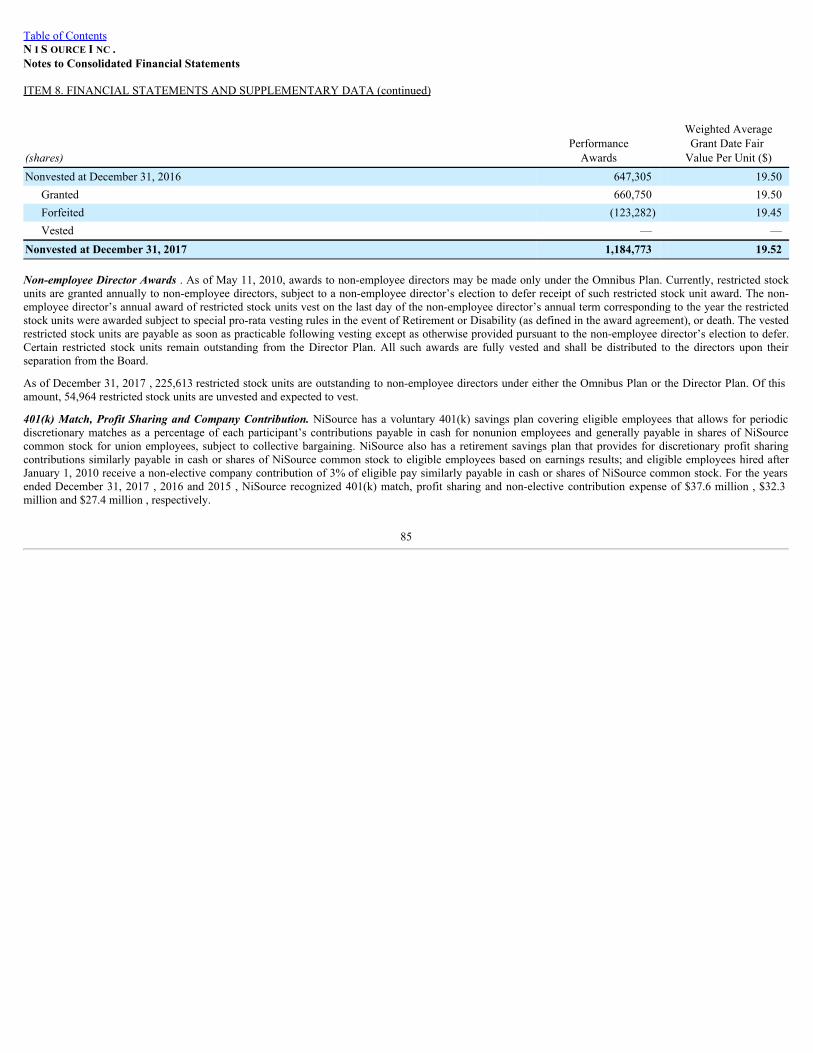
Table of ContentsN I S OURCE I NC .Notes to Consolidated Financial Statements
ITEM 8. FINANCIAL STATEMENTS AND SUPPLEMENTARY DATA (continued)
(shares)PerformanceAwards
Weighted AverageGrant Date Fair Value Per Unit ($)
Nonvested at December 31, 2016 647,305 19.50Granted 660,750 19.50Forfeited (123,282) 19.45Vested — —
Nonvested at December 31, 2017 1,184,773 19.52
Non-employeeDirectorAwards. As of May 11, 2010, awards to non-employee directors may be made only under the Omnibus Plan. Currently, restricted stockunits are granted annually to non-employee directors, subject to a non-employee director’s election to defer receipt of such restricted stock unit award. The non-employee director’s annual award of restricted stock units vest on the last day of the non-employee director’s annual term corresponding to the year the restrictedstock units were awarded subject to special pro-rata vesting rules in the event of Retirement or Disability (as defined in the award agreement), or death. The vestedrestricted stock units are payable as soon as practicable following vesting except as otherwise provided pursuant to the non-employee director’s election to defer.Certain restricted stock units remain outstanding from the Director Plan. All such awards are fully vested and shall be distributed to the directors upon theirseparation from the Board.
As of December 31, 2017 , 225,613 restricted stock units are outstanding to non-employee directors under either the Omnibus Plan or the Director Plan. Of thisamount, 54,964 restricted stock units are unvested and expected to vest.
401(k) Match, Profit SharingandCompanyContribution.NiSource has a voluntary 401(k) savings plan covering eligible employees that allows for periodicdiscretionary matches as a percentage of each participant’s contributions payable in cash for nonunion employees and generally payable in shares of NiSourcecommon stock for union employees, subject to collective bargaining. NiSource also has a retirement savings plan that provides for discretionary profit sharingcontributions similarly payable in cash or shares of NiSource common stock to eligible employees based on earnings results; and eligible employees hired afterJanuary 1, 2010 receive a non-elective company contribution of 3% of eligible pay similarly payable in cash or shares of NiSource common stock. For the yearsended December 31, 2017 , 2016 and 2015 , NiSource recognized 401(k) match, profit sharing and non-elective contribution expense of $37.6 million , $32.3million and $27.4 million , respectively.
85
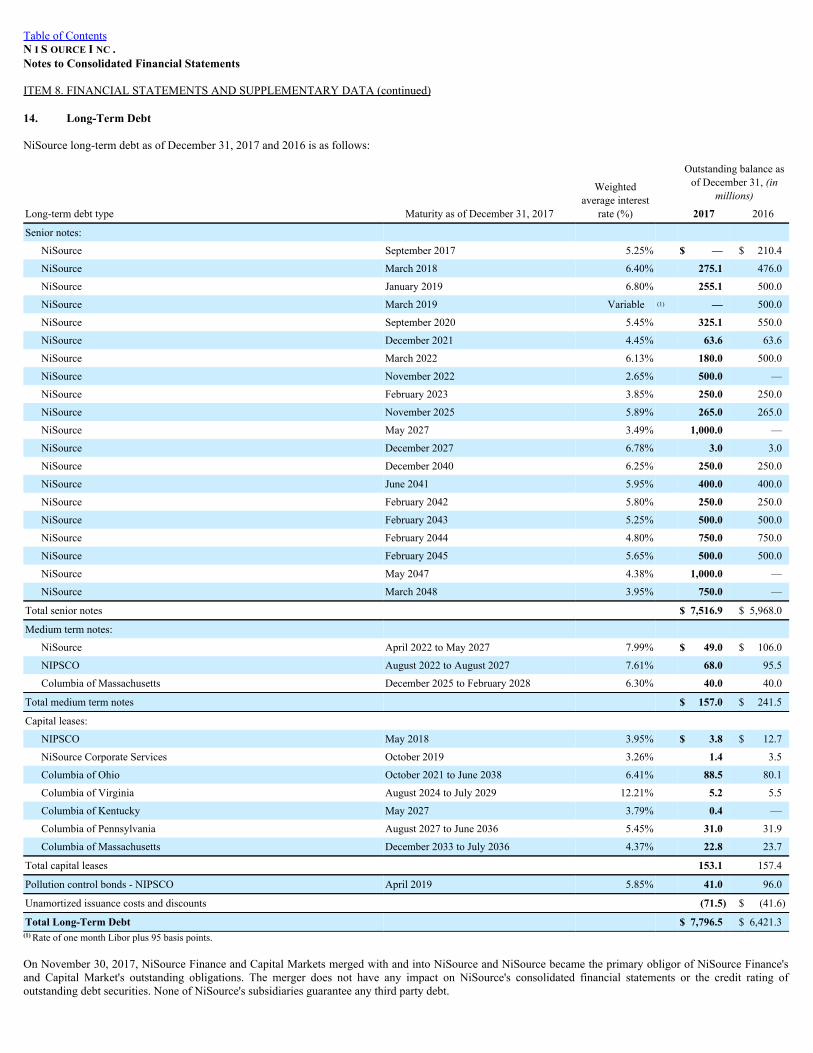
Table of ContentsN I S OURCE I NC .Notes to Consolidated Financial Statements
ITEM 8. FINANCIAL STATEMENTS AND SUPPLEMENTARY DATA (continued)
14. Long-Term Debt
NiSource long-term debt as of December 31, 2017 and 2016 is as follows:
Long-term debt type Maturity as of December 31, 2017
Weightedaverage interest
rate (%)
Outstanding balance asof December 31, (in
millions)
2017 2016
Senior notes: NiSource September 2017 5.25% $ — $ 210.4
NiSource March 2018 6.40% 275.1 476.0
NiSource January 2019 6.80% 255.1 500.0
NiSource March 2019 Variable (1) — 500.0
NiSource September 2020 5.45% 325.1 550.0
NiSource December 2021 4.45% 63.6 63.6
NiSource March 2022 6.13% 180.0 500.0
NiSource November 2022 2.65% 500.0 —
NiSource February 2023 3.85% 250.0 250.0
NiSource November 2025 5.89% 265.0 265.0
NiSource May 2027 3.49% 1,000.0 —
NiSource December 2027 6.78% 3.0 3.0
NiSource December 2040 6.25% 250.0 250.0
NiSource June 2041 5.95% 400.0 400.0
NiSource February 2042 5.80% 250.0 250.0
NiSource February 2043 5.25% 500.0 500.0
NiSource February 2044 4.80% 750.0 750.0
NiSource February 2045 5.65% 500.0 500.0
NiSource May 2047 4.38% 1,000.0 —
NiSource March 2048 3.95% 750.0 —
Total senior notes $ 7,516.9 $ 5,968.0
Medium term notes: NiSource April 2022 to May 2027 7.99% $ 49.0 $ 106.0
NIPSCO August 2022 to August 2027 7.61% 68.0 95.5
Columbia of Massachusetts December 2025 to February 2028 6.30% 40.0 40.0
Total medium term notes $ 157.0 $ 241.5
Capital leases: NIPSCO May 2018 3.95% $ 3.8 $ 12.7
NiSource Corporate Services October 2019 3.26% 1.4 3.5
Columbia of Ohio October 2021 to June 2038 6.41% 88.5 80.1
Columbia of Virginia August 2024 to July 2029 12.21% 5.2 5.5
Columbia of Kentucky May 2027 3.79% 0.4 —Columbia of Pennsylvania August 2027 to June 2036 5.45% 31.0 31.9
Columbia of Massachusetts December 2033 to July 2036 4.37% 22.8 23.7
Total capital leases 153.1 157.4
Pollution control bonds - NIPSCO April 2019 5.85% 41.0 96.0
Unamortized issuance costs and discounts (71.5) $ (41.6)
Total Long-Term Debt $ 7,796.5 $ 6,421.3(1) Rate of one month Libor plus 95 basis points.
On November 30, 2017, NiSource Finance and Capital Markets merged with and into NiSource and NiSource became the primary obligor of NiSource Finance'sand Capital Market's outstanding obligations. The merger does not have any impact on NiSource's consolidated financial statements or the credit rating ofoutstanding debt securities. None of NiSource's subsidiaries guarantee any third party debt.

86
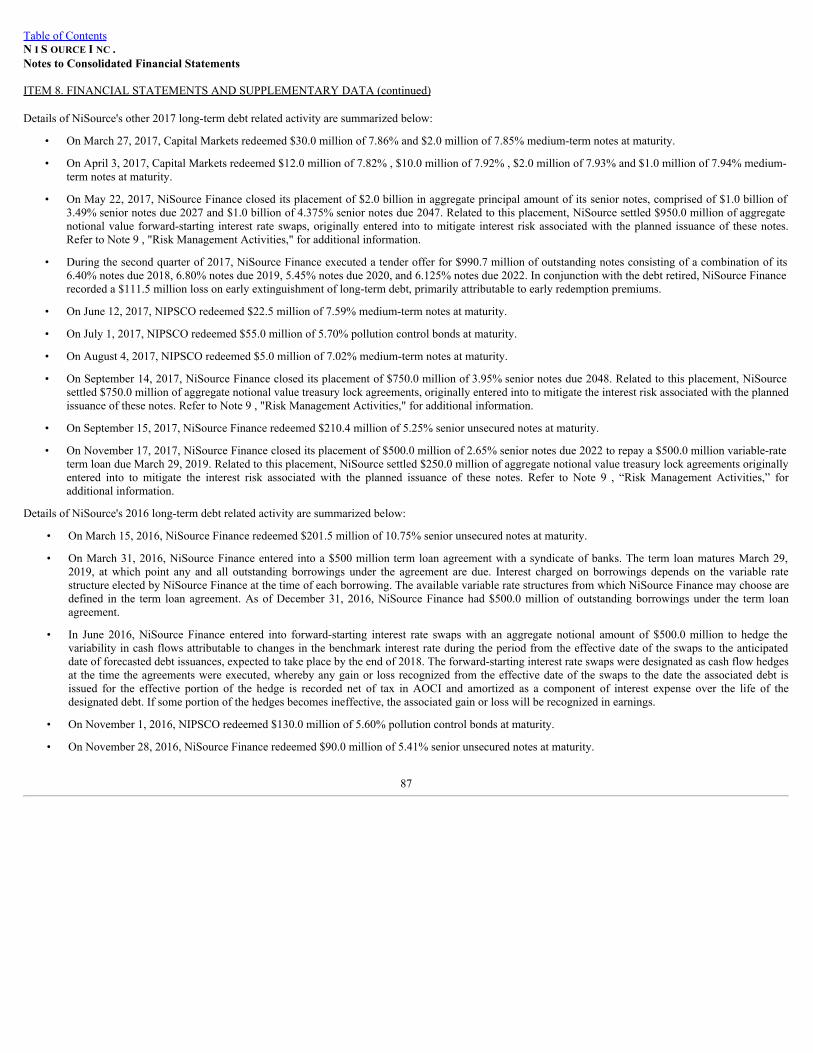
Table of ContentsN I S OURCE I NC .Notes to Consolidated Financial Statements
ITEM 8. FINANCIAL STATEMENTS AND SUPPLEMENTARY DATA (continued)
Details of NiSource's other 2017 long-term debt related activity are summarized below:
• On March 27, 2017, Capital Markets redeemed $30.0 million of 7.86% and $2.0 million of 7.85% medium-term notes at maturity.
• On April 3, 2017, Capital Markets redeemed $12.0 million of 7.82% , $10.0 million of 7.92% , $2.0 million of 7.93% and $1.0 million of 7.94% medium-term notes at maturity.
• On May 22, 2017, NiSource Finance closed its placement of $2.0 billion in aggregate principal amount of its senior notes, comprised of $1.0 billion of3.49% senior notes due 2027 and $1.0 billion of 4.375% senior notes due 2047. Related to this placement, NiSource settled $950.0 million of aggregatenotional value forward-starting interest rate swaps, originally entered into to mitigate interest risk associated with the planned issuance of these notes.Refer to Note 9 , "Risk Management Activities," for additional information.
• During the second quarter of 2017, NiSource Finance executed a tender offer for $990.7 million of outstanding notes consisting of a combination of its6.40% notes due 2018, 6.80% notes due 2019, 5.45% notes due 2020, and 6.125% notes due 2022. In conjunction with the debt retired, NiSource Financerecorded a $111.5 million loss on early extinguishment of long-term debt, primarily attributable to early redemption premiums.
• On June 12, 2017, NIPSCO redeemed $22.5 million of 7.59% medium-term notes at maturity.
• On July 1, 2017, NIPSCO redeemed $55.0 million of 5.70% pollution control bonds at maturity.
• On August 4, 2017, NIPSCO redeemed $5.0 million of 7.02% medium-term notes at maturity.
• On September 14, 2017, NiSource Finance closed its placement of $750.0 million of 3.95% senior notes due 2048. Related to this placement, NiSourcesettled $750.0 million of aggregate notional value treasury lock agreements, originally entered into to mitigate the interest risk associated with the plannedissuance of these notes. Refer to Note 9 , "Risk Management Activities," for additional information.
• On September 15, 2017, NiSource Finance redeemed $210.4 million of 5.25% senior unsecured notes at maturity.
• On November 17, 2017, NiSource Finance closed its placement of $500.0 million of 2.65% senior notes due 2022 to repay a $500.0 million variable-rateterm loan due March 29, 2019. Related to this placement, NiSource settled $250.0 million of aggregate notional value treasury lock agreements originallyentered into to mitigate the interest risk associated with the planned issuance of these notes. Refer to Note 9 , “Risk Management Activities,” foradditional information.
Details of NiSource's 2016 long-term debt related activity are summarized below:
• On March 15, 2016, NiSource Finance redeemed $201.5 million of 10.75% senior unsecured notes at maturity.
• On March 31, 2016, NiSource Finance entered into a $500 million term loan agreement with a syndicate of banks. The term loan matures March 29,2019, at which point any and all outstanding borrowings under the agreement are due. Interest charged on borrowings depends on the variable ratestructure elected by NiSource Finance at the time of each borrowing. The available variable rate structures from which NiSource Finance may choose aredefined in the term loan agreement. As of December 31, 2016, NiSource Finance had $500.0 million of outstanding borrowings under the term loanagreement.
• In June 2016, NiSource Finance entered into forward-starting interest rate swaps with an aggregate notional amount of $500.0 million to hedge thevariability in cash flows attributable to changes in the benchmark interest rate during the period from the effective date of the swaps to the anticipateddate of forecasted debt issuances, expected to take place by the end of 2018. The forward-starting interest rate swaps were designated as cash flow hedgesat the time the agreements were executed, whereby any gain or loss recognized from the effective date of the swaps to the date the associated debt isissued for the effective portion of the hedge is recorded net of tax in AOCI and amortized as a component of interest expense over the life of thedesignated debt. If some portion of the hedges becomes ineffective, the associated gain or loss will be recognized in earnings.
• On November 1, 2016, NIPSCO redeemed $130.0 million of 5.60% pollution control bonds at maturity.
• On November 28, 2016, NiSource Finance redeemed $90.0 million of 5.41% senior unsecured notes at maturity.
87
Table of ContentsN I S OURCE I NC .Notes to Consolidated Financial Statements
ITEM 8. FINANCIAL STATEMENTS AND SUPPLEMENTARY DATA (continued)
See Note 18 -A, "Contractual Obligations," for the outstanding long-term debt maturities at December 31, 2017 .
Unamortized debt expense, premium and discount on long-term debt applicable to outstanding bonds are being amortized over the life of such bonds.
NiSource is subject to a financial covenant under its revolving credit facility which requires NiSource to maintain a debt to capitalization ratio that does not exceed70% . A similar covenant in a 2005 private placement note purchase agreement requires NiSource to maintain a debt to capitalization ratio that does not exceed75% . As of December 31, 2017 , the ratio was 67.6% .
NiSource is also subject to certain other non-financial covenants under the revolving credit facility. Such covenants include a limitation on the creation or existenceof new liens on NiSource’s assets, generally exempting liens on utility assets, purchase money security interests, preexisting security interests and an additionalsubset of assets equal to $150 million . An asset sale covenant generally restricts the sale, conveyance, lease, transfer or other disposition of NiSource’s assets tothose dispositions that are for a price not materially less than fair market of such assets, that would not materially impair the ability of NiSource to performobligations under the revolving credit facility, and that together with all other such dispositions, would not have a material adverse effect. The covenant alsorestricts dispositions to no more than 10% of NiSource's consolidated total assets on December 31, 2015. The revolving credit facility also includes a cross-defaultprovision, which triggers an event of default under the credit facility in the event of an uncured payment default relating to any indebtedness of NiSource or any ofits subsidiaries in a principal amount of $50.0 million or more.
NiSource’s indentures generally do not contain any financial maintenance covenants. However, NiSource’s indentures are generally subject to cross-defaultprovisions ranging from uncured payment defaults of $5 million to $50 million , and limitations on the incurrence of liens on NiSource’s assets, generallyexempting liens on utility assets, purchase money security interests, preexisting security interests and an additional subset of assets capped at 10% of NiSource’sconsolidated net tangible assets.
15. Short-Term Borrowings
NiSource generates short-term borrowings from its revolving credit facility, commercial paper program, letter of credit issuances and accounts receivable transferprograms. Each of these borrowing sources is described further below.
NiSource maintains a revolving credit facility to fund ongoing working capital requirements, including the provision of liquidity support for its commercial paperprogram, provide for issuance of letters of credit and also for general corporate purposes. NiSource's revolving credit facility has a program limit of $1.85 billionand is comprised of a syndicate of banks led by Barclays. At December 31, 2017 and 2016, NiSource had no outstanding borrowings under this facility.
NiSource's commercial paper program has a program limit of up to $1.5 billion with a dealer group comprised of Barclays, Citigroup, Credit Suisse and WellsFargo. At December 31, 2017 and 2016 , NiSource had $869.0 million and $1,178.0 million , respectively, of commercial paper outstanding.
As of December 31, 2017 and 2016 , NiSource had $11.1 million and $14.7 million , respectively, of stand-by letters of credit outstanding all of which were underthe revolving credit facility.
Transfers of accounts receivable are accounted for as secured borrowings resulting in the recognition of short-term debt on the Consolidated Balance Sheets in theamount of $336.7 million and $310.0 million as of December 31, 2017 and 2016 , respectively. Refer to Note 17 , "Transfers of Financial Assets," for additionalinformation.
Short-term borrowings were as follows:
At December 31, (inmillions) 2017 2016Commercial Paper weighted average interest rate of 1.97 % and 1.24% at December 31, 2017 and 2016, respectively. $ 869.0 $ 1,178.0Accounts receivable securitization facility borrowings 336.7 310.0Total Short-Term Borrowings $ 1,205.7 $ 1,488.0
Given their maturities are less than 90 days, cash flows related to the borrowings and repayments of the items listed above are presented net in the Statements ofConsolidated Cash Flows.
88
Table of ContentsN I S OURCE I NC .Notes to Consolidated Financial Statements
ITEM 8. FINANCIAL STATEMENTS AND SUPPLEMENTARY DATA (continued)
16. Fair Value
A. Fair Value Measurements
RecurringFairValueMeasurements. The following tables present financial assets and liabilities measured and recorded at fair value on NiSource’s ConsolidatedBalance Sheets on a recurring basis and their level within the fair value hierarchy as of December 31, 2017 and December 31, 2016 :
Recurring Fair Value MeasurementsDecember 31, 2017 ( inmillions)
Quoted Pricesin Active Marketsfor Identical Assets
(Level 1)
Significant OtherObservable Inputs
(Level 2)
SignificantUnobservable
Inputs(Level 3)
Balance as ofDecember 31, 2017
Assets Risk management assets $ — $ 21.1 $ — $ 21.1Available-for-sale securities — 133.9 — 133.9
Total $ — $ 155.0 $ — $ 155.0Liabilities
Risk management liabilities $ — $ 71.4 $ 0.3 $ 71.7Total $ — $ 71.4 $ 0.3 $ 71.7
Recurring Fair Value MeasurementsDecember 31, 2016 ( inmillions)
Quoted Pricesin Active Marketsfor Identical Assets
(Level 1)
Significant OtherObservable Inputs
(Level 2)
SignificantUnobservable
Inputs(Level 3)
Balance as ofDecember 31, 2016
Assets Risk management assets $ 5.4 $ 43.6 $ — $ 49.0Available-for-sale securities — 131.5 — 131.5
Total $ 5.4 $ 175.1 $ — $ 180.5Liabilities
Risk management liabilities $ 1.2 $ 58.9 $ 1.2 $ 61.3Total $ 1.2 $ 58.9 $ 1.2 $ 61.3
Risk management assets and liabilities include interest rate swaps, exchange-traded NYMEX futures and NYMEX options and non-exchange-based forwardpurchase contracts. Exchange-traded derivative contracts are based on unadjusted quoted prices in active markets and are classified within Level 1. These financialassets and liabilities are secured with cash on deposit with the exchange; therefore, nonperformance risk has not been incorporated into these valuations. Certainnon-exchange-traded derivatives are valued using broker or over-the-counter, on-line exchanges. In such cases, these non-exchange-traded derivatives areclassified within Level 2. Non-exchange-based derivative instruments include swaps, forwards, options and treasury lock agreements. In certain instances, theseinstruments may utilize models to measure fair value. NiSource uses a similar model to value similar instruments. Valuation models utilize various inputs thatinclude quoted prices for similar assets or liabilities in active markets, quoted prices for identical or similar assets or liabilities in markets that are not active, otherobservable inputs for the asset or liability and market-corroborated inputs, (i.e., inputs derived principally from or corroborated by observable market data bycorrelation or other means). Where observable inputs are available for substantially the full term of the asset or liability, the instrument is categorized within Level2. Certain derivatives trade in less active markets with a lower availability of pricing information and models may be utilized in the valuation. When such inputshave a significant impact on the measurement of fair value, the instrument is categorized within Level 3. Credit risk is considered in the fair value calculation ofderivative instruments that are not exchange-traded. Credit exposures are adjusted to reflect collateral agreements which reduce exposures. As of
89
Table of ContentsN I S OURCE I NC .Notes to Consolidated Financial Statements
ITEM 8. FINANCIAL STATEMENTS AND SUPPLEMENTARY DATA (continued)
December 31, 2017 and 2016 , there were no material transfers between fair value hierarchies. Additionally, there were no changes in the method or significantassumptions used to estimate the fair value of NiSource’s financial instruments.
NiSource has entered into forward-starting interest rate swaps to hedge the interest rate risk on coupon payments of forecasted issuances of long-term debt. Thesederivatives are designated as cash flow hedges. Credit risk is considered in the fair value calculation of each agreement. As they are based on observable data andvaluations of similar instruments, the hedges are categorized within Level 2 of the fair value hierarchy. There was no exchange of premium at the initial date of theswaps and treasury lock agreements, and NiSource can settle the contracts at any time. For additional information see Note 9 , "Risk Management Activities."
NIPSCO has entered into long-term forward natural gas purchase instruments that range from five to ten years to lock in a fixed price for its natural gas customers.NiSource values these contracts using a pricing model that incorporates market-based information when available, as these instruments trade less frequently andare classified within Level 2 of the fair value hierarchy. For additional information see Note 9 , “Risk Management Activities.”
Available-for-sale securities are investments pledged as collateral for trust accounts related to NiSource’s wholly-owned insurance company. Available-for-salesecurities are included within “Other investments” in the Consolidated Balance Sheets. NiSource values U.S. Treasury, corporate and mortgage-backed securitiesusing a matrix pricing model that incorporates market-based information. These securities trade less frequently and are classified within Level 2. Total unrealizedgains and losses from available-for-sale securities are included in other comprehensive income. The amortized cost, gross unrealized gains and losses and fair valueof available-for-sale securities at December 31, 2017 and 2016 were:
December 31, 2017 (inmillions)Amortized
Cost
GrossUnrealized
Gains
GrossUnrealized
Losses Fair ValueAvailable-for-sale securities
U.S. Treasury debt securities $ 26.9 $ — $ (0.1) $ 26.8Corporate/Other debt securities 106.8 0.9 (0.6) 107.1
Total $ 133.7 $ 0.9 $ (0.7) $ 133.9
December 31, 2016 (inmillions)Amortized
Cost
GrossUnrealized
Gains
GrossUnrealized
Losses Fair ValueAvailable-for-sale securities
U.S. Treasury debt securities $ 35.0 $ 0.1 $ (0.6) $ 34.5Corporate/Other debt securities 98.7 0.3 (2.0) 97.0
Total $ 133.7 $ 0.4 $ (2.6) $ 131.5
Realized gains and losses on available-for-sale securities were immaterial for the year-ended December 31, 2017 and 2016.
The cost of maturities sold is based upon specific identification. At December 31, 2017 , approximately $13.7 million of U.S. Treasury debt securities andapproximately $ 2.9 million of Corporate/Other debt securities have maturities of less than a year.
There are no material items in the fair value reconciliation of Level 3 assets and liabilities measured at fair value on a recurring basis for the years endedDecember 31, 2017 and 2016 .
Non-recurring Fair Value Measurements . There were no significant non-recurring fair value measurements recorded during the twelve months endedDecember 31, 2017 .
B. Other Fair Value Disclosures for Financial Instruments . The carrying amount of cash and cash equivalents, restricted cash, notes receivable, customerdeposits and short-term borrowings is a reasonable estimate of fair value due to their liquid or short-term nature. NiSource’s long-term borrowings are recorded athistorical amounts.
The following method and assumptions were used to estimate the fair value of each class of financial instruments.
Long-termdebt. The fair values of outstanding long-term debt is estimated based on the quoted market prices for the same or similar securities. Certain premiumcosts associated with the early settlement of long-term debt are not taken into consideration
90
Table of ContentsN I S OURCE I NC .Notes to Consolidated Financial Statements
ITEM 8. FINANCIAL STATEMENTS AND SUPPLEMENTARY DATA (continued)
in determining fair value. These fair value measurements are classified within Level 2 of the fair value hierarchy. For the years ended December 31, 2017 and 2016, there was no change in the method or significant assumptions used to estimate the fair value of long-term debt.
The carrying amount and estimated fair values of these financial instruments were as follows:
At December 31, (inmillions)
CarryingAmount
2017
EstimatedFair Value
2017
CarryingAmount2016
EstimatedFair Value2016
Long-term debt (including current portion) $ 7,796.5 $ 8,603.4 $ 6,421.3 $ 7,064.1
17. Transfers of Financial Assets
Columbia of Ohio, NIPSCO and Columbia of Pennsylvania each maintain a receivables agreement whereby they transfer their customer accounts receivables tothird party financial institutions through wholly-owned and consolidated special purpose entities. The three agreements expire between March 2018 and October2018 and may be further extended if mutually agreed to by the parties thereto.
All receivables transferred to third parties are valued at face value, which approximates fair value due to their short-term nature. The amount of the undividedpercentage ownership interest in the accounts receivables transferred is determined in part by required loss reserves under the agreements.
Transfers of accounts receivable are accounted for as secured borrowings resulting in the recognition of short-term borrowings on the Consolidated Balance Sheets.As of December 31, 2017 , the maximum amount of debt that could be recognized related to NiSource’s accounts receivable programs is $375.0 million .
The following table reflects the gross receivables balance and net receivables transferred as well as short-term borrowings related to the securitization transactionsas of December 31, 2017 and 2016 :
(inmillions)December 31,
2017 December 31,
2016Gross Receivables $ 635.3 $ 618.3Less: Receivables not transferred 298.6 308.3Net receivables transferred $ 336.7 $ 310.0Short-term debt due to asset securitization $ 336.7 $ 310.0
During 2017 and 2016 , $26.7 million and $64.0 million , respectively, was recorded as cash flows from financing activities related to the change in short-termborrowings due to securitization transactions. Fees associated with the securitization transactions were $2.5 million , $2.3 million and $2.5 million for the yearsended December 31, 2017 , 2016 and 2015, respectively. NiSource remains responsible for collecting on the receivables securitized and the receivables cannot betransferred to another party.
91
Table of ContentsN I S OURCE I NC .Notes to Consolidated Financial Statements
ITEM 8. FINANCIAL STATEMENTS AND SUPPLEMENTARY DATA (continued)
18. Other Commitments and Contingencies
A. Contractual Obligations . NiSource has certain contractual obligations requiring payments at specified periods. The obligations include long-term debt, leaseobligations, energy commodity contracts and obligations for various services including pipeline capacity and outsourcing of IT services. The total contractualobligations in existence at December 31, 2017 and their maturities were:
(inmillions) Total 2018 2019 2020 2021 2022 AfterLong-term debt (1) $ 7,714.9 $ 275.1 296.1 $ 296.1 $ 325.1 $ 63.6 $ 710.0 $ 6,045.0Capital leases (2) 254.4 18.1 15.7 15.4 15.5 15.5 174.2Interest payments on long-term debt 6,701.2 364.4 344.4 334.6 316.8 307.7 5,033.3Operating leases (3) 57.2 13.8 10.2 7.3 6.2 4.4 15.3Energy commodity contracts 216.7 102.5 57.3 56.9 — — —Service obligations:
Pipeline service obligations 2,649.9 538.9 520.5 390.7 344.7 331.0 524.1IT service obligations 311.5 88.3 71.5 63.5 50.7 37.5 —Other service obligations 178.2 48.3 43.3 43.3 43.3 — —
Other liabilities 28.7 28.7 — — — — —Total contractual obligations $ 18,112.7 $ 1,478.1 $ 1,359.0 $ 1,236.8 $ 840.8 $ 1,406.1 $ 11,791.9
(1) Long-term debt balance excludes unamortized issuance costs and discounts of $71.5 million.(2) Capital lease payments shown above are inclusive of interest totaling $91.9 million.(3) Operating lease balances do not include amounts for fleet leases that can be renewed beyond the initial lease term. The Company anticipates renewing the leases beyond the initial term, butthe anticipated payments associated with the renewals do not meet the definition of expected minimum lease payments and therefore are not included above. Expected payments are $29.3million in 2018, $27.5 million in 2019, $19.7 million in 2020, $13.9 million in 2021, $9.6 million in 2022 and $7.4 million thereafter.
OperatingandCapital LeaseCommitments.NiSource leases assets in several areas of its operations including fleet vehicles and equipment, rail cars for coaldelivery and certain operations centers. Payments made in connection with operating leases were $ 49.5 million in 2017 , $ 52.0 million in 2016 and $ 47.5 millionin 2015 , and are primarily charged to operation and maintenance expense as incurred. Capital lease assets and related accumulated depreciation included in theConsolidated Balance Sheets were $ 171.2 million and $ 32.4 million at December 31, 2017 , and $ 167.0 million and $ 20.6 million at December 31, 2016 ,respectively.
Included in capital leases are the adjusted payments for the NIPSCO service agreement with Pure Air. Refer to section E, "Other Matters," below for additionalinformation.
Purchase and Service Obligations.NiSource has entered into various purchase and service agreements whereby NiSource is contractually obligated to makecertain minimum payments in future periods. NiSource’s purchase obligations are for the purchase of physical quantities of natural gas, electricity and coal.NiSource’s service agreements encompass a broad range of business support and maintenance functions which are generally described below.
NiSource’s subsidiaries have entered into various energy commodity contracts to purchase physical quantities of natural gas, electricity and coal. These amountsrepresent minimum quantities of these commodities NiSource is obligated to purchase at both fixed and variable prices. To the extent contractual purchase pricesare variable, obligations disclosed in the table above are valued at market prices as of December 31, 2017.
In July 2008, the IURC issued an order approving NIPSCO’s purchase power agreements with subsidiaries of Iberdrola Renewables, Buffalo Ridge I LLC andBarton Windpower LLC. These agreements provide NIPSCO the opportunity and obligation to purchase up to 100 mw of wind power generated commencing inearly 2009. The contracts extend 15 and 20 years, representing 50 mw of wind power each. No minimum quantities are specified within these agreements due tothe variability of electricity generation from wind, so no amounts related to these contracts are included in the table above. Upon any termination of the agreementsby NIPSCO for any reason (other than material breach by Buffalo Ridge I LLC or Barton Windpower LLC), NIPSCO may be required to pay a termination chargethat could be material depending on the events giving rise to termination and the timing of the termination. NIPSCO began purchasing wind power in April 2009.
92
Table of ContentsN I S OURCE I NC .Notes to Consolidated Financial Statements
ITEM 8. FINANCIAL STATEMENTS AND SUPPLEMENTARY DATA (continued)
NiSource has pipeline service agreements that provide for pipeline capacity, transportation and storage services. These agreements, which have expiration datesranging from 2018 to 2045 , require NiSource to pay fixed monthly charges.
NIPSCO has contracts with three major rail operators providing for coal transportation services for which there are certain minimum payments. These servicecontracts extend for various periods through 2021 .
On December 31, 2013, NiSource Corporate Services Company signed a seven-year agreement with IBM to continue to provide business process and supportfunctions to NiSource under a combination of fixed and variable charges, with the variable charges fluctuating based on the actual need for such services. Theagreement was effective January 1, 2014 with a commencement date of April 1, 2014.
In April 2017, NiSource initiated a process to terminate its agreement with IBM and began negotiating contracts with IT service providers other than IBM.NiSource reached an agreement with IBM resolving all termination issues under the service agreement in the fourth quarter of 2017. Liabilities recorded related totermination charges as of December 31, 2017 are not material to the Consolidated Financial Statements.
In May and June 2017, NiSource executed agreements with new IT service providers. The new agreements have terms ending at various dates throughout 2022.Transition of responsibilities from IBM to the new service providers was substantially complete as of the end of 2017. Costs associated with transition activities,including legal and consulting fees, were expensed as incurred.
B. Guarantees and Indemnities . As a part of normal business, NiSource and certain subsidiaries enter into various agreements providing financial orperformance assurance to third parties on behalf of certain subsidiaries. Such agreements include guarantees and stand-by letters of credit. These agreements areentered into primarily to support or enhance the creditworthiness otherwise attributed to a subsidiary on a stand-alone basis, thereby facilitating the extension ofsufficient credit to accomplish the subsidiaries’ intended commercial purposes. At December 31, 2017 and 2016, NiSource had issued stand-by letters of credit of$11.1 million and $14.7 million , respectively, for the benefit of third parties.
C. Legal Proceedings . The Company is party to certain claims and legal proceedings arising in the ordinary course of business, none of which is deemed tobe individually material at this time. Due to the inherent uncertainty of litigation, there can be no assurance that the resolution of any particular claim or proceedingwould not have a material adverse effect on the Company’s results of operations, financial position or liquidity. If one or more of such matters were decidedagainst the Company, the effects could be material to the Company’s results of operations in the period in which the Company would be required to record oradjust the related liability and could also be material to the Company’s cash flows in the periods the Company would be required to pay such liability.
D. Environmental Matters . NiSource operations are subject to environmental statutes and regulations related to air quality, water quality, hazardous wasteand solid waste. NiSource believes that it is in substantial compliance with the environmental regulations currently applicable to its operations.
It is management's continued intent to address environmental issues in cooperation with regulatory authorities in such a manner as to achieve mutually acceptablecompliance plans. However, there can be no assurance that fines and penalties will not be incurred. Management expects a significant portion of environmentalassessment and remediation costs to be recoverable through rates for certain NiSource companies.
As of December 31, 2017 and 2016 , NiSource had recorded a liability of $111.4 million to cover environmental remediation at various sites. The current portionof this liability is included in "Legal and environmental" in the Consolidated Balance Sheets. The noncurrent portion is included in "Other noncurrent liabilities" inthe Consolidated Balance Sheets. NiSource recognizes costs associated with environmental remediation obligations when the incurrence of such costs is probableand the amounts can be reasonably estimated. The original estimates for remediation activities may differ materially from the amount ultimately expended. Theactual future expenditures depend on many factors, including currently enacted laws and regulations, the nature and extent of impact, the method of remediationand the availability of cost recovery. These expenditures are not currently estimable at some sites. NiSource periodically adjusts its liability as information iscollected and estimates become more refined.
Electric Operations' compliance estimates disclosed below are reflective of NIPSCO's Integrated Resource Plan submitted to the IURC on November 1, 2016. Seesection E, "Other Matters," below for additional information.
93
Table of ContentsN I S OURCE I NC .Notes to Consolidated Financial Statements
ITEM 8. FINANCIAL STATEMENTS AND SUPPLEMENTARY DATA (continued)
AirThe actions listed below could require further reductions in emissions from various emission sources. NiSource will continue to closely monitor developments inthese matters.
Future legislative and regulatory programs could significantly limit allowed GHG emissions or impose a cost or tax on GHG emissions. Additionally, rules thatincrease methane leak detection, require emission reductions or impose additional requirements for natural gas facilities could restrict GHG emissions and imposeadditional costs. NiSource will carefully monitor all GHG reduction proposals and regulations.
CleanPowerPlan.On October 23, 2015, the EPA issued a final rule to regulate CO 2 emissions from existing fossil-fuel EGUs under section 111(d) of the CAA.The final rule establishes national CO 2 emission-rate standards that are applied to each state’s mix of affected EGUs to establish state-specific emission-rate andmass-emission limits. The final rule requires each state to submit a plan indicating how the state will meet the EPA's emission-rate or mass-emission limit,including possibly imposing reduction obligations on specific units. If a state does not submit a satisfactory plan, the EPA will impose a federal plan on that state.
On February 9, 2016, the U.S. Supreme Court stayed implementation of the CPP until litigation is decided on its merits. On October 16, 2017, the EPA publishedin the Federal Register a Notice of Proposed Rulemaking that would repeal the CPP. The public will have until April 26, 2018 to comment on this proposal, afterwhich time the proposal may become final. On December 28, 2017, in a separate but related action, the EPA published an Advanced Notice of ProposedRulemaking in the Federal Register to solicit information from the public about a potential future rulemaking to limit greenhouse gas emissions from existingfossil-fuel EGUs. The public will have until February 26, 2018 to comment on the proposal. NIPSCO will continue to monitor this matter and cannot estimate itsimpact at this time. Should costs be incurred to comply with the CPP, NIPSCO believes such costs will be eligible for recovery through customer rates.
WasteCERCLA.NiSource subsidiaries are potentially responsible parties at waste disposal sites under the CERCLA (commonly known as Superfund) and similar statelaws. Under CERCLA, each potentially responsible party can be held jointly, severally and strictly liable for the remediation costs as the EPA, or state, can allowthe parties to pay for remedial action or perform remedial action themselves and request reimbursement from the potentially responsible parties. NiSource’saffiliates have retained CERCLA environmental liabilities, including remediation liabilities, associated with certain current and former operations. These liabilitiesare not material to the Consolidated Financial Statements.
MGP.A program has been instituted to identify and investigate former MGP sites where Gas Distribution Operations subsidiaries or predecessors may haveliability. The program has identified sixty-four such sites where liability is probable. Remedial actions at many of these sites are being overseen by state or federalenvironmental agencies through consent agreements or voluntary remediation agreements.
NiSource utilizes a probabilistic model to estimate its future remediation costs related to its MGP sites. The model was prepared with the assistance of a third partyand incorporates NiSource and general industry experience with remediating MGP sites. NiSource completes an annual refresh of the model in the second quarterof each fiscal year. No material changes to the estimated future remediation costs were noted as a result of the refresh completed as of June 30, 2017. The totalestimated liability at NiSource related to the facilities subject to remediation was $106.9 million and $105.5 million at December 31, 2017 and 2016 , respectively.The liability represents NiSource’s best estimate of the probable cost to remediate the facilities. NiSource believes that it is reasonably possible that remediationcosts could vary by as much as $25 million in addition to the costs noted above. Remediation costs are estimated based on the best available information,applicable remediation standards at the balance sheet date, and experience with similar facilities.
CCRs.On April 17, 2015, the EPA issued a final rule for regulation of CCRs. The rule regulates CCRs under the RCRA Subtitle D, which determines them to benonhazardous. The rule is implemented in phases and requires increased groundwater monitoring, reporting, recordkeeping and posting of related information tothe Internet. The rule also establishes requirements related to CCR management and disposal. The rule will allow NIPSCO to continue its byproduct beneficial useprogram.
The publication of the CCR rule resulted in revisions to previously recorded legal obligations associated with the retirement of certain NIPSCO facilities. Theactual asset retirement costs related to the CCR rule may vary substantially from the estimates used to record the increased asset retirement obligation due to theuncertainty about the compliance strategies that will be used and the preliminary nature of available data used to estimate costs. In addition, to comply with therule, NIPSCO will be required to incur future capital expenditures to modify its infrastructure and manage CCRs. Capital compliance costs are currently expectedto total
94
Table of ContentsN I S OURCE I NC .Notes to Consolidated Financial Statements
ITEM 8. FINANCIAL STATEMENTS AND SUPPLEMENTARY DATA (continued)
approximately $193 million . As allowed by the EPA, NIPSCO will continue to collect data over time to determine the specific compliance solutions andassociated costs and, as a result, the actual costs may vary.
NIPSCO filed a petition on November 1, 2016 with the IURC seeking approval of the projects and recovery of the costs associated with CCR compliance. On June9, 2017, NIPSCO filed with the IURC a settlement reached with certain parties regarding the CCR projects and treatment of associated costs. The IURC approvedthe settlement in an order on December 13, 2017.
WaterELG.On November 3, 2015, the EPA issued a final rule to amend the ELG and standards for the Steam Electric Power Generating category. The final rule becameeffective January 4, 2016. The rule imposes new water treatment and discharge requirements on NIPSCO's electric generating facilities to be applied between 2018and 2023. On April 25, 2017, the EPA published notice in the Federal Register that the EPA is reconsidering the ELG in response to several petitions forreconsideration. On September 18, 2017, the EPA published notice in the Federal Register their intention to postpone the earliest compliance dates for flue gasdesulfurization wastewater and bottom ash transport water requirements to potentially consider revisions to technology and numeric limits achievable. NIPSCO isunable to estimate the impact of the postponement of these compliance dates at this time. Based upon a preliminary engineering study, capital compliance costs arecurrently expected to cost approximately $170 million . On November 1, 2016, NIPSCO filed a petition with the IURC seeking approval of the projects andrecovery of the costs associated with ELG compliance. Given the current postponement of certain compliance dates under the ELG rule, NIPSCO has agreed withthe settling parties as part of the settlement agreement discussed in the "CCRs" subsection above, that these ELG projects and related costs would be addressed in alater proceeding.
E. Other Matters.
NIPSCO2016IntegratedResourcePlan.Environmental, regulatory and economic factors, including low natural gas prices and aging coal-fired units, have ledNIPSCO to pursue modification of its current electric generation supply mix to include less coal-fired generation. Due to enacted CCR and ELG (subsequentlypostponed) regulations, NIPSCO would expect to have incurred over $1 billion in operating, maintenance, environmental and other costs if the current fleet ofcoal-fired generating units were to remain operational.
On November 1, 2016, NIPSCO submitted its 2016 Integrated Resource Plan with the IURC. The plan evaluated demand-side and supply-side resourcealternatives to reliably and cost effectively meet NIPSCO customers' future energy requirements over the ensuing 20 years. The 2016 Integrated Resource Planindicates that the most viable option for customers and NIPSCO involves the retirement of Bailly Generating Station (Units 7 and 8) as soon as mid-2018 and twounits (Units 17 and 18) at the R.M. Schahfer Generating Station by the end of 2023. It is projected over the long term that the cost to customers to retire these unitsat these dates will be lower than maintaining and upgrading them for continuing generation.
NiSource and NIPSCO committed to the retirement of the Bailly Generating Station units in connection with the filing of the 2016 Integrated Resource Plan,pending approval by the MISO. In the fourth quarter of 2016, the MISO approved NIPSCO's plan to retire the Bailly Generating Station units by May 31, 2018. Inaccordance with ASC 980-360, the remaining net book value of the Bailly Generating Station units was reclassified from "Net utility plant" to "Other property, atcost, less accumulated depreciation" on the Consolidated Balance Sheets.
In connection with the MISO's approval of NIPSCO's planned retirement of the Bailly Generating Station units, NiSource recorded $22.1 million of plantretirement-related charges in the fourth quarter of 2016. These charges were comprised of contract termination charges related to NIPSCO's capital lease with PureAir (discussed further below), voluntary employee severance benefits, and write downs of certain materials and supplies inventory balances. These charges arepresented within "Operation and maintenance" on the Statements of Consolidated Income.
On February 1, 2018, as previously approved by the MISO, NIPSCO commenced a four-month outage of Bailly Generating Station Unit 8 in order to begin workon converting the unit to a synchronous condenser (a piece of equipment designed to maintain voltage to ensure continued reliability on the transmission system).Refer to Note 25, "Subsequent Event," for additional information.
NIPSCOPureAir.NIPSCO has a service agreement with Pure Air, a general partnership between Air Products and Chemicals, Inc. and First Air Partners LP,under which Pure Air provides scrubber services to reduce sulfur dioxide emissions for Units 7 and 8 at the Bailly Generating Station. Services under this contractcommenced on July 1, 1992 and expired on June 30, 2012. The agreement was renewed effective July 1, 2012 for ten years requiring NIPSCO to pay for theservices under a combination of fixed and variable charges. NiSource has made an exhaustive effort to obtain information needed from Pure Air to determine thestatus of Pure Air as a VIE. However, NIPSCO has not been able to obtain this information and, as a result, it is unclear whether
95
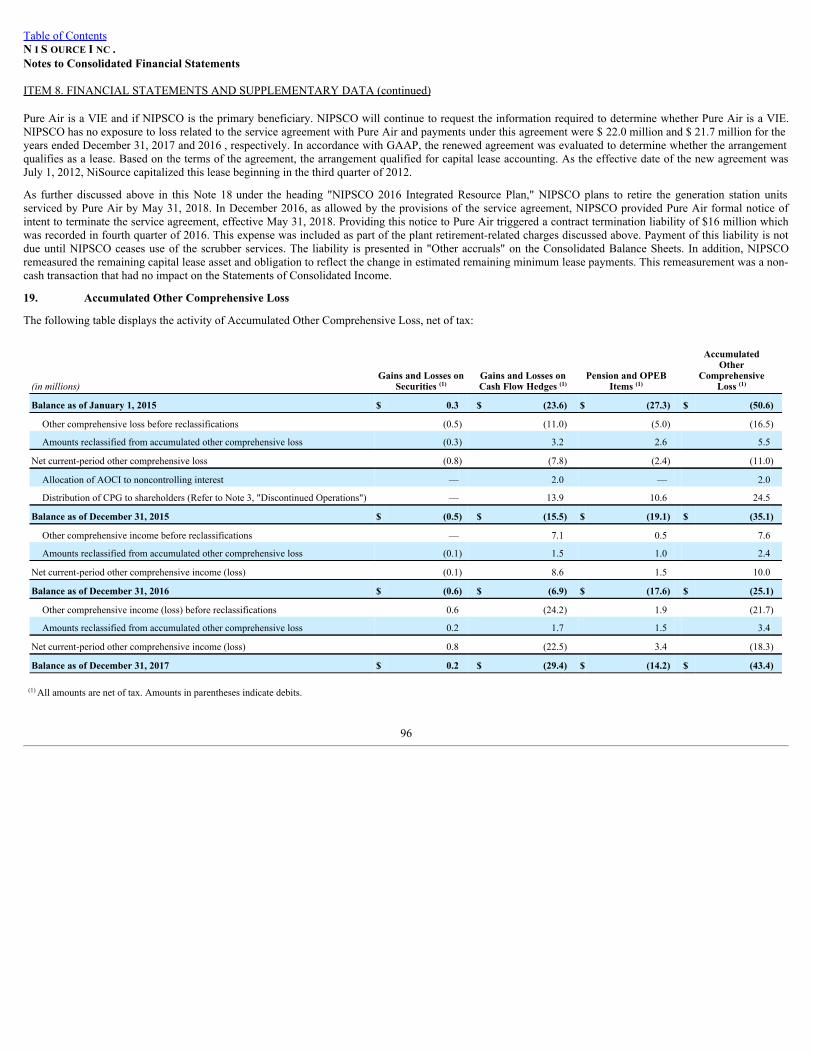
Table of ContentsN I S OURCE I NC .Notes to Consolidated Financial Statements
ITEM 8. FINANCIAL STATEMENTS AND SUPPLEMENTARY DATA (continued)
Pure Air is a VIE and if NIPSCO is the primary beneficiary. NIPSCO will continue to request the information required to determine whether Pure Air is a VIE.NIPSCO has no exposure to loss related to the service agreement with Pure Air and payments under this agreement were $ 22.0 million and $ 21.7 million for theyears ended December 31, 2017 and 2016 , respectively. In accordance with GAAP, the renewed agreement was evaluated to determine whether the arrangementqualifies as a lease. Based on the terms of the agreement, the arrangement qualified for capital lease accounting. As the effective date of the new agreement wasJuly 1, 2012, NiSource capitalized this lease beginning in the third quarter of 2012.
As further discussed above in this Note 18 under the heading "NIPSCO 2016 Integrated Resource Plan," NIPSCO plans to retire the generation station unitsserviced by Pure Air by May 31, 2018. In December 2016, as allowed by the provisions of the service agreement, NIPSCO provided Pure Air formal notice ofintent to terminate the service agreement, effective May 31, 2018. Providing this notice to Pure Air triggered a contract termination liability of $16 million whichwas recorded in fourth quarter of 2016. This expense was included as part of the plant retirement-related charges discussed above. Payment of this liability is notdue until NIPSCO ceases use of the scrubber services. The liability is presented in "Other accruals" on the Consolidated Balance Sheets. In addition, NIPSCOremeasured the remaining capital lease asset and obligation to reflect the change in estimated remaining minimum lease payments. This remeasurement was a non-cash transaction that had no impact on the Statements of Consolidated Income.
19. Accumulated Other Comprehensive Loss
The following table displays the activity of Accumulated Other Comprehensive Loss, net of tax:
(inmillions)Gains and Losses on
Securities (1) Gains and Losses onCash Flow Hedges (1)
Pension and OPEBItems (1)
AccumulatedOther
ComprehensiveLoss (1)
Balance as of January 1, 2015 $ 0.3 $ (23.6) $ (27.3) $ (50.6)
Other comprehensive loss before reclassifications (0.5) (11.0) (5.0) (16.5)
Amounts reclassified from accumulated other comprehensive loss (0.3) 3.2 2.6 5.5
Net current-period other comprehensive loss (0.8) (7.8) (2.4) (11.0)
Allocation of AOCI to noncontrolling interest — 2.0 — 2.0
Distribution of CPG to shareholders (Refer to Note 3, "Discontinued Operations") — 13.9 10.6 24.5
Balance as of December 31, 2015 $ (0.5) $ (15.5) $ (19.1) $ (35.1)
Other comprehensive income before reclassifications — 7.1 0.5 7.6
Amounts reclassified from accumulated other comprehensive loss (0.1) 1.5 1.0 2.4
Net current-period other comprehensive income (loss) (0.1) 8.6 1.5 10.0
Balance as of December 31, 2016 $ (0.6) $ (6.9) $ (17.6) $ (25.1)
Other comprehensive income (loss) before reclassifications 0.6 (24.2) 1.9 (21.7)
Amounts reclassified from accumulated other comprehensive loss 0.2 1.7 1.5 3.4
Net current-period other comprehensive income (loss) 0.8 (22.5) 3.4 (18.3)
Balance as of December 31, 2017 $ 0.2 $ (29.4) $ (14.2) $ (43.4)
(1) All amounts are net of tax. Amounts in parentheses indicate debits.
96
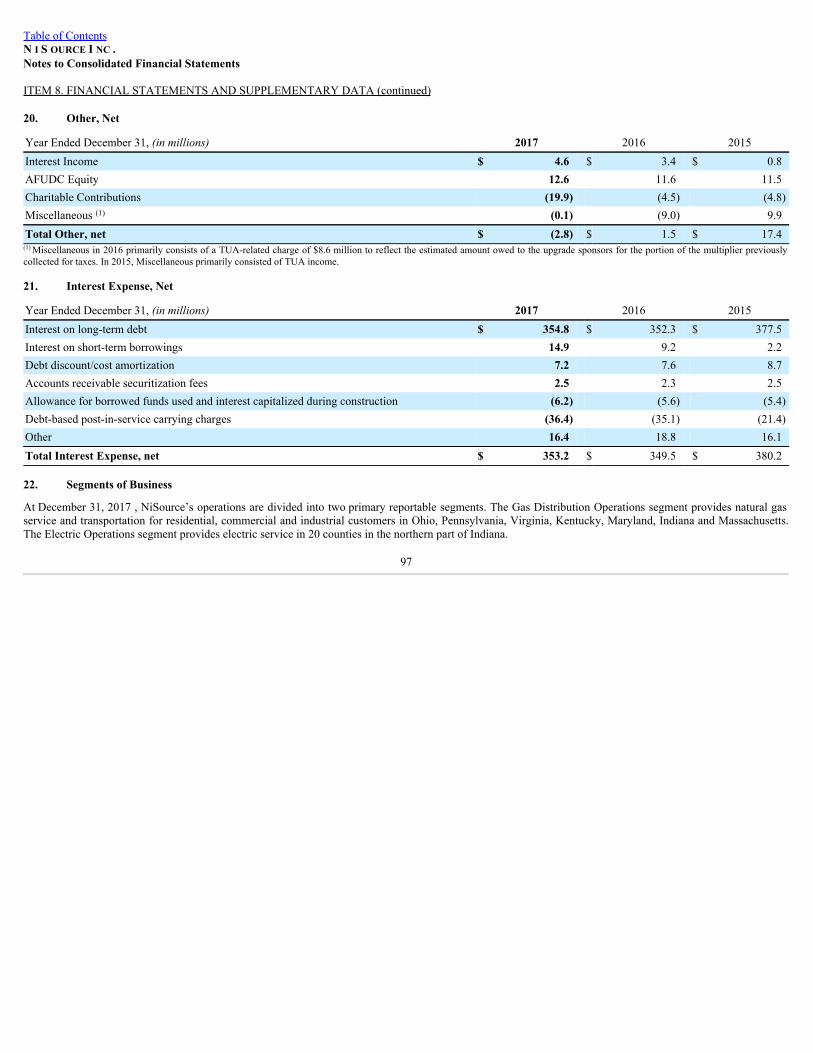
Table of ContentsN I S OURCE I NC .Notes to Consolidated Financial Statements
ITEM 8. FINANCIAL STATEMENTS AND SUPPLEMENTARY DATA (continued)
20. Other, Net
Year Ended December 31, (inmillions) 2017 2016 2015Interest Income $ 4.6 $ 3.4 $ 0.8AFUDC Equity 12.6 11.6 11.5Charitable Contributions (19.9) (4.5) (4.8)Miscellaneous (1) (0.1) (9.0) 9.9Total Other, net $ (2.8) $ 1.5 $ 17.4(1) Miscellaneous in 2016 primarily consists of a TUA-related charge of $8.6 million to reflect the estimated amount owed to the upgrade sponsors for the portion of the multiplier previouslycollected for taxes. In 2015, Miscellaneous primarily consisted of TUA income.
21. Interest Expense, Net
Year Ended December 31, (inmillions) 2017 2016 2015Interest on long-term debt $ 354.8 $ 352.3 $ 377.5Interest on short-term borrowings 14.9 9.2 2.2Debt discount/cost amortization 7.2 7.6 8.7Accounts receivable securitization fees 2.5 2.3 2.5Allowance for borrowed funds used and interest capitalized during construction (6.2) (5.6) (5.4)Debt-based post-in-service carrying charges (36.4) (35.1) (21.4)Other 16.4 18.8 16.1Total Interest Expense, net $ 353.2 $ 349.5 $ 380.2
22. Segments of Business
At December 31, 2017 , NiSource’s operations are divided into two primary reportable segments. The Gas Distribution Operations segment provides natural gasservice and transportation for residential, commercial and industrial customers in Ohio, Pennsylvania, Virginia, Kentucky, Maryland, Indiana and Massachusetts.The Electric Operations segment provides electric service in 20 counties in the northern part of Indiana.
97
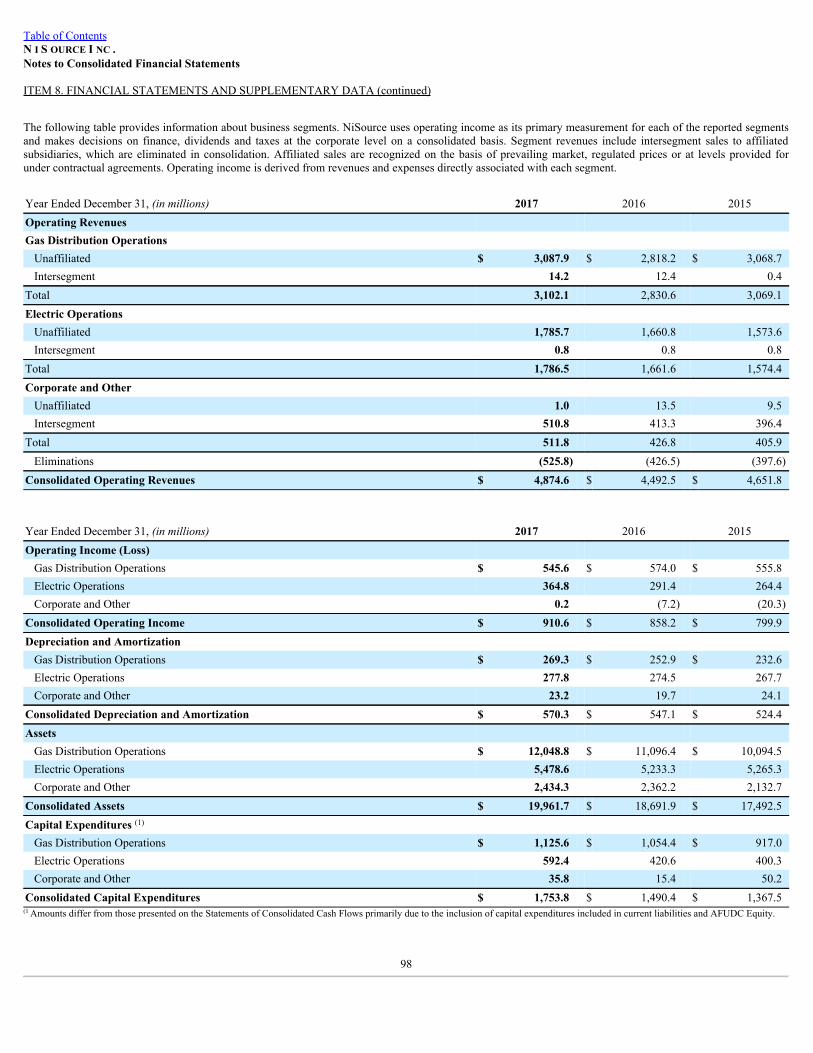
Table of ContentsN I S OURCE I NC .Notes to Consolidated Financial Statements
ITEM 8. FINANCIAL STATEMENTS AND SUPPLEMENTARY DATA (continued)
The following table provides information about business segments. NiSource uses operating income as its primary measurement for each of the reported segmentsand makes decisions on finance, dividends and taxes at the corporate level on a consolidated basis. Segment revenues include intersegment sales to affiliatedsubsidiaries, which are eliminated in consolidation. Affiliated sales are recognized on the basis of prevailing market, regulated prices or at levels provided forunder contractual agreements. Operating income is derived from revenues and expenses directly associated with each segment.
Year Ended December 31, (inmillions) 2017 2016 2015Operating Revenues Gas Distribution Operations Unaffiliated $ 3,087.9 $ 2,818.2 $ 3,068.7Intersegment 14.2 12.4 0.4
Total 3,102.1 2,830.6 3,069.1Electric Operations Unaffiliated 1,785.7 1,660.8 1,573.6Intersegment 0.8 0.8 0.8
Total 1,786.5 1,661.6 1,574.4Corporate and Other Unaffiliated 1.0 13.5 9.5Intersegment 510.8 413.3 396.4
Total 511.8 426.8 405.9Eliminations (525.8) (426.5) (397.6)
Consolidated Operating Revenues $ 4,874.6 $ 4,492.5 $ 4,651.8
Year Ended December 31, (inmillions) 2017 2016 2015Operating Income (Loss) Gas Distribution Operations $ 545.6 $ 574.0 $ 555.8Electric Operations 364.8 291.4 264.4Corporate and Other 0.2 (7.2) (20.3)
Consolidated Operating Income $ 910.6 $ 858.2 $ 799.9Depreciation and Amortization Gas Distribution Operations $ 269.3 $ 252.9 $ 232.6Electric Operations 277.8 274.5 267.7Corporate and Other 23.2 19.7 24.1
Consolidated Depreciation and Amortization $ 570.3 $ 547.1 $ 524.4Assets Gas Distribution Operations $ 12,048.8 $ 11,096.4 $ 10,094.5Electric Operations 5,478.6 5,233.3 5,265.3Corporate and Other 2,434.3 2,362.2 2,132.7
Consolidated Assets $ 19,961.7 $ 18,691.9 $ 17,492.5Capital Expenditures (1) Gas Distribution Operations $ 1,125.6 $ 1,054.4 $ 917.0Electric Operations 592.4 420.6 400.3Corporate and Other 35.8 15.4 50.2
Consolidated Capital Expenditures $ 1,753.8 $ 1,490.4 $ 1,367.5(1 Amounts differ from those presented on the Statements of Consolidated Cash Flows primarily due to the inclusion of capital expenditures included in current liabilities and AFUDC Equity.
98
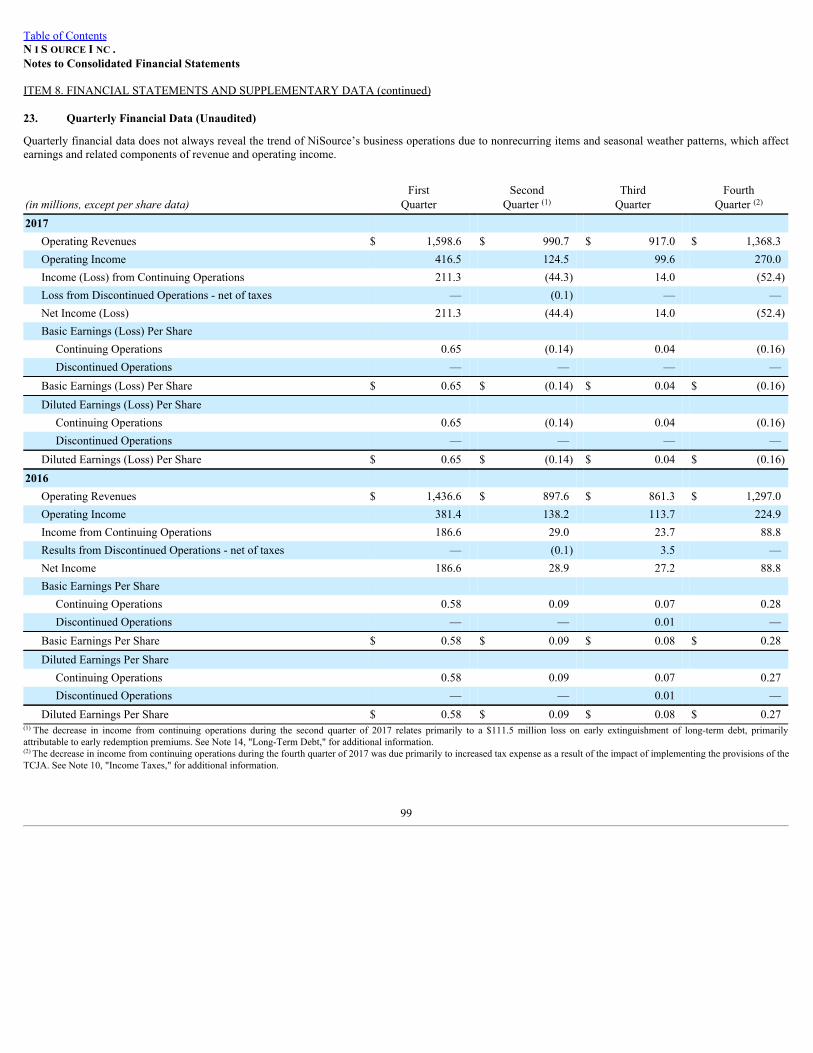
Table of ContentsN I S OURCE I NC .Notes to Consolidated Financial Statements
ITEM 8. FINANCIAL STATEMENTS AND SUPPLEMENTARY DATA (continued)
23. Quarterly Financial Data (Unaudited)
Quarterly financial data does not always reveal the trend of NiSource’s business operations due to nonrecurring items and seasonal weather patterns, which affectearnings and related components of revenue and operating income.
(inmillions,exceptpersharedata)First
Quarter Second
Quarter (1) ThirdQuarter
FourthQuarter (2)
2017 Operating Revenues $ 1,598.6 $ 990.7 $ 917.0 $ 1,368.3Operating Income 416.5 124.5 99.6 270.0Income (Loss) from Continuing Operations 211.3 (44.3) 14.0 (52.4)Loss from Discontinued Operations - net of taxes — (0.1) — —Net Income (Loss) 211.3 (44.4) 14.0 (52.4)Basic Earnings (Loss) Per Share
Continuing Operations 0.65 (0.14) 0.04 (0.16)Discontinued Operations — — — —
Basic Earnings (Loss) Per Share $ 0.65 $ (0.14) $ 0.04 $ (0.16)Diluted Earnings (Loss) Per Share
Continuing Operations 0.65 (0.14) 0.04 (0.16)Discontinued Operations — — — —
Diluted Earnings (Loss) Per Share $ 0.65 $ (0.14) $ 0.04 $ (0.16)2016
Operating Revenues $ 1,436.6 $ 897.6 $ 861.3 $ 1,297.0Operating Income 381.4 138.2 113.7 224.9Income from Continuing Operations 186.6 29.0 23.7 88.8Results from Discontinued Operations - net of taxes — (0.1) 3.5 —Net Income 186.6 28.9 27.2 88.8Basic Earnings Per Share
Continuing Operations 0.58 0.09 0.07 0.28Discontinued Operations — — 0.01 —
Basic Earnings Per Share $ 0.58 $ 0.09 $ 0.08 $ 0.28Diluted Earnings Per Share
Continuing Operations 0.58 0.09 0.07 0.27Discontinued Operations — — 0.01 —
Diluted Earnings Per Share $ 0.58 $ 0.09 $ 0.08 $ 0.27(1) The decrease in income from continuing operations during the second quarter of 2017 relates primarily to a $111.5 million loss on early extinguishment of long-term debt, primarilyattributable to early redemption premiums. See Note 14, "Long-Term Debt," for additional information.(2) The decrease in income from continuing operations during the fourth quarter of 2017 was due primarily to increased tax expense as a result of the impact of implementing the provisions of theTCJA. See Note 10, "Income Taxes," for additional information.
99
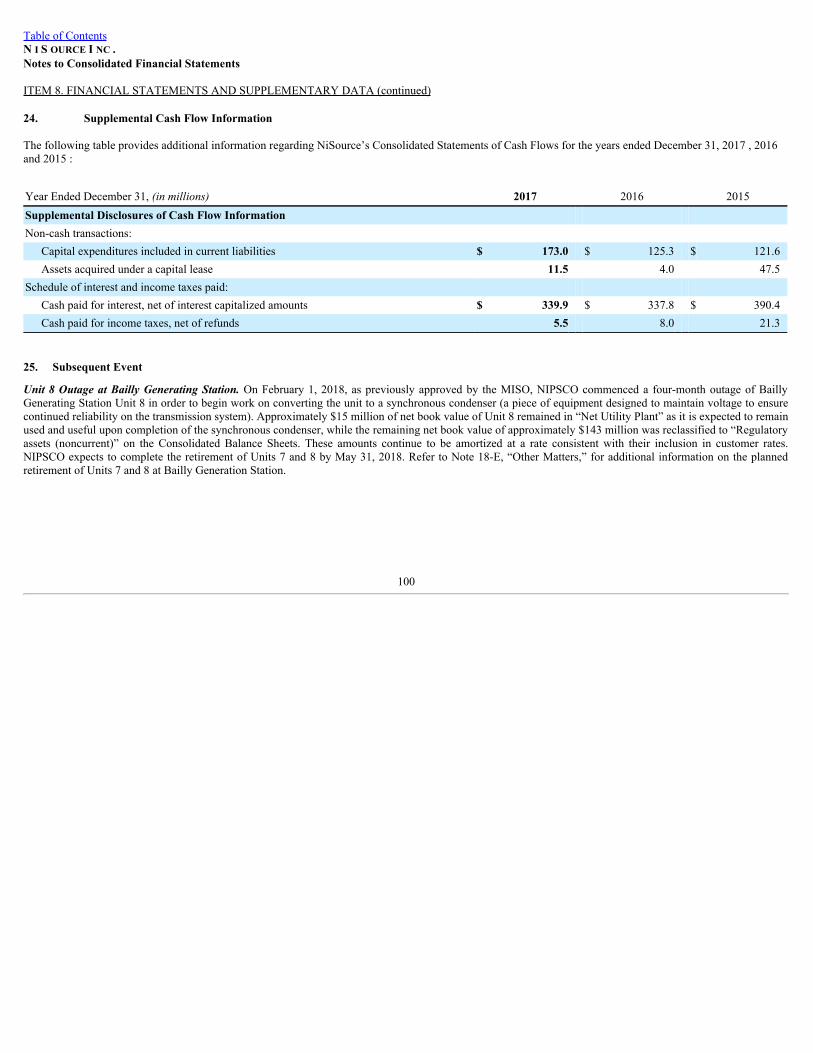
Table of ContentsN I S OURCE I NC .Notes to Consolidated Financial Statements
ITEM 8. FINANCIAL STATEMENTS AND SUPPLEMENTARY DATA (continued)
24. Supplemental Cash Flow Information
The following table provides additional information regarding NiSource’s Consolidated Statements of Cash Flows for the years ended December 31, 2017 , 2016and 2015 :
Year Ended December 31, (inmillions) 2017 2016 2015Supplemental Disclosures of Cash Flow Information Non-cash transactions:
Capital expenditures included in current liabilities $ 173.0 $ 125.3 $ 121.6Assets acquired under a capital lease 11.5 4.0 47.5
Schedule of interest and income taxes paid: Cash paid for interest, net of interest capitalized amounts $ 339.9 $ 337.8 $ 390.4Cash paid for income taxes, net of refunds 5.5 8.0 21.3
25. Subsequent Event
Unit 8 Outageat Bailly Generating Station.On February 1, 2018, as previously approved by the MISO, NIPSCO commenced a four-month outage of BaillyGenerating Station Unit 8 in order to begin work on converting the unit to a synchronous condenser (a piece of equipment designed to maintain voltage to ensurecontinued reliability on the transmission system). Approximately $15 million of net book value of Unit 8 remained in “Net Utility Plant” as it is expected to remainused and useful upon completion of the synchronous condenser, while the remaining net book value of approximately $143 million was reclassified to “Regulatoryassets (noncurrent)” on the Consolidated Balance Sheets. These amounts continue to be amortized at a rate consistent with their inclusion in customer rates.NIPSCO expects to complete the retirement of Units 7 and 8 by May 31, 2018. Refer to Note 18-E, “Other Matters,” for additional information on the plannedretirement of Units 7 and 8 at Bailly Generation Station.
100
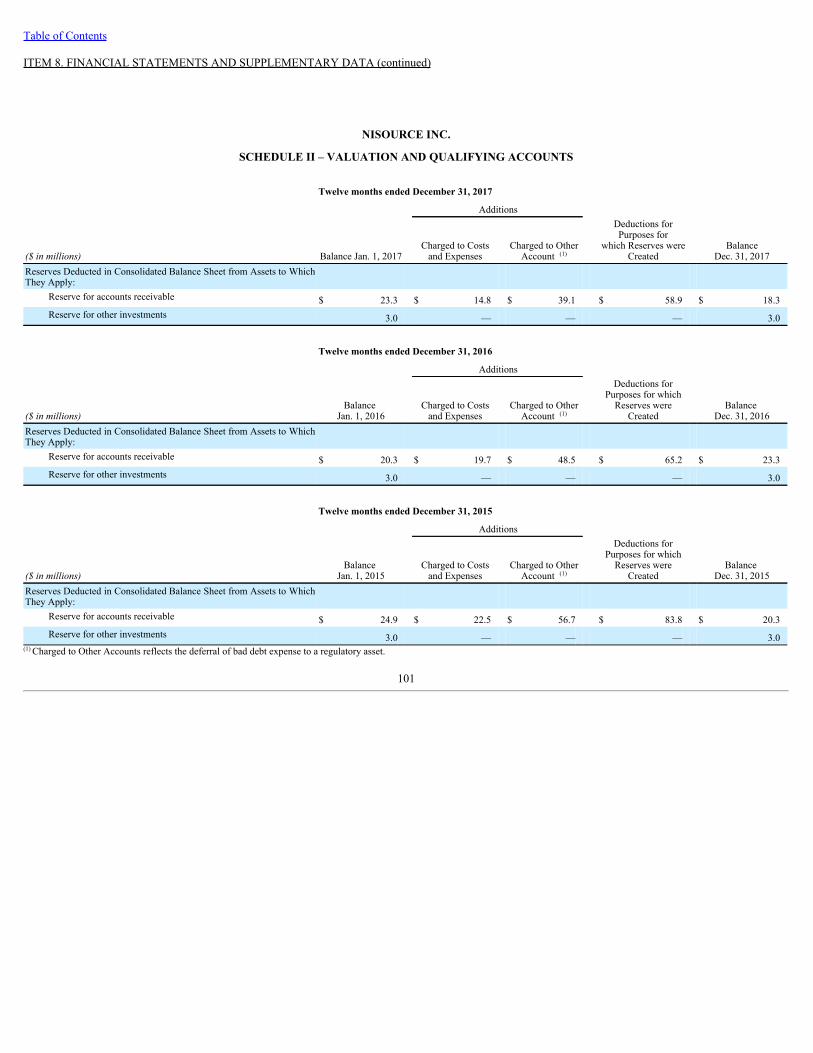
Table of Contents
ITEM 8. FINANCIAL STATEMENTS AND SUPPLEMENTARY DATA (continued)
NISOURCE INC.
SCHEDULE II – VALUATION AND QUALIFYING ACCOUNTS
Twelve months ended December 31, 2017 Additions
($inmillions) Balance Jan. 1, 2017 Charged to Costsand Expenses
Charged to OtherAccount (1)
Deductions forPurposes for
which Reserves wereCreated
BalanceDec. 31, 2017
Reserves Deducted in Consolidated Balance Sheet from Assets to WhichThey Apply:
Reserve for accounts receivable $ 23.3 $ 14.8 $ 39.1 $ 58.9 $ 18.3Reserve for other investments 3.0 — — — 3.0
Twelve months ended December 31, 2016
Additions
($inmillions)Balance
Jan. 1, 2016 Charged to Costsand Expenses
Charged to OtherAccount (1)
Deductions forPurposes for whichReserves were
Created Balance
Dec. 31, 2016Reserves Deducted in Consolidated Balance Sheet from Assets to WhichThey Apply:
Reserve for accounts receivable $ 20.3 $ 19.7 $ 48.5 $ 65.2 $ 23.3Reserve for other investments 3.0 — — — 3.0
Twelve months ended December 31, 2015
Additions
($inmillions)Balance
Jan. 1, 2015 Charged to Costsand Expenses
Charged to OtherAccount (1)
Deductions forPurposes for whichReserves were
Created Balance
Dec. 31, 2015Reserves Deducted in Consolidated Balance Sheet from Assets to WhichThey Apply:
Reserve for accounts receivable $ 24.9 $ 22.5 $ 56.7 $ 83.8 $ 20.3Reserve for other investments 3.0 — — — 3.0
(1) Charged to Other Accounts reflects the deferral of bad debt expense to a regulatory asset.
101
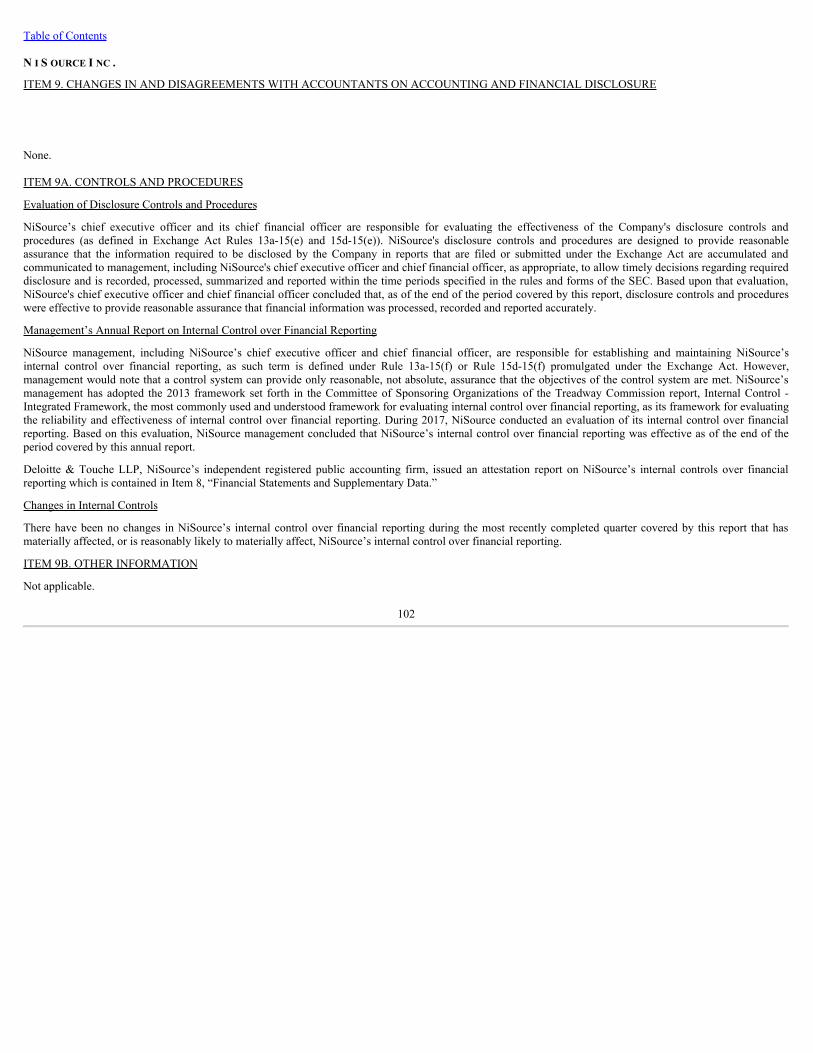
Table of Contents
N I S OURCE I NC .
ITEM 9. CHANGES IN AND DISAGREEMENTS WITH ACCOUNTANTS ON ACCOUNTING AND FINANCIAL DISCLOSURE
None.
ITEM 9A. CONTROLS AND PROCEDURES
Evaluation of Disclosure Controls and Procedures
NiSource’s chief executive officer and its chief financial officer are responsible for evaluating the effectiveness of the Company's disclosure controls andprocedures (as defined in Exchange Act Rules 13a-15(e) and 15d-15(e)). NiSource's disclosure controls and procedures are designed to provide reasonableassurance that the information required to be disclosed by the Company in reports that are filed or submitted under the Exchange Act are accumulated andcommunicated to management, including NiSource's chief executive officer and chief financial officer, as appropriate, to allow timely decisions regarding requireddisclosure and is recorded, processed, summarized and reported within the time periods specified in the rules and forms of the SEC. Based upon that evaluation,NiSource's chief executive officer and chief financial officer concluded that, as of the end of the period covered by this report, disclosure controls and procedureswere effective to provide reasonable assurance that financial information was processed, recorded and reported accurately.
Management’s Annual Report on Internal Control over Financial Reporting
NiSource management, including NiSource’s chief executive officer and chief financial officer, are responsible for establishing and maintaining NiSource’sinternal control over financial reporting, as such term is defined under Rule 13a-15(f) or Rule 15d-15(f) promulgated under the Exchange Act. However,management would note that a control system can provide only reasonable, not absolute, assurance that the objectives of the control system are met. NiSource’smanagement has adopted the 2013 framework set forth in the Committee of Sponsoring Organizations of the Treadway Commission report, Internal Control -Integrated Framework, the most commonly used and understood framework for evaluating internal control over financial reporting, as its framework for evaluatingthe reliability and effectiveness of internal control over financial reporting. During 2017, NiSource conducted an evaluation of its internal control over financialreporting. Based on this evaluation, NiSource management concluded that NiSource’s internal control over financial reporting was effective as of the end of theperiod covered by this annual report.
Deloitte & Touche LLP, NiSource’s independent registered public accounting firm, issued an attestation report on NiSource’s internal controls over financialreporting which is contained in Item 8, “Financial Statements and Supplementary Data.”
Changes in Internal Controls
There have been no changes in NiSource’s internal control over financial reporting during the most recently completed quarter covered by this report that hasmaterially affected, or is reasonably likely to materially affect, NiSource’s internal control over financial reporting.
ITEM 9B. OTHER INFORMATION
Not applicable.
102

Table of Contents
N I S OURCE I NC .
PART III
ITEM 10. DIRECTORS, EXECUTIVE OFFICERS AND CORPORATE GOVERNANCE
Except for the information required by this item with respect to NiSource's executive officers included at the end of Part I of this report on Form 10-K, theinformation required by this Item 10 is incorporated herein by reference to the discussion in "Proposal 1 Election of Directors," "Corporate Governance," and"Section 16(a) Beneficial Ownership Reporting Compliance," of the Proxy Statement for the Annual Meeting of Stockholders to be held on May 8, 2018 .
ITEM 11. EXECUTIVE COMPENSATIONThe information required by this Item 11 is incorporated herein by reference to the discussion in "Corporate Governance - Compensation Committee Interlocks andInsider Participation," "Director Compensation," "Executive Compensation," and "Executive Compensation - Compensation Committee Report," of the ProxyStatement for the Annual Meeting of Stockholders to be held on May 8, 2018 .
ITEM 12. SECURITY OWNERSHIP OF CERTAIN BENEFICIAL OWNERS AND MANAGEMENT AND RELATED STOCKHOLDER MATTERS
The information required by this Item 12 is incorporated herein by reference to the discussion in "Security Ownership of Certain Beneficial Owners andManagement" and "Equity Compensation Plan Information" of the Proxy Statement for the Annual Meeting of Stockholders to be held on May 8, 2018 .
ITEM 13. CERTAIN RELATIONSHIPS AND RELATED TRANSACTIONS, AND DIRECTOR INDEPENDENCE
The information required by this Item 13 is incorporated herein by reference to the discussion in "Corporate Governance - Policies and Procedures with Respect toTransactions with Related Persons" and "Corporate Governance - Director Independence" of the Proxy Statement for the Annual Meeting of Stockholders to beheld on May 8, 2018 .
ITEM 14. PRINCIPAL ACCOUNTING FEES AND SERVICES
The information required by this Item 14 is incorporated herein by reference to the discussion in "Independent Auditor Fees" of the Proxy Statement for the AnnualMeeting of Stockholders to be held on May 8, 2018 .
103
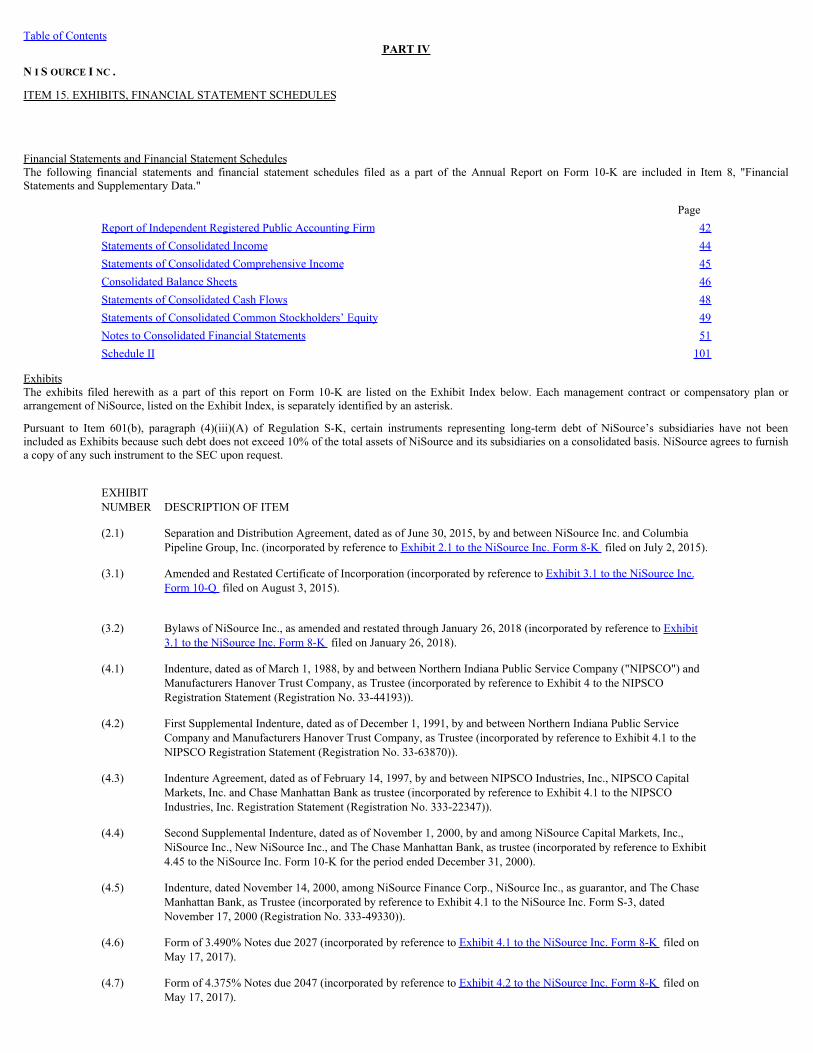
Table of ContentsPART IV
N I S OURCE I NC .
ITEM 15. EXHIBITS, FINANCIAL STATEMENT SCHEDULES
Financial Statements and Financial Statement SchedulesThe following financial statements and financial statement schedules filed as a part of the Annual Report on Form 10-K are included in Item 8, "FinancialStatements and Supplementary Data."
PageReport of Independent Registered Public Accounting Firm 42Statements of Consolidated Income 44Statements of Consolidated Comprehensive Income 45Consolidated Balance Sheets 46Statements of Consolidated Cash Flows 48Statements of Consolidated Common Stockholders’ Equity 49Notes to Consolidated Financial Statements 51Schedule II 101
ExhibitsThe exhibits filed herewith as a part of this report on Form 10-K are listed on the Exhibit Index below. Each management contract or compensatory plan orarrangement of NiSource, listed on the Exhibit Index, is separately identified by an asterisk.
Pursuant to Item 601(b), paragraph (4)(iii)(A) of Regulation S-K, certain instruments representing long-term debt of NiSource’s subsidiaries have not beenincluded as Exhibits because such debt does not exceed 10% of the total assets of NiSource and its subsidiaries on a consolidated basis. NiSource agrees to furnisha copy of any such instrument to the SEC upon request.
EXHIBITNUMBER DESCRIPTION OF ITEM (2.1) Separation and Distribution Agreement, dated as of June 30, 2015, by and between NiSource Inc. and Columbia
Pipeline Group, Inc. (incorporated by reference to Exhibit 2.1 to the NiSource Inc. Form 8-K filed on July 2, 2015). (3.1) Amended and Restated Certificate of Incorporation (incorporated by reference to Exhibit 3.1 to the NiSource Inc.
Form 10-Q filed on August 3, 2015).
(3.2) Bylaws of NiSource Inc., as amended and restated through January 26, 2018 (incorporated by reference to Exhibit
3.1 to the NiSource Inc. Form 8-K filed on January 26, 2018). (4.1) Indenture, dated as of March 1, 1988, by and between Northern Indiana Public Service Company ("NIPSCO") and
Manufacturers Hanover Trust Company, as Trustee (incorporated by reference to Exhibit 4 to the NIPSCORegistration Statement (Registration No. 33-44193)).
(4.2) First Supplemental Indenture, dated as of December 1, 1991, by and between Northern Indiana Public Service
Company and Manufacturers Hanover Trust Company, as Trustee (incorporated by reference to Exhibit 4.1 to theNIPSCO Registration Statement (Registration No. 33-63870)).
(4.3) Indenture Agreement, dated as of February 14, 1997, by and between NIPSCO Industries, Inc., NIPSCO Capital
Markets, Inc. and Chase Manhattan Bank as trustee (incorporated by reference to Exhibit 4.1 to the NIPSCOIndustries, Inc. Registration Statement (Registration No. 333-22347)).
(4.4) Second Supplemental Indenture, dated as of November 1, 2000, by and among NiSource Capital Markets, Inc.,
NiSource Inc., New NiSource Inc., and The Chase Manhattan Bank, as trustee (incorporated by reference to Exhibit4.45 to the NiSource Inc. Form 10-K for the period ended December 31, 2000).
(4.5) Indenture, dated November 14, 2000, among NiSource Finance Corp., NiSource Inc., as guarantor, and The Chase
Manhattan Bank, as Trustee (incorporated by reference to Exhibit 4.1 to the NiSource Inc. Form S-3, datedNovember 17, 2000 (Registration No. 333-49330)).
(4.6) Form of 3.490% Notes due 2027 (incorporated by reference to Exhibit 4.1 to the NiSource Inc. Form 8-K filed on
May 17, 2017). (4.7) Form of 4.375% Notes due 2047 (incorporated by reference to Exhibit 4.2 to the NiSource Inc. Form 8-K filed on
May 17, 2017).

104
Table of Contents
(4.8) Form of 3.950% Notes due 2048 (incorporated by reference to Exhibit 4.1 to the NiSource Inc. Form 8-K filed onSeptember 8, 2017).
(4.9) Form of 2.650% Notes due 2022 (incorporated by reference to Exhibit 4.1 to the NiSource Inc. Form 8-K filed on
November 14, 2017). (4.10) Second Supplemental Indenture, dated as of November 30, 2017, between NiSource Inc. and The Bank of New
York Mellon, as trustee (incorporated by reference to Exhibit 4.4 to Post-Effective Amendment No. 1 to Form S-3 filed November 30, 2017 (Registration No. 333-214360)).
(4.11) Third Supplemental Indenture, dated as of November 30, 2017, between NiSource Inc. and The Bank of New York
Mellon, as trustee (incorporated by reference to Exhibit 4.2 to the NiSource Inc. Form 8-K filed on December 1,2017).
(10.1) 2010 Omnibus Incentive Plan (incorporated by reference to Exhibit B to the NiSource Inc. Definitive Proxy
Statement to Stockholders for the Annual Meeting held on May 11, 2010, filed on April 2, 2010).* (10.2) First Amendment to the 2010 Omnibus Incentive Plan (incorporated by reference to Exhibit 10.2 to the NiSource
Inc. Form 10-K filed on February 18, 2014.)* (10.3) 2010 Omnibus Incentive Plan (incorporated by reference to Exhibit C to the NiSource Inc. Definitive Proxy
Statement to Stockholders for the Annual Meeting held on May 12, 2015, filed on April 7, 2015).* (10.4) Second Amendment to the NiSource Inc. 2010 Omnibus Incentive Plan (incorporated by reference to Exhibit 10.1 to
the NiSource Inc. Form 8-K filed October 23, 2015.)* (10.5) Form of Performance Share Award Agreement under the 2010 Omnibus Incentive Plan (incorporated by reference
to Exhibit 10.1 to the NiSource Inc. Form 10-Q filed on April 30, 2014.)* (10.6) Form of Amended and Restated 2013 Performance Share Agreement effective on implementation of the spin-off on
July 1, 2015, (under the 2010 Omnibus Incentive Plan)(incorporated by reference to Exhibit 10.1 to the NiSourceInc. Form 10-Q filed on November 3, 2015).*
(10.7) Form of Amended and Restated 2014 Performance Share Agreement effective on the implementation of the spin-off
on July 1, 2015, (under the 2010 Omnibus Incentive Plan)(incorporated by reference to Exhibit 10.2 to the NiSourceInc. Form 10-Q filed on November 3, 2015).*
(10.8) Form of Amendment to Restricted Stock Unit Award Agreement related to Vested but Unpaid NiSource Restricted
Stock Unit Awards for Nonemployee Directors of NiSource entered into as of July 13, 2015 (incorporated byreference to Exhibit 10.3 to the NiSource Inc. Form 10-Q filed on November 3, 2015).*
(10.9) NiSource Inc. Nonemployee Director Retirement Plan, as amended and restated effective May 13, 2008
(incorporated by reference to Exhibit 10.2 to the NiSource Inc. Form 10-K filed on February 27, 2009).* (10.10) Supplemental Life Insurance Plan effective January 1, 1991, as amended, (incorporated by reference to Exhibit 2 to
the NIPSCO Industries, Inc. Form 8-K filed on March 25, 1992).* (10.11) Form of Change in Control and Termination Agreement (incorporated by reference to Exhibit 99.1 to the NiSource
Inc. Form 8-K filed January 6, 2014).* (10.12) Revised Form of Change in Control and Termination Agreement (incorporated by reference to Exhibit 10.2 to the
NiSource Inc. Form 8-K filed on October 23, 2015.)* (10.13) Form of Restricted Stock Agreement under the 2010 Omnibus Incentive Plan (incorporated by reference to Exhibit
10.18 to the NiSource Inc. Form 10-K filed on February 28, 2011).* (10.14) Form of Restricted Stock Unit Award Agreement for Non-employee directors under the Non-employee Director
Stock Incentive Plan (incorporated by reference to Exhibit 10.19 to the NiSource Inc. Form 10-K filed on February28, 2011).*
(10.15) Form of Restricted Stock Unit Award Agreement for Nonemployee Directors under the 2010 Omnibus Incentive
Plan (incorporated by reference to Exhibit 10.1 to NiSource Inc. Form 10-Q filed on August 2, 2011).* (10.16) Form of Performance Share Award Agreement under the 2010 Omnibus Incentive Plan (incorporated by reference
to Exhibit 10.3 to the NiSource Inc. Form 10-Q filed on May 3, 2016).* (10.17) Form of Restricted Stock Unit Award Agreement under the 2010 Omnibus Incentive Plan.* (incorporated by
reference to Exhibit 10.17 to the NiSource Inc. Form 10-K filed on February 22, 2017)

105
Table of Contents
(10.18) Form of Restricted Stock Unit Award Agreement for Nonemployee Directors under the 2010 Omnibus IncentivePlan. (incorporated by reference to Exhibit 10.18 to the NiSource Inc. Form 10-K filed on February 22, 2017) *
(10.19) Amended and Restated NiSource Inc. Supplemental Executive Retirement Plan effective May 13, 2011
(incorporated by reference to Exhibit 10.3 to NiSource Inc. Form 10-Q filed on October 28, 2011).* (10.20) Amended and Restated Pension Restoration Plan for NiSource Inc. and Affiliates effective May 13, 2011
(incorporated by reference to Exhibit 10.4 to NiSource Inc. Form 10-Q filed on October 28, 2011).* (10.21) Amended Restated Savings Restoration Plan for NiSource Inc. and Affiliates effective October 22, 2012
(incorporated by reference to Exhibit 10.20 to the NiSource Inc. Form 10-K filed on February 19, 2013).* (10.22) Amended and Restated NiSource Inc. Executive Deferred Compensation Plan effective November 1, 2012
(incorporated by reference to Exhibit 10.21 to the NiSource Inc. Form 10-K filed on February 19, 2013).* (10.23) NiSource Inc. Executive Severance Policy, as amended and restated, effective January 1, 2015 (incorporated by
reference to Exhibit 10.21 to the NiSource Inc. Form 10-K filed on February 18, 2015).* (10.24) Fourth Amended and Restated Revolving Credit Agreement, dated as of November 28, 2016, among NiSource
Finance Corp., as Borrower, NiSource Inc., the Lenders party thereto, Barclays Bank PLC, as Administrative Agent,JPMorgan Chase Bank, N.A. and The Bank of Tokyo-Mitsubishi UFJ, Ltd., as Co-Syndication Agents, Citibank,N.A., Credit Suisse AG, Cayman Islands Branch and Wells Fargo Bank, National Association, as Co-Documentation Agents, and Barclays Bank PLC, JPMorgan Chase Bank, N.A., The Bank of Tokyo-Mitsubishi UFJ,Ltd., Credit Suisse Securities (USA) LLC, Citigroup Global Markets, Inc. and Wells Fargo Securities, LLC, as JointLead Arrangers and Joint Bookrunners (incorporated by reference to Exhibit 10.1 to the NiSource Inc. Form 8-K filed on November 28, 2016).
(10.25) Note Purchase Agreement, dated as of August 23, 2005, by and among NiSource Finance Corp., as issuer, NiSource
Inc., as guarantor, and the purchasers named therein (incorporated by reference to Exhibit 10.1 to the NiSource Inc.Current Report on Form 8-K filed on August 26, 2005).
(10.26) Amendment No. 1, dated as of November 10, 2008, to the Note Purchase Agreement by and among NiSource
Finance Corp., as issuer, NiSource Inc., as guarantor, and the purchasers whose names appear on the signature pagethereto (incorporated by reference to Exhibit 10.30 to the NiSource Inc. Form 10-K filed on February 27, 2009).
(10.27) Term Loan Agreement, dated as of March 31, 2016, by and among NiSource Finance Corp., as Borrower, NiSource
Inc., as Guarantor, the Lenders party thereto, and PNC Bank, National Association, as Administrative Agent, JPMorgan Chase Bank, N.A., as Syndication Agent, and Mizuho Bank, Ltd., as Documentation Agent (incorporatedby reference to Exhibit 10.1 to the NiSource Inc. Form 10-Q filed on May 3, 2016).
(10.28) Letter Agreement, dated as of March 17, 2015, by and between NiSource Inc. and Donald Brown. (incorporated by
reference Exhibit 10.1 to the NiSource Inc. Form 10-Q filed on April 30, 2015).* (10.29) Letter Agreement, dated as of February 23, 2016, by and between NiSource Inc. and Pablo A. Vegas. (incorporated
by reference Exhibit 10.29 to the NiSource Inc. Form 10-K filed on February 22, 2017).* (10.30) Tax Allocation Agreement, dated as of June 30, 2015, by and between NiSource Inc. and Columbia Pipeline Group,
Inc. (incorporated by reference to Exhibit 10.1 of the NiSource Inc. Form 8-K filed on July 2, 2015). (10.31) Employee Matters Agreement, dated as of June 30, 2015, by and between NiSource Inc. and Columbia Pipeline
Group, Inc. (incorporated by reference to Exhibit 10.2 of the NiSource Inc. Form 8-K filed on July 2, 2015). (10.32) Form of Change in Control and Termination Agreement (incorporated by reference to Exhibit 10.1 to the NiSource
Inc. Form 10-Q filed on August 2, 2017). (10.33) Form of Performance share Award Agreement under the 2010 Omnibus Incentive Plan. * ** (10.34) Form of 2018 Restricted Stock Unit Award Agreement under the 2010 Omnibus Incentive Plan. * ** (12) Ratio of Earnings to Fixed Charges. ** (21) List of Subsidiaries. ** (23) Consent of Deloitte & Touche LLP. ** (31.1) Certification of Chief Executive Officer, pursuant to Section 302 of the Sarbanes-Oxley Act of 2002. ** (31.2) Certification of Chief Financial Officer, pursuant to Section 302 of the Sarbanes-Oxley Act of 2002. **

106
Table of Contents
(32.1) Certification of Chief Executive Officer, pursuant to Section 906 of the Sarbanes-Oxley Act of 2002 (furnishedherewith). **
(32.2) Certification of Chief Financial Officer, pursuant to Section 906 of the Sarbanes-Oxley Act of 2002 (furnished
herewith). ** (101.INS) XBRL Instance Document.** (101.SCH) XBRL Schema Document.** (101.CAL) XBRL Calculation Linkbase Document.** (101.LAB) XBRL Labels Linkbase Document.** (101.PRE) XBRL Presentation Linkbase Document.** (101.DEF) XBRL Definition Linkbase Document.**
* Management contract or compensatory plan or arrangement of NiSource Inc.
** Exhibit filed herewith.
References made to NIPSCO filings can be found at Commission File Number 001-04125. References made to NiSource Inc. filings made prior to November 1,2000 can be found at Commission File Number 001-09779.
107
Table of Contents
SIGNATURES
Pursuant to the requirements of Section 13 or 15(d) of the Securities Exchange Act of 1934, the registrant has duly caused this report to be signed on its behalf by the undersigned, hereunto dulyauthorized.
NiSource Inc.
(Registrant)
Date: February 20, 2018 By: /s/ JOSEPH HAMROCK Joseph Hamrock
President, Chief Executive Officer and Director (Principal Executive Officer)
Pursuant to the requirements of the Securities Exchange Act of 1934, this report has been signed below by the following persons on behalf of the registrant and in the capacities and on the datesindicated.
/s/ JOSEPH HAMROCK President, Chief Date: February 20, 2018
Joseph Hamrock
Executive Officer and Director (Principal Executive Officer)
/s/ DONALD E. BROWN Executive Vice President and Date: February 20, 2018
Donald E. Brown
Chief Financial Officer(Principal Financial Officer)
/s/ JOSEPH W. MULPAS Vice President and Date: February 20, 2018
Joseph W. Mulpas
Chief Accounting Officer (Principal Accounting Officer)
/s/ RICHARD L. THOMPSON Chairman and Director Date: February 20, 2018
Richard L. Thompson /s/ RICHARD A. ABDOO Director Date: February 20, 2018
Richard A. Abdoo /s/ PETER A. ALTABEF Director Date: February 20, 2018
Peter A. Altabef /s/ ERIC L. BUTLER Director
Date: February 20, 2018
Eric L. Butler /s/ ARISTIDES S. CANDRIS Director Date: February 20, 2018
Aristides S. Candris /s/ WAYNE S. DEVEYDT Director Date: February 20, 2018
Wayne S. DeVeydt /s/ DEBORAH A. HENRETTA Director Date: February 20, 2018
Deborah A. Henretta /s/ MICHAEL E. JESANIS Director Date: February 20, 2018
Michael E. Jesanis /s/ KEVIN T. KABAT Director Date: February 20, 2018
Kevin T. Kabat /s/ CAROLYN Y. WOO Director Date: February 20, 2018
Carolyn Y. Woo
108
NiSource Inc.2010 Omnibus Incentive Plan
Performance Share Award Agreement
This Performance Share Award Agreement (the “Agreement”), is made and entered into as of [__________] (the “Date of Grant”),by and between NiSource Inc., a Delaware corporation (the “Company”), and [________], an Employee of the Company (the“Grantee”).
Section 1. Performance Share Award . The Company hereby grants to the Grantee, on the terms and conditions hereinafterset forth, an Award of [________] Performance Shares. The Performance Shares will be represented by a bookkeeping entry (the“Performance Share Account”) of the Company, and each Performance Share will be settled with one share of the Company’scommon stock to the extent provided under this Agreement and the Plan.
Section 2. Grantee Accounts . The number of Performance Shares granted pursuant to this Agreement shall be credited tothe Grantee’s Performance Share Account. Each Performance Share Account shall be maintained on the books of the Company untilfull payment of the balance thereof has been made to the Grantee (or the Grantee’s beneficiaries or estate if the Grantee is deceased)in accordance with Section 1 above. No funds shall be set aside or earmarked for any Performance Share Account, which shall bepurely a bookkeeping device.
Section 3. Performance Period . The “Performance Period” is the period beginning on [________], and ending on[________].
Section 4. Performance Goals .
(a) Satisfaction of Performance Goals . If the Company’s cumulative “net operating earnings” per Share for thePerformance Period meets or exceeds [________] (the “Threshold Performance Requirement”), and the Committeecertifies to this result in accordance with subsection (b) below, the Performance Shares will be eligible to vest asprovided below. If the Company’s cumulative “net operating earnings” per Share for the Performance Period does notmeet or exceed [________] all Performance Shares will be forfeited as of the end of the Performance Period.
(b) Committee Certification . As soon as practicable after the end of the Performance Period, the Committee will certifyin writing whether the Threshold Performance Requirement has been met for the Performance Period and determinethe number of Shares, if any, that will be payable to the Grantee. The date of the Committee’s certification under thisSection shall hereinafter be referred to as the “Certification Date.” The Company will notify the Grantee (or theexecutors or administrators of the Grantee’s estate, if appropriate) of the Committee’s certification following theCertification Date (such notice being the “Determination Notice”). The Determination Notice shall specify thenumber of Shares payable in accordance with the Committee’s certification and the terms of this Agreement.

Section 5. Vesting . If the Threshold Performance Requirement for the Performance Period has been met, and the Committeecertifies to this result as provided in Section 4(b), the number of Performance Shares earned and vested shall be determined asfollows:
(a) [________] shall be eligible to vest based on the achievement of cumulative “net operating earnings” per Share forthe Performance Period in accordance with the following results (including interpolation between the trigger, targetand stretch goals, expressed as a percentage of the target) (“Cumulative NOEPS Shares”), provided that the Granteeremains in the continuous employment with the Company through [________]:
Cumulative Net VestingOperating Earnings Percentage
Per Share
(i) The number of Cumulative NOEPS Shares determined above shall be increased or decreased (“TSRAdjustment”) based on the Company’s Relative Total Shareholder Return (“RTSR”) (as definedbelow). If the Company’s RTSR as of the last day of the Performance Period is in the top quartile ofTotal Shareholder Return (“TSR”) performance of a peer group of companies, the number ofCumulative NOEPS Shares eligible to vest as determined above shall be increased by [________]. Ifthe Company’s RTSR as of the last day of the Performance Period is in the bottom quartile of TSRperformance of a peer group of companies, the number of Cumulative NOEPS Shares eligible to vestas determined above shall be decreased by [________]. No other adjustment shall be made based onthe Company’s RTSR.
(ii) For purposes of this Agreement, Relative Total Shareholder Return (“RTSR”) is the annualized growthin the dividends and share price of a share of the Company’s common stock, calculated using a 20 daytrading average of the Company’s closing price beginning [________] and ending [________]compared to the TSR performance of a peer group of companies determined by the Committee at itsmeeting on [________].
(b) [________] shall be eligible to vest based on the individual’s contribution to the Company’s Customer Value
Framework, as determined at the end of the Performance Period, provided that the Grantee remains in the continuousemployment with the Company until [________]. Individual payout percentages may range from [________], asdetermined by the Committee in its sole discretion. The components of the Company’s Customer Value Frameworkshall consist of the following areas of focus: safety, customer satisfaction, financial, culture and environmental.
Section 6. Forfeiture of Performance Shares .
(a) Termination of Service before [________]. Except as set forth below, if Grantee’s Service is terminated for anyreason prior to [________], the Grantee shall forfeit the Performance Shares credited to the Grantee’s PerformanceShare Account.
(b) Retirement, Disability or Death .
(i) Notwithstanding the foregoing, in the event that Grantee’s Service terminates prior to [________] as a resultof (i) Grantee’s Retirement; or (ii) Grantee’s Disability; or (iii) Grantee’s death and such death occurs withless than or equal to twelve months remaining in the Performance Period, the Grantee (or the Grantee’sbeneficiary or estate in the case of Grantee’s death) shall vest in a pro rata portion of the Performance Shares,based on the actual performance results for the Performance Period, including application of the TSRAdjustment, after the Certification Date described in subsection 4(b) above; provided that the Committeeactually certifies that the Threshold Performance Requirement for the Performance Period has been met. Suchpro rata portion of Performance Shares shall be determined by multiplying such number of PerformanceShares by a fraction, where the numerator shall be the number of full or partial calendar months elapsedbetween the Date of Grant and the date the Grantee terminates Service, and the denominator shall be thenumber of full or partial calendar months elapsed between the Date of Grant and [________].
(ii) Additionally, if the Grantee terminates Service due to death prior to [________] with more than 12 monthsremaining in the Performance Period, the Grantee’s beneficiary or estate shall vest, on the date of termination,in a pro rata portion of the Performance Shares equal to the number of Performance Shares that the Granteeotherwise would have received had the Threshold Performance Requirement been met for the PerformancePeriod and vesting had been achieved at the target level (without application of the TSR Adjustment). Suchpro rata portion of Performance Shares shall be determined by multiplying such number of PerformanceShares by a fraction, where the numerator shall be the number of full or partial calendar months elapsedbetween the Date of Grant and the date the Grantee terminates Service, and the denominator shall be thenumber of full or partial calendar months elapsed between the Date of Grant and [________].
(iii) For purposes of this Agreement, “Retirement” means the Grantee’s termination from Service with theCompany at or after attainment of age 55 and completing 10 years of service (within the meaning of theCompany’s tax-qualified pension plan, regardless of whether the Grantee is eligible for such plan).
(d) Change in Control . Notwithstanding the foregoing provisions, in the event of a Change in Control, the PerformanceShares under this Agreement shall vest in accordance with Article XVI of the Plan. In the event of any conflictbetween Article XVI of the Plan and this Agreement, Article XVI shall control.
Section 7. Delivery of Shares . Once Performance Shares have vested under this Agreement, the Company will convert thePerformance Shares in the Grantee’s Performance Share Account into Shares and deliver the total number of Shares due to theGrantee as soon as administratively practicable after such date, but no later than [________]. The delivery of the Shares shall besubject to payment of the applicable withholding tax liability and the forfeiture provisions of this Agreement. If the Grantee diesbefore the Company has distributed any portion of the vested Performance Shares, the Company will transfer any Shares withrespect to the vested Performance Shares in accordance with the Grantee’s written beneficiary designation or to the Grantee’s estateif no written beneficiary designation is provided.
Section 8. Withholding of Taxes . The Company shall have the power and the right to deduct or withhold, or require theGrantee to remit to the Company, an amount sufficient to satisfy federal, state, and local taxes, domestic or foreign, required by lawor regulation to be withheld with respect to any taxable event arising as a result of this Agreement.
Section 9. Securities Law Compliance . The delivery of all or any Shares that relate to the Performance Shares shall only beeffective at such time that the issuance of such Shares will not violate any state or federal securities or other laws. The Company isunder no obligation to effect any registration of Shares under the Securities Act of 1933 or to effect any state registration orqualification of the Shares that may be issued under this Agreement. The Company may, in its sole discretion, delay the delivery ofShares or place restrictive legends on Shares in order to ensure that the issuance of any Shares will be in compliance with federal orstate securities laws and the rules of any exchange upon which the Company’s Shares are traded. If the Company delays the deliveryof Shares in order to ensure compliance with any state or federal securities or other laws, the Company shall deliver the Shares at theearliest date at which the Company reasonably believes that such delivery will not cause such violation, or at such later date that maybe permitted under Code Section 409A.
Section 10. Restriction on Transferability . Except as otherwise provided under the Plan, until the Performance Shareshave vested under this Agreement, the Performance Shares granted herein and the rights and privileges conferred hereby may not besold, transferred, pledged, assigned, or otherwise alienated or hypothecated (by operation of law or otherwise), other than by will orthe laws of descent and distribution. Any attempted transfer in violation of the provisions of this paragraph shall be void, and thepurported transferee shall obtain no rights with respect to such Performance Shares.
Section 11. Grantee’s Rights Unsecured . The right of the Grantee or his or her beneficiary to receive a distributionhereunder shall be an unsecured claim against the general assets of the Company, and neither the Grantee nor his or her beneficiaryshall have any rights in or against any amounts credited to the Grantee’s Performance Share Account or any other specific assets ofthe Company. All amounts credited to the Grantee’s Performance Share Account shall constitute general assets of the Company andmay be disposed of by the Company at such time and for such purposes, as it may deem appropriate.
Section 12. No Rights as Stockholder or Employee .
(a) The Grantee shall not have any privileges of a stockholder of the Company with respect to any Performance Sharessubject to this Agreement, nor shall the Company have any obligation to issue any dividends or otherwise afford anyrights to which Shares are entitled with respect to any such Performance Shares.
(b) Nothing in this Agreement or the Award shall confer upon the Grantee any right to continue as an Employee of theCompany or any Affiliate or to interfere in any way with the right of the Company or any Affiliate to terminate theGrantee’s Service at any time.
Section 13. Adjustments . If at any time while the Award is outstanding, the number of outstanding Performance Shares ischanged by reason of a reorganization, recapitalization, stock split or any of the other events described in the Plan, the number andkind of Performance Shares shall be adjusted in accordance with the provisions of the Plan. In the event of certain corporate eventsspecified in Article XVI of the Plan, any unvested Performance Shares may be replaced by substituted Awards or forfeited inexchange for payment of cash in accordance with the procedures and provisions of Article XVI of the Plan.
Section 14. Notices . Any notice hereunder by the Grantee shall be given to the Company in writing and such notice shall bedeemed duly given only upon receipt thereof at the following address: Corporate Secretary, NiSource Inc., 801 East 86th Avenue,Merrillville, IN 46410-6271, or at such other address as the Company may designate by notice to the Grantee. Any notice hereunderby the Company shall be given to the Grantee in writing and such notice shall be deemed duly given only upon receipt thereof atsuch address as the Grantee may have on file with the Company.
Section 15. Administration . The administration of this Agreement, including the interpretation and amendment ortermination of this Agreement, will be performed in accordance with the Plan. All determinations and decisions made by theCommittee, the Board, or any delegate of the Committee as to the provisions of this Agreement shall be conclusive, final, andbinding on all persons. This Agreement at all times shall be governed by the Plan, which is incorporated in this Agreement, and in noway alter or modify the Plan. All capitalized terms used in this Agreement and not defined herein shall have the meaning set forth inthe Plan. To the extent a conflict exists between this Agreement and the Plan, the provisions of the Plan shall govern.Notwithstanding the foregoing, if subsequent guidance is issued under Code Section 409A that would impose additional taxes,penalties, or interest to either the Company or the Grantee, the Company may administer this Agreement in accordance with suchguidance and amend this Agreement without the consent of the Grantee to the extent such actions, in the reasonable judgment of theCompany, are considered necessary to avoid the imposition of such additional taxes, penalties, or interest.
Section 16. Governing Law . This Agreement shall be construed and enforced in accordance with the laws of the State ofIndiana, without giving effect to the choice of law principles thereof.
Section 17. Government Regulations . Notwithstanding anything contained herein to the contrary, the Company’sobligation to issue or deliver certificates evidencing the Performance
Shares shall be subject to all applicable laws, rules and regulations, and to such approvals by any governmental agencies or nationalsecurities exchanges as may be required.
Section 18. Entire Agreement; Code Section 409A Compliance . This Agreement and the Plan contain the terms andconditions with respect to the subject matter hereof and supersede any previous agreements, written or oral, relating to the subjectmatter hereof. This Agreement is pursuant to the terms of the Company’s 2010 Omnibus Incentive Plan (the “Plan”). The applicableterms of the Plan are incorporated herein by reference, including the definition of capitalized terms contained in the Plan, andincluding the Code Section 409A provisions of Section XIX of the Plan. This Agreement shall be interpreted in accordance withCode Section 409A including the rules related to payment timing for specified employees. This Agreement shall be deemed to bemodified to the maximum extent necessary to be in compliance with Code Section 409A’s rules. If the Grantee is unexpectedlyrequired to include in the Grantee’s current year’s income any amount of compensation relating to the Performance Shares becauseof a failure to meet the requirements of Code Section 409A, then to the extent permitted by Code Section 409A, the Grantee mayreceive a distribution of Shares in an amount not to exceed the amount required to be included in income as a result of the failure tocomply with Code Section 409A.
[SIGNATURE PAGE TO FOLLOW]
IN WITNESS WHEREOF, the Company has caused this Award to be granted, and the Grantee has accepted this Award, as of thedate first above written.
NiSource Inc.
____________________________________________By:Its:
GRANTEE
By: _____________________
NiSource Inc.2010 Omnibus Incentive Plan
2018 Restricted Stock Unit Award Agreement
This Restricted Stock Unit Award Agreement (the “Agreement”), is made and entered into as of [________] (the “Date of Grant”),by and between NiSource Inc., a Delaware corporation (the “Company”), and [________], an Employee of the Company (the“Grantee”).
Section 1. Restricted Stock Unit Award . The Company hereby grants to the Grantee, on the terms and conditionshereinafter set forth, an Award of [________] Restricted Stock Units. The Restricted Stock Units will be represented by abookkeeping entry (the “RSU Account”) of the Company, and each Restricted Stock Unit shall be equivalent to one share of theCompany’s common stock.
Section 2. Grantee Accounts . The number of Restricted Stock Units granted pursuant to this Agreement shall be credited tothe Grantee’s RSU Account. Each RSU Account shall be maintained on the books of the Company until full payment of the balancethereof has been made to the Grantee (or the Grantee’s beneficiaries or estate if the Grantee is deceased) in accordance with Section1 above. No funds shall be set aside or earmarked for any RSU Account, which shall be purely a bookkeeping device.
Section 3. Vesting and Lapse of Restrictions .
(a) Vesting . Subject to the forfeiture conditions described later in this Agreement, the Restricted Stock Units shall veston [________] (the “Vesting Date”), at which date they will become 100% vested, provided that the Grantee iscontinuously employed by the Company through and including the Vesting Date. Except as set forth in subsection (b)hereof, if Grantee’s Service is terminated for any reason prior to the Vesting Date, the unvested Restricted StockUnits subject to this Agreement shall immediately terminate and be automatically forfeited by Grantee.
(b) Effect of Termination of Service Prior to Vesting . Notwithstanding the foregoing, in the event that the Grantee’sService terminates prior to the Vesting Date as a result of (i) the Grantee’s Retirement, (ii) the Grantee’s death, or (iii)the Grantee’s Disability, the restrictions set forth in subsection (a) above shall lapse with respect to a prorataportionof such Restricted Stock Units on the date of termination of Service. Such pro rata lapse of restrictions shall bedetermined using a fraction, where the numerator shall be the number of full or partial calendar months elapsedbetween the Date of Grant and the date the Grantee terminates Service, and the denominator shall be the number offull or partial calendar months between the Date of Grant and the Vesting Date. For purposes of this Agreement,“Retirement” means the Grantee’s termination from Service with the Company at or after attainment of age 55 andcompleting 10 years of service (within the meaning of the Company’s tax-qualified pension plan, regardless ofwhether the Grantee is eligible for such plan).
(c) Change in Control . Notwithstanding the foregoing provisions, in the event of a Change in Control, the RestrictedStock Units under this Agreement shall vest in accordance with Article XVI of the Plan. In the event of any conflictbetween Article XVI of the Plan and this Agreement, Article XVI shall control.
Section 4. Delivery of Shares . Once Restricted Stock Units have vested under this Agreement, the Company will determinethe number of Shares represented by the vested Restricted Stock Units in the Grantee’s RSU Account and deliver the total number ofShares due to the Grantee as soon as administratively practicable after such date but not later than March 15th of the year followingthe year in which such RSUs vest. Notwithstanding the foregoing, to the extent necessary to comply with Code Section 409A, if anyRSUs vest prior to the Vesting Date in connection with a Grantee’s “separation from service” within the meaning of Code Section409A and the Grantee is a “specified employee” within the meaning of Code Section 409A at the time of such separation fromservice, the Shares represented by the vested RSUs will be issued and delivered on the first business day after the date that is six (6)months following the date of the Grantee’s separation from service (or if earlier, the Grantee’s date of death). The delivery of theShares shall be subject to payment of the applicable withholding tax liability and the forfeiture provisions of this Agreement. If theGrantee dies before the Company has distributed any portion of the vested Restricted Stock Units, the Company will transfer anyShares payable with respect to the vested Restricted Stock Units in accordance with the Grantee’s written beneficiary designation orto the Grantee’s estate if no written beneficiary designation is provided.
Section 5. Withholding of Taxes . The Company shall have the power and the right to deduct or withhold, or require theGrantee to remit to the Company, an amount sufficient to satisfy federal, state, and local taxes, domestic or foreign, required by lawor regulation to be withheld with respect to any taxable event arising as a result of this Agreement.
Section 6. Securities Law Compliance . The delivery of all or any Shares that relate to the Restricted Stock Units shall onlybe effective at such time that the issuance of such Shares will not violate any state or federal securities or other laws. The Companyis under no obligation to effect any registration of Shares under the Securities Act of 1933 or to effect any state registration orqualification of the Shares that may be issued under this Agreement. The Company may, in its sole discretion, delay the delivery ofShares or place restrictive legends on Shares in order to ensure that the issuance of any Shares will be in compliance with federal orstate securities laws and the rules of any exchange upon which the Company's Shares are traded. If the Company delays the deliveryof Shares in order to ensure compliance with any state or federal securities or other laws, the Company shall deliver the Shares at theearliest date at which the Company reasonably believes that such delivery will not cause such violation, or at such later date that maybe permitted under Code Section 409A.
Section 7. Restriction on Transferability . Except as otherwise provided under the Plan, until the Restricted Stock Units
have vested under this Agreement, the Restricted Stock Units granted herein and the rights and privileges conferred hereby may notbe sold, transferred, pledged, assigned, or otherwise alienated or hypothecated (by operation of law or otherwise), other than by willor the laws of descent and distribution. Any attempted transfer in violation of the provisions of this
paragraph shall be void, and the purported transferee shall obtain no rights with respect to such Restricted Stock Units.
Section 8. Grantee’s Rights Unsecured . The right of the Grantee or his or her beneficiary to receive a distributionhereunder shall be an unsecured claim against the general assets of the Company, and neither the Grantee nor his or her beneficiaryshall have any rights in or against any amounts credited to the Grantee’s RSU Account or any other specific assets of the Company.All amounts credited to the Grantee’s RSU Account shall constitute general assets of the Company and may be disposed of by theCompany at such time and for such purposes, as it may deem appropriate.
Section 9. No Rights as Stockholder or Employee .
(a) Unless and until Shares have been issued to the Grantee, the Grantee shall not have any privileges of a stockholder ofthe Company with respect to any Restricted Stock Units subject to this Agreement, nor shall the Company have anyobligation to issue any dividends or otherwise afford any rights to which Shares are entitled with respect to any suchRestricted Stock Units.
(b) Nothing in this Agreement or the Award shall confer upon the Grantee any right to continue as an Employee of theCompany or any Affiliate or to interfere in any way with the right of the Company or any Affiliate to terminate theGrantee’s Service at any time.
Section 10. Adjustments . If at any time while the Award is outstanding, the number of outstanding Restricted Stock Unitsis changed by reason of a reorganization, recapitalization, stock split or any of the other events described in the Plan, the number andkind of Restricted Stock Units shall be adjusted in accordance with the provisions of the Plan. In the event of certain corporateevents specified in Article XVI of the Plan, any unvested Restricted Stock Units may be replaced by substituted Awards or forfeitedin exchange for payment of cash in accordance with the procedures and provisions of Article XVI of the Plan.
Section 11. Notices . Any notice hereunder by the Grantee shall be given to the Company in writing and such notice shall bedeemed duly given only upon receipt thereof at the following address: Corporate Secretary, NiSource Inc., 801 East 86 th Avenue,Merrillville, IN 46410-6271, or at such other address as the Company may designate by notice to the Grantee. Any notice hereunderby the Company shall be given to the Grantee in writing and such notice shall be deemed duly given only upon receipt thereof atsuch address as the Grantee may have on file with the Company.
Section 12. Administration . The administration of this Agreement, including the interpretation and amendment ortermination of this Agreement, will be performed in accordance with the Plan. All determinations and decisions made by theCommittee, the Board, or any delegate of the Committee as to the provisions of this Agreement shall be conclusive, final, andbinding on all persons. This Agreement at all times shall be governed by the Plan, which is incorporated in this Agreement byreference, and in no way alter or modify the Plan. All capitalized terms used in this Agreement and not defined herein shall have themeaning set forth in the Plan. To the extent
a conflict exists between this Agreement and the Plan, the provisions of the Plan shall govern. Notwithstanding the foregoing, ifsubsequent guidance is issued under Code Section 409A that would impose additional taxes, penalties, or interest to either theCompany or the Grantee, the Company may administer this Agreement in accordance with such guidance and amend this Agreementwithout the consent of the Grantee to the extent such actions, in the reasonable judgment of the Company, are considered necessaryto avoid the imposition of such additional taxes, penalties, or interest.
Section 13. Governing Law . This Agreement shall be construed and enforced in accordance with the laws of the State ofIndiana, without giving effect to the choice of law principles thereof.
Section 14. Government Regulations . Notwithstanding anything contained herein to the contrary, the Company’sobligation to issue or deliver certificates evidencing the Restricted Stock Units shall be subject to all applicable laws, rules andregulations, and to such approvals by any governmental agencies or national securities exchanges as may be required.
Section 15. Entire Agreement; Code Section 409A Compliance . This Agreement and the Plan contain the terms andconditions with respect to the subject matter hereof and supersede any previous agreements, written or oral, relating to the subjectmatter hereof. This Agreement is pursuant to the terms of the Company’s 2010 Omnibus Incentive Plan (the “Plan”). The applicableterms of the Plan are incorporated herein by reference, including the definition of capitalized terms contained in the Plan, andincluding the Code Section 409A provisions of Section XIX of the Plan. This Agreement shall be interpreted in accordance withCode Section 409A including the rules related to payment timing for “specified employees” within the meaning of Code Section409A. This Agreement shall be deemed to be modified to the maximum extent necessary to be in compliance with Code Section409A’s rules. If the Grantee is unexpectedly required to include in the Grantee’s current year’s income any amount of compensationrelating to the Restricted Stock Units because of a failure to meet the requirements of Code Section 409A, then to the extentpermitted by Code Section 409A, the Grantee may receive a distribution of cash or Shares in an amount not to exceed the amountrequired to be included in income as a result of the failure to comply with Code Section 409A.
[SIGNATURE PAGE TO FOLLOW]
IN WITNESS WHEREOF, the Company has caused this Award to be granted, and the Grantee has accepted this Award, asof the date first above written.
NiSource Inc.
____________________________________________By:Its:

GRANTEE
By: _____________________
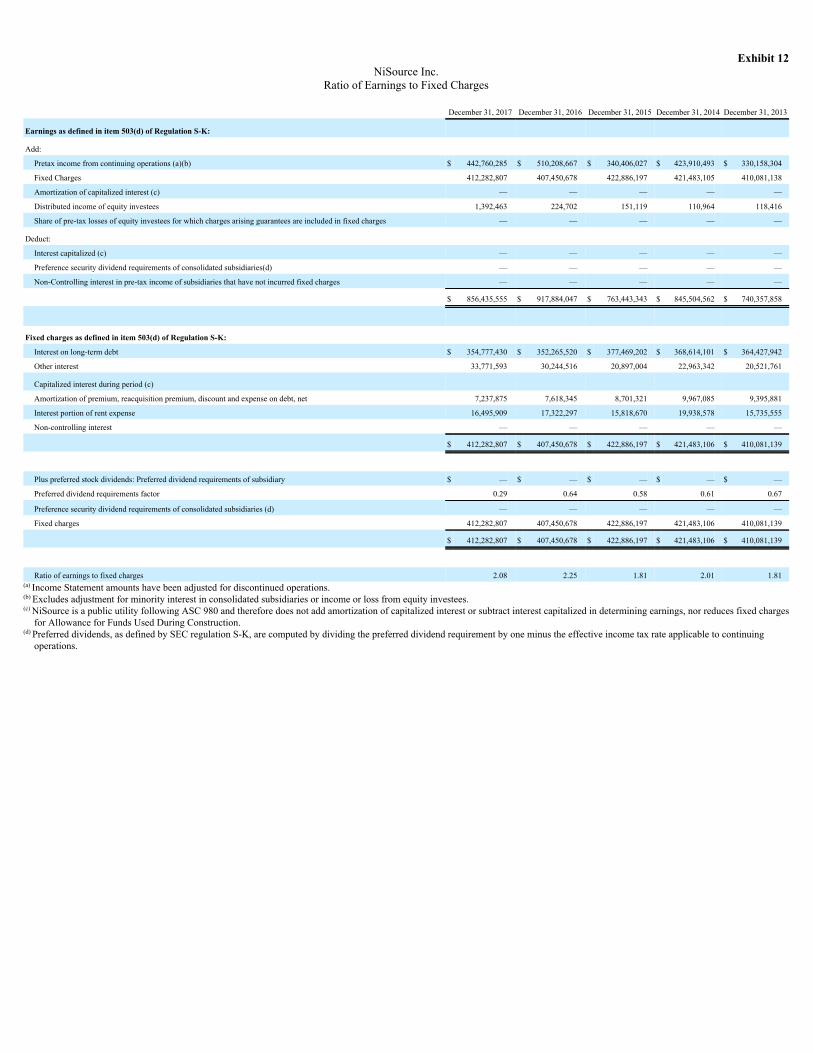
Exhibit 12NiSource Inc.
Ratio of Earnings to Fixed Charges
December 31, 2017 December 31, 2016 December 31, 2015 December 31, 2014 December 31, 2013
Earnings as defined in item 503(d) of Regulation S-K:
Add: Pretax income from continuing operations (a)(b) $ 442,760,285 $ 510,208,667 $ 340,406,027 $ 423,910,493 $ 330,158,304
Fixed Charges 412,282,807 407,450,678 422,886,197 421,483,105 410,081,138
Amortization of capitalized interest (c) — — — — —
Distributed income of equity investees 1,392,463 224,702 151,119 110,964 118,416
Share of pre-tax losses of equity investees for which charges arising guarantees are included in fixed charges — — — — —
Deduct: Interest capitalized (c) — — — — —
Preference security dividend requirements of consolidated subsidiaries(d) — — — — —
Non-Controlling interest in pre-tax income of subsidiaries that have not incurred fixed charges — — — — —
$ 856,435,555 $ 917,884,047 $ 763,443,343 $ 845,504,562 $ 740,357,858
Fixed charges as defined in item 503(d) of Regulation S-K: Interest on long-term debt $ 354,777,430 $ 352,265,520 $ 377,469,202 $ 368,614,101 $ 364,427,942
Other interest 33,771,593 30,244,516 20,897,004 22,963,342 20,521,761
Capitalized interest during period (c) Amortization of premium, reacquisition premium, discount and expense on debt, net 7,237,875 7,618,345 8,701,321 9,967,085 9,395,881
Interest portion of rent expense 16,495,909 17,322,297 15,818,670 19,938,578 15,735,555
Non-controlling interest — — — — —
$ 412,282,807 $ 407,450,678 $ 422,886,197 $ 421,483,106 $ 410,081,139
Plus preferred stock dividends: Preferred dividend requirements of subsidiary $ — $ — $ — $ — $ —
Preferred dividend requirements factor 0.29 0.64 0.58 0.61 0.67
Preference security dividend requirements of consolidated subsidiaries (d) — — — — —
Fixed charges 412,282,807 407,450,678 422,886,197 421,483,106 410,081,139
$ 412,282,807 $ 407,450,678 $ 422,886,197 $ 421,483,106 $ 410,081,139
Ratio of earnings to fixed charges 2.08 2.25 1.81 2.01 1.81
(a) Income Statement amounts have been adjusted for discontinued operations.(b) Excludes adjustment for minority interest in consolidated subsidiaries or income or loss from equity investees.(c) NiSource is a public utility following ASC 980 and therefore does not add amortization of capitalized interest or subtract interest capitalized in determining earnings, nor reduces fixed chargesfor Allowance for Funds Used During Construction.
(d) Preferred dividends, as defined by SEC regulation S-K, are computed by dividing the preferred dividend requirement by one minus the effective income tax rate applicable to continuingoperations.
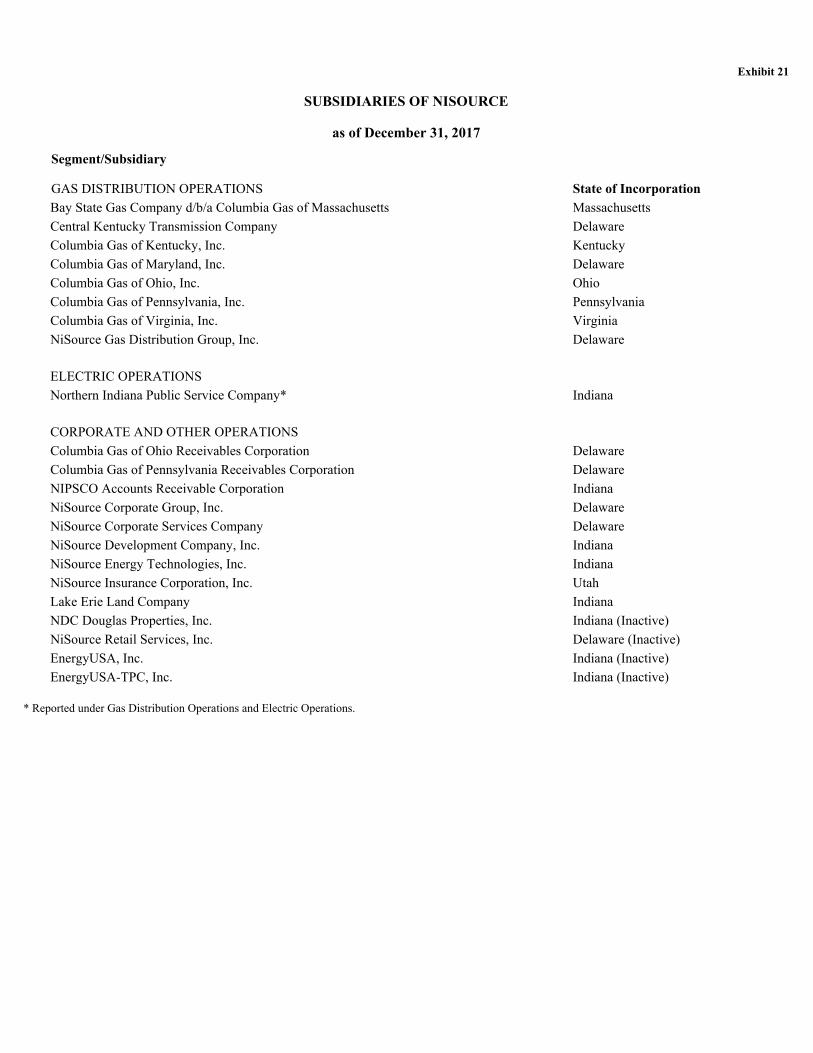
Exhibit 21
SUBSIDIARIES OF NISOURCE
as of December 31, 2017
Segment/Subsidiary
GAS DISTRIBUTION OPERATIONS State of IncorporationBay State Gas Company d/b/a Columbia Gas of Massachusetts MassachusettsCentral Kentucky Transmission Company DelawareColumbia Gas of Kentucky, Inc. KentuckyColumbia Gas of Maryland, Inc. DelawareColumbia Gas of Ohio, Inc. OhioColumbia Gas of Pennsylvania, Inc. PennsylvaniaColumbia Gas of Virginia, Inc. VirginiaNiSource Gas Distribution Group, Inc. Delaware ELECTRIC OPERATIONS Northern Indiana Public Service Company* Indiana CORPORATE AND OTHER OPERATIONS Columbia Gas of Ohio Receivables Corporation DelawareColumbia Gas of Pennsylvania Receivables Corporation DelawareNIPSCO Accounts Receivable Corporation IndianaNiSource Corporate Group, Inc. DelawareNiSource Corporate Services Company DelawareNiSource Development Company, Inc. IndianaNiSource Energy Technologies, Inc. IndianaNiSource Insurance Corporation, Inc. UtahLake Erie Land Company IndianaNDC Douglas Properties, Inc. Indiana (Inactive)NiSource Retail Services, Inc. Delaware (Inactive)EnergyUSA, Inc. Indiana (Inactive)EnergyUSA-TPC, Inc. Indiana (Inactive)
* Reported under Gas Distribution Operations and Electric Operations.
Exhibit 23
CONSENT OF INDEPENDENT REGISTERED PUBLIC ACCOUNTING FIRM
We consent to the incorporation by reference in Registration Statement Nos. 333-107743, 333-166888, 333-170706, and 333-204168 on Form S-8 and 333-214360on Form S-3 of our reports dated February 20, 2018, relating to the consolidated financial statements and financial statement schedule of NiSource Inc. andsubsidiaries (the “Company”) (which report expresses an unqualified opinion and includes an explanatory paragraph relating to the Company’s spin-off of itssubsidiary Columbia Pipeline Group, Inc. on July 1, 2015), and the effectiveness of the Company’s internal control over financial reporting, appearing in thisAnnual Report on Form 10-K of NiSource Inc. for the year ended December 31, 2017.
/s/ DELOITTE & TOUCHE LLPColumbus, OhioFebruary 20, 2018
Exhibit 31.1
Certification Pursuant toSection 302 of the Sarbanes-Oxley Act of 2002
I, Joseph Hamrock, certify that:
1. I have reviewed this Annual Report of NiSource Inc. on Form 10-K for the year ended December 31, 2017 ;
2. Based on my knowledge, this report does not contain any untrue statement of a material fact or omit to state a material fact necessary to make thestatements made, in light of the circumstances under which such statements were made, not misleading with respect to the period covered by this report;
3. Based on my knowledge, the financial statements, and other financial information included in this report, fairly present in all material respects thefinancial condition, results of operations and cash flows of the registrant as of, and for, the periods presented in this report;
4. The registrant’s other certifying officer(s) and I are responsible for establishing and maintaining disclosure controls and procedures (as defined inExchange Act Rules 13a-15(e) and 15d-15(e)) and internal control over financial reporting (as defined in Exchange Act Rules 13a-15(f) and 15d-15(f))for the registrant and have:
a. Designed such disclosure controls and procedures, or caused such disclosure controls and procedures to be designed under our supervision, toensure that material information relating to the registrant, including its consolidated subsidiaries, is made known to us by others within thoseentities, particularly during the period in which this report is being prepared;
b. Designed such internal control over financial reporting, or caused such internal control over financial reporting to be designed under oursupervision, to provide reasonable assurance regarding the reliability of financial reporting and the preparation of financial statements forexternal purposes in accordance with generally accepted accounting principles;
c. Evaluated the effectiveness of the registrant’s disclosure controls and procedures and presented in this report our conclusions about theeffectiveness of the disclosure controls and procedures, as of the end of the period covered by this report based on such evaluation; and
d. Disclosed in this report any change in the registrant’s internal control over financial reporting that occurred during the registrant’s most recentfiscal quarter (the registrant’s fourth fiscal quarter in the case of an annual report) that has materially affected, or is reasonably likely tomaterially affect, the registrant’s internal control over financial reporting; and
5. The registrant’s other certifying officer(s) and I have disclosed, based on our most recent evaluation of internal control over financial reporting, to theregistrant’s auditors and the audit committee of the registrant’s board of directors (or persons performing the equivalent functions):
a. All significant deficiencies and material weaknesses in the design or operation of internal control over financial reporting which are reasonablylikely to adversely affect the registrant’s ability to record, process, summarize and report financial information; and
b. Any fraud, whether or not material, that involves management or other employees who have a significant role in the registrant’s internal controlover financial reporting.
Date: February 20, 2018 By: /s/ Joseph Hamrock Joseph Hamrock President and Chief Executive Officer
Exhibit 31.2
Certification Pursuant toSection 302 of the Sarbanes-Oxley Act of 2002
I, Donald E. Brown, certify that:
1. I have reviewed this Annual Report of NiSource Inc. on Form 10-K for the year ended December 31, 2017 ;
2. Based on my knowledge, this report does not contain any untrue statement of a material fact or omit to state a material fact necessary to make thestatements made, in light of the circumstances under which such statements were made, not misleading with respect to the period covered by this report;
3. Based on my knowledge, the financial statements, and other financial information included in this report, fairly present in all material respects thefinancial condition, results of operations and cash flows of the registrant as of, and for, the periods presented in this report;
4. The registrant’s other certifying officer(s) and I are responsible for establishing and maintaining disclosure controls and procedures (as defined inExchange Act Rules 13a-15(e) and 15d-15(e)) and internal control over financial reporting (as defined in Exchange Act Rules 13a-15(f) and 15d-15(f))for the registrant and have:
a) Designed such disclosure controls and procedures, or caused such disclosure controls and procedures to be designed under our supervision, toensure that material information relating to the registrant, including its consolidated subsidiaries, is made known to us by others within thoseentities, particularly during the period in which this report is being prepared;
b) Designed such internal control over financial reporting, or caused such internal control over financial reporting to be designed under oursupervision, to provide reasonable assurance regarding the reliability of financial reporting and the preparation of financial statements forexternal purposes in accordance with generally accepted accounting principles;
c) Evaluated the effectiveness of the registrant’s disclosure controls and procedures and presented in this report our conclusions about theeffectiveness of the disclosure controls and procedures, as of the end of the period covered by this report based on such evaluation; and
d) Disclosed in this report any change in the registrant’s internal control over financial reporting that occurred during the registrant’s most recentfiscal quarter (the registrant’s fourth fiscal quarter in the case of an annual report) that has materially affected, or is reasonably likely tomaterially affect, the registrant’s internal control over financial reporting; and
5. The registrant’s other certifying officer(s) and I have disclosed, based on our most recent evaluation of internal control over financial reporting, to theregistrant’s auditors and the audit committee of the registrant’s board of directors (or persons performing the equivalent functions):
a) All significant deficiencies and material weaknesses in the design or operation of internal control over financial reporting which are reasonablylikely to adversely affect the registrant’s ability to record, process, summarize and report financial information; and
b) Any fraud, whether or not material, that involves management or other employees who have a significant role in the registrant’s internal controlover financial reporting.
Date: February 20, 2018 By: /s/ Donald E. Brown Donald E. Brown Executive Vice President and Chief Financial Officer
Exhibit 32.1
Certification Pursuant toSection 906 of the Sarbanes-Oxley Act of 2002
In connection with the Annual Report of NiSource Inc. (the “Company”) on Form 10-K for the year ending December 31, 2017 as filed with the Securities andExchange Commission on the date hereof (the “Report”), I, Joseph Hamrock, Chief Executive Officer of the Company, certify, pursuant to Section 906 of theSarbanes-Oxley Act of 2002, that: (1) The Report fully complies with the requirements of section 13(a) or 15(d) of the Securities Exchange Act of 1934; and
(2) The information contained in the Report fairly presents, in all material respects, the financial condition and result of operations of the Company.
/s/ Joseph Hamrock Joseph Hamrock
President and Chief Executive Officer
Date: February 20, 2018
Exhibit 32.2
Certification Pursuant toSection 906 of the Sarbanes-Oxley Act of 2002
In connection with the Annual Report of NiSource Inc. (the “Company”) on Form 10-K for the year ending December 31, 2017 as filed with the Securities andExchange Commission on the date hereof (the “Report”), I, Donald E. Brown, Executive Vice President and Chief Financial Officer of the Company, certify,pursuant to Section 906 of the Sarbanes-Oxley Act of 2002, that: (1) The Report fully complies with the requirements of section 13(a) or 15(d) of the Securities Exchange Act of 1934; and
(2) The information contained in the Report fairly presents, in all material respects, the financial condition and result of operations of the Company.
/s/ Donald E. Brown Donald E. Brown
Executive Vice President and Chief Financial Officer
Date: February 20, 2018
Related Documents


![Corrective Measures Study (CMS) Columbia …...Corrective Measures Study (CMS) Columbia Manufacturing Company (CMC) Restoration Project Westfield, Massachusetts [title] iterative site](https://static.cupdf.com/doc/110x72/5f0b0b9a7e708231d42e947e/corrective-measures-study-cms-columbia-corrective-measures-study-cms-columbia.jpg)


