December 2015

Welcome message from author
This document is posted to help you gain knowledge. Please leave a comment to let me know what you think about it! Share it to your friends and learn new things together.
Transcript

December 2015
ewillison
Stamp

US 50/301 WILLIAM PRESTON LANE JR. MEMORIAL (BAY) BRIDGE
LIFE CYCLE COST ANALYSIS
December 2015
MARYLAND TRANSPORTATION AUTHORITY
Prepared by RK&K and Ammann & Whitney


US 50 / 301 / WILLIAM PRESTON LANE JR. MEMORIAL (BAY) BRIDGE LIFE CYCLE COST ANALYSIS REPORT
i
EXECUTIVE SUMMARY
MDTA initiated the Bay Bridge Life Cycle Cost Analysis (Bay Bridge LCCA) to understand the potential approaches and costs to implement Bay Bridge and approach roadway improvements in several future time frames.
The existing Bay Bridge structures are currently in satisfactory condition. The structural analysis shows that with programmed and anticipated rehabilitation and maintenance the existing structures can be maintained in fair or better condition through 2065, at which point the eastbound structure will be 113 years old and the westbound structure will be 92 years old. Beyond 2065, it is difficult to project what rehabilitation and maintenance would be required to keep the bridges in fair or better condition, but it is likely that major rehabilitation projects would be required that would necessitate extensive short‐term and/or long‐term lane closures. These future projects could have a major, detrimental impact on available bridge capacity and operations. Therefore, 2065 was identified as the horizon year for when Bay Bridge improvements would have to be implemented.
Traffic forecasting and analyses efforts were performed to establish the hourly traffic carrying capacity of the existing bridges, evaluate existing and future traffic operations to assess when the bridge capacity is no longer sufficient, and identify the capacity needed to accommodate future traffic demand. Both the Bay Bridge and the approach roadways within the study limits were analyzed. The traffic analysis shows that without additional capacity by 2040 there will significant queues every day of the week during the summer months. Daily queues in the eastbound direction could extend up to 13 miles. Daily westbound queues could extend three miles and Sunday queues could extend up to 14 miles. Even during non‐summer months there would be eastbound queues of up to a mile on Friday evenings and Saturday afternoons.
The traffic analysis showed that to accommodate traffic demand through the study time frame, 8‐total Bay Bridge lanes are required, with five lanes in the peak direction and three lanes in the off‐peak direction. Similarly, eight mainline lanes (four per direction) are needed along US 50/301 approaching the bridge within the study limits. However, MDTA could consider smaller scale, less costly improvements to the existing bridges that would provide six total bridge lanes. This approach would provide more capacity than the existing condition, but less than is needed to fully accommodate future traffic demand in 2040. Four Build Options were developed to provide the future 8‐lane or 6‐lane capacity. These Options are described in Table ES‐1.
Table ES‐1. Build Options
Option Option Components
Build Option 1 Maintain existing Bay Bridge structures
Provide a new 3‐lane Bay Bridge structure
Widen the US 50/301 mainline by one lane
Build Option 2 Demolish the existing eastbound Bay Bridge
Provide a new 5‐lane Bay Bridge structure
Widen the US 50/301 mainline by one lane
Build Option 3 Demolish both existing Bay Bridge structures
Provide a new 8‐lane Bay Bridge structure
Widen the US 50/301 mainline by one lane
US 50/301 / WILLIAM PRESTON LANE JR. MEMORIAL (BAY) BRIDGE LIFE CYCLE COST ANALYSIS REPORT
ii
Option Option Components
Build Option 4 Maintain existing westbound Bay Bridge
Widen and rehabilitate existing eastbound bridge to three lanes
Maintain US 50/301 mainline (no widening)
The Build Options would also include roadway life cycle improvements and programmed and anticipated Bay Bridge rehabilitation and maintenance through 2065. Roadway life cycle improvements include periodic resurfacing of the mainline pavement and reconstruction of the mainline bridges and overpasses within the study limits. For comparison, a No Build Option was developed, which included only the roadway life cycle improvements and programmed and anticipated Bay Bridge rehabilitation and maintenance.
Cost estimates for the Build and No Build Options were developed and then life cycle costs were estimated based on different time frames when the Build Options could be implemented, and when roadway life cycle improvements and Bay Bridge rehabilitation and maintenance would occur. Four time frames were considered:
2035, which was considered the earliest feasible completion date for a new Bay Bridge projectbased on the assumed durations for planning, design, and construction,
2040, which was the year of the future traffic analysis,
2050, and
2060.
The 2050 and 2060 time frames would only apply to Build Options 1, 2, and 3. Build Option 4 would only provide six total bridge lanes, which would be insufficient for projected demand beyond 2040, so it was determined that this approach would not be used if improvements were to be implemented after 2040.
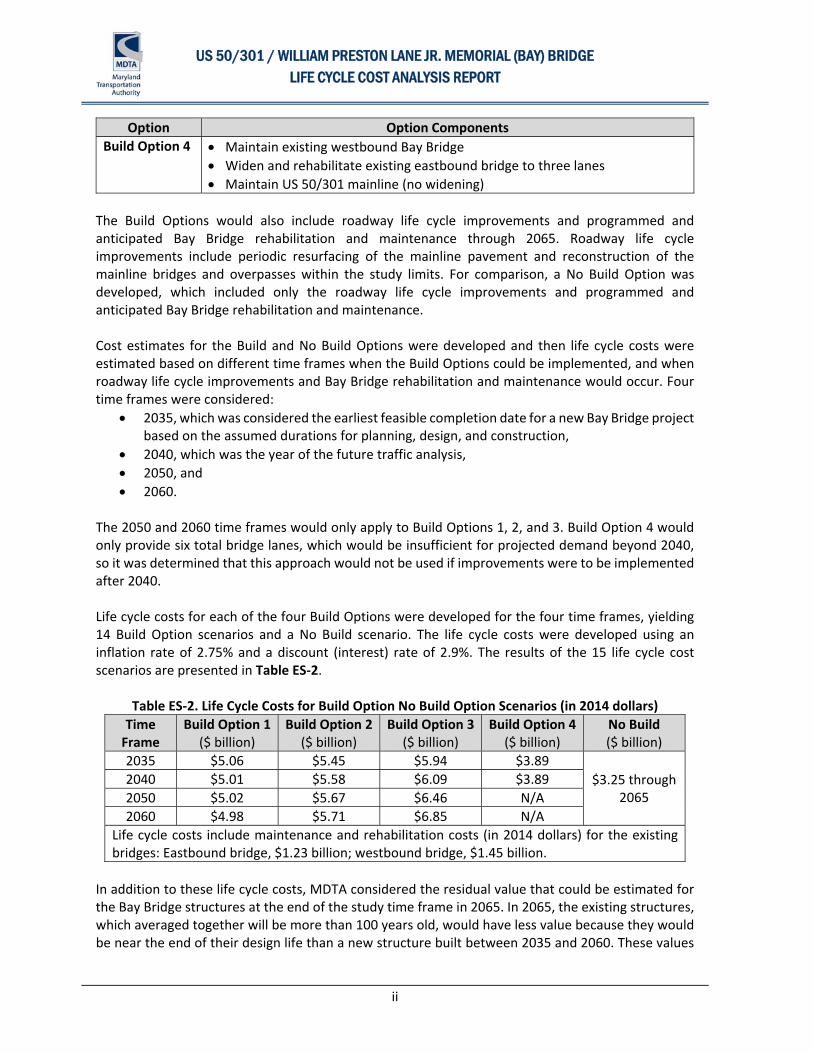
Life cycle costs for each of the four Build Options were developed for the four time frames, yielding 14 Build Option scenarios and a No Build scenario. The life cycle costs were developed using an inflation rate of 2.75% and a discount (interest) rate of 2.9%. The results of the 15 life cycle cost scenarios are presented in Table ES‐2.
Table ES‐2. Life Cycle Costs for Build Option No Build Option Scenarios (in 2014 dollars)
Time Frame
Build Option 1 ($ billion)
Build Option 2($ billion)
Build Option 3($ billion)
Build Option 4 ($ billion)
No Build ($ billion)
2035 $5.06 $5.45 $5.94 $3.89
$3.25 through 2065
2040 $5.01 $5.58 $6.09 $3.89
2050 $5.02 $5.67 $6.46 N/A
2060 $4.98 $5.71 $6.85 N/A
Life cycle costs include maintenance and rehabilitation costs (in 2014 dollars) for the existing bridges: Eastbound bridge, $1.23 billion; westbound bridge, $1.45 billion.
In addition to these life cycle costs, MDTA considered the residual value that could be estimated for the Bay Bridge structures at the end of the study time frame in 2065. In 2065, the existing structures, which averaged together will be more than 100 years old, would have less value because they would be near the end of their design life than a new structure built between 2035 and 2060. These values
US 50 / 301 / WILLIAM PRESTON LANE JR. MEMORIAL (BAY) BRIDGE LIFE CYCLE COST ANALYSIS REPORT
iii
ranged from $30 million for the No Build, where only the unmodified existing structures would remain in 2065, to $1.9 billion for Build Option 3 where a only new 8‐lane bridge would remain.
The Bay Bridge LCCA does not include recommendations for a preferred Build Option or the timing to implement those improvements. There are numerous issues that must be addressed before an option or time frame could be chosen, including understanding the position of key political and community stakeholders affected by the Bay Bridge, especially on the Eastern Shore, a determination of when traffic operations necessitate providing additional capacity, and public and political perspectives on Bay Bridge operations and future improvements. Given the scope of the Build Options and the numerous critical environmental features in proximity to the project, especially the Chesapeake Bay, a NEPA Study would have to be completed for any proposed improvements.

US 50 / 301 / WILLIAM PRESTON LANE JR. MEMORIAL (BAY) BRIDGE LIFE CYCLE COST ANALYSIS REPORT
iv
TABLE OF CONTENTS
EXECUTIVE SUMMARY .................................................................................................................... I
I. INTRODUCTION .................................................................................................................... 1
A. Project Overview and Background ......................................................................................... 1
B. Existing Conditions .................................................................................................................. 3
1. Bay Bridge ........................................................................................................................ 3
2. Approach Roadways ......................................................................................................... 3
3. Environmental Resources ................................................................................................ 3
II. BAY BRIDGE STRUCTURAL EVALUATION ............................................................................... 5
A. Current Bridge Condition ........................................................................................................ 5
1. Eastbound Bridge Condition ............................................................................................ 5
2. Westbound Bridge Condition ........................................................................................... 5
B. Programmed/Future Maintenance and Rehabilitation Projects ............................................ 6
C. Maintenance and Rehabilitation Costs ................................................................................... 6
III. EXISTING BRIDGE CAPACITY AND POTENTIAL FUTURE TRAFFIC DEMAND ............................. 8
A. Existing Bridge Capacity .......................................................................................................... 8
1. Data Collection ................................................................................................................. 8
2. Hourly Capacity ................................................................................................................ 8
B. Projected Traffic Growth ...................................................................................................... 11
1. Bay Bridge ...................................................................................................................... 11
2. Approach Roadways ....................................................................................................... 16
C. 2013 and 2040 Operational Analyses ................................................................................... 16
1. Bay Bridge ...................................................................................................................... 16
2. Approach Roadways ....................................................................................................... 17
D. Future Number of Bridge and Roadway Lanes ..................................................................... 23
1. Potential MDTA Approaches to Provide Additional Bridge and Roadway Capacity ...... 23
2. Future Number of Bridge and Roadway Lanes to Fully Accommodate 2040 Traffic
Demand .......................................................................................................................... 23
3. Future Number of Bridge and Roadway Lanes to Provide Additional Capacity but Not
Fully Accommodate 2040 Traffic Demand ..................................................................... 24
IV. BRIDGE AND ROADWAY OPTIONS ...................................................................................... 27
A. Bridge Options ...................................................................................................................... 27
1. Bridge Option 1 .............................................................................................................. 27
2. Bridge Option 2 .............................................................................................................. 27
3. Bridge Option 3 .............................................................................................................. 28

US 50 / 301 / WILLIAM PRESTON LANE JR. MEMORIAL (BAY) BRIDGE LIFE CYCLE COST ANALYSIS REPORT
v
4. Bridge Option 4 .............................................................................................................. 28
B. Roadway Improvements ...................................................................................................... 28
1. Roadway Widening ........................................................................................................ 28
2. Roadway Life Cycle Cost Improvements ....................................................................... 28
C. Build and No Build Options .................................................................................................. 29
D. Bridge and Roadway Costs ................................................................................................... 30
1. Cost Assumptions .......................................................................................................... 30
2. Bridge Improvements Cost Estimates ........................................................................... 31
3. Roadway Improvements Cost Estimates ....................................................................... 31
4. Build Options Cost Estimates ......................................................................................... 32
V. LIFE CYCLE COST SCENARIOS ............................................................................................... 34
A. Inflation and Discount Rates ................................................................................................ 34
B. Life Cycle Cost Time Frames and Scenarios ......................................................................... 35
1. Life Cycle Costs .............................................................................................................. 35
2. Depreciated Values of Existing Bay Bridge Structures in 2065 ...................................... 35
LIST OF TABLES
Table ES‐1. Build Options ........................................................................................................................ i
Table ES‐2. Life Cycle Costs for Build Option No Build Option Scenarios (in 2014 dollars) ................... ii
Table 2.1. Bay Bridge Rehabilitation, Maintenance, and Improvement Costs (2014 dollars) ............... 6
Table 3.1: Previous Capacity Estimates (vehicles/hour) of the Bay Bridge ............................................ 9
Table 3.2: Historic Observed Maximum Volumes (vehicles/hour) on the Bay Bridge ........................... 9
Table 3.3: Recommended Bridge Capacity Values (vehicles/hour) ..................................................... 11
Table 3.4: Bay Bridge Historic Daily Volumes ....................................................................................... 11
Table 3.5: Summary of Forecasts ......................................................................................................... 13
Table 3.6: Projected Daily Volumes ...................................................................................................... 13
Table 3.7. Maximum Flow (vehicles per hour) ..................................................................................... 23
Table 4.1. Build Option Improvements ................................................................................................ 29
Table 4.2. Bay Bridge Structural Cost Assumptions ............................................................................. 30
Table 4.3. Roadway Cost Assumptions ................................................................................................. 30
Table 4.4. Bay Bridge Costs (in 2014 dollars) ....................................................................................... 31
Table 4.5. Roadway Costs (in 2014 dollars) .......................................................................................... 32
Table 4.6. Roadway Life Cycle Costs (in 2014 dollars) .......................................................................... 32
Table 4.7. Build Options Costs (in 2014 dollars) ................................................................................... 32
Table 5.1: Life Cycle Costs (in billions of dollars) .................................................................................. 35

US 50 / 301 / WILLIAM PRESTON LANE JR. MEMORIAL (BAY) BRIDGE LIFE CYCLE COST ANALYSIS REPORT
vi
Table 5.2: Total Depreciated Value of Remaining Structures in 2065 (in billions of dollars) ............... 36
LIST OF FIGURES
Figure 1.1. Study Area ............................................................................................................................. 2
Figure 2.1. Eastbound and Westbound Bay Bridge Cumulative Rehabilitation Costs – Both Structures
Combined ............................................................................................................................ 7
Figure 3.1. Highest Observed Hourly Volumes ..................................................................................... 10
Figure 3.2. Daily Volumes and Capacities 2013 and 2040 Summer Months ........................................ 14
Figure 3.3. Daily Volumes and Capacities 2013 and 2040 Non‐Summer Months ................................ 15
Figure 3.4. Estimated Queues by Hour (2013, 2020, 2030, and 2040 Summer Months) ..................... 18
Figure 3.5. Estimated Queues by Hour (2013, 2020, 2030, and 2040 Non‐Summer Months) ............. 19
Figure 3.6. Estimated Year when Queues will Extend to Specific Locations (Summer and Non‐Summer
Months) ............................................................................................................................. 20
Figure 3.7. 2040 Mainline Peak Hour Volumes and Level of Service for an Average Weekday ........... 21
Figure 3.8. 2040 Mainline Peak Hour Volumes and Level of Service for a Summer Weekend ............ 22
Figure 3.9. Estimated Queues by Hour with 6‐Lane Bridge Compared to No Build (2040 Summer
Months) ............................................................................................................................. 26

US 50 / 301 / WILLIAM PRESTON LANE JR. MEMORIAL (BAY) BRIDGE LIFE CYCLE COST ANALYSIS REPORT
1
I. INTRODUCTION
A. Project Overview and Background
The Maryland Transportation Authority (MDTA) completed the William Preston Lane Jr. Memorial (Bay) Bridge Life Cycle Cost Analysis Study (Bay Bridge LCCA) to evaluate the traffic operations and structural condition of the Bay Bridge, and to understand the costs and time frame associated with implementing future Bay Bridge improvements. The study also evaluated the complementary improvements that would be needed if/when a new structure(s) were built including mainline US 50/301 improvements. The project limits extend from just west of the Severn River Bridge (near Rowe Boulevard) to the US 50/301 Split on the Eastern Shore, a distance of 21 miles (including the Bay Bridge). The study limits extend well beyond the Bay Bridge because of the major role the Bay Bridge plays in regional transportation as the only crossing of the Chesapeake Bay in Maryland and as the primary connection between the Eastern Shore and the Baltimore and Washington metropolitan areas. As such, if improvements were only made to the Bay Bridge, they would not address the potential capacity limitations of US 50/301 on both sides of the bridge and would; therefore, not provide the regional transportation improvements needed to accommodate future traffic demand. The study area is shown in Figure 1.1. The Bay Bridge LCCA Study time frame extended from the present (2014) through 2065. The latter year was identified because it represents the out year for when maintenance and rehabilitation of the existing bridges has been programmed and/or studied by MDTA. Beyond this date it is hard to predict the maintenance or rehabilitation projects that will be required or the costs associated with those projects. Prior to the Bay Bridge LCCA, MDTA completed several Bay Bridge studies, including a study prepared by the Bay Crossing Task Force in 2006, to understand future needs for the Bay Bridge and travel across the Bay. In addition, the Maryland State Highway Administration (SHA) is currently evaluating capacity enhancements for the Severn River Bridge to address congestion on US 50/301 in the eastbound direction at that location. These previous and on‐going studies were reviewed as part of the Bay Bridge LCCA Study. MDTA coordinated with SHA during the development of the Bay Bridge LCCA, including traffic modeling and growth assumptions, and ongoing and planned US 50/301 corridor improvements. The Bay Bridge LCCA focused on current and future traffic operations, the costs needed to maintain or remove the existing bridges, construct new structures, and provide roadway improvements. The study did not include an analysis of the user costs or benefits, or any of the operational issues associated with lane or roadway closures while maintaining the existing Bay Bridge structures.

Gibson Island Severna Park
bor
Cape St Claire
Arnold
@
@) Ai:i:�y
Annapolis �-----�-------
@ Study Limits • MD 70/Rowe Blvd.
ater
ontowne
\.1/io: Hillsmere 9•11r1
Selby-On-The-Bay
68
�est Rive-
Galesville Shady Side
Shores
J ARUNDEL � ONTHEBAY o�
',i.
•
sandy Poin�State Park
8ay 8r:,., 1"9e
Chesapeake Bay
@
Stevensville
Kent Island
.@ Eastern Neck National
Wildlife Refuge
445
Kent Narrows
Queenstown Harbor [
Study Limits • US 50/301 Split
@
..
Wye Island Natural Resources ...
Bay Bridge
Life Cycle Cost Analysis
301
l���L--S-tu
_
d
_
y1
A
_
r
_
e
_
a __ -1
Figure 1.1

US 50 / 301 / WILLIAM PRESTON LANE JR. MEMORIAL (BAY) BRIDGE LIFE CYCLE COST ANALYSIS REPORT
3
B. Existing Conditions
The existing transportation network within the study area was reviewed. In addition, major community and environmental resources were identified.
1. Bay BridgeThe existing Bay Bridge consists of two structures. The southern structure carries two lanes of eastboundUS 50/301 across the Chesapeake Bay. The northern structure carries three lanes of westbound US50/301 across the Bay. Both structures are configured to allow two‐way, “contra‐flow”, operation. Thetypical contra‐flow operation uses the left lane of the westbound structure for eastbound traffic. Contra‐flow operations are typically only used on the eastbound structure when there is maintenance or anincident on the westbound span. Roadway crossovers on both sides of the bridge facilitate contra‐flowoperations.
Additional information on the existing structures is presented in Section II.
2. Approach RoadwaysUS 50/301 is a six‐lane freeway through the study area. There are numerous auxiliary lanes at andbetween interchanges. The mainline varies from a closed median to an open grass median through thestudy limits. Shoulder widths also vary through the study limits with, in general, full 10 to 12 foot wideright shoulders and narrower 2 to 10 foot wide left shoulders.
There are six interchanges within the study limits on the western shore: MD 70, MD 2/MD 450, Bay Dale Drive, MD 179, Whitehall Road, and Oceanic Drive. The Whitehall Road interchange is a right‐in/right‐out interchange along eastbound US 50/301 only. There are 13 interchanges within the study limits on the Eastern Shore with MD 8, Chester River Beach Road, Nesbit Road, and the US 50/301 split being “traditional” interchanges and the other nine right‐in/right‐out interchanges. In addition to the many interchanges, there are frontage roads located along both directions of the mainline from just west of MD 179 to Oceanic Drive on the western shore and intermittently from MD 8 to just east of Nesbit Road on the Eastern Shore.
In addition to the Bay Bridges, there are numerous other structures within the study limits which include two major bridges: the Severn River Bridge between MD 70 and MD 450 on the western shore and the Kent Narrows Bridge connecting Kent Island and the remainder of the Eastern Shore. Neither bridge has full shoulders. SHA is currently studying improvements to reconfigure the Severn River Bridge to provide an additional eastbound lane without widening the bridge.
The Bay Bridge toll plaza is located along eastbound US 50/301 on the western shore between the Oceanic Drive interchange and the western landing of the bridge (only eastbound vehicles are tolled). The toll plaza includes 11 toll lanes and is operated to allow vehicles to access both the eastbound and westbound bridge if contra‐flow operations are in effect.
3. Environmental ResourcesThe most significant environmental feature within the study limits is the Chesapeake Bay, but on thewestern shore, the US 50/301 mainline also crosses the Severn River and several smaller tributaries thatfeed the Bay. On the Eastern Shore, the mainline crosses Kent Narrows (which separates Kent Island fromthe remainder of the Eastern Shore), Thompson Creek, and several smaller tributaries that feed the Bay.

US 50 / 301 / WILLIAM PRESTON LANE JR. MEMORIAL (BAY) BRIDGE LIFE CYCLE COST ANALYSIS REPORT
4
There are numerous wetlands adjacent to the mainline and interchanges. US 50/301 is within the 100‐year floodplain adjacent to the east and west Bay shores and near Kent Narrows.
The mainline runs adjacent to Sandy Point State Park on the western shore and Terrapin Beach Park on the Eastern Shore. US 50/301 passes through several forested areas on the western shore and on the eastern limits of the study area on the Eastern Shore. US 50/301 is adjacent to the Stevensville Historic District located on the Eastern Shore just east of MD 8.

US 50 / 301 / WILLIAM PRESTON LANE JR. MEMORIAL (BAY) BRIDGE LIFE CYCLE COST ANALYSIS REPORT
5
II. BAY BRIDGE STRUCTURAL EVALUATION
The Bay Bridge LCCA included an evaluation of the existing Bay Bridge structures to identify programmed and future rehabilitation and ongoing maintenance needed to keep the structures serviceable through the study time frame. The costs for bridge rehabilitation and maintenance were computed and included in the overall life cycle cost analysis.
A. Current Bridge Condition
MDTA has an ongoing condition assessment program for the Bay Bridge, as it does for all its major structures, which includes visual inspections and structural evaluations. Condition statements are used to describe structural condition and are defined as follows:
a. Very good condition – no problems noted.b. Good condition – some minor problems.c. Satisfactory condition – structural elements show some minor deterioration.d. Fair condition – all primary structural elements are sound but may have minor section loss,
cracking, spalling, or scour.e. Poor condition – advanced section loss, deterioration, spalling, or scour.f. Serious condition – loss of section, deterioration, spalling or scour have seriously affected
primary structural components.
Sections A.1 and A.2 below provide a condition summary of the eastbound and westbound spans, based on the 2014 Executive Summary Report (Bay Bridge inspection report).
1. Eastbound Bridge ConditionOverall, the eastbound bridge is in satisfactory condition. The general condition of the major bridgeelements is as follows:
a. The bridge deck and approach slabs are in fair condition.b. The superstructure members in the beam spans, girder spans, deck truss spans, through‐truss
spans, and suspension spans are in satisfactory condition.c. The concrete abutments, concrete piers and pier caps, concrete anchorages and steel towers are
in satisfactory condition.d. The substructure and channel are in satisfactory condition.
There are Priority 1 Repair contracts (for defects identified as needing repair within one year of being identified) presently under construction addressing various bridge deck and approach deficiencies, various superstructure deficiencies, and various substructure deficiencies. In addition, other contracts, including painting of the superstructure, structural steel, and bearings are under development.
2. Westbound Bridge ConditionOverall, the westbound bridge is in fair condition. The general condition of the major bridge elements isas follows:
a. The bridge deck slabs and approach slabs are in fair condition.b. The superstructure members in the beam spans, girder spans, deck truss spans, through‐truss
spans and suspension spans are in fair condition.c. The concrete abutments, concrete piers and pier caps, concrete anchorages and steel towers are
in fair condition.d. The substructure and channel are in satisfactory condition.

US 50 / 301 / WILLIAM PRESTON LANE JR. MEMORIAL (BAY) BRIDGE LIFE CYCLE COST ANALYSIS REPORT
6
There are Priority 1 Repair contracts presently under construction addressing various bridge deck and approach deficiencies. There are Priority 1 Repair and Painting contracts presently under construction addressing various superstructure deficiencies and various substructure deficiencies.
B. Programmed/Future Maintenance and Rehabilitation Projects A study of the past and future anticipated rehabilitation costs for the eastbound and westbound Bay Bridge structures was performed as part of the Bay Bridge LCCA to present probable expenditures to maintain the bridges in satisfactory condition through the year 2065. At that time, the eastbound bridge will have been in service for 113 years and the westbound bridge for 92 years. The projected rehabilitation expenditures are based on current conditions, load rating analyses, and MDTA’s long‐range needs. It is difficult to project with any measure of certainty the required rehabilitation and maintenance needs beyond 2065. However, it is anticipated that maintaining the serviceability of these structures beyond 2065 will require major superstructure and substructure rehabilitation/replacement. These major replacement projects beyond 2065 will likely necessitate partial closures of the structures during construction, which could include regular short‐term closures during peak periods and long‐term lane closures. It may also be necessary to close an entire structure for short durations. These more extensive lane closure requirements would make this level of rehabilitation problematic without prior provision for additional capacity. MDTA has more than 20 rehabilitation projects programed for both existing structures, which include on‐call structural repairs, painting, deck rehabilitation, suspension span rehabilitation, and numerous smaller projects to address bridge structural, traffic, and electrical elements. Based on the current condition of the Bay Bridge structures, numerous future projects are anticipated. These include suspension span rehabilitation, deck replacement, superstructure, and substructure replacement/repairs, painting, future maintenance, and capital improvements.
C. Maintenance and Rehabilitation Costs The total past and future expenditures (through 2065) for each Bay Bridge structure are summarized in Table 2.1. The cumulative costs are depicted in Figure 2.1. The future costs were included as part of the life cycle costs presented in Section V.
Table 2.1. Bay Bridge Rehabilitation, Maintenance, and Improvement Costs (2014 dollars)
Eastbound Bridge Costs (in millions of dollars)
Rehabilitation Costs from 1952 to 2014 $217
Anticipated Rehabilitation and Maintenance Costs from 2015 to 2065
$1,227
Westbound Bridge (in millions of dollars)
Rehabilitation Costs from 1973 to 2014 $212
Anticipated Rehabilitation and Maintenance Costs from 2015 to 2065
$1,453
Total Anticipated Future Costs for Both Structures $2,680

US 50 / 301 / WILLIAM PRESTON LANE JR. MEMORIAL (BAY) BRIDGE LIFE CYCLE COST ANALYSIS REPORT
7
Figure 2.1. Eastbound and Westbound Bay Bridge Cumulative Rehabilitation Costs – Both Structures Combined
0.0
0.5
1.0
1.5
2.0
2.5
3.0
1970 1980 1990 2000 2010 2020 2030 2040 2050 2060
Cost in Billions (2015
$)
Year
Cumulative Costs
Trendline
EB Bridge: Full Repainting
EB Bridge: Deck Replacement
WB Bridge: Deck Replacement & P/S Beam Replacement
WB Bridge: Suspension Span Rehabilitation
EB Bridge: Full Repainting & Deck Replacement
Anticipated Future CostsPast Costs

US 50 / 301 / WILLIAM PRESTON LANE JR. MEMORIAL (BAY) BRIDGE LIFE CYCLE COST ANALYSIS REPORT
8
III. EXISTING BRIDGE CAPACITY AND POTENTIAL FUTURE TRAFFIC DEMAND
This chapter discusses the traffic analyses and forecasting efforts performed as part of the Bay Bridge LCCA. After establishing the hourly traffic carrying capacity of the current bridges, existing and future traffic operations were evaluated to assess when the existing bridge capacity would be insufficient to accommodate future traffic demand. Both the Bay Bridge and the approach roadways within the study area were analyzed.
A. Existing Bridge Capacity
1. Data CollectionTraffic volume data from two sources were obtained to analyze existing traffic patterns across the bridge. First, data from the Bay Bridge toll plaza were obtained for the months of October 2012, March 2013, May 2013, and August 2013. In addition, data from a new permanent traffic recording station just east of the toll plaza were obtained from June 19, 2013 through September 12, 2013.
The toll plaza data provide highly accurate volume counts for every day of the year, but only for the eastbound direction. The permanent traffic recording station collects data for both directions of traffic, but with a somewhat lower degree of accuracy.
2. Hourly CapacityThe capacity of the Bay Bridge is a fundamental metric for evaluating its operational performance. Roadway capacity is typically estimated using the techniques outlined in the Highway Capacity Manual (HCM). These traditional analysis methods assume an ideal per‐lane capacity, and apply adjustment factors to account for lane and shoulder width, grade, truck percentage, traffic composition, etc., to develop an appropriate capacity estimate.
Although traditional analysis methods based on the HCM generally provide reasonable estimates of capacity for basic freeway segments, estimating the capacity of the Bay Bridge is more challenging due to its numerous unique characteristics, including long segments at a high elevations over open water (causing some drivers to adjust speed to take in picturesque views, and others to change lanes and reduce speed out of a fear of heights), contra‐flow operation on the westbound span, and highly seasonal traffic in the summer months with drivers that may be unfamiliar with the area. For these reasons, establishing an accurate capacity for the bridge has been challenging.
Over the years, a number of capacity estimates have been developed based on a variety of traditional theoretical analysis methods, as illustrated in Table 3.1.
In addition to these prior capacity estimates, traffic volumes have also been recorded or observed during peak travel periods at various times over the past decade. A summary of historic observed maximum volumes is provided in Table 3.2.

US 50 / 301 / WILLIAM PRESTON LANE JR. MEMORIAL (BAY) BRIDGE LIFE CYCLE COST ANALYSIS REPORT
9
Table 3.1: Previous Capacity Estimates (vehicles/hour) of the Bay Bridge
Source
Eastbound Westbound
2Lanes
per Lane3 Lanes (w/ contra‐
flow)
per Lane
2 Lanes (w/ contra‐
flow)
per Lane
3 Lanes
per Lane
1/13/2009 3,985 1,993 5,585 1,862 3,650 1,825 5,870 1,957
3/18/2005 3,280 1,640 4,890 1,630 3,340 1,670 5,070 1,690
4,250 2,125 5,880 1,960 3,710 1,855 6,180 2,060
6/2005 3,400 1,700 4,900 1,633 3,200 1,600 5,100 1,700
3,985 1,993 5,585 1,862 3,650 1,825 5,870 1,957
Table 3.2: Historic Observed Maximum Volumes (vehicles/hour) on the Bay Bridge
Date Eastbound Westbound
2 Lane per Lane 3 Lane per Lane 2 Lane per Lane 3 Lane per Lane
Max. Obs. 2002‐
2004 3,950 1,975 4,890 1,630 3,170 1,585
Max. Obs.
Summer 2003
and 2004
4,892 1,631
Max. Obs.
10/2006 thru
9/2007
4,722 1,574
Max. Obs.
10/2006 thru
10/2008
4,955 1,652
In 2013, a permanent count station was installed at the Bay Bridge that continuously monitors traffic volumes on the bridge. Unlike the toll plaza data, which only provides data in the eastbound direction, the count station provides data in both directions. Data collected from this station during summer 2013 showed the highest observed volumes in each direction, under one‐way and contra‐flow conditions (see Figure 3.1). These analyses revealed that the maximum observed traffic flow never exceeded 3,495 vehicles/hour in the eastbound direction, and 4,420 vehicles/hour in the westbound direction. Under contra‐flow operations, the maximum observed traffic flows were 4,400 vehicles/hour and 3,355 vehicles/hour in the eastbound and westbound direction, respectively. These values are below the theoretical capacity estimates shown in Table 3.1.
Therefore, rather than using theoretical methods to estimate the capacity of the Bay Bridge, it was established based on actual traffic volumes measured on the bridge during some of the heaviest periods of traffic demand of the year (considered to be at or above “capacity” conditions). Based on the continuous data collected at the permanent count station, and in consultation with MDTA, the directional capacities in Table 3.3 were established for this study. Essentially, these are assumed to be the highest volumes of traffic that the bridge can carry under ideal conditions. If the demand (volume) exceeds these capacity thresholds, traffic operations would break down (Level of Service (LOS) F). Accordingly, the threshold for LOS E was selected to be 150 vehicles/hour/lane below the LOS F thresholds shown in Table 3.3.

EA
ST
BO
UN
DW
ES
TB
OU
ND
Highest Observed Daily Volumes; Summer 2013
Chesapeake Bay BridgeLife Cycle Cost Analysis
Figure 3.1
0
500
1,000
1,500
2,000
2,500
3,000
3,500
4,000
4,500
5,000
6/18/2013
6/19/2013
6/20/2013
6/21/2013
6/22/2013
06/23/13 Sun
6/24/2013
6/25/2013
6/26/2013
6/27/2013
6/28/2013
6/29/2013
06/30/13 Sun
7/1/2013
7/2/2013
7/3/2013
7/4/2013
7/5/2013
7/6/2013
07/07/13 Sun
7/8/2013
7/9/2013
7/10/2013
7/11/2013
7/12/2013
7/13/2013
07/14/13 Sun
7/15/2013
7/16/2013
7/17/2013
7/18/2013
7/19/2013
7/20/2013
07/21/13 Sun
7/22/2013
7/23/2013
7/24/2013
7/25/2013
7/26/2013
7/27/2013
07/28/13 Sun
7/29/2013
7/30/2013
7/31/2013
8/1/2013
8/2/2013
8/3/2013
08/04/13 Sun
8/5/2013
8/6/2013
8/7/2013
8/8/2013
8/9/2013
8/10/2013
08/11/13 Sun
8/12/2013
8/13/2013
8/14/2013
8/15/2013
8/16/2013
8/17/2013
08/18/13 Sun
8/19/2013
8/20/2013
8/21/2013
8/22/2013
8/23/2013
8/24/2013
08/25/13 Sun
8/26/2013
8/27/2013
8/28/2013
8/29/2013
8/30/2013
8/31/2013
09/01/13 Sun
9/2/2013
9/3/2013
9/4/2013
9/6/2013
9/7/2013
09/08/13 Sun
9/9/2013
9/10/2013
9/11/2013
9/12/2013
9/13/2013
Westbound Bay Bridge Daily Highest Observed Volumes, June 18 ‐ September 13, 2013
3 Lanes 2 Lanes
0
500
1,000
1,500
2,000
2,500
3,000
3,500
4,000
4,500
5,000
6/18/2013
6/19/2013
6/20/2013
6/21/2013
6/22/2013
06/23/13 Sun
6/24/2013
6/25/2013
6/26/2013
6/27/2013
6/28/2013
6/29/2013
06/30/13 Sun
7/1/2013
7/2/2013
7/3/2013
7/4/2013
7/5/2013
7/6/2013
07/07/13 Sun
7/8/2013
7/9/2013
7/10/2013
7/11/2013
7/12/2013
7/13/2013
07/14/13 Sun
7/15/2013
7/16/2013
7/17/2013
7/18/2013
7/19/2013
7/20/2013
07/21/13 Sun
7/22/2013
7/23/2013
7/24/2013
7/25/2013
7/26/2013
7/27/2013
07/28/13 Sun
7/29/2013
7/30/2013
7/31/2013
8/1/2013
8/2/2013
8/3/2013
08/04/13 Sun
8/5/2013
8/6/2013
8/7/2013
8/8/2013
8/9/2013
8/10/2013
08/11/13 Sun
8/12/2013
8/13/2013
8/14/2013
8/15/2013
8/16/2013
8/17/2013
08/18/13 Sun
8/19/2013
8/20/2013
8/21/2013
8/22/2013
8/23/2013
8/24/2013
08/25/13 Sun
8/26/2013
8/27/2013
8/28/2013
8/29/2013
8/30/2013
8/31/2013
09/01/13 Sun
9/2/2013
9/3/2013
9/4/2013
9/6/2013
9/7/2013
09/08/13 Sun
9/9/2013
9/10/2013
9/11/2013
9/12/2013
9/13/2013
Eastbound Bay Bridge Daily Highest Observed Volumes, June 18 ‐ September 13, 2013
3 Lanes 2 Lanes
3 Lanes (standard operation)2 Lanes (contra-flow operation)
Legend

US 50 / 301 / WILLIAM PRESTON LANE JR. MEMORIAL (BAY) BRIDGE LIFE CYCLE COST ANALYSIS REPORT
11
Table 3.3: Recommended Bridge Capacity Values (vehicles/hour)
Eastbound Westbound
2 Lanes 3 Lanes 2 Lanes 3 Lanes
Per Lane
2 Lanes Per Lane 3 Lanes Per Lane
2 Lanes Per Lane
3 Lanes
1,600 3,200 1,600 (EB Span) 1,500 (contra‐flow lane)
4,700 1,600 3,200 1,600 4,800
B. Projected Traffic Growth
1. Bay BridgeForecasts for Bay Bridge traffic were prepared for the year 2040. The forecasts were developed bycombing four different components:
1. Historic volumes,2. Growth trends,3. Output from the Integrated Bay‐Nice Model (IBNM), and4. Trend line analysis.
Historic volumes for 1995 through 2013 were obtained from the Bay Bridge toll plaza. The average annual daily traffic volumes are provided in Table 3.4. Between 1995 and 2007, traffic volumes increased annually, reaching a maximum of 79,900 vehicles per day (vpd) in 2007. The growth from 1995 to 2007 represents an annual linear growth rate of 2.5 percent. Following the 2008 recession, traffic volumes in 2009 decreased and by 2013 had still not returned to the levels seen in 2007. In fact, from 2007 to 2012 traffic decreased at a rate of 0.7 percent per year. These volume fluctuations mirror nationwide trends. Combining the prior growth with the more recent declines in traffic volumes, for the entire period from 1995 – 2013, traffic volumes grew at an annual rate of 1.6 percent.
Table 3.4: Bay Bridge Historic Daily Volumes
Year Average Annual
Daily Traffic
1995 55,200
2000 64,900
2005 71,100
2006 72,700
2007 73,900
2008 73,300
2009 69,800
2010 71,200
2011 72,300
2012 71,700
2013 70,700
The Integrated Bay‐Nice Model (IBNM) is a travel demand model that was developed for MDTA as part of the 2006 Bay Bridge Task Force effort. This travel demand model combined the travel demand models

US 50 / 301 / WILLIAM PRESTON LANE JR. MEMORIAL (BAY) BRIDGE LIFE CYCLE COST ANALYSIS REPORT
12
from four metropolitan areas (Fredericksburg Area Metropolitan Planning Organization, National Capital Transportation Planning Board, Baltimore Regional Transportation Board, and Delaware Department of Transportation) into a single model. Development of this single model was needed to study regional traffic patterns, specifically, potential shifts in traffic patterns between the Eastern and western shores of Delaware, Maryland and Virginia, because the four source models used the Chesapeake Bay as their respective model boundaries. Only by combining the four models was it possible to study traffic flows across the Bay Bridge as well as on potential parallel routes such as I‐95 through Cecil County, Maryland and New Castle County, Delaware.
The original IBNM had a 2005 base year and 2030 horizon year. However, the goal for this study was to develop year 2040 traffic forecasts, ten years beyond the horizon year of the original IBNM. Therefore, the IBNM was updated for this study to year 2035 using updated information from the respective Metropolitan Planning Organizations. Specifically, the base and future year model networks were updated with new roadways that were constructed since 2005 (such as the Intercounty Connector, MD 200) or are planned to be in place by 2035 (such as US 301 in Delaware and US 50 improvements betweenUS 301 and MD 404), and verified that the land use assumptions for 2030 in the original IBNM modelnow more closely reflected 2035 conditions.
It should be noted that the updated IBNM was not sensitive to the number of lanes provided across the Bay. That is, a capacity increase on the Bay Bridge did not result in a higher assignment of traffic under 2035 conditions. This result would indicate that all the traffic that theoretically wants to use the bridge can use it, and that traffic volumes are either not constrained by capacity or alternative routes are not attractive enough for any excess demand, even in 2035, to shift their travel route. It should be noted, however, that the IBNM represents average weekday conditions, and does not account for the large seasonal fluctuations seen on the Bay Bridge.
Final projected traffic growth for the Bay Bridge was estimated by combining the historic volumes, growth trends, and IBNM output into one regression analysis. Essentially, the IBNM output was considered as an additional future data point to the historic volumes, so that the growth factor was based both on historic data as well as future projected volume. Through an iterative process, and comparing projections with other studies for reasonableness, including the forecasts being prepared simultaneously by SHA for the nearby Severn River Bridge Study using the Maryland Statewide Model, the following growth assumptions were established for this study:
No growth through 2016 (accounts for the anticipated lag in return to typical traffic volumegrowth following the 2008‐2009 recession), and
1.3 percent per year linear growth from 2017 through 2040.
Under these assumptions, the resulting 2040 average daily volume is projected to be 92,800 vehicles per day. Table 3.5 provides a comparison of the final projected volume to other recently completed forecasts for the Bridge.

US 50 / 301 / WILLIAM PRESTON LANE JR. MEMORIAL (BAY) BRIDGE LIFE CYCLE COST ANALYSIS REPORT
13
Table 3.5: Summary of Forecasts
Traffic Forecast Description Annual Growth Rate
Existing 2013
2025 2030 2035 2040
IBNM Raw Model Output 3.3% 82,072 130,587 N/A N/A
Trend Line Volume Forecasts 1.24% 70,700 91,600 96,300 101,000
Final Volume Forecasts (Zero Growth Through 2016)
1.3% 70,700 83,600 88,200 92,800
Maryland Statewide Model 89,300
Bay Bridge T&R Forecast 71,200 (2023)
Bay Bridge Needs Forecast (Summer Weekend)
135,000
As discussed earlier, the Bay Bridge experiences significant seasonal traffic volume fluctuations. During summer months, weekend traffic destined for the Maryland and Delaware beaches results in severe congestion on the eastbound approach on Friday afternoons, and on the westbound approach on Sunday evenings. To estimate both the monthly variation as well as the diurnal patterns for each weekday, hourly traffic counts at the Bay Bridge toll plaza and the permanent count station were analyzed. Daily and hourly correction factors for summer and non‐summer traffic conditions were developed from the entire data set to obtain typical hourly eastbound and westbound traffic volumes, and for both summer and non‐summer periods for the following days:
Monday through Thursday average,
Friday,
Saturday, and
Sunday.
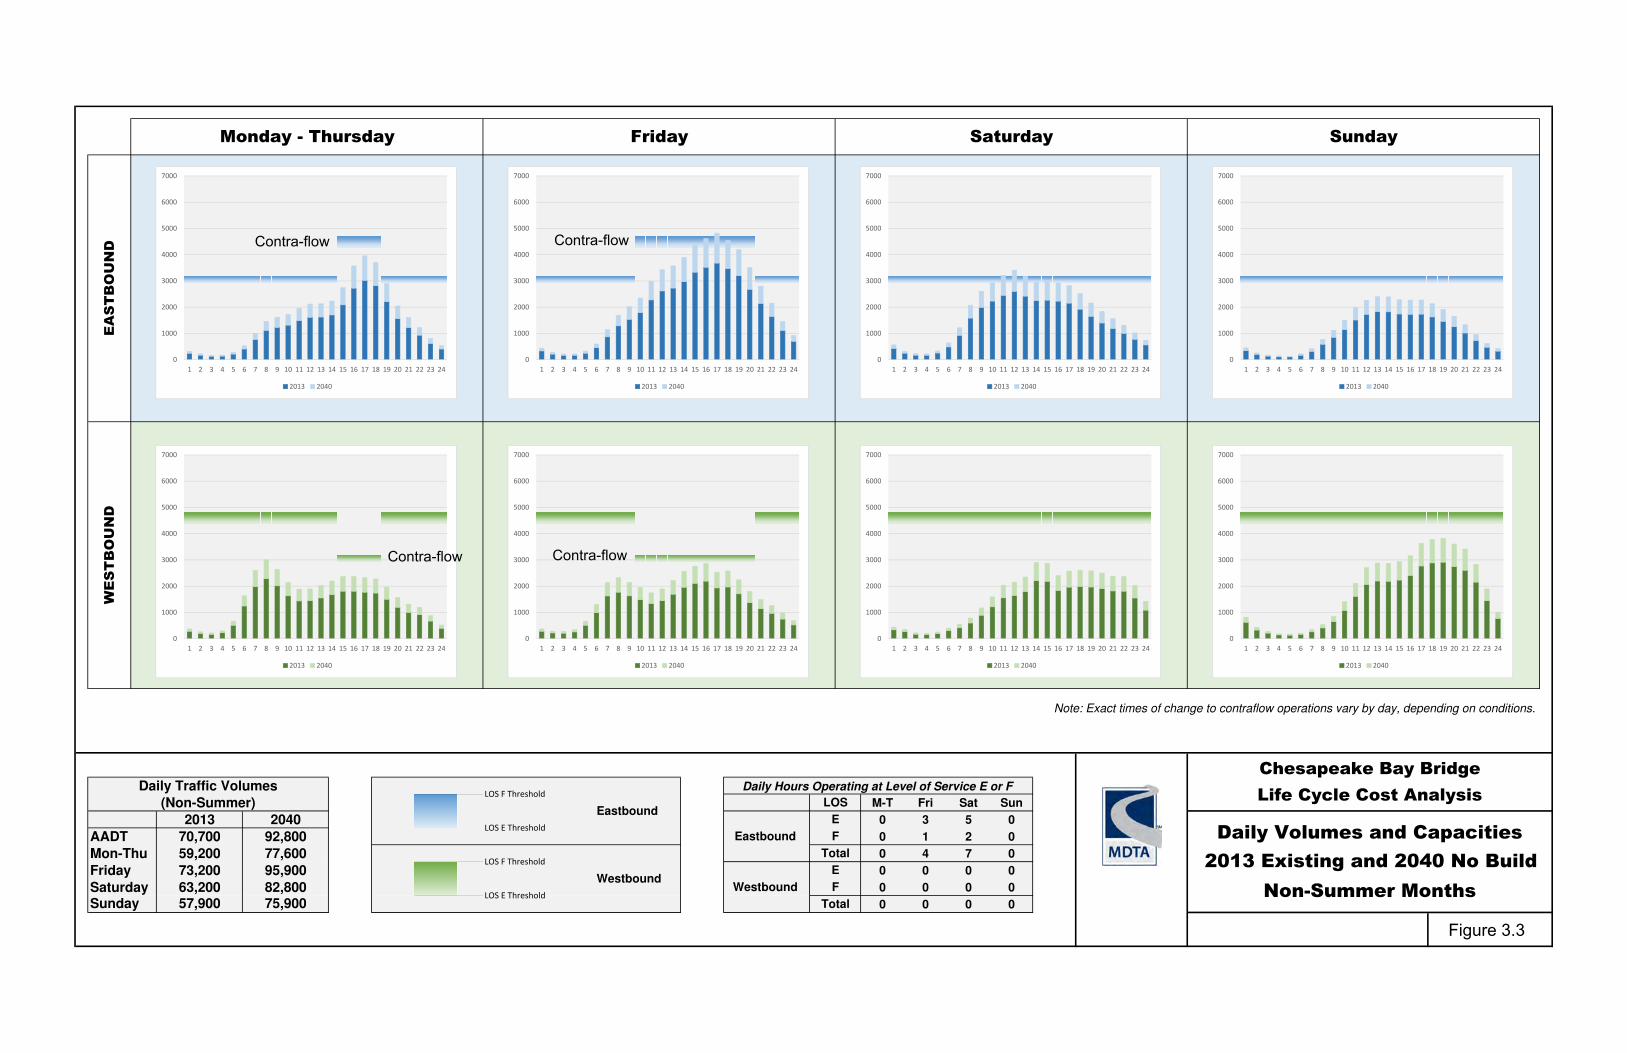
Volumes were developed for summer and non‐summer conditions for both 2013 and 2040. Typical summer conditions were assumed to occur in August; non‐summer conditions were assumed to occur in October. Table 3.6 provides a summary of 2013 and 2040 projected daily volumes. Figures 3.2 and 3.3 show the corresponding hourly volumes for all scenarios.
Table 3.6: Projected Daily Volumes
Time Period Summer Non‐Summer
2013 2040 2013 2040
Annual Average 70,700 92,800 70,700 92,800
Monday – Thursday 86,200 113,100 59,200 77,600
Friday 94,300 128,800 73,200 95,900
Saturday 90,200 118,400 63,200 82,800
Sunday 95,900 125,900 57,900 75,900

Note: Exact times of change to contraflow operations vary by day, depending on conditions.
M-T Fri Sat Sun
3 3 3 1
AADT 5 6 6 8
Mon-Thu 8 9 9 9
Friday 1 0 2 4
Saturday 3 5 1 7
Sunday 4 5 3 11125,900
2013 2040
Daily Traffic Volumes
(Summer)
Figure 3.2
E
90,200LOS E Threshold
F
95,900 Total
Daily Volumes and Capacities
2013 Existing and 2040 No Build Summer Months
70,700 F
86,200LOS F Threshold
Total
94,300Westbound
Westbound
Chesapeake Bay Bridge
Life Cycle Cost AnalysisLOS F ThresholdDaily Hours Operating at Level of Service E or F
EastboundLOS
LOS E Threshold
Eastbound
E
92,800
113,100
123,800
118,400
WESTB
OU
ND
Monday - Thursday Friday Saturday Sunday
EA
STB
OU
ND
0
1000
2000
3000
4000
5000
6000
7000
1 2 3 4 5 6 7 8 9 10 11 12 13 14 15 16 17 18 19 20 21 22 23 24
2013 2040
0
1000
2000
3000
4000
5000
6000
7000
1 2 3 4 5 6 7 8 9 10 11 12 13 14 15 16 17 18 19 20 21 22 23 24
2013 2040
0
1000
2000
3000
4000
5000
6000
7000
1 2 3 4 5 6 7 8 9 10 11 12 13 14 15 16 17 18 19 20 21 22 23 24
2013 2040
0
1000
2000
3000
4000
5000
6000
7000
1 2 3 4 5 6 7 8 9 10 11 12 13 14 15 16 17 18 19 20 21 22 23 24
2013 2040
0
1000
2000
3000
4000
5000
6000
7000
1 2 3 4 5 6 7 8 9 10 11 12 13 14 15 16 17 18 19 20 21 22 23 24
2013 2040
0
1000
2000
3000
4000
5000
6000
7000
1 2 3 4 5 6 7 8 9 10 11 12 13 14 15 16 17 18 19 20 21 22 23 24
2013 2040
0
1000
2000
3000
4000
5000
6000
7000
1 2 3 4 5 6 7 8 9 10 11 12 13 14 15 16 17 18 19 20 21 22 23 24
2013 2040
0
1000
2000
3000
4000
5000
6000
7000
1 2 3 4 5 6 7 8 9 10 11 12 13 14 15 16 17 18 19 20 21 22 23 24
2013 2040
Contra-flow Contra-flow Contra-flow
Contra-flowContra-flowContra-flow
Note: Exact times of change to contraflow operations vary by day, depending on conditions.
M-T Fri Sat Sun
0 3 5 0
AADT 0 1 2 0
Mon-Thu 0 4 7 0
Friday 0 0 0 0
Saturday 0 0 0 0
Sunday 0 0 0 0Total
Daily Volumes and Capacities
2013 Existing and 2040 No BuildNon-Summer Months
F
LOS F ThresholdTotal
Figure 3.3
E
LOS E ThresholdF
WestboundWestbound
Chesapeake Bay Bridge
Life Cycle Cost AnalysisLOS F ThresholdDaily Hours Operating at Level of Service E or F
EastboundLOS
LOS E Threshold
Eastbound
E
Daily Traffic Volumes
(Non-Summer)
2013 2040
WESTBOUND
Monday - Thursday Friday Saturday Sunday
EASTBOUND
63,200 82,80057,900 75,900
70,700 92,800
59,200 77,600
73,200 95,900
0
1000
2000
3000
4000
5000
6000
7000
1 2 3 4 5 6 7 8 9 10 11 12 13 14 15 16 17 18 19 20 21 22 23 24
2013 2040
0
1000
2000
3000
4000
5000
6000
7000
1 2 3 4 5 6 7 8 9 10 11 12 13 14 15 16 17 18 19 20 21 22 23 24
2013 2040
0
1000
2000
3000
4000
5000
6000
7000
1 2 3 4 5 6 7 8 9 10 11 12 13 14 15 16 17 18 19 20 21 22 23 24
2013 2040
0
1000
2000
3000
4000
5000
6000
7000
1 2 3 4 5 6 7 8 9 10 11 12 13 14 15 16 17 18 19 20 21 22 23 24
2013 2040
0
1000
2000
3000
4000
5000
6000
7000
1 2 3 4 5 6 7 8 9 10 11 12 13 14 15 16 17 18 19 20 21 22 23 24
2013 2040
0
1000
2000
3000
4000
5000
6000
7000
1 2 3 4 5 6 7 8 9 10 11 12 13 14 15 16 17 18 19 20 21 22 23 24
2013 2040
0
1000
2000
3000
4000
5000
6000
7000
1 2 3 4 5 6 7 8 9 10 11 12 13 14 15 16 17 18 19 20 21 22 23 24
2013 2040
0
1000
2000
3000
4000
5000
6000
7000
1 2 3 4 5 6 7 8 9 10 11 12 13 14 15 16 17 18 19 20 21 22 23 24
2013 2040
Contra-flow
Contra-flow
Contra-flow
Contra-flow

US 50 / 301 / WILLIAM PRESTON LANE JR. MEMORIAL (BAY) BRIDGE LIFE CYCLE COST ANALYSIS REPORT
16
2. Approach RoadwaysIn addition to Bay Bridge traffic forecasts, 2040 weekday peak hour volume projections were also developed for the mainline segments of US 50/301 on both the east and west sides of the bridge. The main purpose of the approach roadway projections was to determine, at a planning‐level, the number of mainline lanes needed to reasonably accommodate future traffic demand within the study area from Rowe Boulevard to the US 50/US 301 split on Maryland’s Eastern Shore. Detailed cross‐street projections were not developed.
Weekday peak hour 2040 forecasts for the approach roadways were developed by holding the 2040 typical daily peak hour volumes at the bridge, and adding/subtracting ramp volumes to the east and west. Ramp volumes were generally grown by 0.5 percent per year as most areas along US 50 are well developed; however, based on a review of the 2010 Queen Anne’s County Comprehensive Plan Update, volumes on the Jackson Creek Road, Chester River Road, and Station Lane/VFW Road interchange ramps were grown at 1, 1.5 and 1 percent per year, respectively, to account for anticipated development on Kent Island. Ramp volumes at the MD 70, MD 2/450, Bay Dale Drive and MD 179 interchanges were matched to those developed for the US 50 Severn River Bridge Study, which is currently underway by SHA. The resulting peak hour volumes on the mainline represent an annual growth of approximately 1.3 percent per year.
Summer Friday peak hour volumes were developed by holding the 2040 Friday peak hour bridge volumes, and adding/subtracting the 2040 weekday peak hour ramp volumes along the mainline.
Summer Sunday peak hour volumes were developed by holding the 2040 Sunday peak hour bridge volumes, reducing the ramp volumes by a factor based on the ratio between typical peak hour and peak Sunday volumes, and then adding/subtracting the adjusted ramp volumes along the mainline. The ramp volume adjustment factors were estimated by calculating the ratio between typical Friday peak and typical Sunday peak volumes for a limited number of ramps for which data was available. Using this process, the ramp volumes on the western shore were reduced by 30 percent, and ramp volumes on the Eastern Shore were reduced by 20 percent.
As a final check on the Friday and Sunday volumes, the ratio of Friday peak/weekday peak and Sunday peak/weekday peak mainline volumes at the eastern and western end of the study area were compared to existing ratios available from nearby automatic traffic recorder (ATR) stations (ATR #24 at the Anne Arundel County/Prince George’s County line and ATR #22 south of Longwoods Road in Talbot County). This check confirmed that the computed mainline volumes at the ends of the study area were consistent with weekday/Friday/Sunday patterns found at the ATRs.
C. 2013 and 2040 Operational Analyses
1. Bay BridgeThe hourly volumes for all scenarios were compared with the LOS E/F thresholds discussed in Section III.A. Based on queue observations at the Bay Bridge in the summer of 2013, it was determined that queues begin to form when traffic volumes reach approximately 50 percent of the range between LOS E and LOS F conditions. Thus, queue lengths were estimated by calculating the number of vehicles that exceed this threshold in each hour, and reassigning those vehicles to the next hour. The queue length was then computed by multiplying the total “unmet demand” by an average vehicle length of 25 feet,
US 50 / 301 / WILLIAM PRESTON LANE JR. MEMORIAL (BAY) BRIDGE LIFE CYCLE COST ANALYSIS REPORT
17
and dividing that length by the number of lanes that is available for vehicles to queue (3 lanes). An average travel speed of 5 mph in the queue was assumed to estimate queue delay.
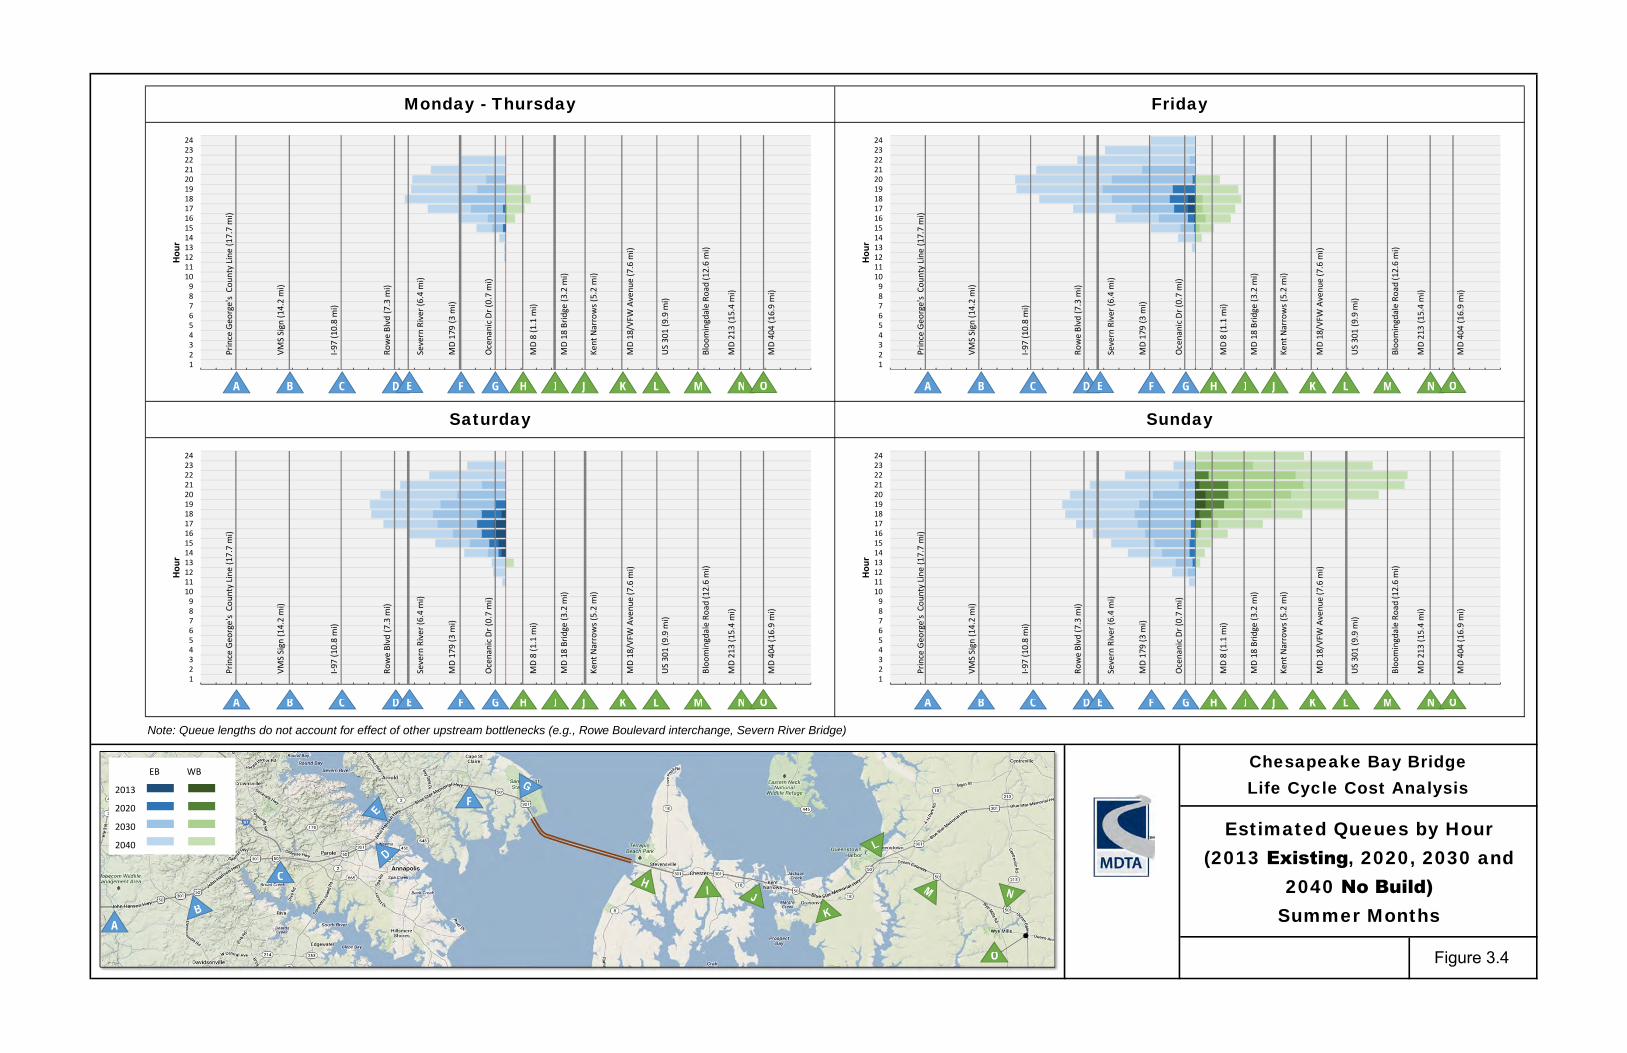
The results of the capacity analysis for the Bay Bridge are shown in Figures 3.2 and 3.3. Projected queue lengths, with landmarks indicating the potential extent that queues may reach under the various scenarios, are shown in Figures 3.4 and 3.5. This information is also summarized in Figure 3.6, which shows in which year and under which conditions (summer or non‐summer, weekday, Friday, Saturday or Sunday) queues are expected to reach certain lengths. For example, on Fridays during the summer, maximum queues are projected to reach 3 miles by 2025 and 10.8 miles by 2040. During non‐summer months, queues would be expected to reach these landmarks beyond 2065.
Examination of Figures 3.4 through 3.5 yields the following observations:
Non‐Summer Months:
Currently (2013), volumes do not yet reach capacity.
By 2040, volumes will reach capacity on: Friday evenings in the eastbound direction for 1 hour with up to 1‐mile queue. Saturday afternoons in the eastbound direction for 2 hours with up to 1‐mile queue.
Summer Months:
Currently (2013), volumes reach capacity on: Friday evenings in the eastbound direction for 1 hour with up to a 1‐mile queue. Saturday afternoons in the eastbound direction for 2 hours with up to a 1‐mile queue. Sunday evenings in the westbound direction for 1 hour with up to a 1‐mile queue.
By 2040, volumes will reach capacity: Every day of the week in both directions. For up to 6 hours, every day in the eastbound direction with up to a 12‐mile queue. For up to 5 hours, Monday through Saturday in the westbound direction with up to a 3‐mile
queue. For 11 hours Sunday in the westbound direction with up to a 14‐mile queue. In the eastbound direction, every day of the week will be similar to the congestion and
delays currently experienced on the Friday of Memorial Day weekend. In the westbound direction, all Sundays will be similar to the congestion and delays
currently experienced on the last day of a July 4th weekend.
2. Approach RoadwaysMainline capacity analyses were performed using the 2010 Highway Capacity Software (HCS) for themainline segments between MD 70 and the US 50/301 split. The results of the 2040 analyses are providedin Figures 3.7 and 3.8. These figures show that without widening, roadways are expected to experienceunacceptable operating conditions (LOS E or F), in particular along eastbound US 50/301 during the PMpeak hour and Summer Fridays, and along westbound US 50/301 during summer Sundays.
Note: Queue lengths do not account for effect of other upstream bottlenecks (e.g., Rowe Boulevard interchange, Severn River Bridge)
Monday - Thursday Friday
Saturday Sunday
Chesapeake Bay BridgeLife Cycle Cost Analysis
Estimated Queues by Hour (2013 Existing, 2020, 2030 and
2040 No Build)Summer Months
Figure 3.4
A
C
F
O
123456789
101112131415161718192021222324
Hou
r
123456789
101112131415161718192021222324
Hou
r
123456789
101112131415161718192021222324
Hou
r
EB WB
2013
2020
2030
2040
123456789
101112131415161718192021222324
Hou
r
Prince Geo
rge's Co
unty Line (17.7 mi)
I‐97 (10.8 mi)
Rowe Blvd (7
.3 m
i)
Severn River (6
.4 m
i)
MD 179 (3 m
i)
Ocenanic Dr (0
.7 m
i)
MD 8 (1.1 m
i)
Kent Narrows (5.2 mi)
US 301 (9.9 mi)
MD 213 (15.4 mi)
MD 404 (16.9 mi)
A C D E F G H J L N O
VMS Sign
(14.2 mi)
MD 18/VFW
Avenu
e (7.6 m
i)
Bloo
mingdale Ro
ad (12.6 mi)
B K M
MD 18
Brid
ge (3
.2 mi)
I

Note: Queue lengths do not account for effect of other upstream bottlenecks (e.g., Rowe Boulevard interchange, Severn River Bridge)
Monday - Thursday Friday
Saturday Sunday
Chesapeake Bay BridgeLife Cycle Cost Analysis
Estimated Queues by Hour (2013 Existing, 2020, 2030 and
2040 No Build) Non-Summer Months
Figure 3.5
A
C
F
O
123456789
101112131415161718192021222324
Hou
r
123456789
101112131415161718192021222324
Hou
r
123456789
101112131415161718192021222324
Hou
r
EB WB
2013
2020
2030
2040
123456789
101112131415161718192021222324
Hou
r
Prince Geo
rge's Co
unty Line (17.7 mi)
I‐97 (10.8 mi)
Rowe Blvd (7
.3 m
i)
Severn River (6
.4 m
i)
MD 179 (3 m
i)
Ocenanic Dr (0
.7 m
i)
MD 8 (1.1 m
i)
Kent Narrows (5.2 mi)
US 301 (9.9 mi)
MD 213 (15.4 mi)
MD 404 (16.9 mi)
A C D E F G H J L N O
VMS Sign
(14.2 mi)
MD 18/VFW
Avenu
e (7.6 m
i)
Bloo
mingdale Ro
ad (12.6 mi)
B K M
MD 18
Brid
ge (3
.2 mi)
I
Prince Geo
rge's Co
unty Line (17.7 mi)
I‐97 (10.8 mi)
Rowe Blvd (7
.3 m
i)
Severn River (6
.4 m
i)
MD 179 (3 m
i)
Ocenanic Dr (0
.7 m
i)
MD 8 (1.1 m
i)
Kent Narrows (5.2 mi)
US 301 (9.9 mi)
MD 213 (15.4 mi)
MD 404 (16.9 mi)
A C D E F G H J L N O
VMS Sign
(14.2 mi)
MD 18/VFW
Avenu
e (7.6 m
i)
Bloo
mingdale Ro
ad (12.6 mi)
B K M
MD 18
Brid
ge (3
.2 mi)
I
Prince Geo
rge's Co
unty Line (17.7 mi)
I‐97 (10.8 mi)
Rowe Blvd (7
.3 m
i)
Severn River (6
.4 m
i)
MD 179 (3 m
i)
Ocenanic Dr (0
.7 m
i)
MD 8 (1.1 m
i)
Kent Narrows (5.2 mi)
US 301 (9.9 mi)
MD 213 (15.4 mi)
MD 404 (16.9 mi)
A C D E F G H J L N O
VMS Sign
(14.2 mi)
MD 18/VFW
Avenu
e (7.6 m
i)
Bloo
mingdale Ro
ad (12.6 mi)
B K M
MD 18
Brid
ge (3
.2 mi)
I
Prince Geo
rge's Co
unty Line (17.7 mi)
I‐97 (10.8 mi)
Rowe Blvd (7
.3 m
i)
Severn River (6
.4 m
i)
MD 179 (3 m
i)
Ocenanic Dr (0
.7 m
i)
MD 8 (1.1 m
i)
Kent Narrows (5.2 mi)
US 301 (9.9 mi)
MD 213 (15.4 mi)
MD 404 (16.9 mi)
A C D E F G H J L N O
VMS Sign
(14.2 mi)
MD 18/VFW
Avenu
e (7.6 m
i)
Bloo
mingdale Ro
ad (12.6 mi)
B K M
MD 18
Brid
ge (3
.2 mi)
I

: . •
Miles
from Bridge 17.7 14.2 10.8 7.3 6.4 3.0 0.7 1.1 3.2 5.2 7.6 9.9 12.6 15.4 16.9
(delay) (3'/z hrs) (3 hrs) (2 hrs) (1'/z hrs) (1'!. hrs) ('lz hr) (15mln) (15mln) ('lz hr) (1 hr) (1'/2 hrs) (2 hrs) (2'/2 hrs) (3 hrs) (3'/z hrs)
Landmark/ Prince Rowe Severn
MD179 Oceanic MD18
Kent MD8NFW US301 Blooming-
George's VMS Sign 1-97 (Cape St. MD8 Narrows MD213 MD404 Interchange County line
Boulevard River Bridge Clair Road)
Drive Bridge Bridge
Road Split dale Road
Summer Months
Mon-Thu 2055 2040 2035 2055 2065+ 2065+
Friday 2040 2035 2025 2040 2055 2065+
Saturday 2045 2040 2025 2065+ 2065+ 2065+
Sunday 2050 2035 2030 2025 2030 2035
Non-Summer Months
Mon -Thu 2065+ 2065+ 2065+ 2065+ 2065+ 2065+
Friday 2065+ 2065+ 2055 2065+ 2065+ 2065+
Saturday 2065+ 2065+ 2055 2065+ 2065+ 2065+
Sunday 2065+ 2065+ 2065+ 2065+ 2065+ 2065+
Bay Bridge
Life Cycle Cost Analysis
Figure 3.6

MD 70 to M
D 2/450 (Severn River Bridge)
MD 2/450 to M
D 648
MD 648 to Bay Dale Drive
Bay Dale Drive to M
D 179
MD 179 to W
hitehall Road
Whitehall Road
to W
.H. R
oad
Slip
Ram
p
W.H. R
oad
Slip
Ram
p to Oceanic Drive
Oceanic Drive to Bay Bridge
BAY BR
IDGE
Bay Bridge to M
D 8
MD 8 to M
D 835A
MD 835A to Shopping Center
Shopping Center to Shopping Center
Shopping Center to Cox Neck Road
Cox Neck Road
to M
D 552
MD 552 to South Piney Road
Piney Creek Road
to Dundee
Avenue
Dundee
Avenue to Piney Narrows Road
Piney Narrows Road
to Ken
t Narrows Road
(Ken
t Narrows Bridge)
Ken
t Narrows Road
to Jackson Creek Road
Jackson Creek Road
to Chester River Beach Road
Chester River Beach Road
to VFW
Avenue
VFW
Avenue to Evans Avenue
Evans Avenue to Hess Road
Hess Road
to Nestbit Road
Nesbit Road
to Ocean
Gateway
Level of Service F E E D C C C C C C B B B B B B C B C
Volume 7,220 6,190 6,205 4,815 3,585 3,585 3,585 3,590 3,590 3,590 3,075 3,125 3,160 3,225 2,955 2,965 2,945 2,945 2,990 3,045 3,225 2,860 3,030 3,200 3,365 3,340
Volume 3,405 3,070 3,070 2,560 2,030 1,990 1,830 1,750 1,750 1,750 2,350 2,295 2,295 2,295 2,450 2,350 2,355 2,350 2,290 2,315 2,315 2,290 2,290 2,290 2,290 2,315
Level of Service C B B B B A A A A A B B B B B B B
Level of Service C C C C B B B B E B C C C C C C C C C
Volume 4,765 4,115 4,110 3,495 2,970 2,970 2,970 2,830 2,830 2,830 3,835 3,790 3,790 3,855 3,570 3,590 3,595 3,595 3,655 3,680 3,690 3,420 3,420 3,420 3,420 3,460
Volume 8,035 7,285 7,285 6,430 5,130 4,990 4,820 4,730 4,730 4,730 4,815 4,815 4,815 4,815 4,830 4,460 4,515 4,515 4,440 4,495 4,595 4,395 4,395 4,395 4,395 4,335
Level of Service F F F E D D D C F D D D D C C C C
Level of Service D D D C B B B B C B B B B B B B B B B
Volume 7,220 6,190 6,205 4,815 3,585 3,585 3,585 3,590 3,590 3,590 3,075 3,125 3,160 3,225 2,955 2,965 2,945 2,945 2,990 3,045 3,225 2,860 3,030 3,200 3,365 3,340
Volume 3,405 3,070 3,070 2,560 2,030 1,990 1,830 1,750 1,750 1,750 2,350 2,295 2,295 2,295 2,450 2,350 2,355 2,350 2,290 2,315 2,315 2,290 2,290 2,290 2,290 2,315
Level of Service B B B A A A A A A A A A A A A A A
Level of Service C B B B B B B B B B B B B B B B B B B
Volume 4,765 4,115 4,110 3,495 2,970 2,970 2,970 2,830 2,830 2,830 3,835 3,790 3,790 3,855 3,570 3,590 3,595 3,595 3,655 3,680 3,690 3,420 3,420 3,420 3,420 3,460
Volume 8,035 7,285 7,285 6,430 5,130 4,990 4,820 4,730 4,730 4,730 4,815 4,815 4,815 4,815 4,830 4,460 4,515 4,515 4,440 4,495 4,595 4,395 4,395 4,395 4,395 4,335
Level of Service E D D D C C C C B C C C C C C C C
Level of Service F E E D C C C C C C B B B B B B C B C
Volume 7,220 6,190 6,205 4,815 3,585 3,585 3,585 3,590 3,590 3,590 3,075 3,125 3,160 3,225 2,955 2,965 2,945 2,945 2,990 3,045 3,225 2,860 3,030 3,200 3,365 3,340
Volume 3,405 3,070 3,070 2,560 2,030 1,990 1,830 1,750 1,750 1,750 2,350 2,295 2,295 2,295 2,450 2,350 2,355 2,350 2,290 2,315 2,315 2,290 2,290 2,290 2,290 2,315
Level of Service 7220 B B B B A A A A A B B B B B B B
Level of Service C C C C B B B B E B C C C C C C C C C
Volume 4,765 4,115 4,110 3,495 2,970 2,970 2,970 2,830 2,830 2,830 3,835 3,790 3,790 3,855 3,570 3,590 3,595 3,595 3,655 3,680 3,690 3,420 3,420 3,420 3,420 3,460
Volume 8,035 7,285 7,285 6,430 5,130 4,990 4,820 4,730 4,730 4,730 4,815 4,815 4,815 4,815 4,830 4,460 4,515 4,515 4,440 4,495 4,595 4,395 4,395 4,395 4,395 4,335
Level of Service F F F E D D D C C D D D D C C C C
Notes:‐ Level of Service based on 2010 HCM methodology, except Bay Bridge LOS
‐ Bay Bridge LOS methodology based on capacities established during project in coordination with MDTA
‐ Under No Build conditions, Bay Bridge LOS assumes reversible lane operation with 3 lanes in the peak direction, and 2 lanes in the non‐peak direction
‐ Under 8‐Lane Bridge Options, Bay Bridge LOS assumes reversible lane operations with 5 lanes in the peak direction and 3 lanes in the non‐peak direction
‐ Under 6‐Lane Bridge Option, Bay Bridge LOS assumes reversible lane operations with 4 lanes in the peak direction and 2 lanes in the non‐peak direction
‐ All Build scenarios assume mainline widening to 8 lanes (one additional lane in each direction)
Eastbound
PM
Westbound
Eastbound
Figure 3.7
Eastbound
PMWestbound
Eastbound
2040 Weekday (Annual Average)Build Options 1, 2, and 3(8‐Lane Bridge and Mainline Widening)
2040 Weekday (Annual Average)No Build
Chesapeake Bay BridgeLife Cycle Cost Analysis
2040 Mainline Peak Hour Volumes and Level of Service for No Build and Build Options
Average Weekday
AMWestbound
Eastbound
PM
Westbound
Eastbound
AM
Westbound
2040 Weekday (Annual Average) Build Option 4(6‐Lane Bridge, no Mainline Widening)
AMWestbound

MD 70 to M
D 2/450 (Severn River Bridge)
MD 2/450 to M
D 648
MD 648 to Bay Dale Drive
Bay Dale Drive to M
D 179
MD 179 to W
hitehall Road
Whitehall Road
to W
.H. R
oad
Slip
Ram
p
W.H. R
oad
Slip
Ram
p to Oceanic Drive
Oceanic Drive to Bay Bridge
BAY BR
IDGE
Bay Bridge to M
D 8
MD 8 to M
D 835A
MD 835A to Shopping Center
Shopping Center to Shopping Center
Shopping Center to Cox Neck Road
Cox Neck Road
to M
D 552
MD 552 to South Piney Road
Piney Creek Road
to Dundee
Avenue
Dundee
Avenue to Piney Narrows Road
Piney Narrows Road
to Ken
t Narrows Road
(Ken
t Narrows Bridge)
Ken
t Narrows Road
to Jackson Creek Road
Jackson Creek Road
to Chester River Beach Road
Chester River Beach Road
to VFW
Avenue
VFW
Avenue to Evans Avenue
Evans Avenue to Hess Road
Hess Road
to Nestbit Road
Nesbit Road
to Ocean
Gateway
Level of Service D D D C C C C C F C D D D C C D D C C
Volume 5,640 4,990 4,985 4,370 3,845 3,845 3,845 3,705 3,705 3,705 4,710 4,665 4,665 4,730 4,445 4,465 4,470 4,470 4,530 4,555 4,565 4,295 4,295 4,295 4,295 4,335
Volume 9,230 8,480 8,480 7,625 6,325 6,185 6,015 5,925 5,925 5,925 6,010 6,010 6,010 6,010 6,025 5,655 5,710 5,710 5,635 5,690 5,790 5,590 5,590 5,590 5,590 5,530
Level of Service F F F F E E E E F E E E E E E E D
Level of Service C C C B B B B B D B C C C C C C C B C
Volume 5,640 4,990 4,985 4,370 3,845 3,845 3,845 3,705 3,705 3,705 4,710 4,665 4,665 4,730 4,445 4,465 4,470 4,470 4,530 4,555 4,565 4,295 4,295 4,295 4,295 4,335
Volume 9,230 8,480 8,480 7,625 6,325 6,185 6,015 5,925 5,925 5,925 6,010 6,010 6,010 6,010 6,025 5,655 5,710 5,710 5,635 5,690 5,790 5,590 5,590 5,590 5,590 5,530
Level of Service F E E D C C C C C C C C C C C C C
Level of Service D D D C C C C C F C D D D C C D D C C
Volume 5,640 4,990 4,985 4,370 3,845 3,845 3,845 3,705 3,705 3,705 4,710 4,665 4,665 4,730 4,445 4,465 4,470 4,470 4,530 4,555 4,565 4,295 4,295 4,295 4,295 4,335
Volume 9,230 8,480 8,480 7,625 6,325 6,185 6,015 5,925 5,925 5,925 6,010 6,010 6,010 6,010 6,025 5,655 5,710 5,710 5,635 5,690 5,790 5,590 5,590 5,590 5,590 5,530
Level of Service F F F F E E E E E E E E E E E E D
Level of Service F F F F E E E E F F F F F F F F F F F
Volume 7,670 7,220 7,220 6,790 6,425 6,425 6,425 6,330 6,330 6,330 7,135 7,100 7,100 7,150 6,920 6,935 6,940 6,940 6,990 7,010 7,020 6,805 6,790 6,790 6,790 6,820
Volume 6,395 5,870 5,870 5,270 4,050 3,950 3,830 3,765 3,765 3,765 3,830 3,830 3,830 3,830 3,840 3,545 3,585 3,585 3,525 3,570 3,650 3,490 3,490 3,490 3,490 3,440
Level of Service E E E D C C C C F C C C C C C C C
Level of Service D D D D D D D D D D D D D D D D D D D
Volume 7,670 7,220 7,220 6,790 6,425 6,425 6,425 6,330 6,330 6,330 7,135 7,100 7,100 7,150 6,920 6,935 6,940 6,940 6,990 7,010 7,020 6,805 6,790 6,790 6,790 6,820
Volume 6,395 5,870 5,870 5,270 4,050 3,950 3,830 3,765 3,765 3,765 3,830 3,830 3,830 3,830 3,840 3,545 3,585 3,585 3,525 3,570 3,650 3,490 3,490 3,490 3,490 3,440
Level of Service D C C C B B B B D B B B B B B B B
Level of Service F F F F E E E E F F F F F F F F F F F
Volume 7,670 7,220 7,220 6,790 6,425 6,425 6,425 6,330 6,330 6,330 7,135 7,100 7,100 7,150 6,920 6,935 6,940 6,940 6,990 7,010 7,020 6,805 6,790 6,790 6,790 6,820
Volume 6,395 5,870 5,870 5,270 4,050 3,950 3,830 3,765 3,765 3,765 3,830 3,830 3,830 3,830 3,840 3,545 3,585 3,585 3,525 3,570 3,650 3,490 3,490 3,490 3,490 3,440
Level of Service E E E D C C C C F C C C C C C C C
Notes:‐ Level of Service based on 2010 HCM methodology, except Bay Bridge LOS
‐ Bay Bridge LOS methodology based on capacities established during project in coordination with MDTA
‐ Under No Build conditions, Bay Bridge LOS assumes reversible lane operation with 3 lanes in the peak direction, and 2 lanes in the non‐peak direction
‐ Under 8‐Lane Bridge Options, Bay Bridge LOS assumes reversible lane operations with 5 lanes in the peak direction and 3 lanes in the non‐peak direction
‐ Under 6‐Lane Bridge Option, Bay Bridge LOS assumes reversible lane operations with 4 lanes in the peak direction and 2 lanes in the non‐peak direction
‐ All Build scenarios assume mainline widening to 8 lanes (one additional lane in each direction)
2040 Summer FridayNo Build
2040 Summer SundayNo Build
PMWestbound
Eastbound
2040 Summer Friday Build Options 1, 2, and 3
2040 Summer Friday Build Option 4
PM
Figure 3.8
Chesapeake Bay BridgeLife Cycle Cost Analysis
2040 Mainline Peak Hour Volumes and Level of Service for No Build and Build Options
Summer Friday and Sunday
PM
Westbound
Eastbound
PMWestbound
Eastbound
PM
Westbound
Eastbound
Westbound
Eastbound
PMWestbound
Eastbound
2040 Summer Sunday Build Option 4
2040 Summer Sunday Build Options 1, 2, and 3

US 50 / 301 / WILLIAM PRESTON LANE JR. MEMORIAL (BAY) BRIDGE LIFE CYCLE COST ANALYSIS REPORT
23
D. Future Number of Bridge and Roadway Lanes
1. Potential MDTA Approaches to Provide Additional Bridge and Roadway CapacityMDTA could use one of three approaches to providing capacity on the Bay Bridge:
Approach 1: No Build. With this approach no additional capacity would be provided on the existing Bay Bridges and no widening would be implemented along US 50/301 within the study limits. The potential 2040 operations under a No Build condition were presented in Section III.C.
Approach 2: Fully accommodate 2040 traffic demand. Ideally, MDTA would be able to provide sufficient future capacity to fully accommodate future traffic demand. This would result in no routine congestion/queuing along the mainline or Bay Bridge in 2040. The number of bridge and roadway lanes needed to fully accommodate future traffic demand are presented in Section III.D.2.
Approach 3: Partially accommodate 2040 traffic demand. MDTA may implement less expensive improvements that provide some additional capacity, but not enough capacity to fully accommodate future traffic demand. The potential 2040 operations if some additional capacity is provided are presented in Section III.D.3.
2. Future Number of Bridge and Roadway Lanes to Fully Accommodate 2040 Traffic DemandFor the Bay Bridge, Table 3.7 indicates the per‐lane maximum vehicular flow for the eastbound andwestbound bridges for certain levels of service. These values are based on the eastbound and westboundcapacity described in Section III.B, and assume that each Level of Service threshold is 150 vehicles perhour per lane lower.
Table 3.7. Maximum Flow (vehicles per hour)
Level of Service Eastbound Westbound
Total (3 lanes) Per Lane Total (3 lanes) Per Lane
D 3,800 1,267 3,900 1,300
E 4,250 1,417 4,350 1,450
F 4,700 1,567 4,800 1,600
In order to accommodate the highest projected 2040 eastbound and westbound volumes (6,225 vph on Friday afternoon, and 6,330 vph on Sunday evening in the eastbound and westbound direction, respectively) at Level of Service D or E, a minimum of 5 lanes in the peak direction would be required. However, due to the highly directional nature of seasonal volumes, no more than three lanes will be needed in the off‐peak direction. To minimize the footprint of the bridge, these operating conditions lend themselves well to the use of reversible lanes.
Given the long design life of a new or expanded Bay Bridge, long‐range, planning‐level traffic volume projections were extended beyond 2040 to estimate the approximate number of years until traffic conditions on a future bridge (with five lanes in the peak direction) would reach levels that are similar to current conditions. For the purposes of this study, it was assumed that traffic volumes will continue to grow beyond 2040 at 0.6 percent per year, which is slightly less than half the assumed rate of growth until 2040 (1.3 percent per year).

US 50 / 301 / WILLIAM PRESTON LANE JR. MEMORIAL (BAY) BRIDGE LIFE CYCLE COST ANALYSIS REPORT
24
It should be noted that forecasts beyond 2040 are subject to a high degree of uncertainty. Land use projections that form the basis for all travel demand models are not available beyond 2040. Furthermore, current demographic and economic trends may result in volumes and roadway capacity estimates 50, 60 or 70 years out that vary significantly from current projections. These include an aging population and lower rates of auto ownership among the young, fluctuating gasoline prices, advances in technology that facilitate telecommuting, and the impact of improved vehicle technology, such as automated/connected vehicles.
Nonetheless, applying these very long‐term growth assumptions uniformly for all scenarios, it is expected that no more than five lanes will be needed in any direction through the 2060s. Similarly, in the opposing direction (off‐peak direction), no more than three lanes will be needed through the 2060s. This analysis indicates that an 8‐lane bridge with reversible operations that provide a 5/3 configuration, will likely be sufficient to accommodate traffic at or better than current congestion levels through the 2060s.
For the mainline, provision of one additional through lane in each direction would yield generally acceptable levels of service (D or better) through 2040, except during summer Fridays along eastbound US 50/301 between Rowe Boulevard and Bay Dale Drive. Additional improvements, such as auxiliary lanes, could be considered in this location to improve mainline operations.
3. Future Number of Bridge and Roadway Lanes to Provide Additional Capacity but Not FullyAccommodate 2040 Traffic Demand
MDTA could determine that smaller scale, less costly improvements should be provided. As presented above, the eastbound bridge currently carries two lanes of traffic. MDTA could consider widening the eastbound bridge to carry three lanes of traffic, matching the number of lanes provided on the westbound bridge. The Bay Bridges would then have a total of six lanes, which could be operated with three lanes per direction or in a contra‐flow (4 lanes/2 lanes) configuration. With three lanes on each bridge, contra‐flow could be utilized in either direction, allowing four lanes to be directed eastbound or westbound as needed for the peak travel direction.
Contrary to an 8‐lane scenario as described in Section D.2, a 6‐lane configuration, whether operated in contra‐flow or non‐contra‐flow configuration, would leave insufficient capacity to accommodate all vehicular bridge demand at certain times. As shown in Figure 3.9, the following observations can be made for summer 2040 traffic conditions:
With standard operations (3 lanes per direction) during summer months:
During weekdays (Monday to Thursday), queues of approximately 4 miles would be expected inthe eastbound direction for up to 6 hours, but no queues in the westbound direction would beexpected.
On Fridays, queues in the eastbound direction would be slightly less compared to the No Buildconditions but still reach approximately 11 miles for up to 11 hours. No queuing in thewestbound direction would be expected.
On Saturdays, queues in the eastbound direction would reach 0.5 miles for up to 3 hours; in thewestbound direction, no queuing would be expected.
On Sundays, no queuing would be expected in the eastbound direction, but queues in thewestbound direction would be equal to those under the No Build conditions and reachapproximately 14 miles for up to 11 hours.

US 50 / 301 / WILLIAM PRESTON LANE JR. MEMORIAL (BAY) BRIDGE LIFE CYCLE COST ANALYSIS REPORT
25
With contra‐flow operations (4 lanes peak direction / 2 lanes off‐peak direction) during summer months:
During weekdays (Monday to Thursday), no queuing would be expected in the eastbounddirection. However, in the westbound direction queues would be identical to the No Buildcondition and exceed one mile for up to 5 hours.
On Fridays, minor queues less than 0.5 miles would be expected in the eastbound direction forup to 3 hours; in the westbound direction, queues up to 3 miles would be expected (identical tothe No Build condition) for approximately 8 hours.
On Saturdays, queues in the eastbound direction would reach 0.5 miles for up to 3 hours; in thewestbound direction, no queuing would be expected.
On Sundays, queues of approximately 4 miles would be expected in the eastbound direction forup to 8 hours, which is approximately half the projected queue length under No Build conditions.In the westbound direction, queues of approximately 1 mile would be expected for up to 5 hours,which is considerably less than the 14‐mile queue expected under No Build conditions.
Although constructing one additional lane on the eastbound span would provide some congestion relief compared to No Build conditions there would still be numerous operations issues:
The eastbound queues Monday through Friday would only be marginally reduced under standardoperation, and would require contra‐flow operation (4 eastbound lanes) to significantlyreduce/eliminate congestion. However, implementing contra‐flow operation would result inwestbound queues that are the same as the No Build operation.
The significant westbound queues experienced on Sundays would only be reduced if contra‐flowwas used. However, utilizing contra‐flow (4 lanes westbound) would result in eastboundcongestion.
Under all time frames the 6‐lane approach would operate worse than the 8‐lane approach where no congestion or queuing is projected.

Note: Queue lengths do not account for effect of other upstream bottlenecks (e.g., Rowe Boulevard interchange, Severn River Bridge)
Chesapeake Bay BridgeLife Cycle Cost Analysis
Comparison of 2040Summer Queues;
No Build vs. Six Lane Bridge
Figure 3.9
Monday - Thursday Friday
Saturday Sunday
A
C
F
O
0123456789
1011121314151617181920212223
Hou
r
Prince George's County Line (17.7 m
i)
I‐97 (10.8 m
i)
Rowe Blvd (7.3 m
i)
Severn River (6.4 m
i)
MD 179 (3 m
i)
Oceanic Dr (0.7 m
i)
MD 8 (1.1 m
i)
Ken
t Narrows (5.2 m
i)
US 301 (9.9 mi)
MD 213 (15.4 m
i)
MD 404 (16.9 m
i)
A C D E F G H J L N O
VMS Sign
(14.2 m
i)
MD 18/VFW
Avenue (7.6 m
i)
Bloomingdale Road
(12.6 m
i)
B K M
MD 18 Bridge (3.2 mi)
I
2040 Queue LengthEB WB
No Build
Six Lanes - contra-flow
Six Lanes ‐ standard
0123456789
1011121314151617181920212223
Hou
r
Prince George's County Line (17.7 m
i)
I‐97 (10.8 m
i)
Rowe Blvd (7.3 m
i)
Severn River (6.4 m
i)
MD 179 (3 m
i)
Oceanic Dr (0.7 m
i)
MD 8 (1.1 m
i)
Ken
t Narrows (5.2 m
i)
US 301 (9.9 mi)
MD 213 (15.4 m
i)
MD 404 (16.9 m
i)
A C D E F G H J L N O
VMS Sign
(14.2 m
i)
MD 18/VFW
Avenue (7.6 m
i)
Bloomingdale Road
(12.6 m
i)
B K M
MD 18 Bridge (3.2 mi)
I
0123456789
1011121314151617181920212223
Hou
r
Prince George's County Line (17.7 m
i)
I‐97 (10.8 m
i)
Rowe Blvd (7.3 m
i)
Severn River (6.4 m
i)
MD 179 (3 m
i)
Oceanic Dr (0.7 m
i)
MD 8 (1.1 m
i)
Ken
t Narrows (5.2 m
i)
US 301 (9.9 mi)
MD 213 (15.4 m
i)
MD 404 (16.9 m
i)
A C D E F G H J L N O
VMS Sign
(14.2 m
i)
MD 18/VFW
Avenue (7.6 m
i)
Bloomingdale Road
(12.6 m
i)B K M
MD 18 Bridge (3.2 mi)
I0123456789
1011121314151617181920212223
Hou
r
Prince George's County Line (17.7 m
i)
I‐97 (10.8 m
i)
Rowe Blvd (7.3 m
i)
Severn River (6.4 m
i)
MD 179 (3 m
i)
Oceanic Dr (0.7 m
i)
MD 8 (1.1 m
i)
Ken
t Narrows (5.2 m
i)
US 301 (9.9 mi)
MD 213 (15.4 m
i)
MD 404 (16.9 m
i)
A C D E F G H J L N O
VMS Sign
(14.2 m
i)
MD 18/VFW
Avenue (7.6 m
i)
Bloomingdale Road
(12.6 m
i)
B K M
MD 18 Bridge (3.2 mi)
I
Build‐6 Contra-flow queue identical to No Build queue
Build‐6 Contra-flow queue identical to No Build queue
Build‐6 Standard queue identical to No Build queueBuild‐6 Contra-flow
queue identical to Build‐6 Standard

US 50 / 301 / WILLIAM PRESTON LANE JR. MEMORIAL (BAY) BRIDGE LIFE CYCLE COST ANALYSIS REPORT
27
IV. BRIDGE AND ROADWAY OPTIONS
The Bay Bridge LCCA included an analysis of several options to increase capacity across the Chesapeake Bay and the evaluation of potential improvements to the US 50/301 mainline within the study limits.
A. Bridge Options
Based on the structural analysis presented in Chapter II, the existing Bay Bridge structures could be maintained throughout the study time frame. As a result, potential Bay Bridge improvements to increase capacity could include demolition of the existing structures and construction of a new structure(s) or a combination of maintaining the existing and building new structures.
The traffic analysis presented in Chapter III indicates that a total of eight bridge lanes would be required across the Bay to accommodate future traffic demand. In addition, the traffic analysis showed that five lanes would be required in the peak direction and three lanes in the off‐peak direction.
Using these parameters, three bridge options were developed:
Bridge Option 1 – Maintain the existing bridges and build a new 3‐lane bridge.
Bridge Option 2 – Demolish the existing eastbound bridge, maintain the existing westboundbridge, and build a new 5‐lane bridge.
Bridge Option 3 – Demolish both existing bridges and build a new 8‐lane bridge.
As discussed in Chapter III, MDTA could also consider smaller scale, less costly improvements that would add capacity to the existing bridges, but not enough capacity to accommodate all of the future traffic demand in 2040. Using this approach, a fourth bridge option was developed:
Bridge Option 4 – Maintain the existing 3‐lane westbound bridge, and rehabilitate and widen theexisting eastbound bridge to three lanes. Another approach to this option would be to add a laneto the newer westbound bridge. This study did not evaluate adding a lane to the existing 3‐lanewestbound bridge.
For each bridge option, the design details for the new bridge, including bridge types (e.g., steel girder, cable‐stayed, suspension, etc.) were not determined during the Bay Bridge LCCA, but assumptions were used to develop structure costs as presented in Chapter IV.D.
1. Bridge Option 1Option 1 would maintain both existing structures and construct a new bridge south of the existingeastbound structure. The combination of existing and new structures would provide eight total lanes,three each on the outside bridges (existing westbound bridge and new bridge) and two on the middlebridge (existing eastbound bridge). This configuration would allow for the two, three‐lane outside bridgesto operate exclusively in the eastbound and westbound directions and the middle two‐lane structure tooperate with reversible lanes to provide additional capacity in the peak direction.
2. Bridge Option 2Option 2 would maintain the existing three‐lane westbound structure, demolish the existing two‐laneeastbound structure, and construct a new bridge south of the existing eastbound structure. The newbridge would carry five total lanes, with a concrete barrier separating the two‐lane and three‐laneroadways. The combination of the existing and new structure would provide eight total lanes. The three‐

US 50 / 301 / WILLIAM PRESTON LANE JR. MEMORIAL (BAY) BRIDGE LIFE CYCLE COST ANALYSIS REPORT
28
lane existing bridge would operate exclusively in the westbound direction. The three right lanes on the new bridge would operate exclusively in the eastbound direction, and the two left lanes on the new bridge would operate as reversible lanes to provide additional capacity in the peak direction.
3. Bridge Option 3Option 3 would demolish both existing bridges and construct a new eight‐lane bridge in place of theexisting structures. The eight lanes would be separated into three‐lane, two‐lane, and three‐laneroadways. The outside three‐lanes roadways would be operated exclusively in the westbound andeastbound directions and the middle two‐lane roadway would operate as reversible lanes to provideadditional capacity in the peak direction.
4. Bridge Option 4Option 4 would maintain both existing bridges and widen the eastbound bridge to carry three lanes. Thetwo structures would provide six total lanes, three on each bridge. This configuration would allow for thebridges to operate exclusively in the eastbound and westbound directions during standard operation orin a 4‐lane/2‐lane configuration (either direction) during contra‐flow operations. Unlike Bridge Options 1through 3, which allow for physically separated reversible lane operations, Bridge Option 4 would allowfor contra‐flow operation very similar to today’s operation where opposing traffic would not physicallyseparated.
B. Roadway Improvements
1. Roadway WideningBased on the traffic analysis presented in Section III, a total of eight mainline lanes, four per direction,are required through the study limits to accommodate future traffic demand. This typical section wouldnecessitate widening the mainline by one lane in each direction. In addition to widening by one lane perdirection, the median and outside shoulders would be widened to 12 feet to meet AASHTO designguidelines for freeways. To reduce potential impacts to properties and environmental features, it wasassumed that the median would have a closed section with concrete barrier throughout the study limits.The mainline widening would only be implemented in conjunction with the 8‐lane bridge options (BuildOptions 1, 2, and 3).
At the western end of the study limits, the additional lane would be added/dropped just west of the MD 70 interchange. At the eastern limits, the additional lane would be added/dropped at the US 50/301 interchange with the additional (third) lane heading to/from US 50. It was assumed that the additional lane to/from US 50 would tie into long‐term improvements planned by SHA to widen US 50 from east of the US 301 split to MD 404.
The traffic analysis in Chapter III indicated that current interchange ramp configurations at all interchanges could accommodate 2040 traffic volumes. Therefore, the interchange ramps would only be modified to tie into the widened mainline section, including widening mainline bridges and replacing overpasses that are directly impacted by the roadway widening.
2. Roadway Life Cycle Cost ImprovementsThe cost of roadway maintenance and improvements within the project limits were included in the lifecycle cost analysis. Roadway maintenance includes periodic resurfacing of the mainline pavement, whichwas assumed to occur at regular intervals throughout the study time frame (2014 to 2065).

US 50 / 301 / WILLIAM PRESTON LANE JR. MEMORIAL (BAY) BRIDGE LIFE CYCLE COST ANALYSIS REPORT
29
Several overpasses would be impacted by the mainline widening; therefore, these overpasses would have to be reconstructed. Additionally, several US 50/301 structures would have to be widened. However, all bridges within the study limits would reach or approach the limit of their design life by the end of the study time frame. As such, it was assumed that all bridges within the limits would have to be completely replaced by 2065. The mainline bridge replacements were assumed to be part of the life cycle cost analysis. Existing bridge replacement would likely occur over a period of many years due to the large number of bridges that would need to be replaced. However, for the purposes of this analysis, it was assumed that the costs for the complete bridge replacements would be incurred at the time of the roadway widening (and new Bay Bridge construction) for the Build Options. For the No Build Option, the costs were incurred in 2045, which was chosen as a median year for complete mainline bridge replacement.
C. Build and No Build Options
The bridge options and roadway improvements were combined into system‐wide Build Options. The improvements included in each Build Option are presented in Table 4.1.
Table 4.1. Build Option Improvements
Improvements
Build Option 1 New 3‐lane Bay Bridge structure (see Section IV.A) Roadway widening (see Section IV.B)
Programmed and anticipated Bay Bridge maintenance
Periodic roadway resurfacing (see Section IV.B)
Complete mainline bridge and overpasses replacement (see Section IV.B)
Build Option 2 Demolition of existing eastbound Bay Bridge
New 5‐lane Bay Bridge structure
Roadway widening
Programmed and anticipated westbound Bay Bridge maintenance
Periodic roadway resurfacing
Complete mainline bridge and overpasses replacement
Build Option 3 Demolition of both existing Bay Bridge structures
New 8‐lane Bay Bridge structure
Roadway widening
Periodic roadway resurfacing
Complete mainline bridge and overpasses replacement
Build Option 4 Widen eastbound Bay Bridge structure to three lanes
Programmed and anticipated Bay Bridge maintenance
Periodic roadway resurfacing (no widening)
Complete mainline bridge and overpasses replacement
No Build Programmed and anticipated Bay Bridge maintenance
Periodic roadway resurfacing
Complete mainline bridge replacement

US 50 / 301 / WILLIAM PRESTON LANE JR. MEMORIAL (BAY) BRIDGE LIFE CYCLE COST ANALYSIS REPORT
30
D. Bridge and Roadway Costs
The bridge and roadway costs were developed based on the improvements and Build and No Build Options described in Sections IV.A, IV.B, and IV.C. The assumptions used to develop the cost estimates and the estimated costs are presented in this section.
1. Cost AssumptionsThe relatively preliminary nature of the Bay Bridge LCCA means that several structural and roadwayassumptions were made to estimate the cost for the improvements presented in Sections IV.A and IV.B.The Bay Bridge structural assumptions are presented in Table 4.2 and the roadway assumptions arepresented in Table 4.3.
Table 4.2. Bay Bridge Structural Cost Assumptions
Element Description Option
New bridge width Build Option 1 – New 3‐lane bridge: 68 feet wide Build Option 2 – New 5‐lane bridge: 110 feet wide Build Option 3 – New 8‐lane bridge: 168 feet wide Build Option 4 – Widen EB bridge to 41 feet
All Build Options
New bridge square foot costs
Based on assumed most suitable structural sub‐unit mix for the new structure. Consideration is given to matching the existing substructure spacing and span lengths. Cost data taken from recent similar projects for each sub‐unit type from across the country.
Build Options 1, 2, and 3
Existing bridge demolition costs
Based on several recent similar deconstruction projects and the existing as‐built quantities
Build Options 2 and 3
Existing EB bridge widening costs
Derived from estimated quantities obtained from available design records for the existing EB and WB Bay Bridge structure. Cost data taken from recent projects from across the country with consideration given to actual site conditions and limitations, including maintaining traffic on the existing bridges during construction
Build Option 4
Contingencies and additives
40% planning contingency 12% construction inspection 5% construction contingency 5% preliminary engineering
No Build and all Build Options
Table 4.3. Roadway Cost Assumptions
Element Description Option
Approach roadway reconstruction
Reconfigured to direct traffic to the new/existing Bay Bridge structures
Build Options 1, 2,
and 3
Toll plaza removal/AET conversion
Assumed to be removed and the highway converted to AET prior to new bridge construction, costs not included
N/A
Resurfacing All existing lanes resurfaced and periodic resurfacing throughout the study time frame
No Build and all Build Options

US 50 / 301 / WILLIAM PRESTON LANE JR. MEMORIAL (BAY) BRIDGE LIFE CYCLE COST ANALYSIS REPORT
31
Element Description Option
Full depth pavement All widening and all existing shoulders reconstructed Build Options 1, 2,
and 3
Structures widening All mainline structures widened to accommodate the proposed roadway typical section
Build Options 1, 2,
and 3
Structure replacement
All structures within the study limits would be reconstructed within the study time frame. Structures along US 50/301 would be widening to accommodate roadway widening (Build Option only)
No Build and all Build Options
Contingencies and additives
40% planning contingency 12% construction inspection 5% construction contingency 5% preliminary engineering
No Build and all Build Options
Right‐of‐way Right‐of‐way costs not included N/A
2. Bridge Improvements Cost EstimatesThe cost estimate for the Bay Bridge cost elements are presented in Table 4.4. These costs include theprogrammed and anticipated rehabilitation and maintenance, new Bay Bridge structures, and demolitionof the existing bridges.
Table 4.4. Bay Bridge Costs (in 2014 dollars)
Element Cost
($ millions) Options Comments
New 3‐lane structure $1,451 Build Option 1
New 5‐lane structure $2,708 Build Option 2
New 8‐lane structure $4,253 Build Option 3
Widen EB Bay Bridge to 3 lanes
$930 Build Option 4
EB existing Bay Bridge demolition
$190 Build Option 2
EB and WB existing Bay Bridge demolition
$478 Build Option 3
Programmed and anticipated existing Bay Bridge structure rehabilitation and maintenance
$2,680 No Build and Build Options 1, 2, and 3
$1,227 for existing EB bridge (see II.C)
$1,453 for existing WB bridge (see II.C)
Rehab/maintenance costs appliedbased on when the Build Options wouldbe implemented (see V)
Programmed and anticipated existing Bay Bridge structure rehabilitation and maintenance
$2,334 Build Option 4 $881 for existing EB bridge
$1,453 for existing WB bridge
Rehab/maintenance costs appliedbased on when the Build Options wouldbe implemented
3. Roadway Improvements Cost EstimatesThe cost estimates for the roadway elements included as part of the Build Options are presented in Table4.5. These costs include widening to provide an additional mainline lane in each directions, a one‐time

US 50 / 301 / WILLIAM PRESTON LANE JR. MEMORIAL (BAY) BRIDGE LIFE CYCLE COST ANALYSIS REPORT
32
roadway resurfacing, and complete replacement of the existing bridges and overpasses within the study limits.
Table 4.5. Roadway Costs (in 2014 dollars)
Element Cost
($ millions) Options Comments
Roadway widening
$900 Build Options 1, 2, and 3
Includes roadway widening
Includes a one‐time roadway resurfacing
Includes complete mainline bridges andoverpasses replacements
The cost estimates for the roadway life cycle cost elements are presented in Table 4.6. These costs include periodic roadway resurfacing and complete replacement of the existing bridges and overpasses within the study limits.
Table 4.6. Roadway Life Cycle Costs (in 2014 dollars)
Element Cost
($ millions) Options Comments
Periodic roadway resurfacing
$41 No Build and all Build Options
Resurfacing to occur every 8 yearsstarting in 2020
Cost includes contingencies and otheradditives
Mainline bridge replacement
$450 No Build and Build Option 4
Only bridge replacement, no widening
Cost includes contingencies and otheradditives
4. Build Options Cost EstimatesThe cost estimates for the four Build Options are presented in Table 4.7. For Build Options 1, 2, and 3these costs include new Bay Bridge structures, existing Bay Bridge structure demolition, roadwaywidening, and complete replacement of roadway bridges and overpasses within the study limits. ForBuild Option 4, these cost include eastbound Bay Bridge widening and complete replacement of roadwaybridges and overpasses within the study limits. The Build Option costs do not include programmed andanticipated existing Bay Bridge rehabilitation and maintenance because those costs would varydepending upon if/when the existing bridges are demolished and a new Bay Bridge structure constructed.Similarly the Build Options costs do not include periodic resurfacing because those costs would varydepending upon when roadway widening would occur. The full costs for the Build Options including theprogrammed and anticipated existing Bay Bridge rehabilitation and maintenance and periodic roadwayresurfacing were calculated as part of the life cycle costs presented in Chapter V.
Table 4.7. Build Options Costs (in 2014 dollars)
Option New Bridge Cost
($million)
Existing Bridge Demolition ($ million)
Roadway Cost ($ million)
Total ($ million)
Option 1 $1,451 $0 $900 $2,351
Option 2 $2,708 $190 $900 $3,798
Option 3 $4,253 $478 $900 $5,631
Option 4 $930 $0 $0 $930

US 50 / 301 / WILLIAM PRESTON LANE JR. MEMORIAL (BAY) BRIDGE LIFE CYCLE COST ANALYSIS REPORT
33
As presented above, the No Build costs include programmed and anticipated existing Bay Bridge rehabilitation and maintenance, periodic roadway resurfacing, and complete replacement of the existing mainline bridge within the study limits. These improvements would be implemented over time and the resulting life cycle costs are presented in Chapter V.

US 50 / 301 / WILLIAM PRESTON LANE JR. MEMORIAL (BAY) BRIDGE LIFE CYCLE COST ANALYSIS REPORT
34
V. LIFE CYCLE COST SCENARIOS
A. Inflation and Discount Rates
A Life Cycle Cost Analysis is an economic analysis tool used to quantify and compare projected investments in system preservation and improvement scenarios. With this tool, the costs of the No Build and four Build Options could be compared over several time frames. The value of dollars tends to decrease over time due to inflation (inflation rate). To counter the effects of inflation, money can be invested such that it will tend to grow over time (discount or interest rate). Money spent in constructing or maintaining a facility over different time frames cannot simply be added together to determine the overall life cycle costs. The inflation rate and discount rate must be used to convert anticipated future costs to present dollar values so that the lifetime costs of different options can be compared directly.
The life cycle cost process used for this project was as follows: 1. Identify initial construction and future rehabilitation/maintenance needs and their associated
costs.2. Determine the timing for each Build Option and the No Build Option.3. Estimate Present Cost (PC) for each improvement identified under each Option. (These values are
presented in Tables 4.4 and 4.5.)4. Determine the Future Cost (FC) for each improvement based on the inflation rate.5. Determine the Present Worth (PW) (i.e. present dollar value) for each improvement based on the
discount rate.6. Develop life cycle cost scenarios based on when each Build Option would be implemented (and
include the No Build as one scenario).7. Determine the Life Cycle Cost for each scenario by summing the PW of improvements identified
for each Build Option and the No Build Option.
The inflation rate used in the life cycle cost analysis was 2.75 percent, which is consistent with current long‐term inflation rates used by the Maryland Department of Transportation at the time this report was prepared.
The discount rate used in the net present value (NPV) analysis was based on the assumption that the project would be financed through debt funding. As a AA‐rated agency, MDTA achieves a relatively low cost of borrowing. This low cost, coupled with MDTA’s ability to utilize cash funding for projects in addition to debt financing, lowers MDTA’s cost of capital. Additionally, on recent mega projects, funding plans were created that allowed MDTA to utilize funding from other sources, such as TIFIA loans and GARVEE bonds. Although this is not the typical approach MDTA uses to fund projects, the potential for alternative funding sources on mega‐projects does exist.
To determine the appropriate discount rate to use, an analysis of the weighted average cost of capital on recent projects was completed. The majority of MDTA’s recent system preservation projects have been cash‐funded, which would suggest using the current investment rate as the discount rate. However, for larger projects, some mix of cash and debt funding may be more appropriate. When considering all funding sources for the ICC and the I‐95 ETLs, a weighted average cost of capital (WACC) of 2.9 percent and 2.3 percent, respectively, was obtained. Considering a conservative approach, the higher of these two rates, 2.9 percent, was used as the discount rate in the NPV analysis.

US 50 / 301 / WILLIAM PRESTON LANE JR. MEMORIAL (BAY) BRIDGE LIFE CYCLE COST ANALYSIS REPORT
35
To provide one example calculation, in Build Option 2, the demolition of the existing eastbound bridge is estimated to cost $190.2 million in 2014 dollars. If the bridge is demolished in 2035, an inflation rate of 2.75 percent would be applied over 21 years. The future (2035) demolition cost would be $327.2 million. The present (2014) worth would then be calculated by applying a 2.9 percent discount rate to the future cost over the same 21‐year period. The present worth of the eastbound bridge demolition would be $184.7 million. These calculations were applied for each study improvement to develop a total net present worth for each scenario.
B. Life Cycle Cost Time Frames and Scenarios
1. Life Cycle CostsThe four Build Options could be implemented over a wide range of time within the overall study timeframe (2014 to 2065). The ultimate decision of when a Bay Bridge Project would occur would be basedon a variety of factors that include traffic operations along US 50/301, the level and duration of trafficcongestion on Kent Island and in Annapolis, public perception, and political direction. It was beyond thescope of the Bay Bridge LCCA Study to consider all of these potential factors to determine a single yearin which a new Bay Bridge should be constructed. Therefore, a range of time frames were considered toprovide information to policy makers about the potential cost for a Bay Bridge project at various timeswithin the study time frame.
The selection of the time frame for which to conduct the life cycle cost analyses was driven by multiple factors, including the earliest year in which a new bridge could be feasibly constructed. This year was determined based on the estimated time frame to complete the required National Environmental Policy Act (NEPA) studies, design, permitting and construction. MDTA assumed that completion of these steps requires a 20‐year time period, yielding an earliest completion year of 2035.
MDTA then identified three additional years for potential implementation: 2040, which is the year used for the future traffic analysis, 2050, and 2060. The four dates provide MDTA with life cycle cost information over a 25‐year window when a Bay Bridge Project could be completed.
The combination of four Build Options considered over four time frames (Build Options 1, 2, and 3) or two time frames (Build Option 4) and a No Build results in 15 life cycle cost scenarios. The costs for these 15 scenarios are presented in Table 5.1.
Table 5.1: Life Cycle Costs (in billions of dollars)
Completion Year
Build Option 1 Build Option 2 Build Option 3 Build Option 4 No Build
2035 $5.06 $5.45 $5.94 $3.89
$3.25 through 2065
2040 $5.01 $5.58 $6.09 $3.89
2050 $5.02 $5.67 $6.46 N/A
2060 $4.98 $5.71 $6.85 N/A
2. Depreciated Values of Existing Bay Bridge Structures in 2065The life cycle cost scenarios considered in this analysis mix old and new Bay Bridge structures. To accountfor the concept that a 100 year old structure does not have the same residual value as a new structure,a Depreciated Value was calculated for each life cycle cost scenario based on the structures remaining in

US 50 / 301 / WILLIAM PRESTON LANE JR. MEMORIAL (BAY) BRIDGE LIFE CYCLE COST ANALYSIS REPORT
36
service at the LCCA Horizon Year of 2065. The Depreciated Value attempts to quantify a value of the remaining structure(s) at the end of the study time frame.
The Depreciated Value is not intended to indicate any particular return that can be “withdrawn” from the overall system investment. Instead, the Depreciated Value is intended as a return on investment comparison between life cycle cost scenarios considered in this study. In general, a higher relative Depreciated Value likely correlates with lower maintenance costs in the years beyond the LCCA horizon year.
The Depreciated Value calculation is summarized as follows: 1. Determine the 2014 construction cost for each structure that will remain beyond the Bay Bridge
LCCA study horizon year (2065). For the existing eastbound and westbound bridges, this value isdetermined by taking the original bridge construction costs and converting them to 2014 dollarsusing the 2.75% LCCA inflation rate.
2. Assume linear depreciation of the present day construction cost over 100 years (i.e. 1% per year)to determine the present day Depreciated Value. Assume structures aged over 100 years priorto the LCCA horizon year have no remaining value.
3. Determine the Future Depreciated Value in the LCCA horizon year based on the inflation rate.4. Determine the Present Worth Depreciated Value (i.e. present dollar value) in the LCCA horizon
year based on the discount rate.
The total depreciated value of the remaining structures in 2065 based for the Build Options and No Build option are presented in Table 5.2.
Table 5.2: Total Depreciated Value of Remaining Structures in 2065 (in billions of dollars)
Completion Year
Build Option 1 Build Option 2 Build Option 3 Build Option 4 No Build
2035 $0.58 $0.98 $1.42 $0.16
$0.03 through 2065
2040 $0.62 $1.05 $1.52 $0.17
2050 $0.70 $1.19 $1.73 N/A
2060 $0.78 $1.32 $1.93 N/A
Related Documents


