BAUER Aktiengesellschaft City West project – Zurich, Switzerland Group Presentation First nine month 2012

Welcome message from author
This document is posted to help you gain knowledge. Please leave a comment to let me know what you think about it! Share it to your friends and learn new things together.
Transcript
© BAUER AG, D-86529 Schrobenhausen 12-08-14 IR-Presentation_9M_2012
BAUER Aktiengesellschaft
City West project – Zurich, Switzerland
Group Presentation
First nine month 2012
© BAUER AG, D-86529 Schrobenhausen 12-08-14 IR-Presentation_9M_2012 2
Total Group revenues (in EUR million)
1,600
1,200
800
400
0
Orders in hand (in EUR million)
800
600
400
200
0
Net profit (in EUR million)
60
45
30
15
0
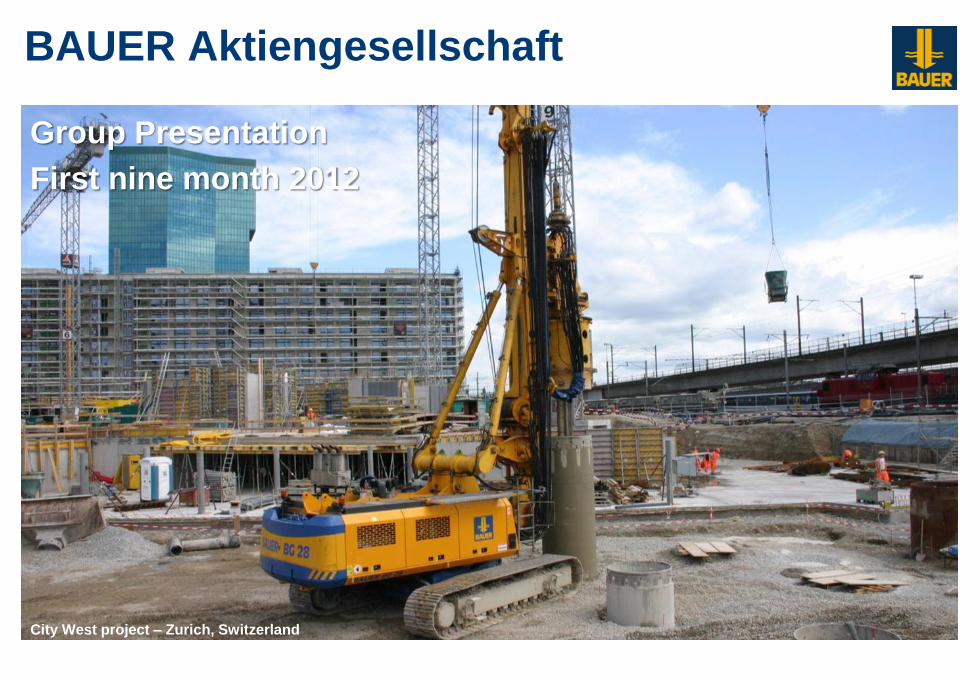
Key Figures 9M 2012
Employees (in average)
12,000
9,000
6,000
3,000
0
2009 2010 2011 9M 2011 9M 2012
2009 2010 2011 9M 2011 9M 2012 2009 2010 2011 9M 2011 9M 2012
2009 2010 2011 9M 2011 9M 2012
1,276 1,304 1,372 1,009 1,063 42.0 39.8 34.1 14.2 6.2
508.9 614.9 750.0 740.0 775.1 8,872 9,094 9,646 9,603 10,151
© BAUER AG, D-86529 Schrobenhausen 12-08-14 IR-Presentation_9M_2012 3
Mission & Strategy
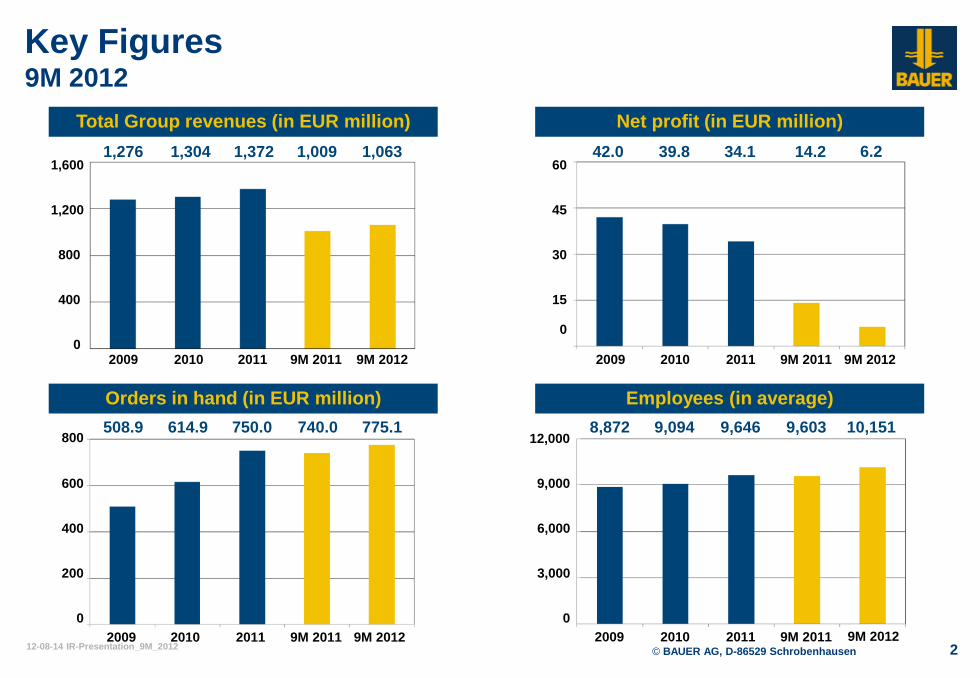
Services, equipment & products dealing with ground
and groundwater
Our mission
Our strategy
The world is our market.
World market leadership for foundation technology.
Powerful development of drilling applications and related
services for resources, water and energy markets.
Optimizing worldwide organizational networks and self
controlling structures for the Group.
Growth 5 to 12 % per year.
MC 128 – Cutter works in Jeddah, Saudi Arabia
© BAUER AG, D-86529 Schrobenhausen 12-08-14 IR-Presentation_9M_2012 4
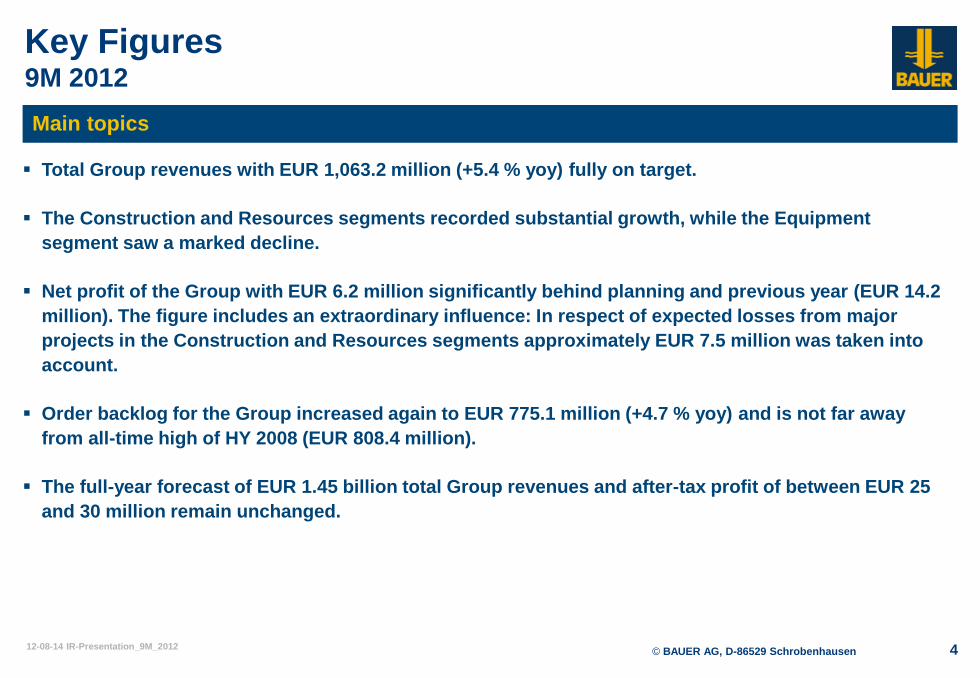
Total Group revenues with EUR 1,063.2 million (+5.4 % yoy) fully on target.
The Construction and Resources segments recorded substantial growth, while the Equipment
segment saw a marked decline.
Net profit of the Group with EUR 6.2 million significantly behind planning and previous year (EUR 14.2
million). The figure includes an extraordinary influence: In respect of expected losses from major
projects in the Construction and Resources segments approximately EUR 7.5 million was taken into
account.
Order backlog for the Group increased again to EUR 775.1 million (+4.7 % yoy) and is not far away
from all-time high of HY 2008 (EUR 808.4 million).
The full-year forecast of EUR 1.45 billion total Group revenues and after-tax profit of between EUR 25
and 30 million remain unchanged.
Main topics
Key Figures 9M 2012
© BAUER AG, D-86529 Schrobenhausen 12-08-14 IR-Presentation_9M_2012 5
Key Figures 9M 2012
9M 2011
in EUR million
9M 2012
in EUR million
∆ HY
in %
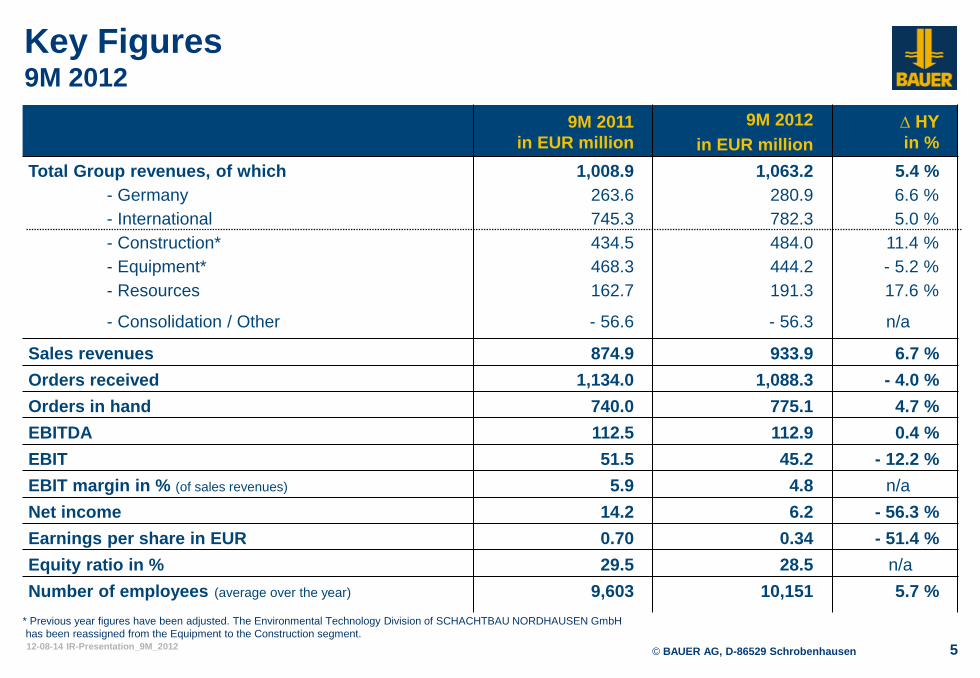
Total Group revenues, of which
- Germany
- International
- Construction*
- Equipment*
- Resources
- Consolidation / Other
1,008.9
263.6
745.3
434.5
468.3
162.7
- 56.6
1,063.2
280.9
782.3
484.0
444.2
191.3
- 56.3
5.4 %
6.6 %
5.0 %
11.4 %
- 5.2 %
17.6 %
n/a
Sales revenues 874.9 933.9 6.7 %
Orders received 1,134.0 1,088.3 - 4.0 %
Orders in hand 740.0 775.1 4.7 %
EBITDA 112.5 112.9 0.4 %
EBIT 51.5 45.2 - 12.2 %
EBIT margin in % (of sales revenues) 5.9 4.8 n/a
Net income 14.2 6.2 - 56.3 %
Earnings per share in EUR 0.70 0.34 - 51.4 %
Equity ratio in % 29.5 28.5 n/a
Number of employees (average over the year) 9,603 10,151 5.7 %
* Previous year figures have been adjusted. The Environmental Technology Division of SCHACHTBAU NORDHAUSEN GmbH
has been reassigned from the Equipment to the Construction segment.
© BAUER AG, D-86529 Schrobenhausen 12-08-14 IR-Presentation_9M_2012 6
Contents
Regional breakdown of Revenues 3
Financials 4
Overview BAUER Group 1
BAUER market environment 2
p. 7
p. 14
p. 16
p. 18
5 Guidance 2012
6 Appendix
p. 26
p. 27
© BAUER AG, D-86529 Schrobenhausen 12-08-14 IR-Presentation_9M_2012 7
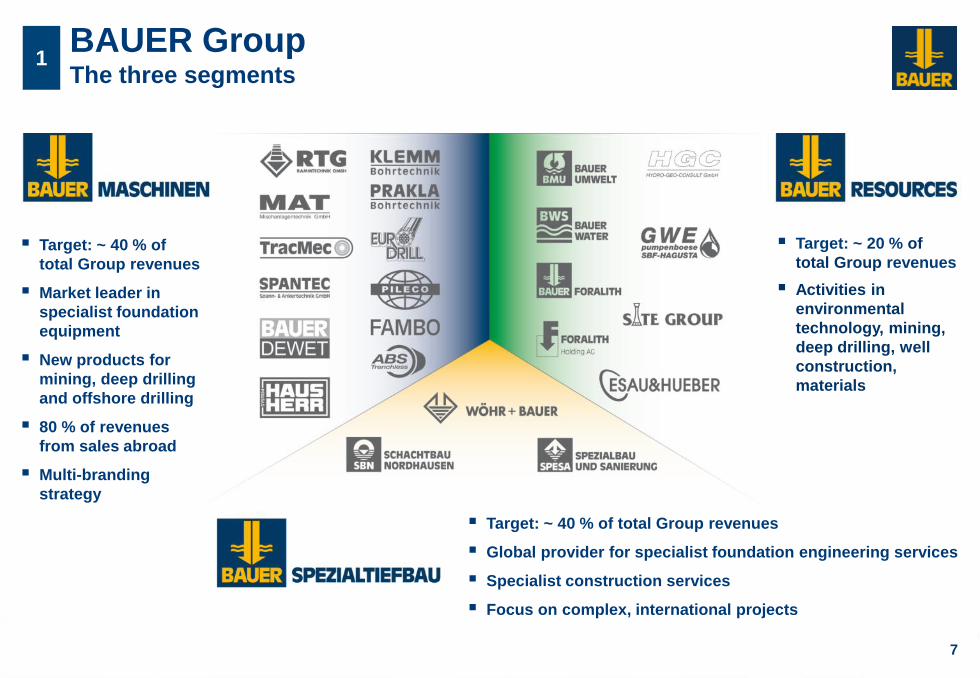
1 BAUER Group The three segments
Target: ~ 40 % of
total Group revenues
Market leader in
specialist foundation
equipment
New products for
mining, deep drilling
and offshore drilling
80 % of revenues
from sales abroad
Multi-branding
strategy
Target: ~ 40 % of total Group revenues
Global provider for specialist foundation engineering services
Specialist construction services
Focus on complex, international projects
Target: ~ 20 % of
total Group revenues
Activities in
environmental
technology, mining,
deep drilling, well
construction,
materials
© BAUER AG, D-86529 Schrobenhausen 12-08-14 IR-Presentation_9M_2012 8
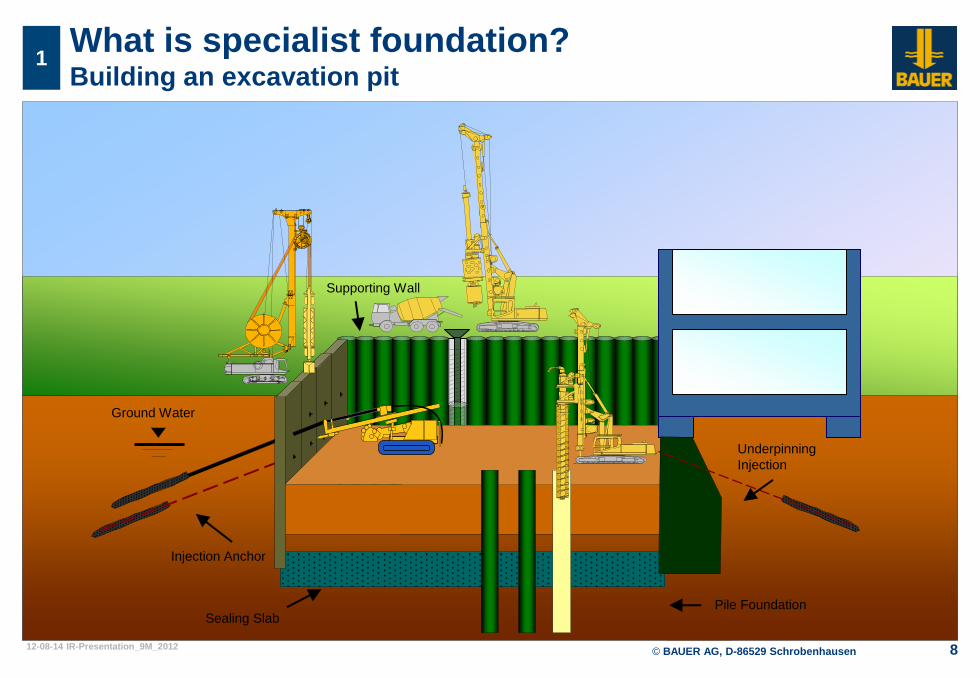
What is specialist foundation? Building an excavation pit
1
Ground Water
Injection Anchor
Sealing Slab
Supporting Wall
Underpinning
Injection
Pile Foundation
© BAUER AG, D-86529 Schrobenhausen 12-08-14 IR-Presentation_9M_2012 9
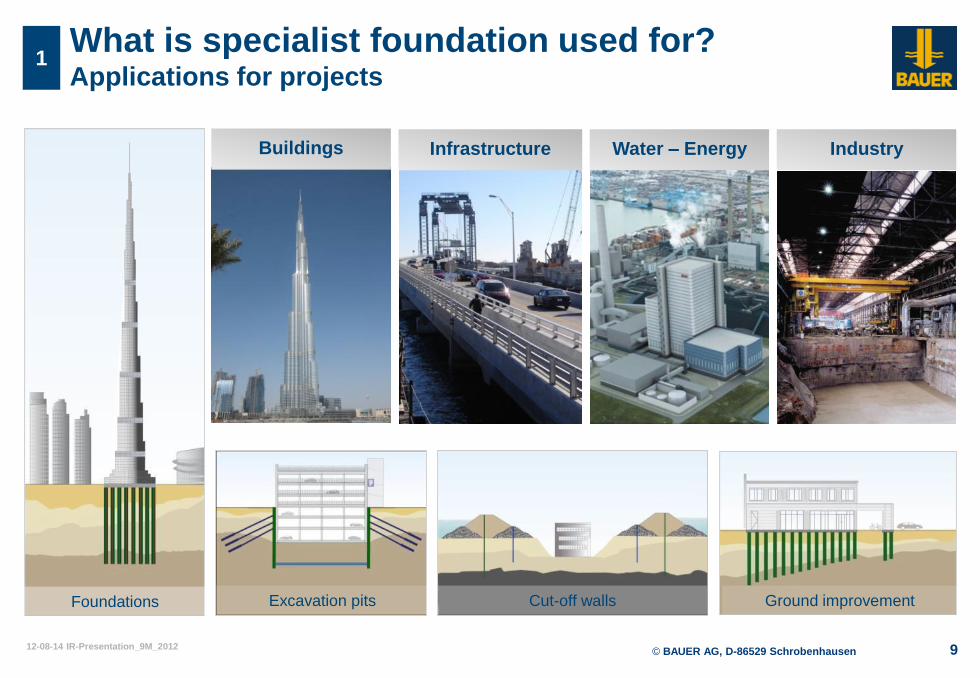
What is specialist foundation used for? Applications for projects
1
Foundations Cut-off walls Excavation pits
Buildings Infrastructure Water – Energy Industry
Ground improvement
© BAUER AG, D-86529 Schrobenhausen 12-08-14 IR-Presentation_9M_2012 10
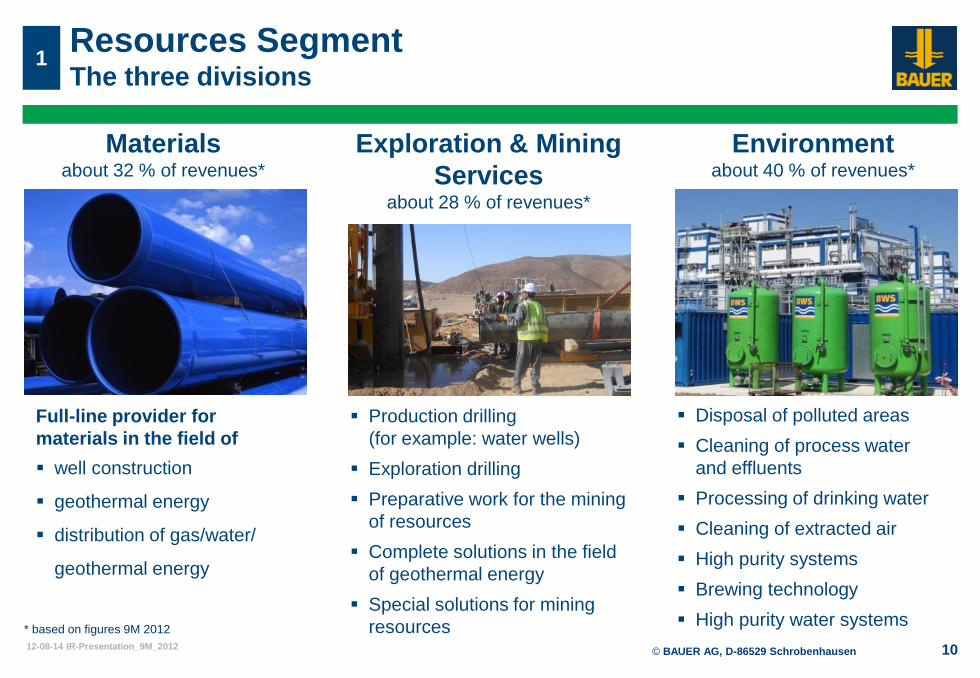
Resources Segment The three divisions
1
Environment about 40 % of revenues*
Exploration & Mining
Services about 28 % of revenues*
Materials about 32 % of revenues*
Full-line provider for
materials in the field of
well construction
geothermal energy
distribution of gas/water/
geothermal energy
Production drilling
(for example: water wells)
Exploration drilling
Preparative work for the mining
of resources
Complete solutions in the field
of geothermal energy
Special solutions for mining
resources
Disposal of polluted areas
Cleaning of process water
and effluents
Processing of drinking water
Cleaning of extracted air
High purity systems
Brewing technology
High purity water systems * based on figures 9M 2012
© BAUER AG, D-86529 Schrobenhausen 12-08-14 IR-Presentation_9M_2012
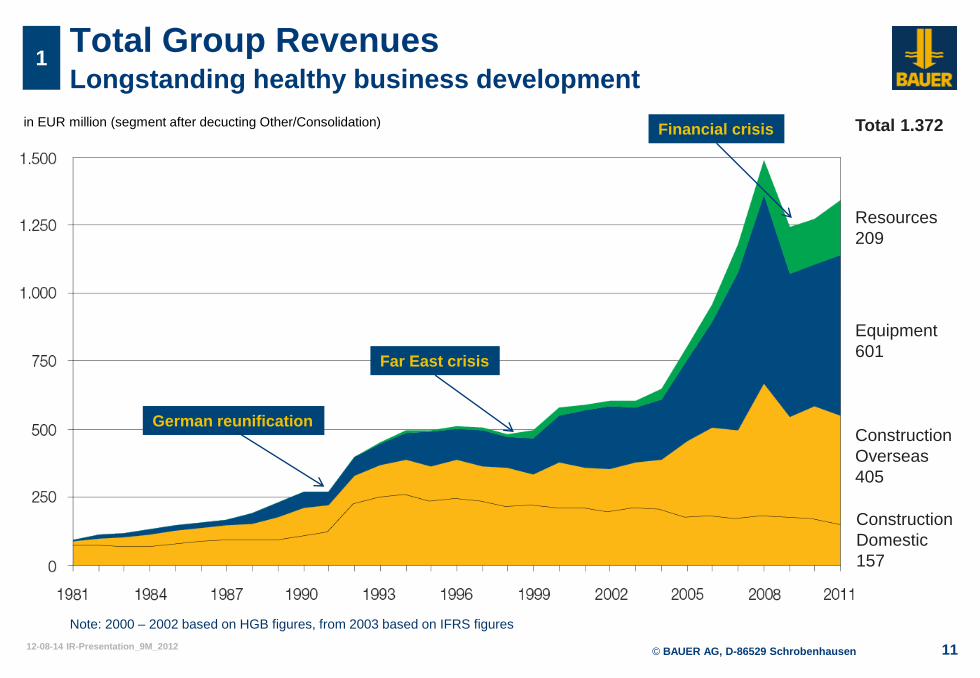
in EUR million (segment after decucting Other/Consolidation)
11
1
Note: 2000 – 2002 based on HGB figures, from 2003 based on IFRS figures
Resources
209
Equipment
601
Construction
Overseas
405
Total 1.372
Construction
Domestic
157
Total Group Revenues Longstanding healthy business development
German reunification
Far East crisis
Financial crisis
© BAUER AG, D-86529 Schrobenhausen 12-08-14 IR-Presentation_9M_2012 12
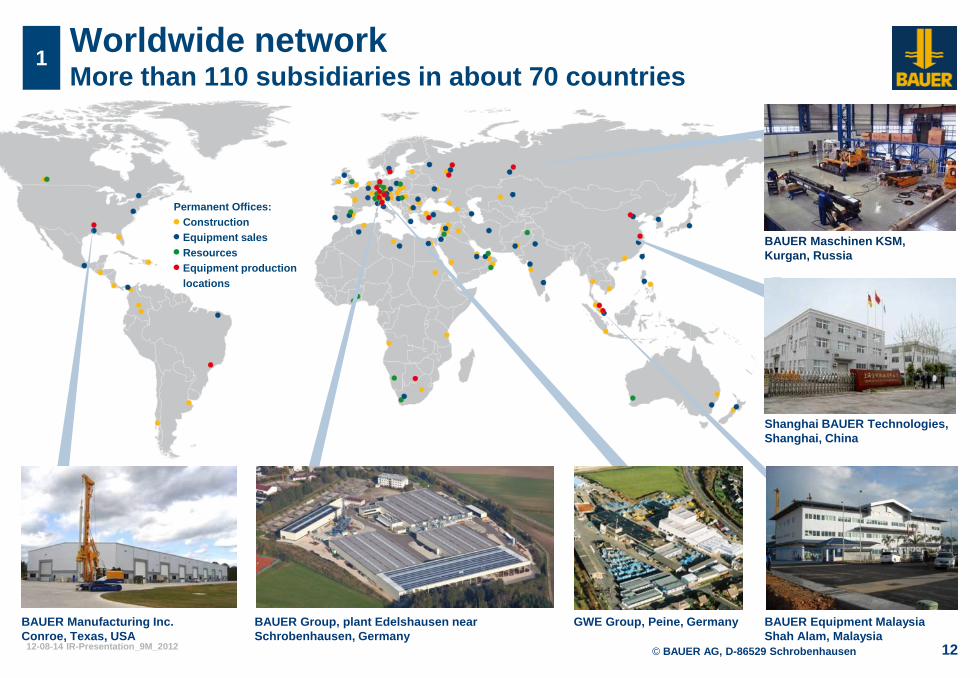
Worldwide network More than 110 subsidiaries in about 70 countries
1
BAUER Manufacturing Inc.
Conroe, Texas, USA
GWE Group, Peine, Germany
BAUER Maschinen KSM,
Kurgan, Russia
BAUER Equipment Malaysia
Shah Alam, Malaysia
Shanghai BAUER Technologies,
Shanghai, China
BAUER Group, plant Edelshausen near
Schrobenhausen, Germany
Permanent Offices:
Construction
Equipment sales
Resources
Equipment production
locations
© BAUER AG, D-86529 Schrobenhausen 12-08-14 IR-Presentation_9M_2012 13
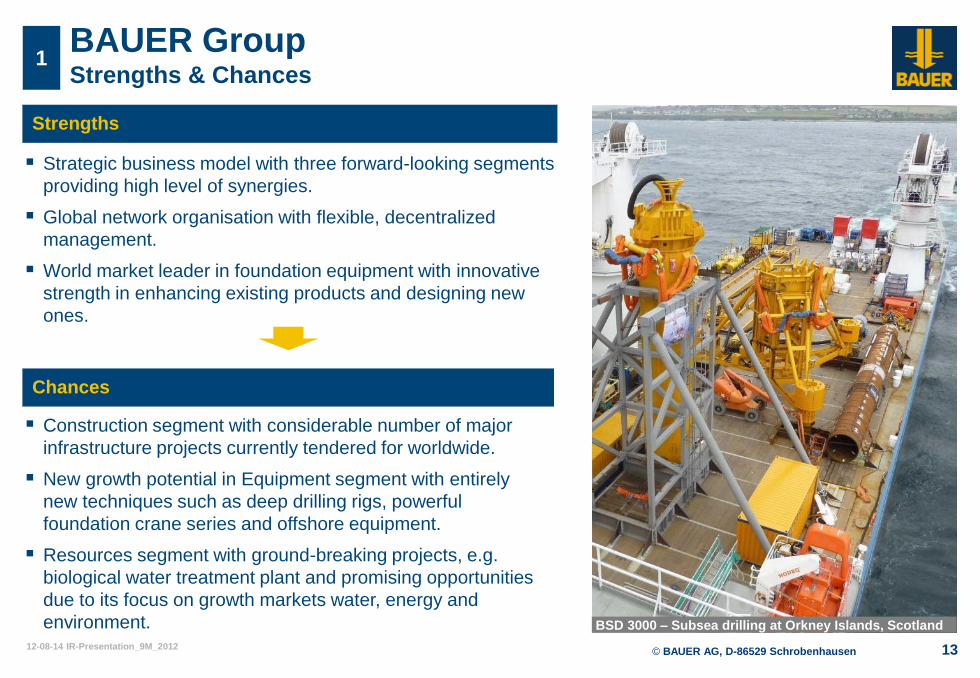
1 BAUER Group Strengths & Chances
Strategic business model with three forward-looking segments
providing high level of synergies.
Global network organisation with flexible, decentralized
management.
World market leader in foundation equipment with innovative
strength in enhancing existing products and designing new
ones.
Strengths
Chances
Construction segment with considerable number of major
infrastructure projects currently tendered for worldwide.
New growth potential in Equipment segment with entirely
new techniques such as deep drilling rigs, powerful
foundation crane series and offshore equipment.
Resources segment with ground-breaking projects, e.g.
biological water treatment plant and promising opportunities
due to its focus on growth markets water, energy and
environment. BSD 3000 – Subsea drilling at Orkney Islands, Scotland

© BAUER AG, D-86529 Schrobenhausen 11-11-14 IR-Presentation_9M2011
+
World construction markets Bauer market potential
2
14
-
Western Europe:
declining markets,
Germany is quite good +
+
++
Far East:
positive development
in all areas, especially
Hongkong, Malaysia
+ Other Americas:
several chances in
Central America
o
Africa:
slight construction activities,
regional growth (Angola, Algeria);
demand for water and resources
Summary: Recovering market conditions worldwide, but generally very unstable; huge pent-up demand.
Specialist foundation construction grows relative to construction market.
Energy sector becomes main booster – also because of energy turnaround (renewable
energies & reduction of energy consumption);
Middle East:
stable, especially
Abu Dhabi, Qatar,
Saudi Arabia
Eastern Europe:
slowly positive development,
especially Russia
Central Asia:
good market
potentials
USA / Canada:
public demand,
power plants, dams, etc.
14
-- weak - slightly weak stable + growing ++ strong growth
-
+
+
© BAUER AG, D-86529 Schrobenhausen 12-08-14 IR-Presentation_9M_2012 15
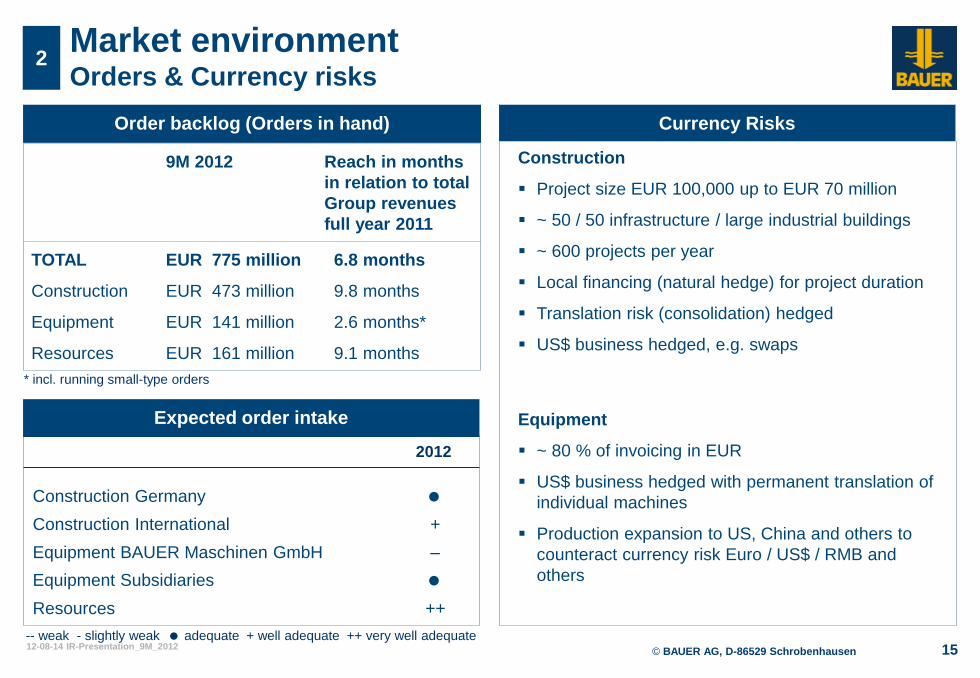
Market environment Orders & Currency risks
2
Order backlog (Orders in hand) Currency Risks
Expected order intake
2012
Construction Germany
Construction International +
Equipment BAUER Maschinen GmbH –
Equipment Subsidiaries
Resources ++
-- weak - slightly weak adequate + well adequate ++ very well adequate
9M 2012 Reach in months
in relation to total
Group revenues
full year 2011
TOTAL
Construction
Equipment
Resources
EUR 775 million
EUR 473 million
EUR 141 million
EUR 161 million
6.8 months
9.8 months
2.6 months*
9.1 months
* incl. running small-type orders
Construction
Project size EUR 100,000 up to EUR 70 million
~ 50 / 50 infrastructure / large industrial buildings
~ 600 projects per year
Local financing (natural hedge) for project duration
Translation risk (consolidation) hedged
US$ business hedged, e.g. swaps
Equipment
~ 80 % of invoicing in EUR
US$ business hedged with permanent translation of
individual machines
Production expansion to US, China and others to
counteract currency risk Euro / US$ / RMB and
others
© BAUER AG, D-86529 Schrobenhausen 12-08-14 IR-Presentation_9M_2012 16
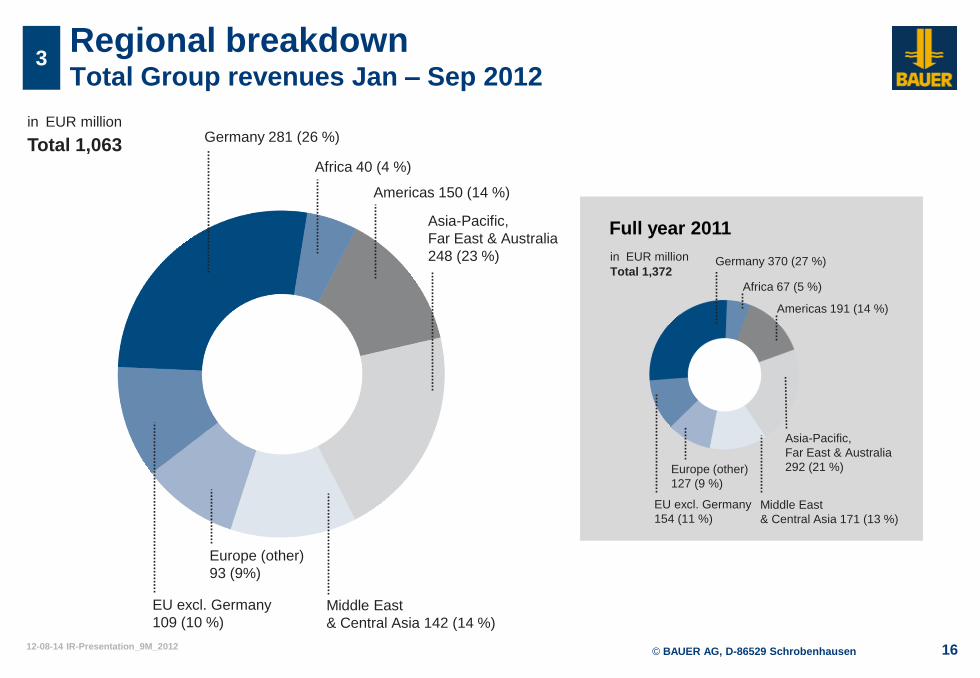
3 Regional breakdown Total Group revenues Jan – Sep 2012
in EUR million
Total 1,063 Africa 40 (4 %)
Americas 150 (14 %)
Asia-Pacific,
Far East & Australia
248 (23 %)
Middle East
& Central Asia 142 (14 %)
Germany 281 (26 %)
EU excl. Germany
109 (10 %)
Europe (other)
93 (9%)
in EUR million
Africa 67 (5 %)
Americas 191 (14 %)
Asia-Pacific,
Far East & Australia
292 (21 %)
Middle East
& Central Asia 171 (13 %)
Germany 370 (27 %)
EU excl. Germany
154 (11 %)
Europe (other)
127 (9 %)
Total 1,372
Full year 2011
© BAUER AG, D-86529 Schrobenhausen 12-08-14 IR-Presentation_9M_2012 17
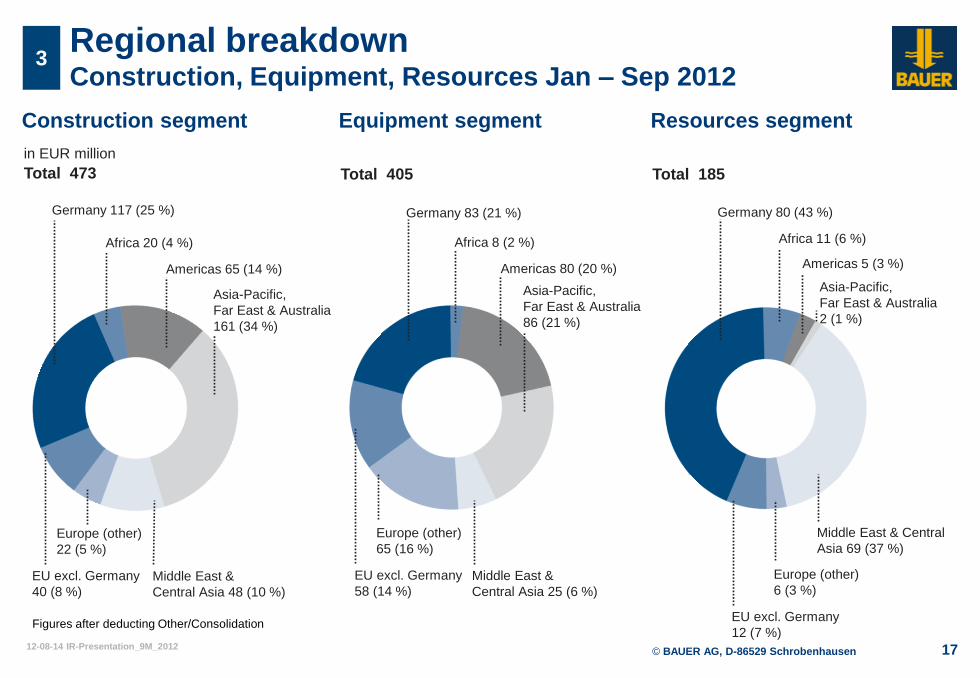
3 Regional breakdown Construction, Equipment, Resources Jan – Sep 2012
Figures after deducting Other/Consolidation
Construction segment Equipment segment Resources segment
in EUR million
Total 473 Total 405 Total 185
Africa 20 (4 %)
Americas 65 (14 %)
Asia-Pacific,
Far East & Australia
161 (34 %)
Middle East &
Central Asia 48 (10 %)
Germany 117 (25 %)
EU excl. Germany
40 (8 %)
Europe (other)
22 (5 %)
Africa 8 (2 %)
Americas 80 (20 %)
Asia-Pacific,
Far East & Australia
86 (21 %)
Middle East &
Central Asia 25 (6 %)
Germany 83 (21 %)
EU excl. Germany
58 (14 %)
Europe (other)
65 (16 %)
Africa 11 (6 %)
Americas 5 (3 %)
Asia-Pacific,
Far East & Australia
2 (1 %)
Middle East & Central
Asia 69 (37 %)
Germany 80 (43 %)
EU excl. Germany
12 (7 %)
Europe (other)
6 (3 %)
© BAUER AG, D-86529 Schrobenhausen 12-08-14 IR-Presentation_9M_2012 18
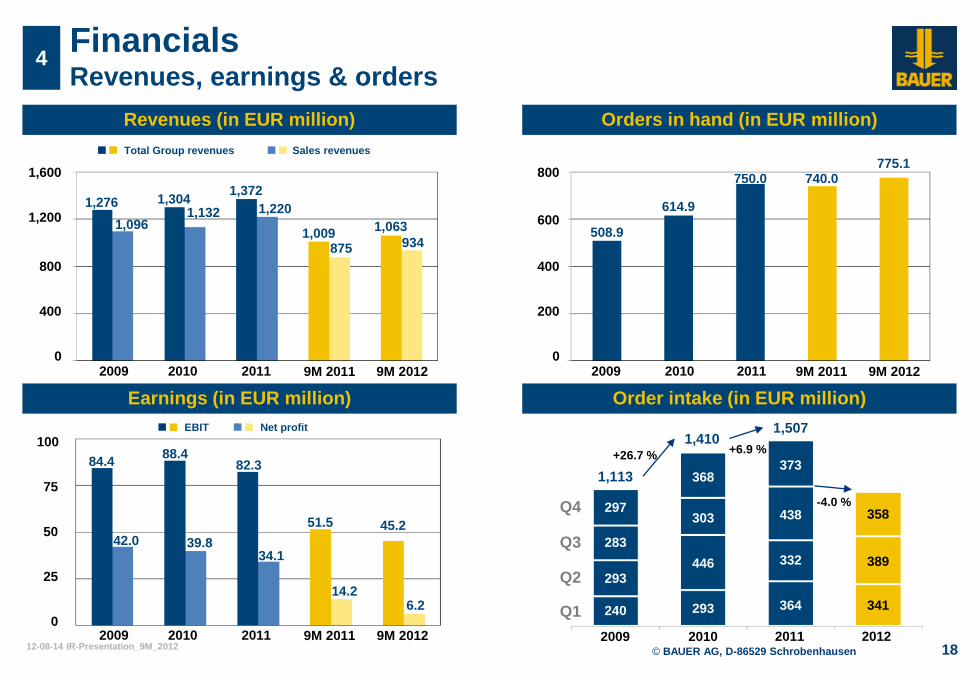
Revenues (in EUR million)
Earnings (in EUR million)
Financials Revenues, earnings & orders
4
1,276
1,096
2011 9M 2011
1,600
1,200
800
400
0
1,304 1,132
84.4
42.0
100
75
50
25
0
88.4
39.8
Orders in hand (in EUR million)
508.9
800
600
400
200
0
614.9
Order intake (in EUR million)
2011 2012
297
283
293
240
303
446
293
1,113
2010
2010
2009
2009
368
1,410 +26.7 %
1,372
1,220
750.0
82.3
34.1
364
332
438
373
1,507
+6.9 %
Q1
Q2
Q3
Q4
1,009 1,063
875 934
9M 2012
2011 9M 2011 2010 2009 9M 2012
51.5
14.2
45.2
6.2
2011 9M 2011 2010 2009 9M 2012
740.0 775.1
341
-4.0 %
Total Group revenues Sales revenues
EBIT Net profit
389
358
© BAUER AG, D-86529 Schrobenhausen 12-08-14 IR-Presentation_9M_2012 19
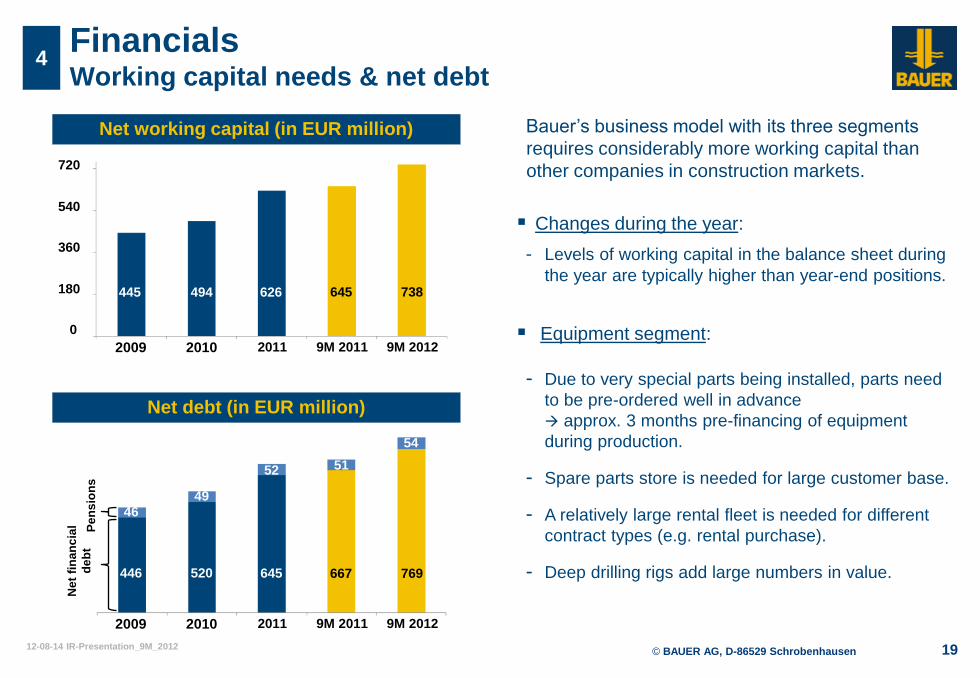
Financials Working capital needs & net debt
4
Net debt (in EUR million)
Net
fin
an
cia
l
de
bt
Pe
ns
ion
s
446 520
46
49
Bauer’s business model with its three segments
requires considerably more working capital than
other companies in construction markets.
Changes during the year:
- Levels of working capital in the balance sheet during
the year are typically higher than year-end positions.
Equipment segment:
- Due to very special parts being installed, parts need
to be pre-ordered well in advance
approx. 3 months pre-financing of equipment
during production.
- Spare parts store is needed for large customer base.
- A relatively large rental fleet is needed for different
contract types (e.g. rental purchase).
- Deep drilling rigs add large numbers in value.
Net working capital (in EUR million)
2009 2010
445 494
720
540
360
180
0
626
645
52
2011 9M 2011 9M 2012
645 738
2009 2010 2011 9M 2011 9M 2012
51
54
667 769
© BAUER AG, D-86529 Schrobenhausen 12-08-14 IR-Presentation_9M_2012 20
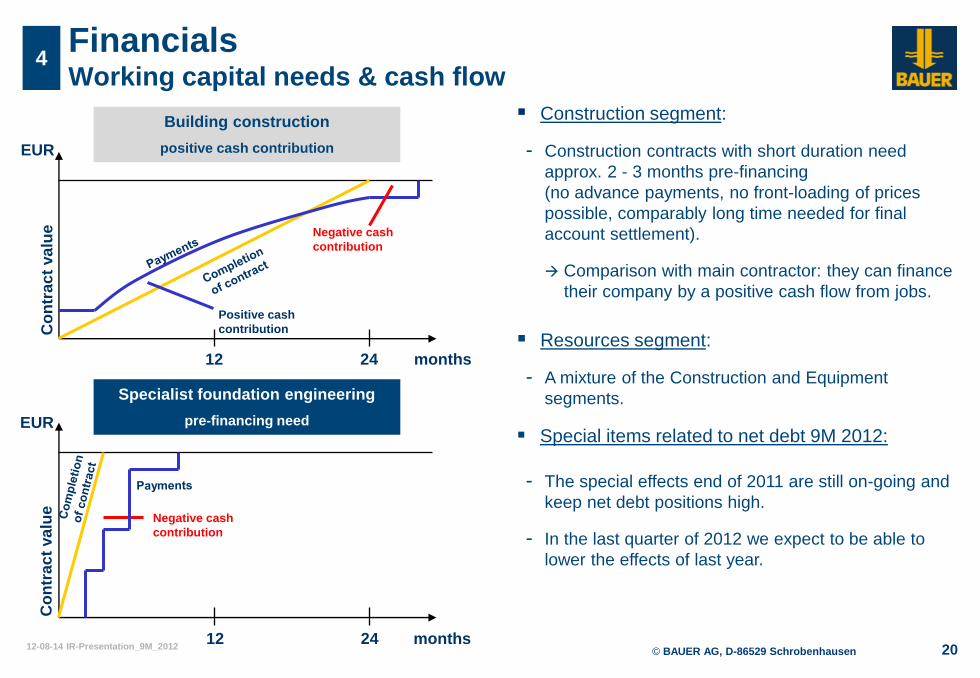
Building construction
positive cash contribution
Specialist foundation engineering
pre-financing need
Financials Working capital needs & cash flow
4
EUR
12 24 months
Positive cash
contribution
Negative cash
contribution
Co
ntr
ac
t va
lue
EUR
Negative cash
contribution
12 24 months
Co
ntr
ac
t va
lue
Construction segment:
- Construction contracts with short duration need
approx. 2 - 3 months pre-financing
(no advance payments, no front-loading of prices
possible, comparably long time needed for final
account settlement).
Comparison with main contractor: they can finance
their company by a positive cash flow from jobs.
Resources segment:
- A mixture of the Construction and Equipment
segments.
Special items related to net debt 9M 2012:
- The special effects end of 2011 are still on-going and
keep net debt positions high.
- In the last quarter of 2012 we expect to be able to
lower the effects of last year.
© BAUER AG, D-86529 Schrobenhausen 12-08-14 IR-Presentation_9M_2012 21
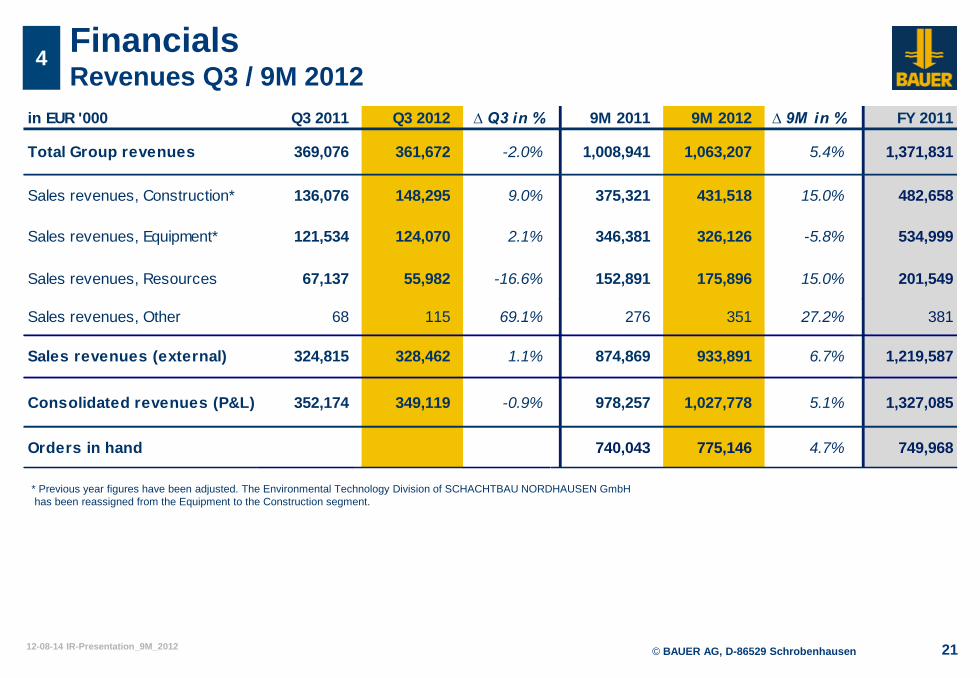
Financials Revenues Q3 / 9M 2012
4
* Previous year figures have been adjusted. The Environmental Technology Division of SCHACHTBAU NORDHAUSEN GmbH
has been reassigned from the Equipment to the Construction segment.
in EUR '000 Q3 2011 Q3 2012 ∆ Q3 in % 9M 2011 9M 2012 ∆ 9M in % FY 2011
Total Group revenues 369,076 361,672 -2.0% 1,008,941 1,063,207 5.4% 1,371,831
Sales revenues, Construction* 136,076 148,295 9.0% 375,321 431,518 15.0% 482,658
Sales revenues, Equipment* 121,534 124,070 2.1% 346,381 326,126 -5.8% 534,999
Sales revenues, Resources 67,137 55,982 -16.6% 152,891 175,896 15.0% 201,549
Sales revenues, Other 68 115 69.1% 276 351 27.2% 381
Sales revenues (external) 324,815 328,462 1.1% 874,869 933,891 6.7% 1,219,587
Consolidated revenues (P&L) 352,174 349,119 -0.9% 978,257 1,027,778 5.1% 1,327,085
Orders in hand 740,043 775,146 4.7% 749,968
© BAUER AG, D-86529 Schrobenhausen 12-08-14 IR-Presentation_9M_2012 22
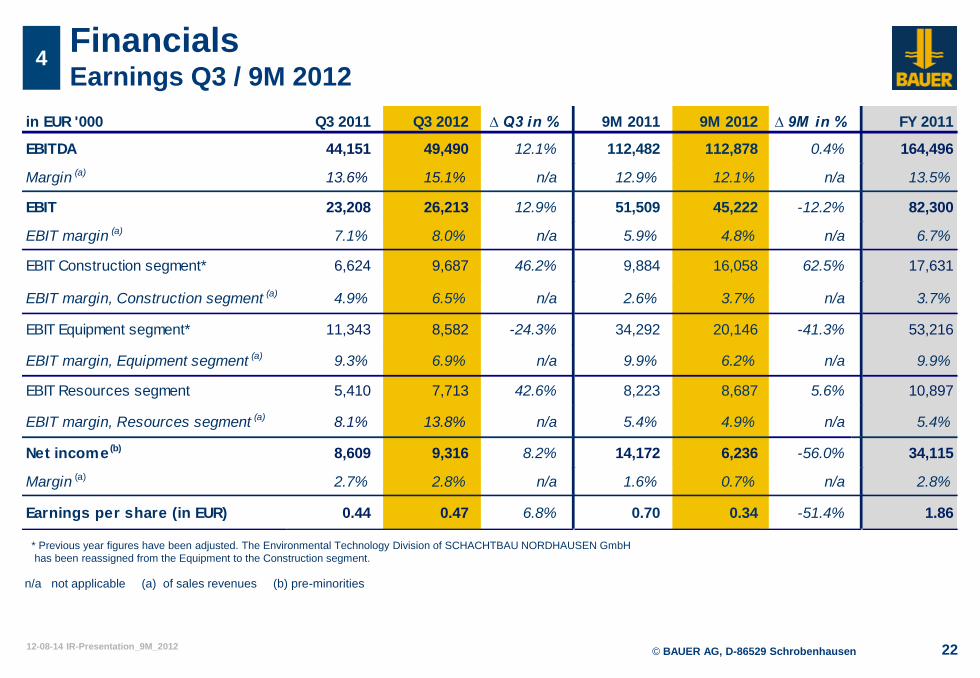
Financials Earnings Q3 / 9M 2012
4
n/a not applicable (a) of sales revenues (b) pre-minorities
* Previous year figures have been adjusted. The Environmental Technology Division of SCHACHTBAU NORDHAUSEN GmbH
has been reassigned from the Equipment to the Construction segment.
in EUR '000 Q3 2011 Q3 2012 ∆ Q3 in % 9M 2011 9M 2012 ∆ 9M in % FY 2011
EBITDA 44,151 49,490 12.1% 112,482 112,878 0.4% 164,496
Margin (a) 13.6% 15.1% n/a 12.9% 12.1% n/a 13.5%
EBIT 23,208 26,213 12.9% 51,509 45,222 -12.2% 82,300
EBIT margin (a) 7.1% 8.0% n/a 5.9% 4.8% n/a 6.7%
EBIT Construction segment* 6,624 9,687 46.2% 9,884 16,058 62.5% 17,631
EBIT margin, Construction segment (a) 4.9% 6.5% n/a 2.6% 3.7% n/a 3.7%
EBIT Equipment segment* 11,343 8,582 -24.3% 34,292 20,146 -41.3% 53,216
EBIT margin, Equipment segment (a) 9.3% 6.9% n/a 9.9% 6.2% n/a 9.9%
EBIT Resources segment 5,410 7,713 42.6% 8,223 8,687 5.6% 10,897
EBIT margin, Resources segment (a) 8.1% 13.8% n/a 5.4% 4.9% n/a 5.4%
Net income (b) 8,609 9,316 8.2% 14,172 6,236 -56.0% 34,115
Margin (a) 2.7% 2.8% n/a 1.6% 0.7% n/a 2.8%
Earnings per share (in EUR) 0.44 0.47 6.8% 0.70 0.34 -51.4% 1.86
© BAUER AG, D-86529 Schrobenhausen 12-08-14 IR-Presentation_9M_2012 23
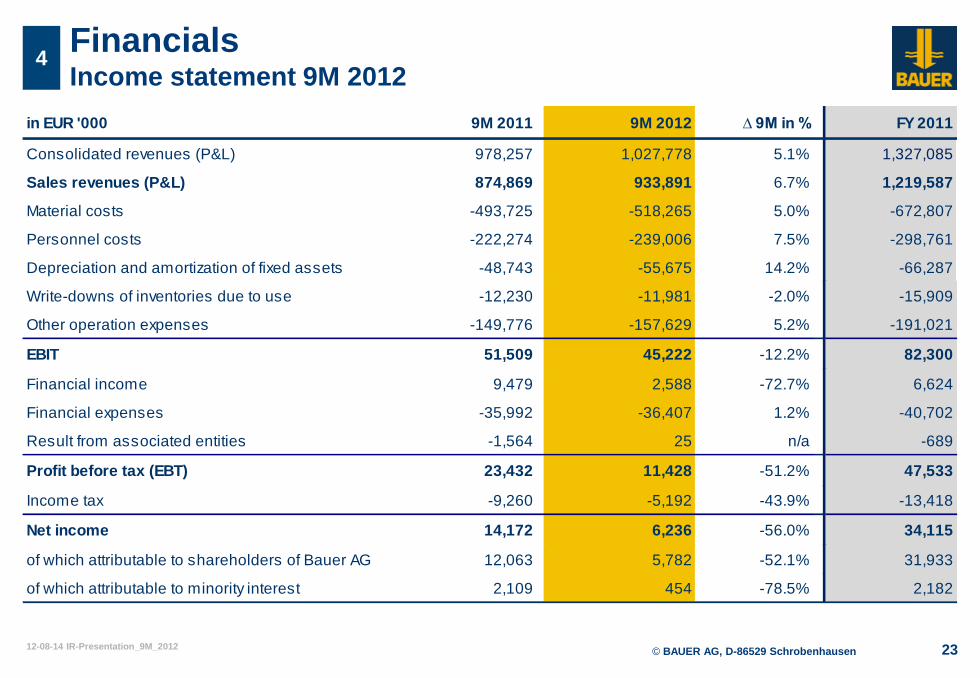
Financials Income statement 9M 2012
4
in EUR '000 9M 2011 9M 2012 ∆ 9M in % FY 2011
Consolidated revenues (P&L) 978,257 1,027,778 5.1% 1,327,085
Sales revenues (P&L) 874,869 933,891 6.7% 1,219,587
Material costs -493,725 -518,265 5.0% -672,807
Personnel costs -222,274 -239,006 7.5% -298,761
Depreciation and amortization of fixed assets -48,743 -55,675 14.2% -66,287
Write-downs of inventories due to use -12,230 -11,981 -2.0% -15,909
Other operation expenses -149,776 -157,629 5.2% -191,021
EBIT 51,509 45,222 -12.2% 82,300
Financial income 9,479 2,588 -72.7% 6,624
Financial expenses -35,992 -36,407 1.2% -40,702
Result from associated entities -1,564 25 n/a -689
Profit before tax (EBT) 23,432 11,428 -51.2% 47,533
Income tax -9,260 -5,192 -43.9% -13,418
Net income 14,172 6,236 -56.0% 34,115
of which attributable to shareholders of Bauer AG 12,063 5,782 -52.1% 31,933
of which attributable to minority interest 2,109 454 -78.5% 2,182
© BAUER AG, D-86529 Schrobenhausen 12-08-14 IR-Presentation_9M_2012 24
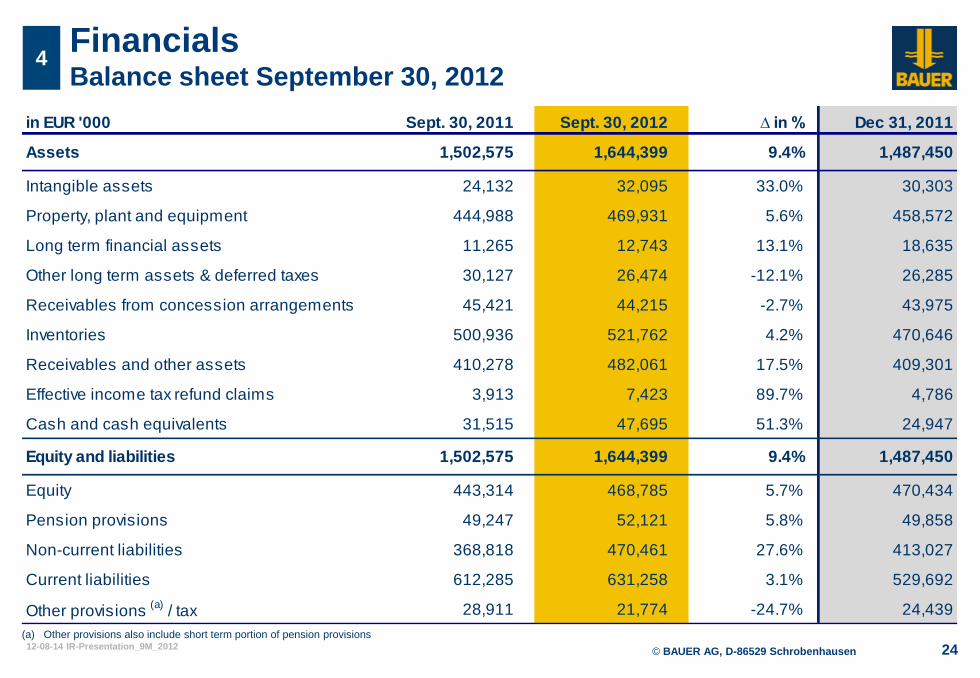
Financials Balance sheet September 30, 2012
4
(a) Other provisions also include short term portion of pension provisions
in EUR '000 Sept. 30, 2011 Sept. 30, 2012 ∆ in % Dec 31, 2011
Assets 1,502,575 1,644,399 9.4% 1,487,450
Intangible assets 24,132 32,095 33.0% 30,303
Property, plant and equipment 444,988 469,931 5.6% 458,572
Long term financial assets 11,265 12,743 13.1% 18,635
Other long term assets & deferred taxes 30,127 26,474 -12.1% 26,285
Receivables from concession arrangements 45,421 44,215 -2.7% 43,975
Inventories 500,936 521,762 4.2% 470,646
Receivables and other assets 410,278 482,061 17.5% 409,301
Effective income tax refund claims 3,913 7,423 89.7% 4,786
Cash and cash equivalents 31,515 47,695 51.3% 24,947
Equity and liabilities 1,502,575 1,644,399 9.4% 1,487,450
Equity 443,314 468,785 5.7% 470,434
Pension provisions 49,247 52,121 5.8% 49,858
Non-current liabilities 368,818 470,461 27.6% 413,027
Current liabilities 612,285 631,258 3.1% 529,692
Other provisions (a)
/ tax 28,911 21,774 -24.7% 24,439
© BAUER AG, D-86529 Schrobenhausen 12-08-14 IR-Presentation_9M_2012 25
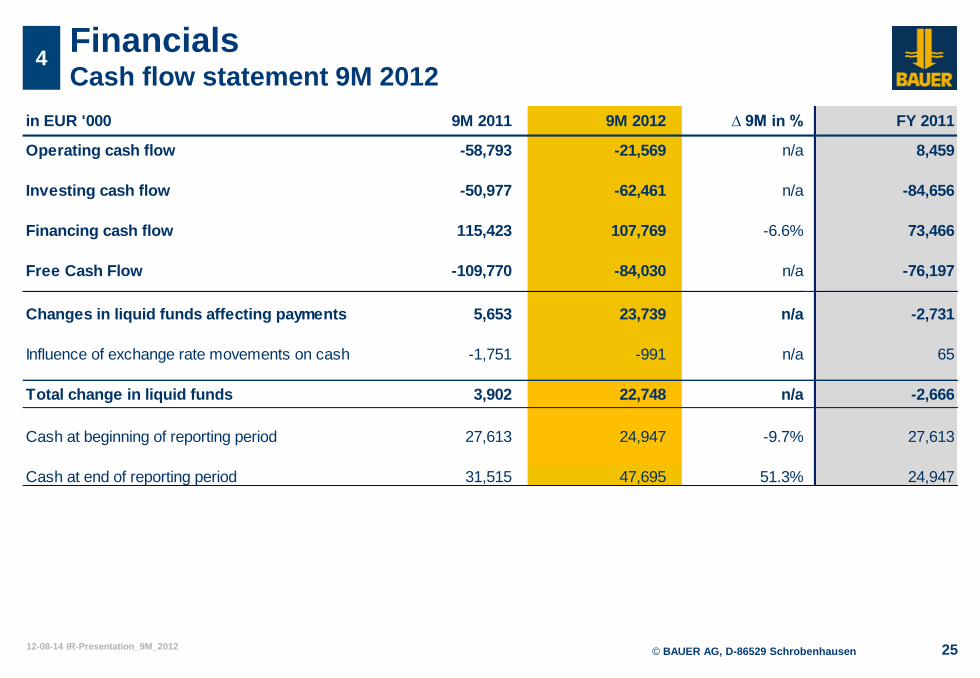
Financials Cash flow statement 9M 2012
4
in EUR '000 9M 2011 9M 2012 ∆ 9M in % FY 2011
Operating cash flow -58,793 -21,569 n/a 8,459
Investing cash flow -50,977 -62,461 n/a -84,656
Financing cash flow 115,423 107,769 -6.6% 73,466
Free Cash Flow -109,770 -84,030 n/a -76,197
Changes in liquid funds affecting payments 5,653 23,739 n/a -2,731
Influence of exchange rate movements on cash -1,751 -991 n/a 65
Total change in liquid funds 3,902 22,748 n/a -2,666
Cash at beginning of reporting period 27,613 24,947 -9.7% 27,613
Cash at end of reporting period 31,515 47,695 51.3% 24,947
© BAUER AG, D-86529 Schrobenhausen 12-08-14 IR-Presentation_9M_2012 26
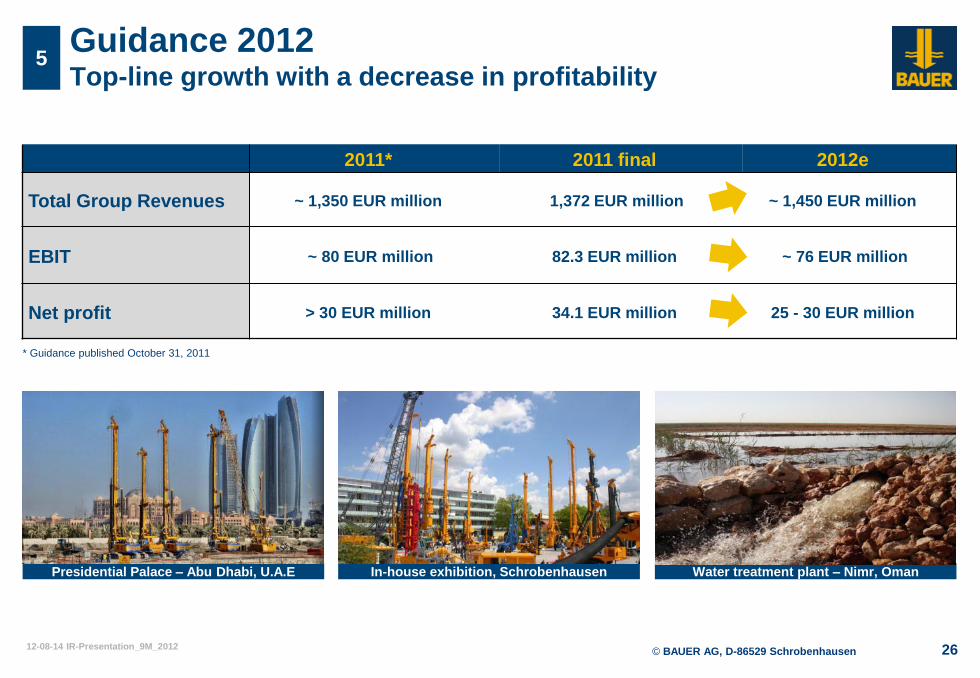
Guidance 2012 Top-line growth with a decrease in profitability
5
2011* 2011 final 2012e
Total Group Revenues ~ 1,350 EUR million 1,372 EUR million ~ 1,450 EUR million
EBIT ~ 80 EUR million 82.3 EUR million ~ 76 EUR million
Net profit > 30 EUR million 34.1 EUR million 25 - 30 EUR million
Presidential Palace – Abu Dhabi, U.A.E In-house exhibition, Schrobenhausen Water treatment plant – Nimr, Oman
* Guidance published October 31, 2011
© BAUER AG, D-86529 Schrobenhausen 12-08-14 IR-Presentation_9M_2012 27
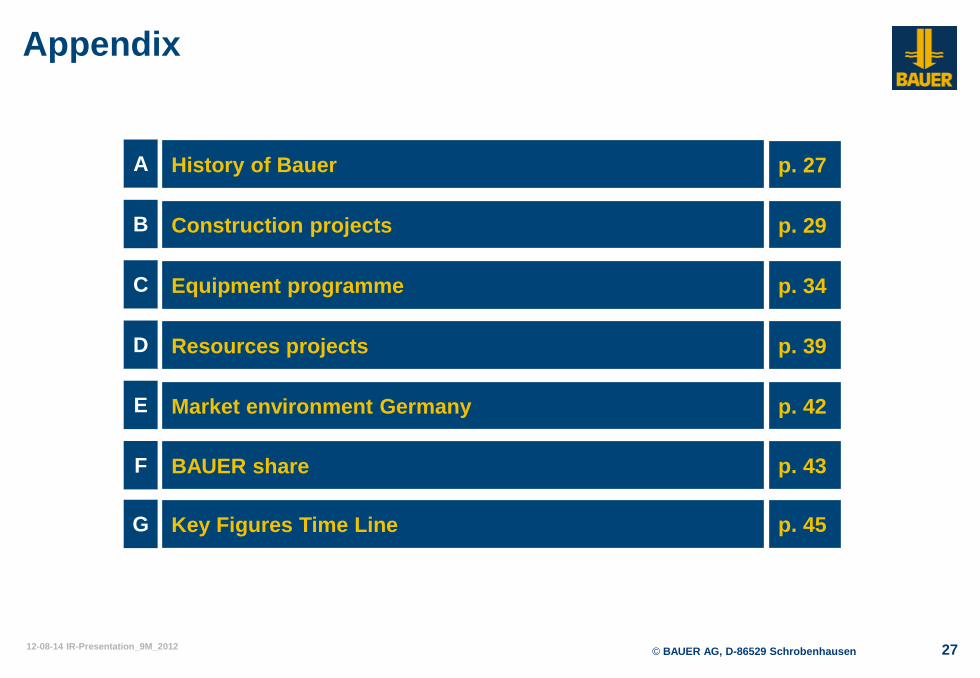
Appendix
Equipment programme C
Resources projects D
History of Bauer A
E Market environment Germany
F BAUER share
Construction projects B
p. 27
p. 29
p. 34
p. 39
p. 42
p. 43
G Key Figures Time Line p. 45
© BAUER AG, D-86529 Schrobenhausen 12-08-14 IR-Presentation_9M_2012 28
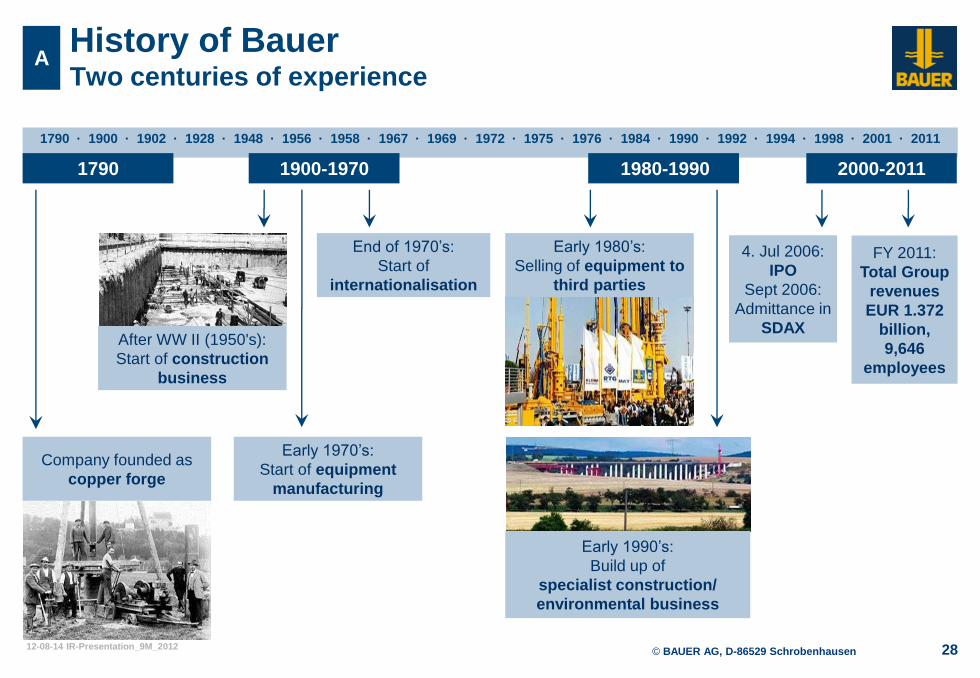
1790 · 1900 · 1902 · 1928 · 1948 · 1956 · 1958 · 1967 · 1969 · 1972 · 1975 · 1976 · 1984 · 1990 · 1992 · 1994 · 1998 · 2001 · 2011
History of Bauer Two centuries of experience
End of 1970’s:
Start of
internationalisation
Early 1990’s:
Build up of
specialist construction/
environmental business
FY 2011:
Total Group
revenues
EUR 1.372
billion,
9,646
employees
4. Jul 2006:
IPO
Sept 2006:
Admittance in
SDAX
A
Early 1970’s:
Start of equipment
manufacturing
Company founded as
copper forge
After WW II (1950's):
Start of construction
business
Early 1980’s:
Selling of equipment to
third parties
1790 1900-1970 1980-1990 2000-2011
© BAUER AG, D-86529 Schrobenhausen 12-08-14 IR-Presentation_9M_2012 29
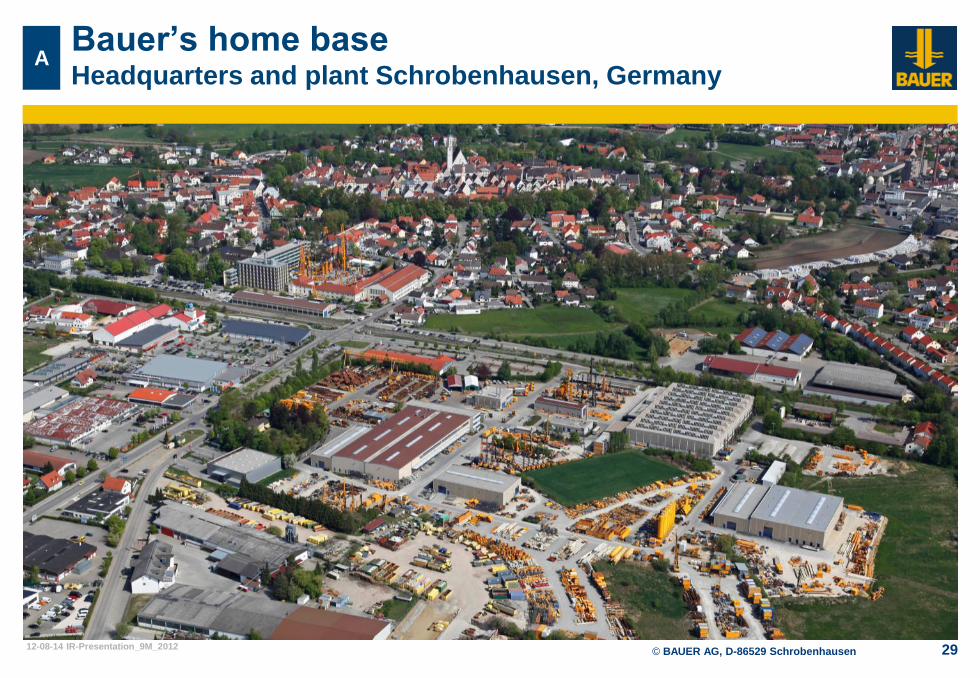
A Bauer’s home base Headquarters and plant Schrobenhausen, Germany
© BAUER AG, D-86529 Schrobenhausen 12-08-14 IR-Presentation_9M_2012 30
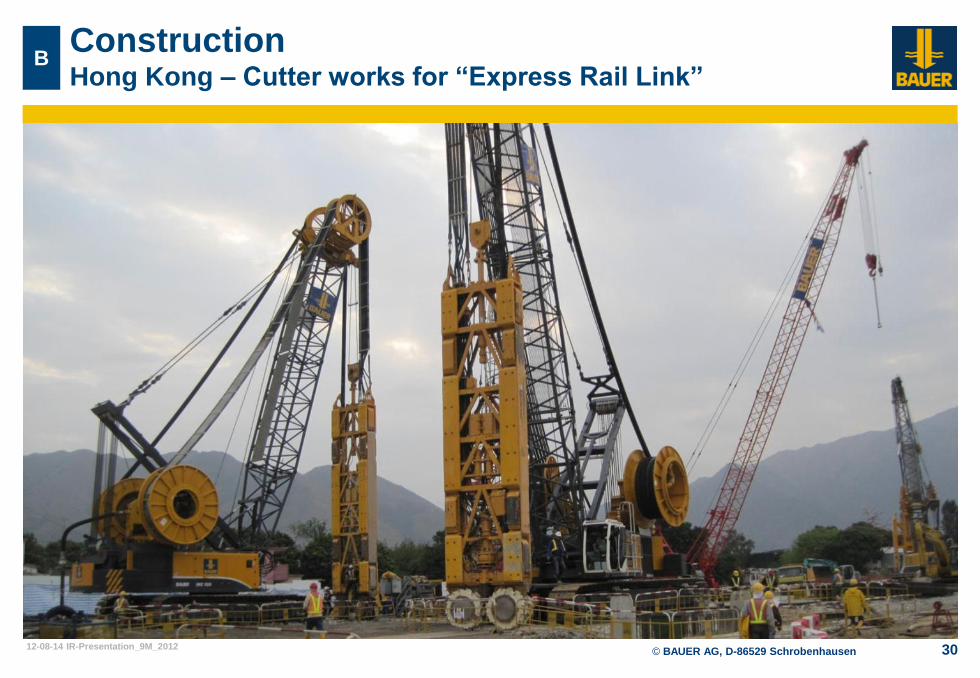
B Construction Hong Kong – Cutter works for “Express Rail Link”

© BAUER AG, D-86529 Schrobenhausen 12-08-14 IR-Presentation_9M_2012 31
Construction Kuala Lumpur, Malaysia – Cutter works for underground station
B
© BAUER AG, D-86529 Schrobenhausen 12-08-14 IR-Presentation_9M_2012 32
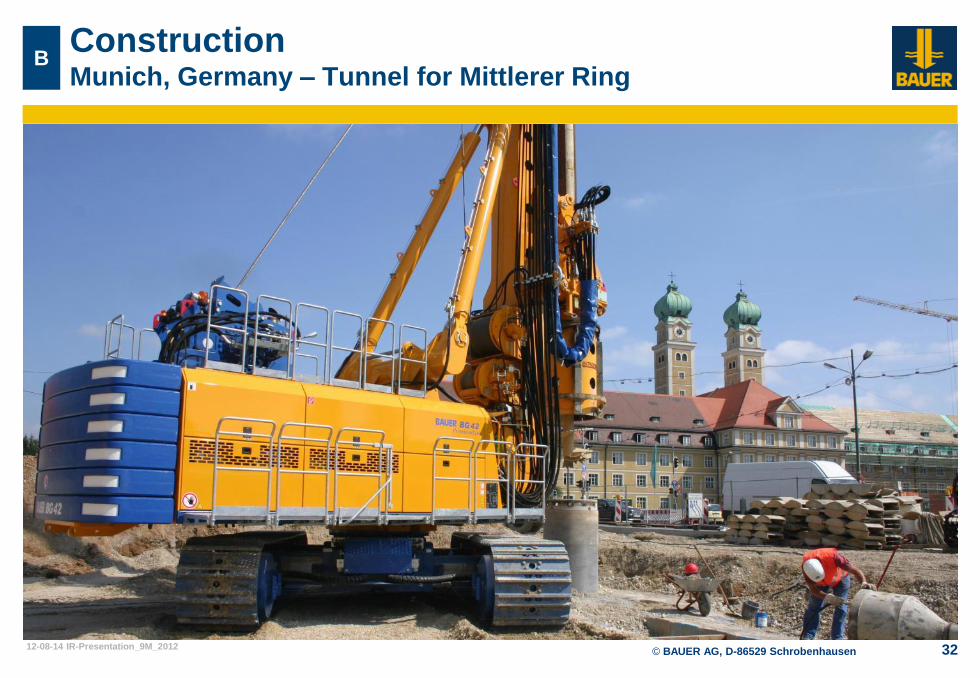
Construction Munich, Germany – Tunnel for Mittlerer Ring
B
© BAUER AG, D-86529 Schrobenhausen 12-08-14 IR-Presentation_9M_2012 33
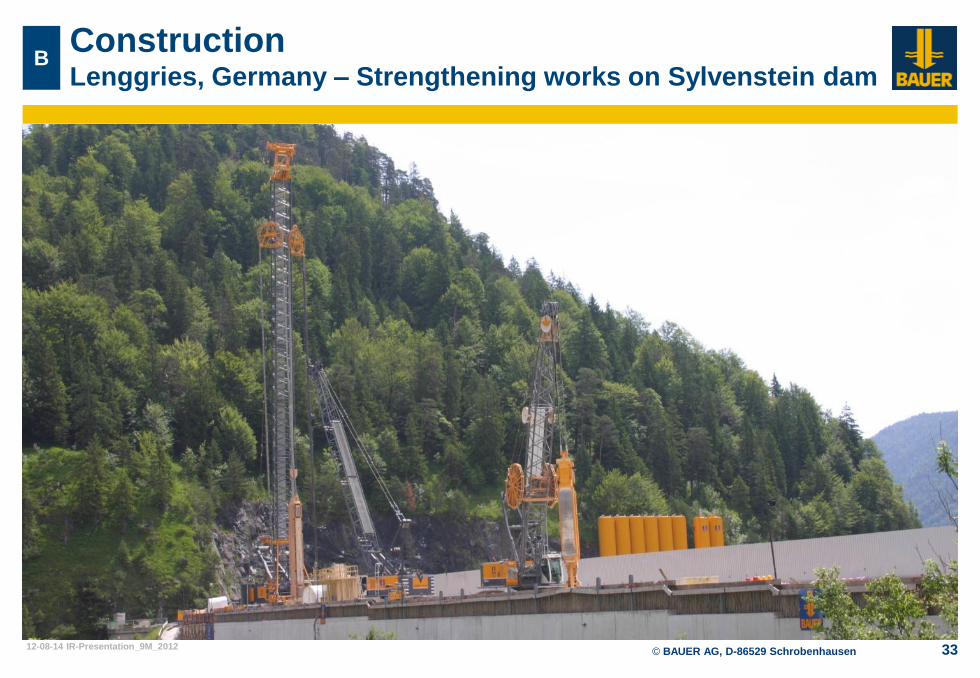
Construction Lenggries, Germany – Strengthening works on Sylvenstein dam
B
© BAUER AG, D-86529 Schrobenhausen 12-08-14 IR-Presentation_9M_2012 34
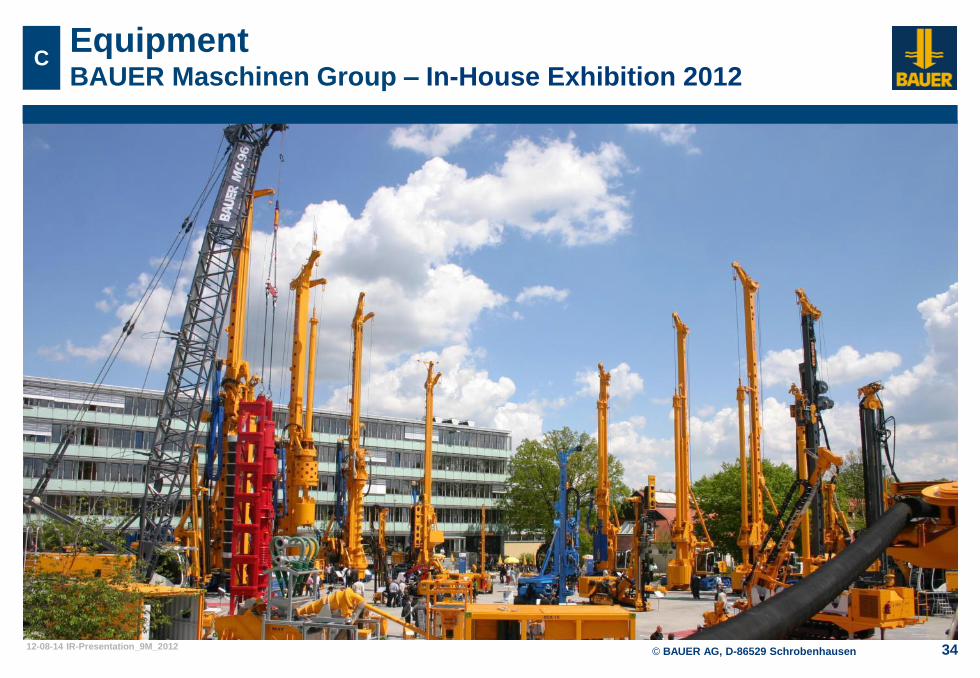
Equipment BAUER Maschinen Group – In-House Exhibition 2012
C
© BAUER AG, D-86529 Schrobenhausen 12-08-14 IR-Presentation_9M_2012 35
Equipment Product range: Drilling rigs (BG-systems)
C
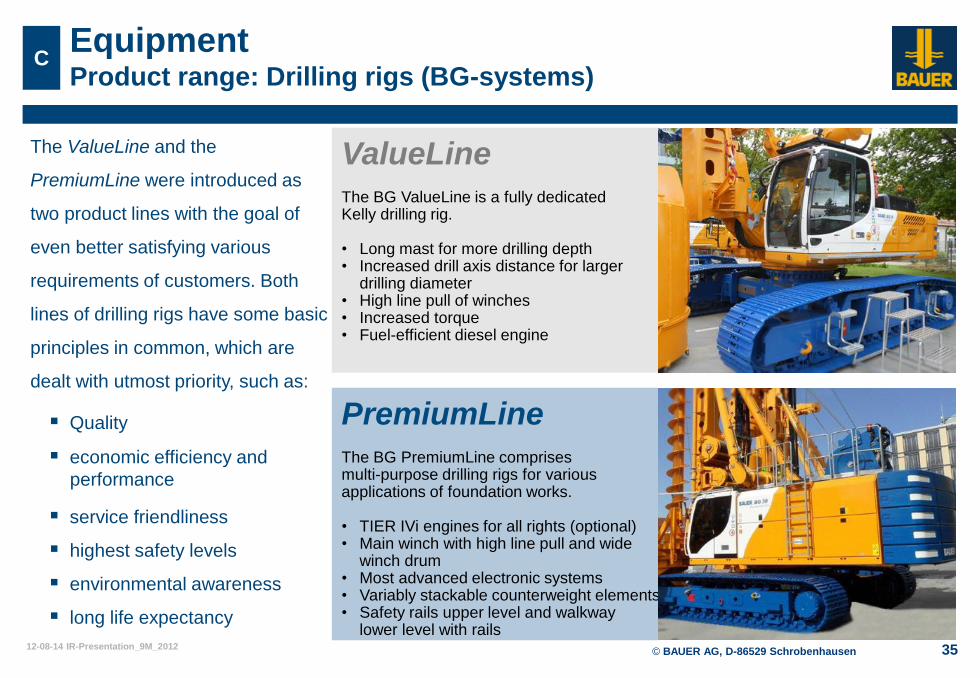
ValueLine The BG ValueLine is a fully dedicated Kelly drilling rig. • Long mast for more drilling depth • Increased drill axis distance for larger
drilling diameter • High line pull of winches • Increased torque • Fuel-efficient diesel engine
PremiumLine The BG PremiumLine comprises multi-purpose drilling rigs for various applications of foundation works. • TIER IVi engines for all rights (optional) • Main winch with high line pull and wide
winch drum • Most advanced electronic systems • Variably stackable counterweight elements • Safety rails upper level and walkway
lower level with rails
The ValueLine and the
PremiumLine were introduced as
two product lines with the goal of
even better satisfying various
requirements of customers. Both
lines of drilling rigs have some basic
principles in common, which are
dealt with utmost priority, such as:
Quality
economic efficiency and
performance
service friendliness
highest safety levels
environmental awareness
long life expectancy

© BAUER AG, D-86529 Schrobenhausen 12-08-14 IR-Presentation_9M_2012 36
C Equipment Product range: Foundation Cranes
MC 128 MC 96 MC 32
© BAUER AG, D-86529 Schrobenhausen 12-08-14 IR-Presentation_9M_2012 37
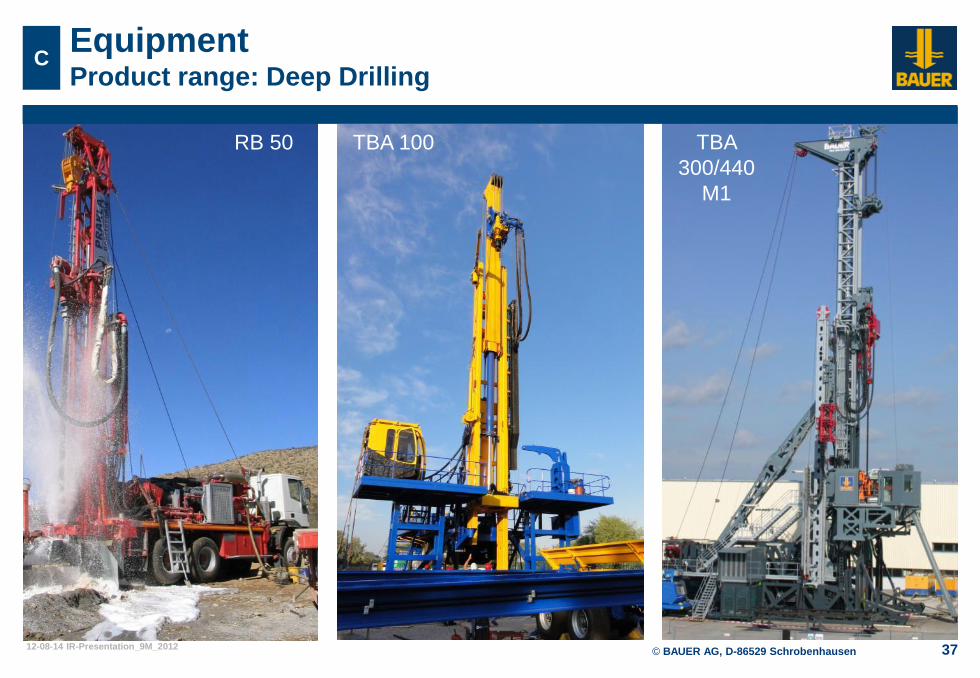
C Equipment Product range: Deep Drilling
RB 50 TBA 100 TBA
300/440
M1
© BAUER AG, D-86529 Schrobenhausen 12-08-14 IR-Presentation_9M_2012 38
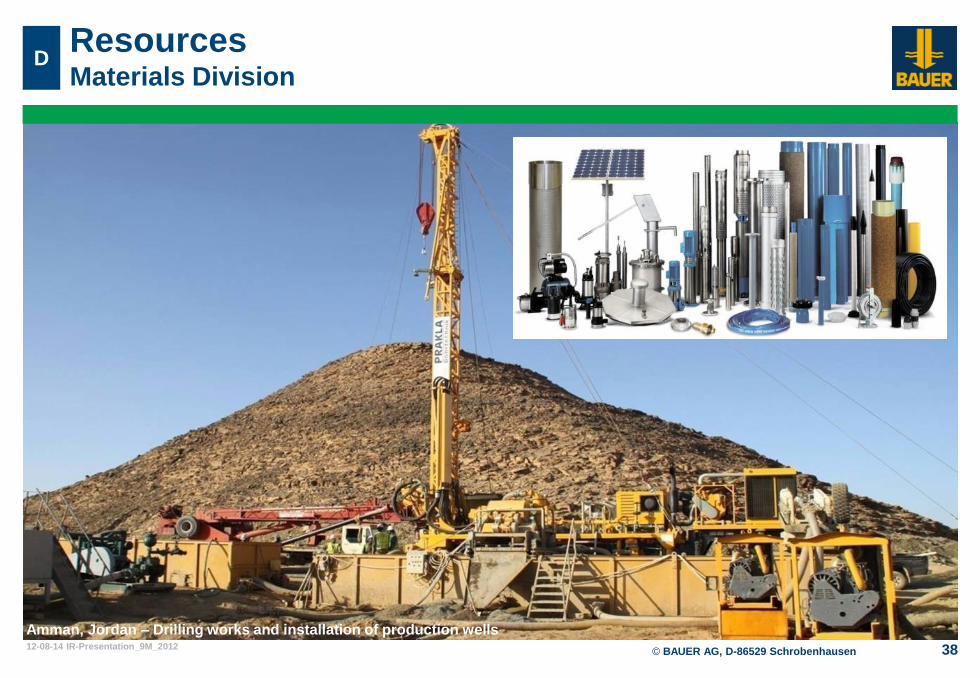
Resources Materials Division
D
Amman, Jordan – Drilling works and installation of production wells
© BAUER AG, D-86529 Schrobenhausen 12-08-14 IR-Presentation_9M_2012 39
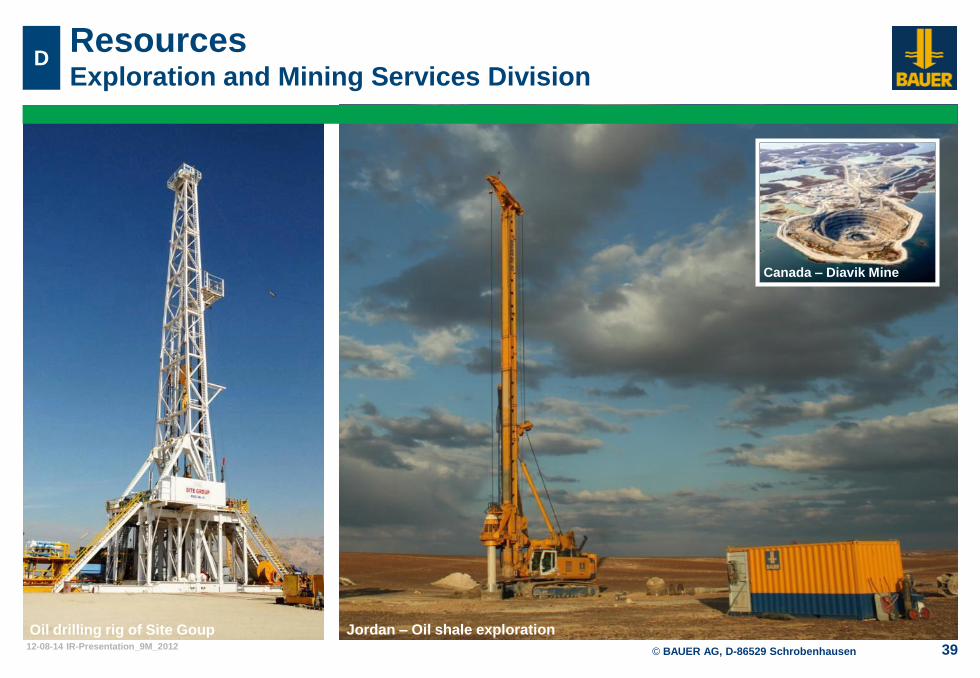
Resources Exploration and Mining Services Division
D
Jordan – Oil shale exploration Oil drilling rig of Site Goup
Canada – Diavik Mine
© BAUER AG, D-86529 Schrobenhausen 12-08-14 IR-Presentation_9M_2012 40
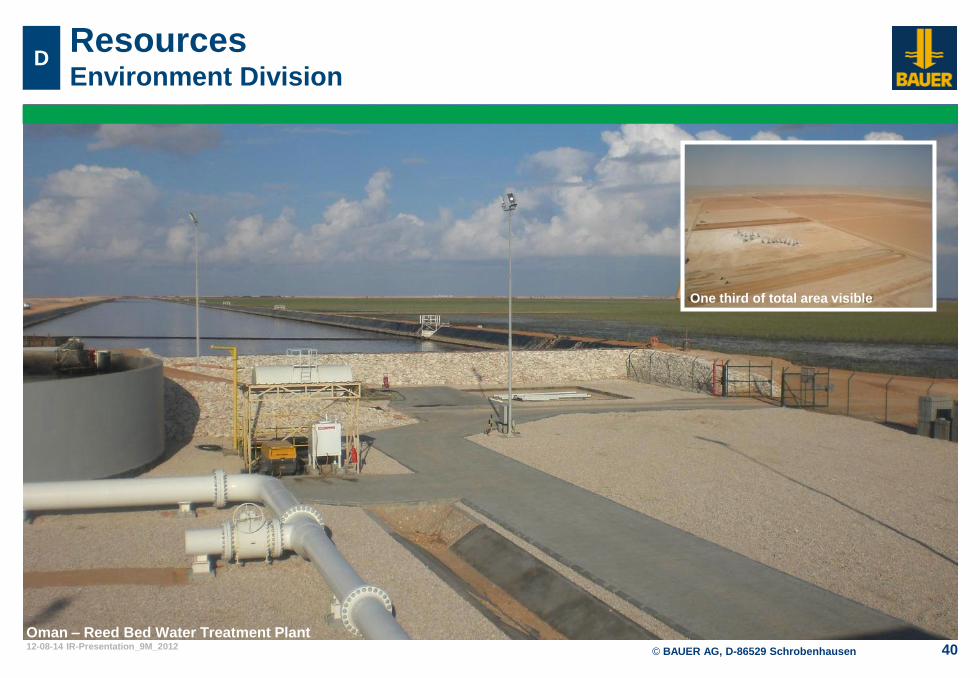
Resources Environment Division
D
Oman – Reed Bed Water Treatment Plant
One third of total area visible
© BAUER AG, D-86529 Schrobenhausen 12-08-14 IR-Presentation_9M_2012 41
West-
Germany
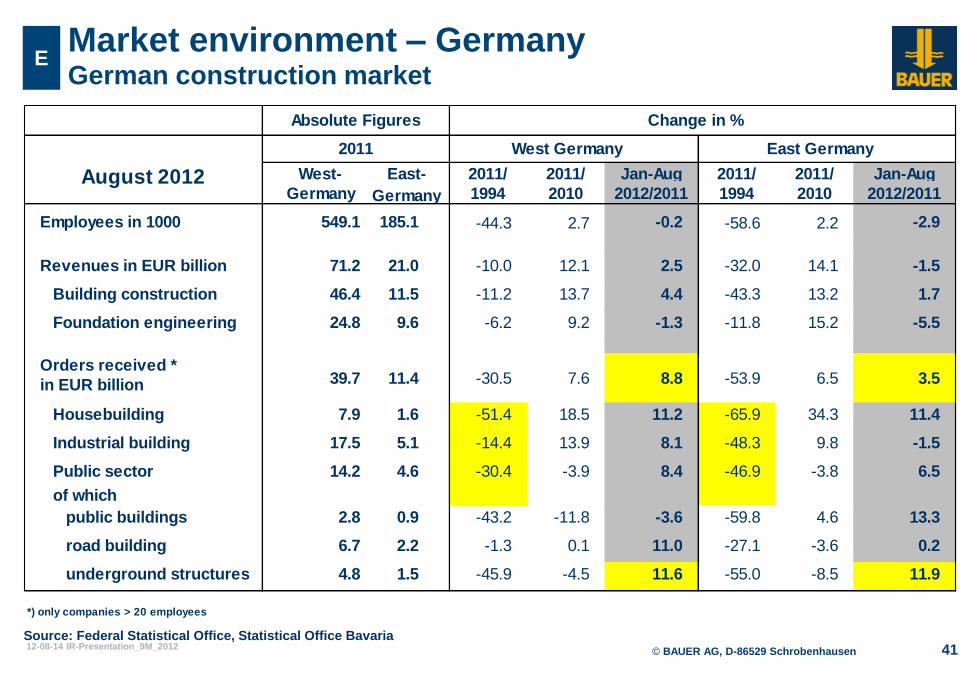
Employees in 1000 549.1 185.1 -44.3 2.7 -0.2 -58.6 2.2 -2.9
Revenues in EUR billion 71.2 21.0 -10.0 12.1 2.5 -32.0 14.1 -1.5
Building construction 46.4 11.5 -11.2 13.7 4.4 -43.3 13.2 1.7
Foundation engineering 24.8 9.6 -6.2 9.2 -1.3 -11.8 15.2 -5.5
Orders received *
in EUR billion
Housebuilding 7.9 1.6 -51.4 18.5 11.2 -65.9 34.3 11.4
Industrial building 17.5 5.1 -14.4 13.9 8.1 -48.3 9.8 -1.5
Public sector
of which
public buildings 2.8 0.9 -43.2 -11.8 -3.6 -59.8 4.6 13.3
road building 6.7 2.2 -1.3 0.1 11.0 -27.1 -3.6 0.2
underground structures 4.8 1.5 -45.9 -4.5 11.6 -55.0 -8.5 11.9
*) only companies > 20 employees
Jan-Aug
Change in %
West Germany East Germany
2011/2011/
1994 2010
East-
Germany
2011/
39.7 11.4
2012/2011August 2012 2011/ Jan-Aug
2012/2011
3.5-30.5
1994
8.8
2010
7.6 -53.9
-3.8 6.5-30.4 -3.9
6.5
Absolute Figures
2011
8.4 -46.914.2 4.6
Market environment – Germany German construction market
E
Source: Federal Statistical Office, Statistical Office Bavaria
© BAUER AG, D-86529 Schrobenhausen 12-08-14 IR-Presentation_9M_2012 42
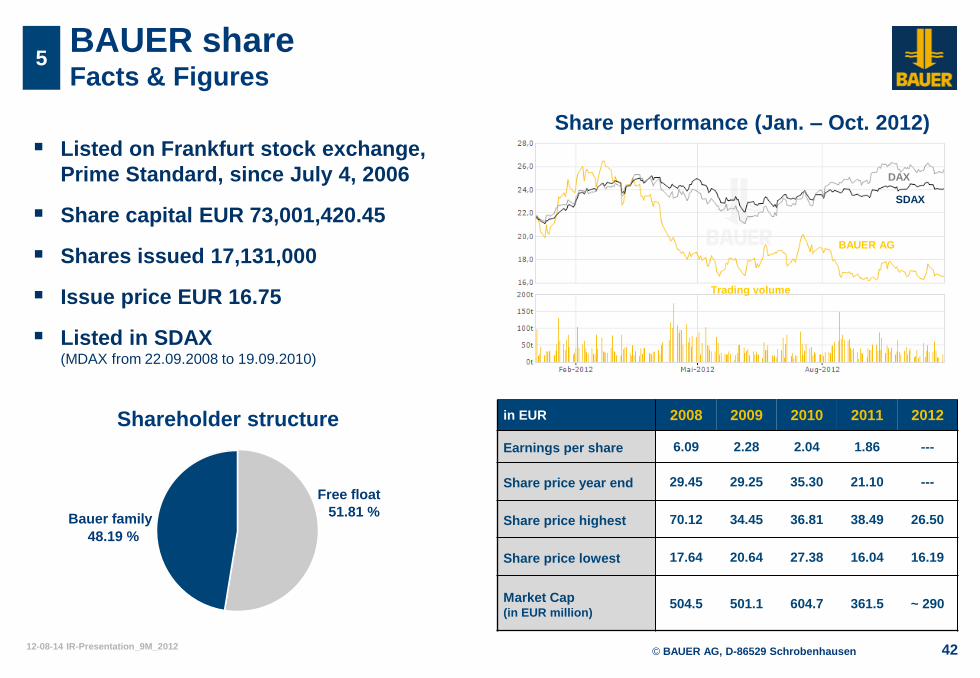
BAUER share Facts & Figures
5
Bauer family
48.19 %
Free float
51.81 %
Listed on Frankfurt stock exchange,
Prime Standard, since July 4, 2006
Share capital EUR 73,001,420.45
Shares issued 17,131,000
Issue price EUR 16.75
Listed in SDAX (MDAX from 22.09.2008 to 19.09.2010)
Shareholder structure
Share performance (Jan. – Oct. 2012)
SDAX
DAX
Trading volume
BAUER AG
in EUR 2008 2009 2010 2011 2012
Earnings per share 6.09 2.28 2.04 1.86 ---
Share price year end 29.45 29.25 35.30 21.10 ---
Share price highest 70.12 34.45 36.81 38.49 26.50
Share price lowest 17.64 20.64 27.38 16.04 16.19
Market Cap (in EUR million)
504.5 501.1 604.7 361.5 ~ 290
© BAUER AG, D-86529 Schrobenhausen 12-08-14 IR-Presentation_9M_2012 43
BAUER share Dividend policy
5
2009
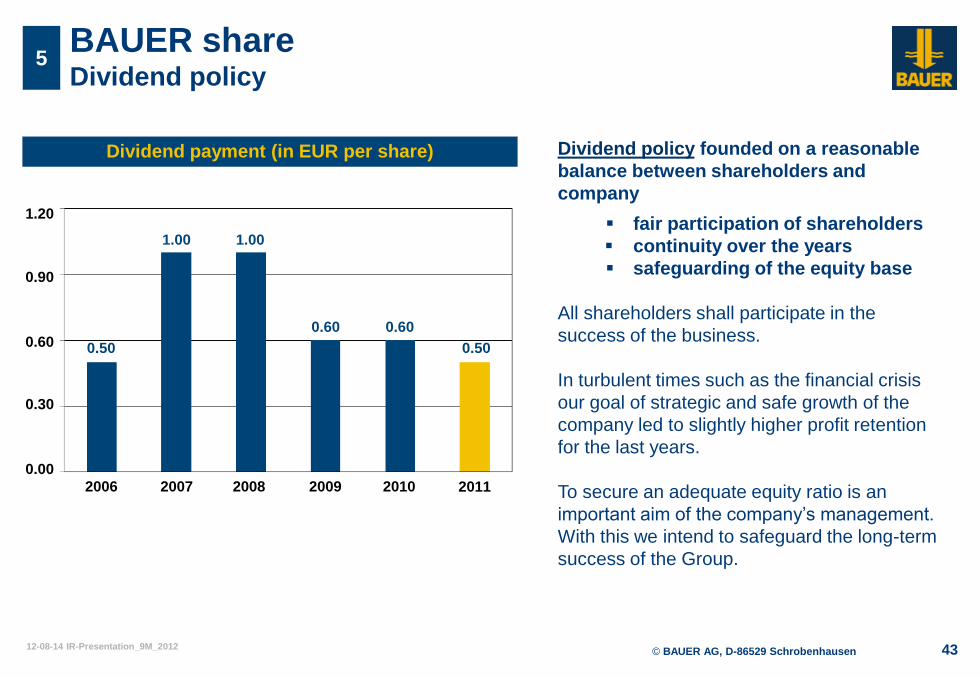
Dividend payment (in EUR per share)
2010 2008 2007 2006
0.30
0.00
0.60
0.90
1.20
0.50
1.00 1.00
0.60 0.60
Dividend policy founded on a reasonable
balance between shareholders and
company
fair participation of shareholders
continuity over the years
safeguarding of the equity base
All shareholders shall participate in the
success of the business.
In turbulent times such as the financial crisis
our goal of strategic and safe growth of the
company led to slightly higher profit retention
for the last years.
To secure an adequate equity ratio is an
important aim of the company’s management.
With this we intend to safeguard the long-term
success of the Group.
2011
0.50

© BAUER AG, D-86529 Schrobenhausen 12-08-14 IR-Presentation_9M_2012 44
G Key Figures Time Line Q3 2009 – Q3 2012
Total Group Revenues
(in EUR million)
BAUER Group 263.5 331.3 1,275.8 261.0 331.9 369.7 341.4 1,304.0 307.4 332.4 369.1 362.9 1,371.8 340.0 361.6 361.7
Construction 127.7 169.1 570.0 125.1 167.7 176.5 146.1 615.4 124.4 146.1 164.0 147.6 582.1 156.9 163.4 163.7
Equipment 106.4 126.9 608.5 113.2 138.8 160.3 169.4 581.7 159.8 154.7 153.9 192.6 661.0 140.7 150.6 153.0
Resources 50.8 49.1 174.3 35.6 41.7 47.3 53.1 177.7 39.1 56.4 67.2 48.8 211.5 58.1 65.5 67.7
Sales Revenues
(in EUR million)
BAUER Group 248.2 314.3 1,096.5 216.0 313.1 315.3 287.3 1,131.7 255.4 294.7 324.8 344.7 1,219.6 286.2 319.2 328.5
Construction 122.6 140.2 487.9 114.0 141.6 155.4 94.8 505.8 112.8 126.5 136.1 107.3 482.7 138.8 144.4 148.3
Equipment 84.2 128.7 456.5 69.9 132.2 118.9 148.3 469.3 108.2 116.7 121.5 188.6 535.0 93.6 108.4 124.1
Resources 41.5 45.4 152.0 32.0 39.3 41.0 44.1 156.4 34.4 51.4 67.1 48.6 201.5 53.6 66.3 56.0
EBIT
(in EUR million)
BAUER Group 15.1 24.4 84.4 5.6 21.6 28.6 32.6 88.4 6.7 21.6 23.2 30.8 82.3 6.2 12.8 26.2
Construction 7.6 5.2 25.7 2.9 6.7 12.9 6.3 28.8 -1.3 4.5 6.6 7.7 17.6 2.2 4.2 9.7
Equipment 5.6 12.6 51.3 2.6 13.7 11.6 20.4 48.3 9.2 13.7 11.4 18.9 53.2 4.9 6.7 8.6
Resources 2.2 3.2 6.0 0.1 1.5 3.3 3.2 8.1 -0.6 3.4 5.4 2.7 10.9 -0.6 1.6 7.7
EBIT margin
(in %)
BAUER Group 6.1% 7.8% 7.7% 2.6% 6.9% 9.1% 11.3% 7.8% 2.6% 7.3% 7.1% 8.9% 6.7% 2.2% 4.0% 8.0%
Construction 6.2% 3.7% 5.3% 2.5% 4.7% 8.3% 6.6% 5.7% -1.2% 3.6% 4.8% 7.2% 3.6% 1.6% 2.9% 6.5%
Equipment 6.7% 9.8% 11.2% 3.7% 10.4% 9.8% 13.8% 10.3% 8.5% 11.7% 9.4% 10.0% 9.9% 5.2% 6.2% 6.9%
Resources 5.3% 7.0% 3.9% 0.3% 3.8% 8.0% 7.3% 5.2% -1.7% 6.6% 8.0% 5.6% 5.4% -1.1% 2.4% 13.8%
Q3 12Q1 12
Q2 12 Q3 12
Q3 12
Q3 12
Q2 12
Q2 12
Q2 12
2011
2011
2011
2011
Q1 12
Q1 12
Q1 12
Q4 10
2010 Q4 11
Q2 112010
Q2 11
Q2 10 Q3 10 Q4 10Q3 09 Q4 09 2009
Q1 11
Q1 11
Q2 11
Q2 11
Q4 09 2009 Q1 10 Q2 10
Q1 11
Q1 11
Q1 10 Q2 10
Q3 09
Q1 10
2009 Q1 10Q3 09 Q4 09
Q4 11
2010 Q4 11
2010 Q4 11
Q3 09 Q4 09 2009
Q3 10
Q3 11
Q3 11
Q3 11
Q3 11
Q2 10 Q3 10 Q4 10
Q3 10 Q4 10
© BAUER AG, D-86529 Schrobenhausen 12-08-14 IR-Presentation_9M_2012 45
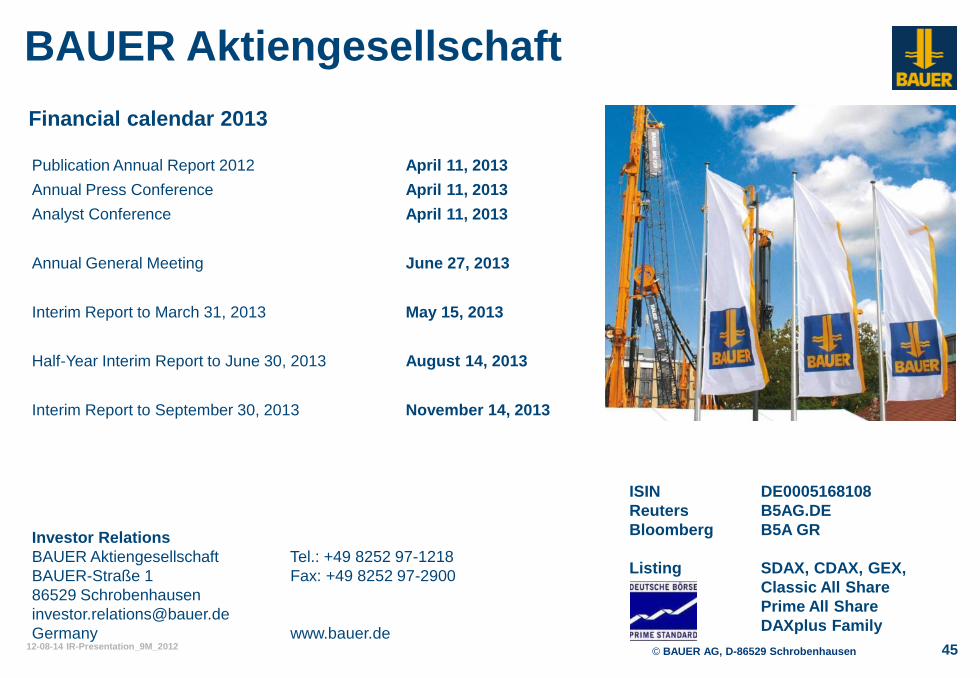
Investor Relations
BAUER Aktiengesellschaft Tel.: +49 8252 97-1218
BAUER-Straße 1 Fax: +49 8252 97-2900
86529 Schrobenhausen
Germany www.bauer.de
BAUER Aktiengesellschaft
Financial calendar 2013
Publication Annual Report 2012 April 11, 2013
Annual Press Conference April 11, 2013
Analyst Conference April 11, 2013
Annual General Meeting June 27, 2013
Interim Report to March 31, 2013 May 15, 2013
Half-Year Interim Report to June 30, 2013 August 14, 2013
Interim Report to September 30, 2013 November 14, 2013
ISIN DE0005168108
Reuters B5AG.DE
Bloomberg B5A GR
Listing SDAX, CDAX, GEX,
Classic All Share
Prime All Share
DAXplus Family
© BAUER AG, D-86529 Schrobenhausen 12-08-14 IR-Presentation_9M_2012 46
Disclaimer
This presentation contains forward-looking statements. Forward-looking statements
are statements that are not historical facts, including statements about our beliefs,
intentions, expectations, predictions and the assumptions underlying them.
These statements are based on factors as they are currently available to the
management of BAUER AG and therefore speak only as of the date they are made.
We assume no liability to update publicly or conform any of them to future events or
future developments.
Forward-looking information is subject to various known and unknown risks and un-
certainties, which could lead to material differences between the actual future results,
financial situation, development or performance of the BAUER Group and those
factors contained in any forward-looking statement. In view of these uncertainties, no
assurance can be given that these forward-looking statements will prove accurate
and correct, or that anticipated and projected future results will be achieved and we
caution you not to place undue reliance on these forward-looking statements.
Related Documents