ERIC VOS BATTERY GAUGING FUNDAMENTALS

Welcome message from author
This document is posted to help you gain knowledge. Please leave a comment to let me know what you think about it! Share it to your friends and learn new things together.
Transcript
ERIC VOS
BATTERY GAUGING FUNDAMENTALS
Agenda
• What is a gauge, and what can it do?
• Battery basics
• Gauging algorithm types
• Gauging challenges
2

What is a gauge, and what can it do?
3
What is a gauge?
4
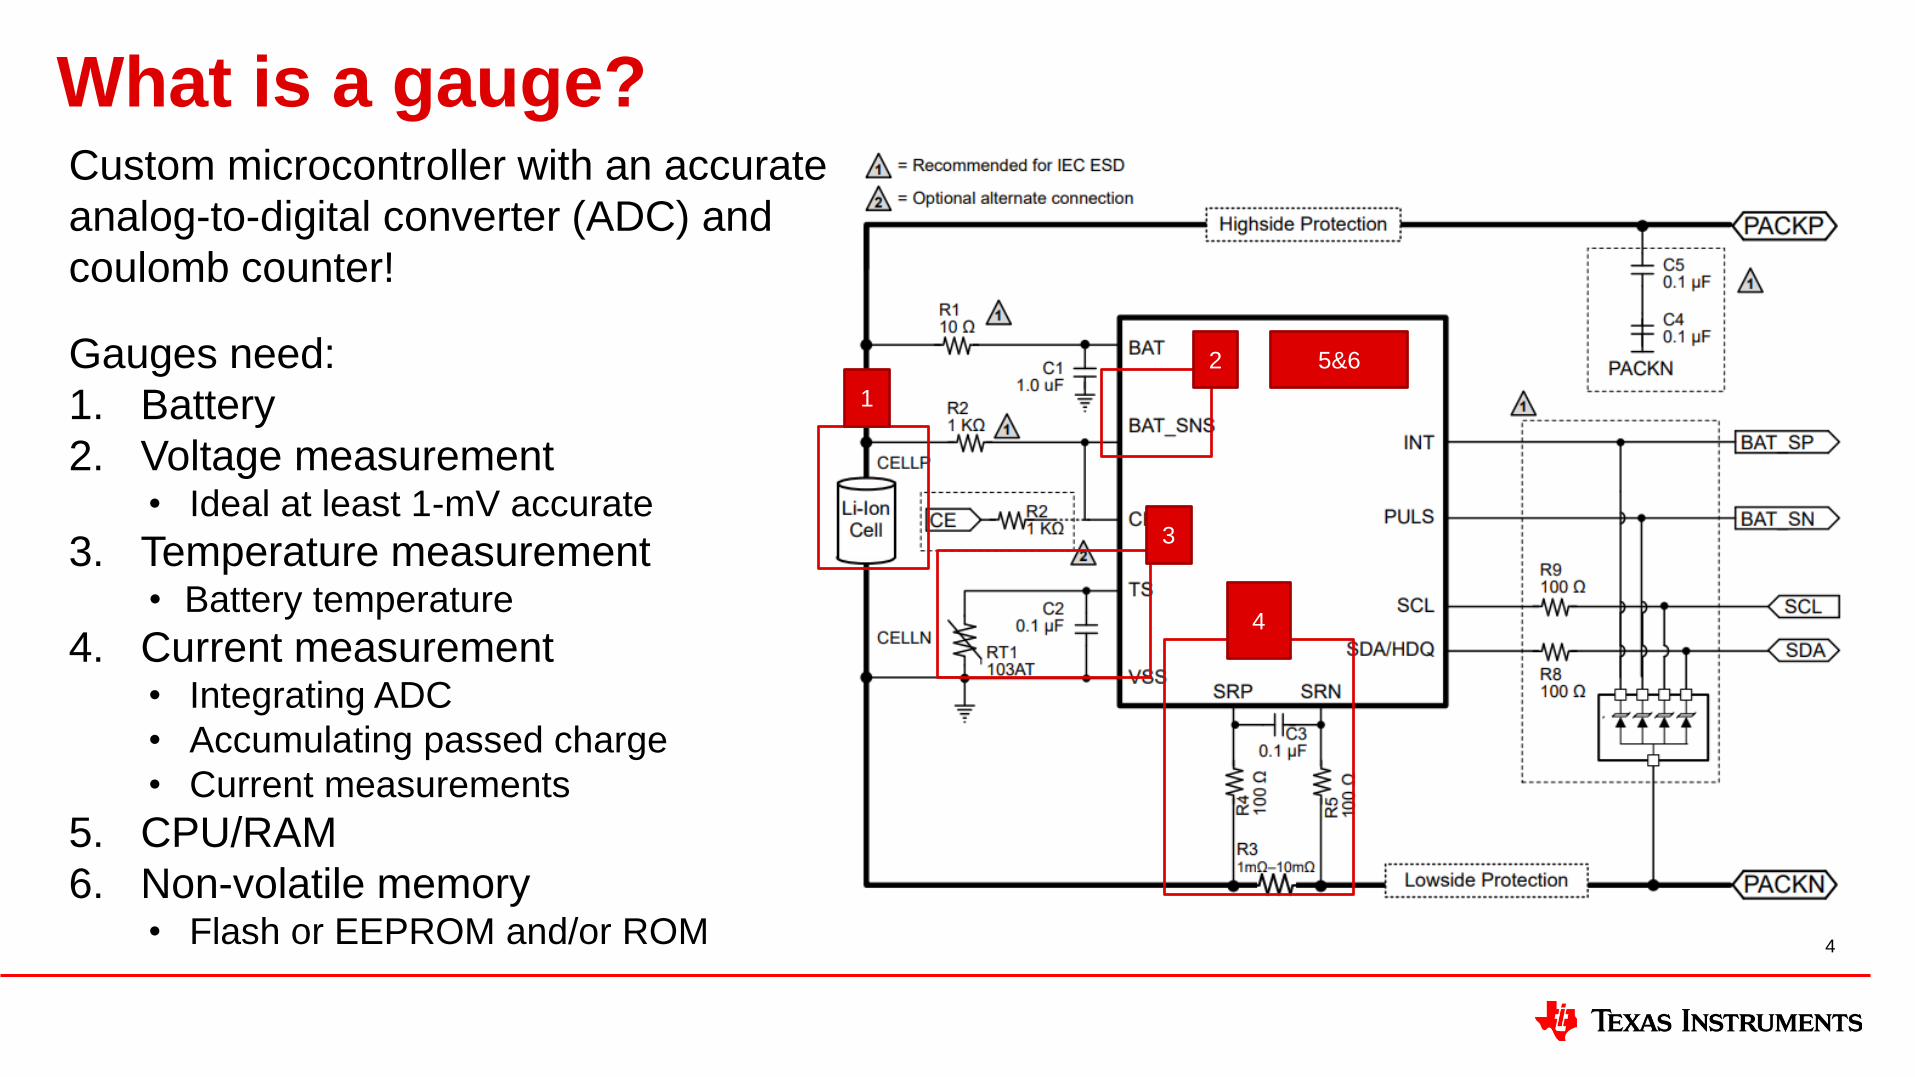
Custom microcontroller with an accurate
analog-to-digital converter (ADC) and
coulomb counter!
Gauges need:
1. Battery
2. Voltage measurement• Ideal at least 1-mV accurate
3. Temperature measurement• Battery temperature
4. Current measurement• Integrating ADC
• Accumulating passed charge
• Current measurements
5. CPU/RAM
6. Non-volatile memory• Flash or EEPROM and/or ROM
4
1
2
3
5&6
What can a gauge do?
5
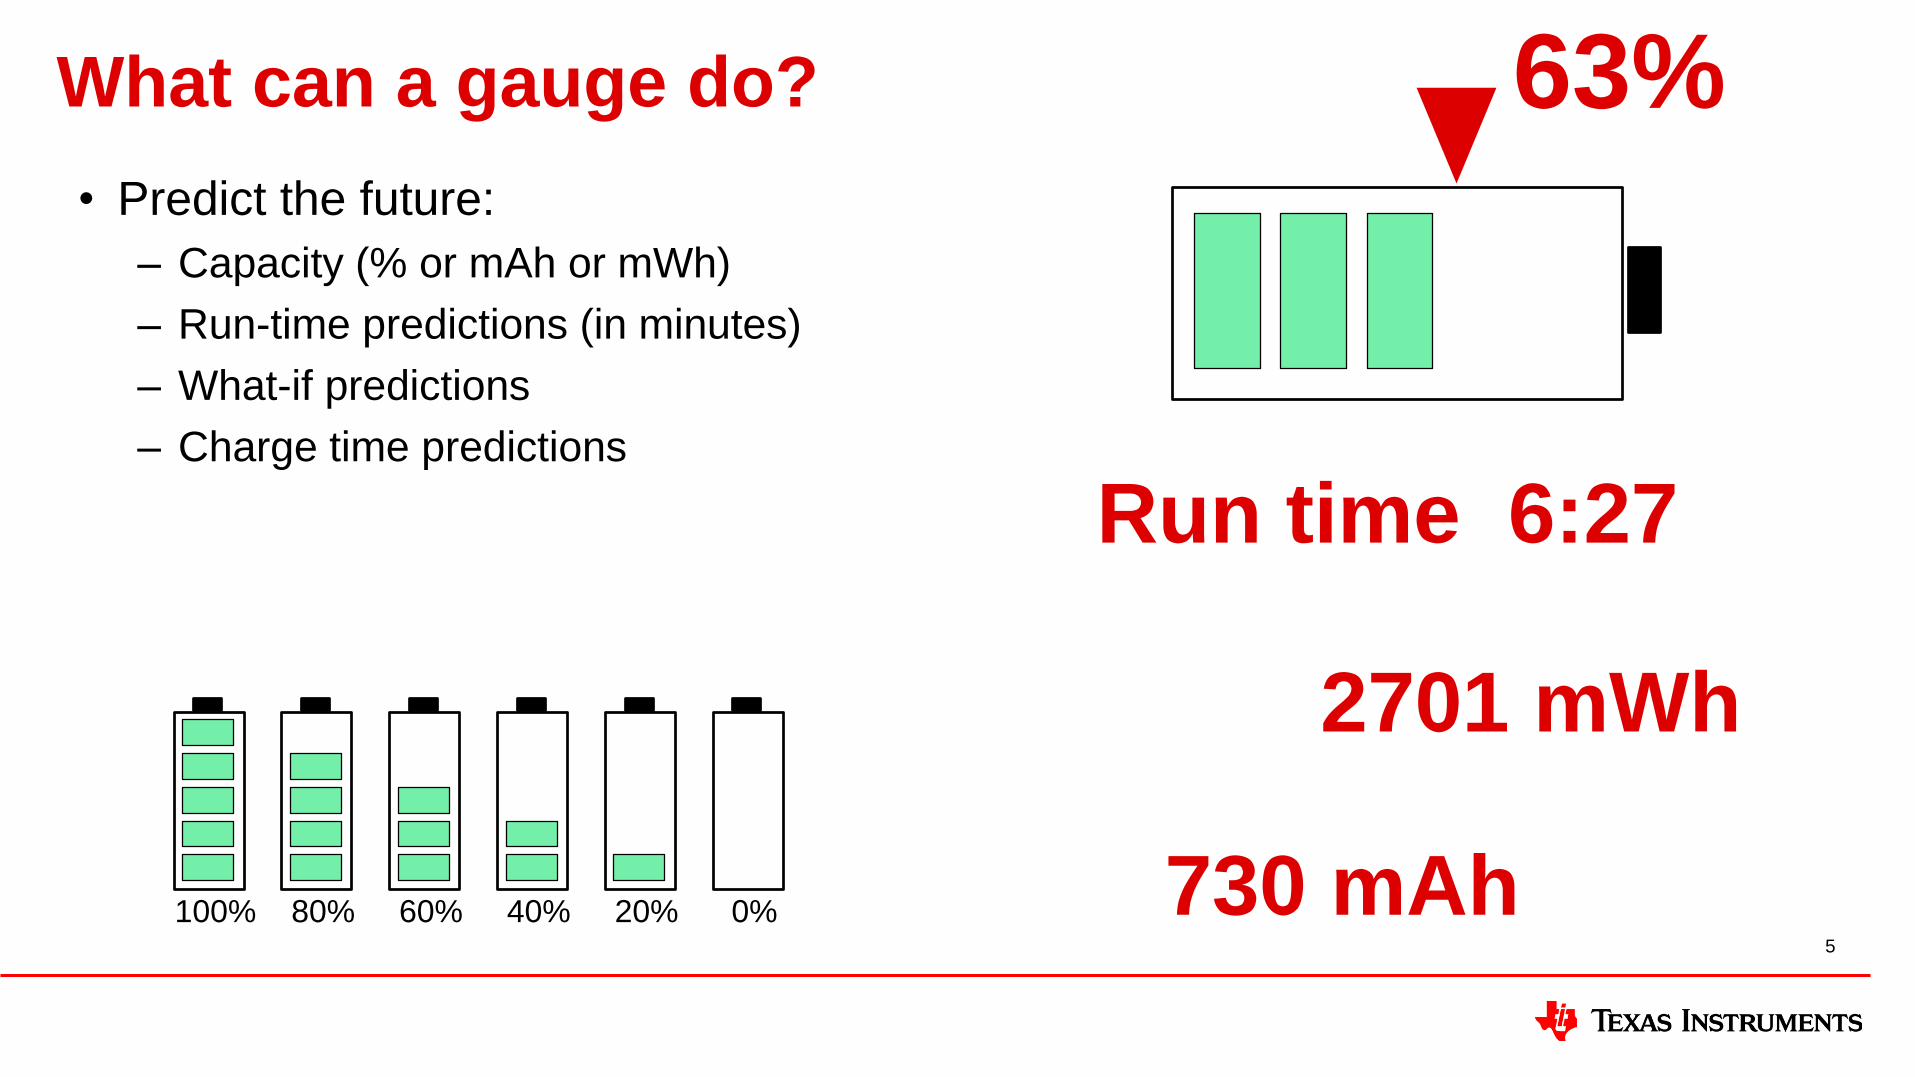
• Predict the future:
– Capacity (% or mAh or mWh)
– Run-time predictions (in minutes)
– What-if predictions
– Charge time predictions
730 mAh
2701 mWh
Run time 6:27
63%
60%80%100% 40% 20% 0%
What can a gauge do?
6
• Predict the future
• Enhance safety:
– Controls protection functions inside the battery pack
• Be a “black box”
• Extend run-time
• Extend lifetime of a battery
What can a gauge do?
7
• Predict the future
• Enhance safety
• Be a “black box:”
– Record usage conditions
– Assist with warranty analysis and troubleshooting
– Assist with supplier quality improvement
• Extend run-time
• Extend lifetime of a battery
What can a gauge do?
8
• Predict the future
• Enhance safety
• Be a “black box”
• Extend run-time:
– Confidently use all available battery capacity with no surprises
– No unused capacity due to over-cautious shutdown conditions
– (see appendix for example)
• Extend lifetime of a battery
What can a gauge do?
9
• Predict the future
• Enhance safety
• Be a “black box”
• Extend run-time
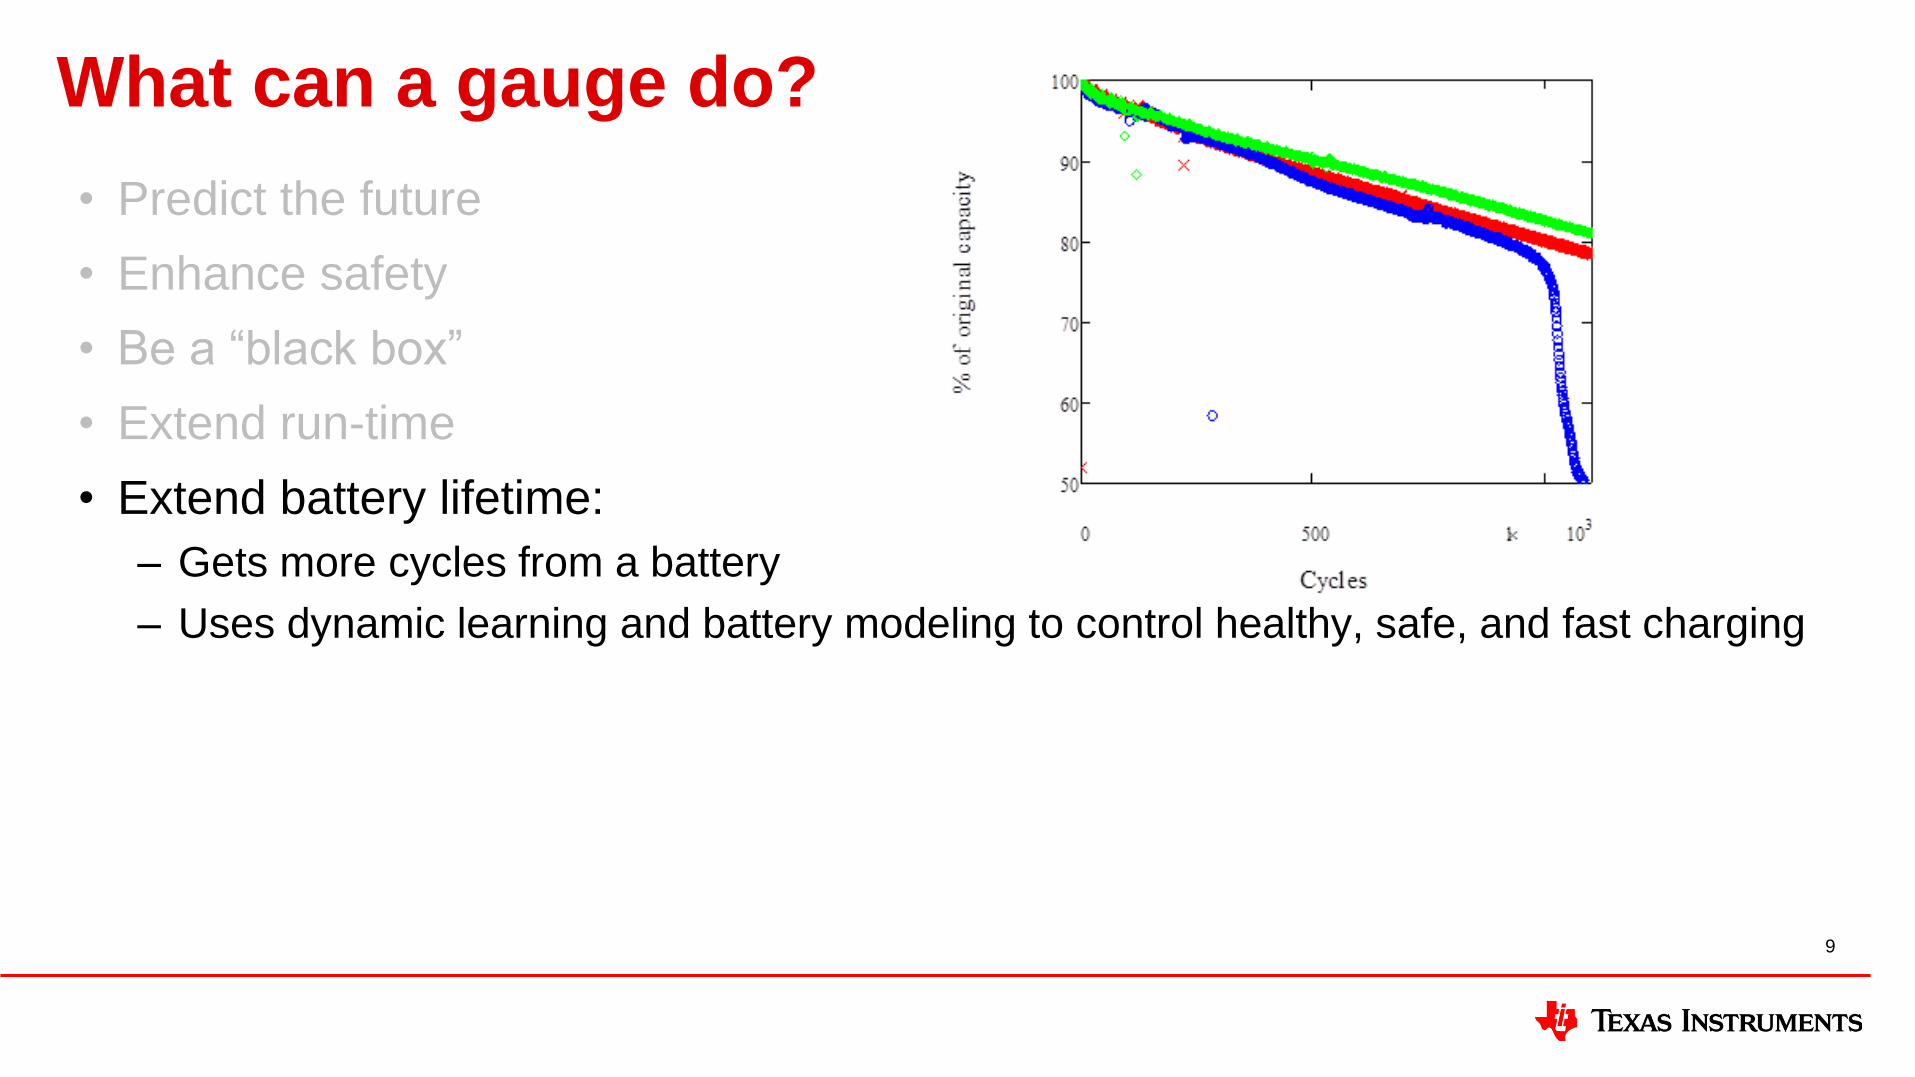
• Extend battery lifetime:
– Gets more cycles from a battery
– Uses dynamic learning and battery modeling to control healthy, safe, and fast charging
What else can a gauge do?
10
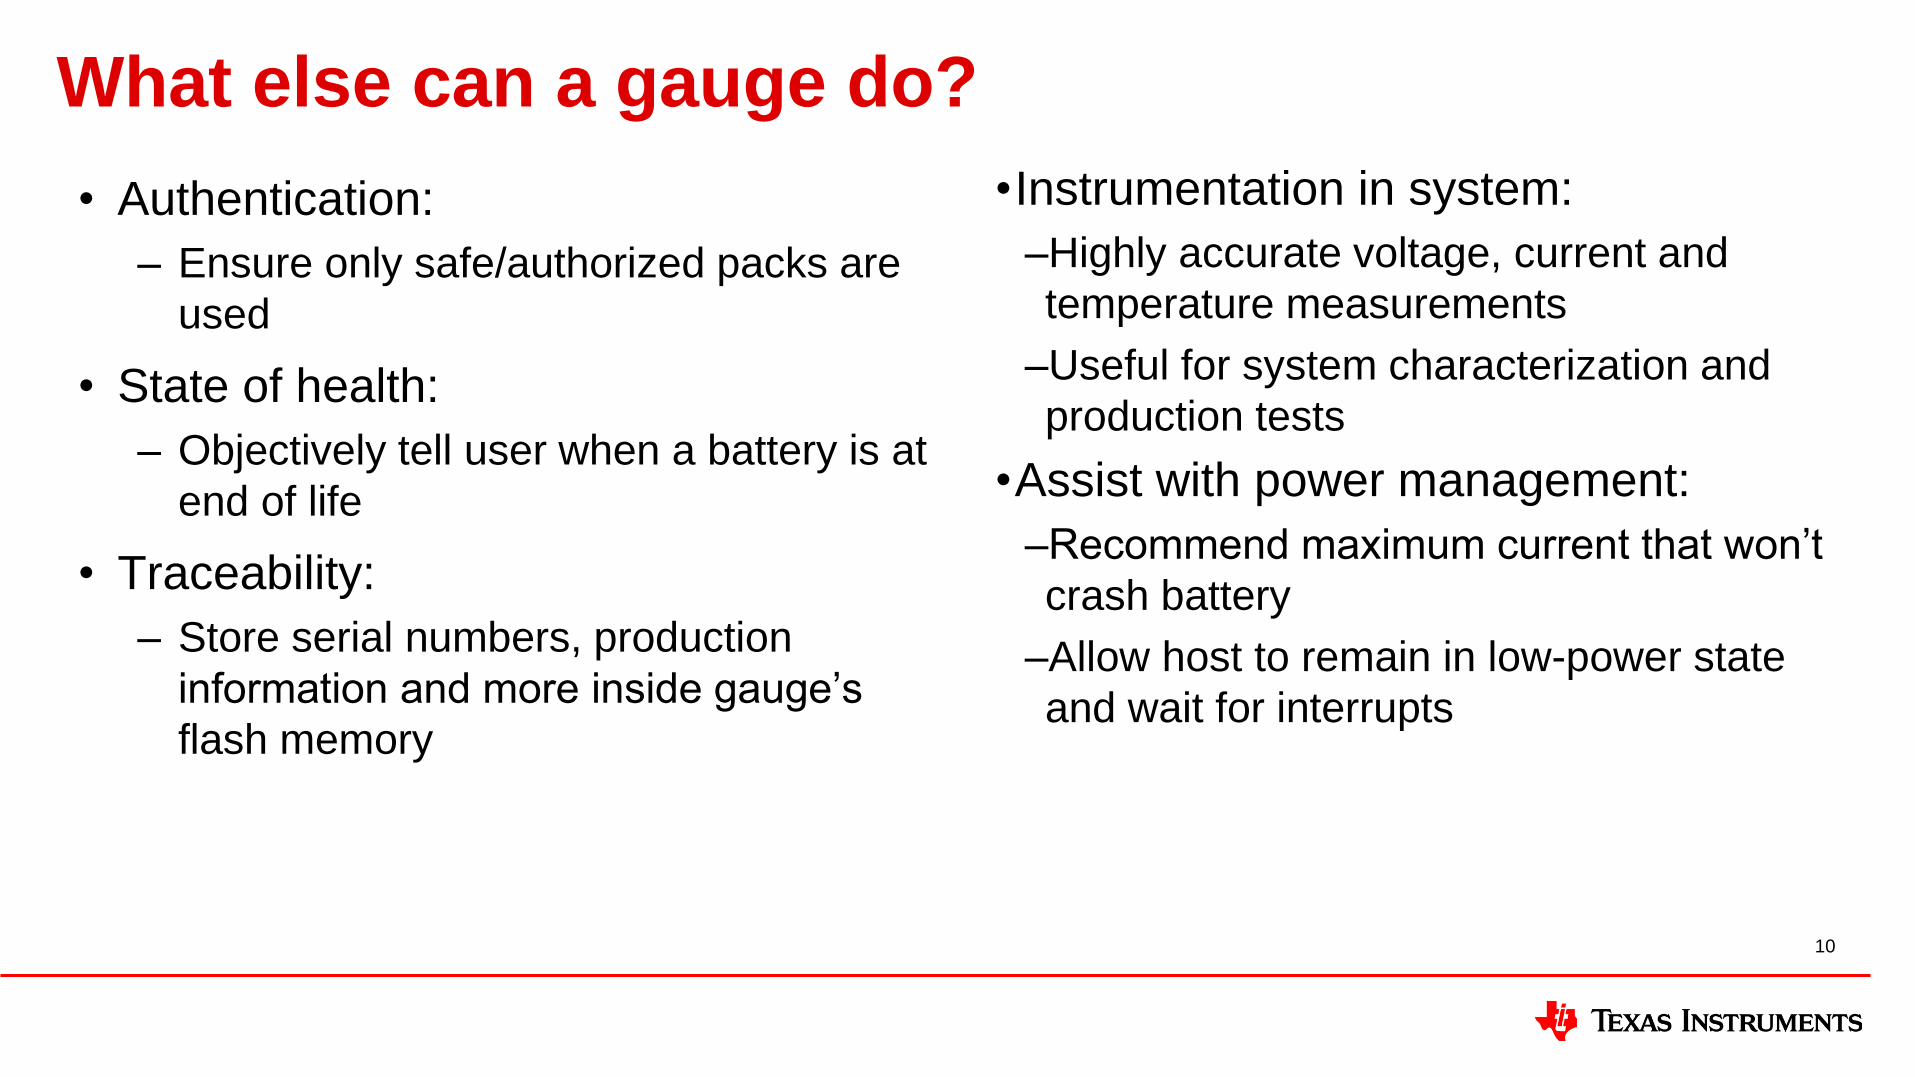
• Authentication:
– Ensure only safe/authorized packs are
used
• State of health:
– Objectively tell user when a battery is at
end of life
• Traceability:
– Store serial numbers, production
information and more inside gauge’s
flash memory
•Instrumentation in system:
–Highly accurate voltage, current and
temperature measurements
–Useful for system characterization and
production tests
•Assist with power management:
–Recommend maximum current that won’t
crash battery
–Allow host to remain in low-power state
and wait for interrupts

Battery basics (LI-ion)
11
Healthy battery habits
12
• Most stable in 50% charged state – ideally between 80%-20%.
• High voltages accelerate corrosion and electrolyte decomposing. Charging
should be limited to maximal voltage specified by manufacturer (4.1 V – 4.45 V).
• Short deep discharge is not detrimental, but long storage in discharge state
results in dissolution of protective layer and resulting capacity loss.
• High temperature is main battery degrader. Provide appropriate cooling and
place battery far from heat-generating circuits. Take battery out of equipment if
long-term AC powered to prevent pack exposure to high temperatures.
Healthy battery habits
13
• Use battery soon after manufacturing. Discharge capacity degrades even if not
used.
• Storage at low temperatures increases shelf life.
• If used in stand-by application, charger should terminate charging and not
resume until state of charge drops below ~95%. Trickle charging is not
recommended.
• Unnecessary charging or discharging should be avoided. Unlike NiCd and NiMh,
there is no benefit from “exercising” the battery.
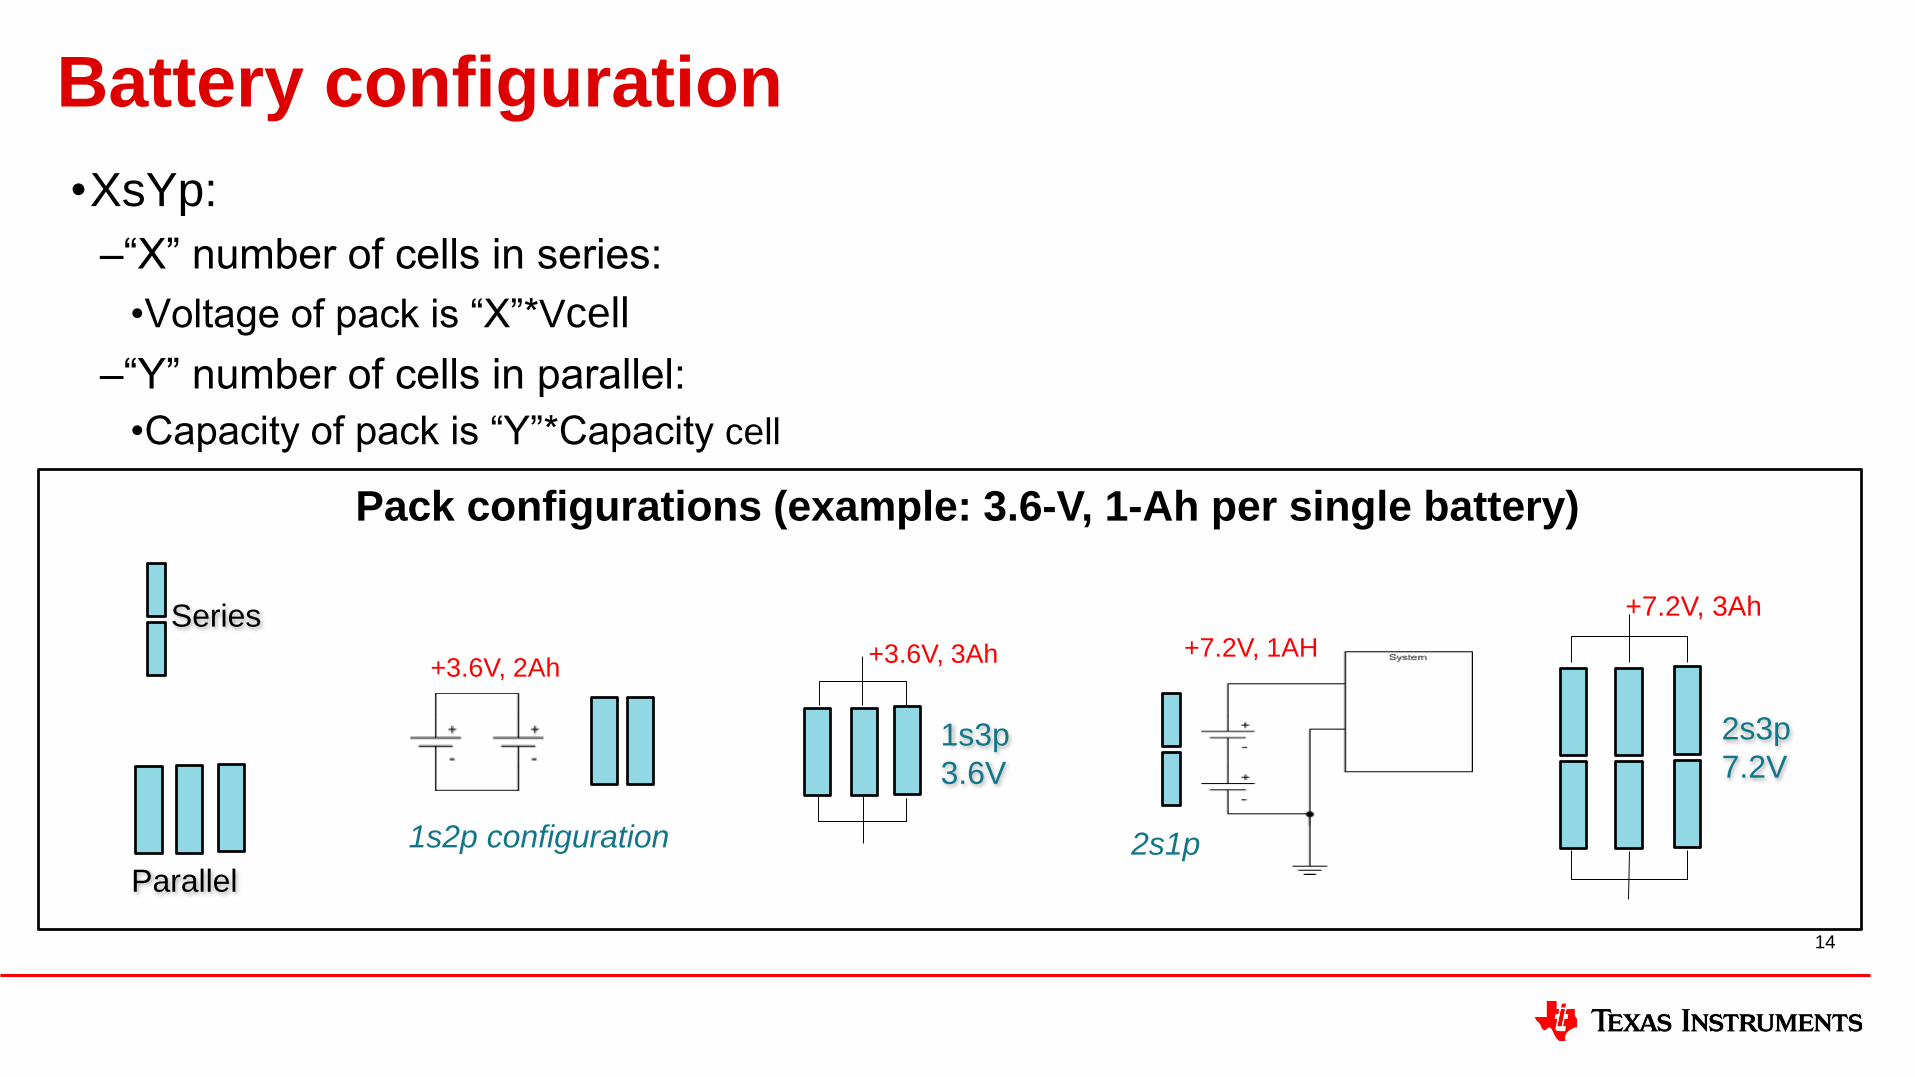
•XsYp:
–“X” number of cells in series:
•Voltage of pack is “X”*Vcell
–“Y” number of cells in parallel:
•Capacity of pack is “Y”*Capacity cell
Battery configuration
14
Series
Parallel
1s3p
3.6V
+3.6V, 3Ah
2s3p
7.2V
+7.2V, 3Ah
2s1p
+7.2V, 1AH
1s2p configuration
+3.6V, 2Ah
Pack configurations (example: 3.6-V, 1-Ah per single battery)
Battery terms
• “C-rate” or “Hour rate” expresses current relative to nominal battery capacity.
• If nominal capacity is 3300 mAh:
– A discharge rate of “1C” means use a current of 3300 mA.
• In theory, it would take 1 hour to discharge at this rate, but it typically takes less time.
– A charge rate of “C/2” means use a current of 1650 mA.
• This is also considered a “2-hour rate.”
15
Battery terms
16
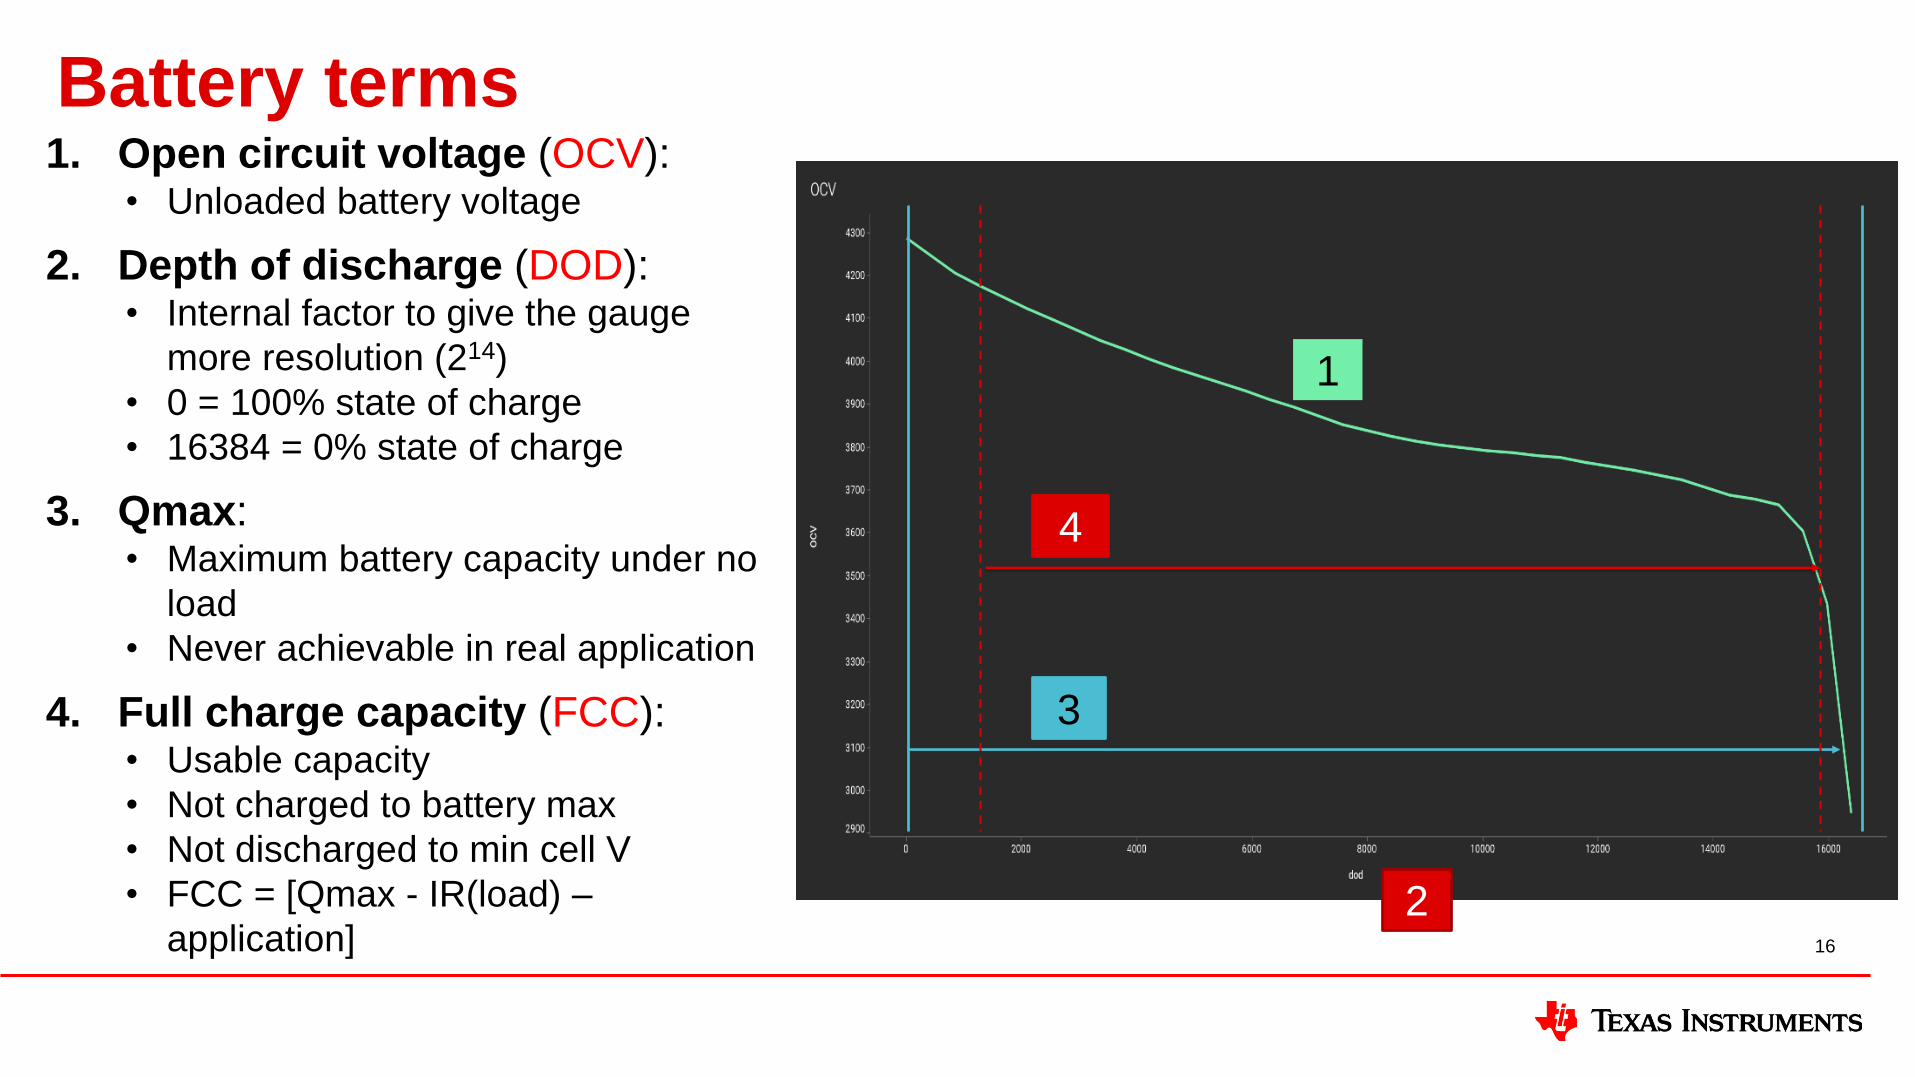
1. Open circuit voltage (OCV):• Unloaded battery voltage
2. Depth of discharge (DOD):• Internal factor to give the gauge
more resolution (214)
• 0 = 100% state of charge
• 16384 = 0% state of charge
3. Qmax:• Maximum battery capacity under no
load
• Never achievable in real application
4. Full charge capacity (FCC):• Usable capacity
• Not charged to battery max
• Not discharged to min cell V
• FCC = [Qmax - IR(load) –
application]
1
2
3
4
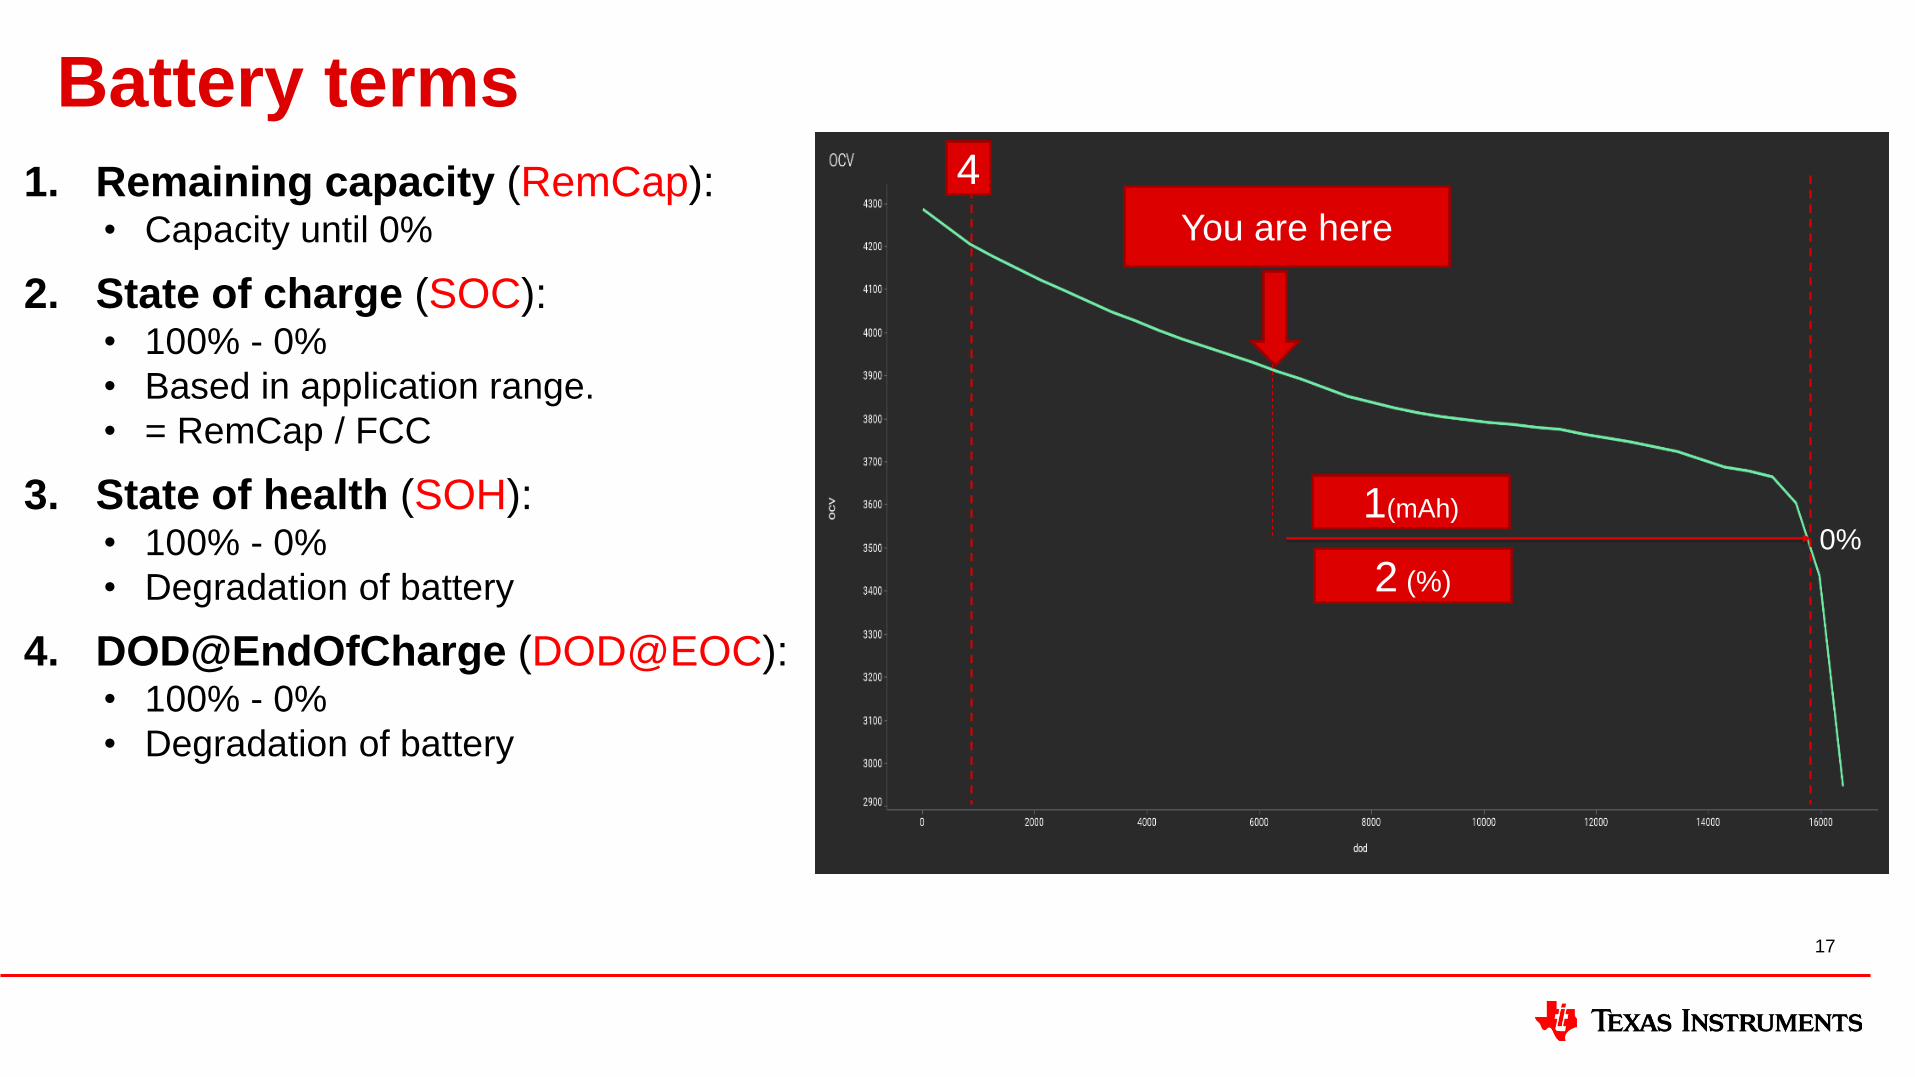
1. Remaining capacity (RemCap):• Capacity until 0%
2. State of charge (SOC):• 100% - 0%
• Based in application range.
• = RemCap / FCC
3. State of health (SOH):• 100% - 0%
• Degradation of battery
4. DOD@EndOfCharge (DOD@EOC):• 100% - 0%
• Degradation of battery
Battery terms
17
You are here
1(mAh)
0%
4
2 (%)
Battery charging
18
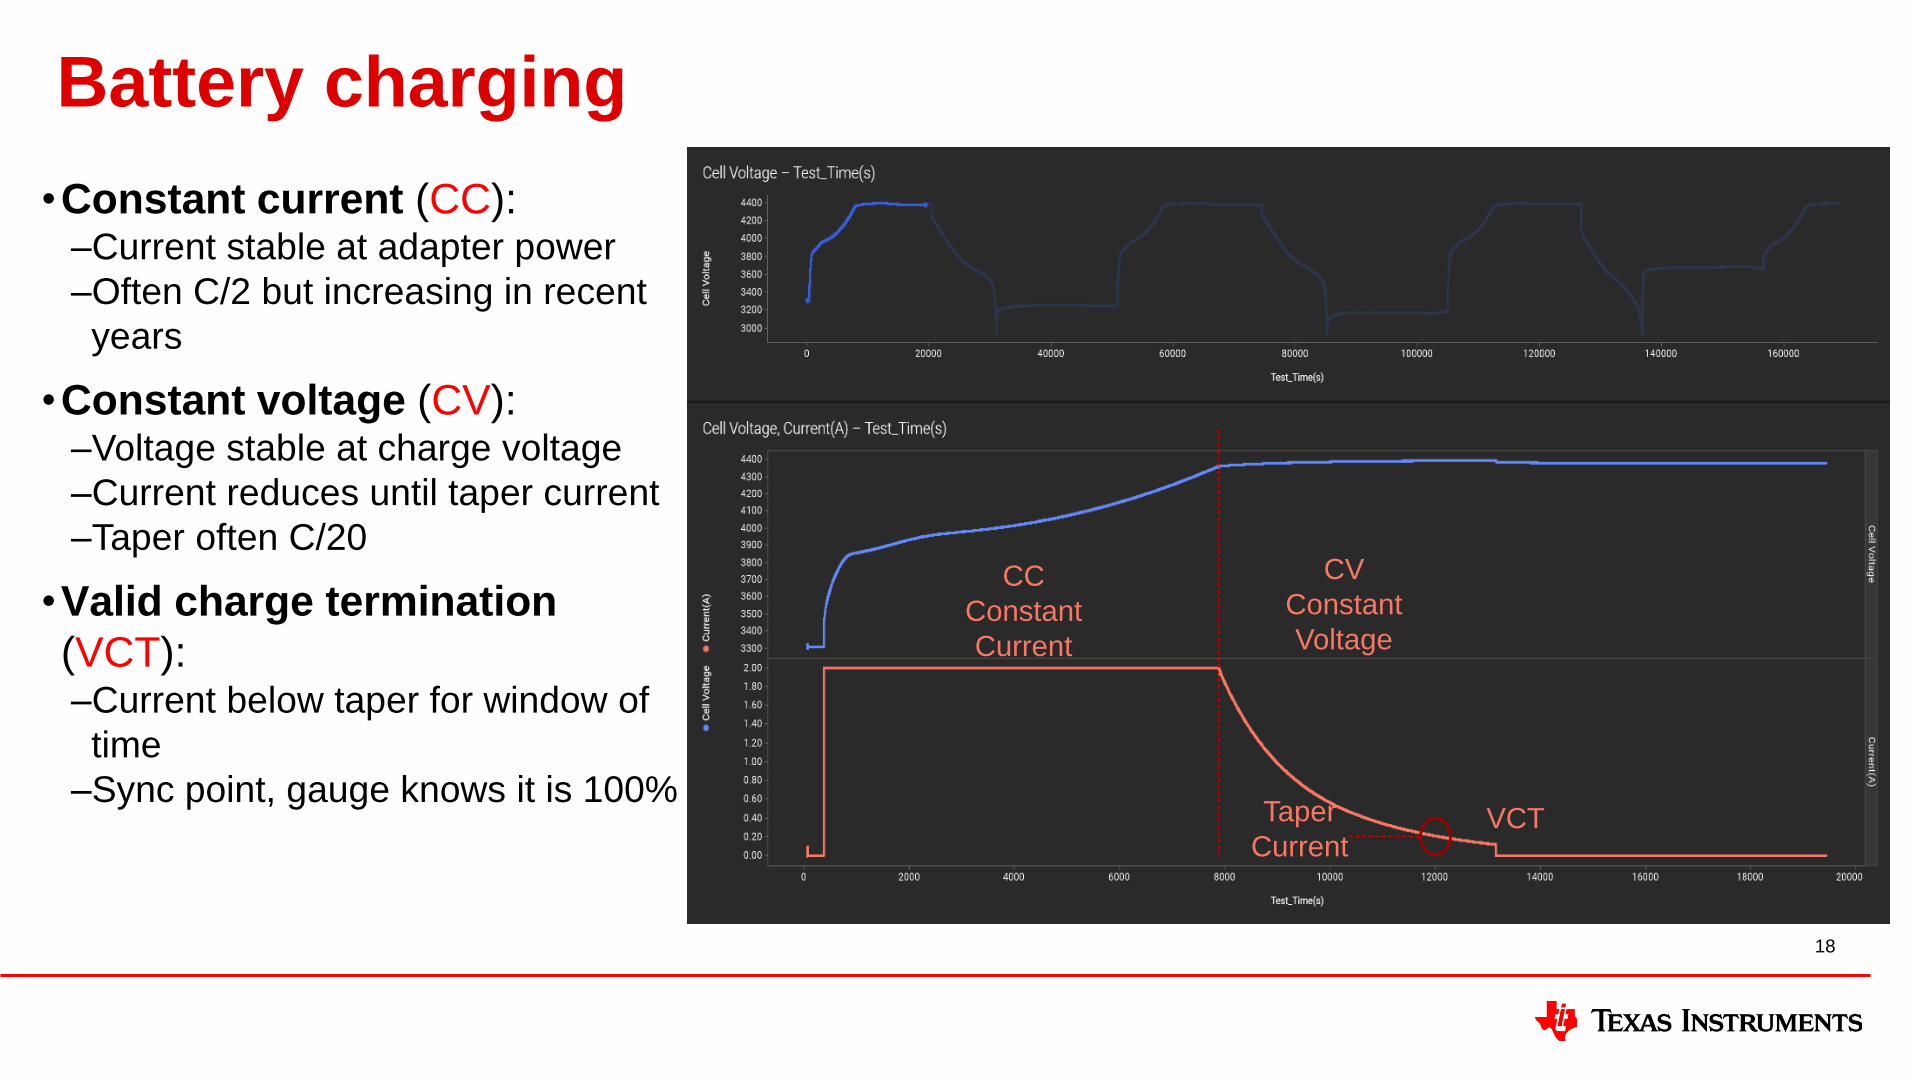
CC
Constant
Current
CV
Constant
Voltage
Taper
CurrentVCT
•Constant current (CC):–Current stable at adapter power
–Often C/2 but increasing in recent
years
•Constant voltage (CV):–Voltage stable at charge voltage
–Current reduces until taper current
–Taper often C/20
•Valid charge termination
(VCT):–Current below taper for window of
time
–Sync point, gauge knows it is 100%
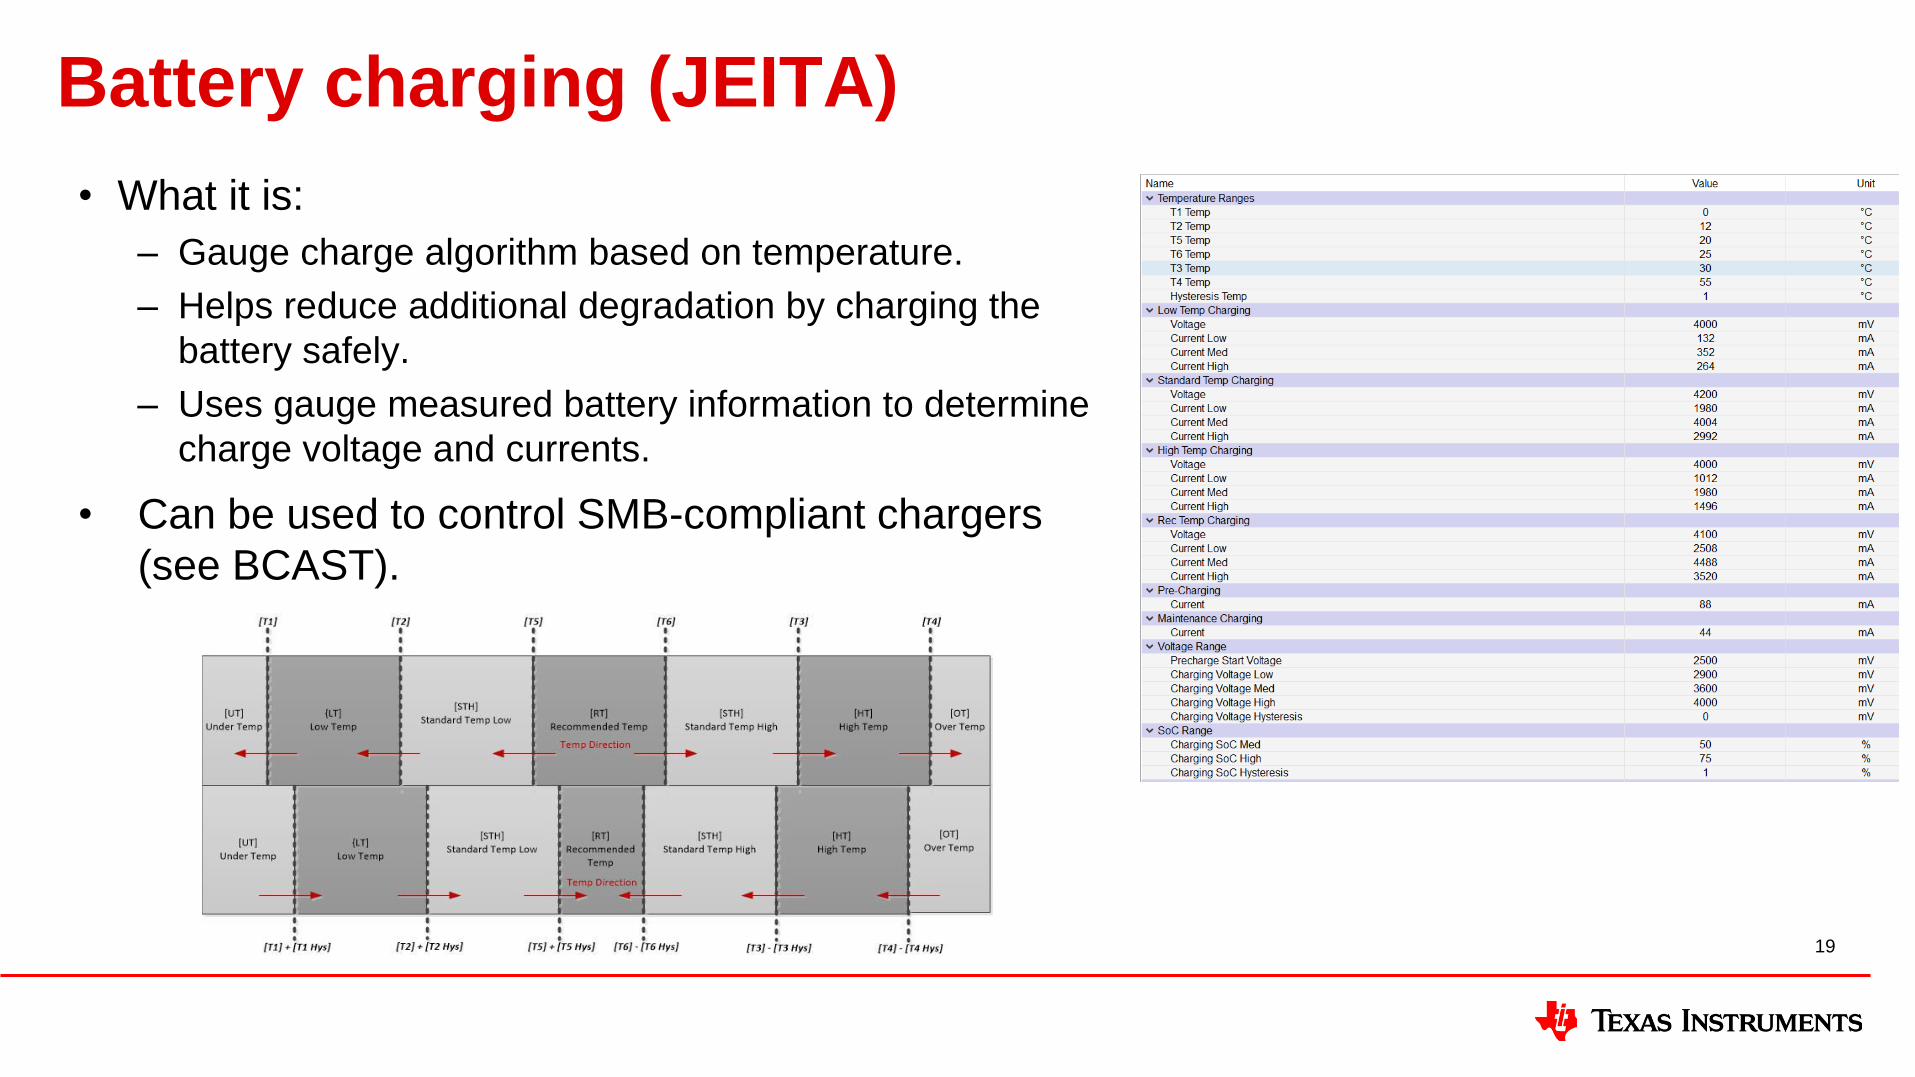
Battery charging (JEITA)
• What it is:
– Gauge charge algorithm based on temperature.
– Helps reduce additional degradation by charging the
battery safely.
– Uses gauge measured battery information to determine
charge voltage and currents.
• Can be used to control SMB-compliant chargers
(see BCAST).
19
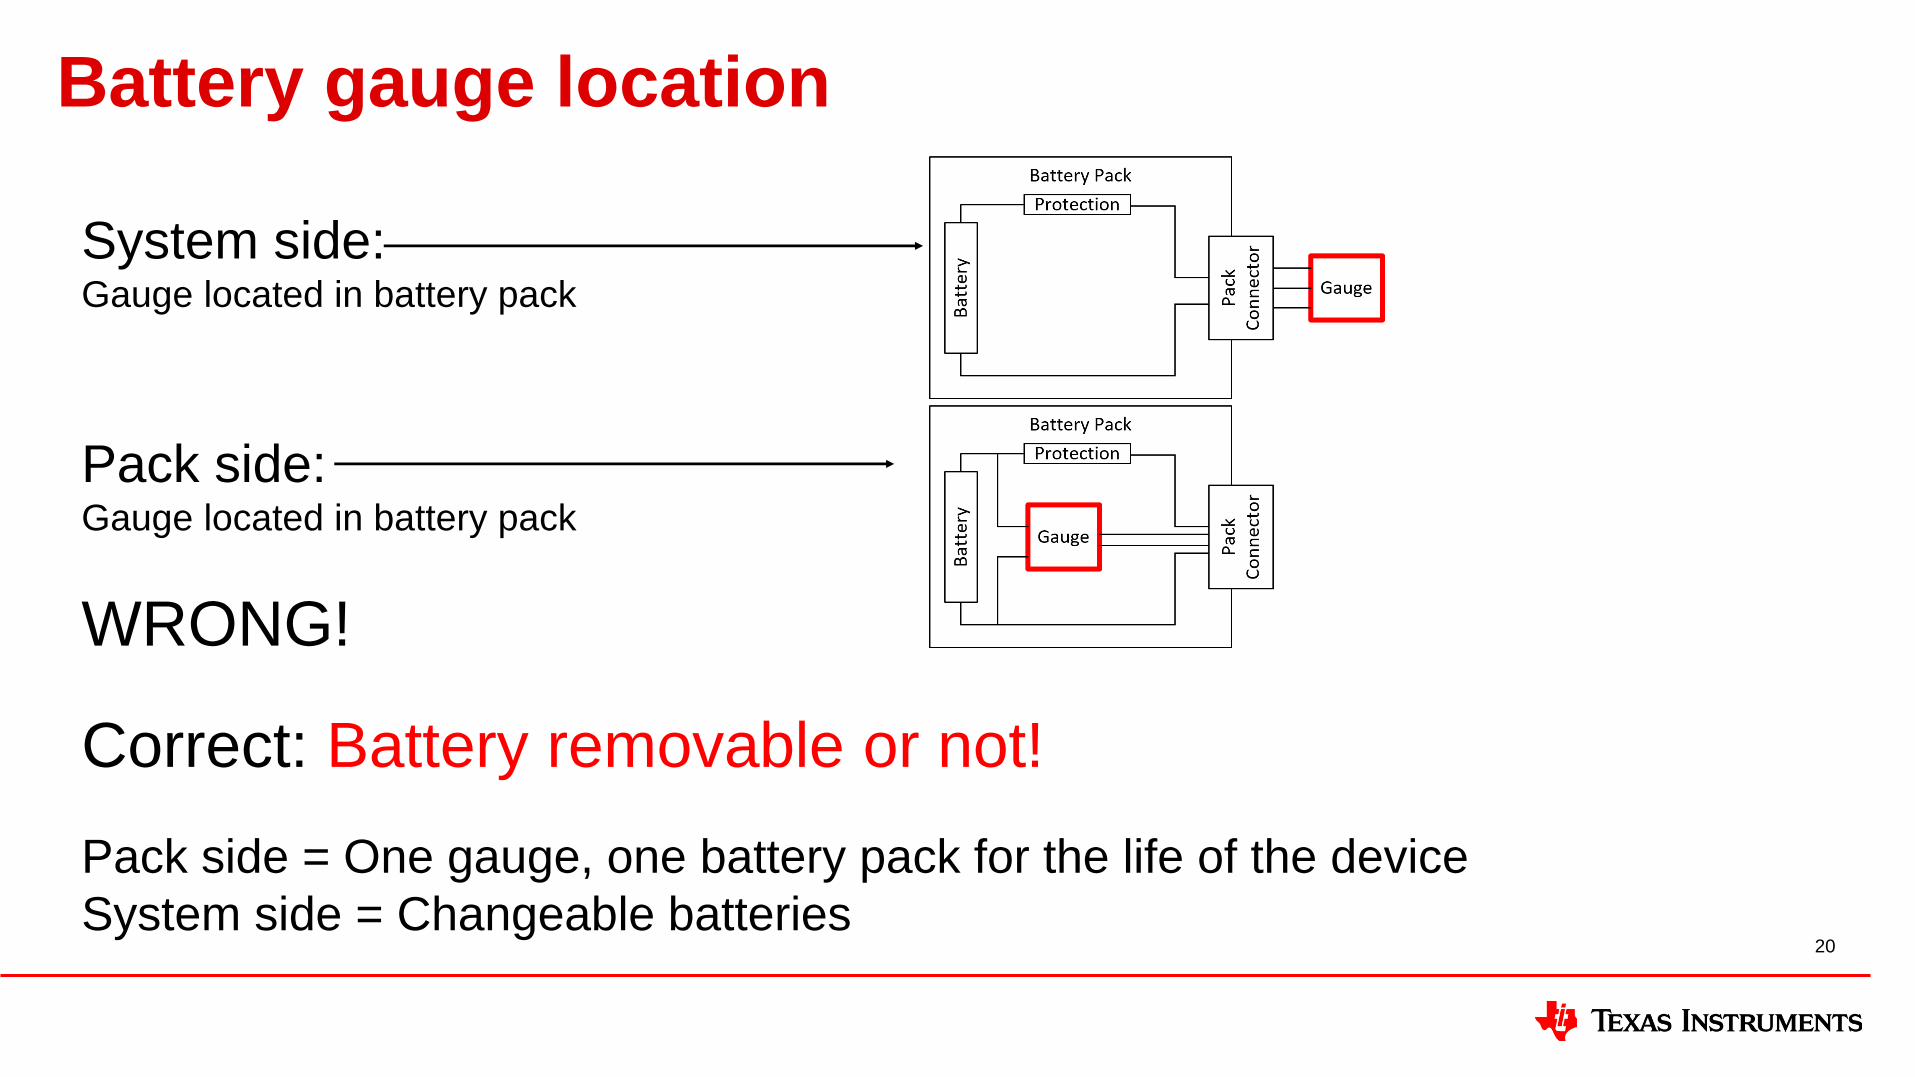
Battery gauge location
20
System side:Gauge located in battery pack
Pack side: Gauge located in battery pack
WRONG!
Correct: Battery removable or not!
Pack side = One gauge, one battery pack for the life of the device
System side = Changeable batteries

Gauging algorithm types
21
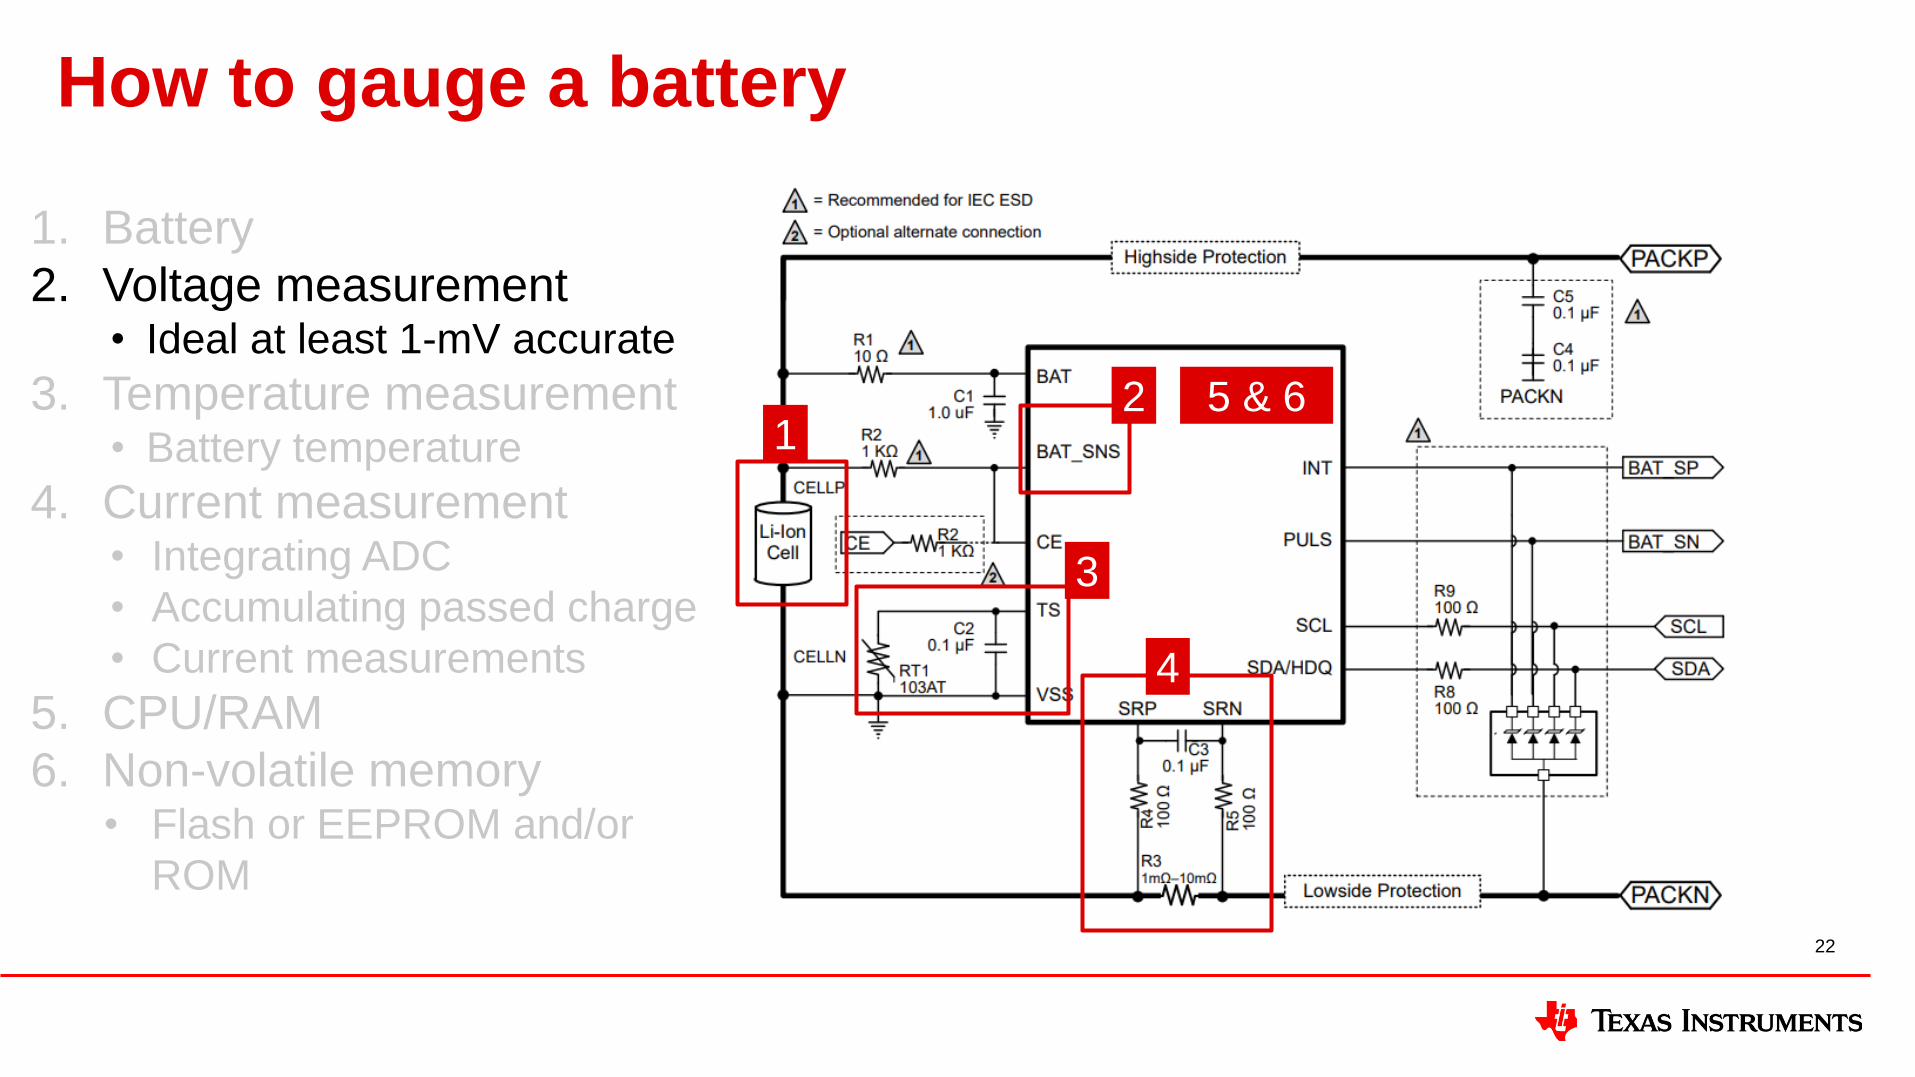
How to gauge a battery
22
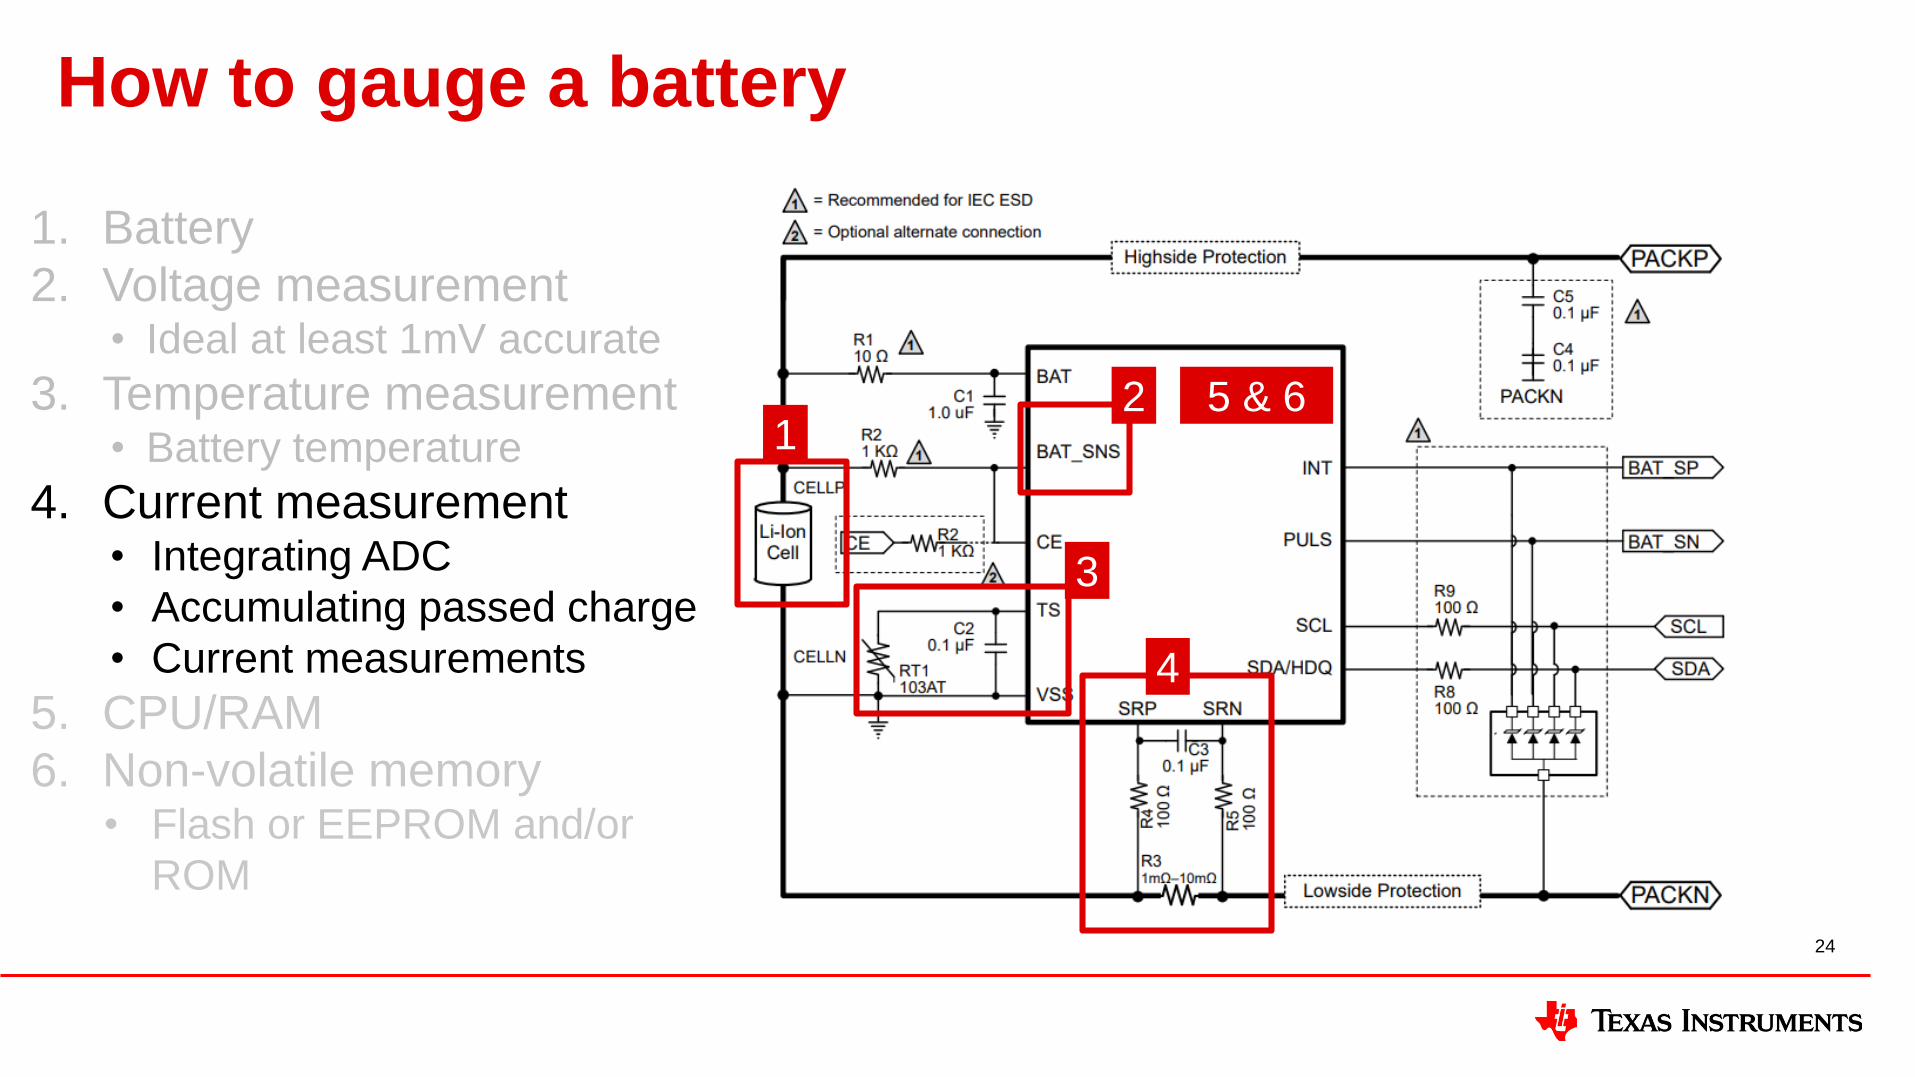
1. Battery
2. Voltage measurement• Ideal at least 1-mV accurate
3. Temperature measurement• Battery temperature
4. Current measurement• Integrating ADC
• Accumulating passed charge
• Current measurements
5. CPU/RAM
6. Non-volatile memory• Flash or EEPROM and/or
ROM
4
12
3
5 & 6
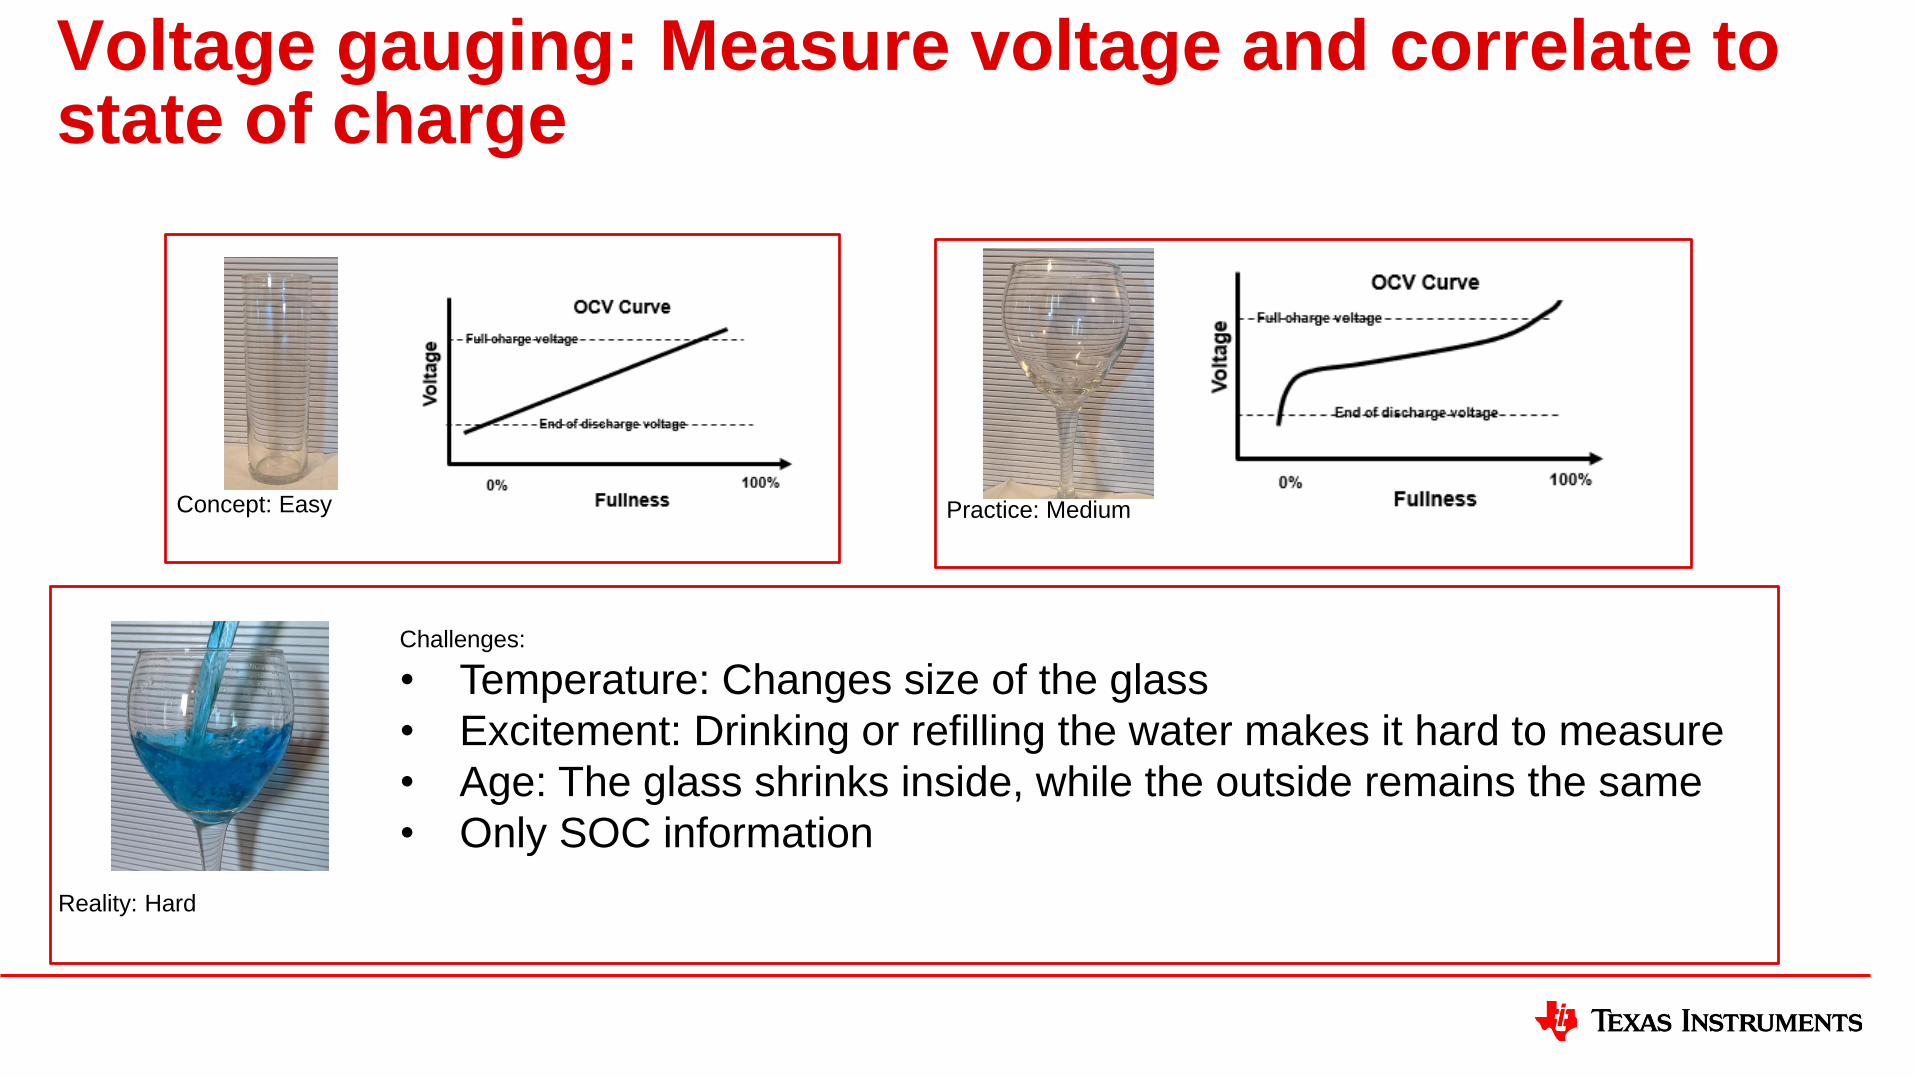
Voltage gauging: Measure voltage and correlate to state of charge
Concept: Easy
Challenges:
• Temperature: Changes size of the glass
• Excitement: Drinking or refilling the water makes it hard to measure
• Age: The glass shrinks inside, while the outside remains the same
• Only SOC information
Practice: Medium
Reality: Hard
How to gauge a battery
24
1. Battery
2. Voltage measurement• Ideal at least 1mV accurate
3. Temperature measurement• Battery temperature
4. Current measurement• Integrating ADC
• Accumulating passed charge
• Current measurements
5. CPU/RAM
6. Non-volatile memory• Flash or EEPROM and/or
ROM
4
12
3
5 & 6
Current gauging
25
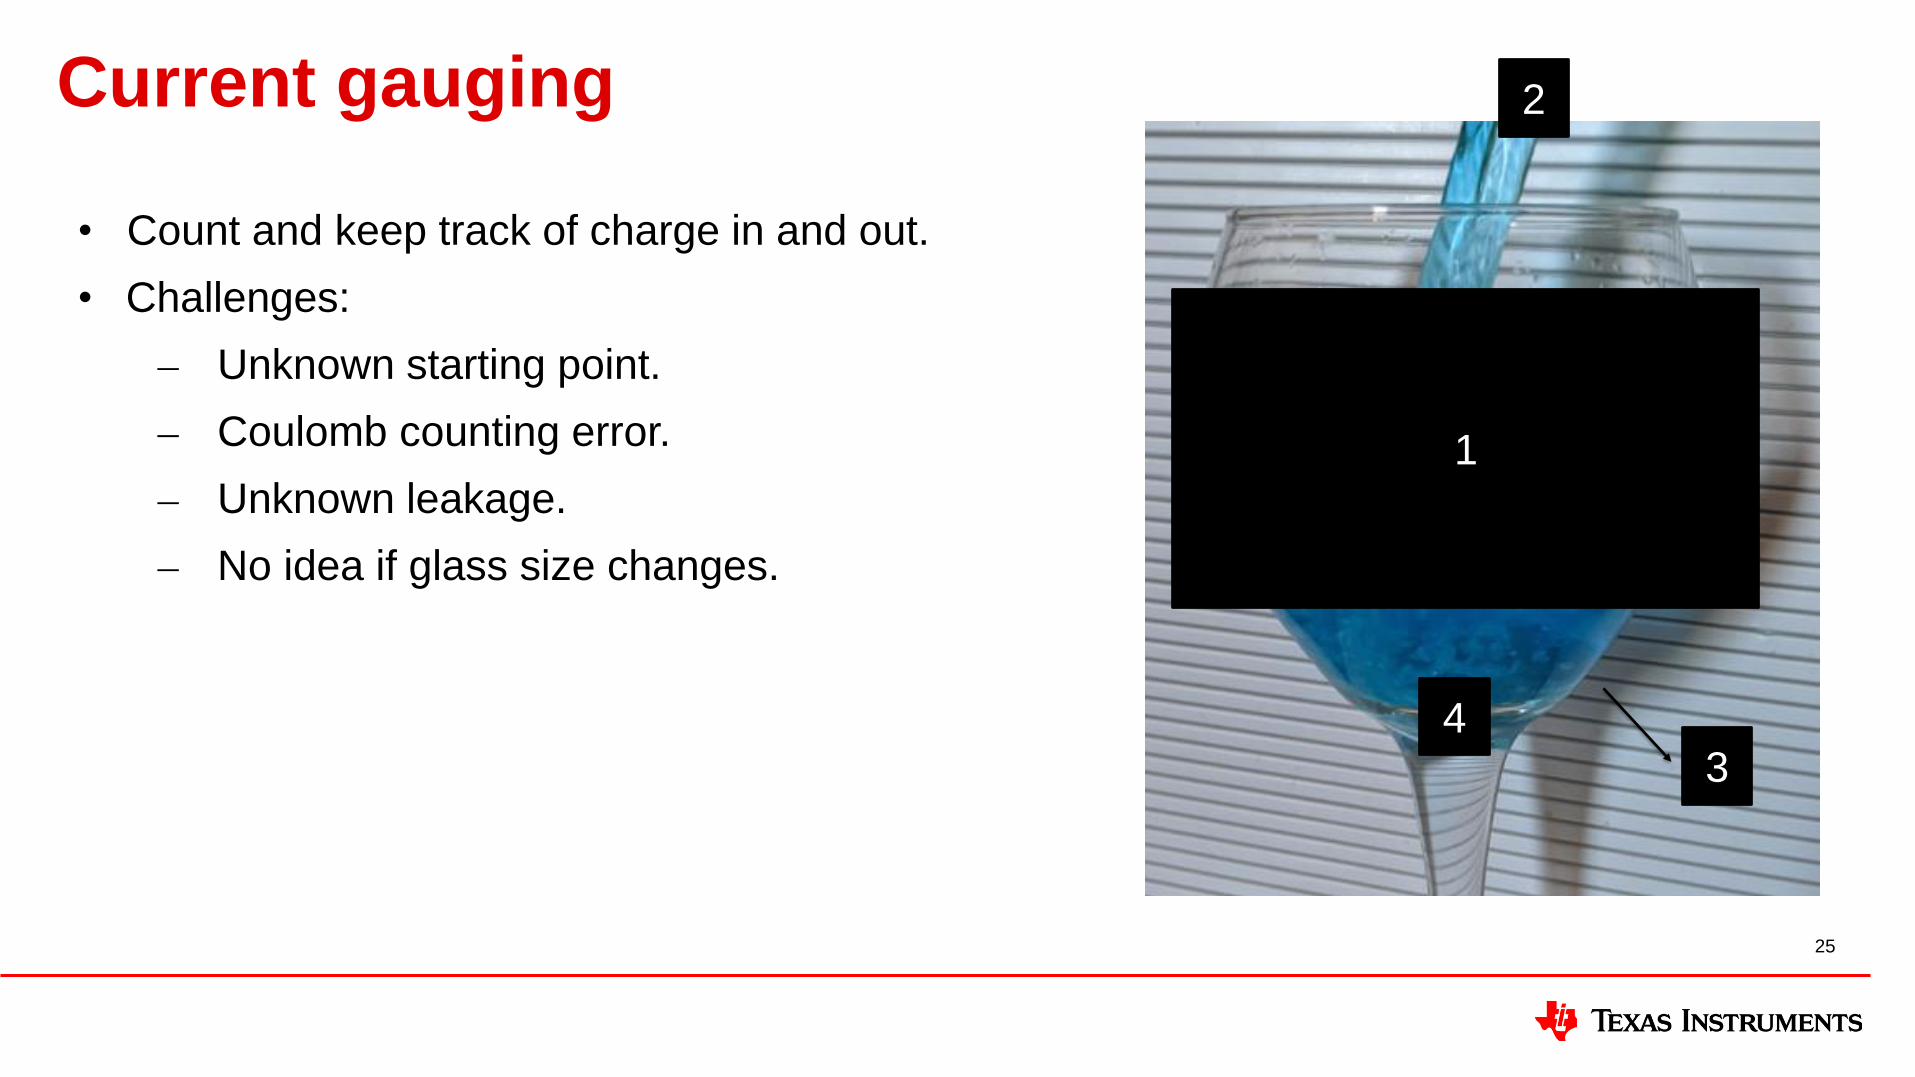
• Count and keep track of charge in and out.
• Challenges:
⎼ Unknown starting point.
⎼ Coulomb counting error.
⎼ Unknown leakage.
⎼ No idea if glass size changes.
1
2
34
How to gauge a battery
26
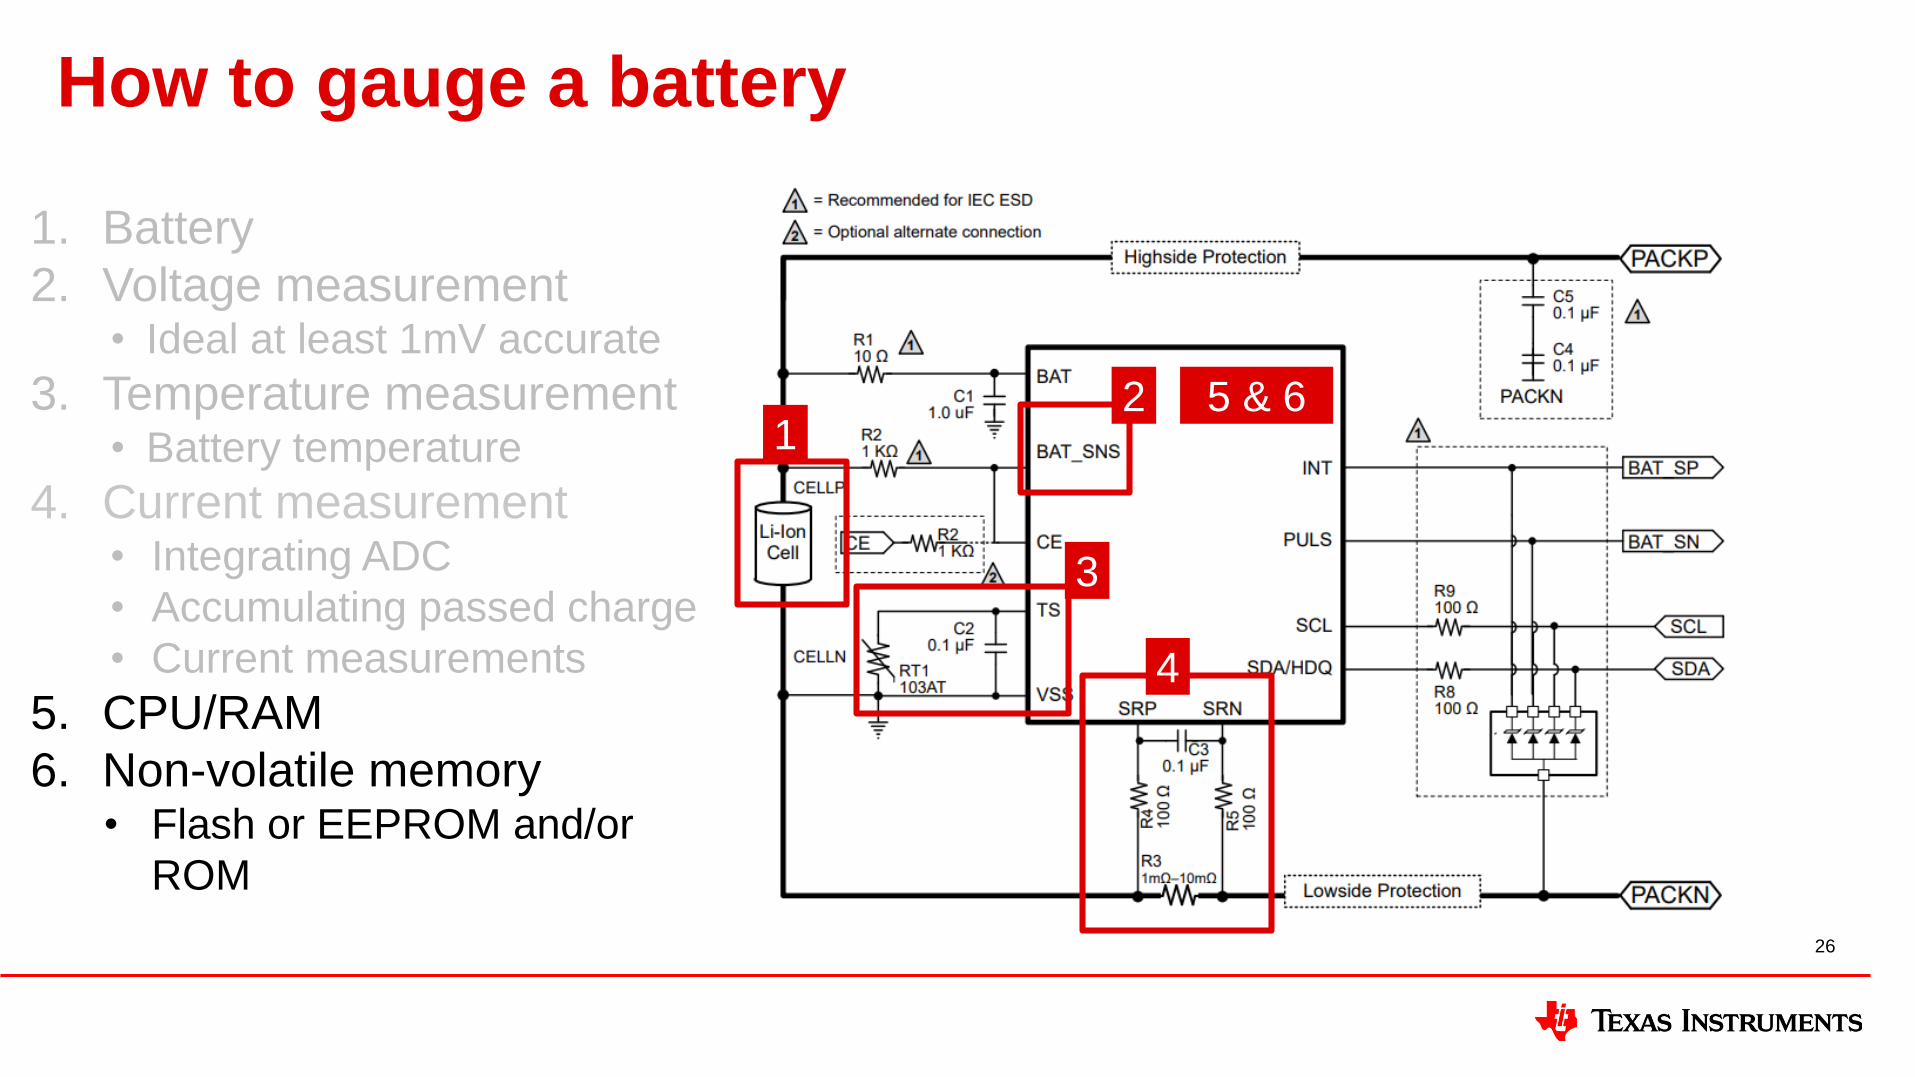
1. Battery
2. Voltage measurement• Ideal at least 1mV accurate
3. Temperature measurement• Battery temperature
4. Current measurement• Integrating ADC
• Accumulating passed charge
• Current measurements
5. CPU/RAM
6. Non-volatile memory• Flash or EEPROM and/or
ROM
4
12
3
5 & 6
Gauging algorithm types
Compensated End of Discharge Voltage (CEDV)
27
TI gauging method: CEDV
• Compensated End of Discharge Voltage (CEDV)
• Everything done through online tool:
– https://www.ti.com/tool/GAUGEPARCAL
• Requires 6 discharge cycles:
– 2x discharge rate (avg application discharge rate and max application discharge rate)
– 3x temperature (cold, room and hot)
• Expected setup time: Less that 1 week
28
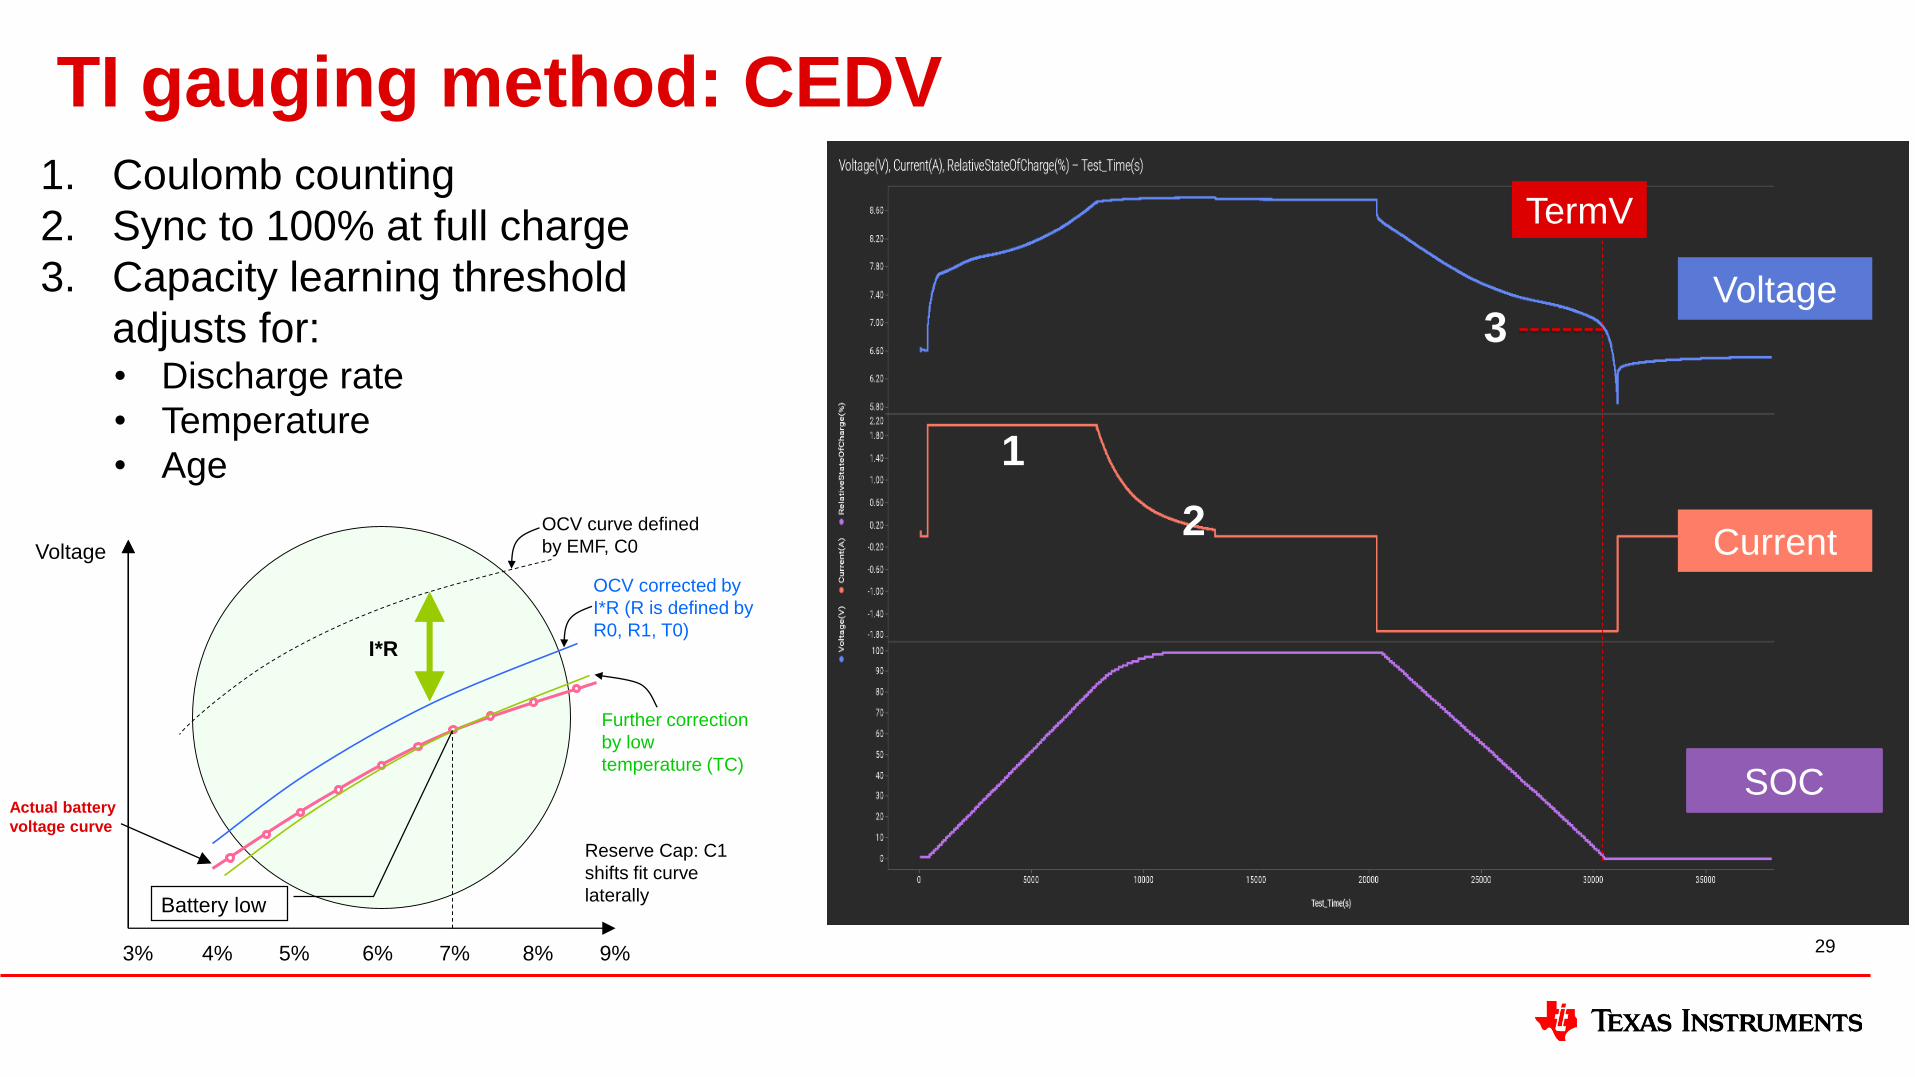
TI gauging method: CEDV
29
TermV
3
1
SOC
Current
Voltage
1. Coulomb counting
2. Sync to 100% at full charge
3. Capacity learning threshold
adjusts for:• Discharge rate
• Temperature
• Age
2
3% 4% 5% 6% 7% 8% 9%
Actual battery
voltage curve
Voltage
OCV curve defined
by EMF, C0
OCV corrected by
I*R (R is defined by
R0, R1, T0)I*R
Further correction
by low
temperature (TC)
Reserve Cap: C1
shifts fit curve
laterallyBattery low
Gauging algorithm types
Impedance Track™ technology (IT or ZT)
30
TI gauging method: Impedance Track technology
• Everything can be done through online tool:
– https://www.ti.com/tool/GAUGEPARCAL
– ChemID match, initial golden learning, & cold temp resistance tuning
• Requires 3 discharge cycles:
– Nominal discharge rate and room temperature
– Nominal discharge rate and cold temperature
– Application charging and discharge rate
• Expected setup time: 2 months
– ChemID: Match (3 days), custom (3-4 weeks)
– Learn cycle: 1 week
– Tuning for application: 3 weeks
• Load select, load mode, charge profile, reserve capacity, thermal model, resistance learning, etc.
31
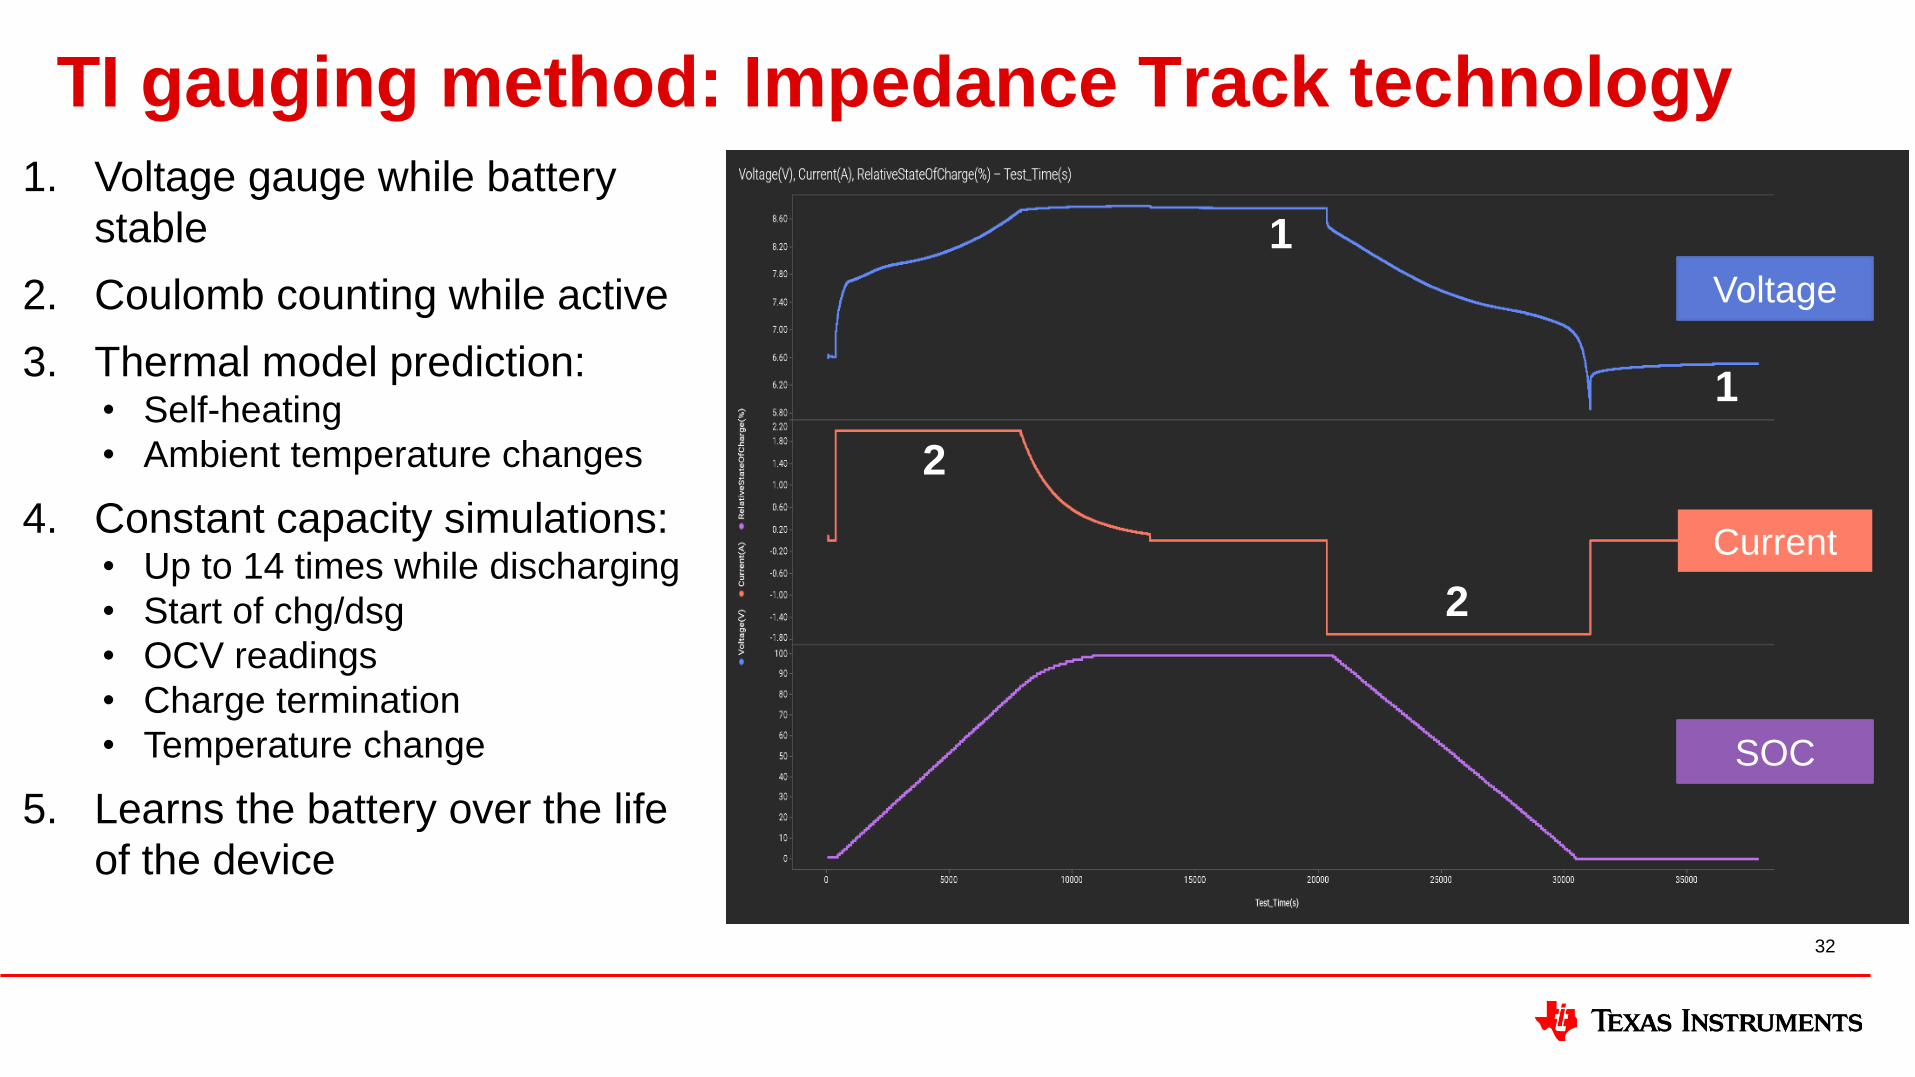
TI gauging method: Impedance Track technology
32
1
SOC
Current
Voltage
2
1. Voltage gauge while battery
stable
2. Coulomb counting while active
3. Thermal model prediction:• Self-heating
• Ambient temperature changes
4. Constant capacity simulations:• Up to 14 times while discharging
• Start of chg/dsg
• OCV readings
• Charge termination
• Temperature change
5. Learns the battery over the life
of the device
2
1
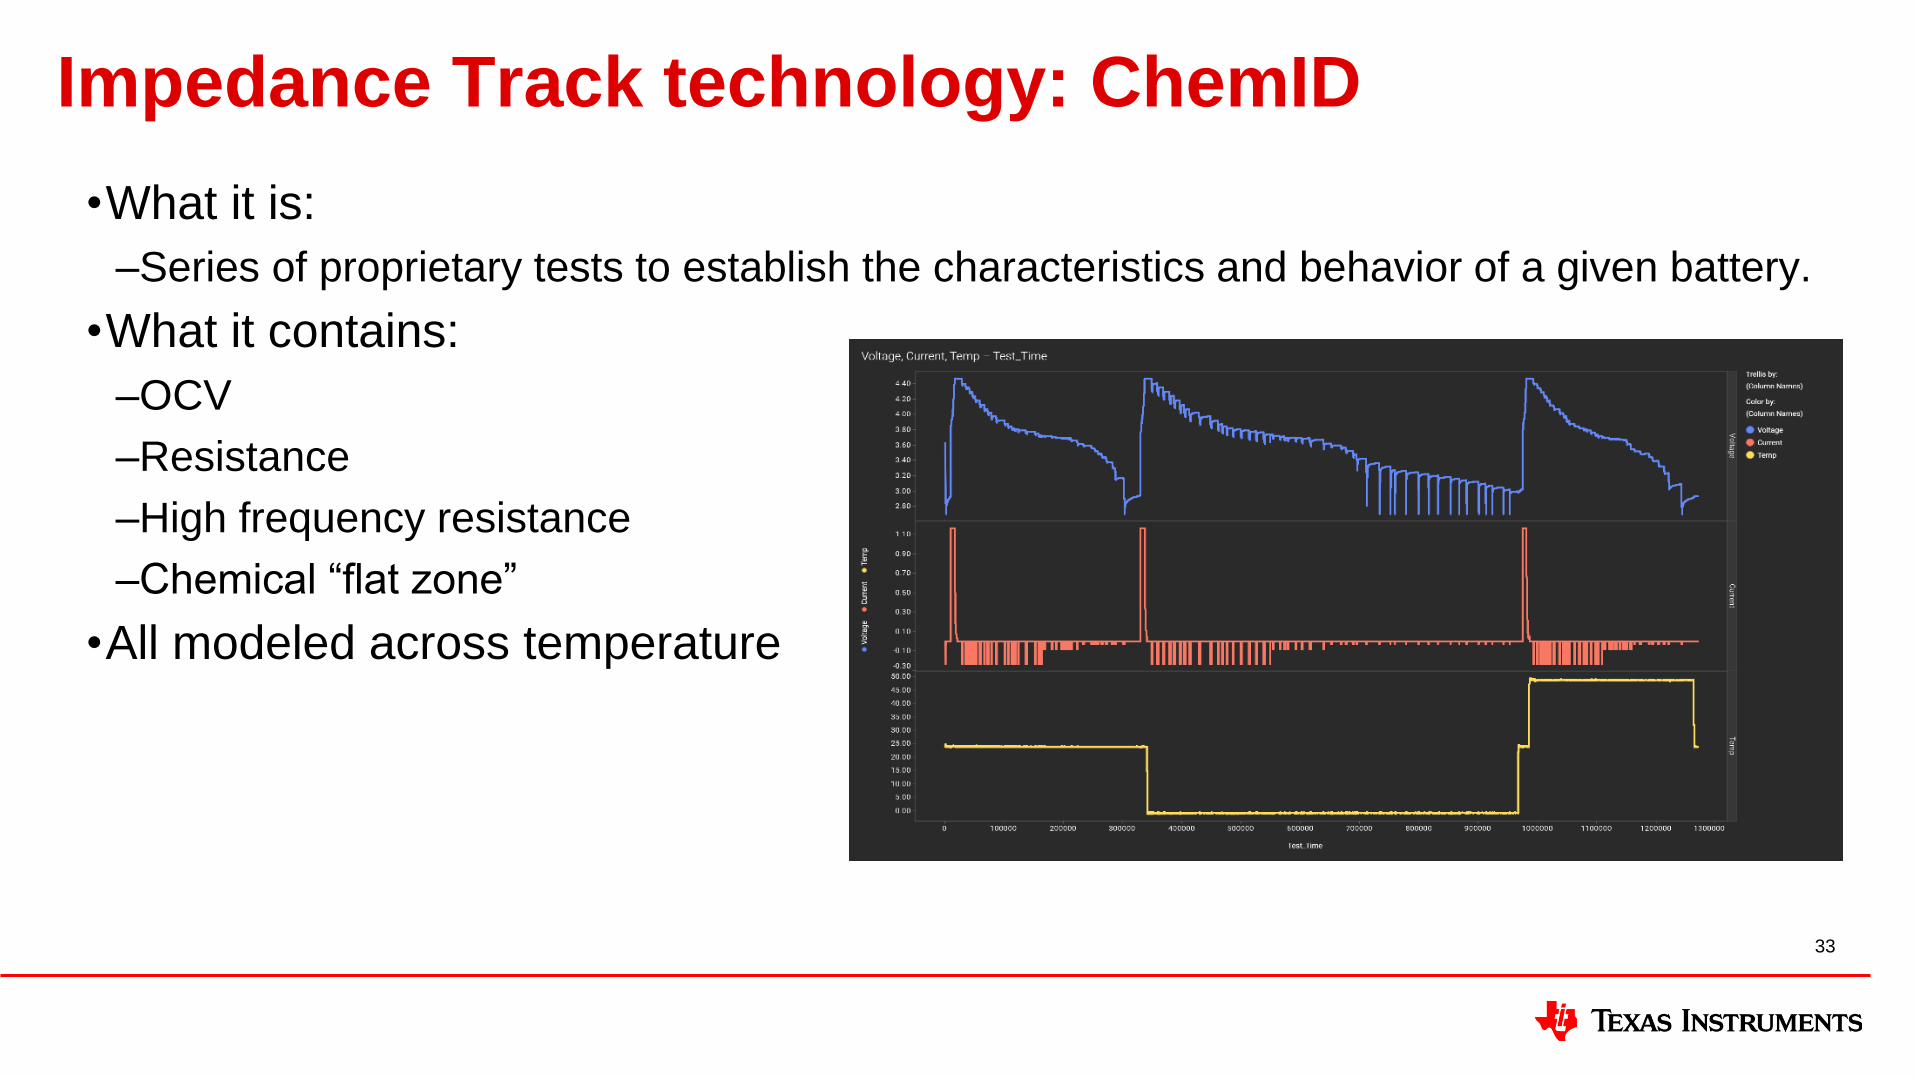
•What it is:
–Series of proprietary tests to establish the characteristics and behavior of a given battery.
•What it contains:
–OCV
–Resistance
–High frequency resistance
–Chemical “flat zone”
•All modeled across temperature
Impedance Track technology: ChemID
33
1
2
2
1
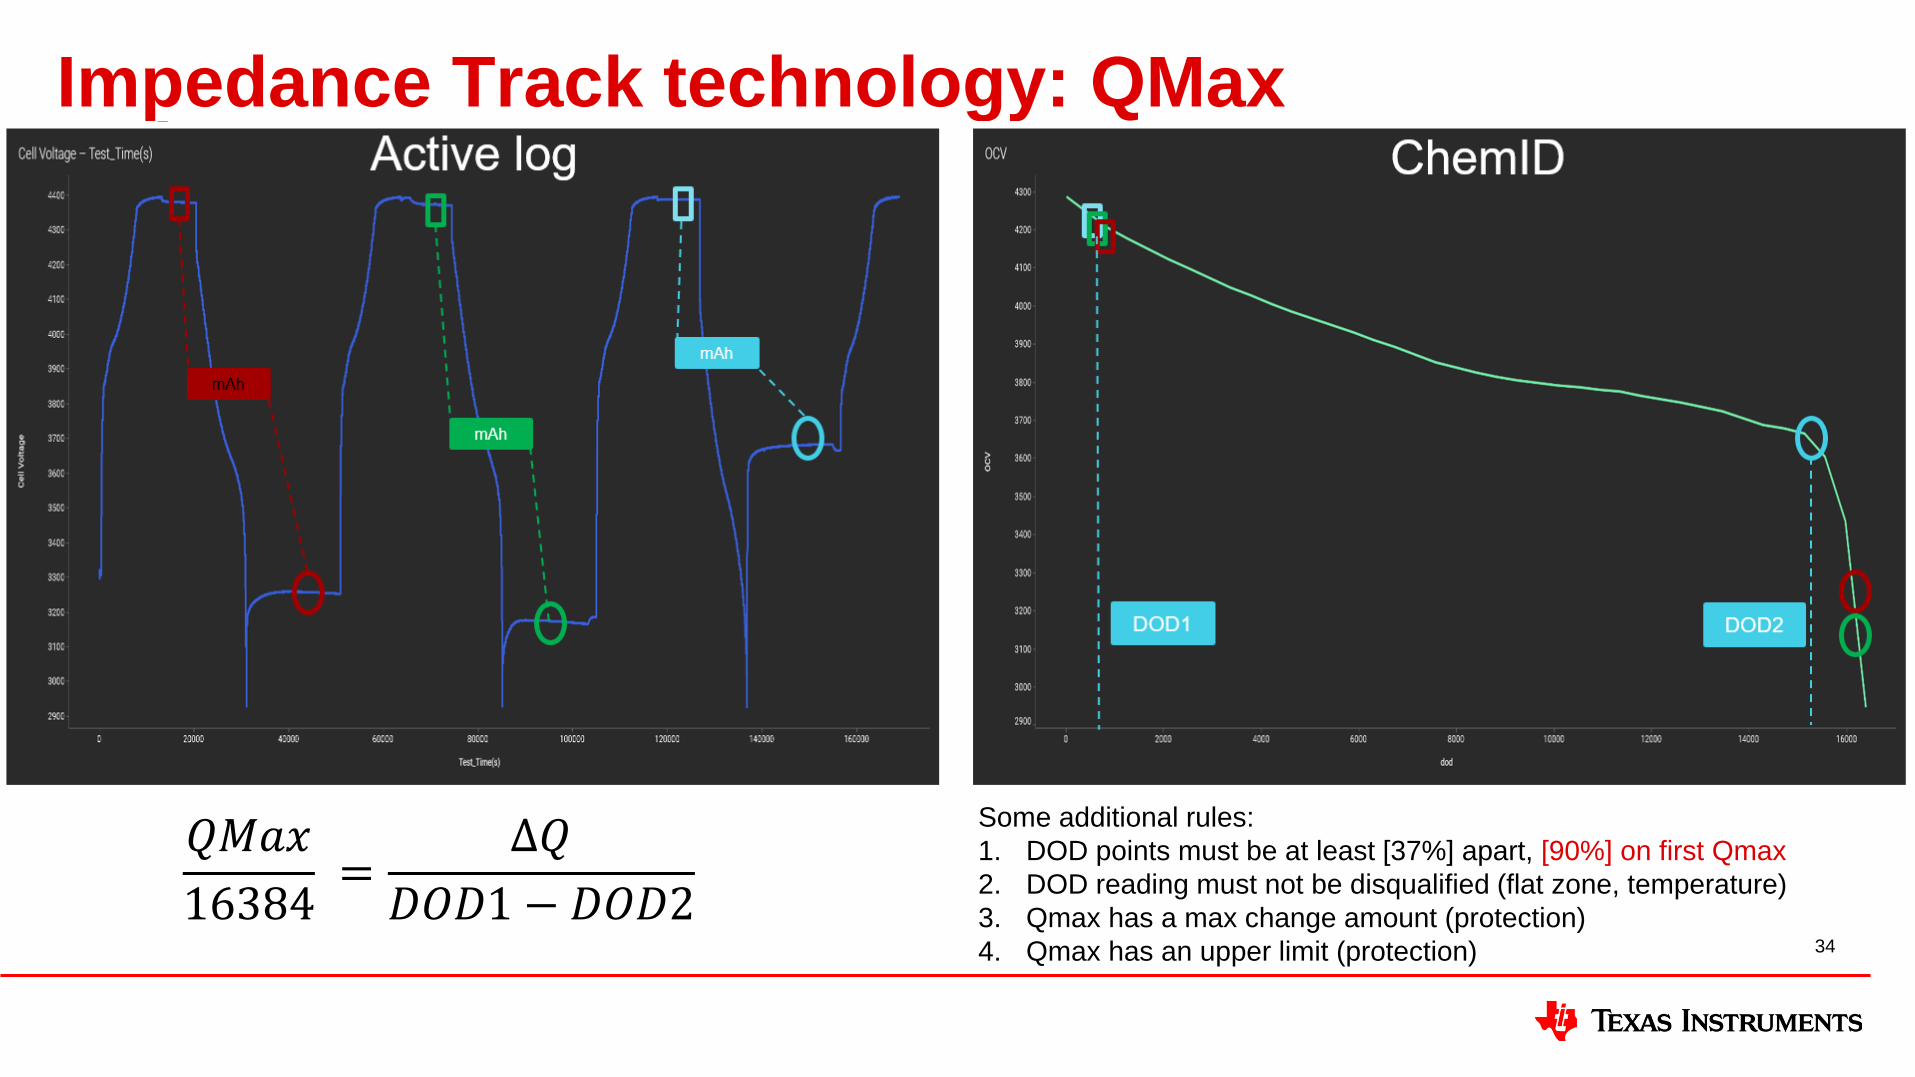
Impedance Track technology: QMax
34
𝑄𝑀𝑎𝑥
16384=
Δ𝑄
𝐷𝑂𝐷1 − 𝐷𝑂𝐷2
Some additional rules:
1. DOD points must be at least [37%] apart, [90%] on first Qmax
2. DOD reading must not be disqualified (flat zone, temperature)
3. Qmax has a max change amount (protection)
4. Qmax has an upper limit (protection)
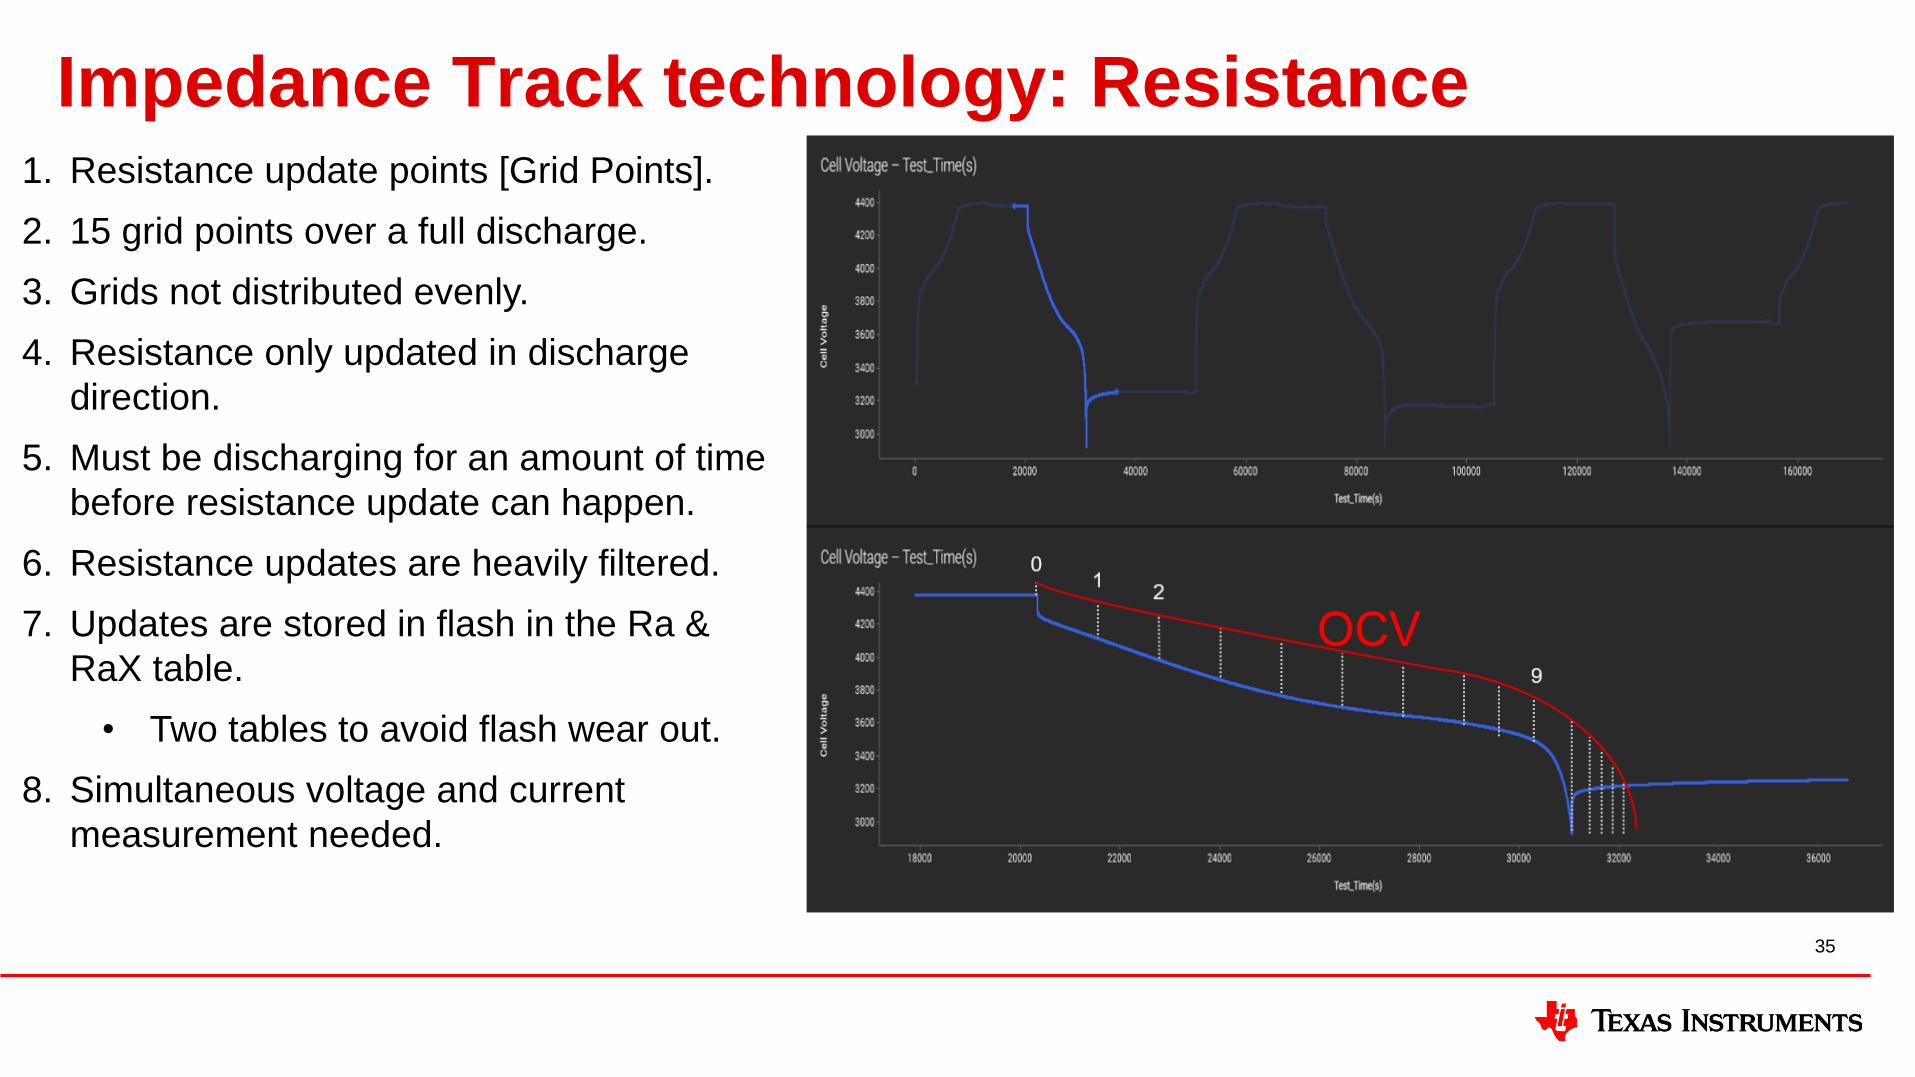
Impedance Track technology: Resistance
35
1. Resistance update points [Grid Points].
2. 15 grid points over a full discharge.
3. Grids not distributed evenly.
4. Resistance only updated in discharge
direction.
5. Must be discharging for an amount of time
before resistance update can happen.
6. Resistance updates are heavily filtered.
7. Updates are stored in flash in the Ra &
RaX table.
• Two tables to avoid flash wear out.
8. Simultaneous voltage and current
measurement needed.
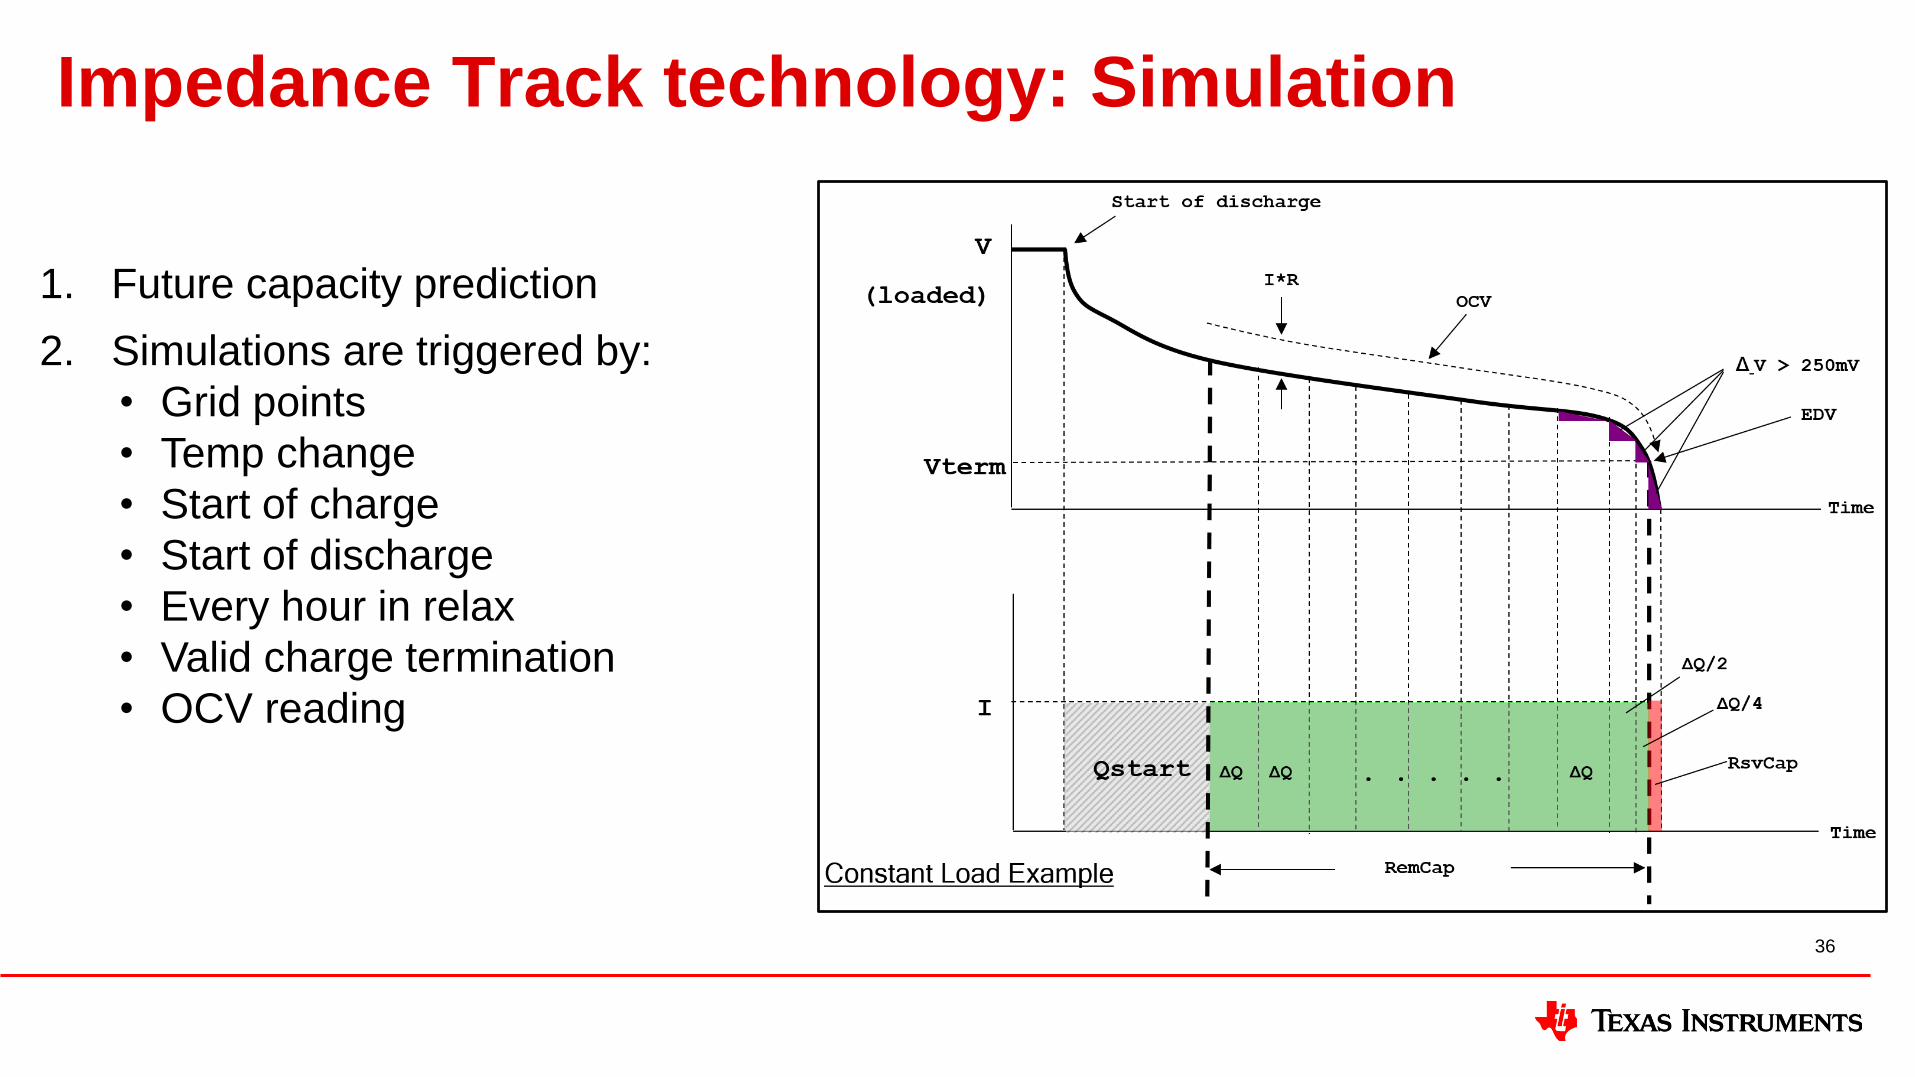
Impedance Track technology: Simulation
36
1. Future capacity prediction
2. Simulations are triggered by:
• Grid points
• Temp change
• Start of charge
• Start of discharge
• Every hour in relax
• Valid charge termination
• OCV reading
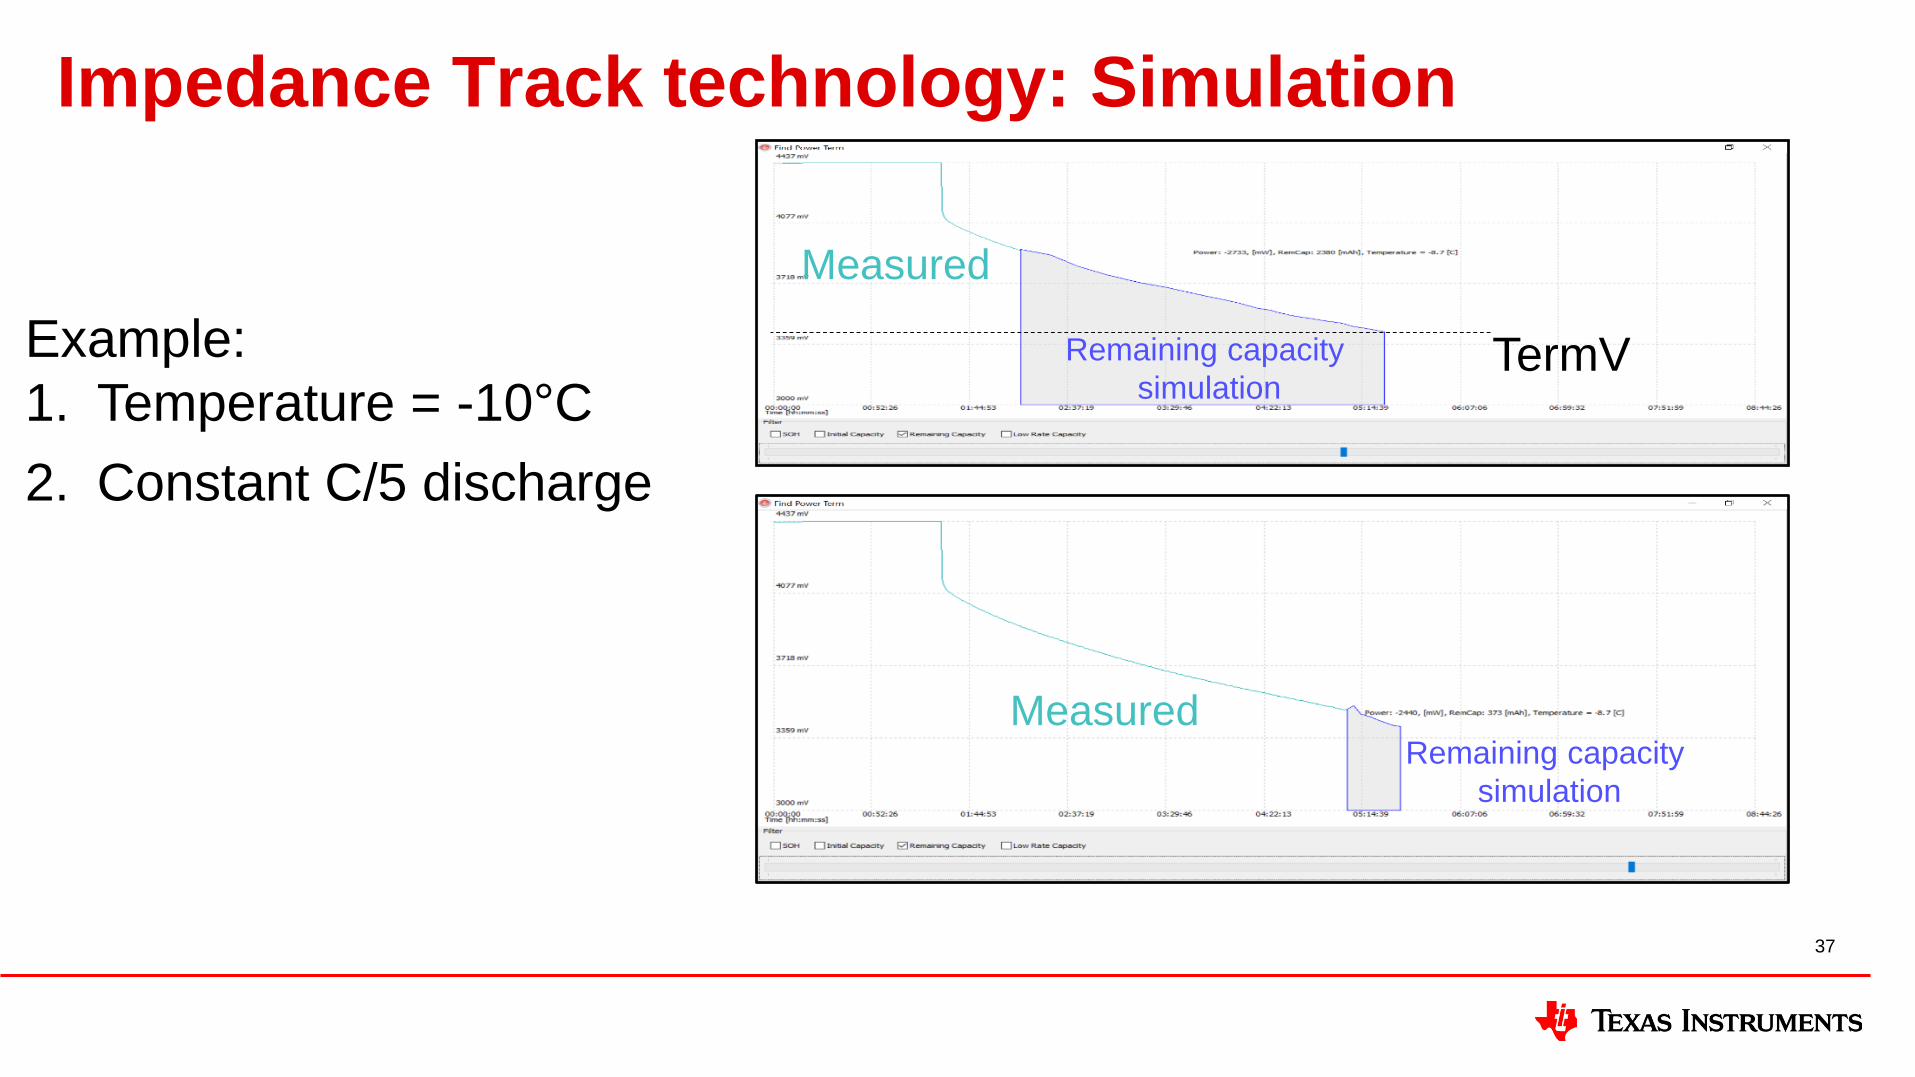
Impedance Track technology: Simulation
37
TermVRemaining capacity
simulation
Measured
Example:
1. Temperature = -10°C
2. Constant C/5 discharge
Remaining capacity
simulation
Measured
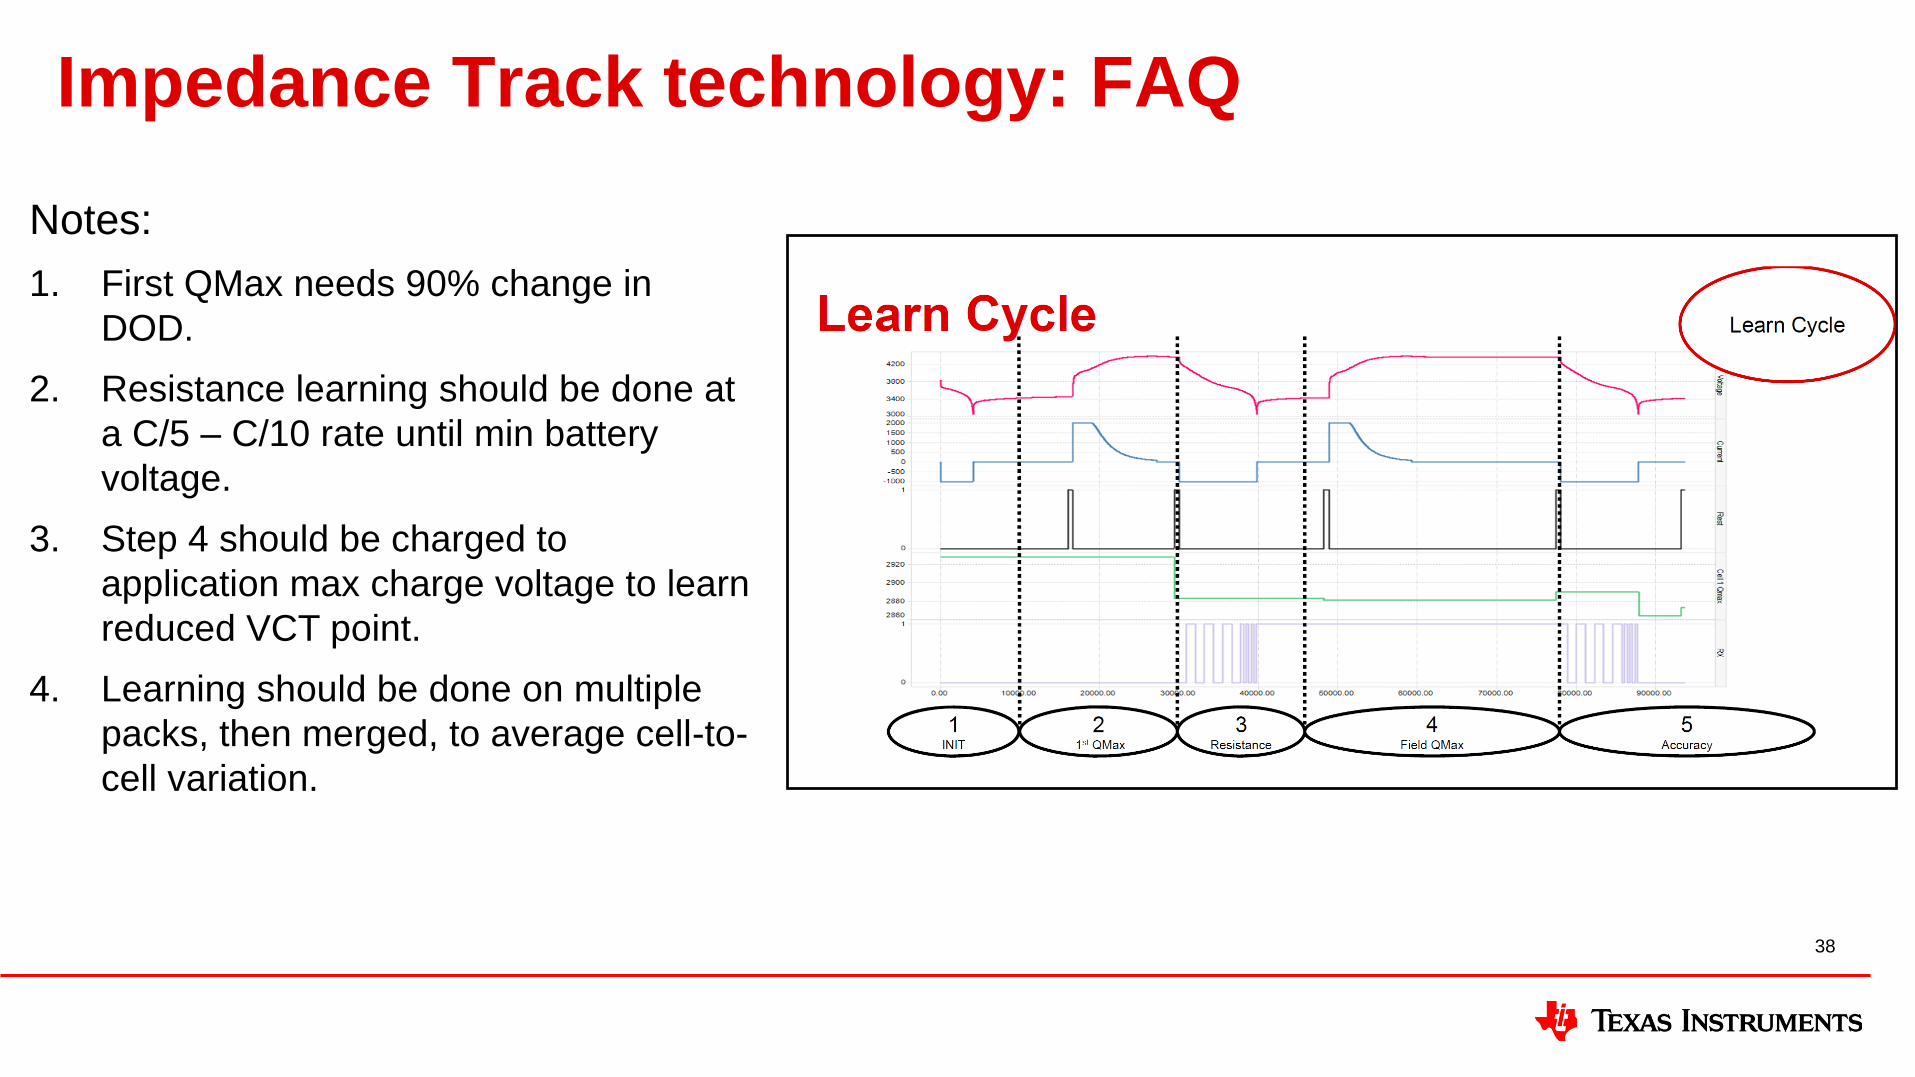
Impedance Track technology: FAQ
38
Notes:
1. First QMax needs 90% change in
DOD.
2. Resistance learning should be done at
a C/5 – C/10 rate until min battery
voltage.
3. Step 4 should be charged to
application max charge voltage to learn
reduced VCT point.
4. Learning should be done on multiple
packs, then merged, to average cell-to-
cell variation.
Impedance Track technology: Common challenges
39
1. Extreme cold temperatures (-10°C or lower).
– Challenge: Battery impedance across temperature is non-linear with greater cell-to-cell
variation.
– Recommendation: Should be tuned at slightly less extreme temperature (eg. -10°C for -
20°C needs).
2. High-rate discharge 1.5C+.
– Challenge: Battery termination could be happening within the “Flat Zone”. Flat zone
calculation errors increase due to mV delta per capacity delta.
– Recommendation: Lower termination voltage to increase accuracy.
3. High termination voltage.
– See #2.
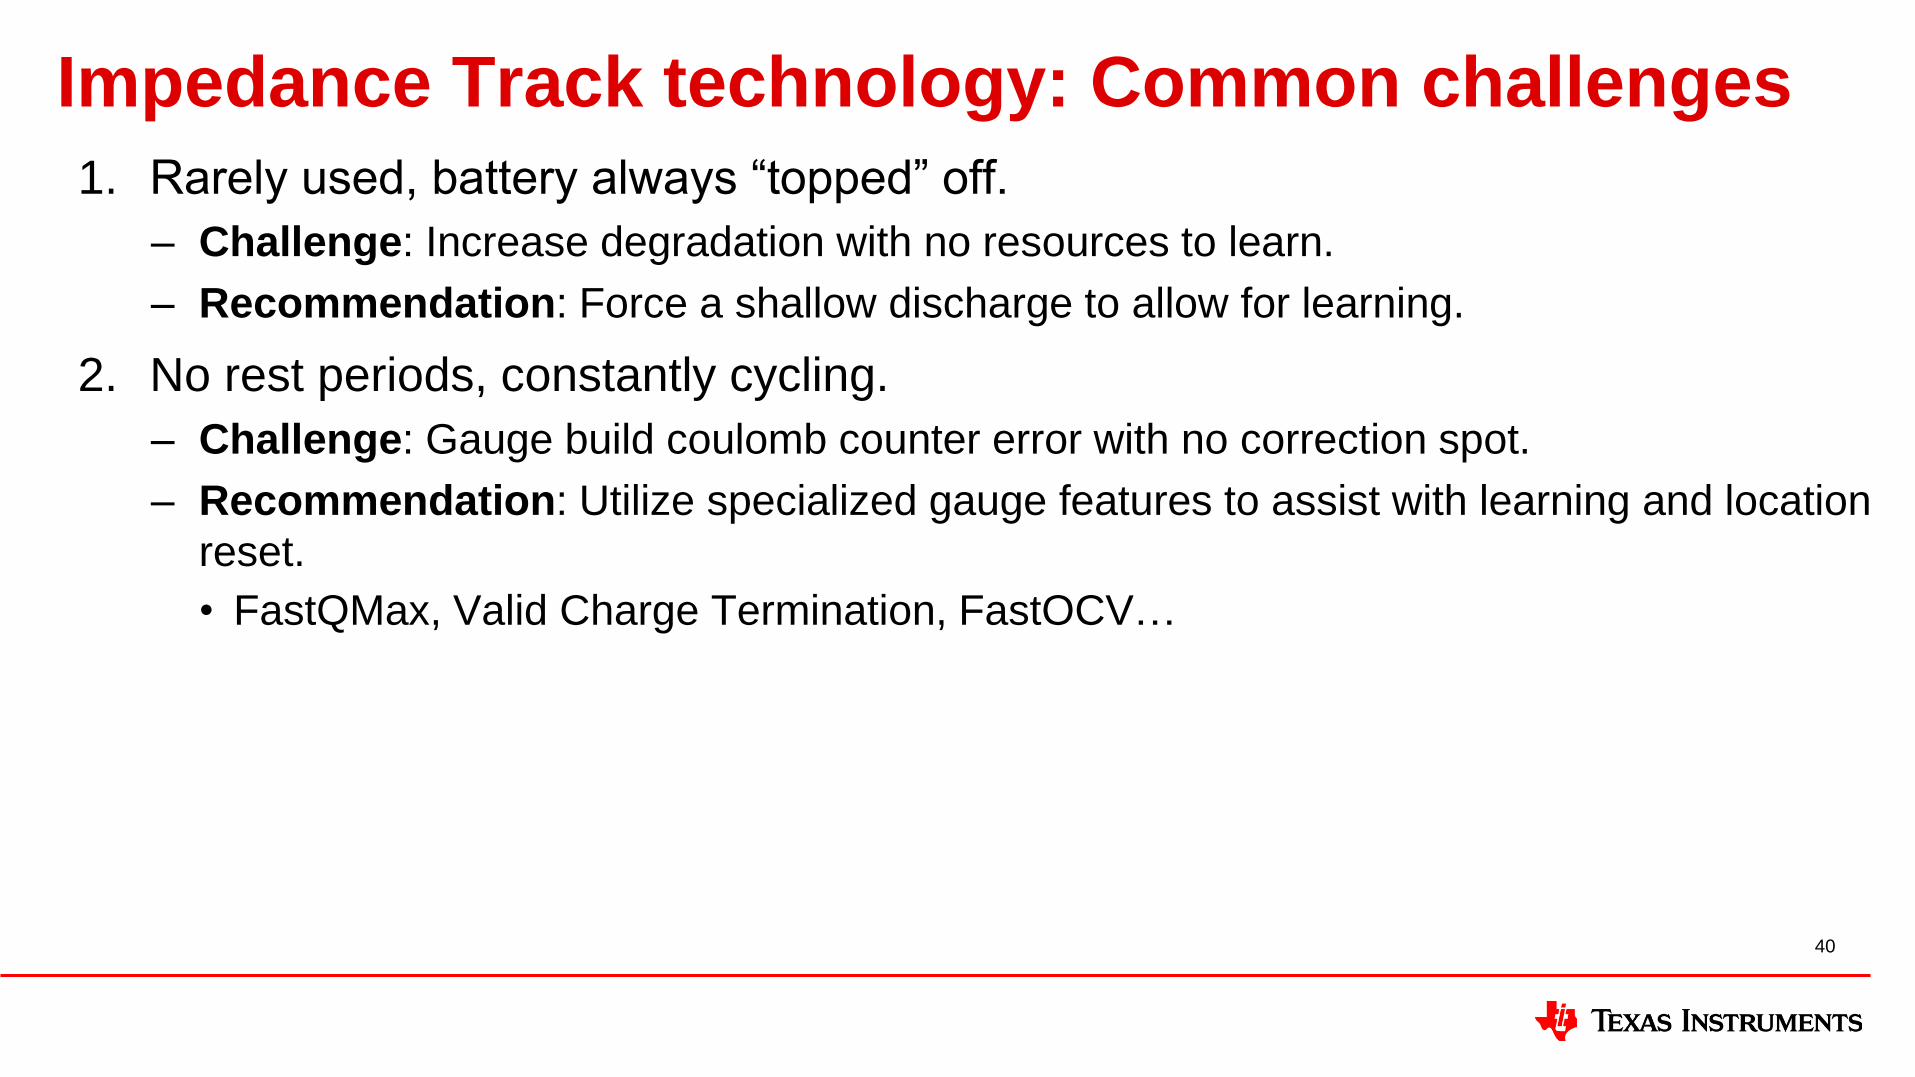
Impedance Track technology: Common challenges
40
1. Rarely used, battery always “topped” off.
– Challenge: Increase degradation with no resources to learn.
– Recommendation: Force a shallow discharge to allow for learning.
2. No rest periods, constantly cycling.
– Challenge: Gauge build coulomb counter error with no correction spot.
– Recommendation: Utilize specialized gauge features to assist with learning and location
reset.
• FastQMax, Valid Charge Termination, FastOCV…
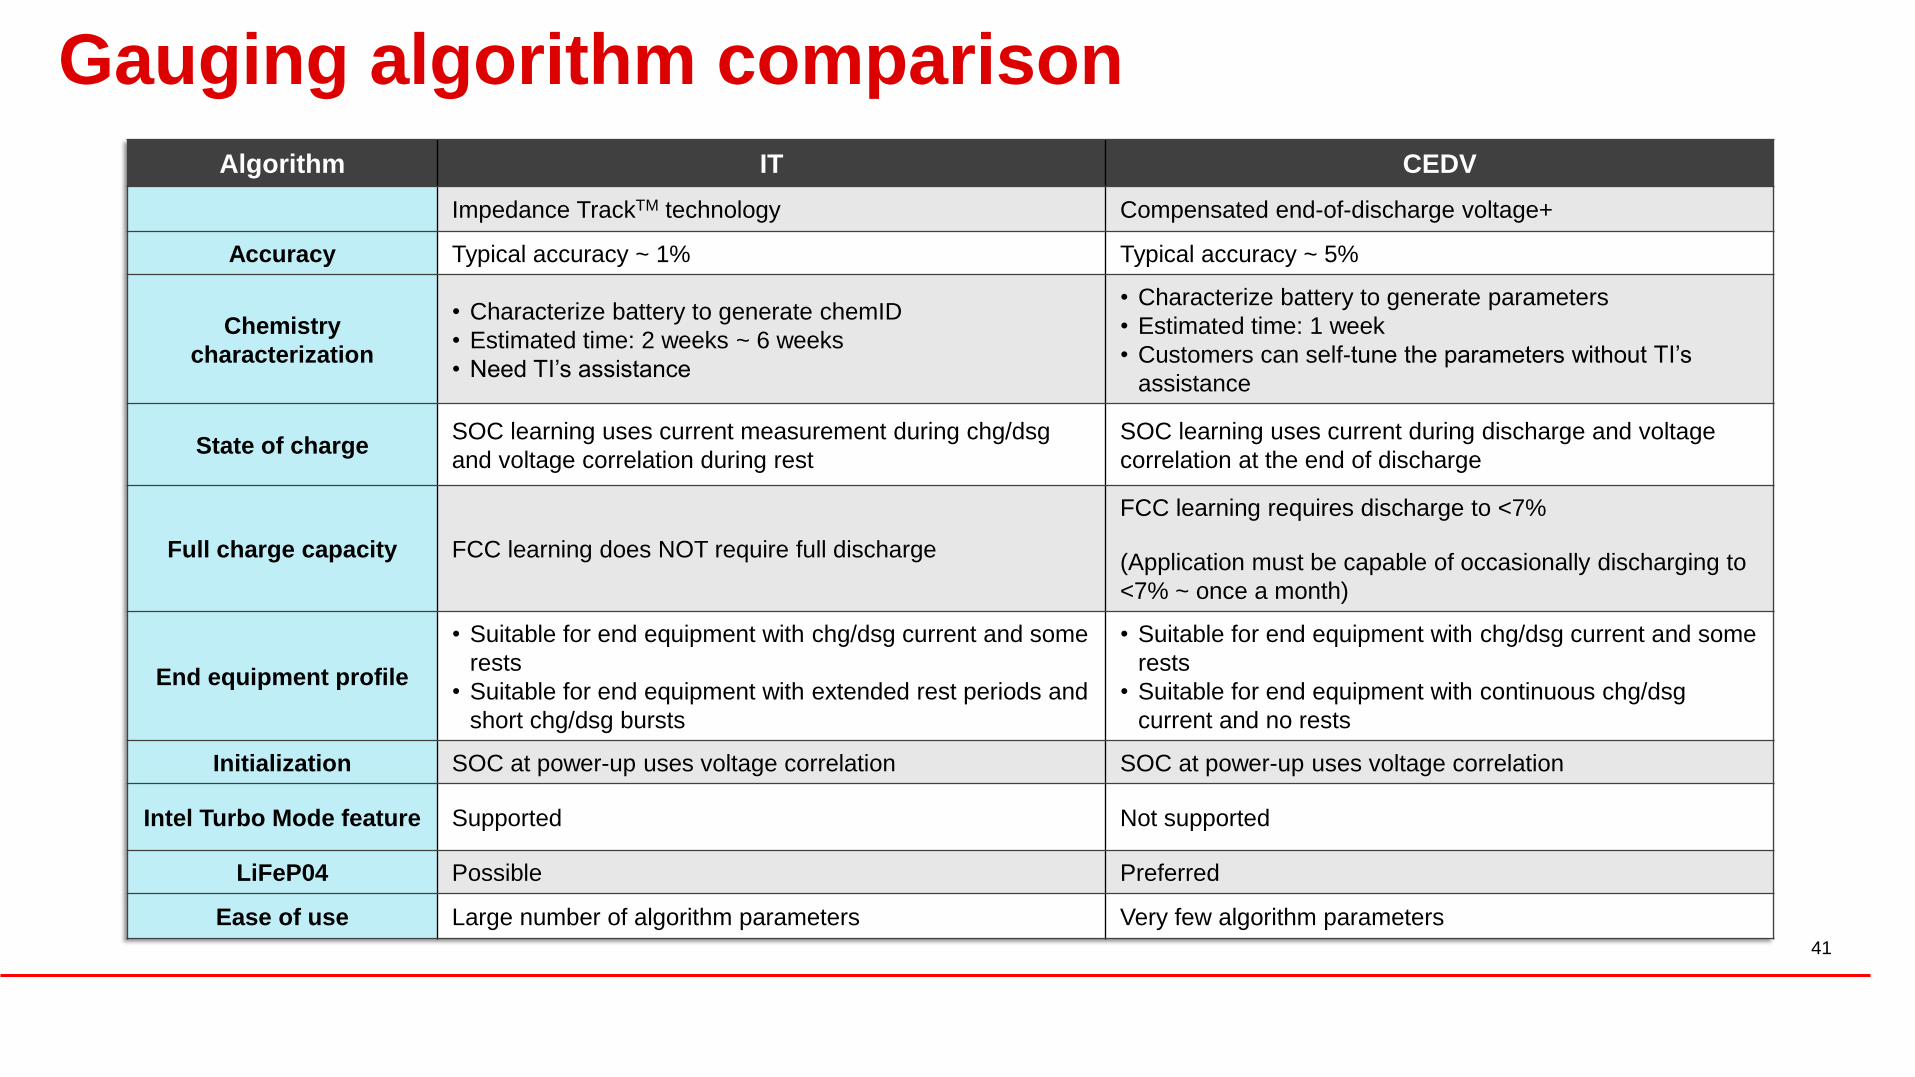
Algorithm IT CEDV
Impedance TrackTM technology Compensated end-of-discharge voltage+
Accuracy Typical accuracy ~ 1% Typical accuracy ~ 5%
Chemistry
characterization
• Characterize battery to generate chemID
• Estimated time: 2 weeks ~ 6 weeks
• Need TI’s assistance
• Characterize battery to generate parameters
• Estimated time: 1 week
• Customers can self-tune the parameters without TI’s
assistance
State of chargeSOC learning uses current measurement during chg/dsg
and voltage correlation during rest
SOC learning uses current during discharge and voltage
correlation at the end of discharge
Full charge capacity FCC learning does NOT require full discharge
FCC learning requires discharge to <7%
(Application must be capable of occasionally discharging to
<7% ~ once a month)
End equipment profile
• Suitable for end equipment with chg/dsg current and some
rests
• Suitable for end equipment with extended rest periods and
short chg/dsg bursts
• Suitable for end equipment with chg/dsg current and some
rests
• Suitable for end equipment with continuous chg/dsg
current and no rests
Initialization SOC at power-up uses voltage correlation SOC at power-up uses voltage correlation
Intel Turbo Mode feature Supported Not supported
LiFeP04 Possible Preferred
Ease of use Large number of algorithm parameters Very few algorithm parameters
Gauging algorithm comparison
41

Resources
42
Impedance Track technology advantages
• Combines advantages of voltage correlation and coulomb counting methods.
• Accounts for cell impedance/aging, temperature and variable current loading.
• Doesn’t require full charge-discharge learning cycle for FCC (usable capacity).
• Best accuracy (~1%).
• Dynamically updates the gauge data flash as it fully characterizes the
parameters of each cell.
• Parameters learning on-the-fly:
– Learn impedance during discharge
– Learn total capacity (Qmax) without full charge or discharge
– Adapt to spiky loads (delta voltage)
• Host system does not need to perform calculations or gauging algorithm.43
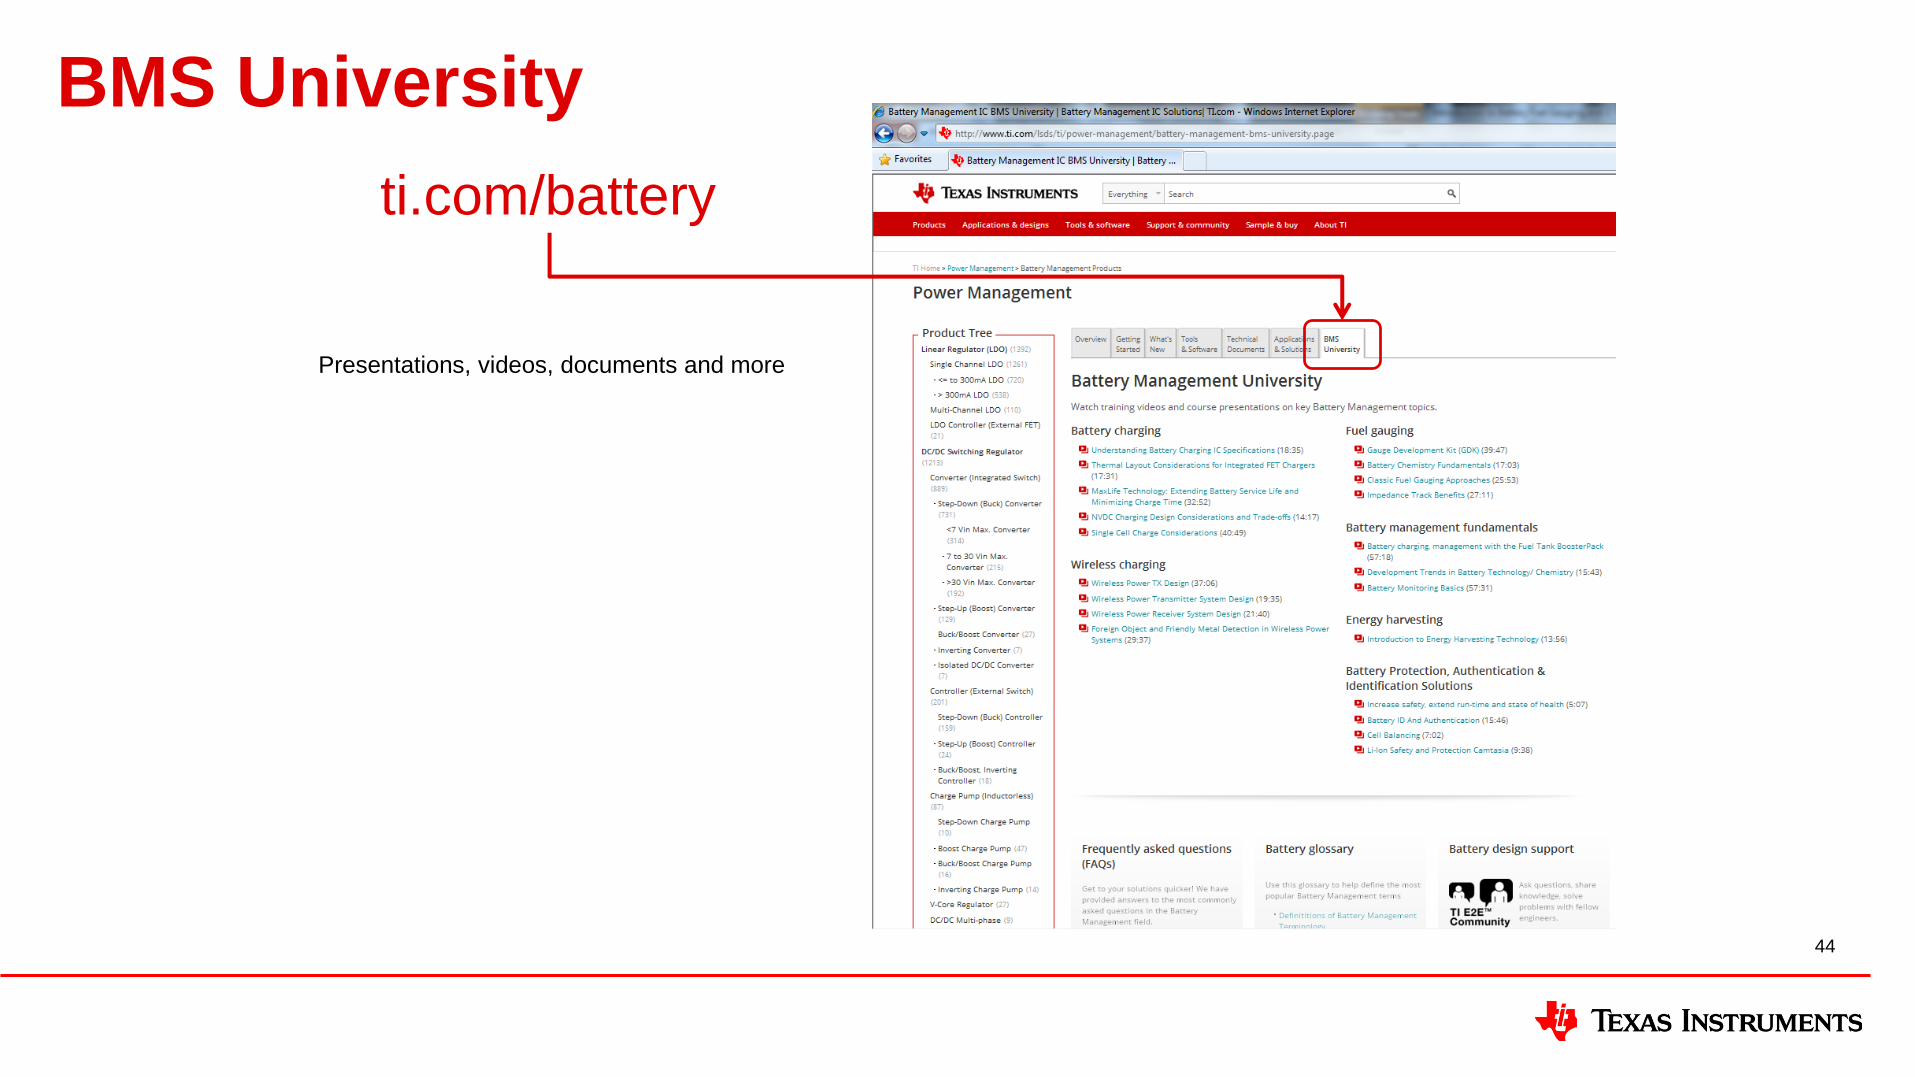
BMS University
ti.com/battery
Presentations, videos, documents and more
44
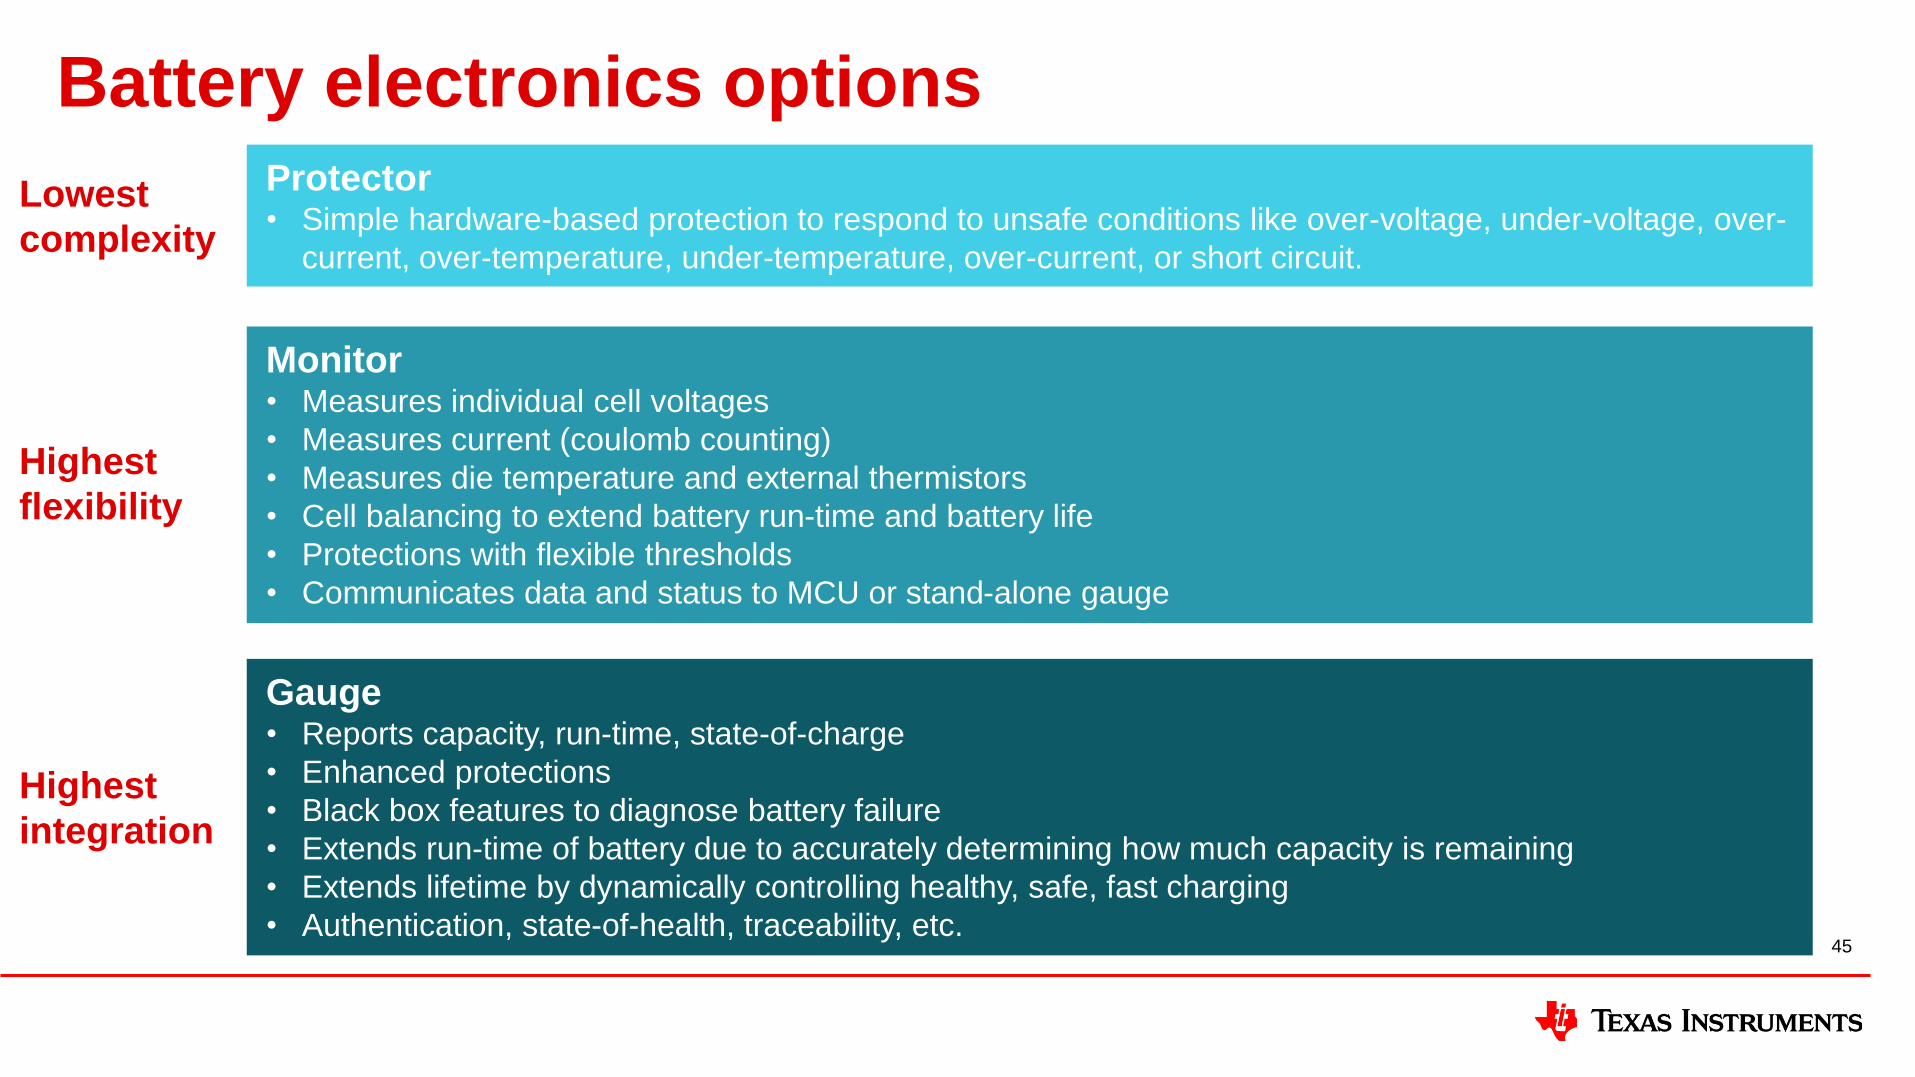
Battery electronics optionsProtector• Simple hardware-based protection to respond to unsafe conditions like over-voltage, under-voltage, over-
current, over-temperature, under-temperature, over-current, or short circuit.
Monitor• Measures individual cell voltages
• Measures current (coulomb counting)
• Measures die temperature and external thermistors
• Cell balancing to extend battery run-time and battery life
• Protections with flexible thresholds
• Communicates data and status to MCU or stand-alone gauge
Gauge• Reports capacity, run-time, state-of-charge
• Enhanced protections
• Black box features to diagnose battery failure
• Extends run-time of battery due to accurately determining how much capacity is remaining
• Extends lifetime by dynamically controlling healthy, safe, fast charging
• Authentication, state-of-health, traceability, etc.
Lowest
complexity
Highest
flexibility
Highest
integration
45
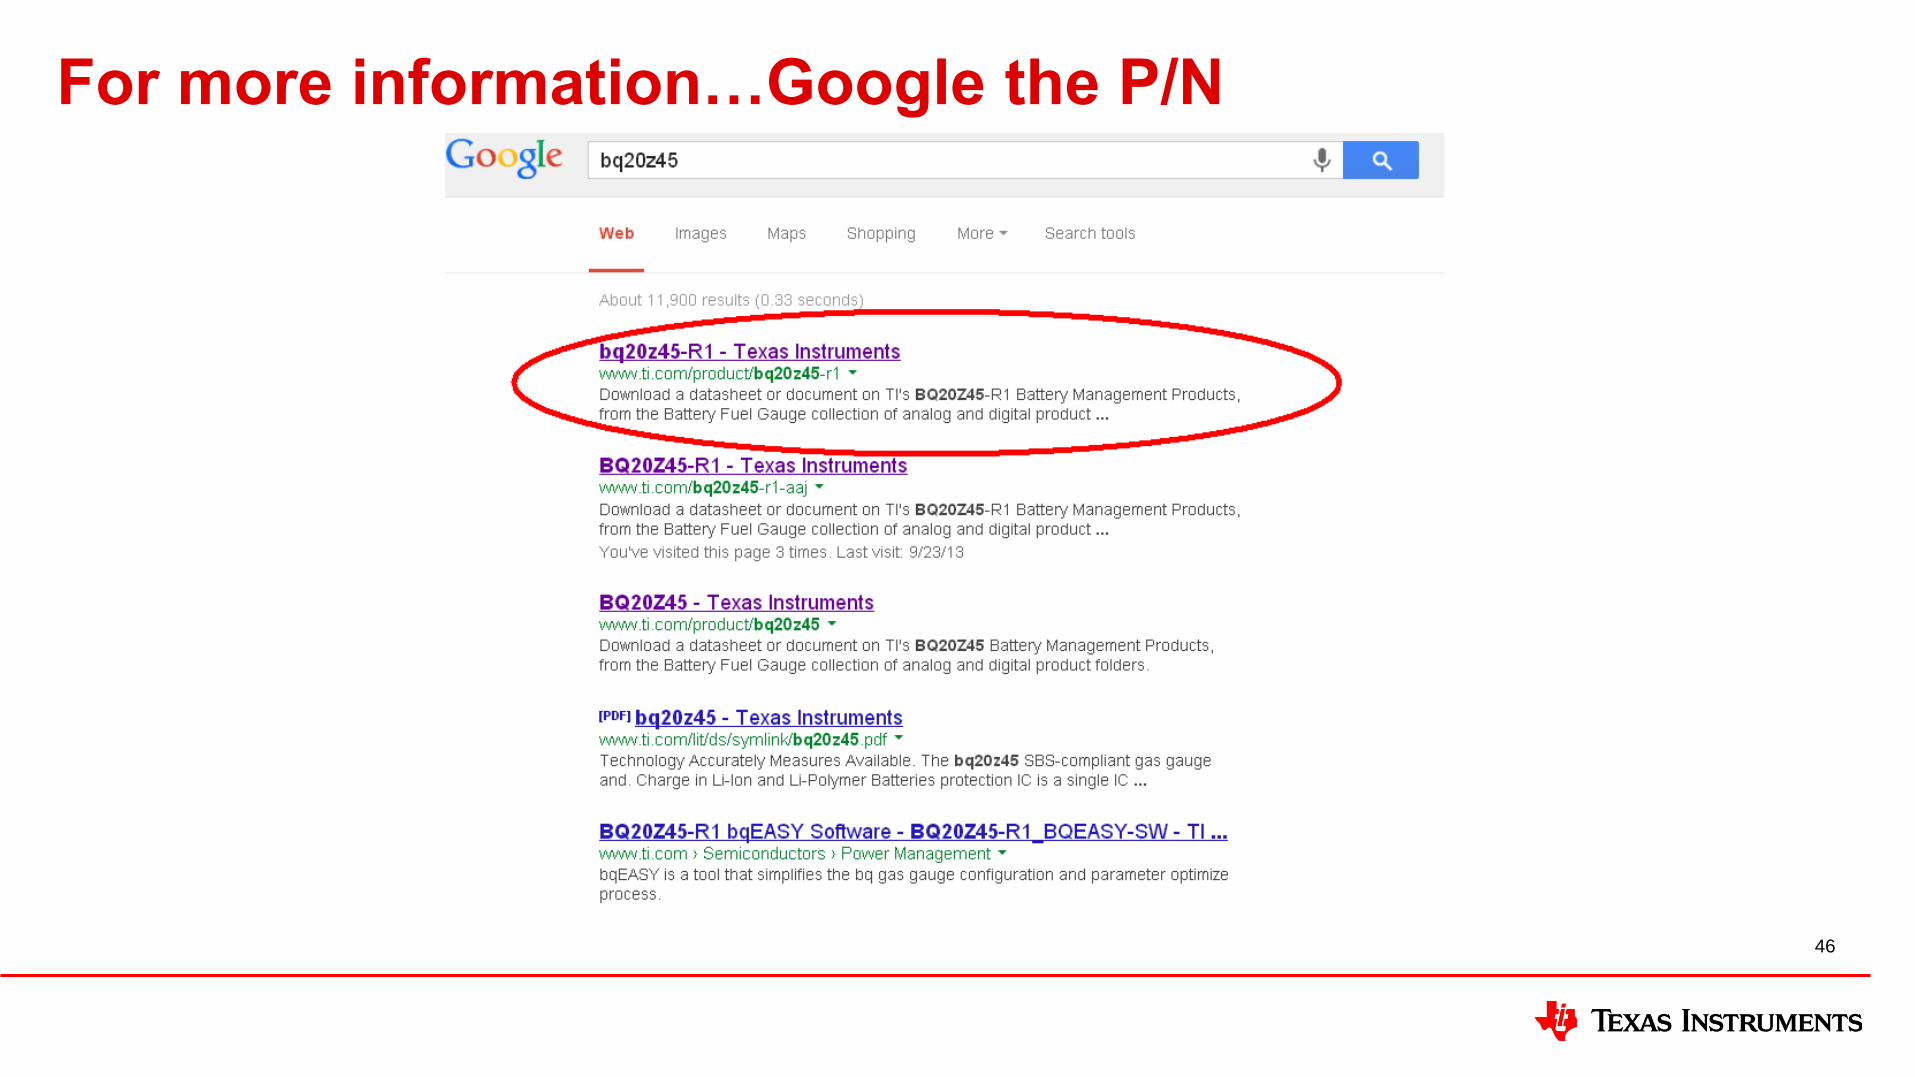
For more information…Google the P/N
46
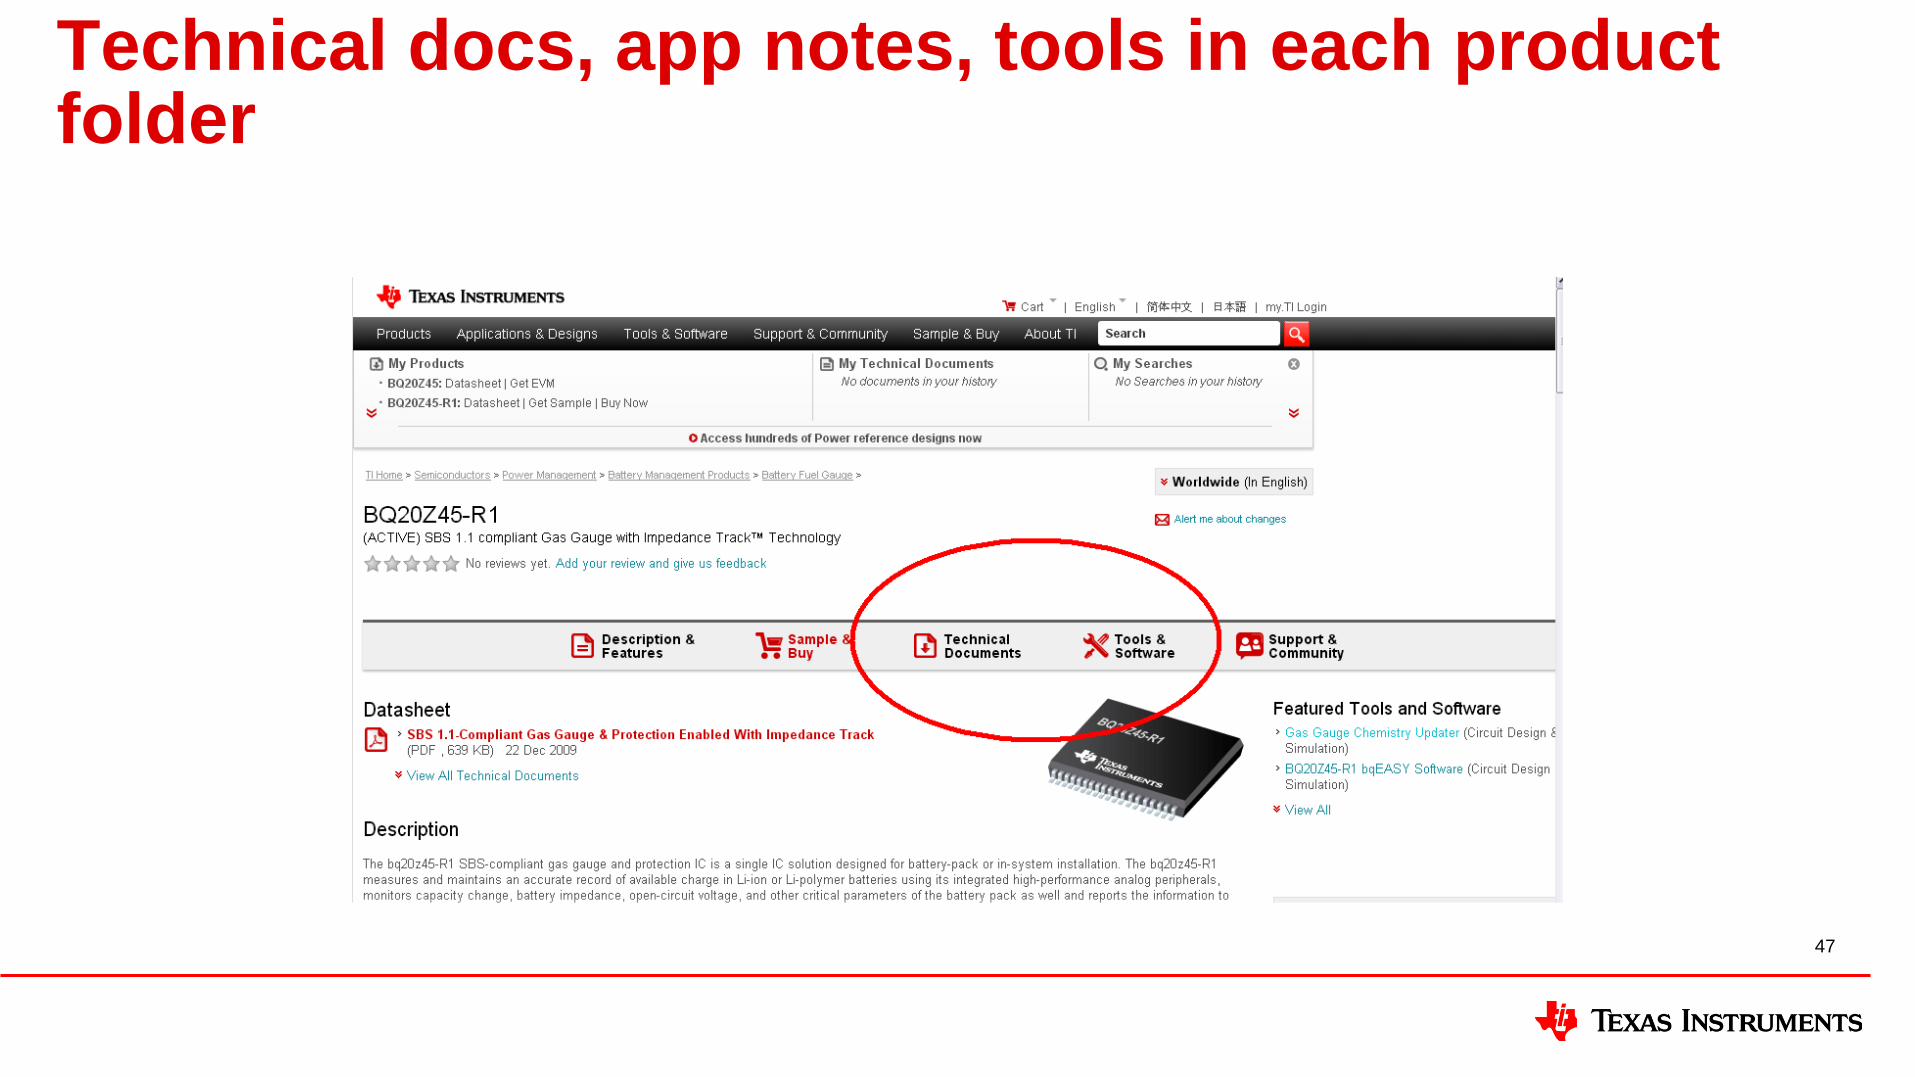
Technical docs, app notes, tools in each product folder
47
Appendix A
How can you extend run-time with an accurate gauge?
48
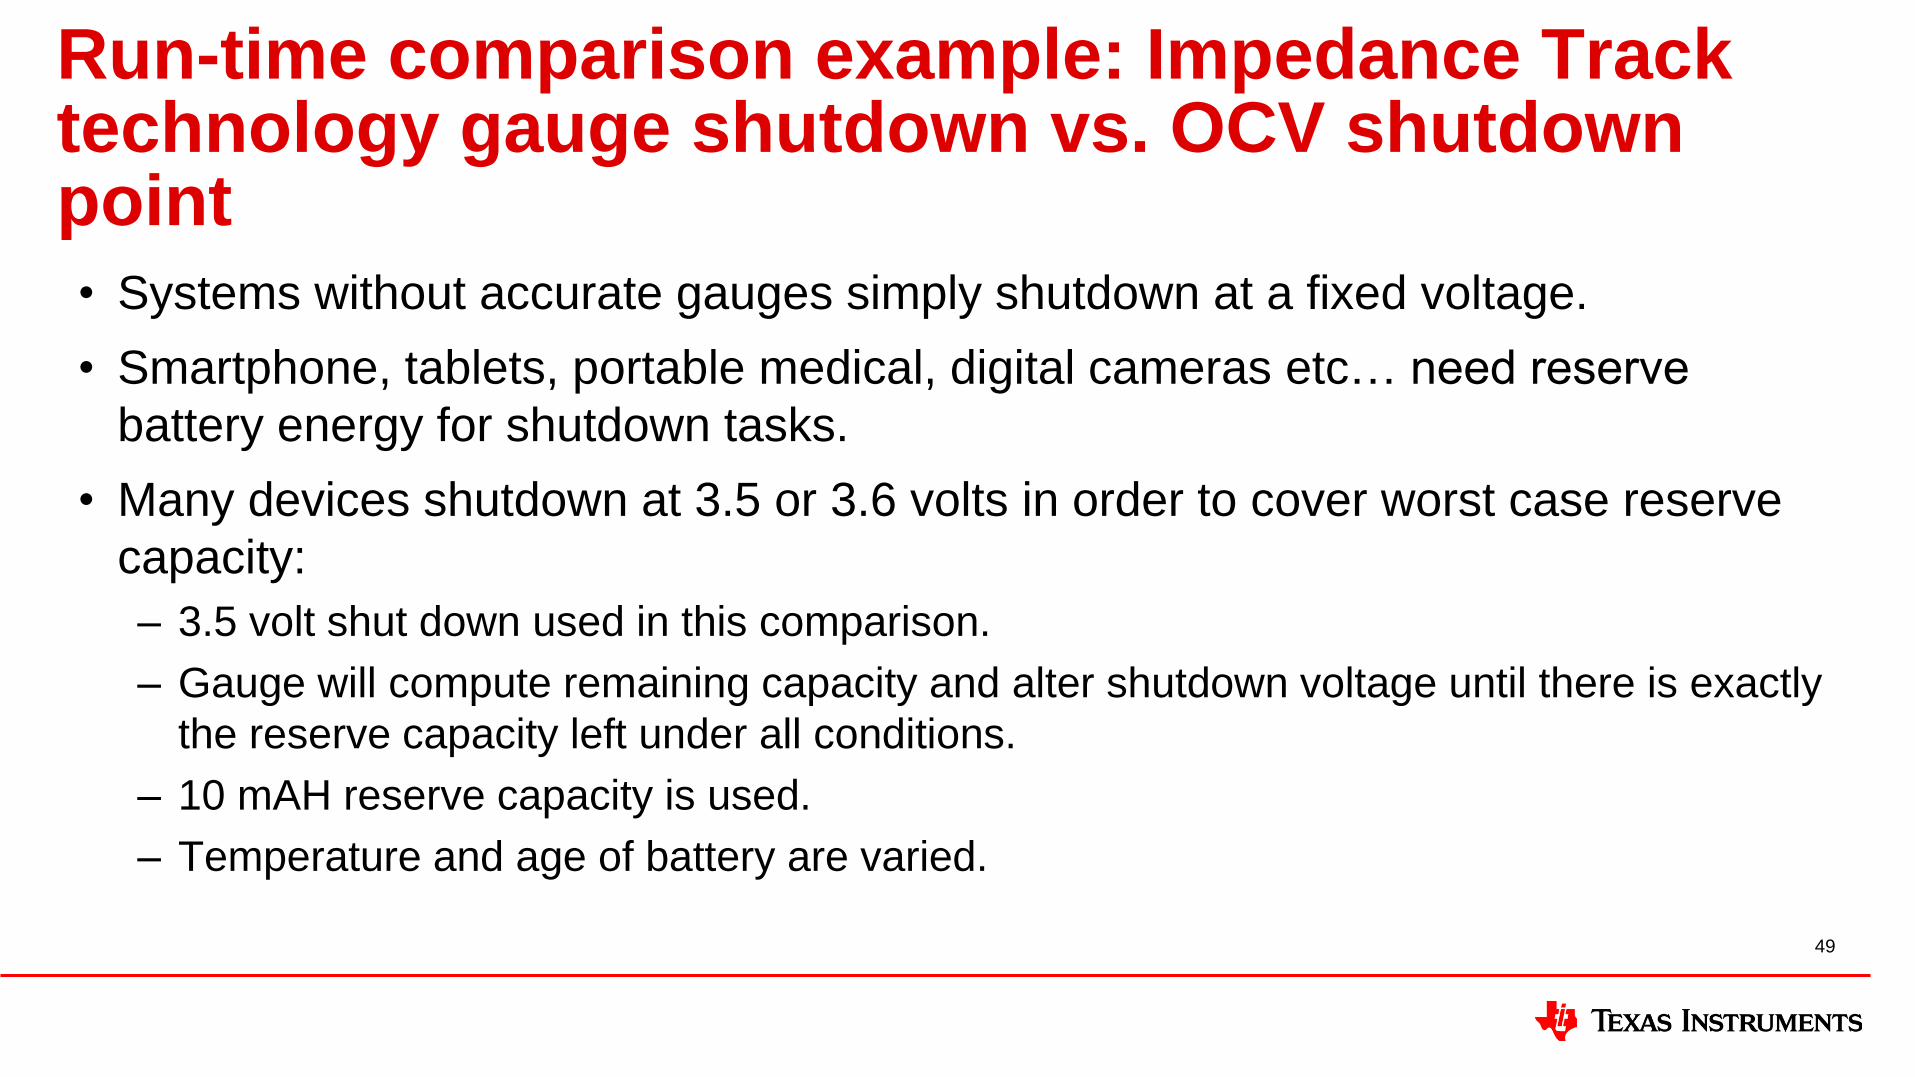
Run-time comparison example: Impedance Track technology gauge shutdown vs. OCV shutdown point • Systems without accurate gauges simply shutdown at a fixed voltage.
• Smartphone, tablets, portable medical, digital cameras etc… need reserve
battery energy for shutdown tasks.
• Many devices shutdown at 3.5 or 3.6 volts in order to cover worst case reserve
capacity:
– 3.5 volt shut down used in this comparison.
– Gauge will compute remaining capacity and alter shutdown voltage until there is exactly
the reserve capacity left under all conditions.
– 10 mAH reserve capacity is used.
– Temperature and age of battery are varied.
49
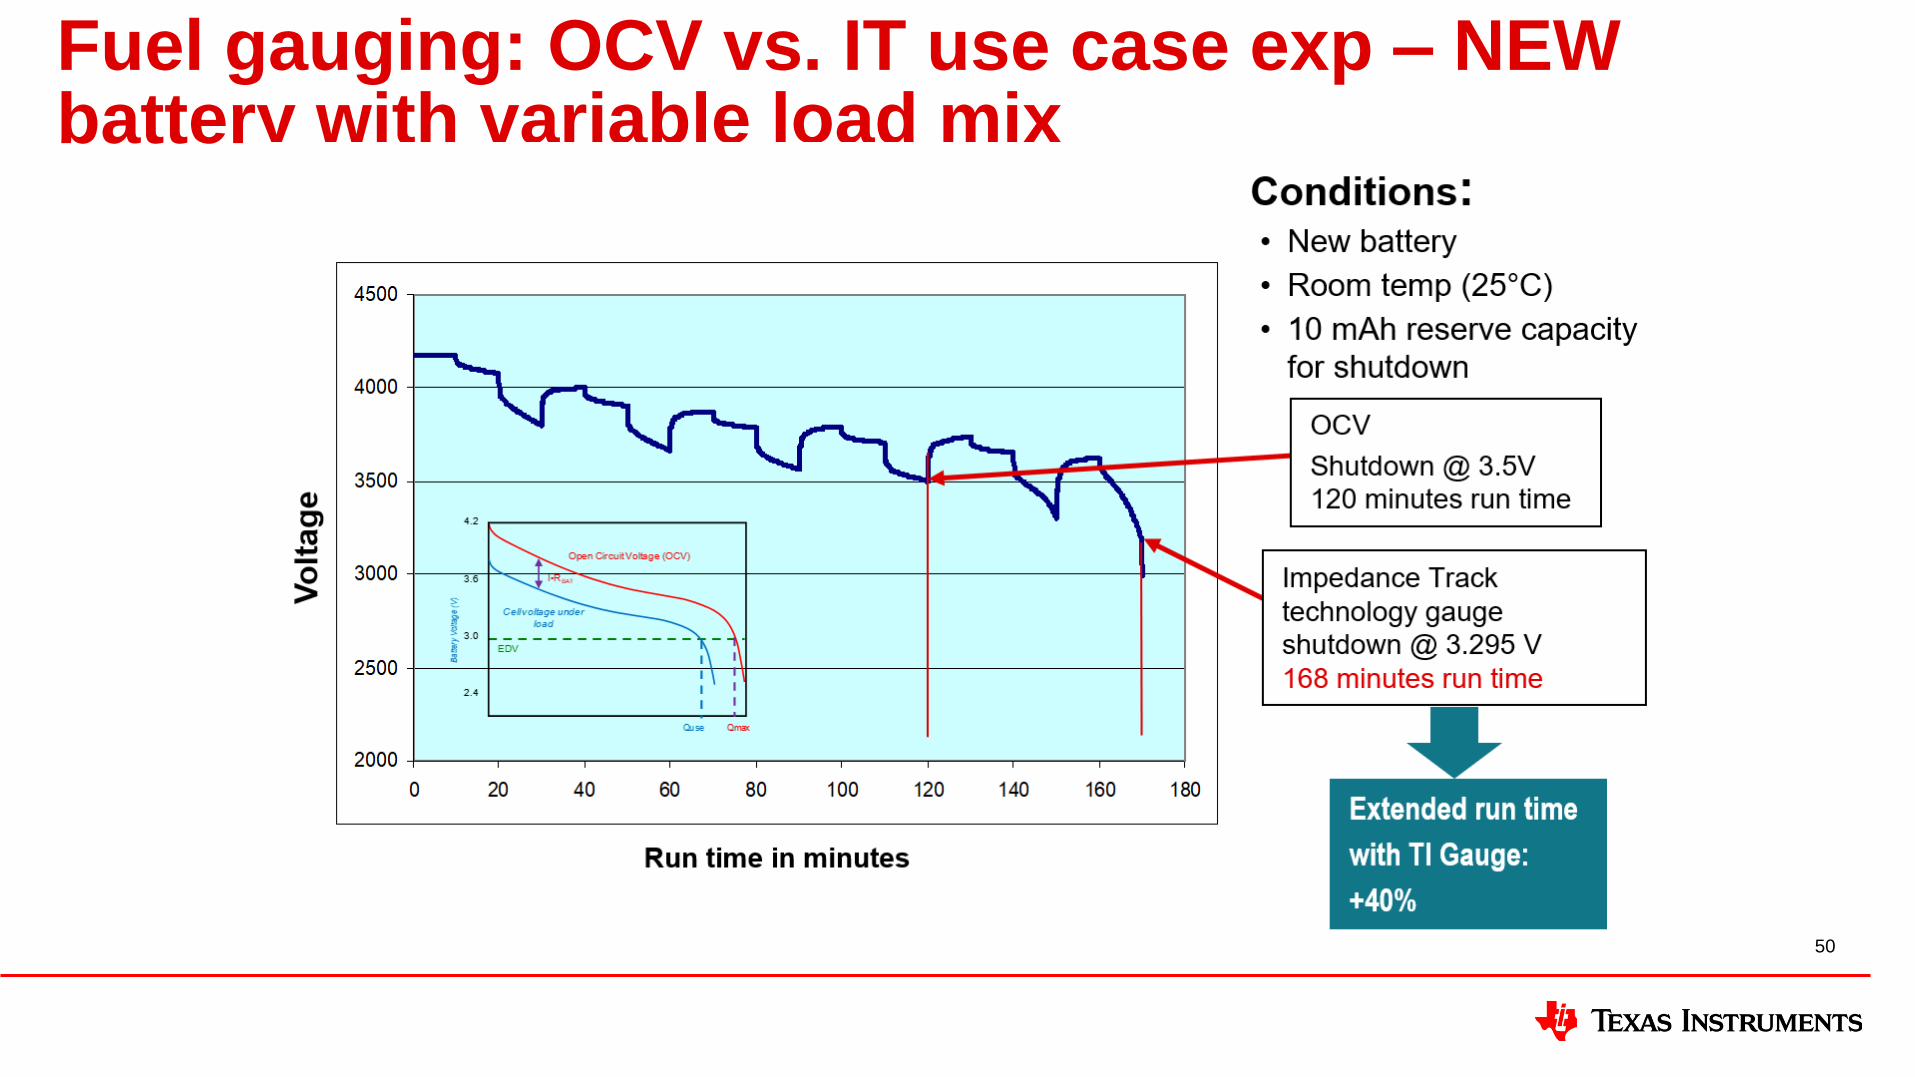
Fuel gauging: OCV vs. IT use case exp – NEW battery with variable load mix
50
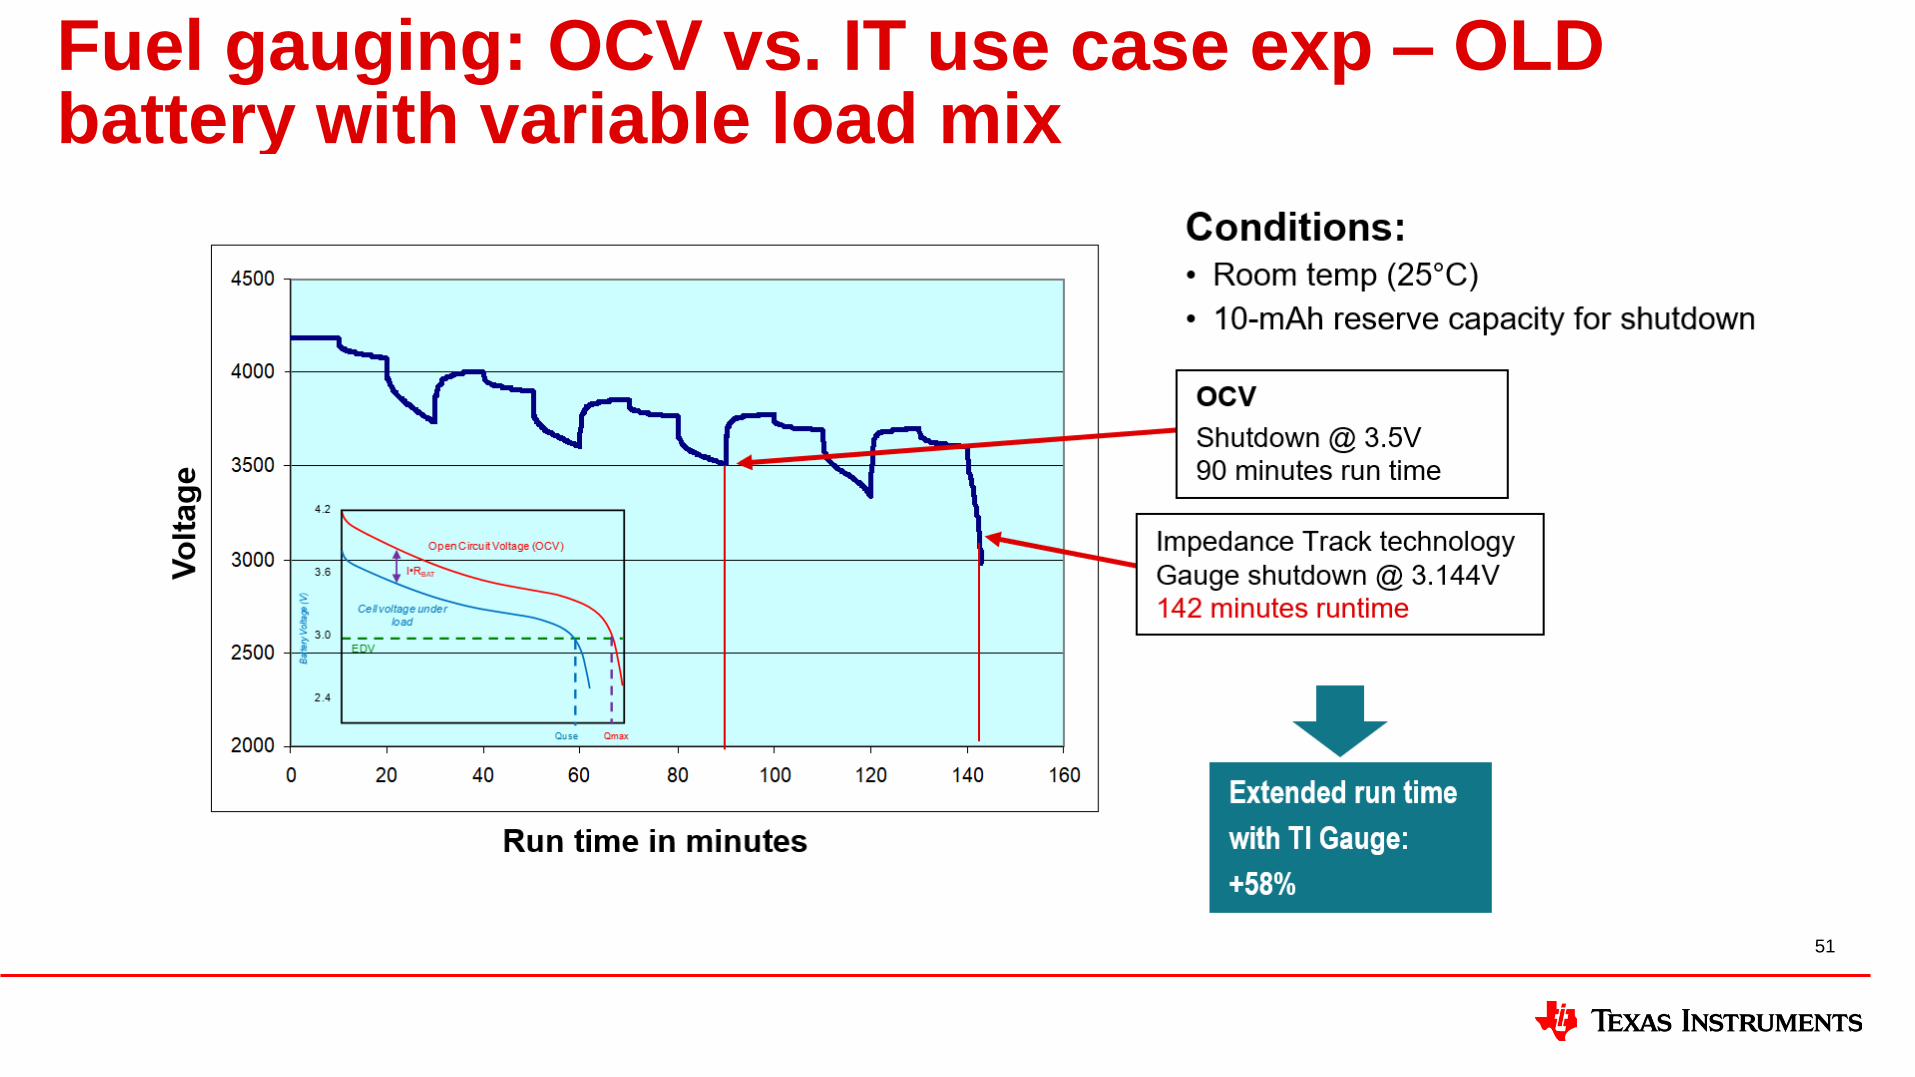
Fuel gauging: OCV vs. IT use case exp – OLD battery with variable load mix
51
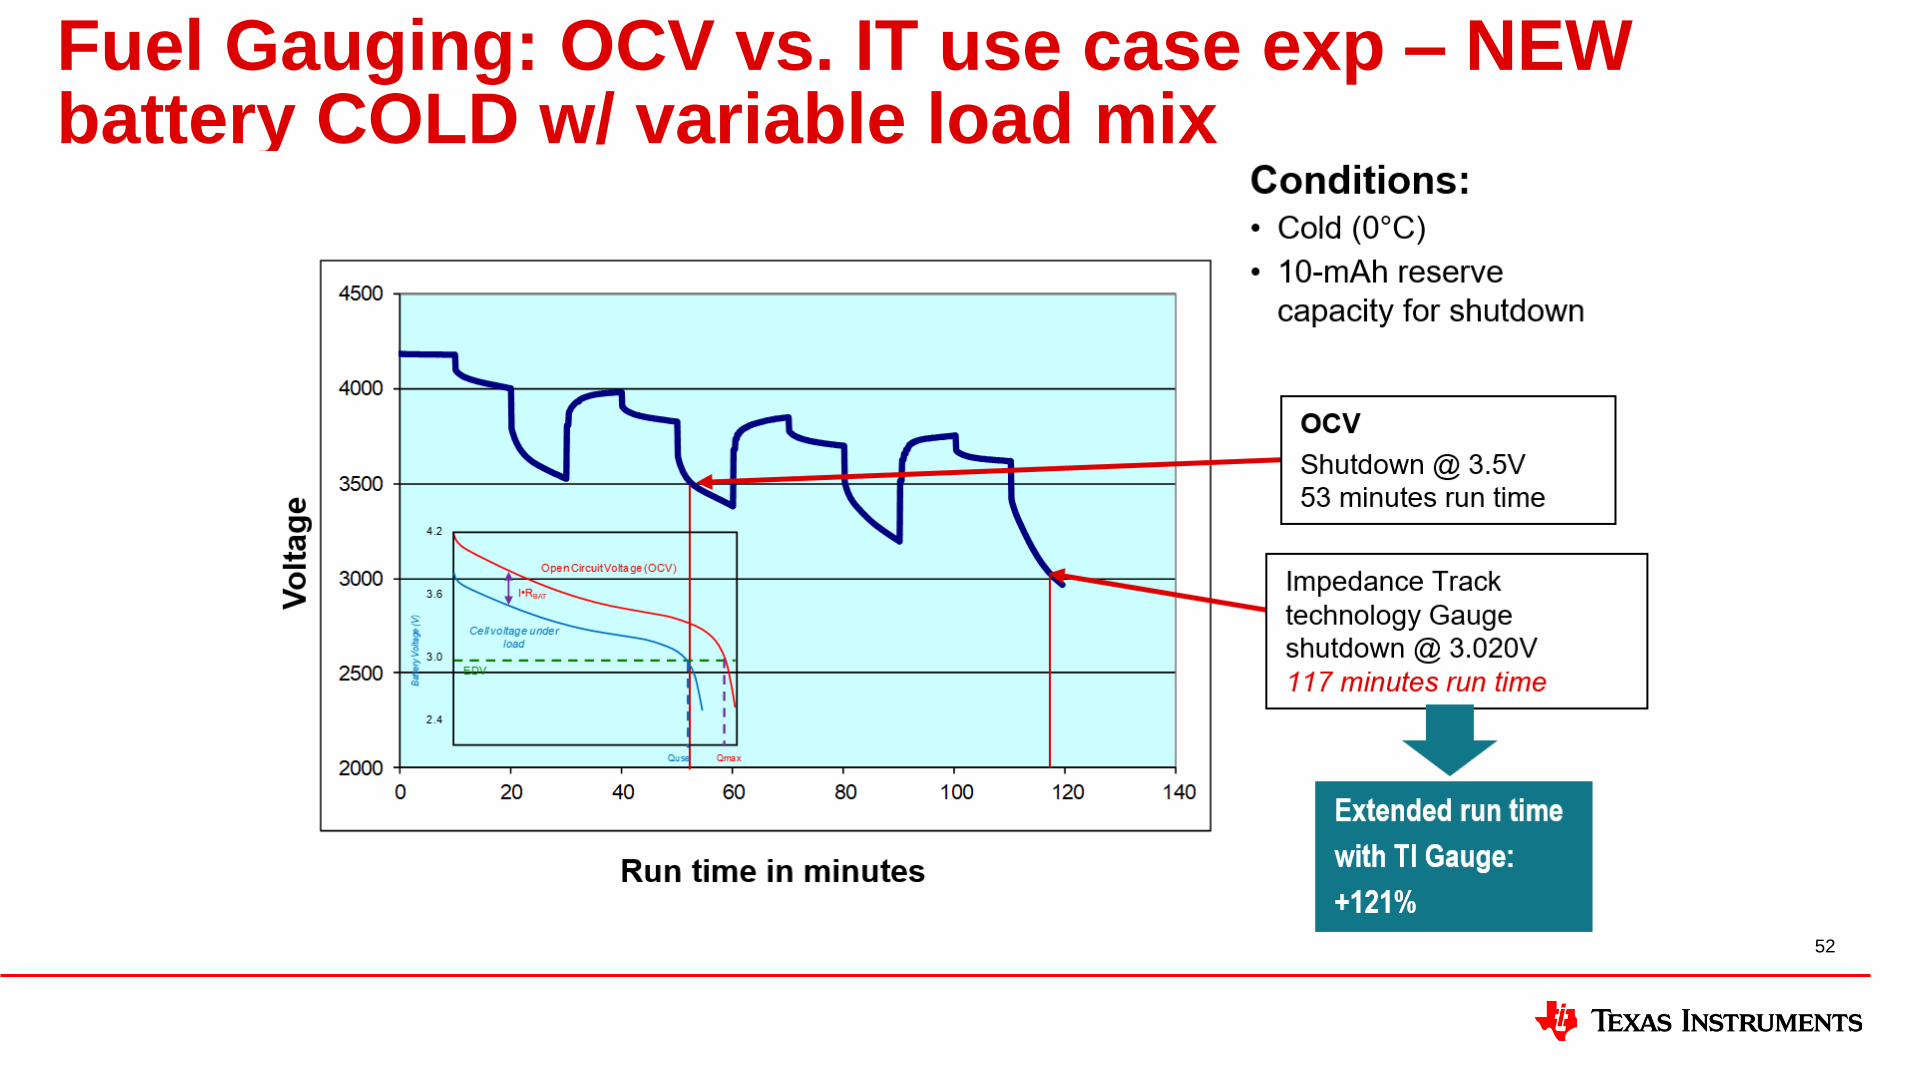
Fuel Gauging: OCV vs. IT use case exp – NEW battery COLD w/ variable load mix
52
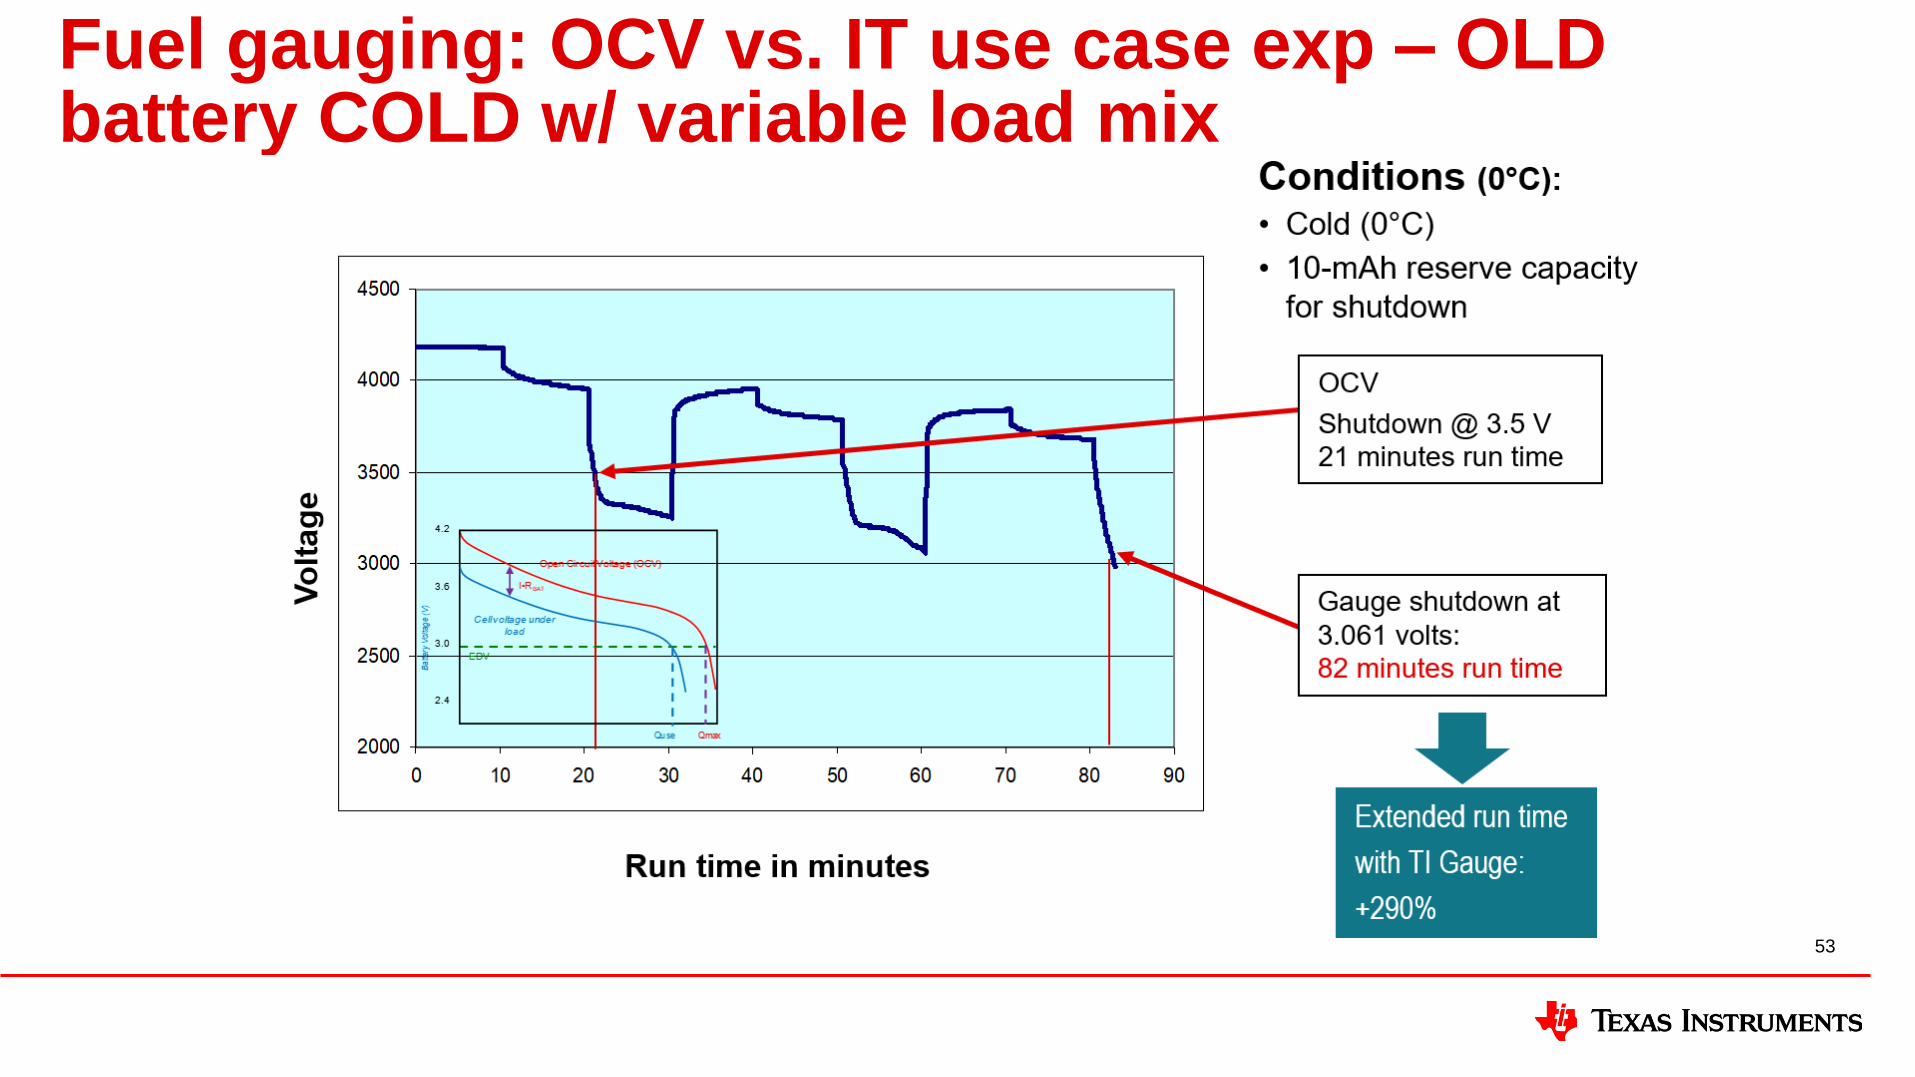
Fuel gauging: OCV vs. IT use case exp – OLD battery COLD w/ variable load mix
53

54
SLYP812

IMPORTANT NOTICE AND DISCLAIMERTI PROVIDES TECHNICAL AND RELIABILITY DATA (INCLUDING DATA SHEETS), DESIGN RESOURCES (INCLUDING REFERENCE DESIGNS), APPLICATION OR OTHER DESIGN ADVICE, WEB TOOLS, SAFETY INFORMATION, AND OTHER RESOURCES “AS IS” AND WITH ALL FAULTS, AND DISCLAIMS ALL WARRANTIES, EXPRESS AND IMPLIED, INCLUDING WITHOUT LIMITATION ANY IMPLIED WARRANTIES OF MERCHANTABILITY, FITNESS FOR A PARTICULAR PURPOSE OR NON-INFRINGEMENT OF THIRD PARTY INTELLECTUAL PROPERTY RIGHTS.These resources are intended for skilled developers designing with TI products. You are solely responsible for (1) selecting the appropriate TI products for your application, (2) designing, validating and testing your application, and (3) ensuring your application meets applicable standards, and any other safety, security, regulatory or other requirements.These resources are subject to change without notice. TI grants you permission to use these resources only for development of an application that uses the TI products described in the resource. Other reproduction and display of these resources is prohibited. No license is granted to any other TI intellectual property right or to any third party intellectual property right. TI disclaims responsibility for, and you will fully indemnify TI and its representatives against, any claims, damages, costs, losses, and liabilities arising out of your use of these resources.TI’s products are provided subject to TI’s Terms of Sale or other applicable terms available either on ti.com or provided in conjunction with such TI products. TI’s provision of these resources does not expand or otherwise alter TI’s applicable warranties or warranty disclaimers for TI products.TI objects to and rejects any additional or different terms you may have proposed. IMPORTANT NOTICE
Mailing Address: Texas Instruments, Post Office Box 655303, Dallas, Texas 75265Copyright © 2021, Texas Instruments Incorporated
Related Documents