Battery Electric Bus Evaluation Results Leslie Eudy Matt Jeffers 2017 APTA Bus and Paratransit Conference, Reno, NV May 8, 2017

Welcome message from author
This document is posted to help you gain knowledge. Please leave a comment to let me know what you think about it! Share it to your friends and learn new things together.
Transcript

Battery Electric Bus Evaluation Results
Leslie Eudy
Matt Jeffers2017 APTA Bus and Paratransit Conference, Reno, NV
May 8, 2017

2
NREL Snapshot
• Leading clean-energy innovation for more than 37 years
• ~1,760 employees with world-class facilities
• Campus is a living model of sustainable energy
• Economic impact at $872M nationwide
• Owned by the Department of Energy and Operated by the Alliance for Sustainable Energy
Dedicated Solely to Advancing Energy Efficiency and Renewable Energy

3
• 3rd Party evaluation of advanced technology in real-world service
• Established evaluation protocol provides consistent data collection and analysis for comparison
• Provide feedback to government (federal, state, local) to understand status and continue funding necessary R&D
• Share information with the transit industry that will aid in purchase decisions on the technologyo Unbiased data in common format
o Comparison to baseline technology
NREL Role in ZEB Evaluation

4
Evaluation Objectives and DOE/FTA Targets
Current Targets2 Units 2016 Target Ultimate Target
Bus lifetime Years/miles 12/500,000 12/500,000
Powerplant lifetime Hours 18,000 25,000
Bus availability % 85 90
Roadcall frequency
(bus/fuel cell system)
Miles between
roadcall3,500/15,000 4,000/20,000
Operation timeHours per day/
days per week20/7 20/7
Maintenance cost $/mile 0.75 0.40
Fuel economyMiles per diesel
gallon equivalent8 8
• Validate zero emission buses1 (ZEB) performance and cost compared to DOE/DOT targets and conventional technologies
• Document progress and “lessons learned” on implementing ZEBs in transit operations to address barriers to market acceptance
1 ZEBs can be battery electric buses (BEB) or fuel cell electric buses (FCEB)2 Fuel Cell Technologies Program Record # 12012, Sep 2012, www.hydrogen.energy.gov/pdfs/12012_fuel_cell_bus_targets.pdf

5
Current Status of BEBsFleet
Minimum
Fleet
Maximum
Fleet
Average
Bus lifetime (years) 0.8 2.9 2.3
Bus lifetime (miles) 17,960 85,274 64,045
Bus availability (%) 74 97 88
Charges (number per day) 1 31 8
Roadcall frequency – bus (MBRC) 5,656
Roadcall frequency – propulsion system 15,023
Roadcall frequency – energy storage
system320,496
Operation time per day (hours) <1 22.4 9
Scheduled and unscheduled maintenance
cost ($/mile)10.13 0.29 0.19
Fuel economy (miles per DGE) 16.09 18.72 17.29
Data from 2 fleets – 15 total buses
1 Buses are currently under warranty – all advanced technology maintenance is handled by OEM

6
Foothill Transit, West Covina, California
FCEB Identifier BEBNumber of Buses 12Bus OEM ProterraBus length/height 35 ft / 126 in
Charging strategy Fast-charge, on-route
MotorPermanent magnet,
UQM, PP220
Rated Power (kW) 220 (peak)Energy Storage - OEM Lithium-titanate
Capacity 368 volts, 88 kWh
Foothill Transit BEB Specifications
BEBs service Start: April 2014
Baseline comparison:
NABI CNG, 42-ft

7
Foothill Transit BEB Efficiency
BEB equivalent fuel economy 4x higher than CNG buses. High cost of electricity results in higher cost per mile.
0
10
20
30
40
50
60
70
80
90
100
0
2
4
6
8
10
12
14
16
18
20
Ave
rag
e H
igh
Te
mp
era
ture
( F
)
Fu
el E
co
no
my (
mi/
dg
e)
BEB (35-ft) CNG (42-ft) Avg High Temp (°F)
8
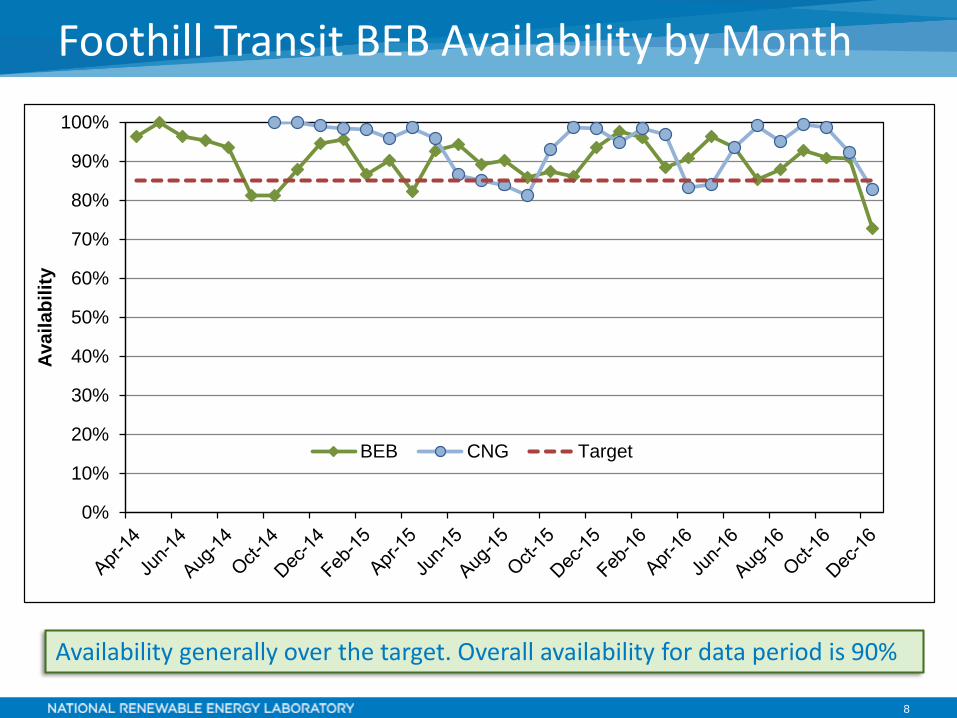
Foothill Transit BEB Availability by Month
Availability generally over the target. Overall availability for data period is 90%
0%
10%
20%
30%
40%
50%
60%
70%
80%
90%
100%
Ava
ila
bil
ity
BEB CNG Target

9
Foothill Transit BEB Availability - Overall
Bus issues are the primary reasons for unavailability, followed by electric drive
BEB Fleet Number %Available 8,550 90Bus 527 5.6PM 25 0.3Electric Drive 263 2.8Charging issues 23 0.2ESS 55 0.6Transmission 52 0.5Total days 9,495 100
Days Available90.0%
Bus5.6%
PM0.3%
Electric drive2.8%
Charging issues0.2%
ESS0.6%
Transmission0.5%
Unavailable10.0%
10
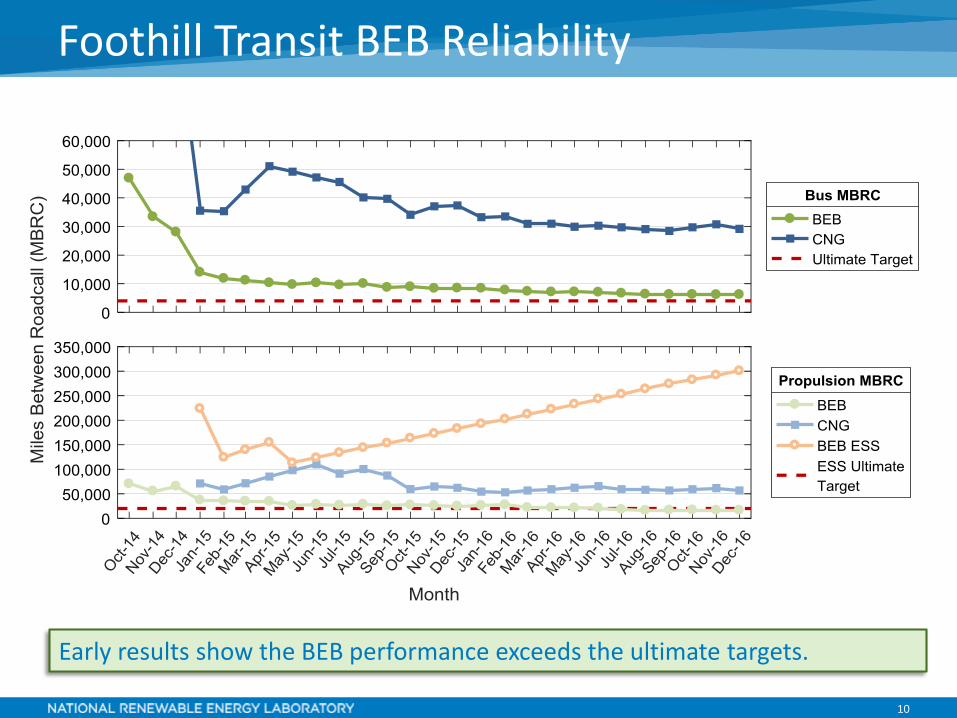
Foothill Transit BEB Reliability
Early results show the BEB performance exceeds the ultimate targets.

11
• BEB in service date: April 2016
• 3 Proterra, 40-ft Catalyst buses and fast charging station (8 more on order)
• Baseline buses: diesel, diesel hybrid, and electric trolley buses
King County Metro, Seattle, WA (TIGGER)
FCEB Identifier BEBNumber of Buses 3Bus OEM ProterraBus length/height 40 ft / 126 in
Charging strategy Fast-charge, on-route
MotorPermanent magnet,
UQM, PP220Rated Power (kW) 220 (peak)
Energy Storage Lithium-titanate
Capacity 331 volts, 106 kWh
KC Metro BEB Specifications

12
KC Metro BEB Efficiency
BEB equivalent fuel economy 3x higher than diesel buses and 2.6x higher than diesel hybrid buses. High cost of electricity results in higher cost per mile.

13
KC Metro Availability by Month
Overall availability for data period: BEB 84% Diesel hybrids 92%Diesel 88% Trolley 87%

14
KC Metro Availability - Overall
Primary reasons for unavailability
BEB: Bus related issues, followed by electric drive
Hybrid and diesel buses: Bus related issues
Trolley buses: current collection, followed by bus related issues

15
KC Metro Reliability
BEB bus-related MBRC increasing. To date, no ESS related roadcalls have occurred.

16
Remaining Challenges and Barriers for ZEBs
Specific to BEBs
• Plan/build of opportunity charging stations & garage chargers
• Select appropriate routes for technology – fast-charge, in-depot charging
• Address challenge of electric rates and demand charges
• Scale up for larger fleets – how best to accommodate plug in charging/ parking
• Training transition for maintenance staff
• Develop supply chain for parts

Web site: http://www.nrel.gov/hydrogen/proj_fc_bus_eval.html
Contact Info:
Leslie Eudy
303-275-4412
Matt Jeffers
303-275-3778

Fuel Cell Buses in Public Transit
Matthew Post
2017 APTA Bus and Paratransit Conference, Reno, NV
May 8, 2017

19
Evaluation Objectives and DOE/FTA Targets
Current Targets* Units 2016 Target Ultimate Target
Bus lifetime Years/miles 12/500,000 12/500,000
Powerplant lifetime Hours 18,000 25,000
Bus availability % 85 90
Roadcall frequency
(bus/fuel cell system)
Miles between
roadcall3,500/15,000 4,000/20,000
Operation timeHours per day/
days per week20/7 20/7
Maintenance cost $/mile 0.75 0.40
Fuel economyMiles per diesel
gallon equivalent8 8
• Validate fuel cell electric bus (FCEB) performance and cost compared to DOE/DOT targets and conventional technologies
• Document progress and “lessons learned” on implementing fuel cell systems in transit operations to address barriers to market acceptance
* Fuel Cell Technologies Program Record # 12012, Sep 2012, www.hydrogen.energy.gov/pdfs/12012_fuel_cell_bus_targets.pdf

20
FCEB Specifications
ACT ZEBA
SL AFCB
Specifications for FCEBs included in data summaryFCEB Identifier ACT ZEBA SL AFCB UCI AFCBTransit agency AC Transit SunLine UCI
Location Oakland, CAThousand Palms, CA
Irvine, CA
Number of buses 13 4 1Bus OEM Van Hool ElDorado NationalBus length/height 40 ft / 136 in. 40 ft / 140 in.Fuel cell OEM UTC Power Ballard
Model PureMotion 120 Fcvelocity–HD6Power (kW) 120 150
Hybrid systemSiemens ELFA, Van
Hool integrationBAE Systems HybriDrive
Design strategy Fuel cell dominant Fuel cell dominant
Energy storage – OEM EnerDel A123
Type Li-ion Nanophosphate Li-ion
Capacity 17.4 kWh 11 kWhNumber of cylinders 8 8
Capacity (kg)/pressure (bar) 40 / 350 50 / 350
Technology readiness level 7 7
OEM = original equipment manufacturerACT ZEBA = AC Transit Zero Emission Bay AreaSL AFCB = SunLine American Fuel Cell BusUCI = University of California at Irvine
UCI AFCB

21
Current Status of FCEBsFleet
Minimum
Fleet
Maximum
Fleet
Average
Bus lifetime (years) 1.3 6.4 4.7
Bus lifetime (miles) 32,485 167,352 118,989
Power plant lifetime (hours) 3,589 23,423 13,801
Bus availability (%) 44 93 76
Fuel fills (number per day) 1 1 1
Roadcall frequency – bus (MBRC) 4,710
Roadcall frequency – propulsion 8,146
Roadcall frequency – fuel cell system 20,705
Operation time (average hours per day) 7.4 13.7 11.8
Scheduled and unscheduled maintenance
cost ($/mile)10.46 1.61 1.03
Range (miles) 215 274 247
Fuel economy (miles per DGE) 5.66 7.22 6.51
Data Summary from 3 fleets – 18 total buses.
1 Buses from two fleets are still under warranty, although most of the maintenance is handled by transit staff

22
FC Powerplant Life
0
5,000
10,000
15,000
20,000
25,000
30,000
1 2 3 4 5 6 7 8 9 10 11 12 13 14 15 16 17 18
To
tal H
ou
rs
Total hours accumulated on each FCPP as of 2/28/17
Top fuel cell powerplant (FCPP) >23,800 hours, surpassing DOE/DOT 2016 target; 67% of FCPPs (12) more than 15,000 hours
In-service FCPPAverage: 14,332
DOE/DOT 2016 Target: 18,000
DOE/DOT Ultimate Target: 25,000
In-service FCPPs ACT ZEBA SL AFCB UCI AFCB

23
0
10
20
30
40
50
60
70
80
90
100
Ja
n-1
5
Feb
-15
Ma
r-1
5
Apr-
15
Ma
y-1
5
Ju
n-1
5
Ju
l-1
5
Au
g-1
5
Se
p-1
5
Oct-
15
No
v-1
5
De
c-1
5
Ja
n-1
6
Feb
-16
Ma
r-1
6
Ap
r-1
6
Ma
y-1
6
Ju
n-1
6
Ju
l-1
6
Au
g-1
6
Se
p-1
6
Oct-
16
No
v-1
6
De
c-1
6
Ava
ila
bil
ity (
%)
FCEB FC System only 2016 Target DOE/FTA Ultimate Target
Availability
Monthly bus availability
Availability = planned operation days compared to actual operation days
2016 SummaryAverage availability: 79%FCPP Availability: 94%
2015 SummaryAverage availability: 75%FCPP Availability: 86%
24
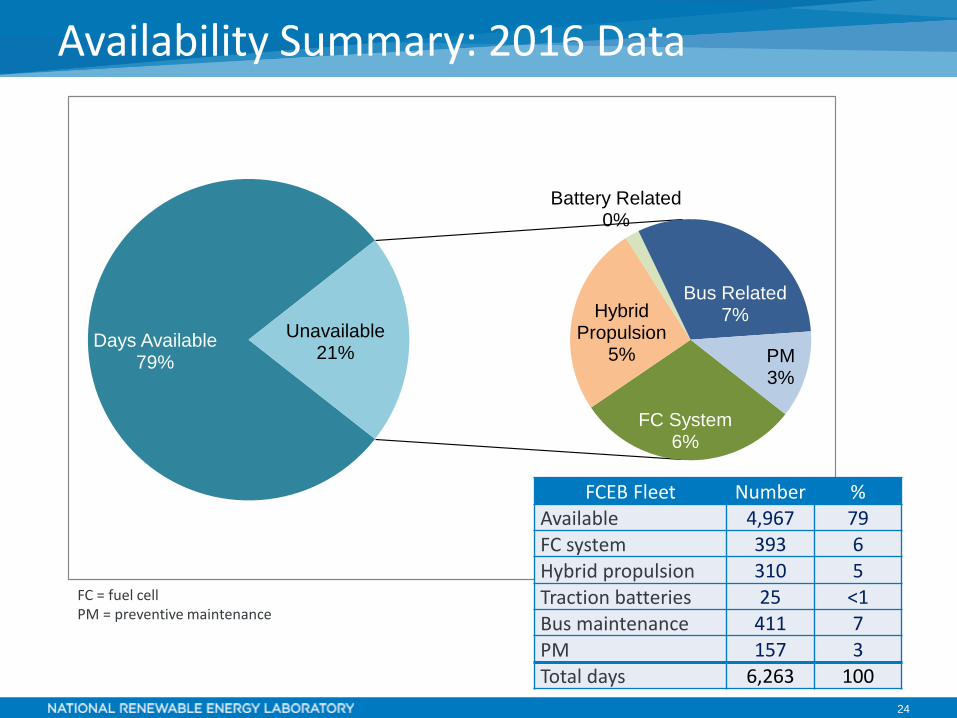
Availability Summary: 2016 Data
PM = preventive maintenanceDays Available
79%
FC System6%
Hybrid Propulsion
5%
Battery Related0%
Bus Related7%
PM3%
Unavailable21%
FCEB Fleet Number %Available 4,967 79FC system 393 6Hybrid propulsion 310 5Traction batteries 25 <1Bus maintenance 411 7PM 157 3Total days 6,263 100
FC = fuel cellPM = preventive maintenance

25
Monthly Fuel Economy Compared to Baseline
0.00
1.00
2.00
3.00
4.00
5.00
6.00
7.00
8.00
Fu
el E
co
no
my (
mi/D
GE
)
FCEB Diesel CNG
mpDGE = miles per diesel gallon equivalent
Drop in fuel economy over time could be due to several factors: degradation of fuel cells, changes in routes used, changes in hybrid system calibration

26
0
5,000
10,000
15,000
20,000
25,000
Mil
es
be
twe
en
ro
ad
ca
ll
FCEB Bus MBRC FCEB FC System MBRC
2016 FC System MBRC Target
Ultimate Bus MBRC Target
2016 Bus MBRC Target
Ultimate FC System MBRC Target
FCEB Reliability
– FCEB reliability surpassed ultimate targets in 2015– Maintenance staff becoming more familiar with system, applying new
tools to anticipate and fix issues before they fail in service

27
FCEB Fueling
Fueling Experience
• Dispenser can be located in the fueling aisle with other services
• Average fueling time: 18 minutes
• Average fill amount: 20 kilograms

28
Remaining Challenges and Barriers for FCEBs
Specific to FCEBs
• Increase durability and reliability of components
• Continue transition of build process to OEM
• Addition of fueling infrastructure
• Develop robust supply chain for components and parts to lower cost and downtime
o Multiple component suppliers to stabilize supply
o Standardized with conventional bus components to lower cost
• Establish support centers for advanced technology components
• Increase learning curve for maintenance staff
o Develop training specific to FCEBs and incorporate in traditional classes
o Provide tools to agencies for monitoring and troubleshooting issues
• Reduce cost, both capital and operating

Web site: http://www.nrel.gov/hydrogen/proj_fc_bus_eval.html
Contact Info:
Matthew Post
303-275-3829
Related Documents


