ORIGINAL ARTICLE Batch sorption–desorption of As(III) from waste water by magnetic palm kernel shell activated carbon using optimized Box–Behnken design Chinedum Anyika 2 • Nur Asilayana Mohd Asri 1 • Zaiton Abdul Majid 1 • Jafariah Jaafar 1 • Adibah Yahya 2 Received: 25 March 2017 / Accepted: 29 August 2017 / Published online: 8 September 2017 Ó The Author(s) 2017. This article is an open access publication Abstract In this study, we converted activated carbon (AC) into magnetic activated carbon (MAC), which was established to have removed arsenic (III) from wastewater. Arsenic (III) is a toxic heavy metal which is readily soluble in water and can be detrimental to human health. The MAC was prepared by incorporating Fe 3 O 4 into the AC by using Fe 3 O 4 extracted from a ferrous sulfate solution, designated: magnetic palm kernel shell from iron suspension (MPKSF). Batch experiments were conducted using two methods: (1) one-factor-at-a-time and (2) Box–Behnken statistical analysis. Results showed that the optimum con- ditions resulted in 95% of As(III) removal in the wastew- ater sample. The adsorption data were best fitted to the Langmuir isotherm. The adsorption of As(III) onto the MPKSF was confirmed by energy dispersive X-ray spec- trometry analysis which detected the presence of As(III) of 0.52% on the surface of the MPKSF. The Fourier transform infrared spectroscopy analysis of the MPKSF–As presented a peak at 573 cm -1 , which was assigned to M–O (metal– oxygen) bending, indicating the coordination of As(III) with oxygen through the formation of inner-sphere com- plexation, thereby indicating a covalent bonding between the MPKSF functional groups and As(III). The findings suggested that the MPKSF exhibited a strong capacity to efficiently remove As(III) from wastewater, while the desorption studies showed that the As(III) was rigidly bound to the MPKSF thereby eliminating the possibility of secondary pollution. Keywords As(III) Sorption Desorption Waste water treatment Magnetic palm kernel shell activated carbon Introduction Removal of contaminants such as arsenic (As) from wastewater by adsorption mechanisms remains the most effective method (Elizalde-Gonza ´lez et al. 2001). Most studies in the field of adsorption for the removal of heavy metals from water have mainly focused on the use of AC, activated alumina, sand impregnated with iron, polymer resins, hydrous ferric oxide and natural ores (Addo Ntim and Mitra 2011). Although AC has been found to be more effective relative to the other adsorbents mentioned above, especially for the removal of heavy metals from aqueous solutions, with percentage removal ranging from 82 to 96% (Ribeiro et al. 2006), this technique may not be adequate when it comes to a heavy metal like As(III) which is known to be highly soluble in water. Arsenic exists in two dif- ferent oxidation states (1) arsenite, As(III) and (2) arsenate, As(V). As(III) is different from As(V) in a number of ways. Firstly, difficulties arise when it comes to the removal of As(III) from wastewater compared to arsenate As(V) due to its high solubility in the aqueous environment, hence As(III) which is the most toxic is also the most difficult to remove from water (Pattanayak et al. 2000). Secondly, whereas As(V) is mostly removed by outer-sphere & Zaiton Abdul Majid [email protected]; [email protected] 1 Department of Chemistry, Faculty of Science, Universiti Teknologi, Malaysia, 81310 Johor Bahru, Malaysia 2 Environmental Biotechnology Laboratory, Faculty of Biosciences and Medical Engineering, Universiti Teknologi, Malaysia, 81310 Johor Bahru, Malaysia 123 Appl Water Sci (2017) 7:4573–4591 https://doi.org/10.1007/s13201-017-0610-9

Welcome message from author
This document is posted to help you gain knowledge. Please leave a comment to let me know what you think about it! Share it to your friends and learn new things together.
Transcript

ORIGINAL ARTICLE
Batch sorption–desorption of As(III) from waste waterby magnetic palm kernel shell activated carbon using optimizedBox–Behnken design
Chinedum Anyika2• Nur Asilayana Mohd Asri1 • Zaiton Abdul Majid1
•
Jafariah Jaafar1• Adibah Yahya2
Received: 25 March 2017 / Accepted: 29 August 2017 / Published online: 8 September 2017
� The Author(s) 2017. This article is an open access publication
Abstract In this study, we converted activated carbon
(AC) into magnetic activated carbon (MAC), which was
established to have removed arsenic (III) from wastewater.
Arsenic (III) is a toxic heavy metal which is readily soluble
in water and can be detrimental to human health. The MAC
was prepared by incorporating Fe3O4 into the AC by using
Fe3O4 extracted from a ferrous sulfate solution, designated:
magnetic palm kernel shell from iron suspension
(MPKSF). Batch experiments were conducted using two
methods: (1) one-factor-at-a-time and (2) Box–Behnken
statistical analysis. Results showed that the optimum con-
ditions resulted in 95% of As(III) removal in the wastew-
ater sample. The adsorption data were best fitted to the
Langmuir isotherm. The adsorption of As(III) onto the
MPKSF was confirmed by energy dispersive X-ray spec-
trometry analysis which detected the presence of As(III) of
0.52% on the surface of the MPKSF. The Fourier transform
infrared spectroscopy analysis of the MPKSF–As presented
a peak at 573 cm-1, which was assigned to M–O (metal–
oxygen) bending, indicating the coordination of As(III)
with oxygen through the formation of inner-sphere com-
plexation, thereby indicating a covalent bonding between
the MPKSF functional groups and As(III). The findings
suggested that the MPKSF exhibited a strong capacity to
efficiently remove As(III) from wastewater, while the
desorption studies showed that the As(III) was rigidly
bound to the MPKSF thereby eliminating the possibility of
secondary pollution.
Keywords As(III) � Sorption � Desorption � Waste water
treatment � Magnetic palm kernel shell activated carbon
Introduction
Removal of contaminants such as arsenic (As) from
wastewater by adsorption mechanisms remains the most
effective method (Elizalde-Gonzalez et al. 2001). Most
studies in the field of adsorption for the removal of heavy
metals from water have mainly focused on the use of AC,
activated alumina, sand impregnated with iron, polymer
resins, hydrous ferric oxide and natural ores (Addo Ntim
and Mitra 2011). Although AC has been found to be more
effective relative to the other adsorbents mentioned above,
especially for the removal of heavy metals from aqueous
solutions, with percentage removal ranging from 82 to 96%
(Ribeiro et al. 2006), this technique may not be adequate
when it comes to a heavy metal like As(III) which is known
to be highly soluble in water. Arsenic exists in two dif-
ferent oxidation states (1) arsenite, As(III) and (2) arsenate,
As(V). As(III) is different from As(V) in a number of ways.
Firstly, difficulties arise when it comes to the removal of
As(III) from wastewater compared to arsenate As(V) due to
its high solubility in the aqueous environment, hence
As(III) which is the most toxic is also the most difficult to
remove from water (Pattanayak et al. 2000). Secondly,
whereas As(V) is mostly removed by outer-sphere
& Zaiton Abdul Majid
[email protected]; [email protected]
1 Department of Chemistry, Faculty of Science, Universiti
Teknologi, Malaysia, 81310 Johor Bahru, Malaysia
2 Environmental Biotechnology Laboratory, Faculty of
Biosciences and Medical Engineering, Universiti Teknologi,
Malaysia, 81310 Johor Bahru, Malaysia
123
Appl Water Sci (2017) 7:4573–4591
https://doi.org/10.1007/s13201-017-0610-9

complexation, i.e., by electrostatic attraction (Cheng et al.
2016), As(III) can be removed by inner-sphere complexa-
tion, which is a covalent bonding as demonstrated in this
study.
On the other hand, the long-term effects of drinking
water contaminated with arsenic include cancer of the skin,
lung, bladder, and kidney, skin thickening, neurological
disorders, muscular weakness and nausea (Jain and Ali
2000; WHO 1981). This has led to numerous studies
regarding the improvement of AC by magnetic modifica-
tion to increase its capacity to remove heavy metal con-
taminants. The MAC adsorbents exhibited magnetic
properties with greater efficiency for the adsorption of
contaminants from aqueous solution (Xu et al. 2010).
Whereas palm kernel shells were used in the production of
AC due to its high carbon content and low organic content
(Daud and Ali 2004), while at the same time high quality
of AC can be synthesized from PKS waste (Adhoum and
Monser 2002; Budinova et al. 2006; Hussein et al. 1996).
One major advantage of the MAC is that it exhibits
magnetic characteristics, in addition to having demon-
strated to be effective for adsorption in dilute solutions,
while its high specific surface area due to the presence of
microporous structure results in greater capacity for the
adsorption of heavy metals (Nakahira et al. 2006). So far,
magnetization has been identified as being potentially
important in improving the sorption characteristics of
organic adsorbents with well-developed structures, i.e., of
woody feedstock such as PKS (Trakal et al. 2016). How-
ever, previous studies on the removal of As(III) from
wastewater employed the use of biochar made from empty
fruit bunch and rice husks (Samsuri et al. 2013), which are
fibrous in nature, unlike the PKS feedstock used in this
study, which is a woody feedstock. Moreover, they used
biochar which is a different material. Another problem with
their study was that they did not carry out a desorption test
to ascertain the stability of the Fe-coated organic adsor-
bents. Further, their study was on competitive adsorption
between As(III) and As(V). Similarly, in the paper by
Payne and Abdel-Fattah (2005) using Fe-coated AC for the
removal of As(III) and As(V) from water, they relied on
commercially procured AC, which had a poorly developed
structure and hence was only able to remove 60% As(III)
from waste water unlike in this study where 95% removal
was achieved by using MPKS which has a well-developed
structure. In addition, they did not look at the magnetic
properties of the Fe-coated AC.
Therefore, the influence of the MAC on the removal of
As(III) from waste water has not been completely eluci-
dated. The objectives of this study are: (1) to prepare
magnetic activated carbon for the removal of arsenic from
water; (2) to optimize the parameters for As(III) sorption
using Box–Behnken design; (3) to study the
sorption–desorption of As(III) onto the prepared magnetic
activated carbon.
Experimental
Chemicals and reagents
Phosphoric acid (H3PO4, 85 wt%, Merck, Germany) was
used to pretreat and impregnate the raw materials. The
chemical reagents for the preparation of magnetic activated
carbon were of three kinds: (1) iron (III) chloride ([96%):
Sigma-Aldrich; (2) iron (II) sulfate (99.5%), Qrec; (3)
sodium hydroxide, Merck Germany. A 1000 ppm stock
solution of arsenite, As(III), was prepared in double dis-
tilled water from 0.05 M sodium arsenite (NaAsO2) pre-
pared by Fluka. Hydrochloric acid (HCl) and sodium
hydroxide (NaOH) were used to adjust the solution pH of
As(III).
Experimental methods
Material development and characterization
The raw PKSs (100 g) used in this study were obtained
from a palm oil estate located at Jalan Sawah, Pekan
Nenas, Johor Bahru, Malaysia. Sample pretreatment was
carried out by weighing out a 50-g portion of the raw PKS,
which was ground and sieved to particle sizes in the range
of 75–250 lm, then soaked and impregnated with 10 mL
of 30 wt% of phosphoric acid, H3PO4, at room temperature
with PKS-to-acid ratio of 1:1. The sample was left
impregnated for 24 h, and afterwards it was washed with
distilled water and dried at room temperature.
A 10-g portion of the pre-treated PKSs was transferred
into five conical flasks containing different concentrations
of H3PO4, i.e., 10, 20, 30, 40 and 50% wt/wt, respec-
tively. Similarly, the pre-treated PKS was treated again
using dilute acid (10, 20 and 30% wt/wt H3PO4). This
was done to determine the appropriate surface area at
which if the surface area obtained by using dilute acid
was high, then the use of concentrated acid can be
reduced and the experimental costs will be less. This ratio
(1:1) implied that 10 g of the raw PKSs was soaked in
10 g of H3PO4 for 24 h. The excess acid was then filtered
and the soaked PKSs were placed in a muffle furnace and
heated at 200 �C for 30 min to initiate the carbonization
process.
Subsequently, the temperature of the furnace was
increased to the range of 400–550 �C and held for 2 h
followed by cooling to room temperature. Afterwards, the
samples were thoroughly washed and rinsed using vacuum
filtration with hot distilled water to remove all the excess
4574 Appl Water Sci (2017) 7:4573–4591
123

acid until the pH of the filtrate was approximately 7. The
samples were then dried in the oven at a temperature of
110 �C for 24 h. The AC samples were then stored in
desiccators for further characterization and adsorption
studies. The preparation of the MPKSF was achieved by
utilizing a suspension of ferric chloride/ferrous sulfate. The
characterization experiments were conducted on the
MPKSF by Fourier transform infrared spectroscopy
(FTIR), X-ray diffraction (XRD), particle size analysis,
nitrogen adsorption analysis, scanning electron microscopy
(SEM), field emission scanning electron microscopy
(FESEM), energy dispersive X-ray spectrometry (EDX)
and the point of zero charge (pHpzc) was also determined
as part of the characterization. The magnetic saturation of
the MAC sample was characterized using vibrating sample
magnetometer (VSM).
Batch experimental procedure and testing methods
Batch experiments were carried out by grinding the
MPKSF into fine powder of 75 lm particle sizes. The stock
solution was prepared by diluting 0.05 M of sodium
arsenite (NaAsO2) with distilled water up to a concentra-
tion of 1000 ppm to give a 1000 ppm arsenite (As(III))
stock solution. The pH of the solution was then adjusted
using hydrochloric acid (HCl) until it reached a pH of 7. A
0.05–0.30 g portion of the powdered MPKSF was placed
into a conical flask together with 200 mL arsenite solution.
The solution was then shaken for 24 h at different tem-
peratures ranging from 10 to 40 �C. The contact time in the
shaker was also varied ranging from 5 to 720 min. The
initial concentration of the arsenite solution was varied
ranging from 5 to 100 lg L-1. This was done to mimic the
drinking water standard. The preliminary experiment was
conducted at an equilibrium time of 180 min. After that,
the suspension was filtered through 0.45-lm pore size
membrane filter.
The preliminary study on the adsorption of As(III) on
MPKSF, was divided into 6 factors and are described
briefly namely (1) effect of contact time, which was found
to be 180 min and established to be the time taken to reach
adsorption–desorption equilibrium; (2) effect of initial
As(III) concentration, which was found to be 5–70 lg L-1
with percentage removal of 87.58–89.42%; (3) effect of
adsorbent dosage, was found to be 0.3 g, which resulted in
an increase in percentage removal of As(III) from 42.17 to
96.58%. This was due to a higher dose of adsorbent utilized
which provides greater proportion of adsorption sites for
As(III) to bind on the MPKSF surface (Yao et al. 2014); (4)
effect of pH, in this case, the effect of the initial solution
pH in the range of 6–8 on the adsorption of As(III) onto the
MPKSF, indicated that the removal of As(III) was better
under pH 6 and 7, (5) effect of temperature, in this case, a
temperature of 30 �C was considered preferable for the
adsorption of the As(III) onto the MPKSF.
The residual arsenic solution was analyzed using gra-
phite furnace atomic absorption spectrometry (GFAAS).
And the same procedures were repeated using a real water
waste sample from Skudai River, Johor Bahru Malaysia,
spiked with arsenite to analyze the percentage of arsenite
removal using MPKSF.
Determination of pHpzc (point of zero charge) of the
samples The pHpzc of both PKSAC and MPKSF was
determined. A 50-mL solution of 0.01 M NaCl was placed
in a closed Erlenmeyer flask. The pH of the solution was
adjusted to achieve a suspension pH of between 2 and 12
by adding 0.1 M HCl or 0.1 M NaOH solutions in ten
conical flasks. Approximately 0.15 g each of the PKSAC
and MPKSF were added and the final pH was measured
after 48 h. The pH of each solution recorded was plotted.
The intersection of pHinitial and pHfinal of the solution was
then taken as the pHpzc.
Desorption procedure of magnetic activated carbon
(MPKSF) The optimum amount of MPKSF loaded with
arsenite (48.08 lg g-1) obtained after the adsorption pro-
cess was then added into a 50 mL of distilled water in a
centrifuge tube. The solution was shaken at 150 rpm and
then agitated at specific time intervals for up to 48 h. The
solution was then centrifuged and the supernatant was
collected for further analysis to examine the concentration
of As(III) desorbed from the MPKSF. The desorption
procedure was repeated three times and the MPKSF
adsorbent was reserved for further analysis.
Graphite furnace atomic absorption spectrometry
(GFAAS) The detection and the concentration of arsen-
ite were conducted by a graphite furnace atomic absorp-
tion spectrometry (GFAAS). The samples were analyzed
in triplicates, to obtain the optimum result of
10–40 lg L-1. A small amount of the sample which was
in the range of 20–100 lL was placed into the graphite
tube manually. Further, the arsenite samples were acidi-
fied with nitric acid to a pH of less than 2. Upon injection
of the samples into the graphite tube, they are vaporized.
Subsequently, the amount of light energy absorbed in the
vapor was considered to be proportional to the atomic
concentration.
Box–Behnken design
In this study, the Box–Behnken design was used to opti-
mize the number of experiments to be conducted with the
Appl Water Sci (2017) 7:4573–4591 4575
123

aim of determining the probable interactions between the
parameters under study and their influence on the adsorp-
tion of As(III) onto the MPKSF. Further characteristics of
the Box–Behnken design has been described elsewhere
(Kumar et al. 2008).
In Table 1, the experimental parameters and a
3-level 5-factorial Box–Behnken experimental design
are presented. This was applied to examine and validate
the adsorption system parameters influencing the
adsorption of As(III) onto the MPKSF. Contact time
(5–720 min), pH (6–8), adsorbent dose (0.05–0.30 g),
initial As(III) concentration (5–100 lg L-1), tempera-
ture (20–40 �C) represent the variable input parameters.
The factor levels (3) were coded as (-1 = low,
0 = medium level or central point, and ?1 = high
level). Response surface methodology (RSM) was
applied to the experimental data using the Design
Expert statistical software version 7.1.6 by Stat-Ease,
Inc., Minneapolis, USA.
The regression equation of the designed experiment was
obtained by applying four models namely linear, interac-
tive, quadratic and cubic models which were fitted to the
experimental data obtained from the design system.
To select the best model, i.e., after the responses have
been recorded, the data were analyzed using three different
tests in order to decide the adequacy of the models stated
above to represent the adsorption process of MPKSF–As.
These validation tests are the sequential model sum of
squares (F test), lack-of-fit test and the model summary
statistics. Further, a quadratic polynomial was used to
explain the relationship between the parameters and As(III)
residual concentration (%).
The second-order polynomial is represented by Eq. (1):
� ¼ b0 þXk
i�1
bixi þXk
i�1
biix2i þ
Xk
1sisj
bijxixj þ e; ð1Þ
where the terms have their established meanings (Ku-
namneni and Singh 2005; Shehzad et al. 2016). A design of
46 tests was formulated.
Results and discussion
Characterization of adsorbents
The characterization results (detailed characterization of
the adsorbent (s) has been described elsewhere, Anyika
et al. 2017) revealed that the MPKSF presented better
characteristics and was therefore selected as the sole
adsorbent for the adsorption studies. It presented a higher
BET surface area of 257 m2 g-1, higher pore volume of
0.1124 cc g-1 and higher magnetic properties with a
magnetic saturation of 49.55 emu g-1. The FTIR spectrum
of the MPKSF exhibited intense OH bending at 1629 cm-1
which can be attributed to the presence of oxygen in the
samples, while the absorption bands at 1093 and 579 cm-1
indicated the presence of C–O stretching and metal–oxy-
gen (M–O) bands due to the interaction of iron and oxygen.
To illustrate that the MPKSF acquired magnetic properties,
the XRD data were analyzed. The MPKSF exhibited the
presence of Fe3O4 at 2h 30.75�, 35.95�, 57.35�, 63.20�from the XRD diffractogram. Similarly, three peaks at 2h19.30�, 43.45�, 54.10� and a peak at 2h 24.40� which can
be assigned to c-Fe2O3 and a-Fe2O3, respectively, were
detected.
The point of zero charge of the MPKSF was determined
to explain the surface charge phenomena as well as the
magnetic properties of the MPKSF. With respect to the
surface charge, the point of zero charge of MPKSF
occurred at pH 5.94. Since As(III) is positively charged, it
is critical for the surface of the MPKSF to be negatively
charged in order for the adsorption process to occur. As the
solution pH is higher than 5.94, the surface of the MPKSF
exhibits greater formation of hydroxide ions. However, at
pH 6 and 7, the MPKSF demonstrated greater adsorption
compared to pH 8. This was presumed to have resulted
from the formation of As(III) precipitate at a higher pH
hence reducing the adsorption efficiency. Additionally, at
higher pH, As(III) has the potential to be oxidized to
As(V), which may significantly reduce the adsorption of
As(III) onto the MPKSF (Vance 2002). In Table 2, the
Table 1 Independent parameters and their levels used for Box–Behnken design
Parameters, unit Factors Levels
-1 0 1
Contact time (min) A 5 362.5 720
pH B 6 7 8
Adsorbent dosage (g) C 0.05 0.17 0.30
Initial As concentration (lg L-1) D 5 52.5 100
Temperature (�C) E 20 30 40
4576 Appl Water Sci (2017) 7:4573–4591
123

initial pH and final pH of the reaction solutions for both
adsorbent samples, PKSAC and MPKSF are presented.
In Fig. 1a, b, a plot of pHfinal versus pHinitial for adsorbent
PKSAC and MPKSF is presented. From the graph, the point
of zero charge (pHpzc) of the sample represents the point
where the plot of final pH versus initial pH intersects with
the line at which the final pH equals to the initial pH. The
blue line in both graphs indicates the line of pHfinal = -
pHinitial, while the red and green curves indicate the plots of
pHfinal against pHinitial for PKSAC and MPKSF, respec-
tively. Figure 1a shows that the pHpzc of PKSAC adsorbent
was 3.94, which indicated that the sample was acidic, due to
the impregnation of PKSAC using phosphoric acid
(H3PO4). A suitable acid activation results in the production
of high quality and high surface area AC (Yakout and
Sharaf El-Deen 2016). In the adsorption process of As(III)
onto MPKSF, at a pH above the point of zero charge of the
MPKSF, i.e., pHpzc = 5.94, its surface becomes negatively
charged, hence the protonated As(III) will have a greater
affinity towards the MPKSF surface. Based on the Box–
Behnken optimization, the optimum adsorption occurred at
pH 6.55, which conformed to the aquatic environmental
range of pH of 5–9 (Zou et al. 2016).
As seen in Fig. 1b, the pHpzc value of MPKSF
decreased its acidity to attain a pH of 5.94. This may be
due to the iron oxide extracted from the ferric chlo-
ride/ferrous sulfate solution (FeOF) which was used in the
production of MPKSF. To further illustrate that the
MPKSF acquired magnetic properties, the hydration of
Fe3O4 in aqueous solution resulted in the formation of a-
Fe2O3 in an acidic condition as depicted by the reaction in
Eq. (2). To illustrate that a-Fe2O3 was formed, previous
studies have reported that the pHpzc for the untreated
Fe3O4 was 6.5 while for c-Fe2O3, it was at pH 5.9
(Milonjic et al. 1983) which indicate that the value of pH
for both was nearly acidic even in the untreated condition.
Further, Schwertmann and Murad (1983) had reported that
a-Fe2O3 is predominantly formed at pH 7–8. In this study,
it was demonstrated that upon impregnation of the PKSAC
with FeOF, the acidity of the modified PKSAC (MPKSF)
was reduced from 3.94 to 5.94 due to the formation of a-
Fe2O3 from the reaction of Fe3O4 with water as represented
by the Eq. (2) below:
2Fe3O4 þ H2O � 3Fe2O3 þ 2Hþ þ 2e�: ð2Þ
Box–Behnken statistical analysis
In Table 3, the most important parameters influencing the
efficiency of adsorption of As(III) onto the MPKSF are
represented by the letters: A, B, C, D and E, which repre-
sents the coded symbols for the respective factors: contact
time, pH, adsorbent dosage, initial As(III) concentration
and the temperature parameters. The combined effects of
these factors were evaluated by performing experiments on
the different combinations of these parameters.
The applied Box–Behnken model can be expressed as
Eq. (3):
Y ¼ X0 þ X1Aþ X2Bþ X3C þ X4Dþ X5E þ X6AB
þ X7AC þ X8ADþ X9AE þ X10BC þ X11BD
þ X12BE þ X13CDþ X14CE þ X15DE þ X16A2
þ X17B2 þ X18C
2 þ X19D2 þ X20E
2; ð3Þ
where Y is the response, X0 and Xi depicted the global mean
and other regression coefficients, respectively, while A, B,
C, D and E are the coded symbols for the respective fac-
tors: contact time, pH, adsorbent dosage, initial As(III)
concentration and the temperature parameters.
In Table 4, the statistical significance of the ratio of
mean square variation due to regression and mean square
Fig. 1 a Graph of pHfinal versus pHinitial for the adsorbent PKSAC
suspension. b Graph of pHfinal versus pHinitial graph for the adsorbent
MPKSF suspension
Table 2 Initial and final pH value of PKSAC and MPKSF reaction
solutions
Initial pH Final pH
PKSAC MPKSF
4.00 3.94a 4.26
6.00 4.22 5.94a
8.00 4.42 5.31
10.00 4.29 6.54
12.00 11.41 11.59
a Point of zero charge
Appl Water Sci (2017) 7:4573–4591 4577
123

Table 3 Experimental, actual and predicted values of Y for As(III) onto MPKSF
Standard run order A B C D E Actual value Predicted value
1 5 6 0.17 52.5 30 86.93 86.91
2 720 6 0.17 52.5 30 99.81 99.80
3 5 8 0.17 52.5 30 81.67 81.65
4 720 8 0.17 52.5 30 93.96 93.94
5 362.50 7 0.05 5 30 57.41 57.43
6 362.50 7 0.3 5 30 51.48 51.50
7 362.50 7 0.05 100 30 18.24 18.22
8 362.50 7 0.3 100 30 92.46 92.44
9 362.50 6 0.17 52.5 20 91.63 91.61
10 362.50 8 0.17 52.5 20 88.46 88.47
11 362.50 6 0.17 52.5 40 96.80 96.78
12 362.50 8 0.17 52.5 40 88.80 88.81
13 5 7 0.05 52.5 30 28.03 28.05
14 720 7 0.05 52.5 30 70.81 70.81
15 5 7 0.3 52.5 30 92.36 92.37
16 720 7 0.3 52.5 30 74.79 74.78
17 362.50 7 0.17 5 20 79.93 79.91
18 362.50 7 0.17 100 20 83.05 83.05
19 362.50 7 0.17 5 40 84.96 84.94
20 362.50 7 0.17 100 40 83.52 83.53
21 362.50 6 0.05 52.5 30 63.35 63.36
22 362.50 8 0.05 52.5 30 29.41 29.41
23 362.50 6 0.3 52.5 30 69.10 69.11
24 362.50 8 0.3 52.5 30 91.95 91.95
25 5 7 0.17 5 30 78.30 78.28
26 720 7 0.17 5 30 84.89 84.89
27 5 7 0.17 100 30 73.18 73.17
28 720 7 0.17 100 30 91.72 91.73
29 362.50 7 0.05 52.5 20 35.69 35.68
30 362.50 7 0.3 52.5 20 96.26 96.26
31 362.50 7 0.05 52.5 40 64.88 64.86
32 362.50 7 0.3 52.5 40 72.58 72.57
33 5 7 0.17 52.5 20 87.86 87.88
34 720 7 0.17 52.5 20 98.26 98.28
35 5 7 0.17 52.5 40 88.42 88.45
36 720 7 0.17 52.5 40 103.20 103.22
37 362.50 6 0.17 5 30 81.57 81.59
38 362.50 8 0.17 5 30 75.49 75.50
39 362.50 6 0.17 100 30 81.90 81.92
40 362.50 8 0.17 100 30 76.89 76.90
41 362.50 7 0.17 52.5 30 85.53 85.53
42 362.50 7 0.17 52.5 30 85.52 85.53
43 362.50 7 0.17 52.5 30 85.51 85.53
44 362.50 7 0.17 52.5 30 85.54 85.53
45 362.50 7 0.17 52.5 30 85.52 85.53
46 362.50 7 0.17 52.5 30 85.53 85.53
4578 Appl Water Sci (2017) 7:4573–4591
123

residual error was tested using ANOVA. The results of the
ANOVA indicated that the F values obtained for all the
regressions were higher, which indicated that that majority
of the variation in the response can be explained by the
regression equation (Kumar et al. 2008). To determine
whether the F is large enough to result in a statistical
significance, the p value is examined. In this case, the
model is considered to be statistically significant if the
values under the column p[F value is \0.05 (Table 4)
(Segurola et al. 1999). The ANOVA result for the MPKSF–
As design system shows that the F value of 99.63 and its
p value of \0.05 imply that the model was significant
towards the response. Hence in this analysis, A, B, C, D,
AC, AD, BC, CD, CE, C2 and D2 were the significant terms
(Table 4). Besides, the ANOVA results for the MPKSF–As
adsorption system showed that the F value is 99.63
(Table 4), indicating that the terms on the model are having
a significant effect on the response.
In Table 5, the adequacy of the model for the adsorption
of As(III) onto the MPKSF was determined by three tests:
(1) sequential model sum of squares; (2) lack-of-fit tests;
(3) model summary statistics. The results showed that the
p value for majority of the regression were \0.05. This
implied that one of the terms in the regression equation was
significantly correlated to the response variable. Further,
the quadratic model was found to yield the best fit of R2,
Adjusted R2 and predicted R2 values of 0.9876, 0.9777 and
0.9505, respectively (Table 5). This also implied that the
model does not explain 1% of the experimental results.
Again, the high R2 values in Table 5 and the p value of
\0.0001 in Table 4, indicate that the quadratic polynomial
was highly significant in explaining the relationship
between the parameters and As(III) residual concentration
(%).
In Table 5, since the cubic model was established to be
aliased, the quadratic model was therefore, chosen to be
used for further analysis. Further, under the lack of fit
(Table 5) the F value is not significant, with an F value of
4.79 and the p value of 0.0687. This shows that the lack of
fit was not significant relative to the pure error. However,
the lack-of-fit value indicates that there is 6.87% possibility
that the error resulted from noise. Thus, the non-significant
Table 4 ANOVA for response surface quadratic model (Y)
Source Sum of squares Df Mean square F value p value (p[F)
Model 6726.26 20 335.36 99.63 \0.0001
A: contact time 218.30 1 218.30 64.85 \0.0001
B: pH 32.86 1 32.86 9.76 0.0045
C: adsorbent dosage 2084.38 1 2084.38 619.20 \0.0001
D: initial conc. As 2242.50 1 2242.50 666.17 \0.0001
E: temperature 5.87 1 5.87 1.74 0.1987
AB 0.03 1 0.03 9.098E-003 0.9248
AC 248.38 1 248.38 73.78 \0.0001
AD 40.51 1 40.51 12.04 0.0019
AE 2.89 1 2.89 0.86 0.3630
BC 221.71 1 221.71 65.86 \0.0001
BD 4.49 1 4.49 1.34 0.2588
BE 1.59 1 1.59 0.47 0.4986
CD 732.51 1 732.51 217.61 \0.0001
CE 190.85 1 190.85 56.70 \0.0001
DE 0.26 1 0.26 0.08 0.7833
A2 0.34 1 0.34 0.10 0.7516
B2 1.85 1 1.85 0.55 0.4654
C2 493.91 1 493.91 146.73 \0.0001
D2 120.20 1 120.20 35.71 \0.0001
E2 6.70 1 6.70 1.99 0.1706
Residual 84.16 25 3.37
Lack of fit 84.11 20 48.21 4.79 0.0687
Pure error 0.04 5
Corr. total 7154.40 45
Appl Water Sci (2017) 7:4573–4591 4579
123

value for the lack of fit showed that the model was valid for
further analysis. The final mathematical equation given by
the Box–Behnken design in terms of actual values deter-
mined by Design Expert software is presented in Eq. (4).
Removal of As(III) (%) is given by:
Y ¼ 85:53 þ 6:29 � A� 2:78 � Bþ 17:07 � C
þ 0:43 � Dþ 1:38 � E � 0:15 � A� B
� 15:09 � A� C þ 2:99 � A� Dþ 1:09 � A� E
þ 14:20 � B� C þ 0:27 � B� D� 1:21 � B� E
þ 20:04 � C � D� 13:22 � C � E � 1:14 � D� E
þ 4:05 � A2 þ 1:01 � B2 � 23:07 � C2 � 7:56 � D2
þ 4:89 � E2: ð4Þ
The equation implied that the constant with a value of
85.53 (see Eq. (4)) which is independent of any factor or
interaction between factors suggests that the average
removal of As(III) by MPKSF was 85.53%. Although
this average removal is independent of the factors in the
experimental setup (Kumar et al. 2008). In addition,
Eq. (4) shows that pH and initial As(III) concentration
had a positive effect while contact time, temperature and
adsorbent dosage had a negative effect on the adsorption
percentage of As(III) by MPKSF. In general, the positive
sign represents the synergistic effect and the negative sign
shows the antagonistic effect on the adsorption process
(Tan et al. 2008). Further, the positive value of the model
term indicates the effect that favors the optimization
process while the negative model term value represents the
inverse interaction between the parameters with the
response.
Adsorption studies
In this study, the Box–Behnken design was used for the
optimization of the selected parameters. Thus, the effects
of these parameters on the MPKSF–As adsorption was
shown by the response surface plots using two parameters
simultaneously while the remaining parameters were set at
their center points. However, it should be noted that since
two parameters were used simultaneously, hence, only one
set of the figures were presented per variable, while the rest
were referred to accordingly under the affected variables,
i.e., from ‘‘Effect of temperature’’ to ‘‘Effect of contact
time’’.
Effect of selected variables and response surface plots
Effect of pH As seen in Fig. 2a–d, the combined effects
of pH with contact time, initial As(III) concentration,
adsorbent dosage and temperature, respectively, were
Table 5 Adequacy of the model tested for MPKSF–As design system
Source Sum of squares Df Mean square F p value (p[F) Remark
Sequential model sum of squares
Mean vs total 5863.8 1 5863.8 – – –
Linear vs mean 4583.91 5 916.78 16.61 \0.0001 –
2FI vs linear 1443.23 10 144.32 5.67 \0.0001
Quadratic vs 2FI 680.13 5 136.03 40.41 \0.0001 Suggested
Cubic vs quadratic 59.05 15 3.94 1.57 0.2386 Aliased
Residual 25.10 10 2.51 – – –
Total 12,655.22 46 275.11 – – –
Lack-of-fit tests
Linear 2207.47 35 63.07 7345.18 \0.0001 –
2FI 764.24 25 30.57 3560.12 \0.0001 –
Quadratic 84.11 20 48.21 4.79 0.0687 Suggested
Cubic 25.06 5 5.01 583.72 \0.0001 Aliased
Pure error 0.043 5 8.587E-003 – –
Source Std. dev. R2 Adjusted R2 Predicted R2 PRESS Remark
Model summary statistics
Linear 7.43 0.6750 0.6343 0.5575 3005.16 –
2FI 5.05 0.8875 0.8312 0.7113 1960.64 –
Quadratic 1.83 0.9876 0.9777 0.9505 336.51 Suggested
Cubic 1.58 0.9963 0.9834 0.7638 1603.97 Aliased
4580 Appl Water Sci (2017) 7:4573–4591
123

presented. From the responses, the lower value of As(III)
residual indicates a higher percentage of removal as given
by Eq. (5):
% Removal ¼ Cinitial � Cfinal
Cinitial
� �� 100%: ð5Þ
Figure 2a shows the interaction between the effect of pH
and the contact time of As(III) solution with the MPKSF
adsorbent. The optimum removal of As occurred at pH 6.55
and at a contact time of 44.73 min with a removal percentage
of 94.76% as the other parameters were set to their center
points. Figure 2b illustrates the interaction of initial As(III)
concentration with pH with the optimum removal of As(III)
achieved at pH 6.55 at an initial As(III) concentration of
5 lg L-1 with a removal percentage of 99.10%.
Further, Fig. 2c, d shows the relationships between pH
with adsorbent dosage and temperature, respectively. The
excluded parameters for the respective response surface
plots remain at their center points. Figure 2c shows that the
removal of As(III) attained a maximum of 100% at pH 8
with an adsorbent dose of 0.3 g, while the other parameters
were at their center points. In Fig. 2d, the relationship
between pH and temperature gives an optimum removal of
91.89% at pH 6 and a temperature of 40 �C.
As reported previously, the pHpzc value for MPKSF
was 5.94. At a pH above the pHpzc value, the As(III)
cations are attracted to the negatively charged surface of
MPKSF, which resulted from the deprotonation of MPKSF
hydroxyl groups. Meanwhile, at pH lower than pHpzc, the
adsorption of As(III) cations occurs only slightly because
the surface of MPKSF is positively charged due to the
protonation of MPKSF hydroxyl group. Thus, a solution
pH of 6.55 provides the optimum condition for adsorption
of MPKSF–As.
Effect of temperature
The experiment was conducted within a temperature range
of 20–40 �C. As seen in Fig. 2d (refer to Fig. 2d in ‘‘Effect
of pH’’ above for the effect of temperature and pH) and 3a–
c, the relationships between temperature and pH, contact
time, adsorbent dose and initial concentration, respectively,
are presented. All the four response surface plots show that
the removal of As(III) increases with temperature. Thus,
the adsorption process could be described as an endother-
mic process, as the removal of As(III) is optimum at higher
temperatures with efficiency of 91–100% removal.
5.00 183.75
362.50 541.25
720.00
6.00
6.50
7.00
7.50
8.00
81
85.75
90.5
95.25
100
Rem
oval
%
A: contact time
B: pH
6.00
6.50
7.00
7.50
8.00 5.00 28.75
52.50 76.25
100.00
75
78.75
82.5
86.25
90
Rem
oval
%
B: pH
D: initial conc As
6.00
6.50
7.00
7.50
8.00
0.05 0.11
0.17 0.24
0.30
29
45.5
62
78.5
95
Rem
oval
%
B: pH C: adsorbent dosage
6.00
6.50
7.00
7.50
8.00 20.00 25.00
30.00 35.00
40.00
83
86.5
90
93.5
97
Rem
oval
% B: pH
E: temperature
ab
cd
Fig. 2 3D response surface plots for As(III) removal vs a contact
time (5–720 min) and the pH of the adsorbent MPKSF suspension
(6–8); b initial As concentration (5–100 lg L-1) and pH (6–8);
c adsorbent dose (0.05–0.3 g) and the pH of the adsorbent MPKSF
suspension (6–8); d temperature (20–40 �C) and the pH of the
adsorbent MPKSF suspension (6–8)
Appl Water Sci (2017) 7:4573–4591 4581
123

Effect of adsorbent dosage
Refer to Fig. 2c under ‘‘Effect of pH’’ and Fig. 3b under
‘‘Effect of temperature’’ above and Fig. 4a, b under ‘‘Effect
of contact time’’ below, for the combined effect of adsor-
bent (MPKSF) dose with pH, temperature, contact time and
initial As(III) concentration, respectively. The results
showed that the percentage removal increases as the
adsorbent dose increases. The increase in the amount of
adsorbent used can be attributed to the formation of a
greater surface area and provides more available vacant
sites for the adsorption of As(III) on MPKSF surface.
Effect of initial As(III) concentration
Adsorption of MPKSF–As was carried out with different
initial concentrations ranging from 5 to 100 lg L-1. Refer
to Fig. 2b under ‘‘Effect of pH’’ and 3c under ‘‘Effect of
temperature’’ above, and Fig. 4b, c, under ‘‘Effect of
contact time’’ below. The results illustrates the combined
effect of initial As(III) concentration with pH of the
adsorbent MPKSF suspension, temperature, adsorbent dose
and contact time, respectively, while two parameters are
kept constant. As shown by the response surface plots, it
revealed that as the initial concentration increases, some of
the percentage removal data showed increasing pattern
while other percentages removal data became slightly
decreased. In this case, other parameters need to be con-
sidered especially the adsorbent dosage which provides the
information on the available vacant adsorption sites for
adsorption of As(III) at higher concentrations.
Effect of contact time
Refer to Fig. 2a (under ‘‘Effect of pH’’, and Fig. 3a under
‘‘Effect of temperature’’) above, and Fig. 4a, c below. The
results illustrate the combined response surface plots of
contact time with pH of the adsorbent MPKSF suspension,
temperature, adsorbent dosage and initial As concentration,
respectively. It shows that the increase in contact time
duration causes the removal percentages of As(III) to
increase. As the contact time increased, the adsorbate had
enough time to disperse and be adsorbed onto the surface
and into the pores of MPKSF until the adsorption reached
equilibrium at an optimum contact time.
Optimization using desirability function
A desirable value for each input parameter and the
response can be selected. The multiple response methods
5.00 183.75
362.50 541.25
720.00
20.00 25.00 30.00 35.00 40.00
83
88.25
93.5
98.75
104
Rem
oval
%
A: contact time E: temperature
0.05
0.11
0.17
0.24
0.30
20.00 25.00
30.00 35.00
40.00
35
51
67
83
99
Rem
oval
%
C: adsorbent dosage E: temperature
Rem
oval
%
5.00
28.75
52.50
76.25
100.00 20.00
25.00
30.00
35.00
40.00
77
80.75
84.5
88.25
92
D: initial conc As E: temperature
ab
c
Fig. 3 3D response surface plots for As(III) removal vs a temperature (20–40 �C) and contact time (5–720 min); b temperature (20–40 �C) and
adsorbent dosage (0.05–0.3 g); c temperature (20–40 �C) and initial As(III) concentration (5–100 lg L-1)
4582 Appl Water Sci (2017) 7:4573–4591
123

was applied to obtain the optimum condition for the five
parameters used including contact time, pH, adsorbent
dose, initial As(III) concentration and temperature. The
numerical optimization reveals the points that maximize
the desirability function. In this study, the maximum level
for As(III) removal was set for desirability at a minimum
level of contact time (5 min), minimum adsorbent dosage
(0.05 g), the maximum level of initial As(III) concentration
(100 lg L-1), the level of solution pH in the range of 6–8
and the level of temperature within a range of 20–40 �C(data not shown for the desirability ramp).
Using Eq. (5) reported previously to determine the
removal percentage, 96% removal of As(III) was achieved
using the optimal conditions at contact time of 45 min,
initial As(III) concentration maximized to 100 lg L-1,
adsorbent dosage of 0.29 g, initial solution pH of 6.55 and
the temperature at 26 �C as shown in Table 6. Experi-
mentally, these optimum values are applied in a verifica-
tion experiment and resulted in 95% removal of As(III) by
MPKSF adsorbent with a percentage error of 1% as com-
pared to the predicted removal of As(III). Thus, this indi-
cated that the Box–Behnken design model is reliable for
the optimization of various parameters used in an adsorp-
tion process.
Adsorption equilibrium studies of As(III)
onto MPKSF adsorbent
Adsorption isotherm models
In this study, several isotherm models were applied to
determine the type of adsorption that occurred on the
magnetic activated carbon surface, by fitting the data to the
Langmuir, Freundlich, and Temkin isotherm models. The
correlation coefficient, R2 obtained from the isothermal
5.00
183.75
362.50
541.25
720.00
0.05 0.11
0.17 0.24
0.30
28
45
62
79
96
Rem
oval
%
A: contact time
C: adsorbent dosage 0.05 0.11
0.17 0.24
0.30
5.00
28.75
52.50
76.25
100.00
18
37
56
75
94
C: adsorbent dosage D: initial conc As
Rem
oval
%
5.00 183.75
362.50 541.25
720.00 5.00 28.75
52.50 76.25
100.00
73
79
85
91
97
Rem
oval
%
A: contact time D: initial conc As
ab
c
Fig. 4 3D response surface plots for As(III) removal vs a contact time (5–720 min) and adsorbent dose (0.05–0.3 g); b initial As(III)
concentration (5–100 lg L-1) and adsorbent dose (0.05–0.3 g); c initial As(III) concentration (5–100 lg L-1) and contact time (5–720 min)
Table 6 Optimal condition and model validation for As(III) removal
by MPKSF
Parameters Optimal conditions
Contact time (min) 45
pH 6.55
Adsorbent dosage (g) 0.29
Initial As(III) concentration (lg L-1) 100.00
Temperature (�C) 26
Removal (%)
Predicted 96
Experimental 95
Error (%) 1
Appl Water Sci (2017) 7:4573–4591 4583
123

plots was used to identify the isotherm model that best
described the adsorption of As(III) onto MPKSF.
The Langmuir adsorption isotherm model
The Langmuir is represented by the following equations;
(1) Eq. (6) which was formulated based on the kinetic
theory; (2) Eq. (7) depicts the equation for the value of
adsorbate adsorbed on the adsorbent; (3) the linear form of
the Langmuir equation is given by Eq. (8):
x
m¼ qe ¼
qmaxKLCe
1 þ KLCe
; ð6Þ
qe ¼Co � Ceð ÞV
m; ð7Þ
Ce
qe
¼ Ce
qmax
þ 1
qmaxKL
; ð8Þ
where x = mass of adsorbate adsorbed (lg), m = mass of
adsorbent (g), V = volume of solution used for adsorption
process (L), Ce = equilibrium concentration (lg L-1),
Co = initial concentration (lg L-1), qe = amount of
adsorbate adsorbed at equilibrium (lg g-1), qmax = max-
imum adsorption at monolayer coverage, KL = Langmuir
isotherm constant (L lg-1).
To assess the Langmuir isotherm model, a graph of Ce/
qe against Ce is plotted, a straight line is obtained and the
values of KL and qmax are computed from the values of the
slope and intercept of the graph. The fitted isotherm in this
study was illustrated by a plot of equilibrium concentration
of adsorbate Ce on the adsorbent, qe, i.e., Ce/qe against the
equilibrium concentration of adsorbate, Ce. Figure 5
depicts the fitted As(III) adsorption isotherm which indi-
cated the presence of a linear part of plotted curve at low
Ce followed by a slight curvature around Ce = 2.56 -
lg L-1 towards the completion of coverage of the mono-
layer with the R2 value of 0.9599. Hence, this indicated that
adsorption of arsenite onto MPKSF is L-type (having no
strict plateau). A similar observation was reported by El-
Said et al. (2009) whose study demonstrated the adsorption
of As(III) and As(V) using Nigella sativa L.
Further, the inherent feature of this isotherm namely a
dimensionless constant separation factor, RL can be
expressed as an equilibrium parameter. The parameter is
calculated using Eq. (9). The effect of the separation factor
on the adsorption nature of the Langmuir isotherm is
summarized in Table 7.
RL ¼ 1
1 þ KLCo
; ð9Þ
where Co = initial concentration of surfactant (mg dm-3),
KL = Langmuir isotherm constant.
To illustrate, that the homogeneous adsorption process
predicted by the Langmuir isotherm assumes a monolayer
adsorption of molecules onto the surface of the adsorbent.
The Langmuir linear plot of the specific adsorption (Ce/qe)
against the equilibrium concentration (Ce) for adsorption of
As(III) onto MPKSF is depicted in Fig. 6. The Ce was
obtained after 180 min. The correlation coefficient (R2)
obtained from the Langmuir isotherm is 0.9973, which
indicates that the adsorption data of the As(III) onto the
MPKSF surface was well fitted to the Langmuir isotherm
model. The monolayer adsorption capacity (qmax) of
As(III) onto MPKSF was found to be 48.08 lg g-1.
A dimensionless equilibrium parameter, RL was used to
express the nature of adsorption of the Langmuir isotherm.
The RL value calculated from the adsorption data is 0.0765
indicating that the adsorption of As(III) on MPKSF was a
favorable process as the RL value lies between 0 to 1
Table 7 Effect of separation factor on Langmuir isotherm
RL Adsorption nature of isotherm
RL[ 1 Unfavorable
RL = 1 Linear
0\RL\ 1 Favorable
RL = 0 Irreversible
Fig. 6 Langmuir isotherm representing the variation of specific
adsorption (Ce/qe) against the equilibrium concentration (Ce) for
adsorption of As(III) onto MPKSF
Fig. 5 Langmuir equilibrium isotherm for the adsorption of As(III)
onto MPKSF
4584 Appl Water Sci (2017) 7:4573–4591
123

(0\RL\ 1) at an equilibrium temperature of 30 �C(Table 7).
The Freundlich isotherm model
This isotherm was applied as an empirical model which
considers the data often fit to the empirical equation stated
in Eq. (10):
x
m¼ qe ¼ KFC
1ne; ð10Þ
where x = weight of solute adsorbed, m = weight of
adsorbent, Ce = equilibrium concentration of adsorbate
(mg L-1), qe = amount of solute adsorbed at equilibrium
(mg g-1), KF and n = Freundlich isotherm constant
(mg g-1)
From the isotherm, the n value reveals the nature of the
adsorption, i.e., how favorable the adsorption process was.
The value of n was used as the linearity parameter implying
that if the n value lies between one and ten, this indicates a
favorable sorption process of the adsorbent (Freundlich
1906). The effect of the n value on the nature of adsorption
as represented by the Freundlich isotherm is shown in
Table 4. The linear form of the equation is given by
Eq. (11). A graph of log (x/m) against log Ce results in a
straight line at which the value slope and intercept are the
value of 1/n and log KF, respectively.
logx
m¼ log qe ¼ logKF þ
1
nlogCe: ð11Þ
A multilayer adsorption for the heterogeneous surface is
indicated by the Freundlich isotherm model. The
heterogeneous system of adsorption assumes that there is
no formation of monolayer adsorption of As(III) on
MPKSF. Figure 7 illustrates the plot of log qe against log
Ce. The correlation coefficient, R2 obtained from the graph
illustrates that the Freundlich isotherm model is not well
fitted to the adsorption data with an R2 value of 0.9744. The
Freundlich constants, KF and the n value are shown in
Table 8.
The slope of the Freundlich isotherm (Fig. 7) shows that
the 1/n value is less than 1 and this has shown that the
process is a favorable physical adsorption process. The
smaller 1/n value indicates that a strong bond is present
between the adsorbent and adsorbate molecules (Okeola
and Odebunmi 2010).
In the paper by Mayo et al. (2007), it was demonstrated
that the adsorption of As(III) and As(V) onto Fe3O4
nanoparticles exhibits the surface complexation reaction by
forming either inner-sphere monodentate or bidentate-bin-
uclear complex with iron oxide (Fe3O4). A similar reaction
of magnesium with iron oxide, i.e., Fe3O4 and c-Fe2O3 was
reported by Jolstera et al. (2012). The proposed adsorption
of As(III) and Fe3O4 in MPKSF is depicted in Fig. 8 and
supported by the FTIR analysis of the MPKSF–As.
It is well known that sodium arsenite can be represented
as sodium ortho-arsenite (Na3AsO3) and sodium meta-
arsenite (NaAsO2), the latter was used in this study for
adsorption. Based on Fig. 9, MPKSF reacted with arsenous
acid (H3AsO3) which is produced according to the chem-
ical reaction (Eq. 11). Firstly, sodium meta-arsenite reacts
with water producing arsenic trioxide with sodium ions and
hydroxide ions followed by the slow hydrolysis of arsenic
trioxide. The reaction proceeds in a basic condition, finally
producing arsenous acid:
2NaAsO2 þ H2O ! As2O3 þ 2Naþ
þ 2OH��������!slow hydrolysis2H3AsO3: ð12Þ
Liu et al. (2015) reported that magnetite (Fe3O4) is
known as a mixture of two iron oxides which are composed
of 67% of Fe(III) and 33% of Fe(II). In the adsorption
study, the major Fe(III) species was reported to interact
with As(III) to form either inner-sphere monodentate or
bidentate-binuclear complex. This can be attributed to the
oxidation reaction which takes place in the presence of
oxygen under atmospheric experimental conditions hence
suggesting the oxidation of Fe(II) to Fe(III).
Temkin isotherm
The Temkin isotherm model was applied to consider the
effect of the interactions between the adsorbent and the
adsorbate on an adsorption isotherm. The model assumes
Table 8 Effect of n values on Freundlich isotherm
n value Adsorption nature of isotherm
n = 1 Linear
n\ 1 Chemical process
n[ 1 Physical process
Fig. 7 Freundlich isotherm indicating the variation of log qe with
respect to log Ce for adsorption of As(III) onto MPKSF
Appl Water Sci (2017) 7:4573–4591 4585
123

that the heat of adsorption of the molecules present in the
adsorbed layer is reducing linearly with the coverage of the
molecules instead of in logarithmic pattern due to this
interaction (Temkin 1941). This means that as the coverage
of adsorbed layer increased, the heat of adsorption
decreased.
Temkin isotherm is given by Eq. (13):
qe ¼RT
bT
� �lnðACeÞ: ð13Þ
The linear form of Eq. 13 is given by:
qe ¼RT
blnAþ RT
blnCe: ð14Þ
Substituting RT/b with B and hence,
qe ¼ B lnAþ B lnCe; ð15Þ
where b = Temkin isotherm constant, A = equilibrium
binding constant correspond to maximum binding energy,
R = gas constant (8.314 J mol-1 K-1), T = absolute
temperature, K.
The values of constant A and B are obtained from a plot
of qe against ln Ce.
Figure 9 shows the plot of qe against ln Ce whereby the
slope and intercept values obtained from the graph plot are
used to calculate Temkin constant A, and the heat of
sorption constant B. The R2 value obtained from the linear
plot of Temkin isotherm model is 0.9816 indicating that the
adsorption data are applicable to this model. Similar
observations have been reported by Itodo and Itodo (2010)
on the adsorption of atrazine onto sheanut shell. Similarly
by Hamdaoui and Naffrechoux (2007) whose study
demonstrated the adsorption of phenol and chlorophenol
onto granular activated carbon. Maurya and Mittal (2006)
had also established the linear Temkin plot for the
adsorption of methylene blue and Rhodamine B onto
activated carbon.
Comparing the three correlation coefficients; R2 for the
three isotherms, the Langmuir isotherm gave the best fit of
adsorption isotherm with highest correlation coefficient, R2
value of 0.9973 followed by Temkin (0.9816) and Fre-
undlich (0.9744) isotherm models (Table 9). Langmuir
isotherm implies that adsorption of As(III) onto MPKSF
adsorbent occurs in a monolayer adsorption at which when
the available sorption sites of MPKSF are fully occupied,
no further adsorption process can take place at those sites.
It is corroborated by the formation of inner-sphere com-
plexes between iron oxide and As(III) molecules on
MPKSF surface.
Fig. 8 Proposed adsorption of
As(III) onto MPKSF. (adapted
from Ciuro Juncosa 2008;
O’Reilly et al. 2001)
Fig. 9 Temkin isotherm showing the variation of qe against ln Ce for
adsorption of As(III) onto MPKSF
4586 Appl Water Sci (2017) 7:4573–4591
123

The R2 value for Langmuir and Freundlich are 0.9973
and 0.9744, respectively (Table 9). The Temkin isotherm
shows that the heat of adsorption is low (9.72 J mol-1)
indicating physical adsorption. Furthermore, the calculated
Freundlich (qmax) (54.48 lg g-1) was higher than the
adsorption capacity (qmax = 48.08 lg g-1) determined
from the Langmuir isotherm. Based on the qmax value
obtained, the adsorption of As(III) is more of a physical
adsorption as described by the Freundlich isotherm. Studies
by Liu et al. (2015) reported that the presence of chemical
interaction between As(III) and iron oxide forming inner-
sphere surface complex can be best explained by Langmuir
isotherm, suggesting a monolayer As(III) adsorption onto
the Fe3O4 surface. However, they also reported that the
adsorption of As(III) onto AC showed the best fit with
Freundlich isotherm. Based on the experimental data, it is
suggested that both chemisorption, involving the formation
of inner-sphere complex and physisorption on activated
carbon occurred in the adsorption of As(III) onto MPKSF.
Desorption of As(III) from MPKSF
Desorption experiment was conducted to examine the
reusability of the MPKSF adsorbent and the reversibility of
the adsorption process. Figure 10 illustrates the percentage
desorption of As(III) from MPKSF. During the first stage
of desorption using distilled water, the percentage of
As(III) desorbed in the solution was 0.72% followed by
0.78 and 0.97% at second and third stages of desorption,
respectively. The small amount of As(III) detected after the
first desorption (Des1) was presumably due to the com-
plexation reaction between As(III) ions with the iron in
MPKSF adsorbent (CiuroJuncosa 2008) which prevents the
dissociation of As(III) from iron oxide on the surface of
MPKSF. This is also consistent with the results of the
Langmuir adsorption isotherm, thus explaining the forma-
tion of chemical bonds between As(III) and the surface of
MPKSF which prevent the As(III) from desorbing easily
from MPKSF.
Identification of the proposed mechanism
of the adsorption of As(III) onto the MPKSF
Fourier transform infrared spectroscopy (FTIR) analysis
As stated previously a mechanism was proposed for the
adsorption of As(III) onto the MPKSF, in this section, this
mechanism was identified using the results of the spec-
troscopy studies and supported by the results of the char-
acterization of the MPKSF after the adsorption. Figure 11
shows the FTIR spectrum of MPKSF after adsorption of
As(III) (MPKSF–As). Five peaks could be observed in the
spectrum identified at wavenumber of 3430, 1625, 1387,
1078 and 573 cm-1. These are assigned to the functional
groups OH, C=O, C–C, C–O, and M–O, respectively.
Both spectra of MPKSF before and after adsorption
show the presence of peaks at a wavenumber of 3430, 1625
and 573 cm-1. Additionally, in MPKSF–As, two new
peaks were detected at 1387 cm-1 and around 800 cm-1
which are assigned to C–C bending (Mayo et al. 2007) and
As–O interaction (Ito et al. 1995), respectively, on MPKSF
surface after adsorption. However, the spectrum showed a
less significant band at 800 cm-1. Thus the EDX analysis
data are used to validate the presence of As(III). According
to Sayle (2000), at a pH lower than the pKa value, the
molecules will be mostly protonated. Thus, the negatively
Table 9 Langmuir, Freundlich and Temkin isotherm model param-
eters and correlation coefficient for adsorption of As(III) on MPKSF
Isotherm Parameters
Langmuir qmax (lg g-1) 48.08
KL (L lg-1) 0.1208
R2 0.9973
Freundlich KF 10.86
1/n 0.36
qmax (lg g-1) (calculated) 54.48
R2 0.9744
Temkin A (L g-1) 1.436
B (J mol-1) 9.72
R2 0.9816
Fig. 10 Desorption of As(III)
from MPKSF. Data obtained:
n = 3 for each desorption
experiment
Appl Water Sci (2017) 7:4573–4591 4587
123
charged MPKSF provides greater affinity towards the
protonated As(III) ions at pH lower than 9.2 which result in
the formation of inner-sphere complexes between As(III)
and Fe3O4 in MPKSF. Additionally, Bundschuh et al.
(2005) reported that as the pH increases, the dominant
negative charges are present on adsorbent surface hence
interference with the adsorption of As(III) and As(V) are
significantly governed by the surface charge of adsorbent.
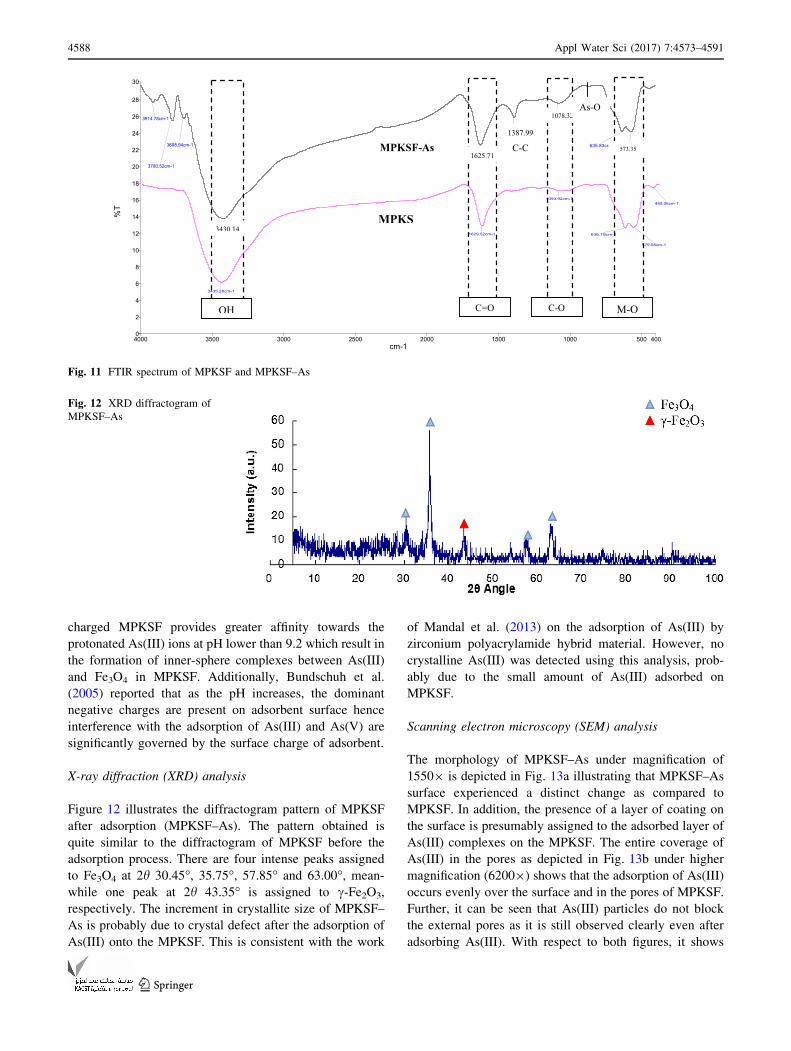
X-ray diffraction (XRD) analysis
Figure 12 illustrates the diffractogram pattern of MPKSF
after adsorption (MPKSF–As). The pattern obtained is
quite similar to the diffractogram of MPKSF before the
adsorption process. There are four intense peaks assigned
to Fe3O4 at 2h 30.45�, 35.75�, 57.85� and 63.00�, mean-
while one peak at 2h 43.35� is assigned to c-Fe2O3,
respectively. The increment in crystallite size of MPKSF–
As is probably due to crystal defect after the adsorption of
As(III) onto the MPKSF. This is consistent with the work
of Mandal et al. (2013) on the adsorption of As(III) by
zirconium polyacrylamide hybrid material. However, no
crystalline As(III) was detected using this analysis, prob-
ably due to the small amount of As(III) adsorbed on
MPKSF.
Scanning electron microscopy (SEM) analysis
The morphology of MPKSF–As under magnification of
15509 is depicted in Fig. 13a illustrating that MPKSF–As
surface experienced a distinct change as compared to
MPKSF. In addition, the presence of a layer of coating on
the surface is presumably assigned to the adsorbed layer of
As(III) complexes on the MPKSF. The entire coverage of
As(III) in the pores as depicted in Fig. 13b under higher
magnification (62009) shows that the adsorption of As(III)
occurs evenly over the surface and in the pores of MPKSF.
Further, it can be seen that As(III) particles do not block
the external pores as it is still observed clearly even after
adsorbing As(III). With respect to both figures, it shows
4000 4003500 3000 2500 2000 1500 1000 500
30
0
2
4
6
8
10
12
14
16
18
20
22
24
26
28
cm-1
%T
3430.14cm-1
1625.71cm-1
635.83cm-1573.35cm-1
3780.52cm-1
3698.94cm-1
1387.99cm-1
1078.32cm-13914.78cm-1
3435.28cm-1
636.19cm-1
579.58cm-1
1629.52cm-1
1093.92cm-1445.06cm-1
MPKS
MPKSF-As
OH C=O C-O M-O
1625.71
1387.99
C-C
1078.32
3430.14
573.35
As-O
Fig. 11 FTIR spectrum of MPKSF and MPKSF–As
Fig. 12 XRD diffractogram of
MPKSF–As
4588 Appl Water Sci (2017) 7:4573–4591
123

that the pore size of MPKSF was affected after the
adsorption process. The size of the pores reduced compared
to the pore size of MPKSF before adsorption. This is
possibly due to the formation of the inner-sphere com-
plexes of As(III) ion with Fe3O4 in MPKSF on the walls of
the external pores.
Energy dispersive X-ray analysis (EDX) analysis
The energy dispersive X-ray analysis is used to detect the
presence of arsenic after adsorption by MPKSF. Figure 14
illustrates EDX spectrum of MPKSF–As. The spectrum
showed the peaks similar to the untreated MPKSF for
carbon, oxygen, iron and phosphorus. However, after the
adsorption process, the presence of As(III) was detected
with a composition of 0.52% as illustrated in Table 10
below. The amount of arsenic detected is small due to the
low concentration of As used in the adsorption process
which is in the range of 5–100 lg L-1. The composition of
other elements present in the sample was unaffected by the
adsorption process as the composition of these elements are
quite similar to the composition of the untreated MPKSF.
Conclusions
This study demonstrated that the MPKSF effectively
removed As(III) from waste water by the formation of
inner-sphere complexes between the Fe and the As(III).
Further, desorption of the sorbed As(III) was found to be in
very minute concentrations, thereby suggesting that the
sorbed As(III) was rigidly bound by inner-sphere com-
plexation mechanism. An efficient adsorption process was
revealed to take place at pH 6 and 7 and at a longer contact
time. The initial As(III) concentration and adsorbent dose
Table 10 Elemental analysis for sample MPKSF and MPKSF–As
Sample MPKSF MPKSF–As
Weight (%) Weight (%)
Carbon (C) 17.14 18.16
Oxygen (O) 31.63 30.03
Phosphorus (P) 1.78 3.24
Iron (Fe) 49.45 48.05
Arsenic (As) – 0.52
Fig. 13 Micrograph of
MPKSF–As under
magnification a 91550 and
b 96200
Fig. 14 EDX spectrum for
MPKSF–As sample
Appl Water Sci (2017) 7:4573–4591 4589
123

were concluded to be dependent on each other due to the
availability of adsorption binding sites for As(III) presented
by greater dose of the MPKSF. Further, the higher reaction
temperature was shown to generate more residual As(III) in
the solution hence reducing the removal efficiency of
As(III) by MPKSF.
The predicted results from the designed experiment on
the adsorption of As(III) onto MPKSF using Box–Behnken
statistical data revealed that 96% of As(III) removal was
achieved utilizing the optimal conditions at contact time of
44.73 min, initial As(III) concentration maximized to
100 lg L-1, adsorbent dosage of 0.29 g, initial solution pH
of 6.55 and the temperature at 26.38 �C. A verification
experiment conducted using a real waste water sample
resulted in a 95% As(III) removal, which indicated that
0.96% error had occurred.
The adsorption studies suggest that the adsorption of
As(III) onto the MPKSF was highly dependent on pH and
contact time relative to the initial As(III) concentration,
adsorbent dose and temperature. The adsorption data of the
As(III) onto the MPKSF was well described by the Lang-
muir isotherm followed by Temkin and Freundlich
isotherms.
Acknowledgements This work was funded by the Universiti
Teknologi Malaysia research Grant no. 12H29.
Open Access This article is distributed under the terms of the
Creative Commons Attribution 4.0 International License (http://
creativecommons.org/licenses/by/4.0/), which permits unrestricted
use, distribution, and reproduction in any medium, provided you give
appropriate credit to the original author(s) and the source, provide a
link to the Creative Commons license, and indicate if changes were
made.
Publisher’s Note Springer Nature remains neutral with regard to
jurisdictional claims in published maps and institutional affiliations.
References
Addo Ntim S, Mitra S (2011) Removal of trace arsenic to meet
drinking water standards using iron oxide coated multiwall
carbon nanotubes. J Chem Eng Data 56:2077–2083
Adhoum N, Monser L (2002) Removal of cyanide from aqueous
solution using impregnated activated carbon. Chem Eng Process
41:17–21
Anyika C, Asri NAM, Majid ZA, Yahya A, Jaafar J (2017) Synthesis
and characterization of magnetic activatedcarbon developed
from palm kernel shells Nanotechnology for Environmental
Engineering 2:16. doi:10.1007/s41204-017-0027-6
Budinova T, Petrov N, Razvigorova M, Parra J, Galiatsatou P (2006)
Removal of arsenic (III) from aqueous solution by activated
carbons prepared from solvent extracted olive pulp and olive
stones. Ind Eng Chem Res 45:1896–1901
Bundschuh J, Bhattacharya P, Chandrashekharam D (2005) Natural
arsenic in groundwater: occurrences, remediation and manage-
ment. In: Proceedings of the pre-congress workshop ‘‘Natural
Arsenic in Groundwater’’, 32nd international geological con-
gress, Florence, Italy, 18–19 August 2004
Cheng W et al (2016) Competitive sorption of As(V) and Cr(VI) on
carbonaceous nanofibers. Chem Eng J 293:311–318
Ciuro Juncosa E (2008) Adsorption properties of synthetic iron oxides:
as(V) adsorption on goethite (alpha-FeOOH). Dissertation. https://
scholar.google.com/scholar?q=Ciur%C3%B3Juncosa?E?%2820
08%29?Adsorption?properties?of?synthetic?iron?oxides%3A
?As%28V%29?adsorption?on?goethite?%28alpha-FeOOH%
29&btnG=&hl=en&as_sdt=0%2C5. Accessed 04 Sept 2017
Daud WMAW, Ali WSW (2004) Comparison on pore development of
activated carbon produced from palm shell and coconut shell.
Biores Technol 93:63–69
Elizalde-Gonzalez M, Mattusch J, Einicke W-D, Wennrich R (2001)
Sorption on natural solids for arsenic removal. Chem Eng J
81:187–195
El-Said S, Alamri M, El-Barak A-BS, Alsogair O (2009) Adsorptive
removal of arsenite As(III) and arsenate As(V) heavy metals
from waste water using Nigella sativa L Asian. J Sci Res
2:96–104
Freundlich HMF (1906) Over the adsorption in solution. J Phys Chem
57:385–471
Hamdaoui O, Naffrechoux E (2007) Modeling of adsorption
isotherms of phenol and chlorophenols onto granular activated
carbon: part I. Two-parameter models and equations allowing
determination of thermodynamic parameters. J Hazard Mater
147:381–394
Hussein M, Tarmizi R, Zainal Z, Ibrahim R, Badri M (1996)
Preparation and characterization of active carbons from oil palm
shells. Carbon 34:1447–1449
Ito F, Nakanaga T, Takeo H, Essig K, Jones H (1995) The FTIR
absorption spectrum of the fundamental band of the AsO radical.
J Mol Spectrosc 174:417–424
Itodo A, Itodo H (2010) Sorption energies estimation using Dubinin–
Radushkevich and Temkin adsorption isotherms. Life Sci J Acta
Zhengzhou Univ Overseas Ed 7:31–39
Jain C, Ali I (2000) Arsenic: occurrence, toxicity and speciation
techniques. Water Res 34:4304–4312
Jolstera R, Gunneriusson L, Holmgren A (2012) Surface complex-
ation modeling of Fe3O4–H? and Mg(II) sorption onto
maghemite and magnetite. J Colloid Interface Sci 386:260–267
Kumar A, Prasad B, Mishra IM (2008) Optimization of process
parameters for acrylonitrile removal by a low-cost adsorbent
using Box–Behnken design. J Hazard Mater 150:174–182.
doi:10.1016/j.jhazmat.2007.09.043
Kunamneni A, Singh S (2005) Response surface optimization of
enzymatic hydrolysis of maize starch for higher glucose
production. Biochem Eng J 27:179–190
Liu C-H, Chuang Y-H, Chen T-Y, Tian Y, Li H, Wang M-K, Zhang
W (2015) Mechanism of arsenic adsorption on magnetite
nanoparticles from water: thermodynamic and spectroscopic
studies. Environ Sci Technol 49:7726–7734
Mandal S, Sahu MK, Patel RK (2013) Adsorption studies of arsenic
(III) removal from water by zirconium polyacrylamide hybrid
material (ZrPACM-43). Water Resour Ind 4:51–67
Maurya NS, Mittal AK (2006) Applicability of equilibrium isotherm
models for the biosorptive uptakes in comparison to activated
carbon-based adsorption. J Environ Eng 132:1589–1599
Mayo J et al (2007) The effect of nanocrystalline magnetite size on
arsenic removal. Sci Technol Adv Mater 8:71–75
Milonjic S, Kopecni M, Ilic Z (1983) The point of zero charge and
adsorption properties of natural magnetite. J Radioanal Nucl
Chem 78:15–24
Nakahira A, Nishida S, Fukunishi K (2006) Adsorption of contam-
inants by MACs and magnetic separation. J Ceram Soc
114:135–137
4590 Appl Water Sci (2017) 7:4573–4591
123

Okeola F, Odebunmi E (2010) Freundlich and Langmuir isotherms
parameters for adsorption of methylene blue by activated carbon
derived from agrowastes. Adv Nat Appl Sci 4:281–288
O’Reilly SE, Strawn DG, Sparks DL (2001) Residence time effects on
arsenate adsorption/desorption mechanisms on goethite. Soil Sci
Soc Am J 65:67–77. doi:10.2136/sssaj2001.65167x
Pattanayak J, Mondal K, Mathew S, Lalvani S (2000) A parametric
evaluation of the removal of As(V) and As(III) by carbon-based
adsorbents. Carbon 38:589–596
Payne KB, Abdel-Fattah TM (2005) Adsorption of arsenate and
arsenite by iron-treated activated carbon and zeolites: effects of
pH, temperature, and ionic strength. J Environ Sci Health
40:723–749
Ribeiro MA, Goncalves AR, Rocha GJM, Quintana G (2006)
Cadmium and nickel removal from water by using activated
carbon obtained from sugarcane lignin. Reunion Iberica de
Adsorcion 116:14
Samsuri AW, Sadegh-Zadeh F, Seh-Bardan BJ (2013) Adsorption of
As(III) and As(V) by Fe coated biochars and biochars produced
from empty fruit bunch and rice husk. J Environ Chem Eng
1:981–988
Sayle R (2000) Physiological ionization and pKa prediction. Euro
MUG. https://scholar.google.com/scholar?hl=en&q=Sayle%2C?
R?Physiological?ionization?and?pKa?prediction?Metaphorics
?LLC%3A?2000?http%3A%2F%2Fwwwdaylightcom%2F
meetings%2Femug00%2FSayle%2Fpkapredicthtml&btnG=&as_
20. Accessed 04 Sept 2017
Schwertmann U, Murad E (1983) Effect of pH on the formation of
goethite and hematite from ferrihydrite. Clays Clay Miner
31:277–284
Segurola J, Allen NS, Edge M, Mc Mahon A (1999) Design of
eutectic photoinitiator blends for UV/visible curable acrylated
printing inks and coatings. Prog Org Coat 37:23–37
Shehzad A, Bashir MJ, Sethupathi S, Lim J-W (2016) An insight into
the remediation of highly contaminated landfill leachate using
sea mango based activated bio-char: optimization, isothermal
and kinetic studies. Desalin Water Treat 57:22244–22257
Tan I, Ahmad A, Hameed B (2008) Preparation of activated carbon
from coconut husk: optimization study on removal of 2,4,6-
trichlorophenol using response surface methodology. J Hazard
Mater 153:709–717
Temkin MI (1941) Adsorption equilibrium and the kinetics of
processes on nonhomogeneous surfaces and in the interaction
between adsorbed molecules. Zh Fiz Chim 15:296–332
Trakal L, Veselska V, Safarık I, Vıtkova M, Cıhalova S, Komarek M
(2016) Lead and cadmium sorption mechanisms on magnetically
modified biochars. Biores Technol 203:318–324
Vance DB (2002) Arsenic chemical behavior and treatment. Internet
WHO (1981) Arsenic, environmental health criteria 18. World Health
Organization, Geneva
Xu J, Gao N, Tang Y, Deng Y, Sui M (2010) Perchlorate removal
using granular activated carbon supported iron compounds:
synthesis, characterization and reactivity. J Environ Sci
22:1807–1813
Yakout SM, Sharaf El-Deen G (2016) Characterization of activated
carbon prepared by phosphoric acid activation of olive stones.
Arab J Chem 9:S1155–S1162. doi:10.1016/j.arabjc.2011.12.002
Yao S, Liu Z, Shi Z (2014) Arsenic removal from aqueous solutions
by adsorption onto iron oxide/activated carbon magnetic com-
posite. J Environ Health Sci Eng 12:1
Zou Y et al (2016) Environmental remediation and application of
nanoscale zero-valent iron and its composites for the removal of
heavy metal ions: a review. Environ Sci Technol 50:7290–7304
Appl Water Sci (2017) 7:4573–4591 4591
123
Related Documents