Basics of Technical Analysis

Welcome message from author
This document is posted to help you gain knowledge. Please leave a comment to let me know what you think about it! Share it to your friends and learn new things together.
Transcript
Basics of Technical Analysis
Disclaimer
This document has been prepared by Bernstein Bank GmbH, exclusively for the purposes of aninformational presentation by Bernstein Bank GmbH. The presentation must not be modified ordisclosed to third parties without the explicit permission of Bernstein Bank GmbH. Any persons whomay come into possession of this information and these documents must inform themselves of therelevant legal provisions applicable to the receipt and disclosure of such information, and must complywith such provisions. This presentation may not be distributed in or into any jurisdiction where suchdistribution would be restricted by law. This presentation is provided for general information purposesonly. It does not constitute an offer to enter into a contract on the provision of advisory services or anoffer to buy or sell financial instruments. As far as this presentation contains information not providedby Bernstein Bank GmbH nor established on its behalf, this information has merely been compiledfrom reliable sources without specific verification. Therefore, Bernstein Bank GmbH does not give anywarranty, and makes no representation as to the completeness or correctness of any information oropinion contained herein. Bernstein Bank GmbH accepts no responsibility or liability whatsoever forany expense, loss or damages arising out of, or in any way connected with, the use of all or any part ofthis presentation. This presentation may contain forward-looking statements of future expectations andother forward-looking statements or trend information that are based on current plans, views and/orassumptions and subject to known and unknown risks and uncertainties, most of them being difficult topredict and generally beyond Bernstein Bank GmbH´s control. This could lead to material differencesbetween the actual future results, performance and/or events and those expressed or implied by suchstatements. Bernstein Bank GmbH assumes no obligation to update any forward-looking statement orany other information contained herein.
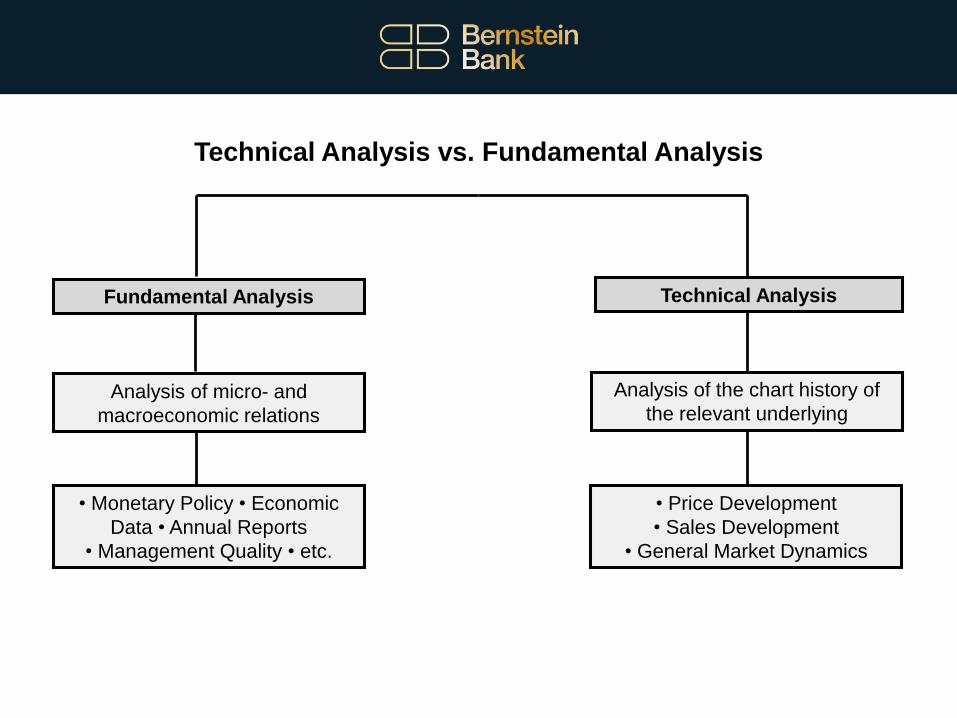
Technical Analysis vs. Fundamental Analysis
Analysis of micro- and
macroeconomic relations
Fundamental Analysis Technical Analysis
• Monetary Policy • Economic
Data • Annual Reports
• Management Quality • etc.
Analysis of the chart history of
the relevant underlying
• Price Development
• Sales Development
• General Market Dynamics
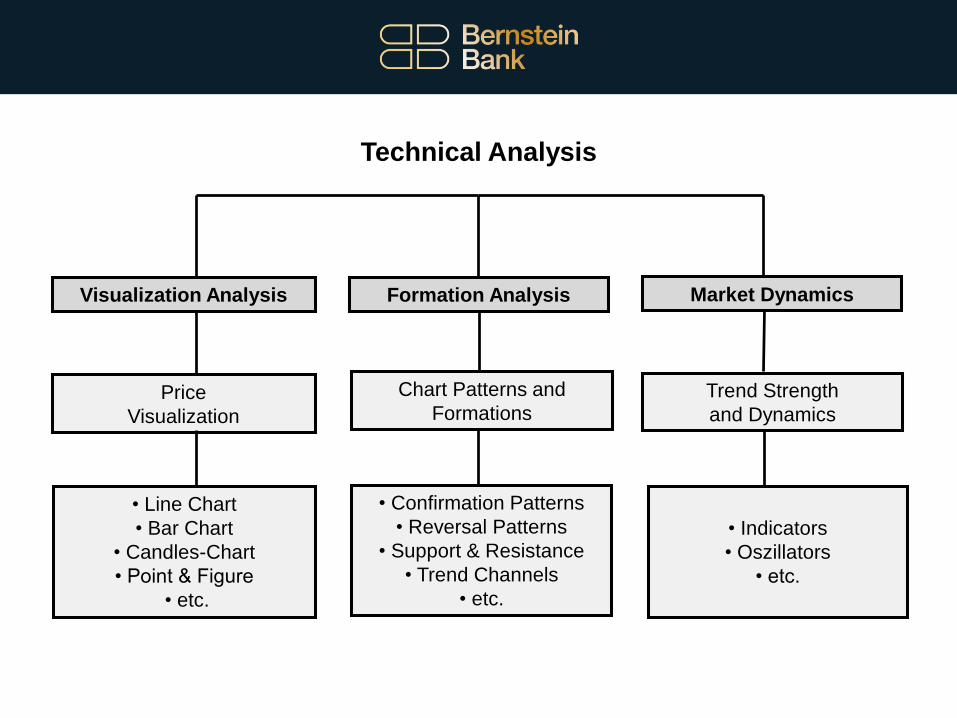
Technical Analysis
Price
Visualization
Visualization Analysis Formation Analysis
• Line Chart
• Bar Chart
• Candles-Chart
• Point & Figure
• etc.
Trend Strength
and Dynamics
• Indicators
• Oszillators
• etc.
Market Dynamics
Chart Patterns and
Formations
• Confirmation Patterns
• Reversal Patterns
• Support & Resistance
• Trend Channels
• etc.
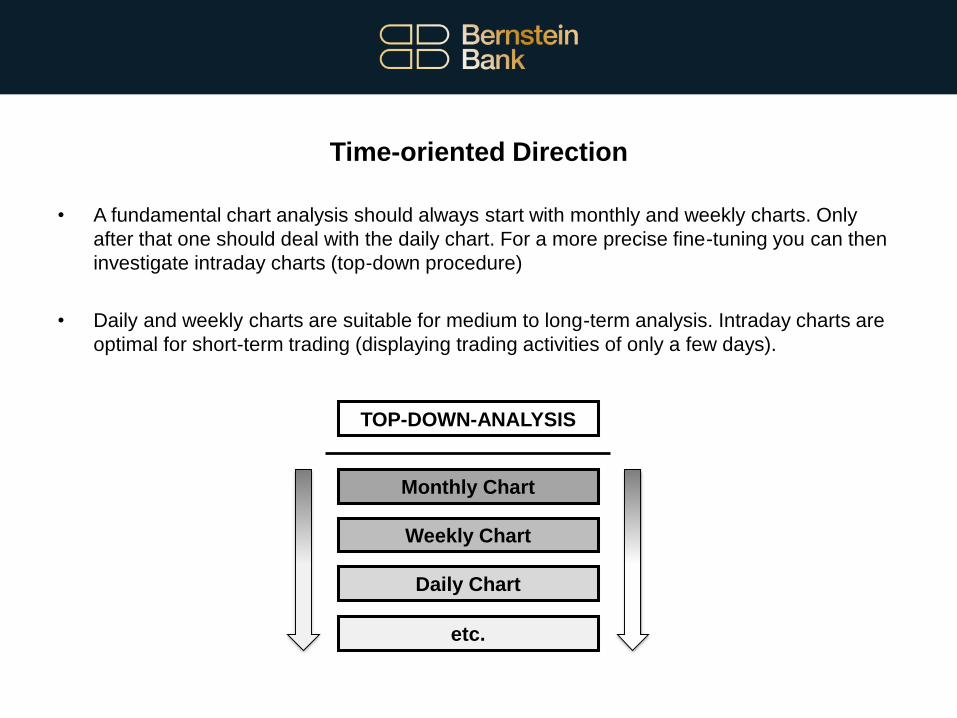
Time-oriented Direction
• A fundamental chart analysis should always start with monthly and weekly charts. Only
after that one should deal with the daily chart. For a more precise fine-tuning you can then
investigate intraday charts (top-down procedure)
• Daily and weekly charts are suitable for medium to long-term analysis. Intraday charts are
optimal for short-term trading (displaying trading activities of only a few days).
Monthly Chart
Weekly Chart
Daily Chart
etc.
TOP-DOWN-ANALYSIS
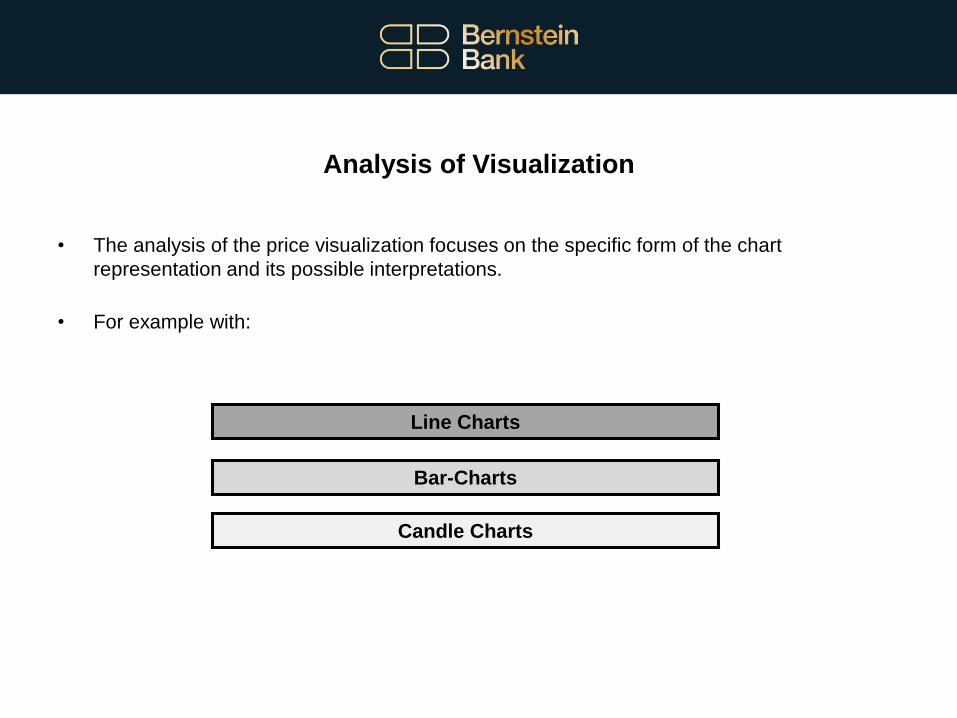
Analysis of Visualization
• The analysis of the price visualization focuses on the specific form of the chart
representation and its possible interpretations.
• For example with:
Line Charts
Bar-Charts
Candle Charts
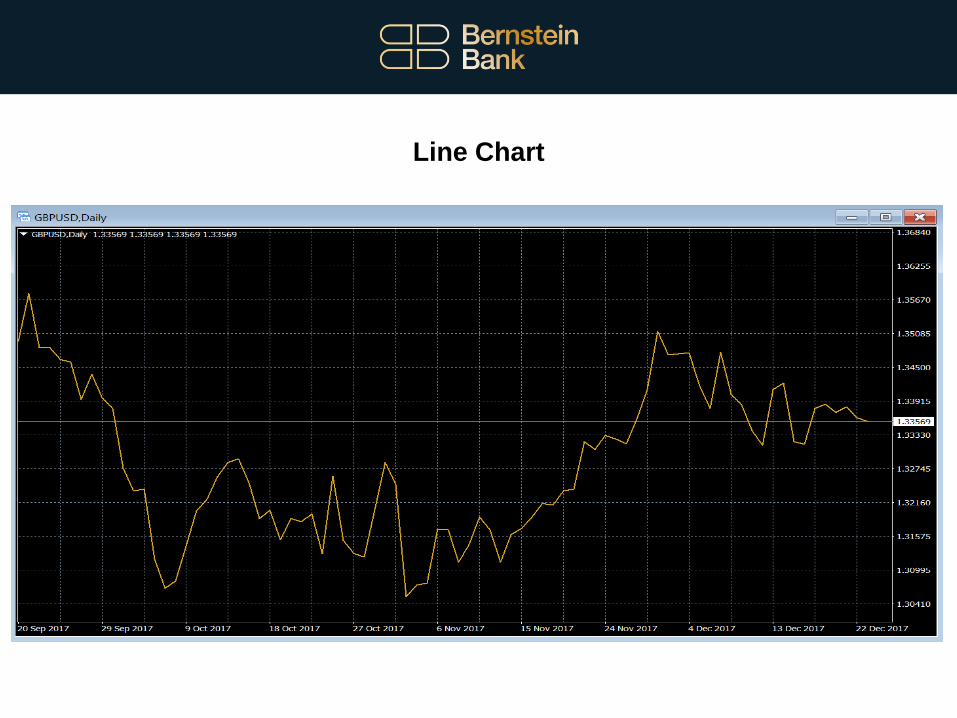
Line Chart
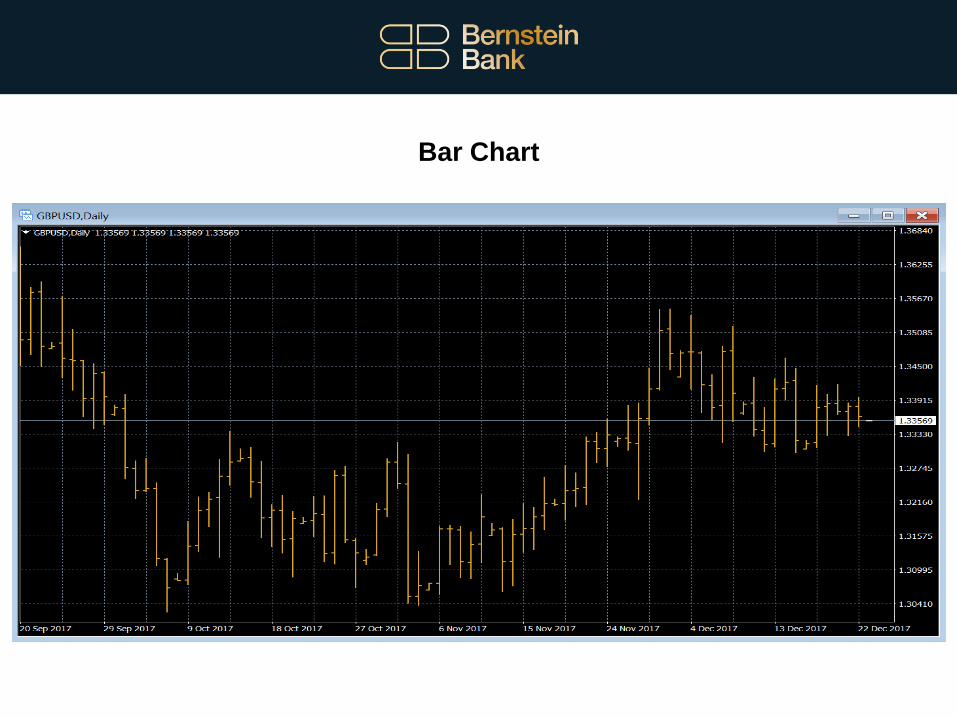
Bar Chart

Candle Sticks
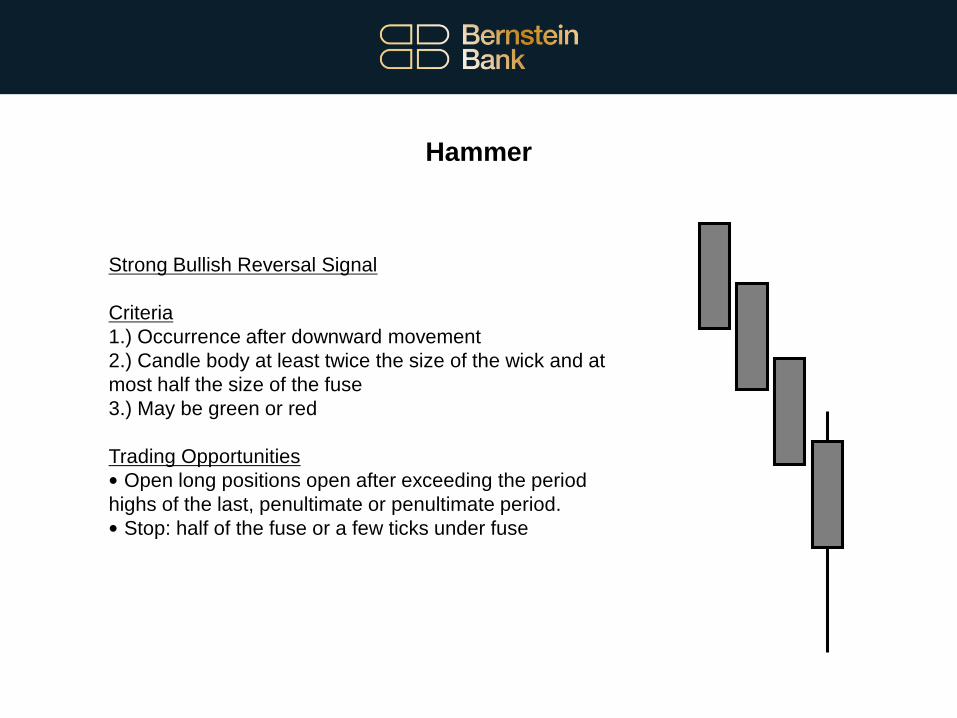
Hammer
Strong Bullish Reversal Signal
Criteria
1.) Occurrence after downward movement
2.) Candle body at least twice the size of the wick and at
most half the size of the fuse
3.) May be green or red
Trading Opportunities
• Open long positions open after exceeding the period
highs of the last, penultimate or penultimate period.
• Stop: half of the fuse or a few ticks under fuse
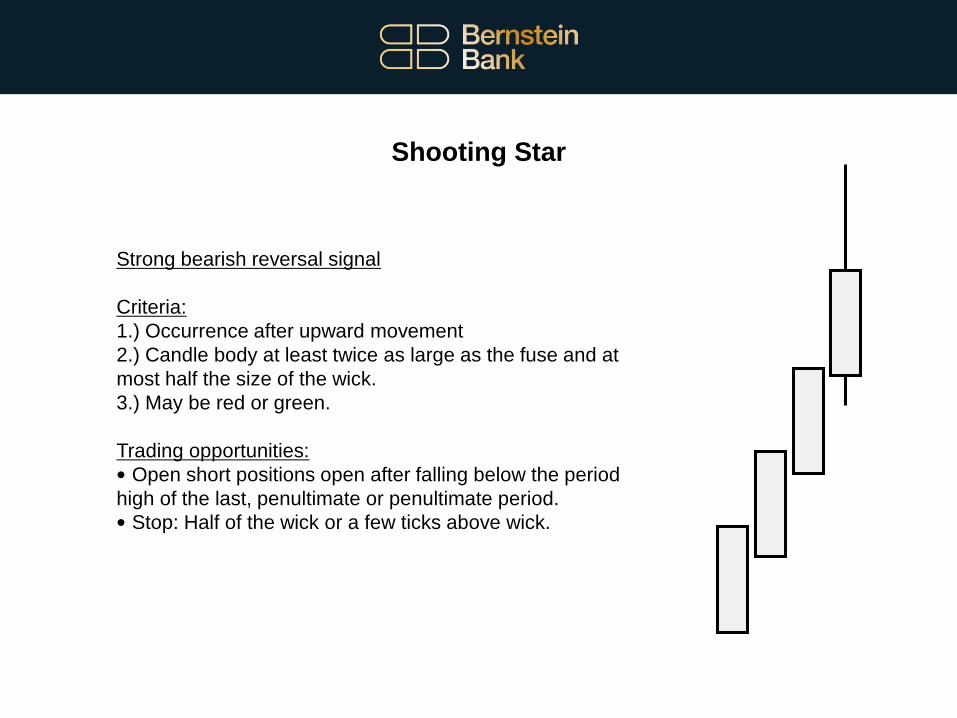
Shooting Star
Strong bearish reversal signal
Criteria:
1.) Occurrence after upward movement
2.) Candle body at least twice as large as the fuse and at
most half the size of the wick.
3.) May be red or green.
Trading opportunities:
• Open short positions open after falling below the period
high of the last, penultimate or penultimate period.
• Stop: Half of the wick or a few ticks above wick.

Formation Analysis
• Formation analysis deals with the teaching of geometric course progressions. Certain chart
patterns (trend confirmation and trend reversal formations) are used to forecast
probabilities for the price trend in the future. For the same purpose, significant resistance
and support zones as well as potential trend developments are identified.
• For example with:
Trend-confirming consolidation formations:
e. g. flags, triangles, pennants
Trend reversal formations:
e. g. double tops & bottoms, shoulder-head-shoulder
Supports & Resistances
Trend Lines & Trend Channels
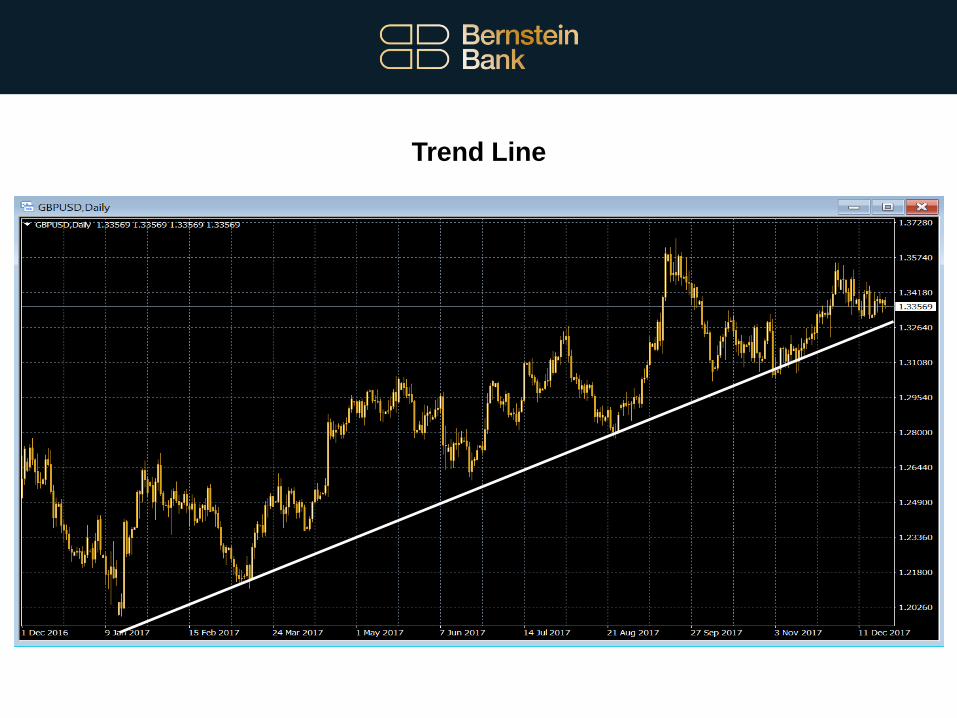
Trend Line
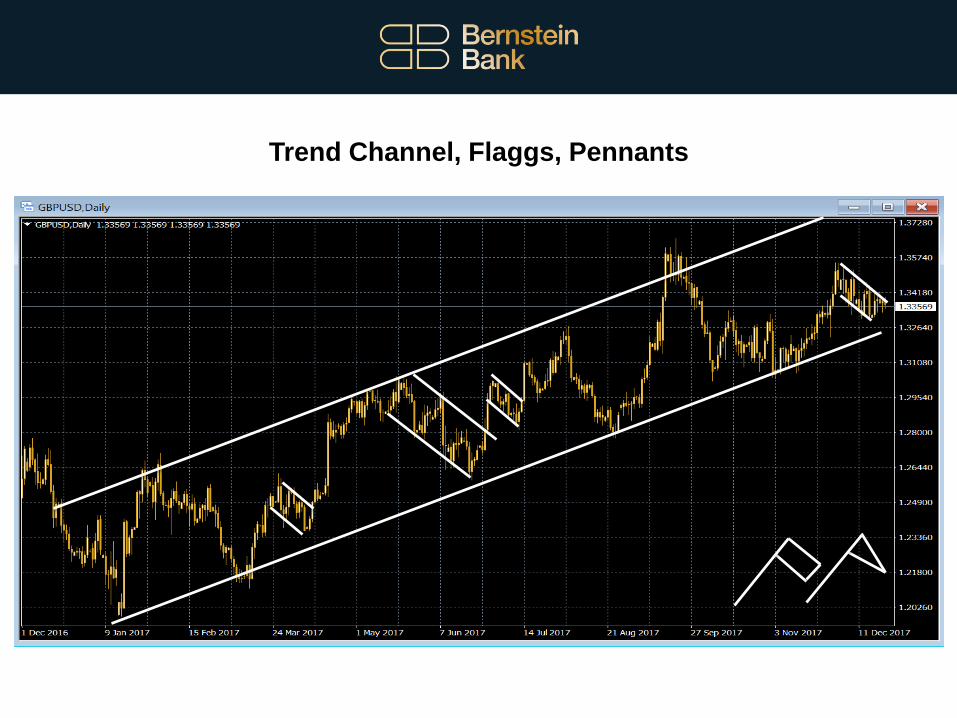
Trend Channel, Flaggs, Pennants

Support, Resistance, Sideways Channel

Sideways Channel, Trend Channel, Rising Triangle

Rounding Top, Double Bottom
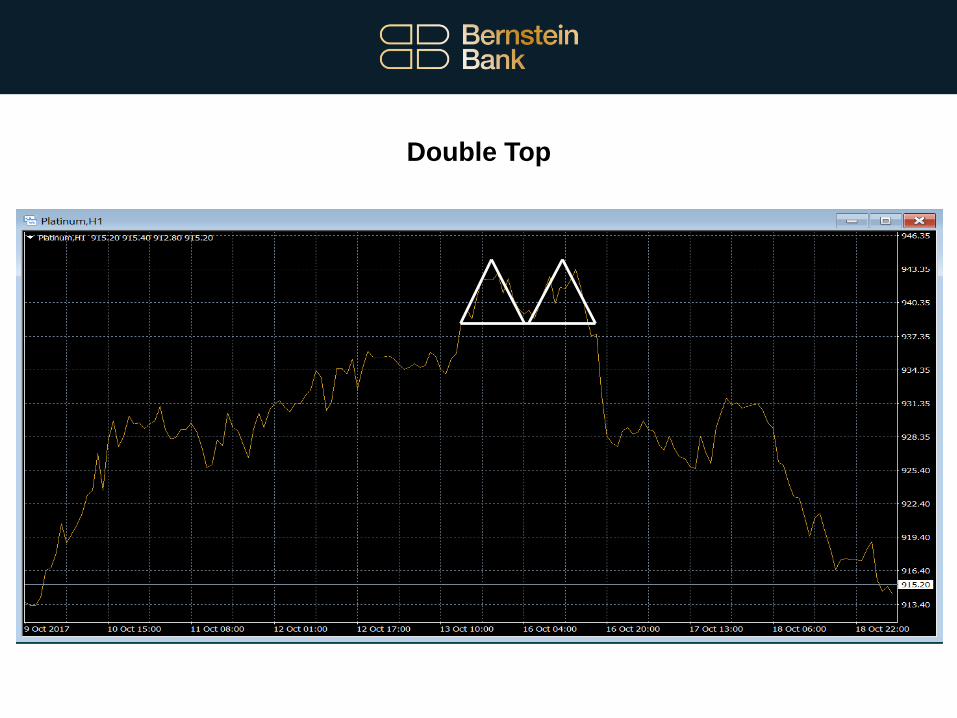
Double Top
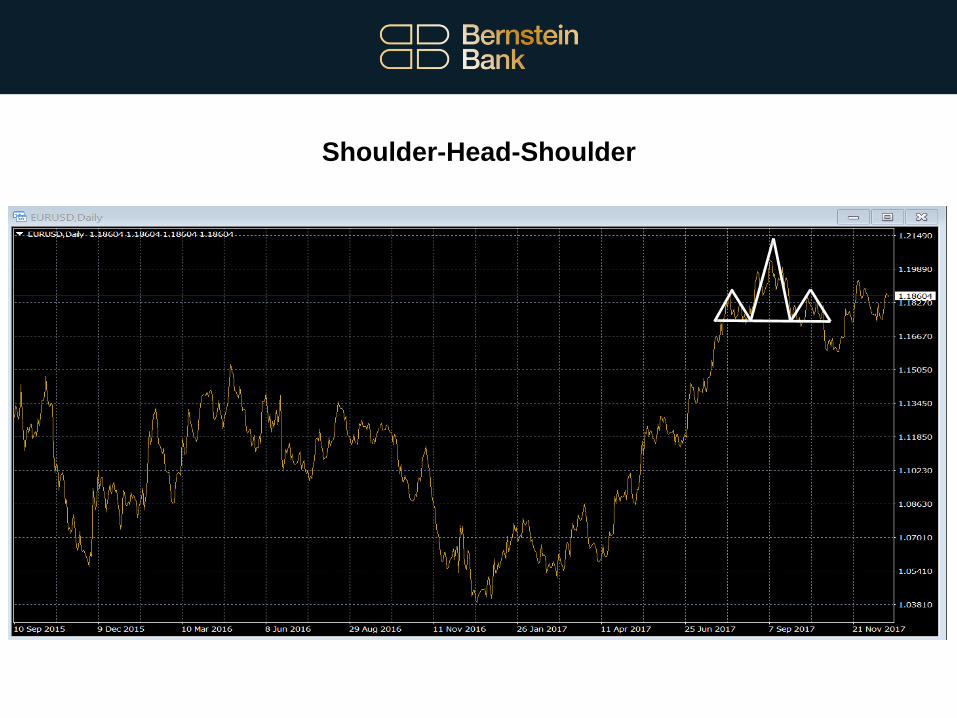
Shoulder-Head-Shoulder
Analysis of Market Dynamics
• The purpose of the analysis of market dynamics is to assess the trend strength of
underlying assets and to identify potential' overbought and oversold' scenarios. Against this
background, entry and exit signals are also qualified.
• For example with:
Indicators:
Determination of trend strength, trend direction and
possible trend breaks
Oscillators:
Identification of potentially overbought or oversold
market situations
Background: Indicators & Oscillators
• Mathematical models to make statements about the probability of future price or market
behavior. Visualization of the result via graphical representation in the chart.
• Indicators are used to identify possible trend changes, identify probable trend directions or
to determine the potential trend strength.
• Depending on the calculation basis, oscillators move within a certain bandwidth or around
a midline (so-called trigger line) to determine possible overbought or oversold situations.

Indicators
Absolute
Indicators
MA
Bollinger Bands
MACD
etc.
Oscillators
(= Relative Indicators)
Stochastic RSI
CCI
etc.
High Relevance
in Trend Markets
High Relevance in
Sideways Markets
Momentum
TRIX Aroon CMO
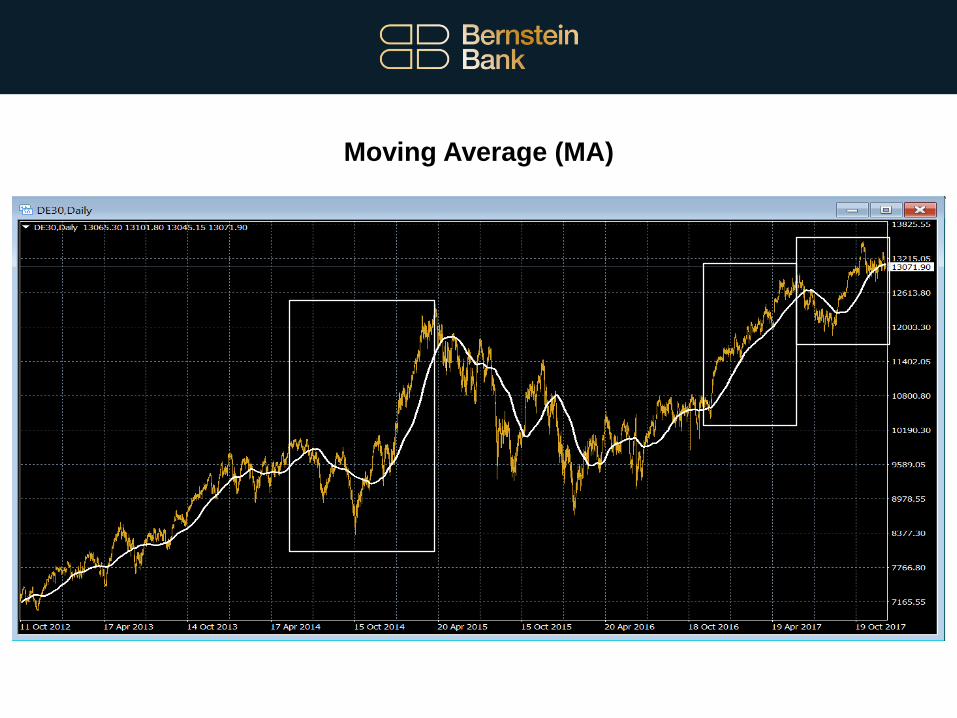
Moving Average (MA)
• Calculation:
Smoothing of the price development by calculating a price average of the rates over a
freely selectable time period.
• Intention: Determination of ...
a) the general trend direction based on the inclination of a long-term MA (= upwards,
downwards or sideways)
b) potential support and resistance zones
c) explicit trading signals by crossing of prices and MA’s as well as MA’s with
each other
Types of Calculation
• Basic variant: Simple moving average (SMA) = simple arithmetic mean of several prices in
a time series (totaling of the closing prices and subsequent division by their number)
• Exponential MA (EMA) puts greater emphasis on recent price development.
• Weighted MA (Weigthed Moving Average WMA): even stronger weighting of the recent
price development (linear weighting)
• Example: Application of daily charts in medium to long-term trading:
200 MA for long-term trends (Big Picture)
50 to 120 employees for medium-term trends
20 to 50 employees for short-term trends
Trading Signals
• Intersections of the price with MA or MAs with each other are interpreted as trading signals:
a) Buy-signal: short-term MA cuts the long-term MA from bottom to top
b) Sell-signal: short-term MA cuts the long-term MA from top to bottom
• Conclusion: Good trading signals in trend markets, rather poor in sideways phases.
However, the quality of the signals always depends on the current market situation and
volatility. There is no magic number combination.
Moving Average (MA)

Moving Average (MA)
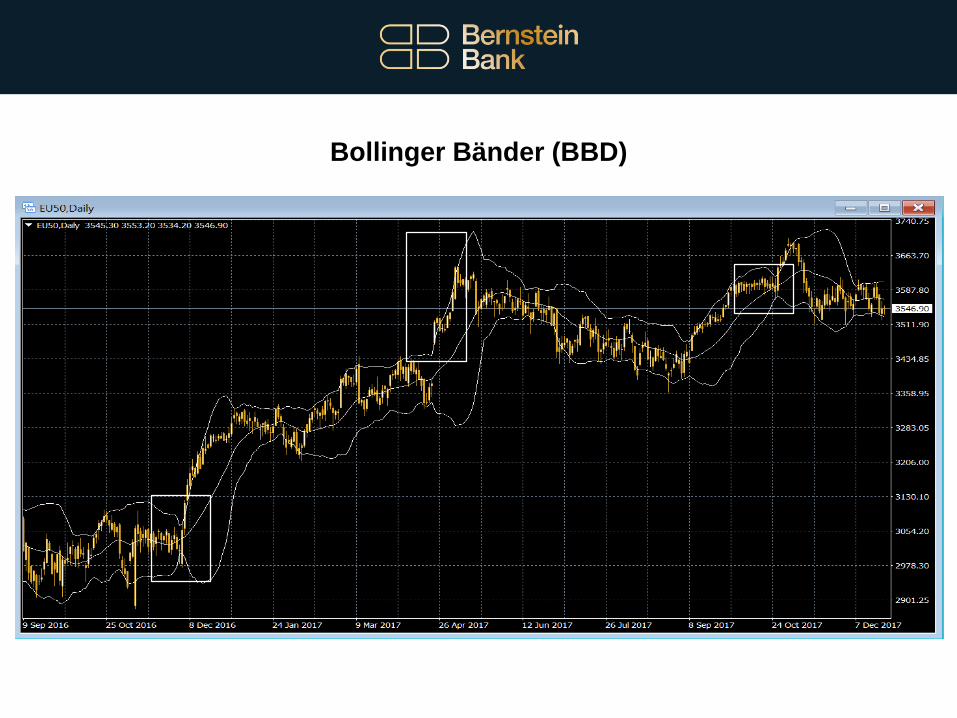
Bollinger Bänder (BBD)
• Intention: measurement of volatility, trend confirmation and reversal, outbreaks
• Calculation: The bands are usually based on the calculation of a single MA 20 and its double standard deviation (straps). The deviation of the bands from the MA depends on the fluctuation intensity (volatility) of the market.
• Wide bands = High price fluctuation Narrow bands = Quiet market
• Trading signals: Chart technically speaking, Bollinger bands often represent strong support lines or resistance lines.
• Should the price touch, exceed or fall below a band several times in succession, a trend acceleration in the existing direction is expected.
• Extreme highs and lows outside the bands indicate a possible trend reversal. Narrowing of the ligaments can in turn indicate a possible impending breakout.
Bollinger Bänder (BBD)
Relative Strength Index (RSI)
• Intention: The Momentum Oscillator RSI visualizes the strength of a price movement. It is based on the ratio of closing prices to each other. This ratio can vary between 0 and 100.
• Trading Signals
a) Overbought: 70 - 100b) Oversold: 0 - 30
If the RSI returns to the normal range, this represents a potential trading signal. In addition, trend divergences give indications of possible impending trend breakdowns.
• Do not use RSI in isolation, but always by complementing and confirmation other indicators.

Relative Strength Index (RSI)
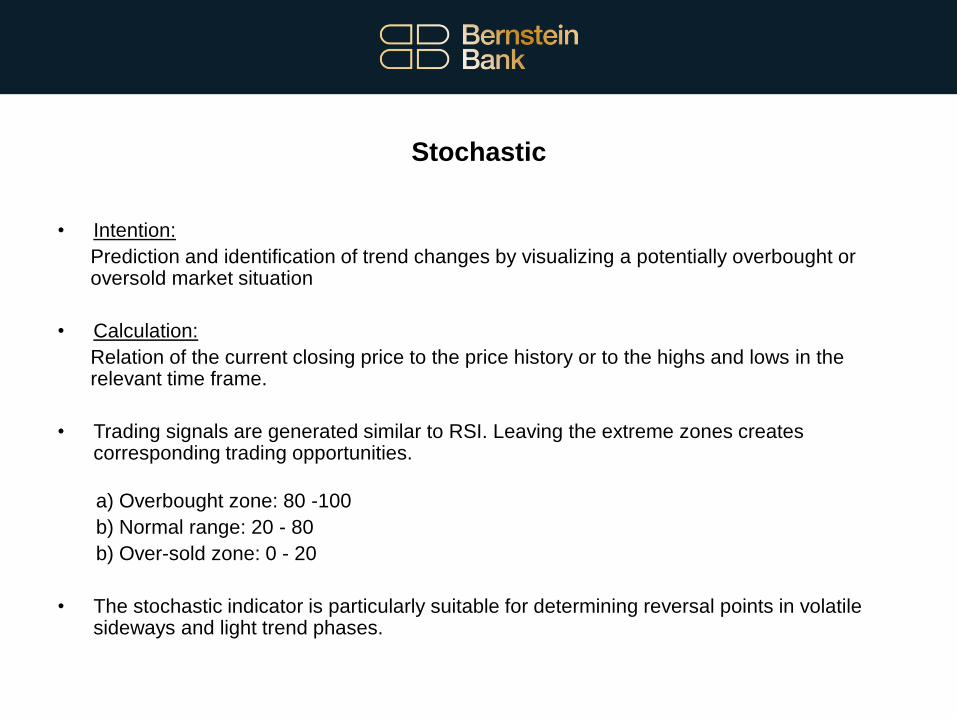
Stochastic
• Intention:
Prediction and identification of trend changes by visualizing a potentially overbought or oversold market situation
• Calculation:
Relation of the current closing price to the price history or to the highs and lows in the relevant time frame.
• Trading signals are generated similar to RSI. Leaving the extreme zones creates corresponding trading opportunities.
a) Overbought zone: 80 -100
b) Normal range: 20 - 80
b) Over-sold zone: 0 - 20
• The stochastic indicator is particularly suitable for determining reversal points in volatile sideways and light trend phases.
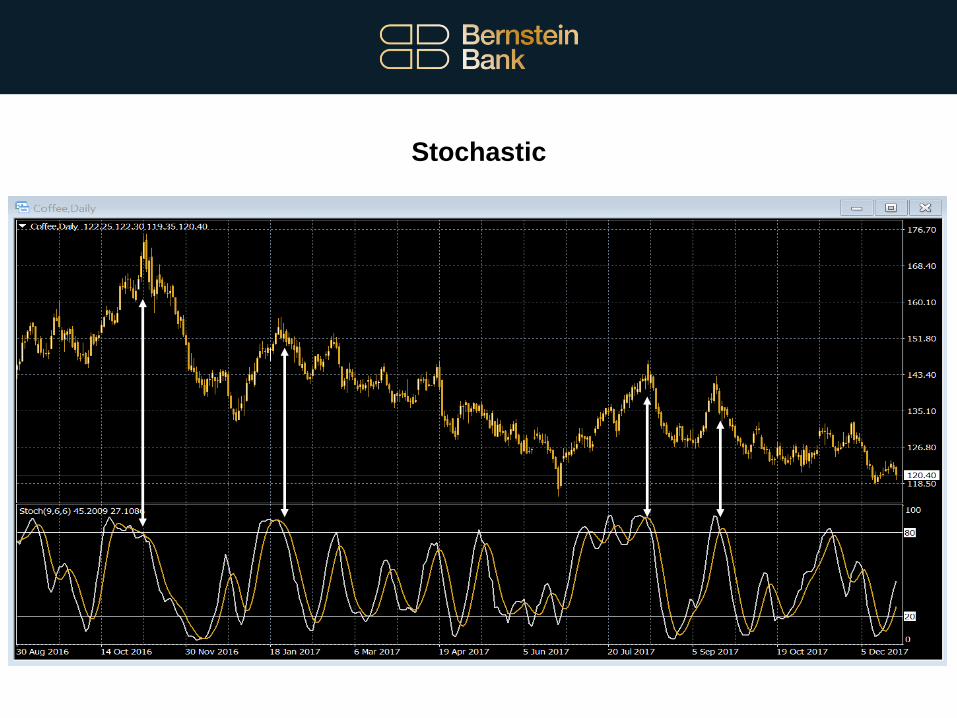
Stochastic

Commodity Channel Index (CCI)
• Intention & Calculation:
Identification of cyclical developments by calculating the price difference to the correlating
MA. Oscillation of the CCI around a zero line.
• Trading Signals
a) Normal range: -100 to + 100
b) Buy-signal: Indicator rises above' -100-line' into the normal range
c) Sell-signal: Indicator falls below' +100-line' into the normal range
• Wait for confirmation of the actual price before making a commitment and position it
exclusively in the direction of the overriding trend.
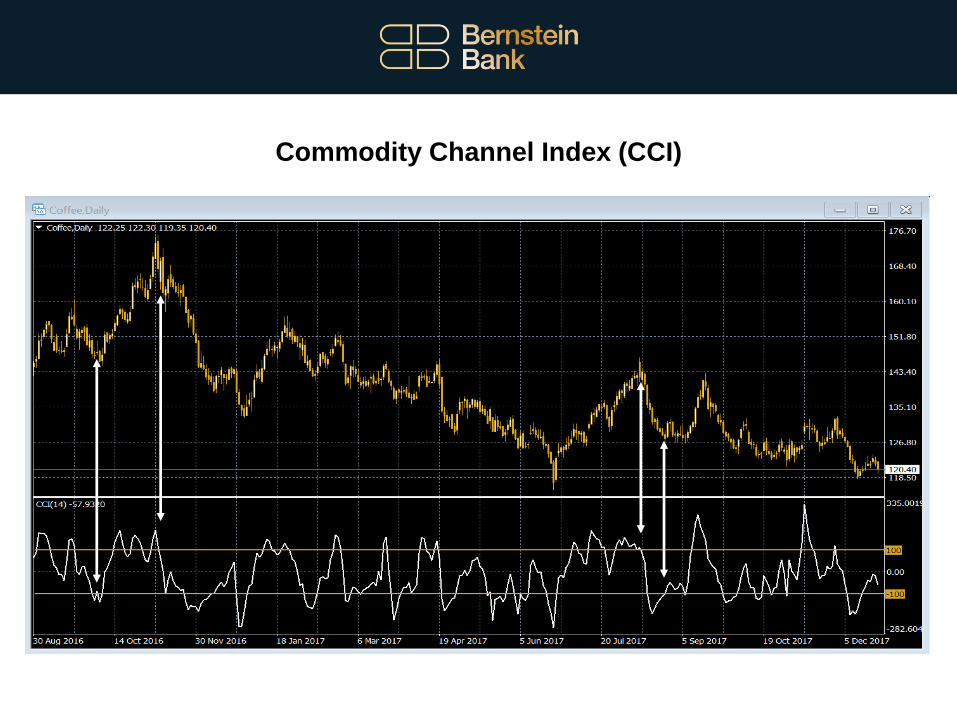
Commodity Channel Index (CCI)

Volume
• A bar chart shows the volume development by showing an increase or decrease in trading activities or turnover.
• Intention: Application for trend confirmation
• Calculation: Volume = number of transactions made or how many financial instruments have changed hands during the relevant period.
• Trend Confirmation Signal: Volume evolves with the trend.
• Vice versa, the volume is also used to indicate divergences.
• Volume divergence: A price movement is not supported or confirmed by a correlated volume increase, indicating a potential eruption (bull or bear trap).
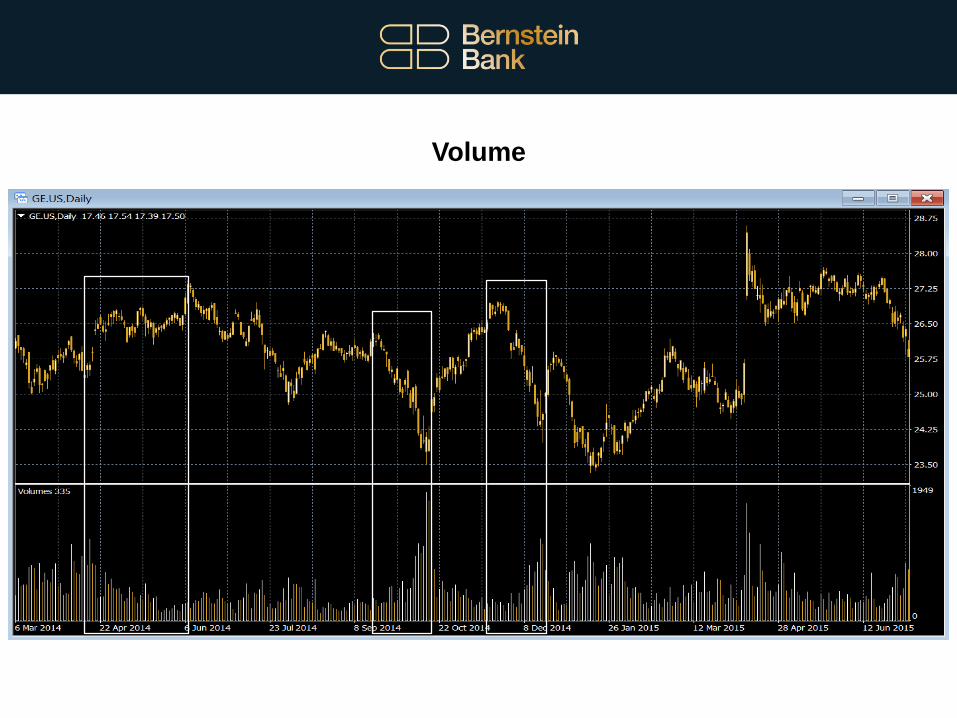
Volume
Summary
• The technical analysis can be used for orientation purposes, in particular for timing within the framework of an entry strategy, as well as for placing meaningful stop-loss and take-profit orders in an exit strategy.
• The charting methods listed here allow conclusions to be drawn - exclusively from a statistical perspective - as to whether a particular underlying asset could be worth an investment or a trade. However, there is no guarantee of success.
• The various instruments of technical analysis should ideally be mutually supportive. From an isolated point of view, the significance is rather limited.
• In this context, technical analysis should also not be used as the sole decision-making criterion.
• Fundamental analysis is a useful supplement, especially with regard to medium- to long-term investment horizons.

Thank you for your Interest
Bernstein Bank GmbH
Maximilianstr. 13
D-80539 München
www.bernstein-bank.com
Related Documents