BASICS OF HYDROGEN TECHNOLOGY Dr. O.P Agarwal, Pawan Mulukutla and Krishnaveni Malladi

Welcome message from author
This document is posted to help you gain knowledge. Please leave a comment to let me know what you think about it! Share it to your friends and learn new things together.
Transcript
1BASICS OF HYDROGEN TECHNOLOGY |
BASICS OFHYDROGEN
TECHNOLOGYDr. O.P Agarwal, Pawan Mulukutla and Krishnaveni Malladi

1.0 GLOBAL ENERGY SCENARIO AND THE TRANSITIONING ROLE OF HYDROGEN 5
2.0 INDIA’S IMPORTS AND EMISSIONS 8
3.0 WHY IS IT NECESSARY TO DEVELOP A GREEN HYDROGEN ECONOMY FOR INDIA? 10
4.0 WHAT IS HYDROGEN 11
4.1 DISCOVERY OF HYDROGEN 12
4.2 HYDROGEN AS AN ENERGY CARRIER 12
4.3 PRODUCTION OF HYDROGEN 13
4.4 ECONOMIC ASPECTS OF PRODUCING HYDROGEN USING DIFFERENT PATHWAYS 18
4.5 HYDROGEN VALUE CHAIN 18
4.6 TECHNOLOGY READINESS LEVELS W.R.T PRODUCTION PATHWAYS GLOBALLY 20
4.7 STORAGE & TRANSPORTATION 20
4.8 END-USE OPPORTUNITIES OF HYDROGEN 22
5.0 CONCLUSION 25
LIST OF ABBREVIATIONS
1. ATR - Auto - Thermal Reforming
2. BG - Biomass Gasification
3. CCS - Carbon Capture and Storage
4. CCUS - Carbon Capture Utilization and Storage
5. CG - Coal Gasification
6. EAF – Electric Arc Furnaces
7. GHGs - Greenhouse Gases
8. GWP - Global Warming Potential
9. MMT – Million Metric Tonnes
10. Mtoe - Million tonnes of oil equivalent
11. PEM - Proton Exchange Membrane
12. POX - Partial Oxidation
13. SMR - Steam Methane Reforming
14. SOE - Solid Oxide Electrolyzer
15. TRL - Technology Readiness Level
CONTENTS

LIST OF FIGURES AND TABLES
Figure 1: World energy consumption in quadrillion Btu 6
Figure 2: Energy mix of India in 2019 and 2040 (In %) 8
Figure 3: India’s power generation mix, 2000-2040 9
Figure 4: Energy related CO2 emissions by sectors 9
Figure 5: Cost of production (in INR) of 1000 MJ of energy, WRI India estimates 12
Figure 6: SMR schematic representation 14
Figure 7: Coal gasification 15
Figure 8: Schematic diagram of electrolysis process 16
Figure 9: Four types of electrolysis in hydrogen production 16
Figure 10: Biomass gasification 17
Figure 11: Production cost of hydrogen 18
Figure 12: Hydrogen value chain 19
Figure 13: End use of hydrogen 22
Table 1: Different pathways of producing hydrogen 15
Table 2: Different colour codes of hydrogen, their production pathways 15
Table 3: Comparison of different electrolysers 20
Table 4: Technology readiness level for different pathways of hydrogen production 23
Table 5: Storage methods of hydrogen 24
Table 6: Transportation modes of hydrogen and issues 25
4
SUMMARYConcerns over climate change are driving the world to explore viable green alternatives, such as solar and wind energy, to replace conventional sources such as fossil fuels. Over the last few years, there has been a global surge of interest in hydrogen as an alternative fuel owing to the wide variety of sources from which it can be produced. Hydrogen provides high-grade heat, with the energy content being about three times higher than that of gasoline. Newer technologies are evolving to produce hydrogen on a large scale, with reduced carbon footprint. Based on the source of production, hydrogen is generally labeled as green, gray, and blue. Efforts are on to improve production efficiency, which would lead to reduced costs and improved economics. Hydrogen is also amenable to transportation in the same manner as fossil fuels, albeit with additional precautions. These factors make hydrogen uniquely positioned to be used pervasively as a new pathway for reducing greenhouse gas emissions. The transition of hydrogen from an obscure industrial-use gas to an energy carrier is an exciting prospect that allows for the remaking of energy markets and a transformation in our lifestyles in the forthcoming decades. Clearly, hydrogen is an idea whose time has come.
5BASICS OF HYDROGEN TECHNOLOGY |
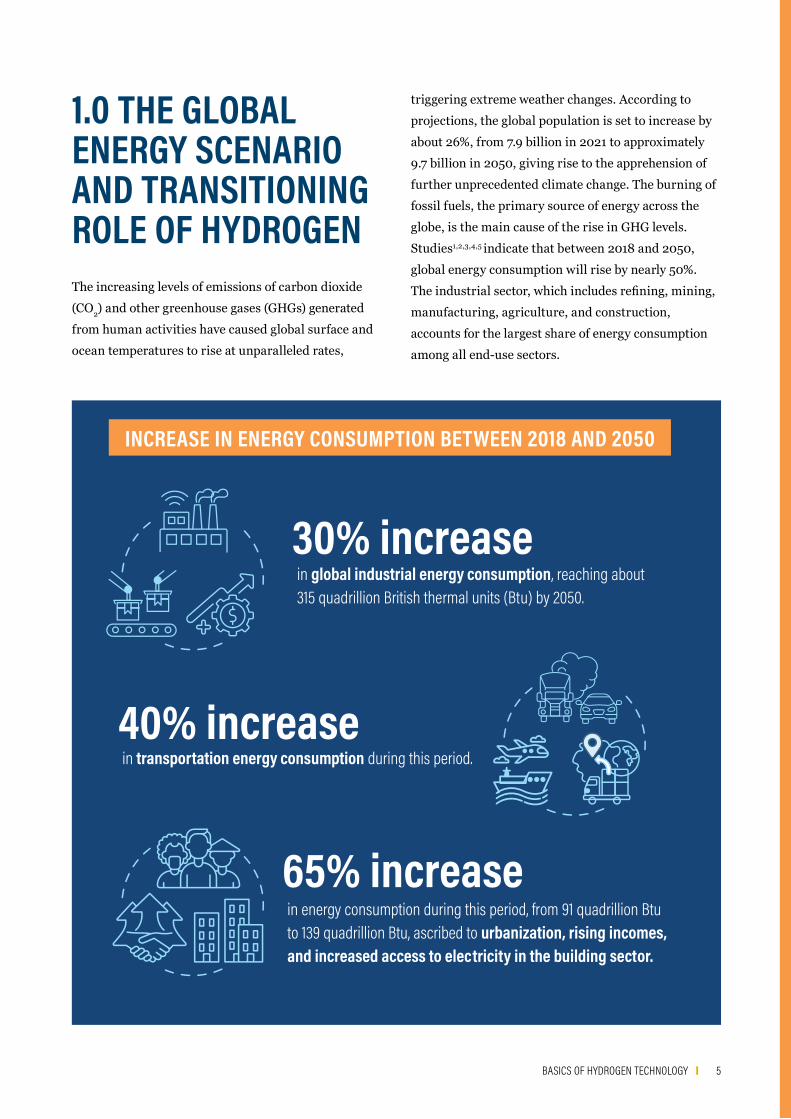
in energy consumption during this period, from 91 quadrillion Btu to 139 quadrillion Btu, ascribed to urbanization, rising incomes, and increased access to electricity in the building sector.
65% increase
in transportation energy consumption during this period.40% increase
in global industrial energy consumption, reaching about
315 quadrillion British thermal units (Btu) by 2050.
30% increase
1.0 THE GLOBAL ENERGY SCENARIO AND TRANSITIONING ROLE OF HYDROGENThe increasing levels of emissions of carbon dioxide (CO2) and other greenhouse gases (GHGs) generated from human activities have caused global surface and ocean temperatures to rise at unparalleled rates,
triggering extreme weather changes. According to projections, the global population is set to increase by about 26%, from 7.9 billion in 2021 to approximately 9.7 billion in 2050, giving rise to the apprehension of further unprecedented climate change. The burning of fossil fuels, the primary source of energy across the globe, is the main cause of the rise in GHG levels. Studies1,2,3,4,5 indicate that between 2018 and 2050, global energy consumption will rise by nearly 50%. The industrial sector, which includes refining, mining, manufacturing, agriculture, and construction, accounts for the largest share of energy consumption among all end-use sectors.
INCREASE IN ENERGY CONSUMPTION BETWEEN 2018 AND 2050
6
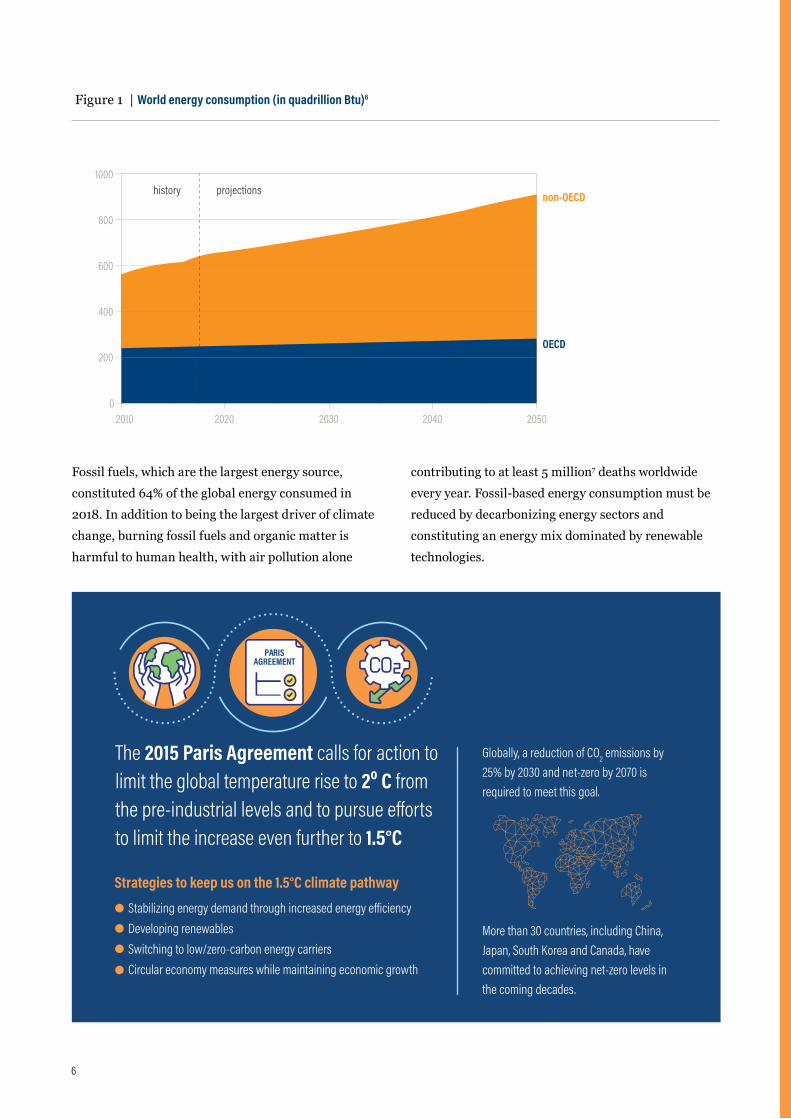
Fossil fuels, which are the largest energy source, constituted 64% of the global energy consumed in 2018. In addition to being the largest driver of climate change, burning fossil fuels and organic matter is harmful to human health, with air pollution alone
contributing to at least 5 million7 deaths worldwide every year. Fossil-based energy consumption must be reduced by decarbonizing energy sectors and constituting an energy mix dominated by renewable technologies.
400
600
800
1000
200
02010 2020 2030 2040 2050
OECD
non-OECD
Price
(Tho
usan
d Yua
n)
history projections
Figure 1 | World energy consumption (in quadrillion Btu)6
PARISAGREEMENT
Globally, a reduction of CO2 emissions by 25% by 2030 and net-zero by 2070 is required to meet this goal.
More than 30 countries, including China, Japan, South Korea and Canada, have committed to achieving net-zero levels in the coming decades.
Strategies to keep us on the 1.5°C climate pathway
7BASICS OF HYDROGEN TECHNOLOGY |
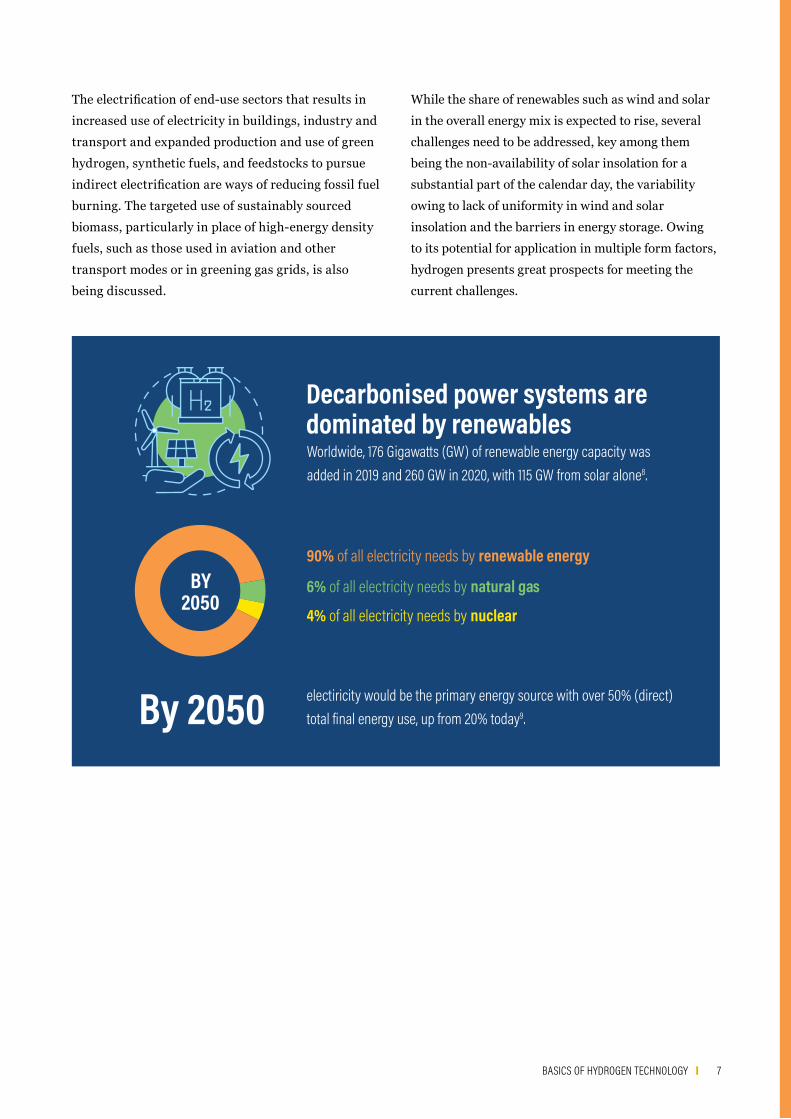
The electrification of end-use sectors that results in increased use of electricity in buildings, industry and transport and expanded production and use of green hydrogen, synthetic fuels, and feedstocks to pursue indirect electrification are ways of reducing fossil fuel burning. The targeted use of sustainably sourced biomass, particularly in place of high-energy density fuels, such as those used in aviation and other transport modes or in greening gas grids, is also being discussed.
While the share of renewables such as wind and solar in the overall energy mix is expected to rise, several challenges need to be addressed, key among them being the non-availability of solar insolation for a substantial part of the calendar day, the variability owing to lack of uniformity in wind and solar insolation and the barriers in energy storage. Owing to its potential for application in multiple form factors, hydrogen presents great prospects for meeting the current challenges.
90% of all electricity needs by renewable energy
6% of all electricity needs by natural gas
4% of all electricity needs by nuclear
Decarbonised power systems are dominated by renewablesWorldwide, 176 Gigawatts (GW) of renewable energy capacity was added in 2019 and 260 GW in 2020, with 115 GW from solar alone8.
electiricity would be the primary energy source with over 50% (direct) total final energy use, up from 20% today9.By 2050
BY 2050
8
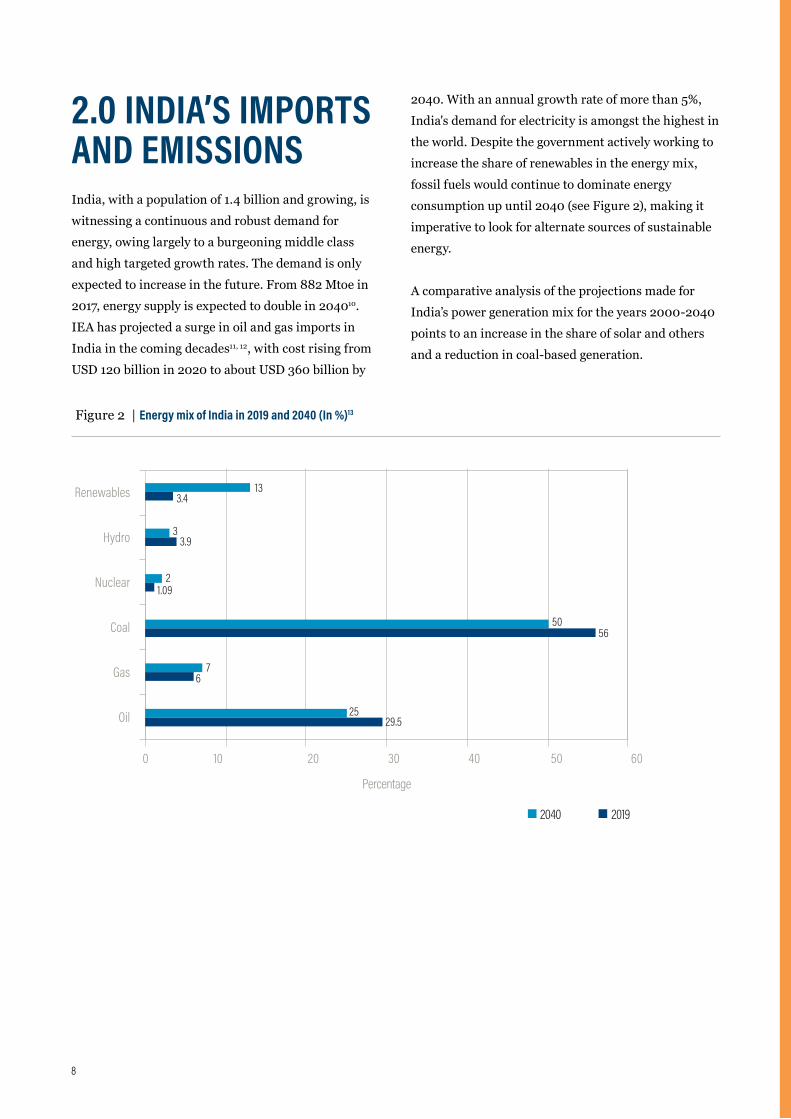
2.0 INDIA’S IMPORTS AND EMISSIONSIndia, with a population of 1.4 billion and growing, is witnessing a continuous and robust demand for energy, owing largely to a burgeoning middle class and high targeted growth rates. The demand is only expected to increase in the future. From 882 Mtoe in 2017, energy supply is expected to double in 204010. IEA has projected a surge in oil and gas imports in India in the coming decades11, 12, with cost rising from USD 120 billion in 2020 to about USD 360 billion by
2040. With an annual growth rate of more than 5%, India's demand for electricity is amongst the highest in the world. Despite the government actively working to increase the share of renewables in the energy mix, fossil fuels would continue to dominate energy consumption up until 2040 (see Figure 2), making it imperative to look for alternate sources of sustainable energy.
A comparative analysis of the projections made for India’s power generation mix for the years 2000-2040 points to an increase in the share of solar and others and a reduction in coal-based generation.
Figure 2 | Energy mix of India in 2019 and 2040 (In %)13
Renewables
Hydro
Nuclear
Coal
Gas
Oil
0 10
2040 2019
20 30 40 50 60
Percentage
133.4
33.9
21.09
50
76
2529.5
56
9BASICS OF HYDROGEN TECHNOLOGY |
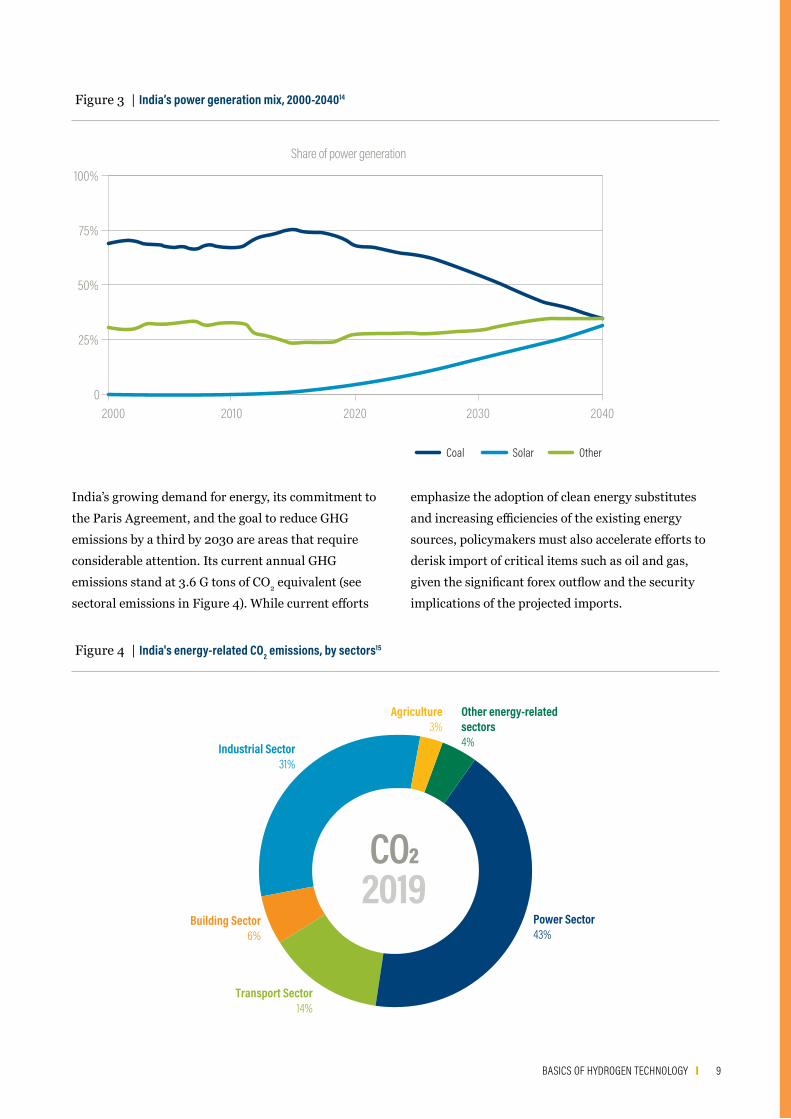
India’s growing demand for energy, its commitment to the Paris Agreement, and the goal to reduce GHG emissions by a third by 2030 are areas that require considerable attention. Its current annual GHG emissions stand at 3.6 G tons of CO2 equivalent (see sectoral emissions in Figure 4). While current efforts
emphasize the adoption of clean energy substitutes and increasing efficiencies of the existing energy sources, policymakers must also accelerate efforts to derisk import of critical items such as oil and gas, given the significant forex outflow and the security implications of the projected imports.
Figure 3 | India’s power generation mix, 2000-204014
Figure 4 | India's energy-related CO2 emissions, by sectors15
Share of power generation
50%
75%
100%
25%
02000 2010 2020 2030 2040
Coal Solar Other
Industrial Sector31%
Transport Sector14%
Agriculture3%
Other energy-relatedsectors*4%
Power Sector43%
Building Sector6%
CO2
2019
10
New models of energy auction have seen rates per unit of electricity hit a rock bottom price of about INR 2 per kWh unit (~2.67 cents/kWh unit). Although solar energy is green and has almost zero carbon emissions, it is an unreliable source. In order to overcome this limitation, the multiple uses of hydrogen generated from green sources of energy can be explored alongside the existing low carbon hydrogen streams. This would also help lower the import bill.
3.0 WHY IS IT NECESSARY TO DEVELOP A GREEN HYDROGEN ECONOMY FOR INDIA?Solar energy is a highly cost-competitive alternative to fossil fuels and increasing the availability of solar energy and its share in the overall energy mix of India
raises exciting possibilities of using alternate pathways of storing, using and reusing energy to meet the demands of various sectors. One such pathway is the utilization of hydrogen as an energy carrier. The solar-hydrogen cycle has the potential to lead the country to a more sustainable energy future. Hydrogen technology promises to be a solution for various sectors. Owing to its application in the transportation sector as fuel and storage of energy, hydrogen must be explored as a policy tool for strategic investment as also for derisking the exposure to increasing imports of fossil fuels. Hydrogen can also be used to produce intermediate energy sources, such as methanol, ammonia, synthetic and natural gas. With the right pricing and other economics in place, hydrogen has the potential to replace fossil fuels to a large extent and protect the economy from the vagaries of international oil markets. For the enormous scale at which it is required in India, a hydrogen economy must be initiated in which hydrogen technology is applied in local solutions, making India self-reliant in its energy needs. This will also provide to the country the flexibility to make choices on the global stage and heighten the interest of multiple stakeholders in the hydrogen ecosystem.
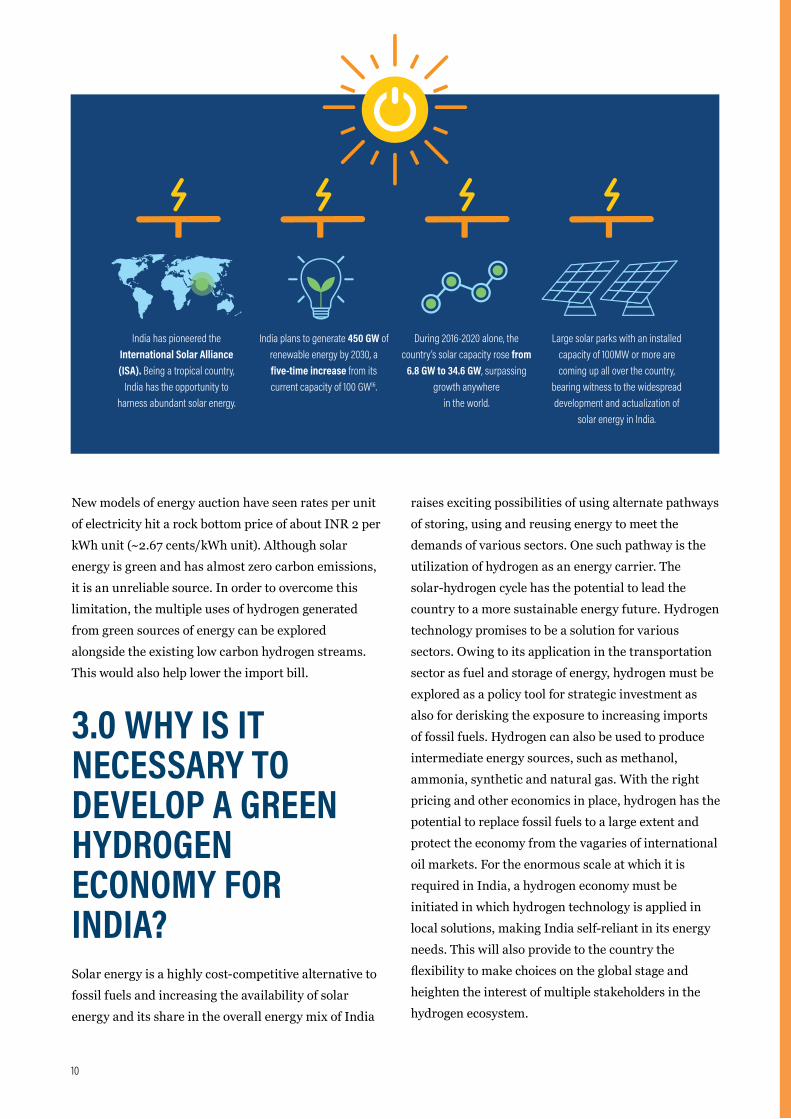
India has pioneered the International Solar Alliance (ISA). Being a tropical country,
India has the opportunity to harness abundant solar energy.
India plans to generate 450 GW of renewable energy by 2030, a five-time increase from its current capacity of 100 GW16.
During 2016-2020 alone, the country’s solar capacity rose from
6.8 GW to 34.6 GW, surpassing growth anywhere
in the world.
Large solar parks with an installed capacity of 100MW or more are coming up all over the country,
bearing witness to the widespread development and actualization of
solar energy in India.
11BASICS OF HYDROGEN TECHNOLOGY |
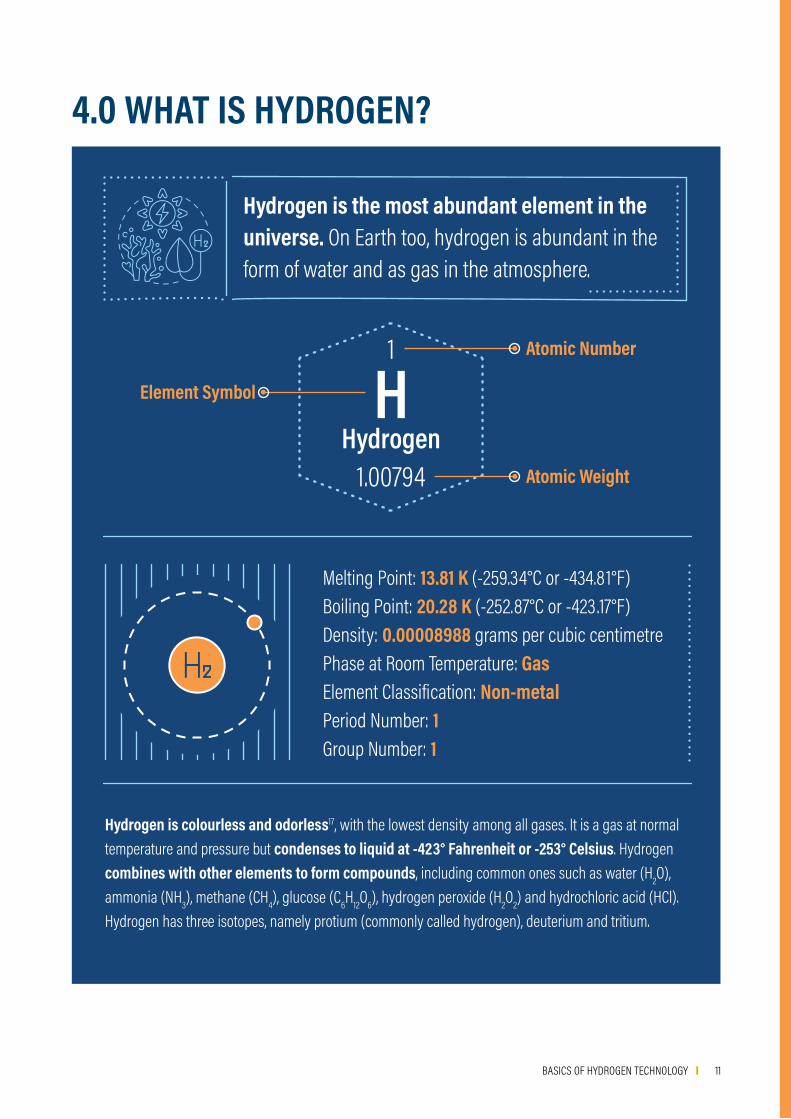
4.0 WHAT IS HYDROGEN?
Hydrogen is the most abundant element in the universe. On Earth too, hydrogen is abundant in the form of water and as gas in the atmosphere.
Melting Point: 13.81 K (-259.34°C or -434.81°F)Boiling Point: 20.28 K (-252.87°C or -423.17°F)Density: 0.00008988 grams per cubic centimetrePhase at Room Temperature: GasElement Classification: Non-metalPeriod Number: 1Group Number: 1
Hydrogen is colourless and odorless17, with the lowest density among all gases. It is a gas at normal temperature and pressure but condenses to liquid at -423° Fahrenheit or -253° Celsius. Hydrogen combines with other elements to form compounds, including common ones such as water (H2O), ammonia (NH3), methane (CH4), glucose (C6H12O6), hydrogen peroxide (H2O2) and hydrochloric acid (HCl). Hydrogen has three isotopes, namely protium (commonly called hydrogen), deuterium and tritium.
1
HHydrogen
1.00794
Atomic Number
Element Symbol
Atomic Weight
12
4.1 DISCOVERY OF HYDROGEN
In the 1500s, alchemist Paracelsus discovered that iron filings on reacting with sulfuric acid produced bubbles that were flammable18. This was observed by Robert Boyle too in 1671. In 1766, Henry Cavendish collected such bubbles and demonstrated that they were different from other gases. He later observed that when hydrogen combines with oxygen (combustion reaction), it results in the formation of water and heat (exothermic reaction). Later, scientists observed that hydrogen also acts as a fuel for nuclear fusion reactions that cause light and heat in celestrial bodies. As hydrogen is less dense (lighter) than air, it can be used in lifting objects such as balloons.
4.2 HYDROGEN AS AN ENERGY CARRIERHydrogen does not exist freely in nature, is an energy carrier that can only be produced from another energy source19 such as water, fossil fuels, or biomass and can be used as a source of energy or fuel. Hydrogen has the
highest energy content as compared with other commonly used fuels by weight, about 3x as compared to gasoline. However, it also has the lowest energy content by volume, about 4x lesser than gasoline. With an average worldwide consumption of about 70 million tons20, its primary use remains in petroleum refining, ammonia production, metal refining, and electronics fabrication.
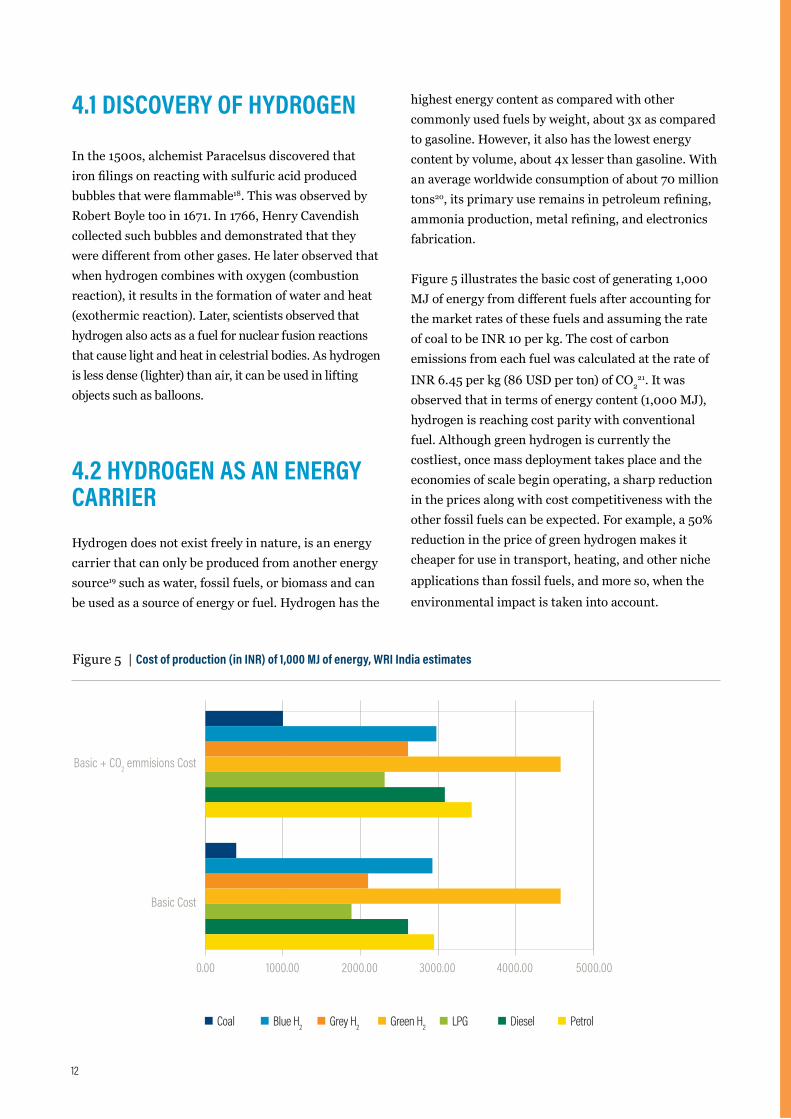
Figure 5 illustrates the basic cost of generating 1,000 MJ of energy from different fuels after accounting for the market rates of these fuels and assuming the rate of coal to be INR 10 per kg. The cost of carbon emissions from each fuel was calculated at the rate of INR 6.45 per kg (86 USD per ton) of CO2
21. It was observed that in terms of energy content (1,000 MJ), hydrogen is reaching cost parity with conventional fuel. Although green hydrogen is currently the costliest, once mass deployment takes place and the economies of scale begin operating, a sharp reduction in the prices along with cost competitiveness with the other fossil fuels can be expected. For example, a 50% reduction in the price of green hydrogen makes it cheaper for use in transport, heating, and other niche applications than fossil fuels, and more so, when the environmental impact is taken into account.
Basic Cost
0.00 1000.00
Coal Blue H2 Grey H2 Green H2 LPG Diesel Petrol
Basic + CO2 emmisions Cost
2000.00 3000.00 4000.00 5000.00
Figure 5 | Cost of production (in INR) of 1,000 MJ of energy, WRI India estimates
13BASICS OF HYDROGEN TECHNOLOGY |
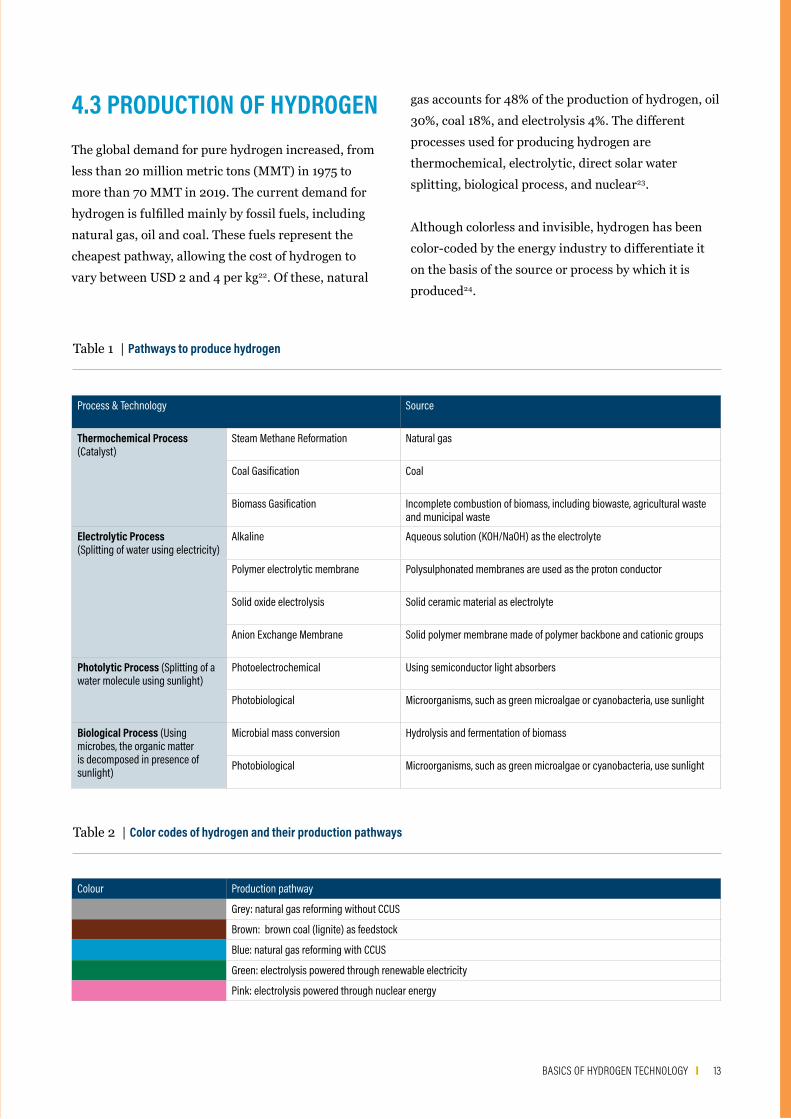
4.3 PRODUCTION OF HYDROGENThe global demand for pure hydrogen increased, from less than 20 million metric tons (MMT) in 1975 to more than 70 MMT in 2019. The current demand for hydrogen is fulfilled mainly by fossil fuels, including natural gas, oil and coal. These fuels represent the cheapest pathway, allowing the cost of hydrogen to vary between USD 2 and 4 per kg22. Of these, natural
gas accounts for 48% of the production of hydrogen, oil 30%, coal 18%, and electrolysis 4%. The different processes used for producing hydrogen are thermochemical, electrolytic, direct solar water splitting, biological process, and nuclear23.
Although colorless and invisible, hydrogen has been color-coded by the energy industry to differentiate it on the basis of the source or process by which it is produced24.
Table 1 | Pathways to produce hydrogen
Table 2 | Color codes of hydrogen and their production pathways
Process & Technology Source
Thermochemical Process (Catalyst)
Steam Methane Reformation Natural gas
Coal Gasification Coal
Biomass Gasification Incomplete combustion of biomass, including biowaste, agricultural waste and municipal waste
Electrolytic Process(Splitting of water using electricity)
Alkaline Aqueous solution (KOH/NaOH) as the electrolyte
Polymer electrolytic membrane Polysulphonated membranes are used as the proton conductor
Solid oxide electrolysis Solid ceramic material as electrolyte
Anion Exchange Membrane Solid polymer membrane made of polymer backbone and cationic groups
Photolytic Process (Splitting of a water molecule using sunlight)
Photoelectrochemical Using semiconductor light absorbers
Photobiological Microorganisms, such as green microalgae or cyanobacteria, use sunlight
Biological Process (Using microbes, the organic matter is decomposed in presence of sunlight)
Microbial mass conversion Hydrolysis and fermentation of biomass
Photobiological Microorganisms, such as green microalgae or cyanobacteria, use sunlight
Colour Production pathway
Grey: natural gas reforming without CCUS
Brown: brown coal (lignite) as feedstock
Blue: natural gas reforming with CCUS
Green: electrolysis powered through renewable electricity
Pink: electrolysis powered through nuclear energy
14
A few significant methods of producing hydrogen are presented in the following subsections:
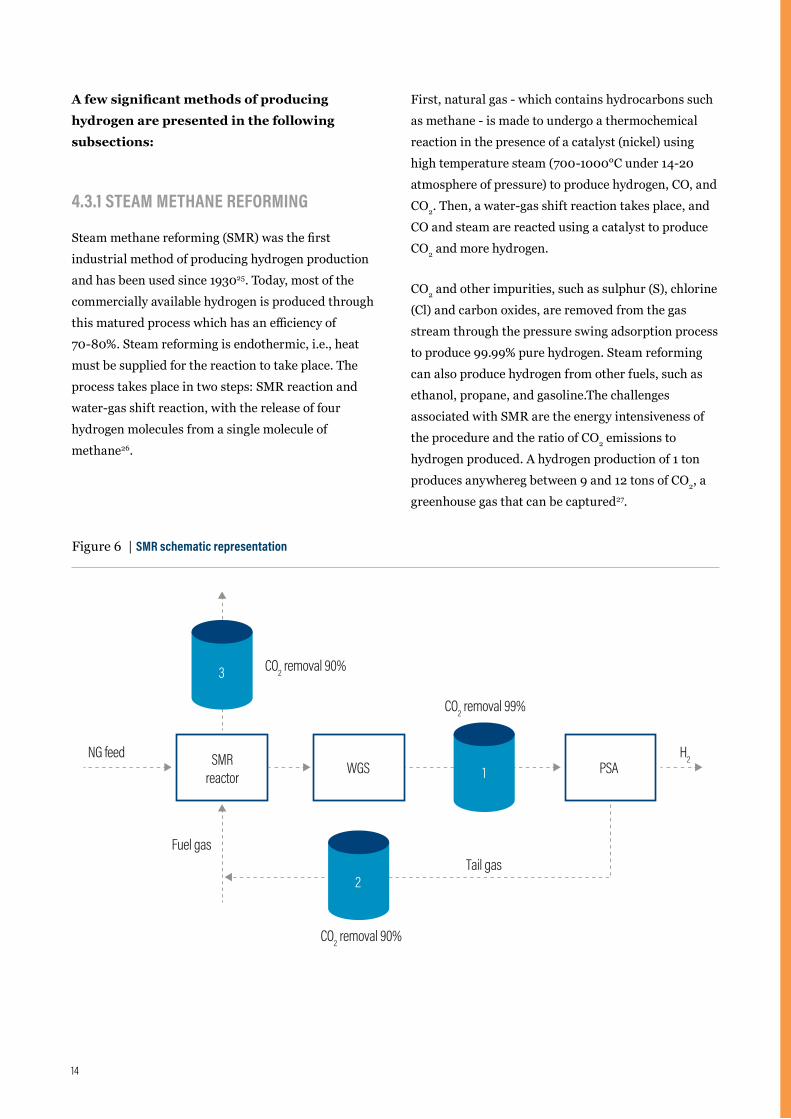
4.3.1 STEAM METHANE REFORMING
Steam methane reforming (SMR) was the first industrial method of producing hydrogen production and has been used since 193025. Today, most of the commercially available hydrogen is produced through this matured process which has an efficiency of 70-80%. Steam reforming is endothermic, i.e., heat must be supplied for the reaction to take place. The process takes place in two steps: SMR reaction and water-gas shift reaction, with the release of four hydrogen molecules from a single molecule of methane26.
First, natural gas - which contains hydrocarbons such as methane - is made to undergo a thermochemical reaction in the presence of a catalyst (nickel) using high temperature steam (700-1000°C under 14-20 atmosphere of pressure) to produce hydrogen, CO, and CO2. Then, a water-gas shift reaction takes place, and CO and steam are reacted using a catalyst to produce CO2 and more hydrogen.
CO2 and other impurities, such as sulphur (S), chlorine (Cl) and carbon oxides, are removed from the gas stream through the pressure swing adsorption process to produce 99.99% pure hydrogen. Steam reforming can also produce hydrogen from other fuels, such as ethanol, propane, and gasoline.The challenges associated with SMR are the energy intensiveness of the procedure and the ratio of CO2 emissions to hydrogen produced. A hydrogen production of 1 ton produces anywhereg between 9 and 12 tons of CO2, a greenhouse gas that can be captured27.
Figure 6 | SMR schematic representation
CO2 removal 90%
CO2 removal 90%
CO2 removal 99%
NG feed
Fuel gas
H2
Tail gas
PSAWGSSMRreactor
3
1
2
15BASICS OF HYDROGEN TECHNOLOGY |
4.3.2 PARTIAL OXIDATION
Hydrocarbons, especially methane, in natural gas react with oxygen to produce CO2 and water. This process is non-catalytic and exothermic. The reaction occurs in two steps at a temperature of 1300-1500°C28
with partial oxidation of methane and water-gas shift. This process is much faster than steam reforming and requires a smaller reactor vessel with the production of heat. This reaction produces three molecules of hydrogen for every molecule of methane. This process is commercially available and has an efficiency of 60-70%. As compared with SMR (H2: CO = 3:1), more CO is produced (H2: CO =1:1 or 2:1) than hydrogen29.
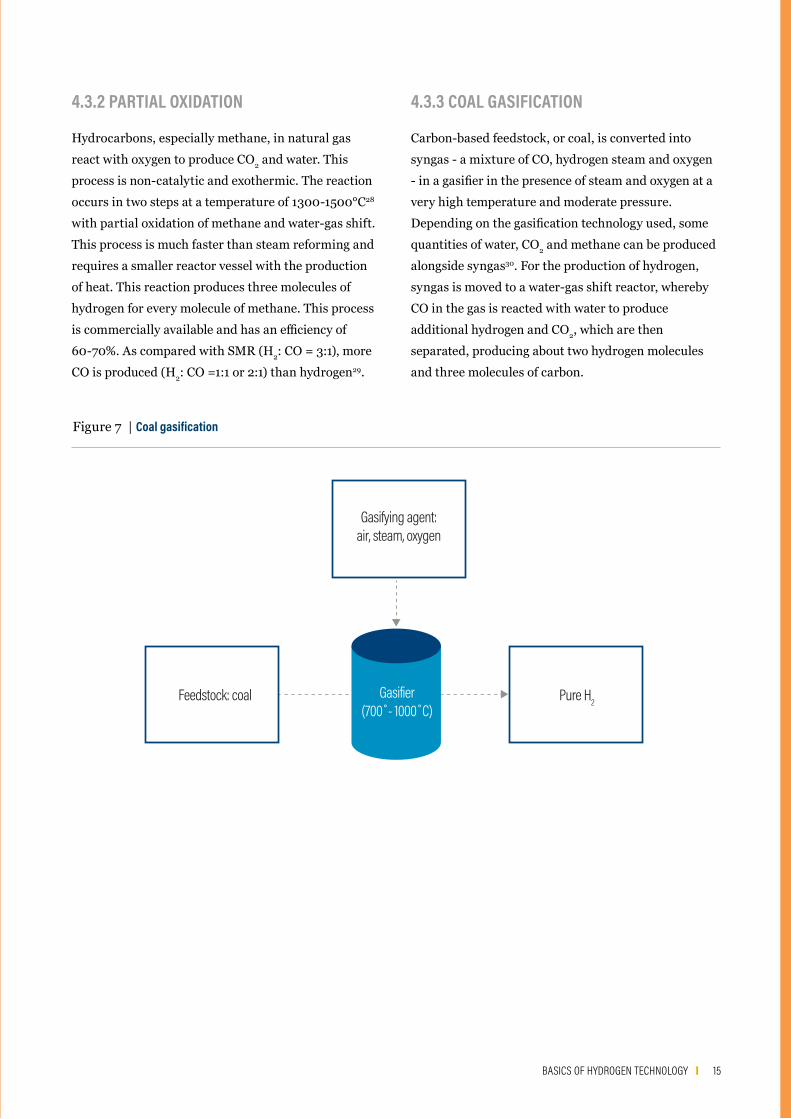
4.3.3 COAL GASIFICATION
Carbon-based feedstock, or coal, is converted into syngas - a mixture of CO, hydrogen steam and oxygen - in a gasifier in the presence of steam and oxygen at a very high temperature and moderate pressure. Depending on the gasification technology used, some quantities of water, CO2 and methane can be produced alongside syngas30. For the production of hydrogen, syngas is moved to a water-gas shift reactor, whereby CO in the gas is reacted with water to produce additional hydrogen and CO2, which are then separated, producing about two hydrogen molecules and three molecules of carbon.
Gasifying agent:air, steam, oxygen
Pure H2Feedstock: coal Gasifier(700˚- 1000˚C)
Figure 7 | Coal gasification
16
4.3.4 ELECTROLYSIS
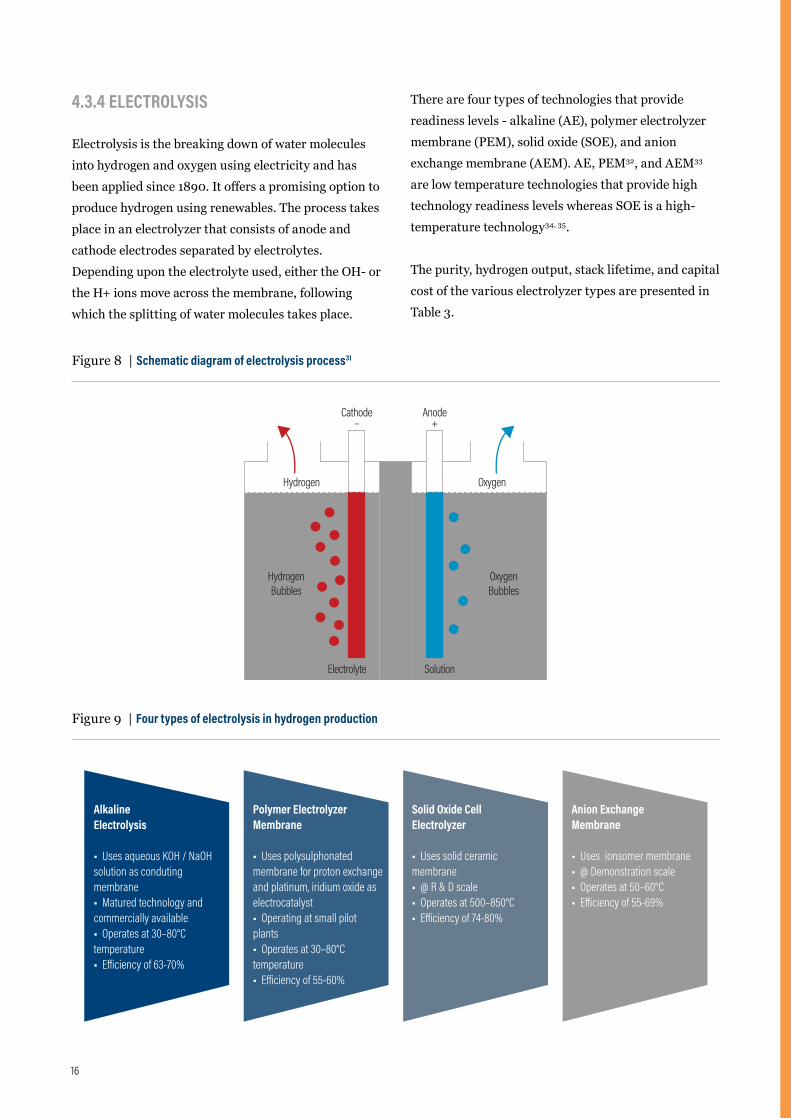
Electrolysis is the breaking down of water molecules into hydrogen and oxygen using electricity and has been applied since 1890. It offers a promising option to produce hydrogen using renewables. The process takes place in an electrolyzer that consists of anode and cathode electrodes separated by electrolytes. Depending upon the electrolyte used, either the OH- or the H+ ions move across the membrane, following which the splitting of water molecules takes place.
There are four types of technologies that provide readiness levels - alkaline (AE), polymer electrolyzer membrane (PEM), solid oxide (SOE), and anion exchange membrane (AEM). AE, PEM32, and AEM33
are low temperature technologies that provide high technology readiness levels whereas SOE is a high-temperature technology34, 35.
The purity, hydrogen output, stack lifetime, and capital cost of the various electrolyzer types are presented in Table 3.
Cathode–
Hydrogen
HydrogenBubbles
OxygenBubbles
Electrolyte Solution
Oxygen
Anode+
Figure 8 | Schematic diagram of electrolysis process31
Figure 9 | Four types of electrolysis in hydrogen production
AlkalineElectrolysis
■ Uses aqueous KOH / NaOH solution as conduting membrane ■ Matured technology and commercially available■ Operates at 30–80°C temperature■ E�iciency of 63-70%
Polymer ElectrolyzerMembrane
■ Uses polysulphonated membrane for proton exchange and platinum, iridium oxide as electrocatalyst■ Operating at small pilot plants■ Operates at 30–80°C temperature■ E�iciency of 55-60%
Solid Oxide CellElectrolyzer
■ Uses solid ceramic membrane■ @ R & D scale■ Operates at 500–850°C■ E�iciency of 74-80%
Anion ExchangeMembrane
■ Uses ionsomer membrane■ @ Demonstration scale■ Operates at 50–60°C■ E�iciency of 55-69%
17BASICS OF HYDROGEN TECHNOLOGY |
4.3.5 BIOMASS GASIFICATION
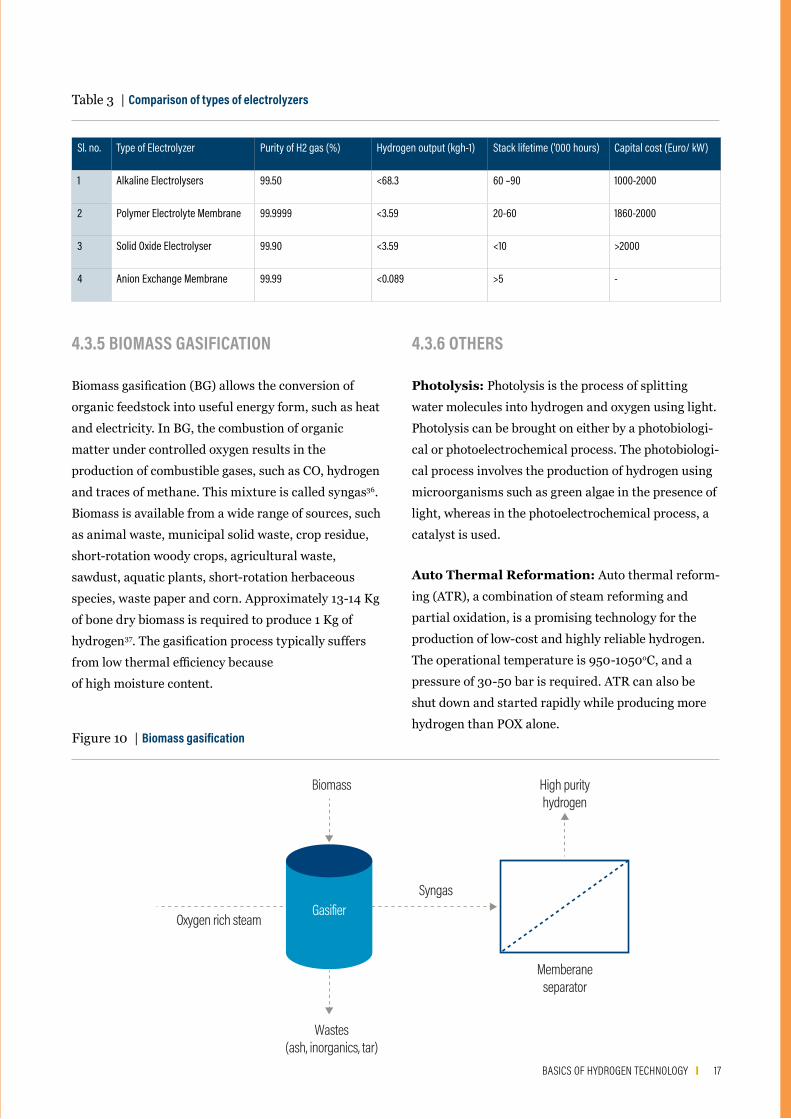
Biomass gasification (BG) allows the conversion of organic feedstock into useful energy form, such as heat and electricity. In BG, the combustion of organic matter under controlled oxygen results in the production of combustible gases, such as CO, hydrogen and traces of methane. This mixture is called syngas36. Biomass is available from a wide range of sources, such as animal waste, municipal solid waste, crop residue, short-rotation woody crops, agricultural waste, sawdust, aquatic plants, short-rotation herbaceous species, waste paper and corn. Approximately 13-14 Kg of bone dry biomass is required to produce 1 Kg of hydrogen37. The gasification process typically suffers from low thermal efficiency because of high moisture content.
Figure 10 | Biomass gasification
Sl. no. Type of Electrolyzer Purity of H2 gas (%) Hydrogen output (kgh-1) Stack lifetime ('000 hours) Capital cost (Euro/ kW)
1 Alkaline Electrolysers 99.50 <68.3 60 –90 1000-2000
2 Polymer Electrolyte Membrane 99.9999 <3.59 20-60 1860-2000
3 Solid Oxide Electrolyser 99.90 <3.59 <10 >2000
4 Anion Exchange Membrane 99.99 <0.089 >5 -
Table 3 | Comparison of types of electrolyzers
Biomass
Wastes(ash, inorganics, tar)
Syngas
High purityhydrogen
Memberaneseparator
Oxygen rich steamGasifier
4.3.6 OTHERS
Photolysis: Photolysis is the process of splitting water molecules into hydrogen and oxygen using light. Photolysis can be brought on either by a photobiologi-cal or photoelectrochemical process. The photobiologi-cal process involves the production of hydrogen using microorganisms such as green algae in the presence of light, whereas in the photoelectrochemical process, a catalyst is used.
Auto Thermal Reformation: Auto thermal reform-ing (ATR), a combination of steam reforming and partial oxidation, is a promising technology for the production of low-cost and highly reliable hydrogen. The operational temperature is 950-1050oC, and a pressure of 30-50 bar is required. ATR can also be shut down and started rapidly while producing more hydrogen than POX alone.
18
4.4 ECONOMIC ASPECTS OF PRODUCING HYDROGEN USING DIFFERENT PATHWAYS
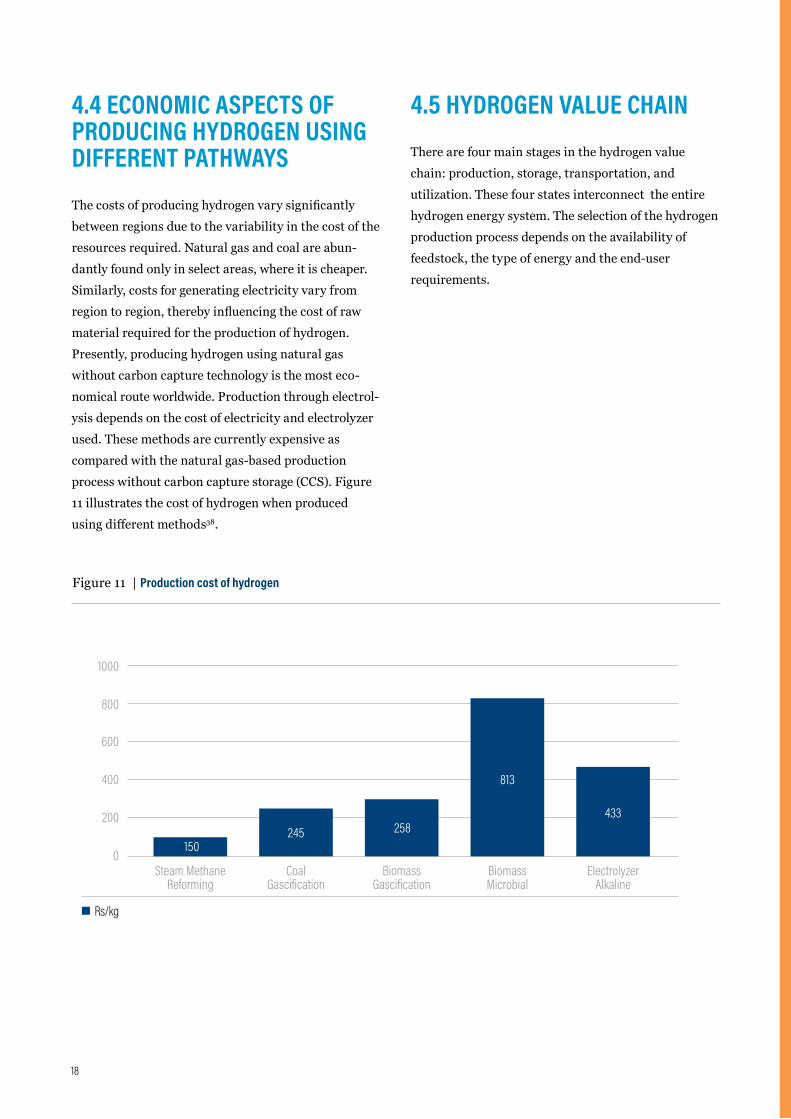
The costs of producing hydrogen vary significantly between regions due to the variability in the cost of the resources required. Natural gas and coal are abun-dantly found only in select areas, where it is cheaper. Similarly, costs for generating electricity vary from region to region, thereby influencing the cost of raw material required for the production of hydrogen. Presently, producing hydrogen using natural gas without carbon capture technology is the most eco-nomical route worldwide. Production through electrol-ysis depends on the cost of electricity and electrolyzer used. These methods are currently expensive as compared with the natural gas-based production process without carbon capture storage (CCS). Figure 11 illustrates the cost of hydrogen when produced using different methods38.
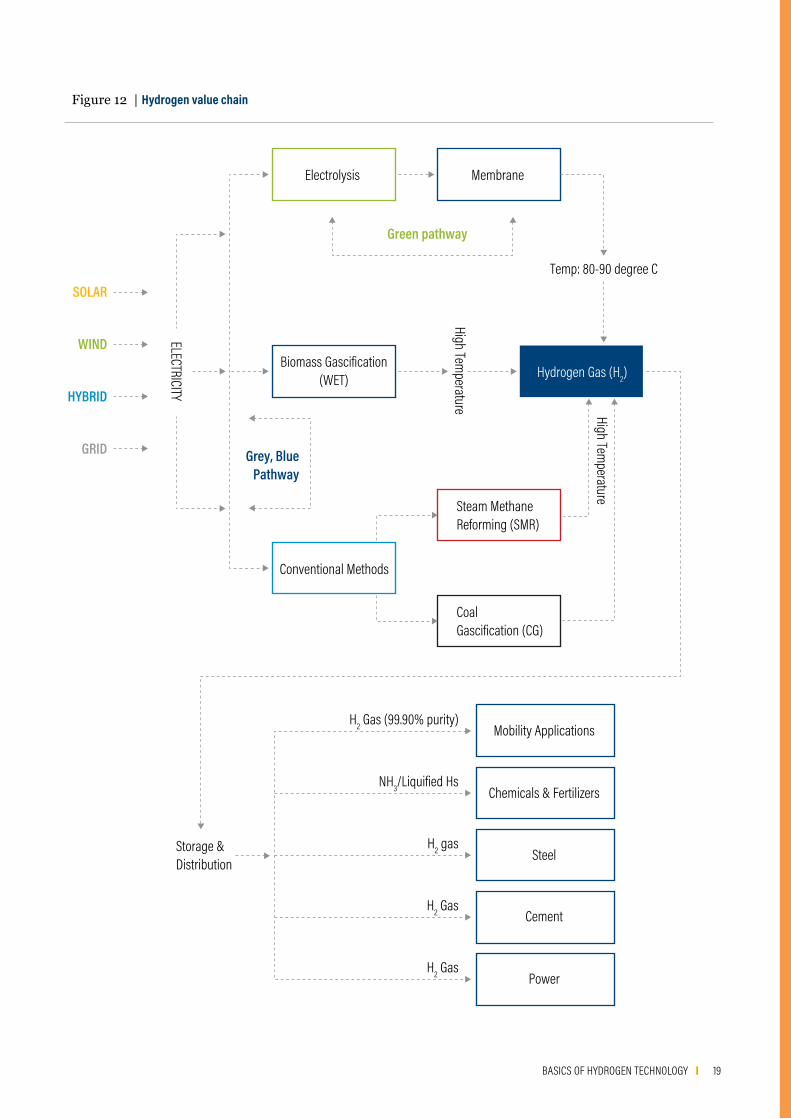
4.5 HYDROGEN VALUE CHAIN
There are four main stages in the hydrogen value chain: production, storage, transportation, and utilization. These four states interconnect the entire hydrogen energy system. The selection of the hydrogen production process depends on the availability of feedstock, the type of energy and the end-user requirements.
Figure 11 | Production cost of hydrogen
200
600
1000
0
400
800
Steam MethaneReforming
CoalGascification
BiomassGascification
BiomassMicrobial
ElectrolyzerAlkaline
150245 258
813
433
Rs/kg
19BASICS OF HYDROGEN TECHNOLOGY |
Figure 12 | Hydrogen value chain
Mobility Applications
Chemicals & Fertilizers
Steel
Cement
Power
H2 Gas (99.90% purity)
NH3/Liquified Hs
Storage &Distribution
High Temperature High Tem
perature
Biomass Gascification(WET)
Grey, BluePathway
Conventional Methods
Steam MethaneReforming (SMR)
CoalGascification (CG)
Temp: 80-90 degree C
MembraneElectrolysis
Green pathway
H2 gas
H2 Gas
H2 Gas
SOLAR
WIND
HYBRID
ELECTRICITY
GRID
Hydrogen Gas (H2)
20
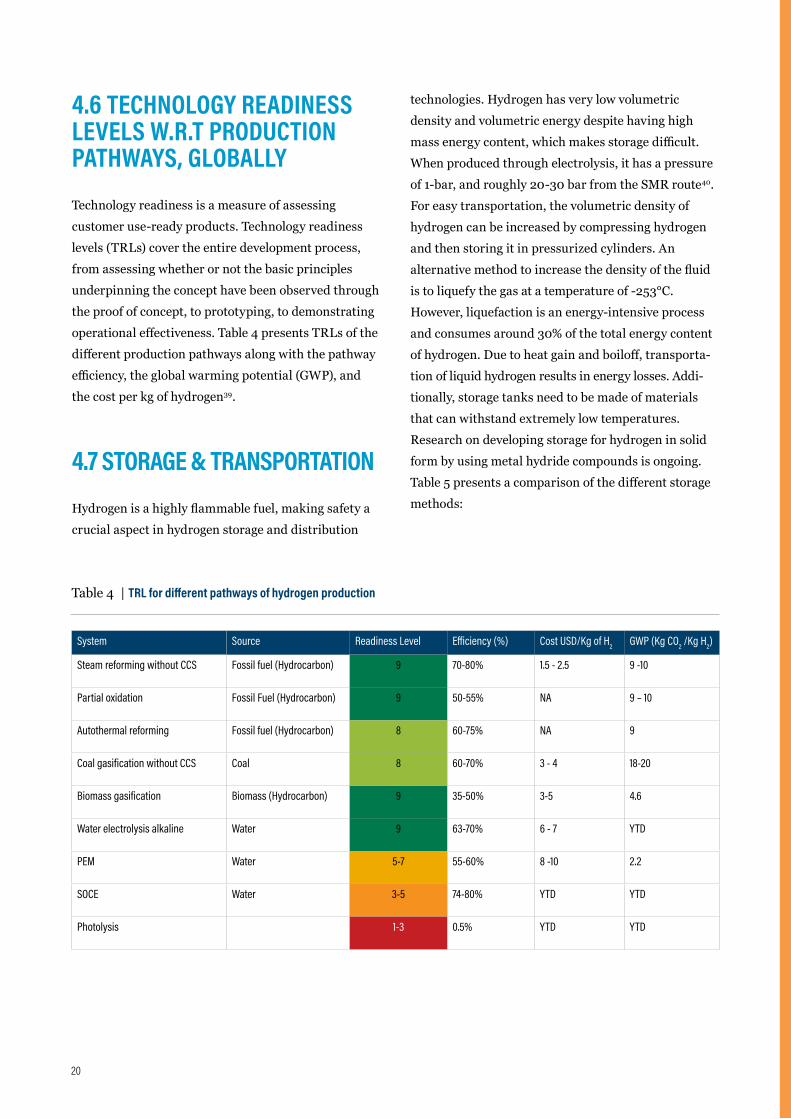
4.6 TECHNOLOGY READINESS LEVELS W.R.T PRODUCTION PATHWAYS, GLOBALLY
Technology readiness is a measure of assessing customer use-ready products. Technology readiness levels (TRLs) cover the entire development process, from assessing whether or not the basic principles underpinning the concept have been observed through the proof of concept, to prototyping, to demonstrating operational effectiveness. Table 4 presents TRLs of the different production pathways along with the pathway efficiency, the global warming potential (GWP), and the cost per kg of hydrogen39.
4.7 STORAGE & TRANSPORTATION
Hydrogen is a highly flammable fuel, making safety a crucial aspect in hydrogen storage and distribution
technologies. Hydrogen has very low volumetric density and volumetric energy despite having high mass energy content, which makes storage difficult. When produced through electrolysis, it has a pressure of 1-bar, and roughly 20-30 bar from the SMR route40. For easy transportation, the volumetric density of hydrogen can be increased by compressing hydrogen and then storing it in pressurized cylinders. An alternative method to increase the density of the fluid is to liquefy the gas at a temperature of -253°C. However, liquefaction is an energy-intensive process and consumes around 30% of the total energy content of hydrogen. Due to heat gain and boiloff, transporta-tion of liquid hydrogen results in energy losses. Addi-tionally, storage tanks need to be made of materials that can withstand extremely low temperatures. Research on developing storage for hydrogen in solid form by using metal hydride compounds is ongoing. Table 5 presents a comparison of the different storage methods:
System Source Readiness Level Efficiency (%) Cost USD/Kg of H2 GWP (Kg CO2 /Kg H2)
Steam reforming without CCS Fossil fuel (Hydrocarbon) 9 70-80% 1.5 - 2.5 9 -10
Partial oxidation Fossil Fuel (Hydrocarbon) 9 50-55% NA 9 – 10
Autothermal reforming Fossil fuel (Hydrocarbon) 8 60-75% NA 9
Coal gasification without CCS Coal 8 60-70% 3 - 4 18-20
Biomass gasification Biomass (Hydrocarbon) 9 35-50% 3-5 4.6
Water electrolysis alkaline Water 9 63-70% 6 - 7 YTD
PEM Water 5-7 55-60% 8 -10 2.2
SOCE Water 3-5 74-80% YTD YTD
Photolysis 1-3 0.5% YTD YTD
Table 4 | TRL for different pathways of hydrogen production

21BASICS OF HYDROGEN TECHNOLOGY |
Hydrogen can be made available at the retail point using distribution options such as pressurised containers, liquified containers, pipelines, and onsite production. Road transport using pressurised containers is the normal way of transporting hydrogen, but liquefaction of hydrogen for transport results in a significant increase in its energy density and allows for carrying upto 10 times more hydrogen.
Pipelines (existing or new), although a sophisticated technology, requires more capital expenditure and is more suited for large volumes. A simpler option is to have onsite hydrogen generation, which eliminates the cost of transportation. Water electrolysis is most suitable for onsite production as it is more scalable and emission-free.
Table 5 | Storage methods for hydrogen
Table 6 | Transportation modes of hydrogen and related Issues
Storage Methods Advantages Limitations
Pressurized storage Matured technology, high efficiency Specialized materials required to withstand high pressure
Cryogenic Higher liquid density, suitable for large quantities High liquefaction costs, boiloff gas management and expensive materials required
Metal hydride Relatively high density, modular operation Emerging technology, not commercialized, heavier to handle
Transportation mode Issues Limitations
Pressurized container or cylinders Limited quantity can be transported Specialized material to withstand the pressure and weight
Cryogenic Liquefaction costs are high Require special material to carry and to boiloff to be addressed
Pipelines Safety such as leak detection Construction material cost is high
Onsite production Economical technology Electrolyser and electricity cost to be reduced
22
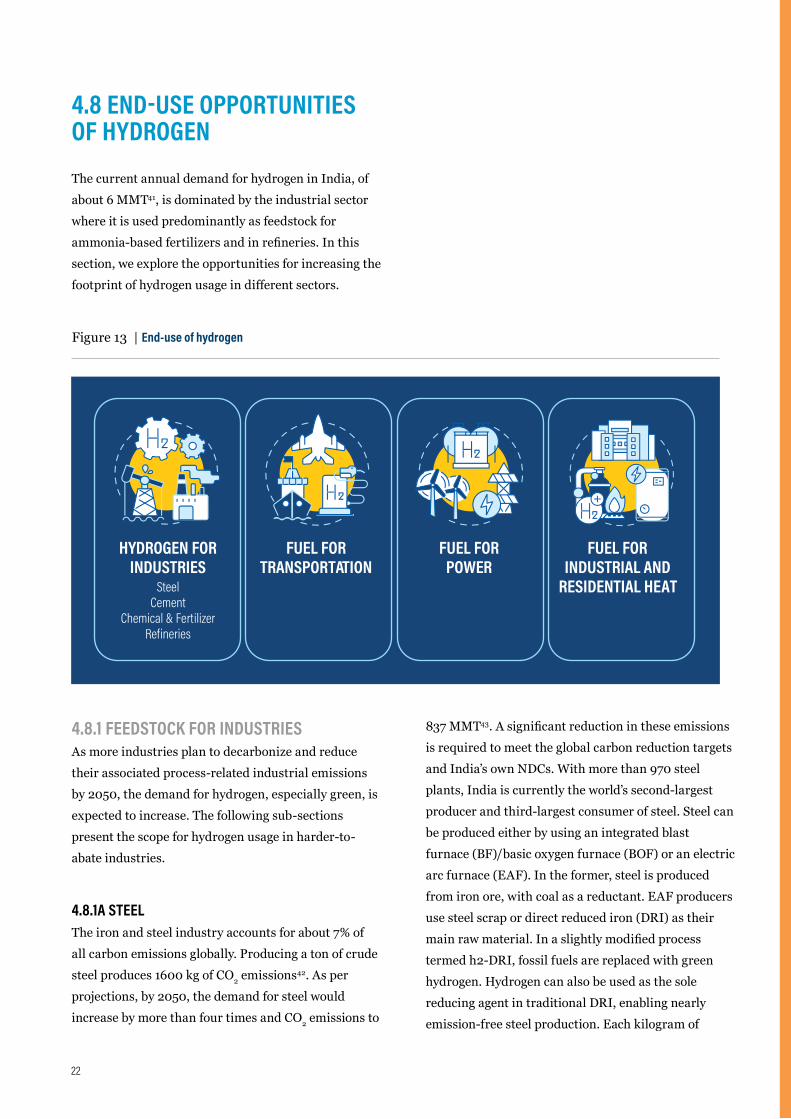
4.8 END-USE OPPORTUNITIES OF HYDROGEN
The current annual demand for hydrogen in India, of about 6 MMT41, is dominated by the industrial sector where it is used predominantly as feedstock for ammonia-based fertilizers and in refineries. In this section, we explore the opportunities for increasing the footprint of hydrogen usage in different sectors.
4.8.1 FEEDSTOCK FOR INDUSTRIESAs more industries plan to decarbonize and reduce their associated process-related industrial emissions by 2050, the demand for hydrogen, especially green, is expected to increase. The following sub-sections present the scope for hydrogen usage in harder-to-abate industries.
4.8.1A STEELThe iron and steel industry accounts for about 7% of all carbon emissions globally. Producing a ton of crude steel produces 1600 kg of CO2 emissions42. As per projections, by 2050, the demand for steel would increase by more than four times and CO2 emissions to
837 MMT43. A significant reduction in these emissions is required to meet the global carbon reduction targets and India’s own NDCs. With more than 970 steel plants, India is currently the world’s second-largest producer and third-largest consumer of steel. Steel can be produced either by using an integrated blast furnace (BF)/basic oxygen furnace (BOF) or an electric arc furnace (EAF). In the former, steel is produced from iron ore, with coal as a reductant. EAF producers use steel scrap or direct reduced iron (DRI) as their main raw material. In a slightly modified process termed h2-DRI, fossil fuels are replaced with green hydrogen. Hydrogen can also be used as the sole reducing agent in traditional DRI, enabling nearly emission-free steel production. Each kilogram of
Figure 13 | End-use of hydrogen
HYDROGEN FOR INDUSTRIES
FUEL FOR TRANSPORTATION
FUEL FOR POWER
FUEL FOR INDUSTRIAL AND
RESIDENTIAL HEATSteelCement
Chemical & FertilizerRefineries
23BASICS OF HYDROGEN TECHNOLOGY |
hydrogen used in the production of crude steel in the DRI method results in a reduction in CO2 emission by 24 kgs44. Currently, only ~7%45 of primary steel is produced using the DRI method and hydrogen must be used as substitute and its share increased over time to reduce the carbon footprint in steel production.
4.8.1B REFINERIESCrude oil accounts for approximately 30% of the primary energy demand in the country, with more than 80% of it being imported (IEA, 2020). Hydrogen is used primarily to remove impurities such as sulphur from crude oil. Stricter regulations on sulphur has led to increased demand for hydrogen even as demand for diesel and petrol has increased. Going by the existing policies, by 2030, the demand for hydrogen is expected to increase by 7%. Thus, the demand currently being met within refineries by gray hydrogen can be replaced with green hydrogen (10% green hydrogen mandate) in the initial stages. In addition, refineries that use fossil fuels instead of hydrogen can be mandated to use the latter and shift to green hydrogen in the later stages.
4.8.1C CHEMICALS AND FERTILIZERSThe chemical sector is the largest industrial consumer of oil and gas and ranks third in CO2 emissions, behind cement, iron and steel46. Ammonia is one of the prime materials used in the production of synthetic nitrogen fertilizers and India is the fourth-largest producer of nitrogenous fertilizers in the world. Conventionally, ammonia is produced by mixing hydrogen (typically produced from fossil fuels) with atmospheric nitrogen, which is a highly CO2 intensive process. As ammonia is not flammable, remains liquid at room temperature and is easy to transport, green ammonia can be used in lieu of hydrogen. This means hydrogen can be converted to ammonia for transportation and then reconverted to hydrogen at the destination. Although this entails some energy loss, it presents a solution for the barriers in transporting and handling hydrogen. Ammonia is also used in the production of nitrogenous fertilizers, such as urea, ammonium sulphate, ammonium sulphate nitrate, and ammonium chloride. Producing these from green hydrogen can help reduce
carbon footprint significantly.
Methanol too is an important chemical, which can be produced by hydrogenating hydrogen (sourced from fossil fuel) with CO2 (biomass or organic matter). Green hydrogen oxygenated with biomass CO2 produces green methanol, which is used for formaldehyde and fuel applications and as an intermediary in the production of high-value chemicals.
4.8.1D CEMENTThe cement industry is highly energy-intensive and a major emitter of CO2 globally. India’s cement industry, on the technological front, has largely adopted modern manufacturing technologies for the burning of limestone for cement production, with 1 ton of cement emitting an equal amount of CO2.47
Cement is a mixture of limestone and clay and is one of the ingredients in concrete production along with water, sand and gravel. To produce concrete, the mixture is heated to a temperature of 1500oC. Hydrogen can be used for such high temperatures and to replace natural gas used in the production of cement.
4.8.2 FUEL FOR TRANSPORTATION The transport sector is a major CO2 emitter, contributing 25% to the global and 14% to national emissions caused by fuel combustion48. The Indian transport fuel mix is dominated by 96% oil %, followed by 3% gas and 1% electricity. Diesel vehicles contribute significantly (61%) to these emissions, followed by petrol vehicles (37%). Freight vehicles that use diesel and passenger vehicles (two-wheelers and cars) are the major segments that contribute to the emissions, given their large numbers49. Emissions from aviation and shipping too are increasing, with increase in air travel and shipping becoming the backbone of global supply chains. Studies50 indicate that by 2050, the share of low carbon fuel should increase to 60% in the transport fuel mix to be compatible with the 1.5oC limit.
24
Some countries have banned all diesel powered cars and trucks owing to the high levels of pollution these generate51 and have tightened emission standards so as to reduce vehicular pollution. There are issues with alternatives such as biofuels and battery electric vehicles. The environmental impact of biofuels includes issues of land use for production and air quality, whereas battery electric vehicles have range anxiety issues, although the number of refueling stations is being increased. Hydrogen can play a significant role in the transportation sector as it addresses these issues more efficiently.
Hydrogen fuel cells (HFCs), which use PEM fuel cells, can be used as an alternative in transportation. PEM cells have better efficiency and high power density52 as compared with the existing power train. Currently, although the capital cost of the fuel cell drive train is high as compared with the internal combustion engine and battery electic vehicle drive trains, it has lesser emissions and maintenance costs, is faster to charge and has more longevity and range. Also, its capital cost is expected to decrease when production is scaled up. It is expected that by 2030, the total cost of ownership (TCO) of fuel cell power trains would converge with other existing power trains53. According to IEA estimates, sales of fuel cell-driven electric vehicles could reach 8 million by 2030 in developed nations, and 150 million by 2050 along with a 25% share of road transport.54
Refueling hydrogen cells is much faster as compared to battery cells, with 15 hydrogen refilling stations generating throughput equivalent to 900 battery cell fast-chargers55. This can be leveraged in the initial stages to roll out the return-to-base fleets, such as delivery vans and point-to-point buses. The deployment of fuel cell buses has begun in Europe, North America, and China in a small way. The long distance heavy trucks domain will open up once the refueling stations proliferate and the capital cost of the drive trains decreases owing to advancements in technology and the activation of the economies of scale.
4.8.3 FUEL FOR POWERPower generation is the largest contributor to India’s carbon emissions, accounting for 43% of the total emissions. More than 70% of the country’s power generation is coal-based. Each unit of electricity releases 684 g of CO2
56. India has set a 40% non-fossil-based power capacity target for 2030, with a predominant share of solar energy. Several hydrogen power projects have been initiated to supply power to the grid over the last two decades, and these involve low volume hydrogen combustion in gas turbines using gray hydrogen, which is a by-product in the utilization of fossil fuels. New green hydrogen gas turbines are being developed, which can burn hydrogen more efficiently and be used for serving peak loads and base loads. This has the potential to reduce the dependency on natural gas. Niche applications such as replenishable hydrogen fuel cells can replace diesel generators in household/small industrial applications and as a short-term source of energy.57
4.8.4 FUEL FOR INDUSTRIAL AND RESIDENTIAL HEATA large share (~66%) of industrial energy is used for heating requirements, and its growing demand will result in increasing CO2 emissions, accounting for a quarter of the global emissions in 204058. Industrial heating systems depend mainly on fossil fuels, biomass (wood or dung), and electricity for producing heat, most of which is produced onsite. These systems could be decarbonized either by switching to alternative fuels or by increasing electrification with the help of substainable heat pumps. Emissions could be reduced by blending up to 20% hydrogen into the exiting natural gas supply and kick-starting the transition. However, the commercial exploitation of hydrogen in the core industrial sectors would need to wait, owing to low maturity, uncertain costs and the need to change the existing plant designs.
25BASICS OF HYDROGEN TECHNOLOGY |
5.0 CONCLUSIONReducing carbon emissions as well as the dependence on fossil fuels are the foremost considerations that propel us towards hydrogen as a source of energy and increasing its share in the country’s energy mix. There are multiple hydrogen production pathways and compelling economics for each category of hydrogen, viz. blue, gray, and green. Hydrogen as an energy carrier can be used for a broad range of applications in different sectors and requires the setting up of suitable infrastructure. This calls for large investments in
technology, infrastructure, and capacity building, both from the public as well as private sectors. Essentially, this implies kick-starting the hydrogen economy by creating an enabling policy and regulatory framework covering all aspects - production, safe storage, refuelling of stations, hydrogen-ready design of transport vehicles, redesigning/reimagining end-user applications to follow the hydrogen pathway and incentives for increasing the usage of hydrogen as a fuel. A strategic alliance to unlock the potential synergies between the government and the private sector to address these aspects would help us meet our climate goals.
Energy in terms of weight
1 Btu(IT)/lb = 2.3278 MJ/t = 2327.8 J/kg = 0.55598 kcal/kg = 0.000646 kWh/kg1 kcal/kg = 1 cal/g = 4.1868 MJ/t = 4186.8 J/kg = 1.8 Btu(IT)/lb = 0.001162 kWh/kg1 MJ/kg = 1000 J/g = 1 GJ/t = 238.85 kcal/kg = 429.9 Btu(IT)/lb = 0.2778 kWh/kg1 kWh/kg = 1547.7 Btu(IT)/lb = 3.597 GJ/t = 3597.1 kJ/kg = 860.421 kcal/kg
Volume in terms of litre
1 imperial gallon = 4.54609 L1 US gallon = 3.785411784 L 1 imperial pint = 0.56826125 L 1 US pint = 0.473176473 L 1 barrel of oil = 158.987294928 L
Energy in terms of power
1 kWh = 3.6 MJ 1 Btu = 1055.056 J 1 MMBtu = 293.07 kWh39.4 kWh ( 1 kg of hydrogen ) = 0.1344 MMBtu1 therm = 105.5056 MJ 1 calorie = 4.1868 J 1 tonne of oil equivalent (toe) = 41.868 GJ (LHV) 1 barrel of oil ≈ 5.70 GJ (IEA def.) (LHV) 5.86 GJ (global avg.)

26
REFERENCES
1. International Energy Outlook 2019 (eia.gov)
2. Kober, T., & Schiffer, H.W. (2020). Global energy perspectives to 2060 – WEC’s World Energy Scenarios 2019. Energy Strategy Reviews, 31(September). https://doi.org/10.1016/j.esr.2020.100523
3. Ritchie, H., & Roser, Max. (2020). Energy production and consumption. Our World in Data. http://ourworldindata.org/energy
4. International Renewable Energy Agency. (2021). World Energy Transitions Outlook: 1.5°C Pathway. https://www.irena.org/-/media/Files/IRENA/Agency/Publication/2021/March/IRENA_World_Energy_Transitions_Outlook_2021.pdf
5. EIA projects nearly 50% increase in world energy usage by 2050, led by growth in Asia. (2019, September 24). Today in Energy. U.S. Energy Information Administration. https://www.eia.gov/todayinenergy/detail.php?id=41433
6. U.S. Energy Information Administration. (2019, September 24). International Energy Outlook 2019. www.eia.gov/ieo
7. Ritchie, H., & Roser, Max. (2017). Air Pollution. Our World in Data. http://ourworldindata.org/air-pollution
8. International Renewable Energy Agency. (2020). Renewable Capacity Statistics 2020. https://www.irena.org/-/media/Files/IRENA/Agency/Publication/2020/Mar/IRENA_RE_Capacity_Statistics_2020.pdf
9. International Renewable Energy Agency. (2021). World Energy Transitions Outlook: 1.5°C Pathway. https://www.irena.org/-/media/Files/IRENA/Agency/Publication/2021/March/IRENA_World_Energy_Transitions_Outlook_2021.pdf
10. IEA. (2020). India 2020 Energy Policy Review. https://iea.blob.core.windows.net/assets/2571ae38-c895-430e-8b62-bc19019c6807/India_2020_Energy_Policy_Review.pdf
11. IEA. (2020). India 2020 Energy Policy Review. https://iea.blob.core.windows.net/assets/2571ae38-c895-430e-8b62-bc19019c6807/India_2020_Energy_Policy_Review.pdf
12. Chaudhary, S. (2020, April 30). India’s crude oil import bill fell 9% to $102 billion in 2019-20. The Economic Times. https://economictimes.indiatimes.com/news/economy/foreign-trade/indias-crude-oil-import-bill-fell-9-to-102-billion-in-2019-20/articleshow/75473757.cms?from=mdr
13. BP. (2018). BP Energy Outlook 2018 edition. BP Energy Economics. https://www.bp.com/content/dam/bp/business-sites/en/global/corporate/pdfs/energy-economics/energy-outlook/bp-energy-outlook-2018.pdf
14. IEA. (2021, February). India Energy Outlook 2021. https://www.iea.org/reports/india-energy-outlook-2021
15. Climate Transparency. (2020). Climate Transparency Report India. https://www.climate-transparency.org/wp-content/uploads/2020/11/India-CT-2020-WEB.pdf
16. Ministry of New and Renewable Energy. Government of India. (2021, March 10). Office Memorandum. Monthly Summary for the Cabinet for the month of February 2021. https://mnre.gov.in/img/documents/uploads/file_f-1615785529839.pdf
17. Royal Society of Chemistry. (2021). Periodic Table. Hydrogen. https://www.rsc.org/periodic-table/element/1/hydrogen
18. Let’s Talk Science. (2019, August 31). STEM in Context. The History and Uses of Hydrogen. https://letstalkscience.ca/educational-resources/stem-in-context/history-and-uses-hydrogen
19. Hydrogen Explained. (n.d). U.S. Energy Information Administration. https://www.eia.gov/energyexplained/hydrogen/
20. Hydrogen production and consumption worldwide in 2019, by sector. (n.d). Statista. https://www.statista.com/statistics/1199339/global-hydrogen-production-and-consumption-by-sector/
21. Combustion of fuels – Carbon dioxide. (n.d). The Engineering Toolbox. https://www.engineeringtoolbox.com/co2-emission-fuels-d_1085.html
22. Noussan, M., Raimondi, P.P., Scita, R. & Hafner, M. (2021). The role of green and blue hydrogen in the energy transition – A technological and geopolitical perspective. Sustainability. 13(1), 298. https://doi.org/10.3390/su13010298
23. Hydrogen production processes. Office of Energy Efficiency & Renewable Energy. Hydrogen and Fuel Cell Technologies Office. (n.d). https://www.energy.gov/eere/fuelcells/hydrogen-production-processes
24. Sara Giovannini (2020). 50 Shades of (grey, blue and Green) Hydrogen, Energy Cities. https://energy-cities.eu/50-shades-of-grey-and-blue-and-green-hydrogen
25. Barelliet al., (2008). Hydrogen production through sorption-enhanced steam methane reforming and membrane technology: A review. Energy Volume 33, Issue 4, April 2008, Pages 554-57.https://www.sciencedirect.com/science/article/pii/S0360544207002058
26. Nielsen (2004). Large-scale hydrogen Production, https://www.topsoe.com/sites/default/files/topsoe_large_scale_hydrogen_produc.pdf
27. Andi Mehmeti , Athanasios Angelis-Dimakis , George Arampatzis , Stephen J. McPhail & Sergio Ulgiati (2018). Life Cycle Assessment and Water Footprint of Hydrogen Production Methods: From Conventional to Emerging Technologies. environments MDPI https: //www.mdpi.com/2076-3298/5/2/24/pdf
28. Energy Efficiency & Renewable Energy: Hydrogen Production: Natural Gas Reforming | Department of Energy
29. Kalamaras and Efstathiou (2013). hydrogen Production Technologies: Current State and Future Developments. https://doi.org/10.1155/2013/690627
30. Stiegel and Ramezan (2005). hydrogen from coal gasification: An economical pathway to a sustainable energy future. International Journal of Coal Geology (Vol. 65, Issues 3–4, 17 January 2006) : https://doi.org/10.1016/j.coal.2005.05.002
31. Ebaid, Munzer & Hammad, Mahmoud & Alghamdi, Talal. (2015). THERMO economic analysis OF PV and hydrogen gas turbine hybrid power plant of 100 MW power output. International Journal of Hydrogen Energy. 40. 10.1016/j.ijhydene.2015.07.077 https://www.researchgate.net/figure/water-electrolysis-principles_fig3_281097033
32. S. Shiva KumarV. Himabindu (2019) hydrogen production by PEM water electrolysis – A review, Material Science for energy Technologies https://doi.org/10.1016/j.mset.2019.03.002

27BASICS OF HYDROGEN TECHNOLOGY |
33. Royal Society of Chemistry Sustainable Energy Fuels,( 2020,4, 2114-2133) https://pubs.rsc.org/en/content/articlehtml/2020/se/c9se01240k
34. M.FoteiniSapountzi, …+3… ,J.W.(Hans) Niemantsverdriet, 58(2017), pp.1-35 Electrocatalysts for the generation of hydrogen, oxygen and synthesis gas Prog. Energy Combust. Sci. https://doi.org/10.1016/j.ijhydene.2013.09.045
35. Brauns, J., & Turek, T. (2020). Alkaline Water Electrolysis Powered by Renewable Energy: A Review. Processes, 8(2), 248. MDPI AG. Retrieved from http://dx.doi.org/10.3390/pr8020248
36. S.C. Bhatia (2014) Biomass gasification, Advanced Renewable Energy Systems, Woodhead Publishing India, ,Pages 473-489 https://doi.org/10.1016/B978-1-78242-269-3.50018-8
37. M. Melaina, M. Penev, and D. Heimiller (2013), Resource Assessment for Hydrogen Production, National Renewable Energy Laboratory http://www.nrel.gov/docs/fy13osti/55626.pdf
38. India Country Status Report on Hydrogen and Fuel Cells Department of Science and Technology(2020)https://dst.gov.in/sites/default/files/Country%20status%20report%20final%20Hydrogen.pdf
39. El-Shafie, Mostafa Ibrahim & Kambara, Shinji & Hayakawa, Yukio. (2019). Hydrogen Production Technologies Overview. Journal of Power and Energy Engineering. 7. 107-154. 10.4236/jpee.2019.71007https://www.researchgate.net/publication/330701158_hydrogen_Production_Technologies_Overview
40. Atul Choudhar TCE (2016) https://www.tce.co.in/wp-content/themes/tce/energy-transition-outlook/pdf/hydrogen-infrastructure.pdf
41. Will Hall, Thomas Spencer, G Renjith, Shruti Dayal (2020), TERI, https://www.teriin.org/sites/default/files/files/hydrogen-es.pdf
42. Christian Hoffmann, Michel Van Hoey, and Benedikt Zeumer (2020) Decarbonization challenge for Steel https://www.mckinsey.com/industries/metals-and-mining/our-insights/decarbonization-challenge-for-steel
43. Press release (January 30 2020) The Energy And Research Institute https://www.teriin.org/press-release/teri-warns-carbon-emissions-steel-growing-almost-600-mt-2050-suggests-decarbonisation
44. Jay Bartlett and Alan Krupnick (2020), Decarbonized Hydrogen in the US Power and Industrial Sectors: Identifying and Incentivizing Opportunities to Lower Emissions, Research for future.https://rmi.org/wp-content/uploads/2020/01/hydrogen_insight_brief.pdf
45. Energy World(2020),Carbon emissions by India’s steel sector to triple by 2050 https://energy.economictimes.indiatimes.com/news/coal/carbon-emissions-by-indias-steel-sector-to-triple-by-2050/73928760
46. IEA (2020), Chemicals, IEA, Paris https://www.iea.org/reports/chemicals
47. Ali Naqi and Jeong Gook Jang (2019) Recent Progress in Green Cement Technology Utilizing Low-Carbon Emission Fuels and Raw Materials: A Review, Sustainability, MDPI https://www.mdpi.com/2071-1050/11/2/537/pdf
48. Climate Transparency. (2020). Climate Transparency Report India. https://www. climate-transparency.org/wp-content/uploads/2020/11/India-CT-2020-WEB.pdf
49. Namita Singh, Trupti Mishra, Rangan Banerjee (2020), Emissions inventory for road transport in India in 2020: Framework and post facto policy impact assessment, Research Square https://doi.org/10.21203/rs.3.rs-297185/v1
50. Rogelj, J. et al. (2018). “Mitigation Pathways Compatible with1.5°C in the Context of Sustainable Development”, inMasson-Delmotte, V. et al. (eds) Global Warming of 1.5°C. An IPCC Special Report on the impacts of global warming of 1.5°C above preindustrial levels and related global greenhouse gas emission pathways, in the context of strengthening the global response to the threat of climate change. Geneva, Switzerland: IPCC. https://www.ipcc.ch/site/assets/uploads/sites/2/2019/05/SR15_Chapter2_Low_Res.pdf
51. Iain Staffell et al(2019). “The role of hydrogen and fuel cells in the global energy system”, Energy Environ. Sci., 2019,12, 463-491,https://doi.org/10.1039/C8EE01157E
52. B. G. Pollet , I. Staffell and J. L. Shang (2012) , Electrochim. Acta, 84 , 235 —249 https://doi.org/10.1016/j.electacta.2012.03.172
53. Iain Staffell et al (2019). “The role of hydrogen and fuel cells in the global energy system”, Energy Environ. Sci., 2019,12, 463-491, https://doi.org/10.1039/C8EE01157E
54. IEA (2015), Technology Roadmap - Hydrogen and Fuel Cells, IEA, Paris https://www.iea.org/reports/technology-roadmap-hydrogen-and-fuel-cellsInternational
55. Ibid, 53
56. Climate Transparency. (2020). Climate Transparency Report India. https://www. climate-transparency.org/wp-content/uploads/2020/11/India-CT-2020-WEB.pdf
57. Sonal Patel (2020),World’s First Integrated Hydrogen Power-to-Power Demonstration Launched, Powermag, https://www.powermag.com/worlds-first-integrated-hydrogen-power-to-power-demonstration-launched/
58. IEA (2018), Clean and efficient heat for industry, IEA, Paris https://www.iea.org/commentaries/clean-and-efficient-heat-for-industry

For any queries about this document, contact [email protected]
AUTHORS
Dr. OP Agarwal is CEO at WRI India and leads the organization’s ongoing efforts around cities, energy, climate, landscape restoration, water, and government and business engagement. He has served as a member of the Indian Administrative Service (IAS) and held several positions from 1979 to 2007. As the head of the Urban Transport division of the Government of India, he authored India’s National Urban Transport Policy, a document that outlines the priorities for sustainable urban transport at all levels of government. He was the Executive Director at the Indian School of Business and chaired the US Transport Research Board’s Committee on Transportation in Developing Countries. He is a highly respected thinker and practitioner with a wealth of experience in cities, urban transport, climate change and related development and environment issues. Dr. Agarwal holds a PhD from the Indian Institute of Technology (IIT), Delhi, a Master’s degree in Transportation from the Massachusetts Institute of Technology, Cambridge, USA and a Bachelor’s degree in Electrical Engineering from IIT, Chennai.
Pawan Mulukutla is the Director of Clean Mobility and Energy Tech at WRI India. He is responsible for shaping WRI India's Hydrogen and Electric Mobility Programs. He is in-charge of the overall strategy and its implementation, partnerships and engagement. Pawan’s areas of focus include EV Industrial Evolution, Hydrogen Value Chain, India's pathway to Hydrogen economy, EV Industrial Evolution, Skill Development, Energy Storage, Charging Infrastructure planning framework, Vehicle to Grid Integration, and EV Asset financing. He holds a degree in Advanced Management from IIM-Bengaluru and an MS in Transport Engineering and Planning from Clemson University, South Carolina, USA.
Krishnaveni Malladi is a Consultant in Hydrogen Energy at WRI India. She leads research and analysis on emerging hydrogen technology. Krishnaveni holds an M. Tech in Biotechnology from Andhra University, Visakhapatnam, India. Krishanveni has several publications including one in the journal of American Chemist Society. She has also worked on enzyme research at SPIC Biotechnology, Chennai.
ACKNOWLEDGEMENTS
The authors give their thanks to Soham Kshirsagar for his support in various stages of writing the paper. The authors give their heartfelt thanks to Dr. Parveen Kumar and Shyamasis Das for their timely review of the paper. The authors are grateful to Dr. Shahana Chattaraj and Sudeshna Chatterjee for their guidance in developing the paper. They are thankful to Rohan Rao and Anuraag Nallapaneni for their discerning insights. In addition, the authors also thank Garima Jain, Neeraja Dhorde, Rama Thoopal, Dnyanada Deshpande, Uma Asher, Anindita Bhattacharjee, Bodhisattva Sen Roy and Karthikeyan Hemalatha who led the copy-editing, designing and final production of this paper. The findings and suggestions in the paper are the sole responsibility of the authors.
Related Documents


