1 Basic Statistical Graphics Using SAS® 9.2 and 9.3 This handout introduces the use of the SAS statistical graphics procedures: Proc Sgplot Proc Sgpanel Proc Sgscatter These are stand-alone procedures that create high quality graphs using a few simple SAS commands. These procedures can create boxplots, barcharts, histograms, scatterplots, line plots, and scatterplot matrices, among other things. These procedures use the ODS (Output Delivery System), which is also used by many SAS/Stat procedures to create graphs as a part of their output. See the document on my web page, ODS Graphics Using SAS.doc for several examples of getting ODS graphs from statistical procedures. Another helpful document with lots of examples is Using PROC SGPLOT for Quick High Quality Graphs by Susan Slaughter and Lora Delwiche. Getting Started Graphs generated using Statistical Graphics procedures will automatically be saved as .png files in your Current SAS Folder in Windows. To set the Current Folder, double-click on the location listed at the bottom of the SAS desktop and browse to the desired folder. Make sure you have double-clicked on the name of the folder. Set the current folder before you submit the SAS commands to create the Statistical Graphs. The files generated by these three procedures are .png (portable network graphics) files, which can be easily imported into other applications, such as Microsoft Word and Power Point. Because .png files use raster graphics they are very compact, and take up less space than .bmp files, for example. You can double-click on the .png files to view them, and they will open using your default Windows application for viewing pictures, or you can view them as thumbnails in the folder where they are saved. They will be given names such as SGPlot.png, SGPlot1.png, etc. The png files will be saved in your results window, as shown below:

Welcome message from author
This document is posted to help you gain knowledge. Please leave a comment to let me know what you think about it! Share it to your friends and learn new things together.
Transcript

1
Basic Statistical Graphics
Using SAS® 9.2 and 9.3 This handout introduces the use of the SAS statistical graphics procedures:
Proc Sgplot
Proc Sgpanel
Proc Sgscatter
These are stand-alone procedures that create high quality graphs using a few simple SAS
commands. These procedures can create boxplots, barcharts, histograms, scatterplots, line plots,
and scatterplot matrices, among other things. These procedures use the ODS (Output Delivery
System), which is also used by many SAS/Stat procedures to create graphs as a part of their
output. See the document on my web page, ODS Graphics Using SAS.doc for several examples
of getting ODS graphs from statistical procedures.
Another helpful document with lots of examples is Using PROC SGPLOT for Quick High
Quality Graphs by Susan Slaughter and Lora Delwiche.
Getting Started
Graphs generated using Statistical Graphics procedures will automatically be saved as .png files
in your Current SAS Folder in Windows. To set the Current Folder, double-click on the location
listed at the bottom of the SAS desktop and browse to the desired folder. Make sure you have
double-clicked on the name of the folder. Set the current folder before you submit the SAS
commands to create the Statistical Graphs.
The files generated by these three procedures are .png (portable network graphics) files, which
can be easily imported into other applications, such as Microsoft Word and Power Point.
Because .png files use raster graphics they are very compact, and take up less space than .bmp
files, for example. You can double-click on the .png files to view them, and they will open using
your default Windows application for viewing pictures, or you can view them as thumbnails in
the folder where they are saved. They will be given names such as SGPlot.png, SGPlot1.png, etc.
The png files will be saved in your results window, as shown below:

2
Data Sets
The SAS dataset used for these examples (employee.sas7bdat) can be downloaded and unzipped
from http://www.umich.edu/~kwelch/b600/sasdata2.zip. Download the zipped file and unzip its
contents to a folder on your desktop called sasdata2. The raw data file used in these examples
(autism.csv) can be found at http://www.umich.edu/~kwelch/b600/labdata.zip. Download and
unzip this file to a folder on your desktop called labdata.
Initial SAS Commands to Submit to Start Your Session:
Submit a libname statement to point to the sasdata2 folder where the SAS datasets reside.
Change this to reflect the location of the sasdata2 folder on your computer.
libname sasdata2 "c:\users\kwelch\desktop\sasdata2";
ods listing sge = on;
Set the current folder by double-
clicking here. Graphs created by
Statistical Graphics procedures will
automatically be saved here.
This is your graph. To view
individual graphics files, double-
click on the plot icon in the results
window.

3
Statistical Graphics Examples
Boxplots
title "Boxplot";
title2 "No Categories";
proc sgplot data=sasdata2.employee;
vbox salary;
run;
title "Boxplot";
title2 "Category=Gender";
proc sgplot data=sasdata2.employee;
vbox salary/ category=gender;
run;

4
Paneled Boxplots
title "Boxplot with Panels";
proc sgpanel data=sasdata2.employee;
panelby jobcat / rows=1 columns=3 ;
vbox salary / category= gender;
run;
Barcharts title "Vertical Bar Chart";
proc sgplot data=sasdata2.employee;
vbar jobcat ;
run;

5
Clustered Bar Charts
title "Vertical Bar Chart";
title2 "Clustered by Gender";
proc sgplot data=sasdata2.employee;
vbar jobcat /group=Gender groupdisplay=cluster ;
run;
Bar Chart with Mean and Error Bars
title "BarChart with Mean and Standard Deviation";
proc sgplot data=sasdata2.employee;
vbar jobcat / response=salary limitstat = stddev
limits = upper stat=mean;
run;

6
Bar Charts for Proportions of a Binary Variable
/*Bar chart with Mean of Indicator Variable*/
data afifi;
set sasdata2.afifi;
if survive=1 then died=0;
if survive=3 then died=1;
run;
proc format;
value shokfmt 2="Non-Shock"
3="Hypovolemic"
4="Cardiogenic"
5="Bacterial"
6="Neurogenic"
7="Other";
run;
title "Barchart of Proportion Died for each Shock Type";
proc sgplot data=afifi;
vbar shoktype / response=died stat=mean;
format shoktype shokfmt.;
run;
Paneled Bar Charts
title "BarChart Paneled by Gender";
proc sgpanel data=sasdata2.employee;
panelby gender ;
vbar jobcat / response=salary limitstat = stddev
limits = upper stat=mean;
run;
7
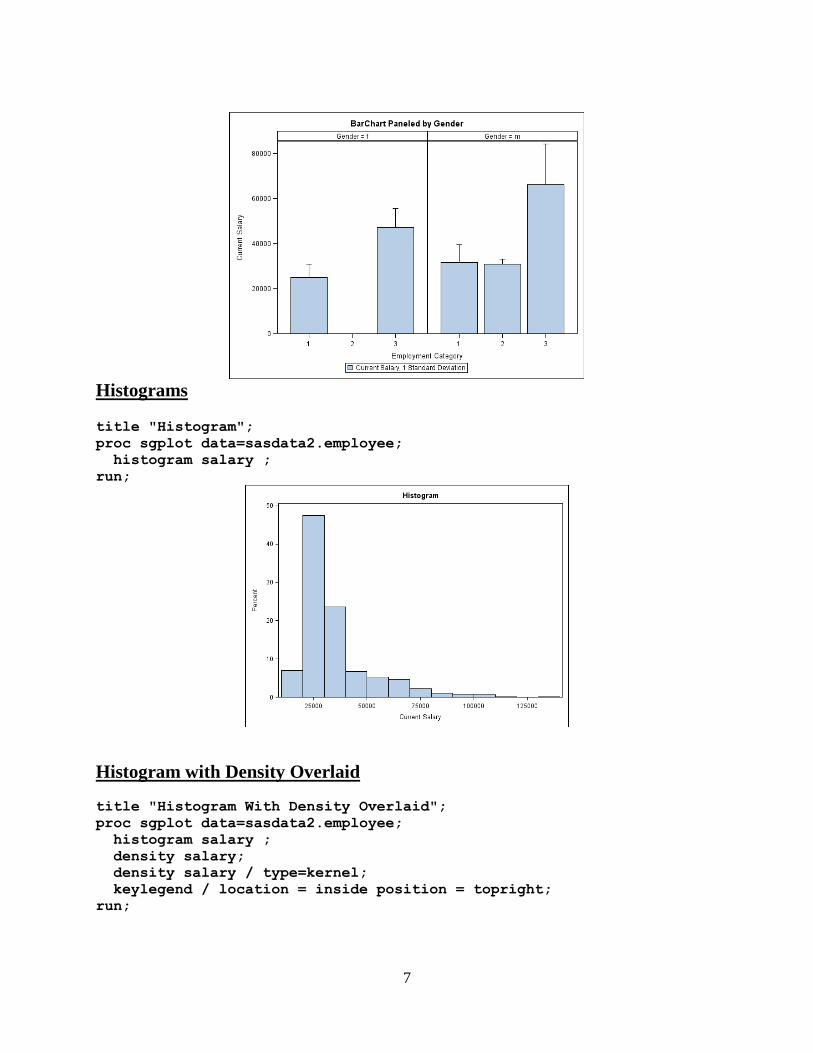
Histograms title "Histogram";
proc sgplot data=sasdata2.employee;
histogram salary ;
run;
Histogram with Density Overlaid
title "Histogram With Density Overlaid";
proc sgplot data=sasdata2.employee;
histogram salary ;
density salary;
density salary / type=kernel;
keylegend / location = inside position = topright;
run;

8
Paneled Histograms
title "Histogram with Panels";
title2 "Exclude Custodial";
proc sgpanel data=sasdata2.employee;
where jobcat not=2;
panelby gender jobcat/ rows=2 columns = 2;
histogram salary / scale=proportion; run;
/*use scale=proportion, count, or percent(default)*/

9
Overlaid Histograms
title "Overlay different variables";
proc sgplot data=sasdata2.employee;
histogram salbegin ;
histogram salary / transparency = .5;
run;
/*Create New Variables for Overlay*/
data employee2;
set sasdata2.employee;
if gender = "m" then salary_m = salary;
if gender = "f" then salary_f = salary;
run;
title "Overlaid histograms";
title2 "Same variable, but two groups ";
proc sgplot data=employee2;
histogram salary_m;
histogram salary_f / transparency=0;
run;
Note: Transparency = 0 is opaque. Transparency = 1.0 is fully transparent.

10
Scatterplots
title "Scatterplot";
proc sgplot data=sasdata2.employee;
scatter x=salbegin y=salary / group=gender ;
run;
Scatterplot with Confidence Ellipse
title "Scatterplot";
proc sgplot data=sasdata2.employee;
scatter x=salbegin y=salary / group=gender ;
ellipse x=salbegin y=salary / type=predicted alpha=.10;
run;
11
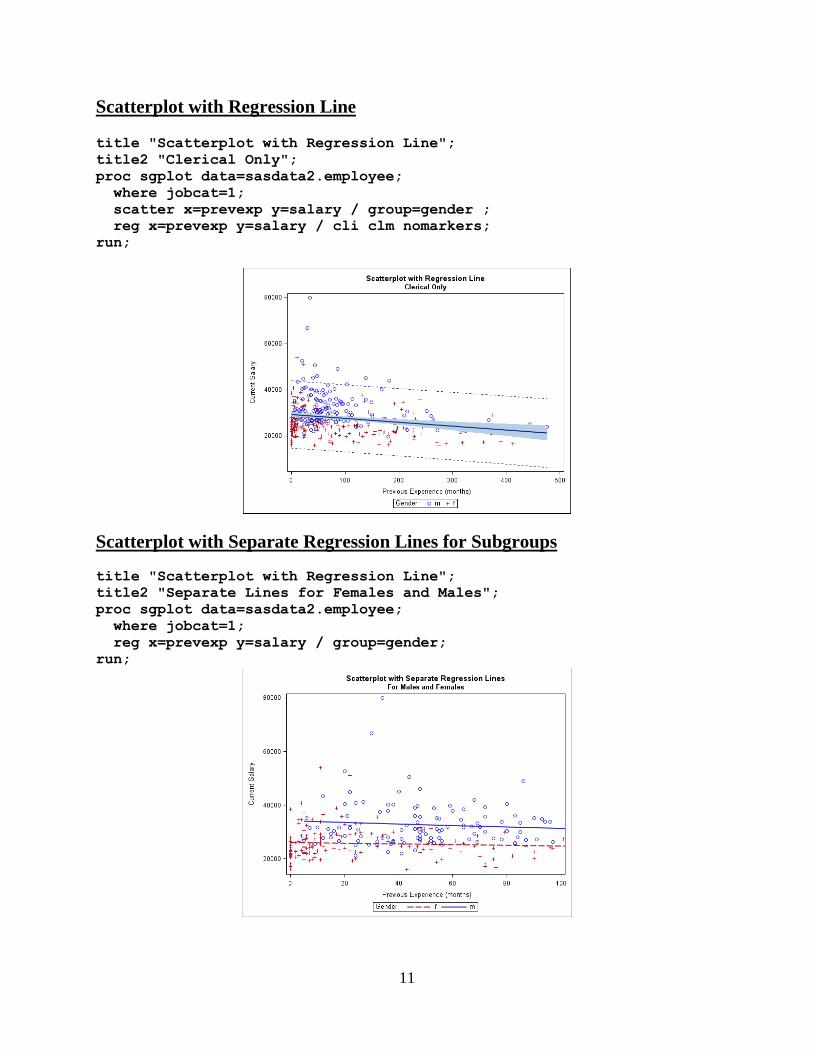
Scatterplot with Regression Line title "Scatterplot with Regression Line";
title2 "Clerical Only";
proc sgplot data=sasdata2.employee;
where jobcat=1;
scatter x=prevexp y=salary / group=gender ;
reg x=prevexp y=salary / cli clm nomarkers;
run;
Scatterplot with Separate Regression Lines for Subgroups
title "Scatterplot with Regression Line";
title2 "Separate Lines for Females and Males";
proc sgplot data=sasdata2.employee;
where jobcat=1;
reg x=prevexp y=salary / group=gender;
run;
12
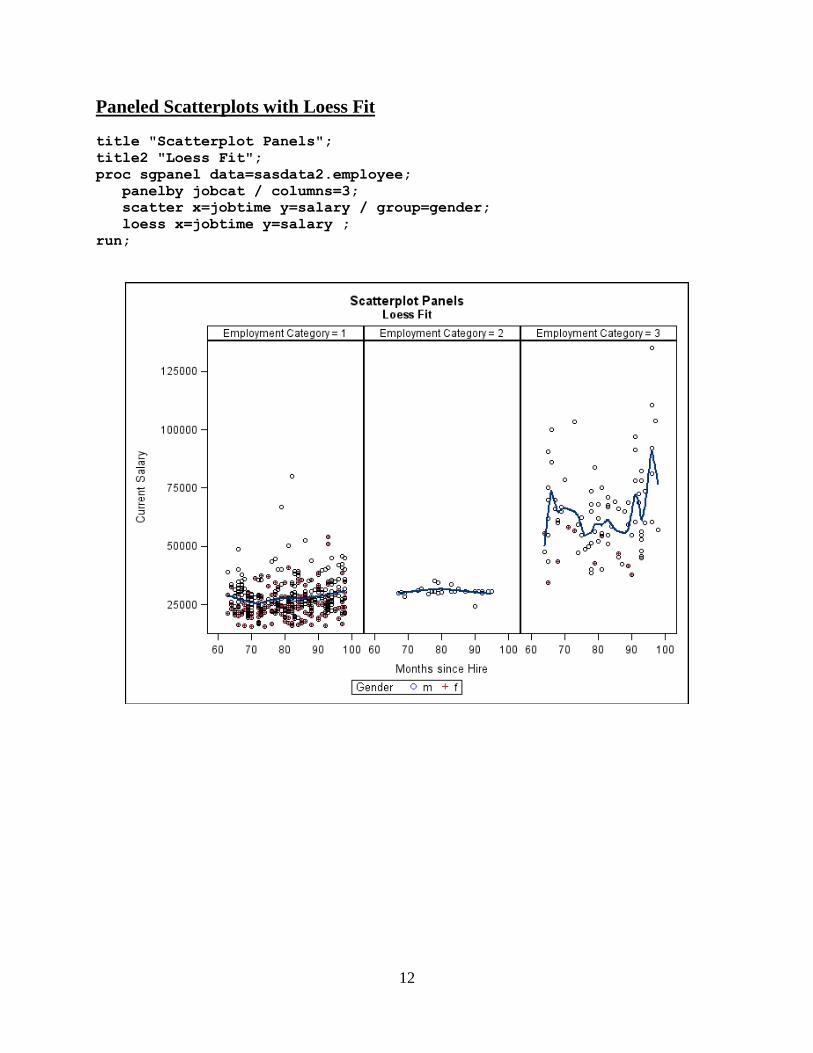
Paneled Scatterplots with Loess Fit
title "Scatterplot Panels";
title2 "Loess Fit";
proc sgpanel data=sasdata2.employee;
panelby jobcat / columns=3;
scatter x=jobtime y=salary / group=gender;
loess x=jobtime y=salary ;
run;

13
Scatterplot Matrix
title "Scatterplot Matrix";
title2 "Clerical Employees";
proc sgscatter data=sasdata2.employee;
where jobcat=1;
matrix salbegin salary jobtime prevexp / group=gender
diagonal=(histogram);
run;
14
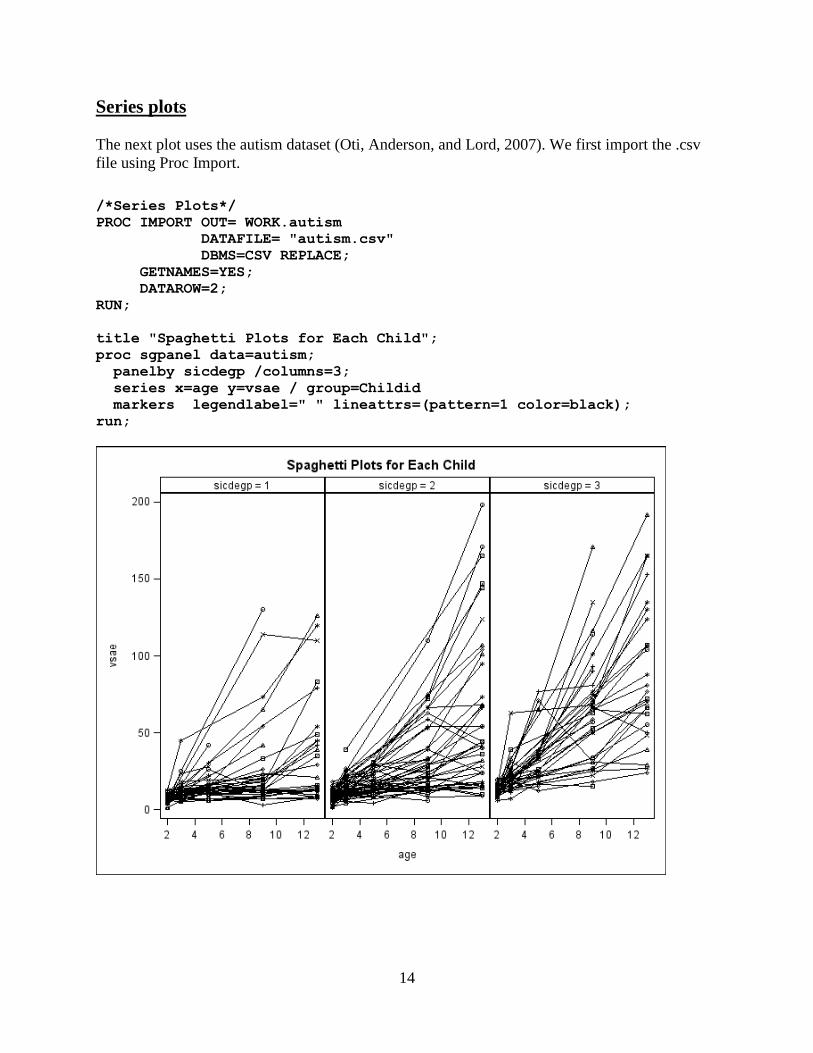
Series plots
The next plot uses the autism dataset (Oti, Anderson, and Lord, 2007). We first import the .csv
file using Proc Import.
/*Series Plots*/
PROC IMPORT OUT= WORK.autism
DATAFILE= "autism.csv"
DBMS=CSV REPLACE;
GETNAMES=YES;
DATAROW=2;
RUN;
title "Spaghetti Plots for Each Child";
proc sgpanel data=autism;
panelby sicdegp /columns=3;
series x=age y=vsae / group=Childid
markers legendlabel=" " lineattrs=(pattern=1 color=black);
run;

15
Overlay Means on Plots
We can calculate the means by SICDEGP and AGE and overlay these means on a dot plot of the
raw data using the commands below.
proc sort data=autism;
by sicdegp age;
run;
proc means data=autism noprint;
by sicdegp age;
output out=meandat mean(VSAE)=mean_VSAE;
run;
data autism2;
merge autism meandat(drop=_type_ _freq_);
by sicdegp age;
run;
title "Means Plots Overlaid on Data";
proc sgplot data=autism2;
series x=age y=mean_VSAE / group=SICDEGP;
scatter x=age y=VSAE ;
run;

16
Series Plot with Error Bars
This example uses some made-up data to illustrate how you can overlay plots in SAS. We use
the Series plot, plus the Highlow plot together, and SAS automatically overlays them. The
remainder of the commands are just window-dressing to make the plot look nice.
data test;
input num_products beta stderror;
upper = beta + stderror;
lower = beta - stderror;
cards;
0 0 0
1 .5 .5
2 1 .6
3 1 .7
4 2 .8
;
proc print data=test;
run;
ods listing sge=on;
proc sgplot data=test noautolegend ;
series x=num_products y=beta /
markers markerattrs=(symbol=diamondfilled color=brown );
highlow x = num_products high=upper low=lower
/ lowcap=serif highcap=serif;
yaxis values = (-.5 to 3.5 by .5) ;
xaxis offsetmin=.1 offsetmax=.1;
label num_products = "Number of additional products used" ;
label upper="B";
run;
17
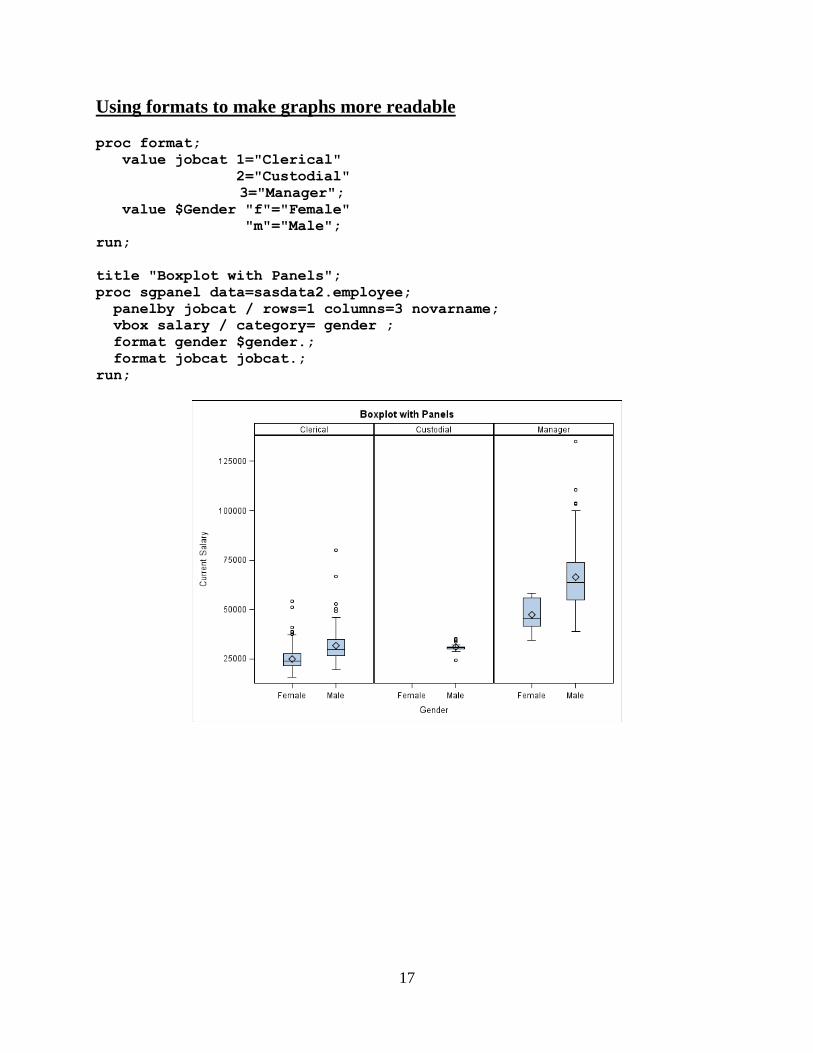
Using formats to make graphs more readable proc format;
value jobcat 1="Clerical"
2="Custodial"
3="Manager";
value $Gender "f"="Female"
"m"="Male";
run;
title "Boxplot with Panels";
proc sgpanel data=sasdata2.employee;
panelby jobcat / rows=1 columns=3 novarname;
vbox salary / category= gender ;
format gender $gender.;
format jobcat jobcat.;
run;
18
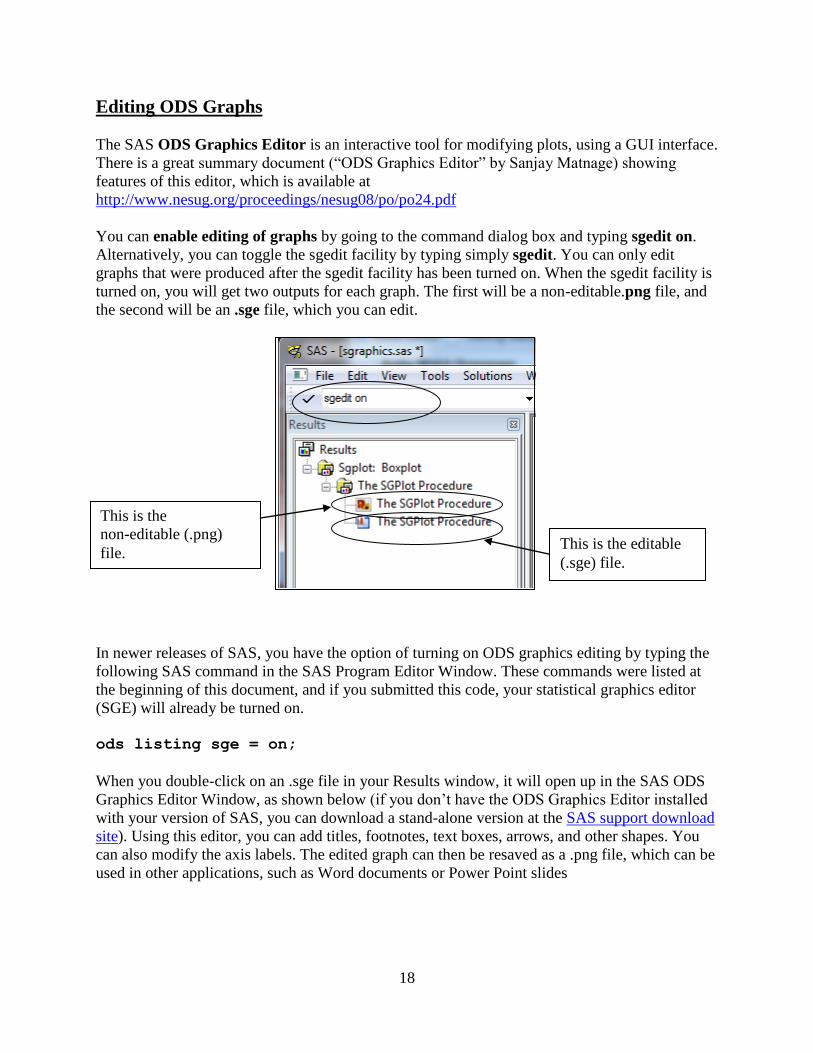
Editing ODS Graphs
The SAS ODS Graphics Editor is an interactive tool for modifying plots, using a GUI interface.
There is a great summary document (“ODS Graphics Editor” by Sanjay Matnage) showing
features of this editor, which is available at
http://www.nesug.org/proceedings/nesug08/po/po24.pdf
You can enable editing of graphs by going to the command dialog box and typing sgedit on.
Alternatively, you can toggle the sgedit facility by typing simply sgedit. You can only edit
graphs that were produced after the sgedit facility has been turned on. When the sgedit facility is
turned on, you will get two outputs for each graph. The first will be a non-editable.png file, and
the second will be an .sge file, which you can edit.
In newer releases of SAS, you have the option of turning on ODS graphics editing by typing the
following SAS command in the SAS Program Editor Window. These commands were listed at
the beginning of this document, and if you submitted this code, your statistical graphics editor
(SGE) will already be turned on.
ods listing sge = on;
When you double-click on an .sge file in your Results window, it will open up in the SAS ODS
Graphics Editor Window, as shown below (if you don’t have the ODS Graphics Editor installed
with your version of SAS, you can download a stand-alone version at the SAS support download
site). Using this editor, you can add titles, footnotes, text boxes, arrows, and other shapes. You
can also modify the axis labels. The edited graph can then be resaved as a .png file, which can be
used in other applications, such as Word documents or Power Point slides
This is the editable
(.sge) file.
This is the
non-editable (.png)
file.

19
ODS Graphics Editor Window
Creating pdf output
To save a graph in .pdf format, you first need to set up the ODS environment. If you use: ods
listing close; SAS will not produce a .png file. To toggle the .png output on again after the pdf
graph is completed, use: ods listing. The pdf output from these commands is shown on the next
page. The output file (testing.pdf) will be placed in your default directory.
ods pdf style=journal2;
ods pdf file = "testing.pdf";
ods listing close;
title "PDF Output";
proc sgpanel data=sasdata2.employee;
panelby jobcat;
scatter x=jobtime y=salary / group=gender;
loess x=jobtime y=salary ;
run;
ods pdf close;
ods listing;
20
Creating html output
The commands shown below illustrate how to create html output, using color output
(style=statistical). The output file (testing.html) will be placed in your default directory.
/*Creating HTML output*/
ods html style=statistical;
ods html file = "testing.html";
ods listing close;
title "HTML Output";
proc sgpanel data=sasdata2.employee;
panelby jobcat / columns=3 novarname;
scatter x=jobtime y=salary / group=gender;
loess x=jobtime y=salary/ nomarkers;
format jobcat jobcat.;
run;
ods html close;
ods listing;
ods html style=htmlblue;
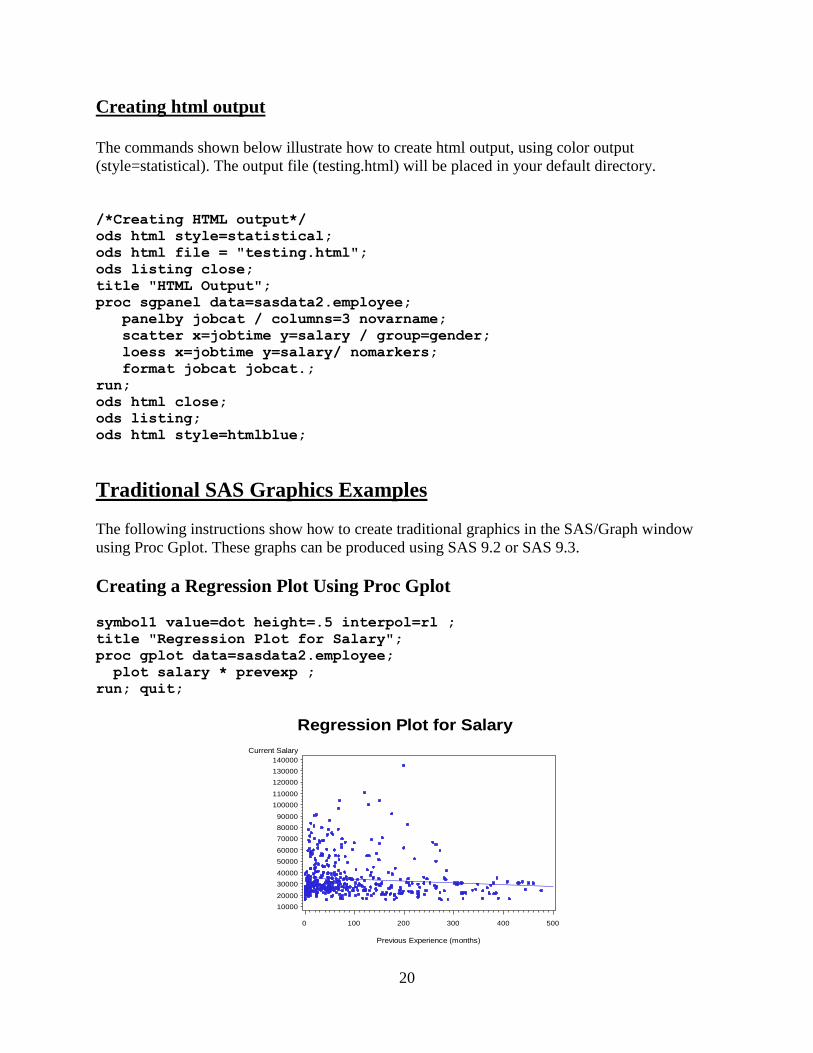
Traditional SAS Graphics Examples
The following instructions show how to create traditional graphics in the SAS/Graph window
using Proc Gplot. These graphs can be produced using SAS 9.2 or SAS 9.3.
Creating a Regression Plot Using Proc Gplot symbol1 value=dot height=.5 interpol=rl ;
title "Regression Plot for Salary";
proc gplot data=sasdata2.employee;
plot salary * prevexp ;
run; quit;
Current Salary
10000
20000
30000
40000
50000
60000
70000
80000
90000
100000
110000
120000
130000
140000
Previous Experience (months)
0 100 200 300 400 500
Regression Plot for Salary
21
Saving Traditional graphs from the Graph Window
Graphs generated using Proc Gplot or other traditional SAS graph procedures will appear in the
SAS/Graph window. You can Export these graphs to a file format that can be read by any
windows applications that can read graphics files. You can save SAS graphs from the graphics
window using any of the commonly used formats for graphs supported by SAS (e.g., .bmp, .gif,
.tif). You can also save graphics files from the SAS/Graph window using a .png (portable
network graphics) format.
Go to the SAS/Graph window. With the appropriate graph open in the Graph Window, Go to
File...Export as Image....Select the File type you want (e.g. .bmp), Browse to the location where
you wish to save the graphics file, and type the file name, e.g.
regression_salary.bmp
Bringing graphics files into a Word document
You can simply drag and drop a graphics file into word, or you can import it using the steps
shown below:
Make sure you are not at the beginning or end of a document, or it will be difficult to work with
the graph. Place your mouse somewhere in the middle of several blank lines in the document. Go
to Insert…Picture from file… Browse until you get to your graph (e.g., histogram_salary.png).
You can resize the graph by clicking your mouse anywhere in the graph to get the outline. Then
grab the lower right corner with your mouse (you should see an arrow going northwest to
southeast) and move it up and to the left to make it smaller, or down and to the right to make it
larger. You can't easily edit the graph in Word. If you're using a .png file, you can simply drag
and drop it into Word.
Related Documents