1 FINANCIAL CONCEPTS AND TOOLS FOR MANAGERS Delta Publishing Company

Welcome message from author
This document is posted to help you gain knowledge. Please leave a comment to let me know what you think about it! Share it to your friends and learn new things together.
Transcript
1
FINANCIAL CONCEPTS AND TOOLS
FOR MANAGERS
Delta Publishing Company
2
Copyright 2008 by
DELTA PUBLISHING COMPANY
P.O. Box 5332, Los Alamitos, CA 90721-5332
All rights reserved. No part of this course may be reproduced in any form or by any means, without
permission in writing from the publisher.
3
CONTENTS
Module 1 The Basics 0. Introduction
1. What is finance? 2. Basic forms of business organizations 3. Financial institutions and markets 4. Depreciation methods 5. Federal corporate taxation
Module 2 Financial Statement Ratios
1. Basic financial statements 2. Stockholders’ equity section of the balance sheet 3. Statement of cash flows 4. Horizontal and vertical analysis 5. Liquidity and liquidity ratios 6. Activity ratios 7. Solvency and debt service ratios 8. Profitability ratios 9. Du Pont system 10. Market value ratios 11. Limitations of ratio analysis
Module 3 Budgeting and forecasting financing needs
12. Budgeting 13. Financial forecasting and the percent-of-sales method 14. Cash budgeting
Module 4 Managing working capital
15. Working capital management 16. Cash management 17. Cash management models 18. Marketable securities 19. Management of accounts receivable 20. Inventory management and just-in-time (JIT)
Module 5 Security, Bond, and Asset Valuation
21. Risk 22. Portfolio theory 23. Market index models 24. Capital asset pricing model (CAPM) and arbitrage pricing model (APM) 25. Beta

4
26. Return 27. The risk-return trade-off 28. Bond valuation 29. Bond yield—effective rate of return on a bond 30. Term structure of interest rates 31. Common stock valuation
Module 6 Time value of money and capital budgeting
32. Time value of money and its applications 33. Capital budgeting 34. Accounting rate of return 35. Payback period 36. Net present value method 37. Profitability index 38. Internal rate of return (IRR) 39. Mutually exclusive investments 40. Lease-purchase decision 41. Capital rationing 42. Capital budgeting and inflation 43. Risk analysis in capital budgeting
Module 7 Determining cost of capital and capital structure decisions
44. Cost of capital 45. Computing the cost of equity capital 46. Level of financing and the marginal cost of capital (MCC) 47. Break-even analysis 48. Cash break-even point 49. Leverage 50. Operating leverage 51. Financial leverage 52. Theory of capital structure 53. EBIT-EPS approach to capital structure
Module 8 Dividends and stock splits
54. Cash dividends 55. Stock dividends and stock splits 56. Dividend policy
Module 9 Short-term financing
57. Financing strategy 58. Trade credit 59. Short-term bank loans 60. Other sources of financing 61. Accounts receivable financing 62. Inventory financing
5
Module 10 Term loans and leasing
63. Intermediate-term bank loans 64. Small Business Administration 65. Leasing
Module 11 Long-term debt
66. Long-term debt financing 67. Bond refunding
Module 12 Stock, convertibles, and warrants
68. Investment banking 69. Public versus private placement of securities 70. Stockholders 71. Preferred stock 72. Common stock 73. Stock rights 74. Stock repurchases 75. Margin trading 76. Short selling 77. Governmental regulation 78. Efficient market theory 79. Convertible securities 80. Stock warrants
Module 13 Mergers and acquisitions
81. Mergers and acquisitions 82. Holding company 83. Tender offer
Module 14 Options and option pricing, derivatives and risk management, and International finance
84. Voluntary settlement 85. Bankruptcy and reorganization 86. Derivatives (options and futures) and risk management 87. The Black-Scholes option pricing model 88. International finance
Glossary
6
Module 1
THE BASICS
LEARNING OBJECTIVES:
After studying this module, your will be able to:
1. Manage funds to maximize shareholder value. 2. Define the concepts of finance. 3. List and discuss basic forms of business organizations. 4. Describe the role of the various financial institutions and markets. 5. Demonstrate and calculate the depreciation methods. 6. Outline the basic concepts associated with federal corporate taxation.
Finance involves obtaining, using, and managing funds to achieve the entity’s financial objectives (e.g., maximization of shareholder value). Funds may be obtained from money markets and capital markets. The various types of business organizations include sole propri-etorship, partnership, corporations (C and S-corporations), and limited liability companies (LLC). Tax planning is important to minimize taxes. The company must take advantage of all allowable tax deductions, including depreciation, write-offs for promotion and entertainment, and contributions. 0. Introduction
1. What is finance? 2. Basic forms of business organizations 3. Financial institutions and markets 4. Depreciation methods 5. Federal corporate taxation
7
0
INTRODUCTION
Finance involves obtaining, using, and managing funds to achieve the company’s financial objectives (e.g., maximization of shareholder value). The course emphasizes and develops an understanding of financial concepts, tools, and major decision areas related to the financial management of the business. This course is directed toward the businessperson who must have financial knowledge but has not had formal training in finance--perhaps a newly promoted middle manager or a marketing manager of a small company who must know some basic finance concepts. The entrepreneur or sole proprietor also needs this knowledge; he or she may have brilliant product ideas, but not the slightest idea about financing.
8
1
WHAT IS FINANCE?
OVERVIEW Finance covers financial analysis and planning, investment decisions, financing and capital structure decisions, and management of financial resources. Goals of managerial finance: 1. stockholder wealth maximization, 2. profit maximization, 3. managerial reward maximization, 4. behavioral goals, and 5. social responsibility. Modern managerial finance theory: assumes that the primary goal of the firm is to maximize the wealth of its stockholders, i.e., to maximize the price of the firm’s common stock. Profit maximization: a short-term goal. A firm may maximize its short-term profits at the expense of its long-term profitability. Stockholder wealth maximization: a long-term goal. Wealth maximization is generally preferred because it considers 1. wealth for the long term, 2. risk or uncertainty, 3. the timing of returns, and 4. the stockholders’ return. Financial manager’s responsibilities:
• Determining the proper amount of funds to employ in the firm, i.e., the size of the firm and its rate of growth • Allocating funds efficiently to specific assets • Raising funds on as favorable terms as possible, i.e., determining the composition of liabilities • Managing working capital, like inventory and accounts receivable Treasurer: handles external financing matters and is responsible for managing corporate assets and liabilities, planning the finances, budgeting capital, financing the business, formulating credit policy, and managing the investment portfolio. Controller: concerned with internal matters—financial and cost accounting, taxes, budgeting, and control functions. Financial vice president or chief financial officer (CFO): supervises all phases of financial activity and serves as financial adviser to the board of directors. Effects: Financial managers influence: • Present and future earnings per share (EPS) • The timing, duration, and risk of these earnings • Dividend policy • The manner of financing the firm
Agency problems: exists when one or more persons (called principals) employ one or more other persons (called agents) to perform some tasks. Primary agency relationships exist 1. between shareholders and managers and 2. between creditors and shareholders.
9
2
BASIC FORMS OF BUSINESS ORGANIZATION
OVERVIEW The basic forms of business organizations are: sole proprietorship, partnership, and corporation. Sole proprietorship: a business owned by one individual. • Advantages: 1. requires no formal charter, 2. has minimal organizational costs, and 3. profits and control not shared with others. • Disadvantages: 1. limited ability to raise large sums of money, 2. unlimited liability, and 3. limited life. Partnership: similar to sole proprietorship but more than one owner. • Advantages: 1. minimal organization effort and costs, and 2. few government regulations. • Disadvantages: 1. unlimited liability, 2. limited ability to raise large sums of money, and 3. dissolved upon the death or withdrawal of any of the partners. Limited partnership: one or more partners, some with limited liability up to their investment if business fails. Example: real estate. • General partner manages the business. • Limited partners not involved in daily activities. • Limited partners receive return in the form of income and capital gains. • Limited partners often receive tax benefits. Corporation: also called a C corporation, a legal entity existing apart from its owners (stockholders). Ownership evidenced by possession of shares of stock. • Advantages: 1. unlimited life, 2. limited liability, 3. transfer of ownership through stock transfer, and 4. ability to raise large sums of capital. • Disadvantages: 1. difficult and costly to establish, and 2. subject to double taxation on earnings and dividends paid to stockholders. Subchapter S corporation: a form of corporation whose stockholders are taxed as partners. Distributes its income directly to shareholders; avoids corporate income tax while enjoying the other advantages of the corporate form. However, unlike a partnership, shareholders cannot receive allocations disproportionate to their interests. To qualify as an S corporation, a corporation must: • Have fewer than 75 shareholders; none may be nonresident aliens • Have only one class of stock • Properly elect Subchapter S status

10
Limited-Liability Company (LLC): Most states permit the establishment of LLCs.
• An LLC provides limited personal liability, as a corporation does. Owners, who are called members, can be other corporations.
• The members run the company unless they hire an outside management group.
• The LLC can choose whether to be taxed as a regular corporation or pass through entity. Profits and losses can be split using special allocation rules that allow distributions disproportionate to members interest.
11
3
FINANCIAL INSTITUTIONS AND MARKETS
OVERVIEW A healthy economy depends on efficient transfer of funds from savers to individuals, businesses, and governments. Most transfers occur through specialized financial institutions that serve as intermediaries between suppliers and users of funds. Financial markets: provide a mechanism through which the financial manager may obtain funds from a wide range of sources, including financial institutions. • Entities demanding funds are brought together with those having surplus funds. • The financial markets are composed of money markets and capital markets. Money markets: credit markets for short-term (less than 1 year) debt securities, usually highly liquid securities with relatively low default risk. Equity instruments such as common stock are not traded here. Examples: U.S. Treasury bills, federal agency securities, bankers’ acceptances, and commercial paper. Capital markets: markets in which long-term debt and equity securities issued by the government and corporations are traded. Capital market instruments often carry greater default and market risks but return a higher yield than money market instruments. Examples: New York Stock Exchange, NASDAQ, and regional stock exchanges. • Over-the-counter (OTC) (or unlisted) market is an informal system of contacts among brokers and dealers. • Most corporate bonds are traded over the counter. Primary market: market for new issues.
Secondary market: market for previously issued, “secondhand” securities. Example: New York Stock Exchange and NASDAQ.
Other financial markets:
• Market for special types of financial instruments • Commodity market: handles various commodities futures • Foreign exchange market: handles international financial transactions between the U.S. and other countries • Mortgage market: handles real estate financing and mortgage-backed securities
12
4
DEPRECIATION METHODS
OVERVIEW Depreciation spreads the original cost of a fixed asset over its estimated useful life. Examples of fixed assets are plant, equipment, and vehicles. Depreciation reduces taxable income. Accelerated depreciation methods provide more rapid expensing of the cost of the asset and thereby offer the advantage of deferring the payment of taxes. Straight-line method: results in equal periodic depreciation charges. Most appropriate when an asset’s usage is uniform from period to period, as is the case with furniture. The amount of asset cost that can be depreciated is the original cost less salvage value.
Depreciation expense = life useful of years ofnumber
valuesalvage -Cost
Sum-of-the years’ digits method (SYD): the number of years of life expectancy enumerated in reverse order in the numerator; the denominator is the sum of the digits. Example: If the life expectancy of a machine is 8 years, write the numbers in reverse order: 8, 7, 6, 5, 4, 3, 2, 1. The sum of these digits is 36, or (8 + 7 + 6 + 5 + 4 + 3 + 2 + 1). Thus, the fraction for the first year is 8/36, while the fraction for the last year is 1/36. The sum of the eight fractions equals 36/36, or 1. Therefore, at the end of 8 years, the machine is completely written down to its salvage value.
• To find the sum-of-the-years’ digits (S):
S = (N)(N + 1)
2
where N is the number of years of expected life.
Double-declining-balance method (DDB): Depreciation expense is highest in the earlier years and lowest in the later years. The computation follows: • A depreciation rate is determined by doubling the straight-line rate. Example: The double-declining rate for a 10-year asset is 20% (10%x 2). • Depreciation equals the rate multiplied by the book value of the asset at the beginning of the period. • The method ignores salvage value in the computation, but total depreciation cannot exceed cost less salvage value.
13
5
FEDERAL CORPORATE TAXATION
OVERVIEW Taxes affect financing and investment decisions. Tax planning minimizes tax obligations and postpones the payment of taxes. Corporations file their federal tax returns on IRS Form 1120. Tax strategies and planning: Analyze the tax consequences of alternative approaches in
decision making. Shift income and expenses into tax years that will result in the least tax. • Receive income in a year in which it will be taxed at a lower rate. • Pay tax-deductible expenses in a year in which tax rates are high. • Accelerate expenses that are deductible or that will be restricted in the future. • Try to invest income in tax-free instruments. Example: Interest on a municipal bond is
partially or totally tax-free. Taxable income: gross income from revenue sources less tax-deductible expenses. Tax rates: the rates applied to taxable income to determine tax.
• Marginal tax rate: tax rate on the next dollar of income. • Effective tax rate: average tax rate on all taxable income equal to the tax divided by the
taxable income.
Income subject to tax: income sources common to many corporations are: 1. sales or revenue, 2. gains or losses from the sale of assets used by the company to produce income (referred to as 1231 gains and losses) 3. interest income, 4. dividend income, 5. lease, rental, and maintenance income, 6. net capital gains (capital gains – capital losses) but not net capital losses (capital losses – capital gains).
Tax deductions: 1. business meal and entertainment expenses (80% deductible), 2. food and
entertainment-related employee benefits, 3. promotional items, 4. business gifts (up to $25 per recipient), 5. insurance payments, 6. depreciation, 7. interest, 8. professional fees, 9. pension expense, 10. casualty and theft losses, and 11. actual bad debts.
Foreign tax credit: credit for taxes paid to a foreign government. Modified Accelerated Cost Recovery System (MACRS): used for computing depreciation deductions for tax purposes. MACRS abandons the concept of useful life and accelerates depreciation deductions by placing all depreciable assets into one of eight age property classes
• It calculates deductions, based on an allowable percentage of the asset's original cost.
14
Module 2
FINANCIAL STATEMENTS AND NALYSIS
LEARNING OBJECTIVES:
After studying this chapter, you will be able to:
1. List and define basic financial statements. 2. Explain the stockholders’ equity section of the balance sheet. 3. Identify and discuss the statement of cash flows. 4. Differentiate between horizontal and vertical analysis. 5. Calculate liquidity ratios. 6. Describe and calculate activity ratios. 7. Explain and give examples of solvency and debt service ratios. 8. Recognize and enumerate examples of profitability ratios. 9. Explain the Du Pont system. 10. Classify and interpret market value ratios. 11. Elaborate and clarify the limitations of ratio analysis.
A company is required to include in its annual report a balance sheet, income statement, and
statement of cash flows. These financial statements enable readers to know the financial health
of the business and its operating performance for the period. The balance sheet reveals what a
company owns and owes, while the income statement reports revenues and expenses. The statement of cash flows divides the sources and uses of cash into operating, investing, and
financing activities. Financial statement analysis involves looking at a company’s liquidity, asset
utilization, solvency, profitability, and dividend history.
6 Basic financial statements
7 Stockholders’ equity section of the balance sheet
8 Statement of cash flows
9 Horizontal and vertical analysis
10 Liquidity and liquidity ratios
11 Activity ratios
12 Solvency and debt service ratios
13 Profitability ratios
14 Du Pont system 15 Market value ratios
16 Limitations of ratio analysis
15
6
BASIC FINANCIAL STATEMENTS
OVERVIEW Financial statements depict a company’s financial position and operating performance so that management, investors, and creditors can appraise the financial health of the business. The two major financial statements are the income statement and balance sheet. These financial statements help reveal the company’s profit, what it owns, what it owes, and the stockholders’ equity. Income statement: reports net income, or profit earned (total revenue minus total expenses). • Revenue: increase in capital from sale of merchandise (sales), performance of services (e.g., professional fees earned), or passive income (e.g., interest income, dividend income). • Expense: decrease in capital from activities necessary to generate revenue. Examples: 1. cost of the inventory sold (cost of sales), 2. value of the services rendered (e.g., salary expense, fringe benefits), 3. expenditure necessary for conducting business operations (e.g., rent expense, telephone expense), 4. financial expenses (e.g., interest expense), and 5. taxes. Balance sheet: lists assets, liabilities, and stockholders’ equity. • Assets: what a company owns, including: 1. current assets (assets expected to be converted into cash or used up within one year, such as inventory), 2. long-term investments (investments in other companies’ stocks or bonds where the intent is to hold them for more than one year), 3. property, plant and equipment (tangible assets having physical substance employed in the production of goods or services and having a life greater than one year, such as machinery), and 4. intangible assets (assets with a life exceeding one year that either lack physical substance or arise from a right granted by the government, such as a patent). • Liabilities: what the company owes, including current liabilities (liabilities due within one year such as accounts payable) and noncurrent liabilities (liabilities due within a period greater than one year, such as bonds payable). • Stockholders’ equity: equity of the stockholders in the business. (See Key 7.)
16
7
STOCKHOLDERS’ EQUITY SECTION OF THE BALANCE SHEET
OVERVIEW The stockholders’ equity section shows the ownership interest of stockholders in the corporation—the extent to which company assets are financed by equity issues rather than debt issues. Stockholders’ equity is the difference between total assets and total liabilities. Stockholders’ equity section: shows transactions affecting stockholders and includes:
• Capital Stock • Plus: Paid-in-Capital • Plus: Retained Earnings • Plus or Minus: Foreign Currency Translation Gain or Loss • Minus: Unrealized Loss on Long-term Investment Portfolio • Total • Minus: Treasury Stock • Equals: Total Stockholders’ Equity
Components of stockholders’ equity: • Capital stock: stock issued by the corporation and stated at par value, as well as stock to be
issued at a later date. Examples: preferred stock, common stock, stock options, stock warrants, and stock dividends.
• Paid-in-capital: the excess over par value received for the issuance of stock. • Retained earnings: the accumulated earnings of the company less any dividends paid out. • Foreign currency translation gain or loss: gain or loss from translating foreign financial
statements in the foreign currency to U.S. dollars. • Unrealized loss on long-term investment portfolio: unrealized (holding) decline in value
from cost to market value of the investment portfolio. • Treasury stock: issued shares that have been reacquired.
17
8
STATEMENT OF CASH FLOWS
OVERVIEW Financial analysis involves 1. financial ratio analysis, using the balance sheet and income statement, and 2. analysis of cash flows, using the statement of cash flows. This statement classifies cash receipts and cash payments as arising from operating, investing, and financing activities. Some questions answered by the statement of cash flows:
• Where did the earnings go? • Why was money borrowed? • Why were the cash dividends not larger? • How was the expansion in productive capacity financed? • How was debt retired? • What became of the proceeds of a bond or equity issue?
Definition of cash: cash and cash equivalents. A cash equivalent is a short-term liquid
investment having an original maturity of 3 months or less. Examples: Treasury bills and commercial paper.
Operating section: Operating activities relate to manufacturing and selling goods or rendering
services. • Cash flow derived from operating activities typically applies to the cash effects of
transactions entering into profit determination. • Cash inflows from operating activities include: 1. cash sales or collections on accounts
receivable, and 2. cash received from interest income and dividend income. • Cash outflows from operating activities include: 1. cash paid for inventory or on accounts
payable, and 2. cash paid for operating expenses. Investing section: cash flows applicable to changes in long-term assets. Investing activities
include purchasing or selling debt and equity securities in other entities and buying and selling fixed assets.
Financing section: cash flows resulting from changes in long-term liabilities and stockholders’
equity items. Financing activities include: • Issuance or repurchase of the company’s own stock • Issuance or retirement of long-term debt • Payment of dividends
18
9
HORIZONTAL AND VERTICAL ANALYSIS
OVERVIEW Horizontal and vertical analysis are part of financial statement analysis. Horizontal analysis looks at trends in the accounts over the years. Vertical analysis uses a significant item on a financial statement as a base value and compares all other items on the common size financial statement to it. Horizontal (common-size) analysis: the percentage change in an account computed to reveal
trends. Percentage change equals the dollar change over the prior year amount. Example: Sales in 20X1 and 20X2 were $100,000 and $120,000, respectively. The percentage change is 20% ($20,000/ $100,000). • It identifies areas of wide divergence to be investigated. • The dollar amount of the change and the percentage change are both important to look at
because either one alone might be misleading. • When an analysis covers many years of comparative financial statements, it may be best to
show trends relative to a base year. The base year is the one most representative of the company’s activity. Example: 20X1 is the base year and total assets are $400,000. If total assets in 20X7 are $500,000, the index in 20X7 is 1.25 ($500,000/$400,000).
• It compares trends in the company’s accounts to those of competitors and to industry norms.
Vertical (common-size) analysis: compares a financial statement item to a base amount within
the same year. • In the balance sheet, total assets are assigned 100%; each asset is expressed as a percentage
of total assets. Similarly, each liability and stockholders’ equity account is expressed as a percentage of total liabilities and stockholders’ equity respectively.
• In the income statement, net sales are assigned 100%; all other income statement accounts are evaluated in comparison to it.
19
10
LIQUIDITY AND LIQUIDITY RATIOS
OVERVIEW Liquidity is the firm’s ability to convert noncash assets into cash or to obtain cash to meet impending obligations. Seasonal: For seasonal businesses, year-end financial data may not be representative; averages
based on quarterly information may be used to level out seasonal effects. Net working capital: current assets less current liabilities. Working capital is a safety cushion
for creditors and a reserve for unexpected contingencies. Current ratio: current assets divided by current liabilities. It reveals the company’s ability to
meet current liabilities out of current assets. Quick ratio: A stringent test of liquidity that looks at the most liquid current assets, excluding
inventory and prepaid expenses; also called acid-test ratio. It equals:
Cash + marketable securities + accounts receivable Current liabilities
Other liquidity ratios: Two other popular liquidity ratios that a short-term creditor might be interested in are: the cash ratio and the cash burn rate. The cash ratio (or doomsday ratio) is:
Cash ratio =iabilitiesl current
cash
Cash burn rate = expenses operatingdaily average
assets current
Importance: Analyzing liquidity is essential for short-term creditors to ensure that the company
has adequate funds to meet current debt. A company with poor liquidity is a credit risk. • Liquidity is crucial to conducting business activity, especially in difficult times, such as
when a business is shut down by a strike. • Inadequate liquidity may lead to serious financial difficulties, including the inability to
obtain financing or to meet obligations, such as operating expenses, that come due.
20
11
ACTIVITY RATIOS
OVERVIEW Activity (asset utilization, turnover) ratios determine how fast asset accounts are converted into sales or cash. A greater utilization of assets results in higher profitability and cash flow and a lower risk of uncollectibiliiy or obsolescence. Accounts receivable ratios and analysis:
• Accounts receivable turnover, number of times accounts receivable are collected during the year, equal to credit sales divided by average accounts receivable (the beginning balance plus the ending balance divided by two).
• A higher turnover indicates faster collection from customers. • Average accounts receivable collection period: number of days it takes to collect on
receivables, equal to 365 days divided by accounts receivable turnover. • Aging of accounts receivable: lists accounts receivable according to the length of time they
are outstanding. A longer period means more risk. Inventory ratios and analysis:
• Inventory Turnover: number of times inventory is sold during the year, equal to cost of goods sold divided by average inventory.
• Lower turnover may result in buildup of merchandise and possible obsolescence. • Average age of inventory: number of days inventory is held before sale, equal to 365 days
divided by the inventory turnover. • If age increases, 1. funds are tied up in inventory that could be invested elsewhere for a
return, and 2. the company incurs higher carrying costs. Operating cycle: the time needed to turn cash into inventory, inventory into receivables, and
receivables back into cash. Cash conversion cycle or cash cycle: the number of days that pass before we collect the cash
from a sale, measured from when we actually pay for the inventory. Fixed asset turnover: number of times fixed assets turn over into sales, equal to sales divided
by average fixed assets. Total asset turnover: number of times total assets turn over into sales, equal to sales divided by
average total assets.
21
12
SOLVENCY AND DEBT SERVICE RATIOS
OVERVIEW Solvency (leverage, coverage) ratios reveal the company’s ability to meet long-term obligations as they become due. Debt service ratios measure the firm’s ability to cover finance charges created by its use of financial leverage. An analysis of solvency emphasizes the long-term financial and operating structure of the business. Solvency also depends upon corporate profitability. Debt level: When debt is excessive, the company may have problems
meeting the interest payments and principal at maturity. If debt is too high, the maturity dates may be extended. • The company enjoys a favorable leverage situation when the return on borrowed funds
exceeds the after-tax interest cost, provided the debt level is reasonable. Debt ratio: compares total liabilities to total assets. It shows the percentage of total funds
obtained from creditors. Debt/equity ratio: a measure of financial leverage and risk, equal to total liabilities divided by
total stockholders’ equity. Noncurrent assets to noncurrent liabilities: A high ratio indicates protection for long-term
creditors, because long-term debt will ultimately be paid out of long-term assets. Times interest earned ratio: reflects the number of times before-tax earnings cover interest
expense:
Earnings before interest and taxes (EBIT) Interest expense
• Indicates how much of a decline in profits a company can absorb. Example: A ratio of 3 to
1 means that there is $3 in earnings available to cover $1 in interest. Cash coverage ratio: A problem with the times interested earned ratio is that is based on EBIT, which it is not really a measure of cash available to pay interest. A more accurate way is to use earnings before interest, taxes, and depreciation (EBITD). Note: depreciation, a noncash expense, should not be taken out. The cash coverage ratio (or EBITD coverage ratio) is:
erestint
EBITD
Free cash flow: This is a valuable tool for evaluating the cash position of a business. Free cash flow (FCF) is a measure of operating cash flows available for corporate purposes after providing sufficient fixed asset additions to maintain current productive capacity and dividends.
It is calculated as follows: Cash flow from operations Less: Cash used to purchase fixed assets Less: Cash dividends
Free cash flow
22
13
PROFITABILITY RATIOS
OVERVIEW Profitability ratios reveal the company’s ability to earn a satisfactory profit and return on investment. The ratios are an indication of good financial health and how effectively the company is managing its assets. Gross profit margin: reveals the percentage of each dollar left over after the cost of sales:
Gross profit Net sales
• Gross profit = Net sales - cost of sales
Profit margin: the ratio of net income to sales; a reflection of corporate earning power.
• The profit margin provides clues to a company’s pricing, cost structure, and manufacturing efficiency.
Return on investment (ROI): Two ratios that evaluate ROI are:
• Return on total assets (ROA): indicates the efficiency with which management has used its resources to obtain income:
Net income
Average total assets
• Return on Common Equity (ROE): measures the rate of return earned on the common stockholders’ investment:
Net income - preferred dividends
Average common stockholders’ equity Implications:
• Investors steer clear of companies with poor earnings potential because the poor earnings negatively impact market price of stock and dividends.
• Creditors avoid unprofitable companies because of a greater risk of default. • Stockholders look at profitability as a key measure of operating performance.
23
14
DU PONT SYSTEM
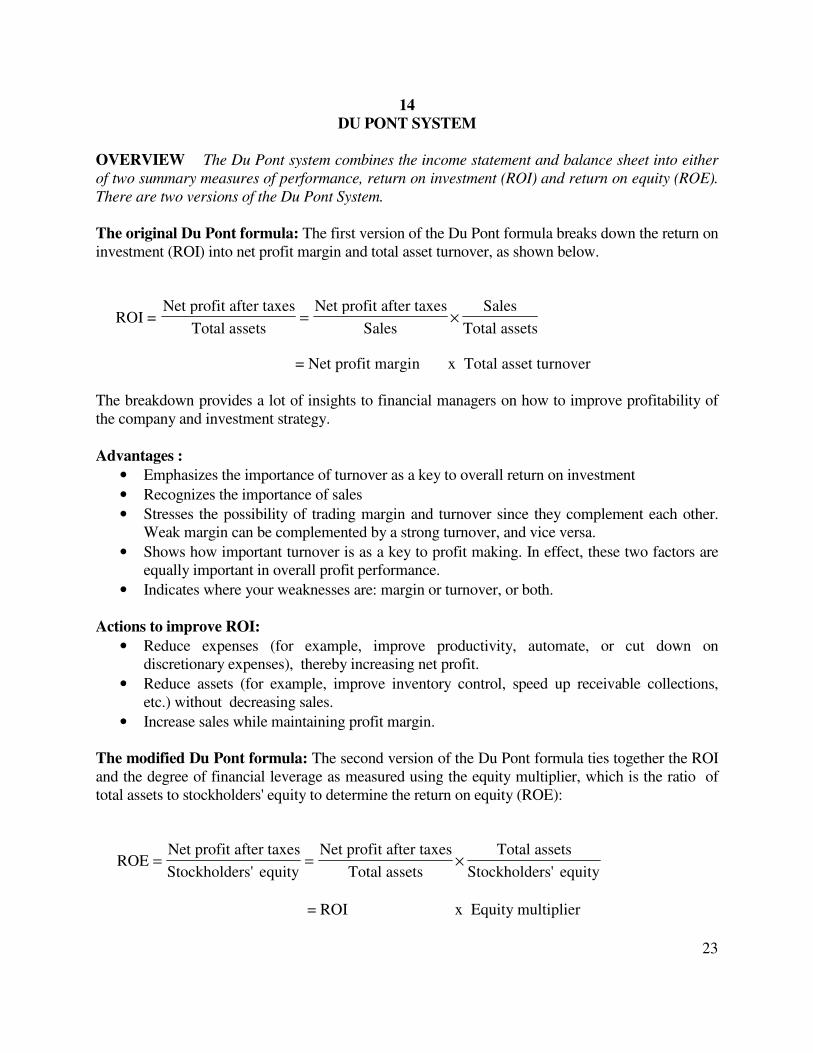
OVERVIEW The Du Pont system combines the income statement and balance sheet into either of two summary measures of performance, return on investment (ROI) and return on equity (ROE). There are two versions of the Du Pont System. The original Du Pont formula: The first version of the Du Pont formula breaks down the return on investment (ROI) into net profit margin and total asset turnover, as shown below.
ROI = Net profit after taxes
Total assets
Net profit after taxes
Sales
Sales
Total assets= ×
= Net profit margin x Total asset turnover
The breakdown provides a lot of insights to financial managers on how to improve profitability of the company and investment strategy.
Advantages :
• Emphasizes the importance of turnover as a key to overall return on investment
• Recognizes the importance of sales
• Stresses the possibility of trading margin and turnover since they complement each other. Weak margin can be complemented by a strong turnover, and vice versa.
• Shows how important turnover is as a key to profit making. In effect, these two factors are equally important in overall profit performance.
• Indicates where your weaknesses are: margin or turnover, or both.
Actions to improve ROI:
• Reduce expenses (for example, improve productivity, automate, or cut down on discretionary expenses), thereby increasing net profit.
• Reduce assets (for example, improve inventory control, speed up receivable collections, etc.) without decreasing sales.
• Increase sales while maintaining profit margin.
The modified Du Pont formula: The second version of the Du Pont formula ties together the ROI and the degree of financial leverage as measured using the equity multiplier, which is the ratio of total assets to stockholders' equity to determine the return on equity (ROE):
ROENet profit after taxes
Stockholders' equity
Net profit after taxes
Total assets
Total assets
Stockholders' equity= = ×
= ROI x Equity multiplier
24
The use of the equity multiplier to convert the ROI to the ROE reflects the impact of the leverage (use of debt) on stockholders' return.
Advantages
• Enables the company to break its ROE into a profit margin portion (net profit margin), an efficiency-of-asset-utilization portion (total asset turnover), and a use-of-leverage portion (equity multiplier).
• Help determine what combination of asset return and leverage will work best in its competitive environment. Most companies try to keep at least a level equal to what is considered "normal" within the industry.
25
15
MARKET VALUE RATIOS
OVERVIEW Market value ratios apply to a company’s stock price relative to its earnings (or book value) per share, as well as to the dividend-related ratios. Earnings per share: amount of earnings for each common share held:
Net income - preferred dividends Common shares outstanding
• An increase in EPS usually results in a rise in the market price of the stock and an increase
in dividends. Price-earnings ratio (multiple): market price per share divided by earnings per share.
• A high P/E ratio indicates investor confidence in the firm. • A drop in the P/E ratio may result from several causes, including deteriorating financial
health, increased risk, and industry problems. • Some investors believe that if a company’s P/E ratio is relatively low, the stock may be
undervalued and represents a buying opportunity. Others believe that if the P/E ratio is relatively high, the stock may be overvalued and should be sold.
Book value per share: value of each share per the books based on historical cost:
Total stockholders’ equity - liquidation value of preferred stock Outstanding common shares
• If market price per share substantially exceeds book value per share, it may indicate good
reception in the stock market. Dividend ratios:
• Dividend yield: dividends per share divided by market price per share; shows return on a share of stock based on the current dividend rate and current price.
• Dividend payout: dividends per share divided by earnings per share; measures the portion of earnings paid out in dividends.
• A decline in the dividend ratios generally causes concern.
Market value added (MVA): the difference between the market value of the firm’s stock and the amount of equity capital supplied by shareholders
26
16
LIMITATIONS OF RATIO ANALYSIS
OVERVIEW The user of ratio analysis must take into account certain limitations when appraising a company’s financial statements. Otherwise, the user may be misled by the ratios’ implications. Limitations:
• Since financial statements are based on historical cost, they do not take into account inflation.
• Since ratios are static as of year-end, they do not consider future flows. • A ratio does not reveal the quality of its components. Example: The current ratio may be
high, but inventory may consist of obsolete goods. • Diversity in accounting policies among companies can distort the ratios and make
comparisons difficult. Example: Companies use different depreciation methods. • The issuance of financial statements occurs several months after the end of the accounting
year; figures may not reflect what is currently occurring in the business. • A company may juggle figures to make the financial ratios look better. Example: A
company may improve its current ratio shortly before year-end by paying a short-term debt. • Financial statements do not take into account qualitative factors such as the quality of
management, marketing aspects, economic conditions, and the political environment. • Many large companies are engaged in multiple lines of business, making it difficult to
identify the industry group to which the firm belongs. Comparing the ratios of such a company with those of other companies in one field may be meaningless.
27
Module 3 BUDGETING AND FINANCIAL FORECASTING
LEARNING OBJECTIVES:
After studying this chapter, you will be able to:
1. Define the basic concepts of budgeting. 2. Explain the concepts of financial forecasting. 3. Outline the computational steps involved in the percent-of-sales method. 4. Demonstrate the format associated with cash budgeting.
A budget reveals management’s expectations with regard to revenue and costs for a future period. It predicts the company’s future cash position, taking into account anticipated cash inflows and cash outflows. Budgets are used for planning and control purposes. Companies prepare many types of budgets, including sales, production, costs, pro forma balance sheet, and pro forma income statement. Financial forecasts, the basis for budget preparation, start with sales and then predict costs, often as a percentage of those sales.
17 Budgeting 18 Financial forecasting and the percent-of-sales method 19 Cash budgeting

28
17
BUDGETING
OVERVIEW A comprehensive (master) budget is a formal statement of management’s expectations regarding sales, expenses, volume, and other financial transactions. The cash budget helps management keep cash balances in reasonable relationships to its needs. Planning and control: At the beginning of the period, the budget is a plan or standard; at the end of the period, it serves as a control device to measure performance against the plan. Types of budgets: The budget is either an operating budget, the result of operating decisions, or a financial budget, the result of financial decisions of the firm. • The operating budget consists of: 1. sales budget, 2. production budget, 3. direct materials budget, 4. direct labor budget, 5. factory overhead budget, 6. selling and administrative expense budget, and 7. pro forma income statement. • The financial budget consists of 1. cash budget, and 2. pro forma balance sheet. Steps in the budgeting process:
1. Prepare a sales forecast. 2. Determine expected production volume. 3. Estimate manufacturing costs and operating expenses. 4. Determine cash flow and other financial effects. 5. Formulate projected financial statements.
The sales budget: starting point in preparing the master budget, since estimated sales volume influences nearly all other items in the master budget. The sales budget indicates the quantity of each product expected to be sold. • The sales budget is constructed by multiplying expected sales in units by expected unit sales price. The production budget: includes the number of units expected to be manufactured to meet budgeted sales and inventory requirements. • The expected volume of production = the units expected to be sold + the desired inventory at the end of the period - the inventory at the beginning of the period. The direct material budget: shows how much material will be required and how much must be purchased to meet production requirement. The factory overhead budget: schedule of all manufacturing costs other than direct materials
and direct labor. The selling and administrative expense budget: list of operating expenses in selling the products and in managing the business. The budgeted income statement: summarizes the various component projections of revenue
and expenses.
The cash budget (See Key 19 on "Cash Budgeting") The budgeted balance sheet: shows expected assets, liabilities, and stockholders’ equity.

29
Computer-based models for budgeting: help build a budget for profit planning and answer a variety of “what-if’ scenarios, providing a basis for choice among alternatives under conditions of uncertainty.
30
18
FINANCIAL FORECASTING AND THE PERCENT-OF-SALES METHOD
OVERVIEW Financial forecasting, an essential element of planning, is the basis for budgeting. Forecasts of future sales and their related expenses provide the firm with the information needed to project future financing needs. Financial forecasting: The basic steps in projecting financing needs are:
1. Project the firm’s sales. The sales forecast is the initial step; most other forecasts (budgets) follow the sales forecast.
2. Project additional variables, such as expenses. 3. Estimate the level of investment in current and fixed assets required to support the
projected sales. 4. Calculate the firm’s financing needs.
The percent-of-sales method: estimates expenses, assets, and liabilities for a future period as a percent of the sales forecast and then, using these percentages together with projected sales, constructs pro forma balance sheets. The computational steps are:
1. Express those balance-sheet items (asset and liability accounts) that vary directly with sales as a percentage of sales. Any item such as long-term debt that does not vary directly with sales is designated “n.a. “or “not applicable.”
2. Multiply these percentages by projected sales. 3. Insert figures for long-term debt, common stock, and paid-in-capital from the current
balance sheet. 4. Compute the new retained earnings after calculating projected net income less planned
dividends. 5. Project the firm’s financing needs as the projected level of total assets less projected
liabilities and equity. Advantages: Simple and inexpensive to use.
Assumption: (1) The firm is operating at full capacity. (2)Current levels of all assets are optimal for the current sales level.
31
19
CASH BUDGETING OVERVIEW The cash budget is used for cash planning and control presenting expected cash inflow and outflow for a designated time period. The cash budget helps management keep cash balances in reasonable relationship to its needs. Objective: aids in avoiding idle cash and possible cash shortages.
• To meet its main objective, sound projections of cash collections from customers and cash expenditures are necessary.
Steps: The most direct way of preparing a cash budget requires incorporation of sales projections and credit terms, collection percentages, estimated purchases and payment terms, and other cash receipts and disbursements. In other words, preparation of the cash budget requires consideration of both inflows and outflows.
Structure: consists typically of four major sections:
• The receipts section, which is the beginning cash balance, cash collections from customers, and other receipts.
• The disbursements section, which comprises all cash payments made by purpose.
• The cash surplus or deficit section, which simply shows the difference between the cash receipts section and the cash disbursements section.
• The financing section, which provides a detailed account of the borrowings and repayments expected during the budgeting period.
32
Module 4 THE MANAGEMENT OF ASSETS
LEARNING OBJECTIVES:
After studying this module, you will be able to:
1. Explain the concept of working capital management. 2. Describe the benefits of cash management. 3. Demonstrate the uses of various cash management models. 4. Define and give examples of marketable securities. 5. Manage accounts receivable. 6. Implement an inventory management system.
The management of working capital involves regulating current assets and current liabilities to achieve a proper balance in terms of risk and return. Cash management attempts to accelerate cash inflow to obtain a return while delaying cash payments. Various cash models may be used to derive the optimal cash position based on corporate needs. Excess cash may be invested temporarily in a host of different marketable securities. Managing accounts receivable includes deciding the amount and terms of credit to be given to customers. If collections are accelerated, the company’s cash flow and profitability benefit. Inventory management involves determining the optimum amount to order each time in order to minimize total inventory costs while avoiding stockouts that lead to lost sales.
20. Working capital management 21. Cash management 22. Cash management models 23. Marketable securities 24. Management of accounts receivable 25. Inventory management
33
20
WORKING CAPITAL MANAGEMENT
OVERVIEW Working capital is equal to current assets. Net working capital equals current assets less current liabilities. The management of working capital involves regulating the various current assets and current liabilities. Characteristics: Management of net working capital requires deciding how to finance current
assets—through short-term debt, long-term debt, or equity capital. • Net working capital is increased when current assets are financed through noncurrent
sources. • The liquidity of current assets affects the terms and availability of short-term credit.
Risk-return trade-off: holding more current assets than fixed assets means:
• A reduced liquidity risk • Greater flexibility, since current assets may be modified easily as sales volume changes.
However, the rate of return is typically less with current assets than with fixed assets. • Long-term financing has less liquidity risk than short-term debt, but it also carries a higher
cost. Financing:
• Short-term debt rather than long-term financing is best for buying seasonal inventory. Short-term debt gives the firm flexibility to meet seasonal needs within its ability to repay the loan.
• Long-term debt is used to finance permanent assets. • The hedging approach to financing (financing assets with liabilities of similar maturity) is
wise.
34
21
CASH MANAGEMENT
OVERVIEW Cash refers to currency and demand deposits. Cash management involves having the optimum amount of cash on hand at the right time. The company should know how much cash it needs, how much it has, where the cash is, what its sources are, and how much can be spent. Factors in determining the cash level: 1. liquidity position, 2. schedule of debt maturity, 3.
ability to borrow and how much time is required, 4. expected cash flow, 5. risk preferences, and 6. line of credit. • A smaller cash balance may be maintained when cash receipts and cash payments are highly
synchronized and predictable. Cash management system: feasible if the return earned on the freed cash exceeds the cost of the
system, such as bank charges and office staff salaries. • Analyze each bank account as to type, balance and cost.
Acceleration of cash inflow:
• Accelerate billing and deposit checks quickly. • Charge interest on delinquent accounts receivable balances. • Send customers preaddressed, stamped envelopes. • Require deposits on large or custom orders or progress payments. • Offer discounts for early payment. • Have postdated checks from customers. • Have cash-on-delivery terms. • Avoid tying up cash unnecessarily in other accounts, such as advances to employees.
Lockbox and concentration banking: Have the collection center located near the customer,
such as lockboxes at strategic post offices. The local bank collects from these lockboxes periodically during the day. • Since the lockbox system usually has a significant per-item cost, it is most cost-effective
with low-volume, high-dollar remissions. • Before implementing a lockbox system, do a cost-benefit analysis including: 1. average
dollar amount of checks received, 2. potential savings, 3. processing cost, and 4. reduction in mailing time per check.
• Use concentration banking in which funds are collected by several local banks and transferred to a main concentration account in another bank. The transfer of funds may be accomplished through depository transfer checks (DTCs) or wire transfers.
Delay of cash outflow:
• Centralize the payable operation so that debt may be paid at the most profitable time. • Make partial payments. • Use payment drafts on which payment is not made on demand. • Draw checks on banks in distant locations. • Mail payments from post offices with limited service or in which mail has to go through
several handling points. • Use probability analysis to determine the expected dates for checks to clear. • Use a computer to transfer funds between various bank accounts at opportune times. • Use a charge account to lengthen the time between buying goods or services and paying for
them. • Do not pay bills before due dates.

35
• Delay the frequency of company payrolls. • Disburse commissions on sales when the receivables are collected rather than when the sales
are made.
36
22
CASH MANAGEMENT MODELS
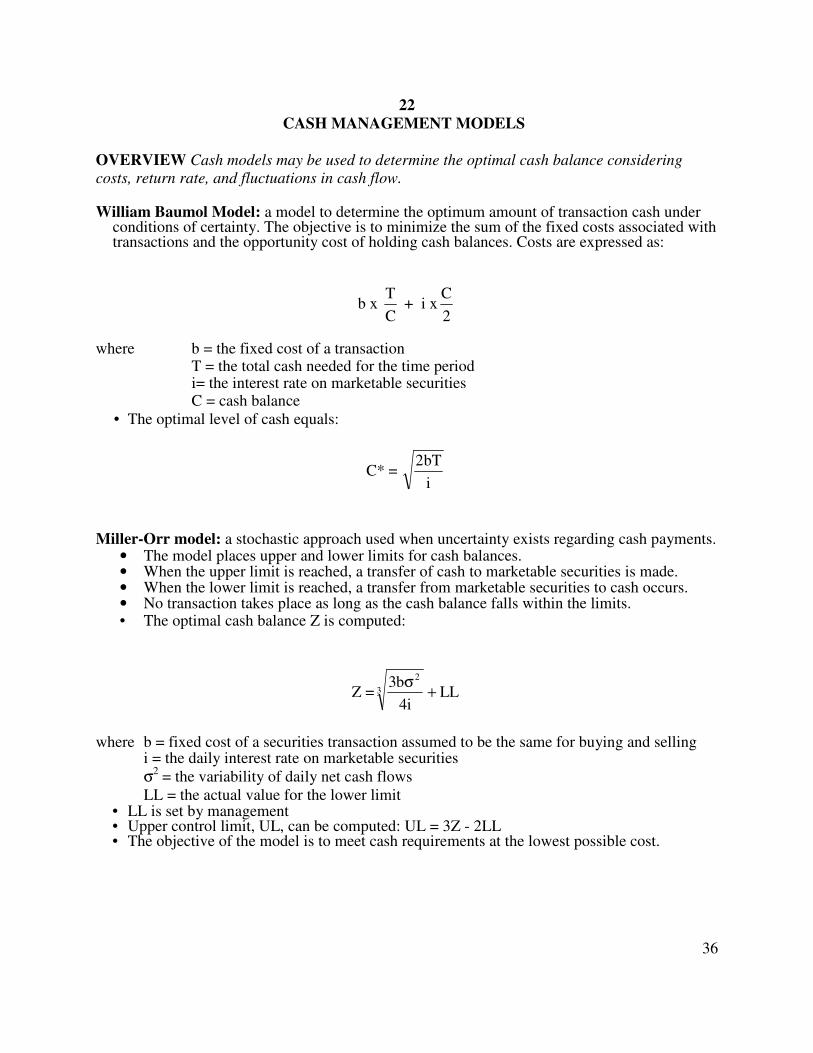
OVERVIEW Cash models may be used to determine the optimal cash balance considering costs, return rate, and fluctuations in cash flow. William Baumol Model: a model to determine the optimum amount of transaction cash under
conditions of certainty. The objective is to minimize the sum of the fixed costs associated with transactions and the opportunity cost of holding cash balances. Costs are expressed as:
b x C
T + i x
2
C
where b = the fixed cost of a transaction
T = the total cash needed for the time period i= the interest rate on marketable securities
C = cash balance • The optimal level of cash equals:
C* = i
bT2
Miller-Orr model: a stochastic approach used when uncertainty exists regarding cash payments. • The model places upper and lower limits for cash balances. • When the upper limit is reached, a transfer of cash to marketable securities is made. • When the lower limit is reached, a transfer from marketable securities to cash occurs. • No transaction takes place as long as the cash balance falls within the limits. • The optimal cash balance Z is computed:
Z = LLi4
b33
2
+σ
where b = fixed cost of a securities transaction assumed to be the same for buying and selling i = the daily interest rate on marketable securities σ
2 = the variability of daily net cash flows LL = the actual value for the lower limit
• LL is set by management • Upper control limit, UL, can be computed: UL = 3Z - 2LL • The objective of the model is to meet cash requirements at the lowest possible cost.
37
23
MARKETABLE SECURITIES
OVERVIEW Marketable securities are readily tradeable debt or equity securities with quoted prices. They are near-cash assets and are classified under current assets since the intent is to hold them for one year or less. Examples of liquid securities are treasury bills, commercial paper, certificates of deposit, and money market funds. Investing in marketable securities:
• Excess cash may be invested in marketable securities for a return. Example: Seasonal companies may buy marketable securities when they have excess funds and then sell the securities when cash deficits occur. • Holding marketable securities serves as protection against cash shortages. • Funds may be held temporarily in marketable securities in expectation of short-term
capital expansion. • In selecting marketable securities, consider return, safety, default risk, marketability, and
maturity date.
38
24
MANAGEMENT OF ACCOUNTS RECEIVABLE
OVERVIEW The management of accounts receivable improves the company’s cash flow and profitability. There is an opportunity cost of holding receivable balances. Determining the amount and terms of credit to extend to customers is a major management decision. Credit policy: Credit terms impact the costs of and revenue from receivables.
• If credit terms are tight, the investment in accounts receivable will be smaller and there will be fewer bad debts, but there will be lower sales and reduced profitability.
• If credit terms are liberal, there will be more sales and increased profitability, but there will be a larger investment in accounts receivable and more bad debts.
• Avoid typically high-risk receivables (e.g., customers in a financially troubled industry). • Revise credit limits as the customer’s financial position changes. • Offer more liberal payment terms in slow seasons to stimulate sales. • Ask for collateral in support of questionable accounts. • Determine average accounts receivable balance equal to:
Days outstanding x Annual credit sales
360 Billing policy: Set your billing cycle to produce uniformity.
• Mail customer statements one day after the end of the accounting period. • Bill large sales immediately. • Invoice customers for goods when the order is processed instead of when it is shipped.
Collection policy: Initiate collection efforts when the first signs of a customer’s financial
problems are evident. • Age accounts receivable to identify delinquent customers. Compare aging to industry
norms, competitors, and prior years. • Compare the credit terms to the length of time the receivables are uncollectible. • Use collection agencies when warranted. • Have credit insurance to guard against unusual bad-debt losses.
Special decision: Offer a discount for early payment by customers when the return on the funds
received exceeds the cost of the discount. In determining whether to offer credit to higher-than-normal risk customers, consider: • Profitability on additional sales generated versus additional bad debts, higher investigation
and collection costs, and the opportunity cost of tying up funds in receivables. • When there is idle capacity, the additional profit is the incremental contribution margin
(sales less variable cost), because fixed costs are constant. The incremental investment in receivables equals:
Average accounts x Unit cost receivable Unit selling price
39
25
INVENTORY MANAGEMENT AND JUST-IN-TIME (JIT)
OVERVIEW Inventory management is a trade-off between the costs of keeping inventory versus the benefits of holding it. High inventory levels result in increased carrying costs but lower the possibility of sales lost because of stock-outs and production slowdowns resulting from inadequate stocking. Types of inventory: raw materials (materials acquired from a supplier to be used in the
manufacture of goods), work-in-process (partially completed goods), and finished goods (completed goods ready for sale).
Inventory management practices:
• Appraise adequacy of raw material levels. • If prices of raw materials are expected to sharply increase, buy more now. • Discard slow-moving items to reduce carrying costs and improve cash flow. • Watch out for inventory buildup. • Minimize inventory levels when cash flow and liquidity problems exist. • Examine the quality of merchandise received. • Monitor backorders, since a high backorder level indicates a reduced need for inventory. • Evaluate internal inventory control. • Minimize lead time in the acquisition, manufacturing, and distribution functions. • Examine the degree of spoilage or obsolescence. • Appraise high inventory risk items, such as technological, perishable, fashionable,
flammable, and specialized goods. Inventory costs.
• Carrying cost: cost of holding inventory (storage, handling, insurance, spoilage, property taxes, and opportunity cost).
Carrying cost = 2
Qx C
where
2
Q = average quantity
C = cost of carrying one unit in stock • ordering cost: cost to place the order and receive the merchandise.
Ordering cost = Q
O x S
where S = usage
Q = quantity per order O = cost of placing one order
• Total Inventory Cost = Carrying Cost + Ordering Cost
40
O x Q
S C x
2
Q+
• A trade-off exists between ordering and carrying costs. A greater order quantity increases
carrying costs but lowers ordering costs. Economic order quantity (EOQ): optimum amount of goods to order each time to minimize
total inventory costs.
EOQ= C
SO2
Safety stock: extra units of inventory carried as protection against possible stockouts, based on
expected usage and anticipated delivery time. Stockout Cost = Number of orders x stockout units x unit stockout cost x probability of a stockout Reorder point: the level of inventory that signals the time to reorder merchandise at the EOQ amount.
Reorder Point = Lead time in weeks x weekly usage + safety stock ABC inventory control method: a system of classifying inventory into groups A, B, or C. Group A items are the most expensive and require the greatest control, while Group C items are the least expensive and require the least control.
Material Requirements Planning (MRP): a system that works backwards from the scheduled quantities and need dates for end items specified in a master production schedule (MPS) to determine the requirements for components needed to meet the MPS.
Just-in-time (JIT): a demand-pull, rather than the traditional "push" approach. No production takes place until a signal from a succeeding process indicates a need to produce. Parts and materials arrive just in time to be used in production.
41
Module 5
RISK, RETURN, AND VALUATION
LEARNING OBJECTIVES:
After studying this module, you will be able to:
1. Explain and list various types of risk. 2. Interpret the concept of portfolio theory. 3. Give examples of market index models. 4. Illustrate and discuss the Capital Asset Pricing Model (CAPM). 5. Explain beta’s role in assessing a security’ risk 6. Discuss and define return. 7. Explain the concept of the risk-return trade-off. 8. Describe how to value a bond. 9. Calculate bond yield and the effective rate of return on a bond. 10. Explain the concept of term structure of interest rates. 11. Describe common stock valuation.
Companies face many risks, including business risk, liquidity risk, default risk, market risk, interest rate risk, and purchasing power risk. Portfolio risk may be reduced through diversification. Models have been developed dealing with the risk and return of portfolios. Beta, the percentage change in the price of a company’s stock relative to the change in a stock market index, is a measure of the risk of a company’s stock. Return is in the form of current income and appreciation in the price of a security. However, a risk-return trade-off exists in that achieving a greater return requires taking increased risk. Several approaches to bond and stock valuation need to be considered.
26. Risk 27. Portfolio theory 28. Market index models 29. Capital asset pricing model (CAPM) 30. Beta 31. Return 32. The risk-return trade-off 33. Bond valuation 34. Bond yield—effective rate of return on a bond 35. Term structure of interest rates 36. Common stock valuation
42
26
RISK
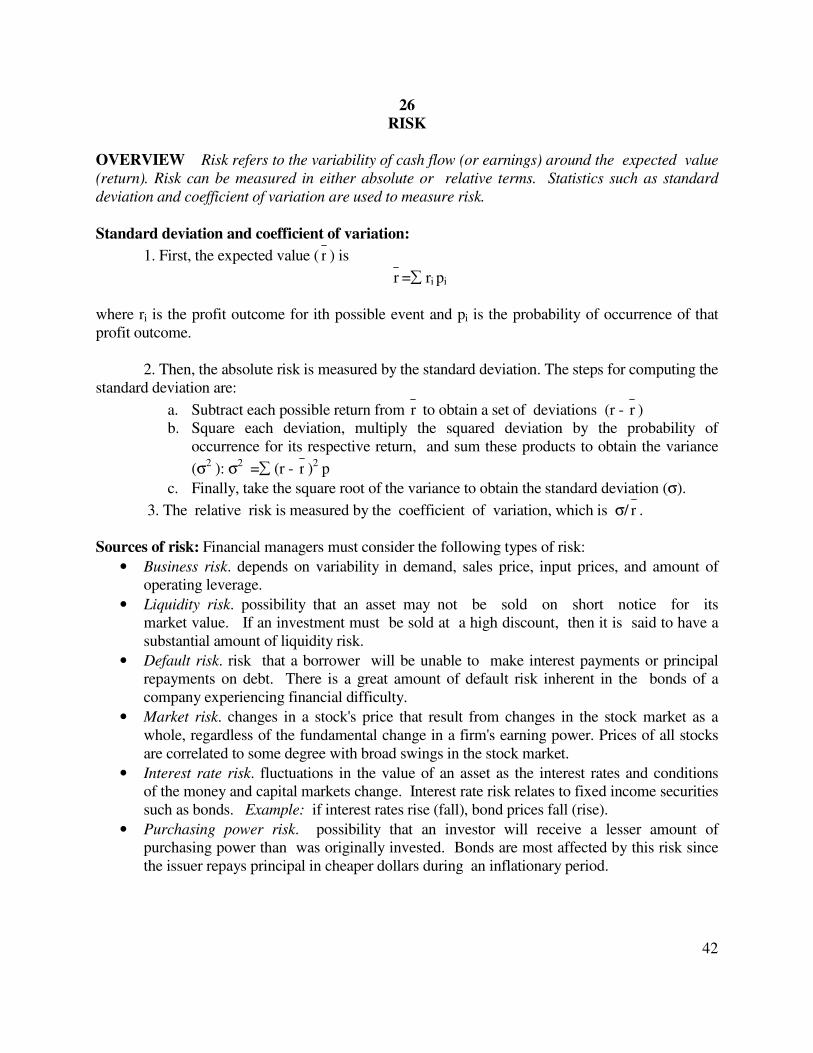
OVERVIEW Risk refers to the variability of cash flow (or earnings) around the expected value (return). Risk can be measured in either absolute or relative terms. Statistics such as standard deviation and coefficient of variation are used to measure risk. Standard deviation and coefficient of variation:
1. First, the expected value ( r ) is
r =∑ ri pi where ri is the profit outcome for ith possible event and pi is the probability of occurrence of that profit outcome. 2. Then, the absolute risk is measured by the standard deviation. The steps for computing the standard deviation are:
a. Subtract each possible return from r to obtain a set of deviations (r - r ) b. Square each deviation, multiply the squared deviation by the probability of
occurrence for its respective return, and sum these products to obtain the variance
(σ2 ): σ2 =∑ (r - r )2 p
c. Finally, take the square root of the variance to obtain the standard deviation (σ).
3. The relative risk is measured by the coefficient of variation, which is σ/ r .
Sources of risk: Financial managers must consider the following types of risk:
• Business risk. depends on variability in demand, sales price, input prices, and amount of operating leverage.
• Liquidity risk. possibility that an asset may not be sold on short notice for its market value. If an investment must be sold at a high discount, then it is said to have a substantial amount of liquidity risk.
• Default risk. risk that a borrower will be unable to make interest payments or principal repayments on debt. There is a great amount of default risk inherent in the bonds of a company experiencing financial difficulty.
• Market risk. changes in a stock's price that result from changes in the stock market as a whole, regardless of the fundamental change in a firm's earning power. Prices of all stocks are correlated to some degree with broad swings in the stock market.
• Interest rate risk. fluctuations in the value of an asset as the interest rates and conditions of the money and capital markets change. Interest rate risk relates to fixed income securities such as bonds. Example: if interest rates rise (fall), bond prices fall (rise).
• Purchasing power risk. possibility that an investor will receive a lesser amount of purchasing power than was originally invested. Bonds are most affected by this risk since the issuer repays principal in cheaper dollars during an inflationary period.
43
27
PORTFOLIO THEORY
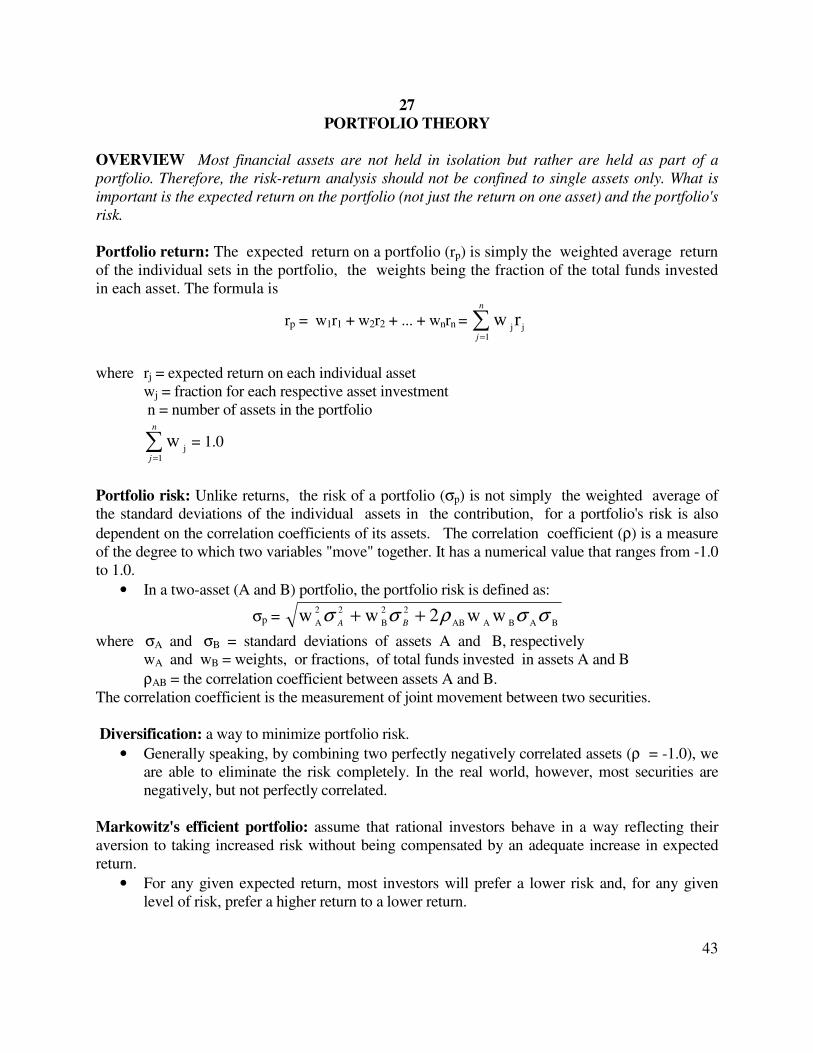
OVERVIEW Most financial assets are not held in isolation but rather are held as part of a portfolio. Therefore, the risk-return analysis should not be confined to single assets only. What is important is the expected return on the portfolio (not just the return on one asset) and the portfolio's risk.
Portfolio return: The expected return on a portfolio (rp) is simply the weighted average return of the individual sets in the portfolio, the weights being the fraction of the total funds invested in each asset. The formula is
rp = w1r1 + w2r2 + ... + wnrn = ∑=
n
j 1jj
rw
where rj = expected return on each individual asset wj = fraction for each respective asset investment n = number of assets in the portfolio
∑=
n
j 1j
w = 1.0
Portfolio risk: Unlike returns, the risk of a portfolio (σp) is not simply the weighted average of the standard deviations of the individual assets in the contribution, for a portfolio's risk is also
dependent on the correlation coefficients of its assets. The correlation coefficient (ρ) is a measure of the degree to which two variables "move" together. It has a numerical value that ranges from -1.0 to 1.0.
• In a two-asset (A and B) portfolio, the portfolio risk is defined as:
σp = BABAAB
22
B
22
Aww2 ww σσρσσ ++
BA
where σA and σB = standard deviations of assets A and B, respectively wA and wB = weights, or fractions, of total funds invested in assets A and B
ρAB = the correlation coefficient between assets A and B. The correlation coefficient is the measurement of joint movement between two securities. Diversification: a way to minimize portfolio risk.
• Generally speaking, by combining two perfectly negatively correlated assets (ρ = -1.0), we are able to eliminate the risk completely. In the real world, however, most securities are negatively, but not perfectly correlated.
Markowitz's efficient portfolio: assume that rational investors behave in a way reflecting their aversion to taking increased risk without being compensated by an adequate increase in expected return.
• For any given expected return, most investors will prefer a lower risk and, for any given level of risk, prefer a higher return to a lower return.

44
• Investors try to find the optimum portfolio by using the indifference curve, which shows the investor's trade-off between risk and return.
45
28
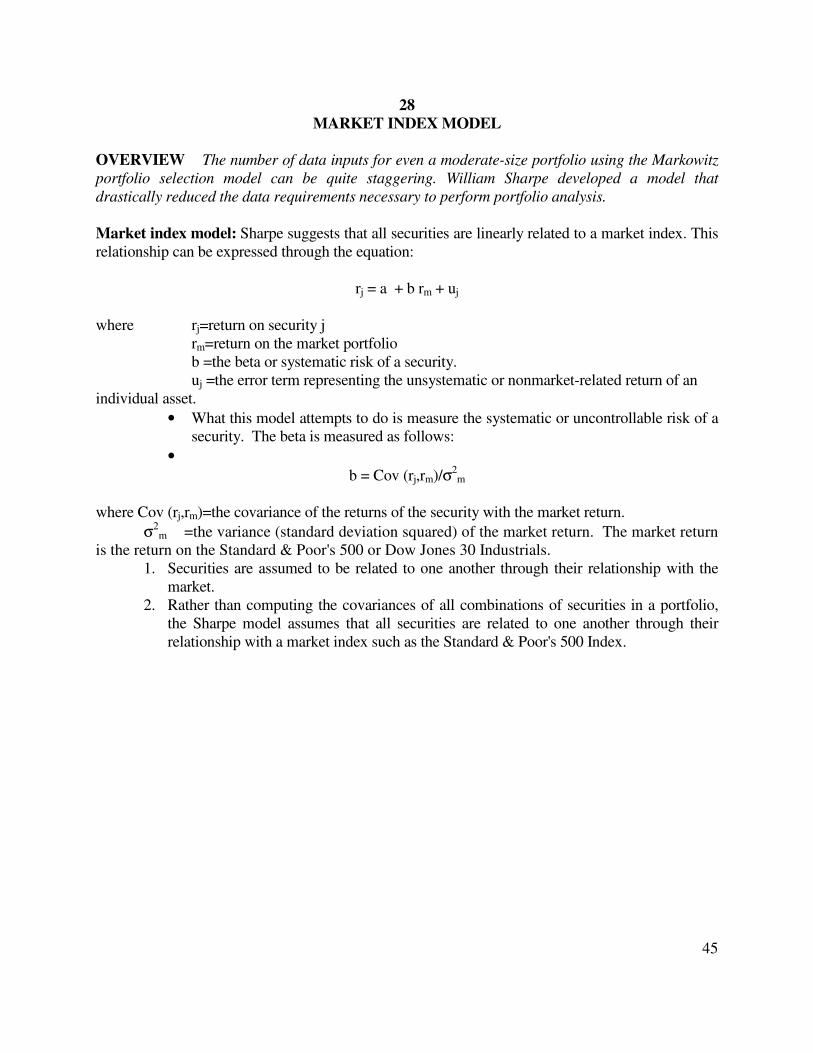
MARKET INDEX MODEL
OVERVIEW The number of data inputs for even a moderate-size portfolio using the Markowitz portfolio selection model can be quite staggering. William Sharpe developed a model that drastically reduced the data requirements necessary to perform portfolio analysis. Market index model: Sharpe suggests that all securities are linearly related to a market index. This relationship can be expressed through the equation:
rj = a + b rm + uj where rj=return on security j rm=return on the market portfolio b =the beta or systematic risk of a security. uj =the error term representing the unsystematic or nonmarket-related return of an individual asset.
• What this model attempts to do is measure the systematic or uncontrollable risk of a security. The beta is measured as follows:
•
b = Cov (rj,rm)/σ2m
where Cov (rj,rm)=the covariance of the returns of the security with the market return.
σ2m =the variance (standard deviation squared) of the market return. The market return
is the return on the Standard & Poor's 500 or Dow Jones 30 Industrials. 1. Securities are assumed to be related to one another through their relationship with the
market. 2. Rather than computing the covariances of all combinations of securities in a portfolio,
the Sharpe model assumes that all securities are related to one another through their relationship with a market index such as the Standard & Poor's 500 Index.
46
29
CAPITAL ASSET PRICING MODEL (CAPM) AND
THE ARBITRAGE PRICING MODEL (APM)
OVERVIEW The capital asset pricing model (CAPM) relates the risk measured by beta to the level of expected or required rate of return on a security. The model, also called the security market line (SML), is a general relationship to show the risk-return trade-off for an individual security.
The security market line: The model of SML is:
rj = rf + b (rm - rf)
where rj = the expected (or required ) return on security j rf = the risk-free security (such as a T-bill)
rm = the expected return on the market portfolio (such as Standard & Poor's 500 Stock Composite Index or Dow Jones 30 Industrials)
b = Beta, an index of nondiversifiable (noncontrollable, systematic) risk
• The term b(rm - rf) represents the risk premium, the additional return required to compensate investors for assuming a given level of risk.
• The CAPM or (SML) equation shows that the required (expected) rate of return on a given security (rj) is equal to the return required for securities that have no risk (rf) plus a risk premium required by investors for assuming a given level of risk.
• The higher the degree of systematic risk (b), the higher the return on a given security demanded by investors.
What does the capital asset pricing model (CAPM) mean? The model shows that investors in individual securities are only assumed to be rewarded for systematic, uncontrollable, market-related risk, known as the beta (b) risk. All other risk is assumed to be diversified away and thus is not rewarded.
The arbitrage pricing model (APM): The CAPM assumes that required rates of return depend only on one risk factor, the stock's beta. The Arbitrage Pricing Model (APM) disputes this and includes any number of risk factors:
r = rf + b1 RP1 + b2 RP2 +...+ bn RPn
where r = the expected return for a given stock or portfolio rf = the risk-free rate
bi = the sensitivity (or reaction) of the returns of the stock to unexpected changes in
economic forces i (i = 1,...n) RPi =the market risk premium associated with an unexpected change in the ith economic
force n = the number of relevant economic forces Roll and Ross suggest the following five economic forces:

47
1. Changes in expected inflation 2. Unanticipated changes in inflation 3. Unanticipated changes in industrial production 4. Unanticipated changes in the yield differential between low- and high-grade bonds
(the default-risk premium) 5. Unanticipated changes in the yield differential between long-term and short-term
bonds
48
30
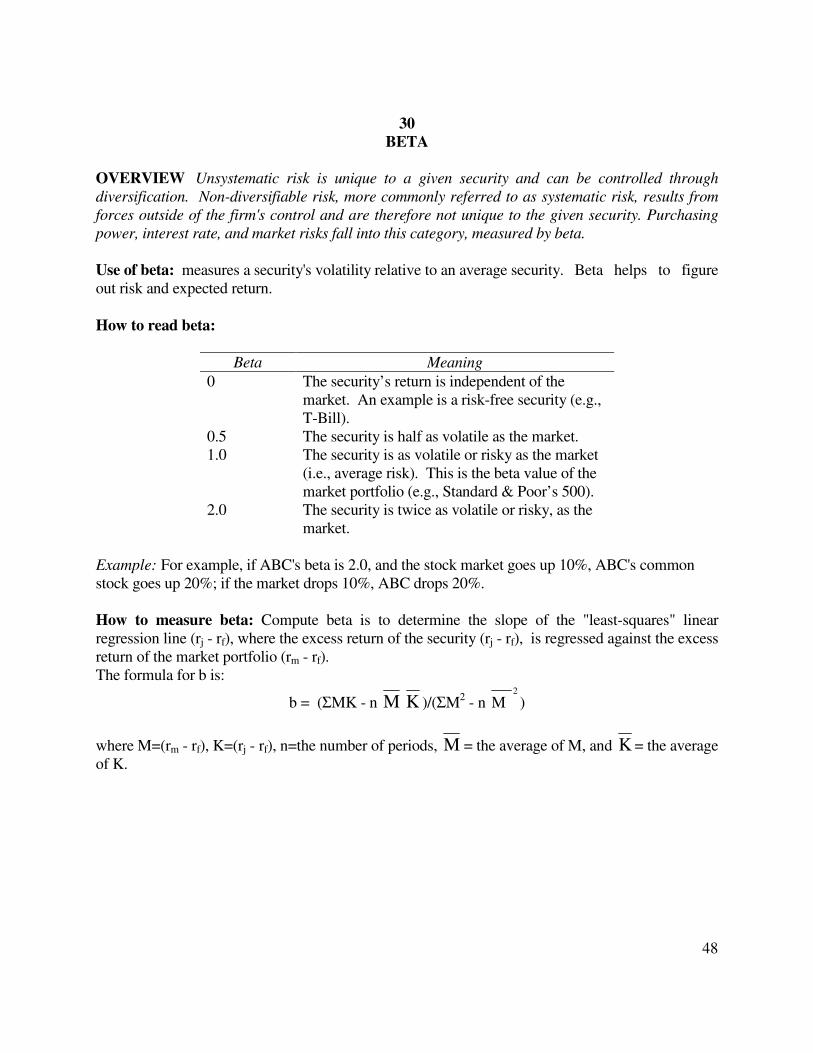
BETA
OVERVIEW Unsystematic risk is unique to a given security and can be controlled through diversification. Non-diversifiable risk, more commonly referred to as systematic risk, results from forces outside of the firm's control and are therefore not unique to the given security. Purchasing power, interest rate, and market risks fall into this category, measured by beta. Use of beta: measures a security's volatility relative to an average security. Beta helps to figure out risk and expected return. How to read beta:
Beta Meaning
0 The security’s return is independent of the market. An example is a risk-free security (e.g., T-Bill).
0.5 The security is half as volatile as the market. 1.0 The security is as volatile or risky as the market
(i.e., average risk). This is the beta value of the market portfolio (e.g., Standard & Poor’s 500).
2.0 The security is twice as volatile or risky, as the market.
Example: For example, if ABC's beta is 2.0, and the stock market goes up 10%, ABC's common stock goes up 20%; if the market drops 10%, ABC drops 20%.
How to measure beta: Compute beta is to determine the slope of the "least-squares" linear regression line (rj - rf), where the excess return of the security (rj - rf), is regressed against the excess return of the market portfolio (rm - rf). The formula for b is:
b = (ΣMK - n M K )/(ΣM2 - n 2
M )
where M=(rm - rf), K=(rj - rf), n=the number of periods, M = the average of M, and K = the average of K.

49
31
RETURN
OVERVIEW Return is the reward for investing. The investor must compare the expected return for a given investment with the risk involved. The return on an investment consists of the following sources of income: periodic cash payments, called current income, and appreciation (or depreciation) in market value, called capital gains (or losses). Current income: includes interest, dividends, rent; is received on a periodic basis. Capital gains or losses: changes in market value.
• A capital gain is the amount by which the proceeds from the sale of an investment exceeds its original purchase price. If the investment is sold for less than its purchase price, then the difference is a capital loss.
Holding period of return: total return earned from holding an investment for a given period of time. Current income + Capital gain (or loss) HPR = Purchase price
• In the case of stock, we use the following symbols:
r = 0
01 1
P
)P (P D ++
where r=expected return for a single period D1=dividend at the end of the period P1=price per share at the end of the period P0=price per share at the beginning of the period
50
32
THE RISK-RETURN TRADE-OFF
OVERVIEW All financial decisions involve some sort of risk-return trade-off. The greater the risk associated with any financial decision, the greater the return expected from it. Connection with inventory: The less inventory a firm keeps, the higher the expected return (since less of the firm's current assets is tied up). But there is also a greater risk of running out of stock and thus losing potential revenue. Trade-off: The investor must compare the expected return from a given investment with the risk associated with it. Generally speaking, the higher the risk undertaken, the more ample the return. Conversely, the lower the risk, the more modest the return. Example: Investors demand higher return from a speculative stock to compensate for the higher level of risk. Policy: Proper assessment and balance of the various risk-return trade-offs is part of creating a sound financial and investment plan.
51
33
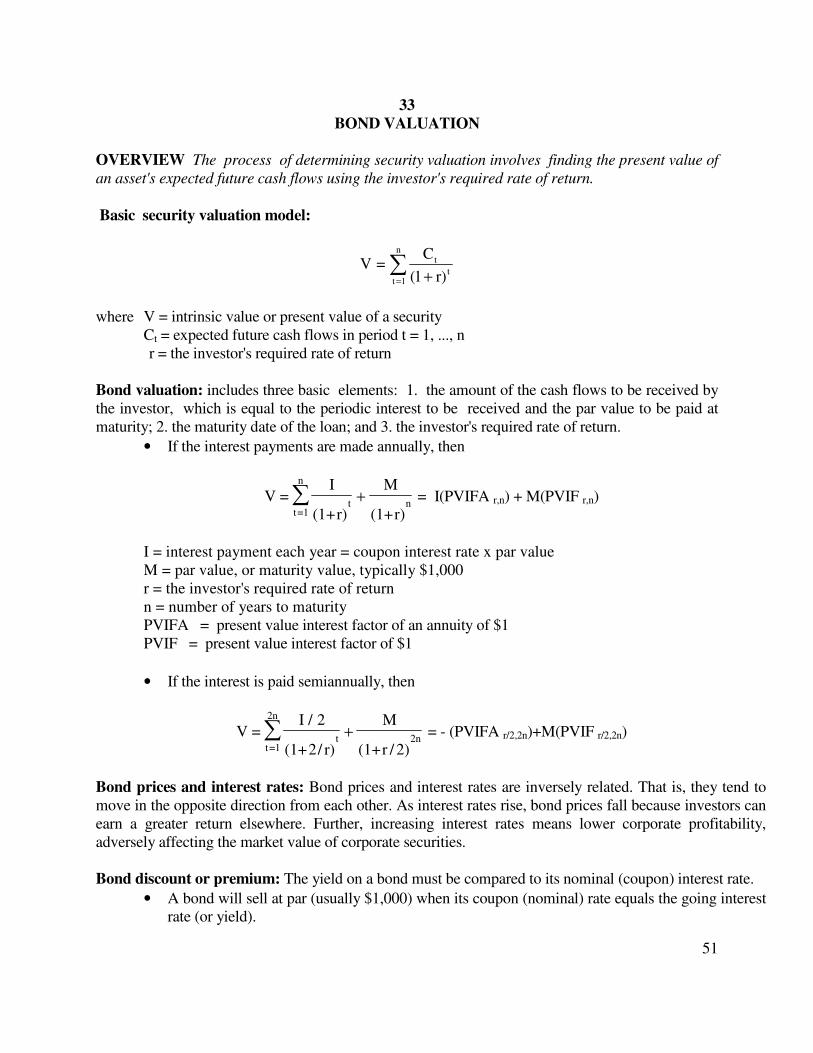
BOND VALUATION
OVERVIEW The process of determining security valuation involves finding the present value of an asset's expected future cash flows using the investor's required rate of return. Basic security valuation model:
∑= +
n
1tt
t
r) 1(
C=V
where V = intrinsic value or present value of a security Ct = expected future cash flows in period t = 1, ..., n r = the investor's required rate of return
Bond valuation: includes three basic elements: 1. the amount of the cash flows to be received by the investor, which is equal to the periodic interest to be received and the par value to be paid at maturity; 2. the maturity date of the loan; and 3. the investor's required rate of return.
• If the interest payments are made annually, then
V =I
(1+r)
M
(1+r)t
t=1
n
n∑ + = I(PVIFA r,n) + M(PVIF r,n)
I = interest payment each year = coupon interest rate x par value M = par value, or maturity value, typically $1,000 r = the investor's required rate of return n = number of years to maturity PVIFA = present value interest factor of an annuity of $1 PVIF = present value interest factor of $1
• If the interest is paid semiannually, then
V =I / 2
(1+2/ r)
M
(1+r / 2)t
t=1
2n
2n∑ + = - (PVIFA r/2,2n)+M(PVIF r/2,2n)
Bond prices and interest rates: Bond prices and interest rates are inversely related. That is, they tend to move in the opposite direction from each other. As interest rates rise, bond prices fall because investors can earn a greater return elsewhere. Further, increasing interest rates means lower corporate profitability, adversely affecting the market value of corporate securities. Bond discount or premium: The yield on a bond must be compared to its nominal (coupon) interest rate.
• A bond will sell at par (usually $1,000) when its coupon (nominal) rate equals the going interest rate (or yield).

52
• The bond will sell at a discount from its face value if the yield is above the coupon rate.
• The bond will sell at a premium above its face value when the yield is below the coupon rate.
53
34
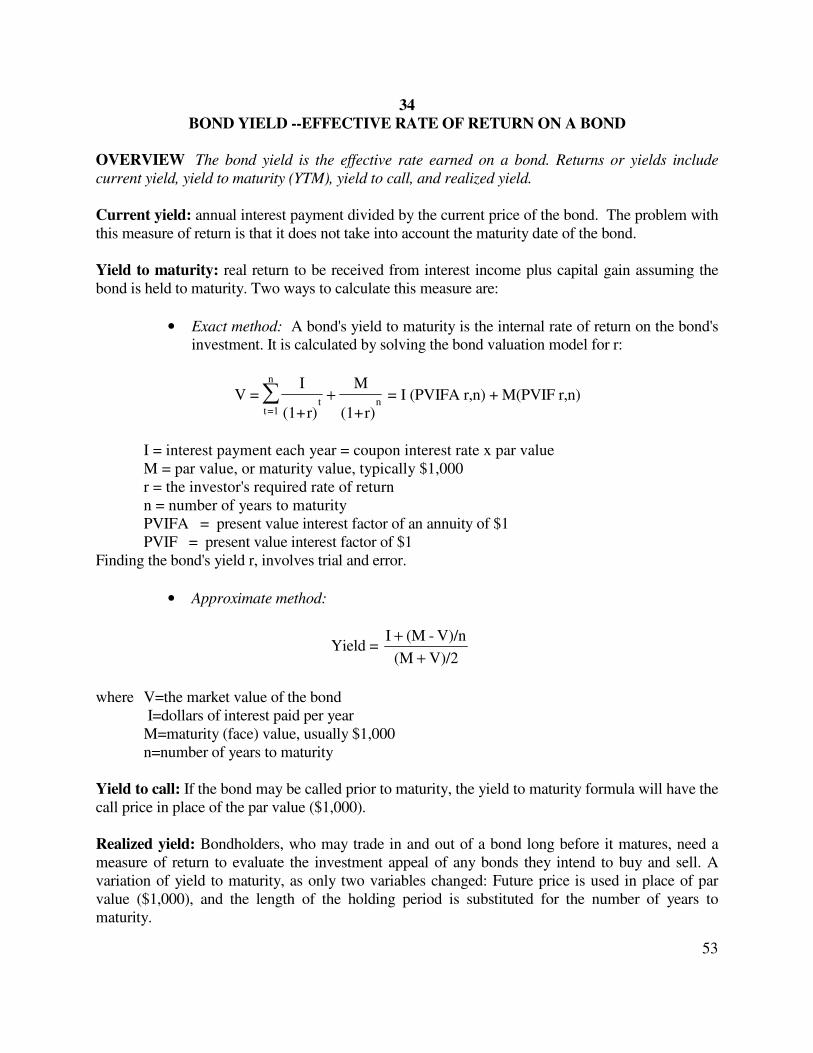
BOND YIELD --EFFECTIVE RATE OF RETURN ON A BOND OVERVIEW The bond yield is the effective rate earned on a bond. Returns or yields include current yield, yield to maturity (YTM), yield to call, and realized yield.
Current yield: annual interest payment divided by the current price of the bond. The problem with this measure of return is that it does not take into account the maturity date of the bond. Yield to maturity: real return to be received from interest income plus capital gain assuming the bond is held to maturity. Two ways to calculate this measure are:
• Exact method: A bond's yield to maturity is the internal rate of return on the bond's investment. It is calculated by solving the bond valuation model for r:
V =I
(1+r)
M
(1+r)t
t=1
n
n∑ + = I (PVIFA r,n) + M(PVIF r,n)
I = interest payment each year = coupon interest rate x par value
M = par value, or maturity value, typically $1,000 r = the investor's required rate of return n = number of years to maturity PVIFA = present value interest factor of an annuity of $1 PVIF = present value interest factor of $1 Finding the bond's yield r, involves trial and error.
• Approximate method:
Yield = V)/2 (M
V)/n - (M I
+
+
where V=the market value of the bond I=dollars of interest paid per year M=maturity (face) value, usually $1,000 n=number of years to maturity
Yield to call: If the bond may be called prior to maturity, the yield to maturity formula will have the call price in place of the par value ($1,000).
Realized yield: Bondholders, who may trade in and out of a bond long before it matures, need a measure of return to evaluate the investment appeal of any bonds they intend to buy and sell. A variation of yield to maturity, as only two variables changed: Future price is used in place of par value ($1,000), and the length of the holding period is substituted for the number of years to maturity.

54
Equivalent before-tax yield: yield on a tax-free municipal bond calculated on an equivalent before-tax yield basis (that is, what the equivalent yield would have to be on a taxable investment to have the same net yield after taxes).
Tax equivalent yield= Tax-exempt yield/ (1 - tax rate) Example: A 7% municipal bond with a tax rate of 28% has an equivalent tax yield of 9.7% computed as follows: .07/(1 - .28) = .07/.72 = 9.7%
55
35
TERM STRUCTURE OF INTEREST RATES
OVERVIEW The term structure of interest rates, also known as a yield curve, shows the relationship between length of time to maturity and yields of debt instruments. Other factors such as default risk and tax treatment are held constant. Importance: An understanding of the relationship between maturity and yield is important to financial managers who must decide whether to borrow by issuing long-or short-term debt.
• Fixed income analysts should investigate the yield curve carefully in order to make judgments about the direction of interest rates.
Yield curve: A graphical presentation of the term structure of interest rates. It may take any number of shapes, i.e., a flat (vertical) yield curve, a positive (ascending) yield curve, an inverted (descending) yield curve, and a humped (ascending and then descending) yield curve.
Expectation theory: The shape of the yield curve reflects investors' expectations of future short-term rates.
• Given the estimated set of future short-term interest rates, the long-term rate is then established as the geometric average of future interest rates.
• A positive (ascending) yield curve implies that investors expect short-term rates to rise, while a descending (inverted) yield curve implies that they expect short-term rates to fall.
Liquidity preference theory: contends that risk-averse investors prefer short-term bonds to long-term bonds, because long-term bonds have a greater chance of price variation, i.e., carry greater interest rate risk.
• Current long-term bonds should include a liquidity premium as additional compensation for assuming interest rate risk. This theory is nothing but a modification of the expectation theory.
Market segmentation (preferred habitat) theory: does not recognize expectations and emphasizes the rigidity in loan allocation patterns by lenders. Interest rates are determined by supply and demand.
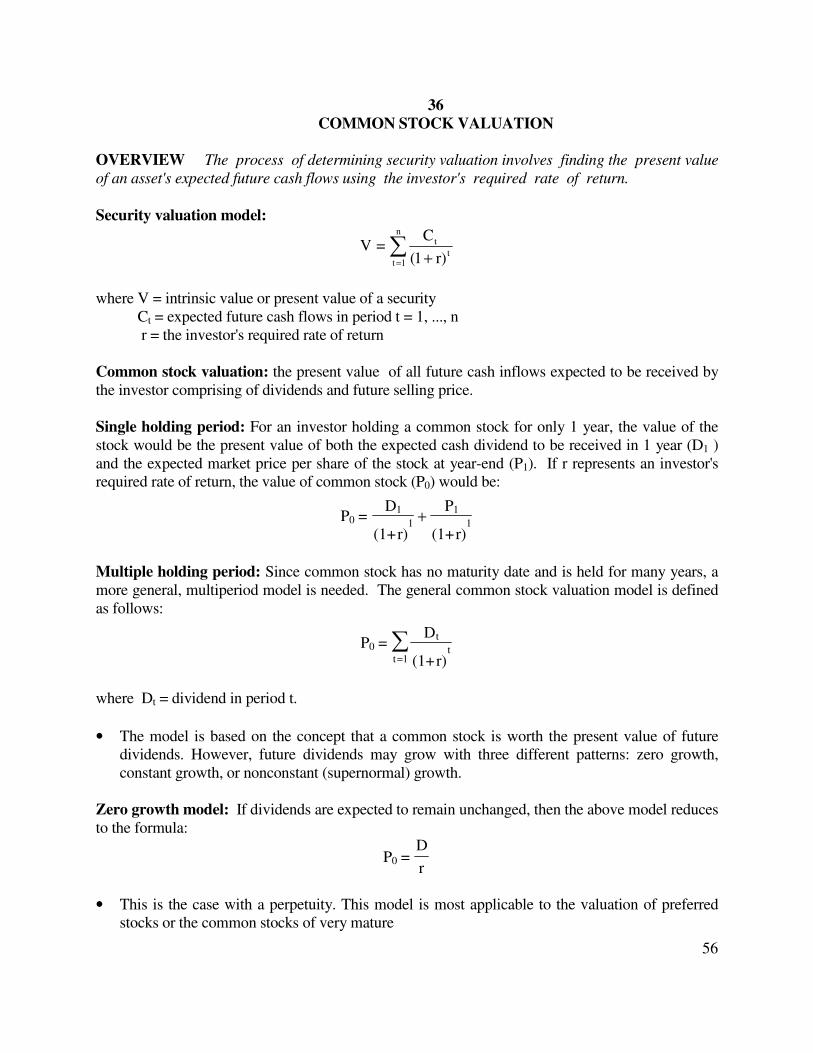
56
36
COMMON STOCK VALUATION
OVERVIEW The process of determining security valuation involves finding the present value of an asset's expected future cash flows using the investor's required rate of return. Security valuation model:
∑= +
n
1tt
t
r) 1(
C=V
where V = intrinsic value or present value of a security Ct = expected future cash flows in period t = 1, ..., n r = the investor's required rate of return Common stock valuation: the present value of all future cash inflows expected to be received by the investor comprising of dividends and future selling price. Single holding period: For an investor holding a common stock for only 1 year, the value of the stock would be the present value of both the expected cash dividend to be received in 1 year (D1 ) and the expected market price per share of the stock at year-end (P1). If r represents an investor's required rate of return, the value of common stock (P0) would be:
P0 = 1
1
1
1
D
(1+r)
P
(1+r)+
Multiple holding period: Since common stock has no maturity date and is held for many years, a more general, multiperiod model is needed. The general common stock valuation model is defined as follows:
P0 = t
tt=1
D
(1+r)∑
where Dt = dividend in period t.
• The model is based on the concept that a common stock is worth the present value of future dividends. However, future dividends may grow with three different patterns: zero growth, constant growth, or nonconstant (supernormal) growth.
Zero growth model: If dividends are expected to remain unchanged, then the above model reduces to the formula:
P0 = D
r
• This is the case with a perpetuity. This model is most applicable to the valuation of preferred stocks or the common stocks of very mature
57
companies such as municipal utilities.
Constant growth model: If dividends grow at a constant rate of g every year [i.e., Dt = D0(1 + g)t], then the general model is simplified to:
P0 = 1D
r - g
• This formula, known as the Gordon's dividend growth model, is most applicable to the valuation of the common stock of vary large or broadly diversified companies.
Nonconstant, or supernormal, growth model: Firms typically go through life cycles, during part of which their growth is faster than that of the economy and then falls sharply.
• The value of stock during such supernormal growth can be found by taking the following steps: (1) Compute the dividends during the period of supernormal growth and find their present value; (2) find the price of the stock at the end of the supernormal growth period and compute its present value; and (3) add these two present value figures to find the value (Po) of the common stock.
Price-earnings ratio -- a pragmatic approach: forecasted price at the end of year = estimated EPS in year t x estimated P/E ratio
58
Module 6
TIME VALUE OF MONEY AND CAPITAL BUDGETING
LEARNING OBJECTIVES:
After studying this module, you will be able to:
1. Describe the concept of time value of the money. 2. Apply the time value concept to financial decision situations. 3. Discuss what capital budgeting is. 4. List and define each of the various evaluation methods. 5. Define mutually exclusive investments. 6. Evaluate a lease versus purchase decision. 7. Allocate a limited budget to capital investment projects. 8. Explain the role of inflation in an investment decision. 9. Discuss how to incorporate risk in capital investment decisions.
When making an investment, consider the time value of money; the longer it takes to receive a dollar, the less it will be worth in today’s dollars. Capital budgeting is the selection of the optimum alternative long-term investment opportunity. There are many capital budgeting methods, including the return on the investment, the payback period (how long it takes to recoup the initial investment), net present value, and internal rate of return. In some cases, proposals are mutually exclusive; the acceptance of one precludes the acceptance of the other. When budget constraints exist, capital rationing is required. Inflation and risk must also be taken into account in investment selection.
37. Time value of money and its applications 38. Capital budgeting 39. Accounting rate of return 40. Payback period 41. Net present value method
42. Profitability index
43. Internal rate of return (IRR)
44. Mutually exclusive investments 45. Lease-purchase decision 46. Capital rationing 47. Capital budgeting and inflation 48. Risk analysis in capital budgeting

59
37
TIME VALUE OF MONEY AND ITS APPLICATIONS
OVERVIEW Time value of money is a critical consideration in financial and investment decisions. Compound interest calculations are needed to determine future sums of money resulting from an investment. Discounting, or the calculation of present value, is inversely related to compounding. It is used to evaluate future cash flow associated with capital budgeting projects. Future values - compounding: a dollar in hand today is worth more than a dollar to be received tomorrow because of the interest it could earn from putting it in a savings account or placing it in an investment account.
• Compounding interest means that interest earns interest.
• For the discussion of the concepts of compounding and time value, let us define: Fn = future value = the amount of money at the end of year n P = principal i = annual interest rate n = number of years Then, F1 = the amount of money at the end of year 1 = principal and interest = P + iP = P(1+i) F2 = the amount of money at the end of year 2 = F1(1+i) = P(1+i)(1+i) = P(1+i)2 The future value of an investment compounded annually at rate i for n years is
Fn = P(1+i)n = P . FVIF i,n where FVIF i,n is the future value interest factor for $1.
Future value of an annuity: a series of payments (or receipts) of a fixed amount for a specified number of periods. The future value of an annuity is a compound annuity which involves depositing or investing an equal sum of money at the end of each year for a certain number of years and allowing it to grow. Let Sn = the future value on an n-year annuity A = the amount of an annuity Then we can write Sn = A(1+i)n-1 + A(1+i)n-2 + ... + A(1+i)0 = A[(1+i)n-1+(1+i)n-2+ ... + (1+i)0]
= A . t
t=0
n-1
(1+i)∑ = A
n
(1+i) -1
i
= A . FVIFA i,n
where FVIFA i,n represents the future value interest factor for an n-year annuity compounded at i percent.

60
Present value - discounting: present worth of future sums of money.
• The process of calculating present values, or discounting, is actually the opposite of finding the compounded future value. In connection with present value calculations, the interest rate i is called the discount rate.
• Recall that Recall that Fn = P (1+i)n
Therefore,
P = n
n
F
(1+i)
= Fn [1
n
(1+i)
] = Fn . PVIF i,n
where PVIF i,n represents the present value interest factor for $1. Present value of mixed streams of cash flows: The present value of a series of mixed payments (or receipts) is the sum of the present value of each individual payment. We know that the present value of each individual payment is the payment times the appropriate PVIF.
Present value of an annuity: present worth of receiving equal year-end annual payments
• Interest received from bonds, pension funds, and insurance obligations all involve annuities.
• The present value of an annuity (Pn) can be found by using the following equation:
Pn = A . 1
1
(1+i) (1+i) (1+i)
A1
A1
2 n
+ •
+ ••• + •
= A . 1 1 1
1 2
1(1+i) +i) (1+i)n+ + ••• +
(
= A •
+−=∑
i)1(
11
i
1. A
1n
1=tt
i)+(1
= A. PVIFA i,n where PVIFA i,n represents the appropriate value for the present value interest factor for a $1 annuity discounted at i percent for n years.
Perpetuities: annuities go on forever. Example: preferred stock which yields a constant dollar dividend indefinitely.
• Present value of a perpetuity = receipt
discount rate
A
i=
Some applications of future values and present values: future savings in a bank account; annual payment on a loan; annual deposit in an investment account; growth rate in earnings; rate of return; periods needed to accumulate a desired amount in a sinking fund; price to be paid for an investment; accumulated amount in a pension plan. Example: To find the annual deposit (or payment) necessary to accumulate a future sum, use the following formula:

61
Sn = A. FVIFA i,n Solving for A, we obtain: Sn Sinking fund amount = A = ----------------- FVIFA i,n
62
38
CAPITAL BUDGETING
OVERVIEW Capital budgeting is the process of deciding whether to commit resources to a project whose benefits will be spread over several time periods. Capital budgeting decisions are a key factor in the long-term profitability of a firm. To make wise investment decisions, financial managers need tools to guide them in comparing the benefits and costs of various investment alternatives. Types of investment decisions:
• Selection decisions in terms of obtaining new facilities or expanding existing facilities. Examples: Purchase of equipment; new product development; information technology (IT).
• Replacement decisions concerning existing facilities. Income tax considerations: A project that is attractive on a pre-tax basis may have to be
rejected on an after-tax basis. Income taxes typically affect both the amount and the timing of cash flows.
Types of cash flows: An investment’s cash flows fall into three categories:
• The initial investment • The incremental projected cash flows over the investment’s life • The terminal cash flow
Incremental (differential) cash flow: The incremental cash flow generated by a project
involves the after-tax cash flows that result from increased revenues and/or savings in operating expenses.
• It includes the depreciation tax shield on an incremental basis in replacement decisions.
• It does not include interest expense if the project is financed by debt; this is accounted for in the cost of capital.
Real options: Almost all capital budgeting proposals can be viewed as real options. Also, projects and operations contain implicit options, such as the option as to when to take a project, the option to expand, the option to abandon, and the option to suspend or contract operations. Deciding when to take a project is called the investment timing option. Capital budgeting techniques:
• Accounting rate of return
• Payback period and discounted payback period • Net present value • Profitability index
• Internal rate of return. See Keys 39 to 43.
63
39
ACCOUNTING RATE OF RETURN
OVER VIEW Accounting rate of return (ARR), also called simple rate of return, book rate of return, or unadjusted rate of return, measures profitability by relating the required investment to the future annual net income. Decision rule: Choose the project with the higher rate of return. Two versions of ARR:
• Using the initial investment:
Expected future annual net income ARR = Required initial investment
• Using the average investment (result called average rate of return):
Expected future annual net income Average investment
• The average investment is typically considered to be one-half of the original investment. As
a result, the average rate of return is twice the ARR.
Advantages: • Easily understandable and simple to compute • Recognizes the profitability factor
Disadvantages
• Ignores the time value of money • Use’s accounting data instead of cash flow data
64
40
PAYBACK PERIOD AND DISCOUNTED PAYBACK PERIOD
OVERVIEW The payback period is the length of time required to recover the initial capital investment.
Calculation: If the cash inflows are uniform:
Payback period = inflowscash Annual
investment Initial
• If annual cash inflows are not even, the payback period must be determined by trial and error.
Payback reciprocal: reciprocal of the payback time. It gives a quick, accurate estimate of the
internal rate of return (IRR) on an investment when the project life is more than twice the payback period and the cash inflows are uniform every period.
Decision rule: Choose the project with the shorter payback period because there is greater
liquidity and less risk. Advantages:
• Is simple to compute and easy to understand • Handles investment risk effectively
Disadvantages:
• Ignores profitability of an investment • Does not recognize the time value of money
Discounted payback period: the length of time required to recover the initial cash outflow from
the discounted future cash inflows. This is obtained when the present values of cash inflows add up to equal the initial investment.
65
41
NET PRESENT VALUE METHOD
OVERVIEW The net present value (NPV) method is a discounted cash flow technique widely used for evaluating investment projects. Under the NPV method, the present value (PV) of all cash inflows from the project is compared to the initial investment (I). Calculation:
1. The future net cash flows from the project are discounted to their present value at an appropriate discount rate (the project’s cost of capital).
2. The initial cost of the project is then subtracted from the present value to determine the NPV.
Decision rule: If the net present value is positive (NPV >0 or PV > I), the project should be
accepted. If it is negative, the project should be rejected. • If two projects are mutually exclusive, the one with the higher NPV should be selected.
Advantages:
• Recognizes the time value of money • Is relatively easy to calculate • Ranks mutually exclusive investments • Is consistent with stockholder wealth maximization as the firm’s goal
Disadvantages:
• Is not as easily understood as the rate-of-return concept • May not work well in capital rationing cases
66
42
PROFITABILITY INDEX
OVERVIEW Profitability index (P1) is an easily-computed index that is widely used for ranking investment projects in terms of their relative attractiveness. The present value of future cash inflows from the project is expressed on a per-dollar invested basis. Definition: The PI is the ratio of the total present value (PV) of future cash inflows to the
initial investment (I):
PV of future cash inflows Initial investment
• It facilitates comparison of different size investments and puts all proposals on a
comparative basis, eliminating the distorting effect of size. Decision rule: In a single-project case, if the index is greater than 1, accept the project;
otherwise reject it. • This index is primarily used as a means of ranking projects in capital rationing situations.
67
43
INTERNAL RATE OF RETURN (IRR)
OVERVIEW Internal rate of return (IRR) is the time-adjusted, real rate earned on a proposal. Computation: IRR is that rate of interest that equates the initial investment (I) with the present
value (PV) of future cash inflows. That is, at IRR, I = PV, or NPV (net present value) = 0. • The IRR method is easy to determine as long as cash inflows are even from year to year. If
the cash flows are uneven, the IRR must be determined by trial and error. Decision rule: Accept the project if IRR exceeds the cost of capital; otherwise reject the
proposal. • The IRR method ranks mutually exclusive investments differently from the NPV method if
1. the cost of one project is larger than the cost of the other, and 2. the timing of the project’s cash flow differs over time.
KEY EXAMPLE A company invests $100,000 in a proposal that will produce annual cash inflows of $15,000 a year for the next 20 years. The factor to obtain the IRR is 6.6667 ($l00,000/$15,000). Looking at the present value of an annuity of $1 table (PVIFA) for n = 20 at a factor closest to 6.6667 (which is a factor of 6.6231) we find that the IRR is approximately 14%. Assuming the company’s cost of capital is 10%, the project should be accepted. Advantages:
• Is easily understood and has intuitive economic meaning • Considers the time value of money and is therefore more exact and realistic than the
accounting rate of return Disadvantages:
• Can be tedious to calculate, especially when cash inflows are not even • Fails to recognize the varying size of investment in competing projects • If there are multiple reversals in the cash flow streams, the project may yield more than one
internal rate of return
68
44
MUTUALLY EXCLUSIVE INVESTMENTS
OVERVIEW Projects are mutually exclusive if the acceptance of one automatically precludes the acceptance of one or more other projects. If you are choosing between mutually exclusive investments, the NPV and IRR methods may yield contradictory indications. Conditions for conflicting rankings:
• Projects with different life expectancies • Projects with different sizes of investment • Projects with differing cash flows over time. Example: The cash flows of one project
increase over time, while those of another decrease. Different reinvestment assumptions:
• The contradictions result from different assumptions with respect to the reinvestment rate on cash flows from the projects.
• The NPV method discounts all cash flows at the cost of capital, thus implicitly assuming that these cash flows can be reinvested at this rate.
• The IRR method implies a reinvestment rate at IRR. Thus, the implied reinvestment rate differs from project to project.
• The NPV method generally gives correct ranking, since the cost of capital is a more realistic reinvestment rate.
Some examples of mutually exclusive proposals:
• Selecting one geographic location for a new plant instead of another • Deciding which machine type to buy • Deciding whether to produce product X or product Y
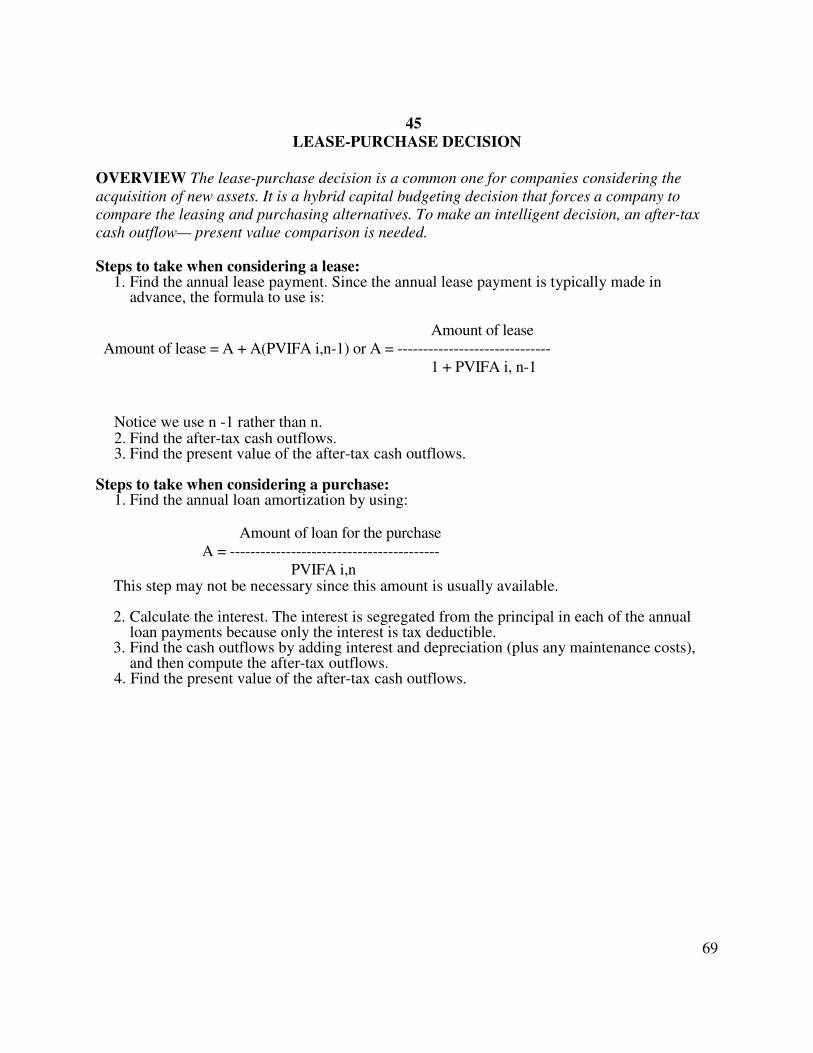
69
45
LEASE-PURCHASE DECISION
OVERVIEW The lease-purchase decision is a common one for companies considering the acquisition of new assets. It is a hybrid capital budgeting decision that forces a company to compare the leasing and purchasing alternatives. To make an intelligent decision, an after-tax cash outflow— present value comparison is needed. Steps to take when considering a lease:
1. Find the annual lease payment. Since the annual lease payment is typically made in advance, the formula to use is:
Amount of lease Amount of lease = A + A(PVIFA i,n-1) or A = ------------------------------ 1 + PVIFA i, n-1
Notice we use n -1 rather than n. 2. Find the after-tax cash outflows. 3. Find the present value of the after-tax cash outflows.
Steps to take when considering a purchase:
1. Find the annual loan amortization by using: Amount of loan for the purchase A = ----------------------------------------- PVIFA i,n
This step may not be necessary since this amount is usually available.
2. Calculate the interest. The interest is segregated from the principal in each of the annual loan payments because only the interest is tax deductible.
3. Find the cash outflows by adding interest and depreciation (plus any maintenance costs), and then compute the after-tax outflows.
4. Find the present value of the after-tax cash outflows.
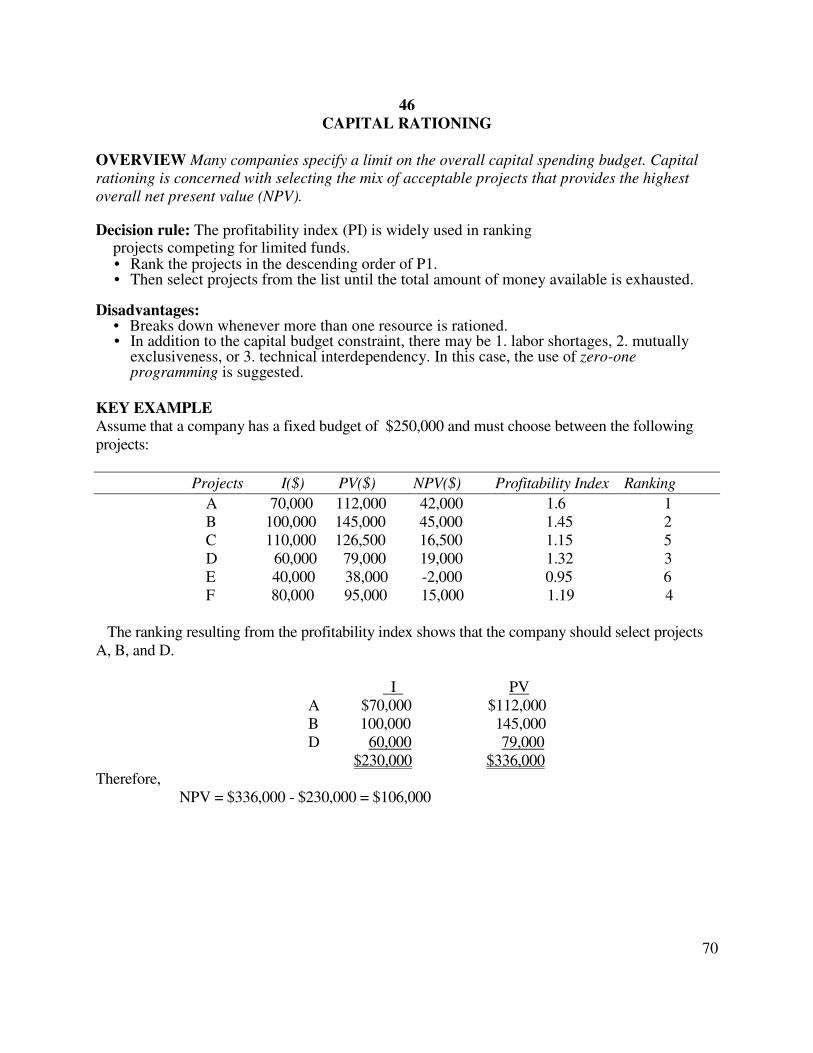
70
46
CAPITAL RATIONING
OVERVIEW Many companies specify a limit on the overall capital spending budget. Capital rationing is concerned with selecting the mix of acceptable projects that provides the highest overall net present value (NPV). Decision rule: The profitability index (PI) is widely used in ranking
projects competing for limited funds. • Rank the projects in the descending order of P1. • Then select projects from the list until the total amount of money available is exhausted.
Disadvantages:
• Breaks down whenever more than one resource is rationed. • In addition to the capital budget constraint, there may be 1. labor shortages, 2. mutually
exclusiveness, or 3. technical interdependency. In this case, the use of zero-one programming is suggested.
KEY EXAMPLE Assume that a company has a fixed budget of $250,000 and must choose between the following projects:
Projects I($) PV($) NPV($) Profitability Index Ranking
A 70,000 112,000 42,000 1.6 1 B 100,000 145,000 45,000 1.45 2 C 110,000 126,500 16,500 1.15 5 D 60,000 79,000 19,000 1.32 3 E 40,000 38,000 -2,000 0.95 6 F 80,000 95,000 15,000 1.19 4 The ranking resulting from the profitability index shows that the company should select projects A, B, and D. I PV A $70,000 $112,000 B 100,000 145,000 D 60,000 79,000 $230,000 $336,000 Therefore, NPV = $336,000 - $230,000 = $106,000
71
47
CAPITAL BUDGETING AND INFLATION
OVERVIEW The accuracy of capital budgeting decisions depends on data reliability regarding cash inflows and outflows. For example, the failure to incorporate price-level changes in capital budgeting situations can result in errors in predicting cash flows and thus in incorrect decisions. Two approaches: Typically, a financial manager has two basically equivalent options for dealing
with a capital budgeting situation involving inflation. • Restate the cash flows in nominal terms and discount them at a nominal cost of capital
(minimum required rate of return). • Restate both the cash flows and cost of capital in constant terms and discount the constant
cash flows at a constant cost of capital. Instead of converting the cash-flow forecasts into nominal terms, you can convert the cost of capital into real terms by using the following formula:
1 + nominal cost of capital Real cost of capital = - 1 1 + inflation rate
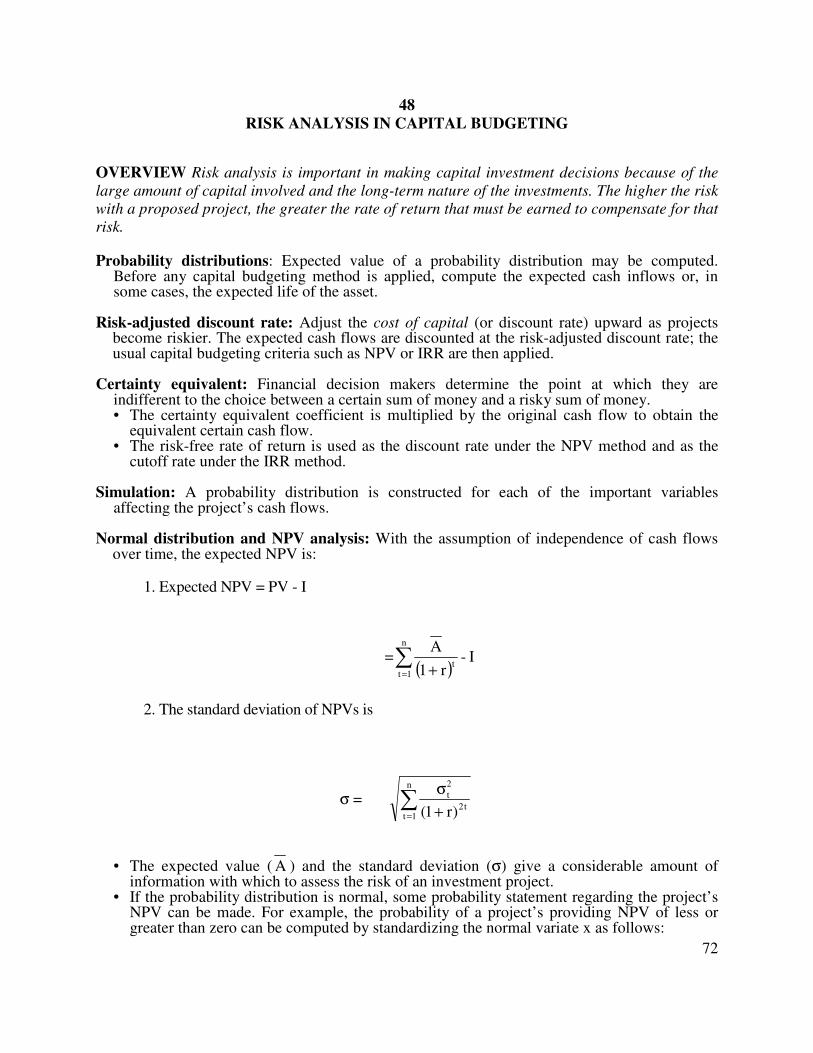
72
48
RISK ANALYSIS IN CAPITAL BUDGETING
OVERVIEW Risk analysis is important in making capital investment decisions because of the large amount of capital involved and the long-term nature of the investments. The higher the risk with a proposed project, the greater the rate of return that must be earned to compensate for that risk. Probability distributions: Expected value of a probability distribution may be computed.
Before any capital budgeting method is applied, compute the expected cash inflows or, in some cases, the expected life of the asset.
Risk-adjusted discount rate: Adjust the cost of capital (or discount rate) upward as projects
become riskier. The expected cash flows are discounted at the risk-adjusted discount rate; the usual capital budgeting criteria such as NPV or IRR are then applied.
Certainty equivalent: Financial decision makers determine the point at which they are
indifferent to the choice between a certain sum of money and a risky sum of money. • The certainty equivalent coefficient is multiplied by the original cash flow to obtain the
equivalent certain cash flow. • The risk-free rate of return is used as the discount rate under the NPV method and as the
cutoff rate under the IRR method. Simulation: A probability distribution is constructed for each of the important variables
affecting the project’s cash flows. Normal distribution and NPV analysis: With the assumption of independence of cash flows
over time, the expected NPV is: 1. Expected NPV = PV - I
=( )
I - r 1
An
1tt∑
= +
2. The standard deviation of NPVs is
σ = ∑= +
σn
1tt2
2
t
)r1(
• The expected value ( A ) and the standard deviation (σ) give a considerable amount of information with which to assess the risk of an investment project.
• If the probability distribution is normal, some probability statement regarding the project’s NPV can be made. For example, the probability of a project’s providing NPV of less or greater than zero can be computed by standardizing the normal variate x as follows:
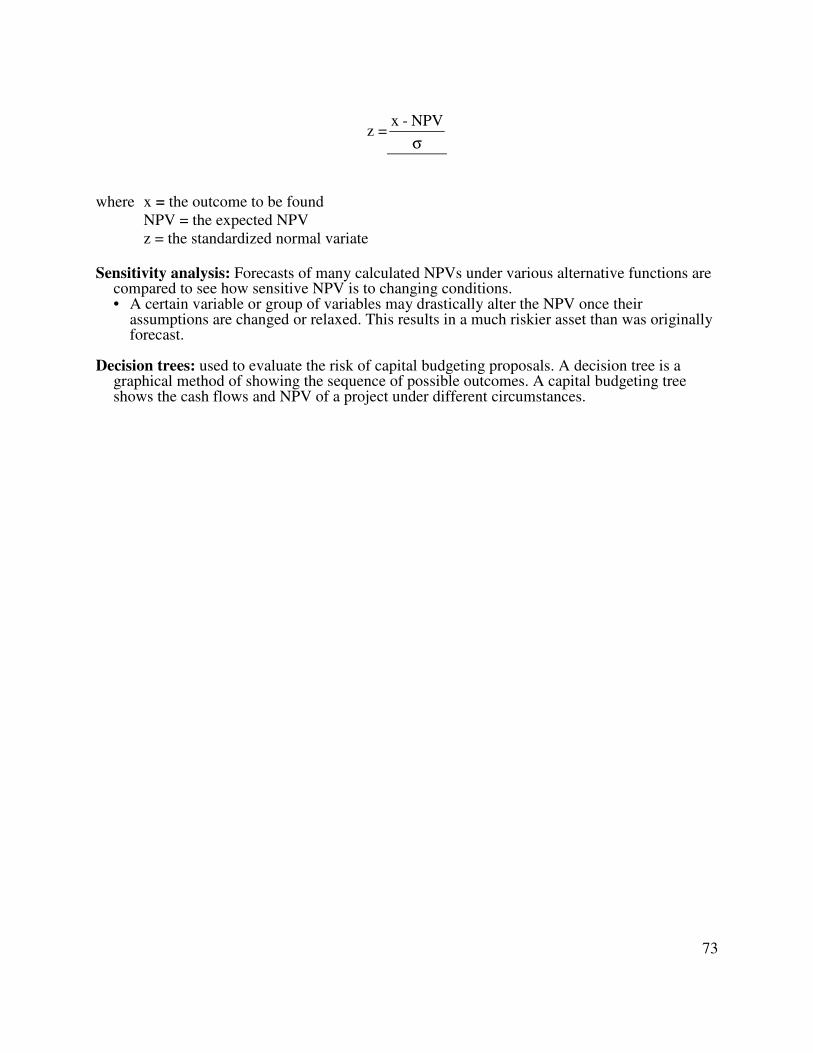
73
z =σ
NPV - x
where x = the outcome to be found
NPV = the expected NPV z = the standardized normal variate Sensitivity analysis: Forecasts of many calculated NPVs under various alternative functions are
compared to see how sensitive NPV is to changing conditions. • A certain variable or group of variables may drastically alter the NPV once their
assumptions are changed or relaxed. This results in a much riskier asset than was originally forecast.
Decision trees: used to evaluate the risk of capital budgeting proposals. A decision tree is a
graphical method of showing the sequence of possible outcomes. A capital budgeting tree shows the cash flows and NPV of a project under different circumstances.
74
Module 7
DETERMINING COST OF CAPITAL AND CAPITAL STRUCTURE DECISIONS
LEARNING OBJECTIVES:
After studying this chapter, you will be able to:
1. Determine the cost of capital. 2. Compute and explain the cost of equity capital. 3. Explain the level of financing and the marginal cost of capital (MCC). 4. Calculate and discuss break-even analysis. 5. Compute and explain the cash break-even point. 6. Discuss and give examples of leverage. 7. Detail the use of operating leverage. 8. Articulate the concept of financial leverage. 9. Discuss the theory of capital structure. 10. Implement the EBIT-EPS approach to capital structure.
The cost of capital is the cost to the business of financing. An increase in the cost of capital to a company means it is viewed as an increasingly risky investment by the investing and credit community. As risk increases, interest rates and dividend yields increase. The break-even point is the amount of sales necessary to cover total costs; resulting in a zero profit. The cash break-even point—the volume of sales that will cover all cash expenses during a period—may also be determined. Operating leverage is the relationship of fixed cost to total cost; financial leverage is the extent to which debt exists in the capital structure. A major goal of the company is to maximize its market value through an optimal mix of long-term fund sources.
49. Cost of capital 50. Computing the cost of equity capital 51. Level of financing and the marginal cost of capital (MCC) 52. Break-even analysis 53. Cash break-even point 54. Leverage 55. Operating leverage 56. Financial leverage 57. Theory of capital structure 58. EBIT-EPS approach to capital structure
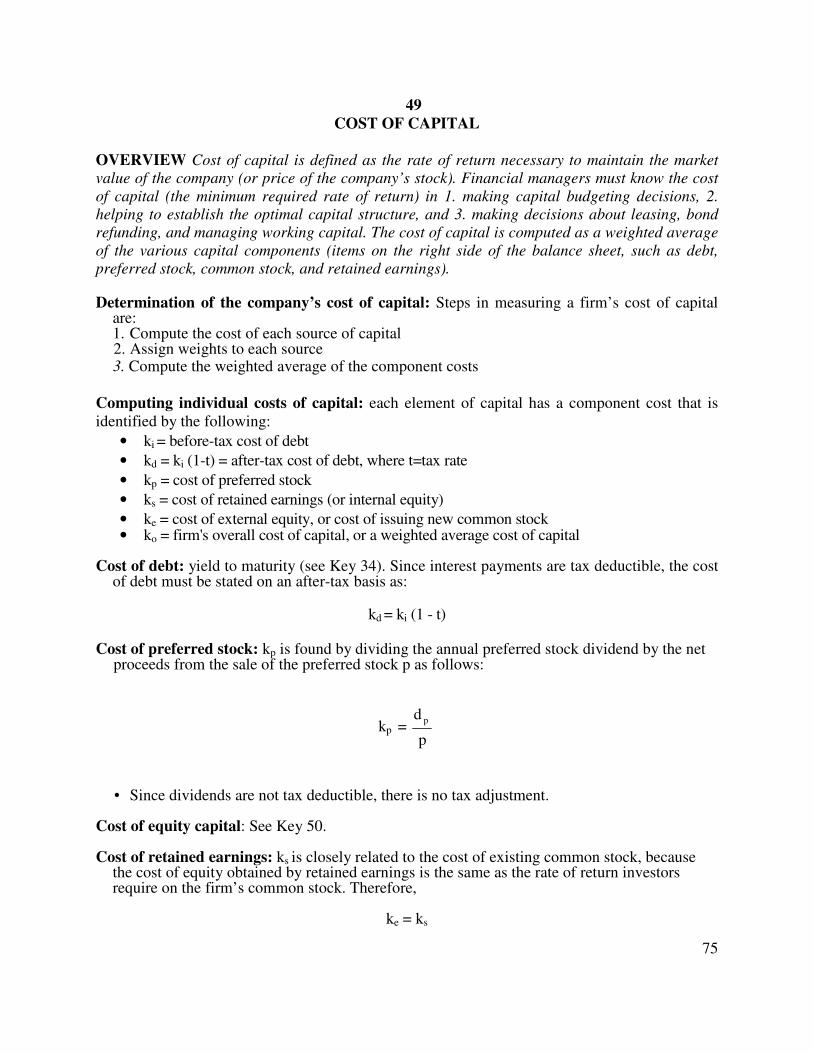
75
49
COST OF CAPITAL
OVERVIEW Cost of capital is defined as the rate of return necessary to maintain the market value of the company (or price of the company’s stock). Financial managers must know the cost of capital (the minimum required rate of return) in 1. making capital budgeting decisions, 2. helping to establish the optimal capital structure, and 3. making decisions about leasing, bond refunding, and managing working capital. The cost of capital is computed as a weighted average of the various capital components (items on the right side of the balance sheet, such as debt, preferred stock, common stock, and retained earnings). Determination of the company’s cost of capital: Steps in measuring a firm’s cost of capital
are: 1. Compute the cost of each source of capital 2. Assign weights to each source 3. Compute the weighted average of the component costs
Computing individual costs of capital: each element of capital has a component cost that is identified by the following:
• ki = before-tax cost of debt
• kd = ki (1-t) = after-tax cost of debt, where t=tax rate
• kp = cost of preferred stock
• ks = cost of retained earnings (or internal equity)
• ke = cost of external equity, or cost of issuing new common stock • ko = firm's overall cost of capital, or a weighted average cost of capital
Cost of debt: yield to maturity (see Key 34). Since interest payments are tax deductible, the cost
of debt must be stated on an after-tax basis as:
kd = ki (1 - t)
Cost of preferred stock: kp is found by dividing the annual preferred stock dividend by the net proceeds from the sale of the preferred stock p as follows:
kp = p
d p
• Since dividends are not tax deductible, there is no tax adjustment. Cost of equity capital: See Key 50. Cost of retained earnings: ks is closely related to the cost of existing common stock, because
the cost of equity obtained by retained earnings is the same as the rate of return investors require on the firm’s common stock. Therefore,
ke = ks
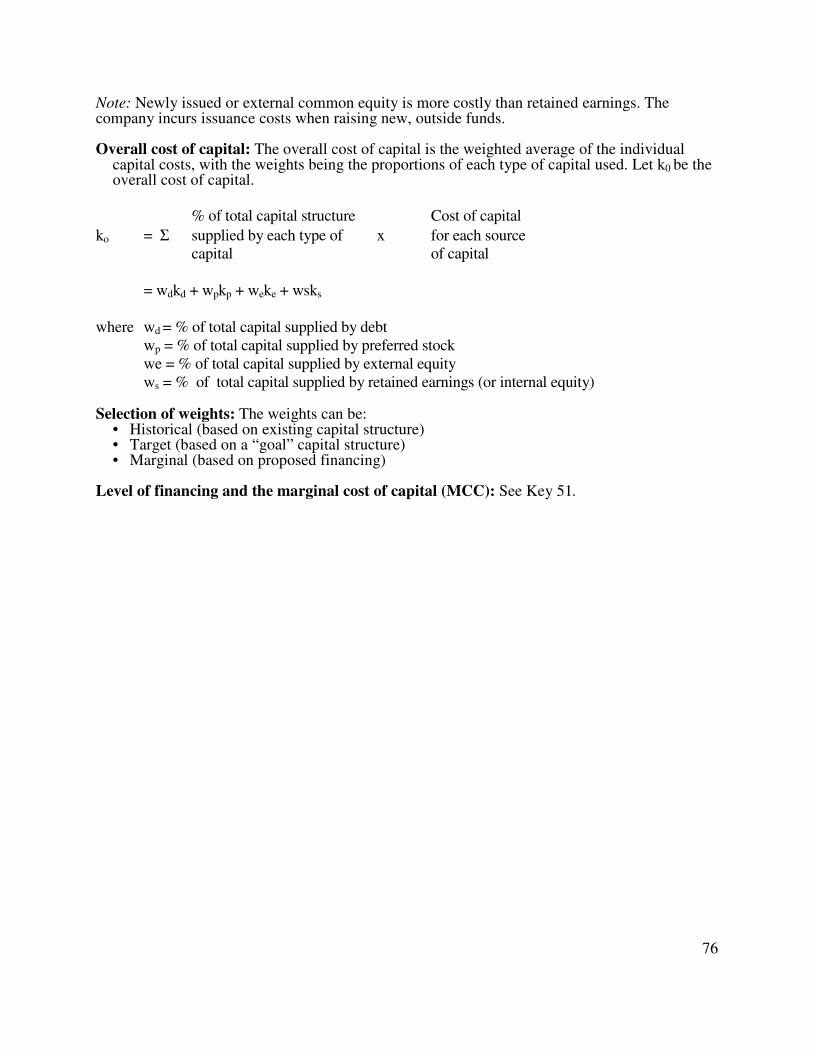
76
Note: Newly issued or external common equity is more costly than retained earnings. The company incurs issuance costs when raising new, outside funds. Overall cost of capital: The overall cost of capital is the weighted average of the individual
capital costs, with the weights being the proportions of each type of capital used. Let k0 be the overall cost of capital.
% of total capital structure Cost of capital
ko = Σ supplied by each type of x for each source capital of capital = wdkd + wpkp + weke + wsks where wd = % of total capital supplied by debt wp = % of total capital supplied by preferred stock we = % of total capital supplied by external equity ws = % of total capital supplied by retained earnings (or internal equity) Selection of weights: The weights can be:
• Historical (based on existing capital structure) • Target (based on a “goal” capital structure) • Marginal (based on proposed financing)
Level of financing and the marginal cost of capital (MCC): See Key 51.
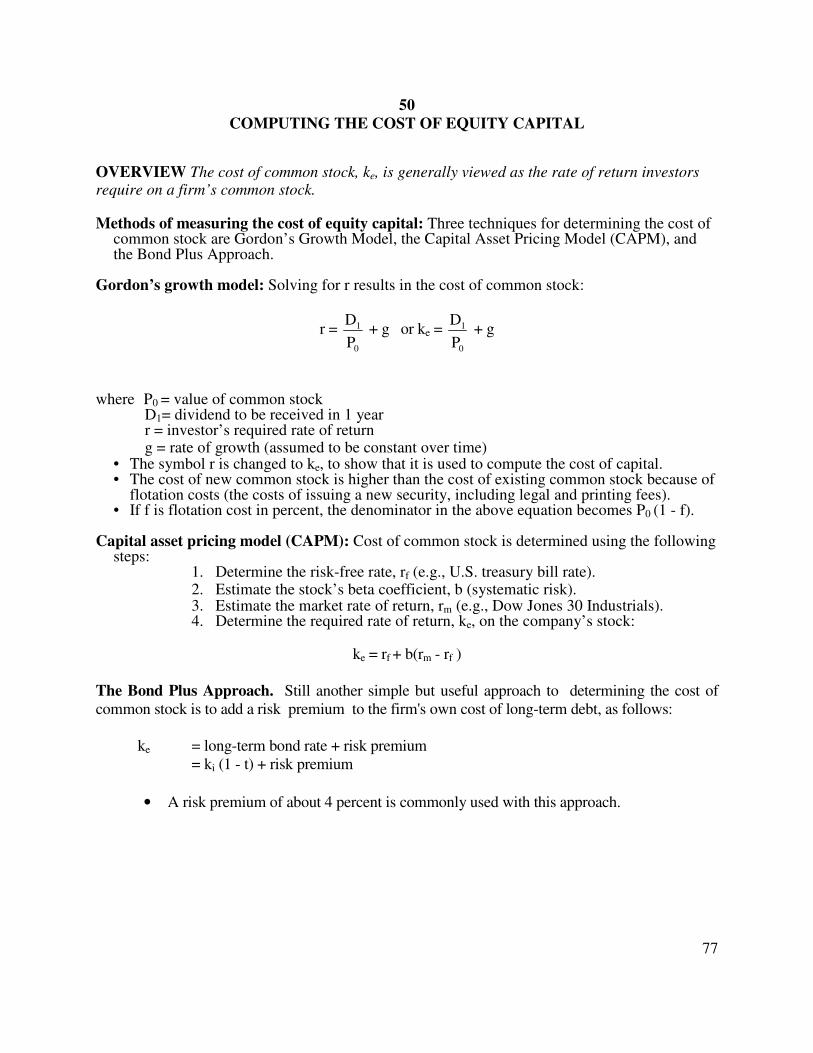
77
50
COMPUTING THE COST OF EQUITY CAPITAL
OVERVIEW The cost of common stock, ke, is generally viewed as the rate of return investors require on a firm’s common stock. Methods of measuring the cost of equity capital: Three techniques for determining the cost of
common stock are Gordon’s Growth Model, the Capital Asset Pricing Model (CAPM), and the Bond Plus Approach.
Gordon’s growth model: Solving for r results in the cost of common stock:
r = 0
1
P
D + g or ke =
0
1
P
D + g
where P0 = value of common stock
D1= dividend to be received in 1 year r = investor’s required rate of return g = rate of growth (assumed to be constant over time)
• The symbol r is changed to ke, to show that it is used to compute the cost of capital. • The cost of new common stock is higher than the cost of existing common stock because of
flotation costs (the costs of issuing a new security, including legal and printing fees). • If f is flotation cost in percent, the denominator in the above equation becomes P0 (1 - f).
Capital asset pricing model (CAPM): Cost of common stock is determined using the following
steps: 1. Determine the risk-free rate, rf (e.g., U.S. treasury bill rate). 2. Estimate the stock’s beta coefficient, b (systematic risk). 3. Estimate the market rate of return, rm (e.g., Dow Jones 30 Industrials). 4. Determine the required rate of return, ke, on the company’s stock:
ke = rf + b(rm - rf )
The Bond Plus Approach. Still another simple but useful approach to determining the cost of common stock is to add a risk premium to the firm's own cost of long-term debt, as follows: ke = long-term bond rate + risk premium = ki (1 - t) + risk premium
• A risk premium of about 4 percent is commonly used with this approach.
78
51
LEVEL OF FINANCING AND THE MARGINAL COST OF CAPITAL (MCC)
OVERVIEW Since the amount of financing has an impact on a company’s cost of capital, the expected return from an investment must be compared with the cost of financing the project. If the cost of capital rises as the level of financing increases, you should look at the marginal cost of capital, not the average cost of all funds financed. The investment should be limited to the amount at which IRR equals marginal cost of capital. The marginal cost of capital: Because external equity capital has a higher cost than retained
earnings because of flotation costs, the weighted cost of capital increases for each dollar of new financing. Therefore, lower-cost capital sources are used first.
Calculation: The steps in calculating the company’s marginal cost of capital are:
1. Determine the cost and the percentage of financing to be used for each source of capital (debt, preferred stock, common stock equity).
2. Compute the breakpoints on the MCC curve at which the weighted cost will increase. The formula for computing the breakpoints is:
Break point = maximum amount of the lowest-cost source of capital percentage financing provided by the source
3. Calculate the weighted cost of capital over the range of total financing between breakpoints. 4. Construct a MCC schedule or graph that shows the weighted cost of capital for each level
of total new financing. 5. This schedule is used in conjunction with the company’s available investment opportunities
schedule (IOS) to select the investments.
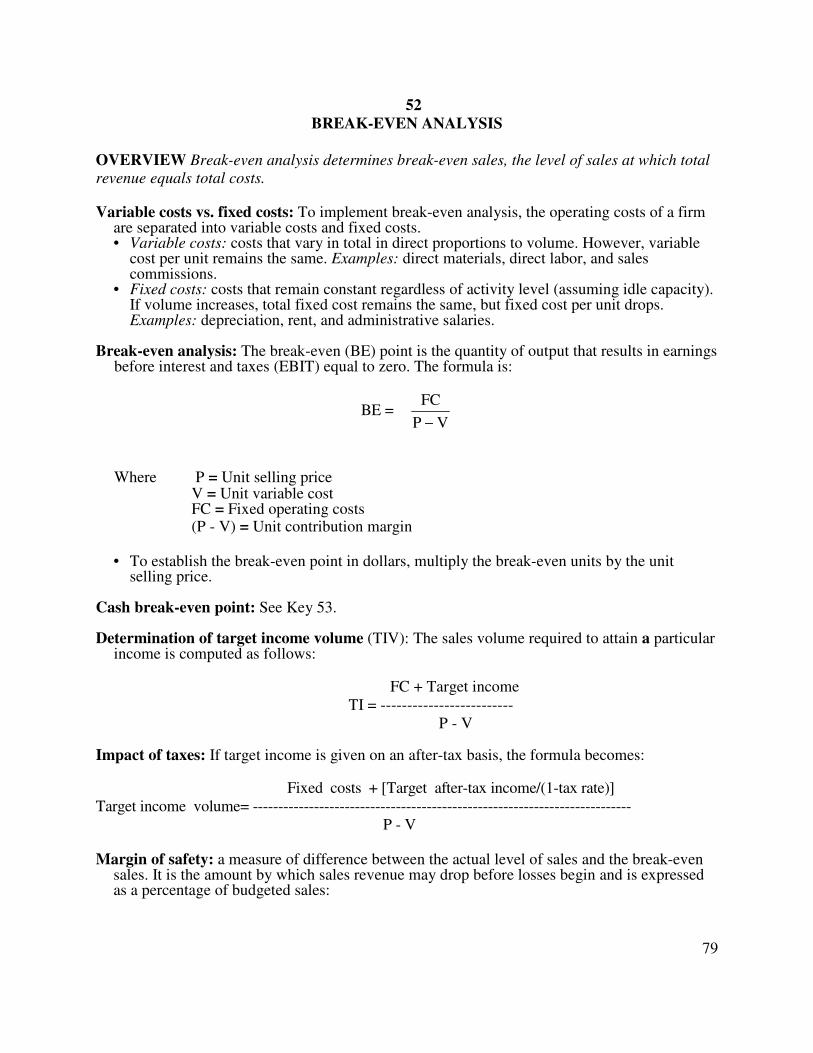
79
52
BREAK-EVEN ANALYSIS
OVERVIEW Break-even analysis determines break-even sales, the level of sales at which total revenue equals total costs. Variable costs vs. fixed costs: To implement break-even analysis, the operating costs of a firm
are separated into variable costs and fixed costs. • Variable costs: costs that vary in total in direct proportions to volume. However, variable
cost per unit remains the same. Examples: direct materials, direct labor, and sales commissions.
• Fixed costs: costs that remain constant regardless of activity level (assuming idle capacity). If volume increases, total fixed cost remains the same, but fixed cost per unit drops. Examples: depreciation, rent, and administrative salaries.
Break-even analysis: The break-even (BE) point is the quantity of output that results in earnings
before interest and taxes (EBIT) equal to zero. The formula is:
BE = V P
FC
−
Where P = Unit selling price V = Unit variable cost FC = Fixed operating costs
(P - V) = Unit contribution margin
• To establish the break-even point in dollars, multiply the break-even units by the unit selling price.
Cash break-even point: See Key 53. Determination of target income volume (TIV): The sales volume required to attain a particular
income is computed as follows:
FC + Target income TI = ------------------------- P - V Impact of taxes: If target income is given on an after-tax basis, the formula becomes: Fixed costs + [Target after-tax income/(1-tax rate)] Target income volume= -------------------------------------------------------------------------- P - V
Margin of safety: a measure of difference between the actual level of sales and the break-even
sales. It is the amount by which sales revenue may drop before losses begin and is expressed as a percentage of budgeted sales:
80
Budgeted sales - Break-even sales Margin of safety = ------------------------------------------ Budgeted sales
• The margin of safety is often used as a measure of risk. The larger the ratio, the safer the situation, because there is a lower risk of reaching the break-even point.
Break-even analysis assumptions: The break-even models assume:
• The behavior of both sales revenue and expenses is linear throughout the entire relevant range of activity.
• There is only one product or a constant sales mix. • Volume is the only factor affecting variable costs. • Inventories do not change significantly from period to period.
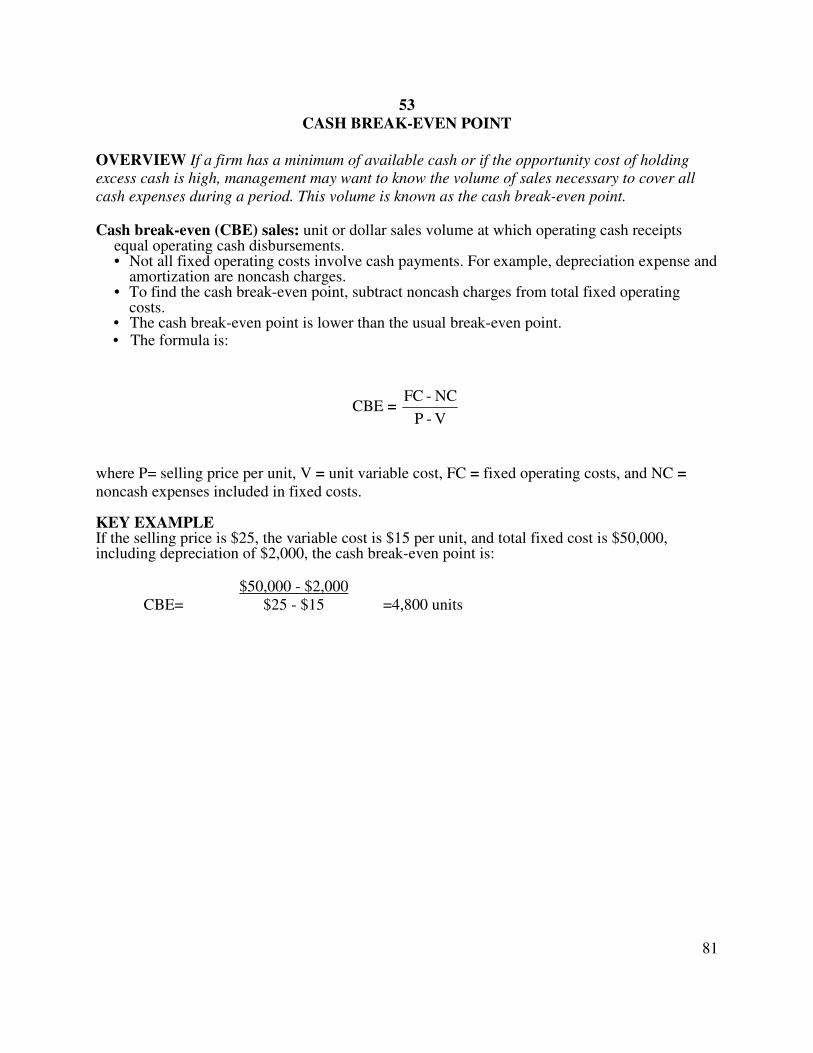
81
53
CASH BREAK-EVEN POINT
OVERVIEW If a firm has a minimum of available cash or if the opportunity cost of holding excess cash is high, management may want to know the volume of sales necessary to cover all cash expenses during a period. This volume is known as the cash break-even point. Cash break-even (CBE) sales: unit or dollar sales volume at which operating cash receipts
equal operating cash disbursements. • Not all fixed operating costs involve cash payments. For example, depreciation expense and
amortization are noncash charges. • To find the cash break-even point, subtract noncash charges from total fixed operating
costs. • The cash break-even point is lower than the usual break-even point. • The formula is:
CBE = V - P
NC - FC
where P= selling price per unit, V = unit variable cost, FC = fixed operating costs, and NC =
noncash expenses included in fixed costs. KEY EXAMPLE If the selling price is $25, the variable cost is $15 per unit, and total fixed cost is $50,000, including depreciation of $2,000, the cash break-even point is:
$50,000 - $2,000 CBE= $25 - $15 =4,800 units
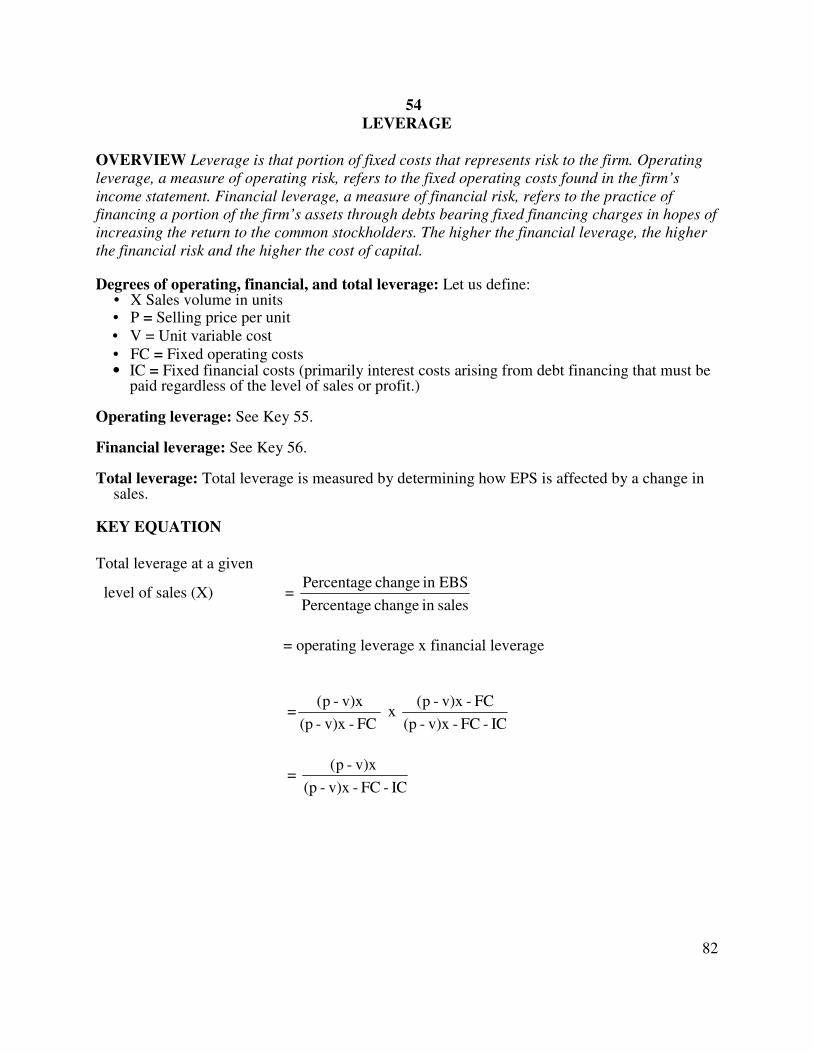
82
54
LEVERAGE
OVERVIEW Leverage is that portion of fixed costs that represents risk to the firm. Operating leverage, a measure of operating risk, refers to the fixed operating costs found in the firm’s income statement. Financial leverage, a measure of financial risk, refers to the practice of financing a portion of the firm’s assets through debts bearing fixed financing charges in hopes of increasing the return to the common stockholders. The higher the financial leverage, the higher the financial risk and the higher the cost of capital. Degrees of operating, financial, and total leverage: Let us define:
• X Sales volume in units • P = Selling price per unit • V = Unit variable cost • FC = Fixed operating costs • IC = Fixed financial costs (primarily interest costs arising from debt financing that must be
paid regardless of the level of sales or profit.) Operating leverage: See Key 55. Financial leverage: See Key 56. Total leverage: Total leverage is measured by determining how EPS is affected by a change in
sales. KEY EQUATION
Total leverage at a given
level of sales (X) = salesin change Percentage
EBSin change Percentage
= operating leverage x financial leverage
= FC - v)x - (p
v)x- p( x
IC- FC - v)x - (p
FC - v)x - p(
= IC- FC - v)x - (p
v)x - p(
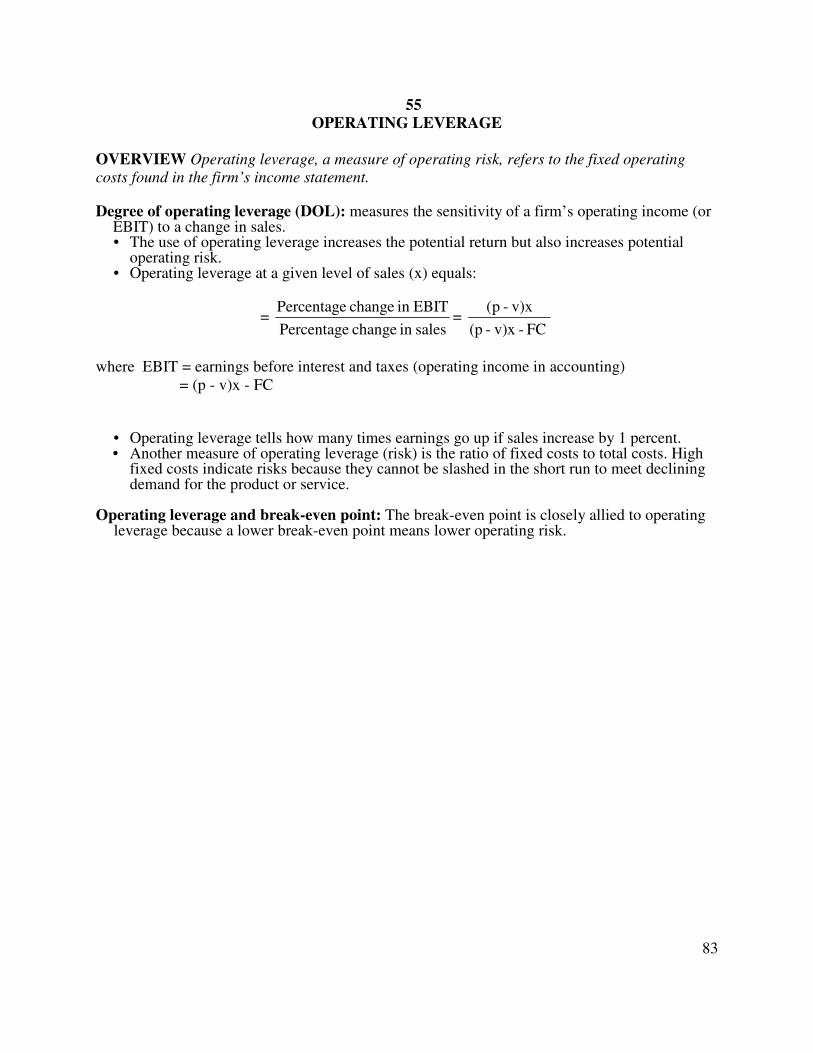
83
55
OPERATING LEVERAGE
OVERVIEW Operating leverage, a measure of operating risk, refers to the fixed operating costs found in the firm’s income statement. Degree of operating leverage (DOL): measures the sensitivity of a firm’s operating income (or
EBIT) to a change in sales. • The use of operating leverage increases the potential return but also increases potential
operating risk. • Operating leverage at a given level of sales (x) equals:
= salesin change Percentage
EBITin change Percentage=
FC - v)x - (p
v)x- p(
where EBIT = earnings before interest and taxes (operating income in accounting) = (p - v)x - FC
• Operating leverage tells how many times earnings go up if sales increase by 1 percent. • Another measure of operating leverage (risk) is the ratio of fixed costs to total costs. High
fixed costs indicate risks because they cannot be slashed in the short run to meet declining demand for the product or service.
Operating leverage and break-even point: The break-even point is closely allied to operating
leverage because a lower break-even point means lower operating risk.
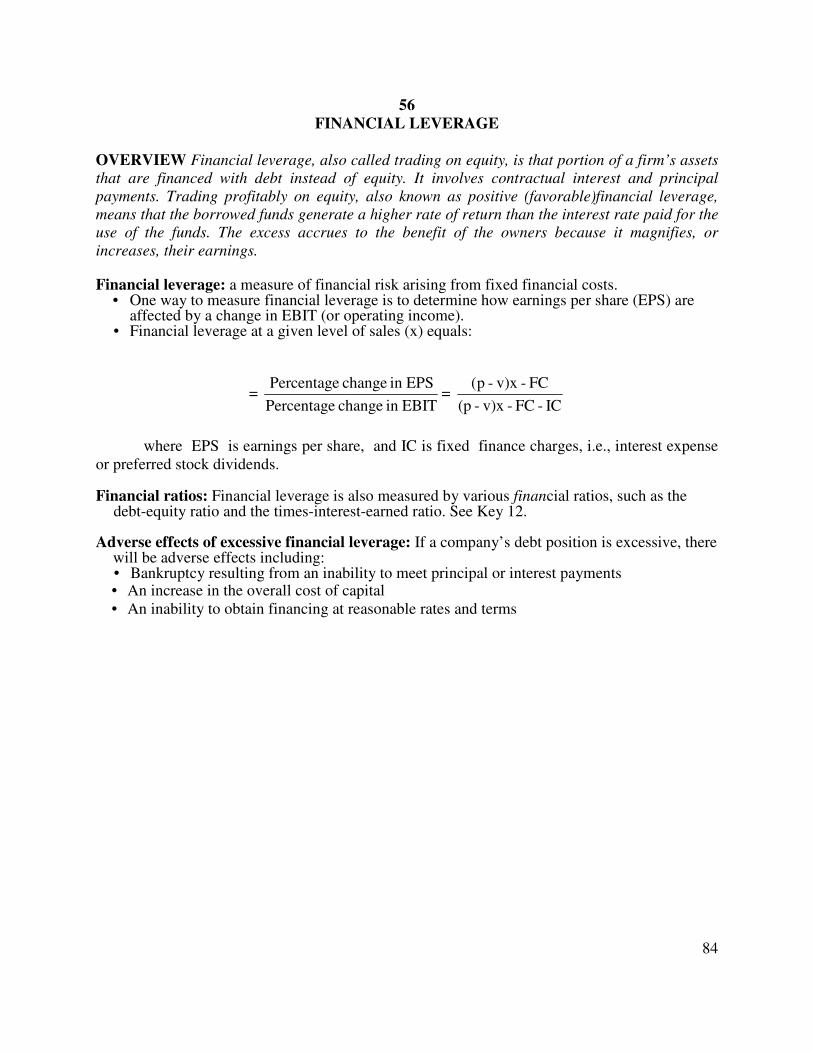
84
56
FINANCIAL LEVERAGE
OVERVIEW Financial leverage, also called trading on equity, is that portion of a firm’s assets that are financed with debt instead of equity. It involves contractual interest and principal payments. Trading profitably on equity, also known as positive (favorable)financial leverage, means that the borrowed funds generate a higher rate of return than the interest rate paid for the use of the funds. The excess accrues to the benefit of the owners because it magnifies, or increases, their earnings. Financial leverage: a measure of financial risk arising from fixed financial costs.
• One way to measure financial leverage is to determine how earnings per share (EPS) are affected by a change in EBIT (or operating income).
• Financial leverage at a given level of sales (x) equals:
= EBITin change Percentage
EPSin change Percentage=
IC- FC - v)x - (p
FC - v)x - p(
where EPS is earnings per share, and IC is fixed finance charges, i.e., interest expense or preferred stock dividends. Financial ratios: Financial leverage is also measured by various financial ratios, such as the
debt-equity ratio and the times-interest-earned ratio. See Key 12. Adverse effects of excessive financial leverage: If a company’s debt position is excessive, there
will be adverse effects including: • Bankruptcy resulting from an inability to meet principal or interest payments • An increase in the overall cost of capital • An inability to obtain financing at reasonable rates and terms
85
57
THEORY OF CAPITAL STRUCTURE
OVERVIEW The theory of capital structure is closely related to the company’s cost of capital. Capital structure is the mix of the long-term sources of funds used by the company. The primary objective of capital structure decisions is to maximize the market value of the company through an appropriate mix of long-term sources of funds. This mix, called the optimal capital structure, minimizes the overall cost of capital; however, there is disagreement about whether an optimal capital structure actually exists. Approaches to the theory of capital structure: 1. net operating income, 2. net income, 3.
traditional, and 4. Miller-Modigliani. All four of these approaches use the following simplifying assumptions: • No income taxes are included • The company’s dividend payout is 100% • No transaction costs are incurred • The company has constant earnings before interest and taxes
(EBIT). • There is a constant operating risk.
Rates: Given these assumptions, the company is concerned with the following three rates: 1.
ki = B
I
where ki = cost or yield on the firm’s debt (assuming a perpetuity) I = annual interest charges
B = market value of debt outstanding 2.
ke =S
EAC
where ke = the firm’s required rate of return on equity or cost of common equity (assuming no earnings growth and a 100% dividend payout ratio) EAC = earnings available to common stockholders S = market value of stock outstanding 3.
k0 = V
EBIT
where k0 = the firm’s overall cost of capital
EBIT = earnings before interest and taxes V = the market value of the firm (B +S)
Effect of leverage: In each of the four approaches to determining capital structure, the concern is
with what happens to ki, ke, and k0 when the degree of leverage, as denoted by the debt-equity
86
(B/S) ratio, increases. The net operating income (NOI) approach: suggests that there is no one optimal capital
structure and that the firm’s overall cost of capital, k0, and the value of the firm’s market value of debt and stock outstanding, V, are both independent of the degree to which the company uses leverage.
The net income (NI) approach: assumes that ki and ke remain unchanged as the debt-equity
ratio increases and both the overall cost of capital, k0, and the market value of the firm, V, are affected by the firm’s use of leverage. • The firm is able to increase its value, V. and lower its cost of capital, k0, as it increases the
degree of leverage. Traditional approach: assumes that there is an optimal capital structure and that the firm can
increase its value through leverage. This moderate view of the relationship between leverage and valuation encompasses all the ground between the NOI approach and the NI approach.
Miller-Modigliani (MM) position: MM asserts that:
• The market value of the firm and its cost of capital are independent of its capital structure. • ke increases to offset exactly the use of cheaper debt money. • The cutoff rate for capital budgeting decisions is completely independent of the way in
which an investment is financed. Factors affecting capital structure: Some factors impacting upon a company’s capital structure
are: 1. growth rate and stability of future sales, 2. industry competition, 3. asset makeup, and 4. risk preferences.
87
58
EBIT-EPS APPROACH TO CAPITAL STRUCTURE OVERVIEW Financial managers use the EBIT-EPS approach to capital structure to evaluate alternative financing plans. It helps achieve an optimal capital structure, resulting in the lowest overall cost of capital. Use of financial leverage: Financial leverage affects earnings in two ways:
• An increased risk in earnings per share (EPS) due to the use of fixed financial obligations.
• A change in the level of EPS at a given EBIT associated with a specific capital structure.
• The first effect is measured by the degree of financial leverage.
• The second effect is analyzed by means of EBIT-EPS analysis. The financial manager evaluates alternative financing plans by investigating their effect on EPS over a range of EBIT levels. EPS-EBIT analysis: Primary objective is to determine the EBIT break-even or indifference points for various alternative financing plans.
• The indifference points between any two methods of financing can be determined by solving for EBIT in the following equality:
1S
PD- t)- I)(1 - EBIT( =
2S
PD- t)- I)(1 - EBIT(
where t = tax rate PD = preferred stock dividends S1 and S2 = number of shares of common stock outstanding after financing for plan 1 and plan 2, respectively.
88
Module 8
DIVIDENDS AND STOCK SPLITS
LEARNING OBJECTIVES:
After studying this chapter, you will be able to:
1. Distinguish between cash dividends and stock dividends. 2. Define stock splits. 3. Discuss various dividend policies.
Cash and stock represent the major types of dividends a company may issue to its stockholders. Cash dividends may be stated on a per-share basis or on a percentage-of-par-value basis. Generally, stockholders look favorably upon a company that issues dividends. However, a growth company typically retains most of its earnings for expansion. A stock split occurs when a company changes the par value per share by issuing more shares; a 2-for-1 split reduces the par value per share by one-half.
59. Cash dividends 60. Stock dividends and stock splits 61. Dividend policy
89
59
CASH DIVIDENDS
OVERVIEW A cash dividend is typically expressed in dollars-and-cents per share based on outstanding shares. However, the dividend on preferred stock is often expressed as a percentage of par value. Declaration date: date the board of directors declares the dividend, making it a legal liability of
the company. Date of record: date on which the stockholder has a right to receive the dividend. Ex-dividend date: date on which the right to the dividend leaves the shares. The right to a
dividend stays with the stock until 4 days before the date of record. The market price of the stock reflects the fact that it has gone ex-dividend and will decrease by approximately the amount of the dividend.
Date of payment: date on which the company distributes dividend checks to its stockholders. Computations:
• If a cash dividend per share is declared, the dividend equals the dividends per share times the outstanding shares. Example: A cash dividend per share of $1.20 on 10,000 outstanding shares results in a dividend of $12,000 ($1.20 x 10,000).
• If a percentage cash dividend is declared, the dividend equals the percentage times the total par value of the outstanding shares. Example: A company has 30,000 shares of $10 par value, 8% preferred stock outstanding. The dividend equals $24,000 (30,000 x $10 x 8%).
Dividend reinvestment plan: A company may give its stockholders the option of automatically
investing their dividends in corporate shares instead of receiving cash.
90
60
STOCK DIVIDENDS AND STOCK SPLITS
OVERVIEW A stock dividend is the issuance of additional shares of stock to stockholders. A stock split is the issuance of a significant amount of additional shares, reducing the par value per share of the stock on a proportional basis. Characteristics of a stock dividend: A stock dividend is a pro rata distribution of additional shares of a corporation’s own stock to its stockholders. While a stock dividend increases the number of shares held, the proportion of the company each stockholder owns remains the same.
• A stock dividend may be declared when the cash position of the company is deficient and/or when the company wants to prompt more trading of its stock by reducing its market price.
Characteristics of a stock split: A stock split increases a company’s outstanding shares without
changing the total par value of the stock; the par value per share is proportionately reduced. Example: If a company with 10,000 shares of $10 par value stock issues a 2-for-1 stock split, there will then be 20,000 shares at a $5 par value. The total par value will remain at $100,000. • After a stock split, theoretically the market price per share of the stock should drop
proportionately. Example: After a 4-for-1 stock split, the market price per share should drop to one-fourth of what it was before the split.
• A stock split may be prompted by a desire to reduce the market price per share to make it easier for small investors to purchase shares.
Similarities between a stock dividend and stock split: 1. outstanding shares increase, 2. total
stockholders’ equity remains the same, and 3. no cash is paid.
91
61
DIVIDEND POLICY
OVERVIEW Dividends should fulfill the objectives of both the stockholders and company. Policies: The more stable a company’s earnings, the more regular its issuance of dividends.
However, if cash flow and investment requirements are volatile, the company should avoid establishing a high regular dividend. If dividends are increased, they should continue at the higher rate since stockholders will expect them to do so.
Reasons dividend policy is important:
• Affects investor attitudes. Stockholders usually look negatively on a company that cuts its dividends.
• Impacts the company’s financing program and capital budget. • Affects the company’s cash position. A company with liquidity problems may have to
restrict or cease dividend payments. Factors that influence dividend policy:
• Net income: A higher net income allows for more dividends. • Earnings stability: A stable earnings usually result in more dividends. • Growth rate: A rapidly growing company often restricts dividends in order to retain funds
in the business to promote further growth. • Debt position: A highly leveraged business is more likely to retain earnings to satisfy
principal and interest payments on debt. • Loan restrictions: Dividends may be restricted in accordance with a loan agreement. • lnternal financing: A company that wants to finance its operations internally will retain
greater earnings. Internal financing is the least costly financing source. • Ability to finance externally: A company with easy access to the capital markets can afford a
higher dividend payout. • Maturity and size: A mature, large company has easier access to outside financing and has
less need to retain profits. • Taxes: Tax penalties may be assessed for excess accumulated retained earnings.
Types of dividend policies: • Stable dividends-per-share policy: This policy is typically looked on favorably by investors.
Dividend stability implies a low-risk company. Some financial institutions and private investors invest only in companies with stable dividends, and individuals relying on a fixed income also favor stable dividends.
• Compromise policy: A compromise between policies 1 and 2 may be suitable for a company. Example: A company pays a low dollar amount per share plus a percentage increment in good years. The increment should not be paid regularly because stockholders come to expect it. This policy may be advisable when profitability shows wide variation.
• Residual-dividend policy: If a firm’s investment opportunities are unstable, the company may opt for a fluctuating dividend policy in which the amount of earnings retained depends on the availability of investment opportunities in a given year.
• Constant dividend-payout-ratio (dividends per share/earnings per share) policy: A constant percentage of earnings is paid out in dividends. Since net income varies, the dividends also vary. Most stockholders do not like fluctuation in dividends.
Theoretical position: Theoretically a company should retain earnings rather than distribute them
when the corporate return exceeds the return investors can obtain on their money elsewhere. • If the company’s return on profits exceeds the cost of capital, market price of stock will rise.
However, practically speaking, investors will expect to receive dividends.
92
Module 9
SHORT-TERM FINANCING LEARNING OBJECTIVES:
After studying this chapter, you will be able to:
1. Enumerate financing strategies. 2. Use trade credit 3. Identify the types of short-term bank loans. 4. List other sources of financing. 5. Describe the process of accounts receivable financing. 6. Explain how to obtain inventory financing.
A company may use short-term funds, those payable within one year, for financing. Balances owed to suppliers are typically cost-free because they carry no interest. Commercial paper is unsecured short-term debt offered at a low interest rate by larger, financially healthy companies. Bank loans usually bear interest rates at or above the prime interest rate, with the prime rate offered to the most financially strong borrowers. When a company has difficulty obtaining a loan from a bank, it may go to commercial finance companies, which typically charge higher interest rates. Accounts receivable and inventory may serve as collateral for a loan or advance.
62. Financing strategy 63. Trade credit 64. Short-term bank loans 65. Other sources of financing 66. Accounts receivable financing 67. Inventory financing
93
62
FINANCING STRATEGY
OVERVIEW The financial manager is concerned about selecting the best possible source of financing based on the company’s particular situation. Considerations in formulating a financing strategy:
• The cost and risk associated with alternative financing instruments • The tax rate. Since interest is tax-deductible, a higher tax rate makes debt more attractive. • The maturity dates of debt securities. If liquidity is a problem, the maturity dates should be
extended. • The present ratio of debt to equity. If debt is excessive, equity financing may be a better
choice. • The adequacy of current lines of credit to meet current and future needs • The inflation rate. In an inflationary economy, repayment of debt is made in cheaper
dollars. • The company’s earning power and liquidity. High earnings and liquidity make it easier to
repay debt obligations. • The amount, nature, and stability of internally-generated funds • The restrictions in existing loan agreements on incurring additional debt • The future trend in capital market conditions • The type and amount of collateral required by long-term creditors • The ability to modify the financing strategy to adjust to changing economic conditions
Short-term vs. long-term financing: Short-term financing typically involves a lower cost than
long-term financing because long-term financing involves more uncertainty. Short-term financing involves greater liquidity risk because payment is due within one year. • Long-term financing is more suitable if a company has current financial problems but
expects things to improve in the future.
94
63
TRADE CREDIT
OVERVIEW Trade credit (accounts payable) are balances owed to suppliers. It is a short-term financing source. Characteristics:
• A spontaneous source of financing because it arises from normal business operations • Least expensive form of financing inventory • Carries either no interest or a minimal amount
Advantages:
• Readily available since suppliers want business • Collateral is not required • Convenient • Trade creditors usually lenient if corporate financial problems occur • Accounts payable may be stretched out within reason
Opportunity cost of foregoing a cash discount: net revenue lost by not taking advantage of a
discount offered by a trade creditor. KEY FORMULA The formula used to compute the opportunity cost in percentage, on an annual basis, of not taking a discount is: Opportunity cost = Discount foregone 360 Proceeds use of x N where N = the number of days payment can be delayed by foregoing the discount
days credit is outstanding less discount period Example:
The opportunity cost of not taking a discount when the terms are 3/15, net/60 is computed as follows:
Opportunity cost = 3100
3
−x
15 - 60
360 =
97
3x
45
360 = 24.7%
95
64
SHORT-TERM BANK LOANS
OVERVIEW A company with a satisfactory financial position may borrow money from the bank. When a bank loan is taken, the debtor typically signs a note, a written promise to repay the loan at the due date. A note payable may be paid at maturity or in installments. A short-term bank loan is payable within one year or less. Interest:
• The prime interest rate is the lowest interest rate applied to bank loans. Banks charge only their most creditworthy clients the prime rate.
• Interest on a bank loan equals: interest rate x principal x time. Example: = The interest on a $10,000, 12% six-month loan is: 12% x $10,000 x 6/12 = $600
• Interest on a loan may be paid either at maturity (ordinary interest) or in advance (discounting the loan).
• When interest is paid in advance, the proceeds from the loan are reduced and the effective (true) interest cost is increased.
Proceeds = Principal - Interest
• Effective interest rate equals interest divided by proceeds. Example: The effective interest
rate on a $50,000, 14%, one-year bank loan on a discount basis equals:
Interest = $7,000 = $7,000 = 16.3% Proceeds $50,000 - $7,000 $43,000
• When a loan has a compensating balance requirement (a deposit maintained with the bank
that does not earn interest), the proceeds received are decreased by the amount of the compensating balance. The compensating balance increases the effective interest rate.
Adjusted proceeds = principal - interest - compensating balance
• Effective interest rate equals interest divided by adjusted proceeds. Example: A $60,000, 19%, one-year bank loan on a discount basis is taken. The compensating balance is 15%. The effective interest rate equals:
Interest = $11,400 = $11,400
Proceeds ($60,000 - $11,400 - $9,000) $39,600 = 28.8% Unsecured loan: A loan without a collateral requirement; usually given to companies with
excellent credit ratings to finance projects that have quick cash flows. Disadvantages: 1. usually has a higher interest rate than a secured loan; and 2. requires payment in a lump sum.
Secured loan: a collateral-backed loan, usually required for borrowers with questionable credit
ratings. Line of credit: an agreement from a bank to lend money to the borrower on a recurring basis up
to a specified amount. Credit lines are usually established for a one-year period and may be
96
renewed annually. • Advantages: 1. provide easy and immediate access to funds during tight money markets,
and 2. enable you to borrow only as much as necessary and to repay immediately when cash is available.
• Disadvantages: 1. require commitment fee on the unused credit line, 2. may require compensating balance on the unused portion, 3. require collateral, and 4. may impose restrictions on the company (e.g., minimum working capital).
Installment loan: a loan requiring monthly payments. Advantage: may be tailored to satisfy a
company’s seasonal financing needs.
97
65
OTHER SOURCES OF FINANCING
OVERVIEW Financing can be arranged through banker’s acceptances, commercial paper, or from finance companies. Banker’s acceptances: A banker’s acceptance is a draft, drawn by an individual and accepted
by a bank, that orders payment to a third party at a later date. • The draft’s creditworthiness is high since it is backed by the bank. • A draft is a debt instrument created by the creditor out of a self-liquidating business
transaction. • It is often used to finance shipment and handling of domestic and foreign merchandise. • It is a marketable instrument. • Acceptances are classed as short-term financing because the maturity date is usually under
180 days. Commercial paper: unsecured, short-term debt issued on a discount
basis by financially strong companies with high credit ratings. • Interest rate below prime • No collateral required • Short-term maturity, usually under 270 days • Issued at discount. The interest is immediately deducted by the creditor, but the debtor pays
the full face value. • Issued through a dealer or directly by an institutional investor • Rated by Standard and Poor’s and by Moody’s • Issued only by large, financially sound companies
Commercial finance companies: When short-term credit cannot be obtained from the bank, a
company may go to a commercial finance company. • A finance company loan has a higher interest rate than a bank loan. • The loan is typically secured by collateral—including inventory, accounts receivable, and
fixed assets—whose value exceeds the balance of the loan. • The finance company may also finance installment purchases of industrial equipment.
98
66
ACCOUNTS RECEIVABLE FINANCING
OVERVIEW Receivable financing uses short-term financing backed by receivables. Accounts receivable financing may be a factoring or an assignment arrangement. Characteristics: The financing of accounts receivable is facilitated if customers are financially
strong, sales returns are minimal, and title to the goods is received by the buyer at shipment. Factoring: outright sale of accounts receivable to a third party without recourse; the purchaser
assumes all credit and collection risks. • The proceeds received by the selling company equal the face value of the receivables less
the commission charge, usually 2 to 5% above the prime interest rate. • The cost of factoring is the factor’s commission for credit investigation, interest on the
unpaid balance of advanced funds, and a discount from the face value of the receivables. • Billing and collection is done by the factor.
Advantages: 1. seller receives immediate cash, 2. overhead is reduced because credit
investigation is no longer needed, 3. seller can obtain advances as needed on a seasonal basis, and 4. seller can receive financial advice.
Disadvantages: 1. high cost, 2. possible negative customer reaction, and 3. pressure applied by
factors to customers who are past due may arouse antagonism. Assignment: assigning accounts receivable with recourse; if the customer does not pay, the
company (borrower) has to pay. The accounts receivable act as collateral; and new receivables substitute for receivables collected. • There is no transfer of ownership of accounts receivable. • The finance company usually advances between 50 and 85% of the face value of the
receivables in cash. • The borrower incurs a service charge, interest on the advance, and bad debt losses. • Customer remittances continue to be made to the company.
Advantages: 1. cash immediately available, 2. cash advances received on a seasonal basis, and 3. negative customer reaction avoided.
Disadvantages: 1. high cost, 2. continued credit investment function, and 3. significant credit
risks.
99
67
INVENTORY FINANCING
OVERVIEW Inventory financing is the use of inventory as collateral for a loan. It typically occurs when a company has fully exhausted its borrowing capacity on receivables. Type of inventory: Inventory financing requires the existence of marketable, nonperishable,
standardized goods with fast turnover. Inventory should preferably be stable in price; expenses associated with its sale should be minimal.
Financing: the advance is usually higher for readily marketable inventory. Generally, 75% of
the value of raw materials and finished goods can be financed. The interest rate is approximately 3 to 5 points over the prime interest rate.
Ways to finance inventory:
• Floating (blanket) lien: uses entire inventory as the creditor’s security. • Warehouse receipt: provides the lender an interest in the borrower’s inventory stored at a
public warehouse. The fixed cost of this arrangement is high. In a field warehouse arrangement, the warehouser sets up a secured area directly at the debtor’s location.
• Trust receipt: gives the creditor title to the goods but releases them to the borrower to sell on the creditor’s behalf. As goods are sold, the borrower pays the lender. An example is automobile dealer financing.
• A collateral certificate: may be issued by a third party to the lender guaranteeing the existence of pledged inventory.
Disadvantages of inventory financing:
• High interest rate. • Restrictions placed on the inventory.
100
Module 10
TERM LOANS AND LEASING LEARNING OBJECTIVES:
After studying this chapter, you will be able to:
1. Characterize the limitations of intermediate-term bank loans. 2. Explain the function and responsibility of Small Business Administration. 3. List the pros and cons of leasing.
Intermediate-term loans, while carrying an interest rate typically higher than that on a short-term loan, have less liquidity risk. Loan payments include principal and interest. However, restrictive provisions often exist in loan agreements. A small business having difficulty obtaining a loan from a bank may contact the Small Business Administration. Equipment may serve as collateral for an advance or loan; a company may also rent real or personal property by making periodic payments. Although the total cost of leasing is typically higher than the cost of buying the item, leasing has many advantages, including the absence of a substantial initial payment, the avoidance of obsolescence risk, and existence of fewer financing restrictions than with a loan.
68. Intermediate-term bank loans
69. Small Business Administration
70. Leasing
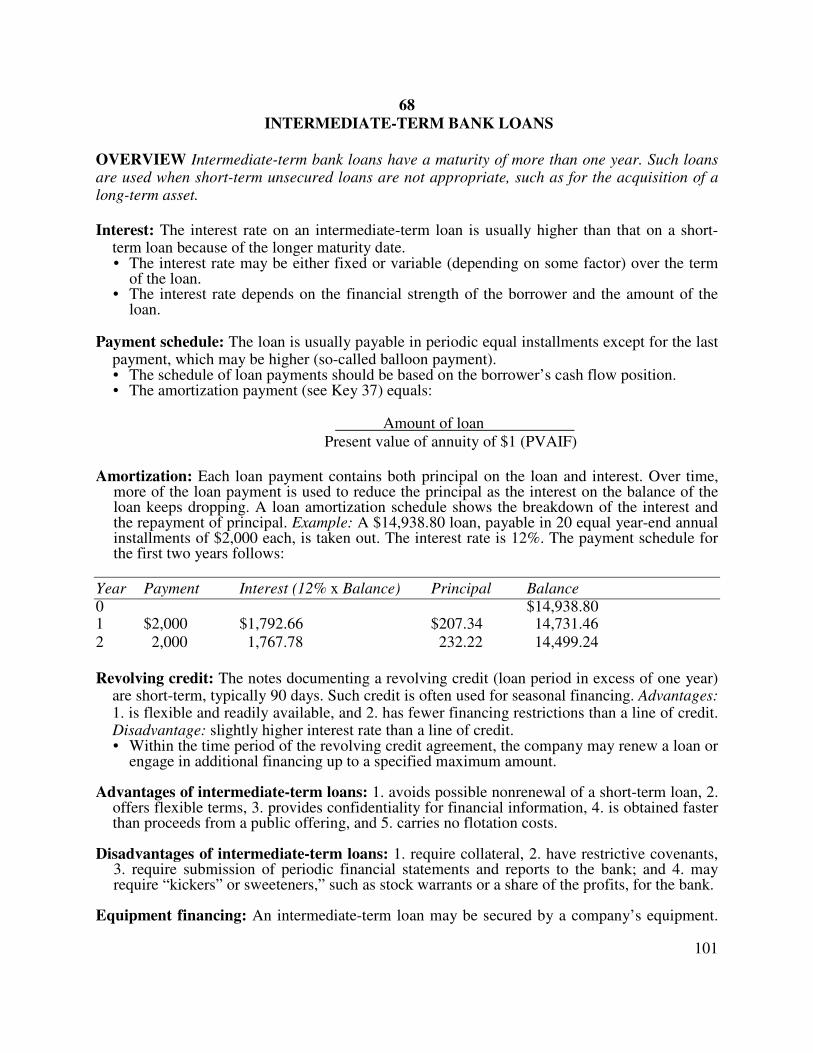
101
68
INTERMEDIATE-TERM BANK LOANS
OVERVIEW Intermediate-term bank loans have a maturity of more than one year. Such loans are used when short-term unsecured loans are not appropriate, such as for the acquisition of a long-term asset. Interest: The interest rate on an intermediate-term loan is usually higher than that on a short-
term loan because of the longer maturity date. • The interest rate may be either fixed or variable (depending on some factor) over the term
of the loan. • The interest rate depends on the financial strength of the borrower and the amount of the
loan. Payment schedule: The loan is usually payable in periodic equal installments except for the last
payment, which may be higher (so-called balloon payment). • The schedule of loan payments should be based on the borrower’s cash flow position. • The amortization payment (see Key 37) equals:
Amount of loan
Present value of annuity of $1 (PVAIF) Amortization: Each loan payment contains both principal on the loan and interest. Over time,
more of the loan payment is used to reduce the principal as the interest on the balance of the loan keeps dropping. A loan amortization schedule shows the breakdown of the interest and the repayment of principal. Example: A $14,938.80 loan, payable in 20 equal year-end annual installments of $2,000 each, is taken out. The interest rate is 12%. The payment schedule for the first two years follows:
Year Payment Interest (12% x Balance) Principal Balance 0 $14,938.80 1 $2,000 $1,792.66 $207.34 14,731.46 2 2,000 1,767.78 232.22 14,499.24 Revolving credit: The notes documenting a revolving credit (loan period in excess of one year)
are short-term, typically 90 days. Such credit is often used for seasonal financing. Advantages: 1. is flexible and readily available, and 2. has fewer financing restrictions than a line of credit. Disadvantage: slightly higher interest rate than a line of credit. • Within the time period of the revolving credit agreement, the company may renew a loan or
engage in additional financing up to a specified maximum amount. Advantages of intermediate-term loans: 1. avoids possible nonrenewal of a short-term loan, 2.
offers flexible terms, 3. provides confidentiality for financial information, 4. is obtained faster than proceeds from a public offering, and 5. carries no flotation costs.
Disadvantages of intermediate-term loans: 1. require collateral, 2. have restrictive covenants,
3. require submission of periodic financial statements and reports to the bank; and 4. may require “kickers” or sweeteners,” such as stock warrants or a share of the profits, for the bank.
Equipment financing: An intermediate-term loan may be secured by a company’s equipment.

102
Equipment financing may be obtained from banks, finance companies, or manufacturers of equipment. • An advance is made against the market value of the equipment; the more marketable the
equipment is, the higher the advance will be. • The cost of selling the equipment, if need be, is a consideration to the creditor. • The repayment schedule is designed so that the market value of the equipment at a given
time exceeds the unpaid balance of the loan.
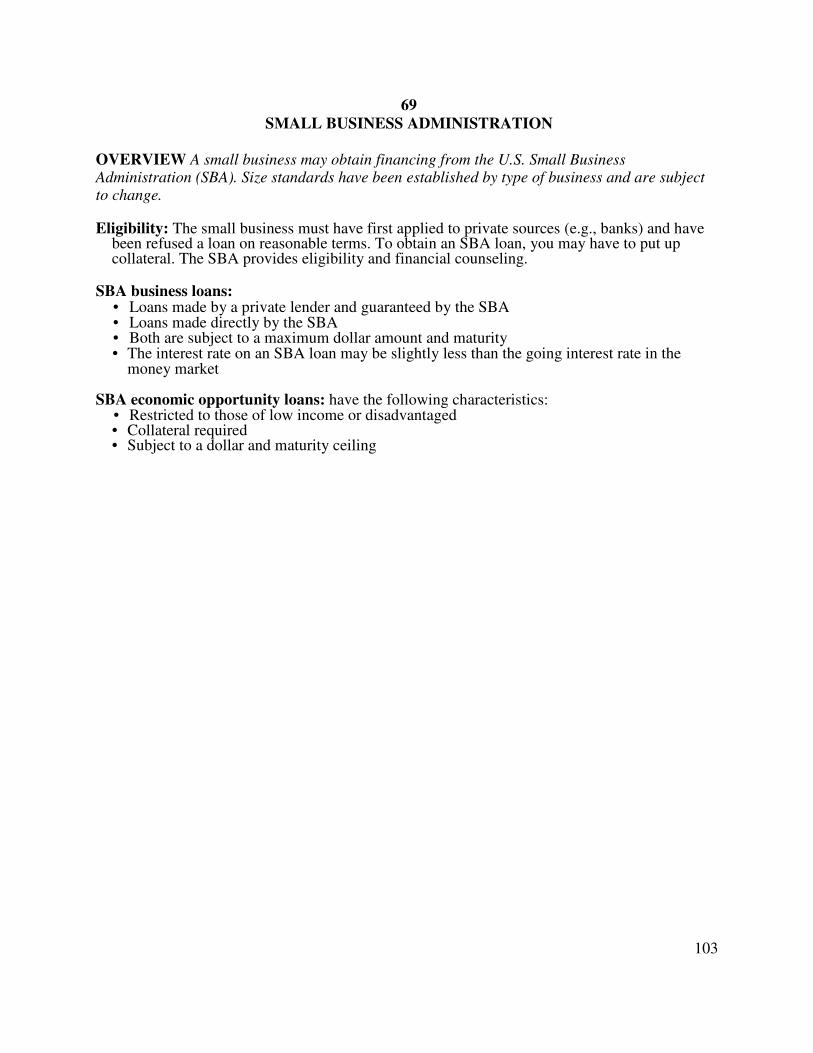
103
69
SMALL BUSINESS ADMINISTRATION
OVERVIEW A small business may obtain financing from the U.S. Small Business Administration (SBA). Size standards have been established by type of business and are subject to change. Eligibility: The small business must have first applied to private sources (e.g., banks) and have
been refused a loan on reasonable terms. To obtain an SBA loan, you may have to put up collateral. The SBA provides eligibility and financial counseling.
SBA business loans:
• Loans made by a private lender and guaranteed by the SBA • Loans made directly by the SBA • Both are subject to a maximum dollar amount and maturity • The interest rate on an SBA loan may be slightly less than the going interest rate in the
money market SBA economic opportunity loans: have the following characteristics:
• Restricted to those of low income or disadvantaged • Collateral required • Subject to a dollar and maturity ceiling
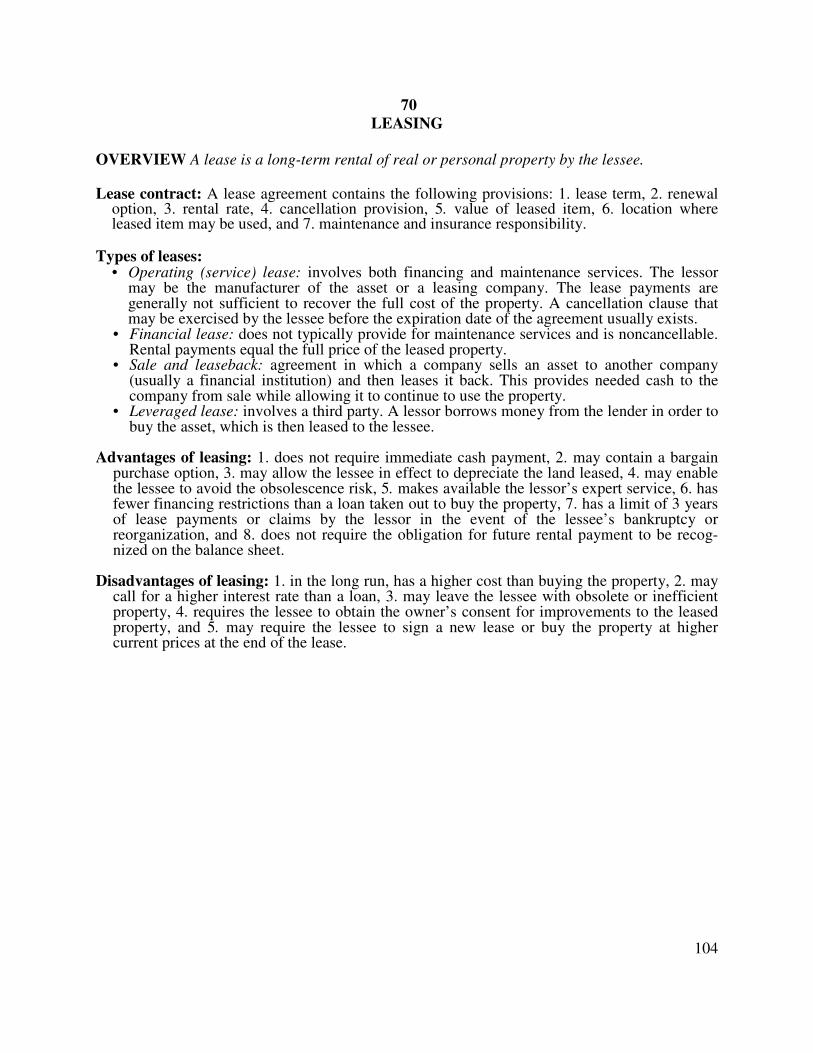
104
70
LEASING
OVERVIEW A lease is a long-term rental of real or personal property by the lessee. Lease contract: A lease agreement contains the following provisions: 1. lease term, 2. renewal
option, 3. rental rate, 4. cancellation provision, 5. value of leased item, 6. location where leased item may be used, and 7. maintenance and insurance responsibility.
Types of leases:
• Operating (service) lease: involves both financing and maintenance services. The lessor may be the manufacturer of the asset or a leasing company. The lease payments are generally not sufficient to recover the full cost of the property. A cancellation clause that may be exercised by the lessee before the expiration date of the agreement usually exists.
• Financial lease: does not typically provide for maintenance services and is noncancellable. Rental payments equal the full price of the leased property.
• Sale and leaseback: agreement in which a company sells an asset to another company (usually a financial institution) and then leases it back. This provides needed cash to the company from sale while allowing it to continue to use the property.
• Leveraged lease: involves a third party. A lessor borrows money from the lender in order to buy the asset, which is then leased to the lessee.
Advantages of leasing: 1. does not require immediate cash payment, 2. may contain a bargain
purchase option, 3. may allow the lessee in effect to depreciate the land leased, 4. may enable the lessee to avoid the obsolescence risk, 5. makes available the lessor’s expert service, 6. has fewer financing restrictions than a loan taken out to buy the property, 7. has a limit of 3 years of lease payments or claims by the lessor in the event of the lessee’s bankruptcy or reorganization, and 8. does not require the obligation for future rental payment to be recog-nized on the balance sheet.
Disadvantages of leasing: 1. in the long run, has a higher cost than buying the property, 2. may
call for a higher interest rate than a loan, 3. may leave the lessee with obsolete or inefficient property, 4. requires the lessee to obtain the owner’s consent for improvements to the leased property, and 5. may require the lessee to sign a new lease or buy the property at higher current prices at the end of the lease.
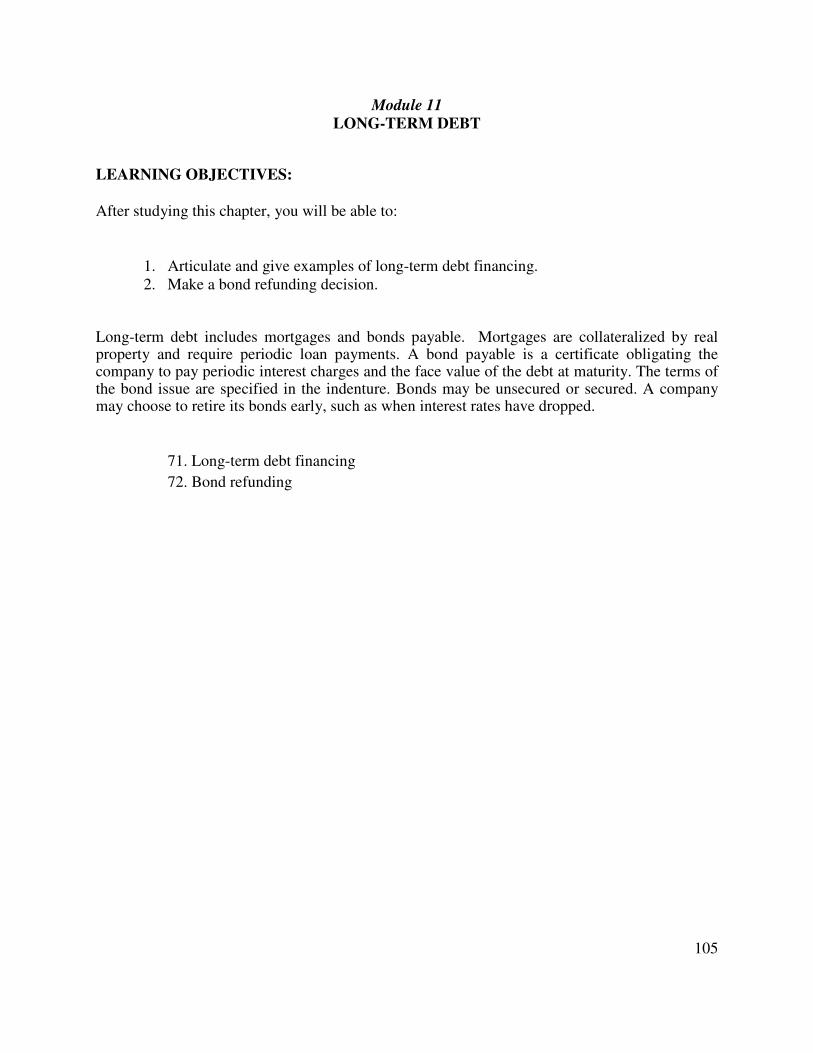
105
Module 11
LONG-TERM DEBT
LEARNING OBJECTIVES:
After studying this chapter, you will be able to:
1. Articulate and give examples of long-term debt financing. 2. Make a bond refunding decision.
Long-term debt includes mortgages and bonds payable. Mortgages are collateralized by real property and require periodic loan payments. A bond payable is a certificate obligating the company to pay periodic interest charges and the face value of the debt at maturity. The terms of the bond issue are specified in the indenture. Bonds may be unsecured or secured. A company may choose to retire its bonds early, such as when interest rates have dropped.
71. Long-term debt financing
72. Bond refunding
106
71
LONG-TERM DEBT FINANCING
OVERVIEW The characteristics, advantages, and disadvantages of long-term debt should be considered in financing a company. Mortgages: notes payable collateralized by real assets and requiring periodic payments
consisting of interest and principal. • The types of mortgages are: 1. senior mortgage (first claim on assets and earnings), and 2.
junior mortgage (subordinate lien). • Mortgage provisions include: 1. closed-end, in which the company cannot issue additional
debt of the same priority against the same property, and 2. open-end, in which the company can issue additional first-mortgage bonds against the property.
Advantages of mortgages: lower interest rates, extended maturity, and fewer financing
restrictions than other forms of long-term debt. Bonds payable: certificates documenting the loan of a specific sum of money that will be repaid
at a later date. • The indenture is a written agreement describing the features of the bond issue. If a
provision is violated, the bonds are in default. • Bonds are issued in $1,000 denominations and typically have maturities of 10 to 30 years. • The price of a bond depends on many factors, including interest rate, maturity date, and
collateral. • Interest equals nominal (coupon) interest rate x face value of bond x fraction of year
outstanding. (See Key 34.) Types of bonds:
• Debentures: unsecured debt that can be issued only by large, financially sound companies with superior credit ratings.
• Subordinated debentures: unsecured debt in which the claims of bondholders are subordinated to senior creditors.
• Mortgage bonds: bonds secured by real assets. • Collateral trust bonds: bonds secured by the issuer’s security investments (stocks or
bonds). • Convertible bonds: bonds that may be converted to stock at a future date. • Income bonds: bonds that pay interest only if the issuer has earnings. • Guaranteed bonds: bonds whose payment is guaranteed by a third party. • Serial bonds: bonds that mature in installments. • Deep discount bonds: bonds issued with very low coupons or at a price far below par
value. • Inflation-linked bonds. These bonds have coupons (and the principal amount as well)
that are adjusted according to the rate of inflation. The U.S. Treasury Inflation Protection Securities (TIPS) is an example.
• Zero Coupon Bonds. These bonds do not pay interest; the return to the holder is in the form of appreciation in price. Lower interest rates may be available for zero coupon bonds (and deep discount bonds) because they cannot be called.
• Floating (Variable)-Rate Bonds. The interest rates on the bonds are adjusted periodically to reflect changes in money market conditions (e.g., prime interest rate). These bonds are popular when future interest rates and inflation are uncertain.
• Eurobonds. Eurobonds are issued outside the country in whose currency the bonds are denominated. Dollar-denominated Eurobonds cannot be sold by U.S. issuers to U.S. investors. They may be sold only to foreign investors, because they are not registered with the SEC.
107
• Catastrophe (cat) bonds. These bonds are issued mostly by insurance companies to cover extraordinary losses.
• Put bonds. These bonds allow the holder to force the issuer to buy the bond back at a stated price.
A callable bond can be recalled by the issuer prior to maturity. A call provision is detrimental to the investor because the issuer can recall the bond when market interest rates decline. It is usually exercised only when a company wishes to refinance high-interest debt.
Advantages of issuing long-term debt: 1. interest is tax-deductible, while dividends are not, 2. bondholders do not participate in superior earnings of the company, 3. common stockholders’ interest and voting rights are not diluted, and 4. in an inflationary economy, the debt is repaid in cheaper dollars. Disadvantages of issuing long-term debt: 1. interest must be paid irrespective of corporate
earnings, 2. the principal on the debt must be repaid at the maturity date, 3. a higher debt position implies greater risk and a higher cost of capital, and 4. restrictive provisions may be placed on the company.
Suitability of debt financing: Debt financing is more appropriate when:
1. revenue and earnings are stable, 2. profit margin is satisfactory, 3. liquidity and cash flow are good, 4. debt/equity ratio is low, 5.stock prices are depressed, 6.
inflation is expected, and 7. indenture restrictions are not burdensome. • A company with financial problems may decide to refinance short-term debt on a long-term
basis, perhaps by extending the maturity dates of loans.
108
72
BOND REFUNDING
OVERVIEW Bonds may be refunded by the company prior to maturity either by the issuance of a serial bond or by exercising a call privilege on a straight bond. The issuance of serial bonds allows the company to refund the debt over the life of the issue. Call feature: When interest rates are expected to decline, a call provision in the bond issue that
enables the company to buy back the high-interest bond and issue a low-interest one is recommended. The timing of the refunding depends on expected future interest rates. • A call price is usually established in excess of the face value of the bond. The resulting call
premium equals the difference between the call price and the maturity value. • The call premium is generally equal to one year’s interest if the bond is called in the first
year; it declines at a constant rate each year thereafter. Bond refunding decision: The desirability of refunding a bond requires net present value
analysis, which involves the following steps: • Step 1. Calculate the initial outlay. • Step 2. Calculate the annual cash benefit of eliminating the old bonds through refunding. • Step 3. Calculate the annual cash outflow of issuing the new bonds. • Step 4. Calculate the annual net cash benefits (that is, difference between Step 2 and Step 3)
from the refunding decision. • Step 5. Calculate the present value of the annual net cash benefits. • Step 6. Calculate the refunding decision’s net present value (that is, difference between
Step 5 and Step 1).
109
Module 12
STOCK, CONVERTIBLES, AND WARRANTS
LEARNING OBJECTIVES: After studying this chapter, you will be able to:
1. Describe the process of investment banking. 2. Differentiate between public versus private placement of securities. 3. Identify and explain the role and rights of stockholders. 4. List and define the conditions and limitations of preferred stock 5. Explain the benefits and risks associated with common stock. 6. Clarify and elaborate on stock rights. 7. Identify and give examples of stock repurchases. 8. Describe and implement a process for margin trading. 9. Utilize short selling in a down trend market. 10. List and define governmental regulations. 11. Articulate the concept of an efficient market theory 12. Define and give examples of convertible securities. 13. Explain the uses of stock warrants.
Investment bankers act as the intermediary between companies issuing securities and investors buying them. Two types of stock may be issued to stockholders: preferred stock and common stock. Preferred stock has priority over common stock in the event of liquidation and the distribution of earnings; however, common stock benefits most if the company is successful. Convertible preferred stock or convertible bonds may be exchanged by the holder for common stock at a later date. A stock warrant gives the holder the option to purchase a specified number of shares of stock at a given price by a particular date.
73. Investment banking 74. Public versus private placement of securities 75. Stockholders 76. Preferred stock 77. Common stock 78. Stock rights 79. Stock repurchases 80. Margin trading 81. Short selling 82. Governmental regulation 83. Efficient market theory 84. Convertible securities 85. Stock warrants
110
73
INVESTMENT BANKING
OVERVIEW Investment banking concerns the public issuance of a security. The investment banker is the middleman between the issuing company and the investor. Functions of investment banking:
• Underwriting: buying a security issue, paying the issuer, and marketing the security. • Distributing: marketing the security issue. • Providing advice: advising the company on the terms and features of the issue as well as on
the best ways to raise funds. • Providing funds: furnishing funds to the issuing company during the distribution period.
Syndicate: group of investment bankers for a new, large, and/or risky issue.
• The investment banker who manages the syndicate and under-banker is limited to the terms of participation.
• In an undivided account, each member is liable for unsold securities up to the amount of its percentage participation regardless of the number of securities that investment banker has sold. The undivided type is the more common one.
Best efforts: The investment banker agrees to sell securities only on a best-efforts basis, or as an
agent for the company. • The investment banker is not acting as an underwriter and receives a commission only on
the sale of the stock. • This arrangement may be advisable when the investment banker has doubts about the
success of the securities offering.
111
74
PUBLIC VERSUS PRIVATE PLACEMENT OF SECURITIES
OVERVIEW Equity and debt securities may be issued publicly or privately. In a public issuance, securities are bought by the general public; in a private placement, the company issues securities directly to either one or a few large institutional investors. The institutional investors may be insurance companies, pension plans, commercial banks, etc. Consideration as to type to use:
• Nature and amount of financing • Cost • Marketability • Exposure
Advantages of private placement versus public issuance:
• Quicker access to funds • Lower costs for registering and selling the securities • Avoidance of SEC filing requirements • Avoidance of disclosure of information to the public at large • Possibility for small companies to issue securities to the public when handling such a
placement would not be profitable for an investment banker. Disadvantages of private placement versus public issuance:
• There is greater difficulty in obtaining significant amounts of money • Large institutional investors may scrutinize the company’s activities more closely and have
more stringent credit standards • Large institutional investors are more capable of obtaining voting control of the company.
112
75
STOCKHOLDERS
OVERVIEW Stockholders are the owners of a corporation. There are preferred and common stockholders. A stock certificate is the evidence of ownership and indicates the shares, par value, and registered owner. Rights of common stockholders:
• Have voting rights • Receive dividends • Receive remaining net assets upon dissolution of the company. • Entitled to preemptive right, allowing the stockholders to buy new shares before they are
issued to the public in order to maintain proportionate percentage ownership. • Have right to inspect the company’s books.
Characteristics: Stockholders share in the company’s financial success or failure since the
market price of the stock and future dividend payments will be affected. • Stockholders have limited liability and are not personally liable for the debts of the
company. • A company that publicly issues stock must abide by the regulatory requirements of the SEC
and applicable stock exchange.
113
76
PREFERRED STOCK
OVERVIEW Preferred stock is a hybrid security in that 1. it represents an equity investment in a firm, but 2. it has many of the features associated with a bond issue. Preferred stock is a class of capital stock that has preference over common stock in the event of corporate liquidation and in the distribution of earnings. Issuance: Preferred stock may be issued when the cost of common stock is high. The best time
to issue preferred stock is when the company has excessive financial leverage and an issue of common stock might create control problems.
Characteristics: Preferred stock dividends are limited to the fixed rate specified, which is based
on the total par value of the outstanding shares. See Key 59. • In liquidation, preferred stockholders are paid after bondholders and before common
stockholders. Preferred stockholders receive the par value of their shares, dividends in arrears, and the current year’s dividend. The residual remaining goes to common stock-holders.
Cumulative versus noncumulative preferred stock:
• Cumulative preferred stock: receives prior-year dividends, if they have not been paid, before common stockholders receive their dividends. Most preferred stock is cumulative.
• Noncumulative preferred stock: is not entitled to make up missed preferred dividends.
Participating versus nonparticipating preferred stock: • Participating preferred stock: preferred and common stockholders participate in excess
dividends if declared dividends exceed the amount normally given to preferred stockholders and common stockholders. Unless stated otherwise, the distribution of the excess dividends is based on the relative total par values. Example: If total par value of preferred stock and common stock are $50,000 and $150,000, respectively, excess dividends of $10,000 will be allocated as $2,500 to preferred and $7,500 to common stock in the ratio of 1/4 and 3/4.
• Nonparticipating preferred stock: preferred stock that does not participate in excess dividends. Most preferred stock is nonparticipating.
Advantages of Issuing preferred stock: 1. preferred stockholders cannot force the company
into bankruptcy, 2. preferred dividends do not have to be paid, whereas interest on debt must be paid, 3. preferred stock issuance does not dilute the ownership interest of common stockholders, 4. no collateral is required, whereas debt may require collateral, 5. preferred stockholders do not share in unusually high corporate earnings, and 6. a growth company may generate better earnings for its original owners by issuing preferred stock having a fixed dividend rate rather than by issuing common stock.
Disadvantages of Issuing preferred stock: 1. preferred dividends are not tax deductible, and 2.
preferred stock requires a higher yield than bonds because of the greater risk to the investor. Advantages of investing in preferred stock: 1. preferred stockholders have priority over
common stockholders if the company is declared bankrupt, and 2. preferred stock typically has a constant return in the form of a fixed dividend payment.
Disadvantages of investing in preferred stock: 1. if earnings are insufficient, the preferred
dividend may be bypassed in the current year, 2. return is limited because of the fixed dividend rate, and 3. because of the absence of a maturity date, greater price variability exists

114
with preferred stock than with bonds.
115
77
COMMON STOCK
OVERVIEW Common stock are equity shares issued by the company to its stockholders. Common stock shares:
• Authorized shares: maximum amount of stock that may be issued according to the corporate charter.
• Issued shares: the number of authorized shares that have been sold to the public. • Treasury shares: the number of previously issued shares that have been reacquired by the
company. • Outstanding shares: issued shares still held by the public. Outstanding shares equals issued
shares less treasury shares. Characteristics:
• Common stock is typically issued at a market price above par value. Par value is the stated amount per share on the stock certificates specified in the corporate charter.
• If debt is excessive, financing with equity is preferable. Calculations:
• A determination of the number of shares that must be issued to raise sufficient funds to meet the capital budget may be required. This equals the funds needed divided by the market price per share.
• The estimated price per share at which to sell securities for a new company equals:
Anticipated market value of the company Total shares outstanding
• The expected rate of return on stock equals:
0
1
P
D + g
where D1 dividends per share in the current year P0 = market price per share g = growth rate in dividends (assumed constant)
Advantages of issuing common stock: 1. there is no repayment date; 2. company can omit
dividend payment, 3. creates preemptive rights (see Key 78), and 4. improves debt/equity ratio.
Disadvantages of issuing Common stock: 1. dividends are not tax-deductible, 2. ownership
interest is diluted, 3. earnings and dividends are spread over more shares, 4. as more shares are issued, market price per share declines, and 5. the flotation costs of issuing common stock are higher than those for preferred stock or debt financing.
116
78
STOCK RIGHTS
OVERVIEW Stock rights represent the option to purchase securities at a specified price at a future date. The preemptive right provides existing stockholders with the first option to buy additional shares in the company. Exercising this right allows them to maintain voting control and protects against dilution in ownership and earnings. Ex rights or rights on: A rights offering has a date of record, which is the last day that the
receiver of the right must be the legal owner in the company’s stock ledger. • Ex rights: stocks are sold without rights 4 business days before the record date. • Rights on: stocks are sold with rights.
Characteristics of rights: The recipient of the rights can exercise them, sell them, or let them
expire. • The rights may be exercised for a given time period at a subscription price, established
somewhat below the going market price. Computations:
• After the subscription price has been determined, management computes the number of rights needed to buy one share of stock.
Shares to be sold = Amount of funds to be obtained
Subscription price
Rights per share =
Total shares outstanding
Shares to be sold
• Theoretically, the value of a right should be the same whether the stock is selling with rights on or with ex rights.
• When stock is selling with rights on, the value of a right equals:
Market value of stock with rights on — subscription price Number of rights needed to buy one share + 1
• When stock is traded ex rights, the market price is expected to drop by the value of the right.
The market value of stock trading ex rights should equal: Market value of stock with rights on less value of a right when stock is selling rights on
• The value of a right when stock is selling ex rights equals:
Market value of stock trading ex rights — subscription price Number of rights needed to buy one new share
117
79
STOCK REPURCHASES
OVERVIEW Treasury stock is previously issued shares that have been reacquired by the company, resulting in a reduction in outstanding shares. Financial effect of repurchase: because there are fewer outstanding shares:
• fewer dividends will be paid • earnings per share will increase (holding net income constant). • market price per share will increase because of the increase in earnings per share.
Advantages of stock repurchase:
• Treasury stock may be used for future acquisitions or stock options. • If there is extra cash temporarily, may be a management strategy instead of paying a higher
dividend that cannot be maintained. • If the price of the company’s stock appreciates considerably, the stock can later be resold to
the public at a significantly higher price. Disadvantages of treasury stock acquisition:
• If investors believe that the company is engaging in a repurchase plan because management does not have alternative attractive investment options, market price of the stock may drop.
• If the reacquisition of stock appears to be intentional company manipulation of the price of the stock, problems with the SEC may arise.
• If the Internal Revenue Service (IRS) finds that the repurchase is designed to avoid the payment of tax on dividends, tax penalties may be imposed on the improper accumulation of earnings.
118
80
MARGIN TRADING
OVERVIEW Margin trading involves buying securities on credit, a form of leverage that magnifies the gains and losses from a given percentage of price fluctuation in securities. Initial margin requirement: minimum percentage of the purchase price that a margin customer must pay in cash. This requirement is currently at least 50 percent of the current market value of the security. Some securities may not be purchased on margin. The stockbroker lends the margin purchaser the money, retaining custody of the stock as collateral.
• A 60% margin requirement means that 100 shares of a stock selling for $200 a share can be purchased by putting up only 60% of the total purchase price in cash, that is, $12,000, borrowing the remaining $8,000.
Maintenance margin requirement: minimum percentage equity an investor must maintain in a stock or bond purchased using borrowed funds. The New York Stock Exchange and the National Association of Securities Dealers both require a maintenance margin in margin accounts equal to 25% of the market value of securities. Many brokerage firms require more, typically 30%.
• Investors who have securities worth less than the maintenance requirement are subject to a margin call.

119
81
SHORT SELLING
OVERVIEW Short selling means a security that is not owned by the seller. This method has been used to gain from a fall in stock price. In short selling, the investor wants to sell the stock high, hoping to buy it back later at a lower price. If the stock price falls, the investor makes money; If the stock price rises, the investor loses money. Short sale requirements: the seller must maintain a margin account with a stockbroker because the government and the brokerage house want to ensure that the investor will be able to buy back the stock if the price suddenly rises.
• The Federal Reserve requires that an investor have in the account cash or securities worth at least 50 percent of the market value of the stock being sold short.
• A listed stock can be sold short only when the stock price has risen. On the other hand, stocks traded over-the-counter may be sold short at any time.
• While the short-seller normally pays no interest charge, proceeds from the sale must be kept in the brokerage account.
Short sale strategies: since selling short can be extremely risky, the investor is advised to use short-selling only in certain cases:
• Go short because you think the stock price is going to decline • Go short if you want to postpone making a gain and paying taxes on it from one year to
the next • Go short to protect yourself if you own the stock but for some reason cannot sell it.
Example: If you buy stock through a payroll purchase plan at the end of each quarter but do not get the certificates until several weeks later, it may make sense to sell your shares short to lock in the gain.
120
82
GOVERNMENTAL REGULATION
OVERVIEW When securities issued to the public must conform to federal and state laws. Federal regulations:
• Securities Act of 1933: deals with regulation of new security issues. According to the Act: 1. it requires the registration of securities before they are sold to the public, 2. adequate disclosure of information must be made in a prospectus so potential investors may adequately appraise the issue, and 3. false representations and disclosures are prohibited.
• Securities Exchange Act of 1934: deals with regulation of existing security transactions. According to the Act: 1. registration of securities listed on the stock exchanges is required and manipulation is prohibited, 2. periodic disclosure of important financial information is mandatory, 3. holdings and transactions of officers and directors must be disclosed; 4. individuals owning 10% or more of equity securities must be identified along with their holdings, and 5. rules regarding proxy voting and margin requirements are spelled out.
• Securities Act Amendments of 1975: defines SEC authority and market determination of broker’s commissions.
State regulations (“blue sky laws”): while state regulations may differ,
they typically: • protect investors from securities fraud • require registration of new stock or debt issues • require the disclosure of financial information about the securities issue.
121
83
EFFICIENT MARKET THEORY
OVERVIEW An efficient market is one in which the market price of a stock is identical to its real (intrinsic) value. In an efficient market, all data are fully and immediately reflected in price. A price change may be positive or negative. Weak form of efficient market: No relationship exists between prior
and future stock prices. • Independence exists over time between prices. • The value of historical information already lies in the current price. Therefore, reviewing
past prices (technical analysis) is unimportant. Semi-strong form of efficient market: Stock price immediately reflects
new information. • Action after a known event produces random results. • All public information is incorporated in a stock’s value. • Fundamental analysis (financial statement analysis) is not helpful in determining if a stock
is over- or undervalued. Strong form of efficient market: Stock prices reflect all information, public or private (insider).
• A perfect market exists. • No individual or group has sole access to information.
122
84
CONVERTIBLE SECURITIES
OVERVIEW A convertible security is one that may be exchanged for common stock by the holder according to agreed-upon terms. Examples are convertible bonds and convertible preferred stock. As the price of the underlying common stock increases, so will the price of the convertible security. Conversion statistics: The conversion ratio applies to the number of shares of stock the holder
of the convertible security receives when the conversion is made. Conversion ratio = Face value of convertible security
Conversion price • The conversion price is the effective price the holder pays for the common stock when the
conversion is effected. The conversion price is reduced by the percentage amount of any stock dividend or stock split so that the common stock shareholder maintains his or her proportionate interest.
• Conversion value of a security equals:
Common stock price x conversion ratio
• When a convertible security is issued, it is priced higher than its conversion value.
Conversion premium = Market value — conversion value
Conversion value
• If the market price of common stock declines, a conversion does not occur, creating a hung
security. Valuation: A convertible security is a hybrid one, with characteristics similar to both bonds
and common stock. • Investment value is the value of the convertible security, assuming it was not convertible
but had all its other attributes. • The conversion value applies to the value of common stock received at the time the bond or
preferred stock is converted. Advantages of convertibles: 1. acts as a sweetener in a debt or preferred stock offering, 2. may
pay a lower interest rate or preferred dividend yield. 3. is easier to market, 4. has less restrictive covenants, and 5. is a means of issuing common stock at a later date at a price higher than the current market price.
Disadvantages of convertibles: 1. the company will have to pay interest and principal on the
convertible bond if the conversion is not made because the market price of the common stock fails to appreciate, and 2. if the market price of common stock does increase, the company would have been better off financing through a regular issue of common stock because it must now issue stock at a higher price.
Financing strategy:
• If the market price of common stock is depressed, convertible debt may be issued if market
123
price of the common stock is expected to rise. • The issuance of convertible debt may be advisable when the company wants to leverage
itself in the short run but does not want to incur interest cost and pay principal in the long run.
• A convertible issue may be suggested for a growth company since the faster the growth rate, the earlier the conversion will take place.
A hybrid security: a security that combines elements of debt and of equity. One example is a convertible bond.
• Attractive for companies looking to procure equity-like capital without damaging their balance sheets and credit ratings. Hybrids are also highly cost-effective for issuers as they look like debt to investors, and coupon payments of such products can be treated as expense.
• Basket D security: the most popular hybrid among financial institutions (banks and insurance companies) Basket D is a reference to a point on Moody's debt-equity continuum scale that treats the hybrid as 75% equity and 25% debt.
124
85
STOCK WARRANTS
OVERVIEW A stock warrant is the option to buy a specified number of shares of stock at a stated price. To obtain the common stock, the warrant must be given up, along with the payment of the exercise price. Detachable versus nondetachable warrants:
• Detachable warrant: is sold separately from the bond with which it is associated. • Nondetachable warrant: is sold with its bond; both must be exercised simultaneously.
Characteristics:
• The issuing company typically receives funds for the warrants. • A holder of a warrant may exercise it by buying the stock or selling the warrant to other
investors or may continue to hold it. • Warrants typically expire on a specified date; however, some warrants are perpetual. • The exercise price of a warrant is usually fixed but is adjusted for stock dividends and
stock splits. • If the company’s stock price goes up above the option price, the warrant will be exercised.
Valuation: The value of a warrant equals: market price per share (exercise price x number of
shares that may be purchased through the exercise of the warrant.) • The formula (theoretical) value is typically below the current market price of the warrant
because the speculative appeal of a warrant allows the investor to obtain considerable leverage. The excess of the market price over its theoretical value is called a premium. The lowest amount that a warrant sells for is its theoretical value.
• The market value of a warrant depends on its convertibility into common stock. • A warrant typically has a higher value if: 1. there is a relatively long active period
remaining, 2. the dividend payment on the common stock is small, 3. the price of common stock is volatile, and 4. the common stock is listed on an exchange.
Advantages of warrants: 1. act as sweeteners for a debt or preferred stock issue, 2. allow bonds
to be issued at a lower interest rate, and 3. allow for balanced financing between debt and equity.
Disadvantages of warrants: 1. dilute common stock when exercised, 2. there is high risk of
losing the investment, 3. pay no dividends, and 4. have no voting rights.
Warrants versus convertible securities:
• The exercise of warrants generates funds for the company; exercise of convertibles does not.
• The exercise of warrants adds to stockholders’ equity with total liabilities remaining the same. On the other hand, the conversion of a bond increases stockholders’ equity and reduces total liabilities.
125
Module 13
BUSINESS COMBINATIONS
LEARNING OBJECTIVES:
After studying this chapter, you will be able to:
1. Differentiate between mergers and acquisitions. 2. Explain the uses and benefits of a holding company. 3. Explain how to implement tender offer.
There are different types of business combinations: vertical, in which a company combines with a customer or supplier; horizontal, in which two companies in a similar business combine; and conglomerate, in which two companies in unrelated industries combine. A merger may result in many benefits, including reducing risk through diversification, improving overall financial condition, and obtaining a tax loss carryforward benefit. A holding company has as its major objective owning other companies. In some cases, an acquiring company may buy another business by going directly to the stockholders and buying their shares.
86. Mergers and acquisitions 87. Holding company 88. Tender offer
126
86
MERGERS AND ACQUISITIONS
OVERVIEW A merger is the combination of two or more companies into one; only the acquiring company retains its identity. Types of business combinations:
• Vertical: a company combines with a customer or supplier. • Horizontal: two companies in a similar business combine. • Conglomerate: two companies in unrelated industries combine.
Mergers:
• Buyers may use various financing packages for mergers, including common stock, preferred stock, convertible securities, cash, debt, and warrants.
• The acquiring company often issues stock according to a specified exchange ratio. A stock trade represents a tax-free exchange.
• When there is an exchange of cash for common stock, the selling firm’s stockholders receive cash for their common stock, resulting in a taxable transaction.
Advantages of mergers: 1. diversification reduces risk, 2. there is a possible synergistic effect,
3. the company may obtain something it lacks, such as research capability 4. a company may improve financial condition by combining with another financially strong company, 5. a good return on the investment may occur when the market value of the acquired company is materially below its replacement cost, and 6. the acquiring company may obtain a tax loss carryforward benefit of the acquired company.
Disadvantage of mergers: 1. expected benefits (e.g., cost reductions) may not materialize, 2.
friction may arise between the management of both companies, 3. antitrust action may block or delay the merger, and 4. dissenting minority stockholders may cause problems.
Considerations in determining acquisition terms: 1. the effect on dollar earnings and its
growth rate which in turn impacts the P/E ratio, 2. dividends, 3. market price of the stock, 4. book value per share, 5. net working capital per share, and 6. liquidity.
Unbundling:
• Divestment: the partial or complete sale or disposal of physical and organizational assets, the closing of facilities and the reduction of the workforce.
• Divestiture: the partial or complete sale or disposal of a business unit, product line, subsidiary or division.
127
87
HOLDING COMPANY
OVERVIEW A holding company has the sole purpose of owning the stock of other businesses. Acquiring a small percentage of another company (e.g., 20%) may be sufficient to obtain a significant influence over the other, particularly when stock ownership is widely dispersed. Characteristics:
• A company in a declining industry may want to move out of its basic operations by liquidating assets and using the funds obtained to invest in other companies with growth potential.
• Because the operating companies held by the holding company are distinct legal entities, the obligations of any one are isolated from the others.
Advantages of holding company:
• There is risk protection in that the failure of one company does not cause the failure of the other companies of the holding company.
• The holding company cannot lose more than its original investment. • The holding company is able to acquire a large amount of assets with a small investment. • It is possible to gain control of another business by buying sufficient shares in the market
place. Disadvantages of holding company:
• A holding company usually is more costly to administer than a single company resulting from a merger because economies of scale typically do not arise.
• There is multiple taxation because the subsidiary pays taxes on its earnings and the holding company pays taxes on the distributed dividends it receives.
• The U.S. Department of Justice may consider the holding company a near-monopoly and force dissolution of some of the companies by disposal of stock.
• A financial leverage effect may occur through increased debt necessitated by the acquisition of other companies. This will magnify either earnings or losses.
128
88
TENDER OFFER
OVERVIEW A tender offer, usually in cash, is made by an acquiring company directly to stockholders of the company it wants to take over when the management of the target company does not want to be merged. Characteristics: Stockholders are induced to sell when the tender price significantly exceeds the current market price of the target common stock.
• Typically, there is an expiration date to the tender. • Good takeover candidates are cash-rich businesses and those with low debt/equity ratios.
Disclosure requirements:
• The acquiring company must notify management of the targeted company and the Securities and Exchange Commission of its intentions 30 days before making its tender offer.
• The name of the group providing the money for the acquisition must be disclosed when significant amounts of stock are purchased on the stock exchange.
• Because of the disclosure rules, competitions may arise in the takeover attempt. How to fight takeover attempts:
• Try to merge with a friendlier company. • Initiate legal action to block takeover attempt. • Furnish negative publicity about the raider. • Purchase treasury stock to make fewer shares available for tendering. • Give stockholders an attractive dividend to keep them happy.
129
Module 14
FAILURE, REORGANIZATION, AND INTERNATIONAL FINANCE
LEARNING OBJECTIVES:
After studying this chapter, you will be able to:
1. Execute and implement a voluntary settlement. 2. State how to file for bankruptcy and reorganization. 3. Discuss how to use derivatives (options and futures) to manage risk. 4. Outline the Black-Scholes option pricing model. 5. Discuss the financial risks associated with doing business globally.
A failing company may be able to arrange for a voluntary reduction in the amounts it owes creditors. However, creditors may insist upon a reorganization of the business if the company may get back on its feet. If things look hopeless, the company may be declared bankrupt and be liquidated. There are many signs of potential business failure, such as the Z score, that must be considered by creditors and investors.
89. Voluntary settlement 90. Bankruptcy and reorganization 91. Derivatives (options and futures) and risk management 92. The Black-Scholes option pricing model 93. International Finance
130
89
VOLUNTARY SETTLEMENT
OVERVIEW A voluntary settlement with creditors allows the company to save many of the costs of a bankruptcy. Such a settlement is done out of court. Characteristics:
• The voluntary settlement enables the company to continue or be liquidated and is initiated to allow the debtor firm to recover some of its investment.
• A creditor committee may allow the business to continue in operation if it is anticipated that the company will recover.
• Creditors may also continue to do business with the company. Extension: Creditors receive balances due over an extended time period. Current purchases are
made with cash. • Creditors may agree not only to lengthen the maturity date for payment but also to
subordinate their claims to current debt for suppliers providing credit in the extension period.
• Creditors anticipate that the debtor will be able to work out the company’s problems. • The creditor committee may require certain controls over the company, such as approval for
cash payments. • If certain creditors object to the extension, they may be paid immediately so they cannot
have the company declared bankrupt. Composition: voluntary reduction of the amount the debtor owes the
creditor. The creditor receives from the debtor a specified percentage of the obligation in full settlement of the debt. • The debtor continues to operate. • Court costs and the stigma of bankruptcy are eliminated.
Integration: a combined plan of extension, composition, and creditor control. Example: There may be a 10% cash down payment and five 10% future payments in the form of notes, for a total payment of 60%. The remaining 40% is forgiven. Advantages of negotiated settlement: 1. creditors usually wind up with more than in
bankruptcy, 2. settlement is less costly because it avoids or reduces legal fees, and 3. settlement is less formal and easier to implement than bankruptcy proceedings.
Disadvantages of negotiated settlement: 1. if the debtor continues in the business, there may be
a further decline in asset values, and 2. unrealistic small creditors may drain the negotiating process.
131
90
BANKRUPTCY AND REORGANIZATION
OVERVIEW When a company fails, it can either be reorganized or be dissolved depending upon the circumstances. In bankruptcy, liabilities exceed the fair market value of assets and there exists a negative real net worth. A company may also fail because of technical insolvency—an inability to satisfy current debt when due even though total assets exceed total liabilities. Possible reasons for business failure: 1. poor financial and operating management, 2. economic
downturn, 3. end of company life cycle, 4. loss of lawsuit, 5. overexpansion, and 6. catastrophe.
Bankruptcy and reorganization:
• If no voluntary settlement is agreed to for a financially distressed company, it may be put into bankruptcy by its creditors.
• A company may file for reorganization under which it will formulate a plan for continued life.
• Chapter 7 of the Bankruptcy Reform Act of 1978 outlines the procedures to be followed for liquidation.
• Chapter 11 describes the steps of reorganizing a failed business. • If reorganization is not possible under Chapter 11, the company will be liquidated in
accordance with Chapter 7. • Types of reorganization are voluntary, in which the company petitions for its own
reorganization, and involuntary, in which creditors file for an involuntary reorganization of the company.
Steps in reorganization:
1. A reorganization petition is filed under Chapter 11. 2. A judge approves the petition and either appoints a trustee or allows the creditors to
elect one to handle the disposition of the assets. 3. The trustee presents a reorganization plan to the court. 4. The plan is given to the creditors and stockholders for approval. 5. The debtor pays professional service fees in connection with the reorganization.
Liquidation due to bankruptcy: A firm that cannot be effectively reorganized is liquidated.
• In many cases, the proceeds from liquidation will be insufficient to pay off stockholders. • After claims have been paid, a discharge in bankruptcy occurs in which the court releases
the company from legitimate debts in bankruptcy. However, there may be certain debts immune to discharge.
• If a debtor has not been discharged within the previous 6 years or was not bankrupt because of fraud, the debtor may then start a new business.
Claim priority: The following rank order exists in meeting claims:
1. Secured claims: If the value of the secured assets is insufficient, the balance reverts to general creditor status.
2. Bankruptcy administrative costs: These include trustee, legal, and accounting. 3. Unsecured salaries and commissions: up to a limit per individual within the prescribed
time period. 4. Unsecured customer deposits: up to a limit. 5. Taxes due. 6. General creditor claims: claims by creditors who do not have collateral supporting the
amounts due. Examples: accounts payable and debentures.
132
7. Preferred stockholders. 8. Common stockholders
Z scores: forecasting business failures: Using a blend of the traditional financial ratios and a statistical method known as A multiple discriminant analysis (MDA), Edward Altman developed a bankruptcy prediction model. The model produces a Z score as follows: Z= 1.2*X1 + 1.4*X2 + 3.3*X3 + 0.6*X4 + 0.999*X5 where X1 = Working capital/Total assets X2 = Retained earnings/Total assets X3 = Earnings before interest and taxes (EBIT)/Total assets X4 = Market value of equity/Book value of debt X5 = Sales/Total assets Altman also established the following guidelines for classifying firms:
Z score Probability of failure
1.8 or less Very high 1.81 - 2.99 Not sure 3.0 or higher Unlikely
133
91
DERIVATIVES (OPTIONS AND FUTURES)
AND RISK MANAGEMENT
OVERVIEW: A derivative is a contract whose value is tied to the value of an underlying asset (e.g., foreign currency, market index, stock, debt security). Derivative can be used to reduce risk exposure such as that related to foreign exchange exposure. Speculators can attempt to obtain significant profit from price level changes or simultaneous price differences in different markets. Further, derivatives may be used to hedge a position so that an unfavorable price movement in one asset is offset by a favorable price movement in another asset.
Options: a contract to give the investor the right -- but not an obligation -- to buy or sell something. It has three main features. It allows you, as an investor to "lock in": 1. a specified number of shares of stock, 2. at a fixed price per share, called strike or exercise price, and 3. for a limited length of time.
Option terminology: Option definitions are as follows. 1. Amount. How much of the underlying asset is involved. 2. The seller of the option is referred to as the writer or grantor. 3. A call is an option to buy an asset, and a put is an option to sell an asset. 4. The exercise or strike price is the specified price for the underlying asset at which the option
can he exercised.
• At the money--exercise price equal to the spot price of the underlying asset.
• In-the-money--exercise price below the current spot price of the underlying asset, while in-the-money puts have an exercise price above the current spot price of the underlying asset. An option that would be profitable if exercised immediately is said to be in the money.
• Out-of-the-money--exercise price above the current spot price of the underlying asset, while out-of-the-money puts have an exercise price below the current spot price of the underlying asset. An option that would not be profitable if exercised immediately is referred to as out of the money.
5. The premium or option price: cost of the option.
Futures: a contract to purchase or sell a given amount of an item for a given price by a certain date (in the future--thus the name "futures market").
• Future markets can be used for both hedging and speculating.
An approach to risk management: Managing risks involve the following process:
• Identify the risks encountered by the company.
• Measure the potential impact of each risk.
• Decide how each relevant risk can be handled: transfer it to an insurance company or a third party.
• Buy derivative contracts to reduce risk.
• Totally avoid the activity that leads to the risk.
134
92
THE BLACK-SCHOLES OPTION PRICING MODEL
OVERVIEW The model provides the relationship between call option value and the five factors that determine the premium of an option's market value over its expiration value: 1. Time to maturity. The longer the option period, the greater the value of the option. 2. Stock price volatility. The grater the volatility of the underlying stock's price, the greater its value. 3. Exercise price. The lower the exercise price, the greater the value. 4. Stock price. The higher the price of the underlying stock, the greater the value. 5. Risk-free rate. The higher the risk-free rate, the higher the value. The model:
V = P[N(d1)] – PV(E) [N(d2)]
where V = Current value of a call option P = current stock price PV(E) = present value of exercise or strike price of the option, E
= E/ e-rt
r = risk-free rate of return, continuously compounded for t time periods e = 2.71828
t = number of time periods until the expiration date (For example, 3 months means t = 3/12 = 1/4 = 0.25) N(d) = probability that the normally distributed random variable Z is less than or equal to d σ
= standard deviation per period of (continuously compounded) rate of return on the
stock
d1 = ln[P/PV(E)]/σ t + σ t /2
d2 = d1 - σ t
The formula requires readily available input data, with the exception of σ2
, or volatility. P, X, r, and t are easily obtained. Implication of the option model: 1. The value of the option increases with the level of stock price relative to the exercise price [P/PV(E)], the time to expiration, and the time to expiration
times the stock's variability (σ t ). 2. Other properties: (a) The option price is always less than the stock price. (b) The option price never falls below the payoff to immediate exercise (P - E or zero, whichever
is larger). (c) If the stock is worthless, the option is worthless. (d) As the stock price becomes very large, the option price approaches the stock price less the
present value of the exercise price.
135
93
INTERNATIONAL FINANCE
OVERVIEW As the world becomes more integrated, the role of the multinational corporation (MNC) is increasingly significant. Although the basic concepts and techniques of finance are essentially the same, the financial manager of the MNC must have an understanding of the international environment in which it is operating. He/she must realize that international business operations are complex, diverse, and risky and require special understanding. The multinational corporation: Basic forms of the MNC are: 1. exporter, 2. licensing agreement--granting of a license to a foreign firm to use the MNC's technology, 3. joint venture--cooperative business partnership with a foreign firm, and 4. wholly owned foreign subsidiary. Foreign exchange rate: Although currencies can be supported by various means for short periods, the primary determinant of exchange rates is the supply of, and demand for, the various currencies. Under current international agreements, exchange rates are allowed to “float.” During periods of extreme fluctuations, however, governments and central banks may intervene to maintain stability in the market.
Special features: International environments that differ from domestic environments are:
• The international environment is more risky. In addition to normal business risk, the MNC is exposed to political risk and foreign exchange risk.
• It can be more profitable.
• It is more complex. The laws, customs, and economic environment of the foreign country may vary in many respects such as rates of inflation, tax rules, work ethics, and structure of financial markets and institutions.
Foreign investment decisions:
1. There are some reasons why companies move into international operations: a. Lower production costs. b. Ease of entry due to advanced technology. c. Profitable investment opportunities. d. Fear of import tariffs in foreign countries. e. Tax advantages. f. International diversification.
2. Foreign investments require analysis of foreign inflation prospects, political and exchange risk, and governmental restrictions on the remittance of cash flows. 3. The cost of capital may be higher for foreign investments since they are usually more risky.
a. Foreign exchange risk. It refers to the fact that exchange rates may fluctuate, increasing the possibility of experiencing a drop in revenue or an increase in cost in an international transaction.
b. Political or sovereign risk. It involves foreign ownership limitations, blockage of repatriation of earnings, and expropriation of the foreign subsidiary's assets.
136
4. The more uncertain or unfavorable a host country's investment climate, the higher the cost of the capital to the MNC.
Managing foreign exchange risk: There are three hedging strategies used to minimize transaction gains or losses.
a. Hedging in the forward exchange market. b. Hedging in the money market. c. Hedging in the currency futures market.
• Other options available to the MNC are to: a. Use currency swaps. b. Attempt always to transact in the home currency. c. Maintain monetary balance. d. Shift funds between countries.
Speculator: An individual who purposely accepts foreign exchange risk is a speculator. Speculators buy and sell foreign exchange in anticipation of favorable changes in rates.
137
GLOSSARY
accounts receivable turnover
Annual credit sales divided by average accounts receivable. acid-test ratio
The most liquid current assets (cash, marketable securities, and accounts receivable) divided by current liabilities. additional paid-in capital
Excess received from stockholders over par value of the stock issued. annual report
Evaluation prepared by companies at the end of the reporting year. annuity
Series of equal periodic payments or receipts. asset turnover
Sales divided by average total assets, revealing the efficiency of corporate assets in generating revenue. banker’s acceptance
Time draft drawn by a business firm whose payment is guaranteed by the bank’s “acceptance” of it. bankruptcy
Situation in which a firm’s liabilities exceed the fair value of its assets. beta
The variability in the price of a stock relative to the variability in a stock market index. bond
Written promise by a company to pay the face amount at the maturity date. book value per share
Worth of each share of stock per the books based on historical cost. break-even point
The level of sales where total costs equal total revenue. bridge loan
Short-term loan that is made in expectation of intermediate- or long-term loans. budget
Quantitative plan of activities and programs expressed in terms of assets, liabilities, revenues, and expenses. business cycle
Recurrence of periods of contracting and expanding economic conditions. callable bond
Bond issue with a call (buy back) provision. capital asset pricing model (CAPM)
Theory of asset pricing used to analyze the relationship between risk and rates of return in securities. capital budgeting
Process of making long-term planning decisions for capital investments. capital rationing
Selecting the mix of acceptable projects that provides the highest overall net present value of
138
future cash flows when a company has a limit on the budget for capital spending. capital structure
Composition of common stock, preferred stock, retained earnings, and long-term debt maintained by the business entity in financing its assets. cash flow
Cash receipts minus cash disbursements. common stock
Share evidencing equity ownership in a company. convertible security
Type of stock or bond that can be voluntarily converted into capital stock at a later date. cost of capital
Weighted average of the costs of debt and equity funds. coupon rate
Interest rate on the face amount of a debt security. credit line
Specified amount of money available to a borrower from a bank, usually for one year. current ratio
Current assets divided by current liabilities. debenture
Long-term debt instrument that is not secured by a mortgage or other lien on specific property. debt-equity ratio
Total liabilities divided by total stockholders’ equity. divestment
the partial or complete sale or disposal of physical and organizational assets, the closing of facilities and the reduction of the workforce. divestiture
the partial or complete sale or disposal of a business unit, product line, subsidiary or division. economic order quantity
Size that minimizes the sum of carrying and ordering costs. effective interest rate
Real rate of interest on a loan equal to the nominal interest divided by the proceeds of the loan. face value
Nominal amount of a debt obligation or equity security as stated in the instrument. factoring
Outright sale of a firm’s accounts receivable to another party (the factor) without recourse, which means the factor must bear the risk of collection. financial leverage
Portion of a firm’s assets financed with debt instead of equity. financial statement
Report containing financial information about a company. holding company
Corporation owning enough voting stock in another company to control its policies and management. indenture
Legal document that specifically states the conditions under which a bond has been issued, the
139
rights of the bondholders, and the duties of the issuing corporation. insolvency
Failure of a company to meet its obligations as they become due. inventory turnover
Cost of goods sold divided by average inventory. investment banker
Intermediary between an issuer of new securities and the investor. lease
Legal agreement whereby the lessee uses real or personal property of the lessor for a rental charge. leveraged buyout
Acquisition of one company by another, typically with borrowed funds. liquidity
Ability of current assets to meet current liabilities when due. lockbox
Box in a United States Postal Service facility, used to facilitate collection of customer remissions. maturity value
Amount to be paid on the maturity date of a financial instrument. nominal interest rate
Stated interest rate on the face of a debt security or loan. opportunity cost
Revenue forfeited by rejecting an alternative use of time or facilities. payback period
Length of time required to recover the initial amount of a capital investment. preferred stock
Class of capital stock that has preference over common stock in the event of corporate liquidation and in the distribution of earnings. present value
Current worth of future sums of money. prime interest rate
Interest rate charged by banks to their most financially sound customers. prospectus
Document that must accompany a new issue of securities. reorder point
Inventory level at which it is appropriate to replenish stock. safety stock
Extra units of inventory carried as protection against possible stockouts. stock option
Right given the holder to buy a specified number of shares of stock at a certain price by a particular date. stock right
Privilege giving current stockholders the first right to buy shares in a new offering, thus maintaining their proportionate ownership interest. stock split

140
Issuance of substantial amount of additional shares, thus reducing the par value of the stock on a proportionate basis. tender offer
Bid to buy stock of a company at a specified price (usually at a premium over the market price) to gain control of the company.
Related Documents