ACPD 8, 6313–6353, 2008 Aerosol particles and gases in savannah environment L. Laakso et al. Title Page Abstract Introduction Conclusions References Tables Figures Back Close Full Screen / Esc Printer-friendly Version Interactive Discussion Atmos. Chem. Phys. Discuss., 8, 6313–6353, 2008 www.atmos-chem-phys-discuss.net/8/6313/2008/ © Author(s) 2008. This work is distributed under the Creative Commons Attribution 3.0 License. Atmospheric Chemistry and Physics Discussions Basic characteristics of atmospheric particles, trace gases and meteorology in a relatively clean Southern African Savannah environment L. Laakso 1 , H. Laakso 1 , P. P. Aalto 1 , P. Keronen 1 , T. Pet¨ aj¨ a 1 , T. Nieminen 1 , T. Pohja 1 , E. Siivola 1 , M. Kulmala 1 , N. Kgabi 2 , M. Molefe 2 , D. Mabaso 2 , D. Phalatse 3 , K. Pienaar 4 , and V.-M. Kerminen 5 1 Department of Physics, University of Helsinki, P. O. BOX 64, 00014 Helsinki, Finland 2 Department of Physics, North-West University, Private Bag X 2046, Mmabatho, South Africa 3 Department of Biology, North-West University, Private Bag X 2046, Mmabatho, South Africa 4 School of Chemistry, North-West University, Private Bag X 6001, Potchefstroom, South Africa 5 Finnish Meteorological Institute, P.O. Box 503, 00101 Helsinki, Finland Received: 20 December 2007 – Accepted: 25 February 2008 – Published: 27 March 2008 Correspondence to: L. Laakso (lauri.laakso@iki.fi) Published by Copernicus Publications on behalf of the European Geosciences Union. 6313

Welcome message from author
This document is posted to help you gain knowledge. Please leave a comment to let me know what you think about it! Share it to your friends and learn new things together.
Transcript
ACPD8, 6313–6353, 2008
Aerosol particles andgases in savannah
environment
L. Laakso et al.
Title Page
Abstract Introduction
Conclusions References
Tables Figures
J I
J I
Back Close
Full Screen / Esc
Printer-friendly Version
Interactive Discussion
Atmos. Chem. Phys. Discuss., 8, 6313–6353, 2008www.atmos-chem-phys-discuss.net/8/6313/2008/© Author(s) 2008. This work is distributed underthe Creative Commons Attribution 3.0 License.
AtmosphericChemistry
and PhysicsDiscussions
Basic characteristics of atmosphericparticles, trace gases and meteorology ina relatively clean Southern AfricanSavannah environmentL. Laakso1, H. Laakso1, P. P. Aalto1, P. Keronen1, T. Petaja1, T. Nieminen1,T. Pohja1, E. Siivola1, M. Kulmala1, N. Kgabi2, M. Molefe2, D. Mabaso2,D. Phalatse3, K. Pienaar4, and V.-M. Kerminen5
1Department of Physics, University of Helsinki, P. O. BOX 64, 00014 Helsinki, Finland2Department of Physics, North-West University, Private Bag X 2046, Mmabatho, South Africa3Department of Biology, North-West University, Private Bag X 2046, Mmabatho, South Africa4School of Chemistry, North-West University, Private Bag X 6001, Potchefstroom, South Africa5Finnish Meteorological Institute, P.O. Box 503, 00101 Helsinki, Finland
Received: 20 December 2007 – Accepted: 25 February 2008 – Published: 27 March 2008
Correspondence to: L. Laakso ([email protected])
Published by Copernicus Publications on behalf of the European Geosciences Union.
6313

ACPD8, 6313–6353, 2008
Aerosol particles andgases in savannah
environment
L. Laakso et al.
Title Page
Abstract Introduction
Conclusions References
Tables Figures
J I
J I
Back Close
Full Screen / Esc
Printer-friendly Version
Interactive Discussion
Abstract
We have analyzed one year (July 2006–July 2007) of measurement data from a rel-atively clean background site located in dry savannah in South Africa. The annual-median trace gas concentrations were equal to 0.7 ppb for SO2, 1.4 ppb for NOx, 36 ppbfor O3 and 105 ppb for CO. The corresponding PM1, PM2.5 and PM10 concentrations5
were 9.0, 10.5 and 18.8µg m−3, and the annual median total particle number con-centration in the size range 10–840 nm was 2340 cm−3. Gases and particles had aclear seasonal and diurnal variation, which was associated with field fires and biolog-ical activity together with local meteorology. Atmospheric new-particle formation wasobserved to take place in more than 90% of the analyzed days. The days with no new10
particle formation were cloudy or rainy days. The formation rate of 10 nm particles var-ied in the range of 0.1–28 cm−3 s−1 (median 1.9 cm−3 s−1) and nucleation mode particlegrowth rates were in the range 3–21 nm h−1 (median 8.5 nm h−1). Due to high formationand growth rates, observed new particle formation gives a significant contribute to thenumber of cloud condensation nuclei budget, having a potential to affect the regional15
climate forcing patterns.
1 Introduction
Air quality and interactions between land ecosystems and atmosphere in a changingclimate are issues that influence most of the developing world. In Africa, for exam-ple, changing climate affect vegetation and may thereby cause emigration (Boko et al.,20
2007). Emigration, on the other hand, increase urban population and air pollution. Al-though most of the population accumulates into urban areas, air quality is affected alsoby the surrounding landscape. One spectacular example of this are the intensive dustepisodes related to the Kosa desert in Asia, increasing occasionally PM10 concentra-tions up to values of about 1000µg m−3 (Mori et al., 2002). For that reason, studying25
the air quality and anthropogenic influences in urban areas requires also knowledge
6314
ACPD8, 6313–6353, 2008
Aerosol particles andgases in savannah
environment
L. Laakso et al.
Title Page
Abstract Introduction
Conclusions References
Tables Figures
J I
J I
Back Close
Full Screen / Esc
Printer-friendly Version
Interactive Discussion
about the natural conditions, and in contrast, urban and industrial plumes may havean adverse effect on vegetation even far a way from the source of emissions. Further-more, vast areas of even sparse vegetation may contribute significantly to the globalatmospheric chemistry (Guenther et al., 1996) and, via the formation of new aerosolparticles, to the properties of clouds and global radiation balance (Went, 1960; Kurten5
et al., 2003; Kerminen et al., 2005).Africa is one of the least studied continents in the World with respect to air quality
(Laakso et al., 2006). Aerosol measurements have been made mainly in equatorialAfrica (Andreae et al., 1992; Afeti et al., 1998; Gatari et al., 2005), with the main in-formation coming from the SAFARI-92 and SAFARI 2000 campaigns conducted in the10
southern parts of Africa (Swap et al., 2003 and references therein). The main findingsfrom the SAFARI-92 campaign were (1) that the anticyclonic circulation links all theenvironments in southern Africa, (2) that in addition to biomass burning, there are sev-eral other sources of trace gases and aerosol particles in Africa, and (3) that a largefraction of smoke and haze is transported southward from lower latitudes. In the SA-15
FARI2000 campaign the focus was in biomass burning plumes due to the exceptionalweather conditions. The published results concentrate on the optical and radiative ef-fects of such plumes, including aerosol-cloud interactions (Ross et al., 2003), as wellas pollutant emissions from vegetation and fires. In addition to result from the SA-FARI campaigns, there is a great deal of publications about VOC emissions from entire20
savanna, and individual tree species (e.g. Guenther et al., 1996; Otter et al., 2003).Currently, there are also several different studies in the framework of African MonsoonMultidisciplinary Analyses (AMMA) from Western and Central Africa (e.g. Caminadeand Terray, 2006) but, to our knowledge, no articles based on aerosol observationshas been published yet.25
Despite some previous observations, combined long-term measurements of tracegas concentrations, aerosol particle mass concentrations and number size distributions(especially in ultrafine size range), air ion number size distributions and meteorologicalvariables are practically non-existent. Also the exposure of people in Africa to air pollu-
6315
ACPD8, 6313–6353, 2008
Aerosol particles andgases in savannah
environment
L. Laakso et al.
Title Page
Abstract Introduction
Conclusions References
Tables Figures
J I
J I
Back Close
Full Screen / Esc
Printer-friendly Version
Interactive Discussion
tants in informal settlements, heavily-industrialized areas and mining regions is poorlyknown (Pikketh et al., 2005; Kgabi, 2006).
In order to get a more detailed picture on various aerosol and related trace gasproperties in southern Africa, we built a transportable measurement trailer (Petaja etal., 2007). The trailer is currently located in a game reserve in a savannah environment5
away from local pollution sources. Later we will place the trailer in a populated miningregion, in an industrial area and in a suburban residential background for one year ineach location. Although the meteorological variability from year to year hampers thecomparison of measurement results between the different environments, we aim tocharacterize air quality in these environments and to investigate reasons for observed10
differences. In this paper, we will describe the measurement site and observationalprocedures and present a general overview of the measurement results from the period23 July 2006 to 23 July 2007.
2 The measurement site and characteristics
2.1 The location15
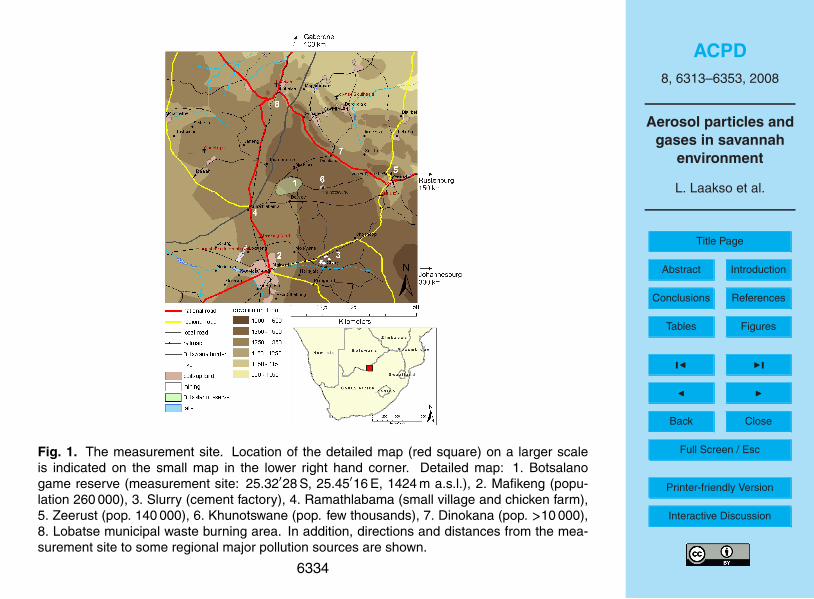
The measurement site considered here is the Botsalano game reserve in North-WestProvince, South Africa (Fig. 1). The reserve is located in a clean background siteabout 50 km north of the nearest city, Mafikeng, with approximately 260 000 inhabitants.One of the large regional pollution sources in North-West Province, the Rustenburgmining region, is located approximately 150 km east of Botsalano (Pikketh et al., 2005).20
Rustenburg is one of the main platinum group metal mining and metallurgical extractionregions in South Africa. Such activities create significant sulphate emissions becauseplatinum-group metals are often connected with sulphides. The capital of Botswana,Gaborone, is approximately 100 km north of Botsalano. Other potential nearby sourcesaffecting the site are shown in Fig. 1.25
6316
ACPD8, 6313–6353, 2008
Aerosol particles andgases in savannah
environment
L. Laakso et al.
Title Page
Abstract Introduction
Conclusions References
Tables Figures
J I
J I
Back Close
Full Screen / Esc
Printer-friendly Version
Interactive Discussion
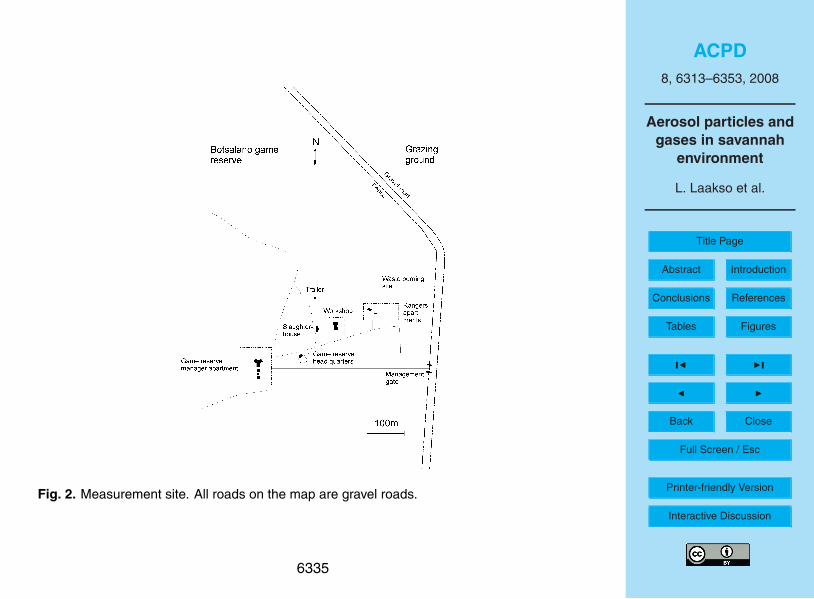
The neighborhood of the measurement trailer is shown in Fig. 2. All the buildingsin the park are heated by electricity. The apartments of rangers and that of managersaccommodate eight and one person, respectively. The workshop of the game reserveis used mainly during the mornings between 06:00 and 08:00 local time, whereas theslaughter house is used only few times per year during the hunting season. The waste5
burning site is used approximately twice a week for a short period, mainly during theafternoon. Game, mainly antelopes, giraffes, rhinoceros and other herbivores, go freelythroughout the reserve. On the savanna grazing ground outside the game reserve,there are sporadically cows and other livestock.
The traffic on the gravel road outside the fence is sparse, totaling a few tens of cars10
per day. The traffic rate between the management gate, workshop and head quartersis less than 20 cars per day. The road next to the trailer is used a few times per day inmaximum.
2.2 Synoptic scale meteorology in Botsalano
The Botsalano game reserve is dry bushveld. The annual precipitation amount, of15
which approximately 60% comes during the summer, is 540 mm year−1. Typical wintertemperatures vary between 4 and 20◦C, the summer temperatures being between 17and 31◦C (South African weather service, 2007).
The seasons in the region are clearly defined and each of them lasts for a periodof approximately three months. The autumn, characterized by relatively high temper-20
atures and relative humidity, lasts from February until April. The winter (May–July)has low temperatures, relative humidities and wind speeds. The spring (August–October) is characterized mainly by low relative humidities, whereas during the summer(November–January) high relative humidities and temperatures together with frequentprecipitation are typically encountered.25
The large-scale meteorology in the region is characterized by a high degree of sta-bility and anticyclonic circulation (Tyson et al., 1996). Due to the limited vertical mix-ing, the atmosphere is layered, containing clean and polluted horizontal cells (Hobbs,
6317
ACPD8, 6313–6353, 2008
Aerosol particles andgases in savannah
environment
L. Laakso et al.
Title Page
Abstract Introduction
Conclusions References
Tables Figures
J I
J I
Back Close
Full Screen / Esc
Printer-friendly Version
Interactive Discussion
2003). The limited vertical mixing, together with high stock heights and anticycloniccirculation, results frequently to a situation in which air masses are contaminated atleast to a certain degree, either by industrial sources or by biomass burning. In somecases, air can re-circulate over the sub-continent up to 20 days (Tyson et al., 1996).
2.3 Vegetation5
The vegetation of the reserve is fairly homogeneous, consisting of the species of Aca-cia, Rhus, Ziziphus, Vitex and Grewia as the dominant trees or shrubs typical of asavanna biome. Other tree or shrubby species include Euclea undulata, Ozoroa pan-iculosa, Ximenia caffra and Tarchonanthus comphoroides.
The typical grass species found in this mixed bushveld vegetation include for exam-10
ple Themeda triandra, Cymbopogon plurinoides, Aristida spp., Eragrostis spp., Het-eropogon contortus, Schmidtia pappophoroides, Echinochloa sp., Cynodon dactylon,Melinis repens, Elionurus argenteus and Panicum spp.
The herbaceous layer include Hypoxis hemerocallidea, Alternanthera pungens,Nidorella resedifolia, Lippia scaberrina, Commelina livingstonii, Jatropha zeyheri,15
Hermbstaedtia adorata, Aerva leucura, as well as species of Ophrestia, Cucumis,Solanum and Hibiscus.
Based on the earlier studies, savanna trees like Acacia emits significant amount ofisoprene and monoterpenes (e.g. Guenther et al., 1996). Biogenic emissions fromother types of vegetation in savannah, such as grass and herbs, are not well known.20
3 Measurements and methods
Air quality monitoring instruments were mounted into an air-conditioned Eurowagon4500 U trailer (length 4.5 m, width 2.1 m, height 2.3 m, weight 2500 kg). The aim ofthe trailer is to be a self-sufficient and transportable monitoring station. Only prereq-uisites are three-phase power and periodical maintenance of the instruments. Data25
6318
ACPD8, 6313–6353, 2008
Aerosol particles andgases in savannah
environment
L. Laakso et al.
Title Page
Abstract Introduction
Conclusions References
Tables Figures
J I
J I
Back Close
Full Screen / Esc
Printer-friendly Version
Interactive Discussion
is downloaded automatically every day to a server via GRPS-modem. This enablesintermittent supervision of the performance of the trailer instruments remotely.
The instrumentation, technical solutions and calibrations are discussed in detail byPetaja et al. (2007), so here we summarize them only briefly and present only primeinformation in Table 1.5
Sub-micron aerosol number size distribution was measured with a Differential Mobil-ity Particle Sizer (DMPS, Aalto et al., 2001) in the size range from 10 to 840 nm. Thesample was drawn through a Digitel PM2.5 inlet. Prior sizing the particles were driedwith a Nafion-drier and then brought to a known charging state with a Ni-63 beta-activeneutralizer. The particles were classified with a Vienna-type (length 0.28 m) Differen-10
tial Mobility Analyzer (Winklmayr et al., 1991) and counted with a TSI CondensationParticle Counter (CPC) model 3010. Time resolution of the system is 7.5 min.
Concentration of air ions and charged aerosol particles were measured with a AirIon Spectrometer (AIS, Airel Ltd, Estonia, Mirme et al., 2007). The instrument is a amulti-channel, parallel-principle device, measuring simultaneously ion concentrations15
in 27 mobility fractions of both positive and negative ions. It has two identical cylindricalaspiration-type DMAs, one for each polarity. A radial electrical field separates naturallycharged particles (cluster ions and aerosol particles) which are then deposited on dif-ferent electrodes on the outer core of the DMA depending on their electrical mobility.There are 21 insulated collector electrodes on each of the DMAs. The current carried20
by the collected ions are amplified and measured. The concentration of ions with mo-bilities between 0.0013 to 3.2 cm2 V−1 s−1 are monitored. The corresponding diameterrange of singly-charged particles is approximately from 0.4 to 40 nm using modifiedMillikan formula (Tammet, 1995, 1998). Time resolution is 5 min.
Suspended aerosol mass concentrations were monitored with a Tapered Element25
Oscillating Microbalance (TEOM) model 1400a (Rupprecht and Patashnick R&P, Co.Inc.). The sample was drawn to the system via a Thermo Andersen PM10 inlet througha custom made inlet switcher. This switcher alternated between three operation modesenabling consecutive measurements of mass concentrations of PM10, PM2.5 and PM1.
6319
ACPD8, 6313–6353, 2008
Aerosol particles andgases in savannah
environment
L. Laakso et al.
Title Page
Abstract Introduction
Conclusions References
Tables Figures
J I
J I
Back Close
Full Screen / Esc
Printer-friendly Version
Interactive Discussion
In practice a linear motor changed between a straight tube (for PM10), a PM2.5 cycloneor a PM1 cyclone in the sampling line. This configuration enabled us to monitor all rel-evant mass fractions with a single TEOM-instrument with a three hour time resolution.Values for each mass corresponds 20 last min (or 4 last measurement points) for eachinlet position, since instrument stabilization takes approximately 40 min after each inlet5
mode change.Gaseous pollutants (SO2, NOx, CO and O3) were monitored in one minute time
resolutions with a set of gas analyzers sharing a PTFE-sampling line. Sulfur dioxidewas measured with Thermo-Electron 43S, NOx with a Teledyne 200AU, CO using aHoriba APMA-360 and ozone with a Environnement s.a. 41A gas analyzer. The gas10
data was corrected based on on-site calibrations done in April 2006, May 2007 andOctober 2007.
Local meteorological parameters (temperature, relative humidity, wind speed anddirection, photosynthetically available radiation (PAR) and amount of precipitation werelogged in one minute time resolution. The meteorological instruments were mounted15
on a mast located on the roof of the trailer.All the instruments were checked and maintained weekly, and a full service was
made approximately every three months.Power in Botsalano game reserve was taken with a 100 m long on-ground cable from
the workshop.20
The data analyses were carried out using MATLAB scripting language with atrailer plot period.m, which automatically filters out questionable data. Such valueswere recorded quite often after frequent electricity breaks. For the same reason, weused median values instead of means in our subsequent data-analysis. Furthermore,all the gathered data were checked visually to make sure that the bad data points were25
excluded.The number size distributions acquired with the DMPS-system were the basis of this
classification yielding separate datasets for new particle formation events, non-eventsand undefined days depending on whether new particle formation was observed or not
6320
ACPD8, 6313–6353, 2008
Aerosol particles andgases in savannah
environment
L. Laakso et al.
Title Page
Abstract Introduction
Conclusions References
Tables Figures
J I
J I
Back Close
Full Screen / Esc
Printer-friendly Version
Interactive Discussion
in the DMPS measurement data. The classification was done according to Dal Masoet al. (2005). Also ion measurement data from the AIS were classified in a similar way,and we used the AIS data to support the event classification when the DMPS data notavailable. We calculated formation rate of the smallest detectable particles of 10 nmdiameter (J10) and the particle growth rate (GR) in size range 10–25 nm from DMPS5
size distributions using the method of Dal Maso et al. (2005).In addition to the continuous measurements described in Table 1, we measured spo-
radically volatile organic compounds (VOC’s) and the chemical composition of aerosolparticles in PM10, PM2.5 and PM1 samples. In August 2007, a new DEBITS-site wasstarted next to the trailer (http://www.igac.noaa.gov/DEBITS.php). DEBITS measure-10
ments cover deposition of several biologically important compounds.
4 Results and discussions
4.1 Annual behaviour of meteorology, trace gases and aerosol particles
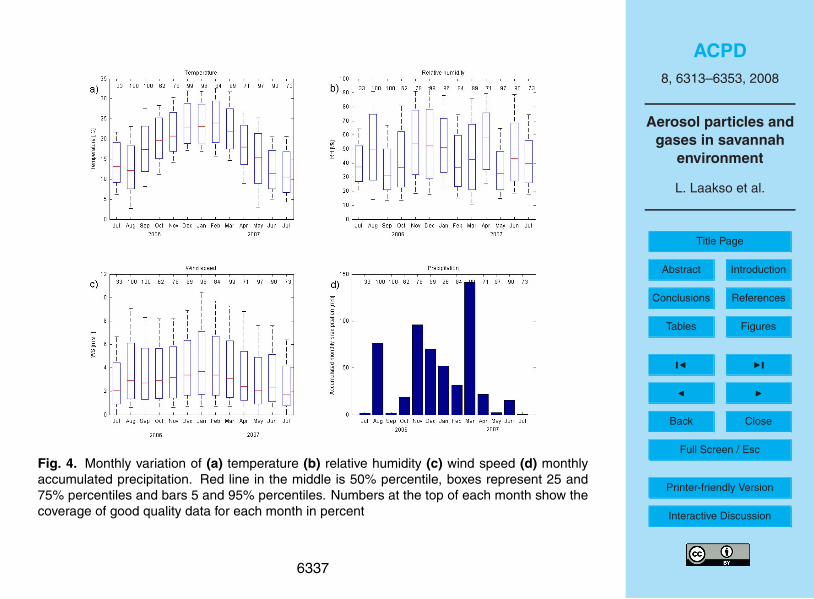
The monthly statistics of local meteorological variables are shown in Fig. 4. As canbe seen, the monthly-median temperature varied by less than 15◦C over a course of15
a year. Freezing temperatures below 0◦C were encountered only during a couple ofnights during the measurement period. In summertime temperatures were relativelyfrequently in the range 25–30◦C and reached occasionally values in excess of 35◦C.The relative humidity was quite low with typical monthly-median values in the range30–60%. Highest average relative humidities were typically detected during the months20
with most frequent precipitation. The winds speed had a clear seasonal trend, being it’shighest during the summer months. Most of the precipitation came during the summer.
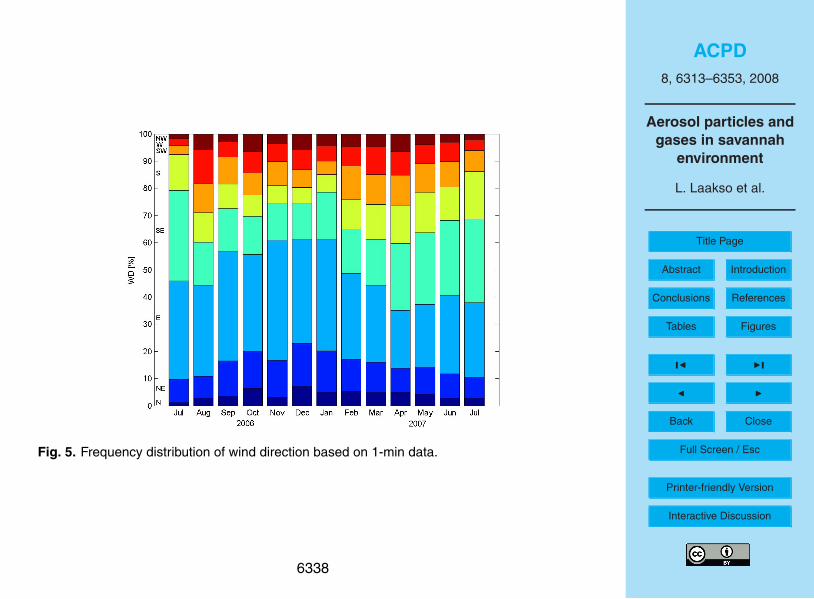
The seasonal variation of wind direction is shown in Fig. 5. During all seasons,wind was coming most often from the Eastern (NE, E, and SE) sector. As discussedearlier in this paper, this is the sector where we can assume most of the anthropogenic25
pollution originates from.
6321
ACPD8, 6313–6353, 2008
Aerosol particles andgases in savannah
environment
L. Laakso et al.
Title Page
Abstract Introduction
Conclusions References
Tables Figures
J I
J I
Back Close
Full Screen / Esc
Printer-friendly Version
Interactive Discussion
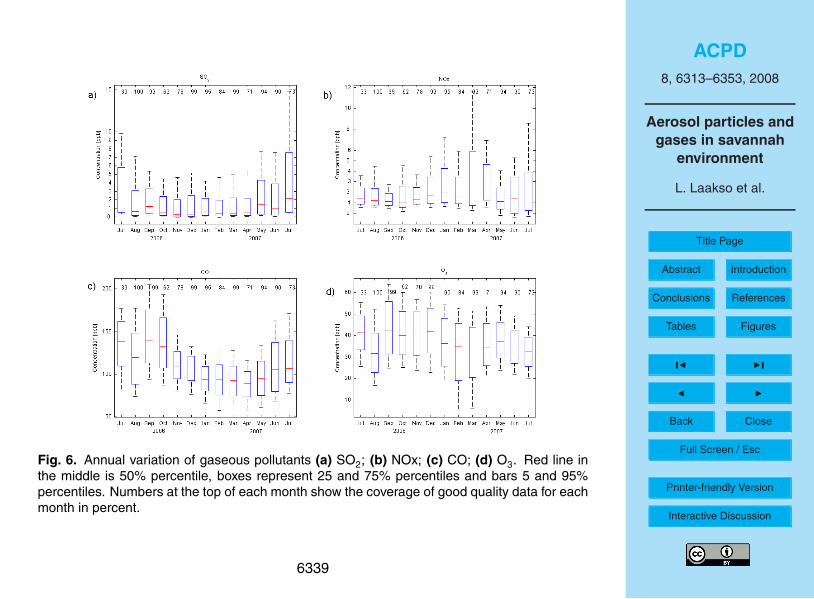
The monthly-median SO2 concentrations were typically in the range 0.5–2 pbb withan annual median equal to 0.7 ppb (Fig. 6a). The highest SO2 concentrations exceeded10 ppb. Sinha et al. (2003) measured SO2 using an aircraft in August–September dur-ing the SAFARI2000 campaign. Their SO2 concentrations were higher than thoseobtained by us, possibly because the SAFARI flights were closer to the mining and in-5
dustrial area of Rustenburg and Johannesburg. SO2 concentrations over the full annualcycle have been measured in only a few regional locations in Africa, including the sitesElandsfontein (annual median equal to 7 ppb) and Cape point (0.3 ppb) in South-Africa(Carmichael et al., 2003). The annual median SO2 concentration measured in equa-torial and northern Africa are substantially lower (<0.1 ppb). Overall, most regional10
background sites in the World show annual median SO2 concentrations less than 1ppb (Carmichael et al., 2003).
The monthly-median NOx concentration varied between 1 and 2.5 ppb with an annualmedian equal to 1.4 ppb (Fig. 6b). The highest values were measured during the localautumn (March–April). These concentrations are comparable to those observed over15
mid-latitude continental areas and substantially larger than those found typically overthe southern oceans (Levy et al., 1999).
The carbon monoxide concentration had a clear seasonal trend with elevated valuesobserved during the late winter and spring (Fig. 6c). The most probable reason forthe elevated CO concentration during the driest months were the regional bush fires20
and possibly more distant biomass burning sources. The monthly-median CO con-centrations varied from about 90 ppb in April up to about 140 ppb in September, theannual median value being equal to 104 ppb. These values are similar to those mea-sured by Sinha et al. (2003) during the SAFARI2000 campaign but roughly twice thosemeasured annually at Cape Point, South Africa (Duncan et al., 2007). Overall, CO25
concentrations comparable to our measurements have been reported for continentalEurope, North America and Asia (Holloway et al., 2000; Duncan et al., 2007).
The monthly-median ozone concentrations shown varied between 30 and 42 ppband had an annual median of 36 ppb (Fig. 6d). These values are similar to those
6322
ACPD8, 6313–6353, 2008
Aerosol particles andgases in savannah
environment
L. Laakso et al.
Title Page
Abstract Introduction
Conclusions References
Tables Figures
J I
J I
Back Close
Full Screen / Esc
Printer-friendly Version
Interactive Discussion
reported by Sinha et al. (2003) and comparable to those measured in various conti-nental surface sites at mid and low latitudes (Scheel et al., 1997; Solomon et al., 2000;Carmichael et al., 2003). Noteworthy in our data is the rather weak seasonal variationof the ozone concentration. In most surface sites, the annual cycle of monthly-medianozone concentration is above 15 ppb (e.g. Scheel et al., 1997; Helmig et al., 2007).5
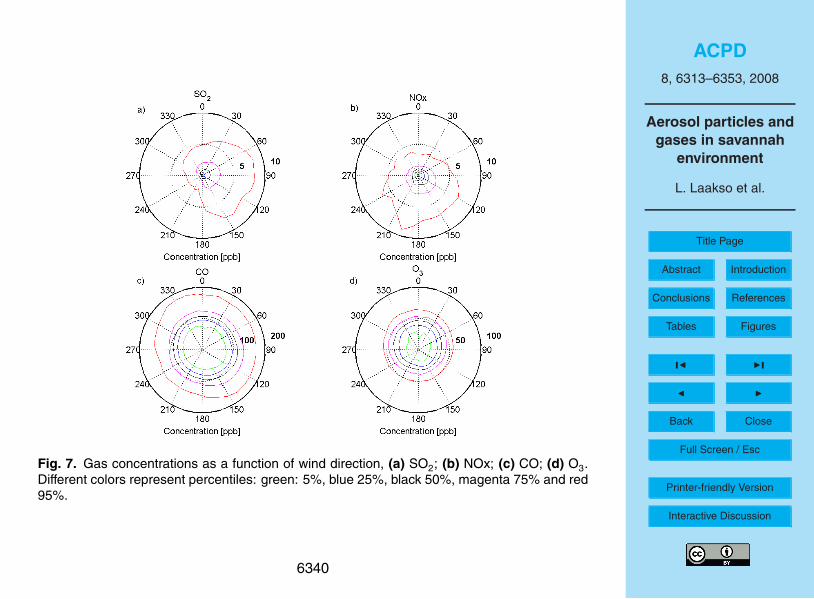
Figure 7 shows the measured trace gas concentrations as a function of the localwind direction. We may instantly see that the highest SO2 concentrations were alwaysassociated with easterly winds bringing heavily-polluted air from the Rustenburg min-ing region approximately 150 km east of Botsalano. During westerly winds SO2 con-centrations were very low, typically around 0.5 ppb or less. The NOx concentrations10
were highest when the wind blew from the direction of Mafikeng. The CO concentra-tions were more homogeneously distributed between the different wind directions, eventhough a minor increase in the CO concentrations due in NE to E directions could beaddressed to the nearby villages of Khunotswane and Dinokana. In contrast to SO2and NOx, ozone did not have any significant dependence on the wind direction.15
The relatively even distributions of the CO and O3 concentrations between the dif-ferent wind sectors is probably attributed to the fact that these pollutants are mostly ofsecondary origin and their formation is due to a combination of several primary pol-lutants and meteorological conditions. O3, for example, results from VOC and NO2,whereas CO originates from the oxidation of biogenic hydrocarbons, soil, termites and20
vegetation (Finlayson-Pitts and Pitts, 2000; Holloway et al., 2000). The North-Eastsector was somewhat elevated for CO probably due to fires at lower latitudes.
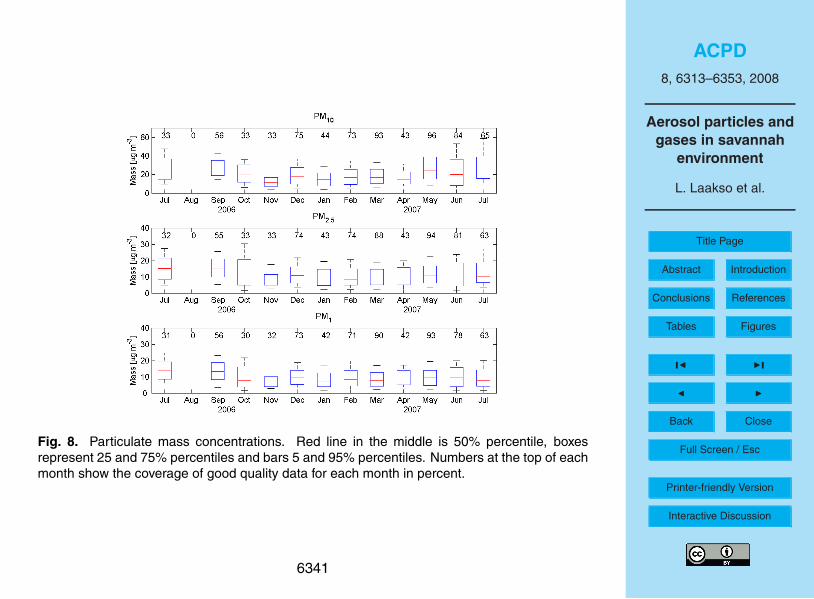
Figure 8 shows the monthly statistics of measured PM1, PM2.5 and PM10 concen-trations. Similar to the CO data, the highest concentrations were observed during thelate winter, especially for PM1 and PM2.5. The PM10 concentration increased earlier25
during the winter (May–July 2007), being indicative of the presence of coarse dustparticles from deserted areas (e.g. Kalahari) during that period of the year. Annual me-dian concentrations of PM1, PM2.5and PM10 were equal to 9.0, 10.5 and 18.8µg m−3,respectively. These values are comparable to those observed in rural or continental
6323
ACPD8, 6313–6353, 2008
Aerosol particles andgases in savannah
environment
L. Laakso et al.
Title Page
Abstract Introduction
Conclusions References
Tables Figures
J I
J I
Back Close
Full Screen / Esc
Printer-friendly Version
Interactive Discussion
background locations in Europe and Northern America (Brook et al., 1997; Eldred etal., 1997, Van Dingenen et al., 2004).
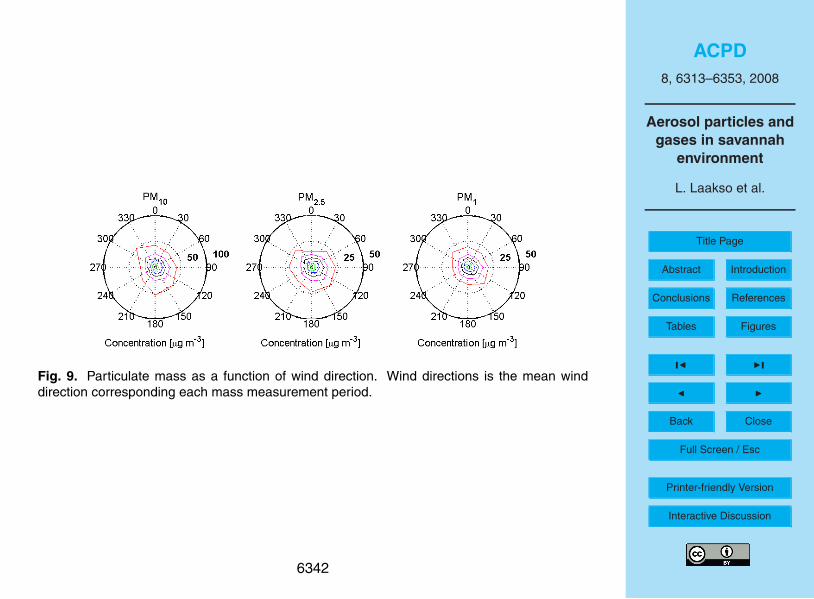
Figure 9 shows the relation between the particle mass concentrations and wind di-rection. We see that the 95% percentile of PM10 is somewhat elevated in the North-West and South-East sectors, the former being probably due to the dust from Kalahari5
and the latter due to activities in the direction of game park management gate andworkshop (Fig. 2). Measured PM2.5and PM1 concentrations were relatively equallydistributed between the different wind sectors.
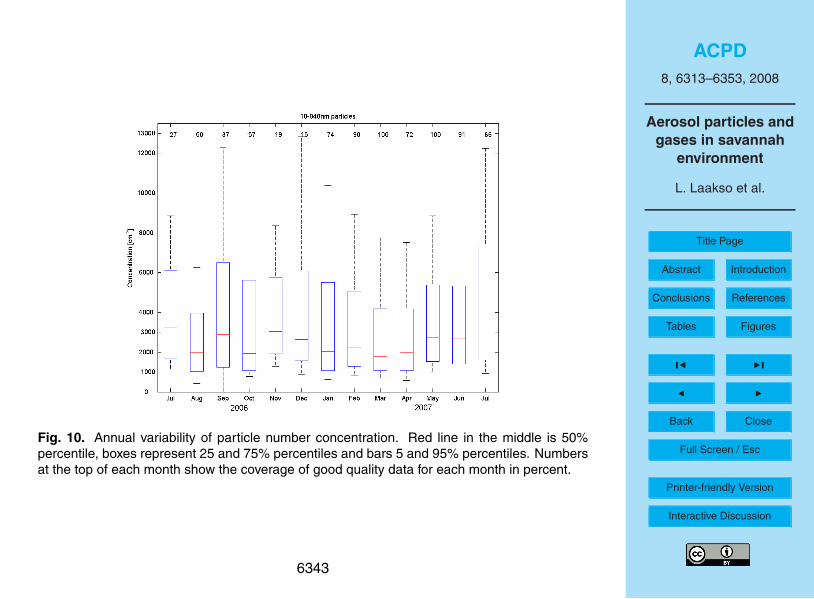
The total particle number concentration in the size range 10–840 nm (Fig. 10) hadan annual median of 2340 cm−3 with no clear seasonal trend. The monthly-median10
values were typically between 2000 and 3500 cm−3. The highest particle number con-centrations were due to daytime new-particle formation events discussed in more de-tail in Sect. 4.3. The values shown here compare relatively well to those by Sinha etal. (2003), the differences being probably due to the combined effects different mea-sured size range and new-particle formation. The measurement flights by Sinha et15
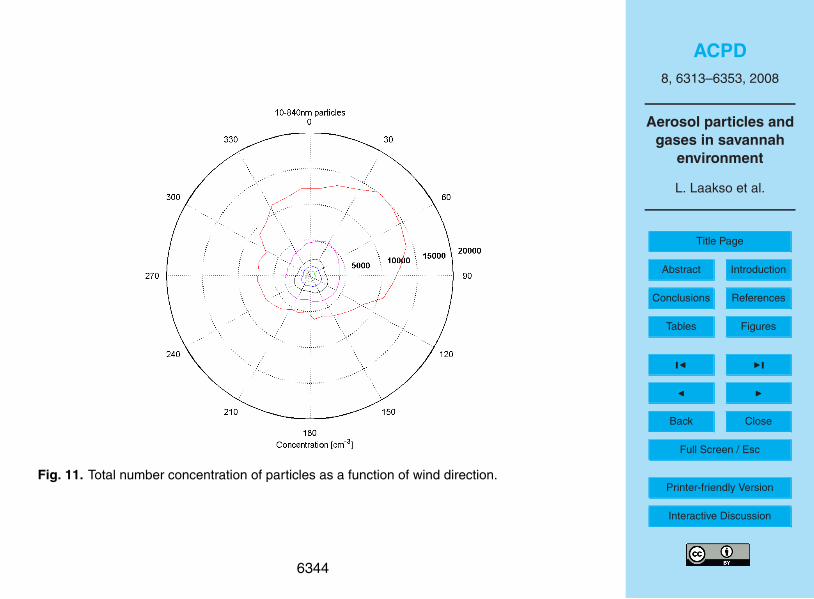
al. (2003) were carried out in the middle of the day at the time when we observed mostintensive new-particle formation. The highest particle number concentrations were ob-served in the same wind sector as the highest SO2 concentrations (Fig. 11). Thereason for this is discussed shortly in Sect. 4.3.
4.2 Diurnal cycles20
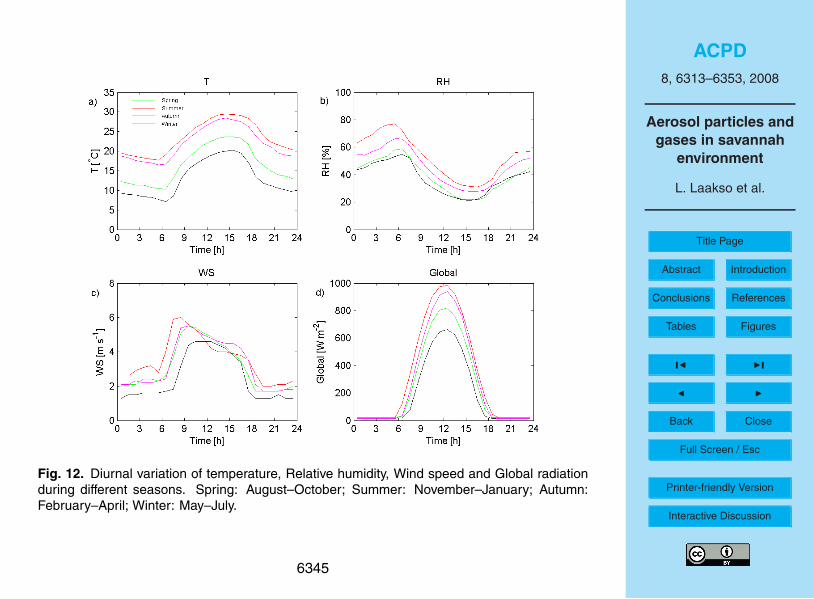
In addition to seasonal variations, we also investigated diurnal variation of the mea-sured quantities during the different seasons. Of temperature, relative humidity, windspeed and global radiation (Fig. 12), it is interesting to note the very clear diurnal be-havior of the wind speed, with highest values observed typically during the morningsand relatively low values during the nights. The wind direction had also a diurnal pat-25
tern. Winds coming from East-North-East sector were frequent in the morning, turningmore toward the West during the afternoon. A detailed trajectory analysis concerningthe influences of air mass origin and local topography on measured aerosol and trace
6324

ACPD8, 6313–6353, 2008
Aerosol particles andgases in savannah
environment
L. Laakso et al.
Title Page
Abstract Introduction
Conclusions References
Tables Figures
J I
J I
Back Close
Full Screen / Esc
Printer-friendly Version
Interactive Discussion
gas concentrations will be carried out after we have completed the measurements inBotsalano in January 2008.
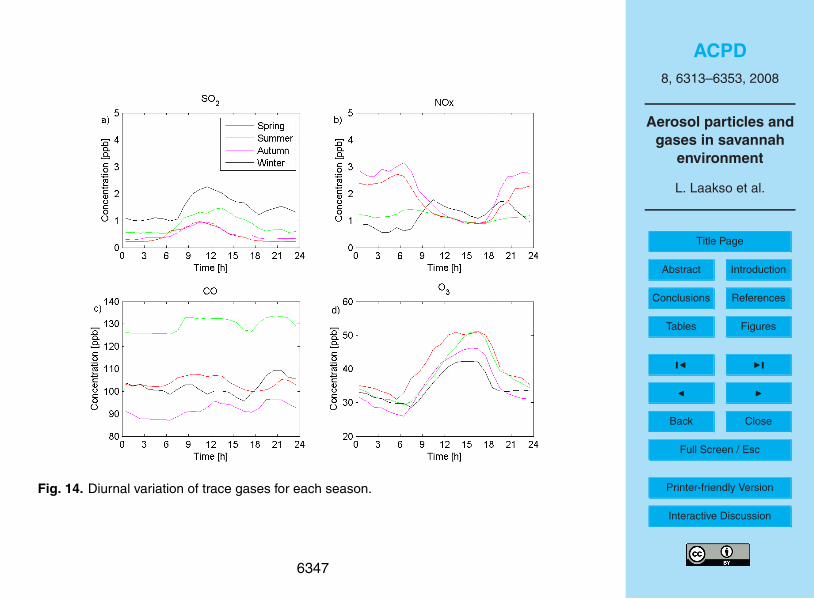
The SO2 concentration had a clear diurnal cycle in all the seasons with peak valuesobserved typically before the noon (Fig. 14a). The high values during the winter com-pared with other seasons can be attributed to less effective mixing, which affects the5
dilution of pollution originating from the Rustenburg mining area. Because of strongnight-time inversions and lack of local sources, SO2 concentrations decreased duringthe nights due to deposition. The concentrations of NOx and O3 were strongly anticor-related over the diurnal cycles as one would expect (Fig. 14b and d) (e.g. Finlayson-Pitts and Finlayson, 2000). The night-time behavior of the NOx concentration during10
winter and spring differed significantly from that during summer and autumn. The rea-son for the winter anomaly is biological activity in the ground related to the availabilityof the water during the humid season, which increases NO emissions (Otter et al.,1999). The CO concentrations had a weak late afternoon minimum potentially dueto the rapid reaction of CO with the OH radical. The high spring values for CO are15
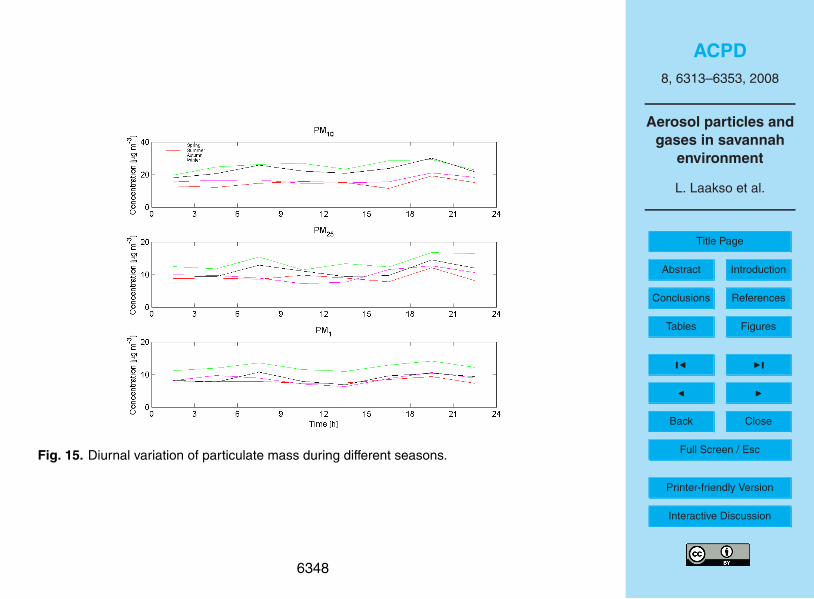
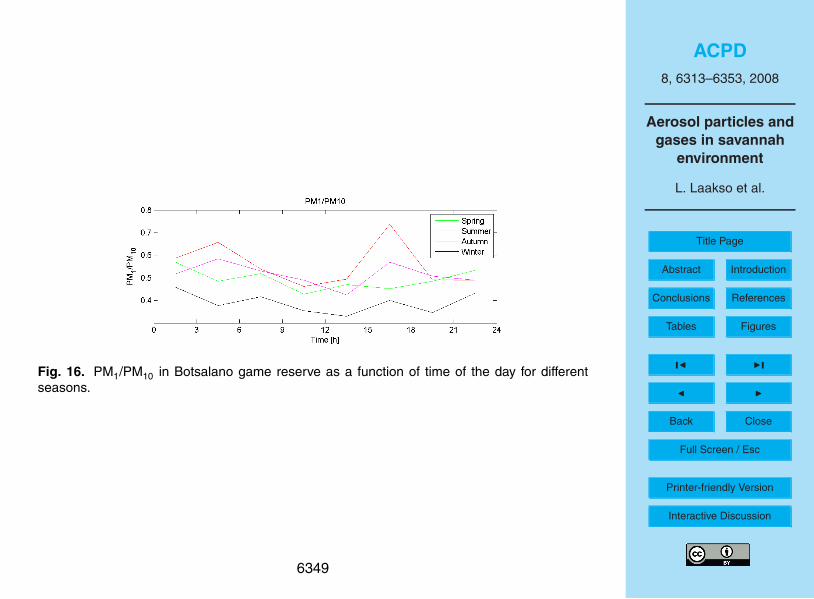
attributed to biomass burning during the dry period as mentioned earlier in Sect. 4.1.Figures 15 and 16d depict the diurnal cycles of PM1, PM2.5 and PM10 concentra-
tions and ratio of PM1 to PM10 concentrations during the different seasons. Duringsome periods a bimodal structure with a morning and late afternoon/evening maxi-mum can be distinguished. In urban areas such a structure is attributed usually to the20
combined effect of traffic emissions and dilution, but this cannot be the case here dueto the very low traffic amounts. The average decrease of the PM1 to PM10 concen-tration ratios throughout the morning until late afternoon co-insides with the period ofhigh wind speeds and might therefore be indicative of the influence of desert dust. Insummer and autumn, the high PM1 to PM10 concentration ratios during the late after-25
noon could be due to secondary aerosol formation associated with biogenic precursoremissions. It appears that multiple sources together with variable mixing conditions,rather than a single source or factor, is needed to explain the diurnal cycle of observedPM concentrations.
6325
ACPD8, 6313–6353, 2008
Aerosol particles andgases in savannah
environment
L. Laakso et al.
Title Page
Abstract Introduction
Conclusions References
Tables Figures
J I
J I
Back Close
Full Screen / Esc
Printer-friendly Version
Interactive Discussion
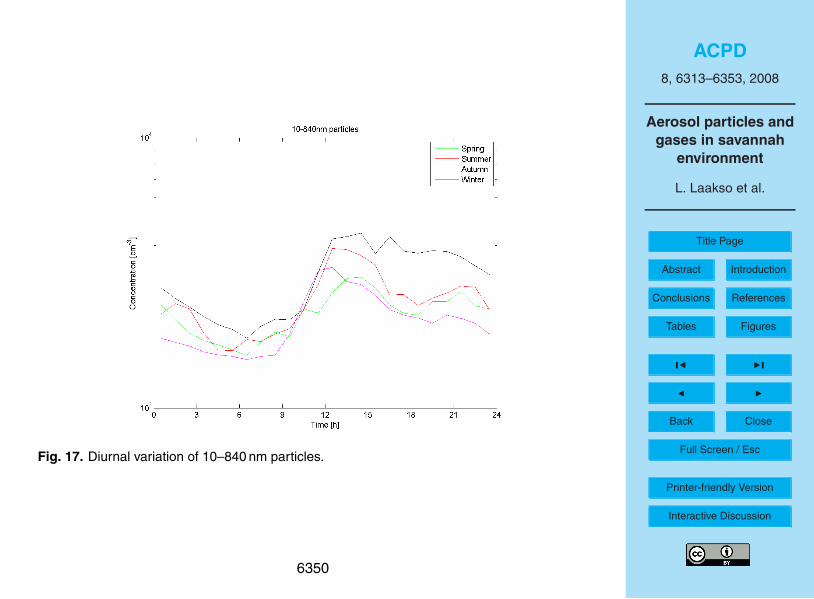
The total particle number concentration was found to peak very clearly in the af-ternoon, which is be related to new-particle formation taking place almost every day.During the winter, total particle number concentrations decreased much less rapidlytoward the night and morning than during other seasons. Potential reasons for thismight be the low winter-time wind speeds resulting in less efficient particle dry de-5
position and dilution, as well as the influence of smoke from the nearby villages andsettlements (e.g. Khunotswane and Dinokana).
4.3 New-particle formation episodes
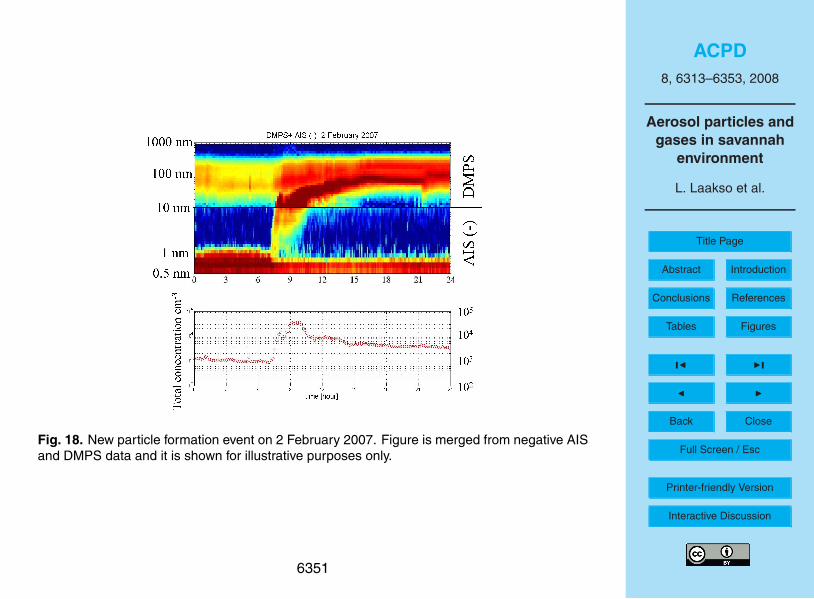
New particle formation was frequent in Botsalano. Figure 18 shows a typical new-particle formation day observed in Botsalano. During this day, nucleation started soon10
after sunrise and lasted for approximately three hours. The average formation rate of10 nm particles was 6.7 cm−3 s−1 and the average particle growth rate was 9.7 nm h−1.About 30 000 new particles cm−3 were formed into the size range >10 nm during theday.
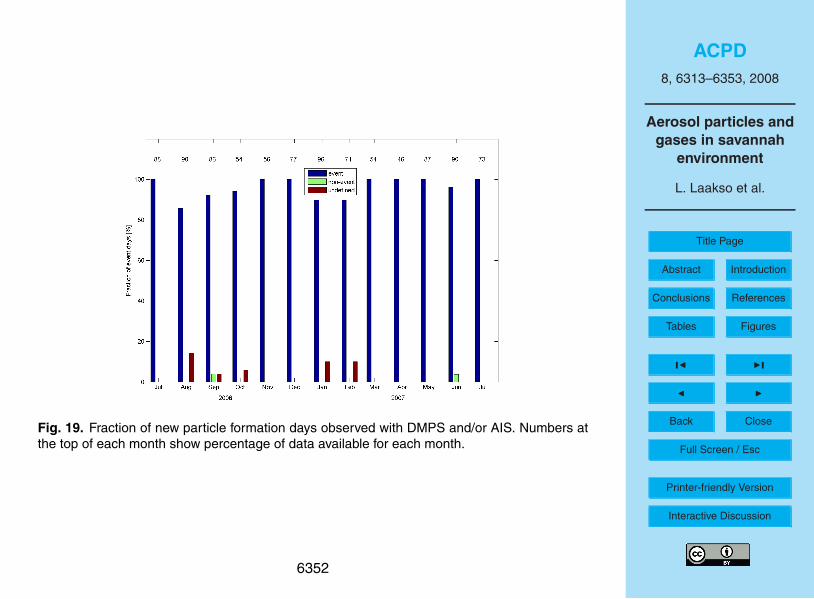
Figure 19 shows the frequency of the observed new-particle formation events in15
each month. The events were analyzed separately from the AIS and DMPS data.We had several periods when only one of the devices worked properly but, due to theoverlapping size range of 10–40 nm, the analyzed days are well comparable. The eventprobability was very high, taking place on more than 90% of the days. Days withoutnew-particle formation (non-events), as well as undefined days, corresponded mainly20
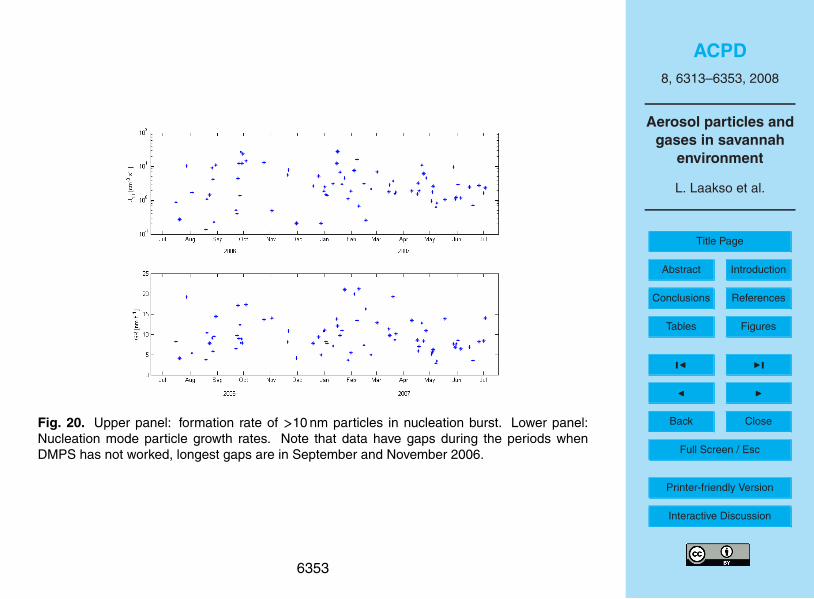
to cloudy or rainy days.Figure 20 shows the formation rate of 10 nm particles for those days when DMPS
data was available (approximately 60% of the time). The observed formation ratesvaried between about 0.1 and 28 cm−3 s −1 with no clear seasonal cycle. The corre-sponding particle growth rates varied between 3 and 21 nm h−1, again with no clear25
seasonal cycle.
6326
ACPD8, 6313–6353, 2008
Aerosol particles andgases in savannah
environment
L. Laakso et al.
Title Page
Abstract Introduction
Conclusions References
Tables Figures
J I
J I
Back Close
Full Screen / Esc
Printer-friendly Version
Interactive Discussion
If we compare the observations with measurements carried out in other sites (seeKulmala et al., 2004, and references therein) as well as recent study from Po-valley,Italy (Hameed et al., 2007) we notice that the frequency of the new-particles forma-tion events, as also the particle formation and growth rates, are among the highestobserved in continental areas. Other important difference is the any lack of seasonal5
variability – clearly, we have enough nucleating and condensing vapors as well as solarradiation for nucleation to take place throughout the year.
5 Summary and conclusions
In this paper, we have introduced a new atmospheric measurement site in SouthernAfrican savannah and presented the main results from a full year of aerosol and trace10
gas measurements. Based on the conducted measurements, we may state that oursite is in general relatively clean but influenced occasionally by anthropogenic plumes.As a result, the site provides an optimal location between polluted industrial regions tothe East and clean, sparsely-populated regions to the West of the measurement site.The location allows us to investigate the influences of sources in different regions with15
the help of air mass trajectories.Our observations have provided information on trace gas concentration, aerosol par-
ticle properties and meteorological variables. When comparing the measurement re-sults with those obtained from earlier studies, we found that the concentrations of tracegases were in the level reported in literature, with seasonal and diurnal variations influ-20
enced by both biological activity and local meteorology.Since there is no prior measurements of aerosol particle number size distributions
from the regions, we observed for the first time that new particle formation takes placealmost every day in such an environment. Due to their high growth rates, the fresh-formed particles reach easily sizes at which they can act as cloud condensation nuclei25
and affect thereby the regional radiation balance.
6327
ACPD8, 6313–6353, 2008
Aerosol particles andgases in savannah
environment
L. Laakso et al.
Title Page
Abstract Introduction
Conclusions References
Tables Figures
J I
J I
Back Close
Full Screen / Esc
Printer-friendly Version
Interactive Discussion
The first analysis of the data set raised also several questions, such as what is theeffect of volatile organic compounds on new-particle formation and growth and howdifferent sources influence trace gas and aerosol concentrations. These issues will bediscussed in more detail in our future publications.
Acknowledgements. The authors thank Head of Botsalano game reserve, M. Khukhela, for his5
kind and invaluable help during our measurements. In addition, the authors are grateful toM. Jokinen and E. Sjoberg for their help to organizing the project. Financial part of the projectis supported by Academy of Finland, Finnish foreign ministry, Finnish Environment Institute(SYKE) and Yrjo and Vilho Vaisala foundation.
References10
Aalto, P., Hameri, K., Becker, E., Weber, R., Salm, J., Makela, J. M., Hoell, C., O’Dowd, C. D.,Karlsson, H., Hansson, H.-C., Vakeva, M., Koponen, I. K., Buzorius, G., and Kulmala, M.:Physical characterization of aerosol particles during nucleation events, Tellus, 53B, 344–358,2001.
Afeti, G. M., Resch, F. J., and Sunnu, A. K.: Size and number distributions of Harmattan dust15
aerosol in central Ghana, Suppl. I., J. Aerosol Sci., 29, 173–174, 1998.Andreae, M. O., Chapuis, A., Cros, B., Fontan, J., Helas, G., Justice, C., Kaufman, Y. J., Minga,
A., and Nganga, D.: Ozone and Aitken nuclei over equatorial Africa: Airborne observationsduring DECAFE88, J. Geophys. Res., 97, 6137–6148, 1992.
Boko, M., Niang, I., Nyong, A., Vogel, C., Githeko, A., Medany, M., Osman-Elasha, B., Tabo, R.20
and Yanda, P.: Africa, Climate Change 2007: Impacts, Adaptation and Vulnerability, Contri-bution of Working Group II to the Fourth Assessment Report of the Intergovernmental Panelon Climate Change, edited by: Parry, M. L., Canziani, O. F., Palutikof, J. P., Van der Linden,P. J., and Hanson, C. E., Cambridge University Press, Cambridge UK, 433–467, 2007.
Brook, J. R., Dann, T. F., and Burnett, R. T.: The relationship among TSP, PM10, PM2.5 and25
inorganic constituents of atmospheric particulate matter at multiple Canadian locations, J.Air Waste Manage., 47, 2–19, 1997.
6328
ACPD8, 6313–6353, 2008
Aerosol particles andgases in savannah
environment
L. Laakso et al.
Title Page
Abstract Introduction
Conclusions References
Tables Figures
J I
J I
Back Close
Full Screen / Esc
Printer-friendly Version
Interactive Discussion
Caminade, C. and Terray, L.: Influence of increased greenhouse gases and sulphate aerosolsconcentration upon diurnal temperature range over Africa at the end of the 20th century,Geophys. Res. Lett., 33, L15703, doi:10.1029/2006GL026381, 2006.
Carmichael, G., Ferm, M., Thongboonchooa, N., Woo, J., Chan, L. Y., Murano, K., Viet, P.,Mossberg, C., Bala, R., Boonjawat, J., Upatum, P., Mohan, M., Adhikary, S., Shrestha, A.,5
Pienaar, J., Brunke, E., Chen, T., Jie, T., Guoan, D., Peng, L., Dhiharto, S., Harjanto, H., Jose,A., Kimani, W., Kirouane, A., Lacaux, J.-P., Richard, S., Barturen, O., Cerda, J., Athayde, A.,Tavares, T., Cotrina, J., and Bilici, E.: Measurements of sulfur dioxide, ozone and ammoniaconcentrations in Asia, Africa, and South America using passive samplers, Atmos. Environ.,37, 1293–1308, 2003.10
Dal Maso, M., Kulmala, M., Riipinen, I., Wagner, R., Hussein, T., Aalto, P. P., and Lehtinen,K. E. J.: Formation and growth of fresh atmospheric aerosols: eight years of aerosol sizedistribution data from SMEAR II, Hyytiala, Finland, Boreal Environ. Res., 10, 323–336, 2005.
Van Dingenen, R., Raes, F., Putaud, J.-P., Baltensperger, U., Charron, A., Facchini, M. C.,Decesari, S., Fuzzi, S., Gehrig, R., Hansson, H.-C., Harrison, R.-M., Huglin, C., Jones,15
A., Laj, P., Lorbeer, G., Maenhaut, W., Palmgren, F., Querol, X., Rodriguez, S., Schneider,J., ten Brink, H., Tunved, P., Torseth, K., Wehner, B., Weingartner, E., Wiedensohler, A.,and Wahlin, P.: A European aerosol phenomenology: physical characteristics of particulatematter at kerbside, urban, rural and background sites in Europe, Atmos. Environ., 38, 2561–2577, 2004.20
Duncan, B. N., Logan, J. A., Bey, I., Megretskaia, I. A., Yantosca, R. M., Novelli, P. C., Jones N.B., and Rinsland, C. P.: Global budget of CO, 1988-1997: Source estimates and validationwith a global model, J. Geophys. Res., 112, D22301, doi:10.1029/2007JD008459, 2007.
Eldred, R. A., Cahill, T. A., and Flocchini, R. G.: Composition of PM2.5 and PM10 aerosols inthe IMPROVE network, J. Air Waste Manage., 47, 194–203, 1997.25
Finlayson-Pitts, B. J. and Pitts, J. N.: Chemistry of Upper and Lower Atmosphere, AcademicPress, San Diego, 2000.
Gatari, M., Wagner, A., and Boman, J.: Elemental composition of tropospheric aerosols inHanoi, Vietnam and Nairobi, Kenya, Sci. Total Environ., 341, 241–249, 2005.
Guenther, A., Otter, L., Zimmermann, P., Greenberg, J., Scholes, R., and Scholes, M.: Biogenic30
hydrocarbon emissions from Southern African savannas, J. Geophys. Res., 101, 25 859–25 865, 1996.
6329
ACPD8, 6313–6353, 2008
Aerosol particles andgases in savannah
environment
L. Laakso et al.
Title Page
Abstract Introduction
Conclusions References
Tables Figures
J I
J I
Back Close
Full Screen / Esc
Printer-friendly Version
Interactive Discussion
Hamed, A., Joutsensaari, J., Mikkonen, S., Sogacheva, L., Dal Maso, M., Kulmala, M., Cavalli,F., Fuzzi, S., Facchini, M. C., Decesari, S., Mircea, M., Lehtinen, K. E. J., and Laaksonen, A.:Nucleation and growth of new particles in Po Valley, Italy, Atmos. Chem. Phys., 7, 355–376,2007,http://www.atmos-chem-phys.net/7/355/2007/.5
Helmig, D., Oltmans, S. J., Carlson, D., Lamarque, J.-F., Jones, A., Labuschagne, C., Anlauf,K., and Hayden, K.: A review of surface ozone in Polar Regions, Atmos. Environ., 41, 5238–5161, 2007.
Hobbs, P. V.: Clean air slots amid dense atmospheric pollution in Southern Africa, J. Geophys.Res., 108, 8490, doi: 10.1029/2002JD002156, 2003.10
Holloway, T., Leby II, H., and Kasibhatla, P.: Global distribution of carbon monoxide, J. Geophys.Res., 105, 12 123-12 147, 2000.
Kerminen, V.-M., Lihavainen, H., Komppula, M., Viisanen, Y., and Kulmala, M.: Direct observa-tional evidence linking atmospheric aerosol formation and cloud droplet activation, Geophys.Res. Lett., 32, L14803, doi:10.1029/2005GL02, 2005.15
Kgabi, N. A.: Monitoring the levels of atmospheric particulate matter in the North West Province,PhD Thesis, North-West University, 2006.
Kulmala, M., Vehkamaki, H., Petaja, T., Dal Maso, M., Lauri, A., Kerminen, V.-M., Birmili, W.,and McMurry, P. H.: Formation and growth rates of ultrafine atmospheric particles: A reviewof observations, J. Aerosol Sci., 35, 143–176, 2004.20
Kurten, T., Kulmala, M., Dal Maso, M., Suni, T., Reissell, A., Vehkamaki, H., Hari, P., Laakso-nen, A., Viisanen, Y., and Vesala, T.: Estimation of different forest-related contributions to theradiative balance using observation in southern Finland, Boreal Environ. Res., 8, 275–285,2003.
Laakso, L., Koponen, I.K., Monkkonen, P., Kulmala, M., Kerminen, V.-M., Wehner, B., Wieden-25
sohler, A., Wu, Z., Hu, M.: Aerosol particles in the developing world; a comparison betweenNew Delhi in India and Beijing in China, Water Air Soil Poll., 173(1–4), 5–20, 2006.
Levy II, H., Klonecki, A. A., and Kasibhatla, P. S.: Simulated tropospheric NOx: Its evaluation,global distribution and individual source contributions, J. Geophys. Res., 104, 25 273-26 306,1999.30
Mirme, A., Tamm, E., Mordas, G., Vana, M., Uin, J., Mirme, S., Bernotas, T., Laakso, L.,Hirsikko, A., and Kulmala, M.: A wide-range multi-channel Air Ion Spectrometer, BorealEnviron. Res., 12, 247–264, 2007.
6330
ACPD8, 6313–6353, 2008
Aerosol particles andgases in savannah
environment
L. Laakso et al.
Title Page
Abstract Introduction
Conclusions References
Tables Figures
J I
J I
Back Close
Full Screen / Esc
Printer-friendly Version
Interactive Discussion
Mori, I., Nishikawa, M., Quan, H., and Morita, M.: Estimation of the concentration and chemicalcomposition of Kosa aerosols at their origin, Atmos. Environ., 36, 4569–4575, 2002.
Otter, L. B., Yang, W., Scholes, M., and Meixner, F.: Nitric oxide emissions from a southernAfrican savanna, J. Geophys. Res., 104, 18 471-18 486, 1999.
Otter, L., Guenther, A., Wiedinmyer, C., Fleming, G., Harley, P., and Greenberg, J.: Spatial5
and temporal variations in biegenic volatile organic compound emissions for Africa South ofequator, J. Geophys. Res., 108, 8505, doi:10.1029/2002JD002609, 2003.
Piketh, S., Van Nierop, M., Rautenbach, C., Walton, N., Ross, K., Holmes, S., and Richards,T.: Rustenburg Local Muncipality Air Quality Management Plan, Palace consulting engineersltd., Republic of South Africa, 2005.10
Petaja, T., Laakso, L., Pohja, T., Siivola, E., Laakso, H., Aalto, P.P., Keronen, P., Kgabi, N.A.and Kulmala, M.: Mobile air quality monitoring trailer for developing countries, Proceedingsof International Conference on Nucleation and Atmospheric Aerosols 2007, Galway, Ireland,August 2007, edited by: O’Dowd, C. D. and Wagner, P. E., Springer, 694–697, 2007.
Ross, K. E., Piketh, S. J., Bruintjes, R. T., Burger, R. P., Swap, R. J. and Annegarn, H. J.:15
Spatial and seasonal variations in CCN distribution and the aerosol-CCN relationship oversouthern Africa, J. Geophys. Res., 108, 8481, doi:10.1029/2002JD002384, 2003.
Scheel, H. E., Areskoug, H., Geiss, H., Gomiscek, B., Granby, K., Haszpra, L., Klasinc, L.,Kley, D., Laurila, T., Lindskog, A., Roemer, M., Schmitt, R., Simmonds, P., Solberg, S., andTounape, G.: On the spatial distribution and seasonal variation of lower-tropospheric ozone20
over Europe, J. Atmos. Chem., 28, 11–28, 1997.Sinha, P., Hobbs, P. V., Yokelson, R. J., Blake, D. R., Gao, S., and Kirchstetter, T.W.: Distribu-
tions of trace gases and aerosols during dry biomass burning season in Southern Africa, J.Geophys. Res., 108, 4536, doi:10.1029/2003JD003691, 2003
Solomon, P., Cowling, E., Hidy, E., and Furiness, C.: Comparison of scientific findings from25
major ozone field studies in North America and Europe, Atmos. Environ., 34, 1885–1920,2000.
South African Weather Service: Climatologic statistics for Mafikeng, http://www.weathersa.co.za/Climat/Climstats/MmabathoStats.jsp, 2007.
Swap, R. J., Annegarn, H. J., Suttles, J. T., King, M. D., Platnick, S., Privette, J. L., and Scholes,30
R. J.: Africa burning: A thematic analysis of the Southern African Regional Science Initiative(SAFARI 2000), J. Geophys. Res., 108, 8465, doi:10.1029/2003JD003747, 2003.
6331
ACPD8, 6313–6353, 2008
Aerosol particles andgases in savannah
environment
L. Laakso et al.
Title Page
Abstract Introduction
Conclusions References
Tables Figures
J I
J I
Back Close
Full Screen / Esc
Printer-friendly Version
Interactive Discussion
Tammet, H.: Size and mobility of nanometer particles, clusters and ions, J. Aerosol Sci., 26,459–475, 1995.
Tammet, H.: Reduction of air ion mobility to standard conditions, J. Geophys. Res., 103,13 933–13 937, 1998.
Tyson, P. D., Garstang, M., and Swap, R.: Large-scale recirculation of Air over Southern Africa,5
J. Appl. Meteorol., 35, 2218–2236, 1996.Went, F. W.: Blue hazes in the atmosphere, Nature, 187, 641–643, 1960.Winklmayr, W., Reischl, G., Lindner, A., and Berner, A.: A new electromobility spectrometer for
the measurement of aerosol size distributions in the size range from 1 to 1000 nm, J. AerosolSci., 22, 289–296, 1991.10
6332
ACPD8, 6313–6353, 2008
Aerosol particles andgases in savannah
environment
L. Laakso et al.
Title Page
Abstract Introduction
Conclusions References
Tables Figures
J I
J I
Back Close
Full Screen / Esc
Printer-friendly Version
Interactive Discussion
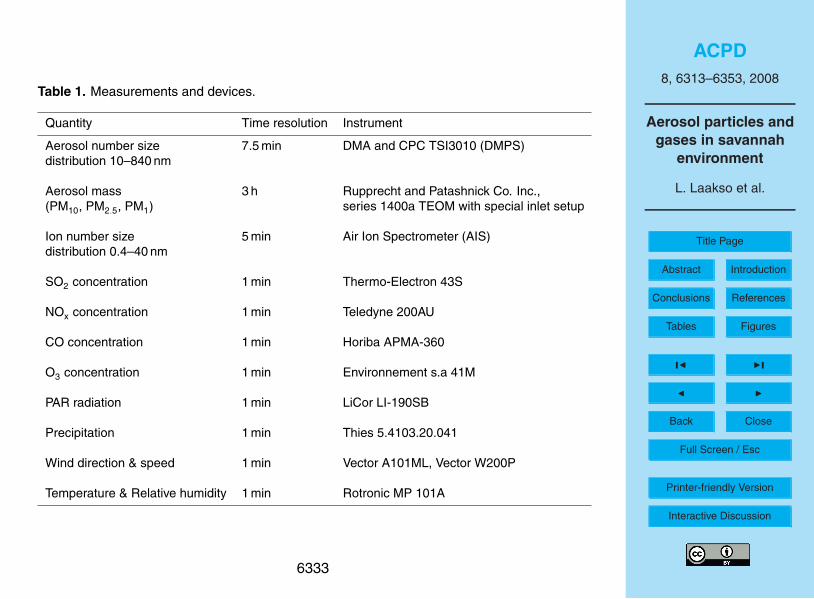
Table 1. Measurements and devices.
Quantity Time resolution Instrument
Aerosol number size 7.5 min DMA and CPC TSI3010 (DMPS)distribution 10–840 nm
Aerosol mass 3 h Rupprecht and Patashnick Co. Inc.,(PM10, PM2.5, PM1) series 1400a TEOM with special inlet setup
Ion number size 5 min Air Ion Spectrometer (AIS)distribution 0.4–40 nm
SO2 concentration 1 min Thermo-Electron 43S
NOx concentration 1 min Teledyne 200AU
CO concentration 1 min Horiba APMA-360
O3 concentration 1 min Environnement s.a 41M
PAR radiation 1 min LiCor LI-190SB
Precipitation 1 min Thies 5.4103.20.041
Wind direction & speed 1 min Vector A101ML, Vector W200P
Temperature & Relative humidity 1 min Rotronic MP 101A
6333
ACPD8, 6313–6353, 2008
Aerosol particles andgases in savannah
environment
L. Laakso et al.
Title Page
Abstract Introduction
Conclusions References
Tables Figures
J I
J I
Back Close
Full Screen / Esc
Printer-friendly Version
Interactive Discussion
Fig. 1. The measurement site. Location of the detailed map (red square) on a larger scaleis indicated on the small map in the lower right hand corner. Detailed map: 1. Botsalanogame reserve (measurement site: 25.32′28 S, 25.45′16 E, 1424 m a.s.l.), 2. Mafikeng (popu-lation 260 000), 3. Slurry (cement factory), 4. Ramathlabama (small village and chicken farm),5. Zeerust (pop. 140 000), 6. Khunotswane (pop. few thousands), 7. Dinokana (pop. >10 000),8. Lobatse municipal waste burning area. In addition, directions and distances from the mea-surement site to some regional major pollution sources are shown.
6334
ACPD8, 6313–6353, 2008
Aerosol particles andgases in savannah
environment
L. Laakso et al.
Title Page
Abstract Introduction
Conclusions References
Tables Figures
J I
J I
Back Close
Full Screen / Esc
Printer-friendly Version
Interactive Discussion
Fig. 2. Measurement site. All roads on the map are gravel roads.
6335
ACPD8, 6313–6353, 2008
Aerosol particles andgases in savannah
environment
L. Laakso et al.
Title Page
Abstract Introduction
Conclusions References
Tables Figures
J I
J I
Back Close
Full Screen / Esc
Printer-friendly Version
Interactive Discussion
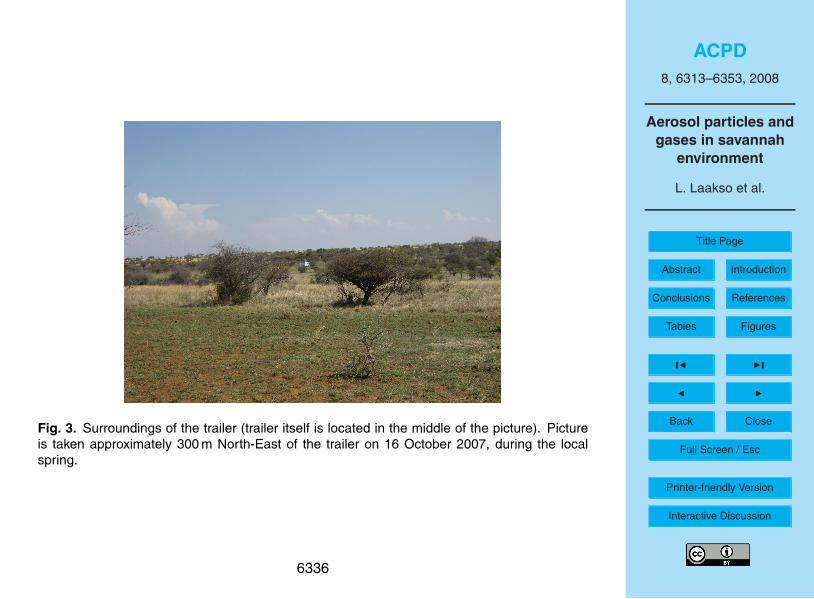
Fig. 3. Surroundings of the trailer (trailer itself is located in the middle of the picture). Pictureis taken approximately 300 m North-East of the trailer on 16 October 2007, during the localspring.
6336
ACPD8, 6313–6353, 2008
Aerosol particles andgases in savannah
environment
L. Laakso et al.
Title Page
Abstract Introduction
Conclusions References
Tables Figures
J I
J I
Back Close
Full Screen / Esc
Printer-friendly Version
Interactive Discussion
Fig. 4. Monthly variation of (a) temperature (b) relative humidity (c) wind speed (d) monthlyaccumulated precipitation. Red line in the middle is 50% percentile, boxes represent 25 and75% percentiles and bars 5 and 95% percentiles. Numbers at the top of each month show thecoverage of good quality data for each month in percent
6337
ACPD8, 6313–6353, 2008
Aerosol particles andgases in savannah
environment
L. Laakso et al.
Title Page
Abstract Introduction
Conclusions References
Tables Figures
J I
J I
Back Close
Full Screen / Esc
Printer-friendly Version
Interactive Discussion
Fig. 5. Frequency distribution of wind direction based on 1-min data.
6338
ACPD8, 6313–6353, 2008
Aerosol particles andgases in savannah
environment
L. Laakso et al.
Title Page
Abstract Introduction
Conclusions References
Tables Figures
J I
J I
Back Close
Full Screen / Esc
Printer-friendly Version
Interactive Discussion
Fig. 6. Annual variation of gaseous pollutants (a) SO2; (b) NOx; (c) CO; (d) O3. Red line inthe middle is 50% percentile, boxes represent 25 and 75% percentiles and bars 5 and 95%percentiles. Numbers at the top of each month show the coverage of good quality data for eachmonth in percent.
6339
ACPD8, 6313–6353, 2008
Aerosol particles andgases in savannah
environment
L. Laakso et al.
Title Page
Abstract Introduction
Conclusions References
Tables Figures
J I
J I
Back Close
Full Screen / Esc
Printer-friendly Version
Interactive Discussion
Fig. 7. Gas concentrations as a function of wind direction, (a) SO2; (b) NOx; (c) CO; (d) O3.Different colors represent percentiles: green: 5%, blue 25%, black 50%, magenta 75% and red95%.
6340
ACPD8, 6313–6353, 2008
Aerosol particles andgases in savannah
environment
L. Laakso et al.
Title Page
Abstract Introduction
Conclusions References
Tables Figures
J I
J I
Back Close
Full Screen / Esc
Printer-friendly Version
Interactive Discussion
Fig. 8. Particulate mass concentrations. Red line in the middle is 50% percentile, boxesrepresent 25 and 75% percentiles and bars 5 and 95% percentiles. Numbers at the top of eachmonth show the coverage of good quality data for each month in percent.
6341
ACPD8, 6313–6353, 2008
Aerosol particles andgases in savannah
environment
L. Laakso et al.
Title Page
Abstract Introduction
Conclusions References
Tables Figures
J I
J I
Back Close
Full Screen / Esc
Printer-friendly Version
Interactive Discussion
Fig. 9. Particulate mass as a function of wind direction. Wind directions is the mean winddirection corresponding each mass measurement period.
6342
ACPD8, 6313–6353, 2008
Aerosol particles andgases in savannah
environment
L. Laakso et al.
Title Page
Abstract Introduction
Conclusions References
Tables Figures
J I
J I
Back Close
Full Screen / Esc
Printer-friendly Version
Interactive Discussion
Fig. 10. Annual variability of particle number concentration. Red line in the middle is 50%percentile, boxes represent 25 and 75% percentiles and bars 5 and 95% percentiles. Numbersat the top of each month show the coverage of good quality data for each month in percent.
6343
ACPD8, 6313–6353, 2008
Aerosol particles andgases in savannah
environment
L. Laakso et al.
Title Page
Abstract Introduction
Conclusions References
Tables Figures
J I
J I
Back Close
Full Screen / Esc
Printer-friendly Version
Interactive Discussion
Fig. 11. Total number concentration of particles as a function of wind direction.
6344
ACPD8, 6313–6353, 2008
Aerosol particles andgases in savannah
environment
L. Laakso et al.
Title Page
Abstract Introduction
Conclusions References
Tables Figures
J I
J I
Back Close
Full Screen / Esc
Printer-friendly Version
Interactive Discussion
Fig. 12. Diurnal variation of temperature, Relative humidity, Wind speed and Global radiationduring different seasons. Spring: August–October; Summer: November–January; Autumn:February–April; Winter: May–July.
6345
ACPD8, 6313–6353, 2008
Aerosol particles andgases in savannah
environment
L. Laakso et al.
Title Page
Abstract Introduction
Conclusions References
Tables Figures
J I
J I
Back Close
Full Screen / Esc
Printer-friendly Version
Interactive Discussion
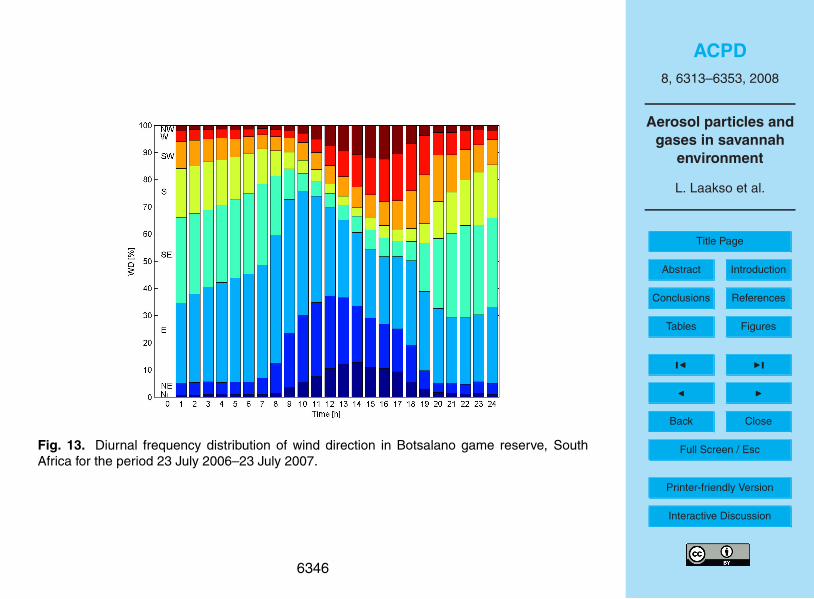
Fig. 13. Diurnal frequency distribution of wind direction in Botsalano game reserve, SouthAfrica for the period 23 July 2006–23 July 2007.
6346
ACPD8, 6313–6353, 2008
Aerosol particles andgases in savannah
environment
L. Laakso et al.
Title Page
Abstract Introduction
Conclusions References
Tables Figures
J I
J I
Back Close
Full Screen / Esc
Printer-friendly Version
Interactive Discussion
Fig. 14. Diurnal variation of trace gases for each season.
6347
ACPD8, 6313–6353, 2008
Aerosol particles andgases in savannah
environment
L. Laakso et al.
Title Page
Abstract Introduction
Conclusions References
Tables Figures
J I
J I
Back Close
Full Screen / Esc
Printer-friendly Version
Interactive Discussion
Fig. 15. Diurnal variation of particulate mass during different seasons.
6348
ACPD8, 6313–6353, 2008
Aerosol particles andgases in savannah
environment
L. Laakso et al.
Title Page
Abstract Introduction
Conclusions References
Tables Figures
J I
J I
Back Close
Full Screen / Esc
Printer-friendly Version
Interactive Discussion
Fig. 16. PM1/PM10 in Botsalano game reserve as a function of time of the day for differentseasons.
6349
ACPD8, 6313–6353, 2008
Aerosol particles andgases in savannah
environment
L. Laakso et al.
Title Page
Abstract Introduction
Conclusions References
Tables Figures
J I
J I
Back Close
Full Screen / Esc
Printer-friendly Version
Interactive Discussion
Fig. 17. Diurnal variation of 10–840 nm particles.
6350
ACPD8, 6313–6353, 2008
Aerosol particles andgases in savannah
environment
L. Laakso et al.
Title Page
Abstract Introduction
Conclusions References
Tables Figures
J I
J I
Back Close
Full Screen / Esc
Printer-friendly Version
Interactive Discussion
Fig. 18. New particle formation event on 2 February 2007. Figure is merged from negative AISand DMPS data and it is shown for illustrative purposes only.
6351
ACPD8, 6313–6353, 2008
Aerosol particles andgases in savannah
environment
L. Laakso et al.
Title Page
Abstract Introduction
Conclusions References
Tables Figures
J I
J I
Back Close
Full Screen / Esc
Printer-friendly Version
Interactive Discussion
Fig. 19. Fraction of new particle formation days observed with DMPS and/or AIS. Numbers atthe top of each month show percentage of data available for each month.
6352
ACPD8, 6313–6353, 2008
Aerosol particles andgases in savannah
environment
L. Laakso et al.
Title Page
Abstract Introduction
Conclusions References
Tables Figures
J I
J I
Back Close
Full Screen / Esc
Printer-friendly Version
Interactive Discussion
Fig. 20. Upper panel: formation rate of >10 nm particles in nucleation burst. Lower panel:Nucleation mode particle growth rates. Note that data have gaps during the periods whenDMPS has not worked, longest gaps are in September and November 2006.
6353
Related Documents