0 Baseline Survey of the Nawiri Resilience Food Security Activities in Kenya May 2022 | Volume I IMPEL | Implementer-Led Evaluation & Learning Associate Award

Welcome message from author
This document is posted to help you gain knowledge. Please leave a comment to let me know what you think about it! Share it to your friends and learn new things together.
Transcript
0
Baseline Survey of the Nawiri Resilience Food Security Activities in Kenya
May 2022 | Volume I
IMPEL | Implementer-Led Evaluation & Learning Associate Award
ABOUT IMPEL
The Implementer-Led Evaluation & Learning Associate Award (IMPEL) works to improve the design and implementation of
Bureau for Humanitarian Assistance (BHA)-funded resilience food security activities (RFSAs) through implementer-led
evaluations and knowledge sharing. Funded by the USAID Bureau for Humanitarian Assistance (BHA), IMPEL will gather
information and knowledge in order to measure performance of RFSAs, strengthen accountability, and improve guidance and
policy. This information will help the food security community of practice and USAID to design projects and modify existing
projects in ways that bolster performance, efficiency, and effectiveness. IMPEL is a seven-year activity (2019–2026)
implemented by Save the Children (lead), TANGO International, Tulane University, Causal Design, Innovations for Poverty
Action, and International Food Policy Research Institute.
RECOMMENDED CITATION
IMPEL. (2022). Baseline Study of the Nawiri Resilience Food Security Activities in Kenya (Vol. I). Washington, DC: The
Implementer-Led Evaluation & Learning Associate Award.
STUDY TEAM
PHOTO CREDITS
Mark Njuguna / Save the Children
DISCLAIMER
This report is made possible by the generous support of the American people through the United States Agency for
International Development (USAID). The contents are the responsibility of the Implementer-Led Evaluation & Learning (IMPEL)
award and do not necessarily reflect the views of USAID or the United States Government.
CONTACT INFORMATION
IMPEL Activity
c/o Save the Children
899 North Capitol Street NE, Suite #900
Washington, DC 20002
www.fsnnetwork.org/IMPEL
PREPARED BY:
Jeanne Downen Chief of Party Mark Langworthy, PhD Management Oversight/Survey Methods Specialist Gheda Temsah, PhD Baseline Study Team Lead Monica Mueller Senior Qualitative Specialist/Quality Assurance Stephanie Martin, PhD Senior Research Scientist Thomas Bower Senior Research Scientist Hannah Martin Research Associate
Baseline Survey of the Nawiri Resilience Food Security Activities in Kenya (Vol. I)
Acknowledgements i
ACKNOWLEDGMENTS We would like to thank several individuals for the support they provided to the baseline study of the BHA RFSAs in Kenya, starting with USAID BHA (in alphabetical order): Mohit Holmesheoran, Amos Kisilu, Chung Lai, Mara Mordini, Benita O’Colmain, Nancy Peek, and Adam Trowbridge. We wish to acknowledge Mehari Belachew, Girum Haile and other staff at Kimetrica for their work in organizing the training and logistics for the survey and conducting the data collection. In addition, we would like to thank the independent survey monitors: Feisal Hassan Adan, Dae Bacho Dae, Walter Lolusu Lenolngenje, Samuel Leparsaiya, Milcah Wanjiku Mwangangi, Dennis Ondicho Onchomba, Yusuf Hajj Shanko, and Grace Wang’ombe. We are grateful for the support of the Nawiri technical and M&E staff at Catholic Relief Services and Mercy Corps for contributing to the development of training materials, providing technical presentations to the field teams in advance of fieldwork, and reviewing the report. Lastly, we wish to thank all of the gracious people in the BHA RFSA areas who took the time to be interviewed for this survey.
Sincerely,
Tim Frankenberger, President
TANGO International
IMPEL | Implementer-Led Evaluation and Learning
ii Table of Contents
TABLE OF CONTENTS Acknowledgments ............................................................................................... i
List of Tables ...................................................................................................... iv
List of Figures ...................................................................................................... v
Acronyms .......................................................................................................... vii
Executive Summary ........................................................................................... ix
1. Introduction ................................................................................................... 1 1.1 Overview of the Baseline Study ..................................................................................................... 1 1.2 Background on BHA RFSAs in Kenya .............................................................................................. 1 1.3 Country Context ............................................................................................................................. 6
1.3.1 Background ................................................................................................................... 6 1.3.2 Overview of the Current Food Security Situation ......................................................... 6
2. Methodology and limitations ......................................................................... 8 2.1 Study Design ................................................................................................................................... 8 2.2 Sample Design ................................................................................................................................ 8 2.3 Questionnaire Design ..................................................................................................................... 9 2.4 Field Procedures ........................................................................................................................... 13
2.4.1 Timing of the Survey ................................................................................................... 13 2.4.2 Listing Exercise ............................................................................................................ 13 2.4.3 Training ....................................................................................................................... 13 2.4.4 Pilot ............................................................................................................................. 14 2.4.5 Fieldwork ..................................................................................................................... 14 2.4.6 Quality Assurance Protocols ....................................................................................... 15
2.5 Data Analysis ................................................................................................................................ 15 2.5.1 Sampling Weights........................................................................................................ 15 2.5.2 Indicator Definitions and Tabulations ......................................................................... 17
2.6 Study Limitations and Issues Encountered .................................................................................. 18 2.6.1 Study Limitations ......................................................................................................... 18 2.6.2 Issues Encountered During Fieldwork ......................................................................... 19
2.7 Qualitative Data ........................................................................................................................... 20
3. Findings ....................................................................................................... 21 3.1 Characteristics of the Study Population ....................................................................................... 21 3.2 Household Food Security ............................................................................................................. 24
3.2.1 Food Insecurity Experience Scale ................................................................................ 24 3.2.2 Food Consumption Score ............................................................................................ 27 3.2.3 Factors Associated with Household Food Security ..................................................... 29
Baseline Survey of the Nawiri Resilience Food Security Activities in Kenya (Vol. I)
Table of Contents iii
3.3 Poverty ......................................................................................................................................... 33 3.3.1 Prevalence of Poverty ................................................................................................. 34 3.3.2 Depth of Poverty of the Poor ...................................................................................... 34 3.3.3 Factors Associated with the Prevalence of Poverty .................................................... 35
3.4 Agriculture .................................................................................................................................... 37 3.4.1 Type of Land Access and Farm Size ............................................................................. 37 3.4.2 Use of Financial Services ............................................................................................. 41 3.4.3 Use of Value Chain Activities....................................................................................... 42 3.4.4 Use of Targeted Improved Agricultural Management Practices ................................ 43 3.4.5 Agricultural Yield ......................................................................................................... 56
3.5 Water, Sanitation, and Hygiene ................................................................................................... 63 3.5.1 Drinking Water Source ................................................................................................ 64 3.5.2 Water Treatment ........................................................................................................ 65 3.5.3 Sanitation Facility ........................................................................................................ 66 3.5.4 Handwashing Station .................................................................................................. 67
3.6 Women’s Health and Nutrition .................................................................................................... 67 3.6.1 Women’s Minimum Dietary Diversity ......................................................................... 67 3.6.2 Factors Associated with Women’s Dietary Diversity .................................................. 71 3.6.3 Antenatal Care ............................................................................................................ 75 3.6.4 Contraceptive Methods: Knowledge, Use, and Decision-Making ............................... 76
3.7 Children’s Health and Nutrition ................................................................................................... 79 3.7.1 Infant and Young Child Feeding .................................................................................. 79 3.7.2 Factors Associated with Children’s Dietary Diversity ................................................. 87 3.7.3 Diarrhea and Oral Rehydration Therapy ..................................................................... 94
3.8 Gender .......................................................................................................................................... 95 3.8.1 Gender and Cash-Earning Activities ............................................................................ 95 3.8.2 Gender and Group Participation ............................................................................... 101 3.8.3 Gender and Credit ..................................................................................................... 102
3.9 Resilience.................................................................................................................................... 104 3.9.1 Household Livelihoods .............................................................................................. 104 3.9.2 Shocks and Coping Strategies ................................................................................... 106 3.9.3 Ability to Recover from Shocks and Stresses ............................................................ 108 3.9.4 Index of Social Capital ............................................................................................... 109 3.9.5 Household Participation in Group-Based Savings, Microfinance, or Lending Programs 110 3.9.6 Absorptive Capacity Index......................................................................................... 111 3.9.7 Adaptive Capacity Index ............................................................................................ 114 3.9.8 Transformative Capacity Index ................................................................................. 116
Conclusions ..................................................................................................... 119
References ...................................................................................................... 122
IMPEL | Implementer-Led Evaluation and Learning
iv List of Tables and Figures
VOLUME II Annex A: Nawiri Resilience Food Security Activities in Kenya Baseline Study Protocol Annex B: Survey Questionnaires Annex C: 2021 Kenya Nawiri RFSA Baseline Study Personnel Annex D: Data Treatment and Analysis Plan Annex E: Baseline Indicator Estimates Annex F: Descriptive Analysis Tables Annex G: Bivariate and Multivariate Analysis Tables Annex H: COVID-19 Knowledge, Practices, Impacts and Coping Strategies
LIST OF TABLES Table 1. Coverage of Nawiri (CRS) RFSA, Kenya ............................................................................................ 2 Table 2. Coverage of Nawiri (Mercy Corps) RFSA, Kenya ............................................................................. 3 Table 3. Number of clusters and households included in the baseline sampling frames ............................ 9 Table 4. Indicators measured in the 2021 baseline survey of Nawiri in Kenya .......................................... 10 Table 5. Response rates by sampling group and county, Kenya 2021 RFSA baseline survey ..................... 16 Table 6. Share of key demographic groups, by RFSA, in total and by county ............................................. 22 Table 7: Household characteristics, total sample and by county ............................................................... 23 Table 8: Daily per capita consumption expenditures, by RFSA area and county (USD 2010, 2011 PPP) ... 34 Table 9. Sex and age distribution of farmers, by county (percentage) ....................................................... 38 Table 10. Number of responding farmers by crop commodity of interest and county .............................. 43 Table 11. Summary of adoption of targeted improved management practices by crop commodity, Turkana ....................................................................................................................................................... 44 Table 12: Sex and age distribution of livestock producers, by targeted commodity, by county (percentage) ................................................................................................................................................ 47 Table 13: Heat map of adoption of targeted improved management practices by livestock commodity . 48 Table 14. Yield from cattle production during the year preceding the survey, total and by farmers’ sex and age ........................................................................................................................................................ 57 Table 15. Yield from goat production during the year preceding the survey, total and by farmers’ sex and age ............................................................................................................................................................... 59 Table 16. Yield from camel production during the year preceding the survey, total and by farmers’ sex and age ........................................................................................................................................................ 60 Table 17. Average dairy cow milk yield, per farmer ................................................................................... 61 Table 18. Average camel milk yield, per farmer ......................................................................................... 61 Table 19. Comparison of milk production estimates with secondary sources ........................................... 62 Table 20. Reasons for not giving certain foods to small children under age 2, Turkana ............................ 93
Baseline Survey of the Nawiri Resilience Food Security Activities in Kenya (Vol. I)
List of Tables and Figures v
LIST OF FIGURES Figure 1. Map of Nawiri (CRS) RFSA implementation areas ......................................................................... 4 Figure 2. Map of Nawiri (Mercy Corps) RFSA implementation areas ........................................................... 5 Figure 3. Seasonal calendar, Kenya ............................................................................................................... 7 Figure 4. Affirmative responses to eight FIES questions (percentage of households), Nawiri (CRS) RFSA areas ............................................................................................................................................................ 25 Figure 5. Affirmative responses to eight FIES questions (percentage of households), Nawiri (Mercy Corps) RFSA areas ................................................................................................................................................... 26 Figure 6. Mean FCS and distribution of households by FCS group and county—Nawiri (CRS) RFSA areas 27 Figure 7. Mean FCS and distribution of households by FCS group and county—Nawiri (Mercy Corps) RFSA areas ............................................................................................................................................................ 27 Figure 8. Frequency of consumption of FCS food groups (mean number of days per week), by county .. 28 Figure 9. Summary of statistically significant associations from the bivariate analyses of the prevalence of food insecurity (FIES), by county ............................................................................................................ 30 Figure 10. Summary of statistically significant associations from the bivariate analyses of FCS groups, by county ......................................................................................................................................................... 32 Figure 11. Households living below the poverty line, by RFSA area and county (percentage) .................. 34 Figure 12. Depth of poverty of the poor, by RFSA area and county ........................................................... 35 Figure 13. Summary of findings from the bivariate analyses of the prevalence of poverty, by county ..... 36 Figure 14. Percentage of farmers by farm size, by county—Nawiri (CRS) RFSA areas ............................... 40 Figure 15. Percentage of farmers by farm size, by county—Nawiri (Mercy Corps) RFSA areas ................. 40 Figure 16. Use of financial services among farmers (percentage), by type and county ............................. 41 Figure 17. Percentage of green gram farmers applying targeted improved management practices by type, Turkana .............................................................................................................................................. 45 Figure 18. Percentage of sorghum farmers applying targeted improved management practices by type, Turkana ....................................................................................................................................................... 46 Figure 19. Adoption of targeted improved management practices by cattle producers ........................... 49 Figure 20. Adoption of targeted improved management practices by goat producers ............................. 50 Figure 21. Adoption of targeted improved management practices by camel producers .......................... 51 Figure 22. Summary of statistically significant associations between access to financial services (credit or savings) and the adoption of targeted improved practices among livestock farmers: cattle .................... 53 Figure 23. Summary of statistically significant associations between access to financial services (credit or savings) and the adoption of targeted improved practices among livestock farmers: goats .................... 54 Figure 24. Summary of statistically significant associations between access to financial services (credit or savings) and the adoption of targeted improved practices among livestock farmers: camels .................. 55 Figure 25. Most-used improved sources of drinking water, by county ...................................................... 63 Figure 26. Household drinking water source, by county ............................................................................ 64 Figure 27. Household sanitation facility, by county .................................................................................... 66 Figure 28. Percentage of women 15–49 years consuming MDD-W food groups, by county ..................... 69 Figure 29. Summary of statistically significant findings from the bivariate analyses MDD-W ................... 71 Figure 30. Use of family planning among non-pregnant women 15–49 years in a union, by county ........ 77
IMPEL | Implementer-Led Evaluation and Learning
vi List of Tables and Figures
Figure 31. Breastfeeding status for children 0–23 months by age in months by type of method, Marsabit (N = 330) .................................................................................................................................................................... 80 Figure 32. Breastfeeding status for children 0–23 months by age in months by type of method, Isiolo (N = 307) . 81 Figure 33. Breastfeeding status for children 0–23 months by age in months by type of method, Turkana (N = 344) ...................................................................................................................................................... 81 Figure 34. Breastfeeding status for children 0–23 months by age in months by type of method, Samburu (N = 283) .................................................................................................................................................................... 82 Figure 35. Components of MAD indicator for children 6–23 months by breastfeeding status, Marsabit (N = 255) .......................................................................................................................................................... 84 Figure 36. Components of MAD indicator for children 6–23 months by breastfeeding status, Isiolo (N = 222) ............................................................................................................................................................. 84 Figure 37. Components of MAD indicator for children 6–23 months by breastfeeding status, Turkana (N = 235) ............................................................................................................................................................. 85 Figure 38. Components of MAD indicator for children 6–23 months by breastfeeding status, Samburu (N = 195) .......................................................................................................................................................... 85 Figure 39. Food groups consumed by children 6–23 months (MDD-C), by county .................................... 87 Figure 40. Summary of statistically significant associations from the bivariate analyses of MAD, by county .................................................................................................................................................................... 88 Figure 41. Summary of statistically significant associations from the bivariate analyses of MDD-C, by county ..... 89 Figure 42. Gender gap in participation in cash-earning activities, by county ............................................. 96 Figure 43. Gender gap in community group participation, by county ...................................................... 101 Figure 44. Women and men’s participation in household credit decision making—Nawiri (CRS) RFSA areas .......................................................................................................................................................... 102 Figure 45. Women and men’s participation in household credit decision making—Nawiri (Mercy Corps) RFSA areas ................................................................................................................................................. 103 Figure 46. Household livelihoods, Nawiri (CRS) RFSA area ....................................................................... 105 Figure 47. Household livelihoods, Nawiri (Mercy Corps) RFSA area ........................................................ 105 Figure 48. Five most prevalent shocks experienced in the previous 12 months, Nawiri (CRS) RFSA area .................................................................................................................................................................. 106 Figure 49. Five most prevalent shocks experienced in the previous 12 months, Nawiri (Mercy Corps) RFSA area .................................................................................................................................................. 106 Figure 50. Coping strategies to any shock, Nawiri (CRS) RFSA areas ........................................................ 107 Figure 51. Coping strategies to any shock, Nawiri (Mercy Corps) RFSA areas ......................................... 107 Figure 52. Ability to recover index, Nawiri (CRS and Mercy Corps) RFSA areas ....................................... 109 Figure 53. Shock exposure index, Nawiri (CRS and Mercy Corps) RFSA areas ......................................... 109 Figure 54. Absorptive capacity index and sub-indicators, Nawiri (CRS) RFSA areas ................................. 112 Figure 56. Adaptive capacity index and sub-indicators, Nawiri (CRS) RFSA area ..................................... 114 Figure 57. Adaptive capacity index and sub-indicators, Nawiri (Mercy Corps) RFSA area ....................... 115 Figure 58. Transformative capacity index and sub-indicators, Nawiri (CRS) RFSA area ........................... 116 Figure 59. Transformative capacity index and sub-indicators, Nawiri (Mercy Corps) RFSA area ............. 117
Baseline Survey of the Nawiri Resilience Food Security Activities in Kenya (Vol. I)
Acronyms vii
ACRONYMS ANC Antenatal Care APHRC African Population and Health Research Center ASAL Arid and Semi-Arid Land BCS Body Condition Score BHA Bureau for Humanitarian Assistance BL Baseline CEFM Child Early and Forced Marriage CHC Centre for Humanitarian Change CIDP County Integrated Development Plan CNAP County Nutrition Action Plan CPR Contraceptive Prevalence Rate CRS Catholic Relief Services CSPro Census and Survey Processing System DHS Demographic and Health Survey FAO Food and Agriculture Organization FCS Food Consumption Score FFP Food for Peace FIES Food Insecurity Experience Scale FTF Feed the Future GAIN Global Alliance for Improved Nutrition GAM Global Acute Malnutrition GDP gross domestic product GHT Gendered Household Type HDI Human Development Index HSNP Hunger Safety Net Programme IBTCI International Business & Technical Consultants, Inc. IMPEL Implementer-Led Evaluation and Learning IP Implementing Partner IPC Integrated Phase Classification KDHS Kenya Demographic and Health Survey kg Kilogram KNAP Kenya Nutrition Action Plan LSMS Living Standards Measurement Survey LZ Livelihood Zone MAD Minimum Acceptable Diet MC Mercy Corps MDD-C Children’s Minimum Dietary Diversity MDD-W Women’s Minimum dDietary Diversity MFI Microfinance Institution NFNSP National Food and Nutrition Security Policy
IMPEL | Implementer-Led Evaluation and Learning
viii Acronyms
NRM Natural Resource Management OFDA Office of Foreign Disaster Assistance ORS Oral Rehydration Solution ORT Oral Rehydration Therapy PBS Population-Based Survey PEA Political Economy Analysis PPP Purchasing Power Parity PREG Partnership for Resilience and Economic Growth RFSA Resilience Food Security Activity RTI Research Triangle Institute TANGO Technical Assistance to NGOs TMG The Manoff Group ToT Training of Trainers USAID United States Agency for International Development VE Village Enterprise VSLA Village Savings and Loan Association WASH Water, Sanitation, and Hygiene WFP World Food Programme
Baseline Survey of the Nawiri Resilience Food Security Activities in Kenya (Vol. I)
Executive Summary ix
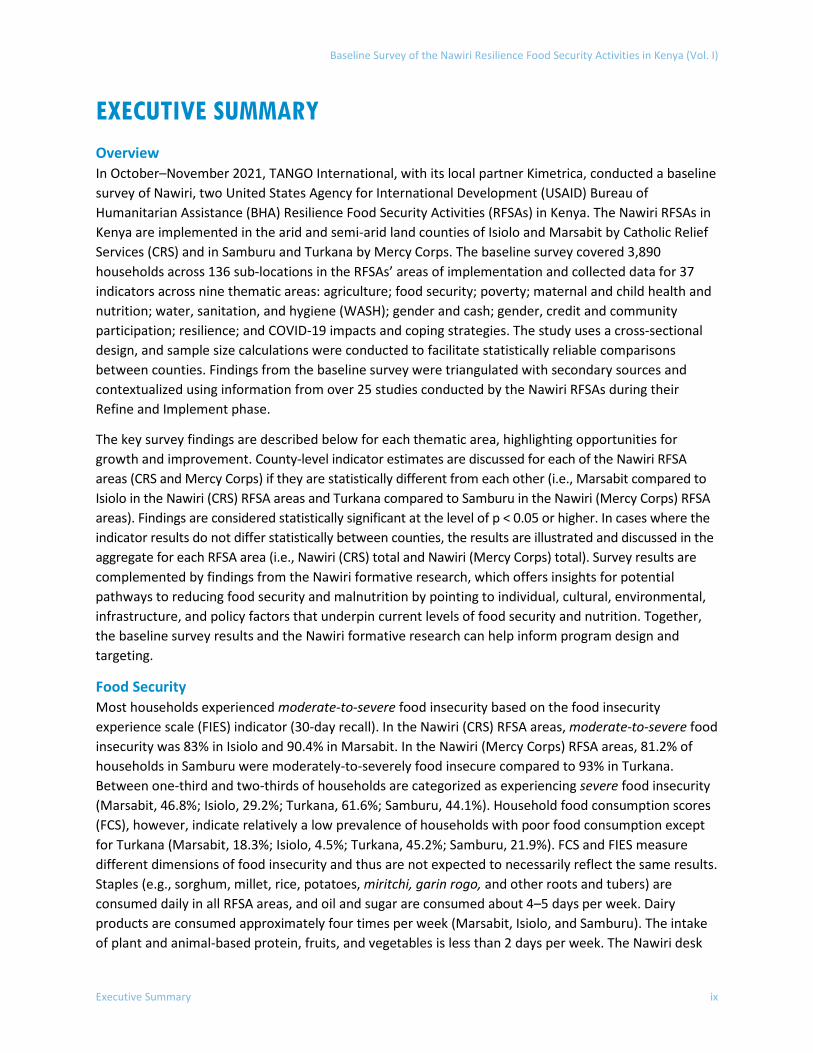
EXECUTIVE SUMMARY Overview In October–November 2021, TANGO International, with its local partner Kimetrica, conducted a baseline survey of Nawiri, two United States Agency for International Development (USAID) Bureau of Humanitarian Assistance (BHA) Resilience Food Security Activities (RFSAs) in Kenya. The Nawiri RFSAs in Kenya are implemented in the arid and semi-arid land counties of Isiolo and Marsabit by Catholic Relief Services (CRS) and in Samburu and Turkana by Mercy Corps. The baseline survey covered 3,890 households across 136 sub-locations in the RFSAs’ areas of implementation and collected data for 37 indicators across nine thematic areas: agriculture; food security; poverty; maternal and child health and nutrition; water, sanitation, and hygiene (WASH); gender and cash; gender, credit and community participation; resilience; and COVID-19 impacts and coping strategies. The study uses a cross-sectional design, and sample size calculations were conducted to facilitate statistically reliable comparisons between counties. Findings from the baseline survey were triangulated with secondary sources and contextualized using information from over 25 studies conducted by the Nawiri RFSAs during their Refine and Implement phase.
The key survey findings are described below for each thematic area, highlighting opportunities for growth and improvement. County-level indicator estimates are discussed for each of the Nawiri RFSA areas (CRS and Mercy Corps) if they are statistically different from each other (i.e., Marsabit compared to Isiolo in the Nawiri (CRS) RFSA areas and Turkana compared to Samburu in the Nawiri (Mercy Corps) RFSA areas). Findings are considered statistically significant at the level of p < 0.05 or higher. In cases where the indicator results do not differ statistically between counties, the results are illustrated and discussed in the aggregate for each RFSA area (i.e., Nawiri (CRS) total and Nawiri (Mercy Corps) total). Survey results are complemented by findings from the Nawiri formative research, which offers insights for potential pathways to reducing food security and malnutrition by pointing to individual, cultural, environmental, infrastructure, and policy factors that underpin current levels of food security and nutrition. Together, the baseline survey results and the Nawiri formative research can help inform program design and targeting.
Food Security Most households experienced moderate-to-severe food insecurity based on the food insecurity experience scale (FIES) indicator (30-day recall). In the Nawiri (CRS) RFSA areas, moderate-to-severe food insecurity was 83% in Isiolo and 90.4% in Marsabit. In the Nawiri (Mercy Corps) RFSA areas, 81.2% of households in Samburu were moderately-to-severely food insecure compared to 93% in Turkana. Between one-third and two-thirds of households are categorized as experiencing severe food insecurity (Marsabit, 46.8%; Isiolo, 29.2%; Turkana, 61.6%; Samburu, 44.1%). Household food consumption scores (FCS), however, indicate relatively a low prevalence of households with poor food consumption except for Turkana (Marsabit, 18.3%; Isiolo, 4.5%; Turkana, 45.2%; Samburu, 21.9%). FCS and FIES measure different dimensions of food insecurity and thus are not expected to necessarily reflect the same results. Staples (e.g., sorghum, millet, rice, potatoes, miritchi, garin rogo, and other roots and tubers) are consumed daily in all RFSA areas, and oil and sugar are consumed about 4–5 days per week. Dairy products are consumed approximately four times per week (Marsabit, Isiolo, and Samburu). The intake of plant and animal-based protein, fruits, and vegetables is less than 2 days per week. The Nawiri desk
IMPEL | Implementer-Led Evaluation and Learning
x Executive Summary
review indicates some degree of reliance on purchased foods across all RFSA areas, and that food prices are often a barrier to purchase, given high levels of poverty.
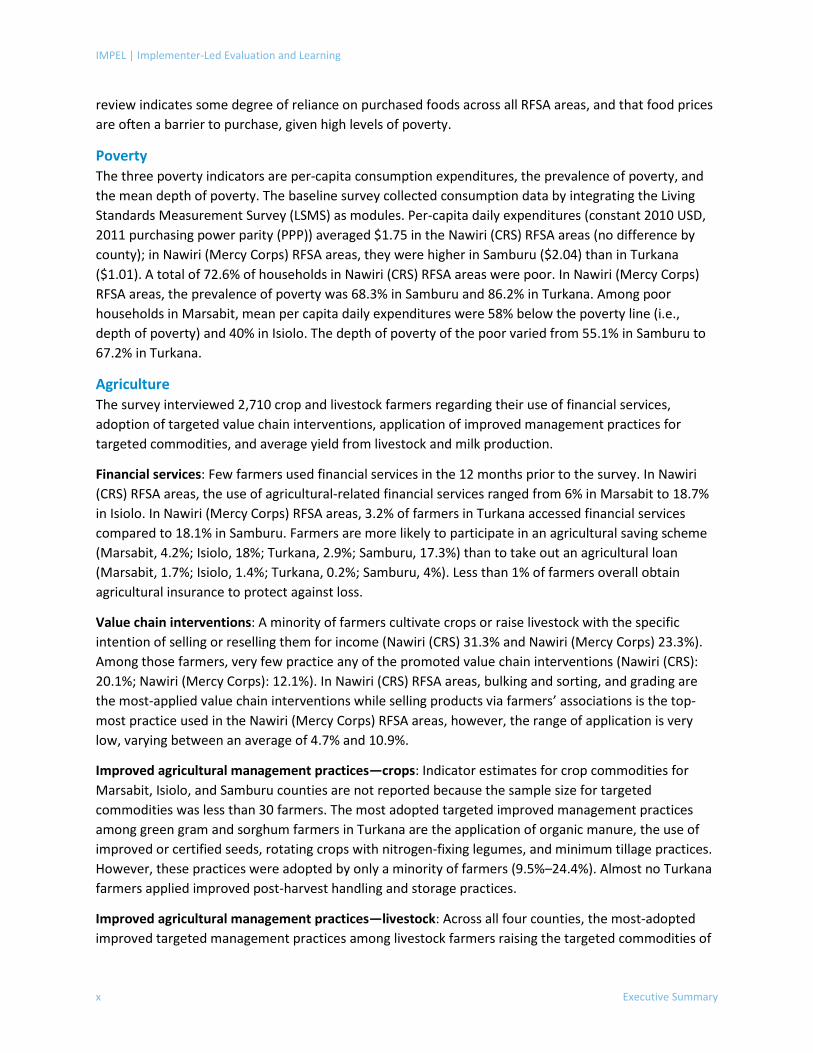
Poverty The three poverty indicators are per-capita consumption expenditures, the prevalence of poverty, and the mean depth of poverty. The baseline survey collected consumption data by integrating the Living Standards Measurement Survey (LSMS) as modules. Per-capita daily expenditures (constant 2010 USD, 2011 purchasing power parity (PPP)) averaged $1.75 in the Nawiri (CRS) RFSA areas (no difference by county); in Nawiri (Mercy Corps) RFSA areas, they were higher in Samburu ($2.04) than in Turkana ($1.01). A total of 72.6% of households in Nawiri (CRS) RFSA areas were poor. In Nawiri (Mercy Corps) RFSA areas, the prevalence of poverty was 68.3% in Samburu and 86.2% in Turkana. Among poor households in Marsabit, mean per capita daily expenditures were 58% below the poverty line (i.e., depth of poverty) and 40% in Isiolo. The depth of poverty of the poor varied from 55.1% in Samburu to 67.2% in Turkana.
Agriculture The survey interviewed 2,710 crop and livestock farmers regarding their use of financial services, adoption of targeted value chain interventions, application of improved management practices for targeted commodities, and average yield from livestock and milk production.
Financial services: Few farmers used financial services in the 12 months prior to the survey. In Nawiri (CRS) RFSA areas, the use of agricultural-related financial services ranged from 6% in Marsabit to 18.7% in Isiolo. In Nawiri (Mercy Corps) RFSA areas, 3.2% of farmers in Turkana accessed financial services compared to 18.1% in Samburu. Farmers are more likely to participate in an agricultural saving scheme (Marsabit, 4.2%; Isiolo, 18%; Turkana, 2.9%; Samburu, 17.3%) than to take out an agricultural loan (Marsabit, 1.7%; Isiolo, 1.4%; Turkana, 0.2%; Samburu, 4%). Less than 1% of farmers overall obtain agricultural insurance to protect against loss.
Value chain interventions: A minority of farmers cultivate crops or raise livestock with the specific intention of selling or reselling them for income (Nawiri (CRS) 31.3% and Nawiri (Mercy Corps) 23.3%). Among those farmers, very few practice any of the promoted value chain interventions (Nawiri (CRS): 20.1%; Nawiri (Mercy Corps): 12.1%). In Nawiri (CRS) RFSA areas, bulking and sorting, and grading are the most-applied value chain interventions while selling products via farmers’ associations is the top-most practice used in the Nawiri (Mercy Corps) RFSA areas, however, the range of application is very low, varying between an average of 4.7% and 10.9%.
Improved agricultural management practices—crops: Indicator estimates for crop commodities for Marsabit, Isiolo, and Samburu counties are not reported because the sample size for targeted commodities was less than 30 farmers. The most adopted targeted improved management practices among green gram and sorghum farmers in Turkana are the application of organic manure, the use of improved or certified seeds, rotating crops with nitrogen-fixing legumes, and minimum tillage practices. However, these practices were adopted by only a minority of farmers (9.5%–24.4%). Almost no Turkana farmers applied improved post-harvest handling and storage practices.
Improved agricultural management practices—livestock: Across all four counties, the most-adopted improved targeted management practices among livestock farmers raising the targeted commodities of
Baseline Survey of the Nawiri Resilience Food Security Activities in Kenya (Vol. I)
Executive Summary xi
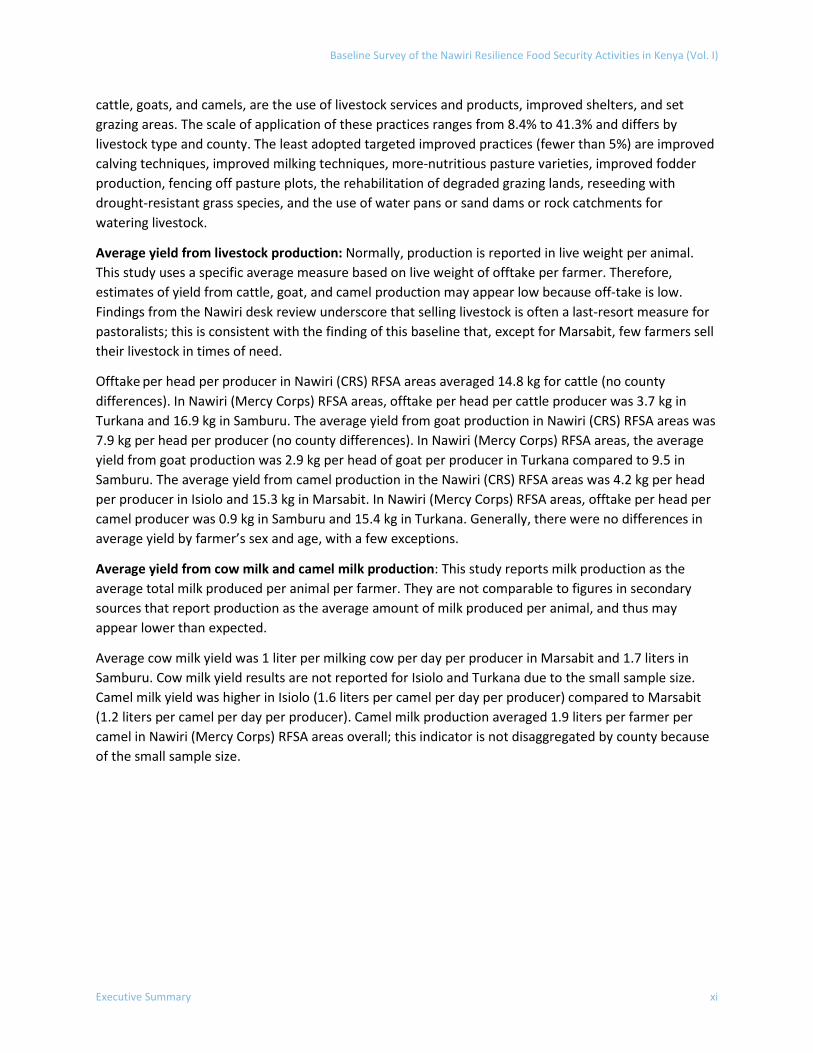
cattle, goats, and camels, are the use of livestock services and products, improved shelters, and set grazing areas. The scale of application of these practices ranges from 8.4% to 41.3% and differs by livestock type and county. The least adopted targeted improved practices (fewer than 5%) are improved calving techniques, improved milking techniques, more-nutritious pasture varieties, improved fodder production, fencing off pasture plots, the rehabilitation of degraded grazing lands, reseeding with drought-resistant grass species, and the use of water pans or sand dams or rock catchments for watering livestock.
Average yield from livestock production: Normally, production is reported in live weight per animal. This study uses a specific average measure based on live weight of offtake per farmer. Therefore, estimates of yield from cattle, goat, and camel production may appear low because off-take is low. Findings from the Nawiri desk review underscore that selling livestock is often a last-resort measure for pastoralists; this is consistent with the finding of this baseline that, except for Marsabit, few farmers sell their livestock in times of need.
Offtake per head per producer in Nawiri (CRS) RFSA areas averaged 14.8 kg for cattle (no county differences). In Nawiri (Mercy Corps) RFSA areas, offtake per head per cattle producer was 3.7 kg in Turkana and 16.9 kg in Samburu. The average yield from goat production in Nawiri (CRS) RFSA areas was 7.9 kg per head per producer (no county differences). In Nawiri (Mercy Corps) RFSA areas, the average yield from goat production was 2.9 kg per head of goat per producer in Turkana compared to 9.5 in Samburu. The average yield from camel production in the Nawiri (CRS) RFSA areas was 4.2 kg per head per producer in Isiolo and 15.3 kg in Marsabit. In Nawiri (Mercy Corps) RFSA areas, offtake per head per camel producer was 0.9 kg in Samburu and 15.4 kg in Turkana. Generally, there were no differences in average yield by farmer’s sex and age, with a few exceptions.
Average yield from cow milk and camel milk production: This study reports milk production as the average total milk produced per animal per farmer. They are not comparable to figures in secondary sources that report production as the average amount of milk produced per animal, and thus may appear lower than expected.
Average cow milk yield was 1 liter per milking cow per day per producer in Marsabit and 1.7 liters in Samburu. Cow milk yield results are not reported for Isiolo and Turkana due to the small sample size. Camel milk yield was higher in Isiolo (1.6 liters per camel per day per producer) compared to Marsabit (1.2 liters per camel per day per producer). Camel milk production averaged 1.9 liters per farmer per camel in Nawiri (Mercy Corps) RFSA areas overall; this indicator is not disaggregated by county because of the small sample size.
IMPEL | Implementer-Led Evaluation and Learning
xii Executive Summary
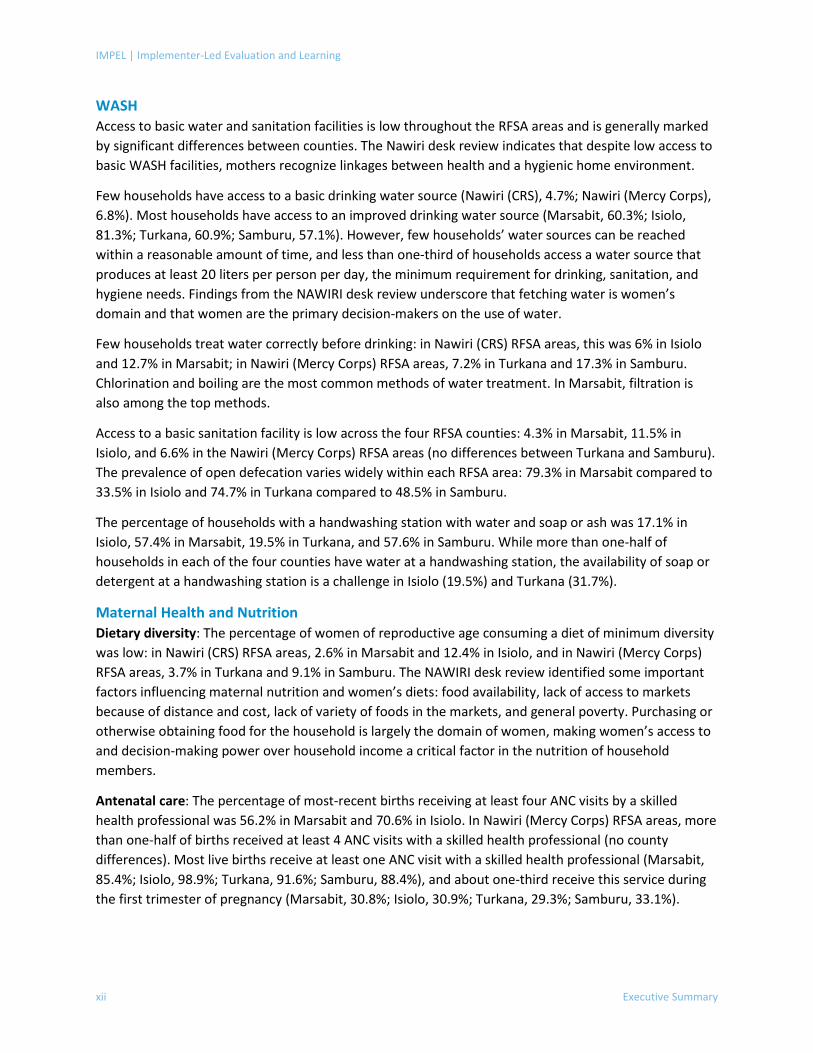
WASH Access to basic water and sanitation facilities is low throughout the RFSA areas and is generally marked by significant differences between counties. The Nawiri desk review indicates that despite low access to basic WASH facilities, mothers recognize linkages between health and a hygienic home environment.
Few households have access to a basic drinking water source (Nawiri (CRS), 4.7%; Nawiri (Mercy Corps), 6.8%). Most households have access to an improved drinking water source (Marsabit, 60.3%; Isiolo, 81.3%; Turkana, 60.9%; Samburu, 57.1%). However, few households’ water sources can be reached within a reasonable amount of time, and less than one-third of households access a water source that produces at least 20 liters per person per day, the minimum requirement for drinking, sanitation, and hygiene needs. Findings from the NAWIRI desk review underscore that fetching water is women’s domain and that women are the primary decision-makers on the use of water.
Few households treat water correctly before drinking: in Nawiri (CRS) RFSA areas, this was 6% in Isiolo and 12.7% in Marsabit; in Nawiri (Mercy Corps) RFSA areas, 7.2% in Turkana and 17.3% in Samburu. Chlorination and boiling are the most common methods of water treatment. In Marsabit, filtration is also among the top methods.
Access to a basic sanitation facility is low across the four RFSA counties: 4.3% in Marsabit, 11.5% in Isiolo, and 6.6% in the Nawiri (Mercy Corps) RFSA areas (no differences between Turkana and Samburu). The prevalence of open defecation varies widely within each RFSA area: 79.3% in Marsabit compared to 33.5% in Isiolo and 74.7% in Turkana compared to 48.5% in Samburu.
The percentage of households with a handwashing station with water and soap or ash was 17.1% in Isiolo, 57.4% in Marsabit, 19.5% in Turkana, and 57.6% in Samburu. While more than one-half of households in each of the four counties have water at a handwashing station, the availability of soap or detergent at a handwashing station is a challenge in Isiolo (19.5%) and Turkana (31.7%).
Maternal Health and Nutrition Dietary diversity: The percentage of women of reproductive age consuming a diet of minimum diversity was low: in Nawiri (CRS) RFSA areas, 2.6% in Marsabit and 12.4% in Isiolo, and in Nawiri (Mercy Corps) RFSA areas, 3.7% in Turkana and 9.1% in Samburu. The NAWIRI desk review identified some important factors influencing maternal nutrition and women’s diets: food availability, lack of access to markets because of distance and cost, lack of variety of foods in the markets, and general poverty. Purchasing or otherwise obtaining food for the household is largely the domain of women, making women’s access to and decision-making power over household income a critical factor in the nutrition of household members.
Antenatal care: The percentage of most-recent births receiving at least four ANC visits by a skilled health professional was 56.2% in Marsabit and 70.6% in Isiolo. In Nawiri (Mercy Corps) RFSA areas, more than one-half of births received at least 4 ANC visits with a skilled health professional (no county differences). Most live births receive at least one ANC visit with a skilled health professional (Marsabit, 85.4%; Isiolo, 98.9%; Turkana, 91.6%; Samburu, 88.4%), and about one-third receive this service during the first trimester of pregnancy (Marsabit, 30.8%; Isiolo, 30.9%; Turkana, 29.3%; Samburu, 33.1%).
Baseline Survey of the Nawiri Resilience Food Security Activities in Kenya (Vol. I)
Executive Summary xiii
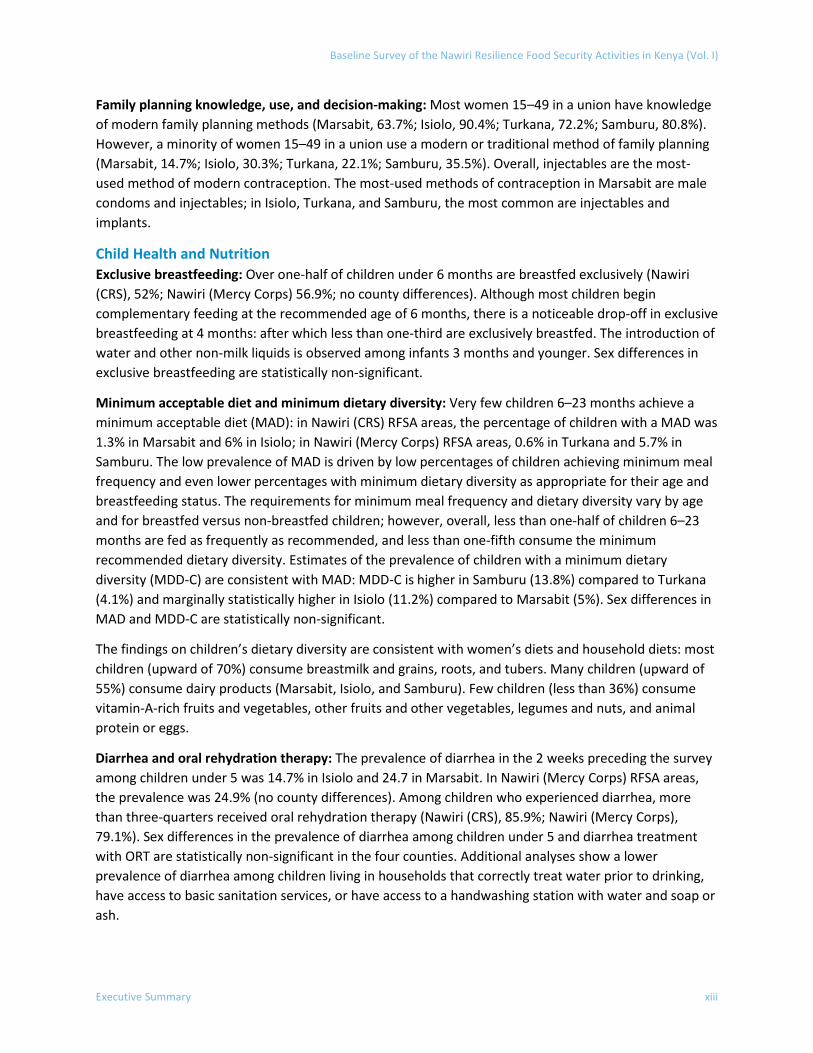
Family planning knowledge, use, and decision-making: Most women 15–49 in a union have knowledge of modern family planning methods (Marsabit, 63.7%; Isiolo, 90.4%; Turkana, 72.2%; Samburu, 80.8%). However, a minority of women 15–49 in a union use a modern or traditional method of family planning (Marsabit, 14.7%; Isiolo, 30.3%; Turkana, 22.1%; Samburu, 35.5%). Overall, injectables are the most-used method of modern contraception. The most-used methods of contraception in Marsabit are male condoms and injectables; in Isiolo, Turkana, and Samburu, the most common are injectables and implants.
Child Health and Nutrition Exclusive breastfeeding: Over one-half of children under 6 months are breastfed exclusively (Nawiri (CRS), 52%; Nawiri (Mercy Corps) 56.9%; no county differences). Although most children begin complementary feeding at the recommended age of 6 months, there is a noticeable drop-off in exclusive breastfeeding at 4 months: after which less than one-third are exclusively breastfed. The introduction of water and other non-milk liquids is observed among infants 3 months and younger. Sex differences in exclusive breastfeeding are statistically non-significant.
Minimum acceptable diet and minimum dietary diversity: Very few children 6–23 months achieve a minimum acceptable diet (MAD): in Nawiri (CRS) RFSA areas, the percentage of children with a MAD was 1.3% in Marsabit and 6% in Isiolo; in Nawiri (Mercy Corps) RFSA areas, 0.6% in Turkana and 5.7% in Samburu. The low prevalence of MAD is driven by low percentages of children achieving minimum meal frequency and even lower percentages with minimum dietary diversity as appropriate for their age and breastfeeding status. The requirements for minimum meal frequency and dietary diversity vary by age and for breastfed versus non-breastfed children; however, overall, less than one-half of children 6–23 months are fed as frequently as recommended, and less than one-fifth consume the minimum recommended dietary diversity. Estimates of the prevalence of children with a minimum dietary diversity (MDD-C) are consistent with MAD: MDD-C is higher in Samburu (13.8%) compared to Turkana (4.1%) and marginally statistically higher in Isiolo (11.2%) compared to Marsabit (5%). Sex differences in MAD and MDD-C are statistically non-significant.
The findings on children’s dietary diversity are consistent with women’s diets and household diets: most children (upward of 70%) consume breastmilk and grains, roots, and tubers. Many children (upward of 55%) consume dairy products (Marsabit, Isiolo, and Samburu). Few children (less than 36%) consume vitamin-A-rich fruits and vegetables, other fruits and other vegetables, legumes and nuts, and animal protein or eggs.
Diarrhea and oral rehydration therapy: The prevalence of diarrhea in the 2 weeks preceding the survey among children under 5 was 14.7% in Isiolo and 24.7 in Marsabit. In Nawiri (Mercy Corps) RFSA areas, the prevalence was 24.9% (no county differences). Among children who experienced diarrhea, more than three-quarters received oral rehydration therapy (Nawiri (CRS), 85.9%; Nawiri (Mercy Corps), 79.1%). Sex differences in the prevalence of diarrhea among children under 5 and diarrhea treatment with ORT are statistically non-significant in the four counties. Additional analyses show a lower prevalence of diarrhea among children living in households that correctly treat water prior to drinking, have access to basic sanitation services, or have access to a handwashing station with water and soap or ash.
IMPEL | Implementer-Led Evaluation and Learning
xiv Executive Summary
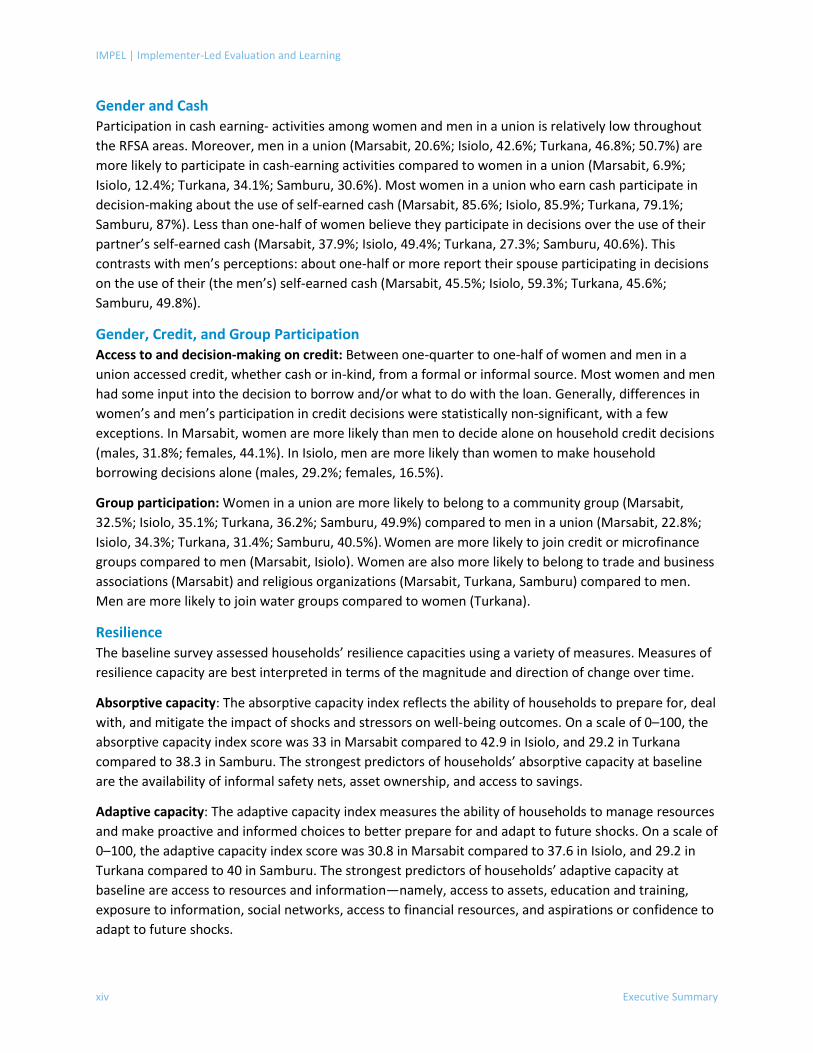
Gender and Cash Participation in cash earning- activities among women and men in a union is relatively low throughout the RFSA areas. Moreover, men in a union (Marsabit, 20.6%; Isiolo, 42.6%; Turkana, 46.8%; 50.7%) are more likely to participate in cash-earning activities compared to women in a union (Marsabit, 6.9%; Isiolo, 12.4%; Turkana, 34.1%; Samburu, 30.6%). Most women in a union who earn cash participate in decision-making about the use of self-earned cash (Marsabit, 85.6%; Isiolo, 85.9%; Turkana, 79.1%; Samburu, 87%). Less than one-half of women believe they participate in decisions over the use of their partner’s self-earned cash (Marsabit, 37.9%; Isiolo, 49.4%; Turkana, 27.3%; Samburu, 40.6%). This contrasts with men’s perceptions: about one-half or more report their spouse participating in decisions on the use of their (the men’s) self-earned cash (Marsabit, 45.5%; Isiolo, 59.3%; Turkana, 45.6%; Samburu, 49.8%).
Gender, Credit, and Group Participation Access to and decision-making on credit: Between one-quarter to one-half of women and men in a union accessed credit, whether cash or in-kind, from a formal or informal source. Most women and men had some input into the decision to borrow and/or what to do with the loan. Generally, differences in women’s and men’s participation in credit decisions were statistically non-significant, with a few exceptions. In Marsabit, women are more likely than men to decide alone on household credit decisions (males, 31.8%; females, 44.1%). In Isiolo, men are more likely than women to make household borrowing decisions alone (males, 29.2%; females, 16.5%).
Group participation: Women in a union are more likely to belong to a community group (Marsabit, 32.5%; Isiolo, 35.1%; Turkana, 36.2%; Samburu, 49.9%) compared to men in a union (Marsabit, 22.8%; Isiolo, 34.3%; Turkana, 31.4%; Samburu, 40.5%). Women are more likely to join credit or microfinance groups compared to men (Marsabit, Isiolo). Women are also more likely to belong to trade and business associations (Marsabit) and religious organizations (Marsabit, Turkana, Samburu) compared to men. Men are more likely to join water groups compared to women (Turkana).
Resilience The baseline survey assessed households’ resilience capacities using a variety of measures. Measures of resilience capacity are best interpreted in terms of the magnitude and direction of change over time.
Absorptive capacity: The absorptive capacity index reflects the ability of households to prepare for, deal with, and mitigate the impact of shocks and stressors on well-being outcomes. On a scale of 0–100, the absorptive capacity index score was 33 in Marsabit compared to 42.9 in Isiolo, and 29.2 in Turkana compared to 38.3 in Samburu. The strongest predictors of households’ absorptive capacity at baseline are the availability of informal safety nets, asset ownership, and access to savings.
Adaptive capacity: The adaptive capacity index measures the ability of households to manage resources and make proactive and informed choices to better prepare for and adapt to future shocks. On a scale of 0–100, the adaptive capacity index score was 30.8 in Marsabit compared to 37.6 in Isiolo, and 29.2 in Turkana compared to 40 in Samburu. The strongest predictors of households’ adaptive capacity at baseline are access to resources and information—namely, access to assets, education and training, exposure to information, social networks, access to financial resources, and aspirations or confidence to adapt to future shocks.
Baseline Survey of the Nawiri Resilience Food Security Activities in Kenya (Vol. I)
Executive Summary xv
Transformative capacity: The transformative capacity index involves system-level resources, governance, and institutions that comprise the enabling environment that promote or limit households’ capacity to respond to shocks and stressors. On a scale of 0–100, the transformative capacity index score was 28.3 in Marsabit and 50.4 in Isiolo. In Nawiri (Mercy Corps) RFSA areas, the transformative capacity index score averaged 36.6 (no county differences). The strongest predictors of households’ transformative capacity at baseline are access to infrastructure, livestock services, basic services, markets, and extension services.
Social capital: The index of social capital comprises an important component of households’ adaptive capacity. It measures the capacity of households to rely on social networks for support to decrease the impact of shocks and stresses on their households. The index measures both the extent of mutual support among households within their own communities (bonding) and the extent of mutual support between households in the area to households outside their own community (bridging). Baseline estimates suggest relatively high levels of social capital in the RFSA areas. On a scale of 0–100, the bonding social capital index score averaged 70.1 and the bridging social capital index score averaged 68 in Nawiri (CRS) RFSA areas (no county differences). In Nawiri (Mercy Corps) RFSA areas, households in Samburu have, on average, higher bonding social capital (72) and bridging social capital (70.4) index scores compared to households in Turkana (63.7 and 63.5, respectively).
Participation in group-based-based savings, micro-finance, or lending programs: Access to savings and access to financial services are important predictors of household absorptive capacity and adaptive capacity. In Nawiri (CRS) RFSA areas, participation in group-based savings, micro-finance, or lending programs averaged 2.9% among all households. There was no difference between the Nawiri (CRS) RFSA counties in participation in group-based credit programs, but participation in group-based savings is higher in Isiolo (5.6%) compared to Marsabit (0.6%). In Nawiri (Mercy Corps) RFSA areas, households in Samburu (12.7%) have a higher average rate of participation in group-based savings, micro-finance, or lending programs compared to households in Turkana (2.9%). This difference is driven by higher participation in savings groups (Turkana, 1.4%; Samburu, 10.1%), with participation rates also slightly higher in lending programs (Turkana, 2.2%; Samburu, 5.4%).
Ability to recover from shocks and stresses: The ability to recover from shocks and stresses index (scale: 0–6) estimates the capability of households to recuperate from typical types of shocks and stressors, such as loss of a family member, loss of income, hunger, drought, flood, conflict or similar events. The ability to recover from shocks and stresses index score ranges between 3.4 and 3.9 for households in Nawiri (CRS) and Nawiri (Mercy Corps) RFSA areas, indicating expectations of relative stability in recovery. In Nawiri (CRS) RFSA areas, households in Isiolo are slightly more pessimistic with respect to their ability to recover (3.4 score) compared to households in Marsabit (3.8 score). This is despite households in Isiolo having lower shock exposure compared to households in Marsabit.


This page is left intentionally blank.

Baseline Survey of the Nawiri Resilience Food Security Activities in Kenya (Vol. I)
Introduction 1
1. INTRODUCTION
1.1 Overview of the Baseline Study In fiscal year 2019, the United States Agency for International Development (USAID) Office of Food for Peace (FFP) funded two 5-year resilience food security activities (RFSAs) in the Isiolo, Marsabit, Samburu, and Turkana counties of Kenya. In 2020, FFP merged with the Office of Foreign Disaster Assistance (OFDA) to form the Bureau for Humanitarian Assistance (BHA) to streamline USAID humanitarian responses. BHA provides life-saving humanitarian emergency and non-emergency aid—including food, water, shelter, sanitation and hygiene, and nutrition services—to the world’s most vulnerable and hardest-to-reach populations. The goal of the 2019 RFSA awards is to sustainably reduce levels of acute malnutrition among vulnerable populations.
Under the Implementer-Led Evaluation and Learning (IMPEL) activity to improve RFSA design and implementation, Technical Assistance to NGOs (TANGO) International was contracted to conduct a baseline study in the RFSA implementation areas. The baseline study includes a population-based household survey (PBS) and qualitative information from secondary sources. TANGO contracted a local firm, Kimetrica, to collect the data for the PBS. The primary purpose of the PBS is to provide baseline population-level estimates for standard BHA performance indicators. The information generated through the baseline study will be used to inform the implementation phase of the RFSAs, measure performance of the RFSAs, strengthen accountability, and improve guidance and policy.
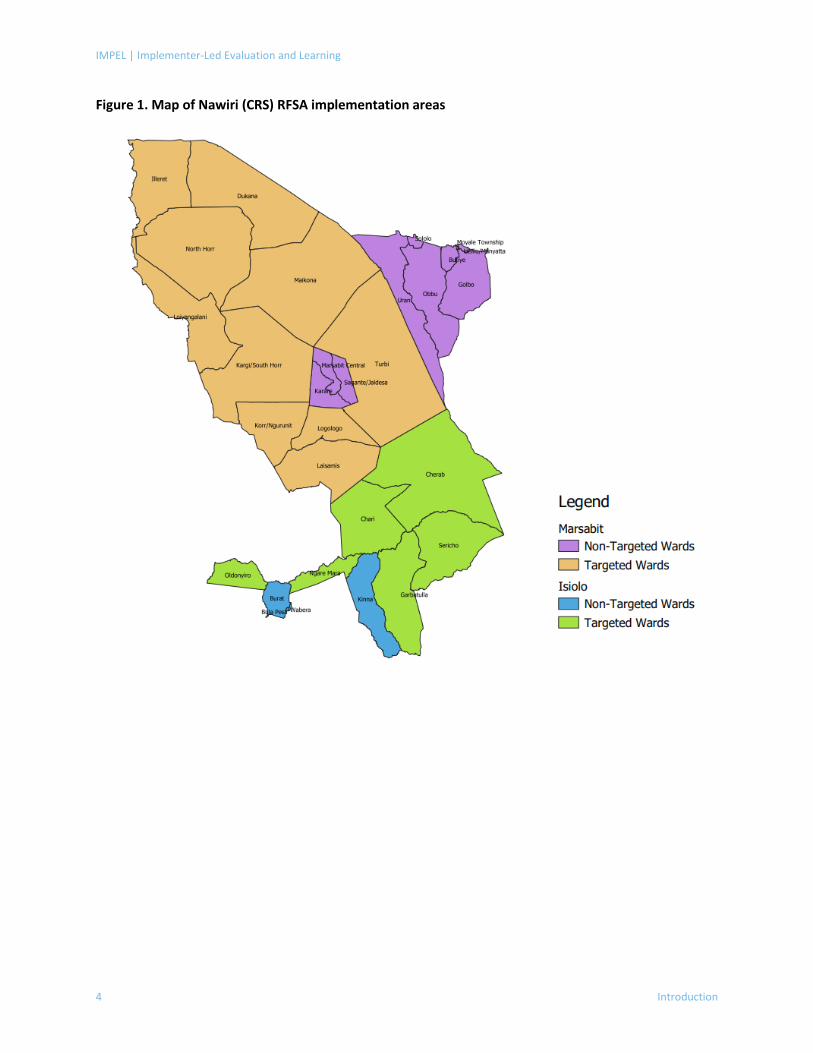
1.2 Background on BHA RFSAs in Kenya The Nawiri RFSAs in Kenya are implemented in the arid and semi-arid land (ASAL) counties of:
• Isiolo and Marsabit, led by Catholic Relief Services (CRS) in partnership with Tufts University’s Feinstein International Center, Concern Worldwide, the Global Alliance for Improved Nutrition (GAIN), International Business & Technical Consultants Inc. (IBTCI), the Manoff Group (TMG), Village Enterprise (VE), Caritas Isiolo and Caritas Marsabit; and
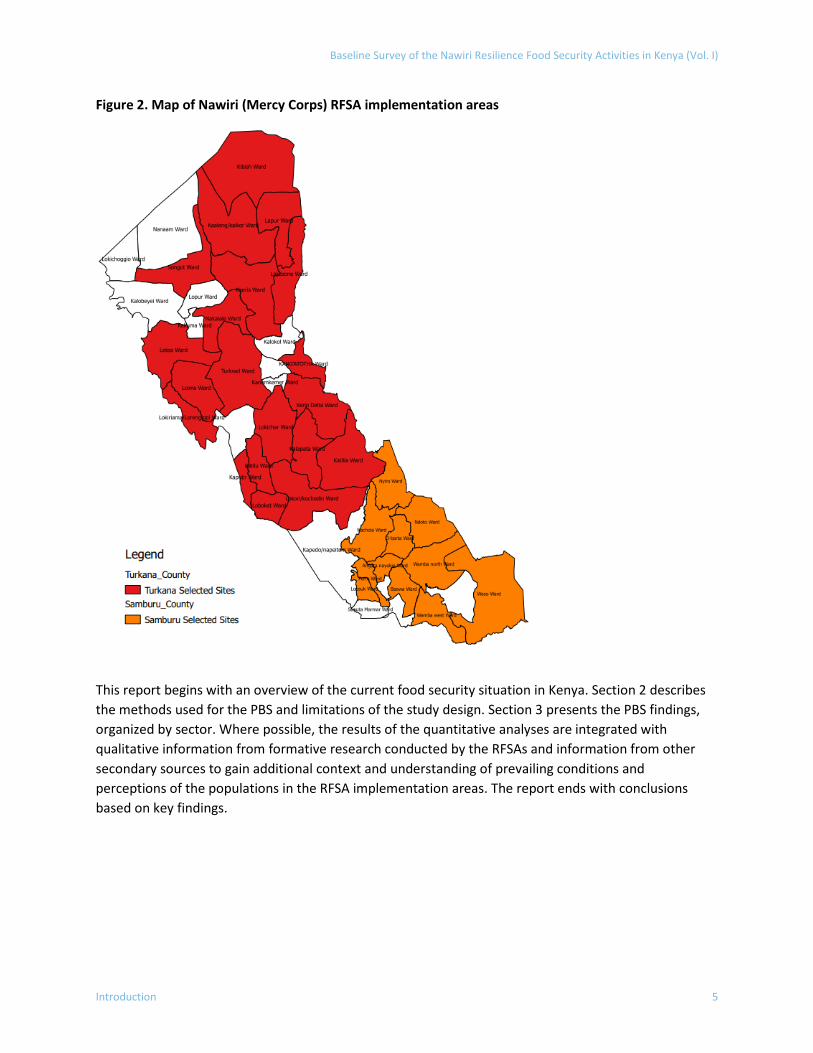
• Samburu and Turkana, led by Mercy Corps in partnership with Save the Children, Research Triangle Institute (RTI) International, the BOMA Project, Centre for Humanitarian Change (CHC), Caritas Lodwar, Caritas Maralal, and the African Population and Health Research Center (APHRC).
IMPEL | Implementer-Led Evaluation and Learning
2 Introduction
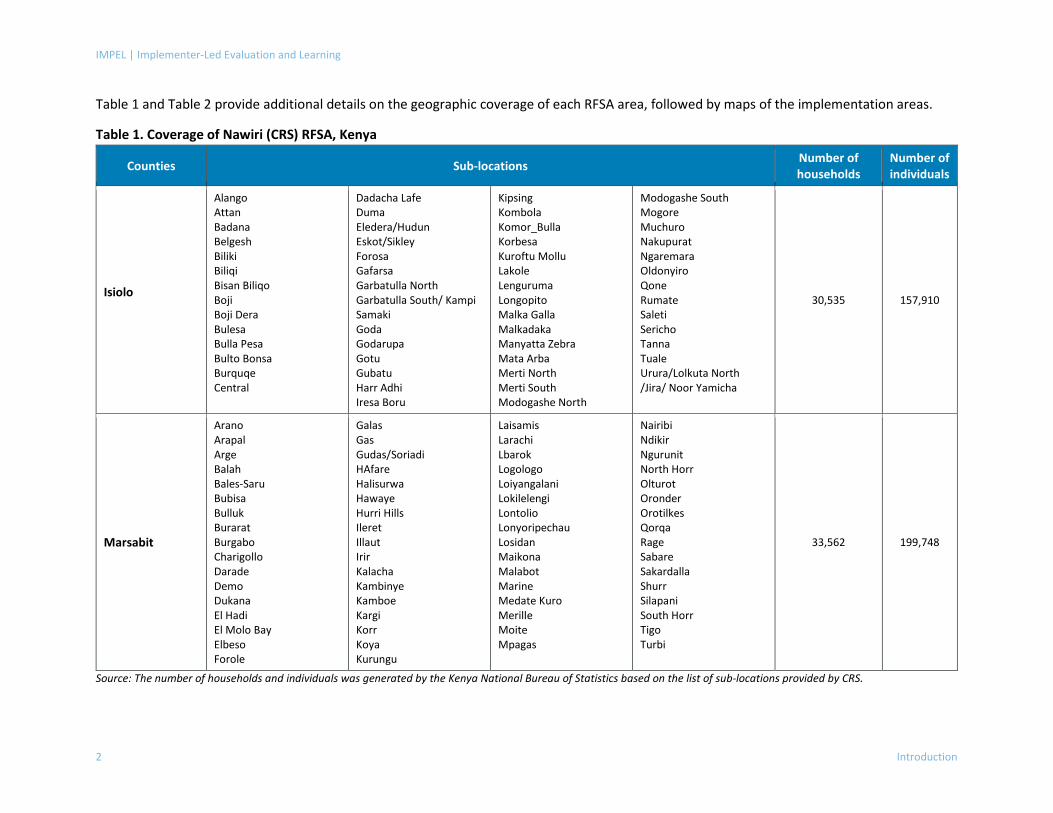
Table 1 and Table 2 provide additional details on the geographic coverage of each RFSA area, followed by maps of the implementation areas.
Table 1. Coverage of Nawiri (CRS) RFSA, Kenya
Counties Sub-locations Number of households
Number of individuals
Isiolo
Alango Attan Badana Belgesh Biliki Biliqi Bisan Biliqo Boji Boji Dera Bulesa Bulla Pesa Bulto Bonsa Burquqe Central
Dadacha Lafe Duma Eledera/Hudun Eskot/Sikley Forosa Gafarsa Garbatulla North Garbatulla South/ Kampi Samaki Goda Godarupa Gotu Gubatu Harr Adhi Iresa Boru
Kipsing Kombola Komor_Bulla Korbesa Kuroftu Mollu Lakole Lenguruma Longopito Malka Galla Malkadaka Manyatta Zebra Mata Arba Merti North Merti South Modogashe North
Modogashe South Mogore Muchuro Nakupurat Ngaremara Oldonyiro Qone Rumate Saleti Sericho Tanna Tuale Urura/Lolkuta North /Jira/ Noor Yamicha
30,535 157,910
Marsabit
Arano Arapal Arge Balah Bales-Saru Bubisa Bulluk Burarat Burgabo Charigollo Darade Demo Dukana El Hadi El Molo Bay Elbeso Forole
Galas Gas Gudas/Soriadi HAfare Halisurwa Hawaye Hurri Hills Ileret Illaut Irir Kalacha Kambinye Kamboe Kargi Korr Koya Kurungu
Laisamis Larachi Lbarok Logologo Loiyangalani Lokilelengi Lontolio Lonyoripechau Losidan Maikona Malabot Marine Medate Kuro Merille Moite Mpagas
Nairibi Ndikir Ngurunit North Horr Olturot Oronder Orotilkes Qorqa Rage Sabare Sakardalla Shurr Silapani South Horr Tigo Turbi
33,562 199,748
Source: The number of households and individuals was generated by the Kenya National Bureau of Statistics based on the list of sub-locations provided by CRS.
Baseline Survey of the Nawiri Resilience Food Security Activities in Kenya (Vol. I)
Introduction 3
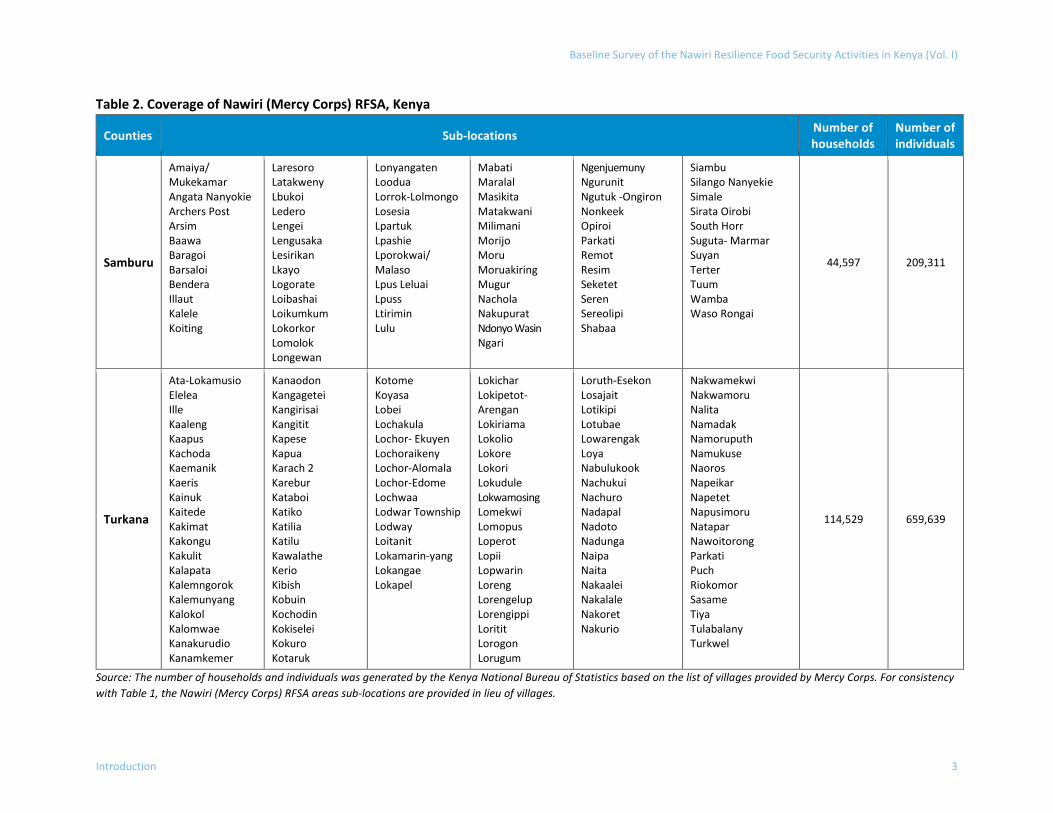
Table 2. Coverage of Nawiri (Mercy Corps) RFSA, Kenya
Counties Sub-locations Number of households
Number of individuals
Samburu
Amaiya/ Mukekamar Angata Nanyokie Archers Post Arsim Baawa Baragoi Barsaloi Bendera Illaut Kalele Koiting
Laresoro Latakweny Lbukoi Ledero Lengei Lengusaka Lesirikan Lkayo Logorate Loibashai Loikumkum Lokorkor Lomolok Longewan
Lonyangaten Loodua Lorrok-Lolmongo Losesia Lpartuk Lpashie Lporokwai/ Malaso Lpus Leluai Lpuss Ltirimin Lulu
Mabati Maralal Masikita Matakwani Milimani Morijo Moru Moruakiring Mugur Nachola Nakupurat Ndonyo Wasin Ngari
Ngenjuemuny Ngurunit Ngutuk -Ongiron Nonkeek Opiroi Parkati Remot Resim Seketet Seren Sereolipi Shabaa
Siambu Silango Nanyekie Simale Sirata Oirobi South Horr Suguta- Marmar Suyan Terter Tuum Wamba Waso Rongai
44,597 209,311
Turkana
Ata-Lokamusio Elelea Ille Kaaleng Kaapus Kachoda Kaemanik Kaeris Kainuk Kaitede Kakimat Kakongu Kakulit Kalapata Kalemngorok Kalemunyang Kalokol Kalomwae Kanakurudio Kanamkemer
Kanaodon Kangagetei Kangirisai Kangitit Kapese Kapua Karach 2 Karebur Kataboi Katiko Katilia Katilu Kawalathe Kerio Kibish Kobuin Kochodin Kokiselei Kokuro Kotaruk
Kotome Koyasa Lobei Lochakula Lochor- Ekuyen Lochoraikeny Lochor-Alomala Lochor-Edome Lochwaa Lodwar Township Lodway Loitanit Lokamarin-yang Lokangae Lokapel
Lokichar Lokipetot-Arengan Lokiriama Lokolio Lokore Lokori Lokudule Lokwamosing Lomekwi Lomopus Loperot Lopii Lopwarin Loreng Lorengelup Lorengippi Loritit Lorogon Lorugum
Loruth-Esekon Losajait Lotikipi Lotubae Lowarengak Loya Nabulukook Nachukui Nachuro Nadapal Nadoto Nadunga Naipa Naita Nakaalei Nakalale Nakoret Nakurio
Nakwamekwi Nakwamoru Nalita Namadak Namoruputh Namukuse Naoros Napeikar Napetet Napusimoru Natapar Nawoitorong Parkati Puch Riokomor Sasame Tiya Tulabalany Turkwel
114,529 659,639
Source: The number of households and individuals was generated by the Kenya National Bureau of Statistics based on the list of villages provided by Mercy Corps. For consistency with Table 1, the Nawiri (Mercy Corps) RFSA areas sub-locations are provided in lieu of villages.
IMPEL | Implementer-Led Evaluation and Learning
4 Introduction
Figure 1. Map of Nawiri (CRS) RFSA implementation areas
Baseline Survey of the Nawiri Resilience Food Security Activities in Kenya (Vol. I)
Introduction 5
Figure 2. Map of Nawiri (Mercy Corps) RFSA implementation areas
This report begins with an overview of the current food security situation in Kenya. Section 2 describes the methods used for the PBS and limitations of the study design. Section 3 presents the PBS findings, organized by sector. Where possible, the results of the quantitative analyses are integrated with qualitative information from formative research conducted by the RFSAs and information from other secondary sources to gain additional context and understanding of prevailing conditions and perceptions of the populations in the RFSA implementation areas. The report ends with conclusions based on key findings.
IMPEL | Implementer-Led Evaluation and Learning
6 Introduction
1.3 Country Context
1.3.1 Background Kenya has an estimated population of 55 million people (2021),1 and though the population is becoming more urbanized, approximately 72% of the population remains rural.2 The country ranks 143rd of the 189 countries on the Human Development Index (HDI), with an HDI score of 0.601 (2019), positioning Kenya in the medium human development category.3 Kenya’s economy is highly dependent on agriculture, which constitutes 26% of the gross domestic product (GDP) and, indirectly, an additional 27% of GDP through connections with other sectors.4 More than 70% of rural Kenya is employed in the agricultural sector.5 Agriculture is primarily rain-fed. However, due to rapid population growth, farmers are being pushed out of areas of high agricultural potential and into areas more vulnerable to drought and unpredictable weather patterns, conditions exacerbated by climate change. In turn, when agriculture expands into arid lands, pastoralists must compete with farmers for limited natural resources.6
Prior to the onset of the COVID-19 pandemic, Kenya boasted an annual average growth rate of 5.7% over 2015–2019, one of the fastest growing economies in Sub-Saharan Africa.7 Though the pandemic affected supply and demand both externally and domestically, agricultural output grew in 2020.8 2021 showed significant economic recovery, though disruption to domestic economic activity due to the pandemic and weather-related shocks such as drought persisted.9 Despite national economic gains in recent years, over one-third of the population (35.6%) lives below the national and purchasing power parity (PPP) poverty line of USD 1.90 per day.10
1.3.2 Overview of the Current Food Security Situation The FEWS NET report at the time of the baseline survey shows Crisis (Integrated Phase Classification (IPC) Phase 3) outcomes in all four RFSA counties as of October 2021; though Turkana is categorized as IPC Phase 3, the FEWS NET report indicates the IPC would likely be at least one phase worse without humanitarian assistance. In September 2021, price trends for maize were following seasonal norms, though they were also higher than recent years in pastoral markets due to reduced local supplies and border closures that reduced imports. Livestock prices overall decreased due to poor livestock body condition, with reports in Marsabit, Turkana, and Isiolo of “fair” and “fair to poor” body condition.
1 United Nations Population Fund. 2021. World Population Dashboard Kenya. Available at https://www.unfpa.org/data/world-population/KE 2 World Bank. 2022. Website accessed 13 January 2022: https://data.worldbank.org/indicator/SP.RUR.TOTL.ZS?locations=KE 3 United Nations Development Program. 2020. Human Development Report 2020. Available at http://hdr.undp.org/en/countries/profiles/NER 4 Food and Agriculture Organization of the United Nations. 2022. FAO in Kenya. Available at https://www.fao.org/kenya/fao-in-kenya/kenya-at-a-glance/en/ 5 Ibid. 6 Ibid. 7 World Bank. 2022. Kenya Overview. Available at https://www.worldbank.org/en/country/kenya/overview#1 8 Ibid. 9 Ibid. 10 World Food Programme. 2022. Available at https://www.wfp.org/countries/kenya
Baseline Survey of the Nawiri Resilience Food Security Activities in Kenya (Vol. I)
Introduction 7
Regardless, livestock prices in Isiolo exceeded the average due in part to high demand from urban areas and low market supply.
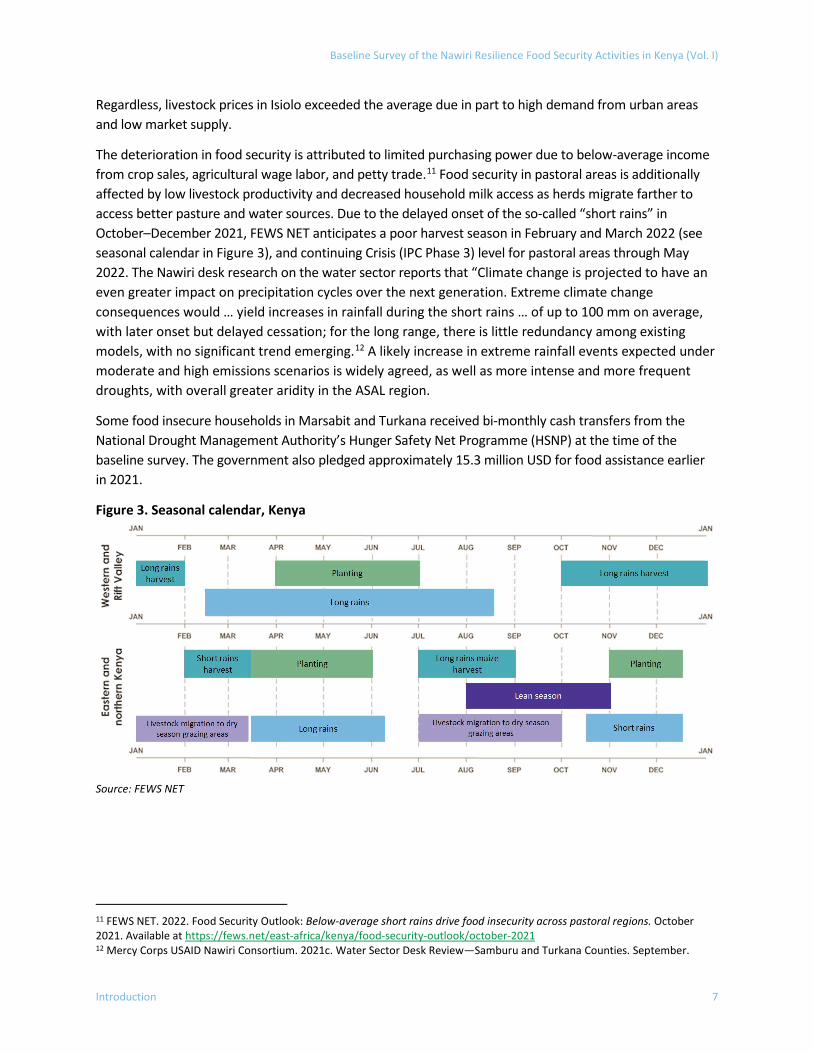
The deterioration in food security is attributed to limited purchasing power due to below-average income from crop sales, agricultural wage labor, and petty trade.11 Food security in pastoral areas is additionally affected by low livestock productivity and decreased household milk access as herds migrate farther to access better pasture and water sources. Due to the delayed onset of the so-called “short rains” in October–December 2021, FEWS NET anticipates a poor harvest season in February and March 2022 (see seasonal calendar in Figure 3), and continuing Crisis (IPC Phase 3) level for pastoral areas through May 2022. The Nawiri desk research on the water sector reports that “Climate change is projected to have an even greater impact on precipitation cycles over the next generation. Extreme climate change consequences would … yield increases in rainfall during the short rains … of up to 100 mm on average, with later onset but delayed cessation; for the long range, there is little redundancy among existing models, with no significant trend emerging.12 A likely increase in extreme rainfall events expected under moderate and high emissions scenarios is widely agreed, as well as more intense and more frequent droughts, with overall greater aridity in the ASAL region.
Some food insecure households in Marsabit and Turkana received bi-monthly cash transfers from the National Drought Management Authority’s Hunger Safety Net Programme (HSNP) at the time of the baseline survey. The government also pledged approximately 15.3 million USD for food assistance earlier in 2021.
Figure 3. Seasonal calendar, Kenya
Source: FEWS NET
11 FEWS NET. 2022. Food Security Outlook: Below-average short rains drive food insecurity across pastoral regions. October 2021. Available at https://fews.net/east-africa/kenya/food-security-outlook/october-2021 12 Mercy Corps USAID Nawiri Consortium. 2021c. Water Sector Desk Review—Samburu and Turkana Counties. September.
IMPEL | Implementer-Led Evaluation and Learning
8 Methodology and Limitations
2. METHODOLOGY AND LIMITATIONS
2.1 Study Design The baseline study is based on a cross-sectional, multi-stage cluster design to allow for the detection of statistically significant change in key indicators between the baseline and endline surveys.
2.2 Sample Design The sample size calculation for the baseline survey is based on the prevalence of poverty (percent of people living on less than $1.90/day 2011 PPP) and the prevalence of moderate and severe food insecurity (based on the Food Insecurity Experience Scale (FIES)). Although the primary objective of the RFSAs is to reduce acute malnutrition, the baseline survey did not include anthropometric measures because this information will be collected by the implementing partners (IPs) through a routine monitoring system. For this reason, the survey uses the indicators of poverty and food insecurity as the basis of the sample size calculations. Statistical information from the 2018 baseline survey of the USAID Partnership for Resilience and Economic Growth (PREG) Initiative in Northern Kenya Phase II and guidance from the Feed the Future Population-based Sampling Guide were used to inform the selection of the parameters for the sample size calculations. The sample size formula used is for detecting changes in proportion variables.
The following parameter values were applied in the calculations: i) design effect of 5; ii) 95% confidence level for one-tailed test; iii) 80% power for one-tailed test; (iv) expected change of 13-14percentage points over the 3-year implementation phase (approximately 4 to 5percentage points per year); and v) non-response factor of 20% to account for estimated household non-response rate. Sample size calculations were performed to detect the expected change at the county level. The highest minimum required sample size was selected based on these calculations. Additional details on the sampling methodology, including the indicators and parameters for determining the sample size, can be found in the study protocol in Annex A.
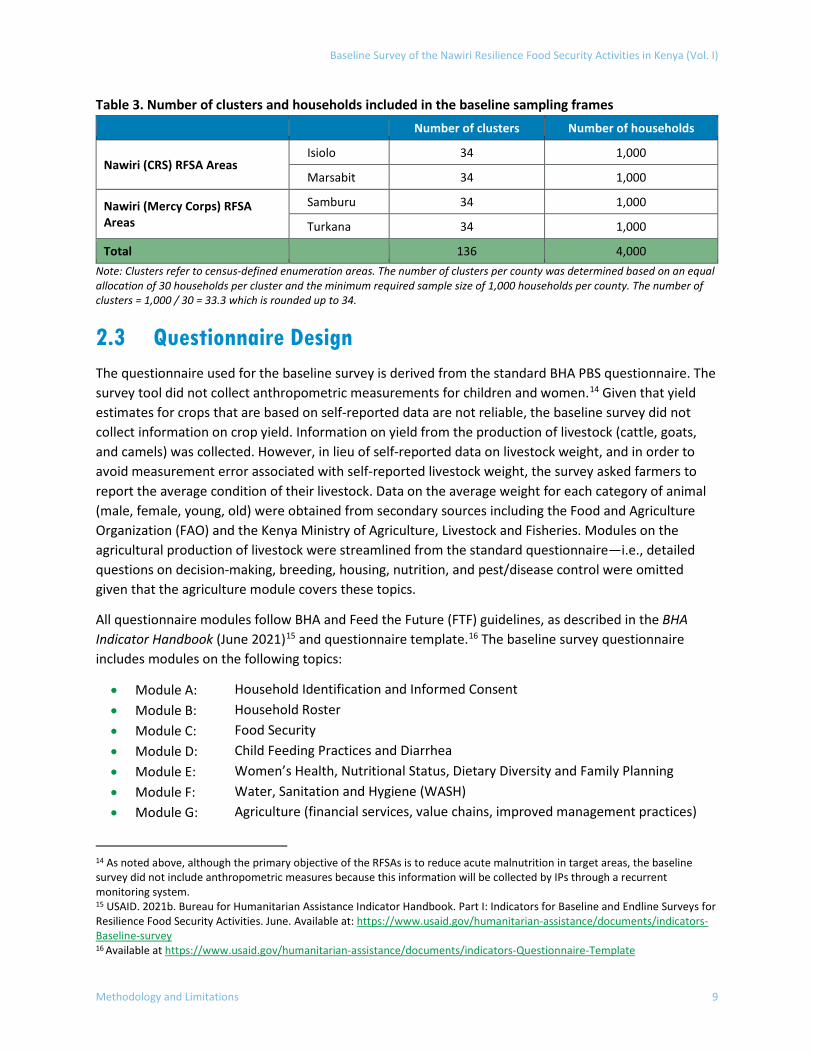
A stratified multi-stage clustered sample design was used with two stages of sampling: (1) selection of clusters (34 clusters plus 9 reserve clusters per county), and (2) selection of households (30 households per cluster).13 A total of 136 clusters were listed, with 30 households sampled in each village, resulting in a sample size of 4,000 households. Table 3 illustrates the derived sample size by county.
13 The study protocol (see Annex A) provides a detailed description of the sampling methodology, including criteria for defining “household” and household member selection procedures, and the indicators and parameters for determining the sample size.
Baseline Survey of the Nawiri Resilience Food Security Activities in Kenya (Vol. I)
Methodology and Limitations 9
Table 3. Number of clusters and households included in the baseline sampling frames Number of clusters Number of households
Nawiri (CRS) RFSA Areas Isiolo 34 1,000
Marsabit 34 1,000
Nawiri (Mercy Corps) RFSA Areas
Samburu 34 1,000
Turkana 34 1,000
Total 136 4,000 Note: Clusters refer to census-defined enumeration areas. The number of clusters per county was determined based on an equal allocation of 30 households per cluster and the minimum required sample size of 1,000 households per county. The number of clusters = 1,000 / 30 = 33.3 which is rounded up to 34.
2.3 Questionnaire Design The questionnaire used for the baseline survey is derived from the standard BHA PBS questionnaire. The survey tool did not collect anthropometric measurements for children and women.14 Given that yield estimates for crops that are based on self-reported data are not reliable, the baseline survey did not collect information on crop yield. Information on yield from the production of livestock (cattle, goats, and camels) was collected. However, in lieu of self-reported data on livestock weight, and in order to avoid measurement error associated with self-reported livestock weight, the survey asked farmers to report the average condition of their livestock. Data on the average weight for each category of animal (male, female, young, old) were obtained from secondary sources including the Food and Agriculture Organization (FAO) and the Kenya Ministry of Agriculture, Livestock and Fisheries. Modules on the agricultural production of livestock were streamlined from the standard questionnaire—i.e., detailed questions on decision-making, breeding, housing, nutrition, and pest/disease control were omitted given that the agriculture module covers these topics.
All questionnaire modules follow BHA and Feed the Future (FTF) guidelines, as described in the BHA Indicator Handbook (June 2021)15 and questionnaire template.16 The baseline survey questionnaire includes modules on the following topics:
• Module A: Household Identification and Informed Consent • Module B: Household Roster • Module C: Food Security • Module D: Child Feeding Practices and Diarrhea • Module E: Women’s Health, Nutritional Status, Dietary Diversity and Family Planning • Module F: Water, Sanitation and Hygiene (WASH) • Module G: Agriculture (financial services, value chains, improved management practices)
14 As noted above, although the primary objective of the RFSAs is to reduce acute malnutrition in target areas, the baseline survey did not include anthropometric measures because this information will be collected by IPs through a recurrent monitoring system. 15 USAID. 2021b. Bureau for Humanitarian Assistance Indicator Handbook. Part I: Indicators for Baseline and Endline Surveys for Resilience Food Security Activities. June. Available at: https://www.usaid.gov/humanitarian-assistance/documents/indicators-Baseline-survey 16 Available at https://www.usaid.gov/humanitarian-assistance/documents/indicators-Questionnaire-Template
IMPEL | Implementer-Led Evaluation and Learning
10 Methodology and Limitations
Questions and response options were adapted to the country context such as those that involve food in Modules C, D, E, and Module 8, and the types of containers and sanitation facilities listed in Module F. The survey was also contextualized to capture information on different improved agricultural practices and value chain activities promoted by each IP (Module G). A COVID-19 sub-module was added to Module R (Resilience) to collect information on knowledge and adoption of COVID-19 mitigation practices, the impacts of COVID-19 on households’ livelihoods, and food security and coping strategies to manage those impacts. The survey was programmed using Census and Survey Processing System (CSPro) and took approximately 3 hours to complete.
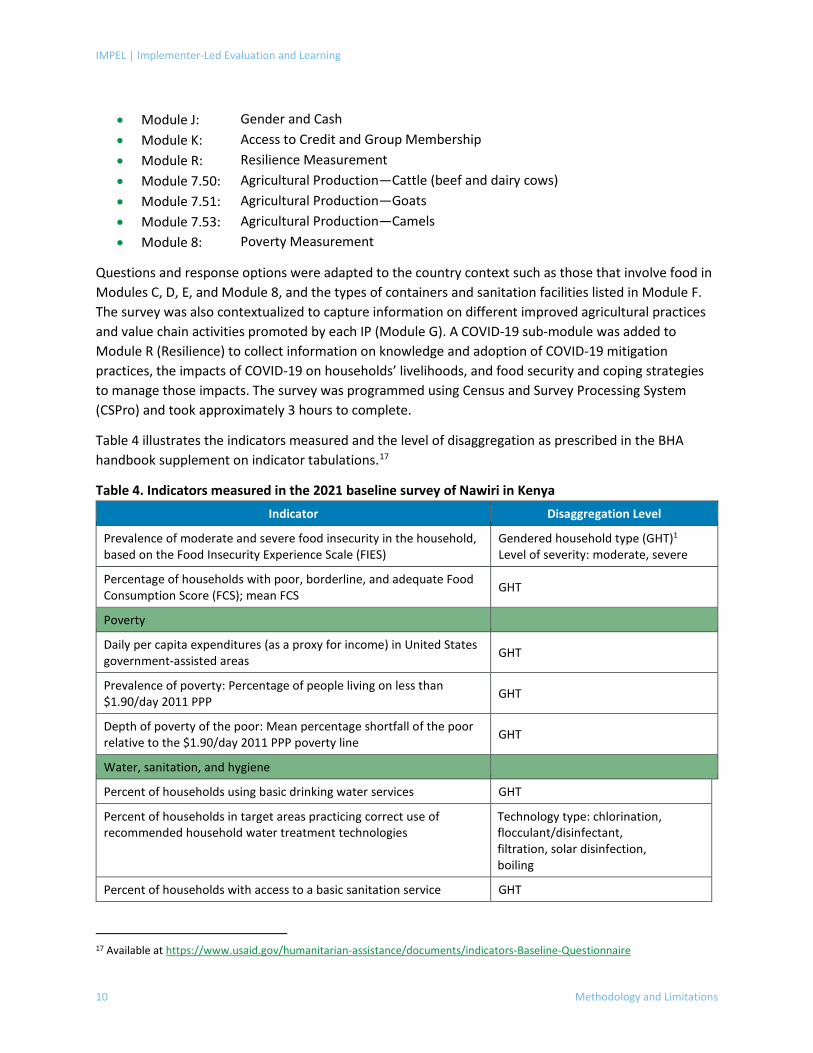
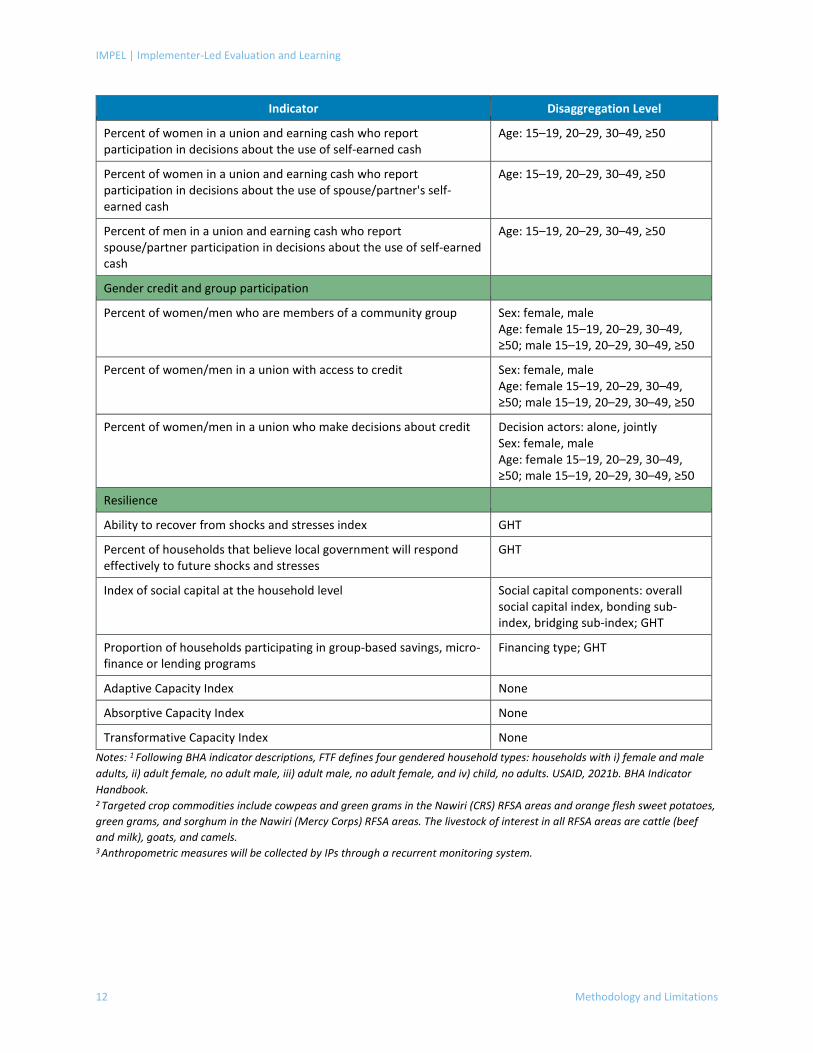
Table 4 illustrates the indicators measured and the level of disaggregation as prescribed in the BHA handbook supplement on indicator tabulations.17
Table 4. Indicators measured in the 2021 baseline survey of Nawiri in Kenya Indicator Disaggregation Level
Prevalence of moderate and severe food insecurity in the household, based on the Food Insecurity Experience Scale (FIES)
Gendered household type (GHT)1
Level of severity: moderate, severe
Percentage of households with poor, borderline, and adequate Food Consumption Score (FCS); mean FCS GHT
Poverty
Daily per capita expenditures (as a proxy for income) in United States government-assisted areas GHT
Prevalence of poverty: Percentage of people living on less than $1.90/day 2011 PPP GHT
Depth of poverty of the poor: Mean percentage shortfall of the poor relative to the $1.90/day 2011 PPP poverty line GHT
Water, sanitation, and hygiene
Percent of households using basic drinking water services GHT
Percent of households in target areas practicing correct use of recommended household water treatment technologies
Technology type: chlorination, flocculant/disinfectant, filtration, solar disinfection, boiling
Percent of households with access to a basic sanitation service GHT
17 Available at https://www.usaid.gov/humanitarian-assistance/documents/indicators-Baseline-Questionnaire
• Module J: Gender and Cash • Module K: Access to Credit and Group Membership • Module R: Resilience Measurement • Module 7.50: Agricultural Production—Cattle (beef and dairy cows) • Module 7.51: Agricultural Production—Goats • Module 7.53: Agricultural Production—Camels • Module 8: Poverty Measurement
Baseline Survey of the Nawiri Resilience Food Security Activities in Kenya (Vol. I)
Methodology and Limitations 11
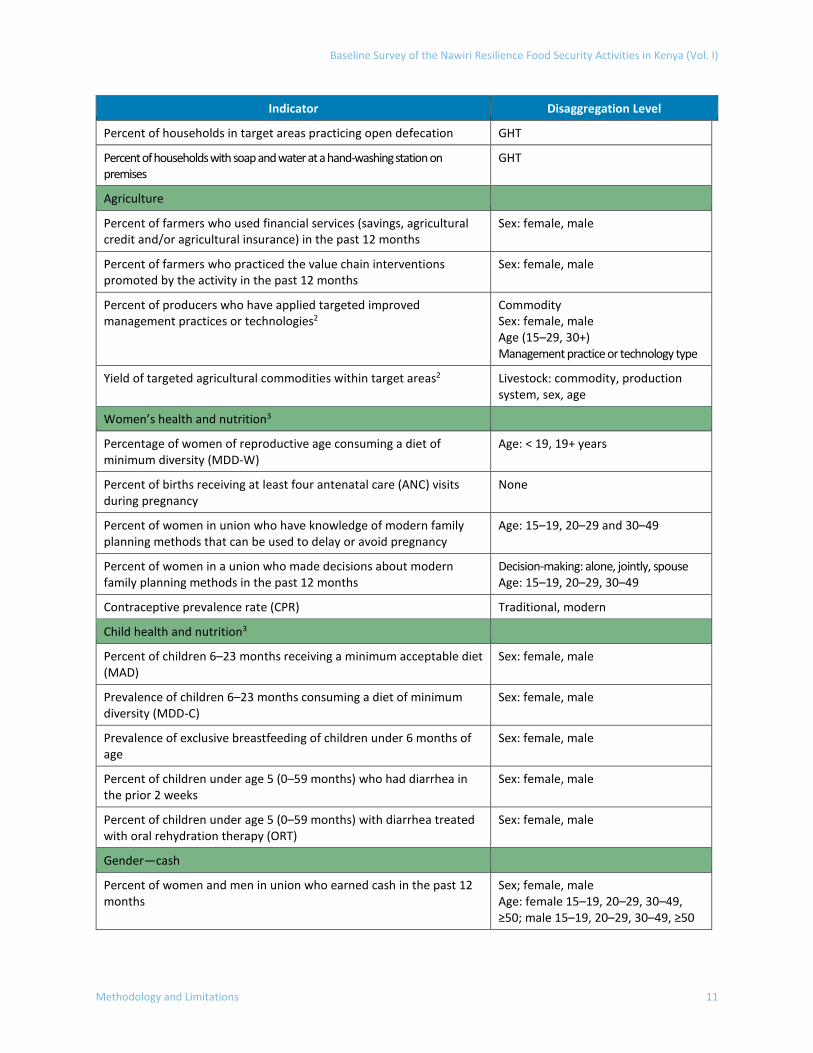
Indicator Disaggregation Level
Percent of households in target areas practicing open defecation GHT
Percent of households with soap and water at a hand-washing station on premises
GHT
Agriculture
Percent of farmers who used financial services (savings, agricultural credit and/or agricultural insurance) in the past 12 months
Sex: female, male
Percent of farmers who practiced the value chain interventions promoted by the activity in the past 12 months
Sex: female, male
Percent of producers who have applied targeted improved management practices or technologies2
Commodity Sex: female, male Age (15–29, 30+) Management practice or technology type
Yield of targeted agricultural commodities within target areas2 Livestock: commodity, production system, sex, age
Women’s health and nutrition3
Percentage of women of reproductive age consuming a diet of minimum diversity (MDD-W)
Age: < 19, 19+ years
Percent of births receiving at least four antenatal care (ANC) visits during pregnancy
None
Percent of women in union who have knowledge of modern family planning methods that can be used to delay or avoid pregnancy
Age: 15–19, 20–29 and 30–49
Percent of women in a union who made decisions about modern family planning methods in the past 12 months
Decision-making: alone, jointly, spouse Age: 15–19, 20–29, 30–49
Contraceptive prevalence rate (CPR) Traditional, modern
Child health and nutrition3
Percent of children 6–23 months receiving a minimum acceptable diet (MAD)
Sex: female, male
Prevalence of children 6–23 months consuming a diet of minimum diversity (MDD-C)
Sex: female, male
Prevalence of exclusive breastfeeding of children under 6 months of age
Sex: female, male
Percent of children under age 5 (0–59 months) who had diarrhea in the prior 2 weeks
Sex: female, male
Percent of children under age 5 (0–59 months) with diarrhea treated with oral rehydration therapy (ORT)
Sex: female, male
Gender—cash
Percent of women and men in union who earned cash in the past 12 months
Sex; female, male Age: female 15–19, 20–29, 30–49, ≥50; male 15–19, 20–29, 30–49, ≥50
IMPEL | Implementer-Led Evaluation and Learning
12 Methodology and Limitations
Indicator Disaggregation Level
Percent of women in a union and earning cash who report participation in decisions about the use of self-earned cash
Age: 15–19, 20–29, 30–49, ≥50
Percent of women in a union and earning cash who report participation in decisions about the use of spouse/partner's self-earned cash
Age: 15–19, 20–29, 30–49, ≥50
Percent of men in a union and earning cash who report spouse/partner participation in decisions about the use of self-earned cash
Age: 15–19, 20–29, 30–49, ≥50
Gender credit and group participation
Percent of women/men who are members of a community group Sex: female, male Age: female 15–19, 20–29, 30–49, ≥50; male 15–19, 20–29, 30–49, ≥50
Percent of women/men in a union with access to credit Sex: female, male Age: female 15–19, 20–29, 30–49, ≥50; male 15–19, 20–29, 30–49, ≥50
Percent of women/men in a union who make decisions about credit Decision actors: alone, jointly Sex: female, male Age: female 15–19, 20–29, 30–49, ≥50; male 15–19, 20–29, 30–49, ≥50
Resilience
Ability to recover from shocks and stresses index GHT
Percent of households that believe local government will respond effectively to future shocks and stresses
GHT
Index of social capital at the household level Social capital components: overall social capital index, bonding sub-index, bridging sub-index; GHT
Proportion of households participating in group-based savings, micro-finance or lending programs
Financing type; GHT
Adaptive Capacity Index None
Absorptive Capacity Index None
Transformative Capacity Index None Notes: 1 Following BHA indicator descriptions, FTF defines four gendered household types: households with i) female and male adults, ii) adult female, no adult male, iii) adult male, no adult female, and iv) child, no adults. USAID, 2021b. BHA Indicator Handbook. 2 Targeted crop commodities include cowpeas and green grams in the Nawiri (CRS) RFSA areas and orange flesh sweet potatoes, green grams, and sorghum in the Nawiri (Mercy Corps) RFSA areas. The livestock of interest in all RFSA areas are cattle (beef and milk), goats, and camels. 3 Anthropometric measures will be collected by IPs through a recurrent monitoring system.
Baseline Survey of the Nawiri Resilience Food Security Activities in Kenya (Vol. I)
Methodology and Limitations 13
2.4 Field Procedures
2.4.1 Timing of the Survey Data collection for the baseline study was expected to start on August 30 and end on September 24, 2021. However, data collection was set back due to several factors: delays in issuing Kimetrica’s contract, the need for multiple rounds of discussions with BHA and IPs to finalize the questionnaire, difficulty recruiting qualified listers in northern Kenya, and the need to revise the sampling approach to account for the mix of villages and sub-locations. Based on the revised schedule, the survey was conducted in October 2021 and ended at the start of November 2021.
2.4.2 Listing Exercise The listing training and exercise took place between September 12 and September 23, 2021. Kimetrica conducted the listing training, mapping of selected clusters and listing of households. Listers were trained on how to locate a cluster (i.e., enumeration area), prepare sketch maps of the cluster, list households, and segment large clusters. The household listing operation was conducted by 80 listing field personnel: 64 listers (16 listers per county) across 136 clusters with 16 team leads (4 per county) with oversight by four field supervisors (one per county).
During the listing exercise, GPS coordinates for each village were taken by using a designated central point in the village. GPS coordinates were also taken for each listed household to facilitate locating sampled households during data collection. During the listing exercise, TANGO replaced 12 clusters initially selected for the baseline survey with reserve clusters due to security risks.18 The results of the listing exercise were used for second-stage household sampling.
2.4.3 Training Due to the COVID pandemic, TANGO conducted the training of trainers (ToT) virtually. The main (enumerator) training was held in person. COVID-19 mitigation and safety protocols, including social distancing, the use of face masks, and temperature checks, were adhered to throughout the training sessions and throughout the survey (see Annex A for details).
Training of Trainers TANGO led a virtual ToT for Kimetrica field supervisors, local independent survey monitors, and team leads. The 5-day ToT was conducted via Zoom from September 25 to September 29. TANGO trained 4 field coordinators, 24 team leads, and 8 local survey monitors. The ToT focused on roles and responsibilities, organization and supervision of fieldwork, data quality assurance, and performance monitoring. Sessions also involved a question-by-question review of the instrument. To capitalize on time- zone differences, the training schedule was adapted to begin in the afternoon in Kenyan time so that the mornings could be
18 The number of clusters replaced during the listing exercise by county are as follows: Isiolo, 5; Turkana, 3; Samburu, 4. An additional two clusters in Isiolo were replaced during data collection due to concerns for insecurity and inaccessibility due to flooding.
IMPEL | Implementer-Led Evaluation and Learning
14 Methodology and Limitations
used for study periods to review manuals and conduct mock interviews using tablets, to ensure that all participants were well versed in the instrument and in navigating the electronic survey.
Main Training The 7-day main (enumerator) training was conducted from October 1 to October 7, 2021. A total of 144 enumerators were trained.19 Kimetrica field coordinators and the independent survey monitors, previously trained by TANGO during the ToT, conducted the main training with remote support from TANGO.20 Local independent survey monitors, trained during the ToT, participated in the main training, observed the mock interviews, and provided feedback. Training topics included data gathering, sampling strategy, human subjects research and informed consent, a review of the survey questionnaire, how to gather data using mobile devices, data checks for quality control, creating backup copies of data, and data archiving and transfer. The training included a combination of plenary sessions for question-by-question guidance and break-out groups to practice and role-play using the tablets. The break-out groups were followed by a plenary session to discuss issues experienced and how to handle them. An events calendar for Kenya was developed as a reference to help enumerators estimate the age of respondents when the age could not be ascertained. Photographs of sanitation facilities and water containers were provided to improve accuracy in recoding responses. Local IP staff participated in the training and gave technical presentations on their RFSAs.
2.4.4 Pilot At the end of the enumerator training, a 1-day pilot test was conducted on October 8, 2021 in the periphery of Nakuru town—a predominantly urban area, about 5 km from the town center. Each enumerator completed two full interviews during the pilot test. Each interview took approximately 2 hours, depending on the size of the household. Team leads and field coordinators observed enumerators and took notes on their performance. On October 9, the Kimetrica survey manager, field coordinators, and team leads debriefed their teams, discussing challenges and issues experienced during the pilot. The debrief sessions were attended by TANGO staff.
2.4.5 Fieldwork Fieldwork began on October 12, 2021. During this period, TANGO revised the electronic questionnaire based on the results of the pilot, and data collection teams were provided with a refresher training before travelling to their respective first clusters. Twenty-four teams conducted the data collection (six teams per county). Each team was comprised of one team lead and five enumerators.21 In addition, Kimetrica’s field team included one survey manager, four field coordinators, and one IT specialist for a total of 150 field staff. Eight local survey monitors (two in each county) independent of Kimetrica and hired directly by TANGO, accompanied the teams throughout the 21 days of data collection, overseeing fieldwork and providing feedback to Kimetrica field coordinators to communicate back to team leads.22
19 Kimetrica recruited and trained 120 enumerators plus an additional 20% (total: 144 people trained) to serve as replacements if needed. 20 TANGO and the trainers were connected on a WhatsApp group and communicated daily and as needed when issues arose during the training. In addition, TANGO staff connected via Zoom and participated in the daily de-brief plenary sessions where issues were discussed among trainers and participants. 21 Data collection teams were comprised of approximately 50% female enumerators and team leads. 22 Annex C provides a list of the study personnel.
Baseline Survey of the Nawiri Resilience Food Security Activities in Kenya (Vol. I)
Methodology and Limitations 15
Data were collected using tablets programmed with CSPro software. Completed interviews were uploaded daily to a cloud server via secure transmission. TANGO convened daily debriefs with local survey monitors and with the Kimetrica survey manager to discuss and resolve issues (e.g., issues with the instrument, data collection program/tablet, survey protocols, etc.) as they emerged.
2.4.6 Quality Assurance Protocols TANGO ensures high-quality data through a strong emphasis on training field staff, monitoring data collection, and quality control during fieldwork. The data treatment and analysis plan provides details about TANGO’s quality assurance protocols at every stage of survey implementation, including data processing (see Annex D).
2.5 Data Analysis
2.5.1 Sampling Weights Separate sampling weights were calculated for indicators and adjusted to compensate for household and individual non-response. Sampling weights were calculated separately for each county and for each of the following distinct groups by taking the inverse of the probabilities of selection from each stage of sampling:
• Households (modules C, F, N, R) • Children under 5 (Module D) • Women 15–49 (Module E) • Female and male cash earners married or in a union (Module J) • Females and males married or in a union (Module K) • Farmers (Module G)
Separate non-response adjustments were calculated for sub-populations with different response rates:
• Female cash-earners versus male cash-earners (Module J) • Females in a union versus males in a union (Module K) • Livestock producers versus all farmers, specifically separate weights for each of the following:
o Cattle producers (Module 7.50) o Goat producers (Module 7.51) o Camel producers (Module 7.53)
Table 5 illustrates response rates by sampling group for each county.23 Refer to Annex D for details on the calculation of sampling weights.
23 Enumerators attempted to complete interviews with all eligible respondents in the household. Possible reasons for non-response include refusal to participate or the member being absent from the household at the time of the visit (and subsequent revisits). In some cases where the eligible respondent is unavailable, it is possible to interview a knowledgeable person (adult) in place of the selected respondent after three re-visits/attempts have been made to interview the selected member. This type of substitution is allowed for modules capturing household-level information (i.e., modules A, B, C, F, and R). It is also possible to interview a responsible adult knowledgeable of farming/livestock practices in lieu of the eligible farmer/herder if s/he is
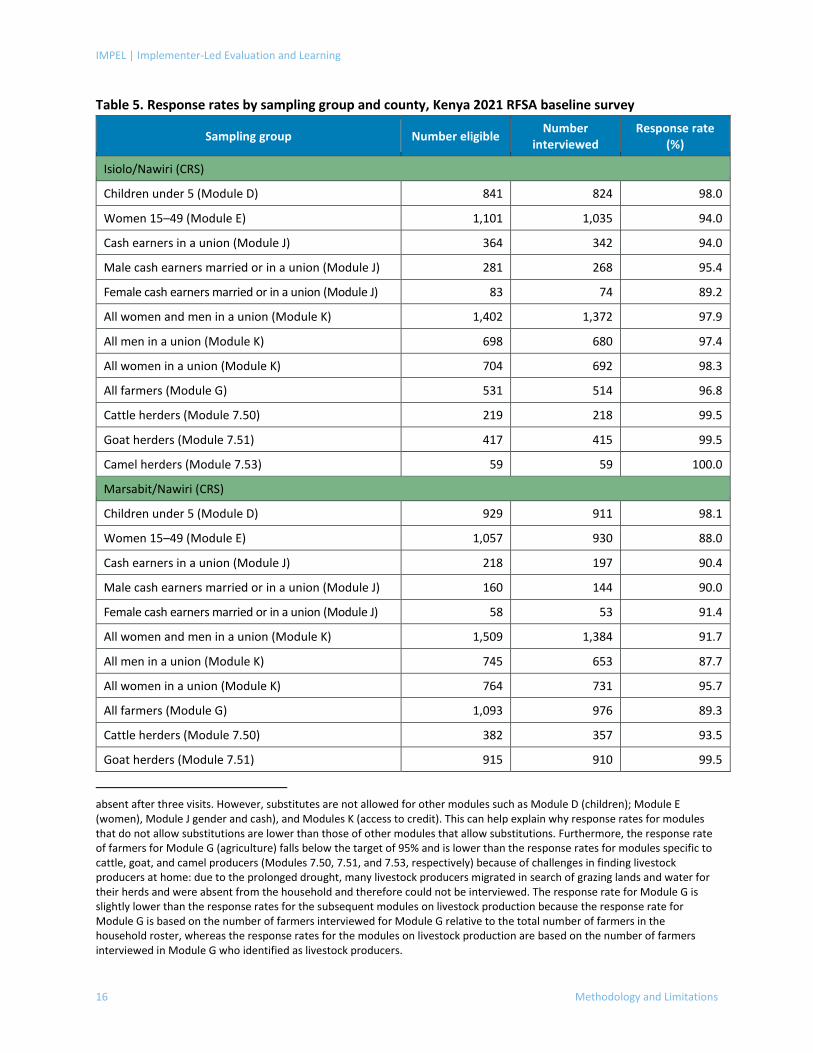
IMPEL | Implementer-Led Evaluation and Learning
16 Methodology and Limitations
Table 5. Response rates by sampling group and county, Kenya 2021 RFSA baseline survey
Sampling group Number eligible Number interviewed
Response rate (%)
Isiolo/Nawiri (CRS)
Children under 5 (Module D) 841 824 98.0
Women 15–49 (Module E) 1,101 1,035 94.0
Cash earners in a union (Module J) 364 342 94.0
Male cash earners married or in a union (Module J) 281 268 95.4
Female cash earners married or in a union (Module J) 83 74 89.2
All women and men in a union (Module K) 1,402 1,372 97.9
All men in a union (Module K) 698 680 97.4
All women in a union (Module K) 704 692 98.3
All farmers (Module G) 531 514 96.8
Cattle herders (Module 7.50) 219 218 99.5
Goat herders (Module 7.51) 417 415 99.5
Camel herders (Module 7.53) 59 59 100.0
Marsabit/Nawiri (CRS)
Children under 5 (Module D) 929 911 98.1
Women 15–49 (Module E) 1,057 930 88.0
Cash earners in a union (Module J) 218 197 90.4
Male cash earners married or in a union (Module J) 160 144 90.0
Female cash earners married or in a union (Module J) 58 53 91.4
All women and men in a union (Module K) 1,509 1,384 91.7
All men in a union (Module K) 745 653 87.7
All women in a union (Module K) 764 731 95.7
All farmers (Module G) 1,093 976 89.3
Cattle herders (Module 7.50) 382 357 93.5
Goat herders (Module 7.51) 915 910 99.5
absent after three visits. However, substitutes are not allowed for other modules such as Module D (children); Module E (women), Module J gender and cash), and Modules K (access to credit). This can help explain why response rates for modules that do not allow substitutions are lower than those of other modules that allow substitutions. Furthermore, the response rate of farmers for Module G (agriculture) falls below the target of 95% and is lower than the response rates for modules specific to cattle, goat, and camel producers (Modules 7.50, 7.51, and 7.53, respectively) because of challenges in finding livestock producers at home: due to the prolonged drought, many livestock producers migrated in search of grazing lands and water for their herds and were absent from the household and therefore could not be interviewed. The response rate for Module G is slightly lower than the response rates for the subsequent modules on livestock production because the response rate for Module G is based on the number of farmers interviewed for Module G relative to the total number of farmers in the household roster, whereas the response rates for the modules on livestock production are based on the number of farmers interviewed in Module G who identified as livestock producers.
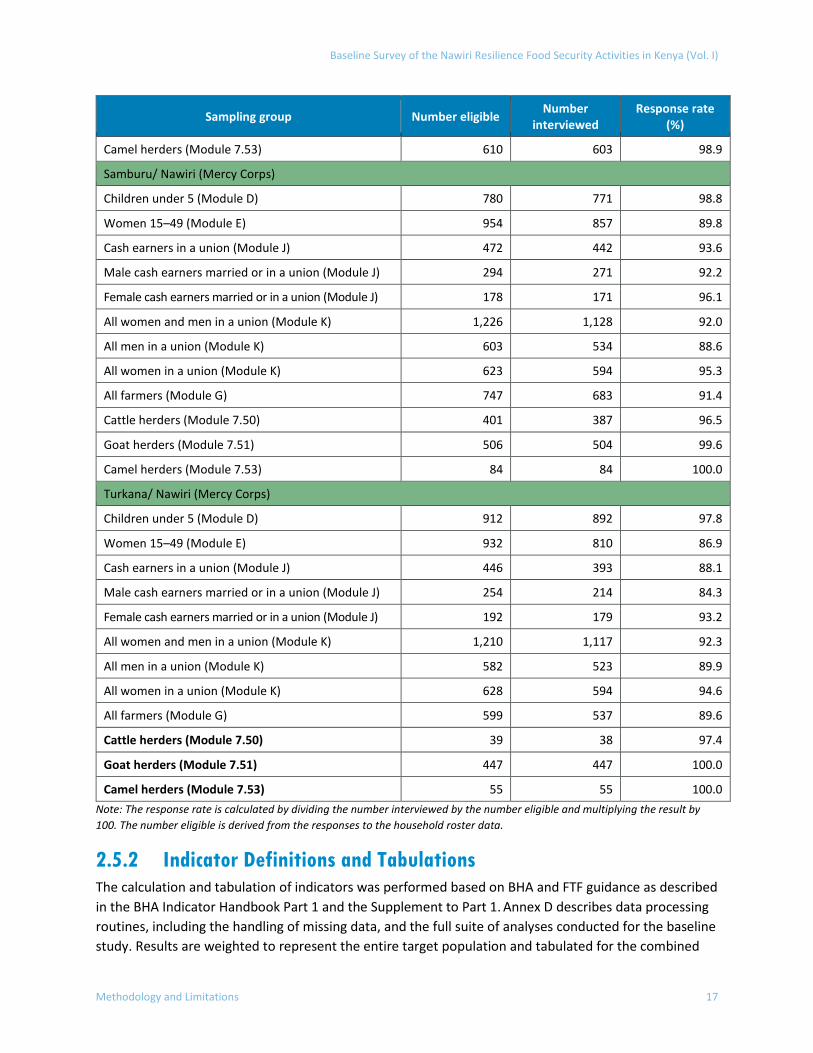
Baseline Survey of the Nawiri Resilience Food Security Activities in Kenya (Vol. I)
Methodology and Limitations 17
Sampling group Number eligible Number interviewed
Response rate (%)
Camel herders (Module 7.53) 610 603 98.9
Samburu/ Nawiri (Mercy Corps)
Children under 5 (Module D) 780 771 98.8
Women 15–49 (Module E) 954 857 89.8
Cash earners in a union (Module J) 472 442 93.6
Male cash earners married or in a union (Module J) 294 271 92.2
Female cash earners married or in a union (Module J) 178 171 96.1
All women and men in a union (Module K) 1,226 1,128 92.0
All men in a union (Module K) 603 534 88.6
All women in a union (Module K) 623 594 95.3
All farmers (Module G) 747 683 91.4
Cattle herders (Module 7.50) 401 387 96.5
Goat herders (Module 7.51) 506 504 99.6
Camel herders (Module 7.53) 84 84 100.0
Turkana/ Nawiri (Mercy Corps)
Children under 5 (Module D) 912 892 97.8
Women 15–49 (Module E) 932 810 86.9
Cash earners in a union (Module J) 446 393 88.1
Male cash earners married or in a union (Module J) 254 214 84.3
Female cash earners married or in a union (Module J) 192 179 93.2
All women and men in a union (Module K) 1,210 1,117 92.3
All men in a union (Module K) 582 523 89.9
All women in a union (Module K) 628 594 94.6
All farmers (Module G) 599 537 89.6
Cattle herders (Module 7.50) 39 38 97.4
Goat herders (Module 7.51) 447 447 100.0
Camel herders (Module 7.53) 55 55 100.0 Note: The response rate is calculated by dividing the number interviewed by the number eligible and multiplying the result by 100. The number eligible is derived from the responses to the household roster data.
2.5.2 Indicator Definitions and Tabulations The calculation and tabulation of indicators was performed based on BHA and FTF guidance as described in the BHA Indicator Handbook Part 1 and the Supplement to Part 1. Annex D describes data processing routines, including the handling of missing data, and the full suite of analyses conducted for the baseline study. Results are weighted to represent the entire target population and tabulated for the combined
IMPEL | Implementer-Led Evaluation and Learning
18 Methodology and Limitations
RFSA areas, and for each RFSA separately, in total and by county.24 Point estimates with 95% confidence intervals and variance estimations were derived for all indicators using Taylor series expansion and considering the design effect associated with the complex sampling design. Annex E1 provides a tabular summary of the indicator estimates and sampling statistics. County comparisons of the baseline indicator estimates are provided in Annex E3. Annex F presents the results of additional descriptive analyses. Results of the bivariate and multivariate analyses are included in Annex G.
2.6 Study Limitations and Issues Encountered
2.6.1 Study Limitations Timing of the survey: Data collection occurred during the month of October. However, measures of food security and dietary diversity could be impacted given that data collection spilled into the period when maize availability increases in the country.25 Additionally, the timing of the survey overlapped with livestock migration to dry-season grazing lands. This created challenges for locating and interviewing livestock farmers.26
Validity and reliability of self-reported data: Most of the data collected for the household survey are self-reported. Limitations of self-reported data include the potential for exaggeration or omission of information; inaccurate recall; the potential for respondents to give responses they perceive as desirable, expected, or acceptable; reporting of untruthful information; and reduced validity if respondents do not fully understand a question. Enumerators were trained in techniques to help mitigate these types of measurement bias. Where possible, enumerators used photos, such as photos of water containers and livestock body condition score charts, to improve data quality.
The reliability of self-reported data is particularly challenging for questions related to livestock yield. This issue was discussed with BHA and IPs prior to the start of fieldwork, and several steps were taken to minimize the effect of errors associated with self-reported estimates: i) obtaining plausible ranges from the IPs and secondary sources for the weight of female and male adult and young cattle, goats, and camels and using these data for the calculation of livestock yield rather than self-reported data; and ii) performing several post-data collection processing routines to identify and address outliers in livestock yield calculations.27
24 Because the estimates are based on a sample of the target population rather than the full target population (i.e., a census), sampling weights are applied to correct for unequal selection probabilities, coverage issues and non-response. If sampling weights are not applied to survey data, the results can be biased. 25 The FEWS NET seasonal calendar for Kenya indicates that the hungry season in northern and eastern Kenya lasts until November, when maize availability from the rest of the country increases after the start of the long rains’ maize harvest in the western and Rift Valley regions (October–February). 26 This is reflected in the response rate for Module G (i.e., number of farmers interviewed divided by total number of farmers identified in the household roster), which in some counties (Marsabit, Turkana, and Samburu) dipped below the target response rate of 95%. The response rates for Modules 7.50, 7.51 and 7.53, which are administered to livestock producers, are 100% or close to 100% because livestock producers who were identified in the course of the interview for Module G were immediately interviewed thereafter. 27 Two approaches were used to adjust producer-level yield to mitigate the effects of extreme values (outliers): trimming the top 5% (i.e., exclusion of outliers from analysis) and winsorizing (retaining observations but capping numeric outliers so that they fall at the edge of the distribution using the 95th percentile). Thresholds for capping were determined for each county separately.
Baseline Survey of the Nawiri Resilience Food Security Activities in Kenya
Methodology and Limitations 19
Non-response: Respondents may be reluctant to participate in the survey due to general mistrust that may arise in politically volatile situations and fears of falling ill in the baseline context of the COVID-19 pandemic. It is also possible that households may have relocated or moved due to the persistent drought. The study employed various measures to account for potential non-response, emphasize the anonymous and voluntary nature of study participation, and observe and communicate survey protocols around COVID-19. As a methodological measure, the study design uses a higher-than-usual non-response factor of 20%. In terms of implementing the survey, field teams were trained to explain to respondents the objectives of the study and measures taken to preserve the anonymity of their responses and thus encourage participation. TANGO also updated the consent statement to include potential exposure to COVID-19 risks, and enumerators were trained and required to both observe COVID safety protocols (see Section 2.4.3) and to explain the risks associated with participating in a face-to-face interview in the context of the pandemic to each eligible household. In addition, in order to reduce non-response, field teams scheduled callbacks with livestock producers at times when absent household members were likely to have returned to the household.
2.6.2 Issues Encountered During Fieldwork Inaccessible clusters: Heavy rains and flooding made roads impassable in Isiolo, and subsequently one cluster was replaced. Following the onset of the seasonal rains, teams prioritized areas that were prone to flooding, starting in areas at risk of becoming inaccessible and scheduling peri-urban clusters toward the end of field work.
In addition to flooding, security concerns persisted throughout field work in parts of Marsabit, Isiolo, and Samburu. In addition to the one cluster replaced due to heavy rains, one cluster in Isiolo was replaced during data collection due to insecurity. Field teams worked closely with the County Commissioner and village leaders to determine when it was safe to enter clusters and begin data collection. While moving within a village, teams were accompanied by well-known village figures, and police escorts accompanied field teams as they moved across insecure regions. In at least one instance, it was necessary for field teams to suspend field work in a cluster due to security concerns and return to base. Field teams continued with other clusters until village leaders or the County Commissioner advised it was safe to resume in suspended areas.
Non-response: Response rates were below target for some modules, specifically for Module G, where farmers are respondents, and for modules E and K, where women 15–49 were respondents. Enumerators had difficulty locating individuals or households as many had migrated to satellite camps with their livestock as a result of the prolonged drought, and typically younger wives accompany their husbands.
Youth between the age of 15 and 18 years old were underreported on the household roster. Upon further investigation, field teams learned that after schools had been closed during the COVID-19 pandemic, many students in the community had moved to towns to stay with family and attend remedial classes or had returned to boarding schools and college. Many youth were thus absent from their homes for the past 6 months, excluding them from the household based on the survey’s definition.
IMPEL | Implementer-Led Evaluation and Learning
20 Methodology and Limitations
Field teams also had difficulty locating households in urban areas. Unlike in rural villages, where households are well acquainted, urban residents reported that many of their neighbors were migrants. Town residents did not know each other well and could not assist in locating households.
2.7 Qualitative Data In accordance with the study protocol, the baseline study did not collect primary qualitative data. To contextualize and help interpret the PBS baseline quantitative findings, the baseline study incorporates qualitative data available in the plethora of desk reviews and formative research conducted by the IPs, and when necessary, will work directly with IP technical leads to provide further triangulation and explanation of unexpected quantitative results. The use of existing data reinforces USAID’s focus on the use and dissemination of data and lessons learned across countries and within the IDEAL-supported food security and nutrition community of practice. Nawiri IPs were invited to submit reports from pilot studies conducted in the first 2 years of the award. The baseline study report also draws contextual information from external sources that are publicly available, e.g., FEWS NET, World Bank, and United Nations agencies. Additionally, the final baseline report will be informed by the review of the draft report by BHA staff and IPs.
Baseline Survey of the Nawiri Resilience Food Security Activities in Kenya (Vol. I)
Findings 21
3. FINDINGS This section presents the baseline survey findings by topic, integrating information from secondary qualitative sources where possible. County-level indicator estimates are discussed for each of the Nawiri RFSA areas (CRS and Mercy Corps) if they are statistically different from each other (i.e., Marsabit compared to Isiolo in the Nawiri (CRS) RFSA areas and Turkana compared to Samburu in the Nawiri (Mercy Corps) RFSA areas). Findings are considered statistically significant at the level of p < 0.05 or higher. In cases where the indicator results do not differ statistically between counties, the results are illustrated and discussed in the aggregate for each Nawiri RFSA area (i.e., CRS total and Mercy Corps total). Annex D summarizes the full set of analyses performed as part of the baseline study, including the methodology for the bivariate and multivariate analyses. Annex E1 provides a tabular summary of indicator estimates and sampling statistics. Annex E2 provides a tabular summary of the statistical test of differences in indicator estimates between counties. Indicator estimates are generally not presented where sample size is less than 30 and estimates therefore statistically unreliable. However, many statistically significant findings from the bivariate analyses are based on small samples28 and are provided for illustrative purposes; caution is needed in interpreting those results.29 Where possible, estimates from this study were compared with the 2018 baseline survey of the USAID Partnership for Resilience and Economic Growth (PREG) Initiative in Northern Kenya Phase II. The PREG II survey used a similar, multi-stage clustered design and covered the four study counties; estimates for common indicators are presented in Annex E3. The results of the descriptive analyses are presented in Annex F and the results of the bivariate and multivariate analyses are presented in Annex G. Annex H presents the results of the COVID-19 sub-module.
3.1 Characteristics of the Study Population Table 6 illustrates the share of key demographic groups by RFSA area, in total and by county. About one-half of the population in the RFSA counties is comprised of individuals 15 aged years and older. Among the population 15 years and older, the percentage of cash earners is on average 15% in the Nawiri (CRS) RFSA areas and 30% in the Nawiri (Mercy Corps) RFSA areas. The share of farmers from the population aged 15 years and older ranged from 19.3% in Isiolo to 41.7% in Marsabit in the Nawiri (CRS) RFSA areas, and from 26.2% in Turkana to 30.5% in Samburu in the Nawiri (Mercy Corps) RFSA areas. Approximately 40% of females in the RFSA areas are of reproductive age (15–49 years). Close to two-thirds of women of reproductive age are married or in a union, and more than one-half of women of reproductive age
28 Bivariate analyses were restricted to cases (i.e., children, women, or households) with observations on all explanatory variables, which resulted in a reduction in sample size. Given that baseline estimates for many intervention-specific factors were low, restricting the analytical sample in this way results in an even smaller number of cases. 29 Results based on small sample size can magnify bias. For example, a finding from bivariate analyses indicating the percentage of farmers using improved seeds is higher among those who took out an agricultural loan compared to those who did not take out a loan, could overstate the positive effect of access to credit on the adoption of productivity-enhancing technologies in a sample where the number of farmers who accessed credit is small (n<30) compared to a sample where the pool of farmers who accessed credit is large. This is because with small samples there is a higher risk (compared to large samples) that the observations (i.e., associations between an intervention and a desired outcome) are due to chance. While increasing sample size is expected to reduce sampling error and improve the reliability of results (by reducing the standard errors of the estimate), statistical bias can result from measurement error.
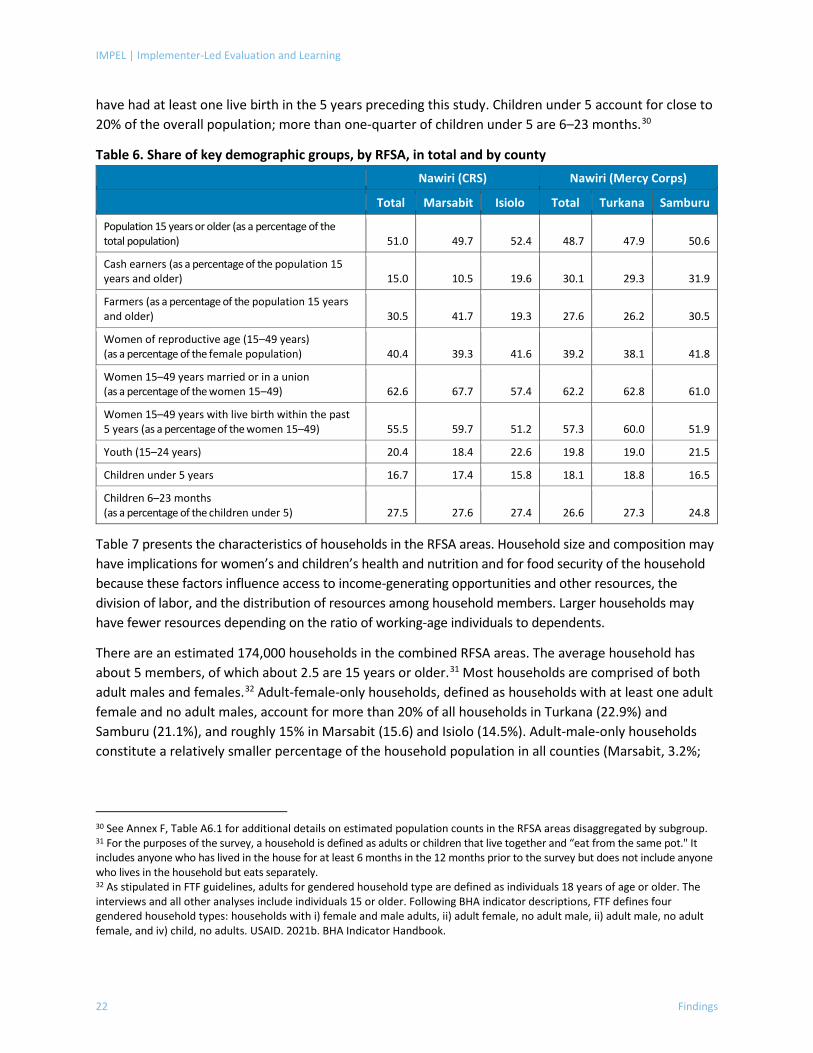
IMPEL | Implementer-Led Evaluation and Learning
22 Findings
have had at least one live birth in the 5 years preceding this study. Children under 5 account for close to 20% of the overall population; more than one-quarter of children under 5 are 6–23 months.30
Table 6. Share of key demographic groups, by RFSA, in total and by county Nawiri (CRS) Nawiri (Mercy Corps) Total Marsabit Isiolo Total Turkana Samburu
Population 15 years or older (as a percentage of the total population) 51.0 49.7 52.4 48.7 47.9 50.6
Cash earners (as a percentage of the population 15 years and older) 15.0 10.5 19.6 30.1 29.3 31.9
Farmers (as a percentage of the population 15 years and older) 30.5 41.7 19.3 27.6 26.2 30.5
Women of reproductive age (15–49 years) (as a percentage of the female population) 40.4 39.3 41.6 39.2 38.1 41.8
Women 15–49 years married or in a union (as a percentage of the women 15–49) 62.6 67.7 57.4 62.2 62.8 61.0
Women 15–49 years with live birth within the past 5 years (as a percentage of the women 15–49) 55.5 59.7 51.2 57.3 60.0 51.9
Youth (15–24 years) 20.4 18.4 22.6 19.8 19.0 21.5
Children under 5 years 16.7 17.4 15.8 18.1 18.8 16.5
Children 6–23 months (as a percentage of the children under 5) 27.5 27.6 27.4 26.6 27.3 24.8
Table 7 presents the characteristics of households in the RFSA areas. Household size and composition may have implications for women’s and children’s health and nutrition and for food security of the household because these factors influence access to income-generating opportunities and other resources, the division of labor, and the distribution of resources among household members. Larger households may have fewer resources depending on the ratio of working-age individuals to dependents.
There are an estimated 174,000 households in the combined RFSA areas. The average household has about 5 members, of which about 2.5 are 15 years or older.31 Most households are comprised of both adult males and females.32 Adult-female-only households, defined as households with at least one adult female and no adult males, account for more than 20% of all households in Turkana (22.9%) and Samburu (21.1%), and roughly 15% in Marsabit (15.6) and Isiolo (14.5%). Adult-male-only households constitute a relatively smaller percentage of the household population in all counties (Marsabit, 3.2%;
30 See Annex F, Table A6.1 for additional details on estimated population counts in the RFSA areas disaggregated by subgroup. 31 For the purposes of the survey, a household is defined as adults or children that live together and “eat from the same pot." It includes anyone who has lived in the house for at least 6 months in the 12 months prior to the survey but does not include anyone who lives in the household but eats separately. 32 As stipulated in FTF guidelines, adults for gendered household type are defined as individuals 18 years of age or older. The interviews and all other analyses include individuals 15 or older. Following BHA indicator descriptions, FTF defines four gendered household types: households with i) female and male adults, ii) adult female, no adult male, ii) adult male, no adult female, and iv) child, no adults. USAID. 2021b. BHA Indicator Handbook.
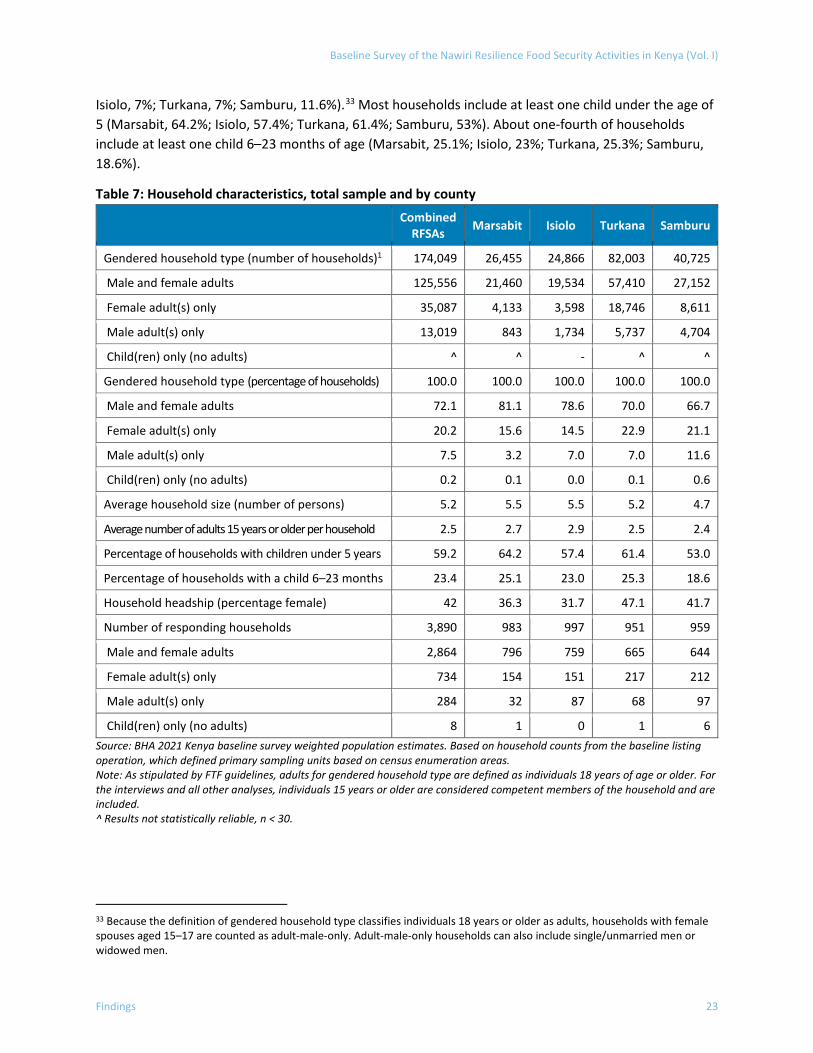
Baseline Survey of the Nawiri Resilience Food Security Activities in Kenya (Vol. I)
Findings 23
Isiolo, 7%; Turkana, 7%; Samburu, 11.6%).33 Most households include at least one child under the age of 5 (Marsabit, 64.2%; Isiolo, 57.4%; Turkana, 61.4%; Samburu, 53%). About one-fourth of households include at least one child 6–23 months of age (Marsabit, 25.1%; Isiolo, 23%; Turkana, 25.3%; Samburu, 18.6%).
Table 7: Household characteristics, total sample and by county
Combined RFSAs Marsabit Isiolo Turkana Samburu
Gendered household type (number of households)1 174,049 26,455 24,866 82,003 40,725
Male and female adults 125,556 21,460 19,534 57,410 27,152
Female adult(s) only 35,087 4,133 3,598 18,746 8,611
Male adult(s) only 13,019 843 1,734 5,737 4,704
Child(ren) only (no adults) ^ ^ - ^ ^
Gendered household type (percentage of households) 100.0 100.0 100.0 100.0 100.0
Male and female adults 72.1 81.1 78.6 70.0 66.7
Female adult(s) only 20.2 15.6 14.5 22.9 21.1
Male adult(s) only 7.5 3.2 7.0 7.0 11.6
Child(ren) only (no adults) 0.2 0.1 0.0 0.1 0.6
Average household size (number of persons) 5.2 5.5 5.5 5.2 4.7
Average number of adults 15 years or older per household 2.5 2.7 2.9 2.5 2.4
Percentage of households with children under 5 years 59.2 64.2 57.4 61.4 53.0
Percentage of households with a child 6–23 months 23.4 25.1 23.0 25.3 18.6
Household headship (percentage female) 42 36.3 31.7 47.1 41.7
Number of responding households 3,890 983 997 951 959
Male and female adults 2,864 796 759 665 644
Female adult(s) only 734 154 151 217 212
Male adult(s) only 284 32 87 68 97
Child(ren) only (no adults) 8 1 0 1 6 Source: BHA 2021 Kenya baseline survey weighted population estimates. Based on household counts from the baseline listing operation, which defined primary sampling units based on census enumeration areas. Note: As stipulated by FTF guidelines, adults for gendered household type are defined as individuals 18 years of age or older. For the interviews and all other analyses, individuals 15 years or older are considered competent members of the household and are included. ^ Results not statistically reliable, n < 30.
33 Because the definition of gendered household type classifies individuals 18 years or older as adults, households with female spouses aged 15–17 are counted as adult-male-only. Adult-male-only households can also include single/unmarried men or widowed men.
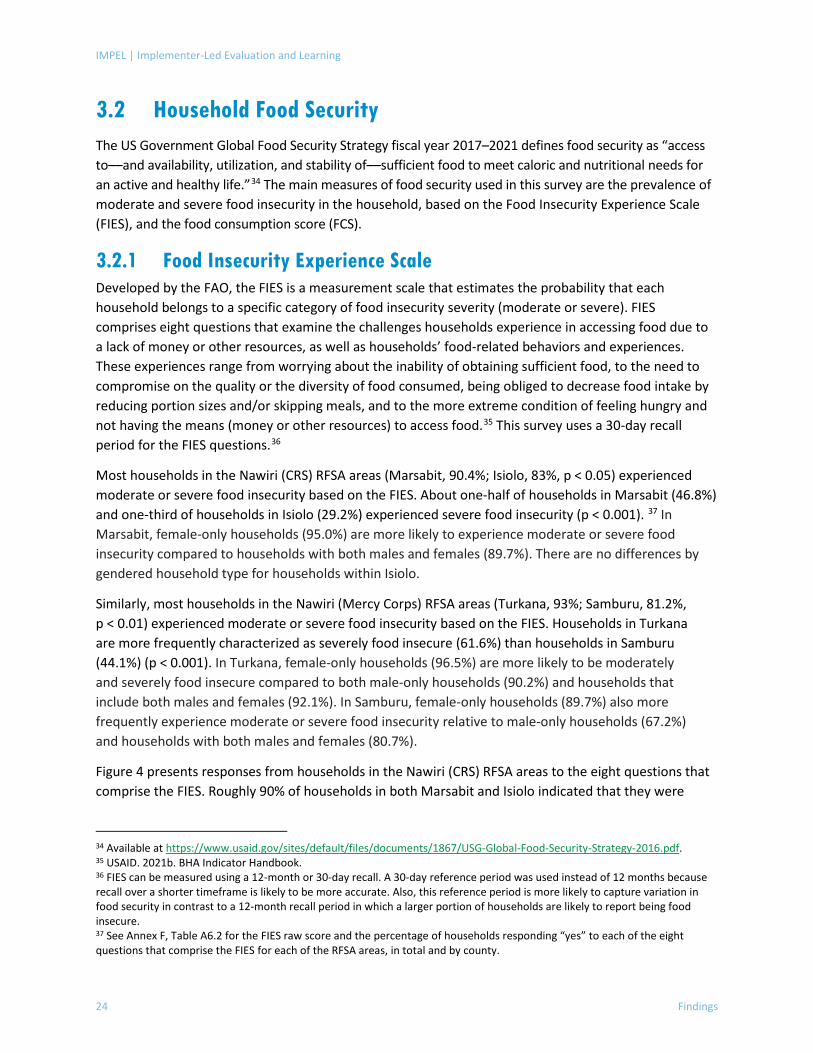
IMPEL | Implementer-Led Evaluation and Learning
24 Findings
3.2 Household Food Security The US Government Global Food Security Strategy fiscal year 2017–2021 defines food security as “access to––and availability, utilization, and stability of––sufficient food to meet caloric and nutritional needs for an active and healthy life.”34 The main measures of food security used in this survey are the prevalence of moderate and severe food insecurity in the household, based on the Food Insecurity Experience Scale (FIES), and the food consumption score (FCS).
3.2.1 Food Insecurity Experience Scale Developed by the FAO, the FIES is a measurement scale that estimates the probability that each household belongs to a specific category of food insecurity severity (moderate or severe). FIES comprises eight questions that examine the challenges households experience in accessing food due to a lack of money or other resources, as well as households’ food-related behaviors and experiences. These experiences range from worrying about the inability of obtaining sufficient food, to the need to compromise on the quality or the diversity of food consumed, being obliged to decrease food intake by reducing portion sizes and/or skipping meals, and to the more extreme condition of feeling hungry and not having the means (money or other resources) to access food.35 This survey uses a 30-day recall period for the FIES questions.36
Most households in the Nawiri (CRS) RFSA areas (Marsabit, 90.4%; Isiolo, 83%, p < 0.05) experienced moderate or severe food insecurity based on the FIES. About one-half of households in Marsabit (46.8%) and one-third of households in Isiolo (29.2%) experienced severe food insecurity (p < 0.001). 37 In Marsabit, female-only households (95.0%) are more likely to experience moderate or severe food insecurity compared to households with both males and females (89.7%). There are no differences by gendered household type for households within Isiolo.
Similarly, most households in the Nawiri (Mercy Corps) RFSA areas (Turkana, 93%; Samburu, 81.2%, p < 0.01) experienced moderate or severe food insecurity based on the FIES. Households in Turkana are more frequently characterized as severely food insecure (61.6%) than households in Samburu (44.1%) (p < 0.001). In Turkana, female-only households (96.5%) are more likely to be moderately and severely food insecure compared to both male-only households (90.2%) and households that include both males and females (92.1%). In Samburu, female-only households (89.7%) also more frequently experience moderate or severe food insecurity relative to male-only households (67.2%) and households with both males and females (80.7%).
Figure 4 presents responses from households in the Nawiri (CRS) RFSA areas to the eight questions that comprise the FIES. Roughly 90% of households in both Marsabit and Isiolo indicated that they were
34 Available at https://www.usaid.gov/sites/default/files/documents/1867/USG-Global-Food-Security-Strategy-2016.pdf. 35 USAID. 2021b. BHA Indicator Handbook. 36 FIES can be measured using a 12-month or 30-day recall. A 30-day reference period was used instead of 12 months because recall over a shorter timeframe is likely to be more accurate. Also, this reference period is more likely to capture variation in food security in contrast to a 12-month recall period in which a larger portion of households are likely to report being food insecure. 37 See Annex F, Table A6.2 for the FIES raw score and the percentage of households responding “yes” to each of the eight questions that comprise the FIES for each of the RFSA areas, in total and by county.
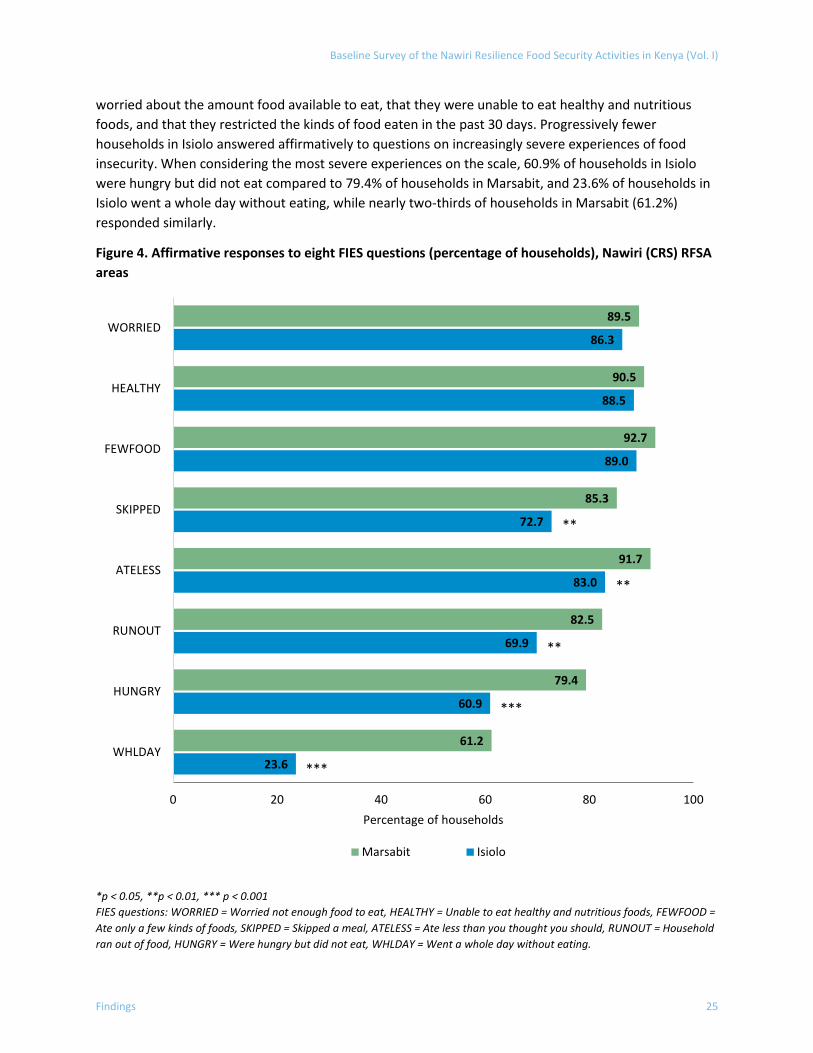
Baseline Survey of the Nawiri Resilience Food Security Activities in Kenya (Vol. I)
Findings 25
worried about the amount food available to eat, that they were unable to eat healthy and nutritious foods, and that they restricted the kinds of food eaten in the past 30 days. Progressively fewer households in Isiolo answered affirmatively to questions on increasingly severe experiences of food insecurity. When considering the most severe experiences on the scale, 60.9% of households in Isiolo were hungry but did not eat compared to 79.4% of households in Marsabit, and 23.6% of households in Isiolo went a whole day without eating, while nearly two-thirds of households in Marsabit (61.2%) responded similarly.
Figure 4. Affirmative responses to eight FIES questions (percentage of households), Nawiri (CRS) RFSA areas
*p < 0.05, **p < 0.01, *** p < 0.001 FIES questions: WORRIED = Worried not enough food to eat, HEALTHY = Unable to eat healthy and nutritious foods, FEWFOOD = Ate only a few kinds of foods, SKIPPED = Skipped a meal, ATELESS = Ate less than you thought you should, RUNOUT = Household ran out of food, HUNGRY = Were hungry but did not eat, WHLDAY = Went a whole day without eating.
23.6
60.9
69.9
83.0
72.7
89.0
88.5
86.3
61.2
79.4
82.5
91.7
85.3
92.7
90.5
89.5
0 20 40 60 80 100
WHLDAY
HUNGRY
RUNOUT
ATELESS
SKIPPED
FEWFOOD
HEALTHY
WORRIED
Percentage of households
Marsabit Isiolo
***
***
**
**
**
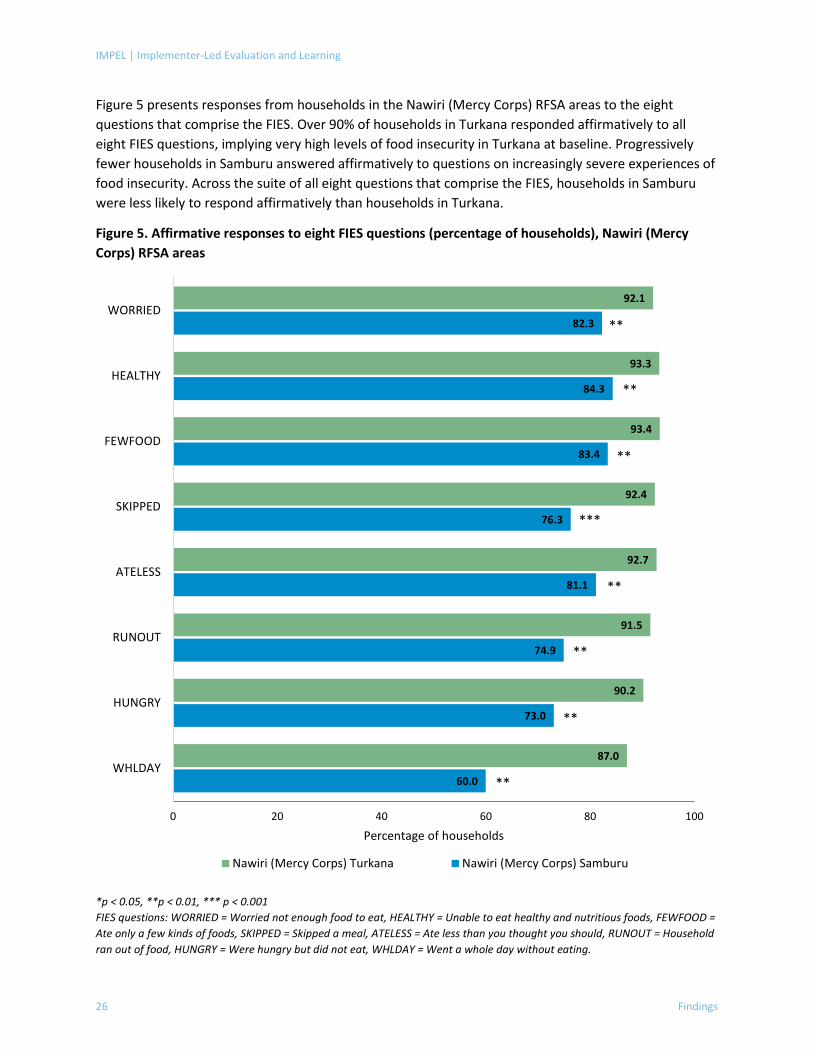
IMPEL | Implementer-Led Evaluation and Learning
26 Findings
Figure 5 presents responses from households in the Nawiri (Mercy Corps) RFSA areas to the eight questions that comprise the FIES. Over 90% of households in Turkana responded affirmatively to all eight FIES questions, implying very high levels of food insecurity in Turkana at baseline. Progressively fewer households in Samburu answered affirmatively to questions on increasingly severe experiences of food insecurity. Across the suite of all eight questions that comprise the FIES, households in Samburu were less likely to respond affirmatively than households in Turkana.
Figure 5. Affirmative responses to eight FIES questions (percentage of households), Nawiri (Mercy Corps) RFSA areas
*p < 0.05, **p < 0.01, *** p < 0.001 FIES questions: WORRIED = Worried not enough food to eat, HEALTHY = Unable to eat healthy and nutritious foods, FEWFOOD = Ate only a few kinds of foods, SKIPPED = Skipped a meal, ATELESS = Ate less than you thought you should, RUNOUT = Household ran out of food, HUNGRY = Were hungry but did not eat, WHLDAY = Went a whole day without eating.
60.0
73.0
74.9
81.1
76.3
83.4
84.3
82.3
87.0
90.2
91.5
92.7
92.4
93.4
93.3
92.1
0 20 40 60 80 100
WHLDAY
HUNGRY
RUNOUT
ATELESS
SKIPPED
FEWFOOD
HEALTHY
WORRIED
Percentage of households
Nawiri (Mercy Corps) Turkana Nawiri (Mercy Corps) Samburu
**
***
**
**
**
**
**
**
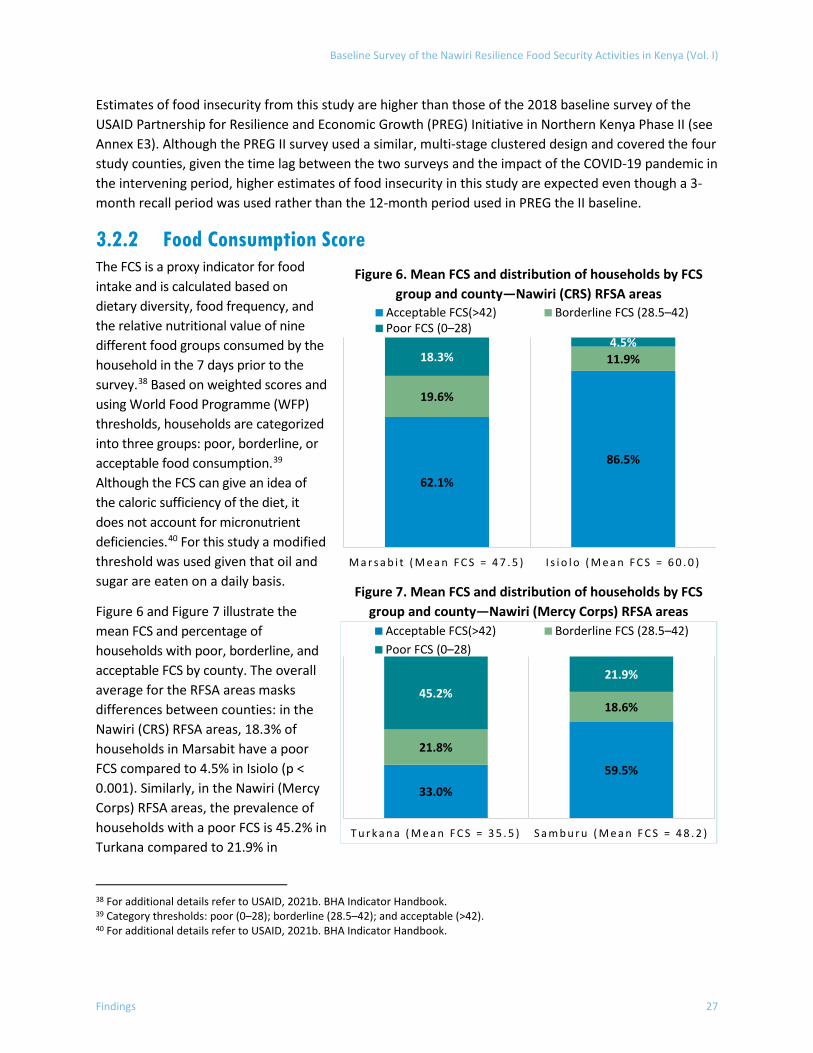
Baseline Survey of the Nawiri Resilience Food Security Activities in Kenya (Vol. I)
Findings 27
Estimates of food insecurity from this study are higher than those of the 2018 baseline survey of the USAID Partnership for Resilience and Economic Growth (PREG) Initiative in Northern Kenya Phase II (see Annex E3). Although the PREG II survey used a similar, multi-stage clustered design and covered the four study counties, given the time lag between the two surveys and the impact of the COVID-19 pandemic in the intervening period, higher estimates of food insecurity in this study are expected even though a 3-month recall period was used rather than the 12-month period used in PREG the II baseline.
3.2.2 Food Consumption Score The FCS is a proxy indicator for food intake and is calculated based on dietary diversity, food frequency, and the relative nutritional value of nine different food groups consumed by the household in the 7 days prior to the survey.38 Based on weighted scores and using World Food Programme (WFP) thresholds, households are categorized into three groups: poor, borderline, or acceptable food consumption.39 Although the FCS can give an idea of the caloric sufficiency of the diet, it does not account for micronutrient deficiencies.40 For this study a modified threshold was used given that oil and sugar are eaten on a daily basis.
Figure 6 and Figure 7 illustrate the mean FCS and percentage of households with poor, borderline, and acceptable FCS by county. The overall average for the RFSA areas masks differences between counties: in the Nawiri (CRS) RFSA areas, 18.3% of households in Marsabit have a poor FCS compared to 4.5% in Isiolo (p < 0.001). Similarly, in the Nawiri (Mercy Corps) RFSA areas, the prevalence of households with a poor FCS is 45.2% in Turkana compared to 21.9% in
38 For additional details refer to USAID, 2021b. BHA Indicator Handbook. 39 Category thresholds: poor (0–28); borderline (28.5–42); and acceptable (>42). 40 For additional details refer to USAID, 2021b. BHA Indicator Handbook.
Figure 6. Mean FCS and distribution of households by FCS group and county—Nawiri (CRS) RFSA areas
Figure 7. Mean FCS and distribution of households by FCS group and county—Nawiri (Mercy Corps) RFSA areas
62.1%
86.5%
19.6%
11.9%18.3%4.5%
M a r s a b i t ( M e a n F C S = 4 7 . 5 ) I s i o l o ( M e a n F C S = 6 0 . 0 )
Acceptable FCS(>42) Borderline FCS (28.5–42)Poor FCS (0–28)
33.0%
59.5%
21.8%
18.6%45.2%
21.9%
T u r k a n a ( M e a n F C S = 3 5 . 5 ) S a m b u r u ( M e a n F C S = 4 8 . 2 )
Acceptable FCS(>42) Borderline FCS (28.5–42)Poor FCS (0–28)
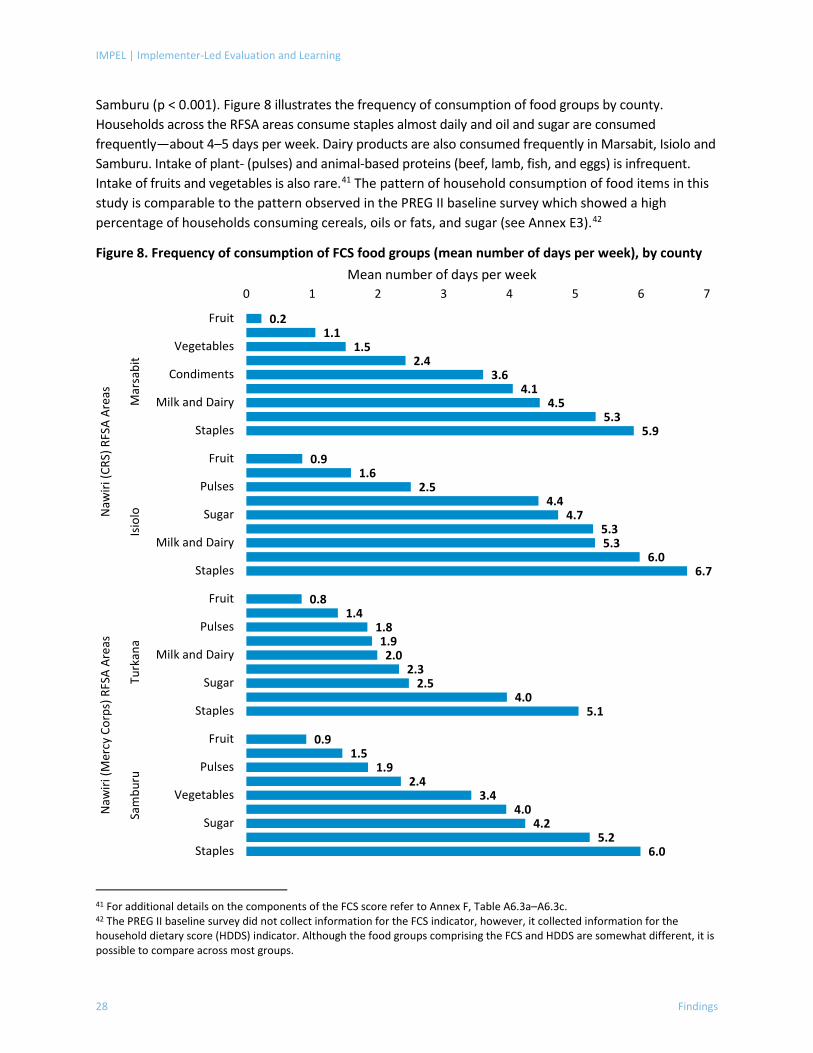
IMPEL | Implementer-Led Evaluation and Learning
28 Findings
Samburu (p < 0.001). Figure 8 illustrates the frequency of consumption of food groups by county. Households across the RFSA areas consume staples almost daily and oil and sugar are consumed frequently—about 4–5 days per week. Dairy products are also consumed frequently in Marsabit, Isiolo and Samburu. Intake of plant- (pulses) and animal-based proteins (beef, lamb, fish, and eggs) is infrequent. Intake of fruits and vegetables is also rare.41 The pattern of household consumption of food items in this study is comparable to the pattern observed in the PREG II baseline survey which showed a high percentage of households consuming cereals, oils or fats, and sugar (see Annex E3).42
Figure 8. Frequency of consumption of FCS food groups (mean number of days per week), by county
41 For additional details on the components of the FCS score refer to Annex F, Table A6.3a–A6.3c. 42 The PREG II baseline survey did not collect information for the FCS indicator, however, it collected information for the household dietary score (HDDS) indicator. Although the food groups comprising the FCS and HDDS are somewhat different, it is possible to compare across most groups.
0.21.1
1.52.4
3.64.1
4.55.3
5.9
0.91.6
2.54.4
4.75.35.3
6.06.7
0.81.4
1.81.92.0
2.32.5
4.05.1
0.91.5
1.92.4
3.44.0
4.25.2
6.0
0 1 2 3 4 5 6 7
Fruit
Vegetables
Condiments
Milk and Dairy
Staples
Fruit
Pulses
Sugar
Milk and Dairy
Staples
Fruit
Pulses
Milk and Dairy
Sugar
Staples
Fruit
Pulses
Vegetables
Sugar
Staples
Mar
sabi
tIs
iolo
Turk
ana
Sam
buru
Naw
iri (C
RS) R
FSA
Area
sN
awiri
(Mer
cy C
orps
) RFS
A Ar
eas
Mean number of days per week
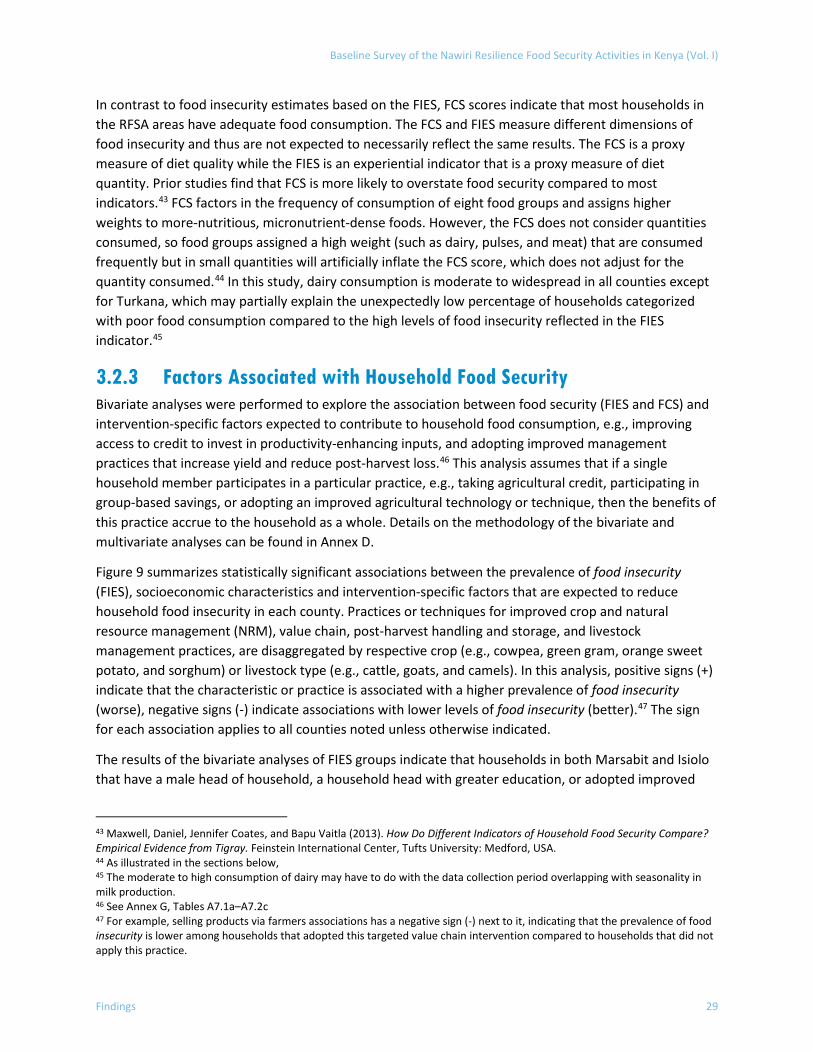
Baseline Survey of the Nawiri Resilience Food Security Activities in Kenya (Vol. I)
Findings 29
In contrast to food insecurity estimates based on the FIES, FCS scores indicate that most households in the RFSA areas have adequate food consumption. The FCS and FIES measure different dimensions of food insecurity and thus are not expected to necessarily reflect the same results. The FCS is a proxy measure of diet quality while the FIES is an experiential indicator that is a proxy measure of diet quantity. Prior studies find that FCS is more likely to overstate food security compared to most indicators.43 FCS factors in the frequency of consumption of eight food groups and assigns higher weights to more-nutritious, micronutrient-dense foods. However, the FCS does not consider quantities consumed, so food groups assigned a high weight (such as dairy, pulses, and meat) that are consumed frequently but in small quantities will artificially inflate the FCS score, which does not adjust for the quantity consumed.44 In this study, dairy consumption is moderate to widespread in all counties except for Turkana, which may partially explain the unexpectedly low percentage of households categorized with poor food consumption compared to the high levels of food insecurity reflected in the FIES indicator.45
3.2.3 Factors Associated with Household Food Security Bivariate analyses were performed to explore the association between food security (FIES and FCS) and intervention-specific factors expected to contribute to household food consumption, e.g., improving access to credit to invest in productivity-enhancing inputs, and adopting improved management practices that increase yield and reduce post-harvest loss.46 This analysis assumes that if a single household member participates in a particular practice, e.g., taking agricultural credit, participating in group-based savings, or adopting an improved agricultural technology or technique, then the benefits of this practice accrue to the household as a whole. Details on the methodology of the bivariate and multivariate analyses can be found in Annex D.
Figure 9 summarizes statistically significant associations between the prevalence of food insecurity (FIES), socioeconomic characteristics and intervention-specific factors that are expected to reduce household food insecurity in each county. Practices or techniques for improved crop and natural resource management (NRM), value chain, post-harvest handling and storage, and livestock management practices, are disaggregated by respective crop (e.g., cowpea, green gram, orange sweet potato, and sorghum) or livestock type (e.g., cattle, goats, and camels). In this analysis, positive signs (+) indicate that the characteristic or practice is associated with a higher prevalence of food insecurity (worse), negative signs (-) indicate associations with lower levels of food insecurity (better).47 The sign for each association applies to all counties noted unless otherwise indicated.
The results of the bivariate analyses of FIES groups indicate that households in both Marsabit and Isiolo that have a male head of household, a household head with greater education, or adopted improved
43 Maxwell, Daniel, Jennifer Coates, and Bapu Vaitla (2013). How Do Different Indicators of Household Food Security Compare? Empirical Evidence from Tigray. Feinstein International Center, Tufts University: Medford, USA. 44 As illustrated in the sections below, 45 The moderate to high consumption of dairy may have to do with the data collection period overlapping with seasonality in milk production. 46 See Annex G, Tables A7.1a–A7.2c 47 For example, selling products via farmers associations has a negative sign (-) next to it, indicating that the prevalence of food insecurity is lower among households that adopted this targeted value chain intervention compared to households that did not apply this practice.
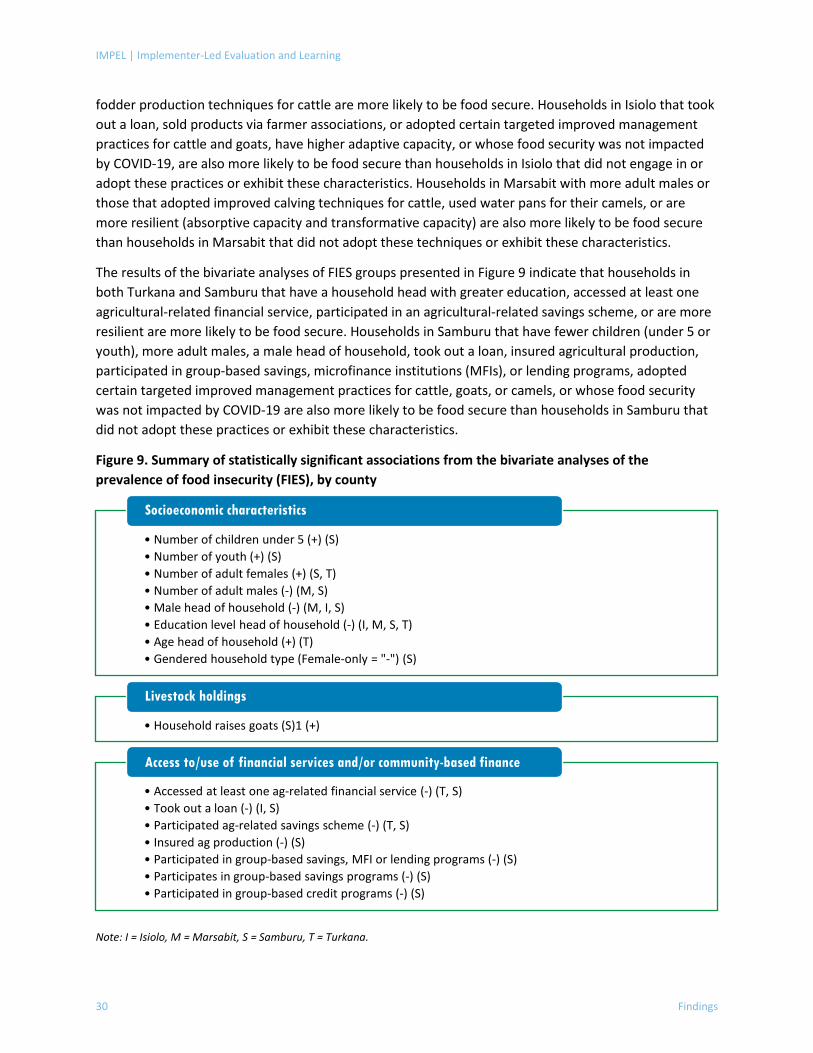
IMPEL | Implementer-Led Evaluation and Learning
30 Findings
fodder production techniques for cattle are more likely to be food secure. Households in Isiolo that took out a loan, sold products via farmer associations, or adopted certain targeted improved management practices for cattle and goats, have higher adaptive capacity, or whose food security was not impacted by COVID-19, are also more likely to be food secure than households in Isiolo that did not engage in or adopt these practices or exhibit these characteristics. Households in Marsabit with more adult males or those that adopted improved calving techniques for cattle, used water pans for their camels, or are more resilient (absorptive capacity and transformative capacity) are also more likely to be food secure than households in Marsabit that did not adopt these techniques or exhibit these characteristics.
The results of the bivariate analyses of FIES groups presented in Figure 9 indicate that households in both Turkana and Samburu that have a household head with greater education, accessed at least one agricultural-related financial service, participated in an agricultural-related savings scheme, or are more resilient are more likely to be food secure. Households in Samburu that have fewer children (under 5 or youth), more adult males, a male head of household, took out a loan, insured agricultural production, participated in group-based savings, microfinance institutions (MFIs), or lending programs, adopted certain targeted improved management practices for cattle, goats, or camels, or whose food security was not impacted by COVID-19 are also more likely to be food secure than households in Samburu that did not adopt these practices or exhibit these characteristics.
Figure 9. Summary of statistically significant associations from the bivariate analyses of the prevalence of food insecurity (FIES), by county
Note: I = Isiolo, M = Marsabit, S = Samburu, T = Turkana.
• Number of children under 5 (+) (S)• Number of youth (+) (S)• Number of adult females (+) (S, T)• Number of adult males (-) (M, S)• Male head of household (-) (M, I, S)• Education level head of household (-) (I, M, S, T)• Age head of household (+) (T)• Gendered household type (Female-only = "-") (S)
Socioeconomic characteristics
• Household raises goats (S)1 (+)
Livestock holdings
• Accessed at least one ag-related financial service (-) (T, S)• Took out a loan (-) (I, S)• Participated ag-related savings scheme (-) (T, S)• Insured ag production (-) (S)• Participated in group-based savings, MFI or lending programs (-) (S)• Participates in group-based savings programs (-) (S)• Participated in group-based credit programs (-) (S)
Access to/use of financial services and/or community-based finance
Baseline Survey of the Nawiri Resilience Food Security Activities in Kenya (Vol. I)
Findings 31
Figure 7 (continued)
Note: I = Isiolo, M = Marsabit, S = Samburu, T = Turkana. 1 Samburu households that raise goats or access health services and products for camels are more likely to be food insecure. See Annex G, Table A7.1b–A7.1c for details, including results for the combined Nawiri (CRS) RFSA areas and the combined Nawiri (Mercy Corps) RFSA areas (not illustrated here).
The results of the bivariate analyses of household food consumption score groups are summarized in Figure 10. In this analysis, positive signs (+) indicate that the characteristic or practice is associated with a higher percentage of households with borderline or acceptable FCS and a lower percentage of households with poor FCS (better). Negative signs (-) indicate associations with fewer households with acceptable or borderline FCS and more households with poor FCS (worse). The sign for each association applies to all counties noted unless otherwise indicated. As noted in the introductory paragraph of the findings section, small sample size increases the likelihood of bias, so appropriate caution should be exercised in interpreting these results.
Some of the key findings include a positive association between access to financial services (agricultural loans, agricultural saving schemes, group-based credit, and group-based savings) and the likelihood that households are categorized with borderline or acceptable FCS rather than poor FCS. The adoption of certain targeted improved practices such as production planning, use of set grazing areas, and use of livestock health services and products is associated with a higher percentage of households with
• Selling products via farmers associations (-) I
Household adoption of targeted value chain interventions
• Cattle—improved livestock breeds/species (-) (I, S)• Cattle—improved calving techniques (-) (M, S)• Cattle—nutritious pasture varieties (-) (I, S)• Cattle—improved fodder production (-) (I, M, S)• Cattle—water pans (-) (S)• Cattle—sand dams (-) (S)• Cattle—used at least one improved practice (-) (S)• Goats—nutritious pasture varieties (-) (I, S)• Goats—improved livestock breeds/species (-) (I)• Goats—water pans (-) (S)• Goats—rock catchments (-) (S)• Camels—water pans (-) (M)• Camels—rock catchments (-) (S)• Camels—health services and products (+) (S)1
Household adoption of targeted livestock management practices
• Absorptive capacity (-) (M, S, T)• Adaptive capacity (-) (I, S, T)• Transformative capacity (-) (M, S, T))
Household resilience
• Household food security impacted by COVID-19 (+) (I, S)
COVID-19 impact
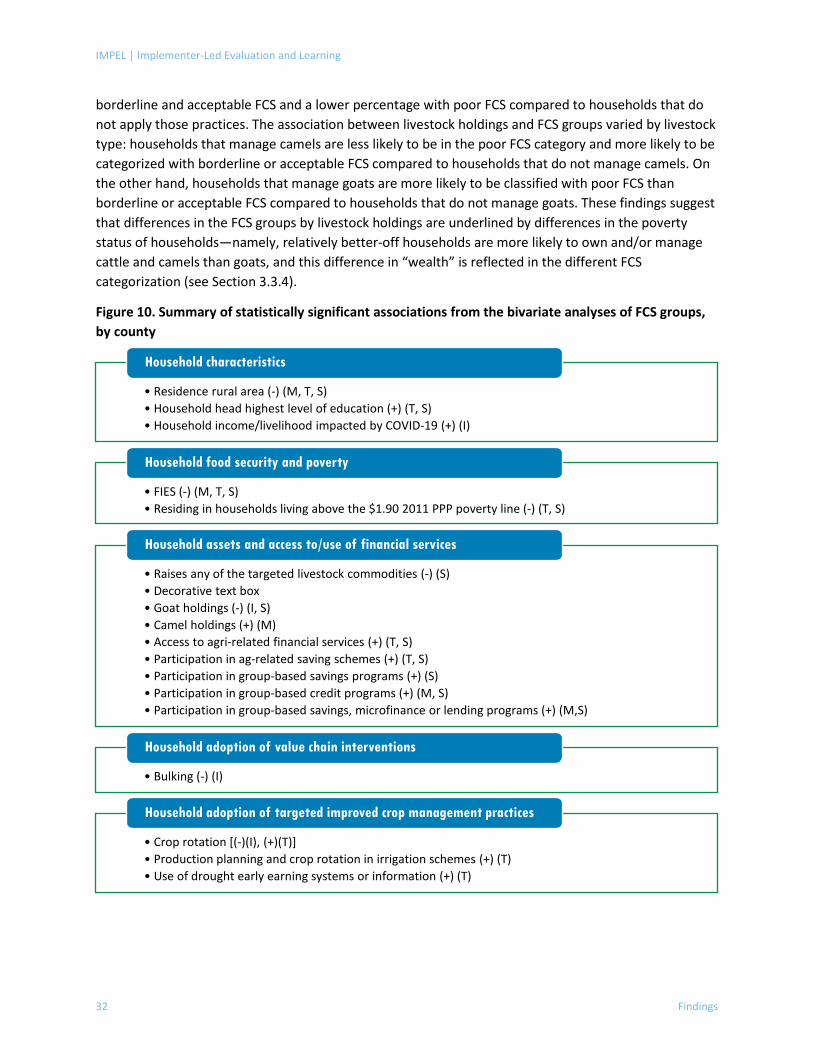
IMPEL | Implementer-Led Evaluation and Learning
32 Findings
borderline and acceptable FCS and a lower percentage with poor FCS compared to households that do not apply those practices. The association between livestock holdings and FCS groups varied by livestock type: households that manage camels are less likely to be in the poor FCS category and more likely to be categorized with borderline or acceptable FCS compared to households that do not manage camels. On the other hand, households that manage goats are more likely to be classified with poor FCS than borderline or acceptable FCS compared to households that do not manage goats. These findings suggest that differences in the FCS groups by livestock holdings are underlined by differences in the poverty status of households—namely, relatively better-off households are more likely to own and/or manage cattle and camels than goats, and this difference in “wealth” is reflected in the different FCS categorization (see Section 3.3.4).
Figure 10. Summary of statistically significant associations from the bivariate analyses of FCS groups, by county
• Residence rural area (-) (M, T, S)• Household head highest level of education (+) (T, S)• Household income/livelihood impacted by COVID-19 (+) (I)
Household characteristics
• FIES (-) (M, T, S)• Residing in households living above the $1.90 2011 PPP poverty line (-) (T, S)
Household food security and poverty
• Raises any of the targeted livestock commodities (-) (S) • Decorative text box• Goat holdings (-) (I, S)• Camel holdings (+) (M)• Access to agri-related financial services (+) (T, S)• Participation in ag-related saving schemes (+) (T, S)• Participation in group-based savings programs (+) (S)• Participation in group-based credit programs (+) (M, S)• Participation in group-based savings, microfinance or lending programs (+) (M,S)
Household assets and access to/use of financial services
• Bulking (-) (I)
Household adoption of value chain interventions
• Crop rotation [(-)(I), (+)(T)]• Production planning and crop rotation in irrigation schemes (+) (T)• Use of drought early earning systems or information (+) (T)
Household adoption of targeted improved crop management practices
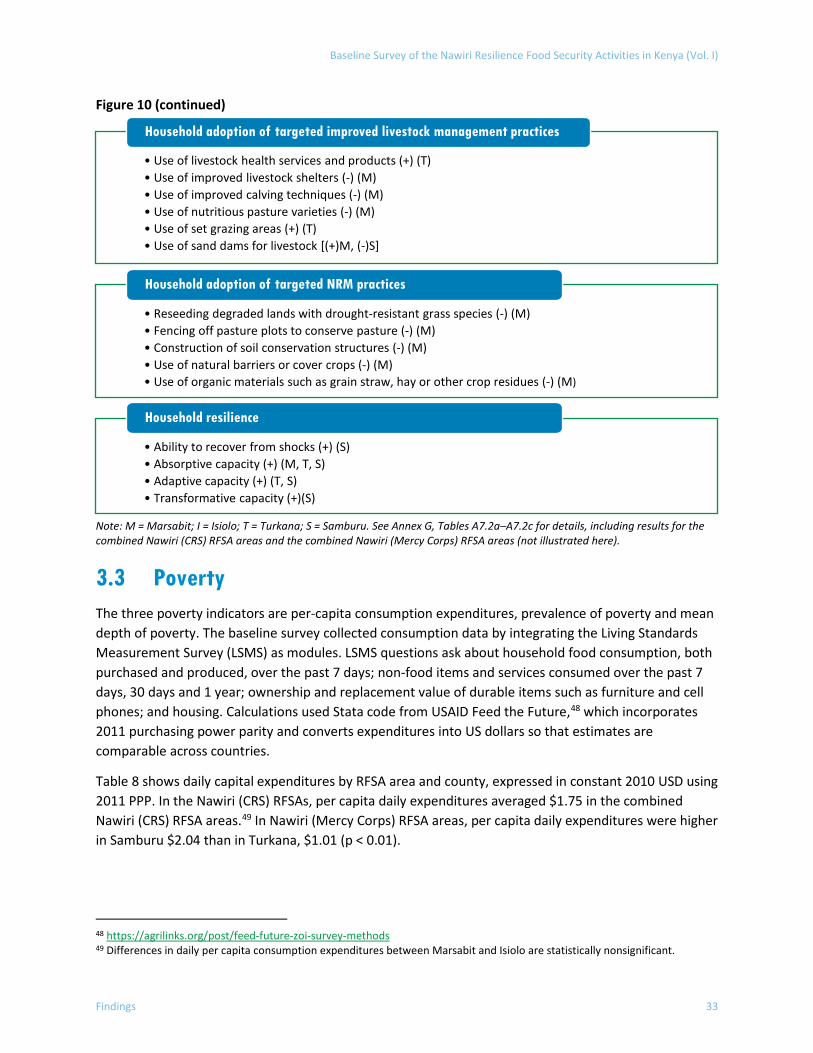
Baseline Survey of the Nawiri Resilience Food Security Activities in Kenya (Vol. I)
Findings 33
Figure 10 (continued)
Note: M = Marsabit; I = Isiolo; T = Turkana; S = Samburu. See Annex G, Tables A7.2a–A7.2c for details, including results for the combined Nawiri (CRS) RFSA areas and the combined Nawiri (Mercy Corps) RFSA areas (not illustrated here).
3.3 Poverty The three poverty indicators are per-capita consumption expenditures, prevalence of poverty and mean depth of poverty. The baseline survey collected consumption data by integrating the Living Standards Measurement Survey (LSMS) as modules. LSMS questions ask about household food consumption, both purchased and produced, over the past 7 days; non-food items and services consumed over the past 7 days, 30 days and 1 year; ownership and replacement value of durable items such as furniture and cell phones; and housing. Calculations used Stata code from USAID Feed the Future,48 which incorporates 2011 purchasing power parity and converts expenditures into US dollars so that estimates are comparable across countries.
Table 8 shows daily capital expenditures by RFSA area and county, expressed in constant 2010 USD using 2011 PPP. In the Nawiri (CRS) RFSAs, per capita daily expenditures averaged $1.75 in the combined Nawiri (CRS) RFSA areas.49 In Nawiri (Mercy Corps) RFSA areas, per capita daily expenditures were higher in Samburu $2.04 than in Turkana, $1.01 (p < 0.01).
48 https://agrilinks.org/post/feed-future-zoi-survey-methods 49 Differences in daily per capita consumption expenditures between Marsabit and Isiolo are statistically nonsignificant.
• Use of livestock health services and products (+) (T)• Use of improved livestock shelters (-) (M)• Use of improved calving techniques (-) (M)• Use of nutritious pasture varieties (-) (M)• Use of set grazing areas (+) (T)• Use of sand dams for livestock [(+)M, (-)S]
Household adoption of targeted improved livestock management practices
• Reseeding degraded lands with drought-resistant grass species (-) (M)• Fencing off pasture plots to conserve pasture (-) (M) • Construction of soil conservation structures (-) (M)• Use of natural barriers or cover crops (-) (M)• Use of organic materials such as grain straw, hay or other crop residues (-) (M)
Household adoption of targeted NRM practices
• Ability to recover from shocks (+) (S)• Absorptive capacity (+) (M, T, S)• Adaptive capacity (+) (T, S)• Transformative capacity (+)(S)
Household resilience
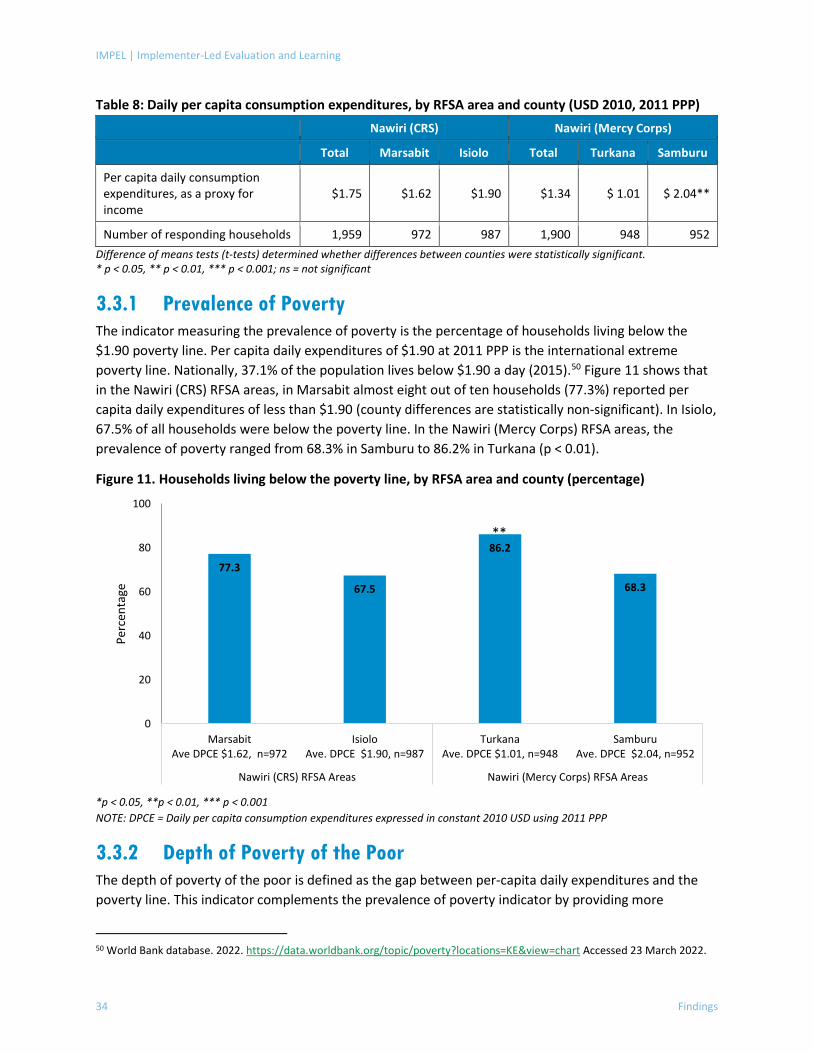
IMPEL | Implementer-Led Evaluation and Learning
34 Findings
Table 8: Daily per capita consumption expenditures, by RFSA area and county (USD 2010, 2011 PPP) Nawiri (CRS) Nawiri (Mercy Corps) Total Marsabit Isiolo Total Turkana Samburu
Per capita daily consumption expenditures, as a proxy for income
$1.75 $1.62 $1.90 $1.34 $ 1.01 $ 2.04**
Number of responding households 1,959 972 987 1,900 948 952 Difference of means tests (t-tests) determined whether differences between counties were statistically significant. * p < 0.05, ** p < 0.01, *** p < 0.001; ns = not significant
3.3.1 Prevalence of Poverty The indicator measuring the prevalence of poverty is the percentage of households living below the $1.90 poverty line. Per capita daily expenditures of $1.90 at 2011 PPP is the international extreme poverty line. Nationally, 37.1% of the population lives below $1.90 a day (2015).50 Figure 11 shows that in the Nawiri (CRS) RFSA areas, in Marsabit almost eight out of ten households (77.3%) reported per capita daily expenditures of less than $1.90 (county differences are statistically non-significant). In Isiolo, 67.5% of all households were below the poverty line. In the Nawiri (Mercy Corps) RFSA areas, the prevalence of poverty ranged from 68.3% in Samburu to 86.2% in Turkana (p < 0.01).
Figure 11. Households living below the poverty line, by RFSA area and county (percentage)
*p < 0.05, **p < 0.01, *** p < 0.001 NOTE: DPCE = Daily per capita consumption expenditures expressed in constant 2010 USD using 2011 PPP
3.3.2 Depth of Poverty of the Poor The depth of poverty of the poor is defined as the gap between per-capita daily expenditures and the poverty line. This indicator complements the prevalence of poverty indicator by providing more
50 World Bank database. 2022. https://data.worldbank.org/topic/poverty?locations=KE&view=chart Accessed 23 March 2022.
77.3
67.5
86.2
68.3
0
20
40
60
80
100
MarsabitAve DPCE $1.62, n=972
IsioloAve. DPCE $1.90, n=987
TurkanaAve. DPCE $1.01, n=948
SamburuAve. DPCE $2.04, n=952
Nawiri (CRS) RFSA Areas Nawiri (Mercy Corps) RFSA Areas
Perc
enta
ge
**
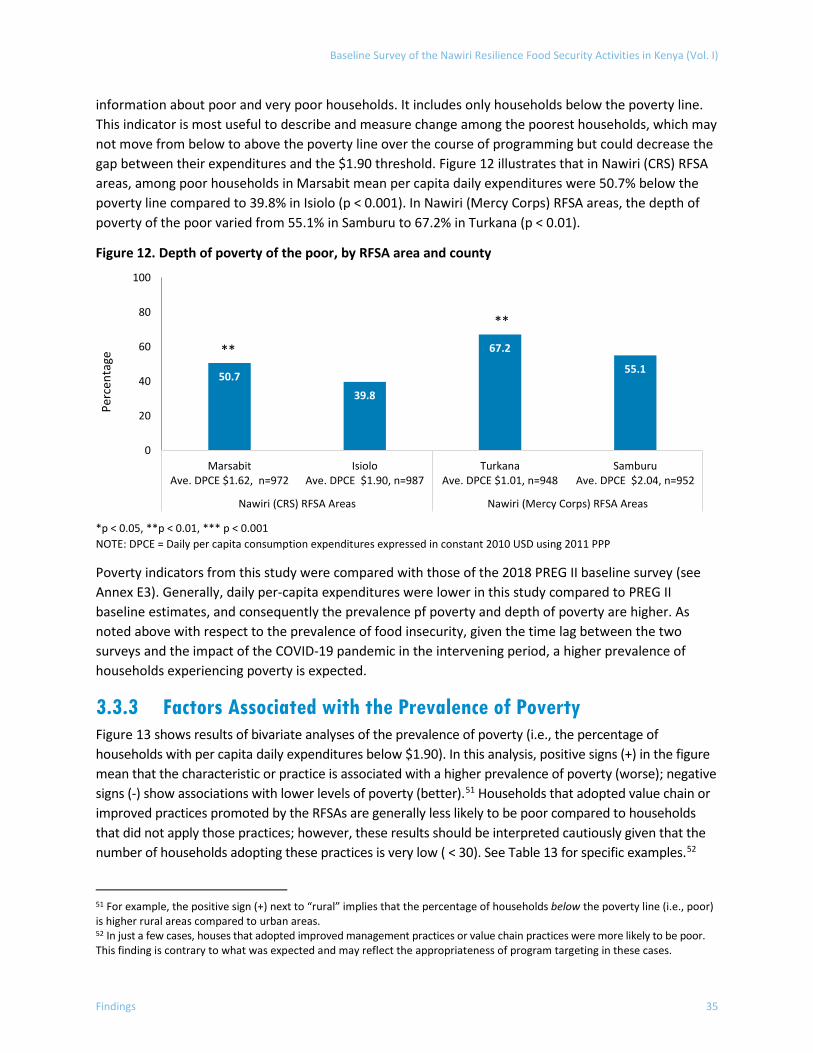
Baseline Survey of the Nawiri Resilience Food Security Activities in Kenya (Vol. I)
Findings 35
information about poor and very poor households. It includes only households below the poverty line. This indicator is most useful to describe and measure change among the poorest households, which may not move from below to above the poverty line over the course of programming but could decrease the gap between their expenditures and the $1.90 threshold. Figure 12 illustrates that in Nawiri (CRS) RFSA areas, among poor households in Marsabit mean per capita daily expenditures were 50.7% below the poverty line compared to 39.8% in Isiolo (p < 0.001). In Nawiri (Mercy Corps) RFSA areas, the depth of poverty of the poor varied from 55.1% in Samburu to 67.2% in Turkana (p < 0.01).
Figure 12. Depth of poverty of the poor, by RFSA area and county
*p < 0.05, **p < 0.01, *** p < 0.001 NOTE: DPCE = Daily per capita consumption expenditures expressed in constant 2010 USD using 2011 PPP
Poverty indicators from this study were compared with those of the 2018 PREG II baseline survey (see Annex E3). Generally, daily per-capita expenditures were lower in this study compared to PREG II baseline estimates, and consequently the prevalence pf poverty and depth of poverty are higher. As noted above with respect to the prevalence of food insecurity, given the time lag between the two surveys and the impact of the COVID-19 pandemic in the intervening period, a higher prevalence of households experiencing poverty is expected.
3.3.3 Factors Associated with the Prevalence of Poverty Figure 13 shows results of bivariate analyses of the prevalence of poverty (i.e., the percentage of households with per capita daily expenditures below $1.90). In this analysis, positive signs (+) in the figure mean that the characteristic or practice is associated with a higher prevalence of poverty (worse); negative signs (-) show associations with lower levels of poverty (better).51 Households that adopted value chain or improved practices promoted by the RFSAs are generally less likely to be poor compared to households that did not apply those practices; however, these results should be interpreted cautiously given that the number of households adopting these practices is very low ( < 30). See Table 13 for specific examples.52
51 For example, the positive sign (+) next to “rural” implies that the percentage of households below the poverty line (i.e., poor) is higher rural areas compared to urban areas. 52 In just a few cases, houses that adopted improved management practices or value chain practices were more likely to be poor. This finding is contrary to what was expected and may reflect the appropriateness of program targeting in these cases.
50.739.8
67.2
55.1
0
20
40
60
80
100
MarsabitAve. DPCE $1.62, n=972
IsioloAve. DPCE $1.90, n=987
TurkanaAve. DPCE $1.01, n=948
SamburuAve. DPCE $2.04, n=952
Nawiri (CRS) RFSA Areas Nawiri (Mercy Corps) RFSA Areas
Perc
enta
ge
**
**
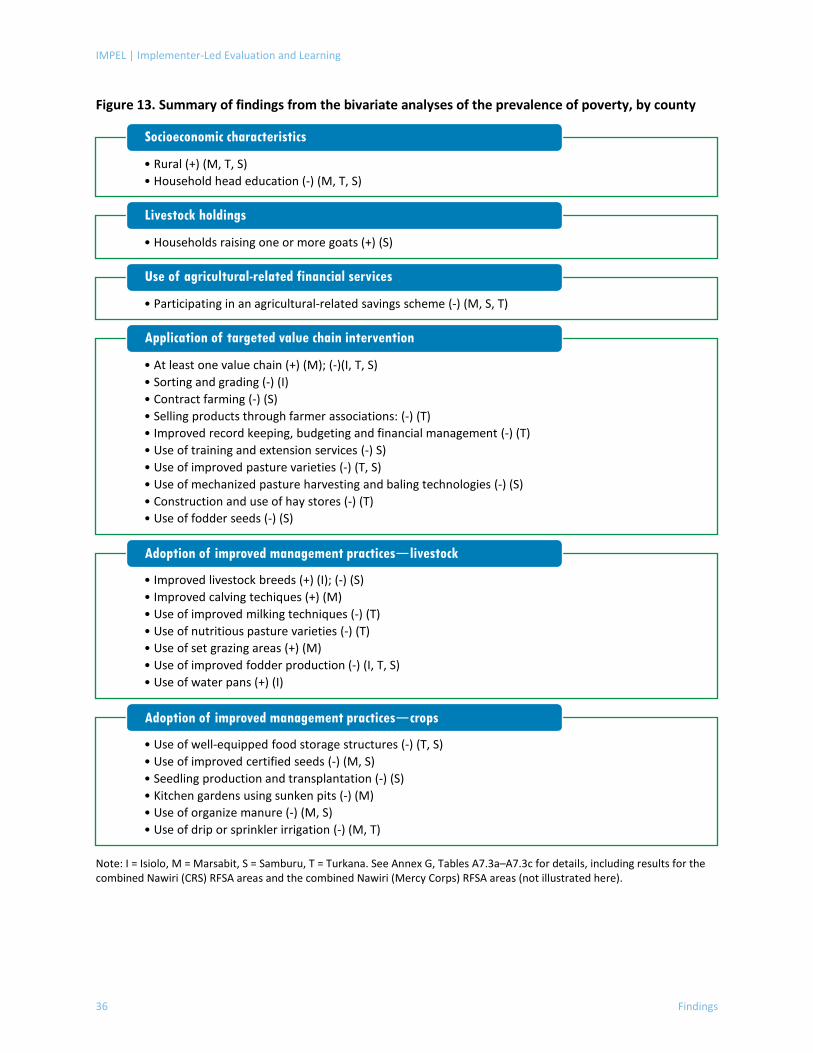
IMPEL | Implementer-Led Evaluation and Learning
36 Findings
Figure 13. Summary of findings from the bivariate analyses of the prevalence of poverty, by county
Note: I = Isiolo, M = Marsabit, S = Samburu, T = Turkana. See Annex G, Tables A7.3a–A7.3c for details, including results for the combined Nawiri (CRS) RFSA areas and the combined Nawiri (Mercy Corps) RFSA areas (not illustrated here).
• Rural (+) (M, T, S)• Household head education (-) (M, T, S)
Socioeconomic characteristics
• Households raising one or more goats (+) (S)
Livestock holdings
• Participating in an agricultural-related savings scheme (-) (M, S, T)
Use of agricultural-related financial services
• At least one value chain (+) (M); (-)(I, T, S)• Sorting and grading (-) (I)• Contract farming (-) (S)• Selling products through farmer associations: (-) (T)• Improved record keeping, budgeting and financial management (-) (T)• Use of training and extension services (-) S)• Use of improved pasture varieties (-) (T, S)• Use of mechanized pasture harvesting and baling technologies (-) (S)• Construction and use of hay stores (-) (T)• Use of fodder seeds (-) (S)
Application of targeted value chain intervention
• Improved livestock breeds (+) (I); (-) (S)• Improved calving techiques (+) (M)• Use of improved milking techniques (-) (T)• Use of nutritious pasture varieties (-) (T)• Use of set grazing areas (+) (M)• Use of improved fodder production (-) (I, T, S)• Use of water pans (+) (I)
Adoption of improved management practices—livestock
• Use of well-equipped food storage structures (-) (T, S)• Use of improved certified seeds (-) (M, S)• Seedling production and transplantation (-) (S)• Kitchen gardens using sunken pits (-) (M)• Use of organize manure (-) (M, S)• Use of drip or sprinkler irrigation (-) (M, T)
Adoption of improved management practices—crops
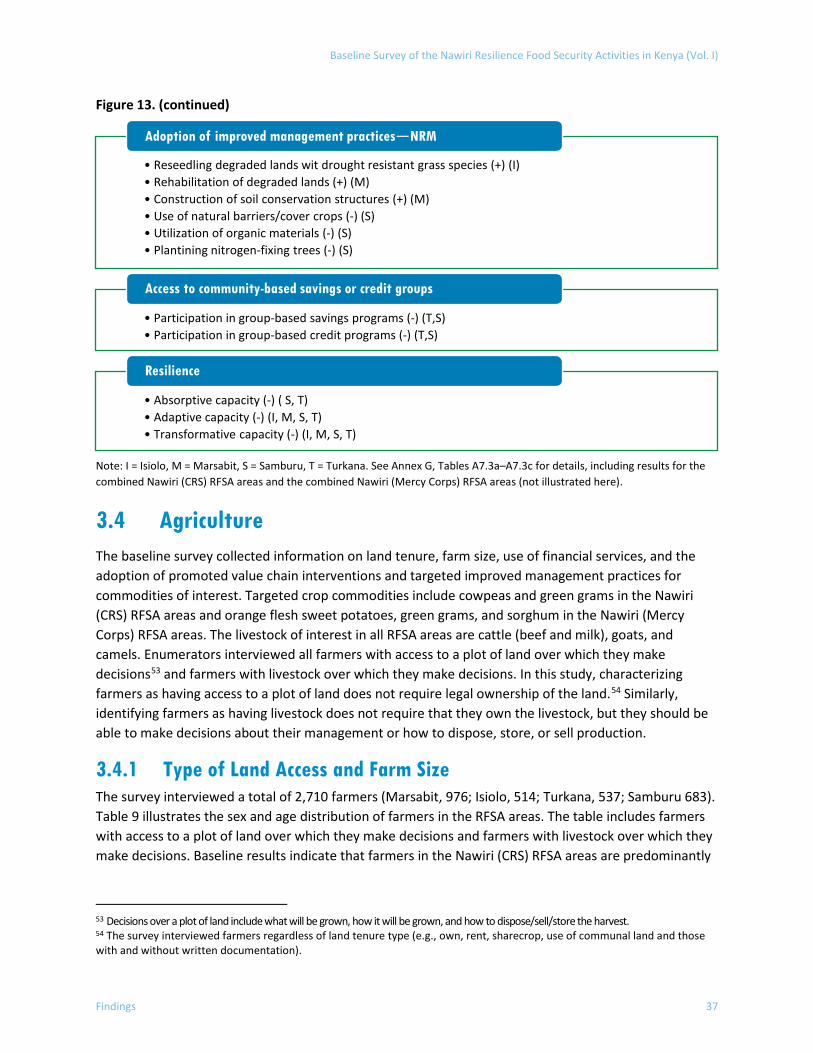
Baseline Survey of the Nawiri Resilience Food Security Activities in Kenya (Vol. I)
Findings 37
Figure 13. (continued)
Note: I = Isiolo, M = Marsabit, S = Samburu, T = Turkana. See Annex G, Tables A7.3a–A7.3c for details, including results for the combined Nawiri (CRS) RFSA areas and the combined Nawiri (Mercy Corps) RFSA areas (not illustrated here).
3.4 Agriculture The baseline survey collected information on land tenure, farm size, use of financial services, and the adoption of promoted value chain interventions and targeted improved management practices for commodities of interest. Targeted crop commodities include cowpeas and green grams in the Nawiri (CRS) RFSA areas and orange flesh sweet potatoes, green grams, and sorghum in the Nawiri (Mercy Corps) RFSA areas. The livestock of interest in all RFSA areas are cattle (beef and milk), goats, and camels. Enumerators interviewed all farmers with access to a plot of land over which they make decisions53 and farmers with livestock over which they make decisions. In this study, characterizing farmers as having access to a plot of land does not require legal ownership of the land.54 Similarly, identifying farmers as having livestock does not require that they own the livestock, but they should be able to make decisions about their management or how to dispose, store, or sell production.
3.4.1 Type of Land Access and Farm Size The survey interviewed a total of 2,710 farmers (Marsabit, 976; Isiolo, 514; Turkana, 537; Samburu 683). Table 9 illustrates the sex and age distribution of farmers in the RFSA areas. The table includes farmers with access to a plot of land over which they make decisions and farmers with livestock over which they make decisions. Baseline results indicate that farmers in the Nawiri (CRS) RFSA areas are predominantly
53 Decisions over a plot of land include what will be grown, how it will be grown, and how to dispose/sell/store the harvest. 54 The survey interviewed farmers regardless of land tenure type (e.g., own, rent, sharecrop, use of communal land and those with and without written documentation).
• Reseedling degraded lands wit drought resistant grass species (+) (I)• Rehabilitation of degraded lands (+) (M)• Construction of soil conservation structures (+) (M)• Use of natural barriers/cover crops (-) (S)• Utilization of organic materials (-) (S)• Plantining nitrogen-fixing trees (-) (S)
Adoption of improved management practices—NRM
• Participation in group-based savings programs (-) (T,S)• Participation in group-based credit programs (-) (T,S)
Access to community-based savings or credit groups
• Absorptive capacity (-) ( S, T) • Adaptive capacity (-) (I, M, S, T)• Transformative capacity (-) (I, M, S, T)
Resilience
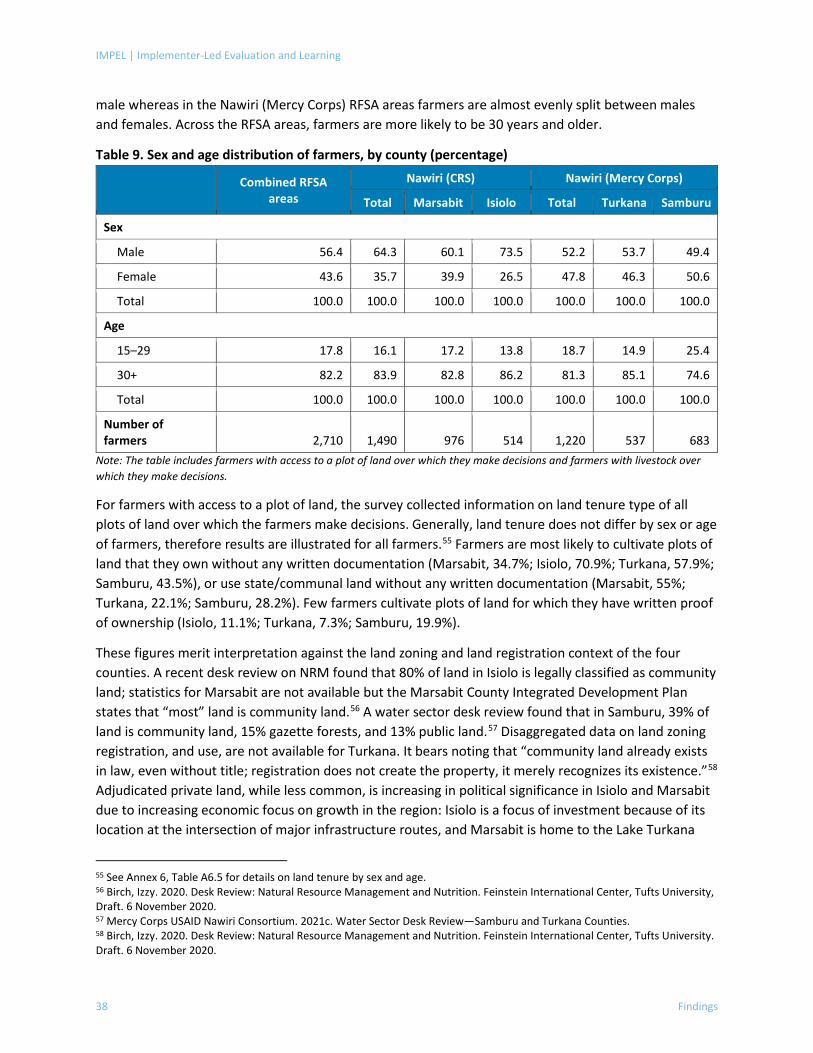
IMPEL | Implementer-Led Evaluation and Learning
38 Findings
male whereas in the Nawiri (Mercy Corps) RFSA areas farmers are almost evenly split between males and females. Across the RFSA areas, farmers are more likely to be 30 years and older.
Table 9. Sex and age distribution of farmers, by county (percentage)
Combined RFSA areas
Nawiri (CRS) Nawiri (Mercy Corps)
Total Marsabit Isiolo Total Turkana Samburu
Sex
Male 56.4 64.3 60.1 73.5 52.2 53.7 49.4
Female 43.6 35.7 39.9 26.5 47.8 46.3 50.6
Total 100.0 100.0 100.0 100.0 100.0 100.0 100.0
Age
15–29 17.8 16.1 17.2 13.8 18.7 14.9 25.4
30+ 82.2 83.9 82.8 86.2 81.3 85.1 74.6
Total 100.0 100.0 100.0 100.0 100.0 100.0 100.0
Number of farmers 2,710 1,490 976 514 1,220 537 683
Note: The table includes farmers with access to a plot of land over which they make decisions and farmers with livestock over which they make decisions.
For farmers with access to a plot of land, the survey collected information on land tenure type of all plots of land over which the farmers make decisions. Generally, land tenure does not differ by sex or age of farmers, therefore results are illustrated for all farmers.55 Farmers are most likely to cultivate plots of land that they own without any written documentation (Marsabit, 34.7%; Isiolo, 70.9%; Turkana, 57.9%; Samburu, 43.5%), or use state/communal land without any written documentation (Marsabit, 55%; Turkana, 22.1%; Samburu, 28.2%). Few farmers cultivate plots of land for which they have written proof of ownership (Isiolo, 11.1%; Turkana, 7.3%; Samburu, 19.9%).
These figures merit interpretation against the land zoning and land registration context of the four counties. A recent desk review on NRM found that 80% of land in Isiolo is legally classified as community land; statistics for Marsabit are not available but the Marsabit County Integrated Development Plan states that “most” land is community land.56 A water sector desk review found that in Samburu, 39% of land is community land, 15% gazette forests, and 13% public land.57 Disaggregated data on land zoning registration, and use, are not available for Turkana. It bears noting that “community land already exists in law, even without title; registration does not create the property, it merely recognizes its existence.”58 Adjudicated private land, while less common, is increasing in political significance in Isiolo and Marsabit due to increasing economic focus on growth in the region: Isiolo is a focus of investment because of its location at the intersection of major infrastructure routes, and Marsabit is home to the Lake Turkana
55 See Annex 6, Table A6.5 for details on land tenure by sex and age. 56 Birch, Izzy. 2020. Desk Review: Natural Resource Management and Nutrition. Feinstein International Center, Tufts University, Draft. 6 November 2020. 57 Mercy Corps USAID Nawiri Consortium. 2021c. Water Sector Desk Review—Samburu and Turkana Counties. 58 Birch, Izzy. 2020. Desk Review: Natural Resource Management and Nutrition. Feinstein International Center, Tufts University. Draft. 6 November 2020.
Baseline Survey of the Nawiri Resilience Food Security Activities in Kenya (Vol. I)
Findings 39
Wind Power project, an historical public-private investment. These developments are noted to create barriers to accessing natural resources and to be transforming attitudes to land. It also bears noting that 36% of land in Turkana is considered arable land (crops, pastures and gardens), versus just 7% in Samburu. Corresponding statistics for Isiolo and Marsabit were not found, however the dominant land use is livestock production (82% of the total area) followed by mixed crop-livestock production (6%), livestock production with wildlife conservation (4%), and wildlife conservation alone (3%).
The Nawiri desk study on NRM raises several points that are important when considering the land to which farmers have access, how that land is used—especially with respect to communal land—and how that use varies throughout the year. Rainfall distribution in drylands varies geographically and over time, rendering rainfall-dependent resources, such as water and vegetation, unpredictable and transient. The report notes, “At the landscape level, drylands are a patchwork of different types and states of vegetation which have particular ecological value at particular times of the year.” Drylands producers’ strategies to maximize these resources include “moving livestock to areas where forage has reached peak nutritional content or combining crop and livestock production in an integrated system.” Areas with permanent water are of special value and may be grazed only during the dry season or used as drought reserves; these areas are also attractive to other land users such as those engaged in cultivation, tourism, or conservation. Conversions of traditional pastoral lands to other uses put the livelihoods and food security of pastoralists at risk. Though rainfall-fed agriculture has been expanding in sedentary areas, the drylands are a difficult environment for irrigated agriculture.59
In addition to land tenure, the survey collected information on farm size—defined as the total farmland in any cropping season in the 12 months prior to the survey. Farmland size does not differ by farmers’ sex or age with a few exceptions; therefore, results are illustrated for all farmers.60 Many farmers cultivate farmland that is less than 0.5 hectares (Marsabit, 58.4%; Isiolo, 40.6%; Turkana, 58.4%; Samburu, 47.2%). As illustrated in Figure 14 and Figure 15, few farmers have access to plots of land larger than 0.5 hectares in the RFSA areas.
59 Birch, Izzy. 2020. Desk Review: Natural Resource Management and Nutrition. Feinstein International Center, Tufts University. Draft 6 November 2020. 60 See Annex F Table A6.5 for details on farmland size by farmers’ age and sex.
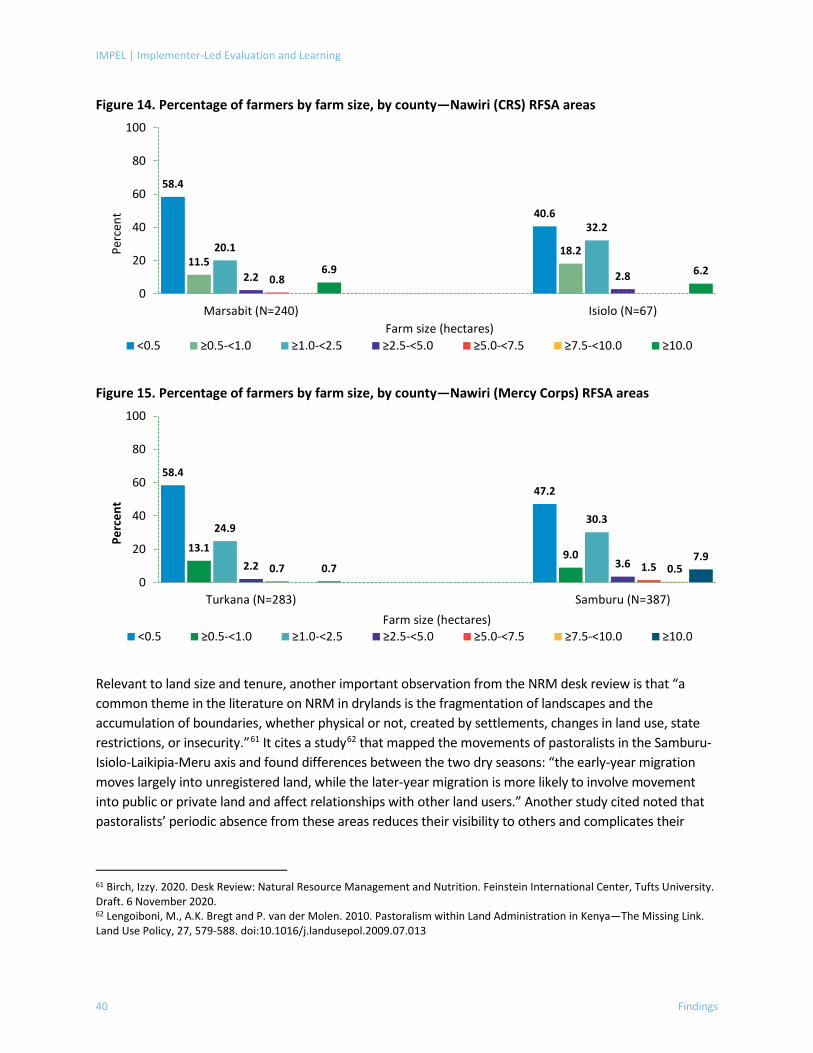
IMPEL | Implementer-Led Evaluation and Learning
40 Findings
Figure 14. Percentage of farmers by farm size, by county—Nawiri (CRS) RFSA areas
Figure 15. Percentage of farmers by farm size, by county—Nawiri (Mercy Corps) RFSA areas
Relevant to land size and tenure, another important observation from the NRM desk review is that “a common theme in the literature on NRM in drylands is the fragmentation of landscapes and the accumulation of boundaries, whether physical or not, created by settlements, changes in land use, state restrictions, or insecurity.”61 It cites a study62 that mapped the movements of pastoralists in the Samburu-Isiolo-Laikipia-Meru axis and found differences between the two dry seasons: “the early-year migration moves largely into unregistered land, while the later-year migration is more likely to involve movement into public or private land and affect relationships with other land users.” Another study cited noted that pastoralists’ periodic absence from these areas reduces their visibility to others and complicates their
61 Birch, Izzy. 2020. Desk Review: Natural Resource Management and Nutrition. Feinstein International Center, Tufts University. Draft. 6 November 2020. 62 Lengoiboni, M., A.K. Bregt and P. van der Molen. 2010. Pastoralism within Land Administration in Kenya—The Missing Link. Land Use Policy, 27, 579-588. doi:10.1016/j.landusepol.2009.07.013
58.4
40.6
11.518.220.1
32.2
2.2 2.80.86.9 6.2
0
20
40
60
80
100
Marsabit (N=240) Isiolo (N=67)
Perc
ent
Farm size (hectares)<0.5 ≥0.5-<1.0 ≥1.0-<2.5 ≥2.5-<5.0 ≥5.0-<7.5 ≥7.5-<10.0 ≥10.0
58.447.2
13.1 9.0
24.930.3
2.2 3.60.7 1.5 0.50.77.9
0
20
40
60
80
100
Turkana (N=283) Samburu (N=387)
Perc
ent
Farm size (hectares)<0.5 ≥0.5-<1.0 ≥1.0-<2.5 ≥2.5-<5.0 ≥5.0-<7.5 ≥7.5-<10.0 ≥10.0
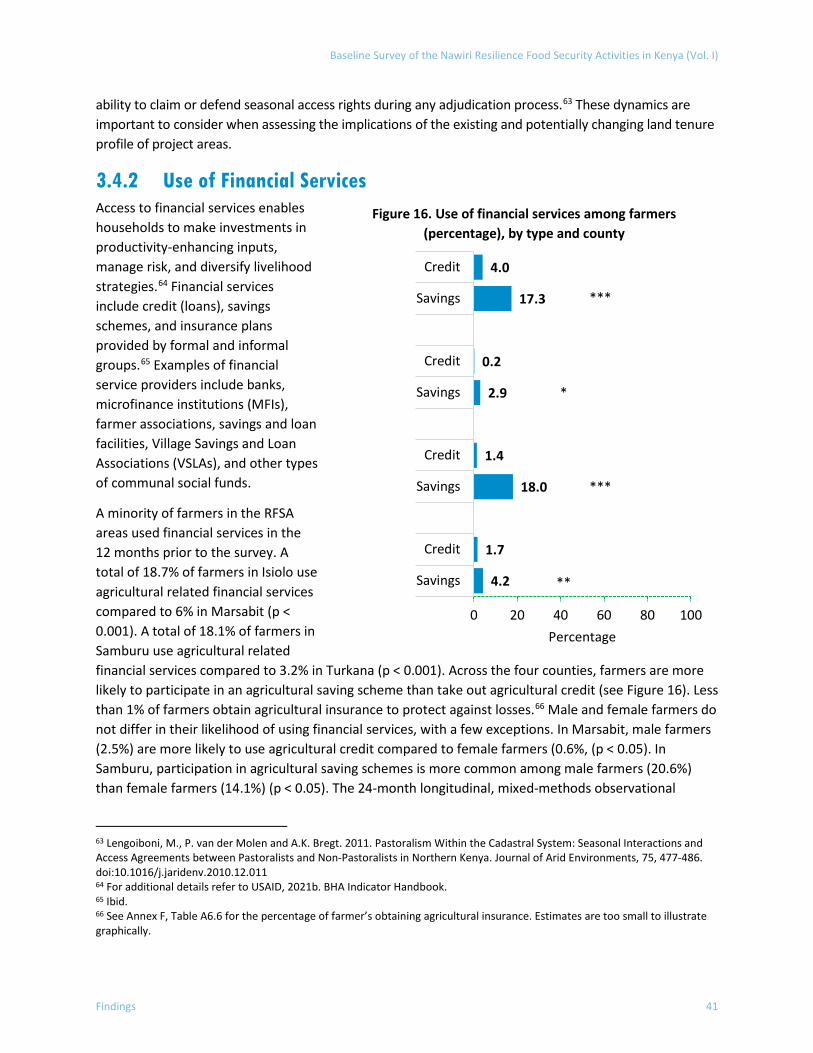
Baseline Survey of the Nawiri Resilience Food Security Activities in Kenya (Vol. I)
Findings 41
ability to claim or defend seasonal access rights during any adjudication process.63 These dynamics are important to consider when assessing the implications of the existing and potentially changing land tenure profile of project areas.
3.4.2 Use of Financial Services Access to financial services enables households to make investments in productivity-enhancing inputs, manage risk, and diversify livelihood strategies.64 Financial services include credit (loans), savings schemes, and insurance plans provided by formal and informal groups.65 Examples of financial service providers include banks, microfinance institutions (MFIs), farmer associations, savings and loan facilities, Village Savings and Loan Associations (VSLAs), and other types of communal social funds.
A minority of farmers in the RFSA areas used financial services in the 12 months prior to the survey. A total of 18.7% of farmers in Isiolo use agricultural related financial services compared to 6% in Marsabit (p < 0.001). A total of 18.1% of farmers in Samburu use agricultural related financial services compared to 3.2% in Turkana (p < 0.001). Across the four counties, farmers are more likely to participate in an agricultural saving scheme than take out agricultural credit (see Figure 16). Less than 1% of farmers obtain agricultural insurance to protect against losses.66 Male and female farmers do not differ in their likelihood of using financial services, with a few exceptions. In Marsabit, male farmers (2.5%) are more likely to use agricultural credit compared to female farmers (0.6%, (p < 0.05). In Samburu, participation in agricultural saving schemes is more common among male farmers (20.6%) than female farmers (14.1%) (p < 0.05). The 24-month longitudinal, mixed-methods observational
63 Lengoiboni, M., P. van der Molen and A.K. Bregt. 2011. Pastoralism Within the Cadastral System: Seasonal Interactions and Access Agreements between Pastoralists and Non-Pastoralists in Northern Kenya. Journal of Arid Environments, 75, 477-486. doi:10.1016/j.jaridenv.2010.12.011 64 For additional details refer to USAID, 2021b. BHA Indicator Handbook. 65 Ibid. 66 See Annex F, Table A6.6 for the percentage of farmer’s obtaining agricultural insurance. Estimates are too small to illustrate graphically.
Figure 16. Use of financial services among farmers (percentage), by type and county
4.2
1.7
18.0
1.4
2.9
0.2
17.3
4.0
0 20 40 60 80 100
Savings
Credit
Savings
Credit
Savings
Credit
Savings
Credit
Percentage
***
***
*
**
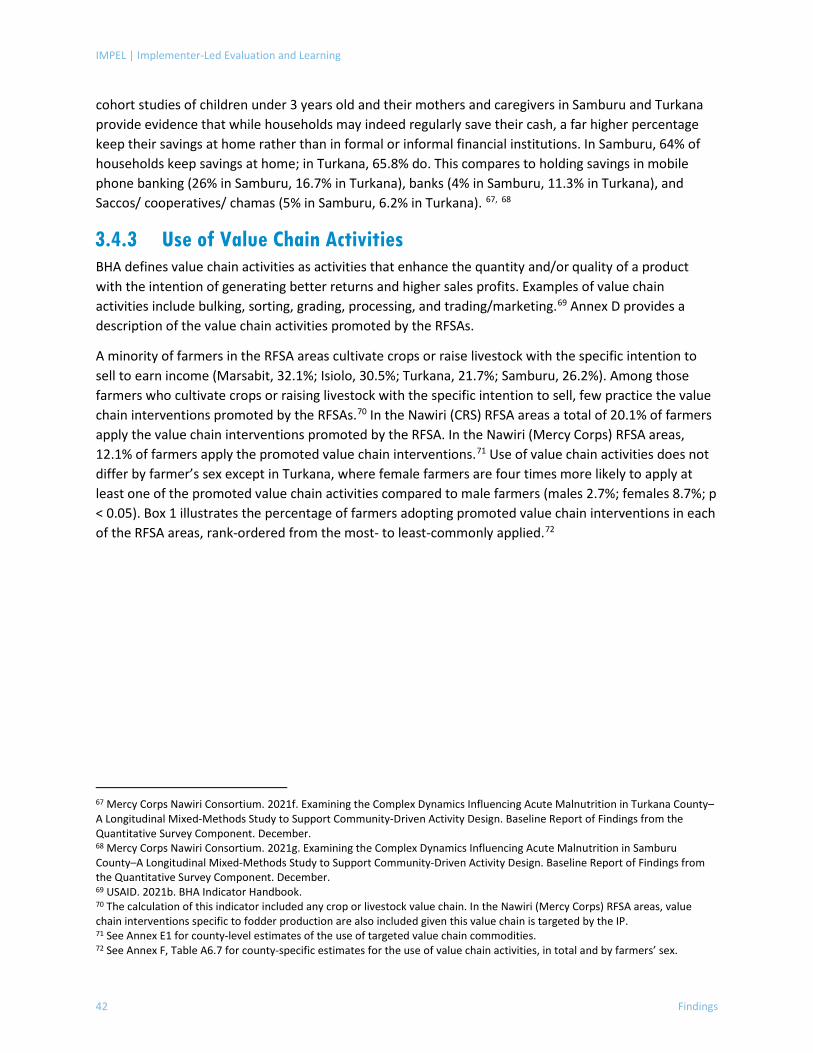
IMPEL | Implementer-Led Evaluation and Learning
42 Findings
cohort studies of children under 3 years old and their mothers and caregivers in Samburu and Turkana provide evidence that while households may indeed regularly save their cash, a far higher percentage keep their savings at home rather than in formal or informal financial institutions. In Samburu, 64% of households keep savings at home; in Turkana, 65.8% do. This compares to holding savings in mobile phone banking (26% in Samburu, 16.7% in Turkana), banks (4% in Samburu, 11.3% in Turkana), and Saccos/ cooperatives/ chamas (5% in Samburu, 6.2% in Turkana). 67, 68
3.4.3 Use of Value Chain Activities BHA defines value chain activities as activities that enhance the quantity and/or quality of a product with the intention of generating better returns and higher sales profits. Examples of value chain activities include bulking, sorting, grading, processing, and trading/marketing.69 Annex D provides a description of the value chain activities promoted by the RFSAs.
A minority of farmers in the RFSA areas cultivate crops or raise livestock with the specific intention to sell to earn income (Marsabit, 32.1%; Isiolo, 30.5%; Turkana, 21.7%; Samburu, 26.2%). Among those farmers who cultivate crops or raising livestock with the specific intention to sell, few practice the value chain interventions promoted by the RFSAs.70 In the Nawiri (CRS) RFSA areas a total of 20.1% of farmers apply the value chain interventions promoted by the RFSA. In the Nawiri (Mercy Corps) RFSA areas, 12.1% of farmers apply the promoted value chain interventions.71 Use of value chain activities does not differ by farmer’s sex except in Turkana, where female farmers are four times more likely to apply at least one of the promoted value chain activities compared to male farmers (males 2.7%; females 8.7%; p < 0.05). Box 1 illustrates the percentage of farmers adopting promoted value chain interventions in each of the RFSA areas, rank-ordered from the most- to least-commonly applied.72
67 Mercy Corps Nawiri Consortium. 2021f. Examining the Complex Dynamics Influencing Acute Malnutrition in Turkana County–A Longitudinal Mixed-Methods Study to Support Community-Driven Activity Design. Baseline Report of Findings from the Quantitative Survey Component. December. 68 Mercy Corps Nawiri Consortium. 2021g. Examining the Complex Dynamics Influencing Acute Malnutrition in Samburu County–A Longitudinal Mixed-Methods Study to Support Community-Driven Activity Design. Baseline Report of Findings from the Quantitative Survey Component. December. 69 USAID. 2021b. BHA Indicator Handbook. 70 The calculation of this indicator included any crop or livestock value chain. In the Nawiri (Mercy Corps) RFSA areas, value chain interventions specific to fodder production are also included given this value chain is targeted by the IP. 71 See Annex E1 for county-level estimates of the use of targeted value chain commodities. 72 See Annex F, Table A6.7 for county-specific estimates for the use of value chain activities, in total and by farmers’ sex.
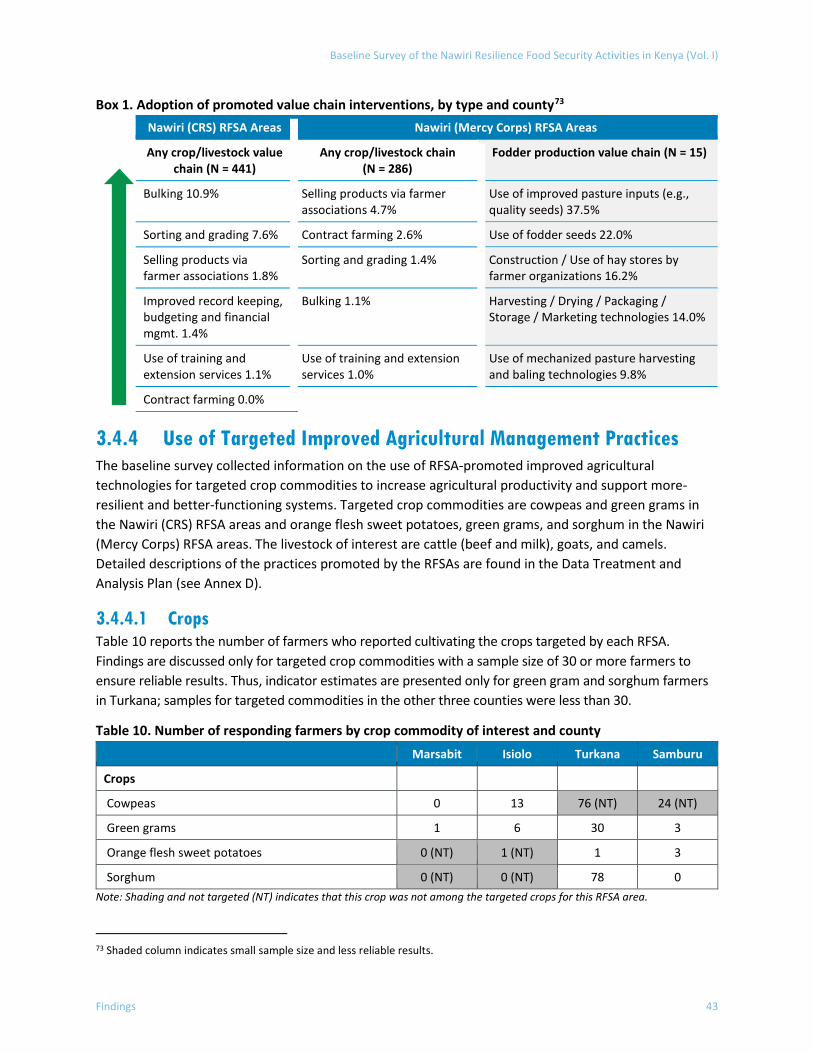
Baseline Survey of the Nawiri Resilience Food Security Activities in Kenya (Vol. I)
Findings 43
Box 1. Adoption of promoted value chain interventions, by type and county73
Nawiri (CRS) RFSA Areas Nawiri (Mercy Corps) RFSA Areas
Any crop/livestock value chain (N = 441)
Any crop/livestock chain (N = 286)
Fodder production value chain (N = 15)
Bulking 10.9% Selling products via farmer associations 4.7%
Use of improved pasture inputs (e.g., quality seeds) 37.5%
Sorting and grading 7.6% Contract farming 2.6% Use of fodder seeds 22.0%
Selling products via farmer associations 1.8%
Sorting and grading 1.4% Construction / Use of hay stores by farmer organizations 16.2%
Improved record keeping, budgeting and financial mgmt. 1.4%
Bulking 1.1% Harvesting / Drying / Packaging / Storage / Marketing technologies 14.0%
Use of training and extension services 1.1%
Use of training and extension services 1.0%
Use of mechanized pasture harvesting and baling technologies 9.8%
Contract farming 0.0%
3.4.4 Use of Targeted Improved Agricultural Management Practices The baseline survey collected information on the use of RFSA-promoted improved agricultural technologies for targeted crop commodities to increase agricultural productivity and support more-resilient and better-functioning systems. Targeted crop commodities are cowpeas and green grams in the Nawiri (CRS) RFSA areas and orange flesh sweet potatoes, green grams, and sorghum in the Nawiri (Mercy Corps) RFSA areas. The livestock of interest are cattle (beef and milk), goats, and camels. Detailed descriptions of the practices promoted by the RFSAs are found in the Data Treatment and Analysis Plan (see Annex D).
3.4.4.1 Crops Table 10 reports the number of farmers who reported cultivating the crops targeted by each RFSA. Findings are discussed only for targeted crop commodities with a sample size of 30 or more farmers to ensure reliable results. Thus, indicator estimates are presented only for green gram and sorghum farmers in Turkana; samples for targeted commodities in the other three counties were less than 30.
Table 10. Number of responding farmers by crop commodity of interest and county
Marsabit Isiolo Turkana Samburu
Crops
Cowpeas 0 13 76 (NT) 24 (NT)
Green grams 1 6 30 3
Orange flesh sweet potatoes 0 (NT) 1 (NT) 1 3
Sorghum 0 (NT) 0 (NT) 78 0 Note: Shading and not targeted (NT) indicates that this crop was not among the targeted crops for this RFSA area.
73 Shaded column indicates small sample size and less reliable results.
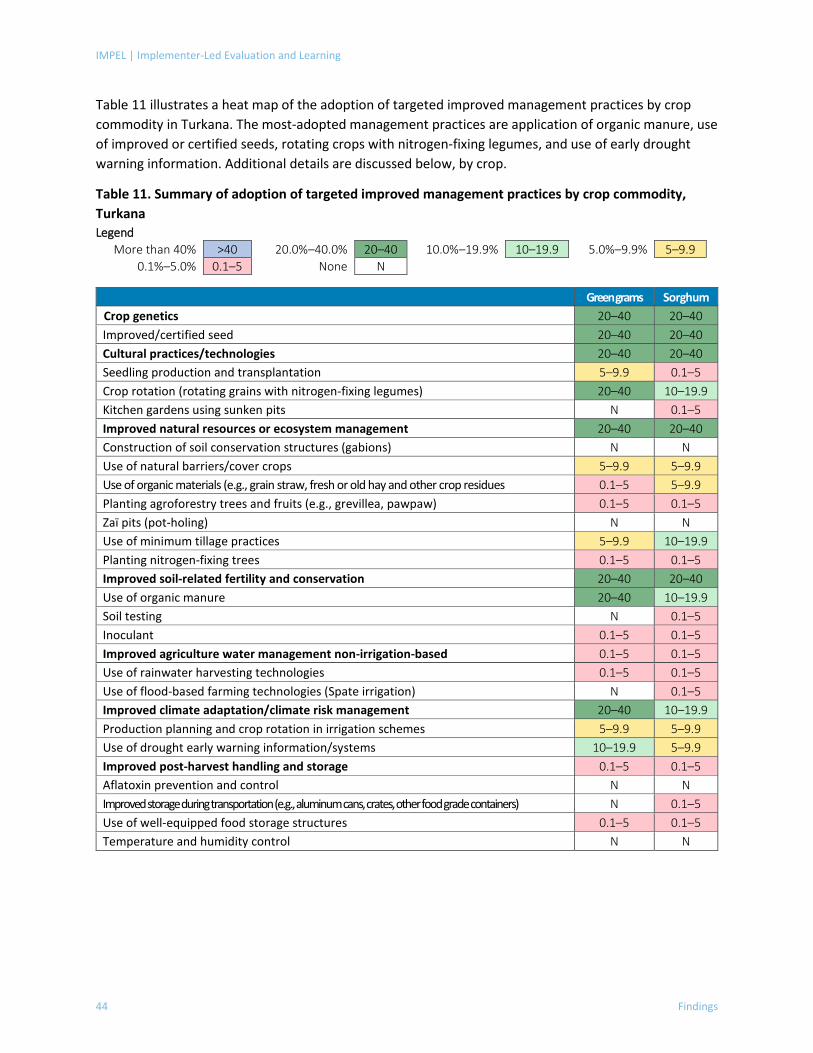
IMPEL | Implementer-Led Evaluation and Learning
44 Findings
Table 11 illustrates a heat map of the adoption of targeted improved management practices by crop commodity in Turkana. The most-adopted management practices are application of organic manure, use of improved or certified seeds, rotating crops with nitrogen-fixing legumes, and use of early drought warning information. Additional details are discussed below, by crop.
Table 11. Summary of adoption of targeted improved management practices by crop commodity, Turkana Legend
More than 40% >40 20.0%–40.0% 20–40 10.0%–19.9% 10–19.9 5.0%–9.9% 5–9.9 0.1%–5.0% 0.1–5 None N
Green grams Sorghum Crop genetics 20–40 20–40 Improved/certified seed 20–40 20–40 Cultural practices/technologies 20–40 20–40 Seedling production and transplantation 5–9.9 0.1–5 Crop rotation (rotating grains with nitrogen-fixing legumes) 20–40 10–19.9 Kitchen gardens using sunken pits N 0.1–5 Improved natural resources or ecosystem management 20–40 20–40 Construction of soil conservation structures (gabions) N N Use of natural barriers/cover crops 5–9.9 5–9.9 Use of organic materials (e.g., grain straw, fresh or old hay and other crop residues 0.1–5 5–9.9 Planting agroforestry trees and fruits (e.g., grevillea, pawpaw) 0.1–5 0.1–5 Zaï pits (pot-holing) N N Use of minimum tillage practices 5–9.9 10–19.9 Planting nitrogen-fixing trees 0.1–5 0.1–5 Improved soil-related fertility and conservation 20–40 20–40 Use of organic manure 20–40 10–19.9 Soil testing N 0.1–5 Inoculant 0.1–5 0.1–5 Improved agriculture water management non-irrigation-based 0.1–5 0.1–5 Use of rainwater harvesting technologies 0.1–5 0.1–5 Use of flood-based farming technologies (Spate irrigation) N 0.1–5 Improved climate adaptation/climate risk management 20–40 10–19.9 Production planning and crop rotation in irrigation schemes 5–9.9 5–9.9 Use of drought early warning information/systems 10–19.9 5–9.9 Improved post-harvest handling and storage 0.1–5 0.1–5 Aflatoxin prevention and control N N Improved storage during transportation (e.g., aluminum cans, crates, other food grade containers) N 0.1–5 Use of well-equipped food storage structures 0.1–5 0.1–5 Temperature and humidity control N N
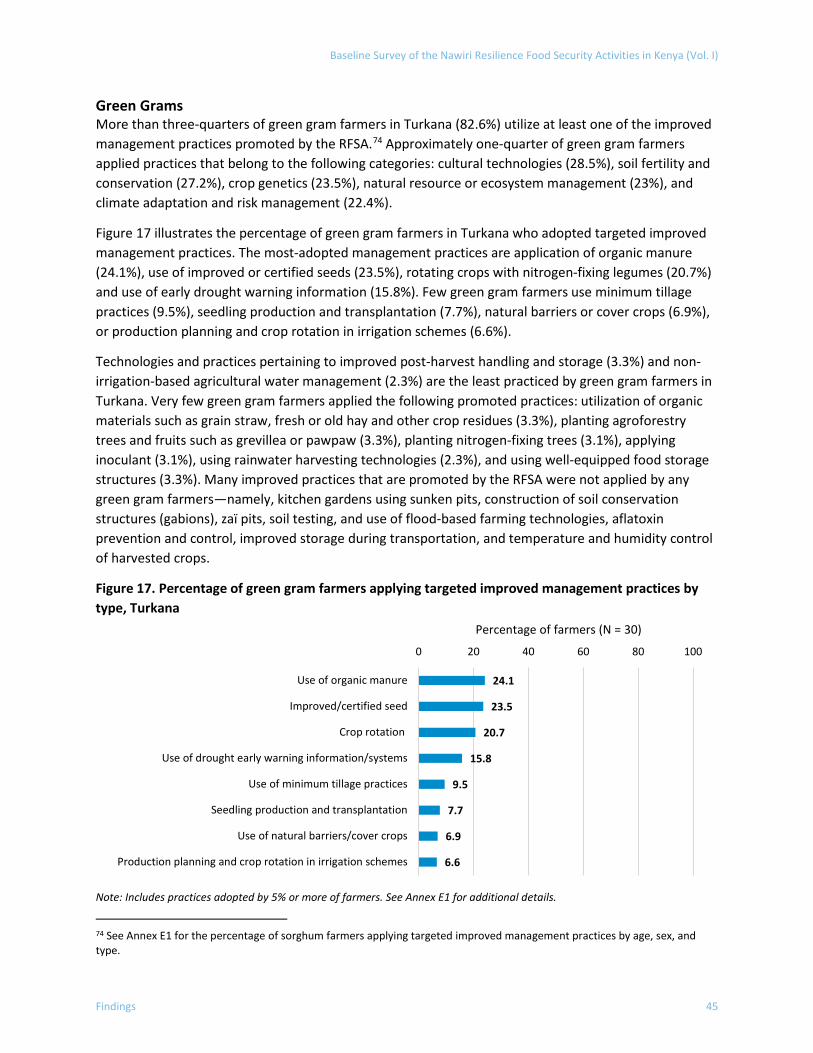
Baseline Survey of the Nawiri Resilience Food Security Activities in Kenya (Vol. I)
Findings 45
Green Grams More than three-quarters of green gram farmers in Turkana (82.6%) utilize at least one of the improved management practices promoted by the RFSA.74 Approximately one-quarter of green gram farmers applied practices that belong to the following categories: cultural technologies (28.5%), soil fertility and conservation (27.2%), crop genetics (23.5%), natural resource or ecosystem management (23%), and climate adaptation and risk management (22.4%).
Figure 17 illustrates the percentage of green gram farmers in Turkana who adopted targeted improved management practices. The most-adopted management practices are application of organic manure (24.1%), use of improved or certified seeds (23.5%), rotating crops with nitrogen-fixing legumes (20.7%) and use of early drought warning information (15.8%). Few green gram farmers use minimum tillage practices (9.5%), seedling production and transplantation (7.7%), natural barriers or cover crops (6.9%), or production planning and crop rotation in irrigation schemes (6.6%).
Technologies and practices pertaining to improved post-harvest handling and storage (3.3%) and non-irrigation-based agricultural water management (2.3%) are the least practiced by green gram farmers in Turkana. Very few green gram farmers applied the following promoted practices: utilization of organic materials such as grain straw, fresh or old hay and other crop residues (3.3%), planting agroforestry trees and fruits such as grevillea or pawpaw (3.3%), planting nitrogen-fixing trees (3.1%), applying inoculant (3.1%), using rainwater harvesting technologies (2.3%), and using well-equipped food storage structures (3.3%). Many improved practices that are promoted by the RFSA were not applied by any green gram farmers—namely, kitchen gardens using sunken pits, construction of soil conservation structures (gabions), zaï pits, soil testing, and use of flood-based farming technologies, aflatoxin prevention and control, improved storage during transportation, and temperature and humidity control of harvested crops.
Figure 17. Percentage of green gram farmers applying targeted improved management practices by type, Turkana
Note: Includes practices adopted by 5% or more of farmers. See Annex E1 for additional details. 74 See Annex E1 for the percentage of sorghum farmers applying targeted improved management practices by age, sex, and type.
24.1
23.5
20.7
15.8
9.5
7.7
6.9
6.6
0 20 40 60 80 100
Use of organic manure
Improved/certified seed
Crop rotation
Use of drought early warning information/systems
Use of minimum tillage practices
Seedling production and transplantation
Use of natural barriers/cover crops
Production planning and crop rotation in irrigation schemes
Percentage of farmers (N = 30)
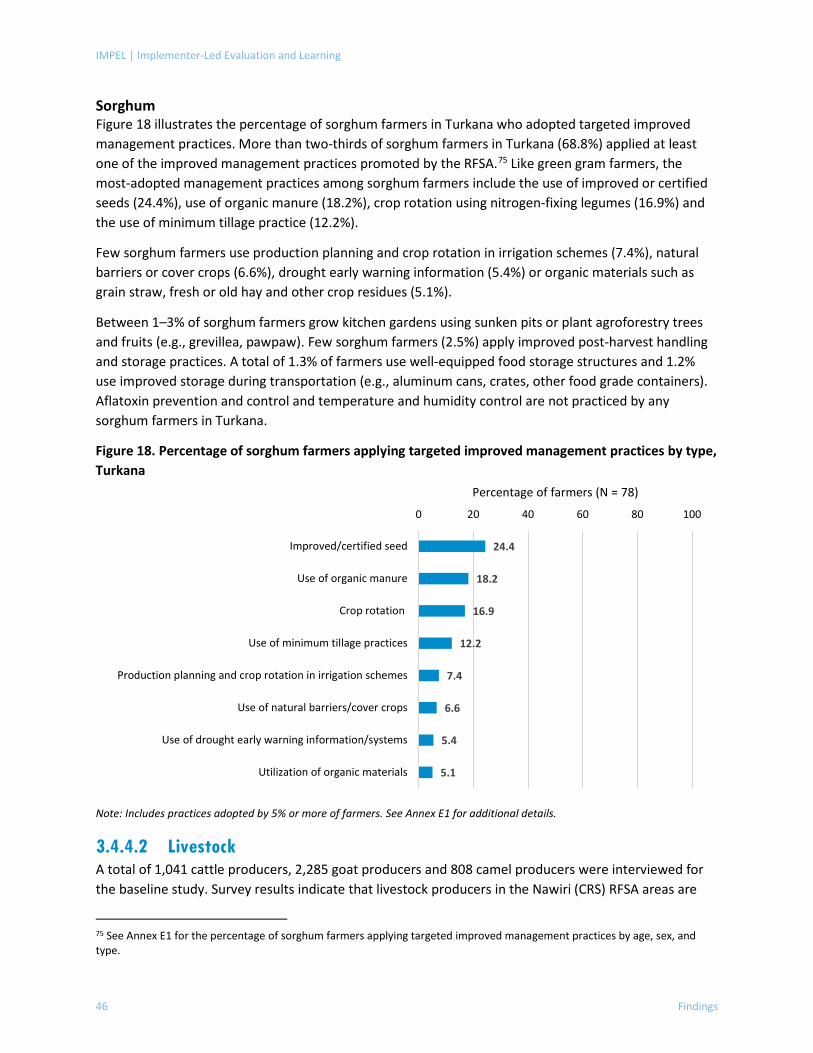
IMPEL | Implementer-Led Evaluation and Learning
46 Findings
Sorghum Figure 18 illustrates the percentage of sorghum farmers in Turkana who adopted targeted improved management practices. More than two-thirds of sorghum farmers in Turkana (68.8%) applied at least one of the improved management practices promoted by the RFSA.75 Like green gram farmers, the most-adopted management practices among sorghum farmers include the use of improved or certified seeds (24.4%), use of organic manure (18.2%), crop rotation using nitrogen-fixing legumes (16.9%) and the use of minimum tillage practice (12.2%).
Few sorghum farmers use production planning and crop rotation in irrigation schemes (7.4%), natural barriers or cover crops (6.6%), drought early warning information (5.4%) or organic materials such as grain straw, fresh or old hay and other crop residues (5.1%).
Between 1–3% of sorghum farmers grow kitchen gardens using sunken pits or plant agroforestry trees and fruits (e.g., grevillea, pawpaw). Few sorghum farmers (2.5%) apply improved post-harvest handling and storage practices. A total of 1.3% of farmers use well-equipped food storage structures and 1.2% use improved storage during transportation (e.g., aluminum cans, crates, other food grade containers). Aflatoxin prevention and control and temperature and humidity control are not practiced by any sorghum farmers in Turkana.
Figure 18. Percentage of sorghum farmers applying targeted improved management practices by type, Turkana
Note: Includes practices adopted by 5% or more of farmers. See Annex E1 for additional details.
3.4.4.2 Livestock A total of 1,041 cattle producers, 2,285 goat producers and 808 camel producers were interviewed for the baseline study. Survey results indicate that livestock producers in the Nawiri (CRS) RFSA areas are
75 See Annex E1 for the percentage of sorghum farmers applying targeted improved management practices by age, sex, and type.
24.4
18.2
16.9
12.2
7.4
6.6
5.4
5.1
0 20 40 60 80 100
Improved/certified seed
Use of organic manure
Crop rotation
Use of minimum tillage practices
Production planning and crop rotation in irrigation schemes
Use of natural barriers/cover crops
Use of drought early warning information/systems
Utilization of organic materials
Percentage of farmers (N = 78)
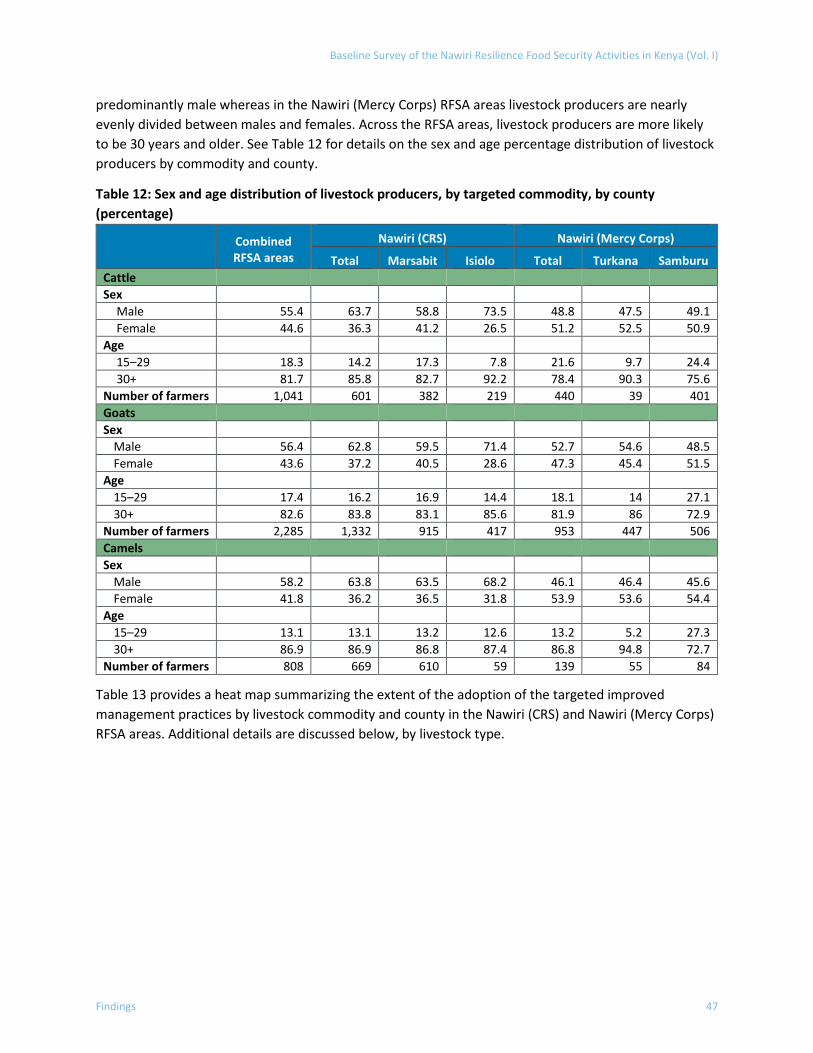
Baseline Survey of the Nawiri Resilience Food Security Activities in Kenya (Vol. I)
Findings 47
predominantly male whereas in the Nawiri (Mercy Corps) RFSA areas livestock producers are nearly evenly divided between males and females. Across the RFSA areas, livestock producers are more likely to be 30 years and older. See Table 12 for details on the sex and age percentage distribution of livestock producers by commodity and county.
Table 12: Sex and age distribution of livestock producers, by targeted commodity, by county (percentage)
Combined RFSA areas
Nawiri (CRS) Nawiri (Mercy Corps)
Total Marsabit Isiolo Total Turkana Samburu Cattle Sex
Male 55.4 63.7 58.8 73.5 48.8 47.5 49.1 Female 44.6 36.3 41.2 26.5 51.2 52.5 50.9
Age 15–29 18.3 14.2 17.3 7.8 21.6 9.7 24.4 30+ 81.7 85.8 82.7 92.2 78.4 90.3 75.6
Number of farmers 1,041 601 382 219 440 39 401 Goats Sex
Male 56.4 62.8 59.5 71.4 52.7 54.6 48.5 Female 43.6 37.2 40.5 28.6 47.3 45.4 51.5
Age 15–29 17.4 16.2 16.9 14.4 18.1 14 27.1 30+ 82.6 83.8 83.1 85.6 81.9 86 72.9
Number of farmers 2,285 1,332 915 417 953 447 506 Camels Sex
Male 58.2 63.8 63.5 68.2 46.1 46.4 45.6 Female 41.8 36.2 36.5 31.8 53.9 53.6 54.4
Age 15–29 13.1 13.1 13.2 12.6 13.2 5.2 27.3 30+ 86.9 86.9 86.8 87.4 86.8 94.8 72.7
Number of farmers 808 669 610 59 139 55 84
Table 13 provides a heat map summarizing the extent of the adoption of the targeted improved management practices by livestock commodity and county in the Nawiri (CRS) and Nawiri (Mercy Corps) RFSA areas. Additional details are discussed below, by livestock type.
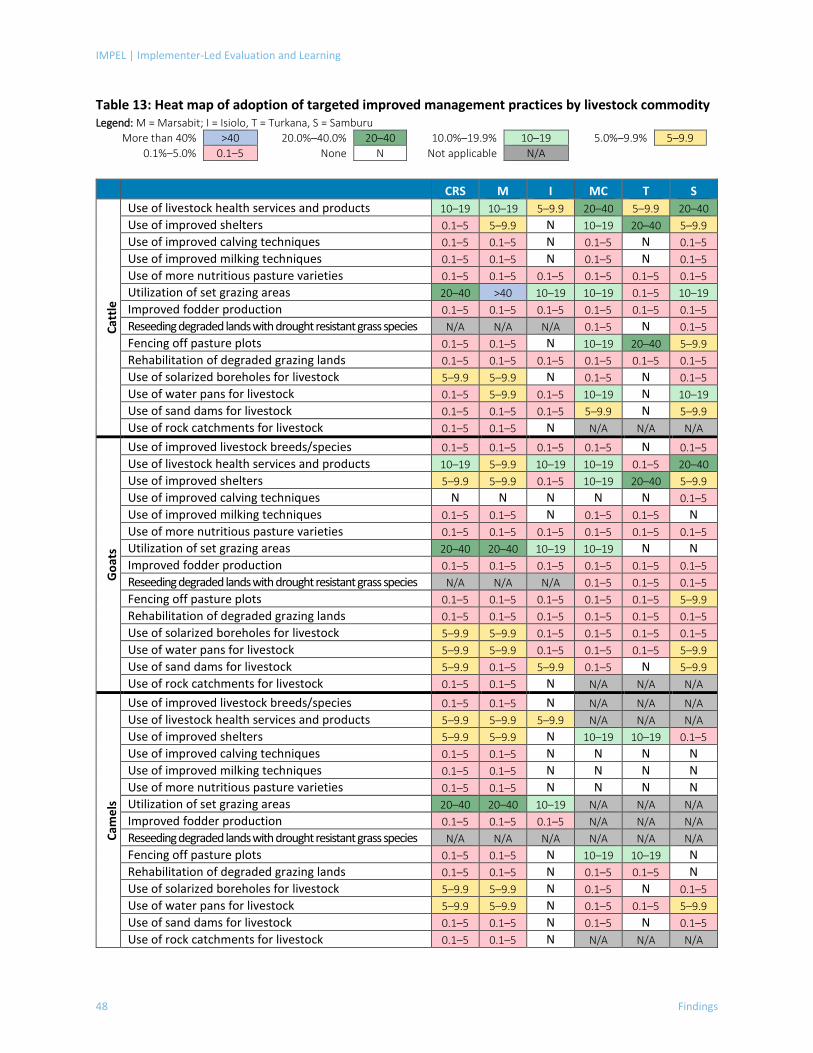
IMPEL | Implementer-Led Evaluation and Learning
48 Findings
Table 13: Heat map of adoption of targeted improved management practices by livestock commodity Legend: M = Marsabit; I = Isiolo, T = Turkana, S = Samburu
More than 40% >40 20.0%–40.0% 20–40 10.0%–19.9% 10–19 5.0%–9.9% 5–9.9 0.1%–5.0% 0.1–5 None N Not applicable N/A
CRS M I MC T S
Catt
le
Use of livestock health services and products 10–19 10–19 5–9.9 20–40 5–9.9 20–40 Use of improved shelters 0.1–5 5–9.9 N 10–19 20–40 5–9.9 Use of improved calving techniques 0.1–5 0.1–5 N 0.1–5 N 0.1–5 Use of improved milking techniques 0.1–5 0.1–5 N 0.1–5 N 0.1–5 Use of more nutritious pasture varieties 0.1–5 0.1–5 0.1–5 0.1–5 0.1–5 0.1–5 Utilization of set grazing areas 20–40 >40 10–19 10–19 0.1–5 10–19 Improved fodder production 0.1–5 0.1–5 0.1–5 0.1–5 0.1–5 0.1–5 Reseeding degraded lands with drought resistant grass species N/A N/A N/A 0.1–5 N 0.1–5 Fencing off pasture plots 0.1–5 0.1–5 N 10–19 20–40 5–9.9 Rehabilitation of degraded grazing lands 0.1–5 0.1–5 0.1–5 0.1–5 0.1–5 0.1–5 Use of solarized boreholes for livestock 5–9.9 5–9.9 N 0.1–5 N 0.1–5 Use of water pans for livestock 0.1–5 5–9.9 0.1–5 10–19 N 10–19 Use of sand dams for livestock 0.1–5 0.1–5 0.1–5 5–9.9 N 5–9.9 Use of rock catchments for livestock 0.1–5 0.1–5 N N/A N/A N/A
Goa
ts
Use of improved livestock breeds/species 0.1–5 0.1–5 0.1–5 0.1–5 N 0.1–5 Use of livestock health services and products 10–19 5–9.9 10–19 10–19 0.1–5 20–40 Use of improved shelters 5–9.9 5–9.9 0.1–5 10–19 20–40 5–9.9 Use of improved calving techniques N N N N N 0.1–5 Use of improved milking techniques 0.1–5 0.1–5 N 0.1–5 0.1–5 N Use of more nutritious pasture varieties 0.1–5 0.1–5 0.1–5 0.1–5 0.1–5 0.1–5 Utilization of set grazing areas 20–40 20–40 10–19 10–19 N N Improved fodder production 0.1–5 0.1–5 0.1–5 0.1–5 0.1–5 0.1–5 Reseeding degraded lands with drought resistant grass species N/A N/A N/A 0.1–5 0.1–5 0.1–5 Fencing off pasture plots 0.1–5 0.1–5 0.1–5 0.1–5 0.1–5 5–9.9 Rehabilitation of degraded grazing lands 0.1–5 0.1–5 0.1–5 0.1–5 0.1–5 0.1–5 Use of solarized boreholes for livestock 5–9.9 5–9.9 0.1–5 0.1–5 0.1–5 0.1–5 Use of water pans for livestock 5–9.9 5–9.9 0.1–5 0.1–5 0.1–5 5–9.9 Use of sand dams for livestock 5–9.9 0.1–5 5–9.9 0.1–5 N 5–9.9 Use of rock catchments for livestock 0.1–5 0.1–5 N N/A N/A N/A
Cam
els
Use of improved livestock breeds/species 0.1–5 0.1–5 N N/A N/A N/A Use of livestock health services and products 5–9.9 5–9.9 5–9.9 N/A N/A N/A Use of improved shelters 5–9.9 5–9.9 N 10–19 10–19 0.1–5 Use of improved calving techniques 0.1–5 0.1–5 N N N N Use of improved milking techniques 0.1–5 0.1–5 N N N N Use of more nutritious pasture varieties 0.1–5 0.1–5 N N N N Utilization of set grazing areas 20–40 20–40 10–19 N/A N/A N/A Improved fodder production 0.1–5 0.1–5 0.1–5 N/A N/A N/A Reseeding degraded lands with drought resistant grass species N/A N/A N/A N/A N/A N/A Fencing off pasture plots 0.1–5 0.1–5 N 10–19 10–19 N Rehabilitation of degraded grazing lands 0.1–5 0.1–5 N 0.1–5 0.1–5 N Use of solarized boreholes for livestock 5–9.9 5–9.9 N 0.1–5 N 0.1–5 Use of water pans for livestock 5–9.9 5–9.9 N 0.1–5 0.1–5 5–9.9 Use of sand dams for livestock 0.1–5 0.1–5 N 0.1–5 N 0.1–5 Use of rock catchments for livestock 0.1–5 0.1–5 N N/A N/A N/A
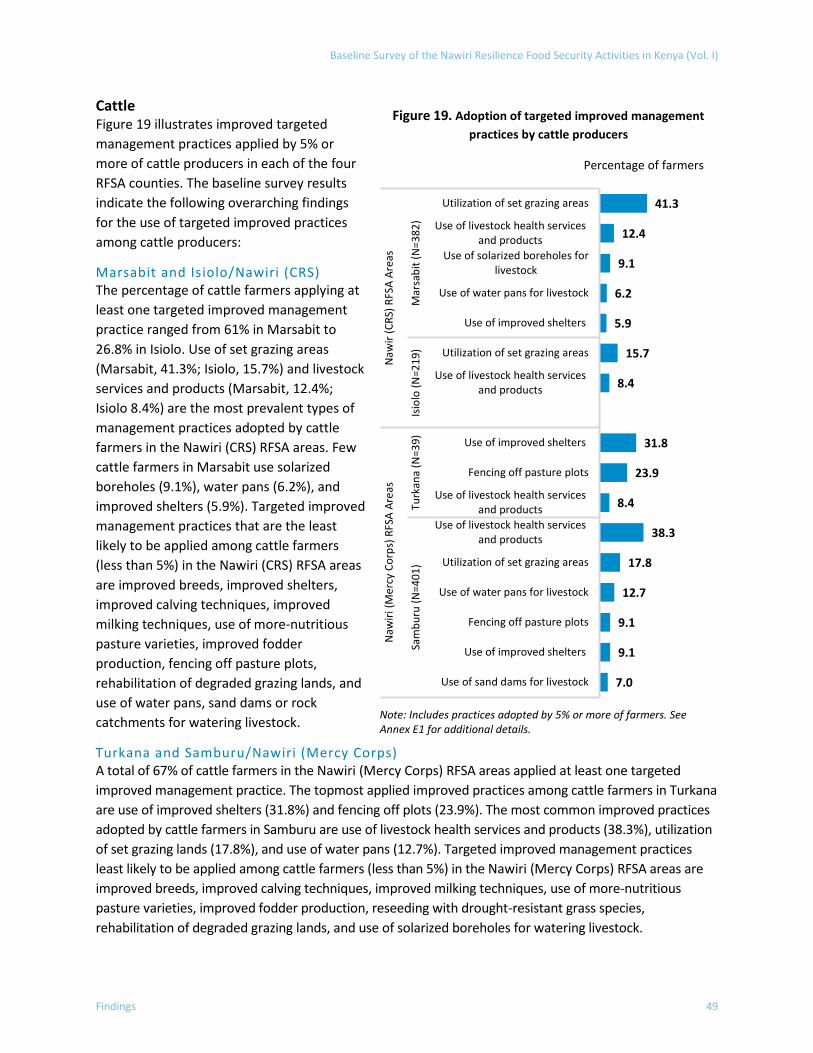
Baseline Survey of the Nawiri Resilience Food Security Activities in Kenya (Vol. I)
Findings 49
Cattle Figure 19 illustrates improved targeted management practices applied by 5% or more of cattle producers in each of the four RFSA counties. The baseline survey results indicate the following overarching findings for the use of targeted improved practices among cattle producers:
Marsabit and Isiolo/Nawiri (CRS) The percentage of cattle farmers applying at least one targeted improved management practice ranged from 61% in Marsabit to 26.8% in Isiolo. Use of set grazing areas (Marsabit, 41.3%; Isiolo, 15.7%) and livestock services and products (Marsabit, 12.4%; Isiolo 8.4%) are the most prevalent types of management practices adopted by cattle farmers in the Nawiri (CRS) RFSA areas. Few cattle farmers in Marsabit use solarized boreholes (9.1%), water pans (6.2%), and improved shelters (5.9%). Targeted improved management practices that are the least likely to be applied among cattle farmers (less than 5%) in the Nawiri (CRS) RFSA areas are improved breeds, improved shelters, improved calving techniques, improved milking techniques, use of more-nutritious pasture varieties, improved fodder production, fencing off pasture plots, rehabilitation of degraded grazing lands, and use of water pans, sand dams or rock catchments for watering livestock.
Turkana and Samburu/Nawiri (Mercy Corps) A total of 67% of cattle farmers in the Nawiri (Mercy Corps) RFSA areas applied at least one targeted improved management practice. The topmost applied improved practices among cattle farmers in Turkana are use of improved shelters (31.8%) and fencing off plots (23.9%). The most common improved practices adopted by cattle farmers in Samburu are use of livestock health services and products (38.3%), utilization of set grazing lands (17.8%), and use of water pans (12.7%). Targeted improved management practices least likely to be applied among cattle farmers (less than 5%) in the Nawiri (Mercy Corps) RFSA areas are improved breeds, improved calving techniques, improved milking techniques, use of more-nutritious pasture varieties, improved fodder production, reseeding with drought-resistant grass species, rehabilitation of degraded grazing lands, and use of solarized boreholes for watering livestock.
Figure 19. Adoption of targeted improved management practices by cattle producers
Note: Includes practices adopted by 5% or more of farmers. See Annex E1 for additional details.
41.3
12.4
9.1
6.2
5.9
15.7
8.4
31.8
23.9
8.4
38.3
17.8
12.7
9.1
9.1
7.0
Utilization of set grazing areas
Use of livestock health servicesand products
Use of solarized boreholes forlivestock
Use of water pans for livestock
Use of improved shelters
Utilization of set grazing areas
Use of livestock health servicesand products
Use of improved shelters
Fencing off pasture plots
Use of livestock health servicesand products
Use of livestock health servicesand products
Utilization of set grazing areas
Use of water pans for livestock
Fencing off pasture plots
Use of improved shelters
Use of sand dams for livestock
Mar
sabi
t (N
=382
)Is
iolo
(N=2
19)
Turk
ana
(N=3
9)Sa
mbu
ru (N
=401
)
Naw
ir (C
RS) R
FSA
Area
sN
awiri
(Mer
cy C
orps
) RFS
A Ar
eas
Percentage of farmers
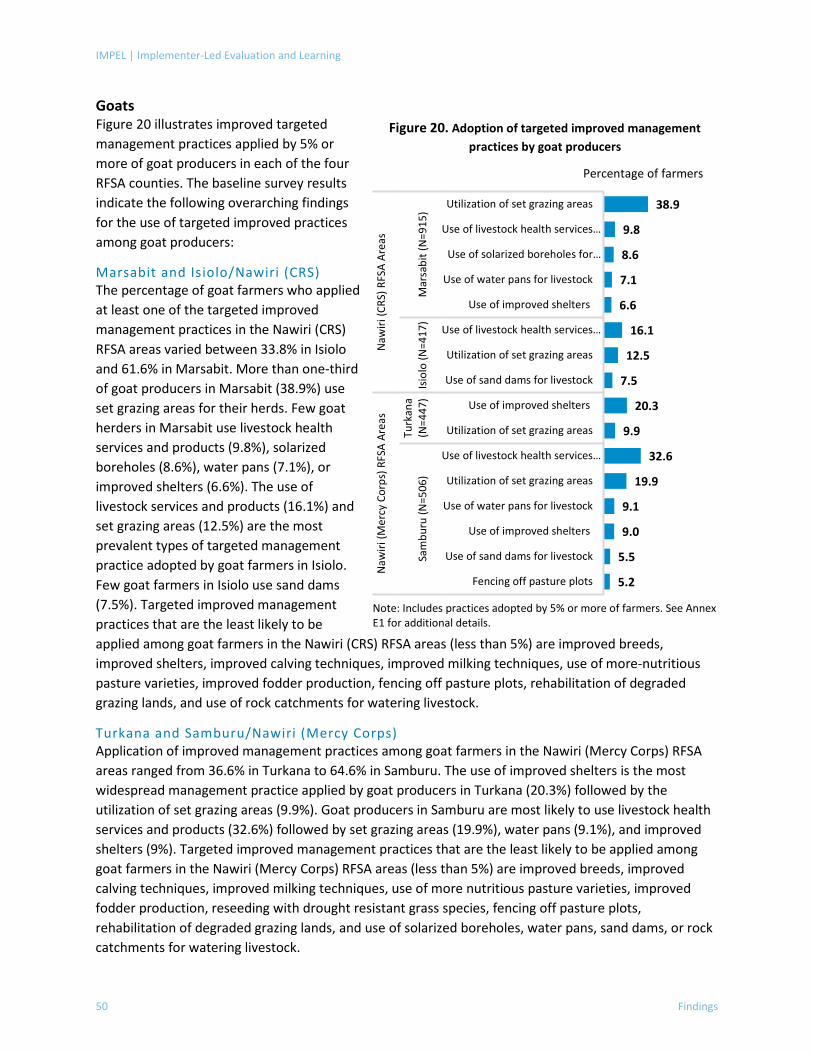
IMPEL | Implementer-Led Evaluation and Learning
50 Findings
Goats Figure 20 illustrates improved targeted management practices applied by 5% or more of goat producers in each of the four RFSA counties. The baseline survey results indicate the following overarching findings for the use of targeted improved practices among goat producers:
Marsabit and Isiolo/Nawiri (CRS) The percentage of goat farmers who applied at least one of the targeted improved management practices in the Nawiri (CRS) RFSA areas varied between 33.8% in Isiolo and 61.6% in Marsabit. More than one-third of goat producers in Marsabit (38.9%) use set grazing areas for their herds. Few goat herders in Marsabit use livestock health services and products (9.8%), solarized boreholes (8.6%), water pans (7.1%), or improved shelters (6.6%). The use of livestock services and products (16.1%) and set grazing areas (12.5%) are the most prevalent types of targeted management practice adopted by goat farmers in Isiolo. Few goat farmers in Isiolo use sand dams (7.5%). Targeted improved management practices that are the least likely to be applied among goat farmers in the Nawiri (CRS) RFSA areas (less than 5%) are improved breeds, improved shelters, improved calving techniques, improved milking techniques, use of more-nutritious pasture varieties, improved fodder production, fencing off pasture plots, rehabilitation of degraded grazing lands, and use of rock catchments for watering livestock.
Turkana and Samburu/Nawiri (Mercy Corps) Application of improved management practices among goat farmers in the Nawiri (Mercy Corps) RFSA areas ranged from 36.6% in Turkana to 64.6% in Samburu. The use of improved shelters is the most widespread management practice applied by goat producers in Turkana (20.3%) followed by the utilization of set grazing areas (9.9%). Goat producers in Samburu are most likely to use livestock health services and products (32.6%) followed by set grazing areas (19.9%), water pans (9.1%), and improved shelters (9%). Targeted improved management practices that are the least likely to be applied among goat farmers in the Nawiri (Mercy Corps) RFSA areas (less than 5%) are improved breeds, improved calving techniques, improved milking techniques, use of more nutritious pasture varieties, improved fodder production, reseeding with drought resistant grass species, fencing off pasture plots, rehabilitation of degraded grazing lands, and use of solarized boreholes, water pans, sand dams, or rock catchments for watering livestock.
Figure 20. Adoption of targeted improved management practices by goat producers
Note: Includes practices adopted by 5% or more of farmers. See Annex E1 for additional details.
38.9
9.8
8.6
7.1
6.6
16.1
12.5
7.5
20.3
9.9
32.6
19.9
9.1
9.0
5.5
5.2
Utilization of set grazing areas
Use of livestock health services…
Use of solarized boreholes for…
Use of water pans for livestock
Use of improved shelters
Use of livestock health services…
Utilization of set grazing areas
Use of sand dams for livestock
Use of improved shelters
Utilization of set grazing areas
Use of livestock health services…
Utilization of set grazing areas
Use of water pans for livestock
Use of improved shelters
Use of sand dams for livestock
Fencing off pasture plots
Mar
sabi
t (N
=915
)Is
iolo
(N=4
17)
Turk
ana
(N=4
47)
Sam
buru
(N=5
06)
Naw
iri (C
RS) R
FSA
Area
sN
awiri
(Mer
cy C
orps
) RFS
A Ar
eas
Percentage of farmers
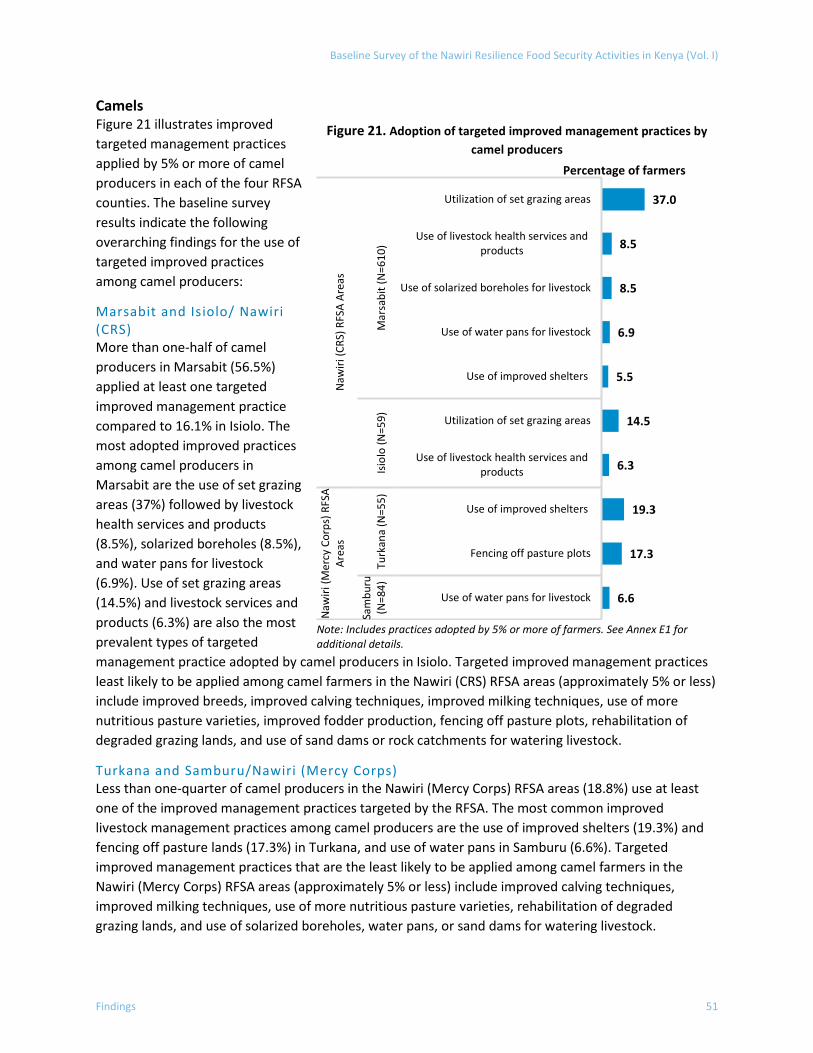
Baseline Survey of the Nawiri Resilience Food Security Activities in Kenya (Vol. I)
Findings 51
Camels Figure 21 illustrates improved targeted management practices applied by 5% or more of camel producers in each of the four RFSA counties. The baseline survey results indicate the following overarching findings for the use of targeted improved practices among camel producers:
Marsabit and Isiolo/ Nawiri (CRS) More than one-half of camel producers in Marsabit (56.5%) applied at least one targeted improved management practice compared to 16.1% in Isiolo. The most adopted improved practices among camel producers in Marsabit are the use of set grazing areas (37%) followed by livestock health services and products (8.5%), solarized boreholes (8.5%), and water pans for livestock (6.9%). Use of set grazing areas (14.5%) and livestock services and products (6.3%) are also the most prevalent types of targeted management practice adopted by camel producers in Isiolo. Targeted improved management practices least likely to be applied among camel farmers in the Nawiri (CRS) RFSA areas (approximately 5% or less) include improved breeds, improved calving techniques, improved milking techniques, use of more nutritious pasture varieties, improved fodder production, fencing off pasture plots, rehabilitation of degraded grazing lands, and use of sand dams or rock catchments for watering livestock.
Turkana and Samburu/Nawiri (Mercy Corps) Less than one-quarter of camel producers in the Nawiri (Mercy Corps) RFSA areas (18.8%) use at least one of the improved management practices targeted by the RFSA. The most common improved livestock management practices among camel producers are the use of improved shelters (19.3%) and fencing off pasture lands (17.3%) in Turkana, and use of water pans in Samburu (6.6%). Targeted improved management practices that are the least likely to be applied among camel farmers in the Nawiri (Mercy Corps) RFSA areas (approximately 5% or less) include improved calving techniques, improved milking techniques, use of more nutritious pasture varieties, rehabilitation of degraded grazing lands, and use of solarized boreholes, water pans, or sand dams for watering livestock.
Figure 21. Adoption of targeted improved management practices by camel producers
Note: Includes practices adopted by 5% or more of farmers. See Annex E1 for additional details.
37.0
8.5
8.5
6.9
5.5
14.5
6.3
19.3
17.3
6.6
Utilization of set grazing areas
Use of livestock health services andproducts
Use of solarized boreholes for livestock
Use of water pans for livestock
Use of improved shelters
Utilization of set grazing areas
Use of livestock health services andproducts
Use of improved shelters
Fencing off pasture plots
Use of water pans for livestock
Mar
sabi
t (N
=610
)Is
iolo
(N=5
9)Tu
rkan
a (N
=55)
Sam
buru
(N=8
4)
Naw
iri (C
RS) R
FSA
Area
sN
awiri
(Mer
cy C
orps
) RFS
AAr
eas
Percentage of farmers
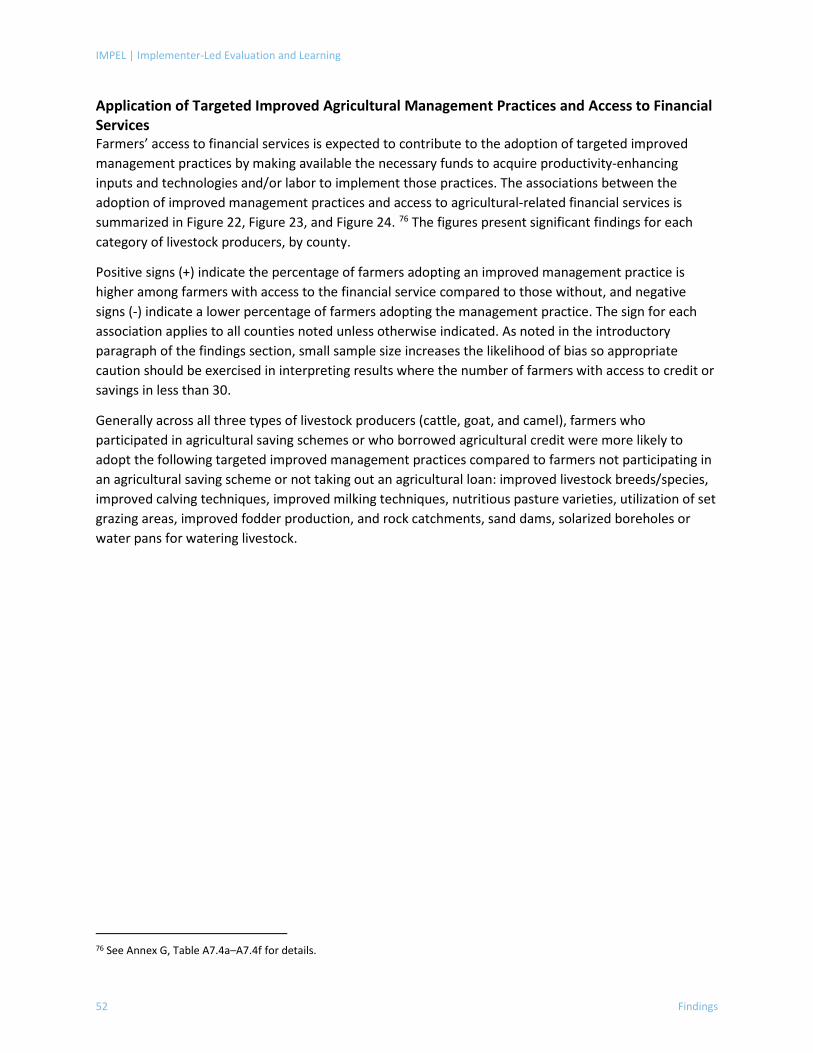
IMPEL | Implementer-Led Evaluation and Learning
52 Findings
Application of Targeted Improved Agricultural Management Practices and Access to Financial Services Farmers’ access to financial services is expected to contribute to the adoption of targeted improved management practices by making available the necessary funds to acquire productivity-enhancing inputs and technologies and/or labor to implement those practices. The associations between the adoption of improved management practices and access to agricultural-related financial services is summarized in Figure 22, Figure 23, and Figure 24. 76 The figures present significant findings for each category of livestock producers, by county.
Positive signs (+) indicate the percentage of farmers adopting an improved management practice is higher among farmers with access to the financial service compared to those without, and negative signs (-) indicate a lower percentage of farmers adopting the management practice. The sign for each association applies to all counties noted unless otherwise indicated. As noted in the introductory paragraph of the findings section, small sample size increases the likelihood of bias so appropriate caution should be exercised in interpreting results where the number of farmers with access to credit or savings in less than 30.
Generally across all three types of livestock producers (cattle, goat, and camel), farmers who participated in agricultural saving schemes or who borrowed agricultural credit were more likely to adopt the following targeted improved management practices compared to farmers not participating in an agricultural saving scheme or not taking out an agricultural loan: improved livestock breeds/species, improved calving techniques, improved milking techniques, nutritious pasture varieties, utilization of set grazing areas, improved fodder production, and rock catchments, sand dams, solarized boreholes or water pans for watering livestock.
76 See Annex G, Table A7.4a–A7.4f for details.
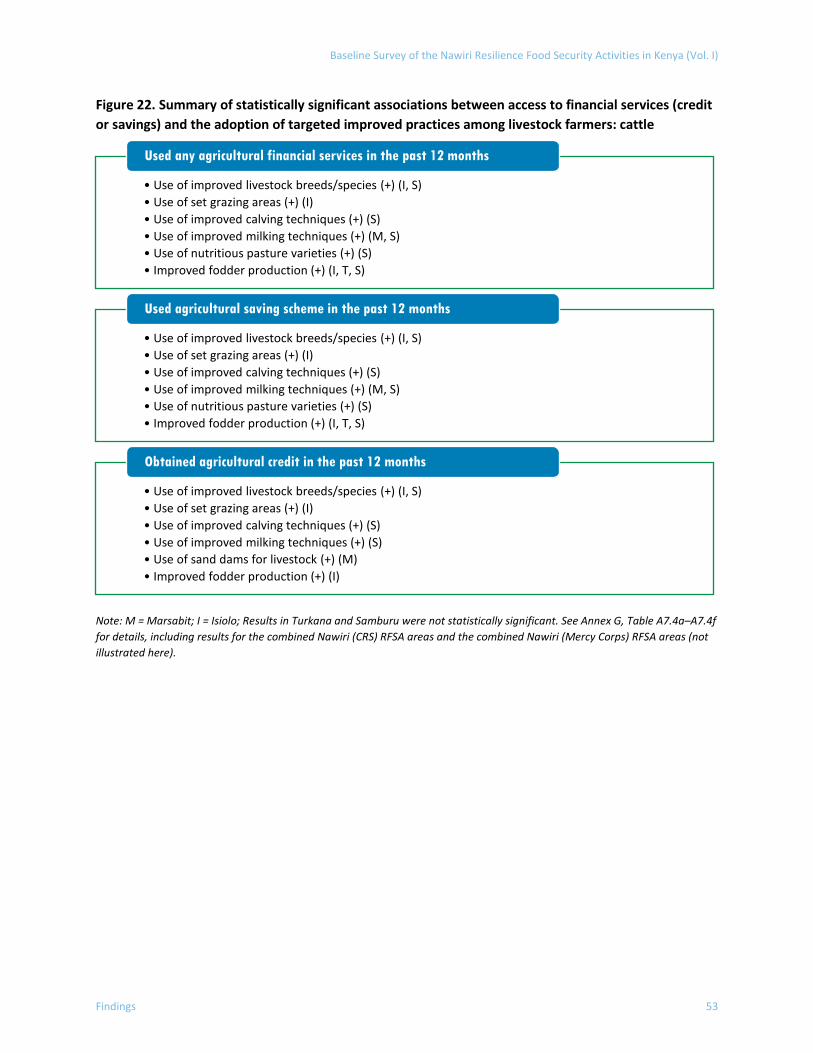
Baseline Survey of the Nawiri Resilience Food Security Activities in Kenya (Vol. I)
Findings 53
Figure 22. Summary of statistically significant associations between access to financial services (credit or savings) and the adoption of targeted improved practices among livestock farmers: cattle
Note: M = Marsabit; I = Isiolo; Results in Turkana and Samburu were not statistically significant. See Annex G, Table A7.4a–A7.4f for details, including results for the combined Nawiri (CRS) RFSA areas and the combined Nawiri (Mercy Corps) RFSA areas (not illustrated here).
• Use of improved livestock breeds/species (+) (I, S)• Use of set grazing areas (+) (I)• Use of improved calving techniques (+) (S)• Use of improved milking techniques (+) (M, S)• Use of nutritious pasture varieties (+) (S)• Improved fodder production (+) (I, T, S)
Used any agricultural financial services in the past 12 months
• Use of improved livestock breeds/species (+) (I, S)• Use of set grazing areas (+) (I)• Use of improved calving techniques (+) (S)• Use of improved milking techniques (+) (M, S)• Use of nutritious pasture varieties (+) (S)• Improved fodder production (+) (I, T, S)
Used agricultural saving scheme in the past 12 months
• Use of improved livestock breeds/species (+) (I, S) • Use of set grazing areas (+) (I)• Use of improved calving techniques (+) (S) • Use of improved milking techniques (+) (S)• Use of sand dams for livestock (+) (M) • Improved fodder production (+) (I)
Obtained agricultural credit in the past 12 months
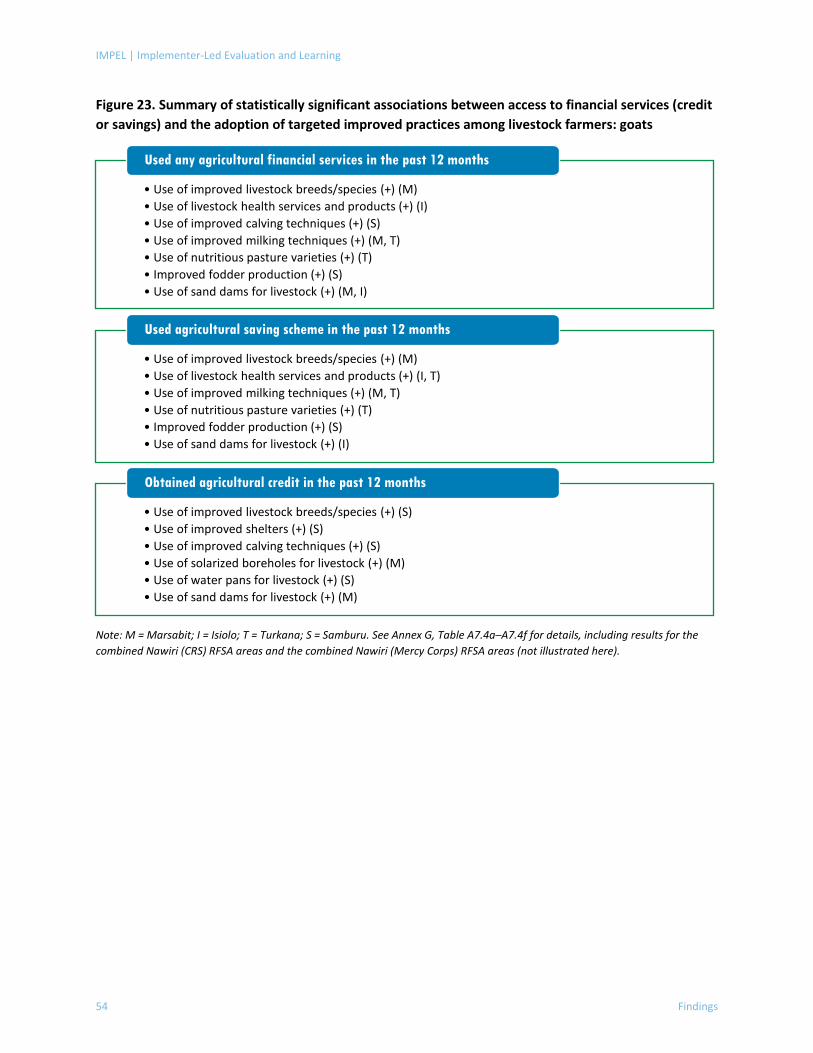
IMPEL | Implementer-Led Evaluation and Learning
54 Findings
Figure 23. Summary of statistically significant associations between access to financial services (credit or savings) and the adoption of targeted improved practices among livestock farmers: goats
Note: M = Marsabit; I = Isiolo; T = Turkana; S = Samburu. See Annex G, Table A7.4a–A7.4f for details, including results for the combined Nawiri (CRS) RFSA areas and the combined Nawiri (Mercy Corps) RFSA areas (not illustrated here).
• Use of improved livestock breeds/species (+) (M)• Use of livestock health services and products (+) (I)• Use of improved calving techniques (+) (S)• Use of improved milking techniques (+) (M, T)• Use of nutritious pasture varieties (+) (T)• Improved fodder production (+) (S)• Use of sand dams for livestock (+) (M, I)
Used any agricultural financial services in the past 12 months
• Use of improved livestock breeds/species (+) (M)• Use of livestock health services and products (+) (I, T)• Use of improved milking techniques (+) (M, T)• Use of nutritious pasture varieties (+) (T)• Improved fodder production (+) (S)• Use of sand dams for livestock (+) (I)
Used agricultural saving scheme in the past 12 months
• Use of improved livestock breeds/species (+) (S)• Use of improved shelters (+) (S) • Use of improved calving techniques (+) (S) • Use of solarized boreholes for livestock (+) (M)• Use of water pans for livestock (+) (S)• Use of sand dams for livestock (+) (M)
Obtained agricultural credit in the past 12 months
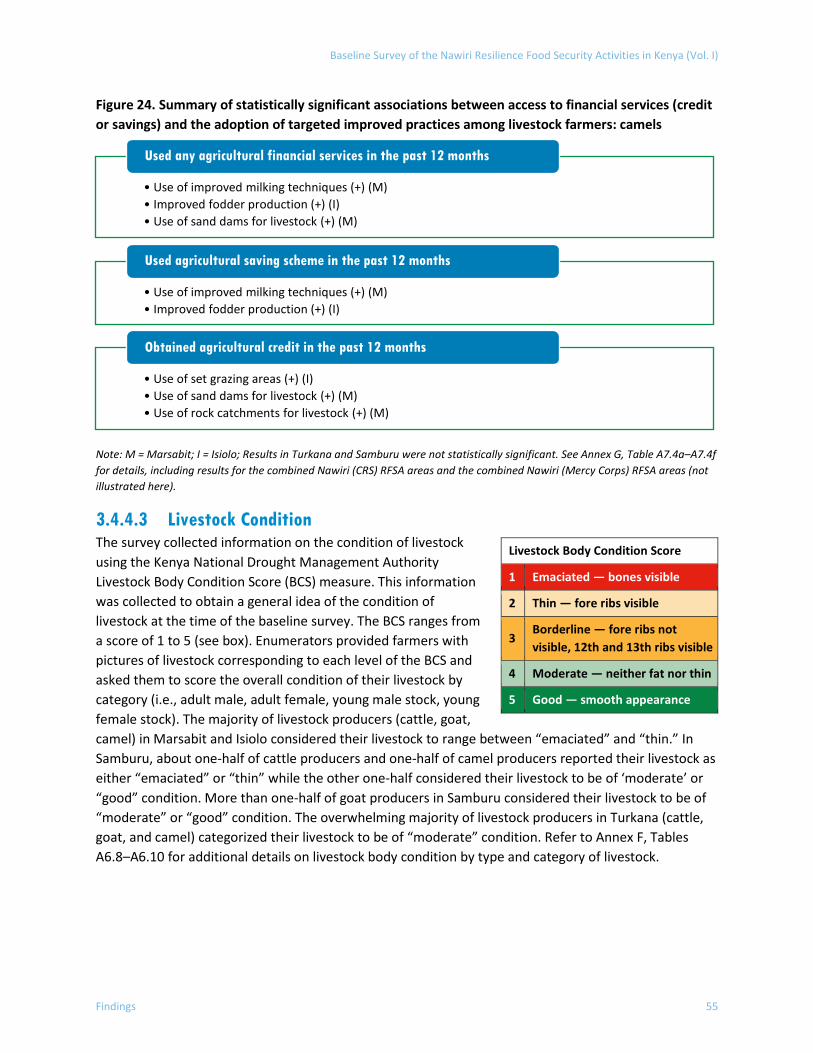
Baseline Survey of the Nawiri Resilience Food Security Activities in Kenya (Vol. I)
Findings 55
Figure 24. Summary of statistically significant associations between access to financial services (credit or savings) and the adoption of targeted improved practices among livestock farmers: camels
Note: M = Marsabit; I = Isiolo; Results in Turkana and Samburu were not statistically significant. See Annex G, Table A7.4a–A7.4f for details, including results for the combined Nawiri (CRS) RFSA areas and the combined Nawiri (Mercy Corps) RFSA areas (not illustrated here).
3.4.4.3 Livestock Condition The survey collected information on the condition of livestock using the Kenya National Drought Management Authority Livestock Body Condition Score (BCS) measure. This information was collected to obtain a general idea of the condition of livestock at the time of the baseline survey. The BCS ranges from a score of 1 to 5 (see box). Enumerators provided farmers with pictures of livestock corresponding to each level of the BCS and asked them to score the overall condition of their livestock by category (i.e., adult male, adult female, young male stock, young female stock). The majority of livestock producers (cattle, goat, camel) in Marsabit and Isiolo considered their livestock to range between “emaciated” and “thin.” In Samburu, about one-half of cattle producers and one-half of camel producers reported their livestock as either “emaciated” or “thin” while the other one-half considered their livestock to be of ‘moderate’ or “good” condition. More than one-half of goat producers in Samburu considered their livestock to be of “moderate” or “good” condition. The overwhelming majority of livestock producers in Turkana (cattle, goat, and camel) categorized their livestock to be of “moderate” condition. Refer to Annex F, Tables A6.8–A6.10 for additional details on livestock body condition by type and category of livestock.
• Use of improved milking techniques (+) (M)• Improved fodder production (+) (I)• Use of sand dams for livestock (+) (M)
Used any agricultural financial services in the past 12 months
• Use of improved milking techniques (+) (M)• Improved fodder production (+) (I)
Used agricultural saving scheme in the past 12 months
• Use of set grazing areas (+) (I)• Use of sand dams for livestock (+) (M) • Use of rock catchments for livestock (+) (M)
Obtained agricultural credit in the past 12 months
Livestock Body Condition Score
1 Emaciated — bones visible
2 Thin — fore ribs visible
3 Borderline — fore ribs not visible, 12th and 13th ribs visible
4 Moderate — neither fat nor thin
5 Good — smooth appearance
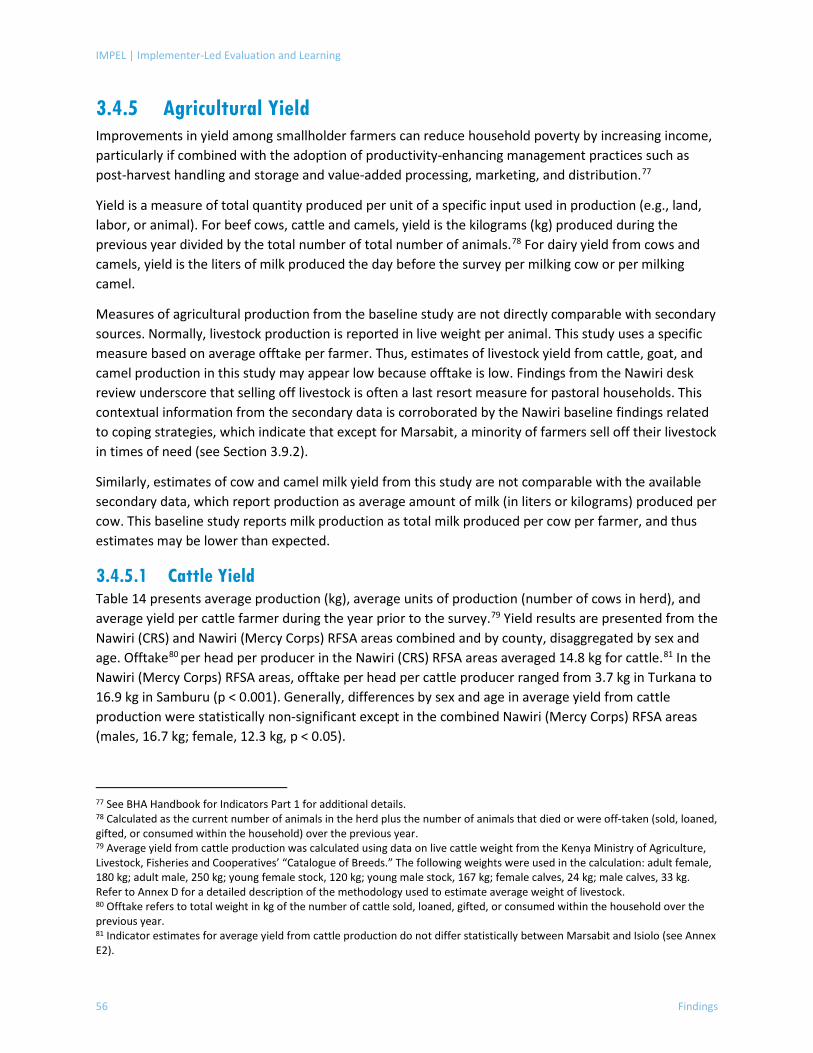
IMPEL | Implementer-Led Evaluation and Learning
56 Findings
3.4.5 Agricultural Yield Improvements in yield among smallholder farmers can reduce household poverty by increasing income, particularly if combined with the adoption of productivity-enhancing management practices such as post-harvest handling and storage and value-added processing, marketing, and distribution.77
Yield is a measure of total quantity produced per unit of a specific input used in production (e.g., land, labor, or animal). For beef cows, cattle and camels, yield is the kilograms (kg) produced during the previous year divided by the total number of total number of animals.78 For dairy yield from cows and camels, yield is the liters of milk produced the day before the survey per milking cow or per milking camel.
Measures of agricultural production from the baseline study are not directly comparable with secondary sources. Normally, livestock production is reported in live weight per animal. This study uses a specific measure based on average offtake per farmer. Thus, estimates of livestock yield from cattle, goat, and camel production in this study may appear low because offtake is low. Findings from the Nawiri desk review underscore that selling off livestock is often a last resort measure for pastoral households. This contextual information from the secondary data is corroborated by the Nawiri baseline findings related to coping strategies, which indicate that except for Marsabit, a minority of farmers sell off their livestock in times of need (see Section 3.9.2).
Similarly, estimates of cow and camel milk yield from this study are not comparable with the available secondary data, which report production as average amount of milk (in liters or kilograms) produced per cow. This baseline study reports milk production as total milk produced per cow per farmer, and thus estimates may be lower than expected.
3.4.5.1 Cattle Yield Table 14 presents average production (kg), average units of production (number of cows in herd), and average yield per cattle farmer during the year prior to the survey.79 Yield results are presented from the Nawiri (CRS) and Nawiri (Mercy Corps) RFSA areas combined and by county, disaggregated by sex and age. Offtake80 per head per producer in the Nawiri (CRS) RFSA areas averaged 14.8 kg for cattle.81 In the Nawiri (Mercy Corps) RFSA areas, offtake per head per cattle producer ranged from 3.7 kg in Turkana to 16.9 kg in Samburu (p < 0.001). Generally, differences by sex and age in average yield from cattle production were statistically non-significant except in the combined Nawiri (Mercy Corps) RFSA areas (males, 16.7 kg; female, 12.3 kg, p < 0.05).
77 See BHA Handbook for Indicators Part 1 for additional details. 78 Calculated as the current number of animals in the herd plus the number of animals that died or were off-taken (sold, loaned, gifted, or consumed within the household) over the previous year. 79 Average yield from cattle production was calculated using data on live cattle weight from the Kenya Ministry of Agriculture, Livestock, Fisheries and Cooperatives’ “Catalogue of Breeds.” The following weights were used in the calculation: adult female, 180 kg; adult male, 250 kg; young female stock, 120 kg; young male stock, 167 kg; female calves, 24 kg; male calves, 33 kg. Refer to Annex D for a detailed description of the methodology used to estimate average weight of livestock. 80 Offtake refers to total weight in kg of the number of cattle sold, loaned, gifted, or consumed within the household over the previous year. 81 Indicator estimates for average yield from cattle production do not differ statistically between Marsabit and Isiolo (see Annex E2).
Baseline Survey of the Nawiri Resilience Food Security Activities in Kenya (Vol. I)
Findings 57
Table 14. Yield from cattle production during the year preceding the survey, total and by farmers’ sex and age Nawiri (CRS) RFSA Areas
Nawiri (CRS)—Total Marsabit Isiolo
Total production a
Units of productionb Yieldc Sig.d N
Total production a
Units of productionb Yieldc Sig.d N
Total production a
Units of productionb Yieldc Sig.d N
Total 280.3 12.7 14.8 564 288.2 12.1 15.3 351 265.1 13.7 13.9 213
Sex
Male 294.7 13.1 15.8 ns 367 304.1 12.0 16.8 ns 215 280.5 14.7 14.1 ns 152
Female 254.9 12.0 13.2 197 265.8 12.3 13.2 136 221.4 11.0 13.2 61
Age 15–29 232.8 11.2 14.6 ns 80 247.4 11.4 14.9 ns 60 169.0 10.3 13.2 ns 20
30+ 288.2 12.9 14.9 484 297.0 12.3 15.4 291 273.2 14.0 14.0 193
Nawiri (Mercy Corps) RFSA Areas Nawiri (Mercy Corps)–Total Turkana Samburu
Total production a
Units of productionb Yieldc Sig.d N
Total production a
Units of productionb Yieldc Sig.d N
Total production a
Units of productionb Yieldc Sig.d N
Total 235.9 10.6 14.5 420 108.8 8.1 3.7 37 265.4 11.2 16.9 383
Sex
Male 301.3 12.2 16.7 * 207 208.2 10.6 4.9 ns 19 321.9 12.5 19.3 ns 188
Female 174.1 9.1 12.3 213 22.3 5.9 2.7 ns 18 211.1 9.9 14.6 195
Age
15–29 214.5 8.7 15.0 ns 94 37.5 4.0 9.4 ns 5 232.2 9.2 15.6 ns 89
30+ 241.7 11.1 14.3 326 116.9 8.6 3.1 ns 32 275.9 11.8 17.3 294 NOTES: a Total production refers to total weight in kg of the number of cattle sold, loaned, gifted, or consumed within the household over the previous year. b Units of production include the total number of animals in herd, calculated as the current number of animals in the herd plus the number of animals that died or were off-taken (sold, loaned, gifted, or consumed within the household) over the previous year. c Yield is measured in kg per head off-take per farmer. d Significance tests were performed to determine whether an association exists between the outcome indicator (average yield per farmer) and the disaggregate variable (sex and age). Associations found to be statistically significant are indicated by level: * p < 0.05, ** p < 0.01, *** p < 0.001; ns = not significant. Results are not statistically reliable where n < 30; they are provided for illustrative purposes
IMPEL | Implementer-Led Evaluation and Learning
58 Findings
3.4.5.2 Goat Yield Table 15 presents average production (kg), average units of production (number of goats in herd), and average yield per goat farmer during the year prior to the survey.82 Yield results are presented for the Nawiri (CRS) and Nawiri (Mercy Corps) RFSA areas in the aggregate and by county, disaggregated by sex and age.
Offtake83 per head per goat producer in the Nawiri (CRS) RFSA areas averaged 7.7 kg.84 In the Nawiri (Mercy Corps) RFSA areas, offtake per head per goat producer ranged from 2.9 in Turkana to 9.5 kg in Samburu (p < 0.001). Generally, differences by sex and age in average yield from goat production were statistically non-significant with a few exceptions. In Isiolo, average yield from goat production was higher among farmers 30+ years (8.7 kg) compared to farmers 15–29 years (6.1 kg) (p < 0.05). In Turkana, male farmers achieved on average higher yields from goat production (3.3 kg) compared to female farmers (2.4 kg) (p < 0.001).
3.4.5.3 Camel Yield Table 16 presents average production (kg), average units of production (number of camels in herd), and average yield per camel farmer during the year prior to the survey.85 Yield results are presented for the Nawiri (CRS) and Nawiri (Mercy Corps) RFSA areas in the aggregate and by county, disaggregated by sex and age.
Average yield from camel production in the Nawiri (CRS) RFSA areas varied between 4.2 kg per head per producer in Isiolo and 15.3 kg in Marsabit (p < 0.001). In the Nawiri (Mercy Corps) RFSA areas, offtake per head per camel producer ranged from 0.9 kg in Samburu to 15.4 kg in Turkana (p < 0.01). Generally, differences by sex and age in average yield from camel production were statistically non-significant except in Turkana: farmers aged 30 years and older achieve higher yields from camel produced compared to farmers who are 15–29 years, however the estimates for younger farmers are based on a small sample (n = 3) and are unreliable.
82 Average yield from goat production was calculated using data on live goat weight from the Kenya Ministry of Agriculture, Livestock, Fisheries and Cooperatives’ “Catalogue of Breeds.” The following weights were used in the calculation: adult female, 42 kg; adult male, 56 kg; young female stock, 21 kg; young male stock, 28 kg. Refer to Annex D for a detailed description of the methodology used to estimate average weight of livestock. 83 Offtake refers to total weight in kg of the number of cattle sold, loaned, gifted, or consumed within the household over the previous year. 84 Indicator estimates for average yield from goat production do not differ statistically between Marsabit and Isiolo (see Annex E2). 85 Average yield from camel production was calculated using data on live camel weight from the Kenya Ministry of Agriculture, Livestock, Fisheries and Cooperatives’ “Catalogue of Breeds.” The following weights were used in the calculation: adult camels, 413 kg; young stock, 206 kg. Weight by sex of animal was not available. Refer to Annex D for a detailed description of the methodology used to estimate average weight of livestock.
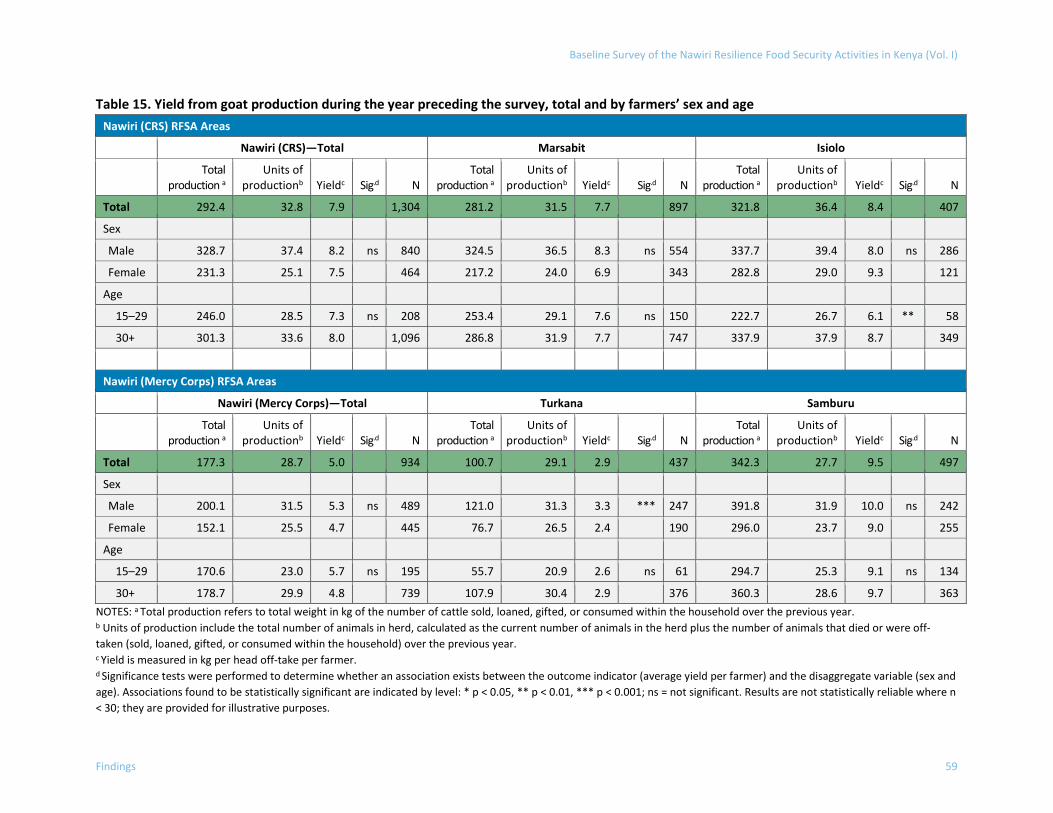
Baseline Survey of the Nawiri Resilience Food Security Activities in Kenya (Vol. I)
Findings 59
Table 15. Yield from goat production during the year preceding the survey, total and by farmers’ sex and age Nawiri (CRS) RFSA Areas
Nawiri (CRS)—Total Marsabit Isiolo
Total production a
Units of productionb Yieldc Sig.d N
Total production a
Units of productionb Yieldc Sig.d N
Total production a
Units of productionb Yieldc Sig.d N
Total 292.4 32.8 7.9 1,304 281.2 31.5 7.7 897 321.8 36.4 8.4 407
Sex
Male 328.7 37.4 8.2 ns 840 324.5 36.5 8.3 ns 554 337.7 39.4 8.0 ns 286
Female 231.3 25.1 7.5 464 217.2 24.0 6.9 343 282.8 29.0 9.3 121
Age
15–29 246.0 28.5 7.3 ns 208 253.4 29.1 7.6 ns 150 222.7 26.7 6.1 ** 58
30+ 301.3 33.6 8.0 1,096 286.8 31.9 7.7 747 337.9 37.9 8.7 349
Nawiri (Mercy Corps) RFSA Areas
Nawiri (Mercy Corps)—Total Turkana Samburu
Total production a
Units of productionb Yieldc Sig.d N
Total production a
Units of productionb Yieldc Sig.d N
Total production a
Units of productionb Yieldc Sig.d N
Total 177.3 28.7 5.0 934 100.7 29.1 2.9 437 342.3 27.7 9.5 497
Sex
Male 200.1 31.5 5.3 ns 489 121.0 31.3 3.3 *** 247 391.8 31.9 10.0 ns 242
Female 152.1 25.5 4.7 445 76.7 26.5 2.4 190 296.0 23.7 9.0 255
Age
15–29 170.6 23.0 5.7 ns 195 55.7 20.9 2.6 ns 61 294.7 25.3 9.1 ns 134
30+ 178.7 29.9 4.8 739 107.9 30.4 2.9 376 360.3 28.6 9.7 363 NOTES: a Total production refers to total weight in kg of the number of cattle sold, loaned, gifted, or consumed within the household over the previous year. b Units of production include the total number of animals in herd, calculated as the current number of animals in the herd plus the number of animals that died or were off-taken (sold, loaned, gifted, or consumed within the household) over the previous year. c Yield is measured in kg per head off-take per farmer. d Significance tests were performed to determine whether an association exists between the outcome indicator (average yield per farmer) and the disaggregate variable (sex and age). Associations found to be statistically significant are indicated by level: * p < 0.05, ** p < 0.01, *** p < 0.001; ns = not significant. Results are not statistically reliable where n < 30; they are provided for illustrative purposes.
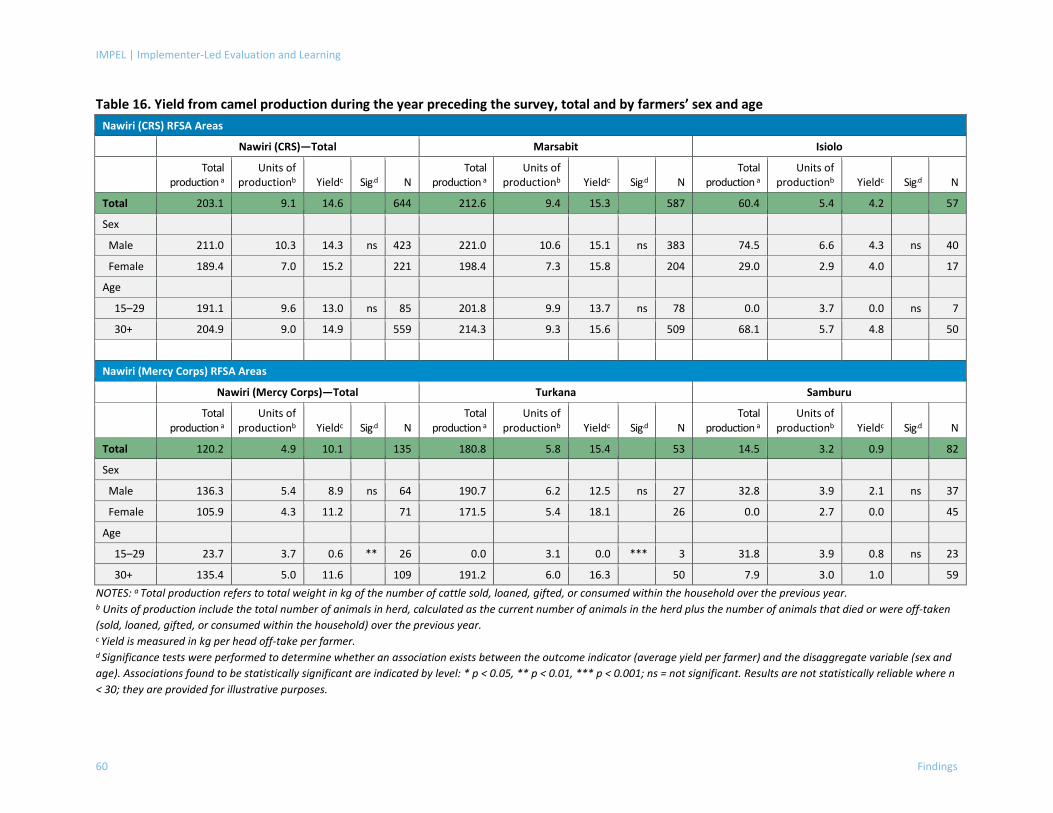
IMPEL | Implementer-Led Evaluation and Learning
60 Findings
Table 16. Yield from camel production during the year preceding the survey, total and by farmers’ sex and age Nawiri (CRS) RFSA Areas
Nawiri (CRS)—Total Marsabit Isiolo
Total production a
Units of productionb Yieldc Sig.d N
Total production a
Units of productionb Yieldc Sig.d N
Total production a
Units of productionb Yieldc Sig.d N
Total 203.1 9.1 14.6 644 212.6 9.4 15.3 587 60.4 5.4 4.2 57
Sex
Male 211.0 10.3 14.3 ns 423 221.0 10.6 15.1 ns 383 74.5 6.6 4.3 ns 40
Female 189.4 7.0 15.2 221 198.4 7.3 15.8 204 29.0 2.9 4.0 17
Age
15–29 191.1 9.6 13.0 ns 85 201.8 9.9 13.7 ns 78 0.0 3.7 0.0 ns 7
30+ 204.9 9.0 14.9 559 214.3 9.3 15.6 509 68.1 5.7 4.8 50
Nawiri (Mercy Corps) RFSA Areas
Nawiri (Mercy Corps)—Total Turkana Samburu
Total production a
Units of productionb Yieldc Sig.d N
Total production a
Units of productionb Yieldc Sig.d N
Total production a
Units of productionb Yieldc Sig.d N
Total 120.2 4.9 10.1 135 180.8 5.8 15.4 53 14.5 3.2 0.9 82
Sex
Male 136.3 5.4 8.9 ns 64 190.7 6.2 12.5 ns 27 32.8 3.9 2.1 ns 37
Female 105.9 4.3 11.2 71 171.5 5.4 18.1 26 0.0 2.7 0.0 45
Age
15–29 23.7 3.7 0.6 ** 26 0.0 3.1 0.0 *** 3 31.8 3.9 0.8 ns 23
30+ 135.4 5.0 11.6 109 191.2 6.0 16.3 50 7.9 3.0 1.0 59 NOTES: a Total production refers to total weight in kg of the number of cattle sold, loaned, gifted, or consumed within the household over the previous year. b Units of production include the total number of animals in herd, calculated as the current number of animals in the herd plus the number of animals that died or were off-taken (sold, loaned, gifted, or consumed within the household) over the previous year. c Yield is measured in kg per head off-take per farmer. d Significance tests were performed to determine whether an association exists between the outcome indicator (average yield per farmer) and the disaggregate variable (sex and age). Associations found to be statistically significant are indicated by level: * p < 0.05, ** p < 0.01, *** p < 0.001; ns = not significant. Results are not statistically reliable where n < 30; they are provided for illustrative purposes.
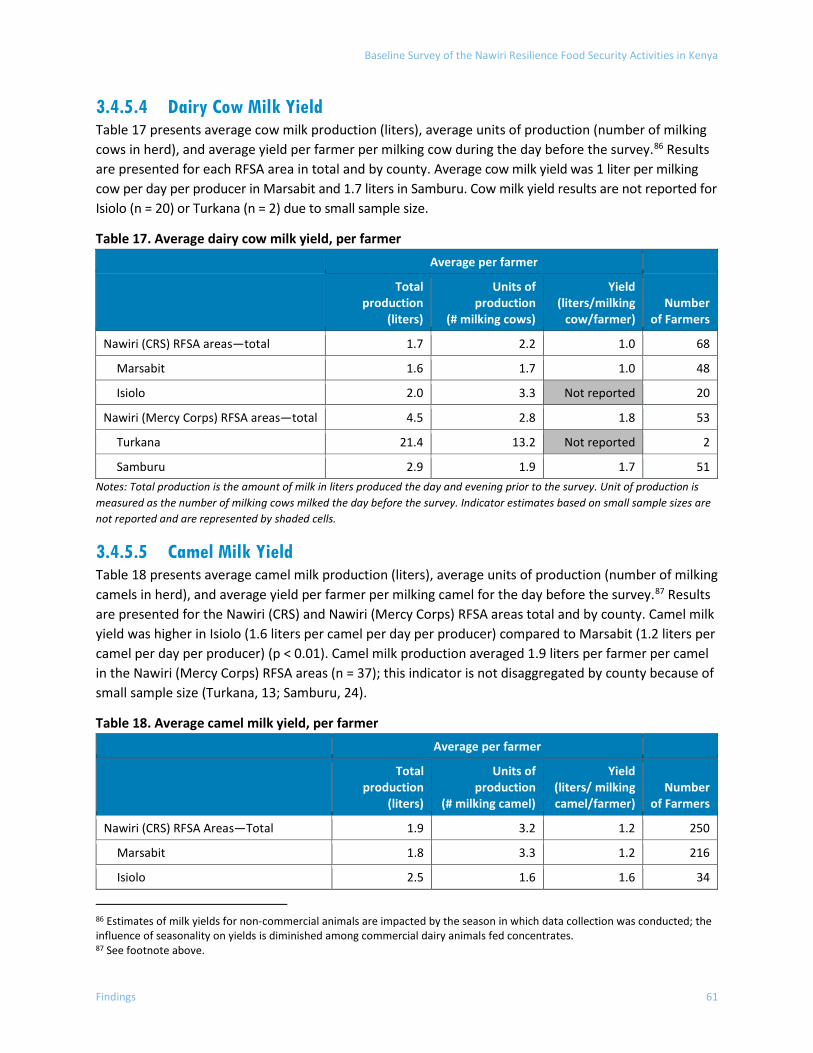
Baseline Survey of the Nawiri Resilience Food Security Activities in Kenya
Findings 61
3.4.5.4 Dairy Cow Milk Yield Table 17 presents average cow milk production (liters), average units of production (number of milking cows in herd), and average yield per farmer per milking cow during the day before the survey.86 Results are presented for each RFSA area in total and by county. Average cow milk yield was 1 liter per milking cow per day per producer in Marsabit and 1.7 liters in Samburu. Cow milk yield results are not reported for Isiolo (n = 20) or Turkana (n = 2) due to small sample size.
Table 17. Average dairy cow milk yield, per farmer Average per farmer
Total production
(liters)
Units of production
(# milking cows)
Yield (liters/milking
cow/farmer) Number
of Farmers
Nawiri (CRS) RFSA areas—total 1.7 2.2 1.0 68
Marsabit 1.6 1.7 1.0 48
Isiolo 2.0 3.3 Not reported 20
Nawiri (Mercy Corps) RFSA areas—total 4.5 2.8 1.8 53
Turkana 21.4 13.2 Not reported 2
Samburu 2.9 1.9 1.7 51 Notes: Total production is the amount of milk in liters produced the day and evening prior to the survey. Unit of production is measured as the number of milking cows milked the day before the survey. Indicator estimates based on small sample sizes are not reported and are represented by shaded cells.
3.4.5.5 Camel Milk Yield Table 18 presents average camel milk production (liters), average units of production (number of milking camels in herd), and average yield per farmer per milking camel for the day before the survey.87 Results are presented for the Nawiri (CRS) and Nawiri (Mercy Corps) RFSA areas total and by county. Camel milk yield was higher in Isiolo (1.6 liters per camel per day per producer) compared to Marsabit (1.2 liters per camel per day per producer) (p < 0.01). Camel milk production averaged 1.9 liters per farmer per camel in the Nawiri (Mercy Corps) RFSA areas (n = 37); this indicator is not disaggregated by county because of small sample size (Turkana, 13; Samburu, 24).
Table 18. Average camel milk yield, per farmer Average per farmer
Total production
(liters)
Units of production
(# milking camel)
Yield (liters/ milking camel/farmer)
Number of Farmers
Nawiri (CRS) RFSA Areas—Total 1.9 3.2 1.2 250
Marsabit 1.8 3.3 1.2 216
Isiolo 2.5 1.6 1.6 34
86 Estimates of milk yields for non-commercial animals are impacted by the season in which data collection was conducted; the influence of seasonality on yields is diminished among commercial dairy animals fed concentrates. 87 See footnote above.
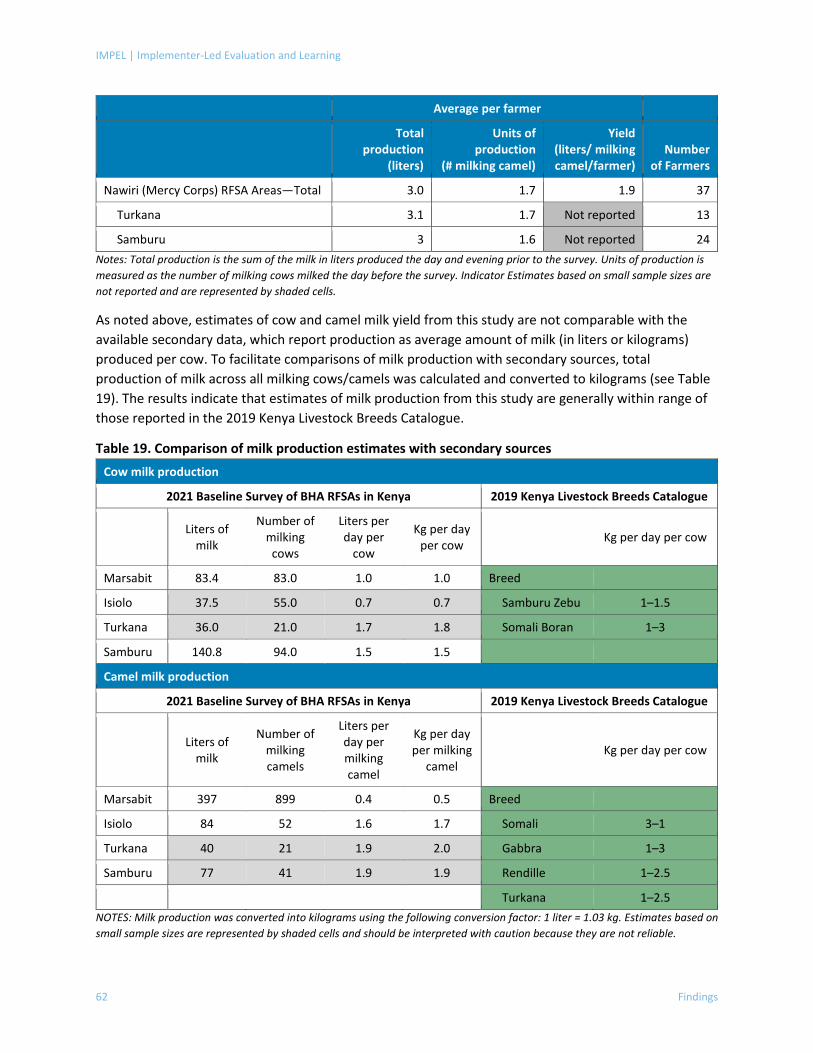
IMPEL | Implementer-Led Evaluation and Learning
62 Findings
Average per farmer
Total production
(liters)
Units of production
(# milking camel)
Yield (liters/ milking camel/farmer)
Number of Farmers
Nawiri (Mercy Corps) RFSA Areas—Total 3.0 1.7 1.9 37
Turkana 3.1 1.7 Not reported 13
Samburu 3 1.6 Not reported 24 Notes: Total production is the sum of the milk in liters produced the day and evening prior to the survey. Units of production is measured as the number of milking cows milked the day before the survey. Indicator Estimates based on small sample sizes are not reported and are represented by shaded cells.
As noted above, estimates of cow and camel milk yield from this study are not comparable with the available secondary data, which report production as average amount of milk (in liters or kilograms) produced per cow. To facilitate comparisons of milk production with secondary sources, total production of milk across all milking cows/camels was calculated and converted to kilograms (see Table 19). The results indicate that estimates of milk production from this study are generally within range of those reported in the 2019 Kenya Livestock Breeds Catalogue.
Table 19. Comparison of milk production estimates with secondary sources Cow milk production
2021 Baseline Survey of BHA RFSAs in Kenya 2019 Kenya Livestock Breeds Catalogue
Liters of milk
Number of milking cows
Liters per day per
cow
Kg per day per cow
Kg per day per cow
Marsabit 83.4 83.0 1.0 1.0 Breed
Isiolo 37.5 55.0 0.7 0.7 Samburu Zebu 1–1.5
Turkana 36.0 21.0 1.7 1.8 Somali Boran 1–3
Samburu 140.8 94.0 1.5 1.5
Camel milk production
2021 Baseline Survey of BHA RFSAs in Kenya 2019 Kenya Livestock Breeds Catalogue
Liters of milk
Number of milking camels
Liters per day per milking camel
Kg per day per milking
camel Kg per day per cow
Marsabit 397 899 0.4 0.5 Breed
Isiolo 84 52 1.6 1.7 Somali 3–1
Turkana 40 21 1.9 2.0 Gabbra 1–3
Samburu 77 41 1.9 1.9 Rendille 1–2.5
Turkana 1–2.5 NOTES: Milk production was converted into kilograms using the following conversion factor: 1 liter = 1.03 kg. Estimates based on small sample sizes are represented by shaded cells and should be interpreted with caution because they are not reliable.
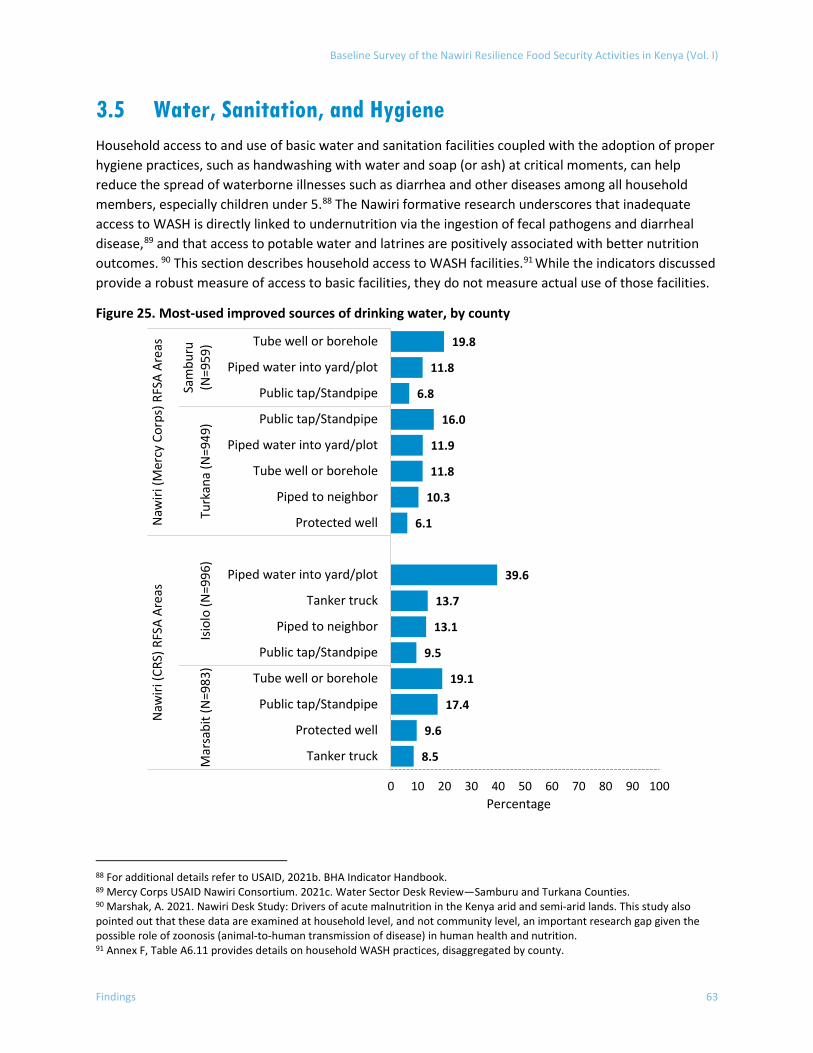
Baseline Survey of the Nawiri Resilience Food Security Activities in Kenya (Vol. I)
Findings 63
3.5 Water, Sanitation, and Hygiene Household access to and use of basic water and sanitation facilities coupled with the adoption of proper hygiene practices, such as handwashing with water and soap (or ash) at critical moments, can help reduce the spread of waterborne illnesses such as diarrhea and other diseases among all household members, especially children under 5.88 The Nawiri formative research underscores that inadequate access to WASH is directly linked to undernutrition via the ingestion of fecal pathogens and diarrheal disease,89 and that access to potable water and latrines are positively associated with better nutrition outcomes. 90 This section describes household access to WASH facilities.91 While the indicators discussed provide a robust measure of access to basic facilities, they do not measure actual use of those facilities.
Figure 25. Most-used improved sources of drinking water, by county
88 For additional details refer to USAID, 2021b. BHA Indicator Handbook. 89 Mercy Corps USAID Nawiri Consortium. 2021c. Water Sector Desk Review—Samburu and Turkana Counties. 90 Marshak, A. 2021. Nawiri Desk Study: Drivers of acute malnutrition in the Kenya arid and semi-arid lands. This study also pointed out that these data are examined at household level, and not community level, an important research gap given the possible role of zoonosis (animal-to-human transmission of disease) in human health and nutrition. 91 Annex F, Table A6.11 provides details on household WASH practices, disaggregated by county.
8.5
9.6
17.4
19.1
9.5
13.1
13.7
39.6
6.1
10.3
11.8
11.9
16.0
6.8
11.8
19.8
0 10 20 30 40 50 60 70 80 90 100
Tanker truck
Protected well
Public tap/Standpipe
Tube well or borehole
Public tap/Standpipe
Piped to neighbor
Tanker truck
Piped water into yard/plot
Protected well
Piped to neighbor
Tube well or borehole
Piped water into yard/plot
Public tap/Standpipe
Public tap/Standpipe
Piped water into yard/plot
Tube well or borehole
Mar
sabi
t (N
=983
)Is
iolo
(N=9
96)
Turk
ana
(N=9
49)
Sam
buru
(N=9
59)
Naw
iri (C
RS) R
FSA
Area
sN
awiri
(Mer
cy C
orps
) RFS
A Ar
eas
Percentage
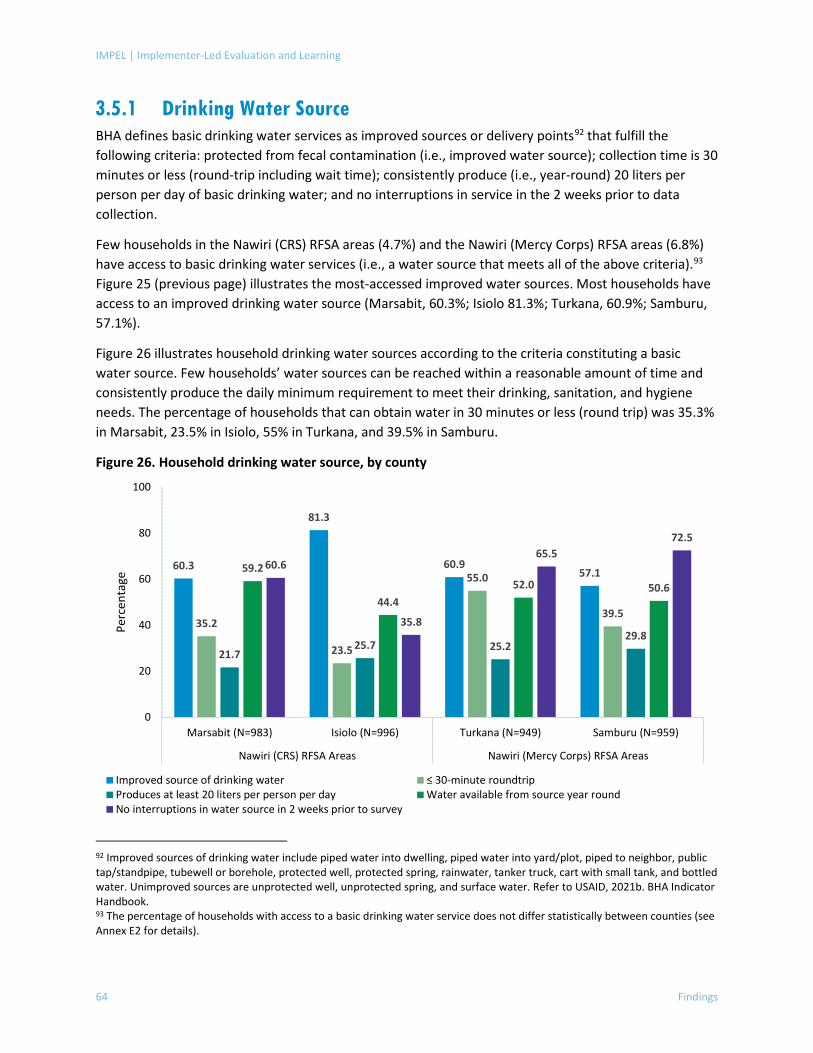
IMPEL | Implementer-Led Evaluation and Learning
64 Findings
3.5.1 Drinking Water Source BHA defines basic drinking water services as improved sources or delivery points92 that fulfill the following criteria: protected from fecal contamination (i.e., improved water source); collection time is 30 minutes or less (round-trip including wait time); consistently produce (i.e., year-round) 20 liters per person per day of basic drinking water; and no interruptions in service in the 2 weeks prior to data collection.
Few households in the Nawiri (CRS) RFSA areas (4.7%) and the Nawiri (Mercy Corps) RFSA areas (6.8%) have access to basic drinking water services (i.e., a water source that meets all of the above criteria).93 Figure 25 (previous page) illustrates the most-accessed improved water sources. Most households have access to an improved drinking water source (Marsabit, 60.3%; Isiolo 81.3%; Turkana, 60.9%; Samburu, 57.1%).
Figure 26 illustrates household drinking water sources according to the criteria constituting a basic water source. Few households’ water sources can be reached within a reasonable amount of time and consistently produce the daily minimum requirement to meet their drinking, sanitation, and hygiene needs. The percentage of households that can obtain water in 30 minutes or less (round trip) was 35.3% in Marsabit, 23.5% in Isiolo, 55% in Turkana, and 39.5% in Samburu.
Figure 26. Household drinking water source, by county
92 Improved sources of drinking water include piped water into dwelling, piped water into yard/plot, piped to neighbor, public tap/standpipe, tubewell or borehole, protected well, protected spring, rainwater, tanker truck, cart with small tank, and bottled water. Unimproved sources are unprotected well, unprotected spring, and surface water. Refer to USAID, 2021b. BHA Indicator Handbook. 93 The percentage of households with access to a basic drinking water service does not differ statistically between counties (see Annex E2 for details).
60.3
81.3
60.957.1
35.2
23.5
55.0
39.5
21.725.7 25.2
29.8
59.2
44.452.0 50.6
60.6
35.8
65.572.5
0
20
40
60
80
100
Marsabit (N=983) Isiolo (N=996) Turkana (N=949) Samburu (N=959)
Nawiri (CRS) RFSA Areas Nawiri (Mercy Corps) RFSA Areas
Perc
enta
ge
Improved source of drinking water ≤ 30-minute roundtrip Produces at least 20 liters per person per day Water available from source year roundNo interruptions in water source in 2 weeks prior to survey
Baseline Survey of the Nawiri Resilience Food Security Activities in Kenya (Vol. I)
Findings 65
Aside from protection of shared water sources, the project may also want to explore how to promote health in shared human-animal spaces, such as management of animal feces at the home, and improved animal shelters. Related to this point, another desk review noted mothers cited a hygienic home environment as contributing to child health; there was awareness in Gabbra communities (in Marsabit) that a child coming into contact with dirt during play, or “eating mud,” is bad for child health.94
The Nawiri formative research indicates that fetching water is the women’s domain, and that the time burden is especially acute during drought, when women must travel longer distances to find water. Children are also responsible for collecting water, which takes time away from school.95, 96 One study underlined that finding ways to lessen this burden is important to improving WASH and nutrition outcomes, and that this is challenging in the context of women’s limited power to monitor and regulate water systems and services. 97 Gender norms dictate that women’s engagement in decisions around water is restricted to the household level. Moreover, the water women collect may be used for livestock rather than for domestic purposes. The same study points out the importance of understanding the interrelationship of water governance and management and household behavior: most households in Turkana and Samburu do not have sustained water system access either because of reluctance or inability to pay for water, opting instead to use traditional surface water sources or hand-dug wells.
The results of the baseline study illustrate that less than one-third of households in the RFSA areas access a water source that produces at least 20 liters per person per day (Marsabit, 21.7%; Isiolo, 25.7%, Turkana, 25.2%; Samburu, 29.8%). Less than two-thirds of households access a water source that produces water year-round (Marsabit, 59.2%; Isiolo, 44.4%; Turkana, 52%; Samburu, 50.6%). National studies suggest that 20–30% of improved water sources are not functional at any given time. A 2019 study in Samburu found that 69% of its water sources were functional at the time of production. Another recent report indicates that the sustainability of water and sanitation investments is 44% in Turkana and 56% in Samburu.98
3.5.2 Water Treatment Household water treatment can improve the quality of drinking water to meet WHO standards for the removal of pathogens. These methods include chlorination (chemical disinfection); flocculant/ disinfectant (physio-chemical disinfection); filtration (physical removal); solar disinfection (UV/heat disinfection); and boiling (disinfection via heat). A household is considered to practice correct use of water treatment technologies if they use at least one of the above-mentioned technologies. Household water treatment is not effective against all types of waterborne pathogens. Substantial education and behavior change are needed to support correct and consistent use of household water treatment.99
94 CRS. 2021. USAID Nawiri Gender Youth and Social Dynamics Analysis to Explore Gender, Social and Cultural Norms Associated with Acute Malnutrition in Isiolo and Marsabit Counties of Kenya. Final Report. CRS, Nairobi, Kenya. 95 CRS. 2021. USAID Nawiri Gender Youth and Social Dynamics Analysis. 96 Mercy Corps USAID Nawiri Consortium. 2021c. Water Sector Desk Review—Samburu and Turkana Counties. 97 Mercy Corps USAID Nawiri Consortium. 2021c. Water Sector Desk Review—Samburu and Turkana Counties. 98 Mercy Corps USAID Nawiri Consortium. 2021c. Water Sector Desk Review—Samburu and Turkana Counties. 99 For additional details refer to USAID. 2021b. BHA Indicator Handbook.
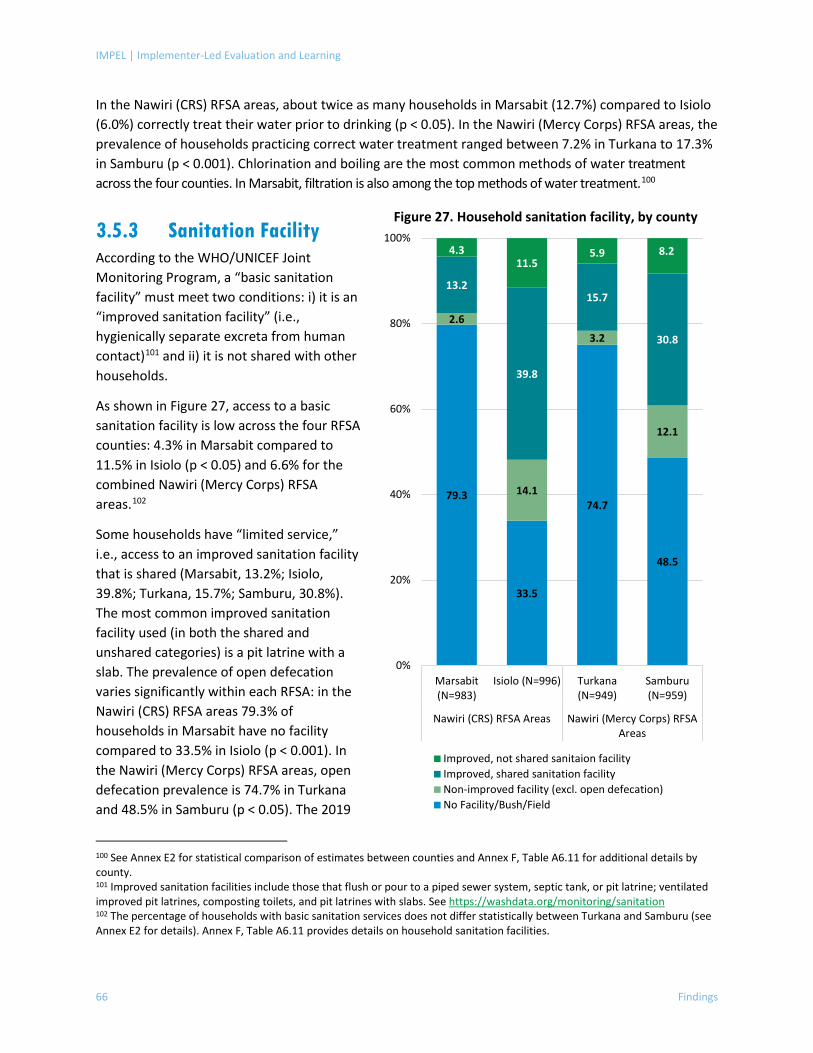
IMPEL | Implementer-Led Evaluation and Learning
66 Findings
In the Nawiri (CRS) RFSA areas, about twice as many households in Marsabit (12.7%) compared to Isiolo (6.0%) correctly treat their water prior to drinking (p < 0.05). In the Nawiri (Mercy Corps) RFSA areas, the prevalence of households practicing correct water treatment ranged between 7.2% in Turkana to 17.3% in Samburu (p < 0.001). Chlorination and boiling are the most common methods of water treatment across the four counties. In Marsabit, filtration is also among the top methods of water treatment.100
3.5.3 Sanitation Facility According to the WHO/UNICEF Joint Monitoring Program, a “basic sanitation facility” must meet two conditions: i) it is an “improved sanitation facility” (i.e., hygienically separate excreta from human contact)101 and ii) it is not shared with other households.
As shown in Figure 27, access to a basic sanitation facility is low across the four RFSA counties: 4.3% in Marsabit compared to 11.5% in Isiolo (p < 0.05) and 6.6% for the combined Nawiri (Mercy Corps) RFSA areas.102
Some households have “limited service,” i.e., access to an improved sanitation facility that is shared (Marsabit, 13.2%; Isiolo, 39.8%; Turkana, 15.7%; Samburu, 30.8%). The most common improved sanitation facility used (in both the shared and unshared categories) is a pit latrine with a slab. The prevalence of open defecation varies significantly within each RFSA: in the Nawiri (CRS) RFSA areas 79.3% of households in Marsabit have no facility compared to 33.5% in Isiolo (p < 0.001). In the Nawiri (Mercy Corps) RFSA areas, open defecation prevalence is 74.7% in Turkana and 48.5% in Samburu (p < 0.05). The 2019
100 See Annex E2 for statistical comparison of estimates between counties and Annex F, Table A6.11 for additional details by county. 101 Improved sanitation facilities include those that flush or pour to a piped sewer system, septic tank, or pit latrine; ventilated improved pit latrines, composting toilets, and pit latrines with slabs. See https://washdata.org/monitoring/sanitation 102 The percentage of households with basic sanitation services does not differ statistically between Turkana and Samburu (see Annex E2 for details). Annex F, Table A6.11 provides details on household sanitation facilities.
Figure 27. Household sanitation facility, by county
79.3
33.5
74.7
48.5
2.6
14.1
3.2
12.1
13.2
39.8
15.7
30.8
4.311.5
5.9 8.2
0%
20%
40%
60%
80%
100%
Marsabit(N=983)
Isiolo (N=996) Turkana(N=949)
Samburu(N=959)
Nawiri (CRS) RFSA Areas Nawiri (Mercy Corps) RFSAAreas
Improved, not shared sanitaion facilityImproved, shared sanitation facilityNon-improved facility (excl. open defecation)No Facility/Bush/Field
Baseline Survey of the Nawiri Resilience Food Security Activities in Kenya (Vol. I)
Findings 67
SMART survey found a similar prevalence rate for open defecation in Turkana (75%), but an even higher rate (compared to the Nawiri baseline) in Samburu (73%).103
3.5.4 Handwashing Station A handwashing station is a location (fixed or mobile) where household members wash their hands with water and soap or ash.104 The measurement of this indicator is based on observation by the enumerator rather than self-reported information: the enumerator is shown the station where household members commonly wash their hands; water and soap or ash must be observed there.
The percentage of households with a handwashing station with soap or ash varied widely: in the Nawiri (CRS) RFSA areas, 17.1% in Isiolo and 57.4% in Marsabit (p < 0.01), and in the Nawiri (Mercy Corps) RFSA areas 19.5% in Turkana and 57.6% in Samburu (p < 0.01).105 The variation in the prevalence of handwashing stations is possibly attributable to differences in the operating contexts, e.g., structural differences, education level, poverty level, and access to water, availability and/or affordability of soap in local markets.
Statistics are available from SMART surveys regarding handwashing practices. Across counties, knowledge of target practices is substantially higher than observance of those practices. The surveys report the percentage of caregivers with children 0–23 months who report to wash their hands at four critical times.106 The results are as follows: Isiolo 21.5% (2020 SMART survey),107 Marsabit 26.7% (2019),108 Samburu 11.8% (2019),109 Turkana 28.6% (2019).110 While all figures are low, the low prevalence in Samburu is also notable because it marks a decrease from the previous year (26% in 2018).
3.6 Women’s Health and Nutrition
3.6.1 Women’s Minimum Dietary Diversity Diverse diets are associated with better micronutrient content, which in turn contributes to better health and nutrition.111 The women’s minimum dietary diversity indicator (MDD-W) captures the percentage of women of reproductive age (15–49 years) who consume five or more of ten food groups in the day and night before the survey. Though this indicator does not capture the frequency of consuming food items, the threshold of five groups is correlated with higher micronutrient adequacy.112
103 USAID. 2021a. Maternal, Infant and Young Child Nutrition (MIYCN) Desk Review: June 2021. Prepared by the Technical Working Group on Maternal, Infant, and Young Child Nutrition (MIYCN) for the USAID Nawiri Project. 104 For additional details refer to USAID, 2021b. BHA Indicator Handbook. 105 See Annex E1 for the percentage of households with a handwashing station with water and soap or ash, disaggregated by gendered household type. 106 After defecation, after changing diapers, before preparing food, and before eating 107 Government of Kenya. 2020. Isiolo County Integrated SMART Survey Report. February 2020. 108 Government of Kenya. 2019c. Marsabit County Integrated SMART Survey Report. February 2019. 109 Government of Kenya. 2019a. Samburu County Integrated SMART Survey Report. June 2019. 110 Government of Kenya. 2019b. Turkana County Integrated SMART Survey Report. June 2019. 111 For additional details refer to USAID, 2021b. BHA Indicator Handbook. 112 See USAID, 2021b. BHA Indicator Handbook.
IMPEL | Implementer-Led Evaluation and Learning
68 Findings
The baseline survey results show that the percentage of women 15–49 years who achieve an MDD-W differs widely between counties. In the Nawiri (CRS) RFSA areas, MDD-W ranged from 2.6% in Marsabit to 12.4% in Isiolo (p < .001). In the Nawiri (Mercy Corps) RFSA areas, the percentage achieving MDD-W was 3.7% in Turkana compared to 9.1% in Samburu (p < 0.05).113 MDD-W statistics computed for this baseline are similarly low to those found in the baseline reports of the longitudinal cohort studies of children and their mothers/ caregivers in Turkana and Samburu. The latter baselines found that 1.8% of women aged 15–49 in Turkana achieved MDD-W (n = 1,149),114 and 5.8% in Samburu (n = 586).115
Figure 28 illustrates the food groups consumed by women in each of the four counties. 116 Nearly all women of reproductive age throughout the RFSA areas consume grains, roots, and tubers. About 20% of women consume meat, poultry, or fish. Few women in the RFSA areas consume eggs, nuts and seeds, other fruits, or other vegetables.
Estimates of MDD-W from this study are lower than those of the PREG II baseline survey, but a similar pattern of county differences was observed, in addition to similar trends in the types of food groups most likely to be consumed by women 15–49 (see Annex E3). As noted above with respect to the prevalence of food insecurity and poverty, given the temporal difference between the two surveys and the impact of the COVID-19 pandemic in the intervening period, lower estimates of women’s dietary diversity in this study are expected.
113 Refer to Annex E1 for details on MDD-W, disaggregated by age. 114 Mercy Corps Nawiri Consortium. 2021f. Baseline Report, Longitudinal Mixed-Methods Study—Turkana. 115 Mercy Corps Nawiri Consortium. 2021g. Baseline Report, Longitudinal Mixed-Methods Study—Samburu. 116 Annex F, Table A6.12 provides details on MDD-W food groups, disaggregated by county.
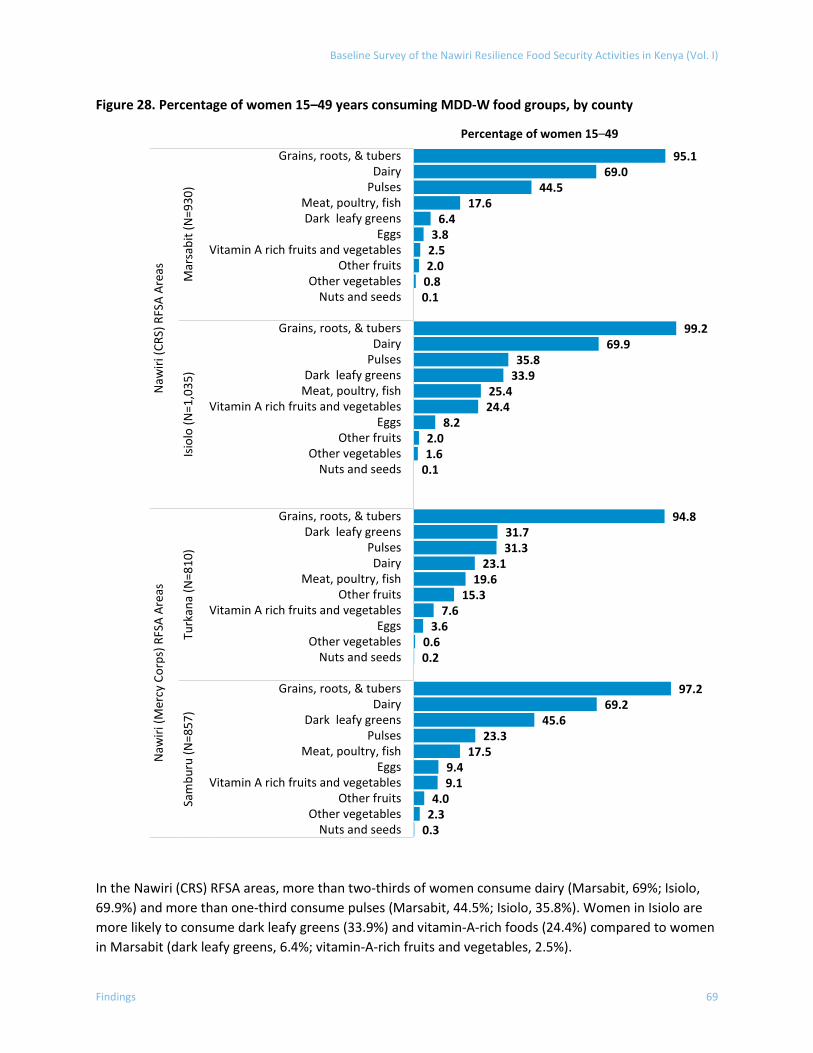
Baseline Survey of the Nawiri Resilience Food Security Activities in Kenya (Vol. I)
Findings 69
Figure 28. Percentage of women 15–49 years consuming MDD-W food groups, by county
In the Nawiri (CRS) RFSA areas, more than two-thirds of women consume dairy (Marsabit, 69%; Isiolo, 69.9%) and more than one-third consume pulses (Marsabit, 44.5%; Isiolo, 35.8%). Women in Isiolo are more likely to consume dark leafy greens (33.9%) and vitamin-A-rich foods (24.4%) compared to women in Marsabit (dark leafy greens, 6.4%; vitamin-A-rich fruits and vegetables, 2.5%).
95.169.0
44.517.6
6.43.8
2.52.0
0.80.1
99.269.9
35.833.9
25.424.4
8.22.01.6
0.1
94.831.731.3
23.119.6
15.37.6
3.60.60.2
97.269.2
45.623.3
17.59.49.1
4.02.3
0.3
Grains, roots, & tubersDairy
PulsesMeat, poultry, fishDark leafy greens
EggsVitamin A rich fruits and vegetables
Other fruitsOther vegetables
Nuts and seeds
Grains, roots, & tubersDairy
PulsesDark leafy greens
Meat, poultry, fishVitamin A rich fruits and vegetables
EggsOther fruits
Other vegetablesNuts and seeds
Grains, roots, & tubersDark leafy greens
PulsesDairy
Meat, poultry, fishOther fruits
Vitamin A rich fruits and vegetablesEggs
Other vegetablesNuts and seeds
Grains, roots, & tubersDairy
Dark leafy greensPulses
Meat, poultry, fishEggs
Vitamin A rich fruits and vegetablesOther fruits
Other vegetablesNuts and seeds
Mar
sabi
t (N
=930
)Is
iolo
(N=1
,035
)Tu
rkan
a (N
=810
)Sa
mbu
ru (N
=857
)
Naw
iri (C
RS) R
FSA
Area
sN
awiri
(Mer
cy C
orps
) RFS
A Ar
eas
Percentage of women 15–49
IMPEL | Implementer-Led Evaluation and Learning
70 Findings
This study’s findings on dairy consumption are consistent with research conducted in Marsabit117 and Isiolo118 in February–April 2021 indicating a positive correlation between dairy production and rainfall.119 The research noted that Kenya’s drought early warning bulletins consistently show elevated levels of livestock milk production during seasons and years with above-average rainfall, and found this to be consistent with participatory research whereby communities attributed higher child nutrition in part to milk access and availability. 120 This is consistent with the Nawiri baseline finding of moderate-high percentage of dairy consumption (near 70% for both counties), given that baseline data collection period coincided with the short rains. There is less milk production and a lack of livestock products during the dry season, during which there is more dependence on purchased food.121, 122
As illustrated in Figure 28, in the Nawiri (Mercy Corps) RFSA areas, consumption of dairy products is widespread among women in Samburu (69.2%) and dark leafy greens are consumed by close to one-half (45.6%). Women’s diets in Turkana are less diverse: about one-third consume dark leafy greens or pulses and about one-quarter consume dairy products.
The lower consumption of greens in Turkana may be due in part to the dry conditions that lower the potential for home gardens; a 2016 study found that only 6% of Turkana households have home gardens.123 The secondary data do not shed light on why dairy consumption in Turkana is relatively low, other than generally, milk availability and consumption—traditionally a fundamental part of nutrition for pastoralists, especially for infants and young children—are declining as pastoralists move to settled areas. 124 At the same time, a review of research on the role of sedentarization on nutrition found no single pattern or differences in nutrition outcomes for pastoral versus settled communities.125
The Turkana cost-of-diet study noted general availability of powdered cow milk and UHT cow milk (milk pasteurized at ultra-high temperature) in markets. Fresh goat milk was not sold in markets, but door-to-door by goat herders, and only minimally sold in the Lodwar Urban LZ. Goat milk was described as desirable but decreasingly available due to changing weather patterns. 126 Another study notes that the
117 Burns, J., A. Catley and H. Mahmoud. 2021a. Women’s knowledge on the seasonality and causes of child malnutrition in Marsabit County, Kenya. USAID Nawiri project. 118 Mahmoud, H., J. Burns and A. Catley. 2021. Women’s knowledge on the seasonality and causes of child malnutrition in Isiolo County, Kenya. USAID Nawiri project. 119 While the data collection timeframe of the research cited is different from this baseline study’s (October–early November 2021), the first period partially overlaps with the long rainy season, and the second with the short rains (see Figure 3), so it is reasonable to understand findings in terms of rainfall generally. 120 Burns, J., Catley, A. and Mahmoud, H. 2021b. Using Participatory Epidemiology to Investigate the Causes and Seasonality of Acute Malnutrition in Marsabit and Isiolo Counties, Northern Kenya: Methods and Experiences. Feinstein International Center, Friedman School of Nutrition Science and Policy at Tufts University Nawiri project. 121 Mahmoud, H., J. Burns and A. Catley. 2021. Women’s knowledge on the seasonality and causes of child malnutrition in Isiolo County, Kenya. USAID Nawiri project. 122 Burns, J., A. Catley and H. Mahmoud. 2021a. Women’s knowledge on the seasonality and causes of child malnutrition in Marsabit County, Kenya. USAID Nawiri project. 123 Save the Children. 2017. A desk review of key determinants of malnutrition in Turkana County, Kenya. Cited in USAID. 2021a. Maternal, Infant and Young Child Nutrition (MIYCN) Desk Review. 124 USAID. 2021a. Maternal, Infant and Young Child Nutrition (MIYCN) Desk Review. 125 Marshak, A. 2021. Nawiri Desk Study: Drivers of acute malnutrition in the Kenya arid and semi-arid lands. 126 Mothers in the Turkana cost-of-diet study reported that other foods less available in markets due to changing weather patterns are popular dark green leafy vegetables (kale, spinach, cowpea leaves), multiple fruits (available in the rainy season),
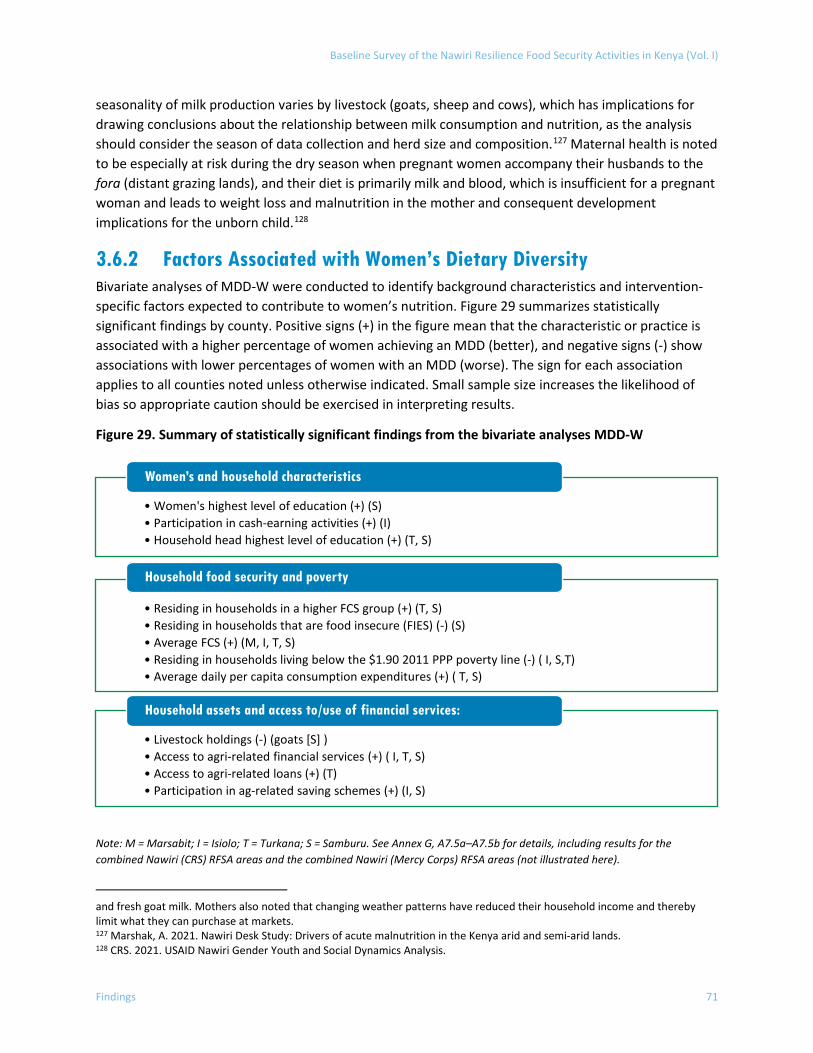
Baseline Survey of the Nawiri Resilience Food Security Activities in Kenya (Vol. I)
Findings 71
seasonality of milk production varies by livestock (goats, sheep and cows), which has implications for drawing conclusions about the relationship between milk consumption and nutrition, as the analysis should consider the season of data collection and herd size and composition.127 Maternal health is noted to be especially at risk during the dry season when pregnant women accompany their husbands to the fora (distant grazing lands), and their diet is primarily milk and blood, which is insufficient for a pregnant woman and leads to weight loss and malnutrition in the mother and consequent development implications for the unborn child.128
3.6.2 Factors Associated with Women’s Dietary Diversity Bivariate analyses of MDD-W were conducted to identify background characteristics and intervention-specific factors expected to contribute to women’s nutrition. Figure 29 summarizes statistically significant findings by county. Positive signs (+) in the figure mean that the characteristic or practice is associated with a higher percentage of women achieving an MDD (better), and negative signs (-) show associations with lower percentages of women with an MDD (worse). The sign for each association applies to all counties noted unless otherwise indicated. Small sample size increases the likelihood of bias so appropriate caution should be exercised in interpreting results.
Figure 29. Summary of statistically significant findings from the bivariate analyses MDD-W
Note: M = Marsabit; I = Isiolo; T = Turkana; S = Samburu. See Annex G, A7.5a–A7.5b for details, including results for the combined Nawiri (CRS) RFSA areas and the combined Nawiri (Mercy Corps) RFSA areas (not illustrated here).
and fresh goat milk. Mothers also noted that changing weather patterns have reduced their household income and thereby limit what they can purchase at markets. 127 Marshak, A. 2021. Nawiri Desk Study: Drivers of acute malnutrition in the Kenya arid and semi-arid lands. 128 CRS. 2021. USAID Nawiri Gender Youth and Social Dynamics Analysis.
• Women's highest level of education (+) (S) • Participation in cash-earning activities (+) (I)• Household head highest level of education (+) (T, S)
Women’s and household characteristics
• Residing in households in a higher FCS group (+) (T, S)• Residing in households that are food insecure (FIES) (-) (S)• Average FCS (+) (M, I, T, S)• Residing in households living below the $1.90 2011 PPP poverty line (-) ( I, S,T) • Average daily per capita consumption expenditures (+) ( T, S)
Household food security and poverty
• Livestock holdings (-) (goats [S] )• Access to agri-related financial services (+) ( I, T, S)• Access to agri-related loans (+) (T)• Participation in ag-related saving schemes (+) (I, S)
Household assets and access to/use of financial services:
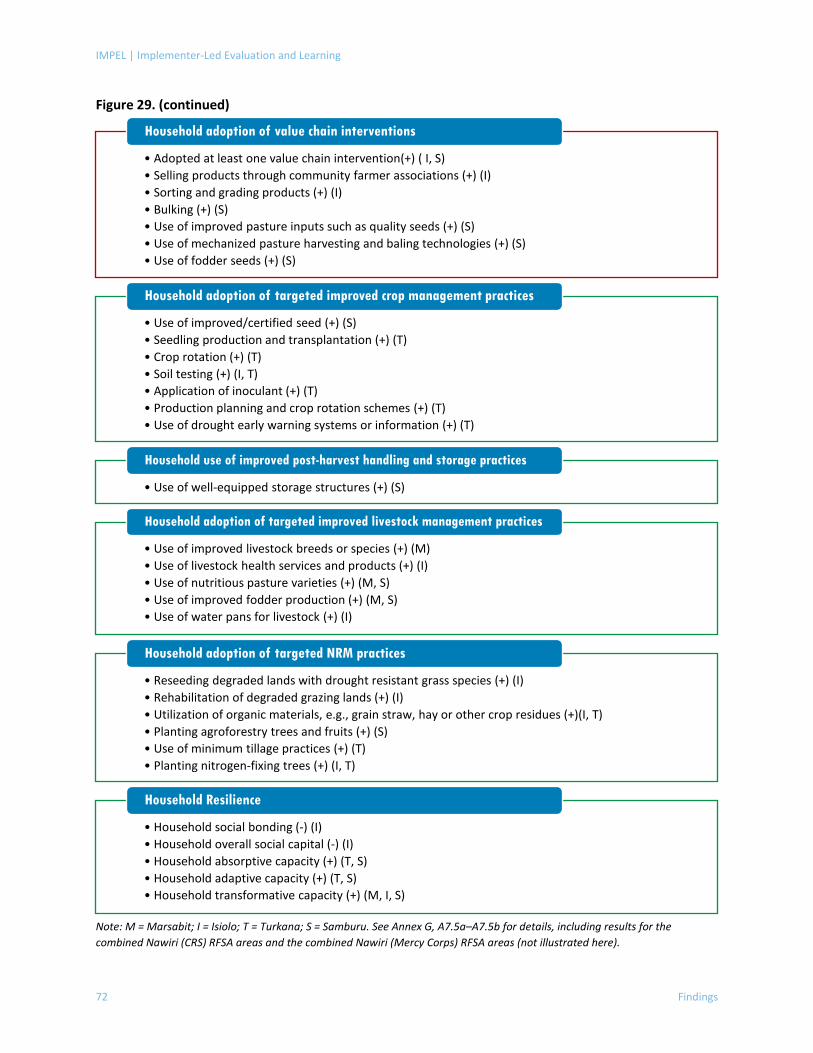
IMPEL | Implementer-Led Evaluation and Learning
72 Findings
Figure 29. (continued)
Note: M = Marsabit; I = Isiolo; T = Turkana; S = Samburu. See Annex G, A7.5a–A7.5b for details, including results for the combined Nawiri (CRS) RFSA areas and the combined Nawiri (Mercy Corps) RFSA areas (not illustrated here).
• Adopted at least one value chain intervention(+) ( I, S)• Selling products through community farmer associations (+) (I)• Sorting and grading products (+) (I)• Bulking (+) (S)• Use of improved pasture inputs such as quality seeds (+) (S)• Use of mechanized pasture harvesting and baling technologies (+) (S)• Use of fodder seeds (+) (S)
Household adoption of value chain interventions
• Use of improved/certified seed (+) (S)• Seedling production and transplantation (+) (T)• Crop rotation (+) (T)• Soil testing (+) (I, T)• Application of inoculant (+) (T)• Production planning and crop rotation schemes (+) (T)• Use of drought early warning systems or information (+) (T)
Household adoption of targeted improved crop management practices
• Use of well-equipped storage structures (+) (S)
Household use of improved post-harvest handling and storage practices
• Use of improved livestock breeds or species (+) (M)• Use of livestock health services and products (+) (I)• Use of nutritious pasture varieties (+) (M, S)• Use of improved fodder production (+) (M, S)• Use of water pans for livestock (+) (I)
Household adoption of targeted improved livestock management practices
• Reseeding degraded lands with drought resistant grass species (+) (I)• Rehabilitation of degraded grazing lands (+) (I)• Utilization of organic materials, e.g., grain straw, hay or other crop residues (+)(I, T)• Planting agroforestry trees and fruits (+) (S)• Use of minimum tillage practices (+) (T)• Planting nitrogen-fixing trees (+) (I, T)
Household adoption of targeted NRM practices
• Household social bonding (-) (I)• Household overall social capital (-) (I)• Household absorptive capacity (+) (T, S)• Household adaptive capacity (+) (T, S)• Household transformative capacity (+) (M, I, S)
Household Resilience
Baseline Survey of the Nawiri Resilience Food Security Activities in Kenya (Vol. I)
Findings 73
The secondary literature provides a wealth of information regarding factors influencing women’s diets in the RFSA areas. The formative research for Nawiri found that some of the most important factors influencing maternal nutrition and women’s diets were food availability, lack of access to markets because of distance and cost, lack of variety of foods in the markets, and general poverty.129,130,131
Another salient point in the literature is that across RFSA areas, the act of purchasing or otherwise obtaining food for the household is largely the domain of women. 132, 133 Women’s access to and decision-making power over household income is therefore a critical factor in the nutrition of household members.
This section provides a brief sketch of the main issues raised.
Reliance on Purchased Foods It is clear from the secondary literature review that while it varies by country and by season, there is some degree of reliance on purchased foods across all RFSA areas, and that food prices are often a barrier to purchase given high levels of poverty. Food prices in Samburu and Turkana in particular are found to have higher food prices relative to other counties due to isolation, transportation costs, and other barriers.134 The Turkana PEA supports the latter finding, noting a strong reliance on markets in Turkana as well as the insufficiency of those markets to meet food needs (see the following discussion), which it attributes to infrastructure and resource deficiencies.135 Indeed, as found in the longitudinal baseline studies in Samburu and Turkana, food purchases were far and above the most common reason for households to borrow money.136 In both counties, more than half of sampled households reported borrowing from friends or family members. The longitudinal baselines disaggregated the data on purposes for borrowing by livelihood group: the percentages of pastoral households borrowing to purchase food were 85% in Samburu and 82.6% in Turkana; among urban/peri-urban households, 80% in Samburu and 73.1% in Turkana; among agro-pastoral households, 81% in Samburu and 70.5% in Turkana; and among fisher folk households (a livelihood group measured in Turkana only), 43.3% borrowed to purchase food.137, 138
Food Availability in Markets Recent cost-of-diet research in Turkana County139 provides insight into some of the reasons for low dietary diversity. The research was conducted in the Fisheries Livelihood Zone (LZ) along the shores of Lake Turkana, and in settlements (groups that were once nomadic pastoralists) in the Urban LZ of Lodwar town. One research component was to assess food patterns, using a list of 67 food items
129 USAID. 2021a. Maternal, Infant and Young Child Nutrition (MIYCN) Desk Review. 130 Mercy Corps Nawiri Consortium. 2021d. Political Economy Analysis (Samburu). 131 Mercy Corps Nawiri Consortium. 2021e. Political Economy Analysis (Turkana). 132 USAID. 2021a. Maternal, Infant and Young Child Nutrition (MIYCN) Desk Review. 133 Mercy Corps USAID Nawiri Consortium. 2021a. Cost of Diet Study in The Lake Turkana Fisheries and Lodwar Urban Livelihood Zones of Turkana County, Kenya. October. 134 USAID. 2021a. Maternal, Infant and Young Child Nutrition (MIYCN) Desk Review. 135 Mercy Corps Nawiri Consortium. 2021e. Political Economy Analysis (Turkana). 136 While the Samburu and Turkana reports both disaggregate by livelihood group in reporting the percentage of households borrowing to purchase food, only the Samburu report provides the overall percentage of households across all livelihood groups: 84%. 137 Mercy Corps Nawiri Consortium. 2021f. Baseline Report, Longitudinal Mixed-Methods Study—Turkana. 138 Mercy Corps Nawiri Consortium. 2021g. Baseline Report, Longitudinal Mixed-Methods Study—Samburu. 139 Mercy Corps USAID Nawiri Consortium. 2021a. Cost of Diet Study (Turkana).
IMPEL | Implementer-Led Evaluation and Learning
74 Findings
considered to be consumed and/or available throughout most of the year and an additional 15 fruits available at certain times of year. In the two largest markets in the Fisheries LZ about half of these food items were for sale, with fruits and vegetables quite limited. Availability was higher in one of the largest markets in the Lodwar Urban LZ, where 54 food items and a greater variety of vegetables and fruits were available.
Maize grain or flour, red beans, tomatoes, tomatoes, vegetable oil, and salt, were among the most commonly consumed foods in both LZ. Notably, nearly all focus groups in both LZ stated that they grow very little or none of the basic foods they consume on a daily basis (maize and beans) and buy almost all. Perhaps attributable to national campaigns to consume fish, consumption of this food was high in the Fisheries LZ (with 93% of respondents indicating that they ate fish usually or often); it was also noted that fishing labor was often paid in kind with fresh fish. Other foods frequently consumed in this LZ were cabbage and doum palm fruit. Vegetable consumption was notably high in Lodwar Urban LZ, with 95% consuming kale and/or tomatoes and 87% consuming onions usually or often; only one or two vegetables (cabbage and onion) were available in most markets in the Fisheries LZ, compared to at least five vegetables in the Lodwar Urban LZ. Focus group participants said that kale, cabbage, and spinach are rarely available.140
Accessibility of Markets Workload and distance were both challenges to traveling to larger markets, and while some foods could be purchased in local village shops, prices for the same products were higher. 141 The Samburu PEA notes that only 10 of the county’s 1,606 total kilometers of road are paved, increasing the cost of transporting food to local markets.142 Security concerns regarding traveling to markets were consistently noted in the Lodwar Urban LZ, and uncommon in the Fisheries LZ.143
COVID-19 Impacts on Market Prices COVID-19 has had an impact on availability and price of market items. Lockdowns have led to supply chain breaks, resulting in price hikes. Traders in Turkana noted that several foods, especially beans and lentils, have increased in price in an unseasonal manner since the end of 2020, and attribute this to accumulated effects of the pandemic.144
Cultural and Generational Beliefs Cultural and generational beliefs about certain foods and food preparation also affect dietary choices. For example, foods that require less firewood to cook and are “easy to cook” were noted in Turkana as preferable, such as pasta, rice and beans imported from Uganda (as compared to the traditional red bean). Adolescent mothers named “newer” foods like pasta and rice as easy to cook and easy for small children to eat, while some older mothers described yoghurt and packaged fruit juices as desirable because they are “readily available for consumption.” 145 The importance of generational perceptions and beliefs around diet and health should not be understated; elders, grandmothers, mothers-in-law (as well as male
140 Mercy Corps USAID Nawiri Consortium. 2021a. Cost of Diet Study (Turkana). 141 Mercy Corps USAID Nawiri Consortium. 2021a. Cost of Diet Study (Turkana). 142 Mercy Corps Nawiri Consortium. 2021d. Political Economy Analysis (Samburu). 143 Mercy Corps USAID Nawiri Consortium. 2021a. Cost of Diet Study (Turkana). 144 Mercy Corps USAID Nawiri Consortium. 2021a. Cost of Diet Study (Turkana). 145 Mercy Corps USAID Nawiri Consortium. 2021a. Cost of Diet Study (Turkana).
Baseline Survey of the Nawiri Resilience Food Security Activities in Kenya (Vol. I)
Findings 75
household heads, religious leaders and traditional healers) exert significant influence on MIYCN behaviors and practices, including diet, cooking, child feeding, breastfeeding, and seeking healthcare.
Cultural norms around gender roles also influence women’s nutrition; for example, convention dictates that the father or male household head eats first, then the children; women eat last after the youngest children are fed. This leads to women’s missing meals, especially during the lean season, which compromises lactating mothers’ health and their ability to care for their infants. However, one study found that this norm is observed less by women under 30 with an education, who report all family members eating at the same time.146
Health Policy and Resourcing Context Several of the Nawiri formative studies emphasize the legal, policy and institutional context supporting nutrition at national147 and county level.148 While some strong frameworks are in place, various challenges to implementation are commonly mentioned related to coordination across levels and agencies of government; institutional “homelessness” of nutrition policy (which is spread among health, agriculture, and education sectors); resourcing; health service infrastructure; delivery of essential services (e.g., birth registration and monitoring); and the engagement of civil society in nutrition efforts. One report notes also competition among county departments for resources, as well as a lack of evidence regarding the drivers of persistent acute malnutrition (see also the discussion on perceptions of the causes of malnutrition, in Section 3.7.3). 149, 150
3.6.3 Antenatal Care Antenatal care (ANC) can help reduce maternal and perinatal morbidity and mortality through early detection and treatment of complications that may arise during pregnancy, as well as through the management of concurrent diseases and illnesses such as HIV and malaria via integrated health care delivery.151 ANC should be provided by skilled health personnel such as a doctor, midwife, or nurse. To detect and effectively treat underlying problems the first ANC visit should occur as early as possible, and within the first trimester.152
A total of 2,026 live births occurred in the RFSA areas in the 5 years prior to the survey (Marsabit, 553; Isiolo, 520; Turkana, 491; Samburu, 462).153 The percentage of most-recent births receiving at least four ANC visits by a skilled health professional ranged from 56.2% in Marsabit to 70.6% in Isiolo (p < 0.01). In
146 CRS. 2021. USAID Nawiri Gender Youth and Social Dynamics Analysis. 147 National instruments include the Kenya Health Policy 2014–2030, the National Food and Nutrition Security Policy (NFNSP), the National Food and Nutrition Security Policy Implementation Framework 2017–2022, the Kenya Nutrition Action Plan 2018–2022 (KNAP), and the National School Meals and Nutrition Strategy 2017–2022. 148 County instruments include County Nutrition Action Plans (CNAPs), County Integrated Development Plans (CIDPs), County Health Sector Strategic Plans 149 Mercy Corps Nawiri Consortium. 2021e. Political Economy Analysis (Turkana). 150 Mercy Corps Nawiri Consortium. 2021d. Strengthening Policy and Institutional Governance for Improved Nutrition Outcomes: Political Economy Analysis of Samburu County. August. 151 For additional details refer to USAID, 2021b. BHA Indicator Handbook. 152 WHO. 2004. Standards for Maternal and Newborn Health: Provision of Effective Antenatal Care (Section 1.6). Geneva, Switzerland: World Health Organization. Available at http://whqlibdoc.who.int/hq/2007/a91272.pdf. 153 A woman may have had more than one birth in the past 5 years. The survey collected information only for the most-recent birth. Annex F, Table A6.13 provides additional details on the use of ANC services.
IMPEL | Implementer-Led Evaluation and Learning
76 Findings
the Nawiri (Mercy Corps) RFSA areas, more than one-half of births received at least 4 ANC visits with a skilled health professional.154 The majority of live births in the RFSA areas received at least one ANC visit with a skilled health professional (Marsabit, 85.4%, Isiolo, 98.9%; Turkana, 91.6%; Samburu, 88.4%). Among those births that received at least one ANC visit, about one-third received this service during the first trimester of pregnancy (Marsabit, 30.8%; Isiolo, 30.9%; Turkana, 29.3%; Samburu, 33.1%). The most common providers of ANC are nurses (Marsabit, 66.6%; Isiolo, 64.6%; Turkana, 86.3%; Samburu, 86%).
A relevant point related to post-natal care is that mothers may be stigmatized if their children are enrolled in nutrition programs. Shaming mothers whose children suffer from acute malnutrition was raised in a study in Isiolo and Marsabit as a discouragement to enrollment in such programs, especially in the Gabbra and Borana communities in the study.155
3.6.4 Contraceptive Methods: Knowledge, Use, and Decision-Making Voluntary and safe family planning are central to improving women and children’s health, reducing HIV/AIDS, advancing gender equality and women’s empowerment, and reducing poverty.156 Knowledge of family planning methods is a prerequisite to accessing and using those methods. Women’s ability to make educated and voluntary choices about childbearing, including the use of contraception, is critical for their empowerment and overall well-being.
Statistics from the most recent Kenya Demographic and Health Survey (KDHS) (2014)157 provide context on the prevalence of contraceptive use nationally and regionally. At national level, 58% of married women aged 15–49 were found to use any method of family planning. All four of the RFSA counties are among the ten counties with the lowest contraceptive prevalence in the country, according to Demographic and Health Survey (DHS) data: Turkana (10%), Marsabit (12%), Samburu (23%) and Isiolo (27%).158
The baseline survey considers women to be knowledgeable of modern contraception if they are aware of at least three modern family planning methods that can be used to delay or avoid pregnancy.159 Knowledge of modern contraceptive methods among women in a union varied from 63.7% in Marsabit
154 Indicator estimates for the percentage of births receiving at least four ANC visits with a skilled health professional do not differ statistically between Samburu and Turkana. See Annexes E1 and E2 for county-level indicator estimates and the results of the statistical comparisons, respectively. 155 CRS. 2021. USAID Nawiri Gender Youth and Social Dynamics Analysis … in Isiolo and Marsabit Counties. 156 Refer to https://www.usaid.gov/global-health/health-areas/family-planning 157 The 2022 KDHS is underway at this writing and data are yet available. 158 National Bureau of Statistics-Kenya and ICF International. 2016. 2014 Kenya Demographic and Health Survey Atlas of County-level Health Indicators. Rockville, Maryland, USA: KNBS and ICF International. https://www.dhsprogram.com/pubs/pdf/ATR16/ATR16.pdf 159 The modern family planning methods used for the calculation of this indicator are female sterilization, male sterilization, intrauterine devices, injectables, implants, contraceptive pills, male condom, female condom, diaphragm with spermicide, emergency contraception, standard days method, and lactation amenorrhea method. Refer to Annex E1 for estimates of knowledge of modern family planning methods, disaggregated by age group and Annex E2 for county comparisons of those estimates.
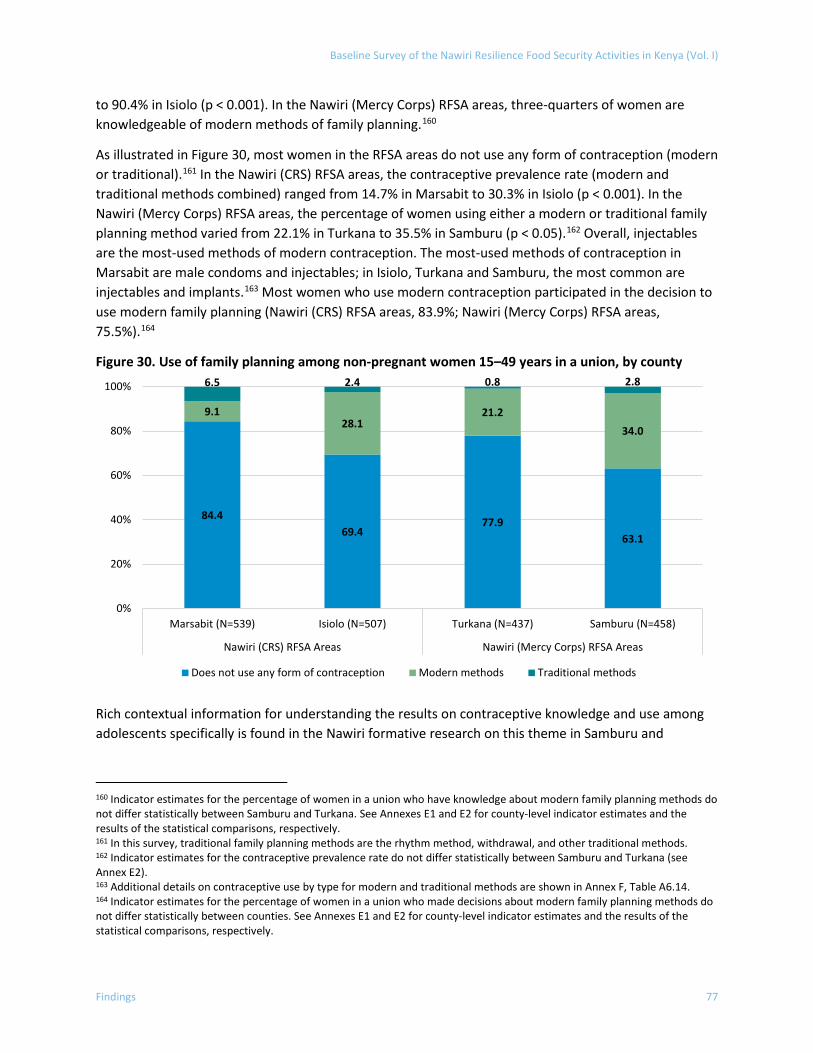
Baseline Survey of the Nawiri Resilience Food Security Activities in Kenya (Vol. I)
Findings 77
to 90.4% in Isiolo (p < 0.001). In the Nawiri (Mercy Corps) RFSA areas, three-quarters of women are knowledgeable of modern methods of family planning.160
As illustrated in Figure 30, most women in the RFSA areas do not use any form of contraception (modern or traditional).161 In the Nawiri (CRS) RFSA areas, the contraceptive prevalence rate (modern and traditional methods combined) ranged from 14.7% in Marsabit to 30.3% in Isiolo (p < 0.001). In the Nawiri (Mercy Corps) RFSA areas, the percentage of women using either a modern or traditional family planning method varied from 22.1% in Turkana to 35.5% in Samburu (p < 0.05).162 Overall, injectables are the most-used methods of modern contraception. The most-used methods of contraception in Marsabit are male condoms and injectables; in Isiolo, Turkana and Samburu, the most common are injectables and implants.163 Most women who use modern contraception participated in the decision to use modern family planning (Nawiri (CRS) RFSA areas, 83.9%; Nawiri (Mercy Corps) RFSA areas, 75.5%).164
Figure 30. Use of family planning among non-pregnant women 15–49 years in a union, by county
Rich contextual information for understanding the results on contraceptive knowledge and use among adolescents specifically is found in the Nawiri formative research on this theme in Samburu and
160 Indicator estimates for the percentage of women in a union who have knowledge about modern family planning methods do not differ statistically between Samburu and Turkana. See Annexes E1 and E2 for county-level indicator estimates and the results of the statistical comparisons, respectively. 161 In this survey, traditional family planning methods are the rhythm method, withdrawal, and other traditional methods. 162 Indicator estimates for the contraceptive prevalence rate do not differ statistically between Samburu and Turkana (see Annex E2). 163 Additional details on contraceptive use by type for modern and traditional methods are shown in Annex F, Table A6.14. 164 Indicator estimates for the percentage of women in a union who made decisions about modern family planning methods do not differ statistically between counties. See Annexes E1 and E2 for county-level indicator estimates and the results of the statistical comparisons, respectively.
84.469.4
77.963.1
9.128.1
21.234.0
6.5 2.4 0.8 2.8
0%
20%
40%
60%
80%
100%
Marsabit (N=539) Isiolo (N=507) Turkana (N=437) Samburu (N=458)
Nawiri (CRS) RFSA Areas Nawiri (Mercy Corps) RFSA Areas
Does not use any form of contraception Modern methods Traditional methods
IMPEL | Implementer-Led Evaluation and Learning
78 Findings
Turkana165 and also in Isiolo and Marsabit.166 Both reports underscore that pregnancy in adolescents and motherhood are key drivers of persistent acute malnutrition in mothers and babies alike, e.g., babies born to adolescent mothers are more likely to have a low birth weight, which heightens their risk for malnourishment, illness, and death. Moreover, “…[U]neducated adolescent mothers who have no family planning information, poor health status, and often have less decision-making ability and capacity to care for a baby compared to older mothers are at greater risk for their babies wasting.”167 Younger mothers may have less knowledge about early breastfeeding and other childcare practices.168 Motherhood at a young age is indeed a characteristic of the RFSA areas. The latest DHS (2014) finds that nationwide, 18% of adolescents aged 15–19 have begun childbearing, with higher rates in the RFSA counties: prevalence is 26% in Samburu (among the highest in the country), between 20 and 24% in Turkana, and between 17 and 19% in Isiolo and Marsabit. 169, 170
Motherhood at a young age is connected to early marriage. At least two of the Nawiri desk reviews point out that early marriage is common, despite laws against it, due to the influence of customary practices: “Harmful practices (e.g., female genital mutilation/ cutting and child early and forced marriage [CEFM] [10–15 years] are driven by social norms and expectations of womanhood among pastoralists and are used to ‘control girls’ sexuality.’” 171, 172 The Samburu and Turkana report describes CEFM as an encouraged practice that enables families to acquire wealth. 173 This ties to other themes around contraceptive use that emerge from secondary literature: the value placed on high fertility (regardless of the means to support a large family),174 and birth spacing.
In the communities studied for research in Isiolo and Marsabit, men typically make decisions about how many children to have and child spacing, though young, educated women are starting to have more influence in these areas. Research respondents mentioned Catholic and Islamic religious beliefs as inflexible on birth spacing, and as prohibiting hormonal methods of birth control; more commonly
165 Technical Working Group (TWG) on Community Health Systems for the USAID Nawiri Project. 2021. Landscape Analysis and Stakeholder Mapping of Turkana and Samburu Counties, Kenya: Individual, Interpersonal, Community, and Structural Influences that Shape Adolescent Pregnancy and Childbearing. August. 166 CRS. 2021. USAID Nawiri Gender Youth and Social Dynamics Analysis… in Isiolo and Marsabit Counties. 167 TWG on Community Health Systems for the USAID Nawiri Project. 2021. Landscape Analysis and Stakeholder Mapping of Turkana and Samburu Counties… 168 CRS. 2021. USAID Nawiri Gender Youth and Social Dynamics Analysis … in Isiolo and Marsabit Counties. 169 National Bureau of Statistics-Kenya and ICF International. 2016. 2014 Kenya Demographic and Health Survey Atlas of County-level Health Indicators. Rockville, Maryland, USA: KNBS and ICF International. 170 Fertility rates are also higher in the RFSA areas for all age groups, compared to national figures. The DHS (2014) finds a national birth rate of 3.9 children per woman, with important regional differences. Women in rural areas have almost 1.5 more children, on average, than women in urban areas (4.5 versus 3.1), and counties with higher fertility rates tend to be in northern Kenya. Turkana (6.9) and Samburu have the second-and third-highest fertility rates in the country (6.9 and 6.3, respectively), and Marsabit and Isiolo rates are in the 4.6–5.2 range. 171 TWG on Community Health Systems for the USAID Nawiri Project. 2021. Landscape Analysis and Stakeholder Mapping of Turkana and Samburu Counties... 172 CRS. 2021. USAID Nawiri Gender Youth and Social Dynamics Analysis … in Isiolo and Marsabit Counties. 173 TWG on Community Health Systems for the USAID Nawiri Project. 2021. Landscape Analysis and Stakeholder Mapping of Turkana and Samburu Counties... 174 Mercy Corps Nawiri Consortium. 2021e. Political Economy Analysis (Turkana).
Baseline Survey of the Nawiri Resilience Food Security Activities in Kenya (Vol. I)
Findings 79
preferred birth control strategies are lactational amenorrhea and taking advantage of men’s absence from home when they migrate their animals during the dry season. 175
Other factors noted to influence use younger women’s use of family planning were misinformation or lack of information on contraceptives or reproductive health services, association (in some Samburu communities) of contraceptives with promiscuity, lack of adolescent safe space and youth-friendly services at health facilities, long distances to health facilities, confidentiality concerns, unavailability of services and/or stock-out of contraceptives, and service fees. Illiteracy, fear, and peer pressure were also mentioned.176
The combination of individual, social, cultural, infrastructure, institutional, policy, and environmental factors influencing health-seeking behaviors around reproductive health and contraceptive use are complex and can be community-specific; the reader is referred to the reports cited here for substantial information available on these issues.
3.7 Children’s Health and Nutrition
3.7.1 Infant and Young Child Feeding
3.7.1.1 Exclusive Breastfeeding Exclusive breastfeeding of infants for 6 months is associated with better health and nutrition benefits, including reduced risk of gastrointestinal infections and reduced risk of mortality from infectious disease.177 In this study, an infant is considered to be exclusively breastfed if they received breastmilk (expressed or from a wet nurse) during the day before the survey, and might have received oral rehydration solution (ORS), vitamins, minerals, and/or medicines, but did not receive any other food or liquid, including water. Over one-half of children under 6 months are breastfed exclusively in the RFSA areas (Nawiri (CRS), 52%; Nawiri (Mercy Corps), 56.9%).178 Sex differences in the prevalence of exclusive breastfeeding are statistically non-significant in the four counties.179
Figure 31 through Figure 34 illustrate breastfeeding status for children 0–23 months by age and county. 180 The results underscore the decline in the prevalence of exclusive breastfeeding well before the age of 6 months, prior to the recommended timeframe for introducing complementary foods and other liquids.
Most children under 2 months (Marsabit, 71.3%; Isiolo, 77.4%; Turkana, 75.8%; Samburu, 78.1%) were exclusively breastfed. A total of 7.7% of children under 2 months in Isiolo and 11.8% in Turkana did not receive any breastmilk. Across the four counties, a marked drop off in exclusive breastfeeding occurs
175 TWG on Community Health Systems for the USAID Nawiri Project. 2021. Landscape Analysis and Stakeholder Mapping of Turkana and Samburu Counties… 176 TWG on Community Health Systems for the USAID Nawiri Project. 2021. Landscape Analysis and Stakeholder Mapping of Turkana and Samburu Counties… 177 BHA Handbook 2021. 178 Exclusive breastfeeding indicator estimates are based on the following sample sizes of children under 6 months: Marsabit, 75; Isiolo, 85; Turkana, 109; Samburu, 88. Indicator estimates for the prevalence of exclusive breastfeeding do not differ statistically between counties (see Annex E2). 179 For additional details on exclusive breastfeeding by sex, see Annex E1. 180 See Annex F, Table A6.15.
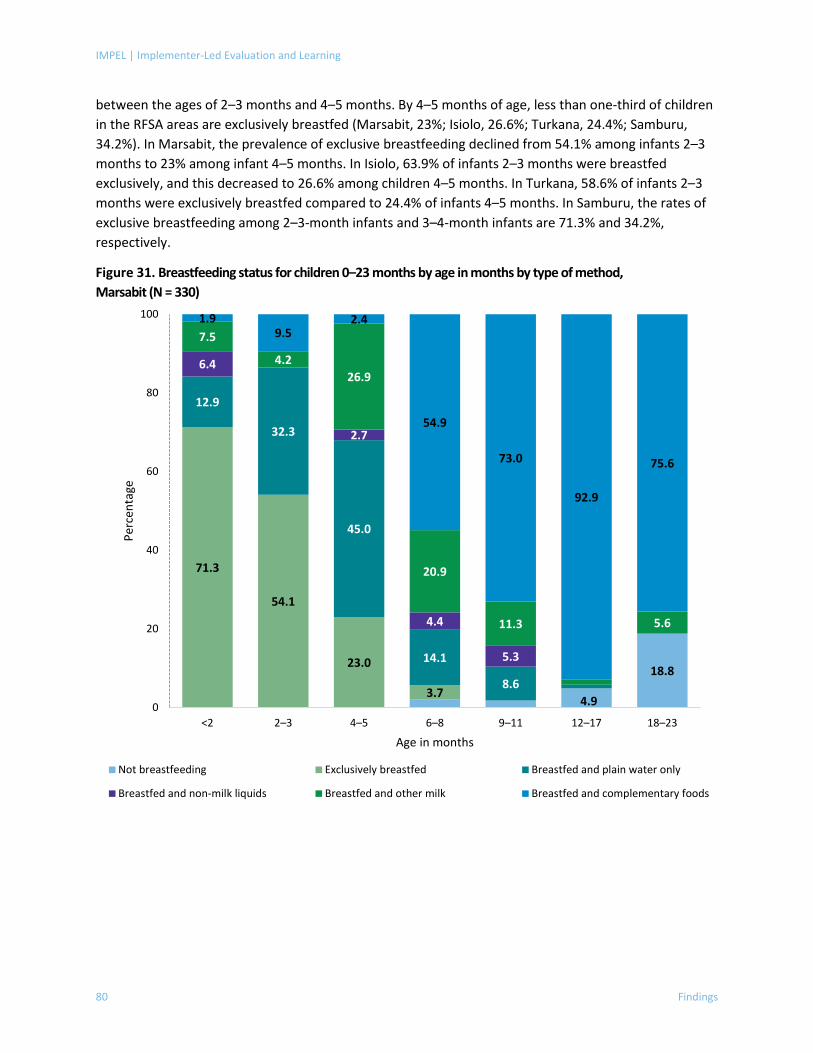
IMPEL | Implementer-Led Evaluation and Learning
80 Findings
between the ages of 2–3 months and 4–5 months. By 4–5 months of age, less than one-third of children in the RFSA areas are exclusively breastfed (Marsabit, 23%; Isiolo, 26.6%; Turkana, 24.4%; Samburu, 34.2%). In Marsabit, the prevalence of exclusive breastfeeding declined from 54.1% among infants 2–3 months to 23% among infant 4–5 months. In Isiolo, 63.9% of infants 2–3 months were breastfed exclusively, and this decreased to 26.6% among children 4–5 months. In Turkana, 58.6% of infants 2–3 months were exclusively breastfed compared to 24.4% of infants 4–5 months. In Samburu, the rates of exclusive breastfeeding among 2–3-month infants and 3–4-month infants are 71.3% and 34.2%, respectively.
Figure 31. Breastfeeding status for children 0–23 months by age in months by type of method, Marsabit (N = 330)
4.9
18.8
71.3
54.1
23.0
3.7
12.9
32.3
45.0
14.1
8.6
6.4
2.7
4.4
5.3
7.5
4.226.9
20.9
11.3 5.6
1.99.5
2.4
54.9
73.0
92.9
75.6
0
20
40
60
80
100
<2 2–3 4–5 6–8 9–11 12–17 18–23
Perc
enta
ge
Age in months
Not breastfeeding Exclusively breastfed Breastfed and plain water only
Breastfed and non-milk liquids Breastfed and other milk Breastfed and complementary foods
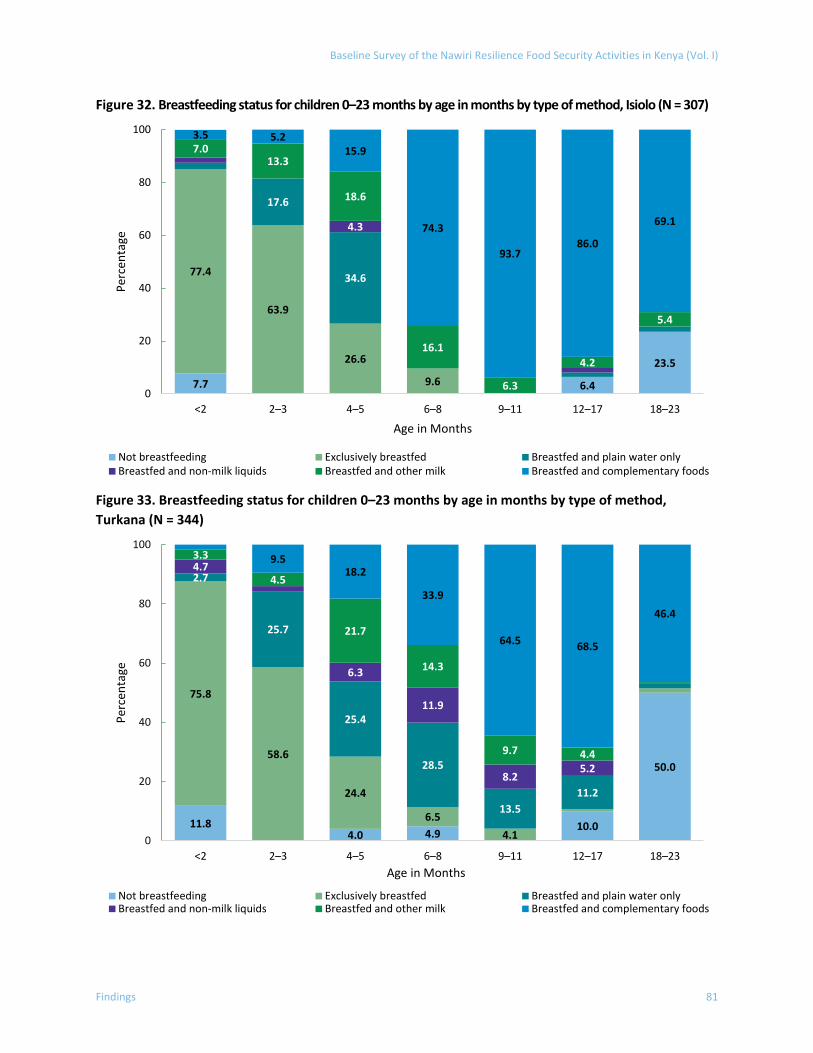
Baseline Survey of the Nawiri Resilience Food Security Activities in Kenya (Vol. I)
Findings 81
Figure 32. Breastfeeding status for children 0–23 months by age in months by type of method, Isiolo (N = 307)
Figure 33. Breastfeeding status for children 0–23 months by age in months by type of method, Turkana (N = 344)
7.7 6.4
23.5
77.4
63.9
26.6
9.6
17.6
34.6
4.3
7.013.3
18.6
16.1
6.3
4.2
5.4
3.5 5.215.9
74.3
93.786.0
69.1
0
20
40
60
80
100
<2 2–3 4–5 6–8 9–11 12–17 18–23
Perc
enta
ge
Age in Months
Not breastfeeding Exclusively breastfed Breastfed and plain water onlyBreastfed and non-milk liquids Breastfed and other milk Breastfed and complementary foods
11.84.0 4.9 10.0
50.0
75.8
58.6
24.4
6.54.1
2.7
25.7
25.4
28.5
13.511.2
4.7
6.3
11.9
8.25.2
3.3
4.5
21.7
14.3
9.7 4.4
9.518.2
33.9
64.5 68.5
46.4
0
20
40
60
80
100
<2 2–3 4–5 6–8 9–11 12–17 18–23
Perc
enta
ge
Age in Months
Not breastfeeding Exclusively breastfed Breastfed and plain water onlyBreastfed and non-milk liquids Breastfed and other milk Breastfed and complementary foods
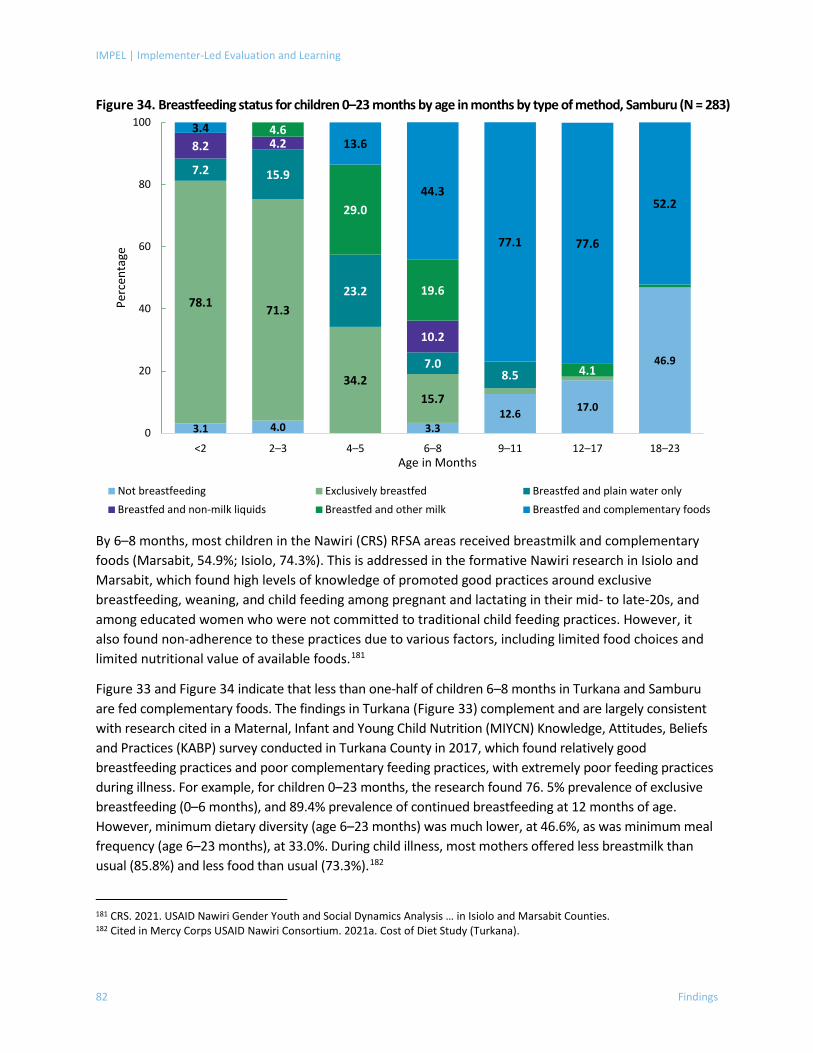
IMPEL | Implementer-Led Evaluation and Learning
82 Findings
Figure 34. Breastfeeding status for children 0–23 months by age in months by type of method, Samburu (N = 283)
By 6–8 months, most children in the Nawiri (CRS) RFSA areas received breastmilk and complementary foods (Marsabit, 54.9%; Isiolo, 74.3%). This is addressed in the formative Nawiri research in Isiolo and Marsabit, which found high levels of knowledge of promoted good practices around exclusive breastfeeding, weaning, and child feeding among pregnant and lactating in their mid- to late-20s, and among educated women who were not committed to traditional child feeding practices. However, it also found non-adherence to these practices due to various factors, including limited food choices and limited nutritional value of available foods.181
Figure 33 and Figure 34 indicate that less than one-half of children 6–8 months in Turkana and Samburu are fed complementary foods. The findings in Turkana (Figure 33) complement and are largely consistent with research cited in a Maternal, Infant and Young Child Nutrition (MIYCN) Knowledge, Attitudes, Beliefs and Practices (KABP) survey conducted in Turkana County in 2017, which found relatively good breastfeeding practices and poor complementary feeding practices, with extremely poor feeding practices during illness. For example, for children 0–23 months, the research found 76. 5% prevalence of exclusive breastfeeding (0–6 months), and 89.4% prevalence of continued breastfeeding at 12 months of age. However, minimum dietary diversity (age 6–23 months) was much lower, at 46.6%, as was minimum meal frequency (age 6–23 months), at 33.0%. During child illness, most mothers offered less breastmilk than usual (85.8%) and less food than usual (73.3%).182
181 CRS. 2021. USAID Nawiri Gender Youth and Social Dynamics Analysis … in Isiolo and Marsabit Counties. 182 Cited in Mercy Corps USAID Nawiri Consortium. 2021a. Cost of Diet Study (Turkana).
3.1 4.0 3.312.6 17.0
46.9
78.1 71.3
34.215.7
7.2 15.9
23.2
7.08.5
8.2 4.2
10.2
4.6
29.0
19.6
4.1
3.413.6
44.3
77.1 77.6
52.2
0
20
40
60
80
100
<2 2–3 4–5 6–8 9–11 12–17 18–23
Perc
enta
ge
Age in Months
Not breastfeeding Exclusively breastfed Breastfed and plain water onlyBreastfed and non-milk liquids Breastfed and other milk Breastfed and complementary foods
Baseline Survey of the Nawiri Resilience Food Security Activities in Kenya (Vol. I)
Findings 83
The desk review of MIYCN practices in Samburu and Turkana noted improvements in breastfeeding practices but taboos and cultural beliefs continue to inhibit the adoption of best practices. 183 These socio-cultural norms and taboos were also found in Marsabit and Isiolo.184 These beliefs include that one should stop breastfeeding a child with diarrhea because breastmilk causes diarrhea, and that colostrum is unclean and/or will prevent the newborn from becoming strong (it is thus discarded). Common practices that are generally detrimental or sub-optimal for child health include delaying the initiation of breastfeeding (such as to allow for the performance of traditional birth ceremonies and rituals), pre-lacteal feeding, and early weaning. Among pastoralists across Kenya, newborns are given animal milk at birth and/or a few days after birth, such as fat or milk from goats, which is a risk factor for malnutrition and morbidity.185, 186 The knowledge of the benefits of continued breastfeeding in the second year may be low—though women’s time poverty may also limit their ability to continue breastfeeding for the recommended period. There are also various food prohibitions and taboos, discussed in Section 3.7.2.
3.7.1.2 Minimum Acceptable Diet The minimum acceptable diet (MAD) indicator is a composite indicator measuring both minimum dietary diversity and minimum feeding frequency, as appropriate for a child’s age and breastfeeding status. Minimum dietary diversity for breastfed children 6–23 months is defined as consuming four or more food groups out of seven food groups. Minimum dietary diversity for non-breastfed children 6–23 months is defined as consuming four or more food groups out of six food groups in addition to two or more milk feeds. Minimum meal frequency for breastfed children 6–23 months is defined as two or more feedings of solid, semi-solid or soft food for children 6–8 months and three or more feedings of solid, semi-solid or soft food for children 9–23 months. Minimum meal frequency for non-breastfed children 6–23 months is defined as four or more feedings of solid, semi-solid or softy foods and two or more milk feeds.
The prevalence of children 6–23 months achieving a diet of minimum diversity is low in the RFSA areas: 1.3% in Marsabit compared to 6% in Isiolo (p < 0.05) and 0.6% in Turkana compared to 5.7% in Samburu (p < 0.01).187 Sex differences in the prevalence of MAD are statistically non-significant in the four counties.188
Figure 35–Figure 38 illustrate components of the MAD indicator for children 6–23 months by age subgroup (6–8 months and 9–23 months) and breastfeeding status.189 In Marsabit, less than one-quarter of children 6–23 months achieve a minimum meal frequency regardless of age subgroup or breastfeeding status and no more than 6% achieve minimum dietary diversity (see Figure 35). In Isiolo, less than one-half of children 6–23 months achieve a minimum meal frequency regardless of age subgroup or breastfeeding status and less than 14% achieve minimum dietary diversity (see Figure 36). Less than 14% of children in Turkana are fed as often as is appropriate regardless of age subgroup or breastfeeding
183 USAID. 2021a. Maternal, Infant and Young Child Nutrition (MIYCN) Desk Review. 184 CRS. 2021. USAID Nawiri Gender Youth and Social Dynamics Analysis … in Isiolo and Marsabit Counties. 185 USAID. 2021a. Maternal, Infant and Young Child Nutrition (MIYCN) Desk Review. 186 Mercy Corps Nawiri Consortium. 2021e. Political Economy Analysis (Turkana). 187 MAD indicator estimates are based on the following sample sizes of children 6-23 months: Marsabit, 255; Isiolo, 222; Turkana, 235; Samburu, 195. 188 For additional details on MAD by sex, see Annex E1. 189 See Annex F, Table A6.16.
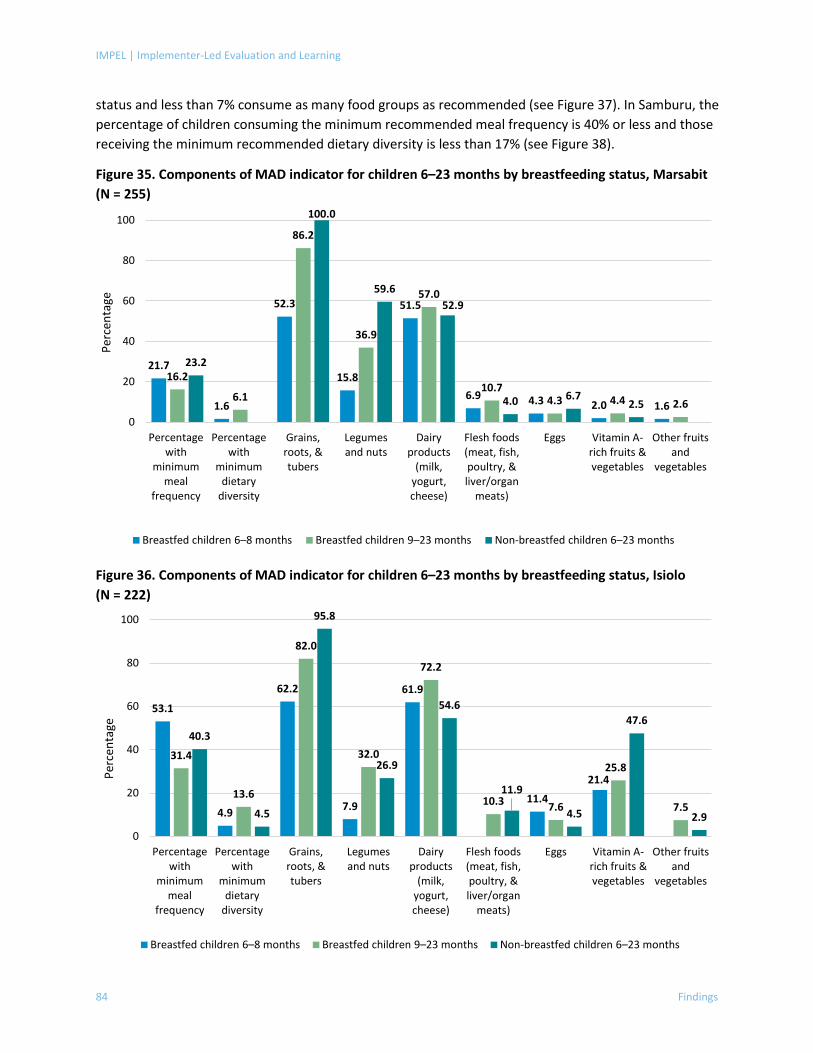
IMPEL | Implementer-Led Evaluation and Learning
84 Findings
status and less than 7% consume as many food groups as recommended (see Figure 37). In Samburu, the percentage of children consuming the minimum recommended meal frequency is 40% or less and those receiving the minimum recommended dietary diversity is less than 17% (see Figure 38).
Figure 35. Components of MAD indicator for children 6–23 months by breastfeeding status, Marsabit (N = 255)
Figure 36. Components of MAD indicator for children 6–23 months by breastfeeding status, Isiolo (N = 222)
21.7
1.6
52.3
15.8
51.5
6.9 4.3 2.0 1.6
16.2
6.1
86.2
36.9
57.0
10.74.3 4.4 2.6
23.2
100.0
59.652.9
4.0 6.72.5
0
20
40
60
80
100
Percentagewith
minimummeal
frequency
Percentagewith
minimumdietary
diversity
Grains,roots, &tubers
Legumesand nuts
Dairyproducts
(milk,yogurt,cheese)
Flesh foods(meat, fish,poultry, &liver/organ
meats)
Eggs Vitamin A-rich fruits &vegetables
Other fruitsand
vegetables
Perc
enta
ge
Breastfed children 6–8 months Breastfed children 9–23 months Non-breastfed children 6–23 months
53.1
4.9
62.2
7.9
61.9
11.4
21.4
31.4
13.6
82.0
32.0
72.2
10.3 7.6
25.8
7.5
40.3
4.5
95.8
26.9
54.6
11.9
4.5
47.6
2.9
0
20
40
60
80
100
Percentagewith
minimummeal
frequency
Percentagewith
minimumdietary
diversity
Grains,roots, &tubers
Legumesand nuts
Dairyproducts
(milk,yogurt,cheese)
Flesh foods(meat, fish,poultry, &liver/organ
meats)
Eggs Vitamin A-rich fruits &vegetables
Other fruitsand
vegetables
Perc
enta
ge
Breastfed children 6–8 months Breastfed children 9–23 months Non-breastfed children 6–23 months
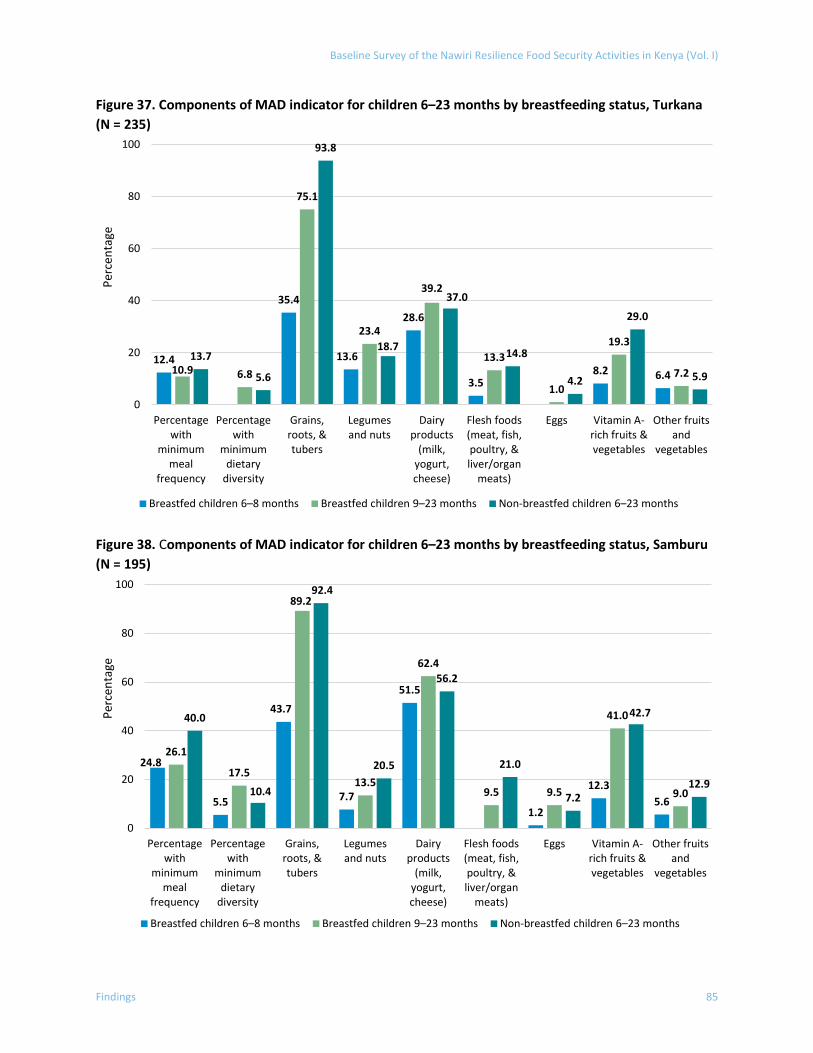
Baseline Survey of the Nawiri Resilience Food Security Activities in Kenya (Vol. I)
Findings 85
Figure 37. Components of MAD indicator for children 6–23 months by breastfeeding status, Turkana (N = 235)
Figure 38. Components of MAD indicator for children 6–23 months by breastfeeding status, Samburu (N = 195)
12.4
35.4
13.6
28.6
3.58.2 6.410.9 6.8
75.1
23.4
39.2
13.3
1.0
19.3
7.213.7
5.6
93.8
18.7
37.0
14.8
4.2
29.0
5.9
0
20
40
60
80
100
Percentagewith
minimummeal
frequency
Percentagewith
minimumdietary
diversity
Grains,roots, &tubers
Legumesand nuts
Dairyproducts
(milk,yogurt,cheese)
Flesh foods(meat, fish,poultry, &liver/organ
meats)
Eggs Vitamin A-rich fruits &vegetables
Other fruitsand
vegetables
Perc
enta
ge
Breastfed children 6–8 months Breastfed children 9–23 months Non-breastfed children 6–23 months
24.8
5.5
43.7
7.7
51.5
1.2
12.35.6
26.1
17.5
89.2
13.5
62.4
9.5 9.5
41.0
9.0
40.0
10.4
92.4
20.5
56.2
21.0
7.2
42.7
12.9
0
20
40
60
80
100
Percentagewith
minimummeal
frequency
Percentagewith
minimumdietary
diversity
Grains,roots, &tubers
Legumesand nuts
Dairyproducts
(milk,yogurt,cheese)
Flesh foods(meat, fish,poultry, &liver/organ
meats)
Eggs Vitamin A-rich fruits &vegetables
Other fruitsand
vegetables
Perc
enta
ge
Breastfed children 6–8 months Breastfed children 9–23 months Non-breastfed children 6–23 months
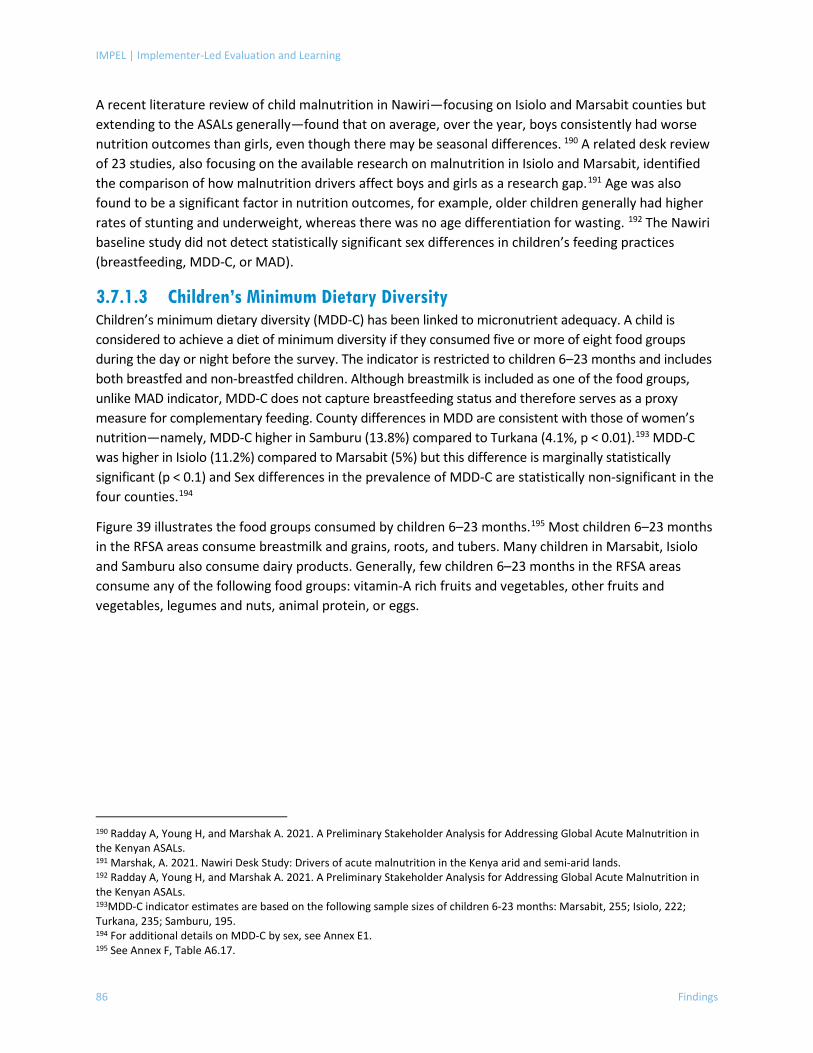
IMPEL | Implementer-Led Evaluation and Learning
86 Findings
A recent literature review of child malnutrition in Nawiri—focusing on Isiolo and Marsabit counties but extending to the ASALs generally—found that on average, over the year, boys consistently had worse nutrition outcomes than girls, even though there may be seasonal differences. 190 A related desk review of 23 studies, also focusing on the available research on malnutrition in Isiolo and Marsabit, identified the comparison of how malnutrition drivers affect boys and girls as a research gap.191 Age was also found to be a significant factor in nutrition outcomes, for example, older children generally had higher rates of stunting and underweight, whereas there was no age differentiation for wasting. 192 The Nawiri baseline study did not detect statistically significant sex differences in children’s feeding practices (breastfeeding, MDD-C, or MAD).
3.7.1.3 Children’s Minimum Dietary Diversity Children’s minimum dietary diversity (MDD-C) has been linked to micronutrient adequacy. A child is considered to achieve a diet of minimum diversity if they consumed five or more of eight food groups during the day or night before the survey. The indicator is restricted to children 6–23 months and includes both breastfed and non-breastfed children. Although breastmilk is included as one of the food groups, unlike MAD indicator, MDD-C does not capture breastfeeding status and therefore serves as a proxy measure for complementary feeding. County differences in MDD are consistent with those of women’s nutrition—namely, MDD-C higher in Samburu (13.8%) compared to Turkana (4.1%, p < 0.01).193 MDD-C was higher in Isiolo (11.2%) compared to Marsabit (5%) but this difference is marginally statistically significant (p < 0.1) and Sex differences in the prevalence of MDD-C are statistically non-significant in the four counties.194
Figure 39 illustrates the food groups consumed by children 6–23 months.195 Most children 6–23 months in the RFSA areas consume breastmilk and grains, roots, and tubers. Many children in Marsabit, Isiolo and Samburu also consume dairy products. Generally, few children 6–23 months in the RFSA areas consume any of the following food groups: vitamin-A rich fruits and vegetables, other fruits and vegetables, legumes and nuts, animal protein, or eggs.
190 Radday A, Young H, and Marshak A. 2021. A Preliminary Stakeholder Analysis for Addressing Global Acute Malnutrition in the Kenyan ASALs. 191 Marshak, A. 2021. Nawiri Desk Study: Drivers of acute malnutrition in the Kenya arid and semi-arid lands. 192 Radday A, Young H, and Marshak A. 2021. A Preliminary Stakeholder Analysis for Addressing Global Acute Malnutrition in the Kenyan ASALs. 193MDD-C indicator estimates are based on the following sample sizes of children 6-23 months: Marsabit, 255; Isiolo, 222; Turkana, 235; Samburu, 195. 194 For additional details on MDD-C by sex, see Annex E1. 195 See Annex F, Table A6.17.
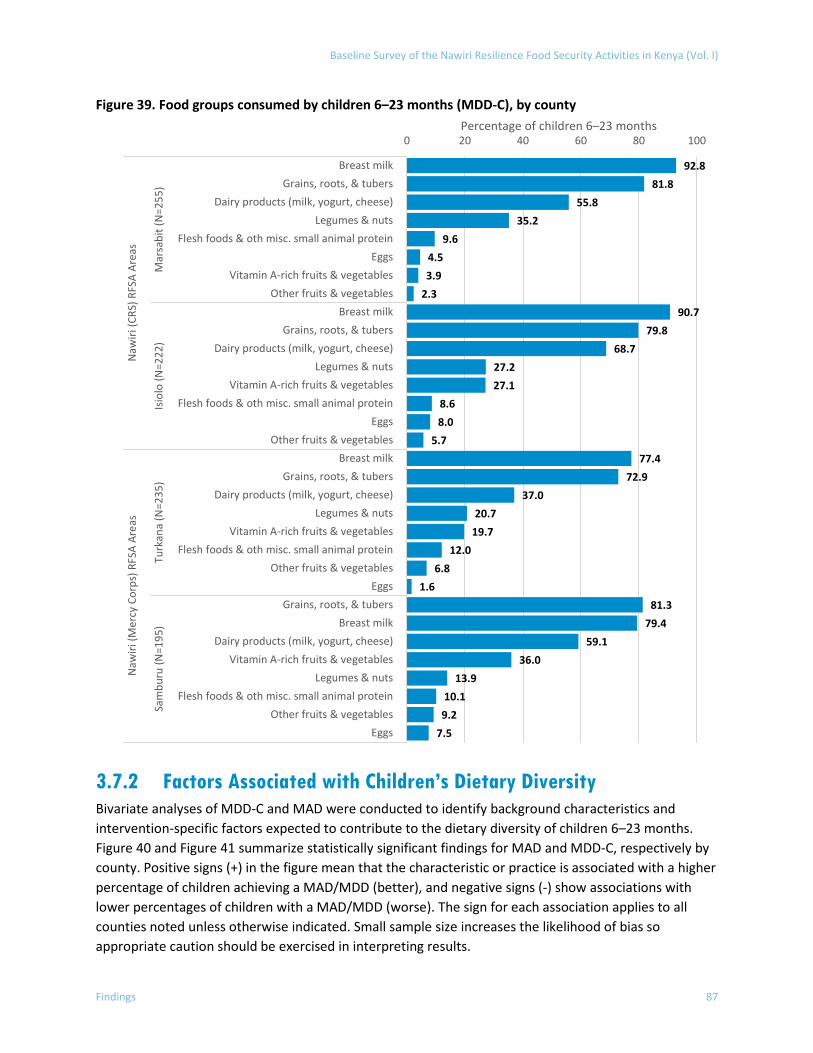
Baseline Survey of the Nawiri Resilience Food Security Activities in Kenya (Vol. I)
Findings 87
Figure 39. Food groups consumed by children 6–23 months (MDD-C), by county
3.7.2 Factors Associated with Children’s Dietary Diversity Bivariate analyses of MDD-C and MAD were conducted to identify background characteristics and intervention-specific factors expected to contribute to the dietary diversity of children 6–23 months. Figure 40 and Figure 41 summarize statistically significant findings for MAD and MDD-C, respectively by county. Positive signs (+) in the figure mean that the characteristic or practice is associated with a higher percentage of children achieving a MAD/MDD (better), and negative signs (-) show associations with lower percentages of children with a MAD/MDD (worse). The sign for each association applies to all counties noted unless otherwise indicated. Small sample size increases the likelihood of bias so appropriate caution should be exercised in interpreting results.
92.881.8
55.835.2
9.64.53.9
2.390.7
79.868.7
27.227.1
8.68.0
5.777.4
72.937.0
20.719.7
12.06.8
1.681.3
79.459.1
36.013.9
10.19.2
7.5
0 20 40 60 80 100
Breast milkGrains, roots, & tubers
Dairy products (milk, yogurt, cheese)Legumes & nuts
Flesh foods & oth misc. small animal proteinEggs
Vitamin A-rich fruits & vegetablesOther fruits & vegetables
Breast milkGrains, roots, & tubers
Dairy products (milk, yogurt, cheese)Legumes & nuts
Vitamin A-rich fruits & vegetablesFlesh foods & oth misc. small animal protein
EggsOther fruits & vegetables
Breast milkGrains, roots, & tubers
Dairy products (milk, yogurt, cheese)Legumes & nuts
Vitamin A-rich fruits & vegetablesFlesh foods & oth misc. small animal protein
Other fruits & vegetablesEggs
Grains, roots, & tubersBreast milk
Dairy products (milk, yogurt, cheese)Vitamin A-rich fruits & vegetables
Legumes & nutsFlesh foods & oth misc. small animal protein
Other fruits & vegetablesEggs
Mar
sabi
t (N
=255
)Is
iolo
(N=2
22)
Turk
ana
(N=2
35)
Sam
buru
(N=1
95)
Naw
iri (C
RS) R
FSA
Area
sN
awiri
(Mer
cy C
orps
) RFS
A Ar
eas
Percentage of children 6–23 months
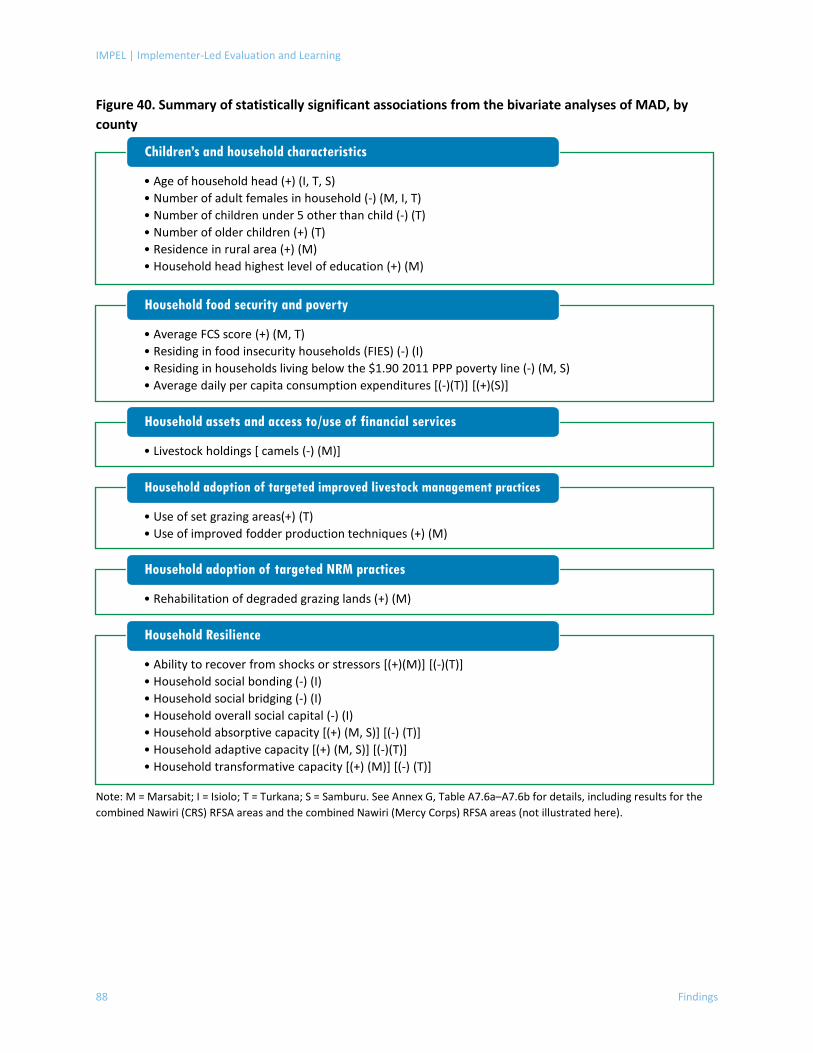
IMPEL | Implementer-Led Evaluation and Learning
88 Findings
Figure 40. Summary of statistically significant associations from the bivariate analyses of MAD, by county
Note: M = Marsabit; I = Isiolo; T = Turkana; S = Samburu. See Annex G, Table A7.6a–A7.6b for details, including results for the combined Nawiri (CRS) RFSA areas and the combined Nawiri (Mercy Corps) RFSA areas (not illustrated here).
• Age of household head (+) (I, T, S)• Number of adult females in household (-) (M, I, T)• Number of children under 5 other than child (-) (T)• Number of older children (+) (T)• Residence in rural area (+) (M)• Household head highest level of education (+) (M)
Children’s and household characteristics
• Average FCS score (+) (M, T)• Residing in food insecurity households (FIES) (-) (I)• Residing in households living below the $1.90 2011 PPP poverty line (-) (M, S)• Average daily per capita consumption expenditures [(-)(T)] [(+)(S)]
Household food security and poverty
• Livestock holdings [ camels (-) (M)]
Household assets and access to/use of financial services
• Use of set grazing areas(+) (T)• Use of improved fodder production techniques (+) (M)
Household adoption of targeted improved livestock management practices
• Rehabilitation of degraded grazing lands (+) (M)
Household adoption of targeted NRM practices
• Ability to recover from shocks or stressors [(+)(M)] [(-)(T)]• Household social bonding (-) (I)• Household social bridging (-) (I)• Household overall social capital (-) (I)• Household absorptive capacity [(+) (M, S)] [(-) (T)]• Household adaptive capacity [(+) (M, S)] [(-)(T)]• Household transformative capacity [(+) (M)] [(-) (T)]
Household Resilience
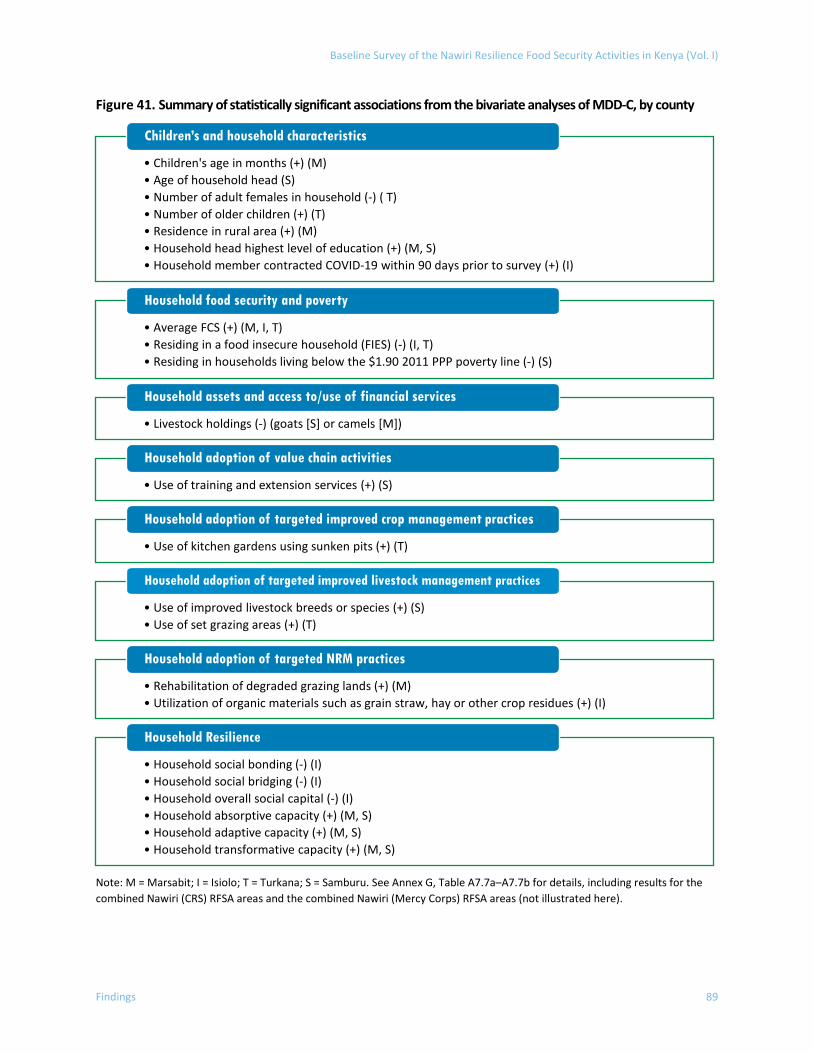
Baseline Survey of the Nawiri Resilience Food Security Activities in Kenya (Vol. I)
Findings 89
Figure 41. Summary of statistically significant associations from the bivariate analyses of MDD-C, by county
Note: M = Marsabit; I = Isiolo; T = Turkana; S = Samburu. See Annex G, Table A7.7a–A7.7b for details, including results for the combined Nawiri (CRS) RFSA areas and the combined Nawiri (Mercy Corps) RFSA areas (not illustrated here).
• Children's age in months (+) (M)• Age of household head (S)• Number of adult females in household (-) ( T)• Number of older children (+) (T)• Residence in rural area (+) (M)• Household head highest level of education (+) (M, S)• Household member contracted COVID-19 within 90 days prior to survey (+) (I)
Children’s and household characteristics
• Average FCS (+) (M, I, T)• Residing in a food insecure household (FIES) (-) (I, T)• Residing in households living below the $1.90 2011 PPP poverty line (-) (S)
Household food security and poverty
• Livestock holdings (-) (goats [S] or camels [M])
Household assets and access to/use of financial services
• Use of training and extension services (+) (S)
Household adoption of value chain activities
• Use of kitchen gardens using sunken pits (+) (T)
Household adoption of targeted improved crop management practices
• Use of improved livestock breeds or species (+) (S)• Use of set grazing areas (+) (T)
Household adoption of targeted improved livestock management practices
• Rehabilitation of degraded grazing lands (+) (M)• Utilization of organic materials such as grain straw, hay or other crop residues (+) (I)
Household adoption of targeted NRM practices
• Household social bonding (-) (I)• Household social bridging (-) (I)• Household overall social capital (-) (I)• Household absorptive capacity (+) (M, S)• Household adaptive capacity (+) (M, S)• Household transformative capacity (+) (M, S)
Household Resilience
IMPEL | Implementer-Led Evaluation and Learning
90 Findings
Generally, no associations were found between the prevalence of MAD or MDD-C and any of the targeted value chain activities, improved crop management practices, improved post-harvest storage and handling practices, or access to financial services. Similarly, no association was found between MAD and COVID-19 impacts on household food security or livelihoods. Restricting the analytical sample to children with observations on all variables resulted in a reduction in sample size and potentially the exclusion of children from households who applied those practices or accessed those services. Secondary literature provides a wealth of information regarding factors influencing children’s diets in the RFSA areas. This section provides a brief sketch of the main issues raised.
Child Feeding Practices The recent cost-of-diet study conducted by the Nawiri Consortium found that inadequate child feeding practices are most likely the limitation to a nutritious diet for a child aged 12 to 23 months.196 This conclusion was informed and supported by the 2017 MIYCN study, which indicated barriers to implementing appropriate feeding practices regularly, despite high overall knowledge and positive perceptions of recommended MIYCN messages. The main barriers were household food insecurity and women’s workload, along with a lack of responsive complementary feeding of young children, and a lack of knowledge of how to prepare nutritious foods for infants and young children. This section explores some of these issues in further detail.
Complementary Feeding Practices Formative research in Marsabit found the main constraints to the accessibility and utilization of complementary foods to be inadequate household income, lack of food, and cultural barriers, and it was suggested that these constraints are shared by the other RFSA areas. That research also reported that complementary feeding practices were suboptimal in Samburu (e.g., 48% of infants aged 6–8 months received complementary foods), though worse in Turkana (36% for the same indicator), with a corresponding trend for minimum dietary diversity (i.e., higher diversity in Samburu). 197 In both Samburu and Turkana, ease of food preparation was found to be an important factor for mothers in determining what to feed their children, given women’s caregiving and domestic workload, including herding livestock and obtaining water. Indeed, one study identified addressing water insecurity in the ASALs as critical to reducing undernutrition, with the most vulnerable being pastoralist communities that have settled, and pastoralists with large numbers of livestock. 198
Women’s Workload Time poverty—women’s workload—came up repeatedly in the Nawiri formative research as a challenge to implementing good caregiving practices and affecting maternal and child nutrition.199 , 200, 201, 202 A gender study in Isiolo and Marsabit found that women spend 14–17 hours a day on labor activities versus 10–15 hours for men, and that women work 2–4 hours a day more than men in both wet and dry
196 Mercy Corps USAID Nawiri Consortium. 2021a. Cost of Diet Study (Turkana). 197 USAID. 2021a. Maternal, Infant and Young Child Nutrition (MIYCN) Desk Review. 198 Balfour, N., J. Obando, and D. Gohil. Dimensions of water insecurity in pastoralist households in Kenya. Waterlines, 2020. 39(1): p. 4-43. As cited in USAID. 2021a. Maternal, Infant and Young Child Nutrition (MIYCN) Desk Review. 199 Marshak, A. 2021. Nawiri Desk Study: Drivers of acute malnutrition in the Kenya arid and semi-arid lands. 200 Mercy Corps USAID Nawiri Consortium. 2021a. Cost of Diet Study (Turkana). 201 USAID. 2021a. Maternal, Infant and Young Child Nutrition (MIYCN) Desk Review. 202 CRS. 2021. USAID Nawiri Gender Youth and Social Dynamics Analysis … in Isiolo and Marsabit Counties.
Baseline Survey of the Nawiri Resilience Food Security Activities in Kenya (Vol. I)
Findings 91
seasons. The same study found that while women’s workload and time poverty are increasing for multiple reasons, many of these tied to gendered roles, at the same time young men are increasingly becoming involved in childcare with possible positive nutrition outcomes for children and mothers. 203
Perceptions of the Causes of Malnutrition A recent stakeholder survey about perspectives and knowledge about persistent Global Acute Malnutrition (GAM) in the ASALs, presents an interesting finding regarding perceptions of the relationship of food intake to malnutrition. The survey targeted professionals whose work directly or indirectly affects or influences one or more of the drivers of GAM in the ASALs, and thus spanned sectors (health, nutrition, WASH, NRM, agriculture) and organizational types (international NGOs, national NGOs, research organizations, Kenyan government). The study found a “food-first” bias in respondent’s views regarding the drivers of malnutrition: when asked directly whether food insecurity is the main driver of malnutrition, 85% of respondents agreed. The research notes that malnutrition is also caused by disease, and its underlying causes are more complex: household food security, caregiving behaviors and the care environment, and access to health care and public health services. In addition, respondents did not raise the issue of seasonality, which is an important feature of the ASALs that influences household food security and its many dimensions. The study recommended more work at the institutional level to help practitioners deepen their understanding of the causal pathways affecting GAM.204
In addition, the common assumption of a positive correlation between poverty and malnutrition bears ongoing re-examination. A desk review of research on child malnutrition in the ASALs found that wealth was consistently assumed, but inconsistently associated with child nutrition outcomes. One study, looking at data over 16 years, found that the role of wealth has diminished over time in relation to stunting. 205 The desk review also noted that asset or livestock ownership are not necessarily a sufficient proxy for wealth in pastoral communities, citing a livelihood systems desk study that highlighted, “In pastoralist communities in Turkana, poverty is measured by both livestock and people, and true impoverishment only exists for those with a deficit in both. Households that experience significant livestock loss can rely on their social connections, networks, and expectations of reciprocity to recover and rebuild. It is only those with neither livestock nor connections that are truly vulnerable.206
Access to Food Formative research in Isiolo found that women prefer livestock products to purchased foods and consider the former more nutritious, especially for children. Research participants explained that they feed their children meat and milk when available, resorting to non-livestock foods only during the dry season. While women in the Isiolo study frequently mentioned the importance of fruits and vegetables to their health, they explained that the high cost of transport to markets where they could obtain these products was a barrier to purchase; this is consistent with their attribution of lack of income as the
203 CRS. 2021. USAID Nawiri Gender Youth and Social Dynamics Analysis … in Isiolo and Marsabit Counties. 204 Radday A, Young H, and Marshak A. 2021. A Preliminary Stakeholder Analysis for Addressing Global Acute Malnutrition in the Kenyan ASALs. 205 Marshak, A. 2021. Nawiri Desk Study: Drivers of acute malnutrition in the Kenya arid and semi-arid lands. 206 Stites, E. 2021. Nawiri desk study: Livelihood systems in Isiolo and Marsabit County. Nawiri program, Nairobi. Cited in Marshak, A. 2021. Nawiri Desk Study: Drivers of acute malnutrition in the Kenya arid and semi-arid lands.
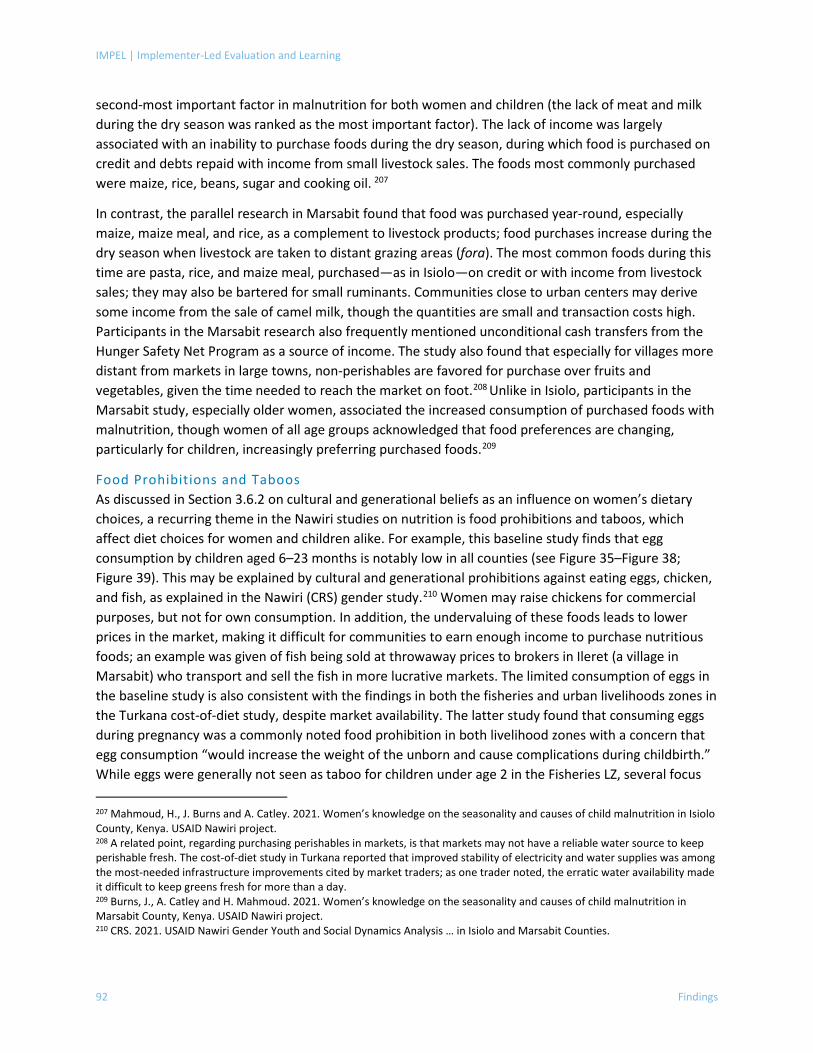
IMPEL | Implementer-Led Evaluation and Learning
92 Findings
second-most important factor in malnutrition for both women and children (the lack of meat and milk during the dry season was ranked as the most important factor). The lack of income was largely associated with an inability to purchase foods during the dry season, during which food is purchased on credit and debts repaid with income from small livestock sales. The foods most commonly purchased were maize, rice, beans, sugar and cooking oil. 207
In contrast, the parallel research in Marsabit found that food was purchased year-round, especially maize, maize meal, and rice, as a complement to livestock products; food purchases increase during the dry season when livestock are taken to distant grazing areas (fora). The most common foods during this time are pasta, rice, and maize meal, purchased—as in Isiolo—on credit or with income from livestock sales; they may also be bartered for small ruminants. Communities close to urban centers may derive some income from the sale of camel milk, though the quantities are small and transaction costs high. Participants in the Marsabit research also frequently mentioned unconditional cash transfers from the Hunger Safety Net Program as a source of income. The study also found that especially for villages more distant from markets in large towns, non-perishables are favored for purchase over fruits and vegetables, given the time needed to reach the market on foot.208 Unlike in Isiolo, participants in the Marsabit study, especially older women, associated the increased consumption of purchased foods with malnutrition, though women of all age groups acknowledged that food preferences are changing, particularly for children, increasingly preferring purchased foods.209
Food Prohibitions and Taboos As discussed in Section 3.6.2 on cultural and generational beliefs as an influence on women’s dietary choices, a recurring theme in the Nawiri studies on nutrition is food prohibitions and taboos, which affect diet choices for women and children alike. For example, this baseline study finds that egg consumption by children aged 6–23 months is notably low in all counties (see Figure 35–Figure 38; Figure 39). This may be explained by cultural and generational prohibitions against eating eggs, chicken, and fish, as explained in the Nawiri (CRS) gender study.210 Women may raise chickens for commercial purposes, but not for own consumption. In addition, the undervaluing of these foods leads to lower prices in the market, making it difficult for communities to earn enough income to purchase nutritious foods; an example was given of fish being sold at throwaway prices to brokers in Ileret (a village in Marsabit) who transport and sell the fish in more lucrative markets. The limited consumption of eggs in the baseline study is also consistent with the findings in both the fisheries and urban livelihoods zones in the Turkana cost-of-diet study, despite market availability. The latter study found that consuming eggs during pregnancy was a commonly noted food prohibition in both livelihood zones with a concern that egg consumption “would increase the weight of the unborn and cause complications during childbirth.” While eggs were generally not seen as taboo for children under age 2 in the Fisheries LZ, several focus 207 Mahmoud, H., J. Burns and A. Catley. 2021. Women’s knowledge on the seasonality and causes of child malnutrition in Isiolo County, Kenya. USAID Nawiri project. 208 A related point, regarding purchasing perishables in markets, is that markets may not have a reliable water source to keep perishable fresh. The cost-of-diet study in Turkana reported that improved stability of electricity and water supplies was among the most-needed infrastructure improvements cited by market traders; as one trader noted, the erratic water availability made it difficult to keep greens fresh for more than a day. 209 Burns, J., A. Catley and H. Mahmoud. 2021. Women’s knowledge on the seasonality and causes of child malnutrition in Marsabit County, Kenya. USAID Nawiri project. 210 CRS. 2021. USAID Nawiri Gender Youth and Social Dynamics Analysis … in Isiolo and Marsabit Counties.
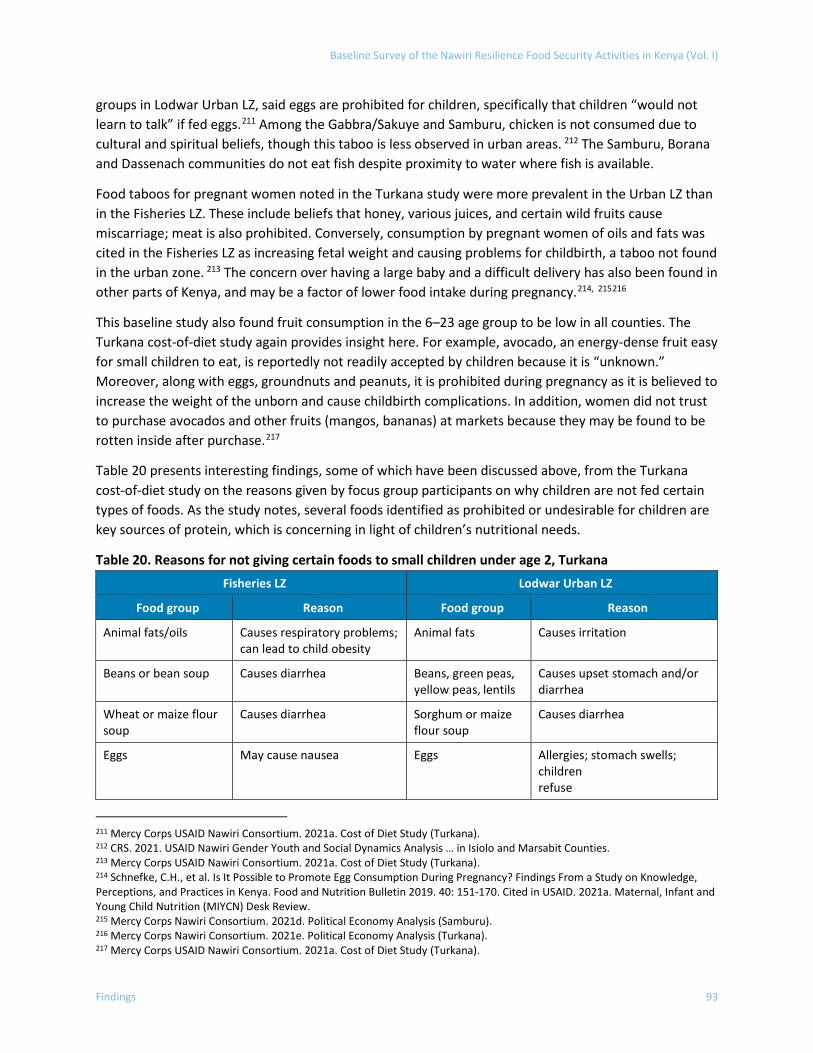
Baseline Survey of the Nawiri Resilience Food Security Activities in Kenya (Vol. I)
Findings 93
groups in Lodwar Urban LZ, said eggs are prohibited for children, specifically that children “would not learn to talk” if fed eggs.211 Among the Gabbra/Sakuye and Samburu, chicken is not consumed due to cultural and spiritual beliefs, though this taboo is less observed in urban areas. 212 The Samburu, Borana and Dassenach communities do not eat fish despite proximity to water where fish is available.
Food taboos for pregnant women noted in the Turkana study were more prevalent in the Urban LZ than in the Fisheries LZ. These include beliefs that honey, various juices, and certain wild fruits cause miscarriage; meat is also prohibited. Conversely, consumption by pregnant women of oils and fats was cited in the Fisheries LZ as increasing fetal weight and causing problems for childbirth, a taboo not found in the urban zone. 213 The concern over having a large baby and a difficult delivery has also been found in other parts of Kenya, and may be a factor of lower food intake during pregnancy.214, 215216
This baseline study also found fruit consumption in the 6–23 age group to be low in all counties. The Turkana cost-of-diet study again provides insight here. For example, avocado, an energy-dense fruit easy for small children to eat, is reportedly not readily accepted by children because it is “unknown.” Moreover, along with eggs, groundnuts and peanuts, it is prohibited during pregnancy as it is believed to increase the weight of the unborn and cause childbirth complications. In addition, women did not trust to purchase avocados and other fruits (mangos, bananas) at markets because they may be found to be rotten inside after purchase.217
Table 20 presents interesting findings, some of which have been discussed above, from the Turkana cost-of-diet study on the reasons given by focus group participants on why children are not fed certain types of foods. As the study notes, several foods identified as prohibited or undesirable for children are key sources of protein, which is concerning in light of children’s nutritional needs.
Table 20. Reasons for not giving certain foods to small children under age 2, Turkana Fisheries LZ Lodwar Urban LZ
Food group Reason Food group Reason
Animal fats/oils Causes respiratory problems; can lead to child obesity
Animal fats Causes irritation
Beans or bean soup Causes diarrhea Beans, green peas, yellow peas, lentils
Causes upset stomach and/or diarrhea
Wheat or maize flour soup
Causes diarrhea Sorghum or maize flour soup
Causes diarrhea
Eggs May cause nausea Eggs Allergies; stomach swells; children refuse
211 Mercy Corps USAID Nawiri Consortium. 2021a. Cost of Diet Study (Turkana). 212 CRS. 2021. USAID Nawiri Gender Youth and Social Dynamics Analysis … in Isiolo and Marsabit Counties. 213 Mercy Corps USAID Nawiri Consortium. 2021a. Cost of Diet Study (Turkana). 214 Schnefke, C.H., et al. Is It Possible to Promote Egg Consumption During Pregnancy? Findings From a Study on Knowledge, Perceptions, and Practices in Kenya. Food and Nutrition Bulletin 2019. 40: 151-170. Cited in USAID. 2021a. Maternal, Infant and Young Child Nutrition (MIYCN) Desk Review. 215 Mercy Corps Nawiri Consortium. 2021d. Political Economy Analysis (Samburu). 216 Mercy Corps Nawiri Consortium. 2021e. Political Economy Analysis (Turkana). 217 Mercy Corps USAID Nawiri Consortium. 2021a. Cost of Diet Study (Turkana).
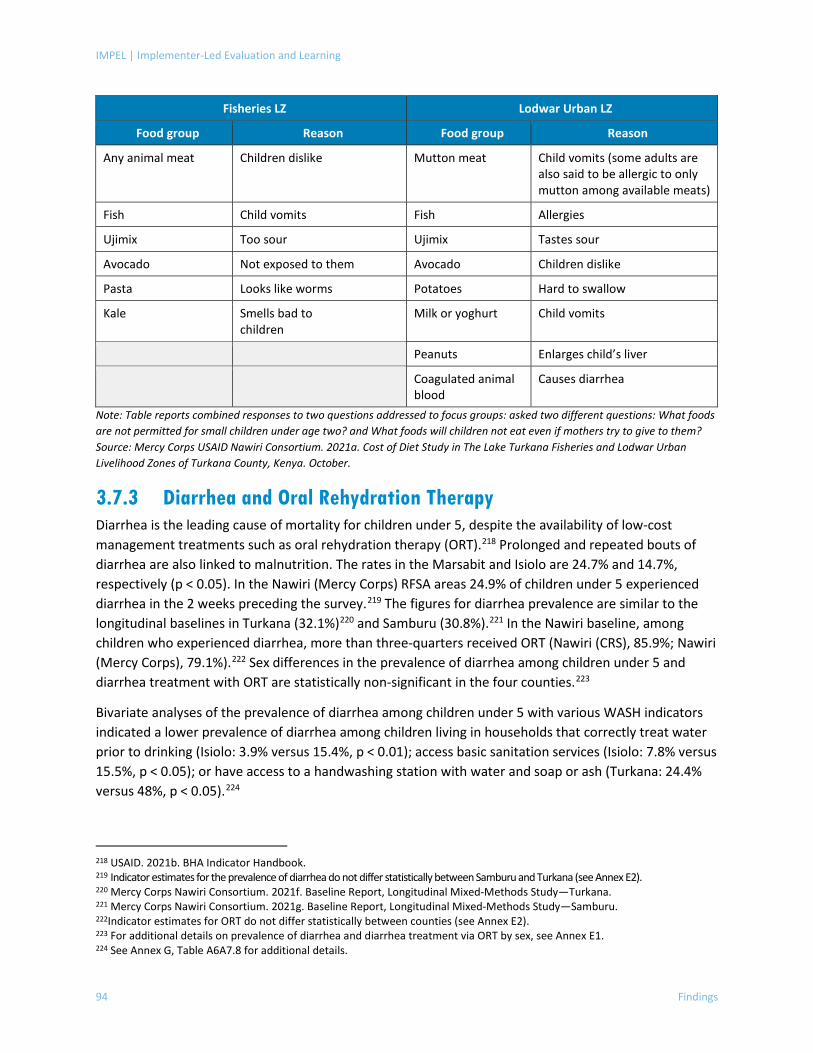
IMPEL | Implementer-Led Evaluation and Learning
94 Findings
Fisheries LZ Lodwar Urban LZ
Food group Reason Food group Reason
Any animal meat Children dislike Mutton meat Child vomits (some adults are also said to be allergic to only mutton among available meats)
Fish Child vomits Fish Allergies
Ujimix Too sour Ujimix Tastes sour
Avocado Not exposed to them Avocado Children dislike
Pasta Looks like worms Potatoes Hard to swallow
Kale Smells bad to children
Milk or yoghurt Child vomits
Peanuts Enlarges child’s liver
Coagulated animal blood
Causes diarrhea
Note: Table reports combined responses to two questions addressed to focus groups: asked two different questions: What foods are not permitted for small children under age two? and What foods will children not eat even if mothers try to give to them? Source: Mercy Corps USAID Nawiri Consortium. 2021a. Cost of Diet Study in The Lake Turkana Fisheries and Lodwar Urban Livelihood Zones of Turkana County, Kenya. October.
3.7.3 Diarrhea and Oral Rehydration Therapy Diarrhea is the leading cause of mortality for children under 5, despite the availability of low-cost management treatments such as oral rehydration therapy (ORT).218 Prolonged and repeated bouts of diarrhea are also linked to malnutrition. The rates in the Marsabit and Isiolo are 24.7% and 14.7%, respectively (p < 0.05). In the Nawiri (Mercy Corps) RFSA areas 24.9% of children under 5 experienced diarrhea in the 2 weeks preceding the survey.219 The figures for diarrhea prevalence are similar to the longitudinal baselines in Turkana (32.1%)220 and Samburu (30.8%).221 In the Nawiri baseline, among children who experienced diarrhea, more than three-quarters received ORT (Nawiri (CRS), 85.9%; Nawiri (Mercy Corps), 79.1%).222 Sex differences in the prevalence of diarrhea among children under 5 and diarrhea treatment with ORT are statistically non-significant in the four counties.223
Bivariate analyses of the prevalence of diarrhea among children under 5 with various WASH indicators indicated a lower prevalence of diarrhea among children living in households that correctly treat water prior to drinking (Isiolo: 3.9% versus 15.4%, p < 0.01); access basic sanitation services (Isiolo: 7.8% versus 15.5%, p < 0.05); or have access to a handwashing station with water and soap or ash (Turkana: 24.4% versus 48%, p < 0.05).224
218 USAID. 2021b. BHA Indicator Handbook. 219 Indicator estimates for the prevalence of diarrhea do not differ statistically between Samburu and Turkana (see Annex E2). 220 Mercy Corps Nawiri Consortium. 2021f. Baseline Report, Longitudinal Mixed-Methods Study—Turkana. 221 Mercy Corps Nawiri Consortium. 2021g. Baseline Report, Longitudinal Mixed-Methods Study—Samburu. 222Indicator estimates for ORT do not differ statistically between counties (see Annex E2). 223 For additional details on prevalence of diarrhea and diarrhea treatment via ORT by sex, see Annex E1. 224 See Annex G, Table A6A7.8 for additional details.
Baseline Survey of the Nawiri Resilience Food Security Activities in Kenya (Vol. I)
Findings 95
3.8 Gender This section discusses gender findings related to cash-earning, access to credit, and participation in community groups. The baseline survey collected information on women and men’s participation in cash-earning activities, decision-making over self-earned cash and spouse’s self-earned-cash, group membership, and access to and decisions over household credit. Cash can be used toward making investments in productivity-enhancing inputs and for the purchase of diverse and more nutritious food. For women, partaking in cash-earning activities can contribute toward empowerment and gender equality, for example by giving women a greater say in the allocation of household resources and other decision-making regarding their own well-being and that of their children. Access to credit, like participation in cash-earning activities, provides access to productive resources and is important for gender equality and women’s economic empowerment.225
Participation in community groups facilitates access to information and resources. By strengthening social networks and community bonds, participation in community groups also enhances the resilience of households and communities in the face of shocks and stressors.
Questions on cash-earning activities, credit and community group participation were asked to all women at least 15 years of age and their partner.
3.8.1 Gender and Cash-Earning Activities In this survey, a household member is considered to participate in cash-earning activities if they are paid for their work in cash or a combination of cash and in-kind. Individuals who are unpaid or paid in-kind- only are excluded. Work includes employment in the formal and/or informal sectors, including full-time, part-time, or seasonal work performed within and/or outside the home.226 Care work, such as looking after children and other household members, is not included. The survey asked all household members aged 15 years and older about their work participation in the past 12 months. However, the indicator on cash-earning is calculated based on the response of women and men in a union rather than all cash earners.227
225 For additional details, refer to USAID, 2021b. BHA Indicator Handbook. 226 Examples of cash-earning activities include agricultural daily wage labor, off-farm daily wage labor, sale of goods produced or processed outside the home or at the home, homestead garden or farm, petty trading, cash for work, food for work, conditional cash transfers and/or productive safety net programs. 227 Refer to Section 3.1 and Annex F, Table 6.1 for estimates of the percentage and number of cash earners.
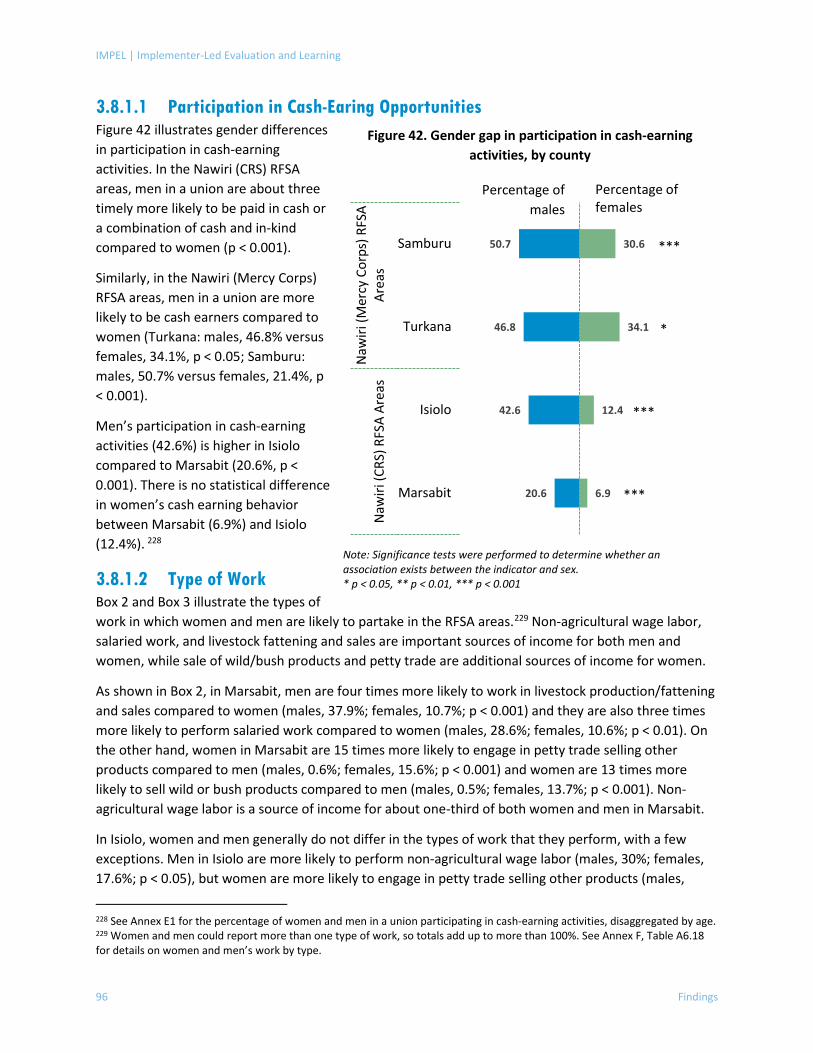
IMPEL | Implementer-Led Evaluation and Learning
96 Findings
3.8.1.1 Participation in Cash-Earing Opportunities Figure 42 illustrates gender differences in participation in cash-earning activities. In the Nawiri (CRS) RFSA areas, men in a union are about three timely more likely to be paid in cash or a combination of cash and in-kind compared to women (p < 0.001).
Similarly, in the Nawiri (Mercy Corps) RFSA areas, men in a union are more likely to be cash earners compared to women (Turkana: males, 46.8% versus females, 34.1%, p < 0.05; Samburu: males, 50.7% versus females, 21.4%, p < 0.001).
Men’s participation in cash-earning activities (42.6%) is higher in Isiolo compared to Marsabit (20.6%, p < 0.001). There is no statistical difference in women’s cash earning behavior between Marsabit (6.9%) and Isiolo (12.4%). 228
3.8.1.2 Type of Work Box 2 and Box 3 illustrate the types of work in which women and men are likely to partake in the RFSA areas.229 Non-agricultural wage labor, salaried work, and livestock fattening and sales are important sources of income for both men and women, while sale of wild/bush products and petty trade are additional sources of income for women.
As shown in Box 2, in Marsabit, men are four times more likely to work in livestock production/fattening and sales compared to women (males, 37.9%; females, 10.7%; p < 0.001) and they are also three times more likely to perform salaried work compared to women (males, 28.6%; females, 10.6%; p < 0.01). On the other hand, women in Marsabit are 15 times more likely to engage in petty trade selling other products compared to men (males, 0.6%; females, 15.6%; p < 0.001) and women are 13 times more likely to sell wild or bush products compared to men (males, 0.5%; females, 13.7%; p < 0.001). Non-agricultural wage labor is a source of income for about one-third of both women and men in Marsabit.
In Isiolo, women and men generally do not differ in the types of work that they perform, with a few exceptions. Men in Isiolo are more likely to perform non-agricultural wage labor (males, 30%; females, 17.6%; p < 0.05), but women are more likely to engage in petty trade selling other products (males,
228 See Annex E1 for the percentage of women and men in a union participating in cash-earning activities, disaggregated by age. 229 Women and men could report more than one type of work, so totals add up to more than 100%. See Annex F, Table A6.18 for details on women and men’s work by type.
Figure 42. Gender gap in participation in cash-earning activities, by county
Note: Significance tests were performed to determine whether an association exists between the indicator and sex. * p < 0.05, ** p < 0.01, *** p < 0.001
20.6
42.6
46.8
50.7
6.9
12.4
34.1
30.6
Marsabit
Isiolo
Turkana
Samburu
Naw
iri (C
RS) R
FSA
Area
sN
awiri
(Mer
cy C
orps
) RFS
AAr
eas
Percentage of females
Percentage of males
***
***
***
*
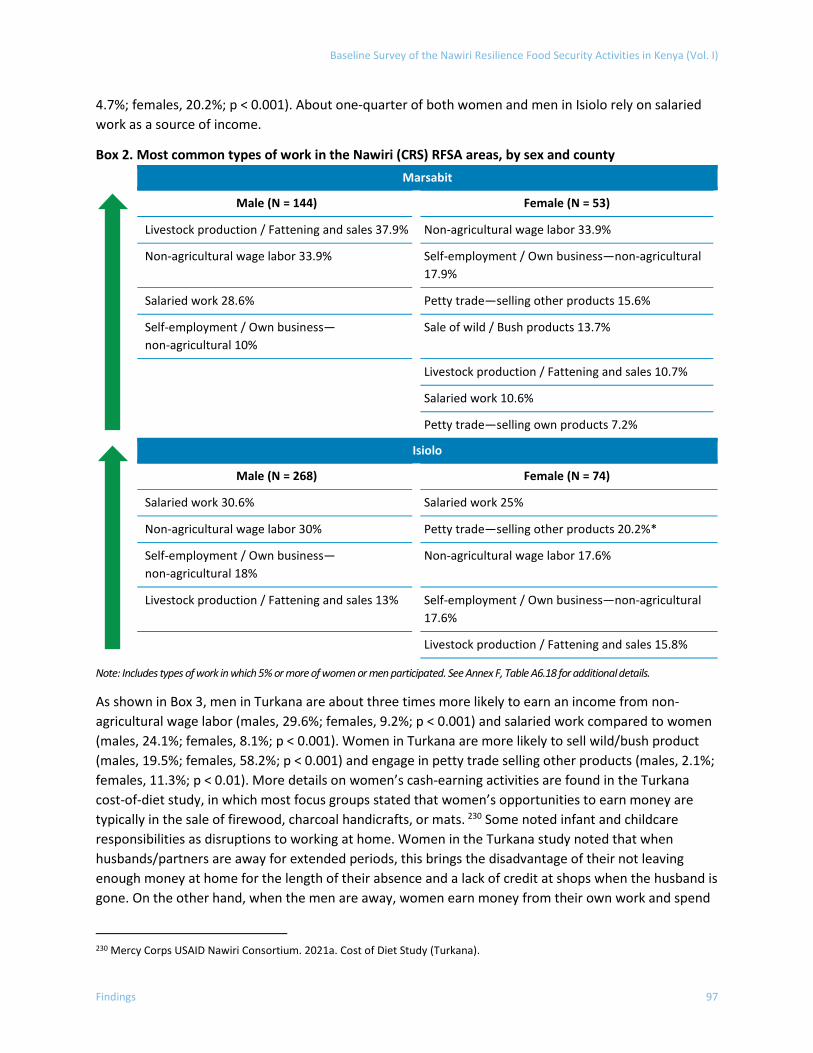
Baseline Survey of the Nawiri Resilience Food Security Activities in Kenya (Vol. I)
Findings 97
4.7%; females, 20.2%; p < 0.001). About one-quarter of both women and men in Isiolo rely on salaried work as a source of income.
Box 2. Most common types of work in the Nawiri (CRS) RFSA areas, by sex and county
Marsabit
Male (N = 144) Female (N = 53)
Livestock production / Fattening and sales 37.9% Non-agricultural wage labor 33.9%
Non-agricultural wage labor 33.9% Self-employment / Own business—non-agricultural 17.9%
Salaried work 28.6% Petty trade—selling other products 15.6%
Self-employment / Own business—non-agricultural 10%
Sale of wild / Bush products 13.7%
Livestock production / Fattening and sales 10.7%
Salaried work 10.6%
Petty trade—selling own products 7.2%
Isiolo
Male (N = 268) Female (N = 74)
Salaried work 30.6% Salaried work 25%
Non-agricultural wage labor 30% Petty trade—selling other products 20.2%*
Self-employment / Own business—non-agricultural 18%
Non-agricultural wage labor 17.6%
Livestock production / Fattening and sales 13% Self-employment / Own business—non-agricultural 17.6%
Livestock production / Fattening and sales 15.8%
Note: Includes types of work in which 5% or more of women or men participated. See Annex F, Table A6.18 for additional details.
As shown in Box 3, men in Turkana are about three times more likely to earn an income from non-agricultural wage labor (males, 29.6%; females, 9.2%; p < 0.001) and salaried work compared to women (males, 24.1%; females, 8.1%; p < 0.001). Women in Turkana are more likely to sell wild/bush product (males, 19.5%; females, 58.2%; p < 0.001) and engage in petty trade selling other products (males, 2.1%; females, 11.3%; p < 0.01). More details on women’s cash-earning activities are found in the Turkana cost-of-diet study, in which most focus groups stated that women’s opportunities to earn money are typically in the sale of firewood, charcoal handicrafts, or mats. 230 Some noted infant and childcare responsibilities as disruptions to working at home. Women in the Turkana study noted that when husbands/partners are away for extended periods, this brings the disadvantage of their not leaving enough money at home for the length of their absence and a lack of credit at shops when the husband is gone. On the other hand, when the men are away, women earn money from their own work and spend
230 Mercy Corps USAID Nawiri Consortium. 2021a. Cost of Diet Study (Turkana).
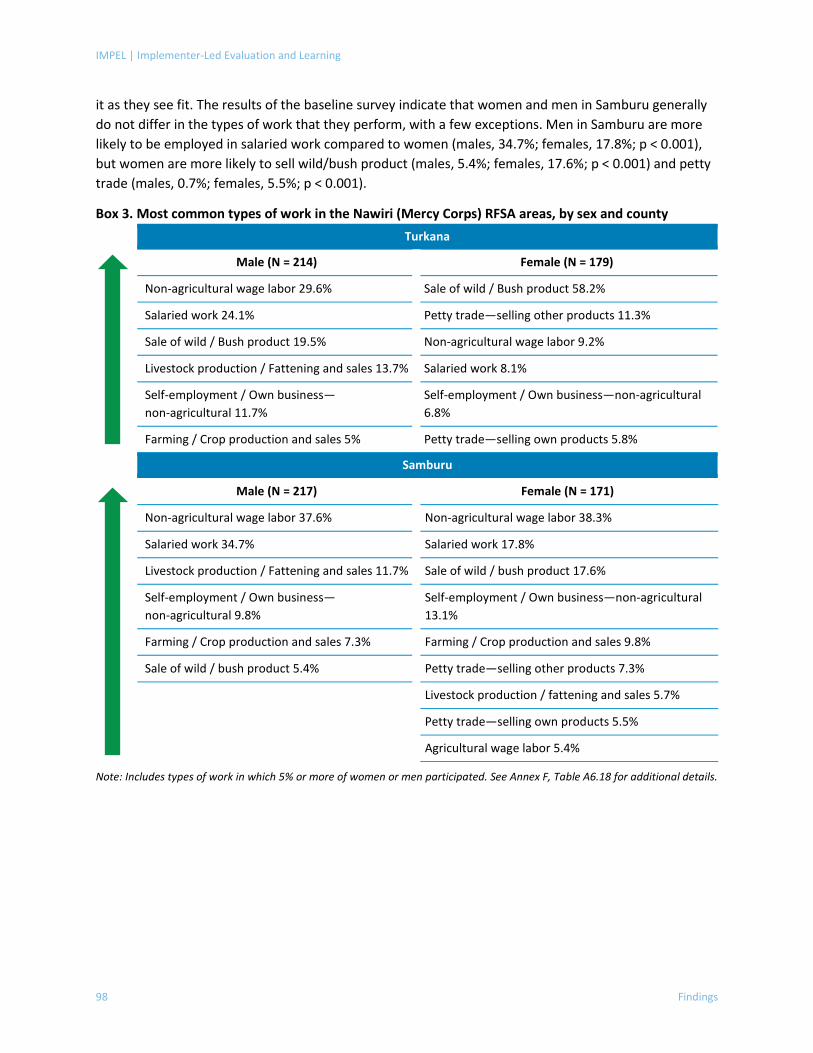
IMPEL | Implementer-Led Evaluation and Learning
98 Findings
it as they see fit. The results of the baseline survey indicate that women and men in Samburu generally do not differ in the types of work that they perform, with a few exceptions. Men in Samburu are more likely to be employed in salaried work compared to women (males, 34.7%; females, 17.8%; p < 0.001), but women are more likely to sell wild/bush product (males, 5.4%; females, 17.6%; p < 0.001) and petty trade (males, 0.7%; females, 5.5%; p < 0.001).
Box 3. Most common types of work in the Nawiri (Mercy Corps) RFSA areas, by sex and county
Turkana
Male (N = 214) Female (N = 179)
Non-agricultural wage labor 29.6% Sale of wild / Bush product 58.2%
Salaried work 24.1% Petty trade—selling other products 11.3%
Sale of wild / Bush product 19.5% Non-agricultural wage labor 9.2%
Livestock production / Fattening and sales 13.7% Salaried work 8.1%
Self-employment / Own business—non-agricultural 11.7%
Self-employment / Own business—non-agricultural 6.8%
Farming / Crop production and sales 5% Petty trade—selling own products 5.8%
Samburu
Male (N = 217) Female (N = 171)
Non-agricultural wage labor 37.6% Non-agricultural wage labor 38.3%
Salaried work 34.7% Salaried work 17.8%
Livestock production / Fattening and sales 11.7% Sale of wild / bush product 17.6%
Self-employment / Own business—non-agricultural 9.8%
Self-employment / Own business—non-agricultural 13.1%
Farming / Crop production and sales 7.3% Farming / Crop production and sales 9.8%
Sale of wild / bush product 5.4% Petty trade—selling other products 7.3%
Livestock production / fattening and sales 5.7%
Petty trade—selling own products 5.5%
Agricultural wage labor 5.4%
Note: Includes types of work in which 5% or more of women or men participated. See Annex F, Table A6.18 for additional details.
Baseline Survey of the Nawiri Resilience Food Security Activities in Kenya (Vol. I)
Findings 99
3.8.1.3 Decision-Making on Self-Earned Cash and Spouses Self-Earned Cash Estimates of women’s and men’s decision-making on self-earned cash are self-reported. 231 In addition, women were asked about their participation in spouse’s self-earned cash.232 Most women in a union in the Nawiri (CRS) RFSA areas (85.8%) participate in decisions over the use of self-earned cash they have earned. Less than one-half of women in the Nawiri (CRS) RFSA areas (45%) participate in decisions over the use of their partner’s self-earned cash. The percentage of men in a union and earning cash who report spouse/partner participation in decisions regarding the use of the self-earned cash was higher in Isiolo (59.3%) compared to Marsabit (45.5%).
Most women in a union in the Nawiri (Mercy Corps) RFSA areas (81.5%) participate in decisions over the use of self-earned cash. Less than one-third of women in the Nawiri (Mercy Corps) RFSA areas (31.3%) participate in decisions over the use of their partner’s self-earned cash. About one-half (47.1%) of men in a union in the Nawiri (Mercy Corps) RFSA areas and earning cash report spouse/partner participation in decisions regarding the use of the self-earned cash.
Statistical testing of differences in women’s and men’s perceptions of women’s participation in spouse/partner’s self-earned cash indicated no differences except in Turkana, where 45.6% of men report women’s participation in their (men’s) self-earned cash, compared to 27.3% of women reporting their (women’s) participation in their spouse’s self-earned cash (p < 0.01).
The Nawiri gender study in Isiolo and Marsabit raises important points relevant to these findings:233 “The study communities give livestock high social and cultural value. Ownership of livestock defines one’s social status in the community and is considered a form of social security and primary investment. Men prefer to accumulate livestock for prestige, social security, and as a long-term investment and only rarely sell/slaughter them to feed their families. Livestock held by men are often not easily sold or converted to other forms of financial capital for household benefit even during lean seasons and are only sold as a last resort to meet critical needs (e.g., school fees and medical expenses). However, the study found the existence of norms which demand that men take good care of their families and will not allow households to go without food while they have livestock. Still, women's lack of asset ownership makes it difficult to obtain cash or access credit in times of need, and lenders typically prefer men, whom they perceive will be better able to repay debts. Women’s ability to decide on domestic 231 Estimates of decision-making on self-earned cash are based on the following question: “Who usually decides how the cash you earn will be used?” Possible response options are: “YOURSELF”, “SPOUSE/PARTNER”, “YOURSELF AND SPOUSE/PARTNER JOINTLY”, “YOURSELF AND OTHER JOINTLY”, and “OTHER.” Respondents are considered to participate in self-earned cash decision-making if they respond “YOURSELF” or “SPOUSE/PARTNER” or “YOURSELF AND SPOUSE/PARTNER JOINTLY” or “YOURSELF AND OTHER JOINTLY.” Given the sensitive nature of this question, this module (i.e., gender), and other modules of the questionnaire that require privacy such as the module on reproductive health, were conducted by a female interviewer, and ideally in private. Notwithstanding, such questions are likely to produce social desirability effects if respondents try to respond in a manner that they believe is expected by the enumerator. 232 Women’s participation in spouse’s self-earned cash is self-report; respondents are asked “Who usually decides how the cash he earns will be used?” Possible response options are: YOURSELF”, “SPOUSE/PARTNER”, “YOURSELF AND SPOUSE/PARTNER JOINTLY”, “YOURSELF AND OTHER JOINTLY”, and “OTHER.” Multiple responses are allowed. Respondents are considered to participate in spouse’s self-earned cash decision-making if they respond “YOURSELF” or “YOURSELF AND SPOUSE/PARTNER JOINTLY” or “YOURSELF AND OTHER JOINTLY.” Women’s perceptions on their participation in spouse’s self-earned cash can then be compared to men’s perceptions based on men’s responses on who participates in decisions having to do with their self-earned cash. 233 CRS. 2021. USAID Nawiri Gender Youth and Social Dynamics Analysis … in Isiolo and Marsabit Counties.
IMPEL | Implementer-Led Evaluation and Learning
100 Findings
purchases is constrained, forcing them to cut back or suppress important food needs.” Similar themes arise in other counties, as well, for example, the Turkana PEA notes that female-headed households are not allowed to own cattle without a son or a male herder in their employ, and as such are unable to earn income from animal husbandry.234
The issue of gender and decision-making at the household level—around how to spend cash and use credit as well as a host of other issues—is more nuanced than can be captured in a quantitative survey. In-depth qualitative research has much to offer on this topic, such as the study on gender, social and cultural norms associated with acute malnutrition in Isiolo and Marsabit.235 This and other qualitative research suggests that while men and women make a range household decisions together or alone, the power and role differential is highly gendered, with men’s influence predominating in many cases: “… [M]en make key household decisions as the head of the household (e.g., access to and use of household resources including money, livestock, and other assets). Women make some decisions when their husbands are away with the livestock in the fora, but ultimately have to seek approval from another source. Women’s decision-making is not independent and involves an intricate negotiation process that might include the mother-in-law and other elderly relations.” The study suggests that even decisions traditionally in the women’s realm, such as what food to purchase and meal timing, require consultation; it found that married women, for example, did not make decisions over property inheritance of livestock sales, and that the following types of decisions required consultation: buying food, seeking health care for children, attending training, marriage, child spacing, starting a business, and spending household income. Because women have little power over decisions regarding strategic assets like livestock, they are unable to address household food needs. The research did find that women’s influence on decision-making processes increases as she grows older.
In Samburu, an area where women are found to have more authority than men is in the allocation of water women collect for domestic use: “by custom, a man’s access to water within the family home is by consent, not by right.” The research states, “Women routinely make tough decisions about water use, balancing a household’s diverse needs for drinking, cooking, personal and domestic hygienic, and, in some cases, watering small stock and kitchen gardens.” Women in Samburu also make decisions about whether to pay for water or transport to secure domestic water, one of the few situations where she has a strong influence over the use of cash that the household has available.236
The gender study found that some families consult mothers-in-law and grandmothers on other household decisions, such as household management, finances, and general family well-being and that they are relied on as alternate caregivers for infants and children. 237
234 Mercy Corps Nawiri Consortium. 2021e. Political Economy Analysis (Turkana). 235 CRS. 2021. USAID Nawiri Gender Youth and Social Dynamics Analysis … in Isiolo and Marsabit Counties. 236 Mercy Corps USAID Nawiri Consortium. 2021c. Water Sector Desk Review—Samburu and Turkana Counties. 237 CRS. 2021. USAID Nawiri Gender Youth and Social Dynamics Analysis … in Isiolo and Marsabit Counties.
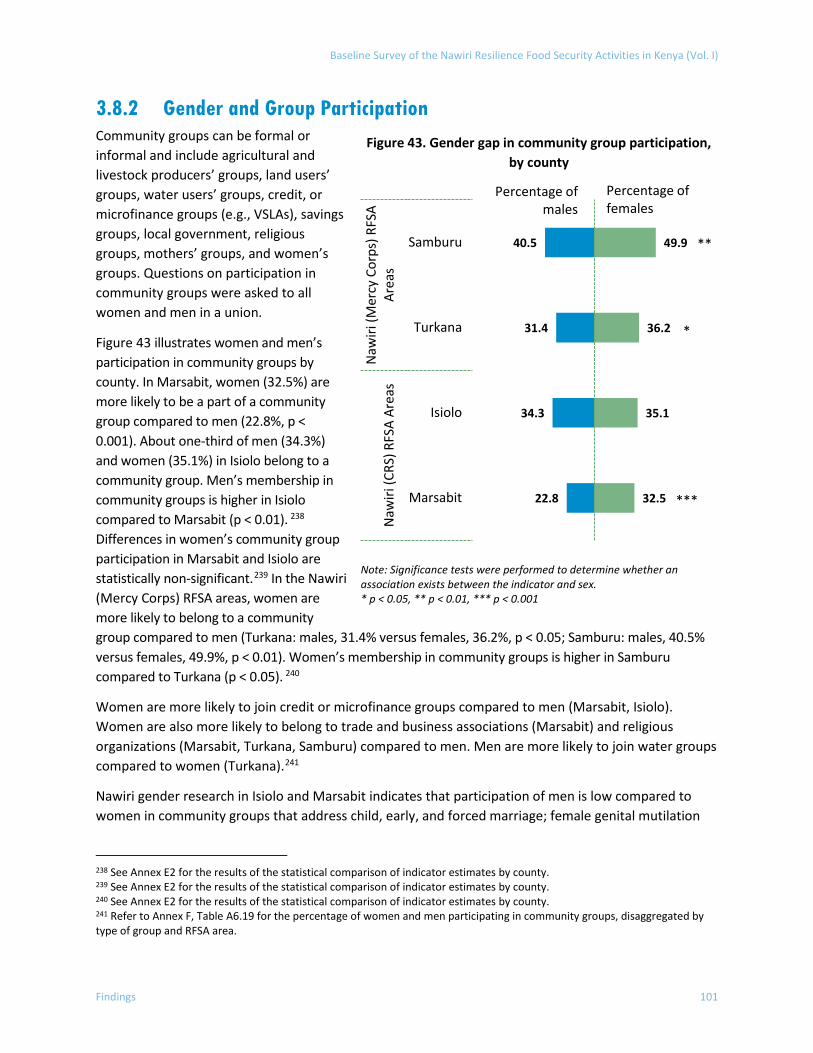
Baseline Survey of the Nawiri Resilience Food Security Activities in Kenya (Vol. I)
Findings 101
3.8.2 Gender and Group Participation Community groups can be formal or informal and include agricultural and livestock producers’ groups, land users’ groups, water users’ groups, credit, or microfinance groups (e.g., VSLAs), savings groups, local government, religious groups, mothers’ groups, and women’s groups. Questions on participation in community groups were asked to all women and men in a union.
Figure 43 illustrates women and men’s participation in community groups by county. In Marsabit, women (32.5%) are more likely to be a part of a community group compared to men (22.8%, p < 0.001). About one-third of men (34.3%) and women (35.1%) in Isiolo belong to a community group. Men’s membership in community groups is higher in Isiolo compared to Marsabit (p < 0.01). 238 Differences in women’s community group participation in Marsabit and Isiolo are statistically non-significant.239 In the Nawiri (Mercy Corps) RFSA areas, women are more likely to belong to a community group compared to men (Turkana: males, 31.4% versus females, 36.2%, p < 0.05; Samburu: males, 40.5% versus females, 49.9%, p < 0.01). Women’s membership in community groups is higher in Samburu compared to Turkana (p < 0.05). 240
Women are more likely to join credit or microfinance groups compared to men (Marsabit, Isiolo). Women are also more likely to belong to trade and business associations (Marsabit) and religious organizations (Marsabit, Turkana, Samburu) compared to men. Men are more likely to join water groups compared to women (Turkana).241
Nawiri gender research in Isiolo and Marsabit indicates that participation of men is low compared to women in community groups that address child, early, and forced marriage; female genital mutilation
238 See Annex E2 for the results of the statistical comparison of indicator estimates by county. 239 See Annex E2 for the results of the statistical comparison of indicator estimates by county. 240 See Annex E2 for the results of the statistical comparison of indicator estimates by county. 241 Refer to Annex F, Table A6.19 for the percentage of women and men participating in community groups, disaggregated by type of group and RFSA area.
Figure 43. Gender gap in community group participation, by county
Note: Significance tests were performed to determine whether an association exists between the indicator and sex. * p < 0.05, ** p < 0.01, *** p < 0.001
22.8
34.3
31.4
40.5
32.5
35.1
36.2
49.9
Marsabit
Isiolo
Turkana
Samburu
Naw
iri (C
RS) R
FSA
Area
sN
awiri
(Mer
cy C
orps
) RFS
AAr
eas
Percentage of females
Percentage of males
***
**
*
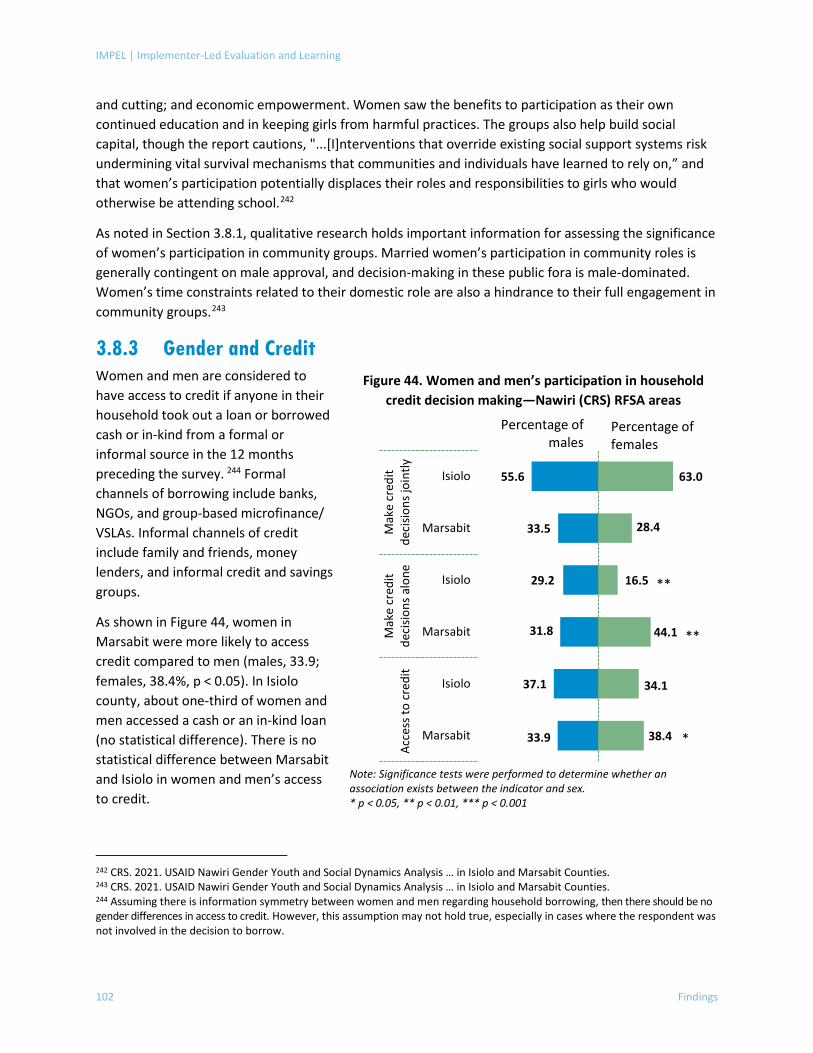
IMPEL | Implementer-Led Evaluation and Learning
102 Findings
and cutting; and economic empowerment. Women saw the benefits to participation as their own continued education and in keeping girls from harmful practices. The groups also help build social capital, though the report cautions, "...[I]nterventions that override existing social support systems risk undermining vital survival mechanisms that communities and individuals have learned to rely on,” and that women’s participation potentially displaces their roles and responsibilities to girls who would otherwise be attending school.242
As noted in Section 3.8.1, qualitative research holds important information for assessing the significance of women’s participation in community groups. Married women’s participation in community roles is generally contingent on male approval, and decision-making in these public fora is male-dominated. Women’s time constraints related to their domestic role are also a hindrance to their full engagement in community groups.243
3.8.3 Gender and Credit Women and men are considered to have access to credit if anyone in their household took out a loan or borrowed cash or in-kind from a formal or informal source in the 12 months preceding the survey. 244 Formal channels of borrowing include banks, NGOs, and group-based microfinance/ VSLAs. Informal channels of credit include family and friends, money lenders, and informal credit and savings groups.
As shown in Figure 44, women in Marsabit were more likely to access credit compared to men (males, 33.9; females, 38.4%, p < 0.05). In Isiolo county, about one-third of women and men accessed a cash or an in-kind loan (no statistical difference). There is no statistical difference between Marsabit and Isiolo in women and men’s access to credit.
242 CRS. 2021. USAID Nawiri Gender Youth and Social Dynamics Analysis … in Isiolo and Marsabit Counties. 243 CRS. 2021. USAID Nawiri Gender Youth and Social Dynamics Analysis … in Isiolo and Marsabit Counties. 244 Assuming there is information symmetry between women and men regarding household borrowing, then there should be no gender differences in access to credit. However, this assumption may not hold true, especially in cases where the respondent was not involved in the decision to borrow.
Figure 44. Women and men’s participation in household credit decision making—Nawiri (CRS) RFSA areas
Note: Significance tests were performed to determine whether an association exists between the indicator and sex. * p < 0.05, ** p < 0.01, *** p < 0.001
38.4
34.1
44.1
16.5
28.4
63.0
33.9
37.1
31.8
29.2
33.5
55.6
Marsabit
Isiolo
Marsabit
Isiolo
Marsabit
Isiolo
Acce
ss to
cre
dit
Mak
e cr
edit
deci
sions
alo
neM
ake
cred
itde
cisio
ns jo
intly
Percentage of females
Percentage of males
**
**
*
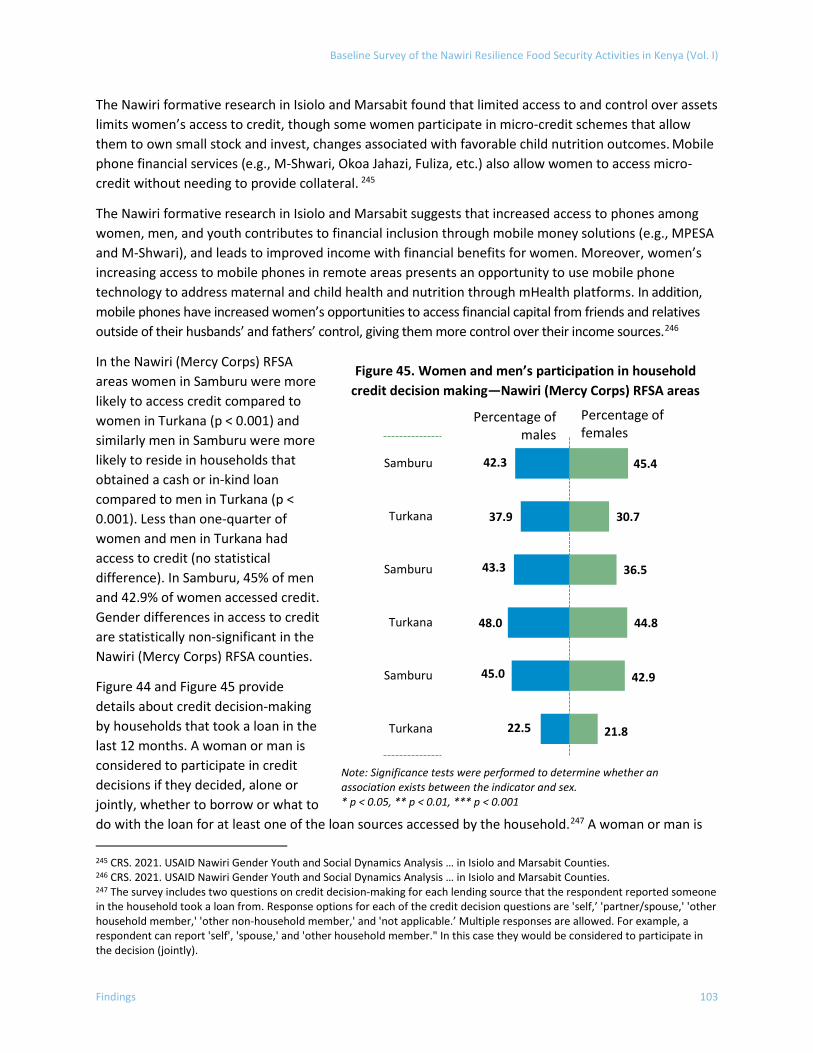
Baseline Survey of the Nawiri Resilience Food Security Activities in Kenya (Vol. I)
Findings 103
The Nawiri formative research in Isiolo and Marsabit found that limited access to and control over assets limits women’s access to credit, though some women participate in micro-credit schemes that allow them to own small stock and invest, changes associated with favorable child nutrition outcomes. Mobile phone financial services (e.g., M-Shwari, Okoa Jahazi, Fuliza, etc.) also allow women to access micro-credit without needing to provide collateral. 245
The Nawiri formative research in Isiolo and Marsabit suggests that increased access to phones among women, men, and youth contributes to financial inclusion through mobile money solutions (e.g., MPESA and M-Shwari), and leads to improved income with financial benefits for women. Moreover, women’s increasing access to mobile phones in remote areas presents an opportunity to use mobile phone technology to address maternal and child health and nutrition through mHealth platforms. In addition, mobile phones have increased women’s opportunities to access financial capital from friends and relatives outside of their husbands’ and fathers’ control, giving them more control over their income sources.246
In the Nawiri (Mercy Corps) RFSA areas women in Samburu were more likely to access credit compared to women in Turkana (p < 0.001) and similarly men in Samburu were more likely to reside in households that obtained a cash or in-kind loan compared to men in Turkana (p < 0.001). Less than one-quarter of women and men in Turkana had access to credit (no statistical difference). In Samburu, 45% of men and 42.9% of women accessed credit. Gender differences in access to credit are statistically non-significant in the Nawiri (Mercy Corps) RFSA counties.
Figure 44 and Figure 45 provide details about credit decision-making by households that took a loan in the last 12 months. A woman or man is considered to participate in credit decisions if they decided, alone or jointly, whether to borrow or what to do with the loan for at least one of the loan sources accessed by the household.247 A woman or man is 245 CRS. 2021. USAID Nawiri Gender Youth and Social Dynamics Analysis … in Isiolo and Marsabit Counties. 246 CRS. 2021. USAID Nawiri Gender Youth and Social Dynamics Analysis … in Isiolo and Marsabit Counties. 247 The survey includes two questions on credit decision-making for each lending source that the respondent reported someone in the household took a loan from. Response options for each of the credit decision questions are 'self,’ 'partner/spouse,' 'other household member,' 'other non-household member,' and 'not applicable.’ Multiple responses are allowed. For example, a respondent can report 'self', 'spouse,' and 'other household member." In this case they would be considered to participate in the decision (jointly).
Figure 45. Women and men’s participation in household credit decision making—Nawiri (Mercy Corps) RFSA areas
Note: Significance tests were performed to determine whether an association exists between the indicator and sex. * p < 0.05, ** p < 0.01, *** p < 0.001
21.8
42.9
44.8
36.5
30.7
45.4
22.5
45.0
48.0
43.3
37.9
42.3
Turkana
Samburu
Turkana
Samburu
Turkana
Samburu
Percentage of females
Percentage of males
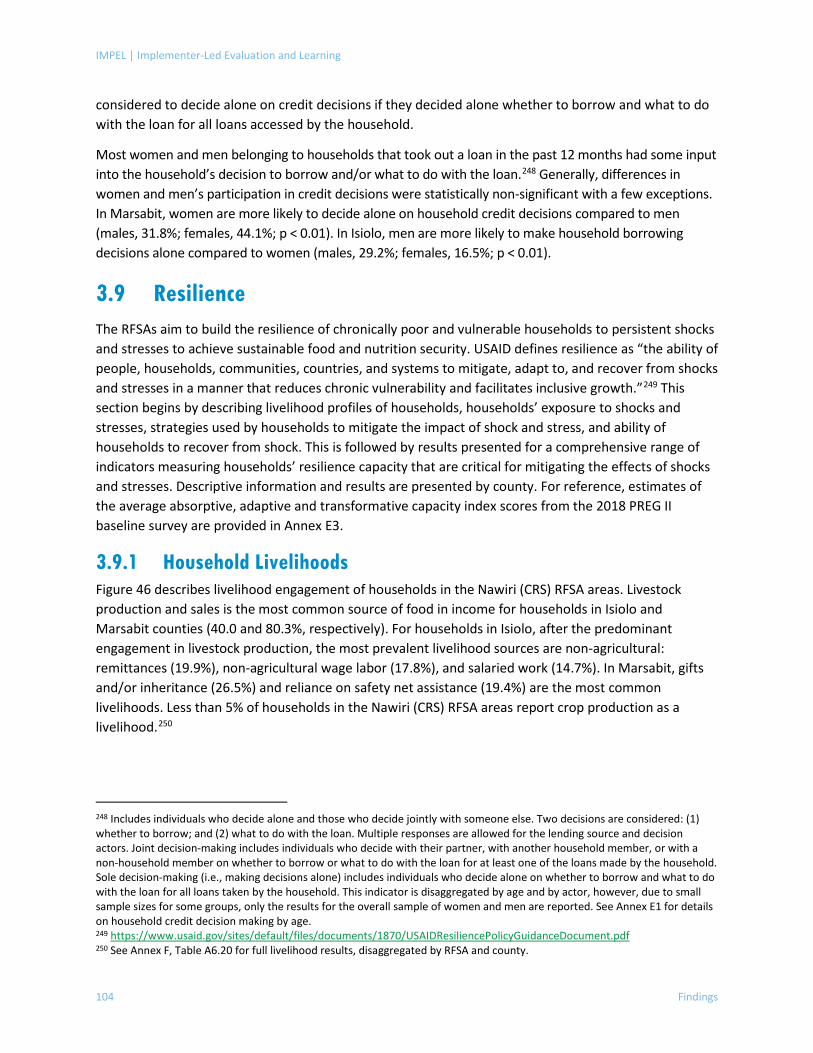
IMPEL | Implementer-Led Evaluation and Learning
104 Findings
considered to decide alone on credit decisions if they decided alone whether to borrow and what to do with the loan for all loans accessed by the household.
Most women and men belonging to households that took out a loan in the past 12 months had some input into the household’s decision to borrow and/or what to do with the loan.248 Generally, differences in women and men’s participation in credit decisions were statistically non-significant with a few exceptions. In Marsabit, women are more likely to decide alone on household credit decisions compared to men (males, 31.8%; females, 44.1%; p < 0.01). In Isiolo, men are more likely to make household borrowing decisions alone compared to women (males, 29.2%; females, 16.5%; p < 0.01).
3.9 Resilience The RFSAs aim to build the resilience of chronically poor and vulnerable households to persistent shocks and stresses to achieve sustainable food and nutrition security. USAID defines resilience as “the ability of people, households, communities, countries, and systems to mitigate, adapt to, and recover from shocks and stresses in a manner that reduces chronic vulnerability and facilitates inclusive growth.”249 This section begins by describing livelihood profiles of households, households’ exposure to shocks and stresses, strategies used by households to mitigate the impact of shock and stress, and ability of households to recover from shock. This is followed by results presented for a comprehensive range of indicators measuring households’ resilience capacity that are critical for mitigating the effects of shocks and stresses. Descriptive information and results are presented by county. For reference, estimates of the average absorptive, adaptive and transformative capacity index scores from the 2018 PREG II baseline survey are provided in Annex E3.
3.9.1 Household Livelihoods Figure 46 describes livelihood engagement of households in the Nawiri (CRS) RFSA areas. Livestock production and sales is the most common source of food in income for households in Isiolo and Marsabit counties (40.0 and 80.3%, respectively). For households in Isiolo, after the predominant engagement in livestock production, the most prevalent livelihood sources are non-agricultural: remittances (19.9%), non-agricultural wage labor (17.8%), and salaried work (14.7%). In Marsabit, gifts and/or inheritance (26.5%) and reliance on safety net assistance (19.4%) are the most common livelihoods. Less than 5% of households in the Nawiri (CRS) RFSA areas report crop production as a livelihood.250
248 Includes individuals who decide alone and those who decide jointly with someone else. Two decisions are considered: (1) whether to borrow; and (2) what to do with the loan. Multiple responses are allowed for the lending source and decision actors. Joint decision-making includes individuals who decide with their partner, with another household member, or with a non-household member on whether to borrow or what to do with the loan for at least one of the loans made by the household. Sole decision-making (i.e., making decisions alone) includes individuals who decide alone on whether to borrow and what to do with the loan for all loans taken by the household. This indicator is disaggregated by age and by actor, however, due to small sample sizes for some groups, only the results for the overall sample of women and men are reported. See Annex E1 for details on household credit decision making by age. 249 https://www.usaid.gov/sites/default/files/documents/1870/USAIDResiliencePolicyGuidanceDocument.pdf 250 See Annex F, Table A6.20 for full livelihood results, disaggregated by RFSA and county.
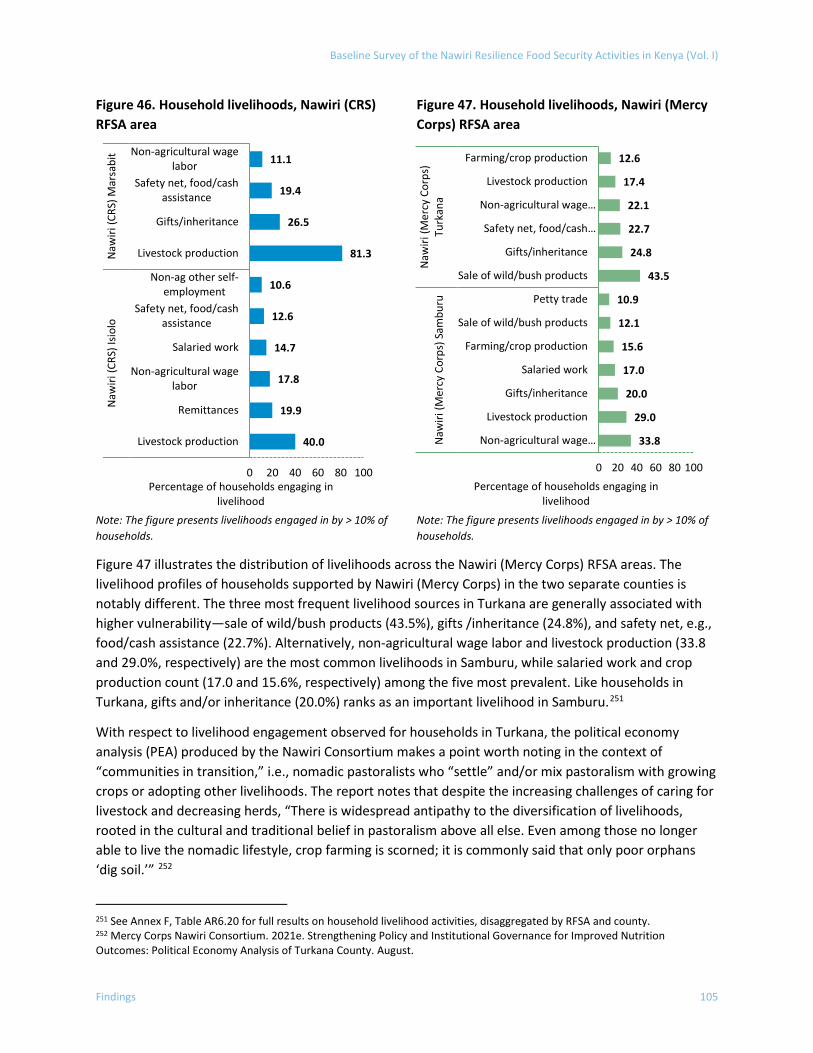
Baseline Survey of the Nawiri Resilience Food Security Activities in Kenya (Vol. I)
Findings 105
Figure 46. Household livelihoods, Nawiri (CRS) RFSA area
Figure 47. Household livelihoods, Nawiri (Mercy Corps) RFSA area
Note: The figure presents livelihoods engaged in by > 10% of households.
Note: The figure presents livelihoods engaged in by > 10% of households.
Figure 47 illustrates the distribution of livelihoods across the Nawiri (Mercy Corps) RFSA areas. The livelihood profiles of households supported by Nawiri (Mercy Corps) in the two separate counties is notably different. The three most frequent livelihood sources in Turkana are generally associated with higher vulnerability—sale of wild/bush products (43.5%), gifts /inheritance (24.8%), and safety net, e.g., food/cash assistance (22.7%). Alternatively, non-agricultural wage labor and livestock production (33.8 and 29.0%, respectively) are the most common livelihoods in Samburu, while salaried work and crop production count (17.0 and 15.6%, respectively) among the five most prevalent. Like households in Turkana, gifts and/or inheritance (20.0%) ranks as an important livelihood in Samburu.251
With respect to livelihood engagement observed for households in Turkana, the political economy analysis (PEA) produced by the Nawiri Consortium makes a point worth noting in the context of “communities in transition,” i.e., nomadic pastoralists who “settle” and/or mix pastoralism with growing crops or adopting other livelihoods. The report notes that despite the increasing challenges of caring for livestock and decreasing herds, “There is widespread antipathy to the diversification of livelihoods, rooted in the cultural and traditional belief in pastoralism above all else. Even among those no longer able to live the nomadic lifestyle, crop farming is scorned; it is commonly said that only poor orphans ‘dig soil.’” 252
251 See Annex F, Table AR6.20 for full results on household livelihood activities, disaggregated by RFSA and county. 252 Mercy Corps Nawiri Consortium. 2021e. Strengthening Policy and Institutional Governance for Improved Nutrition Outcomes: Political Economy Analysis of Turkana County. August.
40.0
19.9
17.8
14.7
12.6
10.6
81.3
26.5
19.4
11.1
0 20 40 60 80 100
Livestock production
Remittances
Non-agricultural wagelabor
Salaried work
Safety net, food/cashassistance
Non-ag other self-employment
Livestock production
Gifts/inheritance
Safety net, food/cashassistance
Non-agricultural wagelabor
Naw
iri (C
RS) I
siolo
Naw
iri (C
RS) M
arsa
bit
Percentage of households engaging in livelihood
33.8
29.0
20.0
17.0
15.6
12.1
10.9
43.5
24.8
22.7
22.1
17.4
12.6
0 20 40 60 80 100
Non-agricultural wage…
Livestock production
Gifts/inheritance
Salaried work
Farming/crop production
Sale of wild/bush products
Petty trade
Sale of wild/bush products
Gifts/inheritance
Safety net, food/cash…
Non-agricultural wage…
Livestock production
Farming/crop production
Naw
iri (M
ercy
Cor
ps) S
ambu
ruN
awiri
(Mer
cy C
orps
)Tu
rkan
a
Percentage of households engaging in livelihood
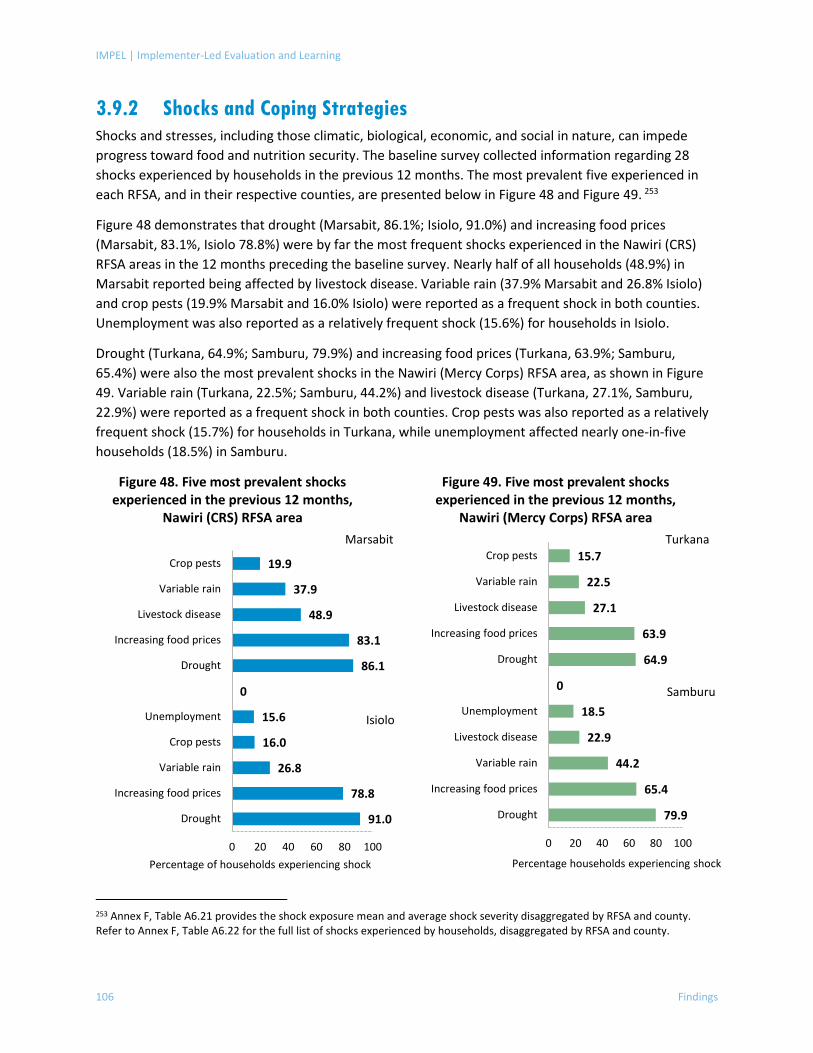
IMPEL | Implementer-Led Evaluation and Learning
106 Findings
3.9.2 Shocks and Coping Strategies Shocks and stresses, including those climatic, biological, economic, and social in nature, can impede progress toward food and nutrition security. The baseline survey collected information regarding 28 shocks experienced by households in the previous 12 months. The most prevalent five experienced in each RFSA, and in their respective counties, are presented below in Figure 48 and Figure 49. 253
Figure 48 demonstrates that drought (Marsabit, 86.1%; Isiolo, 91.0%) and increasing food prices (Marsabit, 83.1%, Isiolo 78.8%) were by far the most frequent shocks experienced in the Nawiri (CRS) RFSA areas in the 12 months preceding the baseline survey. Nearly half of all households (48.9%) in Marsabit reported being affected by livestock disease. Variable rain (37.9% Marsabit and 26.8% Isiolo) and crop pests (19.9% Marsabit and 16.0% Isiolo) were reported as a frequent shock in both counties. Unemployment was also reported as a relatively frequent shock (15.6%) for households in Isiolo.
Drought (Turkana, 64.9%; Samburu, 79.9%) and increasing food prices (Turkana, 63.9%; Samburu, 65.4%) were also the most prevalent shocks in the Nawiri (Mercy Corps) RFSA area, as shown in Figure 49. Variable rain (Turkana, 22.5%; Samburu, 44.2%) and livestock disease (Turkana, 27.1%, Samburu, 22.9%) were reported as a frequent shock in both counties. Crop pests was also reported as a relatively frequent shock (15.7%) for households in Turkana, while unemployment affected nearly one-in-five households (18.5%) in Samburu.
Figure 48. Five most prevalent shocks experienced in the previous 12 months,
Nawiri (CRS) RFSA area
Figure 49. Five most prevalent shocks experienced in the previous 12 months,
Nawiri (Mercy Corps) RFSA area
253 Annex F, Table A6.21 provides the shock exposure mean and average shock severity disaggregated by RFSA and county. Refer to Annex F, Table A6.22 for the full list of shocks experienced by households, disaggregated by RFSA and county.
91.0
78.8
26.8
16.0
15.6
0
86.1
83.1
48.9
37.9
19.9
0 20 40 60 80 100
Drought
Increasing food prices
Variable rain
Crop pests
Unemployment
Drought
Increasing food prices
Livestock disease
Variable rain
Crop pests
Percentage of households experiencing shock
Isiolo
Marsabit
79.9
65.4
44.2
22.9
18.5
0
64.9
63.9
27.1
22.5
15.7
0 20 40 60 80 100
Drought
Increasing food prices
Variable rain
Livestock disease
Unemployment
Drought
Increasing food prices
Livestock disease
Variable rain
Crop pests
Percentage households experiencing shock
Samburu
Turkana
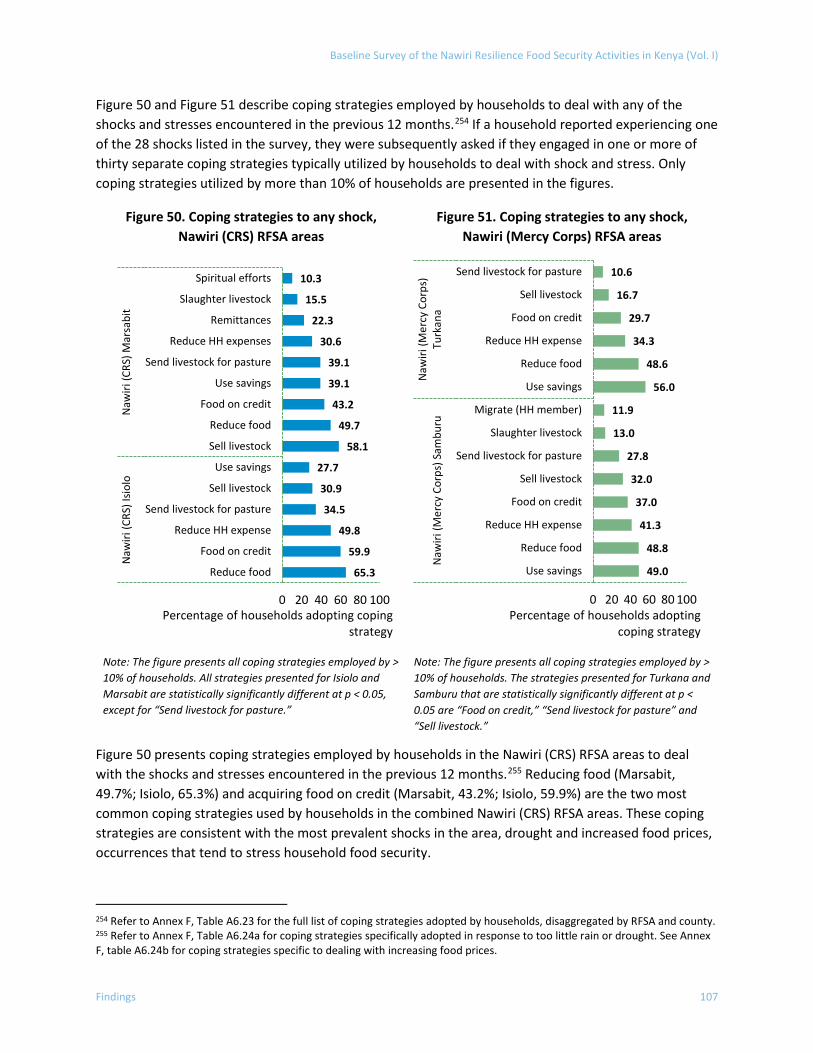
Baseline Survey of the Nawiri Resilience Food Security Activities in Kenya (Vol. I)
Findings 107
Figure 50 and Figure 51 describe coping strategies employed by households to deal with any of the shocks and stresses encountered in the previous 12 months.254 If a household reported experiencing one of the 28 shocks listed in the survey, they were subsequently asked if they engaged in one or more of thirty separate coping strategies typically utilized by households to deal with shock and stress. Only coping strategies utilized by more than 10% of households are presented in the figures.
Figure 50 presents coping strategies employed by households in the Nawiri (CRS) RFSA areas to deal with the shocks and stresses encountered in the previous 12 months.255 Reducing food (Marsabit, 49.7%; Isiolo, 65.3%) and acquiring food on credit (Marsabit, 43.2%; Isiolo, 59.9%) are the two most common coping strategies used by households in the combined Nawiri (CRS) RFSA areas. These coping strategies are consistent with the most prevalent shocks in the area, drought and increased food prices, occurrences that tend to stress household food security.
254 Refer to Annex F, Table A6.23 for the full list of coping strategies adopted by households, disaggregated by RFSA and county. 255 Refer to Annex F, Table A6.24a for coping strategies specifically adopted in response to too little rain or drought. See Annex F, table A6.24b for coping strategies specific to dealing with increasing food prices.
Figure 50. Coping strategies to any shock, Nawiri (CRS) RFSA areas
Figure 51. Coping strategies to any shock, Nawiri (Mercy Corps) RFSA areas
Note: The figure presents all coping strategies employed by > 10% of households. All strategies presented for Isiolo and Marsabit are statistically significantly different at p < 0.05, except for “Send livestock for pasture.”
Note: The figure presents all coping strategies employed by > 10% of households. The strategies presented for Turkana and Samburu that are statistically significantly different at p < 0.05 are “Food on credit,” “Send livestock for pasture” and “Sell livestock.”
65.3
59.9
49.8
34.5
30.9
27.7
58.1
49.7
43.2
39.1
39.1
30.6
22.3
15.5
10.3
0 20 40 60 80 100
Reduce food
Food on credit
Reduce HH expense
Send livestock for pasture
Sell livestock
Use savings
Sell livestock
Reduce food
Food on credit
Use savings
Send livestock for pasture
Reduce HH expenses
Remittances
Slaughter livestock
Spiritual efforts
Naw
iri (C
RS) I
siolo
Naw
iri (C
RS) M
arsa
bit
Percentage of households adopting coping strategy
49.0
48.8
41.3
37.0
32.0
27.8
13.0
11.9
56.0
48.6
34.3
29.7
16.7
10.6
0 20 40 60 80 100
Use savings
Reduce food
Reduce HH expense
Food on credit
Sell livestock
Send livestock for pasture
Slaughter livestock
Migrate (HH member)
Use savings
Reduce food
Reduce HH expense
Food on credit
Sell livestock
Send livestock for pasture
Naw
iri (M
ercy
Cor
ps) S
ambu
ruN
awiri
(Mer
cy C
orps
)Tu
rkan
a
Percentage of households adopting coping strategy
IMPEL | Implementer-Led Evaluation and Learning
108 Findings
Livestock-based coping strategies were prevalent for households in both counties in the Nawiri (CRS) RFSA areas, and relatively more frequent for households in Marsabit. The use of more livestock-based strategies in Marsabit may be tied to the higher engagement in livestock production coupled with the higher reported incidence of livestock disease as a shock in that county. In particular, the most frequently used coping strategy in Marsabit was selling livestock (58.1%), a strategy also utilized by nearly one-third of households in Isiolo (30.9%). Reducing household expenses to cope with shock was employed in both counties, half of Marsabit households engaged in the strategy (49.8%) and nearly one-third of households in Isiolo (30.6%). Notably, use of savings to cope with shock at baseline was prevalent in the Nawiri (CRS) RFSA area, more frequently observed in Marsabit (39.1%) compared to Isiolo (27.7%).
Figure 51 illustrates strategies employed by households in the Nawiri (Mercy Corps) RFSA areas to deal with the shocks and stresses encountered in 12 months before the baseline survey. Coping strategy use was similar across the two counties, with the top six strategies utilized in the same rank order for households in both Turkana and Samburu. It is notable that use of savings ranks as one of the most prevalent strategies utilized by roughly half of households in Turkana and Samburu (56.0 and 49.0%, respectively), although reduction in household food consumption was employed at similar rates (Turkana, 48.6%; Samburu, 48.8%).256 Reduction of household expenses (Turkana, 34.3%; Samburu, 41.3%) and buying food on credit (Turkana, 29.7%; Samburu, 37.0%) were the next most-frequent strategies employed by roughly one-third of households in both counties.
Rounding out the common prevalent coping strategies for households in both counties are selling livestock (Turkana, 16.7%; Samburu, 32.0%) and sending livestock for pasture (Turkana, 10.6%; Samburu 27.8%) with households in Samburu engaging more frequently in those strategies than households in Turkana.
3.9.3 Ability to Recover from Shocks and Stresses The ability to recover from shocks and stresses index estimates capability of households to recuperate from typical types of shocks and stressors, such as loss of a family member, loss of income, hunger, drought, flood, conflict or similar events. The index ranges from 0–6, adjusting for differential shock severity exposure, whereby values of 2 or below represent relative pessimism regarding recovery from retrospective and prospective shock exposure. Values approaching 4 represent expectations of relative stability in recovery (i.e., ability to meet food/income needs is the same), while values approaching 6 represent relative optimism.257
The ability to recover index is adjusted for shock exposure using the shock exposure index. The shock exposure index can range from 0 to 224 and incorporates information related to the number of shocks experienced by households in the previous 12 months (out of 18 total) while weighting each shock by
256 The baseline for the longitudinal study in Turkana found reducing food consumption to be the most common strategy for coping with shocks, with 80% of households reporting using this strategy. However, the recall period for the latter longitudinal study was four months, whereas for this Nawiri baseline, the recall period is 12 months. This underlines the importance of differentiating results from different data collection periods and considering seasonality. The Turkana longitudinal study will collect data in six waves (starting with the baseline in May–June 2021, with the last wave in August–September 2023), hence the shorter data collection intervals. 257 Refer to Annex F, Table A6.21 for additional details.
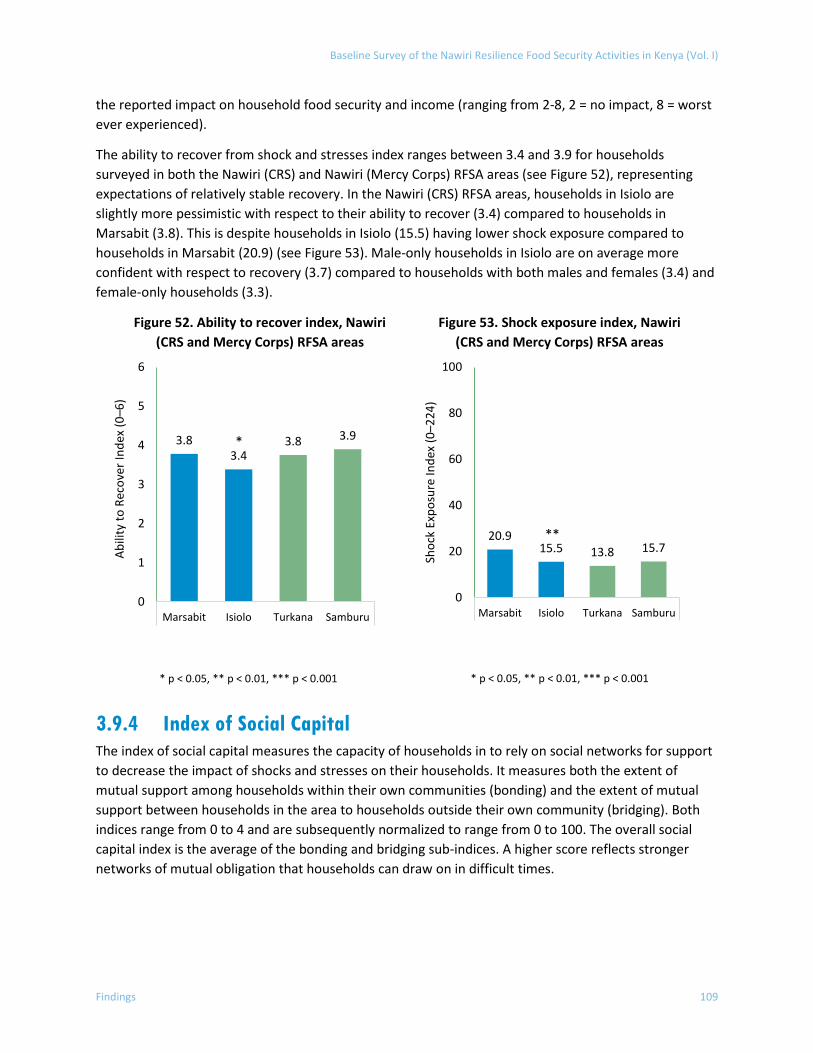
Baseline Survey of the Nawiri Resilience Food Security Activities in Kenya (Vol. I)
Findings 109
the reported impact on household food security and income (ranging from 2-8, 2 = no impact, 8 = worst ever experienced).
The ability to recover from shock and stresses index ranges between 3.4 and 3.9 for households surveyed in both the Nawiri (CRS) and Nawiri (Mercy Corps) RFSA areas (see Figure 52), representing expectations of relatively stable recovery. In the Nawiri (CRS) RFSA areas, households in Isiolo are slightly more pessimistic with respect to their ability to recover (3.4) compared to households in Marsabit (3.8). This is despite households in Isiolo (15.5) having lower shock exposure compared to households in Marsabit (20.9) (see Figure 53). Male-only households in Isiolo are on average more confident with respect to recovery (3.7) compared to households with both males and females (3.4) and female-only households (3.3).
Figure 52. Ability to recover index, Nawiri (CRS and Mercy Corps) RFSA areas
* p < 0.05, ** p < 0.01, *** p < 0.001
Figure 53. Shock exposure index, Nawiri (CRS and Mercy Corps) RFSA areas
* p < 0.05, ** p < 0.01, *** p < 0.001
3.9.4 Index of Social Capital The index of social capital measures the capacity of households in to rely on social networks for support to decrease the impact of shocks and stresses on their households. It measures both the extent of mutual support among households within their own communities (bonding) and the extent of mutual support between households in the area to households outside their own community (bridging). Both indices range from 0 to 4 and are subsequently normalized to range from 0 to 100. The overall social capital index is the average of the bonding and bridging sub-indices. A higher score reflects stronger networks of mutual obligation that households can draw on in difficult times.
3.83.4
3.8 3.9
0
1
2
3
4
5
6
Marsabit Isiolo Turkana Samburu
Abili
ty to
Rec
over
Inde
x (0
–6)
20.915.5 13.8 15.7
0
20
40
60
80
100
Marsabit Isiolo Turkana Samburu
Shoc
k Ex
posu
re In
dex
(0–2
24)
*
**
IMPEL | Implementer-Led Evaluation and Learning
110 Findings
Overall social capital index averaged 69 in the Nawiri (CRS) RFSA areas (bonding, 70.1; bridging, 68).258 In the Nawiri (Mercy Corps) RFSA areas, households in Turkana have lower overall social capital (63.6) than households in Samburu (71.2) (p < 0.001). The difference in social capital is driven by both lower bonding (Turkana, 63.7; Samburu, 72.0, p < 0.001) and bridging social capital (Turkana, 63.5; Samburu, 70.4, p < 0.05).
With respect to gendered household type, households with both males and females in the Nawiri (Mercy Corps) RFSA areas (67.3) have slightly higher overall social capital compared to female-only households (64.7) and male-only households (61.4). Households with both males and females in Turkana have lower overall social capital (56.4) than households with both males and females (64.6) and female-only households (62.9); and, in Samburu households with both males and females have higher overall social capital (72.8) than female-only households (68.8).
One of the Nawiri formative research papers emphasizes the importance of social capital to food security and successful livelihood and nutrition outcomes, and examines ways social capital is functioning currently, uncovering some important challenges. Generally, while traditional systems have ensured access to social support networks, these have been weakened due to transitioning livelihoods, such as to sedentary lifestyles in small market centers, resulting in further impoverishment of already-vulnerable populations. Social capital, built in pastoralist communities through the exchange of livestock or the sale of livestock products, is weakening as livestock herds are diminished due to recurrent drought. The research also found that newly married women and first-time mothers faced challenges accessing help because of limited social networks. Mobile phones have introduced new access to social networks, financial services, mobile money, and information on health services, agriculture, and employment opportunities, etc., and have improved financial inclusion and income. Still, these benefits are uneven along the gender dimension, as women have less access to mobile phones and lower literacy levels than men.259
3.9.5 Household Participation in Group-Based Savings, Microfinance, or Lending Programs
The indicator measuring participation in group-based savings, microfinance or lending programs includes both formal and informal groups such as VSLAs, credit unions, and other formal and informal group-based finance or lending groups. This indicator differs from estimates of access to credit and savings among farmers and estimates of access to credit among women and men in a union in that the latter two estimates include a broader range of service providers or sources, and therefore are likely to be higher than the estimates of group-based access to credit and savings discussed in this section.
In the Nawiri (CRS) RFSA areas, participation in group-based savings, micro-finance, or lending programs averaged 2.9% among all households.260 There was no difference between the Nawiri (CRS) RFSA
258 Indicator estimates for overall social capital index, bonding sub-index, and bridging sub-index do not differ statistically between Marsabit and Isiolo (see Annex E2). 259 CRS. 2021. USAID Nawiri Gender Youth and Social Dynamics Analysis … in Isiolo and Marsabit Counties. 260 Indicator estimates for overall participation in group-based savings, microfinance or lending groups do not differ statistically between Marsabit and Isiolo (see Annex E2).
Baseline Survey of the Nawiri Resilience Food Security Activities in Kenya (Vol. I)
Findings 111
counties in participation in group-based credit programs, but participation in group-based savings is higher in Isiolo compared to Marsabit (Isiolo, 5.6%; Marsabit, 0.6%, p < 0.05).
In the Nawiri (Mercy Corps) RFSA areas, households in Samburu (12.7%) have a roughly 10percentage point higher rate of participation in group-based savings, micro-finance, or lending programs compared to households in Turkana (2.9%) (p < 0.001). This difference is driven by more frequent participation principally in savings groups (Turkana, 1.4%; Samburu, 10.1%; p < 0.001), with participation rates also slightly higher in lending programs (Turkana, 2.2%; Samburu, 5.4%, p < 0.05).
Considering gendered-household type, female-only households in the Nawiri (Mercy Corps) RFSA areas (2.3%) have lower rates of participation in savings groups compared to male-only households (8.0%) and households with both males and females (4.5%). Female-only households in the Nawiri (Mercy Corps) RFSA areas (1.5%) also have lower rates of participation in credit/lending programs compared to households with both males and females (3.8%). In Samburu (Nawiri (Mercy Corps) RFSA areas), female-only households have lower rates of participation in savings groups (6.4%) than male-only households (17.6%) and households with both males and females (10.0%). Female-only households in Samburu (2.0%) also have lower rates of participation in credit/lending programs compared to households with both males and females (6.1%) and male-only households (8.2%).
3.9.6 Absorptive Capacity Index The absorptive capacity index reflects the ability of households to prepare for, deal with, and mitigate the impact of shocks and stressors on well-being outcomes. Absorptive capacity includes both preventive measures and positive coping strategies. The absorptive capacity is comprised of eight sub-indicators capturing various dimensions of resilience that enable households to absorb shocks and stresses.261
In the Nawiri (CRS) RFSA areas, the absorptive capacity index is higher on average for households in Isiolo (42.9) compared to households in Marsabit (33.0) (p < 0.001), as shown in Figure 54. Average values of sub-indicators that comprise the absorptive capacity index are also presented in Figure 54 (and for Nawiri (Mercy Corps) RFSA areas households in Figure 55),262 in ascending order of their relative contribution to overall resilience capacity as measured at the time of baseline, for households in Northern Kenya.263 All indicators in the figure are measured on scales ranging from 0-100. Availability of informal safety nets, asset ownership, and access to savings are the strongest contributors to absorptive capacity based on their factor loadings. Shock preparedness and mitigation capacity, as well as, bonding social capital also have considerable weight in the index, but marginally less than the aforementioned sub-indicators. Access to humanitarian assistance, access to remittances, and access to hazard insurance
261 For a detailed description of the methodology used to calculate resilience capacity sub-indicators and the resilience capacity indexes, see: https://www.fsnnetwork.org/sites/default/files/2021-03/Resilience%20and%20Resilience%20Capacities%20Measurement%20Options%20Full%20Approach%20Methodological%20Guide2021.pdf 262 See Annex F, Table A6.25a and A6.25b for the resilience capacity indices and indicators comprising absorptive capacity (raw and indexed). 263 The factor loadings represent the correlation of the sub-indicators with the overall index. Factor loadings greater than 0.30 to 0.40 are generally considered to have a sufficiently strong association with the index. (cit: Hair, Joseph F., Anderson, Rolph E., Black, William C. (2014). Multivariate Data Analysis (Ed. 7th). Harlow: Pearson)
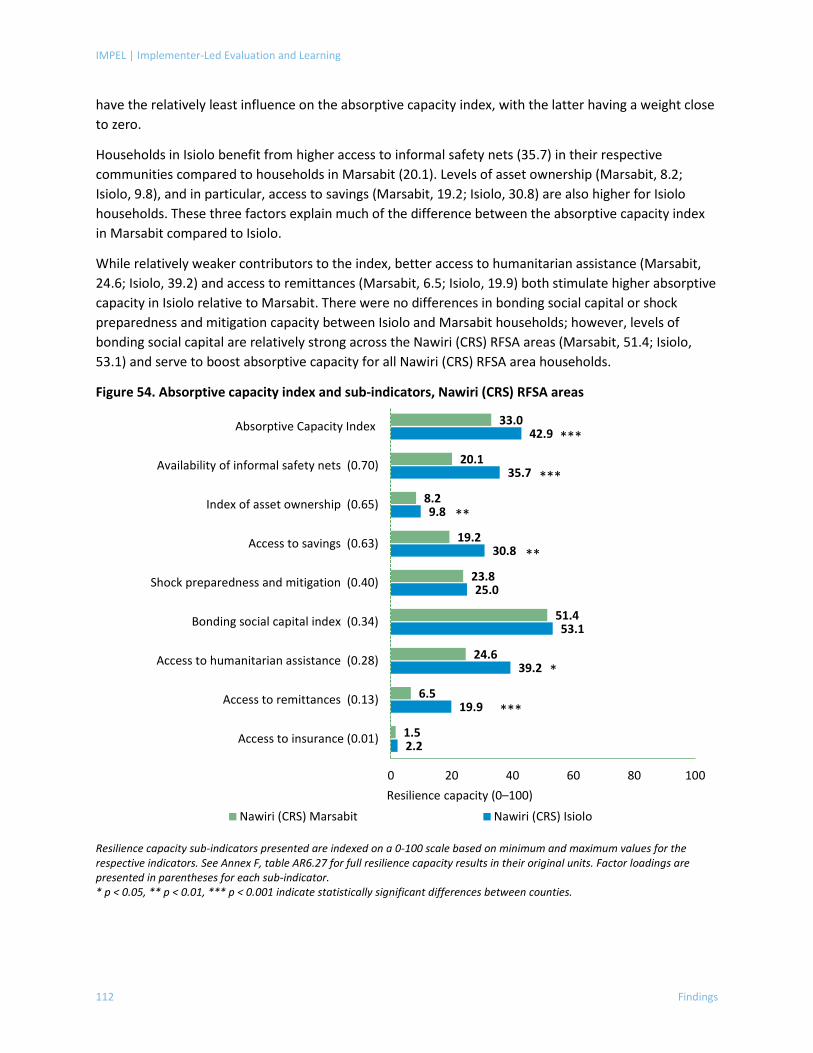
IMPEL | Implementer-Led Evaluation and Learning
112 Findings
have the relatively least influence on the absorptive capacity index, with the latter having a weight close to zero.
Households in Isiolo benefit from higher access to informal safety nets (35.7) in their respective communities compared to households in Marsabit (20.1). Levels of asset ownership (Marsabit, 8.2; Isiolo, 9.8), and in particular, access to savings (Marsabit, 19.2; Isiolo, 30.8) are also higher for Isiolo households. These three factors explain much of the difference between the absorptive capacity index in Marsabit compared to Isiolo.
While relatively weaker contributors to the index, better access to humanitarian assistance (Marsabit, 24.6; Isiolo, 39.2) and access to remittances (Marsabit, 6.5; Isiolo, 19.9) both stimulate higher absorptive capacity in Isiolo relative to Marsabit. There were no differences in bonding social capital or shock preparedness and mitigation capacity between Isiolo and Marsabit households; however, levels of bonding social capital are relatively strong across the Nawiri (CRS) RFSA areas (Marsabit, 51.4; Isiolo, 53.1) and serve to boost absorptive capacity for all Nawiri (CRS) RFSA area households.
Figure 54. Absorptive capacity index and sub-indicators, Nawiri (CRS) RFSA areas
* p < 0.05, ** p < 0.01, *** p < 0.001 indicate statistically significant differences between counties.
2.2
19.9
39.2
53.1
25.0
30.8
9.8
35.7
42.9
1.5
6.5
24.6
51.4
23.8
19.2
8.2
20.1
33.0
0 20 40 60 80 100
Access to insurance (0.01)
Access to remittances (0.13)
Access to humanitarian assistance (0.28)
Bonding social capital index (0.34)
Shock preparedness and mitigation (0.40)
Access to savings (0.63)
Index of asset ownership (0.65)
Availability of informal safety nets (0.70)
Absorptive Capacity Index
Resilience capacity (0–100)
Nawiri (CRS) Marsabit Nawiri (CRS) Isiolo
Resilience capacity sub-indicators presented are indexed on a 0-100 scale based on minimum and maximum values for the respective indicators. See Annex F, table AR6.27 for full resilience capacity results in their original units. Factor loadings are presented in parentheses for each sub-indicator.
***
***
**
**
*
***
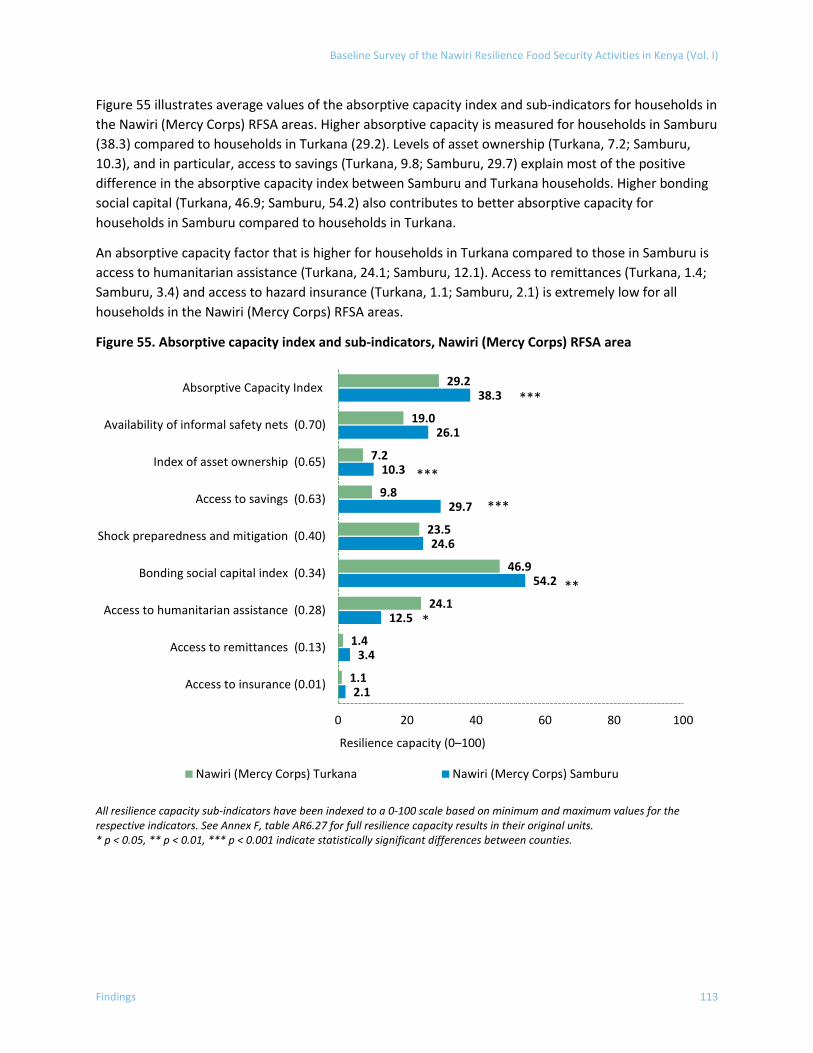
Baseline Survey of the Nawiri Resilience Food Security Activities in Kenya (Vol. I)
Findings 113
Figure 55 illustrates average values of the absorptive capacity index and sub-indicators for households in the Nawiri (Mercy Corps) RFSA areas. Higher absorptive capacity is measured for households in Samburu (38.3) compared to households in Turkana (29.2). Levels of asset ownership (Turkana, 7.2; Samburu, 10.3), and in particular, access to savings (Turkana, 9.8; Samburu, 29.7) explain most of the positive difference in the absorptive capacity index between Samburu and Turkana households. Higher bonding social capital (Turkana, 46.9; Samburu, 54.2) also contributes to better absorptive capacity for households in Samburu compared to households in Turkana.
An absorptive capacity factor that is higher for households in Turkana compared to those in Samburu is access to humanitarian assistance (Turkana, 24.1; Samburu, 12.1). Access to remittances (Turkana, 1.4; Samburu, 3.4) and access to hazard insurance (Turkana, 1.1; Samburu, 2.1) is extremely low for all households in the Nawiri (Mercy Corps) RFSA areas.
Figure 55. Absorptive capacity index and sub-indicators, Nawiri (Mercy Corps) RFSA area
All resilience capacity sub-indicators have been indexed to a 0-100 scale based on minimum and maximum values for the respective indicators. See Annex F, table AR6.27 for full resilience capacity results in their original units. * p < 0.05, ** p < 0.01, *** p < 0.001 indicate statistically significant differences between counties.
2.1
3.4
12.5
54.2
24.6
29.7
10.3
26.1
38.3
1.1
1.4
24.1
46.9
23.5
9.8
7.2
19.0
29.2
0 20 40 60 80 100
Access to insurance (0.01)
Access to remittances (0.13)
Access to humanitarian assistance (0.28)
Bonding social capital index (0.34)
Shock preparedness and mitigation (0.40)
Access to savings (0.63)
Index of asset ownership (0.65)
Availability of informal safety nets (0.70)
Absorptive Capacity Index
Resilience capacity (0–100)
Nawiri (Mercy Corps) Turkana Nawiri (Mercy Corps) Samburu
***
***
***
**
*
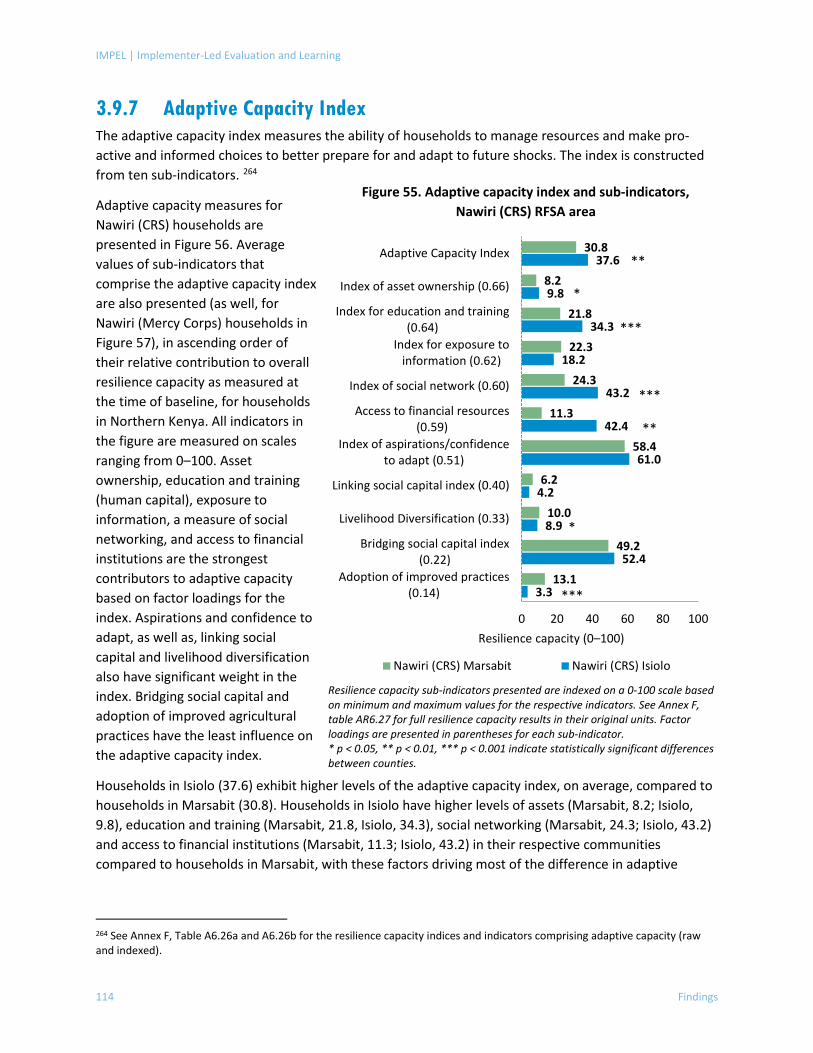
IMPEL | Implementer-Led Evaluation and Learning
114 Findings
3.9.7 Adaptive Capacity Index The adaptive capacity index measures the ability of households to manage resources and make pro-active and informed choices to better prepare for and adapt to future shocks. The index is constructed from ten sub-indicators. 264
Adaptive capacity measures for Nawiri (CRS) households are presented in Figure 56. Average values of sub-indicators that comprise the adaptive capacity index are also presented (as well, for Nawiri (Mercy Corps) households in Figure 57), in ascending order of their relative contribution to overall resilience capacity as measured at the time of baseline, for households in Northern Kenya. All indicators in the figure are measured on scales ranging from 0–100. Asset ownership, education and training (human capital), exposure to information, a measure of social networking, and access to financial institutions are the strongest contributors to adaptive capacity based on factor loadings for the index. Aspirations and confidence to adapt, as well as, linking social capital and livelihood diversification also have significant weight in the index. Bridging social capital and adoption of improved agricultural practices have the least influence on the adaptive capacity index.
Households in Isiolo (37.6) exhibit higher levels of the adaptive capacity index, on average, compared to households in Marsabit (30.8). Households in Isiolo have higher levels of assets (Marsabit, 8.2; Isiolo, 9.8), education and training (Marsabit, 21.8, Isiolo, 34.3), social networking (Marsabit, 24.3; Isiolo, 43.2) and access to financial institutions (Marsabit, 11.3; Isiolo, 43.2) in their respective communities compared to households in Marsabit, with these factors driving most of the difference in adaptive
264 See Annex F, Table A6.26a and A6.26b for the resilience capacity indices and indicators comprising adaptive capacity (raw and indexed).
Figure 55. Adaptive capacity index and sub-indicators, Nawiri (CRS) RFSA area
Resilience capacity sub-indicators presented are indexed on a 0-100 scale based on minimum and maximum values for the respective indicators. See Annex F, table AR6.27 for full resilience capacity results in their original units. Factor loadings are presented in parentheses for each sub-indicator. * p < 0.05, ** p < 0.01, *** p < 0.001 indicate statistically significant differences between counties.
3.3
52.4
8.9
4.2
61.0
42.4
43.2
18.2
34.3
9.8
37.6
13.1
49.2
10.0
6.2
58.4
11.3
24.3
22.3
21.8
8.2
30.8
0 20 40 60 80 100
Adoption of improved practices(0.14)
Bridging social capital index(0.22)
Livelihood Diversification (0.33)
Linking social capital index (0.40)
Index of aspirations/confidenceto adapt (0.51)
Access to financial resources(0.59)
Index of social network (0.60)
Index for exposure toinformation (0.62)
Index for education and training(0.64)
Index of asset ownership (0.66)
Adaptive Capacity Index
Resilience capacity (0–100)
Nawiri (CRS) Marsabit Nawiri (CRS) Isiolo
***
***
**
***
**
*
*
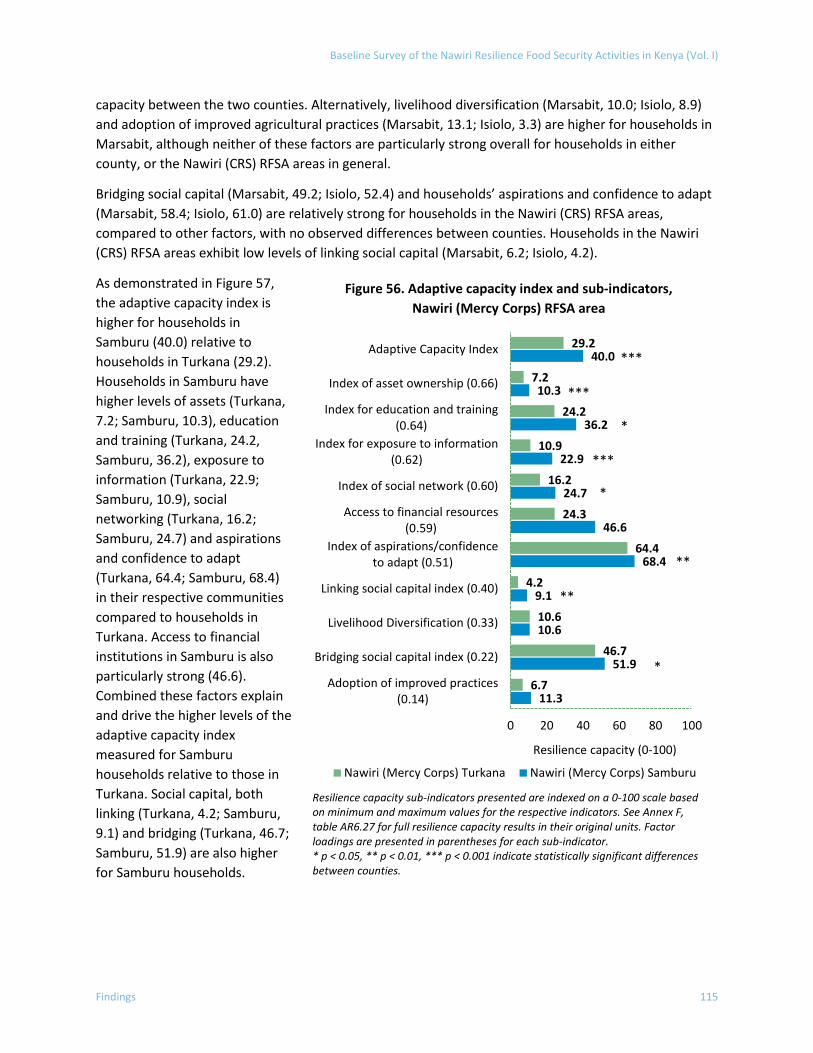
Baseline Survey of the Nawiri Resilience Food Security Activities in Kenya (Vol. I)
Findings 115
capacity between the two counties. Alternatively, livelihood diversification (Marsabit, 10.0; Isiolo, 8.9) and adoption of improved agricultural practices (Marsabit, 13.1; Isiolo, 3.3) are higher for households in Marsabit, although neither of these factors are particularly strong overall for households in either county, or the Nawiri (CRS) RFSA areas in general.
Bridging social capital (Marsabit, 49.2; Isiolo, 52.4) and households’ aspirations and confidence to adapt (Marsabit, 58.4; Isiolo, 61.0) are relatively strong for households in the Nawiri (CRS) RFSA areas, compared to other factors, with no observed differences between counties. Households in the Nawiri (CRS) RFSA areas exhibit low levels of linking social capital (Marsabit, 6.2; Isiolo, 4.2).
As demonstrated in Figure 57, the adaptive capacity index is higher for households in Samburu (40.0) relative to households in Turkana (29.2). Households in Samburu have higher levels of assets (Turkana, 7.2; Samburu, 10.3), education and training (Turkana, 24.2, Samburu, 36.2), exposure to information (Turkana, 22.9; Samburu, 10.9), social networking (Turkana, 16.2; Samburu, 24.7) and aspirations and confidence to adapt (Turkana, 64.4; Samburu, 68.4) in their respective communities compared to households in Turkana. Access to financial institutions in Samburu is also particularly strong (46.6). Combined these factors explain and drive the higher levels of the adaptive capacity index measured for Samburu households relative to those in Turkana. Social capital, both linking (Turkana, 4.2; Samburu, 9.1) and bridging (Turkana, 46.7; Samburu, 51.9) are also higher for Samburu households.
Figure 56. Adaptive capacity index and sub-indicators, Nawiri (Mercy Corps) RFSA area
Resilience capacity sub-indicators presented are indexed on a 0-100 scale based on minimum and maximum values for the respective indicators. See Annex F, table AR6.27 for full resilience capacity results in their original units. Factor loadings are presented in parentheses for each sub-indicator. * p < 0.05, ** p < 0.01, *** p < 0.001 indicate statistically significant differences between counties.
11.3
51.9
10.6
9.1
68.4
46.6
24.7
22.9
36.2
10.3
40.0
6.7
46.7
10.6
4.2
64.4
24.3
16.2
10.9
24.2
7.2
29.2
0 20 40 60 80 100
Adoption of improved practices(0.14)
Bridging social capital index (0.22)
Livelihood Diversification (0.33)
Linking social capital index (0.40)
Index of aspirations/confidenceto adapt (0.51)
Access to financial resources(0.59)
Index of social network (0.60)
Index for exposure to information(0.62)
Index for education and training(0.64)
Index of asset ownership (0.66)
Adaptive Capacity Index
Resilience capacity (0-100)
Nawiri (Mercy Corps) Turkana Nawiri (Mercy Corps) Samburu
***
***
*
***
*
**
**
*
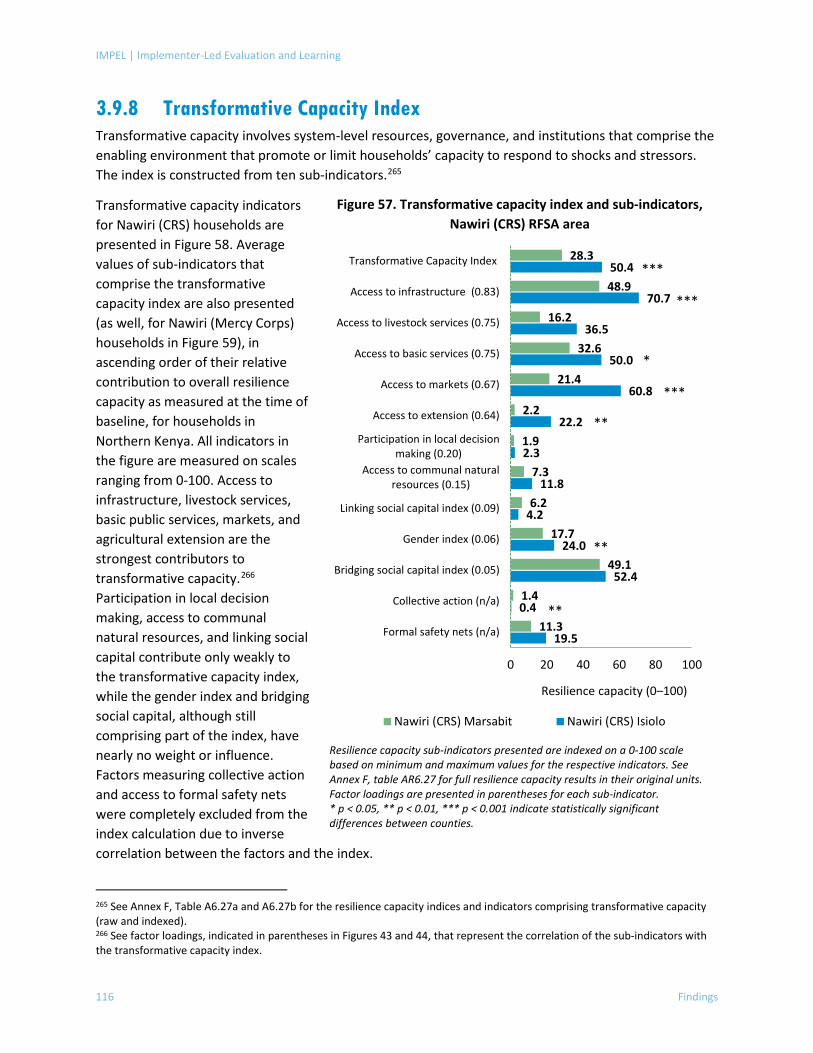
IMPEL | Implementer-Led Evaluation and Learning
116 Findings
3.9.8 Transformative Capacity Index Transformative capacity involves system-level resources, governance, and institutions that comprise the enabling environment that promote or limit households’ capacity to respond to shocks and stressors. The index is constructed from ten sub-indicators.265
Transformative capacity indicators for Nawiri (CRS) households are presented in Figure 58. Average values of sub-indicators that comprise the transformative capacity index are also presented (as well, for Nawiri (Mercy Corps) households in Figure 59), in ascending order of their relative contribution to overall resilience capacity as measured at the time of baseline, for households in Northern Kenya. All indicators in the figure are measured on scales ranging from 0-100. Access to infrastructure, livestock services, basic public services, markets, and agricultural extension are the strongest contributors to transformative capacity.266 Participation in local decision making, access to communal natural resources, and linking social capital contribute only weakly to the transformative capacity index, while the gender index and bridging social capital, although still comprising part of the index, have nearly no weight or influence. Factors measuring collective action and access to formal safety nets were completely excluded from the index calculation due to inverse correlation between the factors and the index.
265 See Annex F, Table A6.27a and A6.27b for the resilience capacity indices and indicators comprising transformative capacity (raw and indexed). 266 See factor loadings, indicated in parentheses in Figures 43 and 44, that represent the correlation of the sub-indicators with the transformative capacity index.
Figure 57. Transformative capacity index and sub-indicators, Nawiri (CRS) RFSA area
Resilience capacity sub-indicators presented are indexed on a 0-100 scale based on minimum and maximum values for the respective indicators. See Annex F, table AR6.27 for full resilience capacity results in their original units. Factor loadings are presented in parentheses for each sub-indicator. * p < 0.05, ** p < 0.01, *** p < 0.001 indicate statistically significant differences between counties.
19.5
0.4
52.4
24.0
4.2
11.8
2.3
22.2
60.8
50.0
36.5
70.7
50.4
11.3
1.4
49.1
17.7
6.2
7.3
1.9
2.2
21.4
32.6
16.2
48.9
28.3
0 20 40 60 80 100
Formal safety nets (n/a)
Collective action (n/a)
Bridging social capital index (0.05)
Gender index (0.06)
Linking social capital index (0.09)
Access to communal naturalresources (0.15)
Participation in local decisionmaking (0.20)
Access to extension (0.64)
Access to markets (0.67)
Access to basic services (0.75)
Access to livestock services (0.75)
Access to infrastructure (0.83)
Transformative Capacity Index
Resilience capacity (0–100)
Nawiri (CRS) Marsabit Nawiri (CRS) Isiolo
***
***
*
***
**
**
**
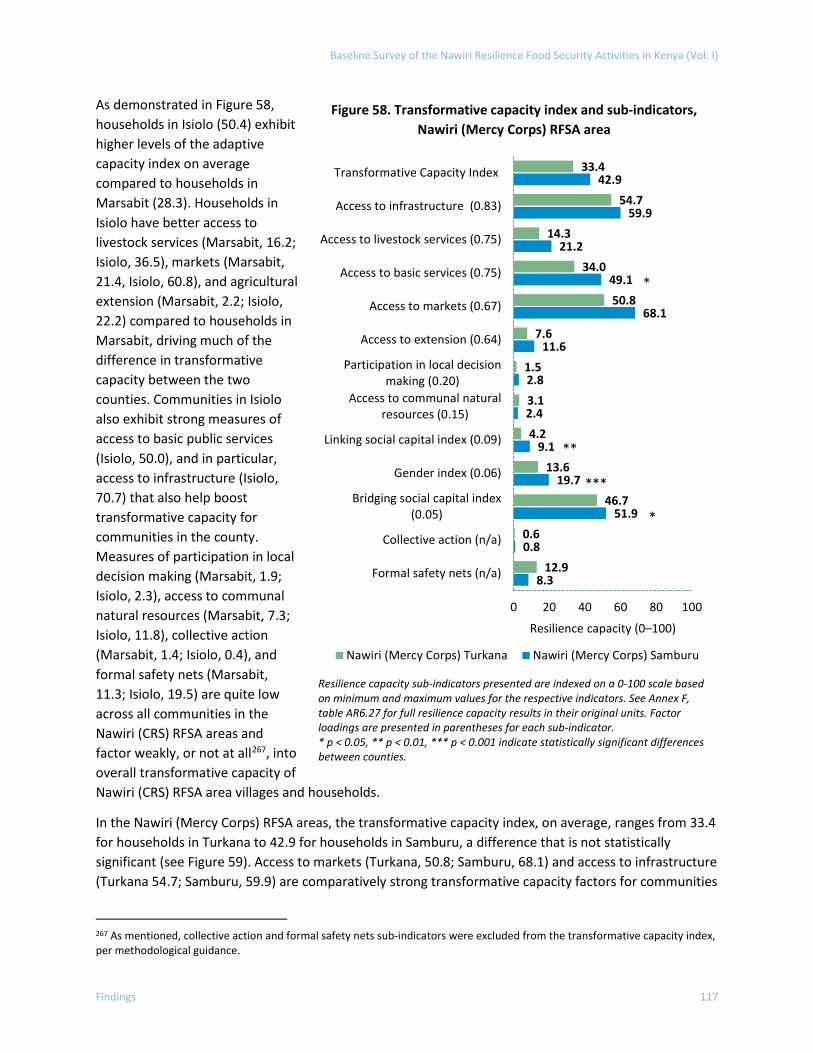
Baseline Survey of the Nawiri Resilience Food Security Activities in Kenya (Vol. I)
Findings 117
As demonstrated in Figure 58, households in Isiolo (50.4) exhibit higher levels of the adaptive capacity index on average compared to households in Marsabit (28.3). Households in Isiolo have better access to livestock services (Marsabit, 16.2; Isiolo, 36.5), markets (Marsabit, 21.4, Isiolo, 60.8), and agricultural extension (Marsabit, 2.2; Isiolo, 22.2) compared to households in Marsabit, driving much of the difference in transformative capacity between the two counties. Communities in Isiolo also exhibit strong measures of access to basic public services (Isiolo, 50.0), and in particular, access to infrastructure (Isiolo, 70.7) that also help boost transformative capacity for communities in the county. Measures of participation in local decision making (Marsabit, 1.9; Isiolo, 2.3), access to communal natural resources (Marsabit, 7.3; Isiolo, 11.8), collective action (Marsabit, 1.4; Isiolo, 0.4), and formal safety nets (Marsabit, 11.3; Isiolo, 19.5) are quite low across all communities in the Nawiri (CRS) RFSA areas and factor weakly, or not at all267, into overall transformative capacity of Nawiri (CRS) RFSA area villages and households.
In the Nawiri (Mercy Corps) RFSA areas, the transformative capacity index, on average, ranges from 33.4 for households in Turkana to 42.9 for households in Samburu, a difference that is not statistically significant (see Figure 59). Access to markets (Turkana, 50.8; Samburu, 68.1) and access to infrastructure (Turkana 54.7; Samburu, 59.9) are comparatively strong transformative capacity factors for communities
267 As mentioned, collective action and formal safety nets sub-indicators were excluded from the transformative capacity index, per methodological guidance.
Figure 58. Transformative capacity index and sub-indicators, Nawiri (Mercy Corps) RFSA area
Resilience capacity sub-indicators presented are indexed on a 0-100 scale based on minimum and maximum values for the respective indicators. See Annex F, table AR6.27 for full resilience capacity results in their original units. Factor loadings are presented in parentheses for each sub-indicator. * p < 0.05, ** p < 0.01, *** p < 0.001 indicate statistically significant differences between counties.
8.3
0.8
51.9
19.7
9.1
2.4
2.8
11.6
68.1
49.1
21.2
59.9
42.9
12.9
0.6
46.7
13.6
4.2
3.1
1.5
7.6
50.8
34.0
14.3
54.7
33.4
0 20 40 60 80 100
Formal safety nets (n/a)
Collective action (n/a)
Bridging social capital index(0.05)
Gender index (0.06)
Linking social capital index (0.09)
Access to communal naturalresources (0.15)
Participation in local decisionmaking (0.20)
Access to extension (0.64)
Access to markets (0.67)
Access to basic services (0.75)
Access to livestock services (0.75)
Access to infrastructure (0.83)
Transformative Capacity Index
Resilience capacity (0–100)
Nawiri (Mercy Corps) Turkana Nawiri (Mercy Corps) Samburu
*
**
***
*
IMPEL | Implementer-Led Evaluation and Learning
118 Findings
in the Nawiri (Mercy Corps) RFSA areas, while access to livestock services (Turkana, 14.3; Samburu, 21.2), formal safety nets (Turkana, 12.9; Samburu, 8.3), agricultural extension (Turkana, 7.6; Samburu, 11.6), communal natural resources (Turkana, 3.1; Samburu, 2.4), participation in local decision-making (Turkana, 1.5; Samburu, 2.8), and collective action (Turkana, 0.6; Samburu, 0.8) are all factors with low observed levels across communities in the Nawiri (Mercy Corps) RFSA areas.
Baseline Survey of the Nawiri Resilience Food Security Activities in Kenya (Vol. I)
Conclusions 119
CONCLUSIONS This section draws conclusions on the status of food security and nutrition in the RFSA areas based on the baseline survey results and desk review of the formative research conducted by the Nawiri RFSAs.
Most households in the RFSA areas are food insecure, and few women and children achieve minimum recommended levels of dietary diversity. Food insecurity and dietary diversity differ markedly between counties within each RFSA area. Households in Marsabit are more frequently categorized as severely food insecure compared to households in Isiolo, and households in Turkana are more likely to be severely food insecure than households in Samburu. Women and children in Marsabit and Turkana are less likely to consume adequately diverse diets compared to women and children in Isiolo and Samburu, respectively. Findings from the extensive Nawiri formative research point to a myriad of individual, cultural, environmental, infrastructure and policy factors that underpin current levels of food security and nutrition and offer insights for potential pathways to reducing food security and malnutrition.
Households across the RFSA areas rely heavily on staples (e.g., sorghum, millet, rice, potatoes, miritchi, garin rogo, and other roots and tubers), as well as oil, and sugar, which are consumed about 4–5 days per week if not daily. Dairy products are consumed frequently by households in Marsabit, Isiolo and Samburu, though this may relate to the overlap in the timing of the survey and seasonality in milk production. Household-level intake of plant and animal-based protein, fruits and vegetables is infrequent (less than 2 days per week).
The data on women’s and children’s dietary diversity are consistent with these findings on household consumption. Most women of reproductive age and children under 2 consume grains, roots, and tubers. Dairy consumption by these groups is moderate to high in all counties except Turkana. Few women and children consume plant or animal-based proteins, eggs, nuts and seeds, fruits, or vegetables. The Nawiri desk study finds that reliance on purchased foods, lack of access to markets because of distance and cost of transportation, lack of variety of foods in markets, high food prices, and general poverty are some of the most important factors influencing nutrition and diets in the RFSA areas. These factors have been exacerbated by drought conditions and the ongoing COVID-19 pandemic, which has disrupted markets. In fact, drought and increasing food prices were the most prevalent shocks among households in the RFSA areas in the 12 months prior to the survey.
Access to adequate WASH facilities, which are expected to foster better health and nutrition outcomes, is low throughout the RFSA areas and marked by notable disparities between counties. Variations in the WASH facilities are possibly attributable to differences in the operating contexts, such as availability and cost of materials and urban-rural differences. Additional analyses underscore the importance of investing in WASH as a pathway for improving health and nutrition: results show a lower prevalence of diarrhea among children living in households that correctly treat water prior to drinking, have access to basic sanitation services, or have access to a handwashing station with water and soap or ash.
Uptake of practices that are expected to contribute to food security and nutrition (e.g., by enhancing productivity, profitability, and household income) is low, in particular financial services, adoption of improvement management practices or use of value chain activities. Participation in group-based savings, microfinance or lending programs was quite low. A minority of farmers accessed any
IMPEL | Implementer-Led Evaluation and Learning
120 Conclusions
agriculture-related financial services (credit, savings, insurance). Farmers were more likely to participate in an agricultural saving scheme than to take out agricultural credit or insurance. The most-adopted improved management practices among crop farmers were the application of organic manure, use of improved or certified seeds, rotating crops with nitrogen-fixing legumes, use of early drought warning information, and minimum tillage practices. However, these practices were adopted by only a minority of farmers. Almost no farmers applied improved post-harvest handling and storage practices. The most common practices among livestock producers included use of livestock services and products, improved shelters, and set grazing areas. However, the scale of application of these practices differed by livestock (cattle, goat, camel) and county. The least-adopted practices included the use of improved calving techniques, improved milking techniques, more-nutritious pasture varieties, improved fodder production, fencing off pasture plots, rehabilitation of degraded grazing lands, reseeding with drought-resistant grass species, and use of water pans or sand dams or rock catchments.
Household food security and women and children’s dietary diversity were higher among households that accessed financial services or adopted certain improved agricultural management practices or value chain activities. However, these results are based on exploratory analyses and should be interpreted with caution, given many of the findings rely on small samples.
Trends in maternal, infant, and young child feeding practices are better understood in the context of prevailing cultural beliefs and gender norms around feeding practices, early marriage and childbearing, and household decision-making. For example, one of the cultural norms affecting women’s food intake is that fathers or male household heads are expected to eat first, then children; women eat last, after the youngest children are fed. There are also several beliefs and practices inhibiting the adoption of target breastfeeding practices, such as stopping breastfeeding a child with diarrhea because breastmilk causes diarrhea or discarding colostrum because it is unclean and/or will prevent the newborn from becoming strong; and delaying the initiation of breastfeeding to allow for the performance of traditional birth ceremonies and rituals. While the baseline data on breastfeeding show that over one-half of children under 6 months in the RFSA areas are breastfed exclusively, the prevalence of exclusive breastfeeding tapers off well before the age of 6 months, prior to the recommended timeframe for introducing complementary foods and other liquids.
An additional important context is the prevalence of early motherhood, which is tied to early marriage (10–15 years), which though illegal, is widespread due to social norms. Tackling persistent malnutrition will thus require a focus on adolescent pregnancy and early motherhood.
Use of modern contraception, which can contribute to improving women and children’s health, is low. While most women of reproductive age are aware of methods to avoid or delay pregnancy, the majority do not use any form of contraception. Women’s health-seeking behaviors around reproductive health and contraception are impacted by misinformation or lack of information on contraceptives or reproductive health services, lack of youth-friendly services at health facilities, long distances to health facilities, confidentiality concerns, unavailability of services and/or stock-out of contraceptives, and service fees. The decision to use family planning is heavily impacted by men, who typically make decisions about how many children to have and child spacing. Addressing these myriad factors inhibiting women’s knowledge of, access to, and decision-making power over the use of contraceptives can help improve safe and voluntary use of family planning.
Baseline Survey of the Nawiri Resilience Food Security Activities in Kenya (Vol. I)
Conclusions 121
Women’s access to income, and decision-making on household income, are low. Although men are culturally perceived to be the providers, purchasing or otherwise obtaining food for the household is largely the domain of women. Although most women in a union participate in decisions on self-earned cash, women's lack of asset ownership and relatively low participation in cash-earning opportunities make it difficult for women to obtain cash or access credit in times of need to feed their families. Less than one-half of women participate in decisions over the use of their partner’s self-earned cash. Improving women’s access to, and decision-making power over, household income is a critical factor in the nutrition of household members.
IMPEL | Implementer-Led Evaluation and Learning
122 References
REFERENCES Birch, I. (2020). Desk Review: Natural Resource Management and Nutrition. Feinstein International Center, Tufts University. Draft.
Burns, J., Catley, A., & Mahmoud, H. (2021a). Women’s knowledge on the seasonality and causes of child malnutrition in Marsabit County, Kenya. USAID Nawiri project.
Burns, J., Catley, A., & Mahmoud, H. (2021b). Using Participatory Epidemiology to Investigate the Causes and Seasonality of Acute Malnutrition in Marsabit and Isiolo Counties, Northern Kenya: Methods and Experiences. Feinstein International Center, Friedman School of Nutrition Science and Policy at Tufts University Nawiri project.
CRS. (2021). USAID Nawiri Gender Youth and Social Dynamics Analysis to Explore Gender, Social and Cultural Norms Associated with Acute Malnutrition in Isiolo and Marsabit Counties of Kenya. Final Report. CRS, Nairobi, Kenya.
FEWS NET. (2021). Food Security Outlook: Below-average short rains drive food insecurity across pastoral regions. https://fews.net/east-africa/kenya/food-security-outlook/october-2021
Government of Kenya. (2020). Isiolo County Integrated SMART Survey Report.
Government of Kenya. (2019a) Samburu County Integrated SMART Survey Report.
Government of Kenya. (2019b) Turkana County Integrated SMART Survey Report.
Government of Kenya. (2019c) Marsabit County Integrated SMART Survey Report.
Lengoiboni, M., van der Molen, P., & Bregt, A. K. (2011). Pastoralism within the Cadastral System: Seasonal Interactions and Access Agreements between Pastoralists and Non-Pastoralists in Northern Kenya. Journal of Arid Environments, 75, 477–486. doi:10.1016/j.jaridenv.2010.12.011
Lengoiboni, M., Bregt, A. K., & van der Molen, P. (2010). Pastoralism within Land Administration in Kenya—The Missing Link. Land Use Policy, 27, 579-588. doi:10.1016/j.landusepol.2009.07.013
Mahmoud, H., Burns, J., & Catley, A. (2021). Women’s knowledge on the seasonality and causes of child malnutrition in Isiolo County, Kenya. USAID Nawiri project.
Marshak, A. (2021). Nawiri Desk Study: Drivers of acute malnutrition in the Kenya arid and semi-arid lands.
Mercy Corps USAID Nawiri Consortium. (2021a). Cost of Diet Study in The Lake Turkana Fisheries and Lodwar Urban Livelihood Zones of Turkana County, Kenya.
Mercy Corps Nawiri Consortium. (2021b). Water Sanitation and Hygiene (WASH) Bottleneck Analysis (BAT) Workshop. Samburu County.
Mercy Corps USAID Nawiri Consortium. (2021c). Water Sector Desk Review—Samburu and Turkana Counties.
Baseline Survey of the Nawiri Resilience Food Security Activities in Kenya (Vol. I)
References 123
Mercy Corps Nawiri Consortium. (2021d). Strengthening Policy and Institutional Governance for Improved Nutrition Outcomes: Political Economy Analysis of Samburu County.
Mercy Corps Nawiri Consortium. (2021e). Strengthening Policy and Institutional Governance for Improved Nutrition Outcomes: Political Economy Analysis of Turkana County.
Mercy Corps Nawiri Consortium. (2021f). Examining the Complex Dynamics Influencing Acute Malnutrition in Turkana County–A Longitudinal Mixed-Methods Study to Support Community-Driven Activity Design. Baseline Report of Findings from the Quantitative Survey Component.
Mercy Corps Nawiri Consortium. (2021g). Examining the Complex Dynamics Influencing Acute Malnutrition in Samburu County–A Longitudinal Mixed-Methods Study to Support Community-Driven Activity Design. Baseline Report of Findings from the Quantitative Survey Component.
National Bureau of Statistics-Kenya and ICF International. (2016). 2014 Kenya Demographic and Health Survey Atlas of County-level Health Indicators. Rockville, Maryland, USA: KNBS and ICF International. https://www.dhsprogram.com/pubs/pdf/ATR16/ATR16.pdf
Radday, A., Young, H., & Marshak, A. (2021). A Preliminary Stakeholder Analysis for Addressing Global Acute Malnutrition in the Kenyan ASALs.
Stites, E. (2021). Nawiri Desk Study. Livelihood Systems in Isiolo and Marsabit County.
Technical Working Group (TWG) on Community Health Systems for the USAID Nawiri Project. (2021). Landscape Analysis and Stakeholder Mapping of Turkana and Samburu Counties, Kenya: Individual, Interpersonal, Community, and Structural Influences that Shape Adolescent Pregnancy and Childbearing.
USAID. (2021a). Maternal, Infant and Young Child Nutrition (MIYCN) Desk Review. June 2021. Prepared by the Technical Working Group on Maternal, Infant, and Young Child Nutrition (MIYCN) for the USAID Nawiri Project.
USAID. (2021b). Bureau for Humanitarian Assistance Indicator Handbook. Part I: Indicators for Baseline and Endline Surveys for Resilience Food Security Activities. https://www.usaid.gov/humanitarian-assistance/documents/indicators-Baseline-survey
WHO. (2004). Standards for Maternal and Newborn Health: Provision of Effective Antenatal Care (Section 1.6). Geneva, Switzerland: World Health Organization. http://whqlibdoc.who.int/hq/2007/a91272.pdf.
Related Documents