BASELINE STUDY REPORT Feasibility Study on Pasture Use Fee CENTRE FOR POLICY RESEARCH 2 nd floor, Inter-office building, Prime Minister Amar street 4, Sukhbaatar district 8, Ulaanbaatar 14200, Phone: (+976) 70117044 Fax: (+976 ) 70119419, e-mail: [email protected] Web: www.cpr.mn 07 November 2017 Ulaanbaatar

Welcome message from author
This document is posted to help you gain knowledge. Please leave a comment to let me know what you think about it! Share it to your friends and learn new things together.
Transcript

BASELINE STUDY REPORT Feasibility Study on Pasture Use Fee
CENTRE FOR POLICY RESEARCH
2nd floor, Inter-office building, Prime Minister Amar street 4, Sukhbaatar district 8, Ulaanbaatar 14200, Phone: (+976) 70117044 Fax: (+976 ) 70119419, e-mail: [email protected] Web: www.cpr.mn
07 November 2017
Ulaanbaatar
1
TABLE OF CONTENT
1. Review of existing literature on the ecosystem vulnerability with regard
to carrying capacity 2
2. Biodiversity concerns including critical habitat of the wildlife 6
3. Current situation of land degradation and existing methodologies for
determining pasture conditions and/or carrying capacity 10
4. Analysis of herder household income and livelihood in relation to number of livestock
and herd structure and to market location and infrastructure
Availability 19

2
1. Review of existing literature on the ecosystem vulnerability with
regard to carrying capacity
Grasslands ecosystems occur in regions that are too dry for forests but that have sufficient soil
water to support a closed herbaceous plant canopy that is lacking in deserts. Thus, temperate
grasslands usually start in areas with 25–100 cm of annual precipitation. About 32% of the Earth's
surface is covered with grasslands. In Mongolia, grassland or pastureland accounts for around
70% of the land territory. By a common definition, Mongolian rangeland encompasses an
extensive variety of ecosystems, including high mountains, mountain forests, mountain steppe,
steppe, desert steppe, desert, alluvial meadows, and lowlands.
Grassland ecosystems are very important for a wide variety of different reasons like:
Habitat. Grassland ecosystems are key habitats for a vast range of biodiversity
Soil quality. The delicate balance of plants and animals in grassland ecosystems maintains
a soil quality. When sustainable use is not practiced the soil quality declines
Natural Beauty. Grassland ecosystems should be important to us, too, because they are
quite simply very beautiful open spaces
Large open space. The grassland ecosystem one of the largest and most important types
of ecosystem in the world
Cradle of pastoralism and nomadic civilization. Mongolian grasslands have been and still
are the key resources base for livestock – critical source for people’s livelihood for
thousands of years.
According some sources1,2 for Mongolia, healthy rangelands can contribute: (i) to the resilience
of livestock production. (ii) the herder community in the face of drought and natural disasters,
(iii) healthy rangelands promote greater overall forage and better nutrition for animals, (iv)
increased animal production (v) healthy rangelands promote well-fed, healthy animals coming
into winter that are better able to survive dzud/drought, and (vi) healthy animals also provide a
basis for marketing according to quality indicators in meat, hide, and the environment.
However, climate change and human interventions especially non-sustainable use pastureland
are threatening grassland ecosystems.
1 Information and Research Institute of Meteorology And Hydrology, SDC Green Gold project, 2015.
National report on the rangeland health of Mongolia 2 David R. Kemp, et al., 2013.‘Innovative Grassland Management Systems for Environmental and
Livelihood Benefits’, Proceedings of the National Academy of Sciences, 110 (2013)

3
The Intended Nationally Determined Contribution (INDC) Submission by Mongolia to the Ad-Hoc
Working Group on the Durban Platform for Enhanced Action (ADP)3 summarizes the key
statements of climate change trends, impacts and vulnerabilities of both the ecology and
ecosystems:
Approximately 70% of pastoral land has degraded, while changing plant composition.
Winter dzud (heavy snow, cold waves, storms etc.) risk is likely to increase leading to
more losses in livestock sector
The drying up of lakes, rivers and springs and melting of glaciers has intensified in the
last decades. The recent surface water resource inventory confirmed that 12% of rivers,
21% of lakes and 15% of springs have dried up. Water temperature and evaporation are
continuously increasing, leading to declining water resources.
The frequency of extreme weather phenomena has doubled in the last two decades.
This is expected to increase by 23-60% by the mid of the century as compared to present
conditions. Climate change assessments undertaken in Mongolia in 2009 and 2014,
demonstrated that fragile ecosystems, a reliance on pastoral animal husbandry and rain-fed
agriculture, and the growing population with a tendency of urbanization, all combine to make
Mongolia’s socio-economic development vulnerable to climate change4.
Chuluun, T., et al. 20175 assessed the ecological vulnerability for the first time in Mongolia.
Climate disasters and grazing intensity were two factors accounted for in this assessment.
Ecological vulnerability was high when both dzud risk (with previous summer drought) and
overgrazing are high. Based on findings of the assessment, an ecological vulnerability assessment
map was produced as shown below. The ecological vulnerability has increased enormously since
1994 and this increase occurred almost everywhere with exceptions being only eastern aimags.
3 Intended Nationally Determined Contribution (INDC) of Mongolia
http://www4.unfccc.int/submissions/INDC/Published%20Documents/Mongolia/1/150924_INDCs%20of
%20Mongolia.pdf 4 Ibid. 5 Chuluun, T., et al. 2017. Vulnerability_of_Pastoral_Social-Ecological_Systems_in_Mongolia.
at: https://www.researchgate.net/publication/316117395

4
1970-1990 1991-2008
Figure 1 Ecological vulnerability assessment of Mongolia, including Biophysical (drought,
dzud) and human (pasture degradation) impact
Source: Chuluun, T., et al. 2017. Vulnerability of Pastoral Social-Ecological Systems in Mongolia,
https://www.researchgate.net/publication/316117395
The assessment also included a long-term ecological vulnerability dynamics in ecological zones
of Mongolia.
Figure 2 Ecological vulnerability index in the Gobi zone was the highest relative to other
ecological zones, however it rapidly increased in the forest-steppe and steppe zones during the
last decade6.
The problem for Mongolian case is that the grassland ecosystems are used more intensive than
they can be recovered or renewed. Several indicators could tell if the stocking rate is too high or
too low, or how the pastureland ecosystem responds to grazing. For example high body condition
may indicate potential to increase stocking rate, and low body conditions may be an indicator of
a stocking rate that is too high. If desired forage species are declining in vigor or decreasing in
number, stocking rate may be too high7. Thus, the issues that practically highlight the linkages
between the potentials of ecosystem services and the pasture capacities via productivity and
other key land patterns are as follows:
Animal performance reduced
6 Chuluun, T., et al. Vulnerability assessment of Mongolian social ecological systems. In Proceedings of
4th International and National Workshop, Applications of Geo-informatics for Natural Resources and
Environment, Ulaanbaatar (pp. 1–11), 2010 7 Melvin George and David Lile. Stocking rate and carrying capacity, 2008
5
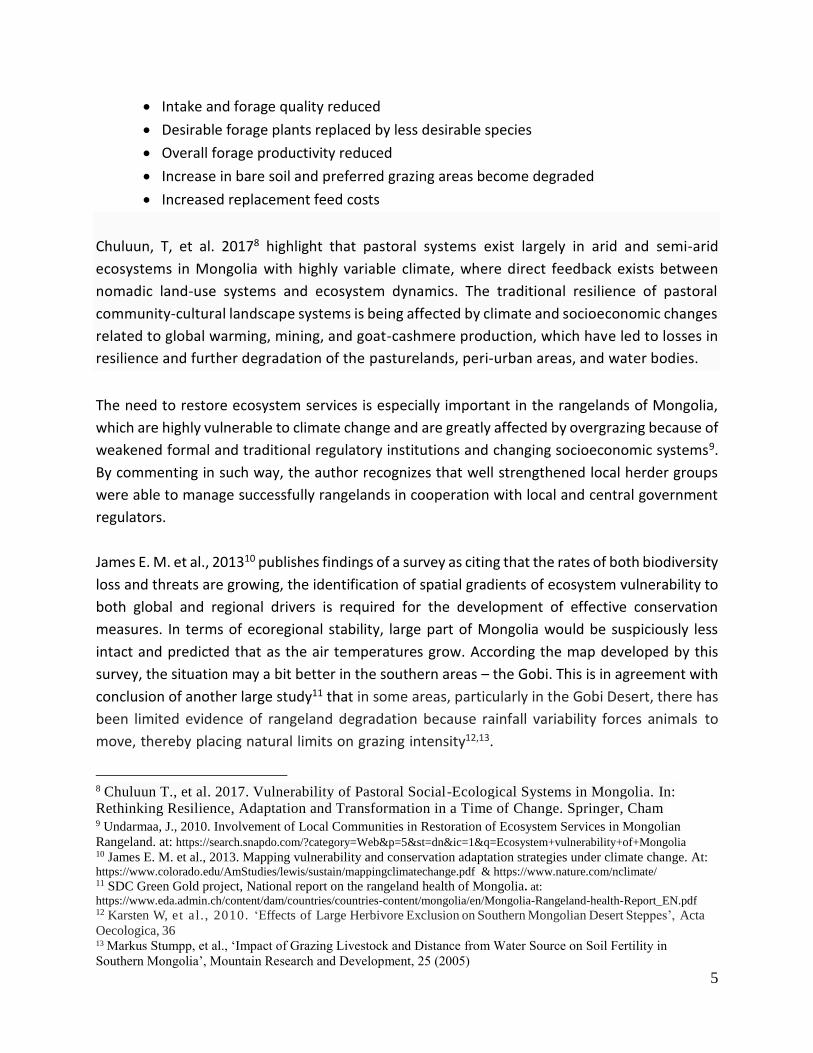
Intake and forage quality reduced
Desirable forage plants replaced by less desirable species
Overall forage productivity reduced
Increase in bare soil and preferred grazing areas become degraded
Increased replacement feed costs
Chuluun, T, et al. 20178 highlight that pastoral systems exist largely in arid and semi-arid
ecosystems in Mongolia with highly variable climate, where direct feedback exists between
nomadic land-use systems and ecosystem dynamics. The traditional resilience of pastoral
community-cultural landscape systems is being affected by climate and socioeconomic changes
related to global warming, mining, and goat-cashmere production, which have led to losses in
resilience and further degradation of the pasturelands, peri-urban areas, and water bodies.
The need to restore ecosystem services is especially important in the rangelands of Mongolia,
which are highly vulnerable to climate change and are greatly affected by overgrazing because of
weakened formal and traditional regulatory institutions and changing socioeconomic systems9.
By commenting in such way, the author recognizes that well strengthened local herder groups
were able to manage successfully rangelands in cooperation with local and central government
regulators.
James E. M. et al., 201310 publishes findings of a survey as citing that the rates of both biodiversity
loss and threats are growing, the identification of spatial gradients of ecosystem vulnerability to
both global and regional drivers is required for the development of effective conservation
measures. In terms of ecoregional stability, large part of Mongolia would be suspiciously less
intact and predicted that as the air temperatures grow. According the map developed by this
survey, the situation may a bit better in the southern areas – the Gobi. This is in agreement with
conclusion of another large study11 that in some areas, particularly in the Gobi Desert, there has
been limited evidence of rangeland degradation because rainfall variability forces animals to
move, thereby placing natural limits on grazing intensity12,13.
8 Chuluun T., et al. 2017. Vulnerability of Pastoral Social-Ecological Systems in Mongolia. In: Rethinking Resilience, Adaptation and Transformation in a Time of Change. Springer, Cham 9 Undarmaa, J., 2010. Involvement of Local Communities in Restoration of Ecosystem Services in Mongolian
Rangeland. at: https://search.snapdo.com/?category=Web&p=5&st=dn&ic=1&q=Ecosystem+vulnerability+of+Mongolia 10 James E. M. et al., 2013. Mapping vulnerability and conservation adaptation strategies under climate change. At: https://www.colorado.edu/AmStudies/lewis/sustain/mappingclimatechange.pdf & https://www.nature.com/nclimate/ 11 SDC Green Gold project, National report on the rangeland health of Mongolia. at:
https://www.eda.admin.ch/content/dam/countries/countries-content/mongolia/en/Mongolia-Rangeland-health-Report_EN.pdf 12 Karsten W, et al. , 2010. ‘Effects of Large Herbivore Exclusion on Southern Mongolian Desert Steppes’, Acta
Oecologica, 36 13 Markus Stumpp, et al., ‘Impact of Grazing Livestock and Distance from Water Source on Soil Fertility in
Southern Mongolia’, Mountain Research and Development, 25 (2005)

6
In Mongolia, overgrazing is commonly acknowledged as a major human-induced threat to the
grassland ecosystem in general and biodiversity in particular, a topic discussed in section 3.
2. Biodiversity concerns including critical habitat of the wildlife
The biodiversity of both domestic livestock and wildlife is closely correlated to the ecosystem
services and closely interrelated. Anthropogenic climate change is affecting ecosystems globally,
causing changes in phenology, species composition and range shifts14, while increasing
environmental degradation is leading to habitat fragmentation or loss. These two factors in
concert are likely to result in exacerbated biodiversity decline and extinction in the near future15.
In this connection, James E. M. et al., 201316 publishes findings of a survey that the rates of both
biodiversity loss and threats are growing; the identification of spatial gradients of ecosystem
vulnerability to both global and regional drivers is required for the development of effective
conservation measures. According the map developed by this survey, Mongolia may attain the
climate stability at lower level, where vegetation intactness would be vulnerable and the
ecoregional climate stability and vegetation intactness – high. In terms of ecoregional stability,
large part of Mongolia would be suspiciously less intact and predicted that as the air
temperatures grow, this indicator would go to more vulnerable gradient. The map shows that
the situation may a bit better in the southern areas – the Gobi. This is in agreement with
conclusion of another large study17 that in some areas, particularly in the Gobi Desert, there has
been limited evidence of rangeland degradation because rainfall variability forces animals to
move, thereby placing natural limits on grazing intensity18,19.
Changes in biodiversity affect the ability of ecosystems to supply services and to recover from
disturbances. When a species is added or lost at a particular location, the various ecosystem
services specifically associated with that species are changed.
14 Chen, I. C., Hill, J. K., Ohlemuller, R., Roy, D. B. & Thomas, C. D. 2011. Rapid range shifts of species associated
with high levels of climate warming. Science 333 15 Brook, B. W., Sodhi, N. S. & Bradshaw, C. J. A. Synergies among extinction drivers under global change. Trends
Ecol. Evol. 23, 453–460 (2008). 16 James E. M. et al., 2013. Mapping vulnerability and conservation adaptation strategies under climate change. At: https://www.colorado.edu/AmStudies/lewis/sustain/mappingclimatechange.pdf & https://www.nature.com/nclimate/ 17 SDC Green Gold project, National report on the rangeland health of Mongolia,
https://www.eda.admin.ch/content/dam/countries/countries-content/mongolia/en/Mongolia-Rangeland-
health-Report_EN.pdf 18 Karsten W, et al., 2010. ‘Effects of Large Herbivore Exclusion on Southern Mongolian Desert
Steppes’, Acta Oecologica, 36 19 Markus Stumpp, et al., ‘Impact of Grazing Livestock and Distance from Water Source on Soil Fertility
in Southern Mongolia’, Mountain Research and Development, 25 (2005)

7
Some sources20 describe that the fauna and flora in Mongolia, which are known well for their
richness, are being acutely threatened. Species and habitat loss, deforestation and forest
destruction, and the largely unregulated overuse of common pasture areas have produced a
complex situation of vulnerability that poses a growing threat to the continued existence of entire
ecosystems in co-existence with wildlife. Human-induced impacts, in combination with climate
change, are causing declines and extinctions of flora and fauna, and may cause irreversible
disrupt on of ecological functions and ecosystem services such as forage production, freshwater
supplies and soil fertility21.
It is known that the carrying capacity describes the maximum number of individuals or species a
specific environment's resources can sustain for an indefinite period of time without degrading
it. While there are small factors that may influence a particular environment - or habitat - from
time to time, four major factors affect the carrying capacity of the environment or pasture that
are feed availability, water sources, ecological conditions, and space. 22 Feed availability in any
habitat is paramount to survival of a species, both domestic and wild. Attention should be paid
to herbivores, grass eaters that can become stressed from a shortage of food in both amount and
quality.
They have the same grazing habits similar to that of domestic livestock - as will feed first on their
preferred feed, and then the staple feed that satisfies their nutritional needs. When no other
feeds are available, herbivores will “shift” on emergency feeds that will fill them up, but not
maintain their body condition and other bio-physiological functions. Water sources are an
attractive to both domestic and wild animals. Where water becomes scarce due to seasonal
availability or changes caused by man-made and climatic factors, feed may also become scarce
as plants die, wild animals die or leave the habitats, and the remaining animals compete for
whatever water is left. Ecological conditions within or adjacent to a habitat area also affect its
carrying capacity. For example, close location to human populations, pollution, natural disasters
and erosion and desertification of land and degradation of pasture in particular affects
environmental carrying capacity. Space, sufficient within habitats allows the animals that inhabit
it better opportunities to find adequate food and water. Without space, animals cannot ensure
a place to hide and raise their young and need space to rest, even to play.
The response of wildlife to domestic grazing varies by habitat. Livestock grazing can have direct
and indirect impacts on wildlife. Direct impacts include the removal and/or trampling of
vegetation that would otherwise be used for food and cover, and livestock-wildlife interactions
20 Biodiversity and adaptation of key forest ecosystems to climate change II 21 The Nature Conservancy ‘Identifying Conservation Priorities in the Face of Future Development’, 2011-2017 22 Lori Garrett-Hatfield, What Factors Affect the Carrying Capacity of an Environment?
http://education.seattlepi.com/factors-affect-carrying-capacity-environment-6190.html

8
that may result in wildlife displacement or disease transmission. As the case for many countries,
overcrowded invasion of domestic livestock into wildlife habitat affects the areas through hoof
action, pawing, wallowing and pawing and, grazing animals trample plants; break up soil surface,
damage seeds and compact soils. Indirect impacts result from changes in plant community
composition, structure, and productivity which together largely determine wildlife habitat
suitability23.
Under MMC Peri-urban Pastureland project, CPR has developed an inventory of pasture use,
which proposes forage needs of wildlife as an inseparable part of pasture feed utilization. To do
so, the wildlife population converts into sheep unit and their need in seasonal pasture forage is
calculated and put into annual pasture use plan24.
In 2011-2017, the Nature Conservancy has undertaken ecoregional assessments of major
ecological regions of Mongolia – Eastern Grasslands, Mongol Altai and Great Lakes Depression,
Hangai-Huvsgul and the Gobi - and prepared reports ‘Identifying Conservation Priorities in the
Face of Future Development25.
Recent surveys and assessments show that biodiversity conservation efforts in Mongolia tend to
produce insufficient outcomes due to a range of reasons. Outstanding among them are
difficulties associated with addressing overgrazing and other non-sustainable grassland use
practices, lack of participation of local stakeholders, especially herder communities in these
efforts and weak sustainability of efforts especially in the area of ensuring sufficient funding and
commitment building. The key issue for two communities- herders and conservationists is to
understand a vital condition: pastoralism and wildlife both have first-order conflicts. It is
impossible to address wildlife issues without being closely associated with, and informed by, the
livestock economy, for it is primarily in pastoral areas, or vice versa. In areas where wildlife
management has been integrated with pastoralism, pastoral communities refer very positively.
Functionally, wildlife and livestock are integrated into their land use production system26.
23 https://www.fws.gov/invasives/staffTrainingModule/methods/grazing/impacts.html 24 Center for Policy Research, Grazing records, Peri-Urban Rangeland Project, MCA, 2012 25 The Nature Conservancy ‘Identifying Conservation Priorities in the Face of Future Development’, 2011-2017 26 Ibid
9
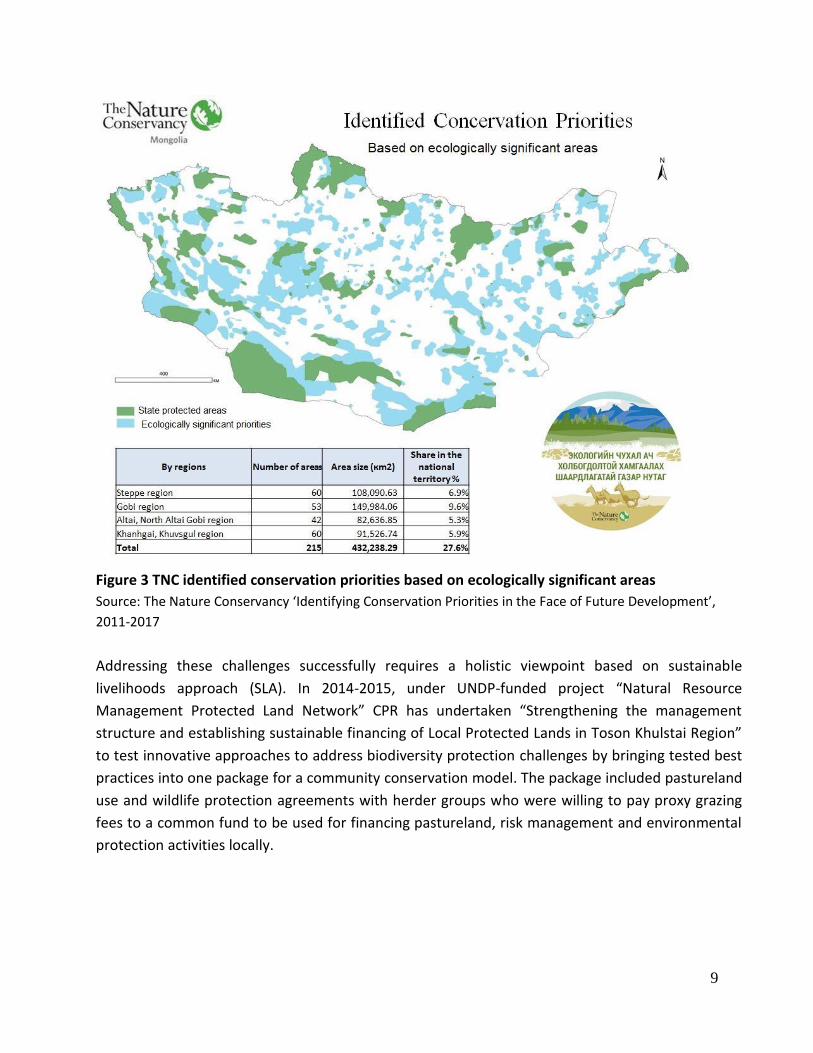
Figure 3 TNC identified conservation priorities based on ecologically significant areas
Source: The Nature Conservancy ‘Identifying Conservation Priorities in the Face of Future Development’,
2011-2017
Addressing these challenges successfully requires a holistic viewpoint based on sustainable
livelihoods approach (SLA). In 2014-2015, under UNDP-funded project “Natural Resource
Management Protected Land Network” CPR has undertaken “Strengthening the management
structure and establishing sustainable financing of Local Protected Lands in Toson Khulstai Region”
to test innovative approaches to address biodiversity protection challenges by bringing tested best
practices into one package for a community conservation model. The package included pastureland
use and wildlife protection agreements with herder groups who were willing to pay proxy grazing
fees to a common fund to be used for financing pastureland, risk management and environmental
protection activities locally.

10
3. Current situation of land degradation and existing methodologies for
determining pasture conditions and/or carrying capacity
Keystone of nomadic pastoralism in Mongolia was availability and rotational use of seasonal
pastures and access to reserve areas in emergencies. For centuries this was regulated by
customary arrangements and was effective in ensuring ecological sustainability and minimizing
animal losses during natural disasters.
For the past 20 and more years the following situation emerged in which the keystone for
traditional pastoralism much violated:
First. The end of XX century that witnessed the livestock privatization and shifting to a market
economy was incomparable to the several thousand years of nomadic history when the national
demand was met by a limited number of animals. Private interest of individuals to meet their
enormously increased demand and resulting competition for pastures reached the level to
actually ‘kill’ the effectiveness of customary arrangements that kept ecological balance for
centuries.
Second. Since the beginning of transition in 1990 the number of herders families has grown from
around 90 thousand to 160 thousand tremendously increasing the number of seasonal camp sites
and virtually destroying the possibility of rotating pastures and keeping emergency reserves. The
majority of new herders came from non-herding families who suffered decline and
unemployment in the other industries meant that they seriously lacked the knowledge and
conscience to keep the customary arraignments. One example is that herders became reluctant
to migrate simply because trespassers came in to use pastures left for rest.
Third. Rapidly increasing urbanization and rural infrastructure development has changed the
livestock distribution that was relatively even across the territory and increased localized
overstocking and degradation.
As a result of the above mentioned situation the number of herders who migrate consciously to
rotate pastures is shrinking to zero leaving a few places where pastures are rotated only because
of unavoidable natural factors such as no water, no pastures, too cold or too much flies and
mosquitoes. An example is long migrations between high mountains and the basin of Great Lakes
in the Uvs lake region with clear cut natural boundaries between seasonal pastures. One hopes
that pastureland can be preserved relatively well only in a few places with such geography.
However, in the entire steppe region and most of Gobi and mountain-steppe regions with
relatively uniform landscape characterized by a lack of clear cut boundaries separating seasonal
11
pastures very short migrations unable to rotate pastures has become commonplace leading to
year around use and degradation. Given the weak seasonal boundaries herders tend to overgrow
animal numbers as they make orientation to the entire area instead of the seasonal pastures.
The steppe and Gobi regions are also more exposed to natural degraders such as wind erosion
and sand movements. As a result of these factors the frequency of natural risks has increased
causing severe losses to the livelihood of herders.
Pastureland degradation resulted from violation of traditional arrangements and a lack of
effective state regulation became a key reason for not only undiminishing rural poverty by
making the livestock sector extremely vulnerable to drought and dzud and the herders livelihood
non-sustainable, but increasing desertification that lead to widespread ecological disaster.
Decision makers who naively think that land producing green mass is intact have to see the
danger of a drastic change in the green mass composition to less nutritional grasses and more
weeds- a key feature of pastureland degradation.
Uncontrolled and chaotic use of pastureland patronizes increasing animal numbers without due
consideration of carrying capacity. The national livestock population has reached 61.5 m in 2016.
It looks good in terms of today’s livelihood for herders, however, there is nothing to boast from
the long-term sustainable development viewpoint. Because, this number is illusional or non-
sustainable relative to the pasture carrying capacity and detrimental to future generations of
herders as it causes serious overgrazing and degradation. One should not forget that boasting
over record animal numbers of 44 m in 2008 was replaced with sad experiences of losing In the
2009‐2010 dzud, about 8.5 million livestock had died, more than 20% of the country’s livestock
population, affecting 769,000 people or 28% of Mongolia’s human population. According to the
Red Cross, 220,000 herding households were affected of which 44,000 households lost all of their
livestock and 164,000 lost more than half their herd27.
Any policy supportive of increasing animal numbers without due consideration of pasture
carrying capacity is inhuman and myopic. It is inhuman in that instead of being consciously
managed the destiny of several hundred thousand herders’ families is left to the reign of volatile
natural shocks - dzuds and droughts. As rightly described by María E. Fernández‐Gimenez et al.
In the period since livestock population and weather data have been regularly documented in
Mongolia, dzud has played a critical role in limiting livestock populations before density‐
dependent competition for forage results in severe overgrazing, starvation, and livestock
population crashes. Thus, despite its devastating consequences for herders, dzud serves an
27 María E. Fernández‐Gimenez, Batbuyan Batjav and Batkhishig Baival, Lessons from the Dzud:
Adaptation and Resilience in Mongolian Pastoral Social‐Ecological Systems, Colorado State University
& the Center For Nomadic Pastoralism Studies, 2012
12
important ecological function in this social‐ecological system, by reducing animals and hence
grazing pressure, to a more sustainable level, albeit temporarily, and allowing pastures to rest
and regenerate28.
It is myopic as it nourishes the existing stagnant position of the extensive livestock industry which
has ‘absorbed’ too many households far beyond its ‘feeding’ capacity only to keep in poor
subsistence but does not allow them to either ‘die’ or develop, thwarts the herders’ willingness
to strive for innovation and more productive jobs, devitalizes the policy to resolve herders’
poverty by actively addressing the excess labor problem to enable the remaining households to
keep the herd size enough for sustaining their livelihood and as a whole confines one third of the
population in chains of underdevelopment29.
At present official estimates of the pasture carrying capacities nationwide are carried out by two
major institutions the National Agency of Meteorological and Environmental Monitoring
(NAMEM) under the Ministry of Environment and Tourism Development and the Agency for Land
Relations, Geodesy and Cartography under the Ministry of Construction and Urban Development.
The NAMEM estimates pasture carrying capacities using grass yield samples of around 1500
points (one point per bagh) taken in every August annually. The key advantage of the NAMEM
methodology is that it estimates carrying capacities on an annual basis and has collected grass
yield data for every soum for quite long period since early 1970s. However, only 5 points for grass
yield samples is hardly representative of the entire soum territory which averages around
300,000 ha of land mass and covers a wide variety of ecological conditions. Although NAMEM
estimates give a kind of approximation for judging the pasture carrying at the soum level, they
are not sufficient for estimating it at the level pastureland users or herders.
The Agency for Land Relations, Geodesy and Cartography (ALRGC) uses 1:100,000 scale land use
and vegetation maps in estimating pasture carrying capacities. The vegetation maps contain the
most detailed information on vegetation composition, grass yields and feed protein content for
each vegetation type that averages around 3-5 per soum. The land use maps contain information
on the land users- location of seasonal camps of herder households and wells etc., in addition to
base information on topography, land use boundaries of other uses such as forests, settlements,
crop farming, mining, protected areas, communications etc. As the pasture carrying capacities
are shown as a part of the 1:100,000 vegetation maps they provide more representative data of
pasture carrying capacities for every corner of the soum territory and as such can be a basis for
decision making at the level of pastureland users-herders. 1:100,000 vegetation maps have been
28 Op. cit. 29 A.Enkh-Amgalan, Let’s Decide the Pasture Issue This Way, Article in the national daily newspaper
Zuunii Medee, No 30, 18 December 2007
13
properly prepared for the first time under socialism and had to be updated every 5 years.
However, since 1990s because funding shortages updates of these maps have been carried out
with less quality control, resulting in the accuracy of grass yield and vegetation composition
boundaries being eroded to some degree.
As for methodology for estimating grass yield, there are two debated issues. One is related to the
way of catting grasses when taking samples. The most researchers agree now that grasses should
be cut at 0 cm form the surface the estimate the entire biomass and then animal intakes should
calculated as percentages from the total biomass. However, this approach is not fully abided by
all institutions. For example, ALRC methodologies for carrying out updates of the 1:100,000 maps
focus on animal intakes of the biomass, cutting grass samples at 3 cm from the surface30. As it is
difficult to ensure exactly 3 cm cuts from the surface the weight of samples and resulting grass
yields can vary according to skills of individuals who cut grasses. The next issue under debate is
the percentage of converting biomass into animal intakes. Although the international best
practices suggest 50% intake, in Mongolian conditions where overgrazing is severe with animal
pressures exceed carrying capacities 2-5 folds in some aimags and soums, the application of 50%
intake might be too far for enforcement. CPR has suggested 80% of intake for soums with severe
overgrazing keeping in mind that 50% intake should kept as be longer-term target after land users
reach 80% target first. In addition, coefficients to convert animal species into sheep units have
also minor variations across researchers and institutions. The most researchers and institutions
use coefficients of 5.7 for camel, 6.6 for horse, 6 for cattle and 0.9 for goat. Some researchers
like those in the Research Institute of Animal Husbandry of the State University of Life Sciences
use coefficients with minor changes. In 2011, under the World Bank funded Sustainable
Livelihoods Project CPR has proposed as a art of the proxy grazing fee pilot modifications to the
coefficients based on claims that goats and horses damage pastures more than other species.
The modified coefficients were sheep 1, goat 2, camel 3, cattle 4, horse 831.
Despite little variations in the exact figures due to methodological differences, all major
institutions and researchers agree that the pastureland in Mongolia is severely overgrazed and
degraded. According to the latest estimates carried out by the Information and Research Institute
of Meteorology And Hydrology and SDC Green Gold project using 1450 monitoring points
nationwide 65% of pastureland in Mongolia is degraded to some degree and 7% the degree of
beyond recovery.
30 Section 2.2.5 Estimating pasture grass yield, “Temporary rules for undertaking field estimates of the state and
quality of land”, approved by the Head of ALRC, Order No A/174 dated 28 June 2013 31 Center for Policy Research, Unpublished project report, Sustainable Livelihoods Project, 2012

14
Figure 4 The situation with pastureland degradation in Mongolia
Source: Information and Research Institute of Meteorology And Hydrology, SDC Green Gold
project, 2015. National report on the rangeland health of Mongolia
According to the Report on Environmental State of Mongolia of 2015-2016 the land degradation
and desertification occur at even faster rates because of climate change, non-sustainable grazing
practices and mining impacts resulting in 76.8% of the land territory subjected to
desertification32.
32 Report on Environmental State of Mongolia, 2015-2016

15
Figure 5 Sample of pasture carrying capacity map produced annually by the National Agency of
Meteorological and Environmental Monitoring of Mongolia
The ADB33 adds that Mongolia is severely impacted by desertification and climate change. More
than 70% of Mongolia’s land is degraded through overgrazing, deforestation, and climate change.
Degradation is a downward spiral, as degraded lands are less resilient to climate change impacts.
Average mean temperature increases are more than 2°C, and climate models indicate that
temperatures will continue to rise. More than 80% of the county’s territory is defined as highly
vulnerable to climate extremes. Climate-related disasters, including droughts, severe storms, and
flash floods, with high social and economic costs (particularly for herders), have doubled in
frequency.
Mongolia is witnessing significant alterations to water and ambient air temperatures and
precipitation patterns. Both the frequency and severity of extreme weather events are
33 Making grasslands sustainable in Mongolia: Herders’ livelihoods and climate change. Asian Development Bank,
2014

16
increasing. From 1940 to 2007, the annual mean air temperature in Mongolia increased by
approximately 2.140C. This is three times higher than the global average. Warming is projected
to further increase up to 50C by the end of the 21st century. To address the additional ecological
challenges presented by climate change, there is still an urgent need to conserve and rehabilitate
the ecosystem services upon which Mongolia's rural economy, traditional culture, and rich
biodiversity depend. This required a paradigm shift to ensure that the very foundation of human
livelihood - ecosystems and their services - is sufficiently resilient to climate change pressure, and
to enable communities to adapt to climate change. A survey in different ecological regions of
Mongolia finds that better maintaining and restoration of ecosystem services would depend on
the capacity of local users and regulators (e.g. local government) and be successful if herders get
organized in well-functioning user groups.
In 2016, CPR has undertaken a survey among herders on the draft pastureland protection law
that promotes pastureland use agreements as a mechanism to regulate stocking densities. The
survey has found that herders in Mongolia are encountered with pressing problems in the area
of pastureland use and rank overgrazing (63.8%), lack of water (50.4%), grazing conflicts and
disputes (42%) lack of regulation leading to chaotic use (34.9%) as the most pressing. The majority
of consultation participants (80.2%) view that the existing Land Law is not effective in addressing
the pressing problems and the new pastureland protection law is essential in addressing them
properly (73.5%). There was general tendency that poor herders show greater support for the
draft law as they lose most from overgrazing, declining land and animal productivity, natural
calamities disasters and receding their grazing rights to expanding rich people and mining
activities. Some rich herders take advantage of the existing common use regime for short-term
gains to expand their herd size and control of pasture resources and they tend to oppose changes
in the legal environment including the draft law. As of 2015, poor herders with less than 200
animals make up almost half of the herders’ population (45.4%) but own only 13.9% of livestock
while rich herders with 1000 and more animals making up only 5.4% of the herders’ population
own 21.6% of livestock. The study revealed that poor herders with less than 200 animals lose
their control of winter spring camps – around one third have no own winter and spring camps.
Rich herders tend to have 2-4 camps and further increase their control of most valuable pastoral
resources.
A large majority of herders simply do not have enough animals to sustain themselves in the
traditional way. They are either forced to combine subsistence livestock-keeping with a variety
of other jobs, or they can choose to become more market-oriented herders. If they choose wisely,
they can increase their incomes and maintain their pastures. However, this depends on renewed
forms of land management institutions preventing a few rich (and partly absentee) herders from

17
over-utilizing the pastures to the detriment of their poorer, and more-market oriented , fellow
pastoralists.34
As an option for sustainable livestock development capable of increasing herders’ income in an
environmentally friendly way (not increasing but reducing animal numbers to optimum level) as
well as to protect the interests of poor herders, CPR has been promoting ‘Smart Herder’ program
since 2014. The idea was, based on tested best practices, to offer herders a solution pressing
challenges like climate change, pastureland degradation, livestock productivity and income
declines and increasing social inequality economic, environmental and social challenges in a
holistic manner. The program was supported by SDC’s Green Gold project, international
environmental organizations WWF and TNC to commence the program pilots in 3-8 soums each.
The program seeks to implement the following mutually reinforcing components:
Make Pastureland use agreement (LUA)s a herders’ self-interest for sustainable use of
pasturelands through regulating stocking densities and a protection against chaotic
converting into mining and other uses by improving their effectiveness
Annually estimate the pasture carrying capacity and in case carrying capacity has been
exceeded, create a system in which animals that exceeded pasture carrying capacity are sold
to increase the income of herders
Organize the value chains of animals and animal products by herder organizations to
improve linkages to markets, value, sales volumes and herder incomes
Enhance market competitiveness by investing the earnings made from sold animals in
improving animal quality, product standards and processing levels
Establish Livestock Risk Management Fund /LRMF/ formed by herders’ contributions and
local budget to have sustainable funding sources for tackling livestock risks and improving
the quality of products
Encourage herders, who have established LUAs towards protecting wildlife and other
natural resources and benefiting from their sustainable uses through establishing
appropriate use agreements
Under the SDC Green Gold project CPR has assisted 17 herder groups in developing and
implementing comprehensive 4-year action plans to achieve, among others, the stocking density
targets stipulated by land use agreements. In total 17 herder groups have targeted to reduce the
total sheep units from 76620 at the end of 2014 to 58930 in 2018, which is very ambitious as the
national herd has a trend increase by 10% annually for the past 5 years. At the end of 2015, the
34 Dietz., A.J., Enkh-Amgalan, A., Erdenechuluun, T., Hess, S. Carrying capacity dynamics,
livestock commercialization and land degradation in Mongolia’s free market area, Poverty
Reduction and Environmental Management Research papers, Institute of Environmental studies,
Netherlands, 2005
18
first year target of reducing animal numbers has been achieved by 80% with some groups
achieving the target by 102.5-131%.
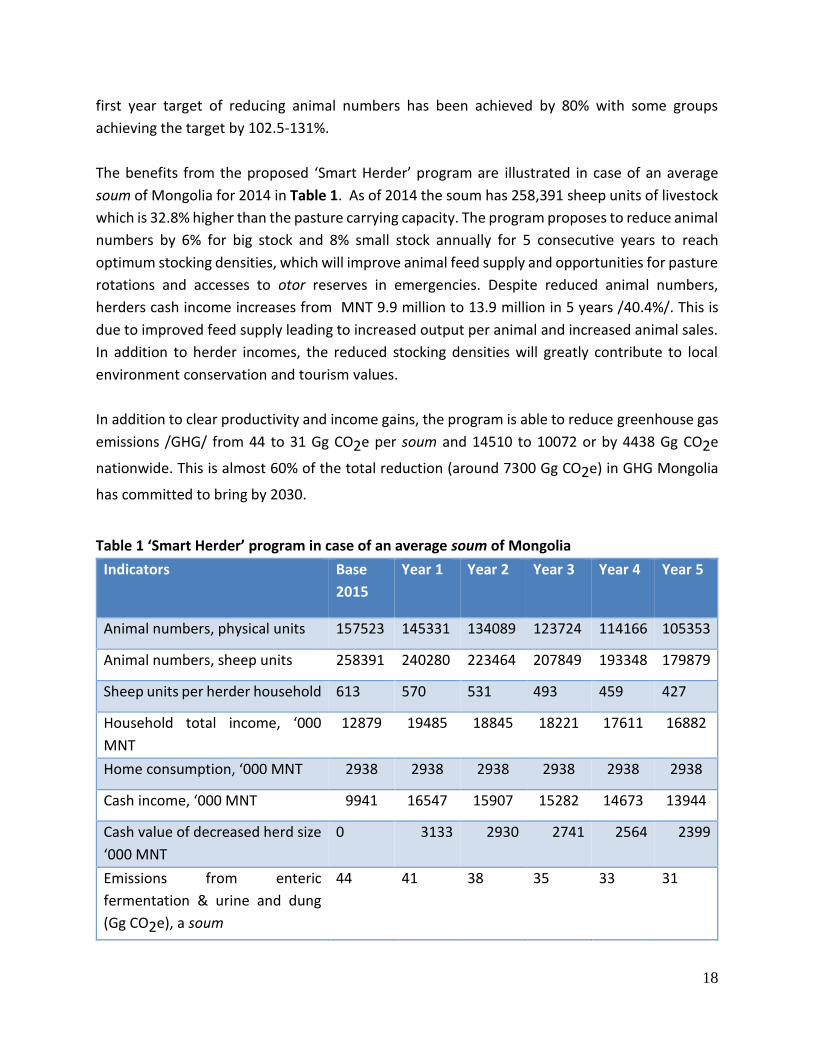
The benefits from the proposed ‘Smart Herder’ program are illustrated in case of an average
soum of Mongolia for 2014 in Table 1. As of 2014 the soum has 258,391 sheep units of livestock
which is 32.8% higher than the pasture carrying capacity. The program proposes to reduce animal
numbers by 6% for big stock and 8% small stock annually for 5 consecutive years to reach
optimum stocking densities, which will improve animal feed supply and opportunities for pasture
rotations and accesses to otor reserves in emergencies. Despite reduced animal numbers,
herders cash income increases from MNT 9.9 million to 13.9 million in 5 years /40.4%/. This is
due to improved feed supply leading to increased output per animal and increased animal sales.
In addition to herder incomes, the reduced stocking densities will greatly contribute to local
environment conservation and tourism values.
In addition to clear productivity and income gains, the program is able to reduce greenhouse gas
emissions /GHG/ from 44 to 31 Gg CO2e per soum and 14510 to 10072 or by 4438 Gg CO2e
nationwide. This is almost 60% of the total reduction (around 7300 Gg CO2e) in GHG Mongolia
has committed to bring by 2030.
Table 1 ‘Smart Herder’ program in case of an average soum of Mongolia
Indicators Base
2015
Year 1 Year 2 Year 3 Year 4 Year 5
Animal numbers, physical units 157523 145331 134089 123724 114166 105353
Animal numbers, sheep units 258391 240280 223464 207849 193348 179879
Sheep units per herder household 613 570 531 493 459 427
Household total income, ‘000
MNT
12879 19485 18845 18221 17611 16882
Home consumption, ‘000 MNT 2938 2938 2938 2938 2938 2938
Cash income, ‘000 MNT 9941 16547 15907 15282 14673 13944
Cash value of decreased herd size
‘000 MNT
0 3133 2930 2741 2564 2399
Emissions from enteric
fermentation & urine and dung
(Gg CO2e), a soum
44 41 38 35 33 31

19
Emissions from enteric
fermentation & urine and dung
(Gg CO2e), national
14510 13485 12535 11652 10833 10072
Source: A.Enkh-Amgalan, Climate-Smart Livestock (CSL) Case Study, Mongolia, 2017, FAO
This shows that Mongolian herders as the guardians of one of the largest remaining grasslands
on Earth can make an important contribution to global climate change mitigation through proper
incentive mechanisms for managing the grasslands in a sustainable way.
4. Analysis of herder household income and livelihood in relation to
number of livestock and herd structure and to market location and
infrastructure availability
4.1 Methodological issues of herders’ income
Herder household income in the current context mostly depends on:
animal productivity or output per head
animal species structure
animal numbers
prices of livestock products
As the assignment purpose is to estimate grazing fee, we need to focus on variables that reflect
the quality of pastures excluding or neutralizing other factors that are not relevant or dependent
on the quality of pastures.
Animal productivity. Economic literature and statistics measure per head productivity in year t as
a ratio of the total output to the number of animals at the beginning of year t.
𝑃 =O
Ao=
A∗Y∗K
Ao (1)
Where:
P = per head productivity
O = output
A= Total number of animals from which output was obtained
Y= Yield per animal
K = Degree of harvesting particular product from animals
Ao = Number of animals at the beginning of the year
20
Here yield represents output of several products, such as meat, wool, hides and milk. As (1)
shows, per head productivity for a given number of animals at the beginning of year t can be
increased as a result of (i) increased yield per animal (ii) increased number of animals which
produce output (iii) the degree of harvesting of produce per animal.
Increased yield per animal is achieved by improving its quality, usually through breeding. An
increased number of output-producing animals in year t can be achieved by either increasing
their birth rate or decreasing their mortality rate. The degree of harvesting animal products
depends on availability of labor, market demand for particular product (in many regions small
stock is not milked because of law milk demand, while wool and cashmere harvesting is carried
out using hired labor if household labor is not sufficient), local customs and others. Using this
approach, Y in (1) is referred to as the biological per head productivity and P is referred to as the
economic per head productivity.
The biological productivity shows physical potential of animals to generate outputs and directly
reflects the supply of pasture in terms of both quantities and quality. The number of animals,
which produce outputs and the degree of harvesting of products depends on, among others,
human factors mentioned above and therefore, variations caused by human factors need to be
neutralized. A simple way to neutralize variations in human factors is to use regional averages of
the relevant variable.
Animal species structure. Animal species are usually better suited to concrete ecological regions,
for example, camels are best suited in the Gobi region and cattle in the forest-steppe region.
Horse and small stock more or less evenly suited to all regions. Thus, animal species structure
reflects to a certain degree the differences in the quality of pastures and need to be considered
in estimating herders incomes for the purposes of land evaluation and estimating grazing fees.
Animal numbers. Animal numbers themselves do not directly reflect the differences in the quality
of pastures. They reflect more the herders’ economic behavior or income generation strategies.
Widstrand35 noted that a pastoral livestock operation is not a capitalistic undertaking aimed at
producing a marketable surplus, its aims are rather to provide a good, regular supply of food for
the family, to enable it to survive physically and socially. This statement is also in agreement with
the viewpoint of Dillon and Hardaker36. They wrote that pastoralists regard their livestock as a
walking bank, a measure of social status and security, but seldom as an enterprise to be rationally
managed to produce profit. In contrast, commercial ranching and dairy farming aim at converting
35 Widstrand, C.G. 1975, ‘The Rationale of Nomad Economy’, AMBIO, No 4, 146-53.
36 Dillon, J.L. and Hardaker, J.B. 1984, Farm Management Research for Small Farmer Development, FAO,
Agricultural Services Bulletin, 41.

21
herbage into marketable produce, and that objective is achieved with large herds upon which
only a small number of people are dependent. Enkh-Amgalan has highlighted that one of the
main distinguishing characteristics of pastoral economies stems from the relationships between
pastoralists and the natural resource base. Animals are owned by individuals but the natural
resources necessary for livestock operations, such as grazing and water, are not. As pastureland
is state owned and the ownership of livestock is individual, the perceptions of nomad livestock
owners concerning the options open to them leave them little choice but to continue on their
present course of trying to increase the size of their herds, even though that course leads to
ecological disaster37. Thus, income estimates need to reflect the currently dominant herders
behavior of maximizing animal numbers.
Prices. Prices are simply a way to convert animal productivity into monetary terms. Secondly as
a mirror of the demand for particular product, its quality and other characteristics, prices may
indirectly reflect the differences of ecological regions as particular animal breeds and sub-breeds
are suited better in particular regions.
Based on the above considerations it is recommended to estimate herders’ income as an average
household income per every ecological region using the following variables:
Average herd size per herder household calculated as the total number of animals in the
region including those owned by absentee herders divided by the total number of
herders households. The inclusion of animals owned by absentee herders as a part of
herder household animals is dictated by the need to account for total income produced
on any pastures regardless of ownership.
Use the regional averages of animal species structure
Use the national average indicators for animal productivity, off-rates rates, mortality
rates, the share of breeding females and herd growth rates. Although these indicators
may slightly vary across regions, there is no region-specific reliable data available. In
addition, it is assumed that regional differences in these variables are minor and will not
lead to differences in herders incomes
The latest national average of livestock and livestock product prices
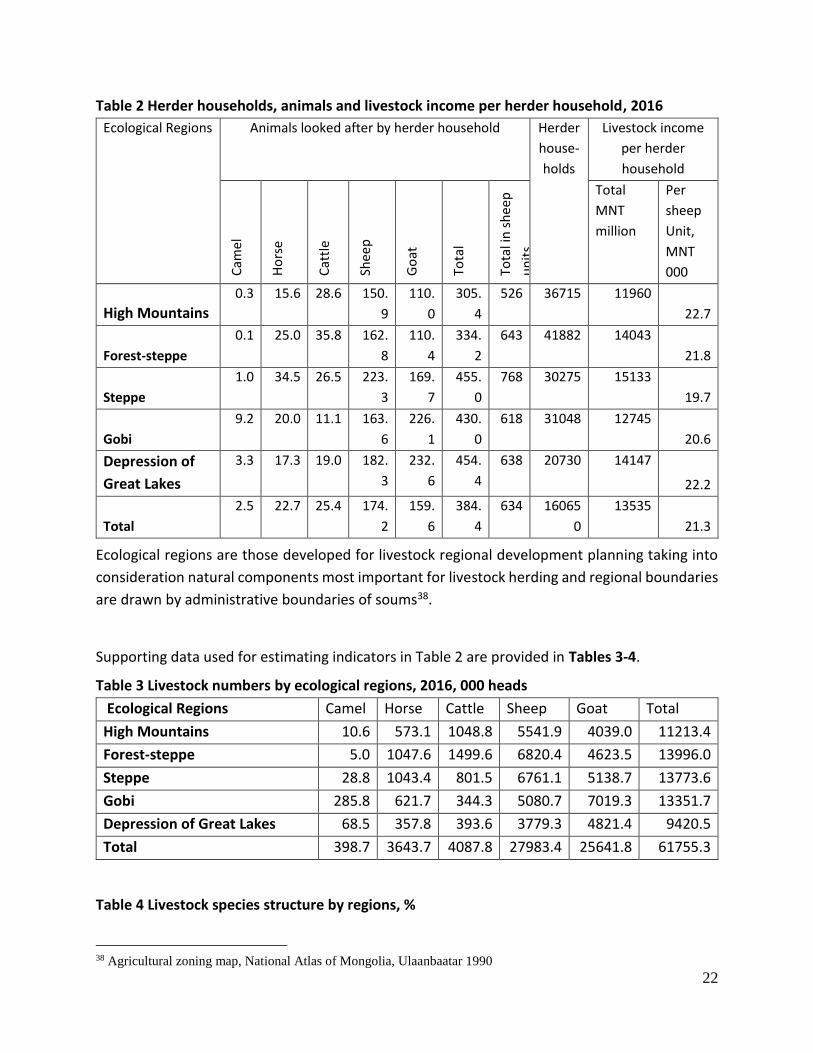
The average herder household income estimated using the above described variables and the
herd turnover model developed by CPR shown in Table 2 by major 5 ecological regions.
37 A.Enkh-Amgalan, A. Production Function Analysis of the Extensive Livestock Industry in Mongolia,
Master of Economics Thesis, University of New England, (UNE), Armidale, Australia, 1998
22
Table 2 Herder households, animals and livestock income per herder household, 2016
Ecological Regions Animals looked after by herder household Herder
house-
holds
Livestock income
per herder
household
Cam
el
Ho
rse
Cat
tle
Shee
p
Go
at
Tota
l
Tota
l in
sh
eep
un
its
Total
MNT
million
Per
sheep
Unit,
MNT
000
High Mountains
0.3 15.6 28.6 150.
9
110.
0
305.
4
526 36715 11960
22.7
Forest-steppe
0.1 25.0 35.8 162.
8
110.
4
334.
2
643 41882 14043
21.8
Steppe
1.0 34.5 26.5 223.
3
169.
7
455.
0
768 30275 15133
19.7
Gobi
9.2 20.0 11.1 163.
6
226.
1
430.
0
618 31048 12745
20.6
Depression of
Great Lakes
3.3 17.3 19.0 182.
3
232.
6
454.
4
638 20730 14147
22.2
Total
2.5 22.7 25.4 174.
2
159.
6
384.
4
634 16065
0
13535
21.3
Ecological regions are those developed for livestock regional development planning taking into
consideration natural components most important for livestock herding and regional boundaries
are drawn by administrative boundaries of soums38.
Supporting data used for estimating indicators in Table 2 are provided in Tables 3-4.
Table 3 Livestock numbers by ecological regions, 2016, 000 heads
Ecological Regions Camel Horse Cattle Sheep Goat Total
High Mountains 10.6 573.1 1048.8 5541.9 4039.0 11213.4
Forest-steppe 5.0 1047.6 1499.6 6820.4 4623.5 13996.0
Steppe 28.8 1043.4 801.5 6761.1 5138.7 13773.6
Gobi 285.8 621.7 344.3 5080.7 7019.3 13351.7
Depression of Great Lakes 68.5 357.8 393.6 3779.3 4821.4 9420.5
Total 398.7 3643.7 4087.8 27983.4 25641.8 61755.3
Table 4 Livestock species structure by regions, %
38 Agricultural zoning map, National Atlas of Mongolia, Ulaanbaatar 1990
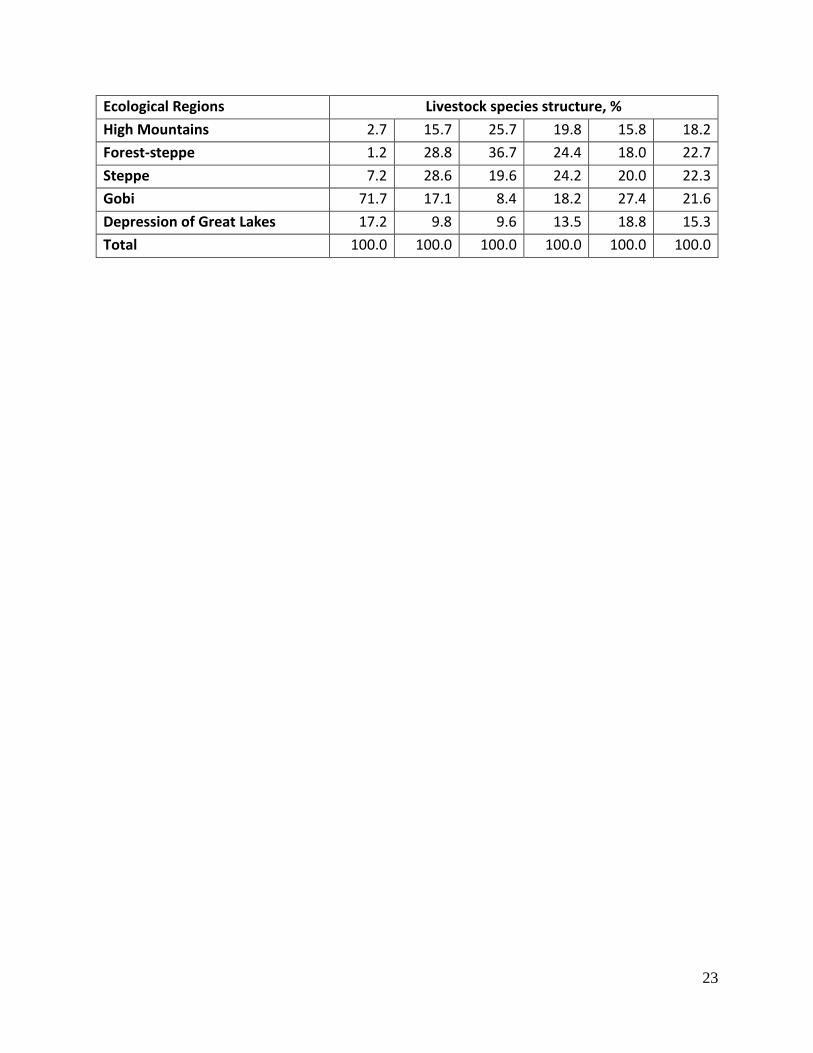
23
Ecological Regions Livestock species structure, %
High Mountains 2.7 15.7 25.7 19.8 15.8 18.2
Forest-steppe 1.2 28.8 36.7 24.4 18.0 22.7
Steppe 7.2 28.6 19.6 24.2 20.0 22.3
Gobi 71.7 17.1 8.4 18.2 27.4 21.6
Depression of Great Lakes 17.2 9.8 9.6 13.5 18.8 15.3
Total 100.0 100.0 100.0 100.0 100.0 100.0
Related Documents