BASELINE software tool for BASELINE software tool for calculation of calculation of microbiological criteria microbiological criteria and risk management metrics and risk management metrics for selected foods and for selected foods and hazards hazards WP6 Model Development WP6 Model Development l Conference BASELINE . Bologna 11-12 November 2013

BASELINE software tool for calculation of microbiological criteria and risk management metrics for selected foods and hazards WP6 Model Development Final.
Jan 01, 2016
Welcome message from author
This document is posted to help you gain knowledge. Please leave a comment to let me know what you think about it! Share it to your friends and learn new things together.
Transcript
BASELINE software tool for BASELINE software tool for calculation of calculation of
microbiological criteria and microbiological criteria and risk management metrics for risk management metrics for selected foods and hazards selected foods and hazards
WP6 Model DevelopmentWP6 Model Development
Final Conference BASELINE . Bologna 11-12 November 2013
Baseline Software tool: Data and Figures
Final Conference BASELINE . Bologna 11-12 November 2013
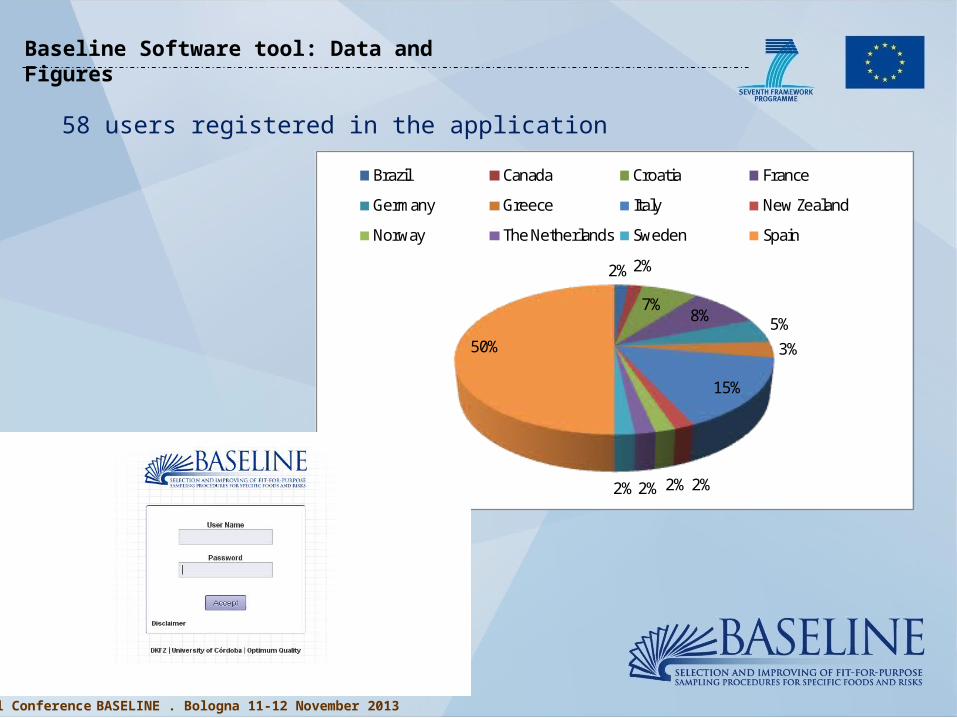
58 users registered in the application
2% 2%
7%8% 5%
3%
15%
2%2%2%2%
50%
Brazil Canada Croatia France
Germany Greece Italy New Zealand
Norway The Netherlands Sweden Spain
Baseline Software tool: Data and Figures
Final Conference BASELINE . Bologna 11-12 November 2013
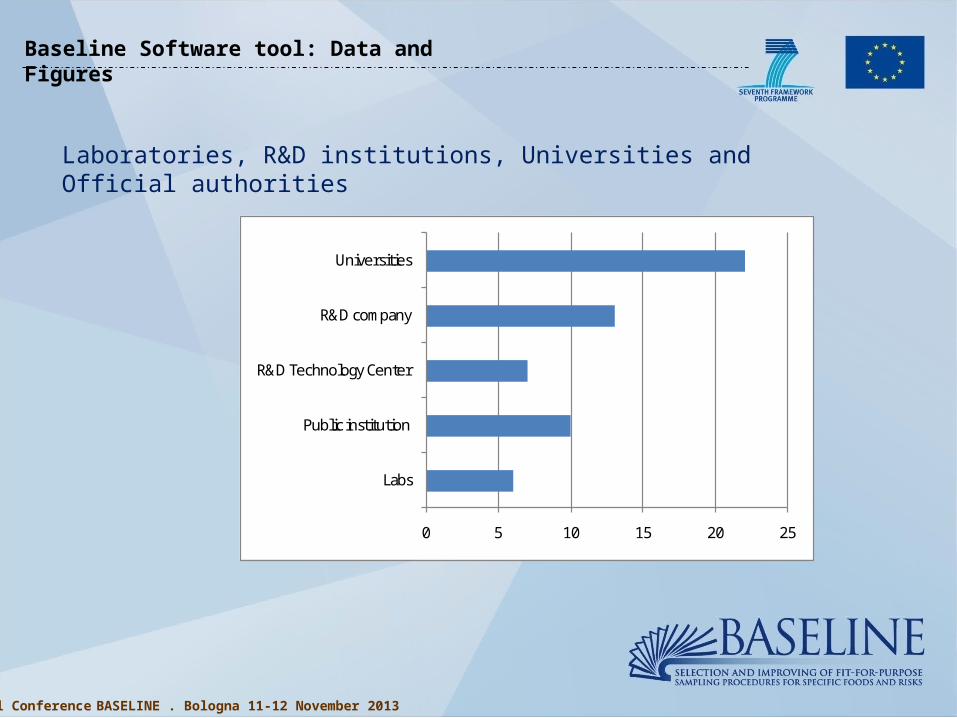
Laboratories, R&D institutions, Universities and Official authorities
0 5 10 15 20 25
Labs
Public institution
R&D Technology Center
R&D company
Universities
Baseline Software tool: Data and Figures
Final Conference BASELINE . Bologna 11-12 November 2013
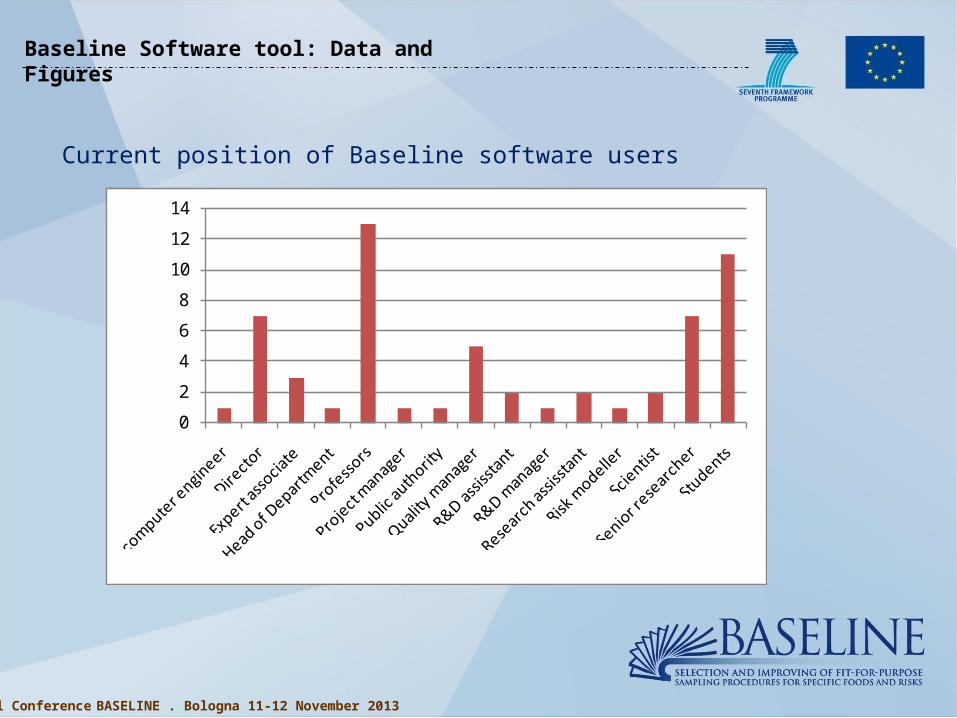
Current position of Baseline software users
0
2
4
6
8
10
12
14
Baseline Software tool: Data and Figures
Final Conference BASELINE . Bologna 11-12 November 2013
Main intended use: dissemination, training, teaching, research and training activities and official control.
It was presented at the International Conference on Predictive Modelling in Foods (ICPMF 8), Paris (France) being selected at the top five software tools
Webinar and training sessions were perfomed over 2013 (Oslo, Northern Spain, Bergamo)
EFSA workshop (September 26th, Parma)
Improvements and upgrades were carried out related to terminology, units and equations.
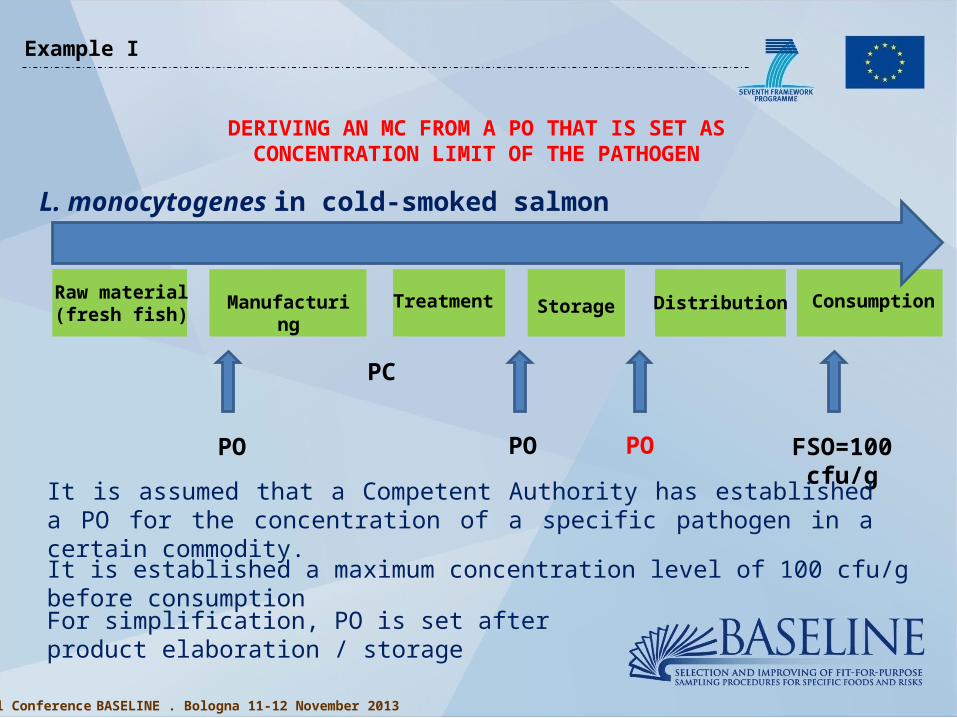
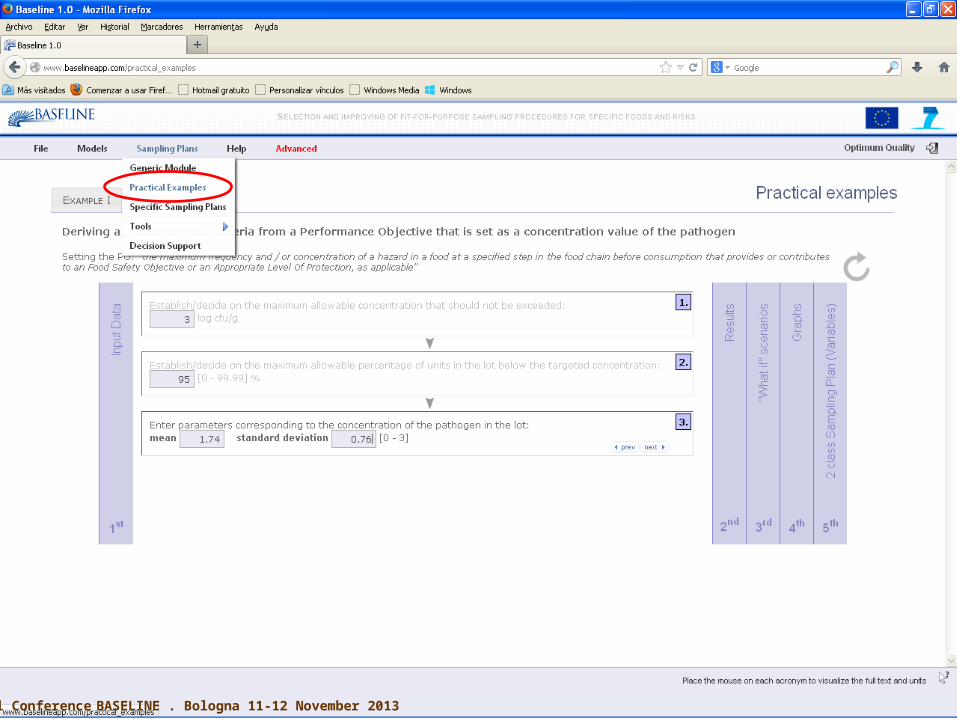
DERIVING AN MC FROM A PO THAT IS SET AS CONCENTRATION LIMIT OF THE PATHOGEN
L. monocytogenes in cold-smoked salmon
Raw material (fresh fish)
Manufacturing
Treatment Storage Distribution Consumption
PO PO PO FSO=100 cfu/g
PC
It is established a maximum concentration level of 100 cfu/g before consumptionFor simplification, PO is set after product elaboration / storage
It is assumed that a Competent Authority has established a PO for the concentration of a specific pathogen in a certain commodity.
Final Conference BASELINE . Bologna 11-12 November 2013
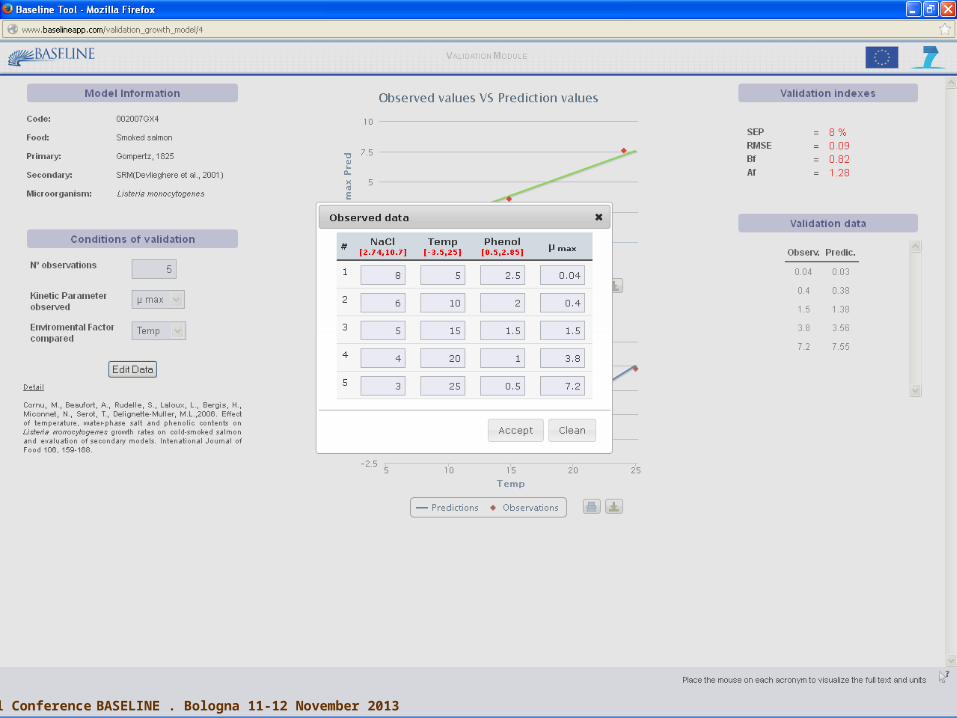
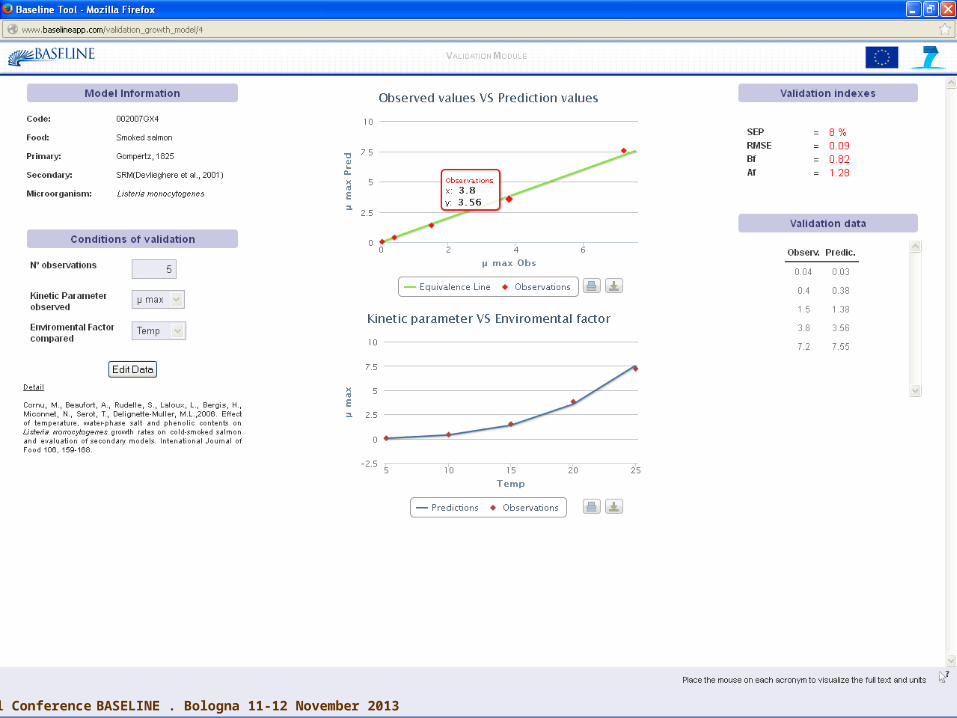
Example I
Example I
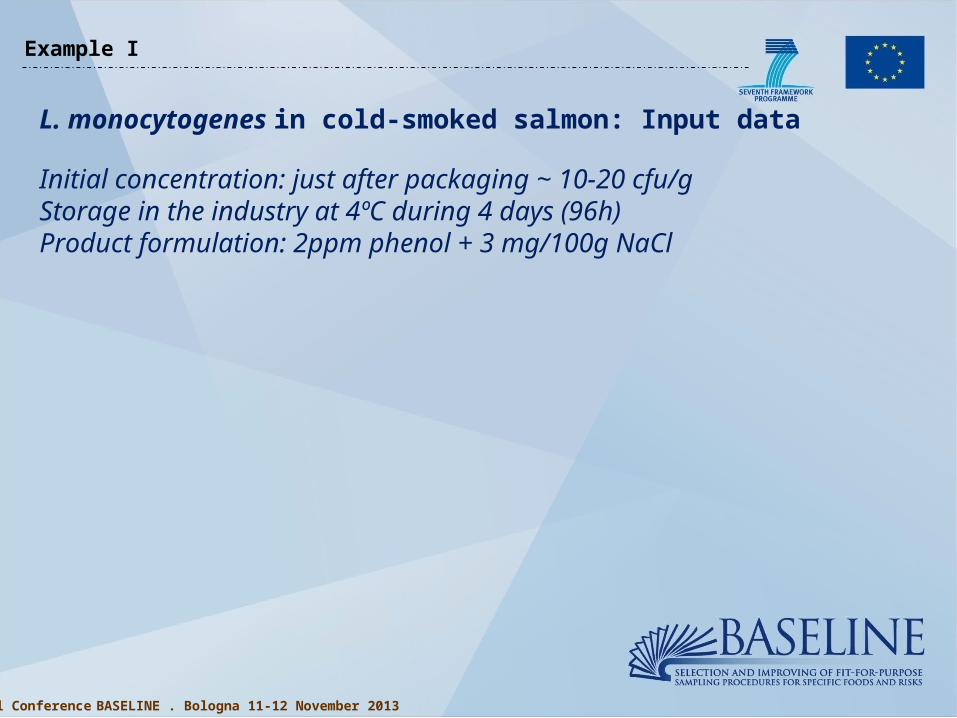
L. monocytogenes in cold-smoked salmon: Input data
Initial concentration: just after packaging ~ 10-20 cfu/gStorage in the industry at 4ºC during 4 days (96h)Product formulation: 2ppm phenol + 3 mg/100g NaCl
Final Conference BASELINE . Bologna 11-12 November 2013
8
Example II
Final Conference BASELINE . Bologna 11-12 November 2013
9
Example II
Final Conference BASELINE . Bologna 11-12 November 2013
10
Example II
Final Conference BASELINE . Bologna 11-12 November 2013
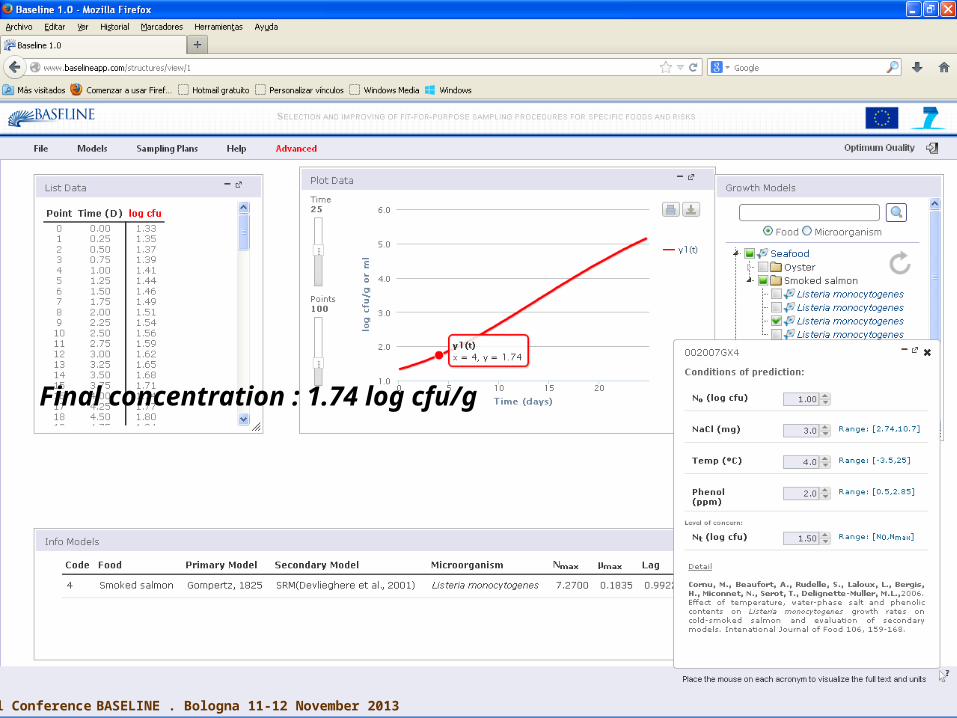
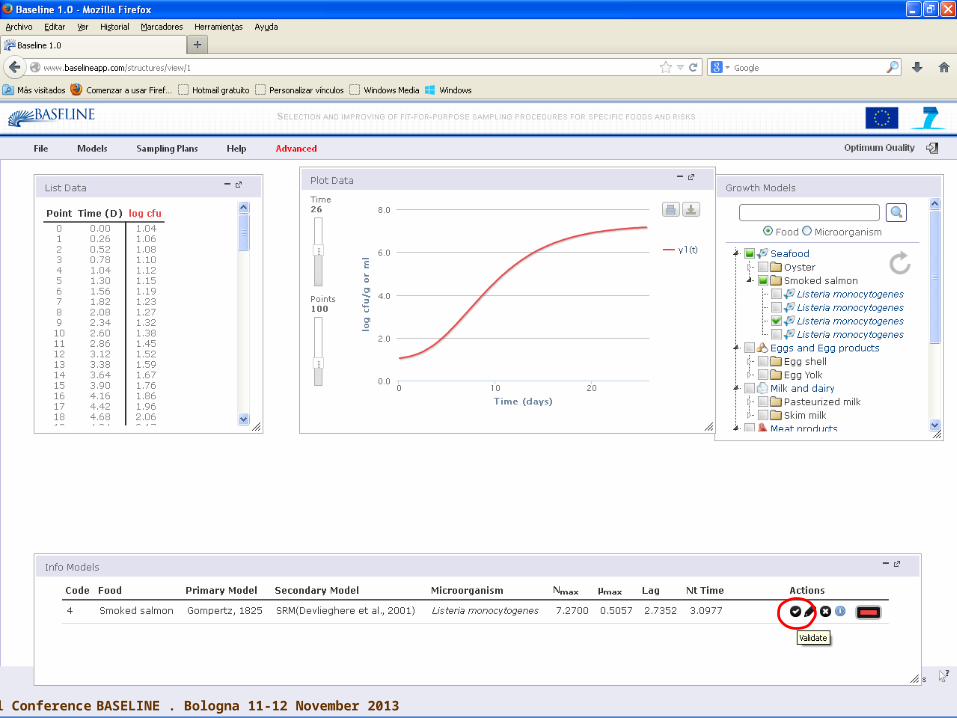
Final concentration : 1.74 log cfu/g
Final Conference BASELINE . Bologna 11-12 November 2013
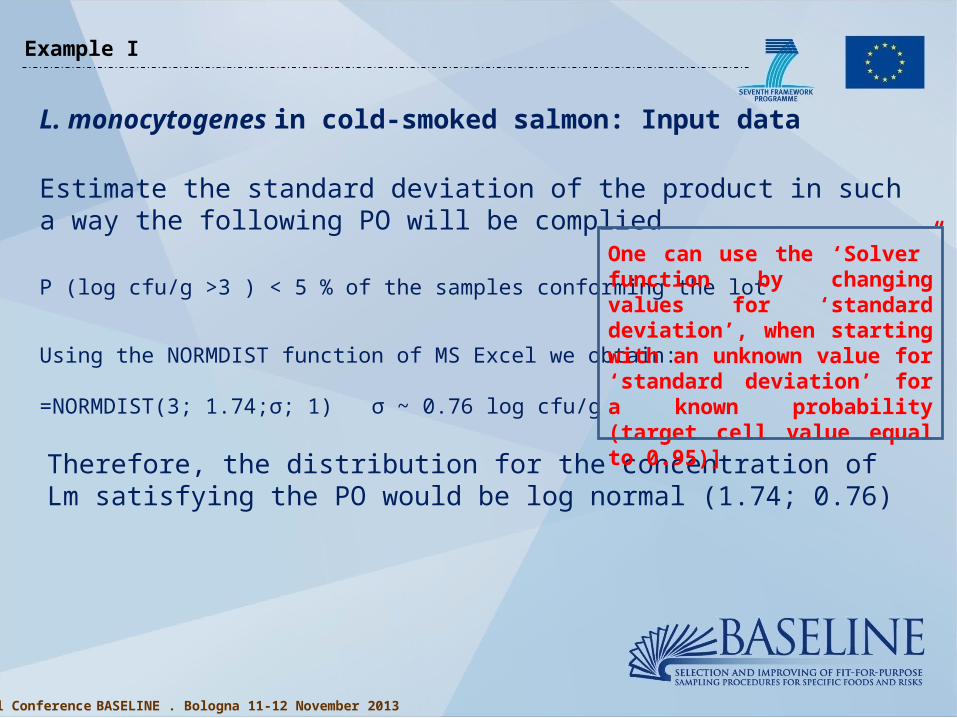
Example I
L. monocytogenes in cold-smoked salmon: Input data
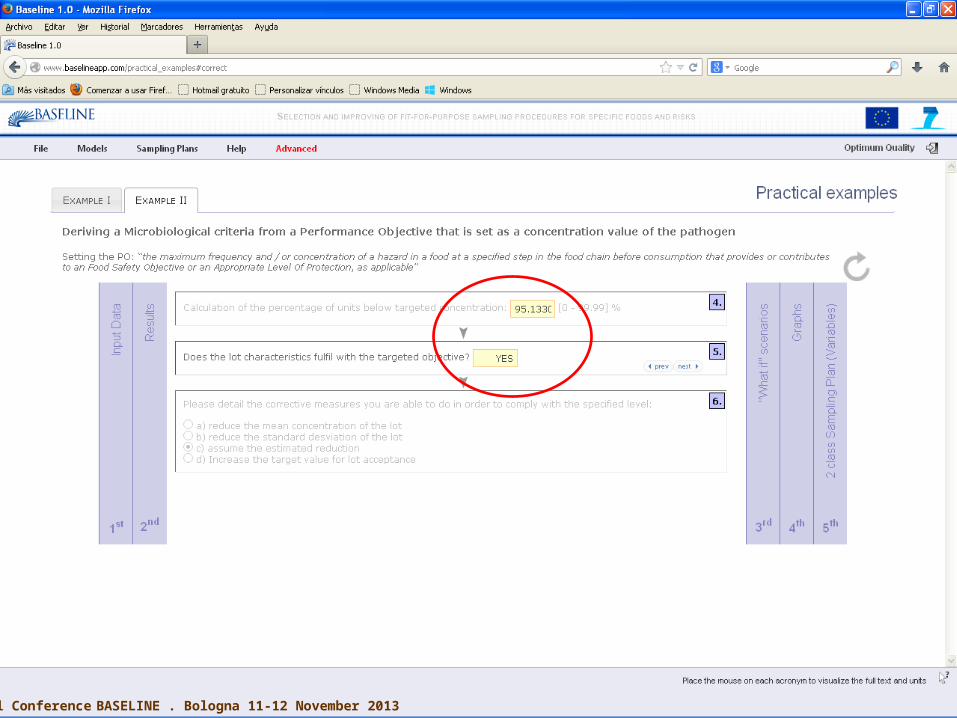
Estimate the standard deviation of the product in such a way the following PO will be complied
P (log cfu/g >3 ) < 5 % of the samples conforming the lot
Using the NORMDIST function of MS Excel we obtain:
=NORMDIST(3; 1.74;σ; 1) σ ~ 0.76 log cfu/g
Therefore, the distribution for the concentration of Lm satisfying the PO would be log normal (1.74; 0.76)
One can use the ‘Solver” function by changing values for ‘standard deviation’, when starting with an unknown value for ‘standard deviation’ for a known probability (target cell value equal to 0.95)]
Final Conference BASELINE . Bologna 11-12 November 2013
Example I
L. monocytogenes in cold-smoked salmon: Input data
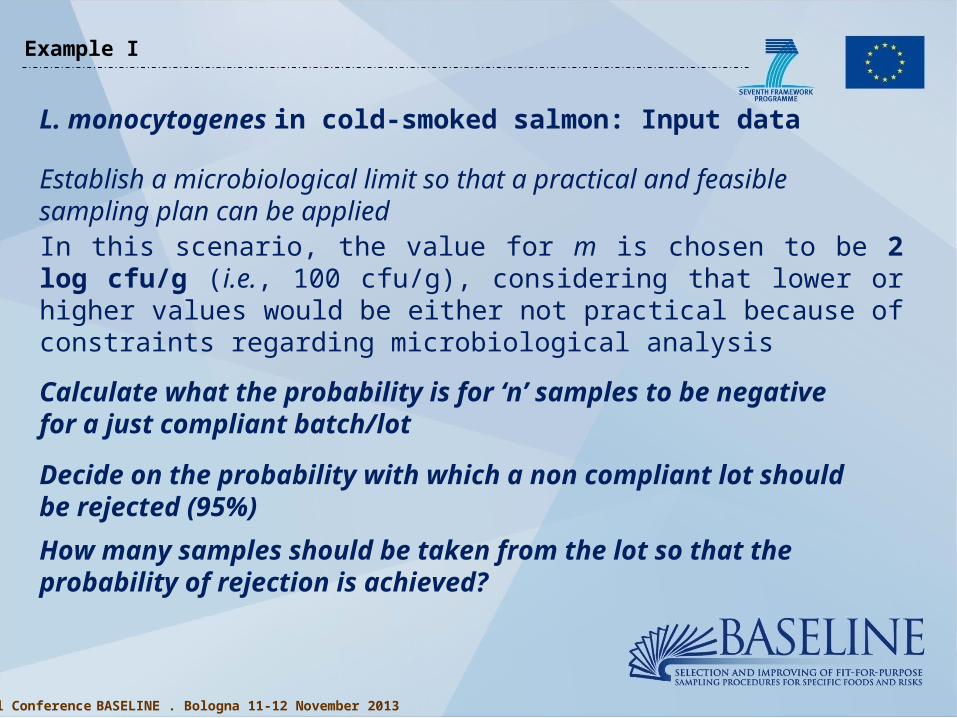
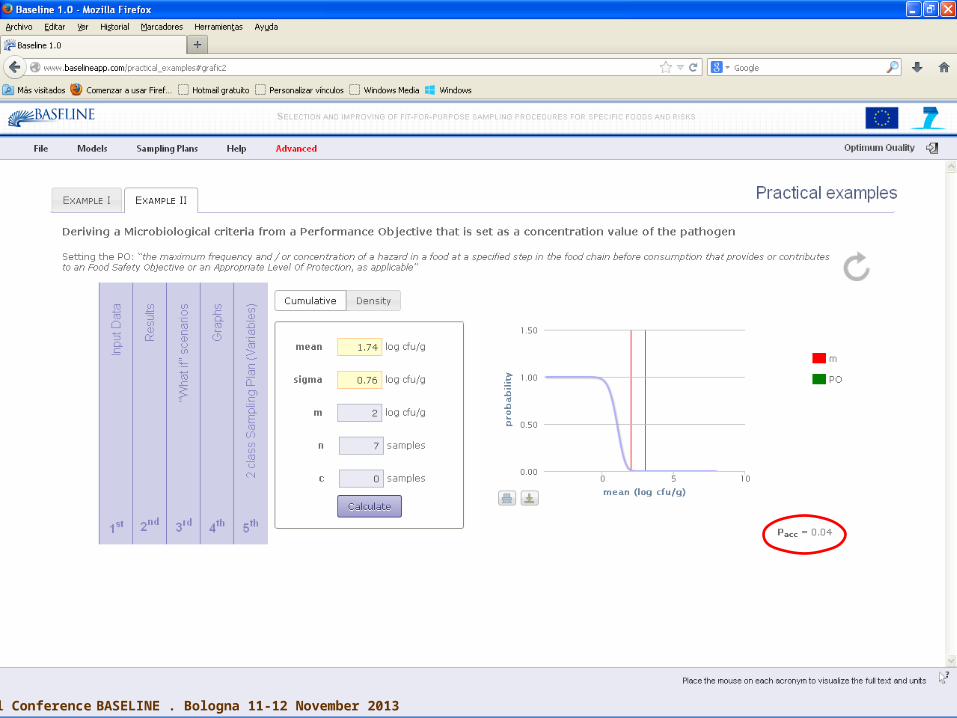
Establish a microbiological limit so that a practical and feasible sampling plan can be applied In this scenario, the value for m is chosen to be 2 log cfu/g (i.e., 100 cfu/g), considering that lower or higher values would be either not practical because of constraints regarding microbiological analysis
Calculate what the probability is for ‘n’ samples to be negative for a just compliant batch/lot
Decide on the probability with which a non compliant lot should be rejected (95%)
How many samples should be taken from the lot so that the probability of rejection is achieved?
Final Conference BASELINE . Bologna 11-12 November 2013
14Final Conference BASELINE . Bologna 11-12 November 2013
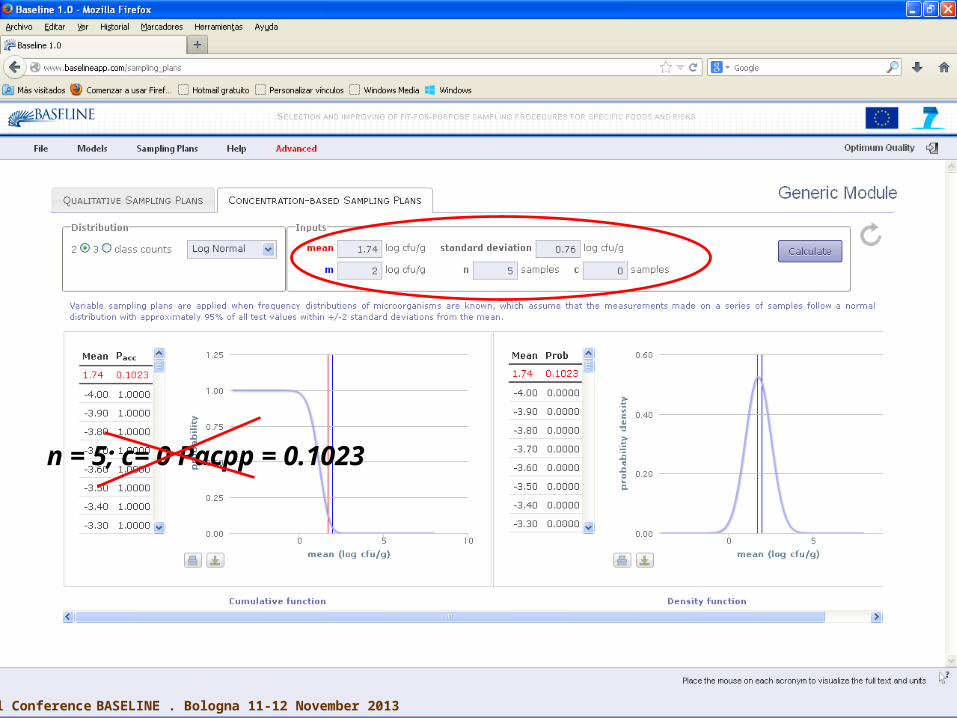
n = 5; c= 0 Pacpp = 0.1023
Final Conference BASELINE . Bologna 11-12 November 2013
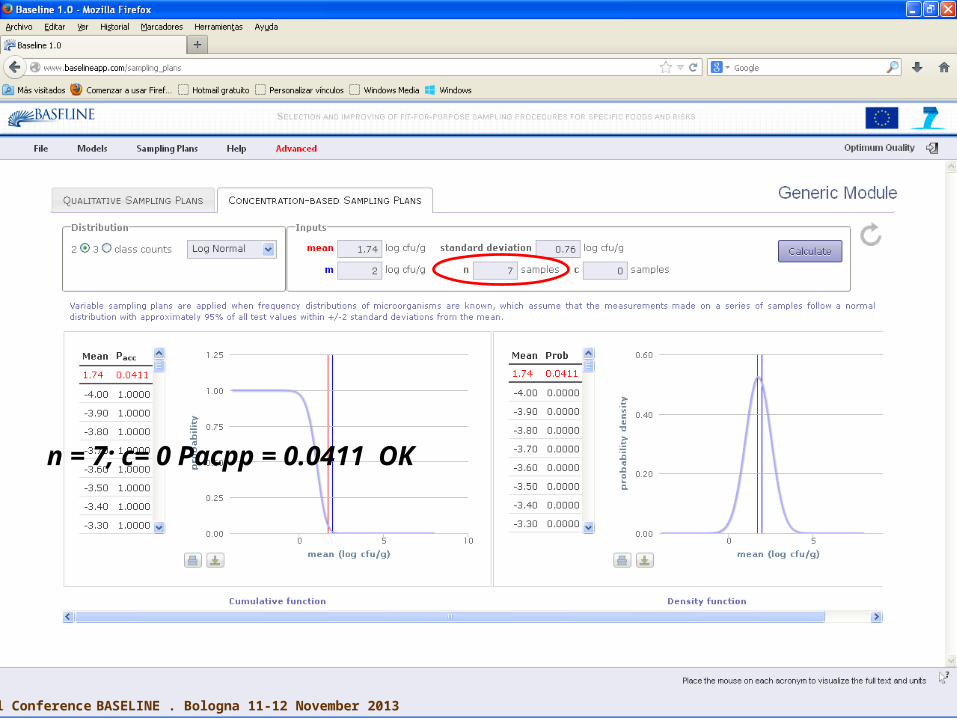
n = 7; c= 0 Pacpp = 0.0411 OK
Final Conference BASELINE . Bologna 11-12 November 2013
17
Input received by WP1-5
Final Conference BASELINE . Bologna 11-12 November 2013
18
Input received by WP1-5
Final Conference BASELINE . Bologna 11-12 November 2013
19
Input received by WP1-5
Final Conference BASELINE . Bologna 11-12 November 2013
Example I
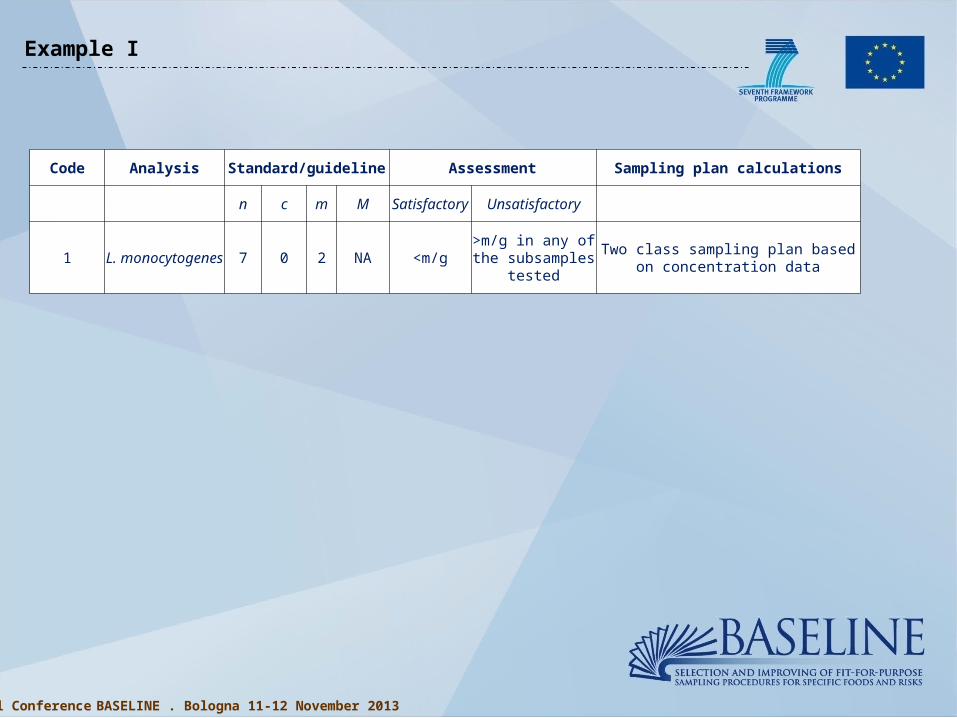
Code Analysis Standard/guideline Assessment Sampling plan calculations
n c m MSatisfactor
yUnsatisfactory
1L.
monocytogenes7 0 2 NA <m/g
>m/g in any of the subsamples
tested
Two class sampling plan based on concentration data
Final Conference BASELINE . Bologna 11-12 November 2013
21
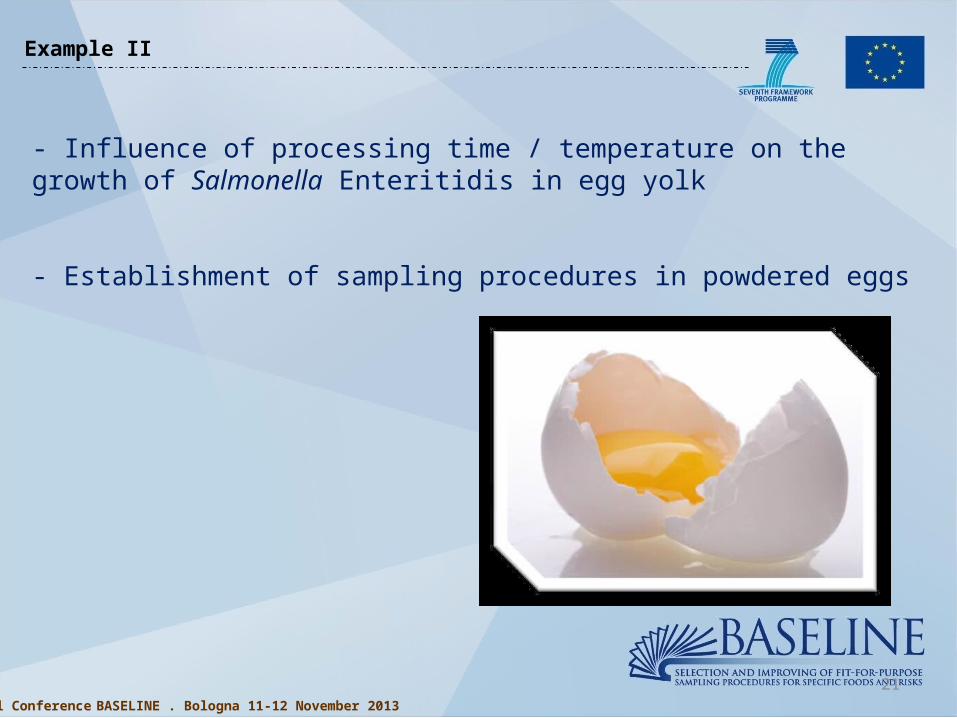
- Influence of processing time / temperature on the growth of Salmonella Enteritidis in egg yolk
- Establishment of sampling procedures in powdered eggs
Example II
Final Conference BASELINE . Bologna 11-12 November 2013
22
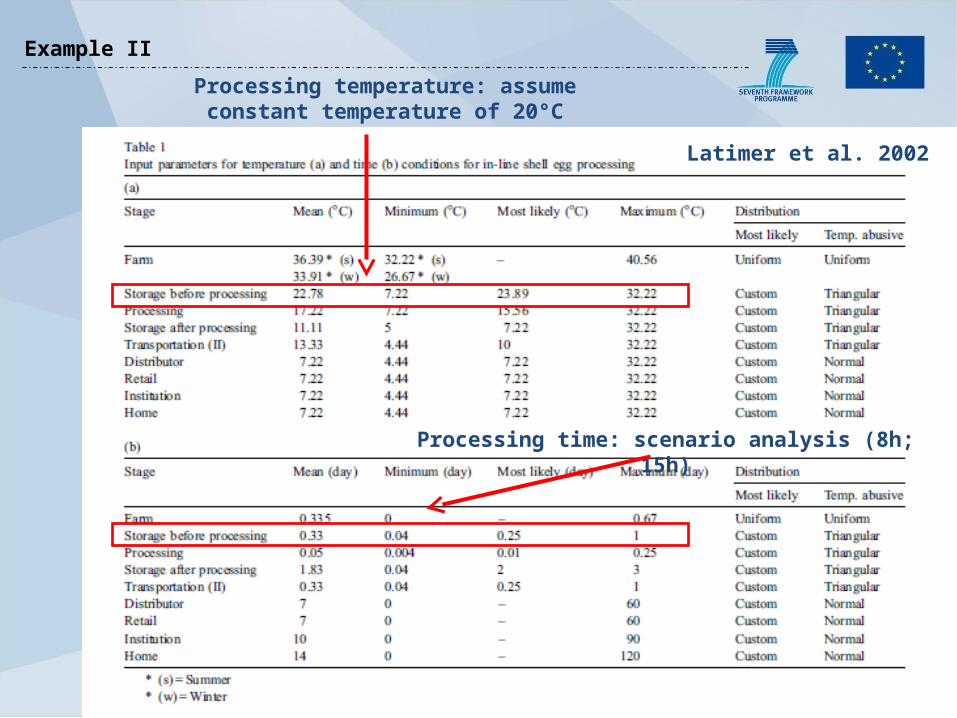
Processing temperature: assume constant temperature of 20°C
Processing time: scenario analysis (8h; 15h)
Latimer et al. 2002
Example II
23
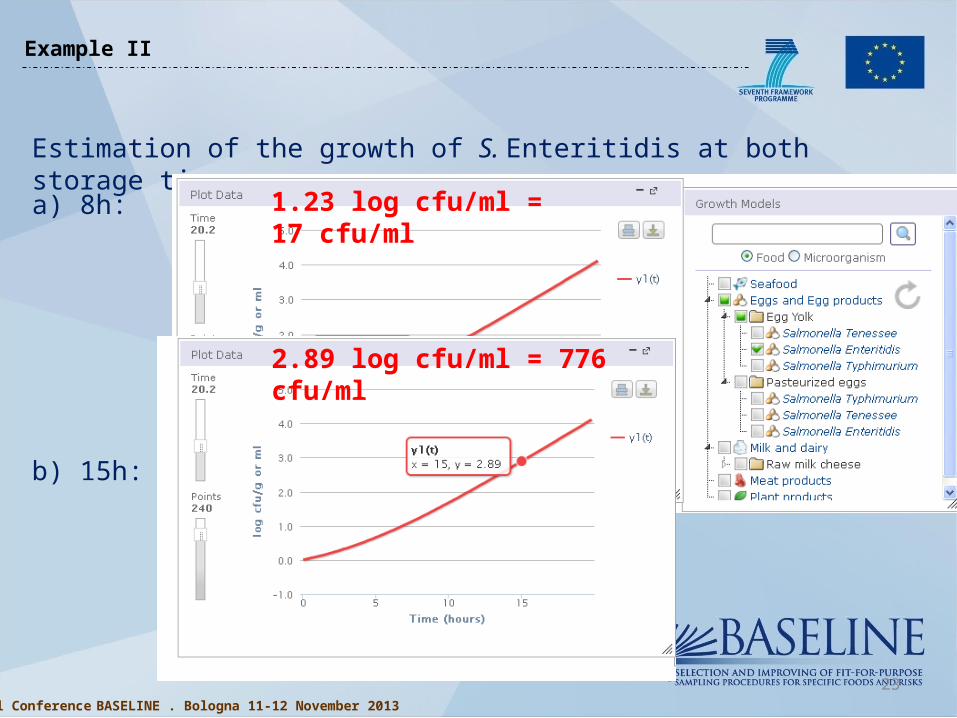
Estimation of the growth of S. Enteritidis at both storage times:
a) 8h:
b) 15h:
1.23 log cfu/ml = 17 cfu/ml
2.89 log cfu/ml = 776 cfu/ml
Example II
Final Conference BASELINE . Bologna 11-12 November 2013
24
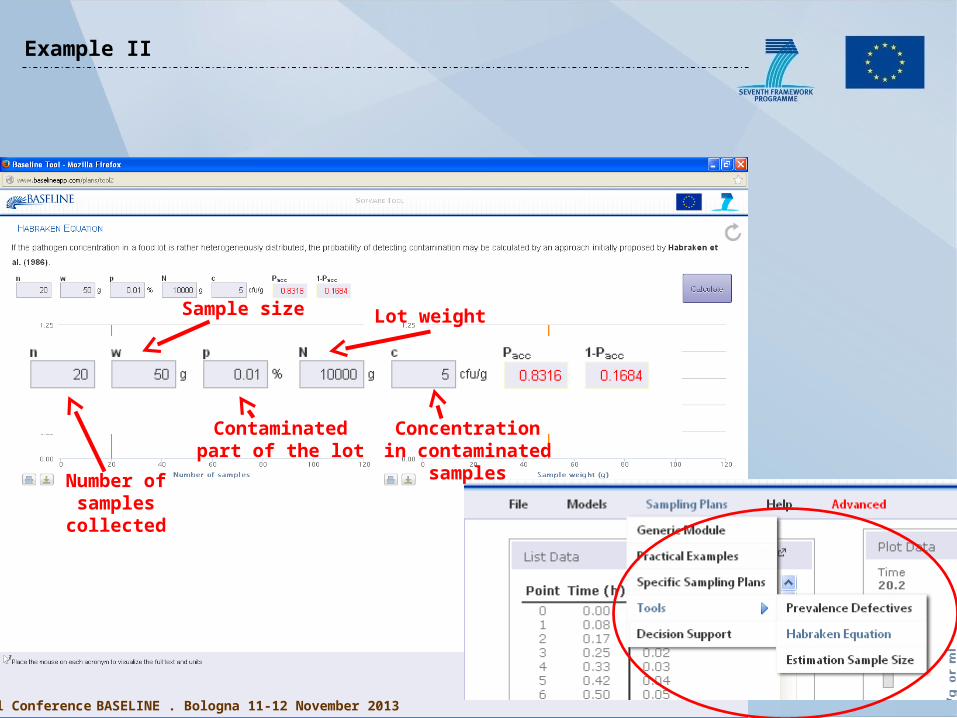
Number of samples collected
Sample size
Contaminated part of the lot
Lot weight
Concentration in contaminated
samples
Example II
Final Conference BASELINE . Bologna 11-12 November 2013
25
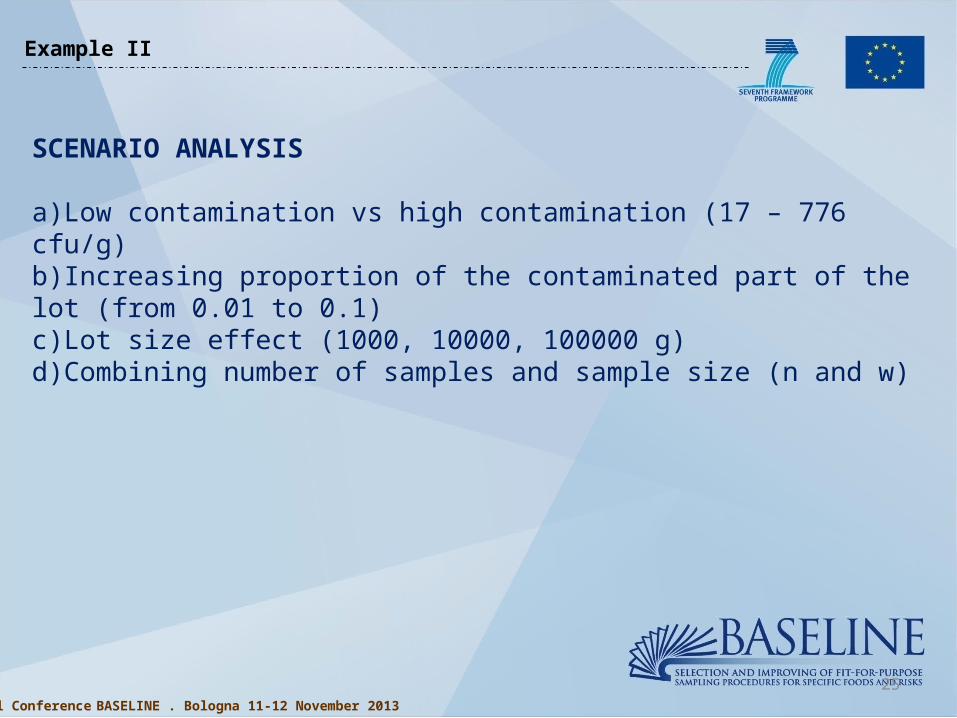
SCENARIO ANALYSIS
a)Low contamination vs high contamination (17 – 776 cfu/g)b)Increasing proportion of the contaminated part of the lot (from 0.01 to 0.1)c)Lot size effect (1000, 10000, 100000 g)d)Combining number of samples and sample size (n and w)
Example II
Final Conference BASELINE . Bologna 11-12 November 2013
26
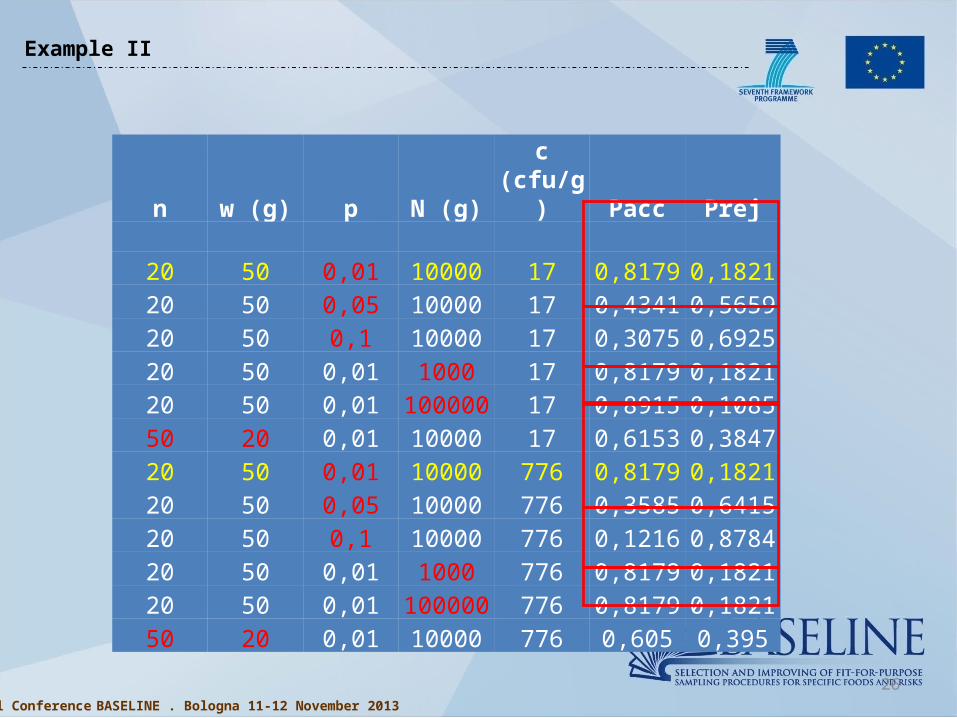
n w (g) p N (g) c (cfu/g) Pacc Prej
20 50 0,01 10000 17 0,8179 0,182120 50 0,05 10000 17 0,4341 0,565920 50 0,1 10000 17 0,3075 0,692520 50 0,01 1000 17 0,8179 0,182120 50 0,01 100000 17 0,8915 0,108550 20 0,01 10000 17 0,6153 0,384720 50 0,01 10000 776 0,8179 0,182120 50 0,05 10000 776 0,3585 0,641520 50 0,1 10000 776 0,1216 0,878420 50 0,01 1000 776 0,8179 0,182120 50 0,01 100000 776 0,8179 0,182150 20 0,01 10000 776 0,605 0,395
Example II
Final Conference BASELINE . Bologna 11-12 November 2013
27
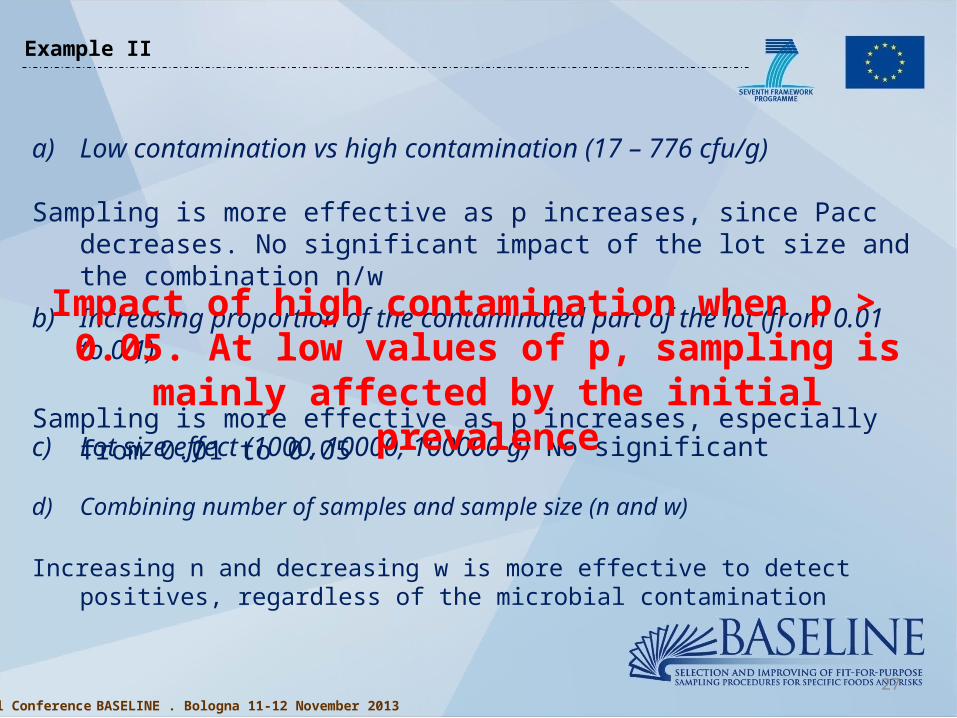
a) Low contamination vs high contamination (17 – 776 cfu/g)
Sampling is more effective as p increases, since Pacc decreases. No significant impact of the lot size and the combination n/w
b) Increasing proportion of the contaminated part of the lot (from 0.01 to 0.1)
Sampling is more effective as p increases, especially from 0.01 to 0.05
c) Lot size effect (1000, 10000, 100000 g) No significant
d) Combining number of samples and sample size (n and w)
Increasing n and decreasing w is more effective to detect positives, regardless of the microbial contamination
Impact of high contamination when p > 0.05. At low values of p, sampling is mainly affected by the initial
prevalence
Example II
Final Conference BASELINE . Bologna 11-12 November 2013
28
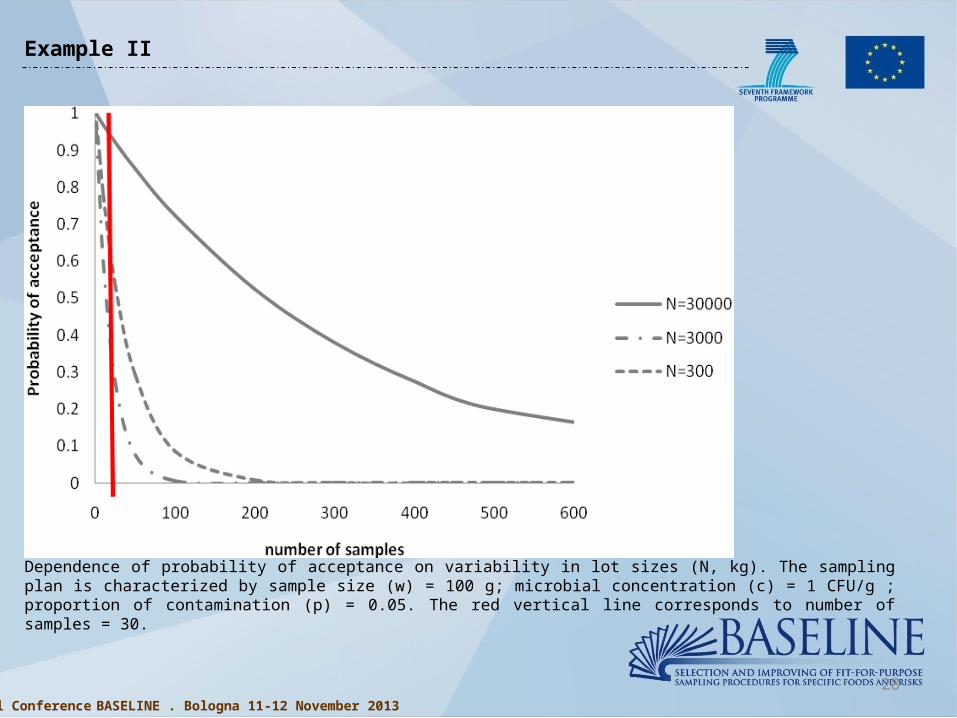
Dependence of probability of acceptance on variability in lot sizes (N, kg). The sampling plan is characterized by sample size (w) = 100 g; microbial concentration (c) = 1 CFU/g ; proportion of contamination (p) = 0.05. The red vertical line corresponds to number of samples = 30.
Example II
Final Conference BASELINE . Bologna 11-12 November 2013
29
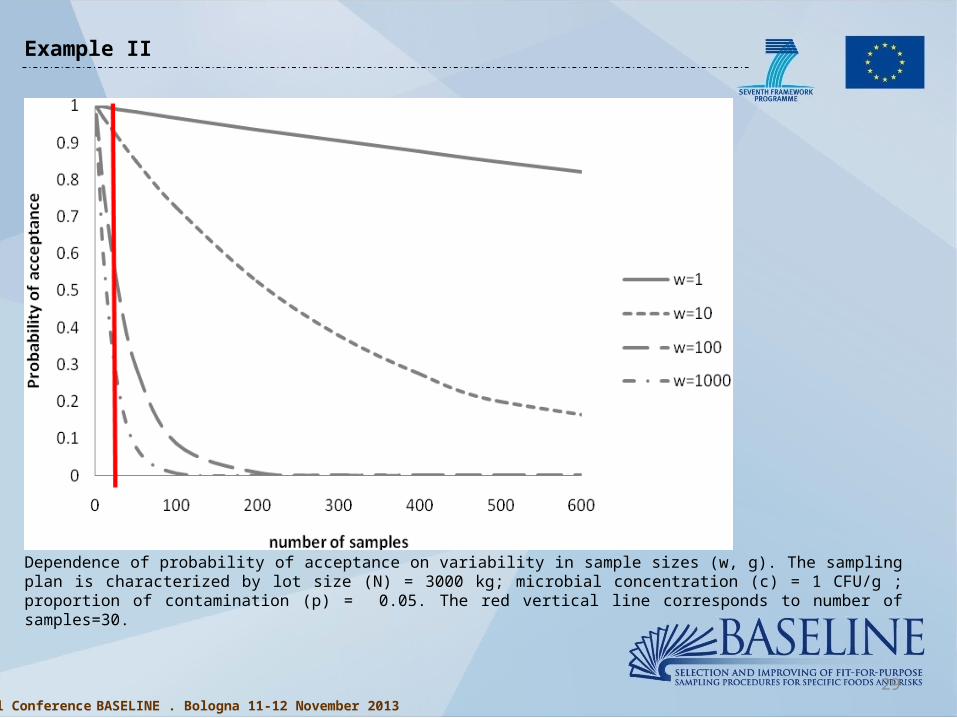
Dependence of probability of acceptance on variability in sample sizes (w, g). The sampling plan is characterized by lot size (N) = 3000 kg; microbial concentration (c) = 1 CFU/g ; proportion of contamination (p) = 0.05. The red vertical line corresponds to number of samples=30.
Example II
Final Conference BASELINE . Bologna 11-12 November 2013
30
Example II
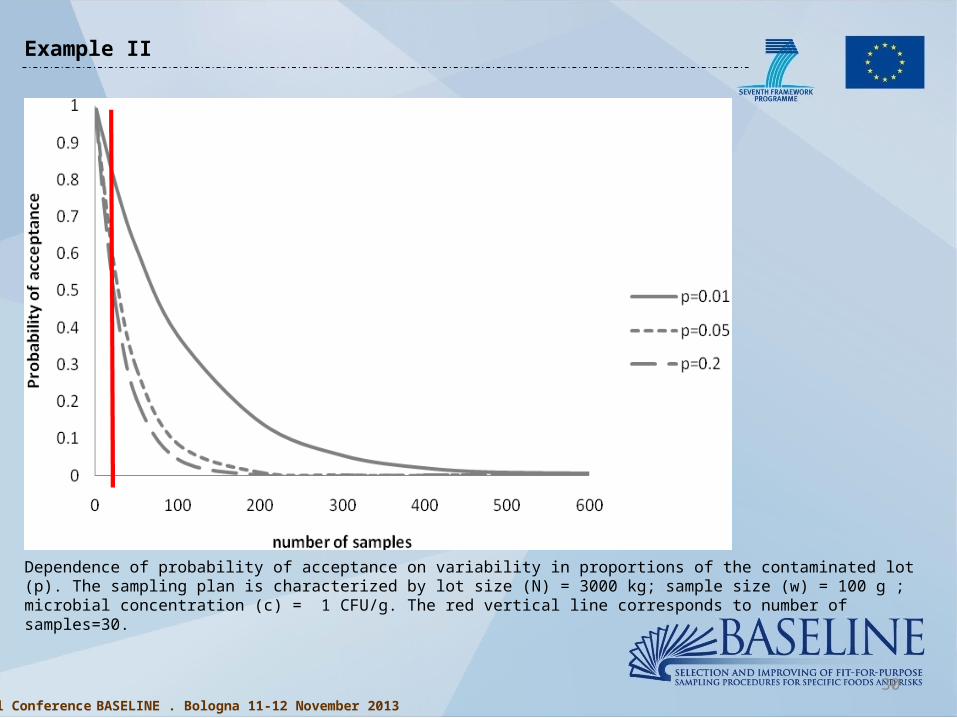
Dependence of probability of acceptance on variability in proportions of the contaminated lot (p). The sampling plan is characterized by lot size (N) = 3000 kg; sample size (w) = 100 g ; microbial concentration (c) = 1 CFU/g. The red vertical line corresponds to number of samples=30.
Final Conference BASELINE . Bologna 11-12 November 2013
31Final Conference BASELINE . Bologna 11-12 November 2013
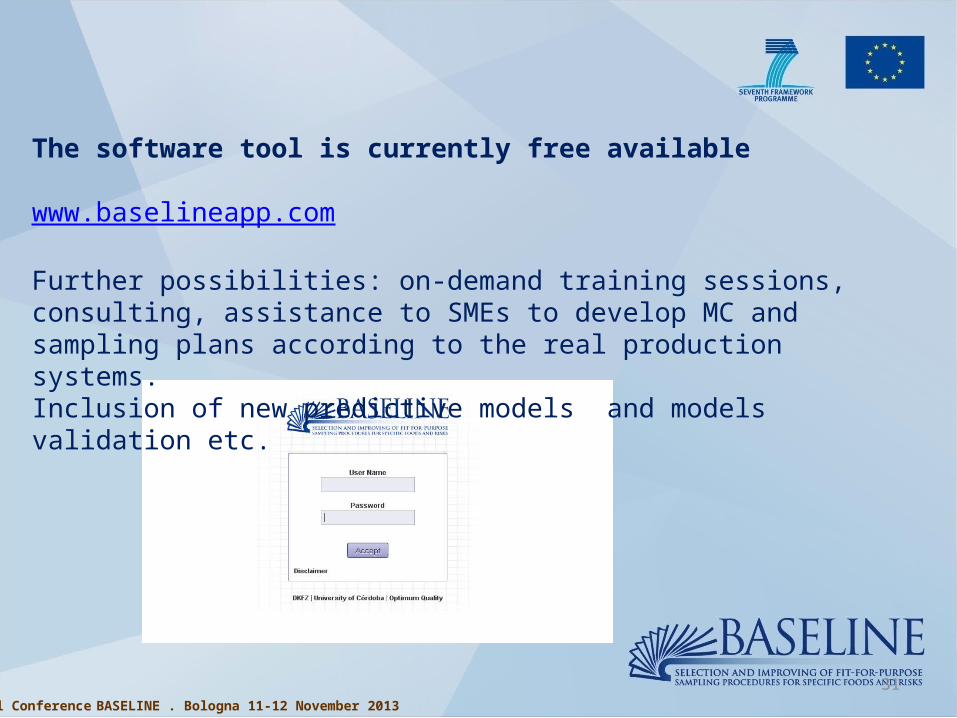
The software tool is currently free available
www.baselineapp.com
Further possibilities: on-demand training sessions, consulting, assistance to SMEs to develop MC and sampling plans according to the real production systems.Inclusion of new predictive models and models validation etc.

THANK YOU FOR YOUR ATTENTION !!!

Related Documents