Baseline Report Series: 2. The Permo-Triassic Sandstones of west Cheshire and the Wirral Groundwater Systems and Water Quality Commissioned Report CR/02/109N National Groundwater & Contaminated Land Centre Technical Report NC/99/74/2 The Natural Quality of Groundwater in England and Wales A joint programme of research by the British Geological Survey and the Environment Agency

Welcome message from author
This document is posted to help you gain knowledge. Please leave a comment to let me know what you think about it! Share it to your friends and learn new things together.
Transcript

Baseline Report Series: 2. The Permo-Triassic Sandstones of west Cheshire and the Wirral
Groundwater Systems and Water Quality Commissioned Report CR/02/109N National Groundwater & Contaminated Land Centre Technical Report NC/99/74/2
The Natural Quality of Groundwater in England and Wales A joint programme of research by the British Geological Survey and the Environment Agency


Contents
FOREWORD iv
BACKGROUND TO THE BASELINE PROJECT v
1. EXECUTIVE SUMMARY 1
2. PERSPECTIVE 2
3. BACKGROUND TO UNDERSTANDING BASELINE QUALITY 6 3.1 Geology 6 3.2 Hydrogeology 11 3.3 Aquifer mineralogy 15 3.4 Rainfall chemistry 15
4. DATA AND INTERPRETATION 18 4.1 Groundwater sampling programme 18 4.2 Historical data 18 4.3 Interpretation of pumped groundwater samples 20 4.4 Data handling 21
5. HYDROCHEMICAL CHARACTERISTICS 22 5.1 Introduction 22 5.2 Water types and physicochemical characteristics 24 5.3 Major elements 26 5.4 Minor and trace elements 28 5.5 Pollution indicators 31
6. GEOCHEMICAL CONTROLS AND REGIONAL CHARACTERISTICS 32 6.1 Introduction 32 6.2 Chemical evolution along flowlines 32 6.3 Temporal variations 39 6.4 Age of the groundwater 42 6.5 Regional variations 43
7. BASELINE CHEMISTRY OF THE AQUIFER 48
8. SUMMARY AND CONCLUSIONS 49
REFERENCES 50
i

List of Figures
Figure 2.1 Topographic map of the West Cheshire and Wirral Area 4 Figure 2.2 View of Mid Cheshire Ridge along the east of the study area, taken near Peckforton
Castle 3 Figure 2.3 Land use map of the study area. 5 Figure 2.4 View from Helsby Hill towards the Mersey Estuary, illustrating the industrial and
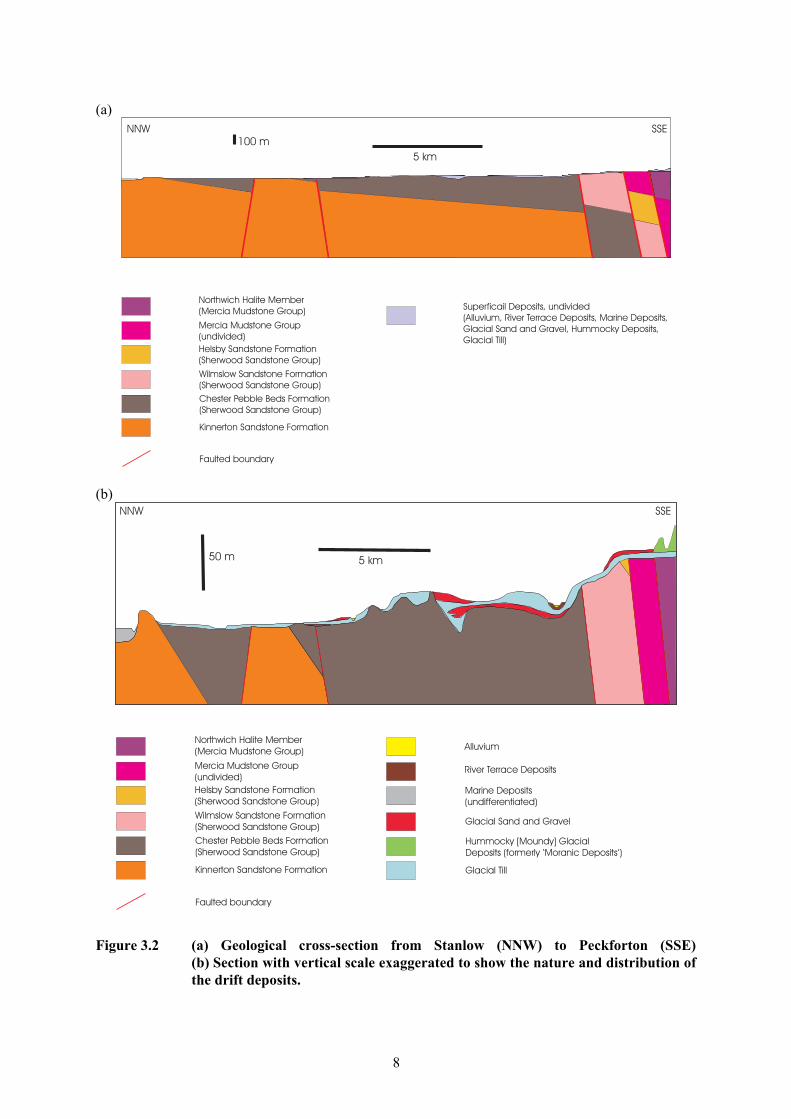
agricultural land use in the area. 6 Figure 3.1 Solid geology of the study area. 7 Figure 3.2 (a) Geological cross-section from Stanlow (NNW) to Peckforton (SSE) (b) Section
with vertical scale exaggerated to show the nature and distribution of the drift deposits. 8
Figure 3.3 Drift geology map to show distribution of drift deposits in the study area. 10 Figure 3.4 Sherwood Sandstone at Fivecrosses Quarry. Water can be seen seeping from the
Quarry face at the contact between sandstone (upper) and mudstone (lower). 12 Figure 3.5 Cross-bedded Sandstones of the Wilmslow Formation, cutting next to the expressway
on the Runcorn Peninsula. 13 Figure 3.6 Geological map of the Cheshire Basin showing groundwater levels (from Plant et al.,
1999). 14 Figure 3.7 SEM photomicrographs to illustrate the mineralogy of the Sherwood Sandstone
aquifer. (a) moderately compacted subarkose showing complete cementation of intergranular porosity by quartz cement. Sherwood Sandstone Group. (b) relationship between dolomite (d), pyrite (p), calcite (c) and quartz (q). Helsby Sandstone Formation, Thornton Borehole. (c) anhydrite veinlet cutting porous sandstone. Malpas Sandstone, Wilkesley Borehole. (d) edge of fault vein containing pyrite and calcite cutting porous sandstone. Helsby Sandstone Formation, Thornton Borehole. 16
Figure 4.1 Map indicating approximate flow lines, distribution of boreholes in EA data set and sampling points for the Baseline project. 19
Figure 4.2 Field sampling using a flow through cell. 20 Figure 5.1 PIPER plot showing the relative concentrations of major cations and anions in
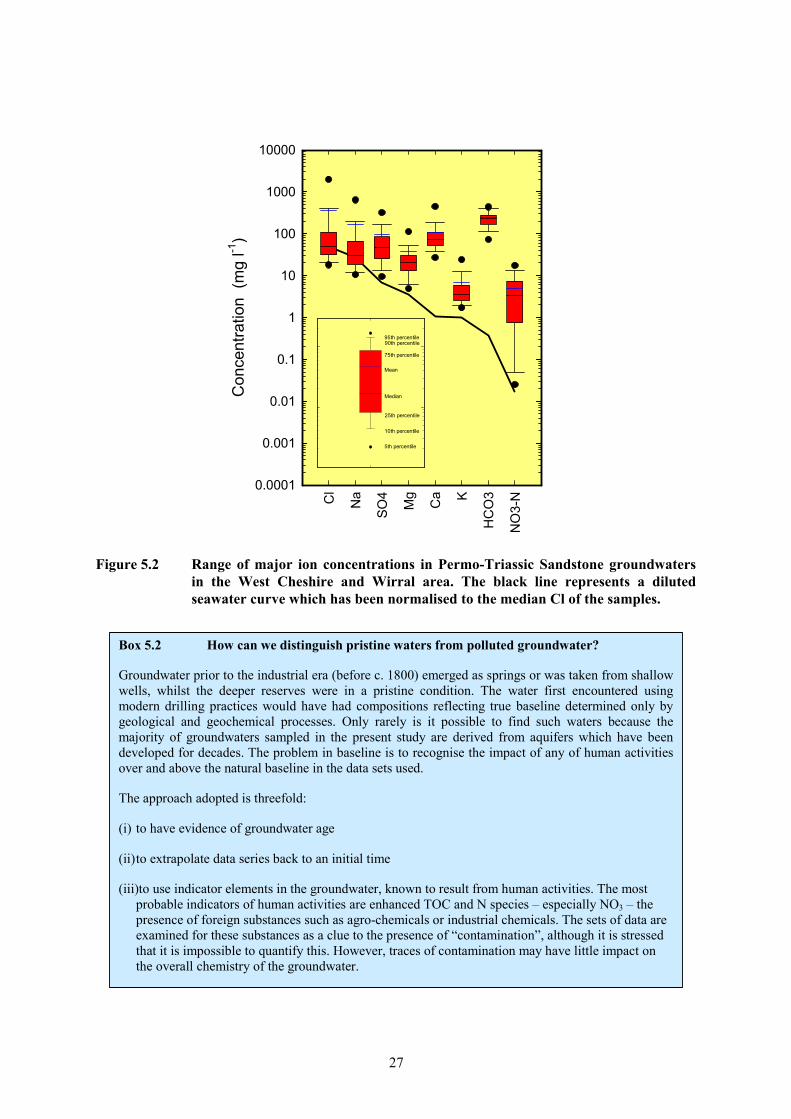
groundwaters of west Cheshire and the Wirral. 25 Figure 5.2 Range of major ion concentrations in Permo-Triassic Sandstone groundwaters in the
West Cheshire and Wirral area. The black line represents a diluted seawater curve which has been normalised to the median Cl of the samples. 27
Figure 5.3 Range of minor and trace element concentrations in Permo-Triassic Sandstone groundwaters in the West Cheshire and Wirral area. The black line represents a diluted seawater curve which has been normalised to the median Cl of the samples. The grey line indicates detection limit of the recent analyses. 28
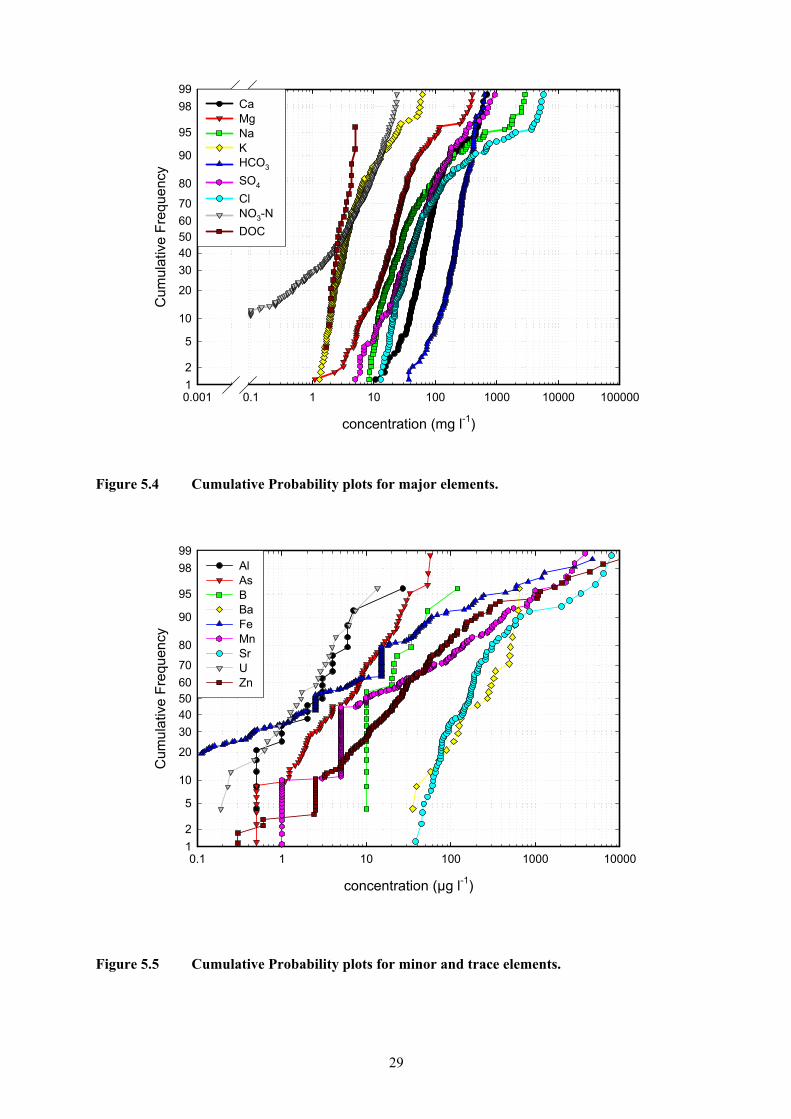
Figure 5.4 Cumulative Probability plots for major elements. 29 Figure 5.5 Cumulative Probability plots for minor and trace elements. 29 Figure 6.1 Major element characteristics of groundwater along the flowlines. 34 Figure 6.2 Chemical variation in redox parameters and redox sensitive elements along the
flowlines. 35
ii
Figure 6.3 Trace element characteristics along the flowline and element ratios. 38 Figure 6.4 Variations in nitrate concentration with time. 40 Figure 6.5 Temporal variations in groundwater chemistry for boreholes at Bowater (close to the
Mersey Estuary, influenced by saline intrusion following unsustainable abstraction), Plemstall (mid-way between Bowater and Eaton) and Eaton (confined). 41
Figure 6.6 Change in composition of groundwaters from the Bowater No. 5 borehole. Note the change from a Ca-HCO3 to a Ca-Cl type water. 42
Figure 6.7 Regional variations is selected element concentrations (a) sulphate, (b) calcium, (c) chloride and (d) sodium. 44
Figure 6.8 Regional variations is selected element concentrations (a) nitrate as N, (b) barium, (c) arsenic and (d) bicarbonate. 47
List of Tables
Table 3.1 Formations of the Sherwood Sandstone Group in the Cheshire Basin .......................11 Table 3.2 Rainfall chemistry from Preston Montford. The precipitation-weighted annual mean
data are for 1999 from The UK National Air Quality Information Archive (http://www.aeat.co.uk/netcen/airqual/). .....................................................................17
Table 5.1a Field parameters, isotope data and range of major and minor element concentrations in the Permo-Triassic Sandstones of the Cheshire study area. ....................................22
Table 5.1b Trace element concentrations in groundwaters of the Cheshire study area. ...............23
iii

FOREWORD
Groundwater issuing from springs has been regarded since the earliest recorded history as something pure, even sacred. In its natural state, it is generally of excellent quality and an essential natural resource. However, the natural quality of groundwater in our aquifers is continually being modified by the influence of man. This occurs due to groundwater abstraction and the consequent change in groundwater flow, artificial recharge and direct inputs of anthropogenic substances. A thorough knowledge of the quantity and quality of groundwaters in our aquifers, including a good understanding of the physical and chemical processes that control these, is therefore essential for effective management of this valuable resource.
About 35 per cent of public water supply in England and Wales is provided by groundwater resources, this figure being higher in the south and east of England where the figure exceeds 70 per cent. Groundwater is also extremely important for private water supplies and in some areas, often those with the highest concentration of private abstractions, alternative supplies are generally not available. Groundwater flows and seepages are also vital for maintaining summer flows in rivers, streams and wetland habitats, some of which rely solely on groundwater, especially in eastern and southern England. The quantity and quality of groundwater is therefore extremely important to sustain both water supply and sensitive ecosystems.
Until now there has not been a common approach, either in the UK or across Europe, to define the natural “baseline” quality of groundwater. Such a standard is needed as the scientific basis for defining natural variations in groundwater quality and whether or not anthropogenic pollution is taking place. It is not uncommon for existing limits for drinking water quality to be breached by entirely natural processes. This means that it is essential to understand the natural quality of groundwater to enable the necessary protection, management and restoration measures for groundwater to be adopted.
One of the main problems pertinent to groundwater remediation issues concerns the background or baseline to which remedial measures must, or can, be taken. Naturally high concentrations of some elements in particular areas may make it impossible or uneconomic to remediate to levels below the natural background which may already breach certain environmental standards. The Baseline Reports Series assesses the controls on water quality which are responsible for causing the natural variations seen in groundwater and provides a background for assessing the likely outcomes and timescales for restoration.
This report builds on a scoping study of England and Wales, carried out in 1996 by the British Geological Survey for the Environment Agency, which reviewed the approach to be adopted in producing a series of reports on the principal aquifers in England and Wales. The initial phase of this work was completed in 1998 and comprised reports on seven aquifers. This report forms part of the second phase of the work that will extend coverage to all the important aquifers in England and Wales. The Baseline reports will be of use not only to regulatory agencies but also to all users of groundwater, including water companies, industry and agriculture, and all those involved in the protection and remediation of groundwater.
iv

BACKGROUND TO THE BASELINE PROJECT
The baseline concentration of a substance in groundwater may be defined in several different ways. For the purpose of the project, the definition is given as
“the range in concentration (within a specified system) of a given element, species or chemical substance present in solution which is derived from natural geological, biological, or atmospheric sources”
Terms such as background or threshold can have a similar meaning and have often been used to identify “anomalous” concentrations relative to typical values e.g. in mineral exploration. There may be additional definitions required for regulation purposes, for example when changes from the present day status of groundwater may represent the starting point of monitoring. This may be defined as background and such an initial condition may include some anthropogenic component in the water quality.
In order to interpret the water quality variations in terms of the baseline, some knowledge of the residence times of groundwater is required. For this purpose both inert and reactive chemical and isotopic tracers are essential. Measurement of the absolute age of groundwater presents many difficulties and radiocarbon dating is the most widely used technique. By investigating the evolution of water quality along flow lines it may be possible to establish relative timescales using a combination of geochemical and isotopic methods. Indicators such as the stable isotope composition of water may also provide indirect evidence of residence time. The identification (or absence) of marker species related to activities of the industrial era, such as total organic carbon (TOC), tritium (3H), dissolved greenhouse gases -chlorofluorocarbons (CFCs) - and certain micro-organic pollutants may provide evidence of a recent component in the groundwater. The baseline has been modified by man since earliest times due to settlement and agricultural practices. However, for practical purposes, it is convenient to be able to distinguish water of different 'ages': (i) Palaeowater - recharge originating during or before the last glacial era i.e. older than c.10 ka (ii) Pre-Industrial Water (pre 1800s), (iii) Pre-War (1940s) and (iv) modern era (post 1963).
Thus an ideal starting point is to locate waters where there are no traces of human impact, essentially those from the pre-industrial era, although this is not always easy for several reasons. Groundwater exploitation by means of drilling may penetrate water of different ages and/or quality with increasing depth as a result of the stratification that invariably develops. This stratification is a result of different flow paths and flow rates being established as a consequence of prevailing hydraulic gradients and the natural variation in the aquifer’s physical and geochemical properties. The drilling and installation of boreholes may penetrate this stratified groundwater and pumped samples will therefore often represent mixtures of the stratified system. In dual porosity aquifers, such as the Chalk, the water contained in the fractures may be considerably different chemically from the water contained in the matrix because of differences in residence time. The determination of the natural baseline can be achieved by several means including the study of pristine (unaffected by anthropogenic influence) environments, the use historical records and the application of graphical procedures such as probability plots to discriminate different populations (Shand & Frengstad, 2001; Edmunds et al., 2002). The “baseline” refers to a specified system (e.g. aquifer, groundwater body or formation) and is represented by a range of concentrations within that system. This range can then be specified by the median and lower and upper limits of concentration.
v

The BASELINE objectives are:
1. to establish criteria for defining the baseline concentrations of a wide range of substances that occur naturally in groundwater, as well as their chemical controls, based on sound geochemical principles, as a basis for defining water quality status and standards in England and Wales (in the context of UK and Europe); also to assess anomalies due to geological conditions and to formulate a quantitative basis for the definition of groundwater pollution.
2. to characterise a series of reference aquifers across England and Wales that can be used to illustrate the ranges in natural groundwater quality. The baseline conditions will be investigated as far as possible by cross-sections along the hydraulic gradient, in well characterised aquifers. Sequential changes in water-rock interaction (redox, dissolution-precipitation, surface reactions) as well as mixing, will be investigated. These results will then be extrapolated to the region surrounding each reference area. Lithofacies and mineralogical controls will also be taken into account. A wide range of inorganic constituents as well as organic carbon will be analysed to a common standard within the project. Although the focus will be on pristine groundwaters, the interface zone between uncontaminated and contaminated groundwaters will be investigated; this is because, even in contaminated systems, the main constituents of the water are also controlled by geological factors, amount of recharge and natural climate variation.
3. to establish long term trends in water quality at representative localities in the selected reference aquifers and to interpret these in relation to past changes due to natural geochemical as well as hydrogeological responses or anthropogenic effects.
4. to provide a scientific foundation to underpin UK and EU water quality guideline policy, notably the Water Framework Directive, with an emphasis on the protection and sustainable development of high quality groundwater.
vi

1. EXECUTIVE SUMMARY
The Permo-Triassic Sandstone forms an important aquifer in the north west of England. This study focuses on the Permo-Triassic aquifer of West Cheshire and the Wirral Peninsula. The aquifer provides public and private water supplies to towns, farms and industry. There is significant industrial land use in the area including oil refinement, salt production, manufacturing industry and chemical processing. Much of the remaining area is dominated by farmland.
This report aims to provide an overview of variations in baseline chemistry and the dominant geochemical processes occurring in this part of the Permo-Triassic aquifer. It provides a tool to aid the management of groundwater and provide a basis from which to identify future impacts on the quality of groundwater. Baseline values are of vital importance in site remediation.
The dominant control on natural groundwater chemistry in the Permo-Triassic Sandstone aquifer is dissolution of carbonate (calcite, dolomite) and sulphate (gypsum, anhydrite) cements. However, ion-exchange, mixing with older formation waters, saline intrusion and redox processes are also very important.
Salinity varies considerably within the aquifer. Higher salinities are found in areas adjacent to the Mersey estuary at Stanlow, Ellesmere Port, Runcorn and the Wirral. These elevated concentrations are largely attributed to the effect of saline intrusion following unsustainable abstraction (Hibbert, 1956; Lucey, 1987 and Scott, 1997). Further inland saline waters are also found and these occur as a result of mixing between fresh recharge water and brines arising from halite dissolution.
The study shows that, in general, the properties of groundwater in the Permo-Triassic Sandstones of Cheshire and Wirral Peninsula are overwhelmingly determined by natural reactions between rainwater reacting with the bedrock and drift deposits. However, along the Mersey Estuary the ingress of saline water is also having an important influence on groundwater chemistry.
The natural baseline within the aquifer is expressed by a range of concentrations which can vary over several orders of magnitude for some elements. Some elements are enhanced over the natural baseline due to pollution. For example, elevated nitrate and chloride concentrations may indicate modification by agricultural and industrial practices. In parts of the aquifer, arsenic, barium and uranium occur at concentrations which exceed drinking water standards. However, these concentrations are not considered to be the impact of pollution, they result from water-rock interaction and reflect aquifer mineralogy. In cases where natural water quality exceeds guide levels it is essential that baseline values are defined.
1

2. PERSPECTIVE
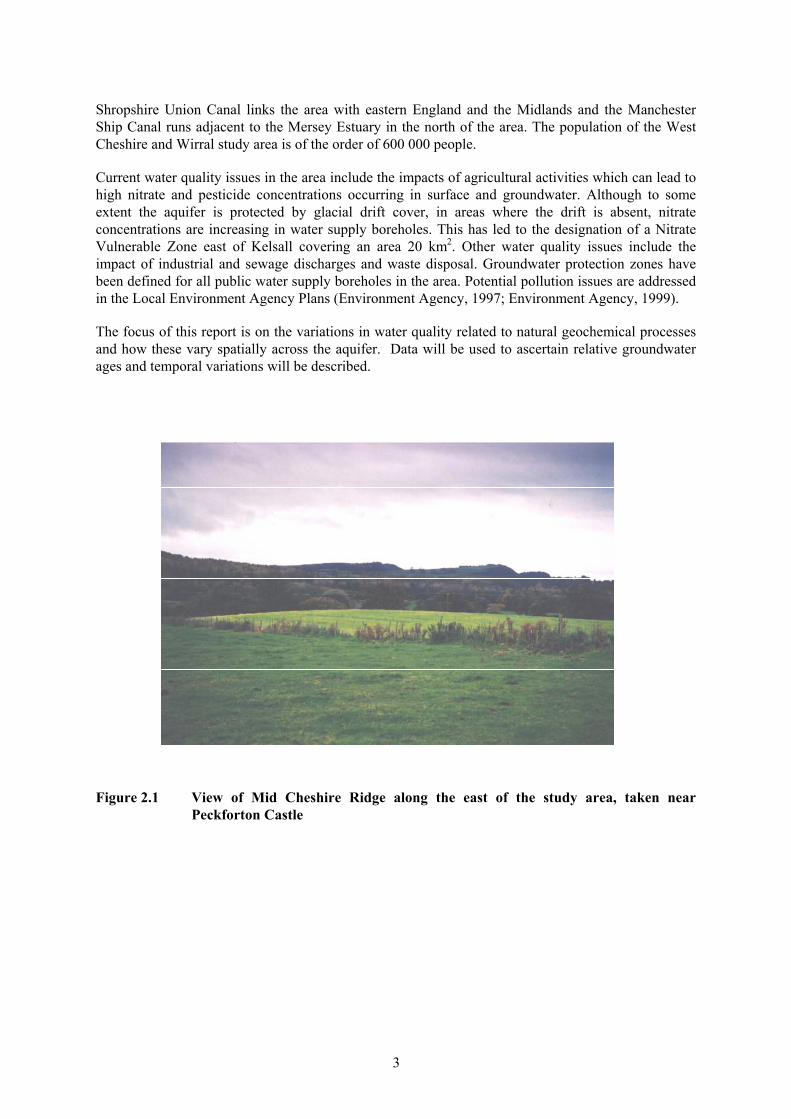
This study focuses on the Permo-Triassic Sandstone of West Cheshire and the Wirral Peninsula, situated towards the north western edge of the Cheshire Basin. The eastern boundary of the study area is formed by the Mid Cheshire Ridge, a topographic high running north-south from Frodsham (SJ 5277) to Malpas (SJ 4848) (Figure 2.1). The ridge is two to three miles wide and reaches an elevation of almost 200 m in the vicinity of Peckforton (SJ 5353). To the west of the Mid Cheshire Ridge the land forms a drift covered plain which ranges in elevation from about 40 m aOD to just above sea-level adjacent to the Mersey Estuary. To the east of the Mid Cheshire Ridge lies the outcrop of the Triassic Mercia Mudstone which confines the underlying sandstone aquifer (Earp and Taylor, 1986). Figure 2.2 illustrates the topography of the region and the area covered by this study.
The northern edge of the study area is bounded by the Mersey Estuary. The western margin is formed by the Westphalian (Upper Carboniferous) outcrop of North Wales. The southernmost margin lies to the south of the Milton Inlier and runs E-W to the east of Wrexham. This region forms the core area for evaluating the regional baseline groundwater quality and selected groundwater data have been used to provide an areal coverage.
The region west of the Mid Cheshire ridge is drained to the north-east by the River Dee, the River Gowy and the River Mersey. The watershed divide between the River Mersey and the River Dee runs from Burwardsley in the Peckforton Hills in the south east through to Upton Heath in the north west. To the west of this line all streams drain into the Dee. The rest of the area west of the Mid-Cheshire hills and to the east of the Peckforton Hills is drained northwards by the River Gowy, a tributary of the Mersey which enters the Mersey at Stanlow. The area immediately south of Helsby is drained directly to the Mersey by a small stream known as Mill’s Brook and Peckmill Brook (Earp and Taylor, 1986).
The Permo-Triassic Sandstones form the second most important aquifer in the UK, supplying approximately 25% of licensed groundwater abstractions in England and Wales (Monkhouse and Richards, 1982). It provides an essential source of baseflow to maintain river quality. Groundwater provides high quality drinking water for both public and private water supplies, and water for agriculture and industry. Total licensed abstractions from the Permo-Triassic Sandstone within the study area are of the order of 230 Ml d-1.
The groundwater abstracted in the area is used to supply towns to the east of the area including Northwich, Winsford, Middlewich and Crewe. Many of these towns are located on the mudstones or evaporite deposits of the Mercia Mudstone Group and which yield no suitable groundwater supply of their own. Warrington also derives water from the Ashton-Manley area while the Peckforton Hills yield supplies for Stoke-on-Trent. One borehole (Plemstall) is used to supplement surface water supplies for Chester (Earp and Taylor, 1986).
Aquifers are vulnerable to urban, agricultural and industrial pollution. The main urban developments in the area of study include Chester, Ellesmere Port, Birkenhead and other towns on the Wirral Peninsula. Figure 2.3 is a land use map of the study area. Farming in the area consists mainly of dairy farming and arable crop production. Agricultural land use may give rise to diffuse and point source pollution by nitrate and pesticides. There is significant industrial land use in the area including oil refinement, salt production, manufacturing industry and chemical processing (Figure 2.4). These activities are mainly concentrated in the north of the area along the Mersey Estuary at Ellesmere Port, Stanlow, Helsby and Runcorn. To the east of the study area, around Northwich and Winsford, extensive salt production has taken place. These industrial areas pose a large potential contamination threat to groundwater and surface water and there are a number of known areas of contamination. A number of major railways and roads traverse the area including the M56 and M53 motorways. The
2
Shropshire Union Canal links the area with eastern England and the Midlands and the Manchester Ship Canal runs adjacent to the Mersey Estuary in the north of the area. The population of the West Cheshire and Wirral study area is of the order of 600 000 people.
Current water quality issues in the area include the impacts of agricultural activities which can lead to high nitrate and pesticide concentrations occurring in surface and groundwater. Although to some extent the aquifer is protected by glacial drift cover, in areas where the drift is absent, nitrate concentrations are increasing in water supply boreholes. This has led to the designation of a Nitrate Vulnerable Zone east of Kelsall covering an area 20 km2. Other water quality issues include the impact of industrial and sewage discharges and waste disposal. Groundwater protection zones have been defined for all public water supply boreholes in the area. Potential pollution issues are addressed in the Local Environment Agency Plans (Environment Agency, 1997; Environment Agency, 1999).
The focus of this report is on the variations in water quality related to natural geochemical processes and how these vary spatially across the aquifer. Data will be used to ascertain relative groundwater ages and temporal variations will be described.
Figure 2.1 View of Mid Cheshire Ridge along the east of the study area, taken near Peckforton Castle
3

Figure 2.2 Topographic map of the West Cheshire and Wirral Area
4

Figure 2.3 Land use map of the study area.
5

Figure 2.4 View from Helsby Hill towards the Mersey Estuary, illustrating the industrial and agricultural land use in the area.
3. BACKGROUND TO UNDERSTANDING BASELINE QUALITY
3.1 Geology
3.1.1 Structure
The area lies along the north western edge of the Cheshire Basin. The Cheshire Basin was initiated at the end of the Variscan (late Carboniferous) period as a result of faulting and uplift. Faulting during the Permo-Triassic, while sediments were being deposited, allowed the rapid accumulation of a thick sedimentary sequence. The eastern boundary of the Cheshire Basin is bounded by a group of N-S trending faults with throws of up to 300 m, enhancing the thickness of the Permo-Triassic deposits. The eastern boundary of the Sherwood Sandstone Group in the study area is created by one of these faults (Peckforton Fault) against which the Mercia Mudstone Group has been downthrown (Figure 3.1 and Figure 3.2a).
6

Figure 3.1 Solid geology of the study area.
7
(a)
Northwich Halite Member
(Mercia Mudstone Group)
Mercia Mudstone Group
(undivided)
Helsby Sandstone Formation
(Sherwood Sandstone Group)
Wilmslow Sandstone Formation
(Sherwood Sandstone Group)
Chester Pebble Beds Formation
(Sherwood Sandstone Group)
Kinnerton Sandstone Formation
Superficail Deposits, undivided
(Alluvium, River Terrace Deposits, Marine Deposits,
Glacial Sand and Gravel, Hummocky Deposits,
Glacial Till)
Faulted boundary
NNW SSE100 m
5 km
(b)
Northwich Halite Member
(Mercia Mudstone Group)
Mercia Mudstone Group
(undivided)
Helsby Sandstone Formation
(Sherwood Sandstone Group)
Wilmslow Sandstone Formation
(Sherwood Sandstone Group)
Chester Pebble Beds Formation
(Sherwood Sandstone Group)
Kinnerton Sandstone Formation
Alluvium
River Terrace Deposits
Marine Deposits
(undifferentiated)
Glacial Sand and Gravel
Hummocky [Moundy] Glacial
Deposits (formerly ‘Moranic Deposits’)
Glacial Till
Faulted boundary
NNW SSE
50 m 5 km
Figure 3.2 (a) Geological cross-section from Stanlow (NNW) to Peckforton (SSE) (b) Section with vertical scale exaggerated to show the nature and distribution of the drift deposits.
8

The Wirral Peninsula is intensively faulted with predominantly north-south trending faults with downthrow to the west but also with some minor faults trending east-west. Faults have two possible hydraulic impacts, either acting as a barrier to flow across the fault or providing a conduit for flow along the fault. Hibbert (1956) considered that one of the most hydrogeologically significant faults is the Thornton-le-Moors – Stanlow Fault. The regional dips are east and south-east towards the centre of the Cheshire basin.
3.1.2 Superficial deposits
The area underwent extensive glaciation during the Pleistocene which has influenced the hydrogeology through the deposition of drift deposits, recharge of meltwater during interglacials, alteration of surface watercourses and development of new flow regimes and base levels within the aquifer as sea-levels fluctuated. Drift deposits may also have an important influence on the hydrochemistry of the aquifer.
The drift cover has the effect of smoothing the topographic surface of the pre-glacial landforms. In the Dee Valley the bedrock surface is below sea level and in the Gowy Valley it is at a depth of 30 metres below sea level. Drift cover is of substantial thickness in places, for example it exceeds 30 metres thickness in the NNW-SSE trending steep-sided valleys along the River Gowy between Helsby and Tarvin.
Drift deposits (Figure 3.2b and Figure 3.3) in the area of study include:
(1) Alluvial deposits and peat along the major river valleys.
(2) Glacial sands and gravels which provide locally important water supplies and permit direct and indirect (via hydraulic continuity with rivers) recharge except where they are till-covered.
(3) Till, which limits recharge and confines the underlying aquifer. It is estimated that more than half of the area is overlain by at least 2 m of clay drift (Earp and Taylor, 1986).
3.1.3 Permo-Triassic sediments
The Permo-Triassic sediments of the Cheshire Basin comprise a sequence of sandstones which make up the Appleby (Permian), Cumbrian Coast (Permian) and Sherwood Sandstone Formations (Permo-Triassic) which are overlain by the mudstone, siltstone and halite deposits of the Mercia Mudstone Group (Triassic) which are overlain by the Penarth Group (Triassic).
The Sherwood Sandstone Group (SSG) was deposited in a fluvial basin system and consists of channel sands, overbank silts and mudstone deposits with some wind blown deposits, marls and breccias characteristic of a desert basin. There is a general upwards reduction in grain size within the sequence (Plant et al, 1999). The Kinnerton Sandstone, at the base of the SSG, comprises aeolian sediments which were deposited prior to the first fluvial influx into the basin from the south which produced the Chester Pebble Beds.
The overlying Mercia Mudstone Group (MMG) comprises partly marine red mudstones and siltstones. The sediments show evidence of a transition from a fluvial environment through to a coastal playa lake environment represented in the sedimentary sequence by mudstones and evaporite deposits, especially halite and gypsum deposits. The evaporite deposits have an important influence upon groundwater flow and hydrogeochemistry of the Cheshire basin.
Dissolution of the evaporites of the MMG during diagenesis resulted in an evaporite cement within the SSG. The dissolution of evaporite cements, notably anhydrite, has created most of the intergranular porosity inherent in the SSG aquifer.
9

���������
��������
���������������
���������������
�������������
���������������
���������
����� !�"�
#!�� ��
$��%!"�
�������&����'�������(�)�'����'������*�+� ��#�,--./�"����'�������(�0/ ���'�0����������*�������� ��������&�0���1�����������0��������(�)��*����������*����������� ���#�����������!����2���)3����������)�������
���������0����"���(����(�� �����0�*������&����������0���0�'�(������0�����)���0��������0���
�����&����')
4 - 4 .- .4 ������������������������������������������������
����������������������������������������
�������������
��������������
��������������
������
�������
�������
�������
�������
�������
�
��������������#�����������56�������
Figure 3.3 Drift geology map to show distribution of drift deposits in the study area.
The SSG aquifer reaches a maximum thickness of more than 1300 m in the vicinity of Knutsford (SJ 7678), to the east of the study area.
The current nomenclature of the Permo-Triassic Sandstone of the Cheshire area is given in Table 3.1.
10

Table 2.1 Formations of the Sherwood Sandstone Group in the Cheshire Basin
Sherwood Sandstone Group comprising: Triassic
Description Estimated thickness
Helsby Sandstone poorly cemented, fine- to coarse-grained sandstones and minor mudstones with breccias and conglomerates at its base
100 to 250 m
Wilmslow Sandstone fine-to medium-grained sandstones with thin mudstones, weakly cemented
280 m
Chester Pebble Beds well-cemented, current-bedded, medium- to coarse-grained micaceous mudstones, conglomerate lenses and pebble layers
150 to 400 m
Permian Due to a lack of fossil evidence the boundary between the Permian and Triassic is often not well established.
Kinnerton Sandstone (spans Permian-Triassic boundary)
fine-to medium-grained sandstones, weakly cemented
10 to 380 m
3.2 Hydrogeology
3.2.1 Introduction
The Sherwood Sandstone Group forms the main aquifer in the region. The Mercia Mudstone Group, which overlies and confines the Sherwood Sandstone Group forms an aquitard. Fine-grained layers within the Sherwood Sandstone may act as localised confining layers within the aquifer. The hydrogeology and aquifer properties of the area have been described by Allen et al. (1997) and the reader is referred to this text for a more detailed description.
Although the unconfined part of the aquifer is extensively penetrated by wells and boreholes there are very few boreholes to the east of the boundary of the Sherwood Sandstone outcrop where the aquifer is confined by the Mercia Mudstone Group.
3.2.2 Aquifer Properties
The aquifer properties of the SSG have been influenced by the sedimentary structures in which they were deposited and also by post-depositional diagenesis. The aquifer is heterogeneous (although within particular beds it is often relatively homogeneous) and anisotropic over a scale of metres with considerable interlayering of sands and less permeable silts present in a series of fluviatile cycles (Figure 3.4). Vertical permeability is generally an order of magnitude less than the horizontal permeability.
The SSG consists of well-sorted fine- to medium-grained sands, poorly cemented, with high matrix porosity (20 to 30%). Pebbly horizons of the Chester Pebble Beds and within the Helsby Sandstone are generally more cemented, with lower porosity and permeability. Laterally discontinuous mudstone
11

bands, usually less than 0.5 m thick, occur locally within the Helsby Sandstone and the Chester Pebble Beds and form local barriers to vertical groundwater flow (Plant et al., 1999).
Figure 3.4 Sherwood Sandstone at Fivecrosses Quarry. Water can be seen seeping from the Quarry face at the contact between sandstone (upper) and mudstone (lower).
The high matrix porosity and typically low hydraulic gradients within the Sherwood Sandstone result in slow groundwater movement with the aquifer. The hydraulic conductivities range from <10-3 to 6.8 m d-1, however field measurements of hydraulic conductivity are often significantly higher because of the presence of fractures through which a significant proportion of groundwater flow occurs. Transmissivity values range from 10 m2 d-1 , to more than 10 000 m2 d-1, but typical values are of the order of 100 to 400 m2 d-1. The range in transmissivities reflects the contrast between intergranular flow and fracture flow, with the highest values occurring where a well-connected fracture network has been developed. Fracture transmissivity will vary according to the dimensions of the fracture aperture, fracture density and the degree of connectivity. Fracture density decreases with depth and valleys are typically more highly fractured than interfluves. Intergranular hydraulic conductivity and transmissivity vary according to the grain size, shape and sorting and the degree of cementation. Weathering of the cement in the shallow aquifer increases porosity. The less well-cemented Wilmslow Sandstone (Figure 3.5) is generally more heavily fractured and can therefore provide higher yields than the other formations of the SSG. Specific yield is of the order of 6 to 14 % and storage coefficients (where the aquifer is confined by the MMG) are typically 10-3 to 10-4 (British Geological Survey, 1989).
3.2.3 Recharge and groundwater flow
Annual rainfall in the region varies from less than 700 mm per annum in the low lying areas of the Dee and Weaver catchments to 850 mm in the Delamere and Peckforton Hills (Earp and Taylor, 1986).
12

Figure 3.5 Cross-bedded Sandstones of the Wilmslow Formation, cutting next to the expressway on the Runcorn Peninsula.
The main recharge area is the Mid-Cheshire Ridge, which is free of drift cover (Lucey, 1987). In the rest of the catchment, recharge water has first to pass through drift, which is extensive in places, before it can penetrate the Sherwood Sandstone Group. For the unconfined aquifer recharge is estimated to be approximately 350 mm a-1 but where till cover is present recharge to the underlying aquifer will be considerably reduced to an estimated 52 mm a-1 (Vines, 1984). As recharging water passes through the drift its chemical composition will be altered e.g. sulphate concentrations are likely to increase.
Groundwater levels are high in areas of recharge e.g. along the Mid-Cheshire Ridge. Towards the SE margin of the basin, the potentiometric surface within the SSG is at approximately 100 m above OD (Figure 3.6). In the west of the basin, the SSG receives water from the Lower Carboniferous Limestone through a series of en echelon faults (Metcalfe et al., 1999). Flow in the west of the basin is influenced by the River Dee which is the principal discharge area; in this area the potentiometric surface is at approximately 10 m above OD. Packer tests conducted by Lucey (1987) showed that heads vary by less than 0.4 m over a 100 m depth interval. Seasonal fluctuations in the water level are of the order of 1 m due to the aquifer’s high specific yield. Perched water tables occur locally within the SSG and are often found above a mudstone layer.
Groundwater levels in a number of areas, e.g. at Stanlow, Ellesmere Port and parts of the Wirral Peninsula, have been lowered as a result of abstraction, notably by industry, exceeding recharge during the past century (Metcalfe et al., 1999). However, in more recent years a gradual recovery has been taking place because of reduced abstraction and improved aquifer management. Where the aquifer is confined, it has not been extensively exploited and there is insufficient information to adequately construct groundwater flow contours (Metcalfe et al., 1999).
The effective base of the aquifer has been defined as the depth at which old saline water is encountered, which in the vicinity of Chester is at about 800 m below OD. Additionally, the
13

frequency of open fractures, and thus transmissivity, decreases at depths of more than 200 m below OD.
Figure 3.6 Geological map of the Cheshire Basin showing groundwater levels (from
Plant et al., 1999).
14

Metcalfe et al. (1999) identified two components of the present day groundwater flow regime in the Cheshire basin:
(1) At the basin margins flow is dominated by topographic driving forces with recharge to high ground and discharge from lower areas.
(2) At the centre of the basin where the SSG is covered by the MMG. Density variations in the groundwater as a result of halite dissolution and mixing of freshwater at the margins influences the groundwater flow. The division of the flow field into a number of mixing cells results in quite large salinity variations across the basin.
3.3 Aquifer mineralogy
Although the Sherwood Sandstone is dominated by quartz with minor feldspar, it contains a wide variety of cements including calcite, dolomite, gypsum, anhydrite, halite, iron oxide and clay minerals (Figure 3.7). In particular, the carbonate and evaporite minerals may exert the dominant control on groundwater quality because these dissolve much more rapidly than the quartz and silicate mineral phases and (for the evaporite minerals) may be highly soluble. The clay minerals are probably dominated by kaolinite, and in deeper parts of the aquifer, illite (Plant et al., 1999).
The sediments of the SSG have a varied provenance including high grade metamorphic rocks, syenite, acid volcanics, quartzite, sandstones and siltstones. The more recent sediments in the sequence contain fewer volcanic fragments.
In general, the detrital mineralogy of the SSG across the Cheshire Basin displays little variation. Detrital chert is more prominent within the Cheshire Basin than in adjacent Permo-Triassic basins. It is believed that the source of the chert was probably cherty horizons within the Dinantian limestones which surrounded the basin (Plant et al., 1999).
Grain coatings within the SSG include iron-oxides and authigenic smectite. Pressure solution and compaction during burial of the sediments resulted in quartz and K-feldspar overgrowths and cements and non-ferroan dolomite cements. Major anhydrite and other evaporite mineral cements are now only present at depth within the basin having been removed by groundwater circulation in the upper parts of the sequence. During burial, anhydrite and halite were remobilised from the overlying Mercia Mudstone Group and were introduced to the SSG via fractures to form cement. Adjacent to faults, complex calcite-barite-Cu-Ag-Pb-As-Co-Hg-Ni-Se-V-Zn-Mn-sulphide mineralisation occurred and replaced earlier anhydrite or halite cement (Plant et al., 1999).
The Mercia Mudstone Group comprises reddish brown and to a lesser degree, greenish grey, dolomitic mudstone also with evaporite minerals especially gypsum and anhydrite but also including halite and locally celestite.
3.4 Rainfall chemistry
Rainfall provides the primary input of solutes to recharge waters and can be considered as representing minimum baseline concentrations at present day. The precipitation weighted annual mean rainfall chemistry for 1999 is shown in Table 3.2 for Preston Montford (SJ 432 143), the nearest site for which data are available. The site is located approximately 40 km to the south of the study area. The data have been multiplied by 3 in the last column in order to estimate the approximate enrichment due to evapotranspiration and hence chemistry of infiltrating rainwater. Although Cl may be assumed to behave conservatively during most recharge conditions, this is not the case for other elements e.g. K and N-species which may be taken up by vegetation, and concentrations may therefore be less in recharge waters than rainfall. Atmospheric inputs of chloride are typically around 6 to 7 mg l-1 (although this may still be above ‘baseline’ concentration because of atmospheric
15

pollution inputs.) Chloride concentrations may be subject to alteration by agricultural pollution or mixing with other water. Nevertheless, the table indicates the order of magnitude of concentrations expected prior to reaction with vegetation or aquifer minerals.
1 µm 100 µm
200 µm
p
p
p
c
d
q
q
q
1 mm
(a) (b)
(c) (d)
Figure 3.7 SEM photomicrographs to illustrate the mineralogy of the Sherwood Sandstone aquifer. (a) moderately compacted subarkose showing complete cementation of intergranular porosity by quartz cement. Sherwood Sandstone Group. (b) relationship between dolomite (d), pyrite (p), calcite (c) and quartz (q). Helsby Sandstone Formation, Thornton Borehole. (c) anhydrite veinlet cutting porous sandstone. Malpas Sandstone, Wilkesley Borehole. (d) edge of fault vein containing pyrite and calcite cutting porous sandstone. Helsby Sandstone Formation, Thornton Borehole.
16

Table 2.2 Rainfall chemistry from Preston Montford. The precipitation-weighted annual mean data are for 1999 from The UK National Air Quality Information Archive (http://www.aeat.co.uk/netcen/airqual/).
Preston Montford
Parameter
Rainfall Rainfall (x3) Enrichment by evapotranspiration
pH 5.73
Na (mg l-1) 1.23 3.69
K (mg l-1) 0.14 0.42
Ca (mg l-1) 0.56 1.68
Mg (mg l-1) 0.33 0.99
Cl (mg l-1) 2.25 6.75
SO4 (mg l-1) 2.93 8.79
NO3 (mg l-1) 1.28 3.84
NH4 (mg l-1) 0.69 2.07
Total N (mg l-1) 0.82 3.64
SEC (µS cm-1) 19.6
Rainfall amount 666 mm per annum
17

4. DATA AND INTERPRETATION
4.1 Groundwater sampling programme
A total of 23 samples were collected by BGS during October 2000 from water company, industrial and farm boreholes mainly from the area to the east of the River Gowy (but including Peckforton to the south, and Plemstall and Borrowmore to the west of the river). The sites form part of the Environment Agency’s groundwater monitoring network and could therefore be compared with historical analyses. The sample sites were selected to provide good areal coverage over part of the aquifer (Figure 4.1) in order to study the chemical evolution of groundwater in the direction of groundwater flow. All boreholes were pumped for a minimum estimated 2 well bore volumes prior to sampling. Pumped groundwater samples represent water entering the borehole over the entire length of the screened interval. The sample may therefore represent a mixture of waters with different chemistries especially if the aquifer is vertically stratified in terms of water quality. Despite these problems, the results can be used to interpret regional variations which exist within the aquifer and for predicting groundwater chemistry within the aquifer.
Where possible, the parameters pH, dissolved oxygen (DO) and redox potential (Eh) were measured in an anaerobic flow-through cell (Figure 4.2). Other on-site measurements included temperature, specific electrical conductance (SEC) and alkalinity by titration. Samples were collected for chemical analysis in polyethylene bottles. Those for major and trace elements were filtered through 0.45 µm filters and an aliquot for cation and trace elements was acidified to 1% v/v HNO3 to minimise adsorption onto container walls. Additional samples were collected in glass bottles for stable isotopes (δ2H, δ18O and δ13C). Samples for organic carbon (total and dissolved) were collected in Cr-acid washed glass bottles and, for the DOC samples, a 0.45µm silver filter was used.
Major cations and sulphate were analysed by ICP AES and a wide range of trace elements by ICP MS. Nitrogen species were analysed at the Environment Agency laboratories in Nottingham and other anion species (Cl, Br, I, F) by automated colorimetry at the BGS laboratory in Wallingford. For comparison, nitrogen species were also analysed by the BGS laboratories and the results showed a good correlation between laboratories. Stable isotope analyses were completed in the BGS laboratories by mass spectrometry and the results reported relative to SMOW for δ2H and δ18O and PDB for δ13C.
4.2 Historical data
Excellent historical water quality data records are available for the area. In order to obtain a representative spatial sample of water quality data over the West Cheshire and Wirral area, data were obtained from a hydrochemical database previously collated for the Wirral and West Cheshire Aquifer Study. This database contained information collected from the Environment Agency Wales and North West Region of the Environment Agency and also from United Utilities plc and the Severn Trent Water plc. It included information from boreholes, wells, springs and porewater samples. The earliest record is for Ford Pumping Station (no longer in use) from 1901; and the most recent from the year 2000. Some good time series data are available and will be further discussed in the section examining time variant trends in water quality. In order to examine spatial variation in baseline water quality, analyses from 1980 to 2000 were used to provide a synoptic overview. For each site, the analysis with the most determinands analysed was used.
18

Figure 4.1 Map indicating approximate flow lines, distribution of boreholes in EA data set and sampling points for the Baseline project.
19

Figure 4.2 Field sampling using a flow through cell.
4.3 Interpretation of pumped groundwater samples
When interpreting trends in regional water quality data it is important to bear in mind the variations in water quality that may arise between sampling boreholes due to:
• differences in borehole design and construction
• different stratigraphic horizons being tapped
• different pumping histories
4.3.1 Different borehole designs
As mentioned earlier, water quality stratification may exist in the Sherwood Sandstone aquifer. As a consequence, differences in borehole design, in particular depth of casing and depth of borehole, may produce differences in water quality not related to geochemical reactions along a flow path.
20

4.3.2 Differences in stratigraphy
The presence of evaporite deposits or differences in cement type within the sandstones may produce significant variation in the baseline water quality for different stratigraphic horizons. Boreholes are likely to intercept different stratigraphic horizons especially where these boreholes are distant from each other and down geological gradient.
4.3.3 Different pumping history
In areas where the Permo-Triassic sandstone aquifer is overlain by permeable drift deposits, the pumping history of an individual borehole may have a significant impact on water quality. For instance, abstraction boreholes where large volumes of water have been pumped historically are likely to have induced significant recharge through the permeable drift deposits. Thus the proportion of modern, high nitrate water in the pumped sample may be relatively high, compared with a borehole where only small volumes have been pumped.
It is not possible, within the resources available to this project, to evaluate which factors may be influencing water quality for each of the water sampling boreholes. Instead, this report presents a broad assessment of the water quality variations observed across the aquifer and the controlling geochemical processes. It is accepted that some water quality variation may be due to the factors described above.
4.4 Data handling
The plots and tables of geochemical data are based on both the new sampling programme and historical data (one analysis per site for analyses from 1980 to 2000) unless otherwise specified. Historical data with an ionic charge balance greater than 10% were rejected. For samples collected within the project, the maximum ionic balance accepted was also 10%, however most were less than 5%.
Results which fell below detection limits were dealt with by substitution with half of the detection limit. However, changes in the detection limits both with time and between laboratories proved problematical in calculation of the average results. The median is least affected by outlying data and is therefore used, together with the minimum, maximum and 97.7 percentile (mean plus two standard deviations).
Median concentrations are taken to represent the average. The effects of pollution are likely to be found in the upper 50%. The 97.7 percentile for each determinand has been taken as an estimate of the upper limit of the concentration range being used to exclude outliers.
21

5. HYDROCHEMICAL CHARACTERISTICS
5.1 Introduction
A summary of the data is shown in Table 5.1 for the study area. This section deals with the fundamental hydrochemical characteristics of the groundwaters in the study area highlighting the features of the summary table. Section 6 will deal with controls and geochemical processes which determine and modify the water chemistry, placing the variations in a regional context.
Table 5.1a Field parameters, isotope data and range of major and minor element concentrations in the Permo-Triassic Sandstones of the Cheshire study area.
Parameter Units min max median mean 97.7th
percentile N
T oC 10.1 12.8 11.6 11.5 12.5 84 pH field 7.00 7.80 7.51 7.44 7.72 240 Eh mV 309 521 423 426 521 11 DO mg l-1 0.0 10.9 6.6 5.6 10.7 75 SEC µS cm-1 305 23900 562 2079 18086 239 δ2H ‰ -55 -43 -52 -51 -43 23 δ18O ‰ -8.6 -6.5 -8.0 -7.8 -6.8 23 δ13C ‰ -16.3 -12.4 -15.5 -15.1 -12.5 23 Ca mg l-1 4.4 795 74.0 109 565 240 Mg mg l-1 0.5 562 20.5 36.976 310 240 Na mg l-1 5.8 4225 29.8 165 2167 240 K mg l-1 0.25 73.0 3.6 6.8 52.7 239 Cl mg l-1 7.0 9000 48.5 350 4751 240 SO4 mg l-1 2.0 1780 48.0 93.9 644 237 HCO3 mg l-1 12.2 683 226 239 505 238 NO3 as N mg l-1 0.025 31.7 3.3 5.0 21.0 239 NO2 as N mg l-1 0.001 0.657 0.010 0.021 0.135 238 NH4 as N mg l-1 <0.003 5.3 0.025 0.159 1.4 238 P mg l-1 <0.02 1.2 0.064 0.121 0.446 155 TOC mg l-1 0.6 5.1 1.7 2.0 4.3 23 DOC mg l-1 1.7 5.0 2.6 3.0 5.0 23 F µg l-1 <40 955 82.5 102 295 79 Br µg l-1 25.0 36000 92.0 1137 9855 82 I µg l-1 3.0 73.0 4.0 7.7 43.7 23 Si µg l-1 460 9522 5290 5238 8579 240
22

Table 5.1b Trace element concentrations in groundwaters of the Cheshire study area.
Parameter units min max median mean 97.7th
percentile n
Trace elements Ag µg l-1 <0.05 0.57 <0.05 <0.05 0.29 23 Al µg l-1 <1 27.0 3.00 3.80 16.9 23 As µg l-1 <1 57.0 6.22 9.89 53.1 81 Au µg l-1 <0.05 <0.05 <0.05 <0.05 <0.05 23 B µg l-1 <20 120 <20 22.8 86.1 23 Ba µg l-1 35.5 644 271 283 634 23 Be µg l-1 <0.05 <0.05 <0.05 <0.05 <0.05 23 Bi µg l-1 <0.05 0.15 <0.05 <0.05 0.09 23 Cd µg l-1 <0.05 28.50 0.05 1.48 5.76 97 Ce µg l-1 <0.01 <0.01 <0.01 <0.01 <0.01 23 Co µg l-1 <0.02 1.05 <0.02 0.06 0.54 23 Cr µg l-1 <0.5 12.00 0.80 2.40 8.64 59 Cs µg l-1 <0.02 0.67 0.04 0.06 0.39 23 Cu µg l-1 <0.3 880 19.00 39.35 167 173 Dy µg l-1 <0.01 <0.01 <0.01 <0.01 <0.01 22 Er µg l-1 <0.01 <0.01 <0.01 <0.01 <0.01 23 Eu µg l-1 <0.01 0.02 <0.01 <0.01 0.02 23 Fe µg l-1 <5 19600 <5 209 1207 210 Ga µg l-1 <0.05 0.11 <0.05 <0.05 0.07 23 Gd µg l-1 <0.01 <0.01 <0.01 <0.01 <0.01 23 Ge µg l-1 <0.05 0.12 <0.05 <0.05 0.10 23 Hf µg l-1 <0.02 <0.02 <0.02 <0.02 <0.02 23 Hg µg l-1 <0.1 0.10 <0.1 <0.1 <0.1 23 Ho µg l-1 <0.01 <0.01 <0.01 <0.01 <0.01 23 In µg l-1 <0.01 <0.01 <0.01 <0.01 <0.01 23 Ir µg l-1 <0.05 <0.05 <0.05 <0.05 <0.05 23 La µg l-1 <0.01 <0.01 <0.01 <0.01 <0.01 23 Li µg l-1 2.00 281 10.0 24.96 158 23 Lu µg l-1 <0.01 <0.01 <0.01 <0.01 <0.01 23 Mn µg l-1 <2 6120 10.0 209 2327 150 Mo µg l-1 0.10 3.00 0.50 0.61 2.54 23 Nb µg l-1 <0.01 0.08 <0.01 <0.01 0.04 23 Nd µg l-1 <0.01 0.01 <0.01 <0.01 0.01 23 Ni µg l-1 <0.2 4.80 0.50 1.26 4.50 23 Os µg l-1 <0.05 <0.05 <0.05 <0.05 <0.05 23 Pb µg l-1 <2 6650 25.0 69.9 210 177 Pd µg l-1 <0.2 2.60 <0.2 0.21 1.34 23 Pr µg l-1 <0.01 <0.01 <0.01 <0.01 <0.01 23 Pt µg l-1 <0.01 0.05 <0.01 <0.01 0.03 23 Rb µg l-1 0.25 19.4 2.0 2.6 11.4 23 Re µg l-1 <0.01 0.02 <0.01 <0.01 0.01 23 Rh µg l-1 <0.01 <0.01 <0.01 <0.01 <0.01 23 Ru µg l-1 <0.05 <0.05 <0.05 <0.05 <0.05 23 Sb µg l-1 <0.05 1.21 0.09 0.15 0.78 23 Sc µg l-1 1.4 5.4 2.0 2.2 4.4 23 Se µg l-1 <0.5 38.0 <0.5 1.91 19.1 23 Sm µg l-1 <0.05 <0.05 <0.05 <0.05 <0.05 23
23

Parameter units min max median mean 97.7th n percentile
Sn µg l-1 0.08 0.55 0.12 0.16 0.42 23 Sr µg l-1 38.4 7980 164 513 5337 81 Ta µg l-1 <0.05 <0.05 <0.05 <0.05 <0.05 23 Tb µg l-1 <0.01 <0.01 <0.01 <0.01 <0.01 23 Te µg l-1 <0.05 1.1 <0.05 0.07 0.56 23 Th µg l-1 <0.05 <0.05 <0.05 <0.05 <0.05 23 Ti µg l-1 <10 <10 <10 <10 <10 23 Tl µg l-1 <0.01 0.03 <0.01 <0.01 0.02 23 Tm µg l-1 <0.01 <0.01 <0.01 <0.01 <0.01 23 U µg l-1 0.19 13.5 1.7 2.7 10.4 23 V µg l-1 <1 30.0 <1 2.3 18.9 23 W µg l-1 0.50 0.50 0.50 0.50 0.50 23 Y µg l-1 <0.01 0.06 0.01 0.02 0.06 23 Yb µg l-1 <0.01 0.04 <0.01 <0.01 0.02 23 Zn µg l-1 0.25 23500 25 401 2536 169 Zr µg l-1 <0.5 <0.5 <0.5 <0.5 <0.5 23
5.2 Water types and physicochemical characteristics
The pH of the waters is generally circumneutral to slightly alkaline. Most of the waters are relatively fresh (SEC <1000 µS cm-1), however one sample was found to have a conductivity of 23 900 µS cm-1. Where DO and Eh have been measured, the waters are shown to be mainly oxidising (median values for DO and Eh are 6.6 mg l-1 and 423 mV).
The groundwaters in the West Cheshire and Wirral show an extremely wide range of major element compositions including Ca-HCO3, Ca-SO4, Na-SO4, Na-Ca-Cl, Na-Cl and waters of mixed type as shown on the Piper diagram (Figure 5.1).The samples collected along the flowlines for this project show a more restricted range, predominantly Ca-HCO3 but including mixed and Na-Ca-Cl type samples.
The summary data are shown graphically on boxplots (Figures 5.2 and 5.3) and cumulative frequency plots (Figures 5.4 and 5.5). The boxplots (or box and whisker plots) display the ranges of data and are designed to highlight the distribution of data on a percentile basis. The black line represents a diluted seawater curve which has been normalised to the median Cl of the samples. This provides a general indication in most aquifers of enrichments due to water-rock interaction above the marine-derived rainfall or connate water input. Cumulative probability plots are useful in visualising the distribution of data and may be of use in determining outlying data or discriminating pollution. Geochemical processes may alter the distribution of populations in several ways (Box 5.1).
24

0
10
20
30
40
50
60
70
80
90
1000
10
20
30
40
50
60
70
80
90
100
0102030405060708090100 0 10 20 30 40 50 60 70 80 90 1000
10
20
30
40
50
60
70
80
90
1000
10
20
30
40
50
60
70
80
90
100
0
10
20
30
40
50
60
70
80
90
100100
90
80
70
60
50
40
30
20
10
0
Regional dataNew data
Ca Na + K
Mg SO4
ClHCO3
Figure 5.1 PIPER plot showing the relative concentrations of major cations and anions in
groundwaters of west Cheshire and the Wirral.
25
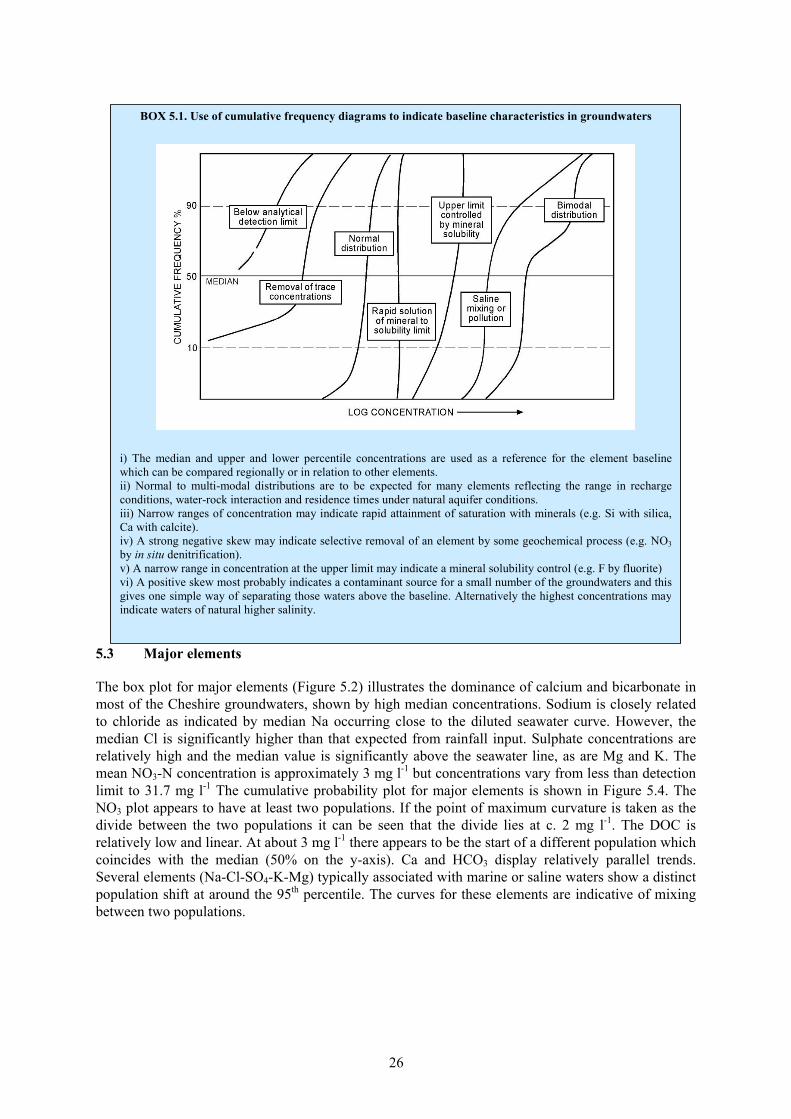
BOX 5.1. Use of cumulative frequency diagrams to indicate baseline characteristics in groundwaters
i) The median and upper and lower percentile concentrations are used as a reference for the element baselinewhich can be compared regionally or in relation to other elements. ii) Normal to multi-modal distributions are to be expected for many elements reflecting the range in rechargeconditions, water-rock interaction and residence times under natural aquifer conditions. iii) Narrow ranges of concentration may indicate rapid attainment of saturation with minerals (e.g. Si with silica,Ca with calcite). iv) A strong negative skew may indicate selective removal of an element by some geochemical process (e.g. NO3by in situ denitrification). v) A narrow range in concentration at the upper limit may indicate a mineral solubility control (e.g. F by fluorite) vi) A positive skew most probably indicates a contaminant source for a small number of the groundwaters and thisgives one simple way of separating those waters above the baseline. Alternatively the highest concentrations mayindicate waters of natural higher salinity.
5.3 Major elements
The box plot for major elements (Figure 5.2) illustrates the dominance of calcium and bicarbonate in most of the Cheshire groundwaters, shown by high median concentrations. Sodium is closely related to chloride as indicated by median Na occurring close to the diluted seawater curve. However, the median Cl is significantly higher than that expected from rainfall input. Sulphate concentrations are relatively high and the median value is significantly above the seawater line, as are Mg and K. The mean NO3-N concentration is approximately 3 mg l-1 but concentrations vary from less than detection limit to 31.7 mg l-1 The cumulative probability plot for major elements is shown in Figure 5.4. The NO3 plot appears to have at least two populations. If the point of maximum curvature is taken as the divide between the two populations it can be seen that the divide lies at c. 2 mg l-1. The DOC is relatively low and linear. At about 3 mg l-1 there appears to be the start of a different population which coincides with the median (50% on the y-axis). Ca and HCO3 display relatively parallel trends. Several elements (Na-Cl-SO4-K-Mg) typically associated with marine or saline waters show a distinct population shift at around the 95th percentile. The curves for these elements are indicative of mixing between two populations.
26
Cl
Na
SO4
Mg
Ca K
HC
O3
NO
3-N
Con
cent
ratio
n (m
g l-1
)
0.0001
0.001
0.01
0.1
1
10
100
1000
10000
Median
75th percentile
25th percentile
Mean
5th percentile
95th percentile
10th percentile
90th percentile
Figure 5.2 Range of major ion concentrations in Permo-Triassic Sandstone groundwaters
in the West Cheshire and Wirral area. The black line represents a diluted seawater curve which has been normalised to the median Cl of the samples.
Box 5.2 How can we distinguish pristine waters from polluted groundwater?
Groundwater prior to the industrial era (before c. 1800) emerged as springs or was taken from shallowwells, whilst the deeper reserves were in a pristine condition. The water first encountered usingmodern drilling practices would have had compositions reflecting true baseline determined only bygeological and geochemical processes. Only rarely is it possible to find such waters because themajority of groundwaters sampled in the present study are derived from aquifers which have beendeveloped for decades. The problem in baseline is to recognise the impact of any of human activitiesover and above the natural baseline in the data sets used.
The approach adopted is threefold:
(i) to have evidence of groundwater age
(ii) to extrapolate data series back to an initial time
(iii)to use indicator elements in the groundwater, known to result from human activities. The most probable indicators of human activities are enhanced TOC and N species – especially NO3 – the presence of foreign substances such as agro-chemicals or industrial chemicals. The sets of data are examined for these substances as a clue to the presence of “contamination”, although it is stressed that it is impossible to quantify this. However, traces of contamination may have little impact on the overall chemistry of the groundwater.
27

5.4 Minor and trace elements
Figure 5.3 presents the box plots for minor and trace elements. Most trace elements lie above the seawater dilution curve, however the mean for Bromide is lower, indicative of a low Br/Cl source. Fluoride concentrations are also relatively low.
Iron concentrations are low reflecting the oxidising nature of the aquifer, however manganese is often higher with concentrations up to 6.1 mg l-1.
Most metals are present at low concentrations, however zinc can be locally high. The concentration of arsenic is locally relatively high and several values exceed the current EC maximum admissible concentration (MAC) concentration of 50 µg l-1 (when the MAC is reduced to 10 µg l-1 as proposed, many more of the analyses will be in excess of the MAC). Barium concentrations are also high (up to several hundred µg l-1) and the median concentration of 270 µg l-1 is above the EC MAC. Silicon displays a narrow range of values probably reflecting saturation with a silica phase.
Br Sr B Si F Li I BaMoZn Ni As Cu FeMn V Al CoCd Cr Pb Sc La Y Be
Con
cent
ratio
n (µ
g l-1
)
0.001
0.01
0.1
1
10
100
1000
10000
100000
Figure 5.3 Range of minor and trace element concentrations in Permo-Triassic Sandstone groundwaters in the West Cheshire and Wirral area. The black line represents a diluted seawater curve which has been normalised to the median Cl of the samples. The grey line indicates detection limit of the recent analyses.
Figure 5.5 displays the cumulative probability plots for minor and trace elements. The concentration of some elements varies over 5 orders of magnitude (Mn and Zn). Straight lines at low concentrations are an artefact resulting from the substitution of half detection limits to concentrations below the detection limit.
28
concentration (mg l-1)
0.001 0.1 1 10 100 1000 10000 100000
Cum
ulat
ive
Freq
uenc
y
12
5
10
20
3040506070
80
90
95
9899
CaMgNaKHCO3
SO4
ClNO3-N DOC
Figure 5.4 Cumulative Probability plots for major elements.
concentration (µg l-1)
0.1 1 10 100 1000 10000
Cum
ulat
ive
Freq
uenc
y
12
5
10
20
3040506070
80
90
95
9899
AlAsBBaFeMnSrUZn
Figure 5.5 Cumulative Probability plots for minor and trace elements.
29

Box 5.3 Nitrate in groundwater investigations
An investigation into nitrate in groundwater, conducted by North West Water Authority in the 1970s and 1980s, examined porewater quality profiles through the unsaturated zone. The plot for Mickledale provides an example of porewater variations in nitrate with depth. A number of sites were selected for study designed to compare the impact of fertiliser use on groundwater quality in outcrop and drift covered areas of the aquifer. Water quality profiles and microbiological investigations were conducted to assess whether denitrification was occurring. It was concluded that little denitrification was occurring. The study was conducted in collaboration with Drift Recharge Investigations (Vines, 1984). Tritium analysis was employed to detect the age of the recharge water. It found that all high nitrate water was relatively recent i.e. post 1953. In the Delamere Hills area there was a clear correlation between sandstone outcrop and high nitrate concentrations. This correlation would also seem to be evident in the samples recently collected for the Baseline survey.
Nitrate NO3-N
0 20 40 60 80 100
Dep
th (m
)
0
20
40
60
80
Porewater nitrate profile with depth for Mickledale (sandstone outcrop) SJ 521 753
30

5.5 Pollution indicators
In order to determine baseline concentrations, it is desirable to study only pristine waters and avoid polluted waters since these may alter baseline concentrations either directly by adding solutes or indirectly by promoting chemical reactions in the aquifer (Box 5.2).
It is generally difficult to obtain pristine waters, in part because waters may be sampled over a large screened interval where polluted waters are present at shallow depth or because diffuse pollution (especially agricultural pollution) is present in large areas of the unconfined aquifer. Boreholes affected by point source pollution have been avoided but most groundwaters in unconfined aquifers show the effects of diffuse agricultural pollution resulting from the application of fertilisers or pesticides over the past decades. High nitrate concentrations and the presence of pesticides/ herbicides are indicative of agricultural pollution (Box 5.2). A previous study, “Nitrate in Groundwater”, was conducted in the Cheshire area in 1984. The study involved collection of porewater samples from which nitrate profiles with depth were derived (Box 5.3). In response to the EC Nitrate Directive (91/676/EEC), the Ministry of Agriculture, Fisheries and Food (MAFF- now part of DEFRA), has defined Nitrate Vulnerable Zones (NVZs) around public water supply abstractions. There is a nitrate vulnerable zone, covering an area of 815 hectares, at Kelsall, encompassing a number of public water supply boreholes.
Nitrate pollution in Liverpool resulting from urban sewer leakage has been well documented (Tellam, 1996; Ion, 1996; Brennan, 1997; Whitehead, 1998). It is believed that the some of the elevated nitrate concentrations in the vicinity of Birkenhead may be also attributed to leaking sewer sources.
The database of historical water chemistry analyses that was used for this study does not contain any information on pesticide concentrations.
Organic contaminants were not considered in this study. Two of the samples collected were excluded from the study: one from an industrial borehole which had an odour of solvent and another from a salt production complex adjacent to the coast.
31

6. GEOCHEMICAL CONTROLS AND REGIONAL CHARACTERISTICS
6.1 Introduction
This section deals with the dominant geochemical processes which influence groundwater chemistry and provides an overview of the regional variations in groundwater chemistry. The dominant geochemical processes acting to determine groundwater chemistry are mineral dissolution/precipitation, redox reactions, ion exchange and mixing with older formation water. Groundwater chemistry will evolve as water moves along flowlines from recharge to discharge areas. In order to study this evolution groundwater samples were collected along flowlines (Figure 4.1). In addition to changes in groundwater chemistry along flowlines the regional hydrogeochemistry has also been considered. For selected sites with good historical records variations in groundwater chemistry with time have also been examined.
The Piper diagram illustrates that the samples collected during the Baseline project sampling campaign have a more limited range of water types than the regional data (Figure 5.1). This is because the latter provide cover of a much larger area and may therefore be considered more representative of the whole aquifer. Most of the waters collected along the flow lines (identified in Figure 4.1) vary in composition from Ca-HCO3 to Ca-Mg-HCO3 types, with the exception of four sites located closest to the Mersey Estuary which trend towards Ca-Cl types, indicating saline intrusion.
Infiltration of meteoric waters into the Sherwood Sandstone has flushed away most pre-existing Na-Cl dominated formation waters within the aquifer to the maximum depth of groundwater circulation. The groundwater chemistry will therefore be dominated by reactions with carbonate cement, detrital dolomite and sulphate minerals (Edmunds et al., 1984; Bath et al., 1987).
6.2 Chemical evolution along flowlines
In the Cheshire area, the direction of groundwater flow is principally towards the Mersey Estuary. There are significant difficulties associated with sampling along flowlines particularly as boreholes penetrate different depths and are open throughout much of their length. The use of pumped samples mean that the sample will represent water entering the borehole at all levels and therefore it is impossible to gauge an indication of vertical chemical variations. In addition, local natural flow systems and modified (e.g. due to pumping) flow systems may impose additional complications on flow patterns and residence time and, therefore, hydrochemistry. Figure 3.2 illustrates a cross-section from the Mid-Cheshire Ridge at Peckforton to the Mersey Estuary at Stanlow. The sampling transects selected (Figure 4.1) broadly follow this section and it can be seen that the geology changes from the Helsby Sandstone in the south east, which forms the topographic high of the ridge, to the Wilmslow Sandstone Formation, the Chester Pebble Beds Formation and the Kinnerton Sandstone formation in the north west. The direction of groundwater flow is to the north west which is contrary to the geological dip which is to the south east. The cross-section also illustrates how the presence and thickness of drift deposits vary along the section.
6.2.1 Mineral dissolution reactions
For most groundwaters, notably relatively young ones, much of their chemistry will be determined close to the start of the flowline by the dissolution of calcite and dolomite which form cements within the sandstone. Infiltrating groundwater will initially be acidic due to the presence of carbonic acid derived from CO2 production in the soil zone. This acidity will be rapidly neutralised through reaction with carbonate minerals. Most of the groundwaters are at saturation with respect to calcite, controlled by the reaction:
32

CaCO3 + H2CO3 ⇔ Ca2+ + 2HCO3 calcite carbonic acid
Many of the samples along the flow line appear to be undersaturated with respect to dolomite and although a few samples along the flow line approach saturation there is not a clear correlation with distance. However, as Mg concentration increases some of the samples approach saturation.
Dolomite dissolution is controlled by the following reaction:
CaMg(CO3)2 + 2 H2CO3 ⇔ Ca2+ + Mg2+ + 4HCO3 dolomite carbonic acid
Another reaction likely to be influencing the water chemistry is that of gypsum (or anhydrite: CaSO4) dissolution:
CaSO4.2H2O(s) ⇔ Ca2+ + SO42-
+ 2H2O gypsum
Sulphate concentrations remain relatively constant, typically below 40 mg l-1. There are four samples which have concentrations in excess of 40 mg l-1, all located at distances greater than 10 km along the flowlines, these samples also contained elevated calcium concentrations indicating that gypsum dissolution may be occurring (Figure 6.1). The enhanced concentrations do not appear to relate to any particular depth. The groundwaters were found to be undersaturated with respect to gypsum, but as sulphate concentrations increase the samples become relatively less undersaturated, consistent with gypsum/anhydrite dissolution. Other possible sources of sulphate include the oxidation of pyrite, mixing of freshwater and seawater, acid rain or fertilizers (Appelo and Postma, 1991).
Carbonate and sulphate reactions are the dominant reactions determining groundwater chemistry along the flowline. However, less rapid silicate dissolution reactions may also be occurring. Silicon concentrations vary along the flowline ranging from 4.5 to 7.7 mg l-1 (Figure 6.1). The amount and rate of dissolution will be controlled by saturation with respect to a silicate mineral or phase. Although the aquifer is composed dominantly of quartz, this mineral is extremely unreactive and the source of Si is most likely to be from silicate minerals such as K- or plagioclase-feldspar. Most groundwaters in the study area have not reached saturation with respect to chalcedony (SiO2).
Concentrations of fluoride are generally low in the groundwaters and the waters are undersaturated with respect to fluoride implying that F-bearing minerals are not significant in the aquifer.
6.2.2 Redox reactions
The parameters redox potential (Eh) and dissolved oxygen (DO) provide the primary indicators of the redox status of natural groundwaters (Box 6.1) Of the samples collected during the Baseline Project, most have a DO concentration greater than 1 mg l-1 with the exception of samples taken more than 16 km along flowline 1 (Figure 6.2). Where Eh measurements were made, the values are indicative of an oxidising aquifer (+309 to +521). All DO and Eh measurements were taken using a flow through cell.
33

Distance (km)0 5 10 15 20 25
SEC
(υS
cm-1
)
0
200
400
600
800
1000
1200
1400
1600
1800
Distance (km)0 5 10 15 20 25
Ca
(mg
l-1)
0
50
100
150
200
250
Flowline 1Flowline 2
Distance (km)0 5 10 15 20 25
Na
(mg
l-1)
0
20
40
60
80
100
120
Distance (km)0 5 10 15 20 25
HC
O3 (
mg
l-1)
100
150
200
250
300
350
Distance (km)0 5 10 15 20 25
SO4 (
mg
l-1)
0
20
40
60
80
100
120
Distance (km)0 5 10 15 20 25
Mg
(mg
l-1)
0
5
10
15
20
25
30
Distance (km)0 5 10 15 20 25
K (m
g l-1
)
0
2
4
6
8
10
Figure 6.1 Major element characteristics of groundwater along the flowlines.
Nitrate, Fe and Mn are all sensitive to redox conditions. Baseline concentrations for nitrate are generally thought to be of the order of 2 mg l-1. Nitrate concentrations appear to be significantly affected by drift cover and land use. Correlations between drift cover, land use and nitrate are more readily identified for flowline 2 than flowline 1. For flowline 1 most of the boreholes have nitrate concentrations of less than 5 mg l-1 NO3-N. The exceptions along this line include Peckforton, which can be explained by the possible absence of drift cover, and two other boreholes which are located on boulder clay. Without detailed investigation it is not possible to identify the reasons for this apparent
34

anomaly - it may be that the boulder clay is of limited thickness, fractured, of more permeable lithology or that there is some other mechanism for nitrate to enter the borehole (inadequate seal etc). Along flowline 2 relatively high concentrations (> 7 mg l-1 NO3-N) occur in boreholes which are located on the sandstone outcrop with no drift cover. The elevated nitrate concentrations for these boreholes may also be a function of land use as they are all located on agricultural land. Five of the boreholes at Delamere, Sandyford and Cotebrook lie within the Kelsall nitrate vulnerable zone. Other boreholes in the section, which are overlain either by alluvial deposits or till at Mouldsworth and Helsby, have nitrate concentrations of approximately 3 mg l-1 NO3-N. The borehole in the confined part of the aquifer (Eaton) has the lowest nitrate concentration. The low nitrate in some samples (some below detection limit) may indicate that some denitrification or nitrate reduction has occurred (Figure 6.2).
Distance (km)0 5 10 15 20 25
Dis
solv
ed o
xyge
n (m
g l-1
)
0
2
4
6
8
10
12
Distance (km)0 5 10 15 20 25
NH
4 (m
g l-1
)
0.000
0.002
0.004
0.006
0.008
0.010
Distance (km)0 5 10 15 20 25
Mn
(µg
l-1)
0.1
1
10
100
1000
Distance (km)0 5 10 15 20 25
Fe (µ
g l-1
)
0.1
1
10
100
1000
Distance (km)0 5 10 15 20 25
Sn (µ
g l-1
)
0.0
0.1
0.2
0.3
0.4
0.5
0.6
Flowline 1Flowline 2
Distance (km)0 5 10 15 20 25
As (µ
g l-1
)
0
10
20
30
40
50
60
Distance (km)0 5 10 15 20 25
NO
3-N
(mg
l-1)
0
5
10
15
20
25
30
Figure 6.2 Chemical variation in redox parameters and redox sensitive elements along the flowlines.
35

Mn and Fe generally are both low, consistent with oxidising conditions in the unconfined aquifer. Higher concentrations of Mn and Fe are found in the boreholes furthest along the flowlines which have lower DO values (Figure 6.2). Although DO is not present towards the end of flowline 1 and NO3 values are lower towards the end of the flowline 2 there does not appear to be a clear redox boundary, and the boreholes with low or absent dissolved oxygen are not significantly deeper than others along the flow line.
The redox-sensitive trace elements As, Se and Sn are found to be higher in the more reducing waters but their chemistry is relatively poorly understood in terms of mobility and speciation in the aquifer. Arsenic concentrations are highest closer to the boundary of the Sherwood Sandstone with the Mercia Mudstone Group. Some concentrations are in excess of the present MAC of 50 mg l-1and many will exceed the limit of 10 mg l-1 which is being considered as the new EC MAC. Arsenic concentrations vary significantly along the flowlines but arsenic was present above the detection limit in all of the samples (Figure 6.2). Selenium concentrations along the flowline were all below detection limit with the exception of one borehole (Cotebrook 40”) which contained 0.7 µg l-1. Concentrations of dissolved organic carbon (DOC) range from 2 to 5 mg l-1.
BOX 6.1 REDOX BOUNDARY
Water at recharge is generally saturated with dissolved oxygen at the partialpressure of the atmosphere (10-12 mg l-1 depending upon barometric conditions).Passing through the soil and the unsaturated zone some of this O2 will react as aresult of microbiological processes and oxidation-reduction reactions. However,almost all water reaching the water table still contains several mg l-1 O2.Geochemical reactions (oxidation of traces of pyrite, organic matter and Fe2+
present in minerals) progressively remove the O2 along flow lines. Once all theoxygen has reacted an abrupt change of water chemistry takes place (redoxboundary). Other changes may occur at and down-gradient of the redox boundary,especially denitrification and the probability that total dissolved iron (Fe2+)concentrations will increase. Sulphate reduction and the production of sulphide(H2S as HS- in solution) may also occur at greater depths.
REDOX BOUNDARY
NO3
O2 O2 NO3
N2
Fe2+ Mn2+
HS- ANAEROBIC
AEROBIC
O2
36

6.2.3 Ion exchange reactions
In the study area, the ion exchange reactions resulting from saltwater/freshwater interaction appear to be very important because of the proximity of the Mersey Estuary. Ca and HCO3 ions owing to the dissolution of calcite dominate the groundwater in freshwater aquifers. Cation exchangers within the aquifer will therefore have a dominance of Ca adsorbed on to their surfaces. In aquifers containing dominantly seawater, Na and Cl are the dominant ions, thus sediments in contact with seawater will have largely adsorbed Na. When seawater intrudes a freshwater aquifer the following exchange takes place:
++ +→+ −− 22 CaNaCaNa
21
21 XX
where X indicates the soil/rock exchanger in this case. Na is taken up by the exchanger and Ca is released which alters the water chemistry from a Na-Cl type to a Ca-Cl2 type. This process will operate in reverse if freshening occurs i.e. freshwater flushing through a salt water aquifer:
++ +→+ −− Na CaNaCa2
1
2
1 2 XX
Here Ca2+ is taken up from the water and exchanged for Na, producing a Na-HCO3 type water, (Appelo and Postma, 1991).
Along the flowlines there appears to be a slight trend towards a Ca-Cl2 type of water for some of the samples which indicates that saline intrusion may be taking place. The Piper diagram showing all of the data (Figure 5.1) in the area illustrates that there is also a trend towards a Na-HCO3 type water within the aquifer. This is consistent with suggestions made by Lucey (1997) and Tellam (1995, 1996) that following a phase of marine incursion, freshening of the aquifer has since been taking place.
The Na/Cl ratio is useful to determine whether any increase in Na is due to mineral weathering and ion exchange or mixing with an older connate water. An excess of Na above the Na/Cl seawater ratio of 0.55 implies that there is an additional source of Na in the system i.e. Na derived from water-rock interaction. The ratio in these groundwaters (Figure 6.3) varies up to 1 indicating that water-rock interaction is contributing to Na concentrations. A trend towards Na-Cl type waters might be indicative of either seawater intrusion or upconing of deeper formation water.
The origin of salinity has been estimated through the use of Br/Cl ratios (Edmunds, 1996). Bromide concentrations often reflect marine-derived inputs (including rainfall) and therefore lie on the dilute seawater line in the box plot (Figure 5.3). Bromide is geochemically associated with chloride, however within the Cheshire Basin the presence of brines and halite will have influenced the ratio of Br/Cl ratio. During the crystallisation of halite from a brine, any Br present will preferentially partition into the aqueous phase and subsequently the halite will have a much lower Br/Cl ratio than the brine. The relatively low (i.e. below the seawater ratio of Br/Clmolar = 1.54 x 10⁻³) Br/Cl ratio indicated for many of the Cheshire samples suggests that, for part of the aquifer, salinity is derived from halite dissolution rather than seawater origin. This is also confirmed by the relatively high Cl concentrations. In a study of the Cheshire Basin, Metcalfe et al. (1999) suggested that groundwaters with Br/Cl ratios similar to the seawater ratio are probably due to marine incursion or the high proportion of sea spray in meteoric waters. Two of the three samples from our survey which are approaching the seawater Br/Cl ratio are from close to the recharge area (Figure 6.3). A high Br/Cl ratio may be indicative of reaction with organic matter or could be evidence of pollution (Edmunds, 1996). Only one sample, from the confined borehole, exceeds the seawater Br/Cl ratio and may relate to interaction with organic matter present in the aquifer. However, the effect of pollution on the Br/Cl ratio is poorly understood and more work needs to be done in this area.
37

The I/Cl ratio for all of the samples collected exceeds that input from rainwater or seawater indicating that there is a source of iodide within the aquifer. It is not known whether the source is naturally derived e.g. from organic material or whether there is an anthropogenic influence.
Distance (km)0 5 10 15 20 25
Ba (µ
g l-1
)
0
100
200
300
400
500
600
700
Distance (km)0 5 10 15 20 25
U (µ
g l-1
)
0
2
4
6
8
Distance (km)0 5 10 15 20 25
Br/C
l (x
10-3)
1
2
3
4
Distance (km)0 5 10 15 20 25
Na/
Cl
0.3
0.4
0.5
0.6
0.7
0.8
0.9
1.0
1.1
Distance (km)0 5 10 15 20 25
Sr (µ
g l-1
)
0
50
100
150
200
250
300
Na (mg l-1)0 20 40 60 80 100 120
Br/C
l (x
10-3)
1
2
3
4
Flowline 1Flowline 2
Na/Cl0 1 2
Br/C
l
1
2
3
4
SO4 (mg l-1)0 20 40 60 80 100 120
Ba (µ
g l-1
)
0
100
200
300
400
500
600
700
rainpollution ?
halitedissolution ?
Figure 6.3 Trace element characteristics along the flowline and element ratios.
6.2.4 Mixing with older formation water
Mixing with an older, deeper connate or formation water is generally indicated by an increase in salinity. However, as discussed previously, the dissolution of evaporite minerals may also lead to increases in salinity because of the high solubility and rapid reaction kinetics of such mineral phases. The clearest indication of mixing with deeper formation waters is an increase in Cl concentration.
38

The relatively low median Cl (49 mg l-1) shows that mixing with saline water is not an important process in the shallow groundwaters of the Cheshire Basin and that the dominant processes controlling water chemistry in the shallow part of the aquifer is mineral dissolution. However, modern seawater intrusion is important along the Mersey estuary. In addition, the stable isotope signatures are consistent with the groundwaters being dominantly of meteoric origin and of Holocene or recent age.
6.2.5 Minor and trace elements
The source of Sr is derived dominantly both from calcite and gypsum, concentrations in the latter typically being much higher. Strontium shows a weak general increase along the flowline (Figure 6.3) and there appears to be a weak negative relationship with Sr and Ca. Strontium concentrations are generally much lower than those encountered in the Vale of York (Shand et al., 2002) where Sr is mostly derived from gypsum dissolution, as opposed to the derivation from carbonate minerals (calcite and dolomite) which occur in this area.
Barium concentrations are higher at the start of the flowlines close to the boundary of the aquifer against the Mercia Mudstone and decrease with distance along the flowline (Figure 6.3 and Figure 6.8). The dominant control on Ba in these groundwaters is the concentration of SO4 which at high concentrations limits Ba due to saturation with the mineral barite (BaSO4). For most of the samples with sulphate greater than 40 mg l-1 the barium concentrations are less than 100 µg l-1.
The trace elements Li and B may be good indicators of residence time in aquifers. Lithium shows an increase along the flow line and boron concentrations are elevated for some of the samples which occur at distances of more than 15 km along the flowpath. Rubidium and Cs show similar geochemical behaviour to K and are most likely related to ion exchange involving clay minerals. Several other trace elements are found at higher concentrations near to the boundary of the Sherwood Sandstone and the Mercia Mudstone including As, Mo, Ni, Sb and Y. These are likely to be source derived related to the presence of sulphide mineralisation which is present in the upper parts of the Sherwood Sandstone and lower formations of the MMG (Metcalfe et al., 1999). Uranium is present in concentrations of up to 13 µg l-1 (Figure 6.3). Uranium, Sr, and As concentrations were highest in the confined borehole at Eaton.
The highest iodide concentration occurs towards the end of flowline 1. Mo and Pb are highest (3 µg l-
1) in the one borehole which lies in the confined part of that aquifer (Eaton borehole).
6.3 Temporal variations
Useful time series data exist from the Nitrates in Groundwater Investigation (Box 5.3. Vines, 1984). Data from one borehole, Delamere No. 3, date back to 1905. At this time the nitrate concentration was 3.3 mg 1-1 NO3-N, which is consistent with the estimate of baseline nitrate
Concentrations estimated from the cumulative frequency plot. Figure 6.4 illustrates changes in nitrate concentration with time for Delamere No. 3 and three other boreholes: Delamere No. 4, Sandyford and Eaton, of which only Eaton is in the confined part of the aquifer. It can be seen that nitrate concentrations in boreholes in the unconfined part of the aquifer start to increase rapidly after 1950 as the impact of changing agricultural practices starts to take effect. In contrast, the borehole at Eaton (confined) has a significantly lower nitrate concentration of 0.8 mg l-1 NO3-N (1940) than the unconfined sites and showed very little variation in concentration with time. Denitrification is likely to be taking place in the confined part of the aquifer.
The excellent data set of groundwater chemistry records provided by the Environment Agency contained many illustrations of change in groundwater chemistry with time. Three examples have been selected: Bowater No. 5 borehole (SJ 377 770), located near Ellesmere Port within a few
39

kilometres of the Mersey Estuary, Plemstall borehole (SJ 449 699), located to the east of Chester and Eaton borehole (SJ 567 634), in the south east of the study area in the confined part of the aquifer.
0
2
4
6
8
10
12
14
16
18
1900 1910 1920 1930 1940 1950 1960 1970 1980 1990 2000Date
Nitr
ate
(NO
3-N
mg
l-1)
Baseline (unconfined)
Delamere No. 3
Confined borehole
Sandyford
Delamere No. 4
Figure 6.4 Variations in nitrate concentration with time. The graph shows three boreholes in the unconfined part of the aquifer – Sandyford, Delamere No.4 and Delamere No.3 which all display a significant increase in nitrate concentration from the 1950s to the present. By comparison, data from the borehole at Eaton (confined) are displayed to illustrate low nitrate concentrations under confined conditions as a result of denitrification.
Bowater No. 5 borehole shows an increase between 1954 and 1999 in many parameters including conductivity, chloride, sodium, sulphate, calcium and magnesium (Figure 6.5). This borehole is located within a few kilometres of the Mersey Estuary and it is likely that the increases in concentration may be the effect of saline intrusion due to unsustainable abstraction from boreholes along the Estuary. The temporal chemical evolution of groundwater in the Bowater borehole is shown on a Piper plot in Figure 6.6. The earlier analyses have a Ca-HCO3 composition indicative of recharge water. However the more recent analyses trend towards Ca-Cl type water. This trend is consistent with the salinisation of a fresh aquifer, previously described by Lucey (1987), Scott (1997), Jones (1997), Tellam (1995, 1996) and Hibbert (1956).
In contrast, Plemstall pumping station, located further inland does not show a significant increase in any of its parameters between 1947 and 2000. Eaton pumping station, located in the confined sandstone displays fluctuations in iron and nitrate but most other parameters show little change from 1972 to the present.
The contrasting changes with time found in these boreholes shows the extent to which the baseline chemistry has been modified at individual sites. The causes of such change are complex and may include natural as well as anthropogenic processes. The monitoring of groundwater and the establishment of long continuous time series are therefore vitally important to determine the natural baseline and to identify and monitor the rates of changes taking place.
40

Plemstall
1/1/1960 1/1/1980 1/1/2000
conc
entra
tion
(mg
l-1)
0.01
0.1
1
10
100
1000
10000
Chloride Iron - as Fe Nitrate - as N Sodium - Na Sulphate SO4 Conductivity us/cm @ 25C
Eaton No. 1
1/1/1960 1/1/1980 1/1/2000
conc
entra
tion
(mg
l-1)
0.01
0.1
1
10
100
1000
Bowater No 5
1/1/1960 1/1/1980 1/1/2000
conc
entra
tion
(mg
l-1)
0.01
0.1
1
10
100
1000
10000
Figure 6.5 Temporal variations in groundwater chemistry for boreholes at Bowater (close to the Mersey Estuary, influenced by saline intrusion following unsustainable abstraction), Plemstall (mid-way between Bowater and Eaton) and Eaton (confined).
41

0 10 20 30 40 50 60 70 80 90 1000
10
20
30
40
50
60
70
80
90
1000
10
20
30
40
50
60
70
80
90
100
0
10
20
30
40
50
60
70
80
90
1000
10
20
30
40
50
60
70
80
90
100
0102030405060708090100
0
10
20
30
40
50
60
70
80
90
100100
90
80
70
60
50
40
30
20
10
0
Ca Na + K HCO3 Cl
SO4Mg1968
1999
1968 1999
1968
1999
Figure 6.6 Change in composition of groundwaters from the Bowater No. 5 borehole. Note
the change from a Ca-HCO3 to a Ca-Cl type water.
6.4 Age of the groundwater
Although geochemical concentrations can be used as guide to relative ages, they provide little direct evidence of true ages. Furthermore, facies changes and kinetic factors make such estimates fraught with difficulties. The fact that the waters show a trend of increasing concentration along the flowline for some elements implies a longer residence time but without specific dating tools (e.g. 14C, CFCs) precise ages cannot be given.
Lucey (1987) calculated average groundwater residence times based on annual recharge and the volume of water stored in the aquifer. He suggested that the rate of movement through the unsaturated zone was typically 2.6 m yr-1 and that within the main outcrop areas, where the unsaturated zone ranges from 20 to 100+ metres thick, it would take between 7 and 90 years for recharge waters to reach the water table. However where fracture flow is occurring the time taken may be much less. Within the saturated zone, Lucey (1987) estimated the average residence time to be of the order of 1300 years and suggested that the top 100 m of the aquifer was the most active – with 95% of modern recharge contributing to its flow and an average residence time of 275 years compared with 21 000 years for the bottom 400 m of the aquifer.
42

Stable isotopes have been used successfully to discriminate older Pleistocene (pre 10,000 year old) water from Holocene (post 10 000 year old) groundwaters in the Sherwood Sandstone of the East Midlands (Edmunds et al., 1982). The climate during the Pleistocene period was colder than present, resulting in lighter (more negative) signatures of the stable isotopes δ2H and δ18O. It would therefore be expected that groundwater along a flow line should become progressively lighter to reflect its increasing age, as observed by Edmunds et al. (1982) for the East Midlands. However, in the Cheshire and Wirral Study area deuterium and δ18O display a general trend of becoming slightly heavier, isotopically, with increasing distance along the flow line, a situation similar to that found in the Vale of York and around Selby (Smedley & Trafford, 1999; Shand et al., 2002). The reasons for this are not yet clear but may relate to infiltration from drift deposits or possibly from mixing with seawater or older formation water.
6.5 Regional variations
The geochemical controls highlighted in the flow lines can be applied to the chemical variations occurring over the whole of the study area. The processes operating along the two flow lines selected are believed to be representative of the geochemical evolution over the whole of the study area from the recharge areas, along the direction of flow towards the coast. The regional variations in the aquifer are shown for selected major elements in Figure 6.7. The hydrogeochemistry of the aquifer is subject to significant spatial (horizontal and vertical variations) as well as long-term temporal variations. However, despite the problems of geochemical heterogeneity, a number of regional trends can be identified.
Where the aquifer is unconfined the water is generally of Ca-HCO3 type with subsidiary Mg and SO4 and minor Na and Cl. Hardness increases at the margins of the basin, notably on the western side, which may be the product of inflow from the adjacent Carboniferous Limestone. Within the main part of the basin, hardness is of the order of 300 mg l-1and chloride is typically less than 60 mg l-1. The dominant mineralogy of the sandstones has limited influence on the hydrochemistry as it consists of relatively inert quartz and feldspar. However, the cements which are dominated by carbonate in the shallower aquifer and gypsum/anhydrite in the deeper parts are much more reactive and therefore have much more influence on the hydrochemistry. In recharge areas the dissolution of carbonate by the action of dissolved CO2 in meteoric water is thought to be the main process supplying Ca, Mg and HCO3. Water quality deteriorates with depth to become a Na-Cl type. In the Cheshire area there is insufficient data available to provide an accurate reflection of the confined aquifer hydrogeochemistry. At the edge of the unconfined aquifer the Mercia Mudstone Group has a greater influence on the chemistry. Sulphate and calcium concentrations increase (Figure 6.7) with increased dissolution of anhydrite and gypsum. It is possible that sulphate concentrations in these boreholes are also being influenced by the drift cover. Although high SO4 concentrations were thought to indicate water which had recharged through the drift deposits, Lucey (1987), found that up to 25% of samples taken from beneath outcrop areas also had elevated sulphate concentrations and concluded that high sulphate concentrations beneath outcrop could be the result of mixing with water from the drift or to dissolution of sulphate bearing minerals within the sandstone. Drift derived waters displayed higher concentrations locally than waters recharged directly onto the sandstone outcrop areas for all major determinands and in particular SO4 and K. In addition to higher TDS along the margin with the MMG, increases in salinity were observed along flowlines and particularly close to the Mersey estuary (Box 6.2).
43

Figure 6.7 Regional variations is selected element concentrations (a) sulphate, (b) calcium, (c) chloride and (d) sodium.
44

Box 6.2 Salinity Saline waters have been identified inland within the basin, notably in the vicinity of the Milton Green inlier and also at Thornton-le-Moors and other sites adjacent to the Mersey Estuary. The inland saline waters are thought to be the product of mixing between fresh recharge water and brines arising from halite dissolution to the east of the Delamere fault and any other major faults where halite bearing formations were found adjacent to the Sherwood Sandstone. Analysis of brines from the Cheshire salt fields indicated that they had similar Ca/Na and Mg/Na ratios to those of the saline waters inland. Analysis of the Carboniferous coalfield brines to the west of the area showed these to be low in salinity and therefore less likely to be contributing to salinity within the Sherwood Sandstone aquifer. High salinity at sites near the Mersey Estuary (e.g. Thornton-le-Moors and parts of the Wirral) is most probably caused by saline intrusion due to groundwater abstraction (Allen, 1969, Hibbert, 1956; Lucey, 1987; Tellam, 1995, Jones, 1997; Scott, 1997). In the Lower Mersey basin, the freshwater-saltwater interface occurs at 50 to 200 metres below OD. Industrial abstraction alongside the Mersey estuary, especially in Liverpool and along the Manchester Ship Canal, has resulted in saline intrusion of the aquifer (University of Birmingham, 1981; Metcalfe et al., 1999; Allen et al., 1997). Variations with depth Groundwater salinity increases with depth. Lucey (1987) defined three zones: freshwater, transitional and high salinity groundwater at depth. He used a conductivity profile from the Collinge borehole, located SE of Chester, as an example. In this borehole the upper 200 m were defined as freshwater underlain by a transitional zone from 250 to 450 m below OD and a high salinity zone from 450 m to the base of the aquifer at 850 m. Two groups of saline water were defined: coastal and inland. The coastal saline waters had higher concentrations of Ca, Mg, K and SO4 and δ2H and δ18O plotted close to the standard mean ocean water line for the coastal saline waters. The vertical distribution of salinity can be ascribed to differential amounts of flushing of the aquifer i.e. the freshwater zone represents complete flushing, the transitional zone incomplete flushing and the high salinity zone “effectively stagnant and unaffected by mixing with fresh recharge waters” (Lucey, 1987).
There is considerable variation in terms of salinity in the aquifer (Box 6.2; Figure 6.7). Higher calcium, sulphate, chloride and sodium are found in areas adjacent to the Mersey estuary at Stanlow, Ellesmere Port, Runcorn and the Wirral. These elevated concentrations are largely attributed to the effect of saline intrusion following unsustainable abstraction (Hibbert, 1956; Lucey, 1987 and Scott, 1997). Higher salinities are also present within the basin particularly in the southern part of the study area. Changes in salinity can be related to several processes including water-rock interaction, mixing with formation water and saline intrusion. Lucey (1987), Tellam (1995, 1996) and Metcalfe et al. (1999) have shown that salinity in the Cheshire Basin varies according to the availability of carbonate and evaporite minerals, flux of recharge waters and extent of saline intrusion (which will be influenced by abstraction rates). Salinity has generally been found to increase along flow paths and this has been attributed to the continued flushing of old saline formation waters. All deep saline waters are of Na-Cl type. The highest salinities (estimated from measurements of SEC in the Collinge
45

borehole) occur at depth towards the base of the basin fill and reach 1.3 times the concentration of seawater. Lucey (1987) concluded that the dominant source of salinity for the inland waters was likely to be halite dissolution. This report emphasises the chemistry of the shallow aquifer where active groundwater circulation is occurring and salinities do not generally approach such high concentrations.
The higher TDS in the southern groundwaters studied here vary from Na-Cl dominated to a range of other types and indicate that halite dissolution is not the only mechanism for producing higher TDS. The fact that these waters lie close to the contact with a Carboniferous inlier may be relevant: either due to deeper flow along faults or reaction with evaporite minerals lower in the Permo-Triassic sequence.
There does not appear to be a distinct redox boundary in the study area aquifer although DO and NO3
both display a decrease towards the end of the flowlines. Iron and Mn are generally quite low, consistent with an oxidising aquifer. Some of the higher Fe and Mn values are from deep boreholes. There is insufficient data available from the part of the aquifer confined by the Mercia Mudstone Group to draw any firm conclusions on the differences between the confined and unconfined aquifer. In other Permo-Triassic aquifers, it has been shown that significant differences exist between these, particularly in redox-sensitive species and elements related to residence time as a result of reducing conditions in the confined part and increased residence time.
Some of the trace elements are highest near to the eastern boundary of the aquifer where it is faulted against the Mercia Mudstone. This is the case for Ba (Figure 6.8) and there is an antithetic relationship between Ba and SO4 (Figure 6.3) due to the low solubility of the mineral barite (BaSO4). Most waters are saturated with barite and those groundwaters with the highest Ba are supersaturated. Barium is only high where gypsum dissolution has not been significant, mainly in the recharge areas close to the edge of the aquifer with the Mercia Mudstone. High barium concentrations have also been found in stream sediments and soils along the Mid-Cheshire ridge and these are attributed to red-bed Ba-(Cu) mineralisation (British Geological Survey, 1997 and 1999).
The highest As concentration (53 µg l-1), which exceeds the current EC MAC (50 µg l-1), is from the confined borehole. High arsenic concentrations occur close to the faulted eastern boundary of the aquifer adjacent to the Mercia Mudstone Group and also on the Wirral Peninsula near the boundary with a downfaulted block of Mercia Mudstone (Figure 6.8). Many of these concentrations, present in oxidising groundwaters, are in excess of the proposed MAC of 10 µg l-1. The main control on As may therefore be partly source-controlled rather than a redox control.
High concentrations of As in soils in the area south of Ellesmere have been found in association with high U. Although the reason for the elevated concentrations is not clear, it is likely that the high As is ultimately related to sulphide mineralisation which is known to be present within upper parts of the Sherwood Sandstone (Warrington, 1966; Carlon, 1981). Arsenic concentrations in these groundwaters are likely to be redox controlled, related to sorption-desorption reactions onto iron oxide grain coatings. It also been has been suggested that it may be linked to the use of raw phosphate rock fertilisers (British Geological Survey, 2000).
46

��
��
������
������������
�� ��
��
��
����
������������
��
������
��
������������
�� ��
��
������
������������
��
��������
����
��
��
�� ������
������
����������������
��
����
��������
��
������
��
����
����
�� ����
��
��
������
����
�� �� ������
��
������
������
����
�� ����
����
�������������� ��
������
�������������� ������
����������
��
���� ����������
��
��
��
�� ��
����
��
������
������
�������������������������������������� �������� ��������������
������
��������
��������
��
��
������������������
�� ����
������ ��������
������������
����
������
��
����
����
������
��������
��
��
��������������
��
����
��
��
��
������
��
������������
�� ��
��
������
������������
���� ������
��
��
��
������
��
������
��
������������������
��
��
��
������
����
����
�������� ��
��
��������
������
��������
��
��
����
��
��
��
������
��
������������
�� ��
��
������
������������
��
��������
����
��
��
�� ������
���������������� ������
��
��
��
��������
��
����������������
�� ����
��
��������
����
���� ��������
������
������
��
���� ����
������������������ ��
��
����
�������������� ��������
��������
��
��
�� ��������������
��
�� ��
������
������
������
���������������������������������������� ��
������ ��������������
������
��
��
����
����������
��
������������������
�� ���� ������ ����������������
����
�������� ��
��
��������
������������ ����
��
������������
��
����
��
��
�����������������������
�� �� ���������� ����������� ����������� ���������
������
���������������������������
����������� ������������ ������������� ������������� ���������
�������������������������������
� �� ������������
������������ ���������
�������������
�������
�� ���
��� ���
�����������������������������
����������
�� ����������� ���������
�����������
����
��
��
�������
Figure 6.8 Regional variations is selected element concentrations (a) nitrate as N, (b) barium, (c) arsenic and (d) bicarbonate.
47

7. BASELINE CHEMISTRY OF THE AQUIFER
The chemical data show that the most important influences on water chemistry in the Permo-Triassic Sandstone of West Cheshire and the Wirral are mineral dissolution reactions, involving in particular calcite, dolomite and gypsum/anhydrite. Silicate reactions, although slower, contribute significant amounts of silica and cations including Na, K and to a lesser degree Ca. The data have been presented in Table 5.1 and the median value and 97.7 percentile provide a good estimate of the baseline concentrations for many elements in the aquifer. The regional plots (Figures 6.7 and 6.8) illustrate how groundwater chemistry varies throughout the study area and as a result baseline concentrations will also display significant regional variations. The baseline for the Sherwood Sandstone will be different where the aquifer is unconfined compared with where it is confined by drift deposits or the Mercia Mudstone Group. Understanding geochemical signatures in the area is complicated by the fact that the aquifer comprises four different geological formations, within which considerable vertical and horizontal heterogeneity is likely to occur in terms of sedimentology, mineralogy, cementation, hydrogeological properties and hydrogeochemistry.
Although most waters are dominated by baseline concentrations of solutes, this is not the case for all components. The effect of anthropogenic inputs is indicated by enhanced concentrations of N-species and a range of other solutes potentially derived from urban and industrial usage. The most obvious inputs over the last few decades have been from agricultural sources. Baseline nitrate concentrations are most likely to be around a few mg l-1. In the cumulative probability plot (Figure 5.4) the main curvature occurs at around 3 mg l-1 and this is around the concentration expected for nitrate-N baseline concentrations. Historical records dating from 1905 indicate a nitrate concentration of 3.3 mg l-1NO3-N for one borehole. Other elements which may have been modified by agriculturally derived anthropogenic inputs include K, Cl and P (Shand et al., 1999). Phosphate concentrations are generally low due to limited mobility in the aqueous environment and the timescales involved for recharge to occur. Potassium is not very mobile in the sub-surface environment and most anthropogenic inputs will be consumed by biomass or through sorption processes. Potassium increases with distance along the flowline. The dominant source of K is most likely to be from dissolution reactions of K-feldspar and biotite. Chloride, on the other hand, is very mobile and likely to modify the baseline significantly where evaporites are present. A comparison of Br/Cl and Na/Cl ratios shows that chloride is generally derived from a combination of rainfall inputs, mixing with more saline waters (seawater, formation water) and halite dissolution, however, a significant input related to agricultural activity may also be present. One of the samples, which was noted as smelling of solvents in the laboratories has a very low Na/Cl ratio and a high Br/Cl ratio, confirming evidence of pollution (Figure 6.3). Although individual water samples may have been affected by such inputs, in general their chemistry reflects the range of baseline concentrations produced through natural processes.
48

8. SUMMARY AND CONCLUSIONS
The Permo-Triassic Sandstone of Cheshire and the Wirral forms an important aquifer and is used for public supply, industrial and agricultural use. Although the unconfined part of the aquifer is extensively used, there are very few sources in the confined part of the aquifer. This study therefore focuses on the baseline groundwater characteristics within the unconfined aquifer as there are insufficient sample points to draw conclusions about the confined aquifer hydrochemistry.
With the exception of the higher elevation Mid-Cheshire Ridge, most of the area is covered by drift deposits. The drift varies in lithological composition and consequently in its hydrogeological and hydrogeochemical characteristics. The drift impedes the amount of direct recharge to the aquifer and can give rise to semi-confined conditions.
There does not appear to be a distinct redox boundary in the aquifer with the unconfined part of the aquifer generally being oxidising and characterised by relatively high nitrate concentrations and low concentrations of Fe and Mn.
Mineral dissolution reactions, notably those involving calcite, dolomite and gypsum, ion exchange, mixing with older waters and redox processes all contribute to determining groundwater chemistry within the study area.
Salinity varies considerably within the aquifer. Higher salinities are found in areas adjacent to the Mersey estuary at Stanlow, Ellesmere Port, Runcorn and the Wirral. These elevated concentrations are largely attributed to the effect of saline intrusion following unsustainable abstraction (Hibbert, 1956; Lucey, 1987 and Scott, 1997). The inland saline waters are believed to be the product of mixing between fresh recharge water and brines arising from halite dissolution.
The natural baseline is expressed as a range of concentrations which can vary over several orders of magnitude for some elements. Some elements are enhanced over the natural baseline due to anthropogenic influences. Increases in nitrate and chloride, for example, may have been modified by agricultural and industrial practices and this is supported by historical data which often demonstrate increases in concentration with time.
The presence of relatively high concentrations of several trace elements is considered to be due to entirely natural processes. A number of trace elements, notably arsenic and barium, are highest close to where the aquifer is in contact with the Mercia Mudstone Group i.e. at the faulted eastern boundary and on the Wirral near the Mercia Mudstone outcrop. The highest As concentration, which exceeds the current EC MAC (50 µg l-1), occurs in the confined part of the aquifer. Many arsenic concentrations are in excess of the proposed MAC of 10 µg l-1. Their occurrence under oxidising conditions suggests that the high arsenic concentrations in this region may be dominantly source- rather than redox-controlled. The median value for Ba exceeds the current EC Guide Level of 100 µg l-1.
The impact of anthropogenic influences can be significantly reduced by appropriate aquifer management strategies and controls. For example, the future management of the groundwater resources under the Environment Agency's Catchment Abstraction Management Strategy (CAMS) should prevent unsustainable abstraction, which in the past has resulted in the intrusion of seawater into the aquifer along the Mersey estuary. The designation of Nitrate Vulnerable Zones (NVZs), such as that at Kelsall, will help with measures to control the agricultural inputs of nitrate into the groundwater around public water supply abstractions.
49

REFERENCES
Allen, D.J., Brewerton, L.M., Coleby, L.M., Gibbs, B.R., Lewis, M.A., MacDonald, A.M., Wagstaff, S. & Williams, A.T. 1997. The physical properties of major aquifers in England and Wales. British Geological Survey Technical Report WD/97/34. 312pp. Environment Agency R&D Publication 8.
Allen, A.D. 1969. The hydrogeology of the Merseyside area. Unpublished PhD thesis, University College London.
Appelo, C.A.J and Postma, D. 1991 Geochemistry, groundwater and pollution. A.A. Balkema.
Bath, A.H., Milodowski, A.E and Strong, G.E. 1987. Fluid flow and diagenesis in the East Midlands Triassic Sandstone aquifer. 127-140 in Fluid flow in sedimentary basins and aquifers. Goff J.C. and Williams B.P.J. (editors) Special Publication of the Geological Society of London, No. 34.
Brennan M.J. 1997. The application of 18-Oxygen/Deuterium isotope techniques and major ion data to determine leakage from water and sewer mains networks in the Triassic Sandstone aquifer of Liverpool, UK. Unpublished MSc thesis, University of East Anglia.
British Geological Survey. 1989. Hydrogeological Map of Clwyd and the Cheshire Basin. NERC.
British Geological Survey. 2000. Regional geochemistry of Wales and part of west-central England: stream sediment and soil. Keyworth, Nottingham: British Geological Survey.
Carlon, C.J. 1981 The Gallantry Bank Copper Mine, Bickerton, Cheshire. British Mining, No. 16.
Earp, J.R. and Taylor B.J. 1986. The geology of the country around Chester and Winsford. Memoir of the British Geological Survey, Sheet 109.
Edmunds, W.M. 1996 Bromine geochemistry of British groundwaters. Mineralogical Magazine, 60, 275-284.
Edmunds, W.M., Bath, A.H. & Miles, D.L. 1982 Hydrochemical evolution of the East Midlands Triassic sandstone aquifer, England. Geochimica et Cosmochimica Acta, 46, 2069-2081.
Edmunds, W.M., Miles D.L. and Cook J.M. 1984 A comparative study of sequential redox processes in three British aquifers. 55-70 in Hydrochemical balances of freshwater systems Ericksson, E. (editor). IAHS Publication, No. 50.
Edmunds, W.M., Darling, W.G., Kinniburgh, D.G., Miles, D.L., Bath, A.H., Morgan-Jones, M. & Andrews, J.N. 1987 Baseline geochemistry conditions in the Chalk aquifer, Berkshire, UK: a basis for groundwater quality management. Applied Geochemistry, 2, 251-274.
Edmunds, W.M., Shand, P., Hart, P. & Ward, R. 2002 (In press) The natural (baseline) quality of groundwater in England and Wales: UK pilot studies. Science of the Total Environment.
Environment Agency. 1997 – Local Environment Agency Plan – Lower Mersey.
Environment Agency. 1999 – Local Environment Agency Plan –Dee area .
Hibbert, E.S. 1956. The hydrogeology of the Wirral Peninsula. J. Inst. Water. Eng. 10, 441-469.
50
Ion, N.J. 1996. The causes and effects of rising groundwater in Merseyside and Manchester. PhD thesis, University of Liverpool.
Jones, D.A.S. 1997. Saline groundwater investigations at Ellesmere Port in Cheshire. Unpublished MSc thesis, University of Birmingham.
Lucey, P.A. 1987. The hydrochemistry of groundwater in the west Cheshire aquifer, North-west England. Unpublished MSc thesis, University of Lancaster.
Melcalfe R, Gale IN, Ball DF, Higgo JJW, Hooker PJ, Noy DJ, Rochelle CA and Savage D. 1999. “Hydrogeology and hydrochemistry” in Plant JA, Jones DG and Haslam HW (editors). 1999. The Cheshire Basin Report: Basin evolution, fluid movement and in a Permo-Triassic rift setting. British Geological Survey, Keyworth, Nottingham.
Monkhouse, R.A. & Richards, H.J. 1982 Groundwater resources of the United Kingdom. Commission of the European Communities, Th. Schäfer Druckerei GmbH, Hannover.
Plant J.A., Jones D.G. and Haslam H.W. (editors). 1999. The Cheshire Basin Report: Basin evolution, fluid movement and in a Permo-Triassic rift setting. British Geological Survey, Keyworth, Nottingham.
Scott, J. 1997. The regional hydrochemistry of the Wirral Peninsula. Unpublished MSc thesis, University of Birmingham.
Shand, P. & Frengstad, B. 2001. Baseline groundwater quality: A comparison of selected British and Norwegian aquifers. British Geological Survey Internal Report, IR/01/177.
Shand, P., Tyler-Whittle, R. A., Morton, M., Simpson, E., Lawrence, A.R. & Hargreaves, R. 2002 Baseline Reports Series: 1. The Triassic Sandstones of the Vale of York. British Geological Survey Commissioned Report, CR/02/102N, 48pp.
Smedley P.L. & Trafford J.M. 1999. Regional hydrogeochemistry of the Sherwood Sandstone aquifer of the Selby-Goole area of Yorkshire. British Geological Survey Technical Report WD/99/25.
Tellam J.H. 1995. Hydrochemistry of saline groundwaters of the lower Mersey Basin, Permo-Triassic sandstone aquifer, UK. Journal of Hydrology 165, 45-84.
Tellam J.H. 1996. Interpreting the borehole water chemistry of the Permo-Triassic sandstone aquifer, UK. Journal of Hydrology 83, 1-21.
University of Birmingham. 1981 – Saline Groundwater Investigation. Phase 1 – Lower Mersey Basin. Final Report to the North West Water Authority, October 1981.
Vines K. 1984. Drift recharge. North West Water Authority. Hydrogeological Report 145.
Vines K. 1984. Nitrate in groundwater investigation. Final report. North West Water Authority. Hydrogeological Report 155.
Warrington, G. 1966 The metalliferous mining district of Alderley Edge, Cheshire. Mercian Geologist, 1, 111-129.
Whitehead E.J. 1998. Application of a multiple marker approach to determine whether leaking sewers are contributing to contamination of groundwater beneath Liverpool, UK. Unpublished MSc thesis, University of East Anglia.
51

ACKNOWLEDGEMENTS
This work would not have been possible without the support of the help from United Utilities plc and the Dee Valley Water Company and we are also grateful to the farming and industrial communities who allowed access to sample their boreholes. The chemical analyses were completed by Debbie Allen and Sarah Trickett under the supervision of Janice Trafford. George Darling (BGS) and Alan Ward (EA) are also thanked for stable isotope and N-species analyses respectively. We are also grateful to Mark Antrobus of SPSS for his development work on PIPER diagrams in Sigmaplot.
52
Related Documents