Baseline Pollution Assessment Mughalsarai Gangaghat Unnao

Welcome message from author
This document is posted to help you gain knowledge. Please leave a comment to let me know what you think about it! Share it to your friends and learn new things together.
Transcript
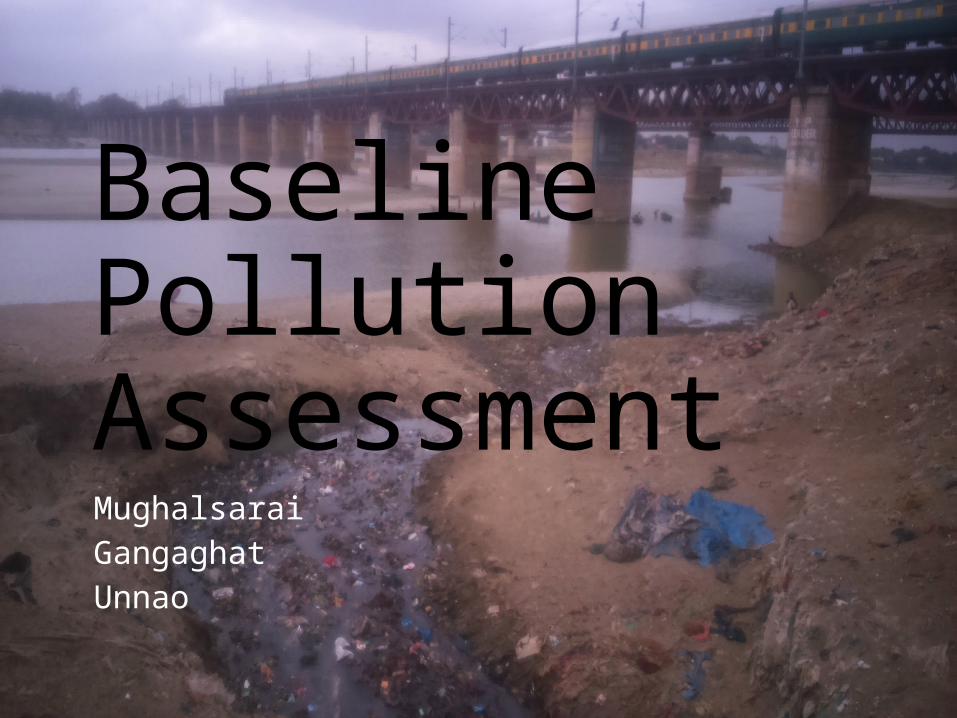
Baseline Pollution AssessmentMughalsaraiGangaghatUnnao
Outline
• Overview of sanitation arrangements in Ganga Basin
• Study objectives and scope
• Study approach and methodology
•Water and sanitation in selected cities
• Pollution sources and loads in selected cities
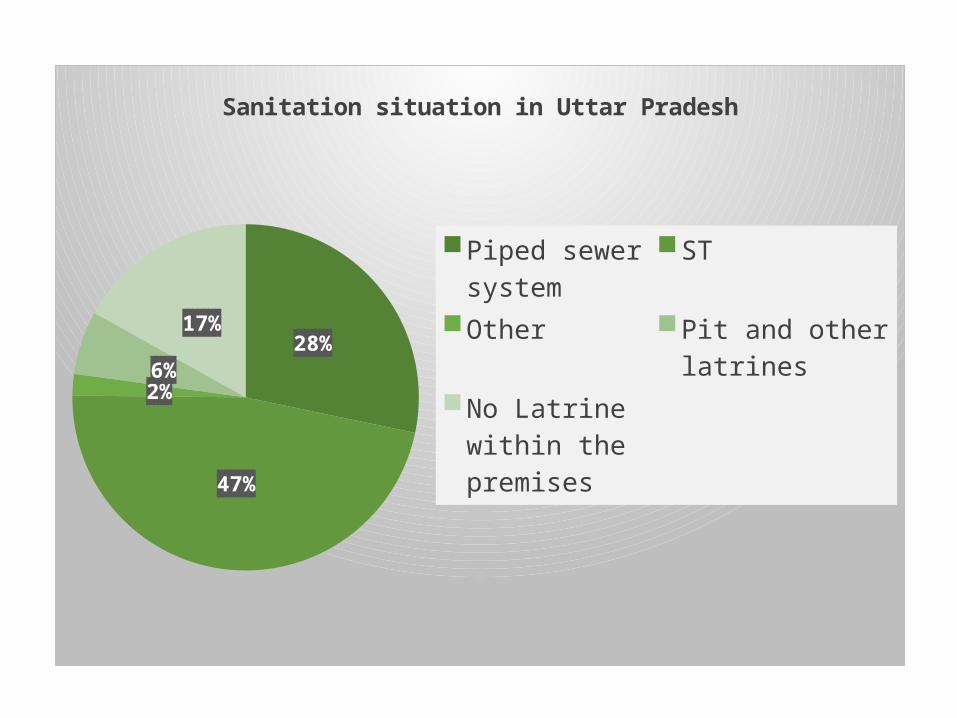
28%
47%
2%6%
17%
Sanitation situation in Uttar Pradesh
Piped sewer systemSTOtherPit and other latrinesNo Latrine within the premises
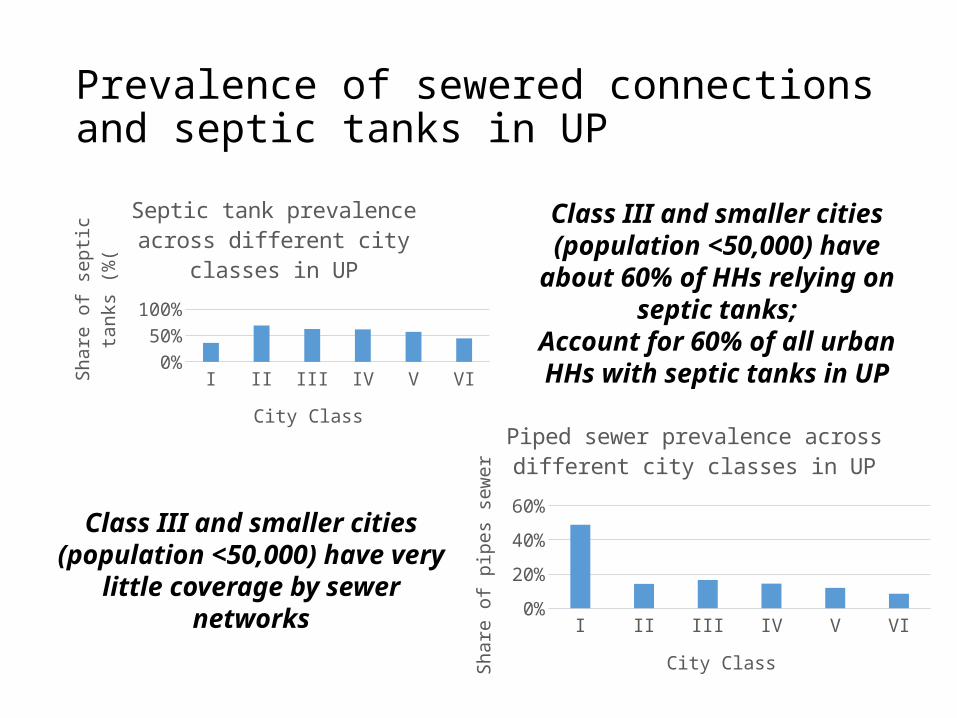
Prevalence of sewered connections and septic tanks in UP
I II III IV V VI0%
20%40%60%80%
Septic tank prevalence across different city classes in UP
City Class
Shar
e of
septi
c ta
nks (
%(
I II III IV V VI0%
10%20%30%40%50%60%
Piped sewer prevalence across different city classes in UP
City Class
Shar
e of
pip
es se
wer
Class III and smaller cities (population <50,000) have about
60% of HHs relying on septic tanks;Account for 60% of all urban HHs
with septic tanks in UP
Class III and smaller cities (population <50,000) have very
little coverage by sewer networks
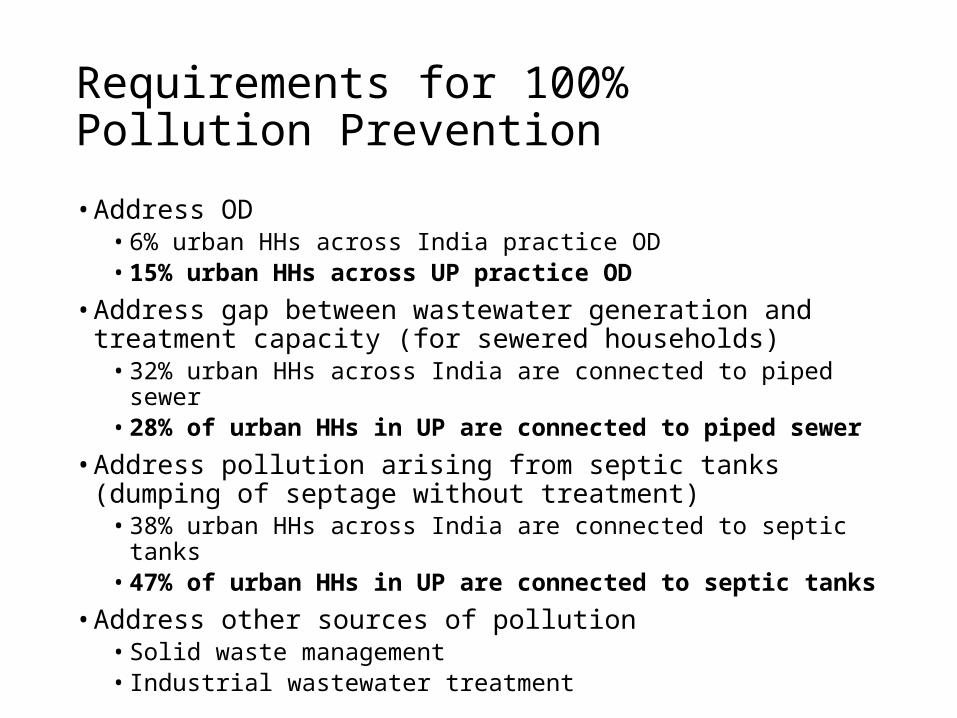
Requirements for 100% Pollution Prevention• Address OD
• 6% urban HHs across India practice OD• 15% urban HHs across UP practice OD
• Address gap between wastewater generation and treatment capacity (for sewered households)• 32% urban HHs across India are connected to piped sewer• 28% of urban HHs in UP are connected to piped sewer
• Address pollution arising from septic tanks (dumping of septage without treatment)• 38% urban HHs across India are connected to septic tanks• 47% of urban HHs in UP are connected to septic tanks
• Address other sources of pollution• Solid waste management• Industrial wastewater treatment
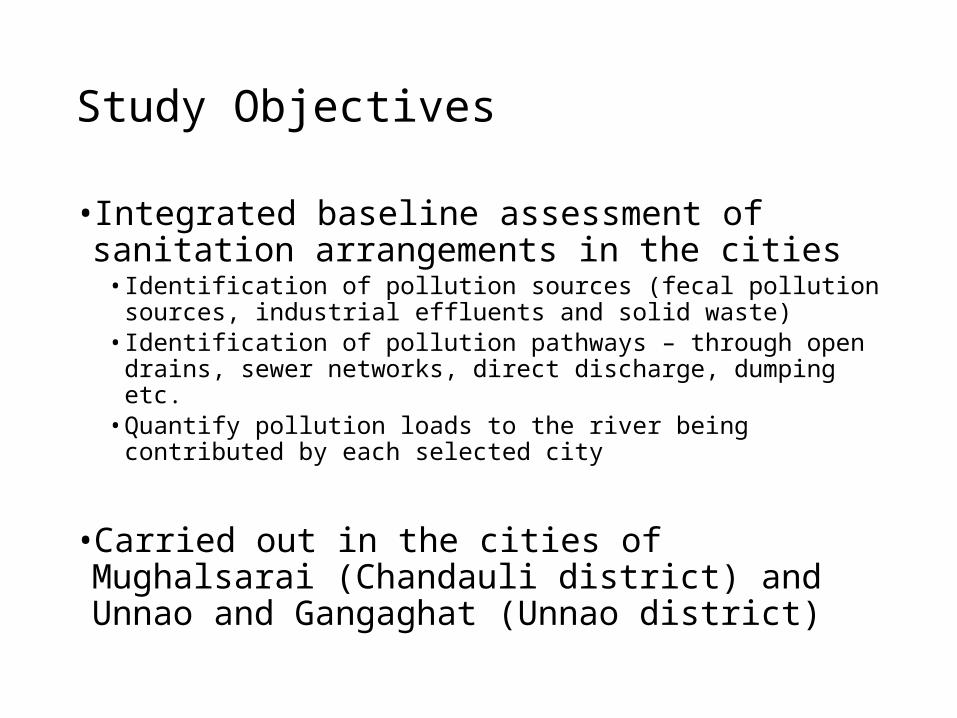
Study Objectives
• Integrated baseline assessment of sanitation arrangements in the cities• Identification of pollution sources (fecal pollution sources, industrial
effluents and solid waste)• Identification of pollution pathways – through open drains, sewer
networks, direct discharge, dumping etc. • Quantify pollution loads to the river being contributed by each
selected city
•Carried out in the cities of Mughalsarai (Chandauli district) and Unnao and Gangaghat (Unnao district)
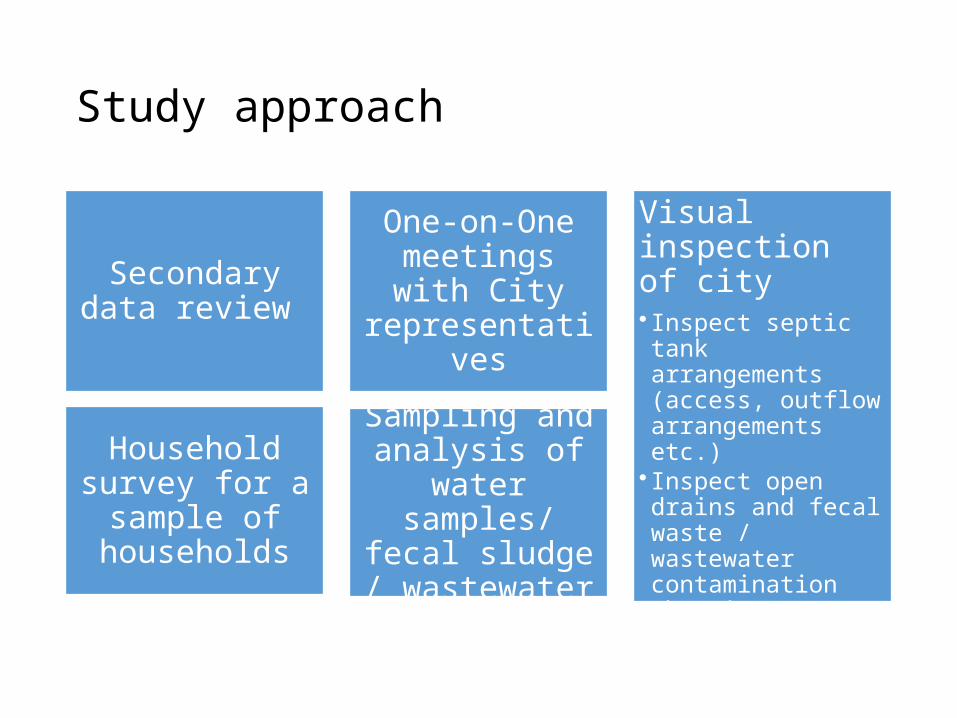
Study approach
Secondary data review
One-on-One meetings with City
representatives
Visual inspection of city • Inspect septic tank
arrangements (access, outflow arrangements etc.)
• Inspect open drains and fecal waste / wastewater contamination therein
•Document prevalence of peri-urban agriculture in / around the city, if observed
Household survey for a sample of
households
Sampling and analysis of water
samples/ fecal sludge /
wastewater
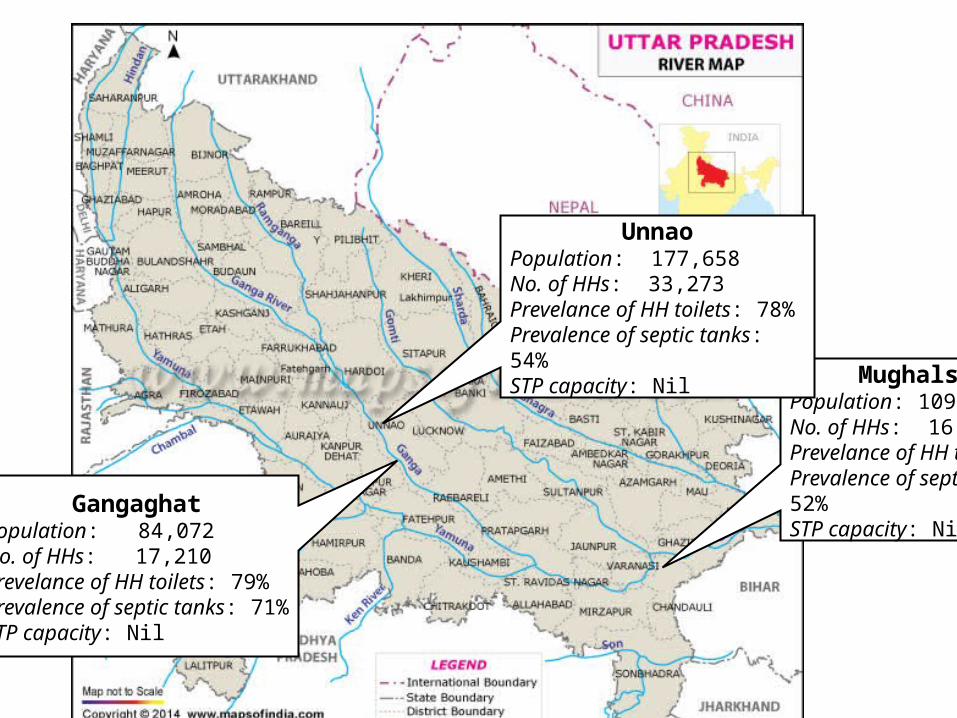
MughalsaraiPopulation: 109650No. of HHs: 16,796 Prevelance of HH toilets: 70%Prevalence of septic tanks: 52%STP capacity: Nil
UnnaoPopulation: 177,658 No. of HHs: 33,273 Prevelance of HH toilets: 78%Prevalence of septic tanks: 54%STP capacity: Nil
GangaghatPopulation: 84,072 No. of HHs: 17,210 Prevelance of HH toilets: 79%Prevalence of septic tanks: 71%STP capacity: Nil
City HHHHs with
toilets (%)
HHs with septic
tanks (%)
HHs with
Sewer (%)
HHs with
Pit (%)
HHs discharging
to open drain (%)
HH relying
on public toilets
(%)
HH practicing
Open Defecation
(%)
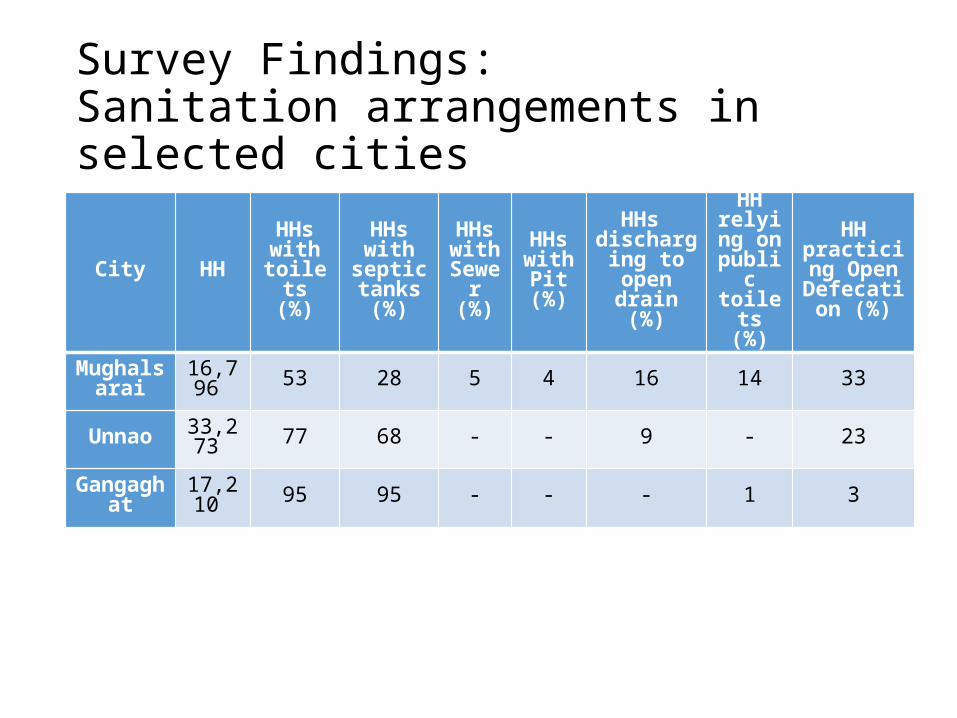
Mughalsarai 16,796 53 28 5 4 16 14 33
Unnao 33,273 77 68 - - 9 - 23
Gangaghat 17,210 95 95 - - - 1 3
Survey Findings: Sanitation arrangements in selected cities
10100%88%
On-site facility
Septic tanks, covered pits,
VIPs etc.
Open defecation (including open pits)
Unsafely emptied
or discharged
Treatment Reuse/ disposalTransportCollectionContainment
Source: Sample HH Survey
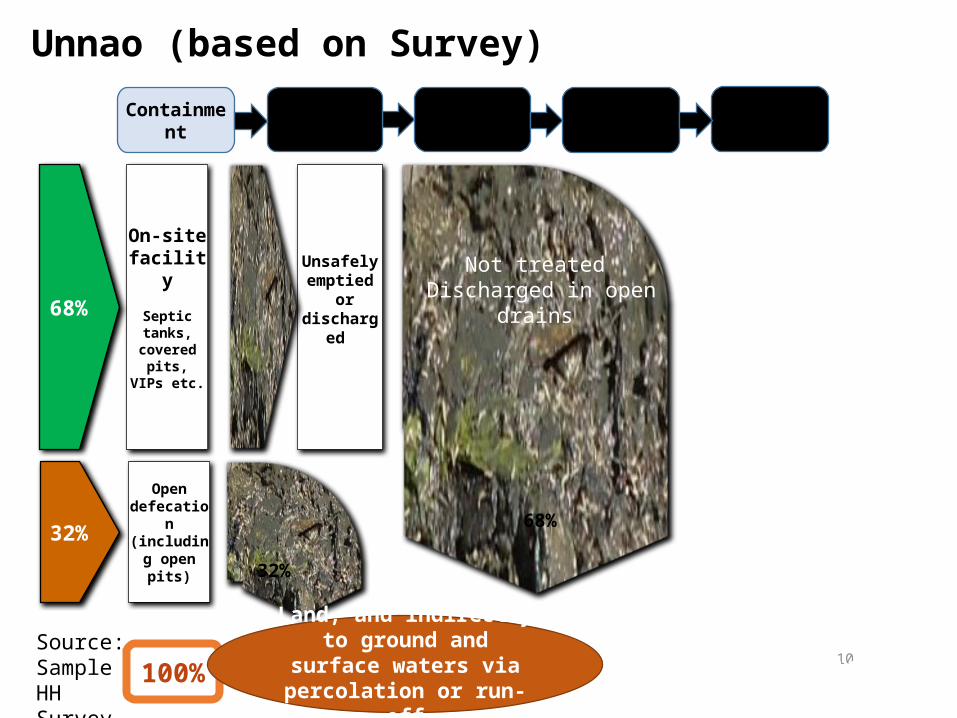
Not treated Discharged in open drains
Unnao (based on Survey)
68%
32%
68%
32%
100%Land, and indirectly to
ground and surface waters via percolation or run-off
11100%88%
On-site facility
Septic tanks, covered pits,
VIPs etc.
Open defecation
Unsafely emptied
or discharged
Treatment Reuse/ disposalTransportCollectionContainment
Source: Sample HH Survey
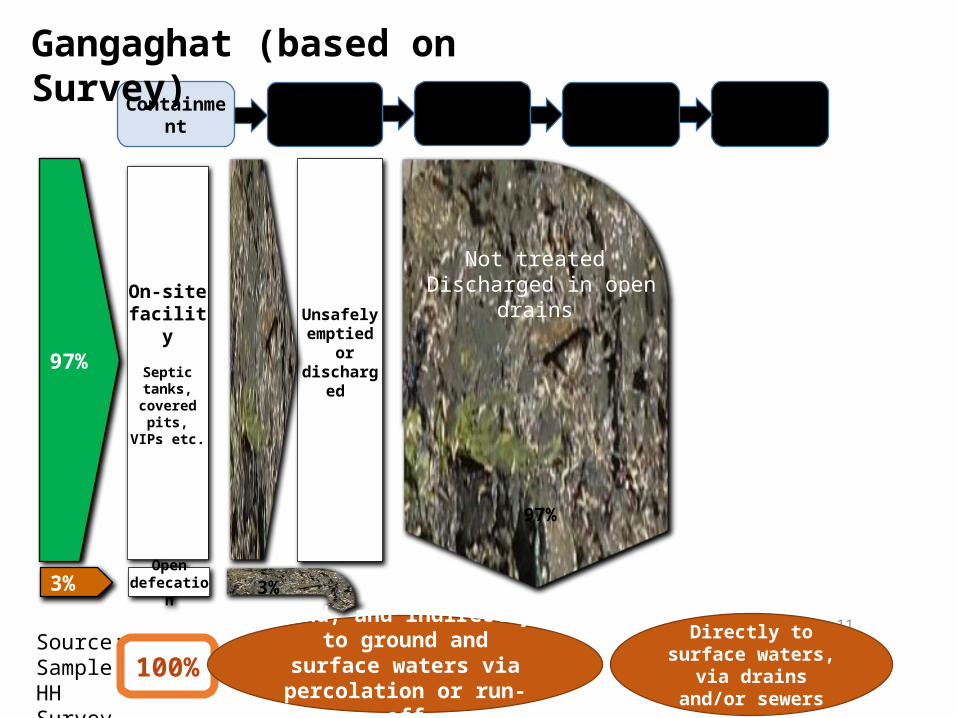
Not treated Discharged in open drains
Gangaghat (based on Survey)
97%
3%
97%
3%
100%Directly to surface waters, via drains
and/or sewers
Land, and indirectly to ground and surface waters via percolation or run-off
12100%88%
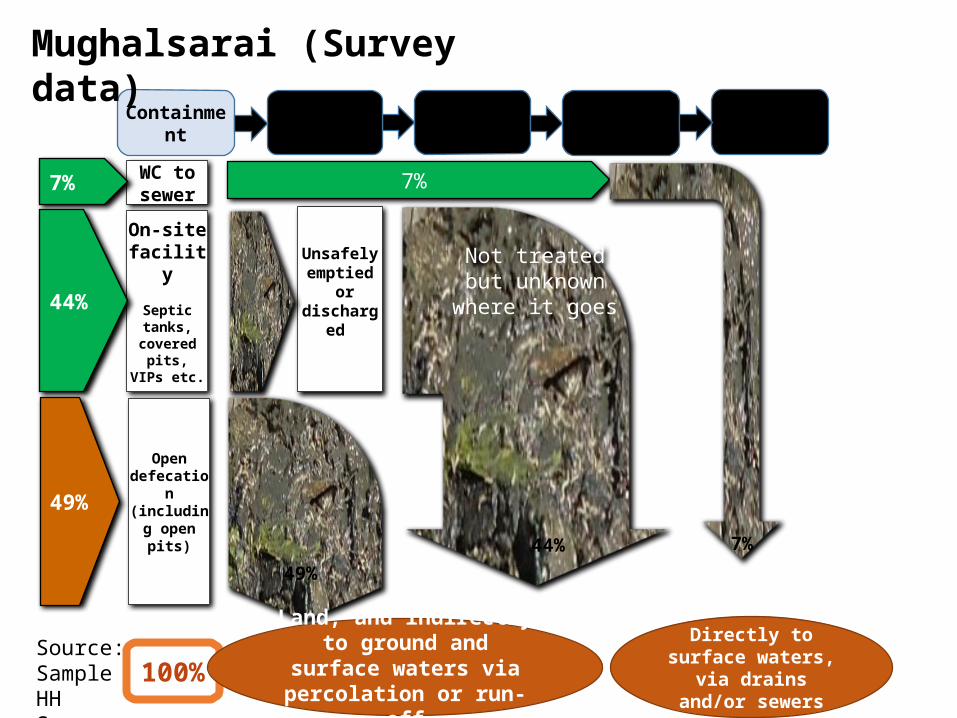
WC tosewer
On-site facility
Septic tanks, covered pits,
VIPs etc.
Open defecation (including open pits)
Unsafely emptied
or discharged
Treatment Reuse/ disposalTransportCollectionContainment
Source: Sample HH Survey
Not treated but unknown where it goes
Mughalsarai (Survey data)
44%49%
7%
44%
7%
7%
49%
100%Directly to surface waters, via drains
and/or sewers
Land, and indirectly to ground and surface waters via percolation or run-off

Households Practicing Open Defecation
UnnaoGangaghat
Mughalsarai
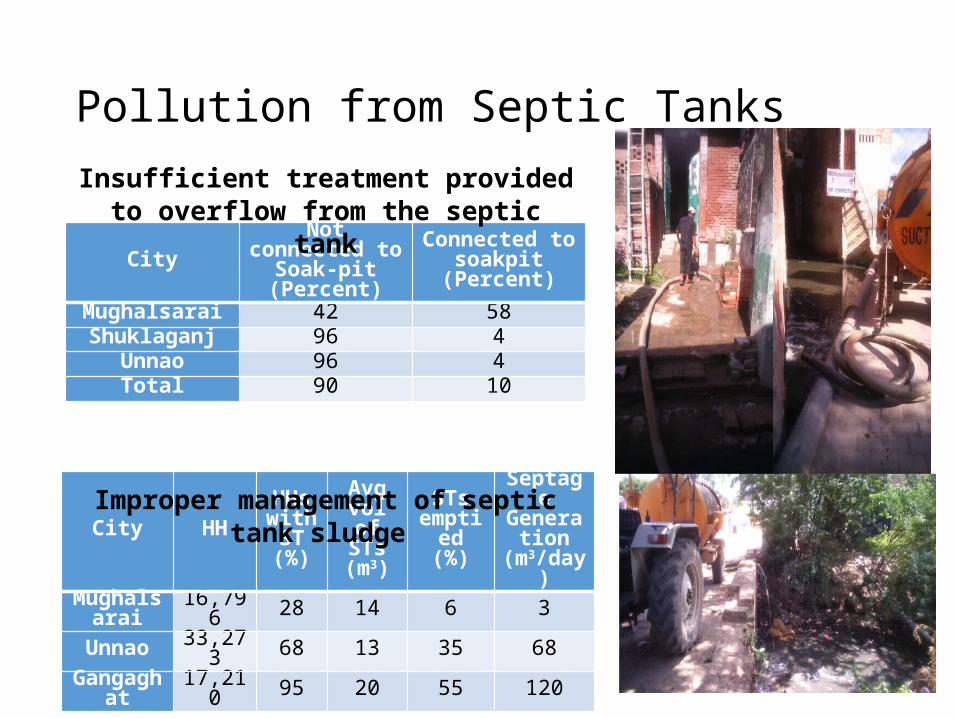
Pollution from Septic Tanks
City Not connected to Soak-pit (Percent)
Connected to soakpit (Percent)
Mughalsarai 42 58Shuklaganj 96 4
Unnao 96 4Total 90 10
City HHHHs with
ST (%)
Avg vol of STs (m3)
STs emptied (%)
Septage Generati
on (m3/day)
Mughalsarai 16,796 28 14 6 3
Unnao 33,273 68 13 35 68Gangaghat 17,210 95 20 55 120
Insufficient treatment provided to overflow from the septic tank
Improper management of septic tank sludge
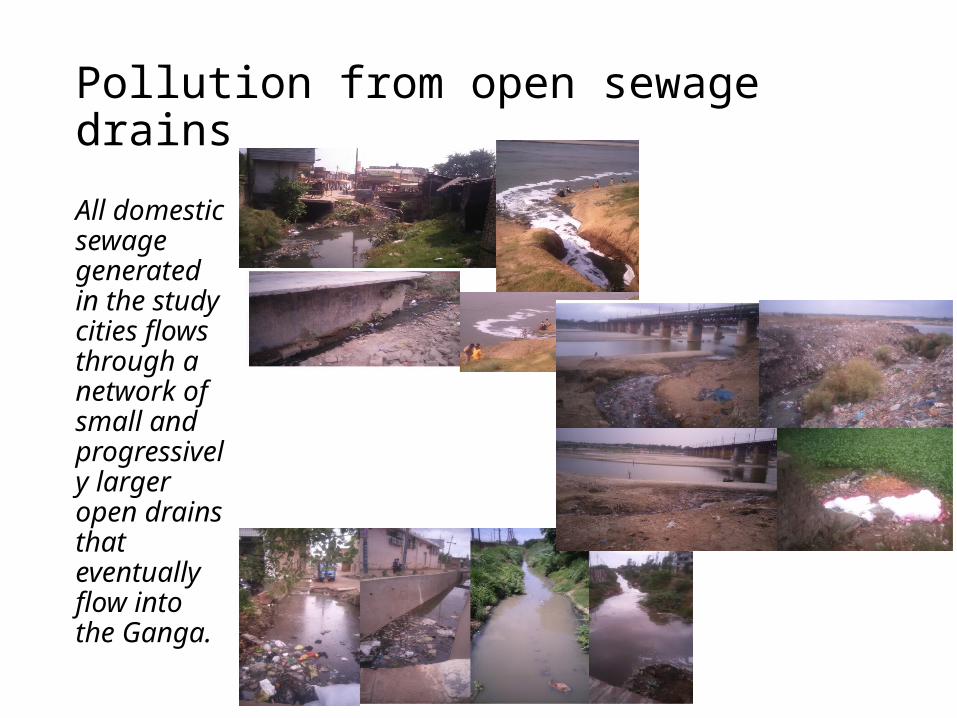
Pollution from open sewage drains
All domestic sewage generated in the study cities flows through a network of small and progressively larger open drains that eventually flow into the Ganga.
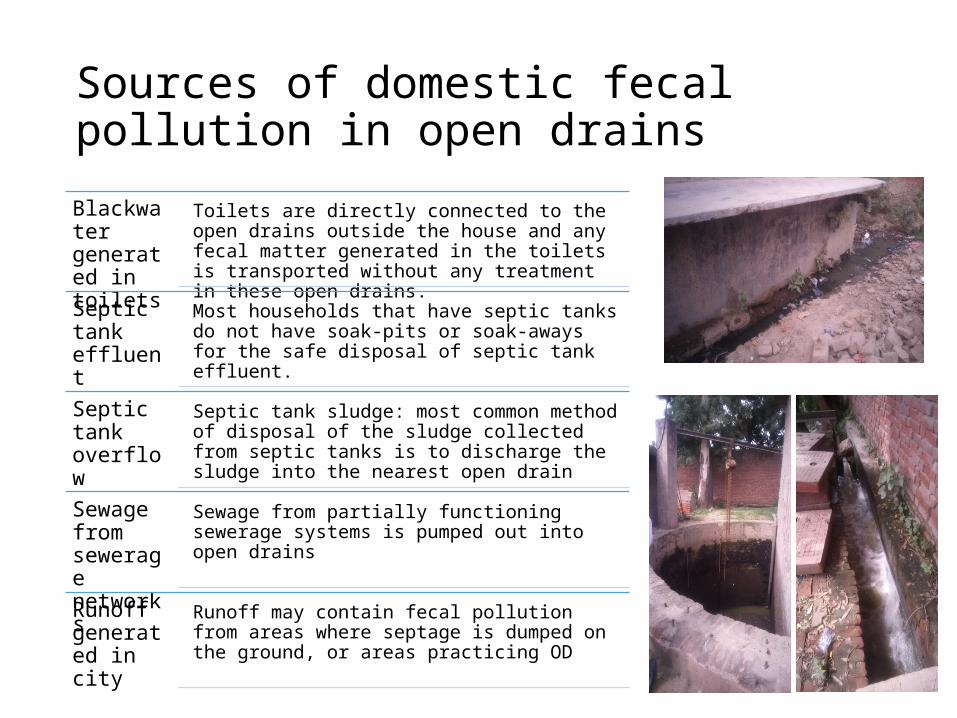
Sources of domestic fecal pollution in open drainsBlackwater generated in toilets
Toilets are directly connected to the open drains outside the house and any fecal matter generated in the toilets is transported without any treatment in these open drains.
Septic tank effluent
Most households that have septic tanks do not have soak-pits or soak-aways for the safe disposal of septic tank effluent.
Septic tank overflow
Septic tank sludge: most common method of disposal of the sludge collected from septic tanks is to discharge the sludge into the nearest open drain
Sewage from sewerage networks
Sewage from partially functioning sewerage systems is pumped out into open drains
Runoff generated in city
Runoff may contain fecal pollution from areas where septage is dumped on the ground, or areas practicing OD
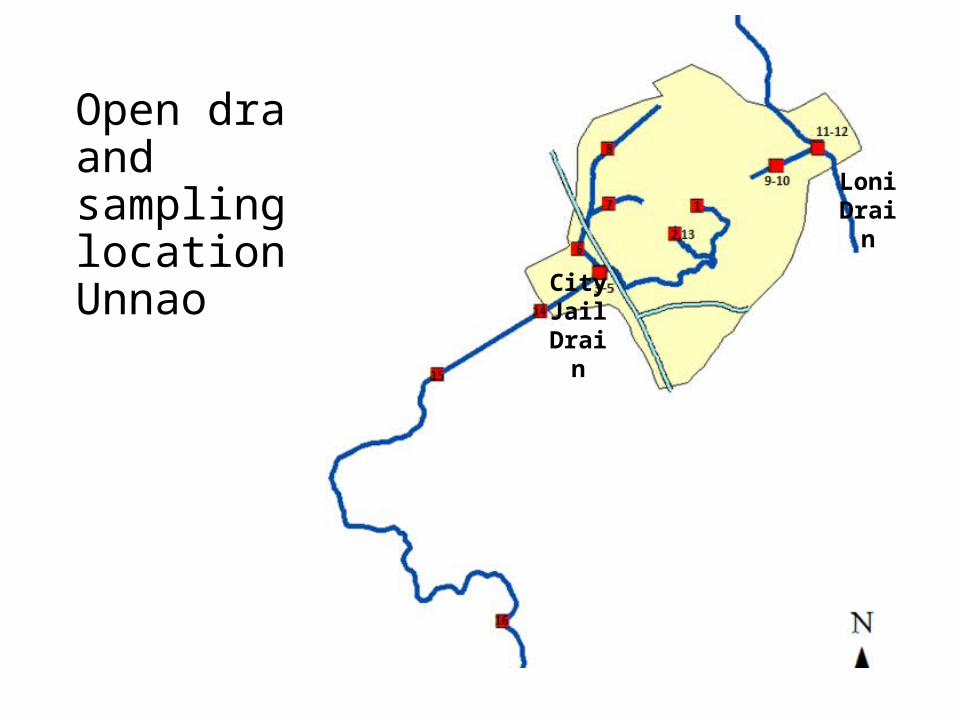
Open drains and sampling locations - Unnao
Loni Drain
City Jail
Drain
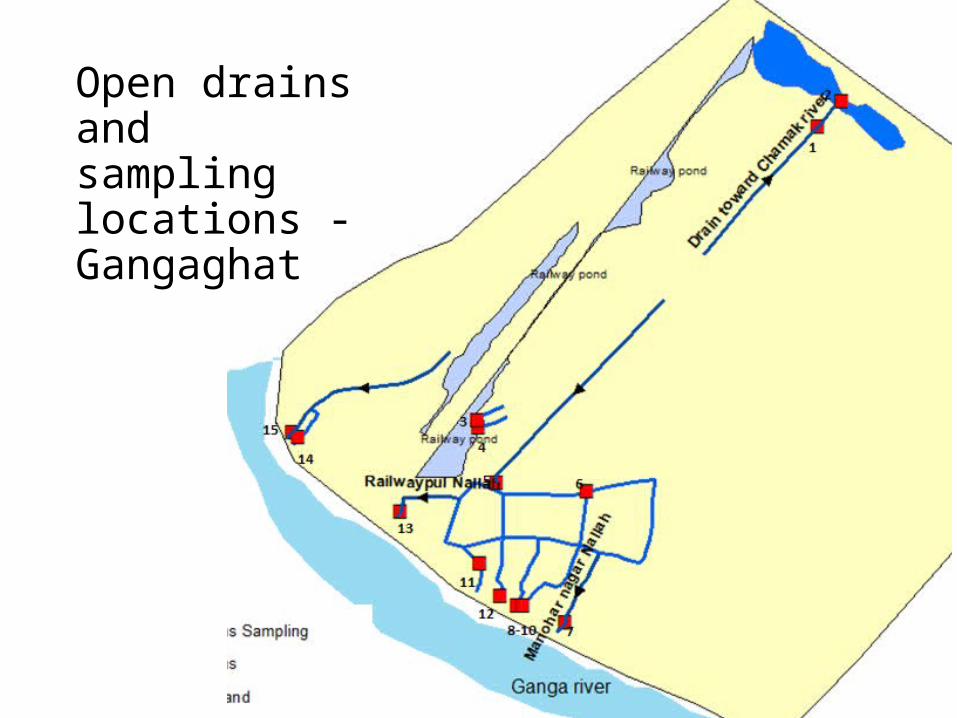
Open drains and sampling locations - Gangaghat
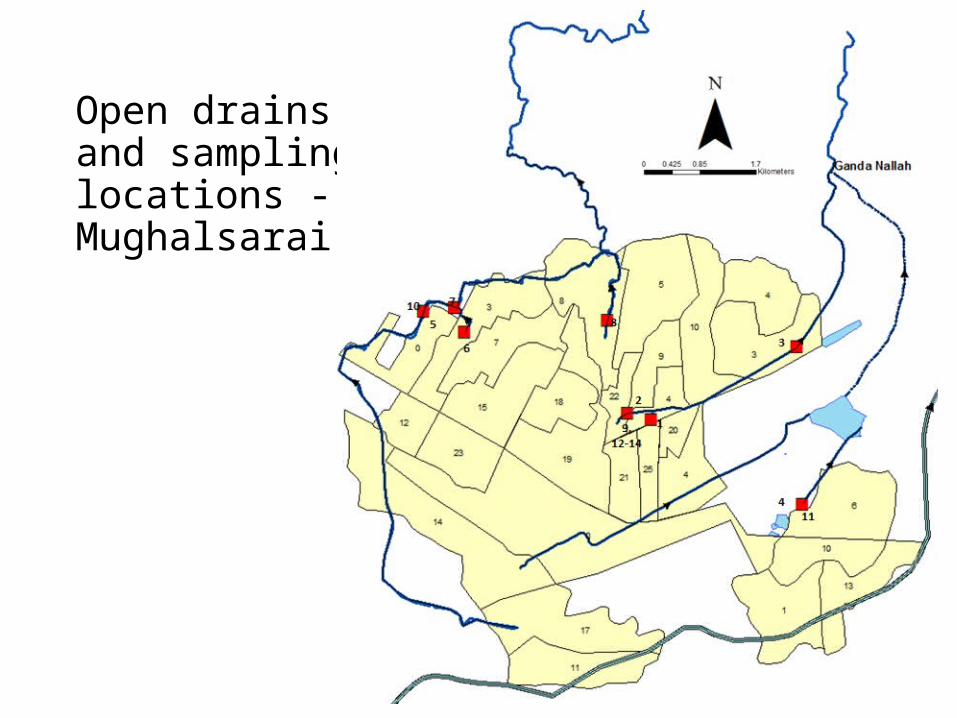
Open drains and sampling locations - Mughalsarai
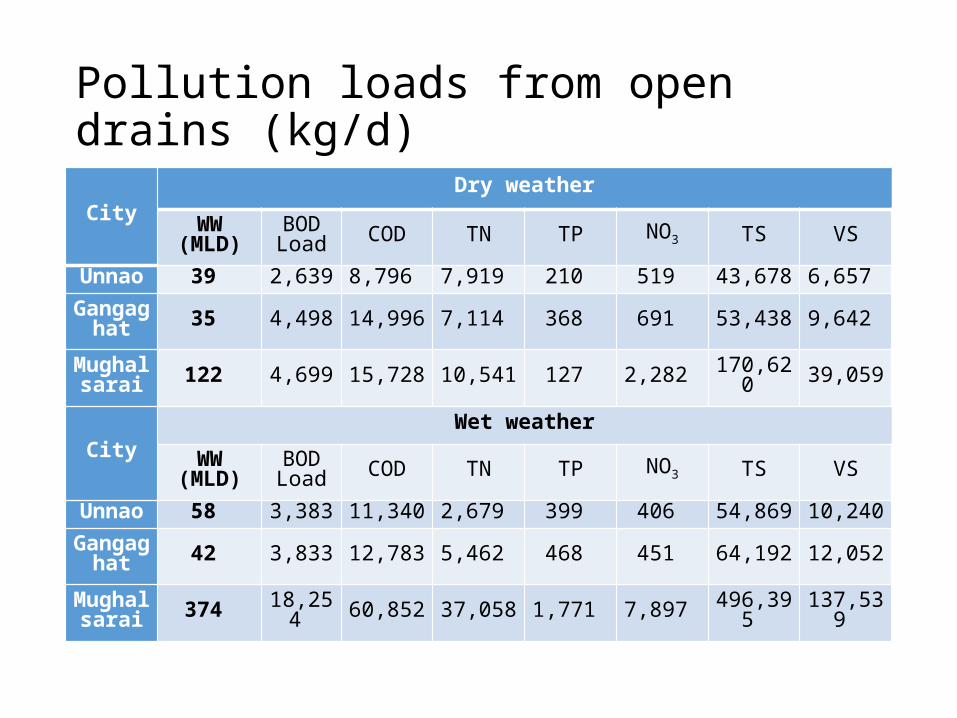
Pollution loads from open drains (kg/d)
CityDry weather
WW (MLD)
BOD Load COD TN TP NO3 TS VS
Unnao 39 2,639 8,796 7,919 210 519 43,678 6,657 Gangagh
at 35 4,498 14,996 7,114 368 691 53,438 9,642
Mughalsarai 122 4,699 15,728 10,541 127 2,282 170,620 39,059
CityWet weather
WW (MLD)
BOD Load COD TN TP NO3 TS VS
Unnao 58 3,383 11,340 2,679 399 406 54,869 10,240 Gangagh
at 42 3,833 12,783 5,462 468 451 64,192 12,052
Mughalsarai 374 18,254 60,852 37,058 1,771 7,897 496,395 137,539
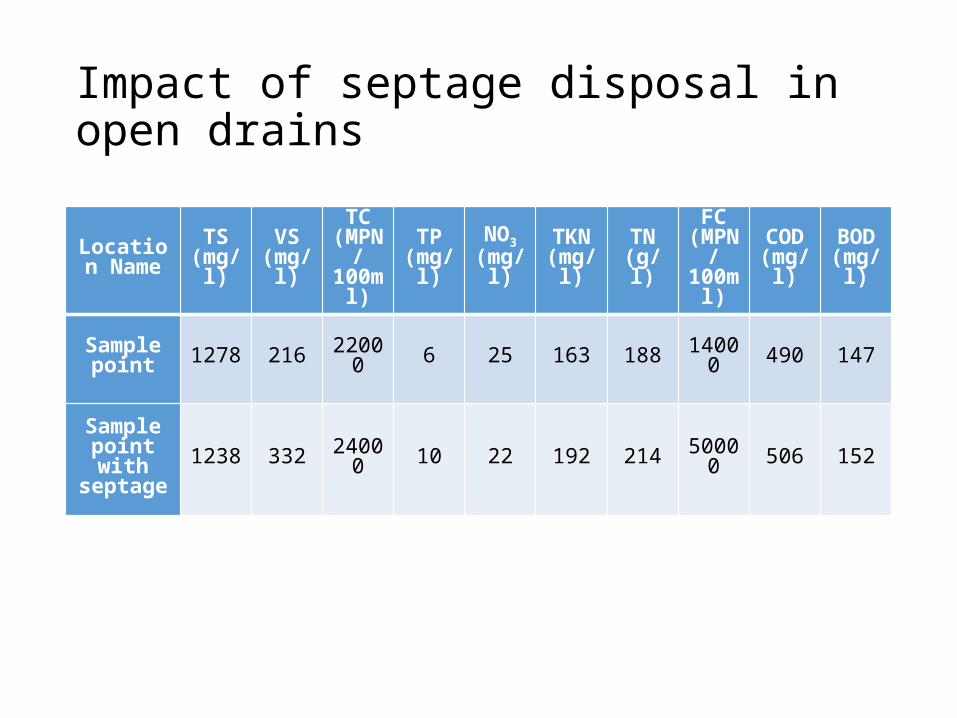
Impact of septage disposal in open drains
Location Name
TS (mg/l)
VS(mg/l)
TC(MPN
/100ml
)
TP(mg/l)
NO3(mg/l)
TKN(mg/l)
TN(g/l)
FC(MPN
/100ml
)
COD(mg/l)
BOD(mg/l)
Sample point 1278 216 22000 6 25 163 188 14000 490 147
Sample point with
septage1238 332 24000 10 22 192 214 50000 506 152
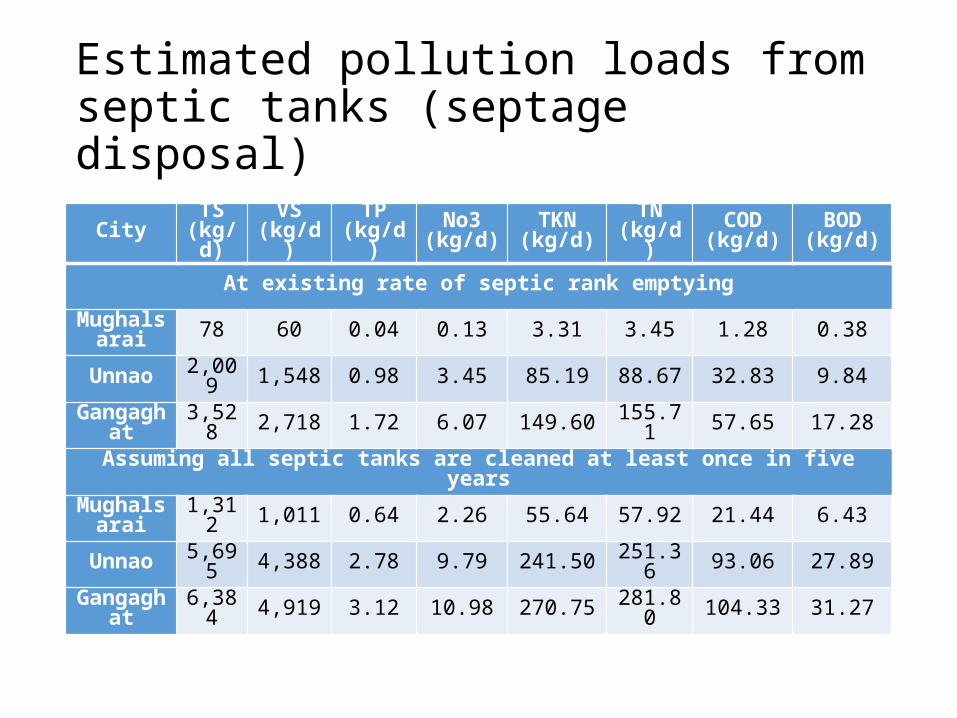
Estimated pollution loads from septic tanks (septage disposal)
City TS (kg/d)
VS (kg/d)
TP (kg/d)
No3 (kg/d)
TKN (kg/d)
TN (kg/d)
COD (kg/d)
BOD (kg/d)
At existing rate of septic rank emptying
Mughalsarai 78 60 0.04 0.13 3.31 3.45 1.28 0.38
Unnao 2,009 1,548 0.98 3.45 85.19 88.67 32.83 9.84
Gangaghat 3,528 2,718 1.72 6.07 149.60 155.71 57.65 17.28
Assuming all septic tanks are cleaned at least once in five years
Mughalsarai 1,312 1,011 0.64 2.26 55.64 57.92 21.44 6.43
Unnao 5,695 4,388 2.78 9.79 241.50 251.36 93.06 27.89
Gangaghat 6,384 4,919 3.12 10.98 270.75 281.80 104.33 31.27
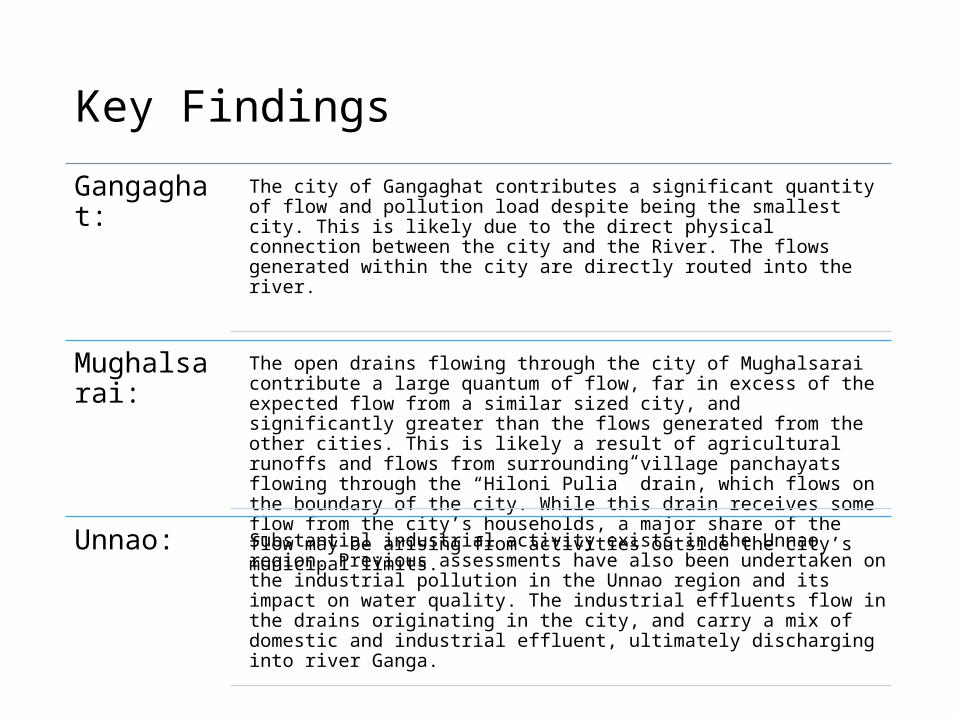
Key FindingsGangaghat: The city of Gangaghat contributes a significant quantity of flow and pollution load
despite being the smallest city. This is likely due to the direct physical connection between the city and the River. The flows generated within the city are directly routed into the river.
Mughalsarai: The open drains flowing through the city of Mughalsarai contribute a large quantum of flow, far in excess of the expected flow from a similar sized city, and significantly greater than the flows generated from the other cities. This is likely a result of agricultural runoffs and flows from surrounding village panchayats flowing through the “Hiloni Pulia” drain, which flows on the boundary of the city. While this drain receives some flow from the city’s households, a major share of the flow may be arising from activities outside the city’s municipal limits.
Unnao: Substantial industrial activity exists in the Unnao region. Previous assessments have also been undertaken on the industrial pollution in the Unnao region and its impact on water quality. The industrial effluents flow in the drains originating in the city, and carry a mix of domestic and industrial effluent, ultimately discharging into river Ganga.

Thank you!
Related Documents