
Welcome message from author
This document is posted to help you gain knowledge. Please leave a comment to let me know what you think about it! Share it to your friends and learn new things together.
Transcript


Onion 1
Introduction 1
Production and Yield 3
Seasonal Factors Resulting in Crop Loss 3
Problem of Plenty 4
Onion Consumption and Demand (Domestic) 4
Global Scenario and Exports from India 5
Farmers Interest versus Domestic Prices in Onions 7
Storage Issues 9
Potato 10
Potato- “The Food for Future” 10
Potato in India 11
Potato Prices & Arrivals Seasonality in India 13
Potato Prices in Consumption Center vs Producing Region 13
Potato Consumption in India 14
World Production of Potato 15
Key Thrust Areas which Needs to be Addressed 16
C o n t e n t s
O N I O N
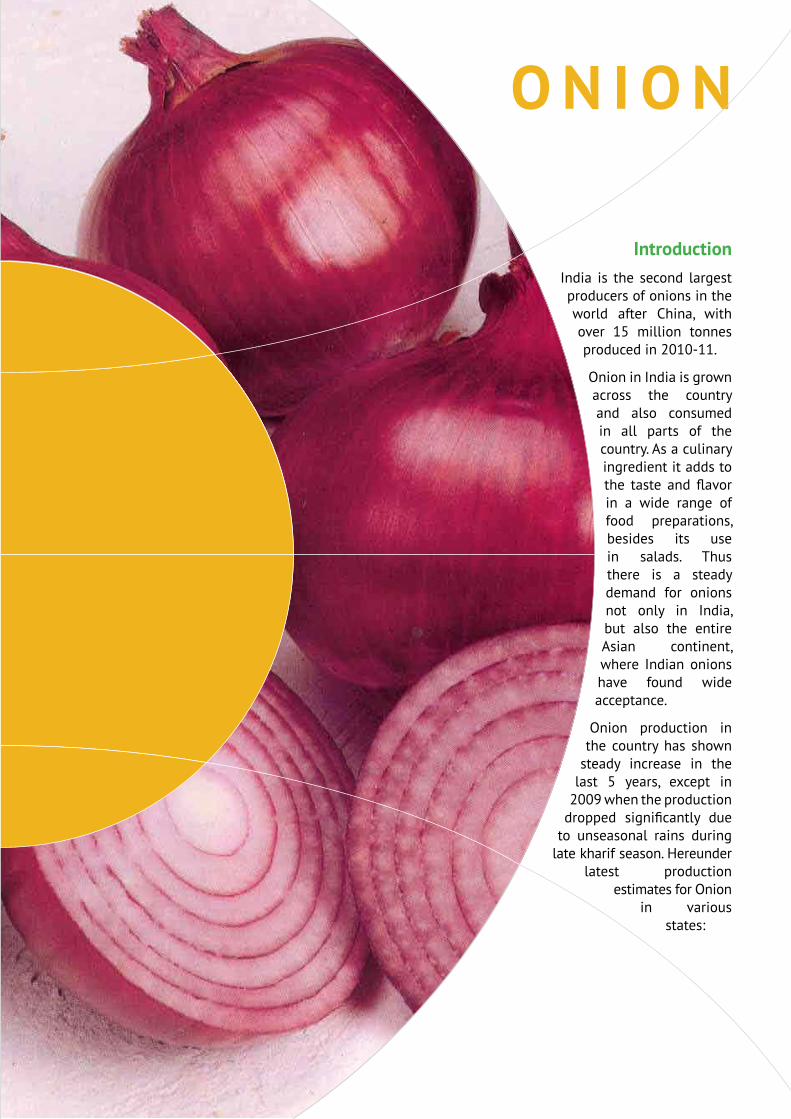
IntroductionIndia is the second largest producers of onions in the world after China, with over 15 million tonnes produced in 2010-11.
Onion in India is grown across the country and also consumed in all parts of the country. As a culinary ingredient it adds to the taste and flavor in a wide range of food preparations, besides its use in salads. Thus there is a steady demand for onions not only in India, but also the entire Asian continent, where Indian onions have found wide acceptance.
Onion production in the country has shown
steady increase in the last 5 years, except in
2009 when the production dropped significantly due
to unseasonal rains during late kharif season. Hereunder
latest production estimates for Onion
in various states:
MARKET INTELLIGENCE SYSTEM Baseline Data for POTATO & ONION | April 2012
2
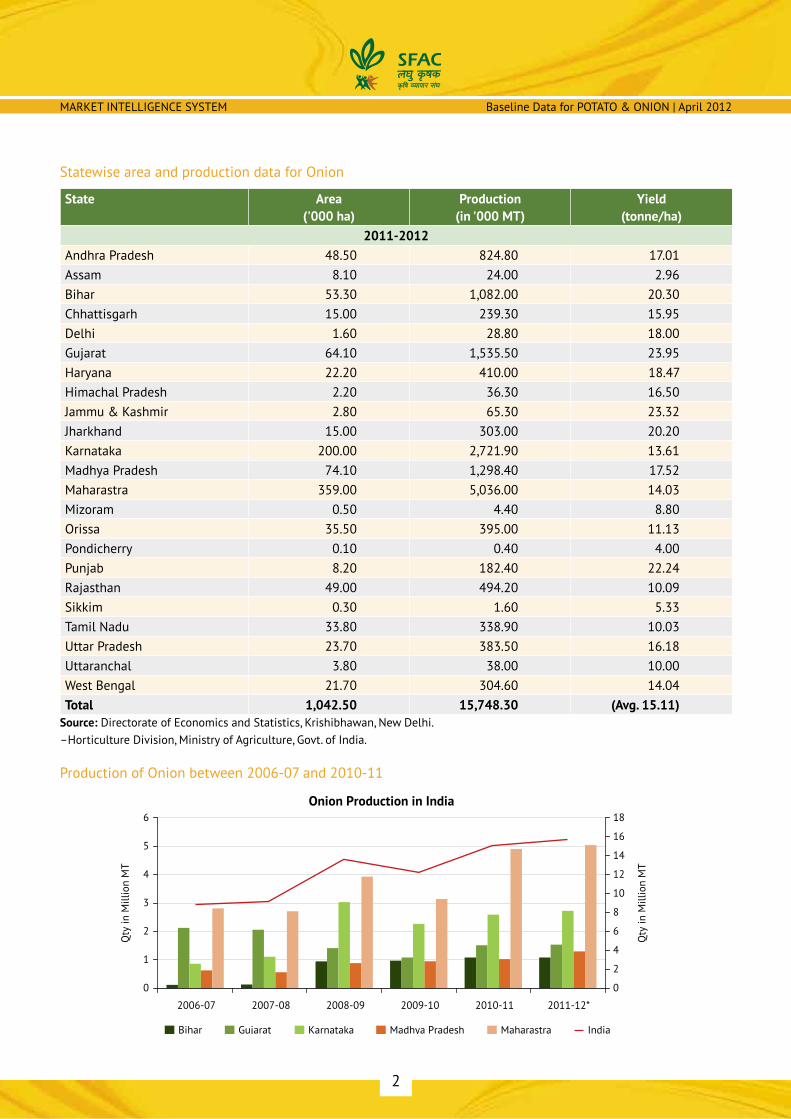
Statewise area and production data for Onion
State Area ('000 ha)
Production (in '000 MT)
Yield (tonne/ha)
2011-2012Andhra Pradesh 48.50 824.80 17.01Assam 8.10 24.00 2.96Bihar 53.30 1,082.00 20.30Chhattisgarh 15.00 239.30 15.95Delhi 1.60 28.80 18.00Gujarat 64.10 1,535.50 23.95Haryana 22.20 410.00 18.47Himachal Pradesh 2.20 36.30 16.50Jammu & Kashmir 2.80 65.30 23.32Jharkhand 15.00 303.00 20.20Karnataka 200.00 2,721.90 13.61Madhya Pradesh 74.10 1,298.40 17.52Maharastra 359.00 5,036.00 14.03Mizoram 0.50 4.40 8.80Orissa 35.50 395.00 11.13Pondicherry 0.10 0.40 4.00Punjab 8.20 182.40 22.24Rajasthan 49.00 494.20 10.09Sikkim 0.30 1.60 5.33Tamil Nadu 33.80 338.90 10.03Uttar Pradesh 23.70 383.50 16.18Uttaranchal 3.80 38.00 10.00West Bengal 21.70 304.60 14.04Total 1,042.50 15,748.30 (Avg. 15.11)
Source: Directorate of Economics and Statistics, Krishibhawan, New Delhi. –Horticulture Division, Ministry of Agriculture, Govt. of India.
Production of Onion between 2006-07 and 2010-11
0
2
4
6
8
10
12
14
16
18
0
1
2
3
4
5
6
2006-07 2007-08 2008-09 2009-10 2010-11 2011-12*
Qty
in M
illio
n M
T
Qty
in M
illio
n M
T
Onion Production in India
Bihar Gujarat Karnataka Madhya Pradesh Maharastra India

MARKET INTELLIGENCE SYSTEM ONION
3
Crop Year All India Production in Million MT2006-07 8.8852007-08 9.1382008-09 13.5882009-10 12.1912010-11 15.1172011-12* 15.748
Source: NHRDF *Estimated
Production and YieldThe key onion producing states of Maharashtra, Karnataka and Gujarat contribute over 50 percent of All India production, with Maharashtra alone accounting for over 30 percent of India’s onion production. The other significant contributors are M.P., Bihar, A.P. and Rajasthan. However yields vary from state to state and are often inconsistent except Gujarat, which has a better record on yield. Onion production in the country has shown steady increase in the last 5 years, except in 2009 when the production dropped significantly due to unseasonal rains during late kharif season. Onion production in 2006-07 season was 8.89 million tonnes which rose to 15.12 million tonnes in 2010-11 season and is further expected to increase in the current season to over 15.5 million tonnes.
On the yield front (as reported by FAO 2009), compared to Korean Republic at 66.67 MT/ha followed by USA with 56.56 MT/ha, Spain (53.53 MT/ha) and Netherland (48.81 MT/ha), China (22.21 MT/ha) average onion yield in India is just around 15-16 MT/ha although India is the second largest onion producer in the world. Thus there is a wide gap between yields obtained in India and other developed countries, reflecting the huge scope to increase yields in India. Non-availability of storable and high yielding quality seeds for all the three seasons coupled with sub-optimal standards of cultivation adopted by farmers, have been identified as the key reason for poor yields. In addition susceptibility to pests and diseases, lack of post-harvest facilities and policy support has contributed to sluggish growth in yield and production of onion in India. Notwithstanding the seed and cultivation related shortcoming in onion production, weather too has been responsible for crop losses and consequent drop in yields and production.
Seasonal Factors Resulting in Crop LossProduction of onions in India reflected a steady uptrend in the last six years except in the year 2009-10 when onion production dropped to 12.19 million tonnes from 13.59 million tonnes in the previous year, due to cyclone and unseasonal rains in Maharashtra, Gujarat and Karnataka accompanied by hailstorm in November 2009. Again during crop year 2010-11 unseasonal rains hit production of late kharif crop in the aforesaid key onion producing states, which resulted in skyrocketing onion prices due to temporary shortages across the country. In the earlier years prior to 2006, it has been reported that abnormal weather resulted in crop losses during rabi 1997, kharif 1998 and kharif 2005.
Had it not been for the smaller size of kharif onion crop, the losses would have been even higher. The component of kharif and rabi onion crop is as under:
Kharif/Early Kharif 20 Percent
Late Kharif 20 Percent
Rabi 60 Percent

MARKET INTELLIGENCE SYSTEM Baseline Data for POTATO & ONION | April 2012
4
The following table will give a better idea of Onion Seasons in India
S. No. Seasons Time of Sowing Time of Transplanting Time of Harvesting1 Maharashtra and some
parts of Gujarat1. Kharif2. Early Rabi or late Kharif3. Rabi
May-JuneAug-SeptOct-Nov
July-AugSept-OctDec-Jan
Sep-DecJan-MarApr-May
2 Tamil Nadu/Karnataka/A.P.1. Early Kharif2. Kharif3. Rabi
Mar-AprMay-JuneSept-Oct
Apr-MayJuly-AugNov-Dec
July-AugOct-NovMar-Apr
3 Rajasthan/Haryana/Punjab/Uttar Pradesh and Bihar1. Kharif2. Rabi
May-JuneOct-Nov
July-AugDec-Jan
Nov-DecMay-June
4 West Bengal and Orissa1. Kharif2. Late Kharif
June-JulyAug-Sept
Aug-SeptOct-Dec
Nov-DecFeb-Mar
5 Hills1. Rabi2. Summer (long day type)
Sept-OctNov-Dec
Oct-NovFeb-Mar
June-JulyAug-Sept
Problem of PlentyEarly production estimates in onion tend to be misleading, as these are based on nursery stage estimates. Further acreage and yields are subject to changes, hence it has been found in the past that there is a pressing need to check/cross check acreage and adopt more reliable yield estimates. This will go a long way in formulating guidelines and policies concerning domestic price support operations and exports.
It is now estimated that 2011-12 production is likely to go up to 15.50-15.75 million tonnes (MMT) from 15.14 MMT (first nursery estimate in 2011), as compared to 15.17 MMT during 2010-11. While Maharashtra seems to be heading for a record production in 2011-12, onion production in Gujarat and Karnataka are reportedly lower compared to last year, mainly due to decline in Kharif crop. Major rabi crop across the country is harvested from March onwards and continues till June/July and accordingly the arrival pressure in the coming 2-3 months will be strong, in view of the higher rabi production.
Thus in the current year, based on the present/emerging scenario it appears that onion production would exceed domestic needs and consequently prices are likely to be under pressure.
Onion Consumption and Demand (Domestic)Consumption of onion in India is subject to fluctuation on account of religious considerations. A section of the society avoids onions totally and a few others leave out onion from their daily diet during observance of religious occasions (Navaratras/Pitru Paksh). Table consumption of onions tends to decline when other fresh vegetables like carrot, radish and cucumber are available at affordable prices. Thus during winter, onion consumption in North India is comparatively lower.

MARKET INTELLIGENCE SYSTEM ONION
5
I. In the absence of reliable survey based consumption estimates for Onion, we have to rely on NSSO based total annual household consumption and estimated indirect demand from all other users including wastage. Thus there is a demand potential of 15.7 MMT as under:
Total Annual Consumption (Household) for 2009-10 11.00 MMT
Indirect demand (assumed at 30% of total consumption) 4.71 MMT
Total: 15.71 MMT
II. Given the fact that exports range between 1.5 to 2 MMT, we are of the opinion that actual household consumption demand is not more than 9 MMT currently and indirect demand is around 3.5 MMT. In other words the present demand for onion in the country can be indicatively considered as under:
Total Annual Consumption (Household) 2011-12 9.00 MMT
Indirect demand 3.50 MMT
Export demand 2.00 MMT
Total: 14.50 MMT
We would like to hasten here that a more precise consumption estimate will be helpful in tackling price volatility and determining surplus availability for exports. It has been found that onion exports and domestic prices are a subject of intense speculation with various related issues surrounding Market support operations, MEP on exports, etc. and these are sought to be handled on ad-hoc basis.
Global Scenario and Exports from India
Major Onion Producing Countries
China
India
USA
Turkey
Egypt
Pakistan
Russian Fed.
Iran
Brazil
Netherlands
Spain
Rep. of Korea
Mexico
Japan
Myanmar
Algeria Source: FAO (2009)
With over 70 million tonnes onions produced globally, China occupies the first position accounting for over 25 percent of total production, followed by India contributing around 20 percent of world onion production. However India leads the list of exporters of onion followed by Netherlands. Netherlands has traditionally dominated global trade in onions and is having a strong hold over the European market for onions, which are basically white/yellow varieties that are less pungent.

MARKET INTELLIGENCE SYSTEM Baseline Data for POTATO & ONION | April 2012
6
Destination-wise Onion exports from India – 2008-09 to 2010-11
Country 2008-2009 2009-2010 2010-2011Qty. in MT Value* Qty. in MT Value* Qty. in MT Value*
Dubai/UAE 199492 24912.66 159294 20748.78 139199 19318.46Sharjah/Abu Dhabi 4559 489.86 128 18.58 91 25.09Bahrain/Jeddah 20191 2619.77 15080 2244.33 11660 1744.49Dammam 18231 2191.81 14497 2344.03 11657 1672.3Doha 22465 2724.13 19099 2693.77 20624 3091.36Kuwait 21142 2714.03 13762 1924.96 18394 2824.22Muscat 11353 1271.52 8387 1151.58 18645 2650.4Re Union 6550 1324.08 4842 1088.28 3553 758.91Seychelles 1092 218.95 844 228.86 962 225.47Singapore 27387 3468.62 27153 4033.96 24152 3751.91Malaysia 279515 35171.72 320616 47653.96 293790 55860.29Sri Lanka 165401 20563.72 137618 22770.16 130919 20799.6Bangladesh 722359 88194.43 916118 141418.68 488930 71931.35Nepal 33987 2963.42 37562 5805.1 31266 4403.34Maldives 6274 1161.94 6103 1287.38 5023 1199.71Philipines 23987 4139.2 16241 3781.65 1886 517.87Mauritius 11017 2306.03 13782 3138.97 6535 1418.41Pakistan 169918 21045.1 104637 11168.36 49992 6092.14Greece 1468 375.64 1121 214.31China/Hongkong 92 12.93 6694 1096.45 3639 707.53Brunie 2021 524.1 2337 545.5 1875 656.37Indonesia 9388 1394.83 8678 1395.12 40087 9452.65Italy 2160 400.62 3673 933.35 2055 462.31Jebel Ali Vietnam 2152 378.41 15162 2350.55UK 12020 2146.48 2279 677.64 2127 551.54Oman 8047 891.64 2932 374.35Iran 1007 129.24 12684 1883.75 5221 855.64Others 11672 2223.06 9227 1749.29 9248 2000.51Total 1783280 224312.25 1873002 283428.18 1340745 215911.08
Source: All STEs *` in Lakhs
Bangladesh, Malaysia and Sri Lanka form the largest block for Indian onion exports, followed by Arabian Gulf countries. Indian onions are preferred in these destinations for the pungency and extensive usage in daily food preparations. Price is not a critical issue as they continue to buy all through the year at prices ranging from US$ 125 pmt to US$ 500+ pmt FOB.
While Indian government might think that higher MEP could moderate exports and thereby cool domestic prices, it has been observed that exports are driven by
Demand from importing countries – In this regard a casual look at the per unit value realization • shows that exports tend to increase notwithstanding higher FOB levels. Thus even when per unit value realization is over US$ 500 pmt exports were brisk. Whereas now the MEP is US$ 125 pmt exports are sluggish.

MARKET INTELLIGENCE SYSTEM ONION
7
During the last four years, exports during the month of March have been comparatively higher and • likewise in three years out of last four years exports during month of July have been higher. It is interesting to note that export volume has little co-relation to domestic prices. Nevertheless when domestic prices are higher, exports do fetch a higher unit value realization.
Buyers are willing to pay higher prices year after year, as Indian onions are well received in the • destination markets for their taste, color and size. In fact Indian onions command a premium over Pakistani and Chinese produce.
Soil, Climate and Geographic factors in the onion belt of Maharashtra have bestowed unique • advantage for Indian onions in export market. Hence demand for Indian produce will continue to flourish but we have to sharpen our preparedness for capitalizing on global opportunities for better price realization and greater market share.
Onions produced in Gujarat, besides Bengaluru Rose and Krishnapuram varieties are also being • exported regularly.
Instead of focusing on MEP, Government should gather market intelligence on our competitors’ position in the global markets – In Asia, China and Pakistan are the main competitors and unless we have definite idea about their surplus and daily prices, India cannot take advantage of the emerging scenario in the global markets.
Hence we need to have sound market intelligence/data on Pakistani and Chinese production, FOB • prices, etc.
Indian Onions are quite well known in the Asian markets and exporters too are well equipped to • tap the potential. However, we have to gear ourselves to serve European markets in terms of quality, packing, taste preferences, etc.
It is also believed that Indian onions find their way to European markets through Dubai where they • are repacked as per destination market needs.
From export point of view, kharif onions from India are not export worthy. Hence our competitors get an opportunity to grab a share of the market during the time of shortage of quality Indian onions i.e. during non-availability of Rabi/Nasik origin produce. Government should look into this aspect and ensure that producers of quality onions get a fair price, as they are in demand globally.
There is a niche market for white/yellow onions from Gujarat and some South Indian varieties, which are also exported.
From export point of view it is important to know the production of quality (export worthy) onions in Maharashtra, stocks lying with resourceful farmers, stockists and exporters, then take an informed view on restrictions if any are required.
India has a natural advantage in the production and export of onions which needs to be strategically improved, so that the country can increase its share in the global market.
Farmers Interest versus Domestic Prices in OnionsOnion farmers have demonstrated their capability to increase production year after year. However onion prices have been highly volatile and more recently the prices have been sluggish. This has resulted in MSAMB seeking price support.
In view of the huge rabi onion production in Maharashtra State in the current season, Maharashtra State Agricultural Marketing Board (MSAMB) is seeking central government assistance to implement price support
MARKET INTELLIGENCE SYSTEM Baseline Data for POTATO & ONION | April 2012
8
operations, which will ensure a fair price to farmers and stem distress sale by farmers. A pragmatic view and a pro-active policy in this situation will go a long way in ensuring a robust onion economy.
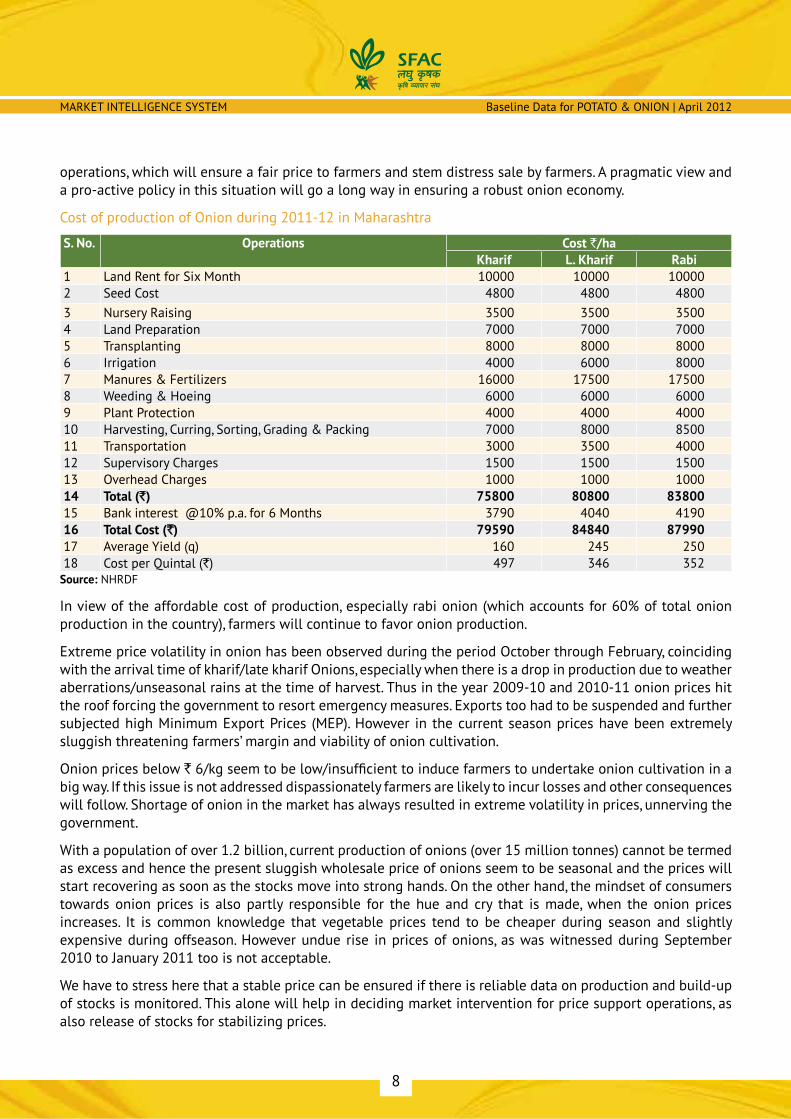
Cost of production of Onion during 2011-12 in Maharashtra
S. No. Operations Cost `/haKharif L. Kharif Rabi
1 Land Rent for Six Month 10000 10000 100002 Seed Cost 4800 4800 48003 Nursery Raising 3500 3500 35004 Land Preparation 7000 7000 70005 Transplanting 8000 8000 80006 Irrigation 4000 6000 80007 Manures & Fertilizers 16000 17500 175008 Weeding & Hoeing 6000 6000 60009 Plant Protection 4000 4000 400010 Harvesting, Curring, Sorting, Grading & Packing 7000 8000 850011 Transportation 3000 3500 400012 Supervisory Charges 1500 1500 150013 Overhead Charges 1000 1000 100014 Total (`) 75800 80800 8380015 Bank interest @10% p.a. for 6 Months 3790 4040 419016 Total Cost (`) 79590 84840 8799017 Average Yield (q) 160 245 25018 Cost per Quintal (`) 497 346 352
Source: NHRDF
In view of the affordable cost of production, especially rabi onion (which accounts for 60% of total onion production in the country), farmers will continue to favor onion production.
Extreme price volatility in onion has been observed during the period October through February, coinciding with the arrival time of kharif/late kharif Onions, especially when there is a drop in production due to weather aberrations/unseasonal rains at the time of harvest. Thus in the year 2009-10 and 2010-11 onion prices hit the roof forcing the government to resort emergency measures. Exports too had to be suspended and further subjected high Minimum Export Prices (MEP). However in the current season prices have been extremely sluggish threatening farmers’ margin and viability of onion cultivation.
Onion prices below ` 6/kg seem to be low/insufficient to induce farmers to undertake onion cultivation in a big way. If this issue is not addressed dispassionately farmers are likely to incur losses and other consequences will follow. Shortage of onion in the market has always resulted in extreme volatility in prices, unnerving the government.
With a population of over 1.2 billion, current production of onions (over 15 million tonnes) cannot be termed as excess and hence the present sluggish wholesale price of onions seem to be seasonal and the prices will start recovering as soon as the stocks move into strong hands. On the other hand, the mindset of consumers towards onion prices is also partly responsible for the hue and cry that is made, when the onion prices increases. It is common knowledge that vegetable prices tend to be cheaper during season and slightly expensive during offseason. However undue rise in prices of onions, as was witnessed during September 2010 to January 2011 too is not acceptable.
We have to stress here that a stable price can be ensured if there is reliable data on production and build-up of stocks is monitored. This alone will help in deciding market intervention for price support operations, as also release of stocks for stabilizing prices.

MARKET INTELLIGENCE SYSTEM ONION
9
Both Maharashtra government and the Central Government are unable to quickly address the situation, with the result farmers in Maharashtra are threatening to resort to agitation if the government is unable to ensure a fair price to the farmers.
Of late we come across farmers selling directly to retail chains and F&V outlets like Mother Dairy. While this will help in better price realization for farmers, traditional marketing channels still dominate onion distribution across the country.
Storage IssuesCold storage in onion is not a common practice in India, due to prohibitively high costs and technical feasibility. Considering the low prices of onions, expensive storage models will threaten viability and hence the need for cheap and efficient storage structures. This way rabi onions can be stored conveniently during the period May/June to October.
Wholesale rates of Onion in Nasik (`/Qtl) – 2008-09 to 2011-12
0
500
1000
1500
2000
2500
3000
3500
April
May
June July
Augu
st
Sept
embe
r
Oct
ober
Nov
embe
r
Dec
embe
r
Janu
ary
Febr
uary
Mar
ch
2008-09 2009-10 2010-11 2011-12
Onion arrivals in Nasik during 2008-09 through 2011-12(In Quintals)
0
April
May
June July
Augu
st
Sept
embe
r
Oct
ober
Nov
embe
r
Dec
embe
r
Janu
ary
Febr
uary
Mar
ch
2008-09 2009-10 2010-11 2011-12
200000
400000
600000
800000
1000000
1200000
1400000
1600000

POTATOPotato-
“The Food for Future”The potato is the third most
important food crop in the world after rice and wheat which is
consumed by more than a billion people worldwide. Both potato production and consumption are accelerating in most of the developing countries including India and it is expected that the trend will continue for the years to come. The two emerging Asian economies, viz. China and India together contribute nearly 1/3rd of the global potato production today. Potato is preferred in these densely populated countries largely because of its high productivity, flexibility in terms of fitting into many prevailing cropping
systems, and stable yields under conditions
in which other crops may fail. Potato
consumption in this region is increasing due to
increasing industrialization and participation of women
in the job market that created demand for processed, ready-to-
eat convenience food, particularly in urban areas. Keeping in view
the potential of potato in the food security of developing nations, FAO
has declared it as the “food for future”.

11
MARKET INTELLIGENCE SYSTEM POTATO
Potato in IndiaPotato in India is considered as vegetable item not as staple food. The per capita consumption of Potato in India is far below many of the developed nations. In fact, China has identified potato as the key crop from which 50% of its extra food demand during next 20 years will be met (http://www.cipotato.org/press-room/press- releases/feeding-the-future).
Potato in India is cultivated in approx 18-19 lakh hectare which is around 1.25% of total cultivable area in India. It contributed around 2.42% of agricultural GDP in 2008 from 1.25% cultivable area. Among the vegetables segment, the share of potato is estimated to be approx 26%. The below chart shows the production, Area and Yield trends of Potato in India:
145150155
165170175
185190195200
500
1000
2000
2500
3000
3500
4000
2000 2001 2002 2003 2004 2005 2006 2007 2008 2009
Yiel
d
Area
, Pro
duct
ion
Potato-Area, Prod and Yield
Yield (Qtl/ha) Production (’0000 tonnes)Area (’000 ha)
1500
180
160
Source: NHB
Production of potato has increased in the last ten years due to increase in area under cultivation. The yield is more or less static except in year 2003 and 2007 when it decreased substantially due to abrupt weather condition during tuber formations and untimely rain in producing regions. The continuous growth in acreage is not possible, India has to improve its productivity to cater the demand and stable productions. After every 3rd year a dip in yield is seen which severely impacts the demand and supply balance sheet of Potato the very next year.
Although potatoes are widely grown in India, the climatic variations across the country determine its distribution and cropping patterns. More than 80 per cent of the potato crop is raised in the winter Season (Rabi) under assured irrigation during short winter days from October to March. Generally one crop is grown in this belt during winter, planted from late October to early November and harvested in January through February. However, in UP and in some of the eastern states farmers go for two crops in succession, the first during September to November-December, and the second from November to March. The major producing states and their production share during year 2010-11 is shown in adjacent graph.
12
MARKET INTELLIGENCE SYSTEM Baseline Data for POTATO & ONION | April 2012
16%
Potato Production Share in 2010-11
3%
6%
15%
23%
37%
Uttar Pradesh West Bengal BiharPunjab Gujarat Others
2006-07 2007-08 2008-092009-10 2010-11
5
10
15
20
25
30
35
Yiel
d in
(ton
nes/
ha)
Uttar Pradesh
West Bengal
Bihar PunjabGujarat
Potato Yield in India
Source: Agriwatch
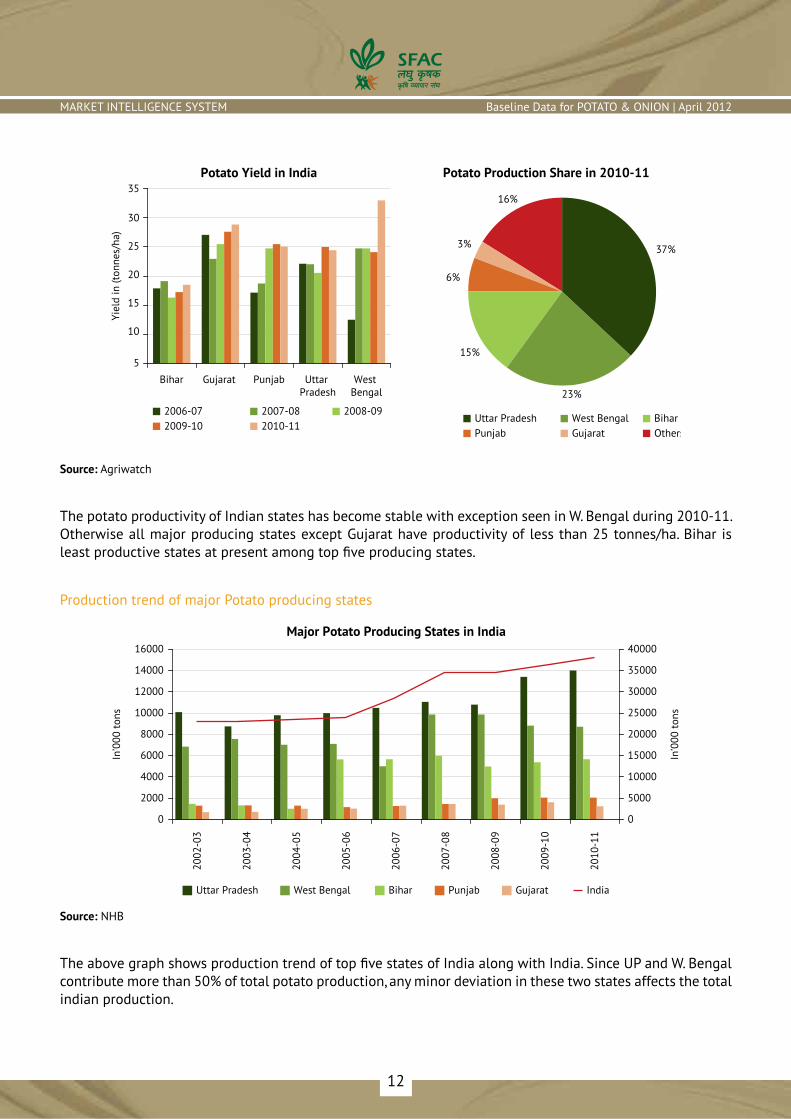
The potato productivity of Indian states has become stable with exception seen in W. Bengal during 2010-11. Otherwise all major producing states except Gujarat have productivity of less than 25 tonnes/ha. Bihar is least productive states at present among top five producing states.
Production trend of major Potato producing states
0
5000
10000
15000
20000
25000
30000
35000
40000
In’0
00 to
ns
In’0
00 to
ns
Major Potato Producing States in India
0
2000
6000
10000
12000
14000
16000
2002
-03
2003
-04
2004
-05
2005
-06
2006
-07
2007
-08
2008
-09
2009
-10
2010
-11
4000
8000
Uttar Pradesh West Bengal Bihar Punjab Gujarat India
Source: NHB
The above graph shows production trend of top five states of India along with India. Since UP and W. Bengal contribute more than 50% of total potato production, any minor deviation in these two states affects the total indian production.

13
MARKET INTELLIGENCE SYSTEM POTATO
Major Potato varieties in India & its suitability
Potato Variety Average Yield (tonne/ha) Crop Duration (Days) SuitabilityKufri Sinduri 40 110-120 ProcessingKufri Chandramukhi 25 80-90 Flakes & ChiptsKufri Jyoti 20 80-90 ProcessingKufri Laukar 30 75-80 ProcessingKufri Badshah 50 100-110 Table ConsumptionKufri Bahar 45 100-110 Table ConsumptionKufri Lalima 40 100-110 Table ConsumptionKufri Jawahar 40 80-90 Table ConsumptionKufri Satlej 40 90-100 Table ConsumptionKufri Ashoka 40 70-80 Table ConsumptionKufri Pukhraj 40 70-90 Table ConsumptionKufri Chipsona-1 40 90-110 Chips & French FriesKufri Chipsona-2 35 90-110 Chips & French FriesKufri Anand 35-40 100-110 French Fries
Potato Prices & Arrivals Seasonality in IndiaThe following table shows the potato prices and arrivals seasonality in metro cities and major producing center:
0
200
400
600
800
1200
1000
1400
Pric
e (`
/Qtl
)
Potato Price Seasonality at Agra Mandi
Janu
ary
Febr
uary
Mar
ch
April
May
June July
Augu
st
Sept
embe
r
Oct
ober
Nov
embe
r
Dec
embe
r
2009 2010 2011 3-years Average
Janu
ary
Febr
uary
Mar
ch
May
June July
Augu
st
Sept
embe
r
Oct
ober
Nov
embe
r
Dec
embe
r
05000
10000
2000025000
4000035000
15000
30000
45000
Arriv
als
in Q
tls
Potato Arrivals Seasonality in Agra Mandi
2009 2010 2011 3-years Average
Source: Agriwatch Research, NHRDF
The above adjacent charts show the co-relation between price and arrivals of Potato. Prices start increasing from Feb month onwards as harvesting season comes to an end in UP and Punjab. From April to October, potato kept in cold stores comes to market at higher prices. During peak arrival period, Farmers and Traders store potatoes in anticipation of selling at higher price during lean season of April to October.
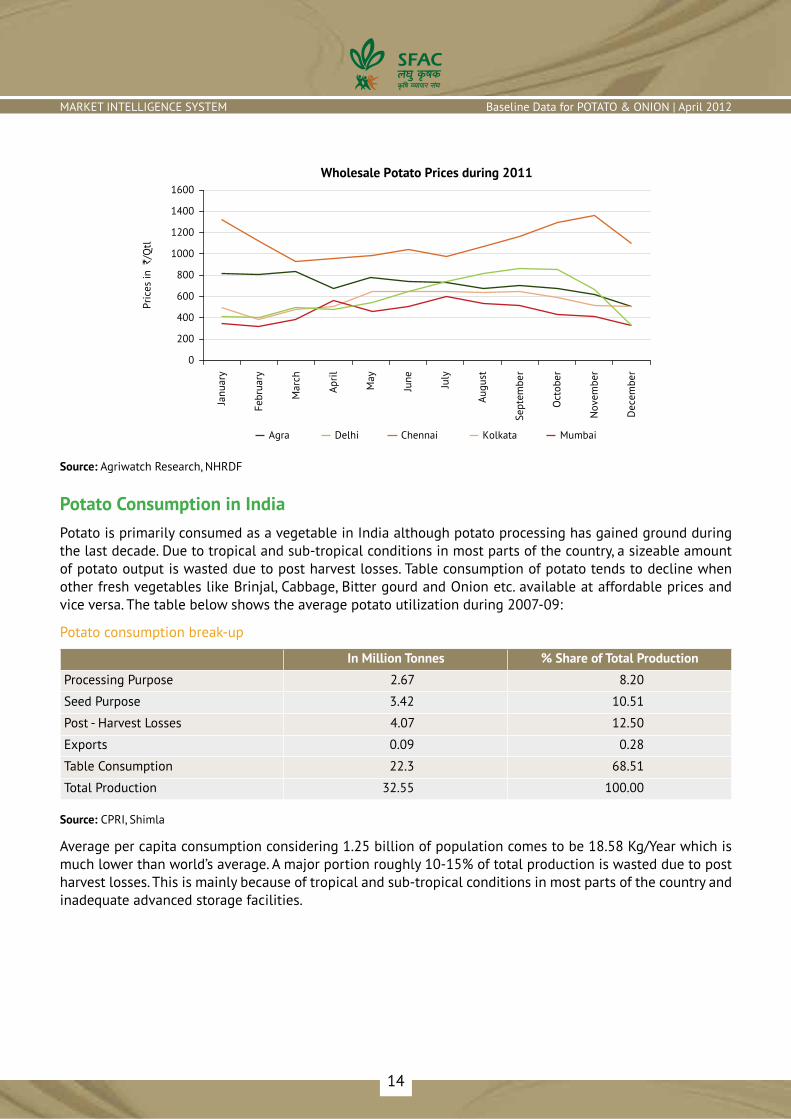
Potato Prices in Consumption Center vs Producing RegionThe below graph show the monthly average prices during year 2011 in four metro cities of India and Agra. The potato prices and its fluctuation is more in Chennai due to its distant location from producing region like UP and West Bengal.
14
MARKET INTELLIGENCE SYSTEM Baseline Data for POTATO & ONION | April 2012
Pric
es in
`/Q
tl
Wholesale Potato Prices during 2011
0
200
600
1000
1200
1400
1600
400
800
Janu
ary
Febr
uary
Mar
ch
April
May
June July
Augu
st
Sept
embe
r
Oct
ober
Nov
embe
r
Dec
embe
r
Agra Delhi Chennai Kolkata Mumbai
Source: Agriwatch Research, NHRDF
Potato Consumption in IndiaPotato is primarily consumed as a vegetable in India although potato processing has gained ground during the last decade. Due to tropical and sub-tropical conditions in most parts of the country, a sizeable amount of potato output is wasted due to post harvest losses. Table consumption of potato tends to decline when other fresh vegetables like Brinjal, Cabbage, Bitter gourd and Onion etc. available at affordable prices and vice versa. The table below shows the average potato utilization during 2007-09:
Potato consumption break-up
In Million Tonnes % Share of Total Production
Processing Purpose 2.67 8.20
Seed Purpose 3.42 10.51
Post - Harvest Losses 4.07 12.50
Exports 0.09 0.28
Table Consumption 22.3 68.51
Total Production 32.55 100.00
Source: CPRI, Shimla
Average per capita consumption considering 1.25 billion of population comes to be 18.58 Kg/Year which is much lower than world’s average. A major portion roughly 10-15% of total production is wasted due to post harvest losses. This is mainly because of tropical and sub-tropical conditions in most parts of the country and inadequate advanced storage facilities.
15
MARKET INTELLIGENCE SYSTEM POTATO
The below table shows the Potato Cold storage capacity and Production in major potato producing states:
Potato Production vs Cold Storage Capacities
States No. of Cold Stores Total Capacity (in MT) as on 31/12/2009
Potato Production in 2010-11 (in MT)
% Storage Capacity to Production
Bihar 228 1069841 5748000 18.61Gujarat 213 967000 1881800 51.39Orissa 39 139630 191400 72.95Punjab 344 1097609 2088000 52.57Rajasthan 19 65896 75700 87.05Uttar Pradesh 1286 8719533 13576000 64.23West Bengal 402 5460000 13391000 40.77
Source: Directorate of Marketing & Inspection and NHB
In the absence of storage capacities prices fluctuates throughout the year. Sometimes, prices fall below the cost of production during peak harvesting season of Dec-Feb and reaches peak during lean season. This forces small farmers into distress sales and losses. The small growers cannot take benefit of cold storages. Yearly prices fluctuation is visible in below weekly price chart of Potato at Agra Mandi.
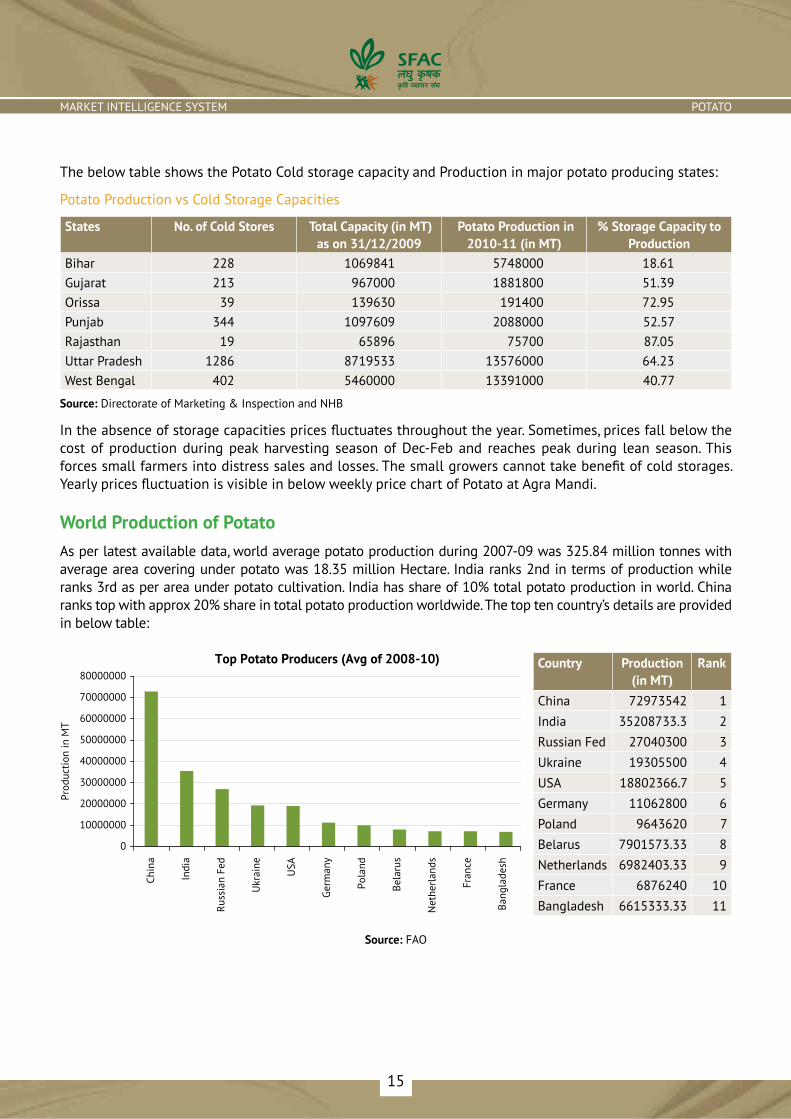
World Production of PotatoAs per latest available data, world average potato production during 2007-09 was 325.84 million tonnes with average area covering under potato was 18.35 million Hectare. India ranks 2nd in terms of production while ranks 3rd as per area under potato cultivation. India has share of 10% total potato production in world. China ranks top with approx 20% share in total potato production worldwide. The top ten country’s details are provided in below table:
Country Production (in MT)
Rank
China 72973542 1India 35208733.3 2Russian Fed 27040300 3Ukraine 19305500 4USA 18802366.7 5Germany 11062800 6Poland 9643620 7Belarus 7901573.33 8Netherlands 6982403.33 9France 6876240 10Bangladesh 6615333.33 11
Prod
uctio
n in
MT
Top Potato Producers (Avg of 2008-10)
0
10000000
30000000
50000000
60000000
70000000
80000000
20000000
40000000
Chin
a
Indi
a
Russ
ian
Fed
Ukr
aine
USA
Germ
any
Pola
nd
Bela
rus
Net
herl
ands
Fran
ce
Bang
lade
sh
Source: FAO

16
MARKET INTELLIGENCE SYSTEM Baseline Data for POTATO & ONION | April 2012
Potato yield (Qtl/ha) of top four Potato producing nations
Country 2005 2006 2007 2008 2009 Last 3 Years Average
China 128.24 146.28 147.57 145.31 146.39 146.42India 185.92 164.1 193.08 188.13 181.77 187.66Russian Fed 130.21 128.99 137.23 142.66 136.3 138.73USA 440.95 444.34 444.37 462.73 450.48 452.53
Though productivity of India is better than other top producers like China, Russian Federation and Ukraine, it is less than half of USA and major European countries. One of the reasons of getting poor productivity by subsistence farmers is the use of locally produced degenerated seed and non-adoption of modern agro-techniques. Making available certified healthy seed coupled with appropriate agro-techniques will immediately improve productivity.
Key Thrust Areas which Needs to be AddressedConsidering the importance of Potato in Indian agriculture and its ability to address the food security issue, following measures are required for sustainable potato production:
Improving productivity through high quality seeds.•
Development of advanced varieties with high yielding capacities and can sustain weather vagaries.•
Increasing the storage capacities through energy-efficient cold storages.•
Facilitating soft-loans to small farmers and crop insurance at nominal cost.•
Improving the supply chain through proper monitoring at each stage.•
DisclaimerThe information contained in this document has been compiled by Agriwatch from sources believed to be reliable, such as NHB, Agmarknet, etc. and directly from traders in mandis. However, users of this data are requested to use the information with due caution and crosscheck with other sources. This document is not, and should not be construed as an offer to sell or buy any commodities. This document may not be reproduced, distributed or published without the express consent of SFAC.


SMALL FARMERS’ AGRIBUSINESS CONSORTIUMNCUI Auditorium Building, 5th Floor, 3 Siri Institutional Area
August Kranti Marg, Hauz Khas, New Delhi - 110016Tel: (011) 26862365, 26966017 | Fax: (011) 26862367
Email: [email protected], [email protected] | Web: www.sfacindia.com
Report Produced by:
INdIAN AGRIBUSINESS SySTEMS PvT. LTd.H-128, First Floor, Sector 63, Noida - 201 301, IndiaTel: (0120) 4618100 | Fax: (0120) 4618118
Email: [email protected]: www.agriwatch.com
Report Compiled by:
Related Documents


