BARRIERS TO ENTRY IN THE AIRLINE INDUSTRY: A MULTIDIMENSIONAL REGRESSION-DISCONTINUITY ANALYSIS OF AIR-21 Connan Snider and Jonathan W. Williams* Abstract—We investigate the success of legislation aimed at increasing competition at highly concentrated U.S. airports, mainly by forcing these airports to increase the availability of scarce facilities. We use a multidimen- sional regression-discontinuity approach to exploit a sharp discontinuity in the law’s implementation and identify its effects. We find that fares decrease by 13.4% (20.2%) in markets with one (both) end point(s) covered. Approx- imately half of the decline is driven by the entry of low-cost carriers. We find little evidence that the fare declines were accompanied by a dimin- ished quality of service, and passenger volumes increased, which suggests the legislation improved consumer welfare. I. Introduction O NE of the most enduring features of the postderegula- tion U.S. airline industry has been the hub premium— the premium over average fares paid by passengers traveling to and from airports dominated by a single large hub car- rier. Though this phenomenon has been widely documented (Borenstein, 1989), its causes and consequences are still in question. To the extent that higher fares result from the exercise of market power, they are detrimental to consumer welfare and efficiency. However, there is substantial evidence that consumers value the large route network and high fre- quencies that dominant carriers often provide (Berry, 1990). To the extent that high prices derive from these quality factors, they benefit consumers. Airport facilities, a necessary input for the provision of air service, are increasingly scarce due in large part to government regulation handicapping their’ abil- ity to finance facilities expansion in response to increasing demand. As a consequence of this increased scarcity, airport- level concentration and market power go hand-in-hand with the airline scope and scale that consumers value and drive down costs. Given this, the relative contribution, and the optimality of the balance, of these factors is an empirical question. In 2000, the U.S. Congress enacted the Wendell H. Ford Aviation Investment and Reform Act for the 21st Century (AIR-21). A primary directive of the bill was to require air- ports, above a given level of concentration, to take concrete steps to ensure that new entrants had ample access to airport Received for publication March 25, 2013. Revision accepted for publica- tion February 13, 2014. Editor: Philippe Aghion. * Snider: UCLA; Williams: University of North Carolina. This paper has benefited from discussions with Severin Borenstein, Jan Brueckner, Dennis Carlton, Federico Ciliberto, Alon Eizenburg, Silke Forbes, Alfred Galichon, Mara Lederman, Yehua Li, Nancy Rose, Nick Rupp, Stephen Ryan, and Steven Stern. Seminar participants at Clemson University, London Business School, NYU, the Sauder School at the Uni- versity of British Columbia, and UCLA, as well as conference participants at the 2010 IIOC and 2011 NBER IO Summer Institute, provided valuable comments. We are grateful to Sharon Glasgow and Andrea Toney of the FAA, as well as Liying Gu, Deborah McElroy, and A. J. Muldoon of the ACI-NA for assistance in collecting the data for this project and providing valuable industry insight. All remaining errors are our own. A supplemental appendix is available online at http://www.mitpress journals.org/doi/suppl/10.1162/REST_a_00455. facilities. 1 Airport compliance requires filing a Competition Plan with the Federal Aviation Administration (FAA), detail- ing the steps taken. The Federal Aeronautics Administration then reviews the plan and releases federal funding contingent on a satisfactory plan. In this paper we empirically evaluate the impact of AIR-21 on prices, passenger volumes, quality, and market structure to investigate the importance of access to airport facilities as barriers to entry in the airline industry. The nature of the implementation of AIR-21 is useful for solving identi- fication problems common in industrial organization studies of competition and market structure and present in our con- text. The problem is that elements of market structure (e.g., concentration, low-cost carrier presence) are determined simultaneously with the level of competition and usually depend on common, market-specific unobserved factors (e.g., demand elasticities or network economies associated with airport geography). We use the design of AIR-21 to formu- late a differences in differences (diff-in-diff) and regression discontinuity (RD) solution to these problems. We first argue that the AIR-21 mandates were enforced and effectively reduced barriers to entry at covered airports. This generates rarely available variation, with a plausibly known direction, over time in barriers to entry within markets. This allows us to control for time-invariant, market-specific factors using standard panel techniques. Second, having con- temporaneous treatment and control groups allows us to use diff-in-diff to address aggregate and market-specific variation in these factors over time. There are still likely to be selection problems associated with using the full sample for identification. Berry and Jia (2010), observing lower fares and diminished carrier profit margins between the end of the 1990s and the mid-2000s, esti- mate discrete choice demand systems separately for 1997 and 2005 and conclude that increased passenger price sensitiv- ity, combined with increased penetration of low-cost carriers, was responsible for the change. Since airport concentration itself is likely highly correlated with product quality, the time- varying relative valuations of quality found by Berry and Jia (2010) likely interact with our determinant of treatment. This causes differing average trends for treated and untreated mar- kets, invalidating the simple diff-in-diff approach. We solve this and any similar such problems by arguing that while there is likely a selection problem associated with highly con- centrated airports, there is no such problem locally around the 50% two-carrier concentration level specified by AIR- 21. This allows us to develop an RD estimator for the local average treatment effects associated with AIR-21. Essentially 1 The law applied to airports in which the top two airlines accounted for over 50% of total enplanements at the airport. The Review of Economics and Statistics, December 2015, 97(5): 1002–1022 © 2015 by the President and Fellows of Harvard College and the Massachusetts Institute of Technology doi:10.1162/REST_a_00455

Welcome message from author
This document is posted to help you gain knowledge. Please leave a comment to let me know what you think about it! Share it to your friends and learn new things together.
Transcript

BARRIERS TO ENTRY IN THE AIRLINE INDUSTRY: A MULTIDIMENSIONALREGRESSION-DISCONTINUITY ANALYSIS OF AIR-21
Connan Snider and Jonathan W. Williams*
Abstract—We investigate the success of legislation aimed at increasingcompetition at highly concentrated U.S. airports, mainly by forcing theseairports to increase the availability of scarce facilities. We use a multidimen-sional regression-discontinuity approach to exploit a sharp discontinuity inthe law’s implementation and identify its effects. We find that fares decreaseby 13.4% (20.2%) in markets with one (both) end point(s) covered. Approx-imately half of the decline is driven by the entry of low-cost carriers. Wefind little evidence that the fare declines were accompanied by a dimin-ished quality of service, and passenger volumes increased, which suggeststhe legislation improved consumer welfare.
I. Introduction
ONE of the most enduring features of the postderegula-tion U.S. airline industry has been the hub premium—
the premium over average fares paid by passengers travelingto and from airports dominated by a single large hub car-rier. Though this phenomenon has been widely documented(Borenstein, 1989), its causes and consequences are stillin question. To the extent that higher fares result from theexercise of market power, they are detrimental to consumerwelfare and efficiency. However, there is substantial evidencethat consumers value the large route network and high fre-quencies that dominant carriers often provide (Berry, 1990).To the extent that high prices derive from these quality factors,they benefit consumers. Airport facilities, a necessary inputfor the provision of air service, are increasingly scarce due inlarge part to government regulation handicapping their’ abil-ity to finance facilities expansion in response to increasingdemand. As a consequence of this increased scarcity, airport-level concentration and market power go hand-in-hand withthe airline scope and scale that consumers value and drivedown costs. Given this, the relative contribution, and theoptimality of the balance, of these factors is an empiricalquestion.
In 2000, the U.S. Congress enacted the Wendell H. FordAviation Investment and Reform Act for the 21st Century(AIR-21). A primary directive of the bill was to require air-ports, above a given level of concentration, to take concretesteps to ensure that new entrants had ample access to airport
Received for publication March 25, 2013. Revision accepted for publica-tion February 13, 2014. Editor: Philippe Aghion.
* Snider: UCLA; Williams: University of North Carolina.This paper has benefited from discussions with Severin Borenstein, Jan
Brueckner, Dennis Carlton, Federico Ciliberto, Alon Eizenburg, SilkeForbes, Alfred Galichon, Mara Lederman, Yehua Li, Nancy Rose, NickRupp, Stephen Ryan, and Steven Stern. Seminar participants at ClemsonUniversity, London Business School, NYU, the Sauder School at the Uni-versity of British Columbia, and UCLA, as well as conference participantsat the 2010 IIOC and 2011 NBER IO Summer Institute, provided valuablecomments. We are grateful to Sharon Glasgow and Andrea Toney of theFAA, as well as Liying Gu, Deborah McElroy, and A. J. Muldoon of theACI-NA for assistance in collecting the data for this project and providingvaluable industry insight. All remaining errors are our own.
A supplemental appendix is available online at http://www.mitpressjournals.org/doi/suppl/10.1162/REST_a_00455.
facilities.1 Airport compliance requires filing a CompetitionPlan with the Federal Aviation Administration (FAA), detail-ing the steps taken. The Federal Aeronautics Administrationthen reviews the plan and releases federal funding contingenton a satisfactory plan.
In this paper we empirically evaluate the impact of AIR-21on prices, passenger volumes, quality, and market structureto investigate the importance of access to airport facilitiesas barriers to entry in the airline industry. The nature ofthe implementation of AIR-21 is useful for solving identi-fication problems common in industrial organization studiesof competition and market structure and present in our con-text. The problem is that elements of market structure (e.g.,concentration, low-cost carrier presence) are determinedsimultaneously with the level of competition and usuallydepend on common, market-specific unobserved factors (e.g.,demand elasticities or network economies associated withairport geography). We use the design of AIR-21 to formu-late a differences in differences (diff-in-diff) and regressiondiscontinuity (RD) solution to these problems.
We first argue that the AIR-21 mandates were enforcedand effectively reduced barriers to entry at covered airports.This generates rarely available variation, with a plausiblyknown direction, over time in barriers to entry within markets.This allows us to control for time-invariant, market-specificfactors using standard panel techniques. Second, having con-temporaneous treatment and control groups allows us to usediff-in-diff to address aggregate and market-specific variationin these factors over time.
There are still likely to be selection problems associatedwith using the full sample for identification. Berry and Jia(2010), observing lower fares and diminished carrier profitmargins between the end of the 1990s and the mid-2000s, esti-mate discrete choice demand systems separately for 1997 and2005 and conclude that increased passenger price sensitiv-ity, combined with increased penetration of low-cost carriers,was responsible for the change. Since airport concentrationitself is likely highly correlated with product quality, the time-varying relative valuations of quality found by Berry and Jia(2010) likely interact with our determinant of treatment. Thiscauses differing average trends for treated and untreated mar-kets, invalidating the simple diff-in-diff approach. We solvethis and any similar such problems by arguing that whilethere is likely a selection problem associated with highly con-centrated airports, there is no such problem locally aroundthe 50% two-carrier concentration level specified by AIR-21. This allows us to develop an RD estimator for the localaverage treatment effects associated with AIR-21. Essentially
1 The law applied to airports in which the top two airlines accounted forover 50% of total enplanements at the airport.
The Review of Economics and Statistics, December 2015, 97(5): 1002–1022© 2015 by the President and Fellows of Harvard College and the Massachusetts Institute of Technologydoi:10.1162/REST_a_00455

BARRIERS TO ENTRY IN THE AIRLINE INDUSTRY 1003
we assume that the distribution of unobservables for a ran-domly selected market just below the cutoff is identical to arandomly selected market just above the cutoff.
The design of AIR-21 also helps us dismiss concerns aboutmanipulation of the predictors of coverage. Airport coverageis determined by traffic data from two years prior to cover-age, making coverage dependent on the past actions of thecarriers, which are not subject to manipulation. Given thecomplexity of airline pricing decisions, it also seems unlikelythat carriers would adjust fare-setting behavior to manipulateenplanements at the airport level. Nevertheless, we design aninformal test of manipulation. The test is based on the obser-vation that for a given two-firm airport concentration level,airports with higher one-firm concentration levels would bemore likely to see manipulation, since a single carrier hasmore control over the coverage variable. This test shows noevidence of manipulation.
Ultimately we implement two RD estimators. The firsttakes the boundary dummy approach of Black (1999), usingobservations from progressively smaller windows around thetreatment cutoffs. The second is a novel, true RD estima-tor. Since airline markets necessarily involve both an originand a destination airport, we naturally have to consider twopredictor variables and four treatment/control groups whendefining our treatment effects; both the origin and destina-tion are treated, just the origin is treated, just the destinationis treated, and neither is treated. Our approach is essentiallyto estimate the surface for each of these “quadrants” and lookfor breaks at the boundaries of those quadrants. Our imple-mentation of the two-dimensional RD estimator is novel inthat it allows substantial heterogeneity by permitting the aver-age treatment effect of one end point to vary, essentially,according to the identity of the other end-point airport.
Our relatively clean identification strategy represents acontribution to the literature on airline market structure andthe importance of barriers to entry more generally. A typicalstructural study of entry and market structure in concentratedindustries (Bresnahan & Reiss, 1991; Berry, 1992; Mazzeo,2002; Seim, 2006; Ciliberto & Tamer, 2009) looks at firmchoices and uses a revealed preference approach to inferentry barriers. This approach requires the economist to relyon many restrictions of the empirical model derived from eco-nomic theory. In the end, barriers to entry are often measuredas the residual that justifies the cross-market heterogeneity inmarket structures. Our approach instead uses a known sourceof exogenous variation in entry barriers to investigate theireffects on market outcomes and requires little necessary the-oretical structure. The minimal structural requirements areuseful for an industry as complex as the airline industry,where it is difficult to construct a model that is simultaneouslyrich enough to be quantitatively relevant and tractable enoughto be amenable to analysis. Also, our focus on outcomesmakes our results directly relevant for policy.
To preview results, we find AIR-21 had a substantial,and evidently positive, impact on competition and fares inthe airline industry. We find that markets for which one
of the end-point airports was subject to AIR-21 have seenprice declines of 13% on average. Markets for which bothend points were subject to the mandates have seen pricedeclines of around 20% on average. These price declineswere associated with no economically and statistically sig-nificant changes in measures of quality, with one exception.We find that the on-time performance of carriers at coveredairports decreased. This is not particularly surprising, as weidentify increased low-cost carrier penetration as a drivingforce behind the declines in fares, reinforcing the findingsof Mayer and Sinai (2003) that higher airport concentrationleads to better on-time performance as large carriers, presum-ably, internalize more of the congestion costs. We also findthat the magnitude of the decline in fares is greater for carri-ers with a large presence at an airport than for other carriers.This suggests that AIR-21 was successful at reducing the hubpremiums that Borenstein (1989) identified. While the delayresults suggest some quality degradation on some dimen-sions, the magnitudes of the price declines and accompanyingincreases in passenger volumes indicate the legislation was,overall, welfare enhancing.
The implications of our findings are not limited to ret-rospective policy evaluation. The competition provisions ofAIR-21 address the allocation of a given stock of airportfacilities. A more natural policy prescription might be toencourage the expansion of this stock. However, since 2001,passenger facility charges (PFCs), the per boarding passen-ger tax levied by the airport and a primary source of fundingfor airport investment projects for large airports and the pri-mary backing for the external finance of such projects, havebeen federally capped at $4.50, in spite of protest by airportauthorities. In a letter to President Obama dated August 18,2011, Greg Pricipatio, president of the trade association Air-ports Council International–North America (ACI-NA), urgedthe president to lift the cap as part of his jobs creation plan,saying, “The $2 billion [PFC] raises a year is already com-mitted to paying for recently completed projects or thosecurrently underway.” Resistance to PFC increases has comefrom large carriers that wish to avoid their share of the taxburden and simultaneously prevent expansion of their homeairports and the accompanying increase in competition. Theinfluence of these carriers is not surprising given their impor-tance not only to the airport where they operate large hubs,but also to the communities, where they employ thousands ofworkers and provide a substantial tax base. While our resultsdo not speak directly to the effect of airport expansion, theysuggest this resistance may come at the cost of diminishedcompetition and sharply higher fares for air travelers in thosecommunities and may warrant more careful study.
The remainder of the paper is organized as follows. Insection II, we provide some background on the airline indus-try and discuss AIR-21 in detail. The data are described insection III, and we document some basic patterns in the dataover the policy period. In section IV, we discuss our iden-tification strategy and the results of our analysis. Section Vconcludes and discusses possible extensions of our research.

1004 THE REVIEW OF ECONOMICS AND STATISTICS
II. The Aviation Investment and Reform Actfor the Twenty-First Century
The Government Accounting Office (GAO) and Trans-portation Research Board (TRB) released a series of reports(GAO, 1989, 1990, 2001; TRB, 1999), bringing attention tothe limited amount of competition at many major U.S. air-ports. These reports identified two types of barriers to entryin the airline industry that can limit competition and result inhigher fares: operating and marketing.
Marketing barriers include loyalty programs intended totie consumers to an airline, frequent flier programs, cor-porate incentive agreements, and travel agent commissionoverrides. A lack of data has limited the study of thesetype of barriers, with Lederman (2007, 2008) and Gools-bee and Syverson (2008) as notable exceptions. Lederman(2007, 2008) finds evidence that improvements in loyalty pro-grams enhance demand and can explain a modest portion ofthe hub premium. Goolsbee and Syverson (2008) show thatnational carriers respond to the “threat of entry” by SouthwestAirlines, a low-cost carrier, by lowering fares to strengthenconsumer loyalties prior to entry of Southwest.
Operating barriers include limited access to boarding gates,ticket counters, baggage handling and storage facilities, andtake-off and landing slots. Ciliberto and Williams (2010)were the first to directly link these operating barriers to thehub premium. Using unique data on carrier-specific access toboarding gates, they show that long-term exclusive-use leas-ing agreements for boarding gates limit competition and area major driver of the hub premium. In this paper, we employa unique identification strategy to examine the success ofAIR-21 in reducing these operating barriers and encour-aging competition at major U.S. airports. In the sectionsthat follow, we discuss the details of AIR-21’s design andimplementation.
A. Legislation and Airport Coverage
In response to governmental, public, and academic con-cern with institutional barriers to entry in the airline industry,President Clinton signed into law AIR-21 on April 5, 2000.Section 155 of AIR-21 begins:
The Congress makes the following findings:(1) Major airports must be available on a reasonable
basis to all air carriers wishing to serve those airports.(2) 15 large hub airports today are each dominated by
one air carrier, with each such carrier controlling morethan 50 percent of the traffic at the hub.
(3) The General Accounting Office has found thatsuch levels of concentration lead to higher air fares.
(4) The United States Government must take everystep necessary to reduce those levels of concentration.
(5) Consistent with air safety, spending at these air-ports must be directed at providing opportunities for car-riers wishing to serve such facilities on a commerciallyviable basis.
Together findings 1, 4, and 5 demonstrate Congress’s clearintentions to reduce concentration by encouraging additionalentry at concentrated airports. To encourage airports’ cooper-ation in opening up airports to “all air carriers wishing to servethose airports,” Congress made federal sources of fundingcontingent on compliance:
Beginning in fiscal year 2001, no passenger facility feemay be approved for a covered airport under section40117 and no grant may be made under this subchapterfor a covered airport unless the airport has submitted tothe secretary a written competition plan in accordancewith this subsection.
Passenger facility fees (commonly called PFCs) and air-port improvement program (AIP) grants are the primarysources of federal funding for the industry and make up asignificant portion of capital (including maintenance) bud-gets for major airports.2 PFCs were first authorized byCongress in 1990 and are tied to projects to preserve andenhance safety, reduce noise pollution, and provide oppor-tunities for greater competition between carriers. The PFCceiling, the maximum fee allowed by law, was increased from$1.00 to $4.50 between 1990 and 2001. This ceiling has notbeen increased since AIR-21 and is not indexed for inflation.AIP grants are part of a federal program to help cover costsfor approved capital projects aimed at increasing safety andcapacity, as well as reducing environmental concerns.
A 2009 Airport Council International North America(ACI-NA) study found that over 40% of airports’ capital fund-ing is drawn from PFCs (21.7%) and AIP grants (22.2%).3PFCs alone have funded $50 billion worth of airport capitalinvestments since 1990, including the addition and mainte-nance of passenger boarding gates and runways necessaryto accommodate additional entry. An additional 30% of air-ports’ revenues come from bonds, which are often backedwith future PFCs revenues. This substantial and stable rev-enue base allows airports to significantly lower the cost ofborrowing and enjoy investment-grade ratings. While thequasi-public status of many airports makes it difficult to knowtheir exact objectives, the strong dependence of airports’ rev-enues on the federal government’s control over the right tocharge PFCs and distribute AIP grant funding seems to implystrong incentives for compliance. All airports covered byAIR-21 are required to file a competition plan with the FAAand the DOT, which must certify the plan as acceptable forfunding to be released.4
2 PFCs are charged by airlines at the time a ticket is purchased and arethen transferred directly to the appropriate airports.
3 A copy of the presentation describing this report is available from theauthors on request.
4 The 44 airports required by AIR-21 to file a competition plan are: ABQ,ANC, ATL, AUS, BNA, BUR, BWI, CLE, CLT, CVG, DAL, DCA, DEN,DFW, DTW, EWR, HOU, IAD, IAH, JAX, LAS, MDW, MEM, MIA, MKE,MSP, OAK, OGG, ONT, ORD, PBI, PHL, PHX, PIT, PVD, RNO, SAT,SDF, SFO, SJC, SJU, SLC, SMF, and STL. All but one of the airports wereimmediately covered by the retroactive nature of the legislation. The onlyairport to be covered later was LAS in 2005.

BARRIERS TO ENTRY IN THE AIRLINE INDUSTRY 1005
Congress also made it clear that competition “plans” wereto be implemented:
The Secretary shall review any plan submitted . . . toensure that it meets the requirements of this section,and shall review its implementation from time-to-timeto ensure that each covered airport successfully imple-ments its plan. . . . The Secretary shall ensure that gatesand other facilities are made available at costs that arefair and reasonable to air carriers at covered airports . . .
where a “majority-in-interest clause” of a contract orother agreement or arrangement inhibits the ability ofthe local airport authority to provide or build new gatesor other facilities.
In conversations with those at the FAA assigned to approveand ensure implementation of the competition plans, welearned that approval was not a certainty for any plan. Inmany cases, the plans were significantly revised after dis-cussions between the FAA, DOT, and airport authorities toensure the plans meet the goals of the legislation. After filingthe initial competition plan, airports were required to com-plete two updates (approximately eighteen months apart) thatdemonstrate significant progress toward implementing thecompetition plan. There are no mandatory steps after the sec-ond update for covered airports unless the airport denies acarrier access to airport facilities or significantly amends anexisting leasing agreement or enacts a new master-leasingagreement.
Section 155 continues:
A competition plan under this subsection shall includeinformation on the availability of airport gates andrelated facilities, leasing and sub-leasing arrangements,gate-use requirements, patterns of air service, gate-assignment policy, financial constraints, airport controlsover air- and ground-side capacity, whether the airportintends to build or acquire gates that would be used ascommon facilities, and airfare levels (as compiled by theDepartment of Transportation) compared to other largeairports.
The typical competition plan ranges in length from 75 to100 pages and contains a vast amount of information aboutthe airport’s operations. Ciliberto and Williams (2010) usethis information to demonstrate that Congress’s focus onequal access to sunk airport facilities is not completely mis-guided. Using cross-sectional variation in gate allocationsand leasing terms, they can explain an economically signif-icant fraction of the hub premium, with this fraction beinglarger at congested airports. In this paper, we focus on mea-suring any reduction in fares and the hub premium resultingfrom coverage of an airport by AIR-21.
To identify the impact of AIR-21 on the hub premium,and fares more generally, we exploit the sharp discontinu-ity in the relationship between coverage and concentration:“‘covered airport’ means a commercial service airport . . . thathas more than .25 percent of the total number of passengerboardings each year at all such airports . . . at which one or
two air carriers control more than 50 percent of the passengerboardings.”
These concentration thresholds create treatment and con-trol groups, airports “very near” either side of the discontinu-ity, which can be used to measure the impact of the legislationon competition.5 An airport is covered by the legislation ifit qualifies in both the size and concentration dimensions.6In section IV, we discuss how we exploit this feature of thelegislation using a regression discontinuity approach to mea-sure a (local) treatment effect or impact from coverage atthe concentration cutoff. Tables 1 and 2 show the two-firmenplanement concentration and the fraction of total domesticenplanement at covered and noncovered airports, respec-tively. While concentration and size are positively correlated,it is far from a perfect relationship. For example, Newark(EWR) is covered, while New York (JFK) is not. Similarly,San Francisco (SFO) is covered, while Los Angeles (LAX)is not.
B. Implementation of Competition Plans
Most of the competition plans and subsequent updates areavailable on each airport’s website. The details of each com-petition plan are too vast to review here. However, a 2006FAA report highlights specific actions taken by airports in avariety of areas to increase competition.7
In terms of improving availability of gates and relatedfacilities, airport responses included asserting control overunderused gates, designating competition access commit-tees, adopting more entry-friendly leasing terms, removingspecific access protections for signatory carriers, and stream-lining a forced accommodation process. There were a numberof specific actions. Hartsfield-Jackson Atlanta InternationalAirport (ATL), for example, invoked recapture authority toconvert a leased gate to common use, Cincinnati-NorthernKentucky International Airport (CVG) negotiated conver-sion of exclusively leased gates to common and preferentiallyleased gates, and San Francisco International Airport (SFO)invoked a forced accommodation clause to ensure that tem-porary needs of new entrant airlines were met. In terms ofsubleasing agreements, covered airports also began to assertmore control and oversight over sublease fees, terms, andconditions; impose sublease caps on administrative fees;review or preapprove subleases; and notify carriers of gatesavailable for subleases.
Improving access to passenger boarding gates was clearlythe focus of a large proportion of each competition plan.
5 As with any other analysis examining treatment effects, the treatmentmust be exogenously applied. In the context of our study, endogeneity oftreatment might arise if airports can lower the concentration of enplane-ments or total enplanements to avoid being covered by the legislation. Insection IVB, we show that there is little or no support for the claim thatenplanements were strategically manipulated by carriers to avoid coverage.
6 The discontinuity along the size dimension also presents an opportunityto identify an effect from coverage, but the small number of airports nearthis cutoff limits our ability to exploit this feature of the law.
7 This report is available through the FAA website: http://www.faa.gov/airports/aip/guidance_letters/media.

1006 THE REVIEW OF ECONOMICS AND STATISTICS
Table 1.—Enplanements and Gates for Covered Airports
Enplanements Gates
United States % Top 2% Common % Legacy % LCC %
Airport Year Covered Mean Mean Maximum 2001 2008 2001 2008 2001 2008
ABQ 2000 0.45% 61.24% 63.97% 26.09% 31.82% 39.13% 63.64% 34.78% 4.55%ANC 2000 0.36% 55.23% 61.74%ATL 2000 5.85% 79.17% 82.18% 14.59% 15.08% 72.43% 73.37% 12.97% 11.56%AUS 2000 0.51% 60.32% 61.80% 28.00% 16.00% 44.00% 52.00% 28.00% 32.00%BNA 2000 0.64% 59.02% 63.03% 11.48% 9.84% 44.26% 44.26% 44.26% 45.90%BUR 2000 0.36% 77.98% 83.54% 21.43% 7.14% 28.57% 35.71% 50.00% 57.14%BWI 2000 1.42% 56.59% 65.95%CLE 2000 0.84% 58.97% 61.29%CLT 2000 1.82% 81.43% 86.84% 44.71% 48.35% 55.29% 51.65% 0.00% 0.00%CVG 2000 1.52% 87.47% 92.87%DAL 2000 0.48% 97.79% 99.82% 18.75% 0.00% 15.63% 25.00% 65.63% 75.00%DCA 2001 1.09% 44.06% 50.10%DEN 2000 2.82% 66.04% 72.44%DFW 2000 4.06% 77.14% 85.12% 5.47% 17.42% 89.06% 80.00% 5.47% 2.58%DTW 2000 2.47% 72.71% 76.32% 5.47% 5.08% 84.38% 88.14% 10.16% 6.78%EWR 2000 2.41% 59.77% 69.90%HOU 2000 0.61% 89.23% 92.19%IAD 2001 1.42% 53.70% 59.91%IAH 2000 2.50% 80.91% 86.12%JAX 2000 0.37% 46.52% 50.19%LAS 2005 2.68% 47.81% 52.40%MDW 2000 1.11% 77.90% 90.37%MEM 2000 0.80% 72.17% 77.10%MIA 2001 2.29% 57.22% 68.95% 21.65% 32.04% 74.23% 64.08% 4.12% 3.88%MKE 2001 0.47% 49.87% 56.49% 17.95% 0.00% 48.72% 21.28% 33.33% 78.72%MSP 2000 2.44% 75.89% 78.75% 9.52% 8.66% 86.90% 90.55% 3.57% 0.79%OAK 2000 0.88% 72.26% 78.52% 12.50% 37.93% 16.67% 3.45% 70.83% 58.62%OGG 2000 0.42% 60.00% 68.59%ONT 2000 0.48% 59.52% 61.44%ORD 2000 5.01% 67.79% 74.12%PBI 2000 0.46% 52.29% 58.64% 50.00% 53.13% 39.29% 34.38% 10.71% 12.50%PHL 2000 1.92% 60.61% 65.66%PHX 2000 2.72% 66.85% 68.95%PIT 2000 1.22% 66.85% 81.65%PVD 2000 0.39% 56.71% 63.55%RNO 2000 0.38% 58.91% 62.61%SAT 2001 0.48% 57.94% 100.00% 16.67% 17.39% 54.17% 52.17% 29.17% 30.43%SDF 2000 0.27% 45.50% 51.64%SFO 2000 2.44% 53.42% 56.29% 36.14% 37.04% 60.24% 59.26% 3.61% 3.70%SJC 2000 0.82% 57.53% 64.18%SJU 2000 0.74% 62.30% 69.04%SLC 2000 1.42% 73.60% 80.12% 9.64% 8.43% 80.72% 81.93% 9.64% 9.64%SMF 2000 0.65% 62.66% 65.90% 21.43% 38.46% 32.14% 19.23% 46.43% 42.31%STL 2000 1.53% 69.14% 84.04% 4.55% 52.87% 79.55% 34.48% 15.91% 12.64%Mean 2000.23 1.45% 64.77% 71.46% 19.79% 22.98% 55.02% 51.29% 25.19% 25.72%
LCC: low-cost carriers. In this and subsequent tables, data are missing for the empty cells.
However, covered airports put forth effort in a variety ofother ways to increase competition. For example, both Char-lotte Douglas International Airport (CLT) and San AntonioInternational Airport (SAT) implemented a marketing planto attract additional low-fare carrier service. To make moreefficient use of existing common-use facilities, ATL nowenforces maximum turnaround times. Oakland InternationalAirport (OAK) installed common use ticketing equipment(CUTE) at ticket counters and gates so that all airlines oper-ating there will use identical facilities, providing maximumflexibility to airport administrators. CLT reduced landing feesfor nonsignatory and new entrant carriers to the same level assignatory airlines (i.e., those obligated to repay debt issuedby the airport). Nearly all covered airports implementedmeasures to record gate utilization, impose minimum-use
standards, and notify airlines of gate availability to makemore efficient use of existing gates. Many airports alsoamended majority-in-interest (MII) agreements to exemptcapital projects necessary for competition from MII votes.8
III. Data
A. Sources
The majority of our data for this study are taken fromthe Data Bank 1B (DB1B) of the U.S. Department of
8 MII agreements share the rights to decide on expansion of airport facili-ties between the airport authority and the airline controlling the majority ofoperations at the airport. In some cases, airlines even have veto power overairport expansions.

BARRIERS TO ENTRY IN THE AIRLINE INDUSTRY 1007
Table 2.—Enplanements and Gates for Noncovered Airports
Enplanements Gates
United States % Top 2% Common % Legacy % LCC %
Airport Mean Mean Maximum 2001 2008 2001 2008 2001 2008
BDL 0.49% 44.91% 49.15%BOS 1.87% 34.99% 38.93% 11.90% 10.31% 82.14% 68.04% 5.95% 21.65%BUF 0.32% 37.59% 49.72% 6.25% 21.74% 78.13% 56.52% 15.63% 21.74%CMH 0.49% 32.06% 37.66% 19.44% 22.22% 50.00% 58.33% 30.56% 19.44%FLL 1.27% 35.05% 40.89%HNL 1.51% 45.34% 48.07%IND 0.57% 28.50% 32.86% 26.47% 30.00% 52.94% 57.50% 20.59% 12.50%JFK 2.50% 41.42% 46.15%LAX 4.22% 34.44% 40.44%LGA 1.79% 41.34% 44.43%MCI 0.81% 42.96% 47.56%MCO 2.16% 36.66% 42.92%MSY 0.67% 44.68% 47.59%OKC 0.24% 41.82% 47.67% 0.00% 23.53% 68.75% 52.94% 31.25% 23.53%OMA 0.28% 39.14% 41.72% 25.00% 35.00% 45.00% 45.00% 30.00% 20.00%PDX 0.97% 37.15% 38.80% 19.57% 39.13% 32.61% 28.26% 47.83% 32.61%RDU 0.63% 35.02% 41.34% 2.08% 19.05% 85.42% 66.67% 12.50% 14.29%RSW 0.43% 39.12% 47.35% 23.53% 39.29% 58.82% 32.14% 17.65% 28.57%SAN 1.15% 46.34% 47.80% 32.50% 22.50% 42.50% 43.75% 25.00% 33.75%SEA 2.04% 45.12% 48.33% 21.62% 35.00% 40.54% 25.00% 37.84% 40.00%SNA 0.62% 36.73% 39.64%TPA 1.20% 40.40% 42.66% 18.37% 28.81% 63.27% 44.07% 18.37% 27.12%Mean 1.19% 39.13% 43.71% 17.23% 27.21% 58.34% 48.19% 24.43% 24.60%
Transportation’s Origin and Destination Survey for the years1993 through 2008. The DB1B data are a 10% random sam-ple of all domestic itineraries. The unit of observation is thepassenger level. The data contain information on the ticketingand operating carrier, details of any connections made by thepassenger, and the fare paid for the itinerary used by the pas-senger. Following Evans and Kessides (1994), we considerround-trip tickets to be two equally priced one-way ticketsand drop both interline and open-jaw tickets. Due to key-punch errors or redemption of frequent flier miles, there aresome unusually large and small ticket prices in the DB1Bdata. For this reason, we drop any fares, measured in 2008dollars, greater than $2,500 and less than $25.9 In addition,we drop itineraries with more than six coupons (four con-nections) for round-trip itineraries and three coupons (twoconnections) for one-way itineraries. Following Borensteinand Rose (1994), we define a market as directional travelbetween a unique airport pair.
We supplement the DB1B data with information on thefrequency and severity of delays from the DOT’s Airline On-Time Performance database.
We also collected the enplanement data used by the FAAto determine coverage by AIR-21. There are significant dif-ferences between these data and the enplanement data that arepublicly available through the DOT’s T100 database. Thesedifferences arise because the T100 data do not include on-demand (e.g., charter flights) and in-transit (e.g., plane stopsto refuel but does not deplane) passengers who are a signifi-cant source of enplanements at many airports. The differences
9 We also drop all itineraries for which the DOT questions the credibilityof the reported fare, as indicated by the tktdollarcred variable.
are significant enough that the determination of coverage fora handful of airports would change depending on the sourceof enplanement data.
Our final source of data is a survey conducted jointlywith the ACI-NA.10 The survey, completed by 47% of allmedium and large hubs (those enplaning more than 0.25%of all enplanements at primary airports in the United States),focused on gathering information on carrier-airport-specificleasing agreements for boarding gates. For each airport, weobserve the total number of gates, number of gates leasedby each carrier on an exclusive and preferential basis, andthe number of gates reserved for common use by the airportauthority. The details regarding the construction of the dataset can be found in the online appendix.
B. Descriptive Statistics
Tables 1 and 2 summarize the FAA and survey data formedium and large hubs. Column 1 in tables 1 and 2 liststhe covered and noncovered airports, respectively. The sec-ond column of table 1 lists the year in which each airportwas first covered by the legislation. Due to the lag in datacollection, coverage in any particular year is determined byenplanement data from two years earlier. For example, the setof airports first covered by the legislation in 2000 was deter-mined using enplanement data from 1998. This is importantfor our purposes, since it would be very unlikely that an air-line could perfectly foresee the details of the legislation twoyears in advance and manipulate enplanements to avoid cov-erage of a particular airport. Of covered airports, LAS was
10 See Williams (2012) for more details on this survey.

1008 THE REVIEW OF ECONOMICS AND STATISTICS
the only airport not covered retroactively by the legislation.In section IVB, we test whether the lack of a significant num-ber of airports first covered in later years is due to potentialmanipulation of enplanements by carriers.
The next three columns of tables 1 and 2 report the meanfraction of all U.S. enplanements performed at the airport,and the mean and maximum share of the top two carriersfrom 1998 to 2006 (determines coverage from 2000 to 2008).The maximum of the top two carriers’ shares during thisperiod serves as the predictor of coverage by the legislationsince once an airport’s concentration exceeds this threshold,it is required to file and execute a competition plan. Thus,for each airport in table 1 (2) this variable is greater (less)than .5. It is also important to note that coverage is not aproxy for the size of the airport. Examining the means at thebottom of tables 1 and 2 for the fraction of all U.S. enplane-ments, we see little difference in size between covered andnoncovered airports. This is important, as it alleviates someconcerns over the homogeneity of the treatment and controlgroups in our analysis.
The final columns of tables 1 and 2 report the fractionof gates reserved by the airport authority for common use,fraction leased on a preferential or exclusive basis by legacycarriers, and fraction leased on a preferential or exclusivebasis by low-cost carriers (LCC).11 Examining the respec-tive means in 2001 and 2008 of these variables at the bottomof tables 1 and 2, we see little evidence that gates moveddifferentially at covered and noncovered airports. However,the large amount of missing data makes drawing any strongconclusions difficult. The lack of significant movement inthe allocation of gates for most airports from 2001 to 2008suggests that the FAA and DOT largely followed the recom-mendations put forth by GAO (2001). GAO (2001) cautionedthat AIR-21 should not be used as a means to force the divesti-ture of assets (e.g., boarding gates) from dominant carriersat an airport for two reasons. First, the reallocation of assetsamong competing carriers might have little to no benefit if thegates were not allocated to a low-cost competitor (see Brueck-ner, Lee, & Singer, 2011, and Ciliberto & Tamer, 2009, forstrong support for this statement). Second, service in smallermarkets would likely be the first affected by divestiture of adominant carrier’s assets. This is intuitive: we expect a firmto eliminate or cut service in the least profitable markets,and the presence of any fixed costs associated with serving amarket and significant economies of density in the industry(see Brueckner & Spiller (1994)) ensures a strong correlationbetween profitability and size.
The lack of a significant difference in the reallocation ofgates among carriers at covered and noncovered airports fore-shadows our finding that coverage by AIR-21 has little effecton the network of destinations offered out of an airport. Italso suggests that if we are to find a significant effect from
11 Low-cost carriers are B6, FL, F9, G4, J7, KP, KN, N7, NJ, NK, P9,QQ, SY, SX, TZ, U5, VX, W7, W9, WN, WV, XP, and ZA. The remainingcarriers in our analysis are AA, AQ, AS, CO, DL, HA, NW, UA, US, andYX.
coverage by AIR-21 on other dimensions of service, it is dueto more efficient use of existing assets (the focus of mostcompetition plans) rather than to a redistribution of assetsamong carriers.
Table 3 summarizes the variables we construct from theDB1B data and other sources, before and after AIR-21, sepa-rately for the set of covered and noncovered airports. Column3 gives the means of each variable, for covered and noncov-ered airports, over the entire sample period. To motivate ourapproach in section IV and emphasize the importance of con-trolling for trends in the data prior to coverage by AIR-21,we summarize the first difference for each variable. Moreprecisely, for each variable, the difference before AIR-21 iscalculated as the level in the first quarter of 1999 minus thelevel in the first quarter of 1993, while the difference afterAIR-21 is calculated as the level in the first quarter of 2008minus the level in the first quarter of 2002.12
Using the DB1B data, we classify a carrier’s service ineach market into one of two types: nonstop or connecting.For each type of service in a market, Avg.Fare is calculatedas the average fare across passengers choosing a type ofservice. Avg.Mkt.Fare, 20thPct.Mkt.Fare, 50thPct.Mkt.Fare,and 80thPct.Mkt.Fare are constructed similarly for differentquantiles of the fare distribution in the market as a whole,aggregating across carriers and types of service. Table 3shows a significant downward trend in fares in both cov-ered and noncovered markets. However, prior to AIR-21,fares were falling less rapidly at covered airports, while afterAIR-21, fares fell more rapidly at covered airports. Thesedifferential trends are strongest in the upper quantiles ofthe fare distribution. In section IV, we attempt to identifya causal relationship between coverage by AIR-21 and thesedifferential trends in fares while controlling for a variety oftime-varying covariates. Nonstop is an indicator for whethera carrier’s service is nonstop. Distance.Traveled is the aver-age number of miles traveled by passengers purchasing atype of service from a carrier in a particular market. Fornonstop service, Distance.Traveled is equal to the direct dis-tance between the market end points. For connecting service,Distance.Traveled is strictly greater than the direct distance.
At the airport-carrier level, we construct two variables fromthe DB1B. Fraction.Routes is the proportion of all the des-tinations offered out of an originating airport for which acarrier offers either nonstop or connecting service. For exam-ple, suppose that 200 different markets are served out ofAtlanta (ATL) by all carriers. Further, suppose Delta andAmerican serve 180 and 100 markets out of ATL, respec-tively. In this example, Fraction.Routes is equal to 0.9 and0.5 for Delta and American, respectively. Thus, the numera-tor of Fraction.Routes is the total number of markets servedby a carrier out of an airport, Number.Routes, while the
12 Our results are nearly identical if 1993 to 2000 and 2001 to 2008 areused to construct the differences. Yet by not using 2000 and 2001, we reducethe possibility that our results are biased from the disruptions to the industryfrom the events of 9/11, anticipation by airports regarding the componentsof the law, or delays in its implementation.

BARRIERS TO ENTRY IN THE AIRLINE INDUSTRY 1009
Table 3.—Means for Covered and Noncovered Markets
Pre-AIR21 Post-AIR211993–1999 2002–2008
Covered Mean, 1993–2008 Number of Observations Mean Diff. Mean Diff. Diff. in Diff.
Market-carrier-productAvg.Fare Yes 234.926 7,669 −34.004 −21.695 −40.295
No 274.505 1,353 −47.050 5.554Distance.Traveled Yes 1.660 7,669 0.012 0.014 0.009(Unit = 1000s of Miles) No 1.658 1,353 0.020 0.013Fraction.Routes Yes 0.380 7,669 −0.014 0.036 −0.004
No 0.359 1,353 −0.010 0.044Pass Yes 3,049.413 7,669 1,391.059 448.477 736.864
No 2,688.051 1,353 1,152.424 −527.022Market
Avg.Mkt.Fare Yes 240.872 2,619 −55.993 −31.328 −29.281No 280.646 360 −63.127 −9.181
20th Pct.Mkt.Fare Yes 144.692 2,619 −47.002 0.704 −8.057No 168.967 360 −51.803 3.960
50th Pct.Mkt.Fare Yes 193.199 2,619 −66.638 −7.032 −18.589No 222.056 360 −72.163 6.032
80th Pct.Mkt.Fare Yes 312.435 2,619 −79.894 −55.398 −43.735No 370.831 360 −81.410 −13.179
Avg.Dominant.Premium Yes 17.604 1,360 17.516 −18.576 −18.789No 14.724 163 7.367 −9.936
Lcc.Presence Yes 0.723 2,619 0.337 0.183 0.192No 0.494 360 0.464 0.118
Number.Firms Yes 6.069 2,619 0.688 0.339 −0.169No 6.021 360 0.804 0.624
P(delay>15) Yes 6.127 105 −0.004 0.098 0.015No 6.924 1,372 0.018 0.106
Pct.Nonstop Yes 0.512 2,619 0.025 0.041 −0.059No 0.459 360 −0.012 0.062
Airport-carrierNumber.Routes Yes 67.699 130 4.683 3.077 −3.401
No 65.300 76 4.846 6.641
denominator is the total number of routes served by any car-rier out of the airport. This variable is intended to measurethe relative attractiveness of carriers’ networks.
Our measure of the hub premium, similar to the relativeprice measures used in Borenstein (1989), in a given market iscalculated as the difference between the fares charged by thecarriers with the largest share of enplanements at the originand destination airports and the average of fares charged byall other carriers. For example, in the ATL (Atlanta Hartsfield)to CLE (Cleveland Hopkins) market, Delta and Continentalare regarded as the dominant carriers (those with the largestshare of enplanements), and Avg.Dominant.Premium is cal-culated as the difference between the average fare chargedby Delta and Continental and the average fare charged byall other carriers. This variable is summarized in table 3 andsuggests that coverage is associated with a moderate declinein the premium charged by dominant carriers. To measure theavailability of nonstop service, an important dimension to ser-vice quality, we calculate Pct.Nonstop as the percentage ofpassengers traveling nonstop in a market. We also constructtwo measures of competition in a market, Lcc.Penetrationand Number.Firms. Lcc.Penetration, summarized in table 3,is an indicator for whether a low-cost carrier is present inthe market. As has been well documented, low-cost carrierpenetration has been steadily increasing over the previousdecade and typically results in intense price competition. Insection IV, and as the descriptives suggest, we show that in
markets where one or both end-point airports are covered byAIR-21, the low-cost penetration rate is significantly higheras a result of coverage. Number.Firms is the total number offirms serving the market and is a commonly used measureof competition in the industrial organization literature (seeBerry, 1992, and Ciliberto & Tamer, 2009).
We calculate P(Delay ≥ 15), using the Airline On-TimePerformance data, as the proportion of flights delayed fifteenminutes or more in a quarter on a particular flight segment.In addition to those variables we construct from the DOTsources, we also collected data on both population and percapita income for each MSA from the Bureau of EconomicAnalysis to serve as controls throughout our analysis.
IV. Empirical Analysis
Our final sample includes data from all airports classifiedas a medium or large hub by the FAA (enplaning at least0.25% of total domestic enplanements), including highlyconcentrated hubs such as Minneapolis and Dallas.13 A legit-imate concern here is that these highly concentrated airportsare significantly different from the control group (noncov-ered airports) in both observable and unobservable ways. For
13 Smaller airports, below the 0.25% of total domestic enplanements, arenot eligible to be covered by AIR-21. An analysis including these smallerairports gives nearly identical results. These estimates are available fromthe authors on request.

1010 THE REVIEW OF ECONOMICS AND STATISTICS
Figure 1.—Coverage Cutoffs
example, since airport presence is known to be an impor-tant factor in airline quality, cost, and price competition, itis troubling that we have no airports in the control groupcomparable to Dallas and Minneapolis in terms of presencemeasures. Similarly, unobserved airport features, such as geo-graphic location, may affect the network economies of anairport, leading it to be highly concentrated and to have dif-ferent competitive mechanics than less concentrated airports.The results from Berry and Jia (2010) also give an impor-tant example of the interaction of unobservable changes inconsumer preferences (i.e., decreasing willingness to pay forquality), with observable airport presence differences.
To get around these problems, we exploit AIR-21’s sharpdiscontinuity at the 50% two-carrier enplanement level.Essentially we assume that the distribution of market-levelunobservables changes smoothly across the policy discon-tinuity. That is, the unobservable features of a randomlychosen market just below the cutoff have the same distri-bution as the unobservable features of a randomly chosenmarket just above the cutoff. Such an identification strategyalso has the advantage of lessening concerns that other events(e.g., September 11) near the time of the policy interventionare influencing our results, as the event would have to have adifferential effect on airports on either side of the treatmentcutoff. A local identification approach also has the advantageof mitigating concerns regarding mean reversion, or the ideathat concentrated airports tend to deconcentrate over time dueto high prices and entry.
With this identification strategy in mind, we estimate thelocal average treatment effects (LATEs) of the law using twoapproaches. First, we proceed in the spirit of Black (1999)and estimate a series of difference-in-difference regressionsusing only those observations in progressively smaller win-dows around the concentration cutoffs determining coverage.Figure 1 demonstrates this approach. We begin by usingthe complete sample and then examine the subset of mar-kets within narrower windows around the coverage cutoffs.
Using this approach, we identify market outcomes affectedby coverage in a statistically and economically significantmanner. This approach also allows us to use covariates to con-trol for observable differences in airports and markets. Thisis potentially useful because while we have a large numberof markets, these markets are drawn from a relatively smallnumber of airports, which may create a small sample problemeven if our identifying assumption is correct. For example,New York (JFK) is always included as a control airport andserves destinations that are larger, richer, and more distant onaverage than those in the treatment group, and due to the largenumber of markets originating or terminating at the airport,it represents a nontrivial fraction of the sample.
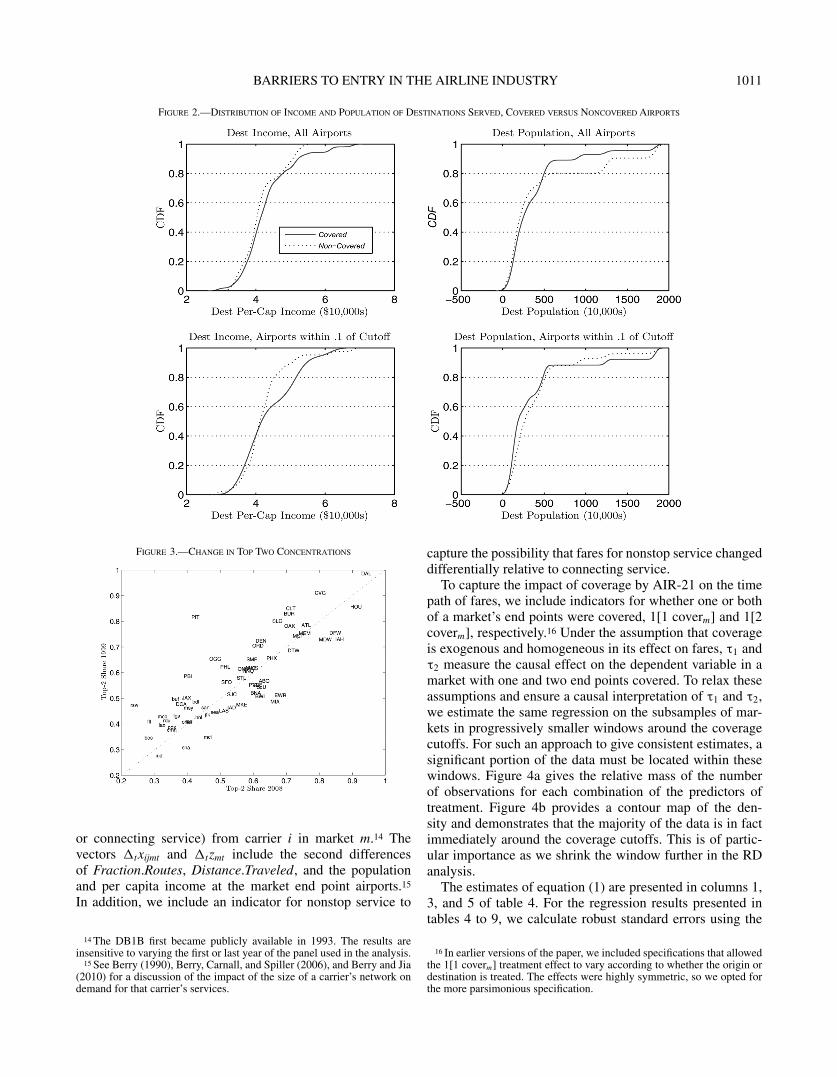
In the top half of figure 2, we plot the cdf of per capitaincome and population of destinations served out of coveredand noncovered airports. Airports covered by AIR-21 tendto serve destinations with larger populations and higher percapita incomes. In the bottom half of figure 2, we plot thecdf of the same observables for destinations served out ofairports with two-firm concentrations within 0.1 of the treat-ment cutoff. In this window, the difference in the distributionof population narrows greatly, while the difference in theright-hand tails of the distribution of per capita income alsonarrows. Figure 3 shows the two-firm concentration ratios ateach airport in 2000 and 2008, respectively.
In the second step, we employ a true RD approach andallow the window width to collapse to 0. We find that our mainconclusions from the first step are robust, which one wouldexpect given the similarity of the distribution of observablesin figure 2. In addition, our particular RD implementationallows us to examine variation in the effect of coverage alongthe cutoffs. We do this by defining treatment effects as func-tions of an origin’s or destination’s concentration level, whichwe describe more fully below, whereas in the first step, weidentify only an average effect of coverage, ignoring potentialheterogeneity in treatment effects across markets. In the caseof low-cost entry, we find significant heterogeneity along thetreatment cutoff. Intuitively, following implementation of thecompetition plans and the resulting improvement in accessto airport facilities, we find that low-cost carriers enter moreconcentrated markets with greater frequency.
A. Boundary Dummy Approach
Fares. Following Black (1999), we begin under theassumption that coverage is exogenous and homogeneous inits effect on fares by estimating the following regression:
Δt log(Avg.Fareijmt)
= Δtxijmtβ + Δtzmtγ + ψNonstopijmt
+ τ11[1 coverm] + τ21[2 coverm] + Δtεijmt , (1)
using the complete sample. The dependent variable is thelong second difference, the change from 2002 to 2008 minusthe change from 1993 to 1999, of the logarithm of averagefares paid by passengers who purchased product j (nonstop
BARRIERS TO ENTRY IN THE AIRLINE INDUSTRY 1011
Figure 2.—Distribution of Income and Population of Destinations Served, Covered versus Noncovered Airports
Figure 3.—Change in Top Two Concentrations
or connecting service) from carrier i in market m.14 Thevectors Δtxijmt and Δtzmt include the second differencesof Fraction.Routes, Distance.Traveled, and the populationand per capita income at the market end point airports.15
In addition, we include an indicator for nonstop service to
14 The DB1B first became publicly available in 1993. The results areinsensitive to varying the first or last year of the panel used in the analysis.
15 See Berry (1990), Berry, Carnall, and Spiller (2006), and Berry and Jia(2010) for a discussion of the impact of the size of a carrier’s network ondemand for that carrier’s services.
capture the possibility that fares for nonstop service changeddifferentially relative to connecting service.
To capture the impact of coverage by AIR-21 on the timepath of fares, we include indicators for whether one or bothof a market’s end points were covered, 1[1 coverm] and 1[2coverm], respectively.16 Under the assumption that coverageis exogenous and homogeneous in its effect on fares, τ1 andτ2 measure the causal effect on the dependent variable in amarket with one and two end points covered. To relax theseassumptions and ensure a causal interpretation of τ1 and τ2,we estimate the same regression on the subsamples of mar-kets in progressively smaller windows around the coveragecutoffs. For such an approach to give consistent estimates, asignificant portion of the data must be located within thesewindows. Figure 4a gives the relative mass of the numberof observations for each combination of the predictors oftreatment. Figure 4b provides a contour map of the den-sity and demonstrates that the majority of the data is in factimmediately around the coverage cutoffs. This is of partic-ular importance as we shrink the window further in the RDanalysis.
The estimates of equation (1) are presented in columns 1,3, and 5 of table 4. For the regression results presented intables 4 to 9, we calculate robust standard errors using the
16 In earlier versions of the paper, we included specifications that allowedthe 1[1 coverm] treatment effect to vary according to whether the origin ordestination is treated. The effects were highly symmetric, so we opted forthe more parsimonious specification.

1012 THE REVIEW OF ECONOMICS AND STATISTICS
Figure 4.—Mass over Support of Predictors
Table 4.—Average Fare Regressions
All Markets 0.2 of Cutoff 0.1 of Cutoff(1) (2) (3) (4) (5) (6)
Log(Avg. Fare) N = 8,996 N = 8,453 N = 5,813
1[1 cover] −0.147∗∗∗ −0.106∗∗∗ −0.145∗∗∗ −0.105∗∗∗ −0.144∗∗∗ −0.109∗∗∗(0.030) (0.023) (0.030) (0.023) (0.030) (0.024)
1[2 cover] −0.210∗∗∗ −0.133∗∗∗ −0.202∗∗∗ −0.129∗∗∗ −0.226∗∗∗ −0.143∗∗∗(0.047) (0.033) (0.046) (0.032) (0.050) (0.034)
Nonstop −0.191∗∗∗ −0.189∗∗∗ −0.195∗∗∗ −0.193∗∗∗ −0.184∗∗∗ −0.182∗∗∗(0.019) (0.019) (0.019) (0.019) (0.019) (0.019)
Fraction.Routes 0.275∗∗∗ 0.314∗∗∗ 0.277∗∗∗ 0.304∗∗∗ 0.291∗∗∗ 0.310∗∗∗(0.104) (0.079) (0.100) (0.078) (0.097) (0.081)
Distance.Traveled 0.161∗∗∗ 0.196∗∗∗ 0.152∗∗∗ 0.184∗∗∗ 0.125∗∗ 0.154∗∗∗(0.047) (0.041) (0.049) (0.044) (0.055) (0.046)
Lcc.Presence −0.166∗∗∗ −0.164∗∗∗ −0.151∗∗∗(0.020) (0.020) (0.022)
Number.Firms −0.013∗∗∗ −0.013∗∗ −0.012∗∗(0.005) (0.005) (0.006)
Origin.HHI 0.142 0.161 0.051(0.183) (0.183) (0.173)
Dest.HHI 0.046 0.066 −0.017(0.167) (0.164) (0.157)
Market.HHI 0.067∗∗ 0.074∗∗ 0.121∗∗∗(0.034) (0.034) (0.040)
Has.Other.Products 0.007 0.009 0.005(0.007) (0.008) (0.008)
R2 0.096 0.178 0.092 0.174 0.098 0.175Borenstein-Rose (1994) controls No Yes No Yes No Yes
Additional controls include Population Origin, Population Dest, Per-Cap Income Origin, and Per-Cap Income Dest. Statistical significance: ***1%, **5%, *10%.
approach of Cameron, Gelbach, and Miller (2007) to clusteron both the origin and destination, allowing arbitrary forms ofcorrelation between observations with either the origin, des-tination, or both in common. Our estimates of τ1 and τ2 arenegative and statistically and economically significant in eachwindow around the coverage cutoff. From column 5, wherewe can reasonably interpret our coefficients in a causal fash-ion, the results indicate that coverage of a single end point byAIR-21 results in a 13.4% reduction in average fares,17 while
17 Following Halvorsen and Palmquist (1980), this is calculated as−13.4 = 100 × (exp(−0.144) − 1).
coverage of both end points results in approximately a 20.2%change in average fares. This result is robust across differ-ent window widths, suggesting we might safely extrapolateour local effects to more highly concentrated airports. Theremaining results in column 5 are straightforward to interpretand are consistent across all subsamples.
We interpret the results in columns 1, 3, and 5 as esti-mates of the total effect, both direct and indirect, of AIR-21on average fares. Since we typically think of the effect ofbarriers to entry on fares as being indirect, that is, barriersto entry affect entry and exit, and market structure, whichin turn affect prices, it is important to the credibility of our

BARRIERS TO ENTRY IN THE AIRLINE INDUSTRY 1013
identification as well as our evaluation of the policy to tryto understand the direct channels through which fares areaffected. Columns 2, 4, and 6 of table 4 show specificationsdesigned to partially get at these channels. Specifically, weadd a very similar set of time-varying regressors to thoseemployed by Borenstein and Rose (1994) to control for anychanges in the competitive environment in a market. The setof controls includes the number of competitors in the market,an indicator for whether a low-cost carrier serves the market,airport-level Herfindahl indices for both end points, market-level Herfindahl indices, and an indicator for whether thecarrier offers both nonstop and connecting service.18 Each ofthese variables enters the regression as a second differenceas described above. One can then interpret changes in theestimates of τ1 and τ2, when the controls are included, as evi-dence that variation in the competitive environment explainssome portion of the estimated effect of coverage. We find thatthese controls explain between 30% and 50%, depending onthe window width, of the effect from coverage we estimatedin columns 1, 3, and 5. Lcc.Penetration has a statistically sig-nificant and economically meaningful effect on fares. Thissuggests the explanation for the large decline in fares causedby AIR-21 has come, to a large extent, through exactly thechannels envisioned by the law. While, under our identifyingassumptions, our treatment effect estimates are consistent inthe presence of potentially endogenous market structure vari-ables, we do not argue that the coefficients on these variablesare consistent estimates of the effect of, for example, low-costentry. However, we note that the substantial 14% declinesassociated with the Lcc.Penetration variable are consistentwith the range of estimates presented by Brueckner et al.(2011).19
Estimates of equation (1) provide insight into how faresfor a particular type of service in market changed as a resultof AIR-21. It is also of interest to know how the distributionof fares in a market as a whole changed as a result of AIR-21.Specifically, performing the analysis on the distribution offares in the market as a whole serves as an informal test ofwhether sample selection, on carriers serving a market overthe entire period, is driving our results. If the estimated effectsfor coverage are similar to those of equation (1), we can beconfident that selection is not driving our results.
For this purpose, we estimate market-level regressions ofthe form
Δt log(Qtile.Mkt.Faremt)
= Δtzmtγ + τ11[1 coverm] + τ21[2 coverm] + Δtεmt ,
where the dependent variable, Qtile.Mkt.Faremt , is a partic-ular quantile (e.g., 20thPct.Mkt.Fare) of the distribution of
18 We also estimated a specification including an interaction of the nonstopindicator and the indicator for whether the carrier offers both nonstop andconnecting service. This interaction was never significant.
19 Results from estimating slight variations of equation (1) using the entirepanel of data (every year from 1993 to 2008) and year-on-year first dif-ferences are available at http://jonwms.myweb.uga.edu/research.htm. Theresults are nearly identical to those presented in table 4.
fares in a market. Table 5 presents these estimates. For con-ciseness and due to the similarity of the estimates to thosein table 4, we present only coefficients of particular inter-est. Columns 2, 4, and 6 (1, 3, and 5) present the estimateswith(out) the Borenstein and Rose (1994) controls; the num-ber of competitors in the market, an indicator for whethera low-cost carrier serves the market, airport-level enplane-ment Herfindahl indices for both end points, and market-levelenplanement Herfindahl indices.
The results for Avg.Mkt.Faremt , in the top panel of table5, are very similar to those reported in table 4, suggest-ing that selection is not a concern. Additionally, consistentwith the descriptive evidence in table 3, we find that theestimated decline in fares resulting from coverage by AIR-21 is increasing in the fare quantile. The coefficients incolumn 5, which we can reasonably interpret in a causalfashion, show little decline at the bottom of the distribu-tion as a result of coverage, while there were large andstatistically significant declines in both 50thPct.Mkt.Fare and80thPct.Mkt.Fare. 50thPct.Mkt.Fare declines 8.6% (19.0%)when one (both) end point(s) is (are) covered, while80thPct.Mkt.Fare declines 10.1% (21.6%). Inclusion of theBorenstein and Rose (1994) controls, low-cost carrier entryin particular, again explains away up to 50% of the estimatedeffect from coverage. Consistent with low-cost carriers suc-cessfully targeting business travelers, we find the effect oflow-cost entry to be larger in the upper quantiles of the faredistribution.
The last measure of the impact of AIR-21 on fares thatwe examine is the effect on the dominant carrier premium,Avg.Dominant.Premiummt . We measure the hub premium asthe difference in the logarithm of the average fare chargedin a market by the carriers with the largest presence at themarket’s end points with that of its competitors. These pre-miums range from roughly 15% to 40% in 1999 and, onaverage, are sharply increasing in the concentration of anairport. Table 6 reports the results of these regressions. Themagnitudes of the estimates are similar across different win-dow widths but not always statistically significant. If we focuson column 5, the narrowest window, we find that these pre-miums have fallen slightly faster in markets with one or bothend points covered, although the coefficient on 1[2 cover] isnot statistically significant. These results suggest, at most,that AIR-21 had a modest impact on reducing premiumscharged by dominant carriers, despite the success of AIR-21in reducing fares overall.
Quality. In addition to fares, many other characteristicsof service may change as the result of coverage by AIR-21.GAO (2001) suggests that granting authority to regulators toforce dominant carriers at certain airports to divest criticalassets (e.g., boarding gates) introduces uncertainty and canlead to disinvestment in an airport. In particular, GAO (2001)suggests that service to smaller airports would be the firstto be affected, possibly losing service altogether. If the farereductions are accompanied by diminished service quality

1014 THE REVIEW OF ECONOMICS AND STATISTICS
Table 5.—Fare Distribution Regressions
All Markets 0.2 of Cutoff 0.1 of Cutoff(1) (2) (3) (4) (5) (6)
N = 2,978 N = 2,746 N = 1,825
Log(Avg.Mkt.Fare)1[1 cover] −0.116∗∗∗ −0.090∗∗∗ −0.117∗∗∗ −0.089∗∗∗ −0.115∗∗∗ −0.092∗∗∗
(0.034) (0.026) (0.034) (0.026) (0.032) (0.027)
1[2 cover] −0.213∗∗∗ −0.139∗∗∗ −0.198∗∗∗ −0.128∗∗∗ −0.238∗∗∗ −0.152∗∗∗(0.054) (0.039) (0.054) (0.040) (0.064) (0.050)
Lcc.Presence −0.257∗∗∗ −0.253∗∗∗ −0.227∗∗∗(0.026) (0.027) (0.027)
Number.Firms −0.009 −0.009 −0.003(0.007) (0.007) (0.008)
R2 0.050 0.287 0.047 0.277 0.071 0.264Log(20thPct.Mkt.Fare)
1[1 cover] −0.063∗ −0.052∗ −0.063∗ −0.051∗ −0.068∗∗ −0.058∗∗(0.034) (0.029) (0.034) (0.029) (0.033) (0.028)
1[2 cover] −0.088∗ −0.058 −0.089∗ −0.061 −0.078 −0.032(0.049) (0.041) (0.051) (0.043) (0.065) (0.057)
Lcc.Presence −0.120∗∗∗ −0.118∗∗∗ −0.108∗∗∗(0.021) (0.021) (0.023)
Number.Firms −0.022∗∗∗ −0.022∗∗∗ −0.019∗∗∗(0.006) (0.006) (0.007)
R2 0.008 0.109 0.009 0.110 0.014 0.096Log(50th Pct.Mkt.Fare)
1[1 cover] −0.092∗∗∗ −0.072∗∗∗ −0.091∗∗∗ −0.073∗∗∗ −0.090∗∗∗ −0.076∗∗∗(0.032) (0.025) (0.032) (0.025) (0.033) (0.028)
1[2 cover] −0.199∗∗∗ −0.145∗∗∗ −0.186∗∗∗ −0.139∗∗∗ −0.211∗∗∗ −0.143∗∗(0.049) (0.037) (0.051) (0.040) (0.070) (0.060)
Lcc.Presence −0.208∗∗∗ −0.197∗∗∗ −0.166∗∗∗(0.028) (0.029) (0.030)
Number.Firms −0.030∗∗∗ −0.031∗∗∗ −0.023∗∗(0.008) (0.008) (0.009)
R2 0.031 0.184 0.028 0.177 0.037 0.151Log(80thPct.Mkt.Fare)
1[1 cover] −0.113∗∗ −0.077∗∗ −0.114∗∗∗ −0.077∗∗ −0.107∗∗ −0.077∗∗(0.044) (0.035) (0.044) (0.034) (0.042) (0.034)
1[2 cover] −0.242∗∗∗ −0.144∗∗∗ −0.213∗∗∗ −0.118∗∗ −0.243∗∗∗ −0.124∗(0.071) (0.053) (0.070) (0.051) (0.083) (0.064)
Lcc.Presence −0.340∗∗∗ −0.336∗∗∗ −0.302∗∗∗(0.030) (0.031) (0.033)
Number.Firms −0.011 −0.011 −0.004(0.007) (0.007) (0.008)
R2 0.046 0.251 0.041 0.242 0.062 0.242Borenstein-Rose (1994) controls No Yes No Yes No Yes
The coefficients of the remaining Borenstein-Rose (1994) controls, Origin HHI, Dest HHI, and Market HHI, are not displayed for space considerations and are available from the authors on request. Additionalcontrols include Population Origin, Population Dest, Per-Cap Income Origin, Per-Cap Income Dest. Statistical significance: ***1%, **5%, *10%.
Table 6.—Dominant Carrier Premium Regressions
All Markets 0.2 of Cutoff 0.1 of Cutoff(1) (2) (3) (4) (5) (6)
N = 1,487 N = 1,343 N = 899
Avg.Dominant.Premium1[1 cover] −0.070∗ −0.064∗ −0.068∗ −0.062 −0.076∗∗ −0.072∗
(0.037) (0.038) (0.036) (0.038) (0.037) (0.039)
1[2 cover] −0.063 −0.049 −0.070 −0.054 −0.038 −0.026(0.048) (0.049) (0.051) (0.052) (0.064) (0.061)
Lcc.Presence −0.029 −0.036 −0.021(0.026) (0.026) (0.023)
Number.Firms 0.002 0.005 0.005(0.008) (0.009) (0.009)
R2 0.004 0.014 0.005 0.017 0.011 0.026Borenstein-Rose (1994) controls No Yes No Yes No Yes
The coefficients of the remaining Borenstein-Rose (1994) controls, Origin HHI, Dest HHI, and Market HHI, are not displayed for space considerations and are available from the authors on request. Additionalcontrols include Population Origin, Population Dest, Per-Cap Income Origin, Per-Cap Income Dest. Statistical significance: ***1%, **5%, *10%.

BARRIERS TO ENTRY IN THE AIRLINE INDUSTRY 1015
then the welfare consequences of coverage are ambiguous.We focus on three critical dimensions of service quality: theavailability of nonstop service (percentage of passengers fly-ing nonstop in a market), the on-time performance of carriers(fraction of flights delayed fifteen minutes of more), and thenumber of markets served by a carrier out of an airport (num-ber of destinations served on a connecting or nonstop basisby a carrier out of an airport).
To estimate the impact of coverage on the availability ofnonstop service, we estimate the following regression:
ΔtPct.Nonstopmt
= Δtzmtγ + τ11[1 coverm] + τ21[2 coverm] + Δtεmt ,
where ΔtPct.Nonstopmt denotes the second difference, con-structed identically to the dependent variable in equation(1), in the fraction of passengers flying nonstop in marketm. To examine the impact of coverage on the frequency oflate flights on any nonstop flight segment s, we estimate thefollowing regression:
ΔtP(Delay ≥ 15)st
= Δtzstγ + τ11[1 coverm] + τ21[2 coverm] + Δtεst ,
where P(Delay ≥ 15) is the fraction of flights delayed fifteenminutes or more. Finally, to capture any potential divestitureby carriers in an airport resulting from coverage by AIR-21,we estimate the following regression:
Δt log(Number.Routesiat)
= Δtzatγ + τ1[1 covera] + Δtεiat ,
where the unit of observation is at the carrier (i)-airport (a)level.
The results of these regressions are presented in table 7.The GAO (2001) was most concerned that AIR-21 might leadcarriers to completely cease operations or reduce the numberof destinations served from covered airports. We do not findrobust evidence that the range of destinations offered by car-riers was affected negatively by coverage; however, the largeamount of noise in these regressions and the variation in thepoint estimates make it difficult to draw firm conclusions.With regard to delays, consistent with the findings of Forbes(2008), we find weak evidence of an increase in the propor-tion of late flights; however, this result is not robust across allwindows.20 This is an intuitive result. Mayer and Sinai (2003)find that carriers controlling the majority of the operations atan airport have an incentive to internalize congestion-relateddelays. At covered airports, a number of gates were seizedfrom dominant carriers and subsequently operated by the air-port authority, a third party with a lesser incentive to minimize
20 In unreported results, we included a variety of measures to attempt tomeasure congestion and concentration to try to explain the observed increasein the frequency of late flights. Interestingly, none of these measures explainaway any portion of the measured effect of coverage. This leaves very fewpossible explanations other than a change in control over the managementof the scarce airport facilities.
Table 7.—Quality Regressions
All Markets 0.2 of Cutoff 0.1 of Cutoff(1) (2) (3)
Pct.Nonstop N = 2,978 N = 2,746 N = 1,8251[1 cover] −0.052∗∗ −0.052∗∗ −0.045∗
(0.026) (0.026) (0.024)
1[2 cover] −0.063∗∗ −0.064∗∗ −0.038(0.030) (0.030) (0.032)
R2 0.007 0.007 0.009P(Delay>15) N = 1,420 N = 1,263 N = 814
1[1 cover] 0.038∗ 0.039∗ 0.035∗(0.020) (0.020) (0.020)
1[2 cover] 0.067∗∗ 0.064∗∗ 0.045(0.027) (0.027) (0.031)
R2 0.074 0.083 0.097Log(Number.Routes) N = 419 N = 312 N = 181
1[cover] −0.069 −0.092∗ −0.010(0.054) (0.055) (0.082)
R2 0.008 0.017 0.011
Additional controls include Population Origin, Population Dest, Per-Cap Income Origin, Per-Cap IncomeDest. Statistical significance: ***1%, **5%, *10%.
delays of any particular carrier or flight. Besides an increasein delays, we find that the proportion of passengers flyingnonstop declines slightly as a result of coverage. While thisis difficult to test, a likely explanation is a change in the com-position of passengers in covered markets, such that thoseconsumers brought into the market as a result of the largedeclines in fares are more price sensitive and prefer cheaperconnecting service.
If it were not for such a significant decline in fares, con-clusions regarding consumer welfare would be—and to asignificant degree still are—less clear, as it would require anunreasonably high opportunity cost of time (associated withincreased delays and connections) to completely offset a 19%reduction in the median fare. However, this finding speaks tothe idea that AIR-21 may have been suboptimally focused onthe reallocation of scarce facilities rather than expansion ofthe facilities.
Quantity. For the decrease in fares in covered markets tobe welfare improving for consumers, we should not observestatistically significant declines in passenger traffic in thesemarkets. We have shown there are only minor declines inmeasurable aspects of service quality. Observing declinesin passenger volumes would suggest that other, unobserved,aspects of service (e.g., quality) declined along with faresin covered markets. To measure the effect of coverage onpassenger volumes, we run the following regression:
Δt log(Passijmt) = Δtxijmtβ + Δtzmtγ + ψNonstopijmt
+ τ11[1 coverm] + τ21[2 coverm]+ Δtεijmt ,
where Passijmt is the number of passengers traveling, eithernonstop or connecting, j, with carrier i in market m, asreported in the DB1B data. The vectors Δtxijmt and Δtzmt
include the same controls as in equation (1).

1016 THE REVIEW OF ECONOMICS AND STATISTICS
Table 8.—Quantity Regressions
All Markets 0.2 of Cutoff 0.1 of Cutoff
(1) (2) (3) (4) (5) (6)
Log(Pass) N = 8,724 N = 8,194 N = 5,6501[1 cover] 0.199∗∗∗ 0.076 0.200∗∗∗ 0.074 0.185∗∗∗ 0.059
(0.044) (0.047) (0.044) (0.047) (0.043) (0.050)
1[2 cover] 0.267∗∗∗ 0.027 0.264∗∗∗ 0.022 0.352∗∗∗ 0.138(0.081) (0.076) (0.085) (0.078) (0.115) (0.103)
Lcc.Presence 0.268∗∗∗ 0.271∗∗∗ 0.254∗∗∗(0.030) (0.032) (0.030)
Number.Firms 0.032∗∗∗ 0.031∗∗∗ 0.029∗∗∗(0.011) (0.011) (0.010)
R2 0.059 0.267 0.060 0.270 0.061 0.280Borenstein-Rose (1994)
controls No Yes No Yes No Yes
The coefficients of the remaining Borenstein-Rose (1994) controls, Origin HHI, Dest HHI, and Market HHI, are not displayed for space considerations and are available from the authors on request. Additionalcontrols include Population Origin, Population Dest, Per-Cap Income Origin, Per-Cap Income Dest. Statistical significance: ***1%, **5%, *10%.
The results of these regressions are reported in table 8.Columns 2, 4, and 6 (1, 3, and 5) report the results with(out)the Borenstein and Rose (1994) controls for different windowwidths. Column 5 indicates that coverage, on average, had apositive and statistically significant effect on passenger vol-umes. Passenger volumes rose approximately 20.3% (42.2%)in markets with one (both) end point(s) covered, consistentwith the large coverage effect for fares reported in table 4.The large increase in passenger volumes suggests that theincrease in delays did little to diminish the benefit to con-sumers resulting from the large decline in fares. Column 6shows that inclusion of the Borenstein and Rose (1994) con-trols explains away much of the estimated effect on passengervolumes from coverage. Low-cost entry in covered marketsdrives nearly all of the increase in passenger volumes.
Competition. The results in tables 4, 5, and 8 suggestthat increased competition, particularly by low-cost carriers,explains a significant portion of the variation in fares andincreases in passenger volumes in covered markets. However,it is not clear whether this increase in competition is drivenby coverage. To test whether the steps taken by covered air-ports had a significant impact on the number and identity offirms, we estimate two regressions:
ΔtNumber.Firmsmt = Δtzmtγ + τ11[1 coverm]+ τ21[2 coverm] + Δεmt
and
ΔtLcc.Penetrationmt = Δtzmtγ + τ11[1 coverm]+ τ21[2 coverm] + Δεmt ,
where the dependent variables in these regressions are thenumber of firms serving the market and an indicator forwhether a low-cost carrier is present, respectively.
The estimates of the coefficients on the coverage indica-tors are presented in table 9. We find that for markets with one(both) end point(s) covered, there is a 0.11 (0.40) increase inthe probability of a low-cost carrier serving the market. While
Table 9.—Competition Regressions
All Markets 0.2 of Cutoff 0.1 of Cutoff(1) (2) (3)
Lcc.Presence N = 2,978 N = 2,746 N = 1,8251[1 cover] 0.114∗∗∗ 0.117∗∗∗ 0.108∗∗
(0.043) (0.044) (0.043)
1[2 cover] 0.305∗∗∗ 0.298∗∗∗ 0.404∗∗∗(0.084) (0.084) (0.106)
R2 0.008 0.008 0.020Log(Number.Firms) N = 2,978 N = 2,746 N = 1,825
1[1 cover] −0.142 −0.137 −0.105(0.214) (0.215) (0.223)
1[2 cover] −0.351 −0.377 −0.053(0.325) (0.313) (0.330)
R2 0.006 0.007 0.007
Additional controls include Population Origin, Population Dest, Per-Cap Income Origin, Per-Cap IncomeDest. Statistical significance: ***1%, **5%, *10%.
there are obvious caveats in interpreting the coefficients of asecond differenced linear probability model, at a minimum,this corroborates our finding that variation in the low-costindicator played a major role in explaining between 30% and50% of the reduction in fares as a result of coverage. We findAIR-21 has no significant impact on the average number offirms serving a market.
B. Regression Discontinuity Design
There are many strengths associated with Black’s (1999)approach. The results, however, rely on a number of assump-tions, including homogeneity of the coverage effect andexogeneity of coverage, to estimate the effects of coverageby AIR-21. These assumptions can be troublesome becausemore concentrated airports (those with two carriers enplaningmore than 50% of the passengers) are treated, while less con-centrated airports are not. Therefore, any covariation betweenfares and concentration after the first quarter of 2001 (thetime of the treatment) would be empirically indistinguish-able from a treatment effect due to AIR-21. While theseassumptions are difficult to test formally, it is possible tomeasure a local-average treatment effect (LATE) around thetreatment cutoff in the absence of these assumptions using

BARRIERS TO ENTRY IN THE AIRLINE INDUSTRY 1017
an RD approach. Examining treatment and control groups“very near” either side of the treatment cutoff allows us todisentangle those movements in fares that result from cov-erage from those that are simply due to correlation betweenfares and concentration. We discuss our approach below.21
Defining LATEs. Estimation of the LATEs here is com-plicated by the two-dimensional predictor vector. Instead ofa point, our LATE estimates are now functions of the predic-tors of treatment, Porig
m and Pdestm . Let Yijmt(o, d), o, d ∈ {0, 1},
denote the outcome variable when the origin treatment statusis o and the destination treatment status is d. For each obser-vation, we get to observe one of the four possible values ofthe variable. When only one end point is treated, we definethe LATEs as
τorig1 (Pdest
m ) = E[Yimt(1, 0) − Yimt(0, 0)|Porigm = .5Pdest
m < .5],τdest
1 (Porigm ) = E[Yimt(0, 1) − Yimt(0, 0)|Porig
m < .5Pdestm = .5],
and when both end points are treated,
τorig2 (Pdest
m ) = E[Yimt(1, 1) − Yimt(0, 1)|Porigm = .5Pdest
m > .5],τdest
2 (Porigm ) = E[Yimt(1, 1) − Yimt(1, 0)|Porig
m > .5Pdestm = .5].
Our definition of treatment effects is motivated by severalconsiderations. First are identification considerations. Ourdata are lumpy in the sense that the predictors of coverage donot vary within an airport, so for a sufficiently small windowaround a given concentration level, all the markets in thatwindow will be drawn from a single airport. For example,consider Dallas–Fort Worth (DFW), which has a predictorvalue of around 0.8, well away from the coverage cutoff.The estimate of τ2
dest(0.8) compares the path of fares overthe period since the passage of AIR-21 in markets origi-nating at DFW and terminating at airports just below thecoverage cutoff to markets originating at DFW and terminat-ing at airports just above the coverage cutoff. This approachallows us to control, to some extent, for fixed unobserved fac-tors associated with given airports that are potentially distantfrom the coverage cutoffs. Second, in contrast to the win-dow regressions, allowing the treatment effect to vary alongthe treatment cutoff in addition to the local linear regressionimplementation, discussed below, we estimate the effect ofcoverage more flexibly. Figure 4 shows that the majority ofthe observations are near the treatment cutoff, making sucha flexible approach feasible. Moreover, Berry and Jia (2010)suggest there is direct evidence that the treatment effects maydiffer in airport concentration. Of course, the interpretation ofour estimates as a flexible interactive effect is invalid if thereis selection inherent in conditioning on the away-from-the-boundary-airport concentration level, which is likely giventhat a single airport will dominate any small bin. However,
21 See Imbens and Lemieux (2008) for an introduction to RD and Hahn,Todd, and Van Der Klaauw (2001) for a detailed discussion of identificationof treatment effects within an RD framework.
even in the presence of such selection, we can still interpretthe estimates as an estimate of LATE heterogeneity wherethe heterogeneity corresponds to interaction with whatever isdriving selection.
Our major task in estimation is to adapt the basic RDframework to account for a two-dimensional predictor vector.This requires flexibly estimating a two-dimensional surfacethat relates Yimt to {Porig
m , Pdestm }. Local linear estimators are
particularly attractive for this type of problem (see Imbens& Lemieux, 2008). At boundary points of the support forthe predictor vector, local linear estimators do not sufferfrom the inherent bias of kernel estimators and achieve fasterrates of convergence. In addition, local linear estimators areeasily extended to multiple dimensions. Fan and Gijbels(1996) provide a detailed discussion of the advantages oflocal-polynomial modeling.
To demonstrate our approach, suppose we are estimat-ing τ
orig1 (Pdest
m ). This requires us to estimate the conditionalexpectation, E[Yimt(1, 0) − Yimt(0, 0)|Porig
m = .5, Pdestm < .5],
for each Pdestm < .5. For a particular value of Pdest
m , Pdest
, theestimator is defined as
τorig1 (P
dest) = α̂c+ − α̂c−,
where
min{αc− ,βc−
orig,βc−dest
}∑m:
{Porigm <.5,Pdest
m <.5}
[Yimt(0, 0) − αc−0
− βc−orig(P
origm − .5) − βc−
dest(Pdestm − P
dest)]2w−
m (2)
and
min{αc+ ,βc+
orig,βc+dest
}∑m:
{Porigm ≥.5,Pdest
m <.5}
[Yimt(1, 0) − αc+0
− βc+orig(P
origm − .5) − βc+
dest(Pdestm − P
dest)]2w+
m . (3)
The weights, w+m , are calculated as
w+m =
φ
(Porig
m −0.5horig , Pdest
m −Pdest
hdest
)∑
j: Porigj ≥.5,Pdest
j <0.5 φ
(Porig
j −0.5
horig ,Pdest
j −Pdest
hdest
) ,
where φ(·) is the bivariate standard normal pdf and horig andhdest are bandwidths. The weights, w−
m , are defined similarly.This process is then repeated for a range of values for P
dest
to get an estimate of the treatment effect, τorig1 (Pdest
m ), alongthe entire treatment cutoff. The estimators of τdest
1 (Porigm ),
τorig1 (Pdest
m ), and τdest2 (Pdest
m ) are defined similarly.To simplify the choice of bandwidth in multiple dimen-
sions, we transform the predictors of coverage prior to esti-mation to have mean zero and identity covariance matrix (seePagan & Ullah, 1999). This allows us to check the sensitivity

1018 THE REVIEW OF ECONOMICS AND STATISTICS
Figure 5.—Smoothed Surfaces, Average Fares, and LCC Penetration
of our results by varying a single factor of proportionality, k,such that both horig and hdest are equal to
h = kN− 14+d ,
where N is the number of observations in the quadrant ofinterest and d = 2 (dimension of predictor support). Inequations (2) and (3),
N+ =∑
m
1[Porigm < .5, Pdest
m < .5]
and
N− =∑
m
1[Porigm ≥ .5, Pdest
m < .5],
respectively. We find our results to be insensitive to thechoice of bandwidth and use k = 2 for all the RD analy-sis, which allows a great deal of flexibility, as we will discussbelow, yet adequately smooths the surface.22
Calculating asymptotically valid standard errors for ourestimates is a nontrivial computational exercise for a numberof reasons. First, we are estimating a nonparametric surfacein multiple dimensions. Second, we are most interested inthe estimates of this nonparametric surface at the coveragecutoffs. Finally, we must account for the dependence in ourdata resulting from markets having end points in common,as was the case in the window regressions. For these reasons,we appeal to the resampling with dependent data literature
22 We also explored cross-validation methods for choosing k, but we findit performs very poorly in our application by suggesting a bandwidth near0 that overfits the data. A few aspects of our application and the method(interdependence of observations, multiple dimensional predictor vector,and the slow convergence rate of the cross-validation method) make this anunsurprising result.
to calculate asymptotically valid point-wise standard errors.(For a detailed treatment of resampling techniques for depen-dent data, see Lahiri, 2003). The clear dependence structurein our data makes application of these techniques straightfor-ward. We treat the sample as representative of the populationand compute jack-knife standard errors where we leave outblocks of markets with a common end point. Precisely, foreach airport we find all markets with a common end pointand drop them from the sample. Using the resulting subsam-ple, we then reestimate the model. We repeat this process foreach market and use the distribution of the estimates acrosssubsamples to infer moments of the asymptotic distributionof our LATEs.
Results. The results and conclusions of our RD anal-ysis are consistent and nearly identical to our findingsusing the window regression approach. For this reason, wefocus the discussion of our RD results on the impact ofcoverage on fares and low-cost competition. Figures 5aand 5b present the surfaces relating second differences ofthe average fare and low-cost penetration, ΔtAvg.Fareijmt
and ΔtLcc.Penetrationmt , respectively, to the predictors oftreatment, where we smooth over the policy discontinuity.Foreshadowing the results from our RD analysis, we find thegradient of the surface changes rapidly around the treatmentcutoffs in a way that is consistent with the results from thewindow regressions. In particular, there are four clearly vis-ible planes in each of the surfaces, corresponding to the fourquadrants in figure 1.
Figure 6 shows the estimated surface for a representativeregion of the surface relating the second difference of averagefares to the predictors of treatment, along with the data usedin estimation in the same region, when we allow for a breakat the coverage cutoff. The figure makes clear that our RDis not as clear as many in the literature, in the sense that the

BARRIERS TO ENTRY IN THE AIRLINE INDUSTRY 1019
Figure 6.—Local Coverage Effect on Average Fare
discontinuity is not plainly visible. This is not surprising dueto the high variability in fares, two-dimensional support ofour predictors, and the clumpiness of the data. This motivatesour two-dimensional smoothing procedure.
Figures 7a and 7b and table 10 present the complete resultsof our RD analysis of fares and low-cost entry. Figures 7aand 7b show the RD surfaces, relating average fares and low-cost entry to the predictors of treatment, respectively, whileallowing for a break in the surface at the coverage cutoffs. Notsurprisingly, given the smoothed surfaces in Figures 5a and5b and our findings from the window regressions, we findeconomically and statistically significant breaks along thecoverage cutoffs for both market outcomes. Table 10 presentsthe point estimates along with standard errors, calculatedusing the block-bootstrapping procedure already discussed.Collectively, the results of our RD analysis both corroborateand provide additional insights to the findings gleaned fromthe window regressions.
The RD estimates of the effect on average fares of goingfrom no end points treated to one end point treated range from12% to 15%, only slightly larger than our findings from thewindow regressions. The effect of going from no coverageto both end points covered, if measured as the jump right atthe vertex of the four surfaces, is about 27% (15.8 plus 11.6or 15.6 plus 11.3). While, strictly speaking, this is the onlycorrect way to measure this effect, averaging over the sur-faces suggests the effect is around 18% to 21%. The reasonfor this difference is that unlike the window regressions, wedon’t impose symmetric effects for the one-end-point treatedmarkets, and as figure 7a shows, we find substantial het-erogeneity in the LATEs for the effect of coverage for thesecond market endpoint. Specifically, the effect of coverageis substantial and statistically significant for less concentratedairports (about 0.5), while not statistically different from 0for more concentrated airports (0.6 or greater).23
23 The symmetry of the surface remains, and the results are nearly identicalif the return legs of round-trip tickets are not used in computing fares.
For low-cost penetration, the magnitudes of the estimatesare slightly smaller and exhibit some interesting patterns. Oneadvantage of employing a true RD approach in our applica-tion is the opportunity to look for heterogeneity in the effectof coverage. This heterogeneity is obvious as one looks atthe point estimates of the effect from coverage on low-costpenetration in table 10. This heterogeneity is also clearly vis-ible in figure 7b. Looking at the estimates of τ
orig1 (Pdest
m ), wefind a nearly monotonic relationship between concentrationand the effect of coverage on low-cost entry, ranging froma point estimate of 0.024 to 0.218. As one would expect,coverage had its largest effect on entry in more concentratedmarkets. This explains why we get a statistically insignifi-cant point estimate for the coefficient on 1[1 coverm] in thewindow regressions, where we can identify only an averageeffect of coverage. The effect of going from no end point toboth end points being covered, again measured at the jump ofthe vertex between the four surfaces, is 0.28 and 0.31. Thisimplies that approximately three additional markets out ofevery ten, with a two-firm concentration of above 0.5, havea low-cost presence as a result of AIR-21. Consistent withthe fare estimates, we find only a moderate increase in low-cost penetration in the most concentrated markets when thesecond end point is covered. Collectively, our results sug-gest that coverage had the largest effect, fare declines andincreased low-cost penetration, on moderately concentratedairports.
Regression-Discontinuity Validity. Above, we have dis-cussed why we are comfortable assuming there are no (local)selection effects associated with AIR-21. The validity of ouridentifying assumption also requires there be no problemwith incentive effects; that is, that carriers do not manip-ulate enplanement levels to avoid treatment. There are anumber of reasons that we believe this is a valid assump-tion. First, coverage is determined at the airport level, notthe airline level. Therefore, no individual airline can manip-ulate enplanements and entirely determine coverage; rather,it would take a cooperative effort by airlines serving the air-port. Second, coverage in each year was determined usingFAA enplanement data from two years earlier. An airlineattempting to avoid coverage by the legislation would havebeen required to foresee the exact details of the legislation(including the exact enplanement cutoff) two years in advanceof its passage.24 Finally, manipulating enplanements at anyone airport, particularly a large airport, has significant coststo an airline in terms of adjusting traffic in its entire network.
Extending formal tests to check for the strategic manip-ulation of enplanements (see McCrary, 2008) with a two-dimensional predictor vector is not immediately clear. How-ever, we develop an informal test for manipulation of thepredictors of treatment and provide evidence that little or no
24 We also examined enplanements of airports near the coverage cutoff inthe years prior to AIR-21, 1998 to 2000. We find no evidence that concen-tration measures changed in a way that would suggest airports or carriersknew of the particular value of the coverage cutoff.

1020 THE REVIEW OF ECONOMICS AND STATISTICS
Figure 7.—RD Surface, Average Fare, and LCC Penetration
Table 10.—RDD Coverage Estimates, Avg.Fare and Lcc.Presence
Predictor τ(Porig < 0.5, Pdest = 0.5) Predictor τ(Porig < 0.5, Pdest = 0.5)
(Porig, Pdest) Log(Avg.Fare) Lcc.Presence (Porig, Pdest) Log(Avg.Fare) Lcc.Presence
(0.4,0.50) −0.128∗∗∗ 0.024 (0.50,0.40) −0.136∗∗∗ 0.038(0.019) (0.033) (0.02) (0.032)
(0.42,0.50) −0.153∗∗∗ 0.017 (0.50,0.42) −0.168∗∗∗ 0.048∗(0.02) (0.03) (0.02) (0.03)
(0.44,0.50) −0.168∗∗∗ 0.046∗ (0.50,0.44) −0.177∗∗∗ 0.085∗∗∗(0.021) (0.026) (0.019) (0.027)
(0.46,0.50) −0.153∗∗∗ 0.112∗∗∗ (0.50,0.46) −0.151∗∗∗ 0.145∗∗∗(0.019) (0.022) (0.017) (0.024)
(0.48,0.50) −0.144∗∗∗ 0.158∗∗∗ (0.50,0.48) −0.143∗∗∗ 0.183∗∗∗(0.017) (0.023) (0.016) (0.026)
(0.50,0.50) −0.17∗∗∗ 0.197∗∗∗ (0.50,0.50) −0.173∗∗∗ 0.218∗∗∗(0.019) (0.028) (0.018) (0.031)
(0.50,0.50) −0.12∗∗∗ 0.07∗∗∗ (0.50,0.50) −0.124∗∗∗ 0.092∗∗∗(0.014) (0.024) (0.014) (0.021)
(0.52,0.50) −0.09∗∗∗ 0.053∗∗∗ (0.50,0.52) −0.094∗∗∗ 0.081∗∗∗(0.012) (0.023) (0.013) (0.021)
(0.54,0.50) −0.063∗∗∗ 0.041∗ (0.50,0.54) −0.066∗∗∗ 0.074∗∗∗(0.012) (0.023) (0.013) (0.022)
(0.56,0.50) −0.039∗∗∗ 0.034 (0.50,0.56) −0.043∗∗∗ 0.071∗∗∗(0.011) (0.023) (0.012) (0.022)
(0.58,0.50) −0.021∗∗∗ 0.032 (0.50,0.58) −0.024∗∗∗ 0.07∗∗∗(0.011) (0.023) (0.012) (0.022)
(0.60,0.50) −0.007 0.034 (0.50,0.60) 0.011 0.072∗∗∗(0.011) (0.023) (0.011) (0.022)
(0.62,0.50) 0.004 0.039∗ (0.50,0.62) 0.011 0.076∗∗∗(0.011) (0.023) (0.011) (0.022)
(0.64,0.5) 0.013 0.048∗∗∗ (0.50,0.64) 0.011 0.082∗∗∗(0.011) (0.023) (0.011) (0.022)
Statistical significance: ***1%, **5%, *10%.
strategic manipulation of enplanements occurred. The testis based on the simple observation that airports just belowthe coverage cutoff in which one carrier controls a largerproportion of the traffic will be most vulnerable to strate-gic manipulation of enplanements. For example, considertwo airports where the two largest carriers enplane 49% ofthe passengers. Suppose at the first airport, the top carrier
enplanes 35% of all passengers, while the top carrier at thesecond airport enplanes 25% of all passengers. If an airlinewas attempting to avoid coverage of an airport by AIR-21 bymanipulating enplanements, one would expect this to occurat the first airport. At the first airport, the largest carrierwould have greater control in ensuring that the airport wasnot covered.
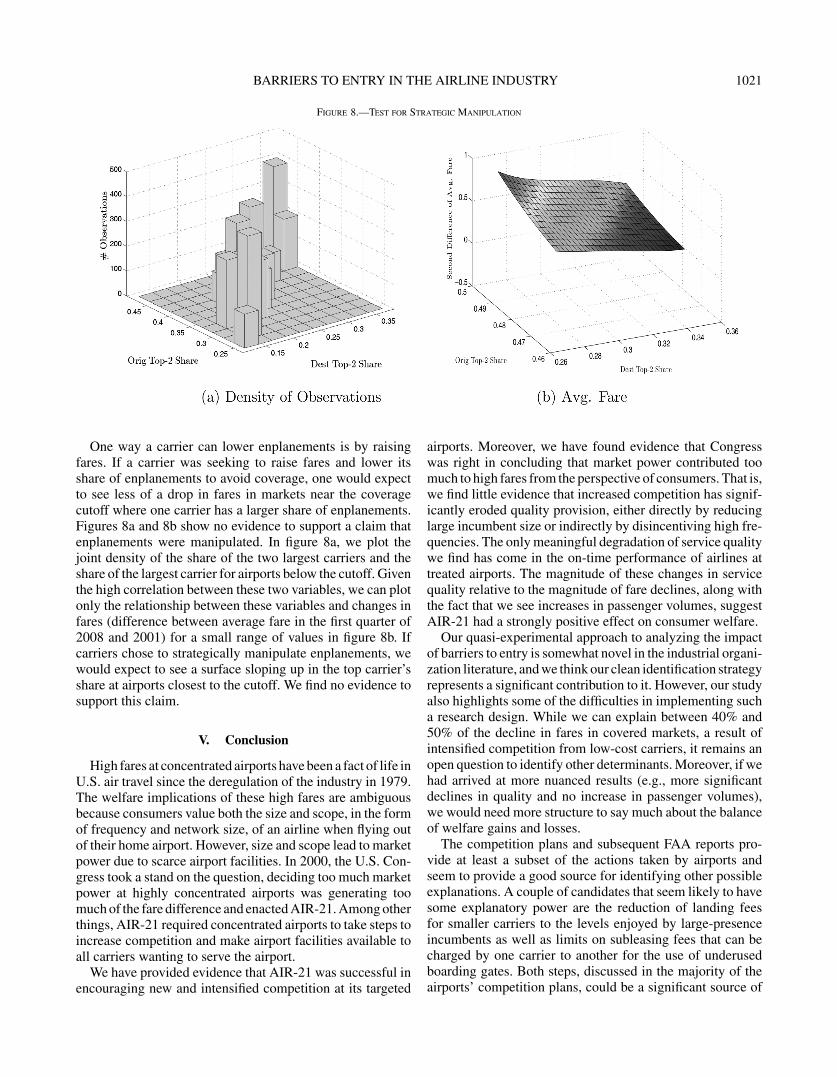
BARRIERS TO ENTRY IN THE AIRLINE INDUSTRY 1021
Figure 8.—Test for Strategic Manipulation
One way a carrier can lower enplanements is by raisingfares. If a carrier was seeking to raise fares and lower itsshare of enplanements to avoid coverage, one would expectto see less of a drop in fares in markets near the coveragecutoff where one carrier has a larger share of enplanements.Figures 8a and 8b show no evidence to support a claim thatenplanements were manipulated. In figure 8a, we plot thejoint density of the share of the two largest carriers and theshare of the largest carrier for airports below the cutoff. Giventhe high correlation between these two variables, we can plotonly the relationship between these variables and changes infares (difference between average fare in the first quarter of2008 and 2001) for a small range of values in figure 8b. Ifcarriers chose to strategically manipulate enplanements, wewould expect to see a surface sloping up in the top carrier’sshare at airports closest to the cutoff. We find no evidence tosupport this claim.
V. Conclusion
High fares at concentrated airports have been a fact of life inU.S. air travel since the deregulation of the industry in 1979.The welfare implications of these high fares are ambiguousbecause consumers value both the size and scope, in the formof frequency and network size, of an airline when flying outof their home airport. However, size and scope lead to marketpower due to scarce airport facilities. In 2000, the U.S. Con-gress took a stand on the question, deciding too much marketpower at highly concentrated airports was generating toomuch of the fare difference and enacted AIR-21. Among otherthings, AIR-21 required concentrated airports to take steps toincrease competition and make airport facilities available toall carriers wanting to serve the airport.
We have provided evidence that AIR-21 was successful inencouraging new and intensified competition at its targeted
airports. Moreover, we have found evidence that Congresswas right in concluding that market power contributed toomuch to high fares from the perspective of consumers. That is,we find little evidence that increased competition has signif-icantly eroded quality provision, either directly by reducinglarge incumbent size or indirectly by disincentiving high fre-quencies. The only meaningful degradation of service qualitywe find has come in the on-time performance of airlines attreated airports. The magnitude of these changes in servicequality relative to the magnitude of fare declines, along withthe fact that we see increases in passenger volumes, suggestAIR-21 had a strongly positive effect on consumer welfare.
Our quasi-experimental approach to analyzing the impactof barriers to entry is somewhat novel in the industrial organi-zation literature, and we think our clean identification strategyrepresents a significant contribution to it. However, our studyalso highlights some of the difficulties in implementing sucha research design. While we can explain between 40% and50% of the decline in fares in covered markets, a result ofintensified competition from low-cost carriers, it remains anopen question to identify other determinants. Moreover, if wehad arrived at more nuanced results (e.g., more significantdeclines in quality and no increase in passenger volumes),we would need more structure to say much about the balanceof welfare gains and losses.
The competition plans and subsequent FAA reports pro-vide at least a subset of the actions taken by airports andseem to provide a good source for identifying other possibleexplanations. A couple of candidates that seem likely to havesome explanatory power are the reduction of landing feesfor smaller carriers to the levels enjoyed by large-presenceincumbents as well as limits on subleasing fees that can becharged by one carrier to another for the use of underusedboarding gates. Both steps, discussed in the majority of theairports’ competition plans, could be a significant source of

1022 THE REVIEW OF ECONOMICS AND STATISTICS
cost pass-throughs from carriers to consumers. Carriers mayalso simply reduce fares to generate outcomes consistent withthe goals of AIR-21 to avoid additional oversight in the future.We leave more detailed investigation of these channels forfuture research.
REFERENCES
Berry, Steven, “Airport Presence as Product Differentiation,” AmericanEconomic Review P&P 80 (1990), 394–399.
——— “Estimation of a Model of Entry in the Airline Industry,” Econo-metrica 60 (1992), 889–917.
Berry, Steven, Michael Carnall, and Pablo Spiller, “Airline Hubs: Costs,Markups, and the Implications of Costumer Heterogeneity,” in DarinLee, ed., Advances in Airline Economics, Competition Policy andAntitrust, vol. 1 (New York: Elsevier, 2006).
Berry, Steven, and Panle Jia, “Tracing the Woes: An Empirical Analysis ofthe Airline Industry,” American Economic Journal: Microeconomics2 (2010), 1–43.
Black, Sandra, “Do Better Schools Matter? Parental Valuation of Ele-mentary Education,” Quarterly Journal of Economics 114 (1999),577–599.
Borenstein, Severin, “Hubs and High Fares: Dominance and Market Powerin the U.S. Airline Industry,” Rand Journal of Economics 20 (1989),344–365.
Borenstein, Severin, and Nancy Rose, “Competition and Price Dispersion inthe U.S. Airline Industry,” Journal of Political Economy 102 (1994),653–683.
Bresnahan, Timothy, and Peter Reiss, “Entry and Competition in Concen-trated Markets,” Journal of Political Economy 99 (1991), 977–1009.
Brueckner, Jan, Darin Lee, and Ethan Singer, “Airline Competition andDomestic U.S. Airfares: A Comprehensive Reappraisal,” Universityof California, Irvine, working paper (2011).
Brueckner, Jan, and Pablo Spiller, “Economies of Traffic Density in theDeregulated Airline Industry,” Journal of Law and Economics 37(1994), 379–415.
Cameron, A. Colin, Jonah Gelbach, and Douglas Miller, “Robust Inferencewith Multi-Way Clustering,” NBER technical working paper T0327(2007).
Ciliberto, Federico, and Elie Tamer, “Market Structure and MultipleEquilibria in the Airline Industry,” Econometrica 77 (2009), 1791–1828.
Ciliberto, Federico, and Jonathan Williams, “Limited Access to AirportFacilities and Market Power in the Airline Industry,” Journal of Lawand Economics 53 (2010), 467–495.
Evans, William, and Ioannis Kessides, “Living by the ‘Golden Rule’: Mul-timarket Contact in the U.S. Airline Industry,” Quarterly Journal ofEconomics 109 (1994), 341–366.
Fan, Jianqing, and Irène Gijbels, Local Polynomial Modelling and ItsApplications (London: Chapman & Hall, 1996).
Forbes, Silke J., “The Effect of Air Traffic Delays on Airline Prices,”International Journal of Industrial Organization 26 (2008), 1218–1232.
Goolsbee, Austan, and Chad Syverson, “How Do Incumbents Respond tothe Threat of Entry? Evidence from the Major Airlines,” QuarterlyJournal of Economics 123 (2008), 1611–1633.
Hahn, Jinyong, Petra Todd, and Wilbert Van Der Klaauw, “Identification andEstimation of Treatment Effects with a Regression-DiscontinuityDesign,” Econometrica 69 (2001), 201–209.
Halvorsen, Robert, and Raymond Palmquist, “The Interpretation of DummyVariables in Semilogarithmic Equations,” American EconomicReview 70 (1980), 474–475.
Imbens, Guido, and Thomas Lemieux, “Regression Discontinuity Designs:A Guide to Practice,” Journal of Econometrics 142 (2008),615–635.
Lahiri, Soumendra, Resampling Methods for Dependent Data (New York:Springer, 2003).
Lederman, Mara, “Do Enhancements to Loyalty Programs Affect Demand?The Impact of International Frequent Flyer Partnerships on Domes-tic Airline Demand,” Rand Journal of Economics 38 (2007),1134–1158.
——— “Are Frequent Flyer Programs a Cause of the ‘Hub Premium’?”Journal of Economics and Management Strategy 17 (2008), 35–66.
Mayer, Christopher, and Todd Sinai, “Network Effects, Congestion Exter-nalities, and Air Traffic Delays: Or Why Not All Delays Are Evil,”American Economic Review 93 (2003), 1194–1215.
Mazzeo, Michael, “Product Choice and Oligopoly Market Structure,” RandJournal of Economics 33 (2002), 221–242.
McCrary, Justin, “Testing for Manipulation of the Running Variable inthe Regression Discontinuity Design,” Journal of Econometrics 142(2008), 698–714.
Pagan, Adrian, and Aman Ullah, Nonparametric Econometrics (Cam-bridge: Cambridge University Press, 1999).
Seim, Katja, “An Empirical Model of Firm Entry with Endogenous Product-Type Choices,” Rand Journal of Economics 37 (2006), 619–640.
Transportation Research Board, Entry and Competition in the U.S. AirlineIndustry: Issues and Opportunities (Washington, DC: Transporta-tion Research Board, 1999).
U.S. General Accounting Office, Barriers to Competition in the AirlineIndustry (Washington, DC: U.S. General Accounting Office, 1989).
——— Airline Competition: Industry Operating and Marketing PracticesLimit Market Entry (Washington, DC: U.S. General AccountingOffice, 1990).
——— Challenges in Enhancing Competition in Dominated Markets(Washington, DC: U.S. General Accounting Office, 2001).
Williams, Jonathan, “Capacity Investments, Exclusionary Behavior, andWelfare: A Dynamic Model of Competition in the Airline Industry,”SSRN working paper 1375450 (2012).
Related Documents