Barriers to coastal shipping development: an Indian perspective Article (Accepted Version) http://sro.sussex.ac.uk Venkatesh, V G, Zhang, Abraham, Luthra, Sunil, Dubey, Rameshwar, Subramanian, Nachiappan and Mangla, S (2017) Barriers to coastal shipping development: an Indian perspective. Transportation Research Part D: Transport and Environment, 52a. pp. 362-378. ISSN 1361-9209 This version is available from Sussex Research Online: http://sro.sussex.ac.uk/id/eprint/67134/ This document is made available in accordance with publisher policies and may differ from the published version or from the version of record. If you wish to cite this item you are advised to consult the publisher’s version. Please see the URL above for details on accessing the published version. Copyright and reuse: Sussex Research Online is a digital repository of the research output of the University. Copyright and all moral rights to the version of the paper presented here belong to the individual author(s) and/or other copyright owners. To the extent reasonable and practicable, the material made available in SRO has been checked for eligibility before being made available. Copies of full text items generally can be reproduced, displayed or performed and given to third parties in any format or medium for personal research or study, educational, or not-for-profit purposes without prior permission or charge, provided that the authors, title and full bibliographic details are credited, a hyperlink and/or URL is given for the original metadata page and the content is not changed in any way.

Welcome message from author
This document is posted to help you gain knowledge. Please leave a comment to let me know what you think about it! Share it to your friends and learn new things together.
Transcript
Barriers to coastal shipping development: an Indian perspective
Article (Accepted Version)
http://sro.sussex.ac.uk
Venkatesh, V G, Zhang, Abraham, Luthra, Sunil, Dubey, Rameshwar, Subramanian, Nachiappan and Mangla, S (2017) Barriers to coastal shipping development: an Indian perspective. Transportation Research Part D: Transport and Environment, 52a. pp. 362-378. ISSN 1361-9209
This version is available from Sussex Research Online: http://sro.sussex.ac.uk/id/eprint/67134/
This document is made available in accordance with publisher policies and may differ from the published version or from the version of record. If you wish to cite this item you are advised to consult the publisher’s version. Please see the URL above for details on accessing the published version.
Copyright and reuse: Sussex Research Online is a digital repository of the research output of the University.
Copyright and all moral rights to the version of the paper presented here belong to the individual author(s) and/or other copyright owners. To the extent reasonable and practicable, the material made available in SRO has been checked for eligibility before being made available.
Copies of full text items generally can be reproduced, displayed or performed and given to third parties in any format or medium for personal research or study, educational, or not-for-profit purposes without prior permission or charge, provided that the authors, title and full bibliographic details are credited, a hyperlink and/or URL is given for the original metadata page and the content is not changed in any way.
Barriers to Coastal Shipping Development: An Indian Perspective
V. G. Venkatesh
Department of Management Systems, Waikato Management School, The University of Waikato,
Hamilton 3240, New Zealand. Email: [email protected]
Abraham Zhang (Corresponding author)
Auckland University of Technology (AUT) Busienss School, Private Bag 92006, Auckland
1142, New Zealand. Tel: (64) 9 921 9999 ext 5327; E-mail: [email protected]
Sunil Luthra
Department of Mechanical Engineering, Government Engineering College, Nilokheri-132117,
Haryana, India. Email: [email protected]
Rameshwar Dubey
Montpellier Business School, 2300 avenues des Moulins, 34185 Montpellier cedex 4, France.
Email: [email protected]
Nachiappan Subramanian University of Sussex School of Business, Management and Economics Jubilee Building 302 Falmer,
Brighton, UK BN1 9SL UK
Email : [email protected]
S. Mangla
Department of Mechanical Engineering, Graphic Era University, Dehradun- 248002,
Uttarakhand, India. Email: [email protected]
Abstract: Coastal shipping has been widely recognised as a sustainable and efficient alternative
to road transport. However, the barriers encountered in the industry have not been systematically
studied in any region. From an Indian perspective, this study aims to prioritise barriers to coastal
shipping development for effective policy interventions. It identifies important barriers through a
Delphi study and then quantifies their cause-and-effect relationships by the decision making-trial
and evaluation laboratory analysis (DEMATEL) technique. It is interesting that the main barriers,
those have most impact on coastal shipping development, are not necessarily the ones most
widely recognized. The study also uncovers the hidden cause-and-effect relationships between
several barriers. Four main barriers are identified: 1) Indian maritime legislation (especially
cabotage rules); 2) issues in the infrastructure and procedures at port and port-centric areas; 3)
underdevelopment of small ports; 4) lack of a collaborative culture among the various service
providers involved in the logistics supply chain. This study finally recommends relaxing
cabotage rules to stimulate the inflow of foreign capital to grow coastal shipping, improving the
current port system through joint efforts of the ports, Indian customs and government, and
fostering supply chain collaboration.
Keywords: Coastal Shipping; Short Sea Shipping; India; Delphi study; Fuzzy DEMATEL.
1. Introduction
Coastal shipping is the transport of goods along the coast over relatively short distances, as
opposed to intercontinental cross-ocean deep sea shipping. In recent years, coastal shipping has
been increasingly recognised as a sustainable and efficient alternative to road transport (Saldanha
and Gray, 2002; Reis, 2014). It is more environmentally friendly as it produces far less
greenhouse gas emissions and noise pollution. For medium- to long-distance freight transport, it
offers substantial cost savings. Furthermore, it can reduce traffic congestion and can lower
casualties due to accidents, which are common in road transport (Medda and Trujillo, 2010).
The term coastal shipping is often used interchangeably with short sea shipping in the literature
and practice (Musso and Marchese, 2002; Brooks and Frost, 2004; Grosso et al., 2010). There is
no worldwide consensus on their respective definitions, so it is difficult to clearly differentiate
them (Perakis and Denisis, 2008; Suárez-Alemán et al., 2014). We perceive two subtle
differences between prevalent use of these two terms. One difference is that coastal shipping
implicitly excludes freight movement at inland waterways, while short sea shipping has evolved
to include the use of inland waterways. For example, the United States (US) Maritime
Administration (MARAD) defines short sea shipping as an alternative form of shipping that uses
both inland and coastal waterways to move freight from major domestic ports to its destination
(MARAD, 2005; Yonge and Henesey, 2005). In Europe, a substantial amount of freight is
moved along the Rhine river and is regarded as short sea shipments. The other difference is that,
strictly speaking, coastal shipping refers to a single mode of waterborne transport, but short sea
shipment is a door-to-door intermodal movement in which transshipment at the road/sea
interface is the strategic element (Beškovnik, 2006). Therefore, coastal shipping does not include
intermodal/multimodal components as short sea shipping does. Given these two differences, it is
safe to argue that the term short sea shipping covers more than just coastal shipping.
Nevertheless, it is mainly the coastal shipping journey that generates environmental and
economic benefits in a door-to-door short sea shipment. This is especially true in regions where
there are few or no inland waterways for commercial navigation.
To exploit the potential of coastal shipping, several economies have initiated some major
programmes (Gouvernal et al., 2010). Since 1992, the European Union (EU) has been actively
funding short sea shipping projects to support the development of a more sustainable and
efficient intermodal freight system. In 2001, the EU launched the Marco Polo programme to
develop “Motorways of the Sea (MoS)”. This large-scale programme aims at shifting freight
from road to sea to relieve pressure on road transport by 20 billion tonne-kilometres (km). In fact,
short sea shipping has become the backbone of the EU’s transport policy (Perakis and Denisis,
2008; Douet and Cappuccilli, 2011). Similarly, the US government has launched a project called
Marine Highways to efficiently use its 29,000 nautical miles of navigable waterways. MARAD
leads the way in promoting short sea shipping and its vision is to reduce freight congestion on
road and on rail transportation networks by increasing intermodal capacity through the
underutilised waterways. Many other countries, including Australia (Bendall and Brooks, 2011),
China (Hong, 2007), Japan and South Korea (Medda and Trujillo, 2010) have also showed great
interest in coastal shipping development.
This study is motivated by a significant problem observed in the industry: despite a promising
future, coastal shipping has encountered many barriers to its development. In the European
Union, MoS projects have achieved limited success in spite of strong political backing and
favourable policies (Paixão Casaca and Marlow, 2002, 2005; Baindur and Viegas, 2011). In
North America, relevant studies point out major challenges and barriers (Brooks and Frost, 2004,
Perakis and Denisis, 2008). These studies sporadically offer valuable insights into the obstacles
to a modal shift to coastal shipping; however, none of them systematically prioritise the barriers
or analyse their relative impacts so as to inform effective policy intervention. In addition, the
contexts of these studies were developed Western economies, which are quite different from the
contexts of many developing countries that have observed much stronger growth in the port
sector. Apparently, there is a significant gap in the literature as extant research remains far from
scientifically analysing barriers to coastal shipping development, especially in the context of a
developing country.
This research aims to narrow the literature gap by conducting a systematic barrier study of
coastal shipping development. It addresses the following three research questions from the
perspective of India, a major developing country that has both great need and ambition to grow
its coastal shipping industry.
1) What are the prominent barriers hindering the development of coastal shipping?
2) How do these barriers interact with each other and how can they be prioritised for
identifying root causes?
3) What policies would be effective for overcoming the barriers?
This research answers the first question by a Delphi study to establish a list of important barriers
based on inputs from experienced practitioners in the Indian shipping industry. It tackles the
second question by employing a scientific prioritisation technique, decision making-trial and
evaluation laboratory analysis (DEMATEL), to systematically analyse the complicated
relationships between barriers. Based on the findings from the analysis, it discusses policy
implications to answer the third question.
This research makes important original contributions. To the best of our knowledge, this research
is the very first barrier study on coastal shipping or short sea shipping development. Besides
identifying the major barriers and understanding their causal relationships, the research
significantly contributes in eliciting discussions on policy implications. It timely meets the need
of providing scientific inputs to facilitate effective policy formulation to support coastal shipping
development. The insights offered are not only applicable to India, but also shed light on many
other economies that face similar obstacles to growing their coastal shipping.
The rest of this paper is organised as follows. Section 2 is a review of relevant literature. Section
3 describes the methods used. Section 4 explains data collection. Section 5 presents the results
and sensitivity analysis. Section 6 discusses policy implications. Section 7 concludes the research
and suggests areas for further investigation.
2. Literature review
This section reviews relevant literature. The first subsection provides an overview of coastal
shipping in India. The second subsection evaluates relevant quantitative techniques for analysing
the relationships among interdependent factors.
2.1 Coastal Shipping in India
Being one of the largest developing countries, India has the longest coastline in South Asia of
7,517 km. It has 12 major ports and over 200 small ports on its eastern and western coasts. Its
government has recognised the role of the shipping industry in its economy (Sakhuja, 2011).
Many new ports are under construction in a public-private partnership mode. The Indian
shipping industry is divided into four sectors whose operations are largely separated from each
other: overseas shipping, coastal shipping, offshore support services and inland water transport.
Vessels under the Indian flag are mostly deployed on international operations, which take up 93
percent of their total capacity, while coastal shipping takes up only 5.7 percent; the remainder is
for offshore support services (CII Report, 2012). Consequently, coastal shipping accounts for six
percent only in domestic transport on a tonne-km basis (TATA SMG Report, 2013). This share
of coastal shipping is very low compared to that of the EU, whose short sea shipping has a modal
share of about 40% (Reis et al., 2014). Obviously, the Indian coastline is underutilised for coastal
shipping. There are a variety of reasons for this, including longer transit time needed to connect
with only major ports, limited back haul opportunities, lack of awareness of its benefits, and
policy regulations pertaining to the coastal shipping industry (KPMG Report, 2013).
The need for coastal shipping development in India was first put forward by a few academic
researchers. In particular, Raghuram (2000) established the need for connecting coastal transport
for domestic logistics. He noted that, in the early 2000s, some companies were starting to use
coastal shipping to transfer goods domestically. Chandra and Jain’s (2007) review concluded that
the logistics sector in India had been rapidly developing in infrastructure and technology. Coastal
shipping was identified as a new mode of transport through which the industry could reduce
transportation costs yet enjoy better services. However, overall, very limited research has been
conducted on international transportation and shipping industries in India (Jim Wu and Lin,
2008). Coastal shipping has been “the neglected mode” among all the modes for domestic
transport in the Indian landscape (TATA SMG Report, 2013).
Not until the past few years has the Indian shipping industry acknowledged the potential of
coastal shipping and positive changes started to take place. Coastal shipping has now started to
be recognised in India as an attractive alternative to other modes because of its lower costs and
also as a sustainable way to relieve the pressure on rail and road transport. Because of these
benefits, the Indian government is making efforts to boost its growth (Čepinskis and Masteika,
2011; OIFC, 2012; Live Mint Report, 2014). On the Indian Maritime Agenda 2010-20, coastal
shipping is a focus for long-term growth (Raghuram and Shukla, 2014). A few studies on coastal
shipping opportunities have been conducted by the Ministry of Shipping and consulting
companies at policy levels (KPMG, 2013; India Transport Report, 2014). All of a sudden, it
seems, coastal shipping has become a hot topic in almost all the leading forums of transport
policy discussion.
The India Transport Report (2014) agrees that the growth of coastal shipping is very slow, and it
has recommended that some incentives be given to shippers and service providers to promote the
industry. The current government is looking at the possibility of introducing subsidies for coastal
shipping as opposed to road and rail transport. Also, with a proposed 20-30 percent reduction in
customs duty on fuels, coastal shipping promotion is gaining momentum in India. Chitravanshi
(2014) suggests that this adjustment and 5 percent cargo diversion to coastal shipping can result
in annual savings of Rs 2,000 crore (equivalent to 294 million US dollars) and (assuming a
cascading effect) a 6 percent reduction in pollutants and harmful chemicals. These prospects of
sustainable long-term benefits justify government subsidies to increase the share of coastal
shipping. Also, changes in the business environments of South Asian countries through regional
trade agreements are going to be a catalyst of trade in the region, which will increase the coastal
shipping trade exchanges (Kelegama, 2009). Furthermore, Ahmad (2014) highlights changes in
technology, such as green shipping, as enablers for coastal shipping in the coming years. Finally,
Raghuram and Shukla (2014) analysed the complete traffic profiles across Indian ports and
identified strategies for the growth of coastal shipping in the future.
In summary, coastal shipping has long been neglected in India. Although there are avenues for
coastal shipping to contribute to the Indian economy, the industry had little focus on this sector
in the past as there were many complexities involved in operating at the Indian coastal points.
Only in recent years has coastal shipping started to be recognised as an economical and
sustainable alternative to road and rail transport. The Indian government and the industry have
shown keen interest in growing coastal shipping. However, little research has been conducted to
develop understanding of the barriers to it, despite the great enthusiasm. Given this gap, it is
essential to conduct a systematic barrier study to generate scientific knowledge as strategic
inputs for effective policy formulation.
2.2 Barrier Study Techniques
To uncover the complicated interdependence among barriers, it is necessary to employ a
scientific prioritisation tool. Many sophisticated techniques can be used to analyse both
qualitative and quantitative factors to take into account trade-offs and multiple (even conflicting)
goals (Wang, 2009). Among them, analytic hierarchy process (AHP) and interpretive structural
modeling (ISM) have been very widely utilized because they are rigorous and relatively easy to
implement.
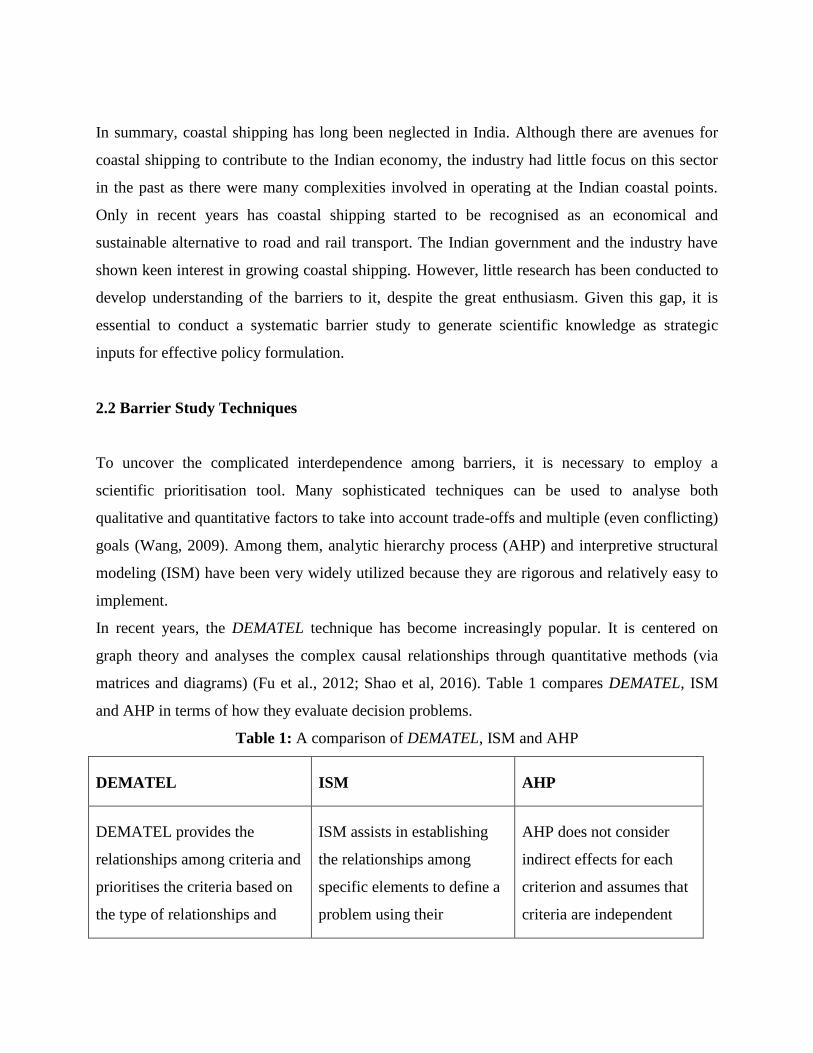
In recent years, the DEMATEL technique has become increasingly popular. It is centered on
graph theory and analyses the complex causal relationships through quantitative methods (via
matrices and diagrams) (Fu et al., 2012; Shao et al, 2016). Table 1 compares DEMATEL, ISM
and AHP in terms of how they evaluate decision problems.
Table 1: A comparison of DEMATEL, ISM and AHP
DEMATEL ISM AHP
DEMATEL provides the
relationships among criteria and
prioritises the criteria based on
the type of relationships and
ISM assists in establishing
the relationships among
specific elements to define a
problem using their
AHP does not consider
indirect effects for each
criterion and assumes that
criteria are independent
severity of their effects on each
other.
dependency and driving
power.
Source: Luthra et al. (2011, 2015), Mangla et al. (2013; 2015), Patil and Kant (2014)
Generally speaking, DEMATEL and ISM are better than AHP for analysing factors that are
dependent on each other. For a barrier study, DEMATEL had advantages over ISM as the former
not only helps visualize causal relationships among sub-systems through an impact-relations
map, but also shows the overall degree of influence of the respective factors (Gabus and Fontela,
1972; Liou et al., 2007; Alam-Tabriz et al., 2014). It can also divide multiple factors into cause
and effect groups in order to establish causal relationships visibly (Jim Wu et al., 2008). These
advantages explain why DEMATEL has been widely employed in barrier studies. Note that
DEMATEL takes up heterogeneous factors for analysis (Li and Wan, 2014; Benyoucef et al.,
2014; Herrera- Videma, 2015; Li et al., 2015). Moreover, it does not need a large amount of data
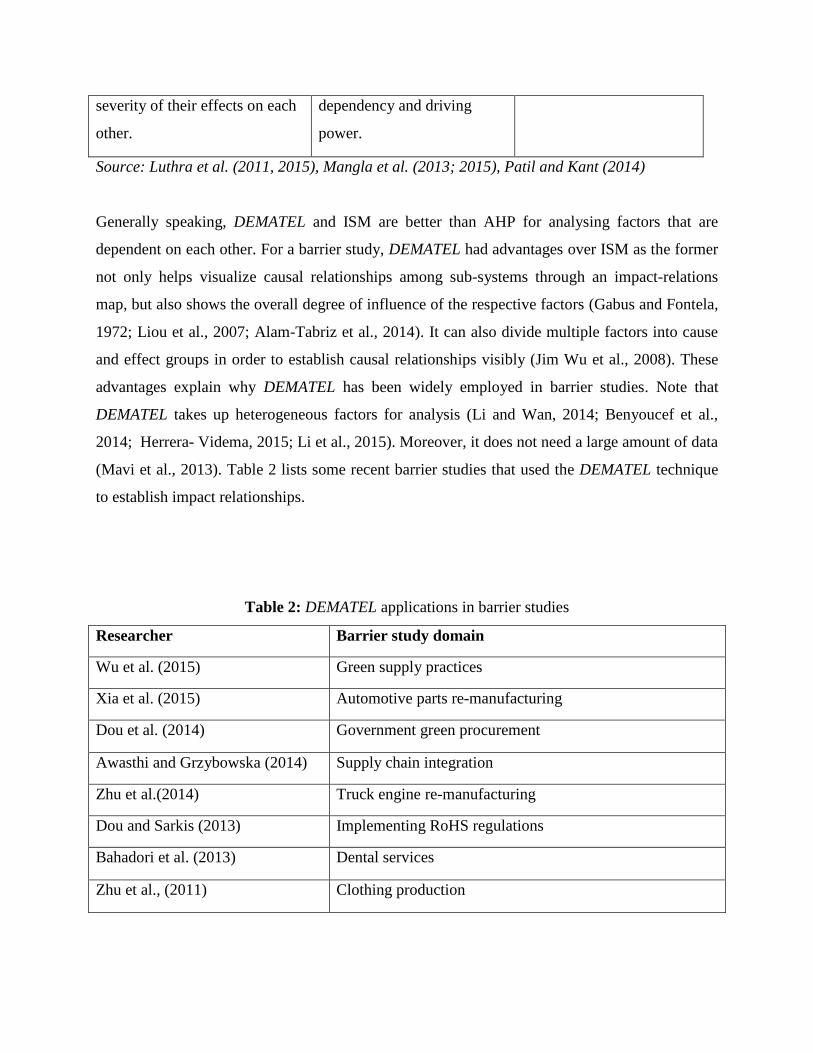
(Mavi et al., 2013). Table 2 lists some recent barrier studies that used the DEMATEL technique
to establish impact relationships.
Table 2: DEMATEL applications in barrier studies
Researcher Barrier study domain
Wu et al. (2015) Green supply practices
Xia et al. (2015) Automotive parts re-manufacturing
Dou et al. (2014) Government green procurement
Awasthi and Grzybowska (2014) Supply chain integration
Zhu et al.(2014) Truck engine re-manufacturing
Dou and Sarkis (2013) Implementing RoHS regulations
Bahadori et al. (2013) Dental services
Zhu et al., (2011) Clothing production
Whether or not barrier studies are involved, the DEMATEL technique is widely used in the
transportation domain. Some of the latest examples include Lee (2010), Zhu et al. (2011), Tzeng
and Huang (2012), Büyüközkan and Çifçi (2012), and Fahimi et al. (2014). These studies affirm
the use of DEMATEL for studying transport issues.
In this research, fuzzy set theory is used along with the DEMATEL technique. The main benefits
of fuzzy DEMATEL over non-fuzzy lies in dealing with problems of vagueness, bias and the
uncertainty associated with human judgment (Wu and Lee, 2007; Wu, 2012; Lin, 2013).
Furthermore, scholars and practitioners have successfully used fuzzy DEMATEL to evaluate
various systems and analyze various problems, in the areas of, for instance, knowledge
management adoption (Wu, 2012; Patil and Kant, 2014), software implementation (Wu et al.,
2011), truck selection (Baykasoğlu et al., 2013), green supplier evaluation and selection
(Büyüközkan and Çifçi, 2012) and green supply chain management practice analysis (Hsu et al.,
2013; Lin, 2013; Diabat, 2013).
In short, the DEMATEL technique yields a visualization of causal relationships between selected
factors in the form of an impact-relations map and calculates the degree of influence. It precisely
fits the objectives of this research. It is also relatively easy to implement as it does not require a
large amount of data. Given the involvement of human participants, it is best to use it along with
the fuzzy set theory. These explain the imperative rationale of using fuzzy DEMATEL in our
study.
3. Methods
This barrier study employs a two-step process. In the first step, qualitative data on barriers are
collected. A Delphi study is used to shortlist 10 important barriers from a comprehensive list of
possible barriers. In the second step, the shortlisted barriers are subjected to an impact-relations
analysis using the fuzzy DEMATEL technique. The following two subsections describe the
details of the methods.
3.1 The Delphi Method
The Delphi method is an empirical tool for obtaining a consensus from the various opinions of a
group of experts. The method has been chosen for the present study because it has a systematic
procedure for arriving at a point of convergence on multifaceted and complicated issues
(Grisham, 2009). In a Delphi study, the involved experts answer questionnaires in two or more
rounds. After each round, a facilitator circulates an anonymous summary of the experts’ opinions
and the reasons of their judgments. The experts are encouraged to revise their earlier answers in
light of the opinions of others. In the process, the experts’ opinions are likely to converge at the
“correct” answers (Okoli and Pawlowski, 2004).
The Delphi method offers a high level of credibility as the procedure avoids the negative
influence of peer pressure. In contrast, peer pressure is often unavoidable in a face-to-face focus
group study as a dominant figure is likely to cause a biased outcome. The Delphi method elicits
discussions during the Delphi interactions helping the researchers drill down on the focused
factors. Though a survey method was also an option, the study used the Delphi method as it
allows the posing of in-depth queries to the participants in a practical context. This is important
for a barrier study in coastal shipping as this domain is at the nascent stage of research. Another
merit of the Delphi method is that it is very economical and not limited by geographical
boundaries.
3.2 Fuzzy DEMATEL Method
Fuzzy set theory can be used to represent vague, probabilistic and imprecise information. Zadeh
(1965) first suggested the effectiveness of fuzzy set theory in the decision-making process when
information is inadequate or incomplete. In various real-life situations, decision-makers’
judgments are normally characterized by ambiguity. Fuzzy numbers are suggested to suitably
express linguistic variables (Kumar et al., 2013). Triangular and trapezoidal fuzzy numbers have
been identified as the most commonly-used (Kahraman, 2008). Triangular Fuzzy Numbers
(TFNs) are often used in applications because of their ease of calculation and features (Seçme et
al., 2009). In this study, the relative weight of various barriers to coastal shipping development in
India have been considered as linguistic variables and represented by TFNs. Each TFN has been
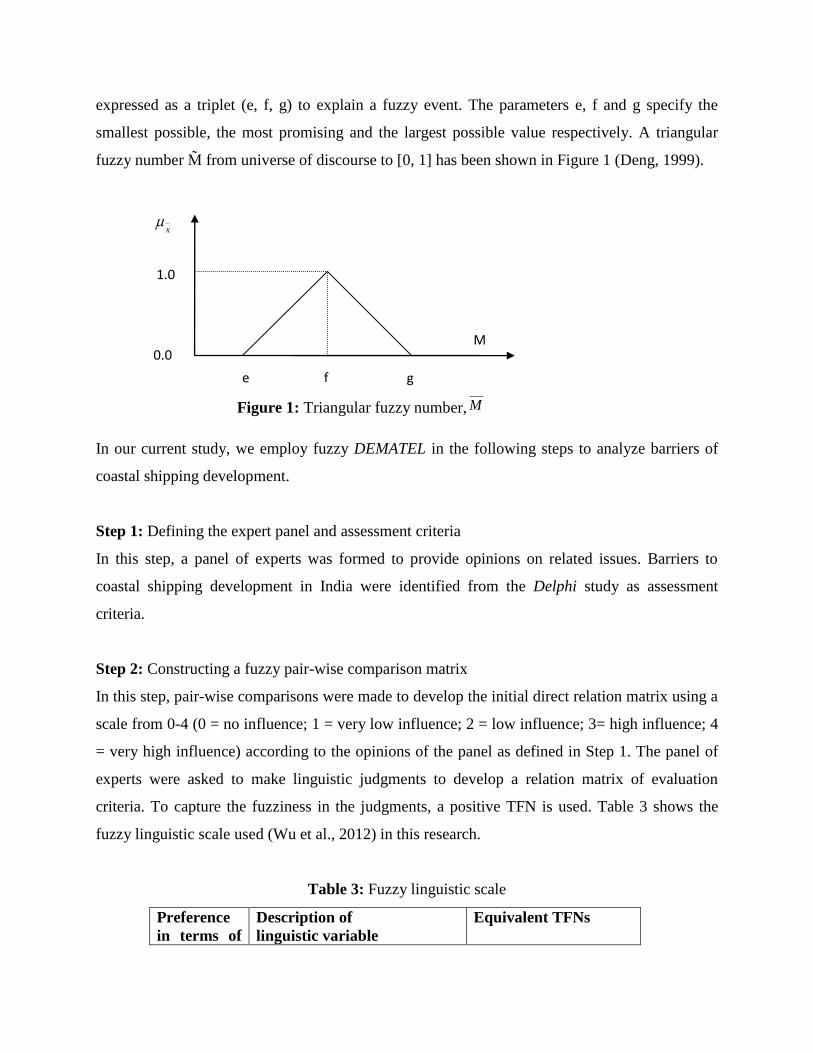
expressed as a triplet (e, f, g) to explain a fuzzy event. The parameters e, f and g specify the
smallest possible, the most promising and the largest possible value respectively. A triangular
fuzzy number M̃ from universe of discourse to [0, 1] has been shown in Figure 1 (Deng, 1999).
In our current study, we employ fuzzy DEMATEL in the following steps to analyze barriers of
coastal shipping development.
Step 1: Defining the expert panel and assessment criteria
In this step, a panel of experts was formed to provide opinions on related issues. Barriers to
coastal shipping development in India were identified from the Delphi study as assessment
criteria.
Step 2: Constructing a fuzzy pair-wise comparison matrix
In this step, pair-wise comparisons were made to develop the initial direct relation matrix using a
scale from 0-4 (0 = no influence; 1 = very low influence; 2 = low influence; 3= high influence; 4
= very high influence) according to the opinions of the panel as defined in Step 1. The panel of
experts were asked to make linguistic judgments to develop a relation matrix of evaluation
criteria. To capture the fuzziness in the judgments, a positive TFN is used. Table 3 shows the
fuzzy linguistic scale used (Wu et al., 2012) in this research.
Table 3: Fuzzy linguistic scale
Preference
in terms of
Description of
linguistic variable
Equivalent TFNs
e f
M
g
0.0
1.0
x
Figure 1: Triangular fuzzy number, M
score
0 No influence (No) (0,0,0.25)
1 Very low influence (VL) (0,0.25,0.5)
2 Low influence (L) (0.25,0.5,0.75)
3 High influence (H) (0.5,0.75,1.0)
4 Very high influence (VH) (0.75,1.0,1.0)
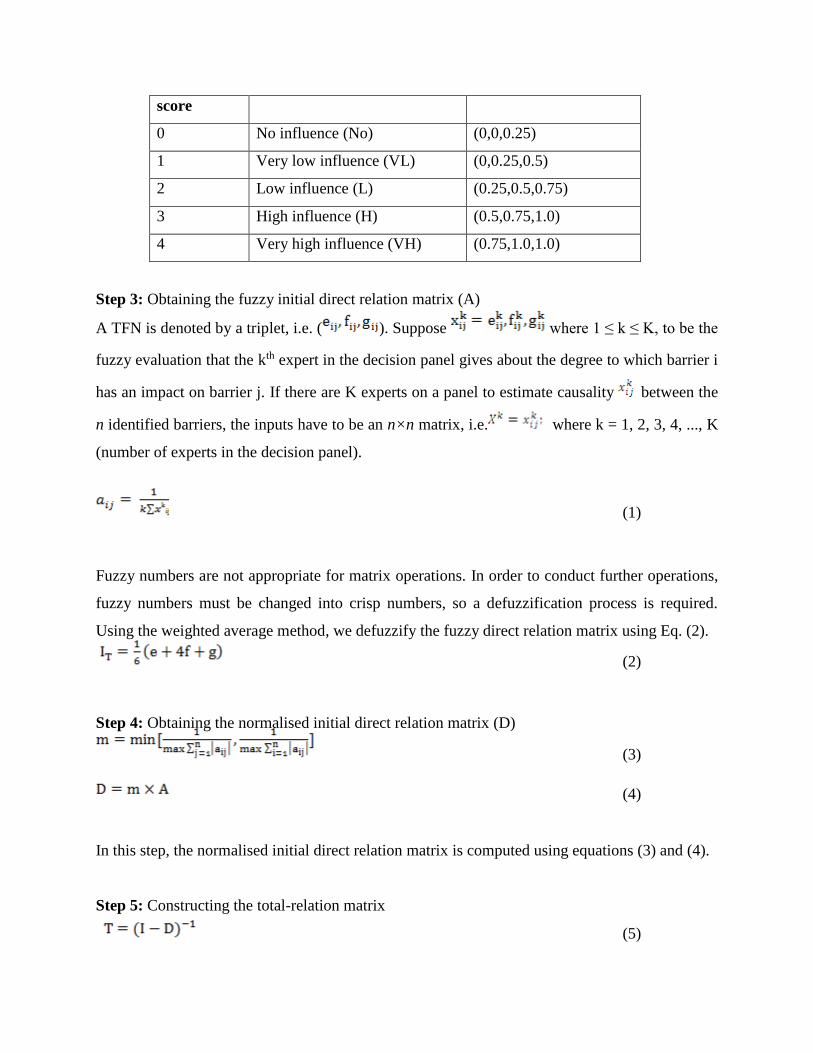
Step 3: Obtaining the fuzzy initial direct relation matrix (A)
A TFN is denoted by a triplet, i.e. ( ). Suppose where 1 ≤ k ≤ K, to be the
fuzzy evaluation that the kth expert in the decision panel gives about the degree to which barrier i
has an impact on barrier j. If there are K experts on a panel to estimate causality between the
n identified barriers, the inputs have to be an n×n matrix, i.e. where k = 1, 2, 3, 4, ..., K
(number of experts in the decision panel).
(1)
Fuzzy numbers are not appropriate for matrix operations. In order to conduct further operations,
fuzzy numbers must be changed into crisp numbers, so a defuzzification process is required.
Using the weighted average method, we defuzzify the fuzzy direct relation matrix using Eq. (2).
(2)
Step 4: Obtaining the normalised initial direct relation matrix (D)
(3)
(4)
In this step, the normalised initial direct relation matrix is computed using equations (3) and (4).
Step 5: Constructing the total-relation matrix
(5)
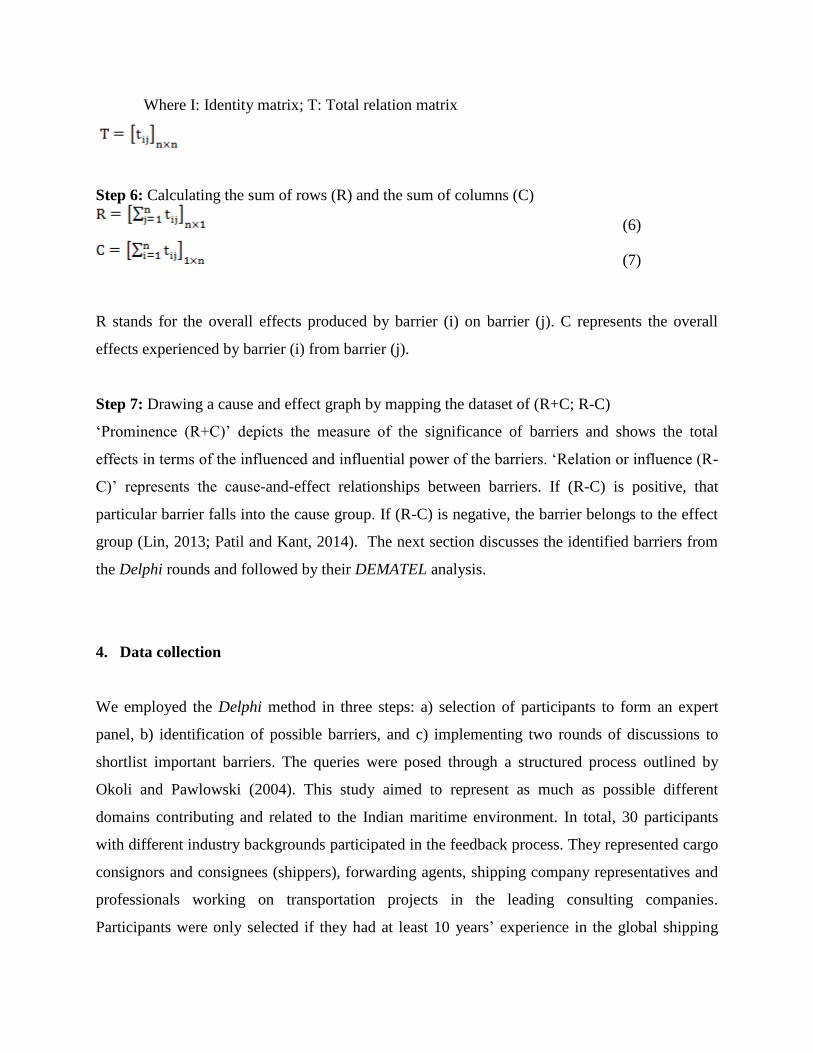
Where I: Identity matrix; T: Total relation matrix
Step 6: Calculating the sum of rows (R) and the sum of columns (C)
(6)
(7)
R stands for the overall effects produced by barrier (i) on barrier (j). C represents the overall
effects experienced by barrier (i) from barrier (j).
Step 7: Drawing a cause and effect graph by mapping the dataset of (R+C; R-C)
‘Prominence (R+C)’ depicts the measure of the significance of barriers and shows the total
effects in terms of the influenced and influential power of the barriers. ‘Relation or influence (R-
C)’ represents the cause-and-effect relationships between barriers. If (R-C) is positive, that
particular barrier falls into the cause group. If (R-C) is negative, the barrier belongs to the effect
group (Lin, 2013; Patil and Kant, 2014). The next section discusses the identified barriers from
the Delphi rounds and followed by their DEMATEL analysis.
4. Data collection
We employed the Delphi method in three steps: a) selection of participants to form an expert
panel, b) identification of possible barriers, and c) implementing two rounds of discussions to
shortlist important barriers. The queries were posed through a structured process outlined by
Okoli and Pawlowski (2004). This study aimed to represent as much as possible different
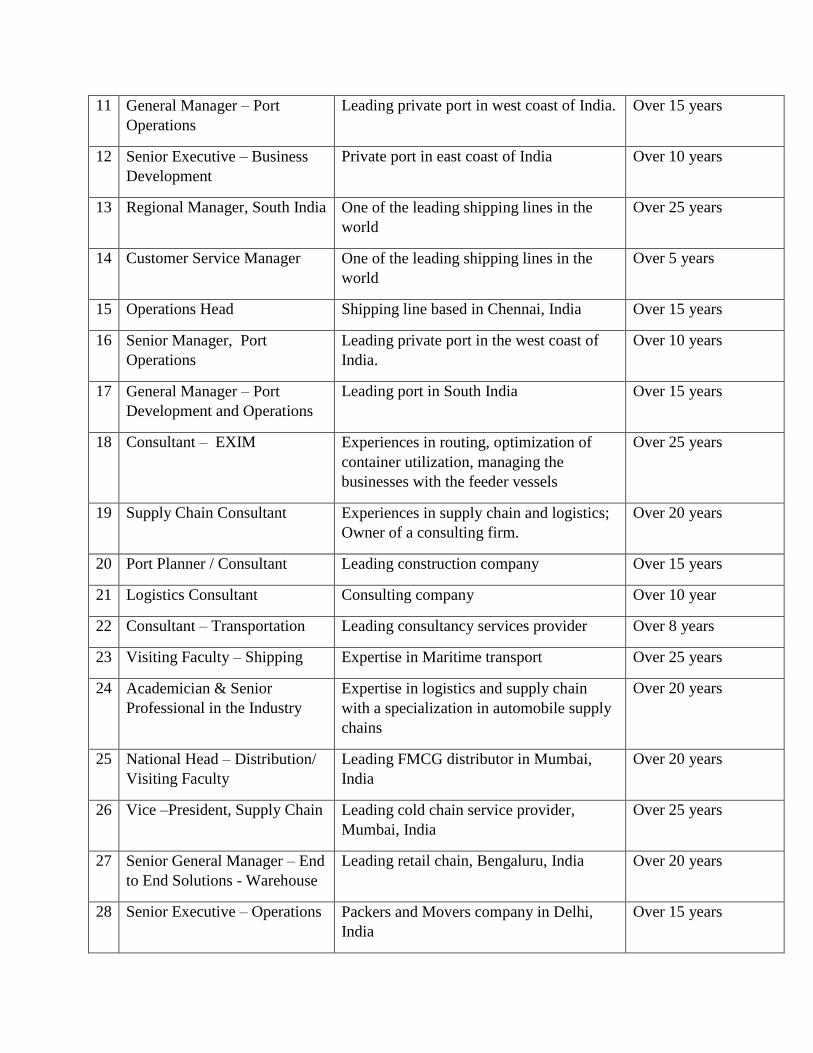
domains contributing and related to the Indian maritime environment. In total, 30 participants
with different industry backgrounds participated in the feedback process. They represented cargo
consignors and consignees (shippers), forwarding agents, shipping company representatives and
professionals working on transportation projects in the leading consulting companies.
Participants were only selected if they had at least 10 years’ experience in the global shipping
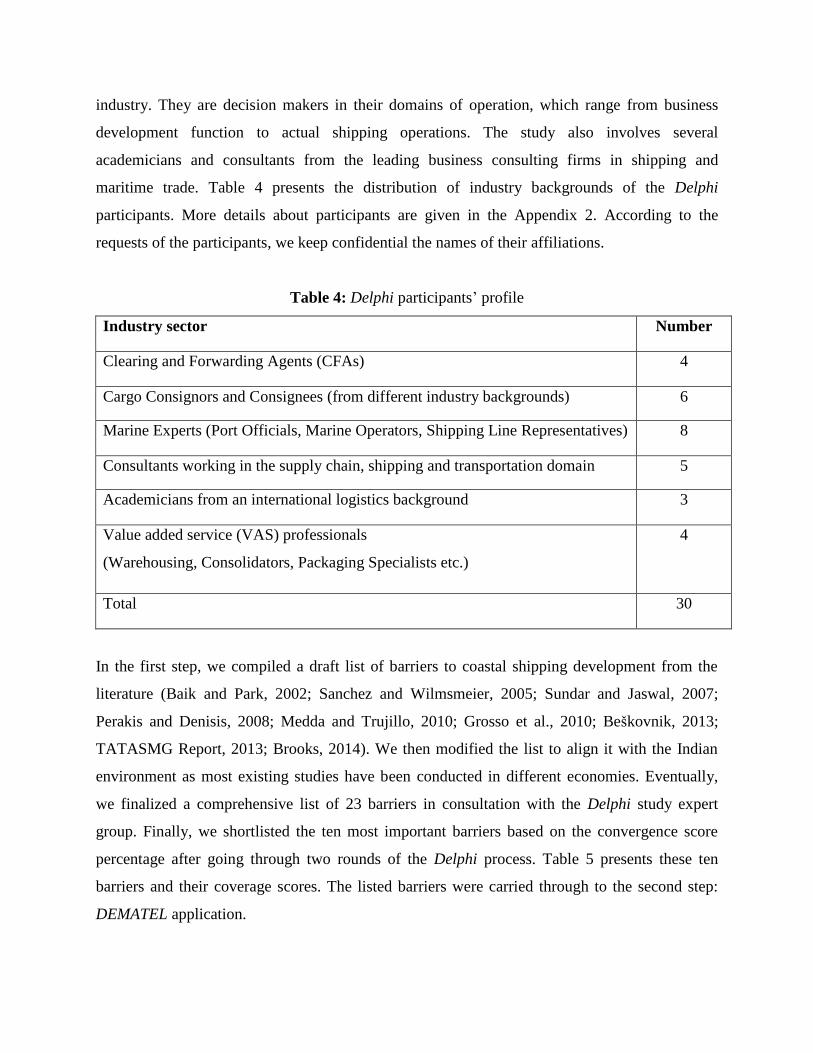
industry. They are decision makers in their domains of operation, which range from business
development function to actual shipping operations. The study also involves several
academicians and consultants from the leading business consulting firms in shipping and
maritime trade. Table 4 presents the distribution of industry backgrounds of the Delphi
participants. More details about participants are given in the Appendix 2. According to the
requests of the participants, we keep confidential the names of their affiliations.
Table 4: Delphi participants’ profile
Industry sector Number
Clearing and Forwarding Agents (CFAs) 4
Cargo Consignors and Consignees (from different industry backgrounds) 6
Marine Experts (Port Officials, Marine Operators, Shipping Line Representatives) 8
Consultants working in the supply chain, shipping and transportation domain 5
Academicians from an international logistics background 3
Value added service (VAS) professionals
(Warehousing, Consolidators, Packaging Specialists etc.)
4
Total 30
In the first step, we compiled a draft list of barriers to coastal shipping development from the
literature (Baik and Park, 2002; Sanchez and Wilmsmeier, 2005; Sundar and Jaswal, 2007;
Perakis and Denisis, 2008; Medda and Trujillo, 2010; Grosso et al., 2010; Beškovnik, 2013;
TATASMG Report, 2013; Brooks, 2014). We then modified the list to align it with the Indian
environment as most existing studies have been conducted in different economies. Eventually,
we finalized a comprehensive list of 23 barriers in consultation with the Delphi study expert
group. Finally, we shortlisted the ten most important barriers based on the convergence score
percentage after going through two rounds of the Delphi process. Table 5 presents these ten
barriers and their coverage scores. The listed barriers were carried through to the second step:
DEMATEL application.
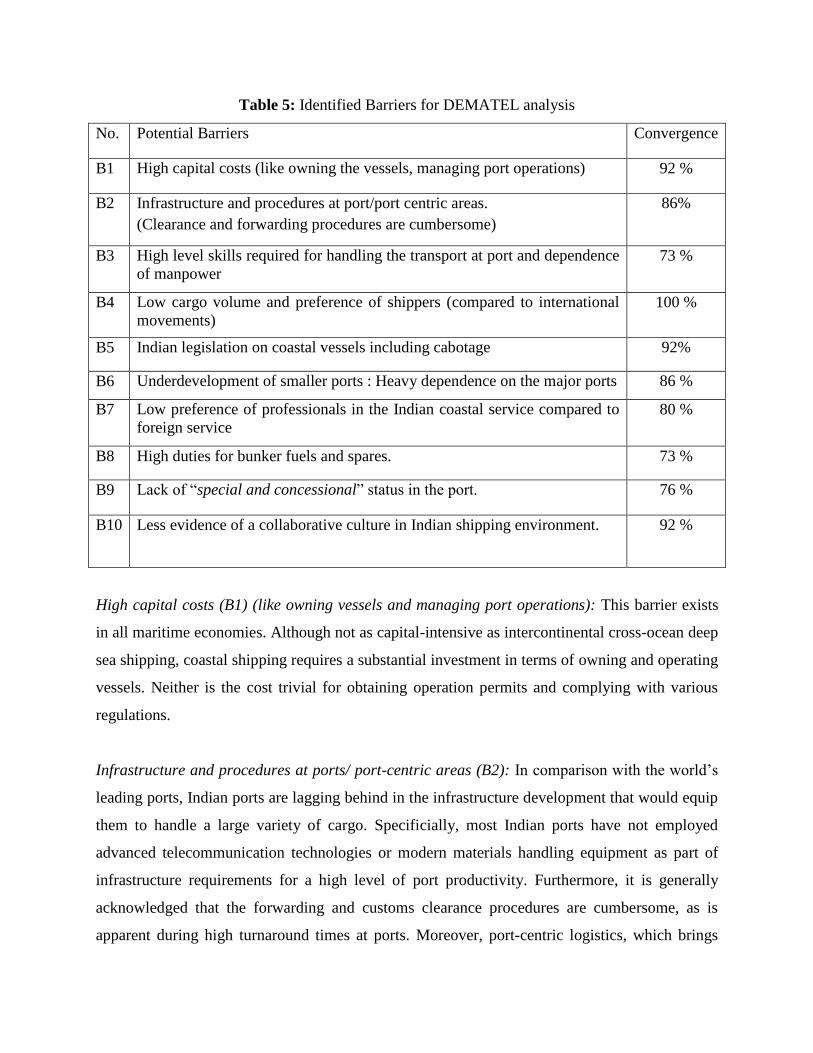
Table 5: Identified Barriers for DEMATEL analysis
No. Potential Barriers Convergence
B1 High capital costs (like owning the vessels, managing port operations) 92 %
B2 Infrastructure and procedures at port/port centric areas.
(Clearance and forwarding procedures are cumbersome)
86%
B3 High level skills required for handling the transport at port and dependence
of manpower
73 %
B4 Low cargo volume and preference of shippers (compared to international
movements)
100 %
B5 Indian legislation on coastal vessels including cabotage 92%
B6 Underdevelopment of smaller ports : Heavy dependence on the major ports 86 %
B7 Low preference of professionals in the Indian coastal service compared to
foreign service
80 %
B8 High duties for bunker fuels and spares. 73 %
B9 Lack of “special and concessional” status in the port. 76 %
B10 Less evidence of a collaborative culture in Indian shipping environment. 92 %
High capital costs (B1) (like owning vessels and managing port operations): This barrier exists
in all maritime economies. Although not as capital-intensive as intercontinental cross-ocean deep
sea shipping, coastal shipping requires a substantial investment in terms of owning and operating
vessels. Neither is the cost trivial for obtaining operation permits and complying with various
regulations.
Infrastructure and procedures at ports/ port-centric areas (B2): In comparison with the world’s
leading ports, Indian ports are lagging behind in the infrastructure development that would equip
them to handle a large variety of cargo. Specificially, most Indian ports have not employed
advanced telecommunication technologies or modern materials handling equipment as part of
infrastructure requirements for a high level of port productivity. Furthermore, it is generally
acknowledged that the forwarding and customs clearance procedures are cumbersome, as is
apparent during high turnaround times at ports. Moreover, port-centric logistics, which brings
together a bundle of services, is still at the nascent stage in the Indian context when benchmarked
against other developed ports.
High-level skills required for handling the transport at ports (B3): India did not alert itself to
develop skills in maritime logistics until very lately compared to economies like Singapore and
Hong Kong. There is a skill shortage in relevant operations, including warehousing, stevedoring
and container handling (including crane operations). Ports are also undergoing automation, as
many berths have been taken over by foreign operators like Dubai Ports (DP) and Port of
Singapore Authority (PSA). They are global terminal operators that require highly-skilled and
specialized employees. Unfortunately, the supply of skilled labor has not caught up in the
shipping industry in India.
Low cargo volume and preference of shippers (B4): Shipping corporations fear to run coastal
services with low cargo volume, which results in higher overheads. Short sea shipping has not
proved its advantages in India against the volume of business handled by other modes.
Furthermore, there is continued apprehension about the trade imbalance between head haul and
backhaul operations, which makes coastal operations less sustainable.
Indian legislation on coastal vessels, including cabotage (B5): The current cabotage law allows
only Indian ships to transport cargo along the Indian coast. That is to say, foreign ships may do
so only when Indian ships are unavailable and the foreign ships have a license from India's
maritime regulator. This is explained in sections 407 and 408 – Part XIV of the Merchant
Shipping Act, 1958. This has been identified as one of the important barriers for coastal
operations. Furthermore, there is no clear policy draft on incentives for coastal shipping
operators in terms of bunker fuels and other preferential rates.
Underdevelopment of smaller ports (B6): This is certainly one of the eminent barriers given the
imperative role of smaller ports in coastal shipping. One of the main objectives of coastal
shipping is to establish plenty of connections to the hinterland by utilizing the smaller ports.
Unfortunately, in the last two decades, there has been no agenda or support from the government
for the development of smaller ports. As a result, shippers and customers depend heavily on
major ports, pushing up costs in port handling and landside transportation. Furthermore, smaller
ports can only handle small barges and do not have the facilities to handle those that carry a large
number of twenty foot equivalent units (TEUs).
Low preference of professionals in the coastal service compared to Foreign Service (B7): Delphi
participants acknowledged that coastal services are now less profitable than foreign services.
Pricing mechanisms are a threat for coastal operations as the Indian market is highly sensitive to
costs. There is a bias among professionals towards foreign transfer as it enjoys higher profit
margins in its operations.
High duties for bunker fuels and spares (B8): Although the shipbuilding industry has been
growing in India, many of the spares still need to be imported at heavy duty rates, which stunts
the growth of the industry. Also, the bunker fuel duty rates are high as there are no substantial
subsidies from the government to help pay them.
Lack of “special and concessional” status in the port (B9): In the major ports in Europe and the
Americas, there is special consideration for coastal shipping vessels in terms of rates and a
separate berthing facility for faster turnaround. New terminal operators in India, however, are
still hesitant to give concessions to coastal-bound vessels. Though Indian ports are increasing
their overall capacities, they have not shown any interest in dedicated berths for coastal shipping
vessels.
Less evidence of a collaborative culture in the Indian shipping environment (B10): Indian
shipping companies operating in the coastal environment do not have a strong network amongst
themselves. Also, they have not shown any keen interest in establishing collaborative
relationships (as have the members of the Ocean 3 and G6 alliances in the international markets)
with other shipping players. This is related to the fact that India does not have a well-established
transshipment hub of its own where a cluster of collaborative activities could be synergized.
Currently, India heavily depends on feeder vessels to connect its major ports with nearby
transshipment hubs in other countries like Sri Lanka (which has Colombo) and Singapore.
Theoretically, sufficient local collaboration could justify a hub in India to improve both transit
time and operating cost for coastal shipping.
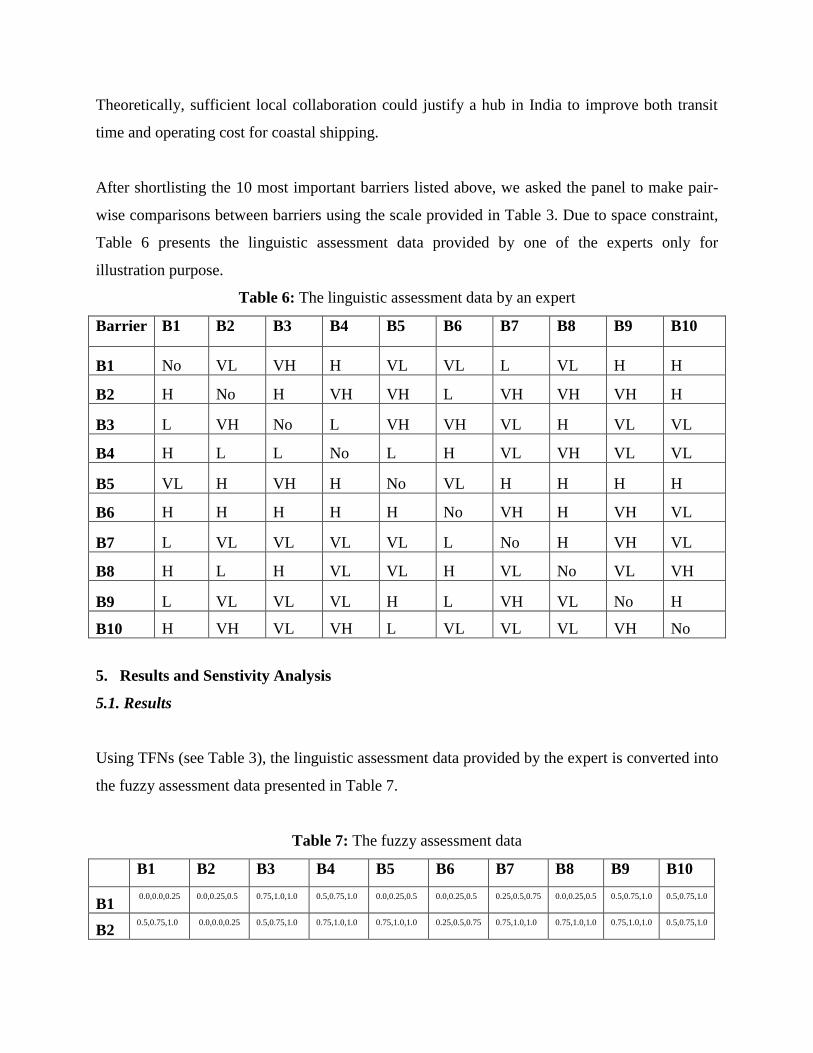
After shortlisting the 10 most important barriers listed above, we asked the panel to make pair-
wise comparisons between barriers using the scale provided in Table 3. Due to space constraint,
Table 6 presents the linguistic assessment data provided by one of the experts only for
illustration purpose.
Table 6: The linguistic assessment data by an expert
Barrier B1 B2 B3 B4 B5 B6 B7 B8 B9 B10
B1 No VL VH H VL VL L VL H H
B2 H No H VH VH L VH VH VH H
B3 L VH No L VH VH VL H VL VL
B4 H L L No L H VL VH VL VL
B5 VL H VH H No VL H H H H
B6 H H H H H No VH H VH VL
B7 L VL VL VL VL L No H VH VL
B8 H L H VL VL H VL No VL VH
B9 L VL VL VL H L VH VL No H
B10 H VH VL VH L VL VL VL VH No
5. Results and Senstivity Analysis
5.1. Results
Using TFNs (see Table 3), the linguistic assessment data provided by the expert is converted into
the fuzzy assessment data presented in Table 7.
Table 7: The fuzzy assessment data
B1 B2 B3 B4 B5 B6 B7 B8 B9 B10
B1 0.0,0.0,0.25 0.0,0.25,0.5 0.75,1.0,1.0 0.5,0.75,1.0 0.0,0.25,0.5 0.0,0.25,0.5 0.25,0.5,0.75 0.0,0.25,0.5 0.5,0.75,1.0 0.5,0.75,1.0
B2 0.5,0.75,1.0 0.0,0.0,0.25 0.5,0.75,1.0 0.75,1.0,1.0 0.75,1.0,1.0 0.25,0.5,0.75 0.75,1.0,1.0 0.75,1.0,1.0 0.75,1.0,1.0 0.5,0.75,1.0
B3 0.25,0.5,0.75 0.75,1.0,1.0 0.0,0.0,0.25 0.25,0.5,0.75 0.75,1.0,1.0 0.75,1.0,1.0 0.0,0.25,0.5 0.5,0.75,1.0 0.0,0.25,0.5 0.0,0.25,0.5
B4 0.5,0.75,1.0 0.25,0.5,0.75 0.25,0.5,0.75 0.0,0.0,0.25 0.25,0.5,0.75 0.5,0.75,1.0 0.0,0.25,0.5 0.75,1.0,1.0 0.0,0.25,0.5 0.0,0.25,0.5
B5 0.0,0.25,0.5 0.5,0.75,1.0 0.75,1.0,1.0 0.5,0.75,1.0 0.0,0.0,0.25 0.0,0.25,0.5 0.5,0.75,1.0 0.5,0.75,1.0 0.5,0.75,1.0 0.5,0.75,1.0
B6 0.5,0.75,1.0 0.5,0.75,1.0 0.5,0.75,1.0 0.5,0.75,1.0 0.5,0.75,1.0 0.0,0.0,0.25 0.75,1.0,1.0 0.5,0.75,1.0 0.75,1.0,1.0 0.0,0.25,0.5
B7 0.25,0.5,0.75 0.0,0.25,0.5 0.0,0.25,0.5 0.0,0.25,0.5 0.0,0.25,0.5 0.25,0.5,0.75 0.0,0.0,0.25 0.5,0.75,1.0 0.75,1.0,1.0 0.0,0.25,0.5
B8 0.5,0.75,1.0 0.25,0.5,0.75 0.5,0.75,1.0 0.0,0.25,0.5 0.0,0.25,0.5 0.5,0.75,1.0 0.0,0.25,0.5 0.0,0.0,0.25 0.0,0.25,0.5 0.75,1.0,1.0
B9 0.25,0.5,0.75 0.0,0.25,0.5 0.0,0.25,0.5 0.0,0.25,0.5 0.5,0.75,1.0 0.25,0.5,0.75 0.75,1.0,1.0 0.0,0.25,0.5 0.0,0.0,0.25 0.5,0.75,1.0
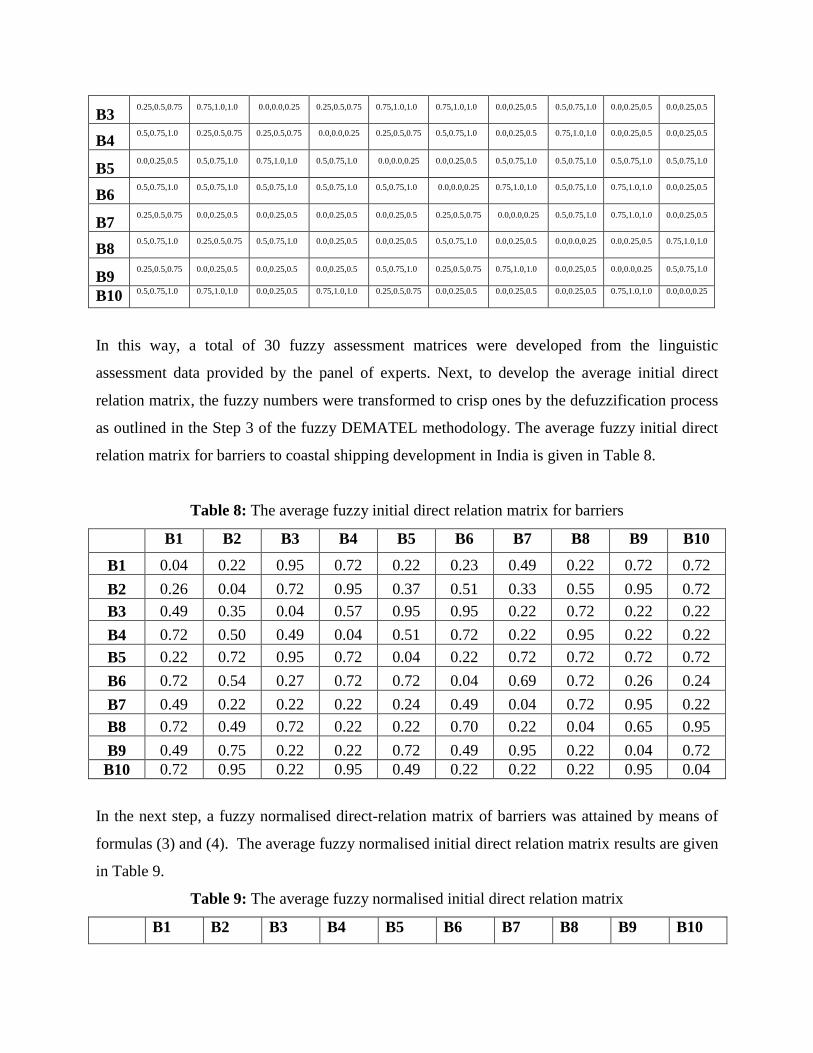
B10 0.5,0.75,1.0 0.75,1.0,1.0 0.0,0.25,0.5 0.75,1.0,1.0 0.25,0.5,0.75 0.0,0.25,0.5 0.0,0.25,0.5 0.0,0.25,0.5 0.75,1.0,1.0 0.0,0.0,0.25
In this way, a total of 30 fuzzy assessment matrices were developed from the linguistic
assessment data provided by the panel of experts. Next, to develop the average initial direct
relation matrix, the fuzzy numbers were transformed to crisp ones by the defuzzification process
as outlined in the Step 3 of the fuzzy DEMATEL methodology. The average fuzzy initial direct
relation matrix for barriers to coastal shipping development in India is given in Table 8.
Table 8: The average fuzzy initial direct relation matrix for barriers
B1 B2 B3 B4 B5 B6 B7 B8 B9 B10
B1 0.04 0.22 0.95 0.72 0.22 0.23 0.49 0.22 0.72 0.72
B2 0.26 0.04 0.72 0.95 0.37 0.51 0.33 0.55 0.95 0.72
B3 0.49 0.35 0.04 0.57 0.95 0.95 0.22 0.72 0.22 0.22
B4 0.72 0.50 0.49 0.04 0.51 0.72 0.22 0.95 0.22 0.22
B5 0.22 0.72 0.95 0.72 0.04 0.22 0.72 0.72 0.72 0.72
B6 0.72 0.54 0.27 0.72 0.72 0.04 0.69 0.72 0.26 0.24
B7 0.49 0.22 0.22 0.22 0.24 0.49 0.04 0.72 0.95 0.22
B8 0.72 0.49 0.72 0.22 0.22 0.70 0.22 0.04 0.65 0.95
B9 0.49 0.75 0.22 0.22 0.72 0.49 0.95 0.22 0.04 0.72
B10 0.72 0.95 0.22 0.95 0.49 0.22 0.22 0.22 0.95 0.04
In the next step, a fuzzy normalised direct-relation matrix of barriers was attained by means of
formulas (3) and (4). The average fuzzy normalised initial direct relation matrix results are given
in Table 9.
Table 9: The average fuzzy normalised initial direct relation matrix
B1 B2 B3 B4 B5 B6 B7 B8 B9 B10
B1 0.01 0.04 0.17 0.13 0.04 0.04 0.09 0.04 0.13 0.13
B2 0.05 0.01 0.13 0.17 0.07 0.09 0.06 0.10 0.17 0.13
B3 0.09 0.06 0.01 0.10 0.17 0.17 0.04 0.13 0.04 0.04
B4 0.13 0.09 0.09 0.01 0.09 0.13 0.04 0.17 0.04 0.04
B5 0.04 0.13 0.17 0.13 0.01 0.04 0.13 0.13 0.13 0.13
B6 0.13 0.09 0.05 0.13 0.13 0.01 0.12 0.13 0.05 0.04
B7 0.09 0.04 0.04 0.04 0.04 0.09 0.01 0.13 0.17 0.04
B8 0.13 0.09 0.13 0.04 0.04 0.12 0.04 0.01 0.11 0.17
B9 0.09 0.13 0.04 0.04 0.13 0.09 0.17 0.04 0.01 0.13
B10 0.13 0.17 0.04 0.17 0.09 0.04 0.04 0.04 0.17 0.01
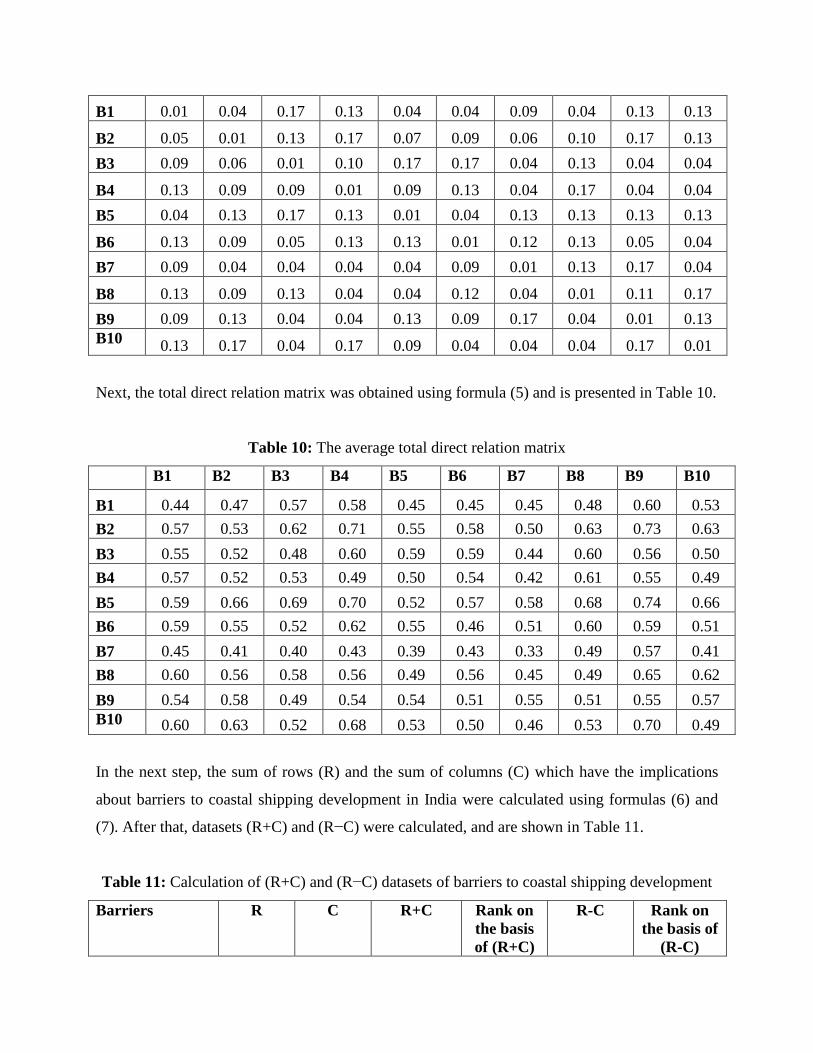
Next, the total direct relation matrix was obtained using formula (5) and is presented in Table 10.
Table 10: The average total direct relation matrix
B1 B2 B3 B4 B5 B6 B7 B8 B9 B10
B1 0.44 0.47 0.57 0.58 0.45 0.45 0.45 0.48 0.60 0.53
B2 0.57 0.53 0.62 0.71 0.55 0.58 0.50 0.63 0.73 0.63
B3 0.55 0.52 0.48 0.60 0.59 0.59 0.44 0.60 0.56 0.50
B4 0.57 0.52 0.53 0.49 0.50 0.54 0.42 0.61 0.55 0.49
B5 0.59 0.66 0.69 0.70 0.52 0.57 0.58 0.68 0.74 0.66
B6 0.59 0.55 0.52 0.62 0.55 0.46 0.51 0.60 0.59 0.51
B7 0.45 0.41 0.40 0.43 0.39 0.43 0.33 0.49 0.57 0.41
B8 0.60 0.56 0.58 0.56 0.49 0.56 0.45 0.49 0.65 0.62
B9 0.54 0.58 0.49 0.54 0.54 0.51 0.55 0.51 0.55 0.57
B10 0.60 0.63 0.52 0.68 0.53 0.50 0.46 0.53 0.70 0.49
In the next step, the sum of rows (R) and the sum of columns (C) which have the implications
about barriers to coastal shipping development in India were calculated using formulas (6) and
(7). After that, datasets (R+C) and (R−C) were calculated, and are shown in Table 11.
Table 11: Calculation of (R+C) and (R−C) datasets of barriers to coastal shipping development
Barriers R C R+C Rank on
the basis
of (R+C)
R-C Rank on
the basis of
(R-C)
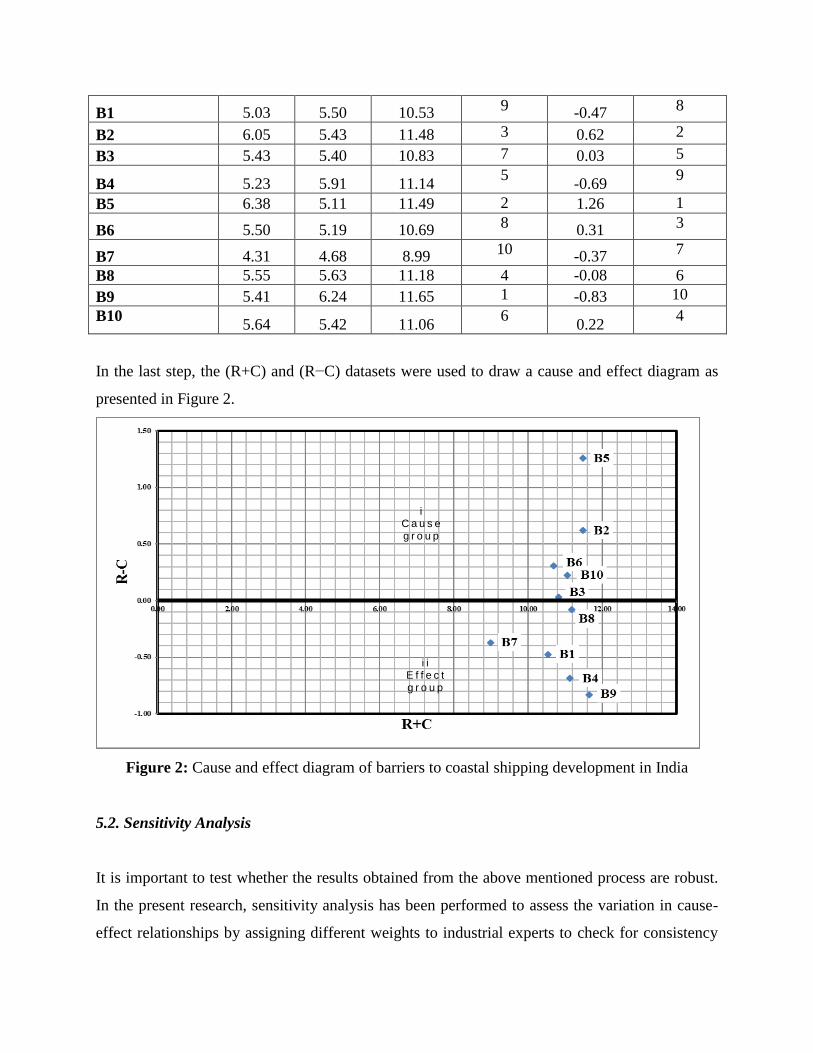
B1 5.03 5.50 10.53 9
-0.47 8
B2 6.05 5.43 11.48 3 0.62 2
B3 5.43 5.40 10.83 7 0.03 5
B4 5.23 5.91 11.14 5
-0.69 9
B5 6.38 5.11 11.49 2 1.26 1
B6 5.50 5.19 10.69 8
0.31 3
B7 4.31 4.68 8.99 10
-0.37 7
B8 5.55 5.63 11.18 4 -0.08 6
B9 5.41 6.24 11.65 1 -0.83 10
B10 5.64 5.42 11.06
6 0.22
4
In the last step, the (R+C) and (R−C) datasets were used to draw a cause and effect diagram as
presented in Figure 2.
Figure 2: Cause and effect diagram of barriers to coastal shipping development in India
5.2. Sensitivity Analysis
It is important to test whether the results obtained from the above mentioned process are robust.
In the present research, sensitivity analysis has been performed to assess the variation in cause-
effect relationships by assigning different weights to industrial experts to check for consistency
i C a u s e g r o u p
i i E f f e c t g r o u p
in the decision making process. This sensitivity analysis allows determining whether the possible
biases of a particular expert may have influenced the results obtained. If we assign two different
weights to each expert, the total number of combinations will be , which is far too many for
sensitivity runs. To perform sensitivity analysis more efficiently, we give a greater weight to one
expert chosen from each domain of participants (named as experts 1–6), keeping identical
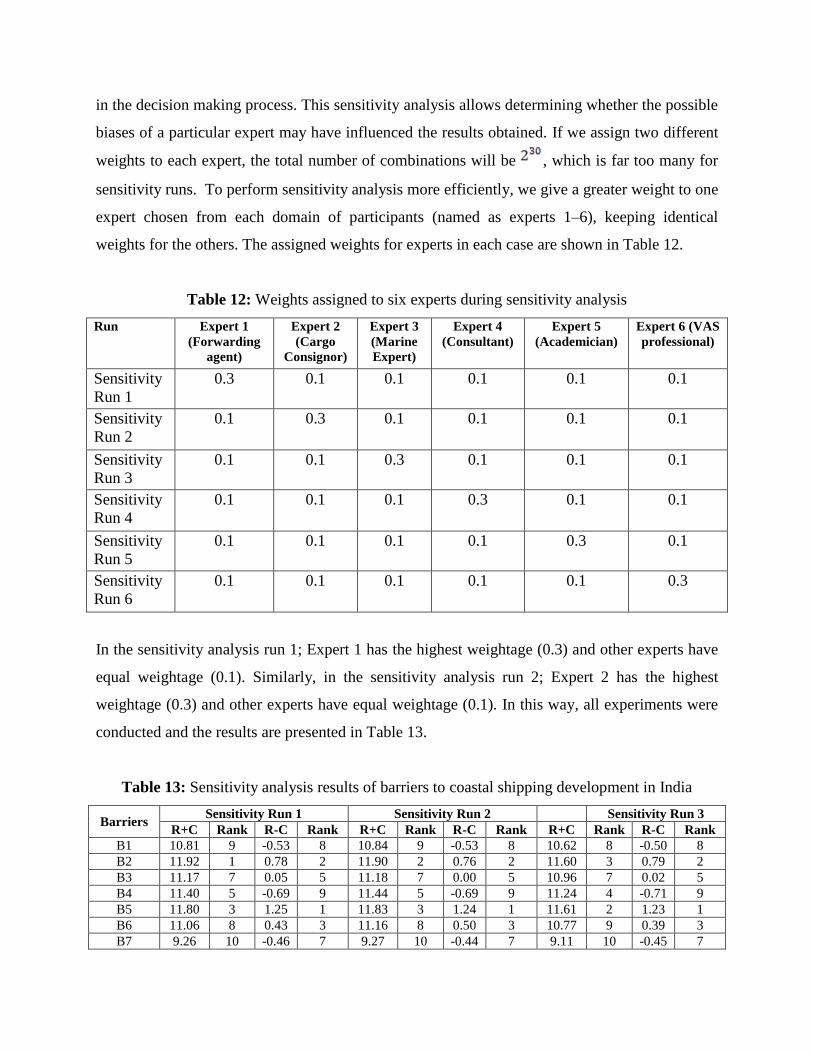
weights for the others. The assigned weights for experts in each case are shown in Table 12.
Table 12: Weights assigned to six experts during sensitivity analysis
Run Expert 1
(Forwarding
agent)
Expert 2
(Cargo
Consignor)
Expert 3
(Marine
Expert)
Expert 4
(Consultant)
Expert 5
(Academician)
Expert 6 (VAS
professional)
Sensitivity
Run 1
0.3 0.1 0.1 0.1 0.1 0.1
Sensitivity
Run 2
0.1 0.3 0.1 0.1 0.1 0.1
Sensitivity
Run 3
0.1 0.1 0.3 0.1 0.1 0.1
Sensitivity
Run 4
0.1 0.1 0.1 0.3 0.1 0.1
Sensitivity
Run 5
0.1 0.1 0.1 0.1 0.3 0.1
Sensitivity
Run 6
0.1 0.1 0.1 0.1 0.1 0.3
In the sensitivity analysis run 1; Expert 1 has the highest weightage (0.3) and other experts have
equal weightage (0.1). Similarly, in the sensitivity analysis run 2; Expert 2 has the highest
weightage (0.3) and other experts have equal weightage (0.1). In this way, all experiments were
conducted and the results are presented in Table 13.
Table 13: Sensitivity analysis results of barriers to coastal shipping development in India
Barriers Sensitivity Run 1 Sensitivity Run 2 Sensitivity Run 3
R+C Rank R-C Rank R+C Rank R-C Rank R+C Rank R-C Rank
B1 10.81 9 -0.53 8 10.84 9 -0.53 8 10.62 8 -0.50 8
B2 11.92 1 0.78 2 11.90 2 0.76 2 11.60 3 0.79 2
B3 11.17 7 0.05 5 11.18 7 0.00 5 10.96 7 0.02 5
B4 11.40 5 -0.69 9 11.44 5 -0.69 9 11.24 4 -0.71 9
B5 11.80 3 1.25 1 11.83 3 1.24 1 11.61 2 1.23 1
B6 11.06 8 0.43 3 11.16 8 0.50 3 10.77 9 0.39 3
B7 9.26 10 -0.46 7 9.27 10 -0.44 7 9.11 10 -0.45 7
B8 11.46 4 -0.14 6 11.49 4 -0.06 6 11.23 5 -0.11 6
B9 11.91 2 -0.92 10 11.96 1 -0.94 10 11.70 1 -0.88 10
B10 11.33 6 0.23 4 11.40 6 0.17 4 11.14 6 0.23 4
Barriers Sensitivity Run 4 Sensitivity Run 5 Sensitivity Run 6
R+C Rank R-C Rank R+C Rank R-C Rank R+C Rank R-C Rank
B1 10.56 9 -0.47 8 10.56 9 -0.48 8 10.48 8 -0.47 8
B2 11.58 2 0.62 2 11.55 3 0.69 2 11.42 2 0.57 2
B3 10.93 7 0.10 5 10.85 7 0.02 5 10.76 6 0.02 5
B4 11.20 4 -0.73 9 11.17 5 -0.68 9 11.08 4 -0.68 9
B5 11.55 3 1.25 1 11.57 2 1.22 1 11.42 2 1.27 1
B6 10.71 8 0.26 3 10.75 8 0.33 3 10.66 7 0.32 3
B7 8.95 10 -0.34 7 9.05 10 -0.41 7 8.95 9 -0.38 7
B8 11.18 5 -0.11 6 11.23 4 -0.07 6 11.10 3 -0.11 6
B9 11.62 1 -0.82 10 11.68 1 -0.86 10 11.58 1 -0.78 10
B10 11.09 6 0.23 4 11.10 6 0.23 4 11.00 5 0.23 4
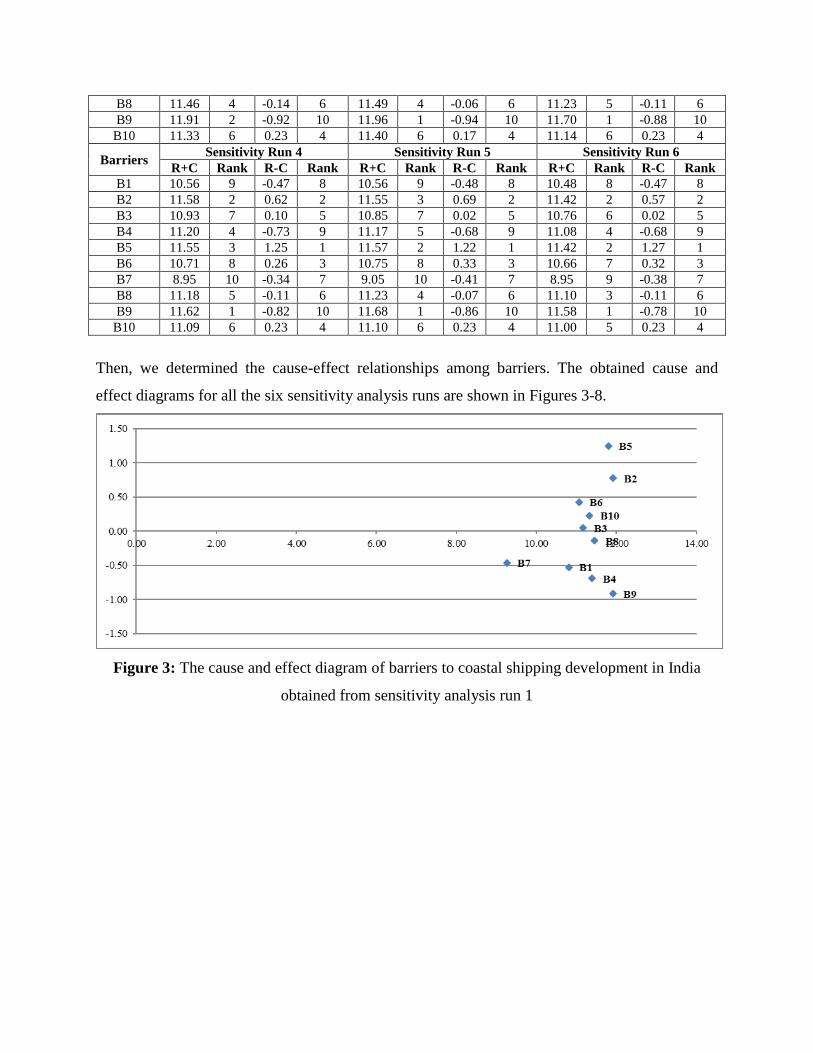
Then, we determined the cause-effect relationships among barriers. The obtained cause and
effect diagrams for all the six sensitivity analysis runs are shown in Figures 3-8.
Figure 3: The cause and effect diagram of barriers to coastal shipping development in India
obtained from sensitivity analysis run 1
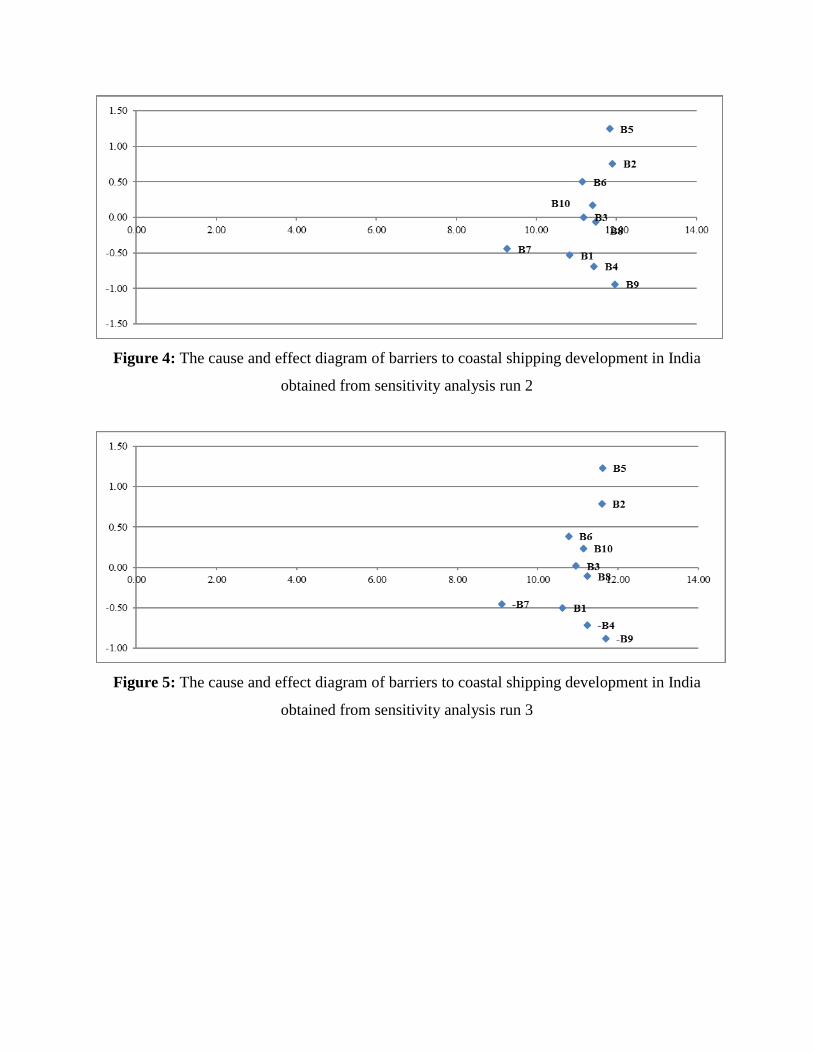
Figure 4: The cause and effect diagram of barriers to coastal shipping development in India
obtained from sensitivity analysis run 2
Figure 5: The cause and effect diagram of barriers to coastal shipping development in India
obtained from sensitivity analysis run 3
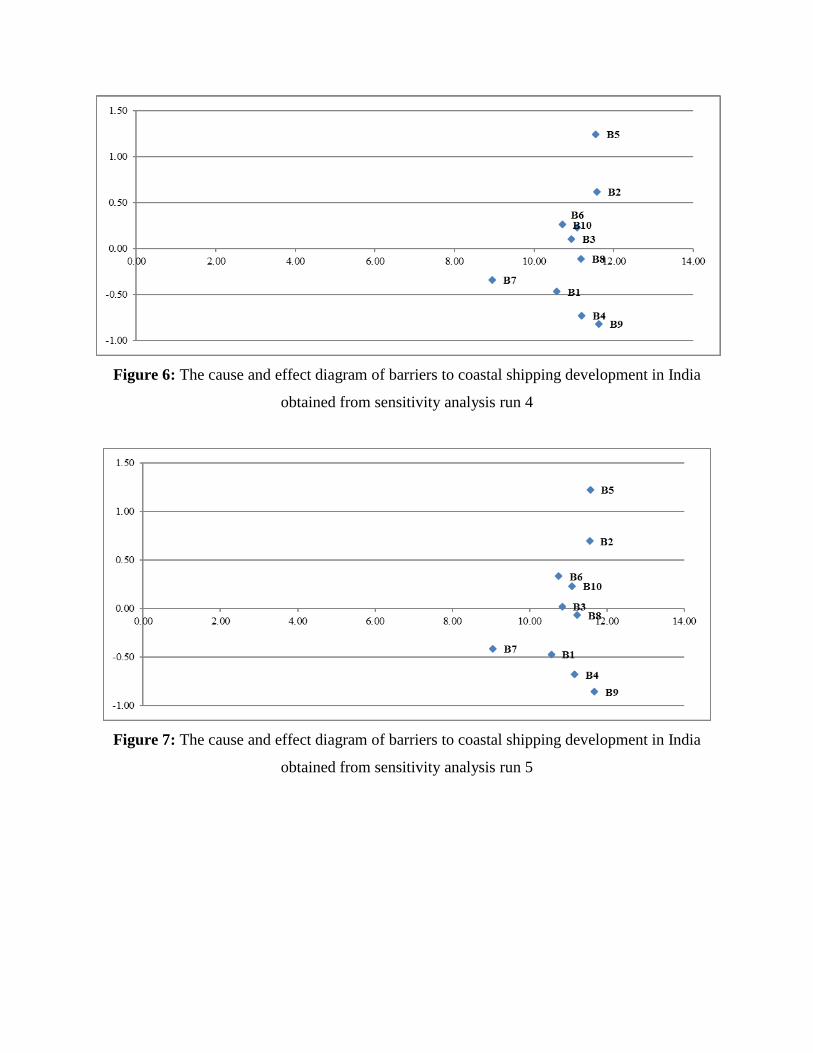
Figure 6: The cause and effect diagram of barriers to coastal shipping development in India
obtained from sensitivity analysis run 4
Figure 7: The cause and effect diagram of barriers to coastal shipping development in India
obtained from sensitivity analysis run 5
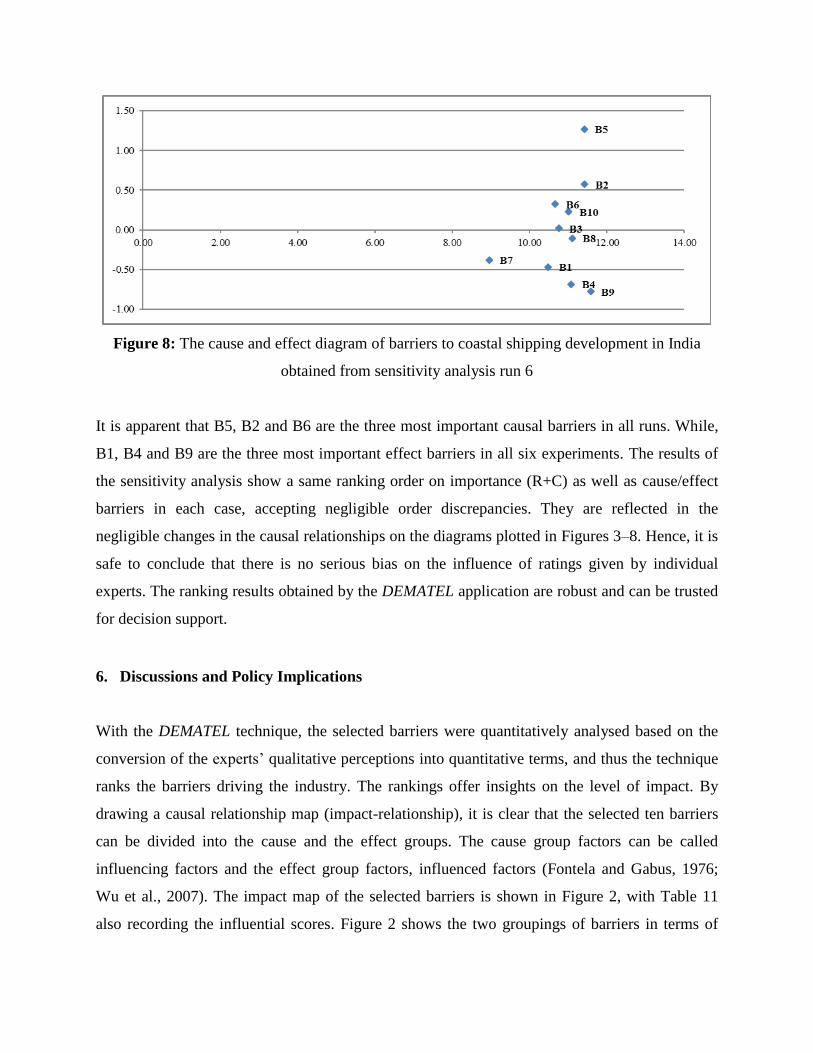
Figure 8: The cause and effect diagram of barriers to coastal shipping development in India
obtained from sensitivity analysis run 6
It is apparent that B5, B2 and B6 are the three most important causal barriers in all runs. While,
B1, B4 and B9 are the three most important effect barriers in all six experiments. The results of
the sensitivity analysis show a same ranking order on importance (R+C) as well as cause/effect
barriers in each case, accepting negligible order discrepancies. They are reflected in the
negligible changes in the causal relationships on the diagrams plotted in Figures 3–8. Hence, it is
safe to conclude that there is no serious bias on the influence of ratings given by individual
experts. The ranking results obtained by the DEMATEL application are robust and can be trusted
for decision support.
6. Discussions and Policy Implications
With the DEMATEL technique, the selected barriers were quantitatively analysed based on the
conversion of the experts’ qualitative perceptions into quantitative terms, and thus the technique
ranks the barriers driving the industry. The rankings offer insights on the level of impact. By
drawing a causal relationship map (impact-relationship), it is clear that the selected ten barriers
can be divided into the cause and the effect groups. The cause group factors can be called
influencing factors and the effect group factors, influenced factors (Fontela and Gabus, 1976;
Wu et al., 2007). The impact map of the selected barriers is shown in Figure 2, with Table 11
also recording the influential scores. Figure 2 shows the two groupings of barriers in terms of
influence: positive and negative ones. The cause group has positive R-C values and the effect
group has negative R-C values.
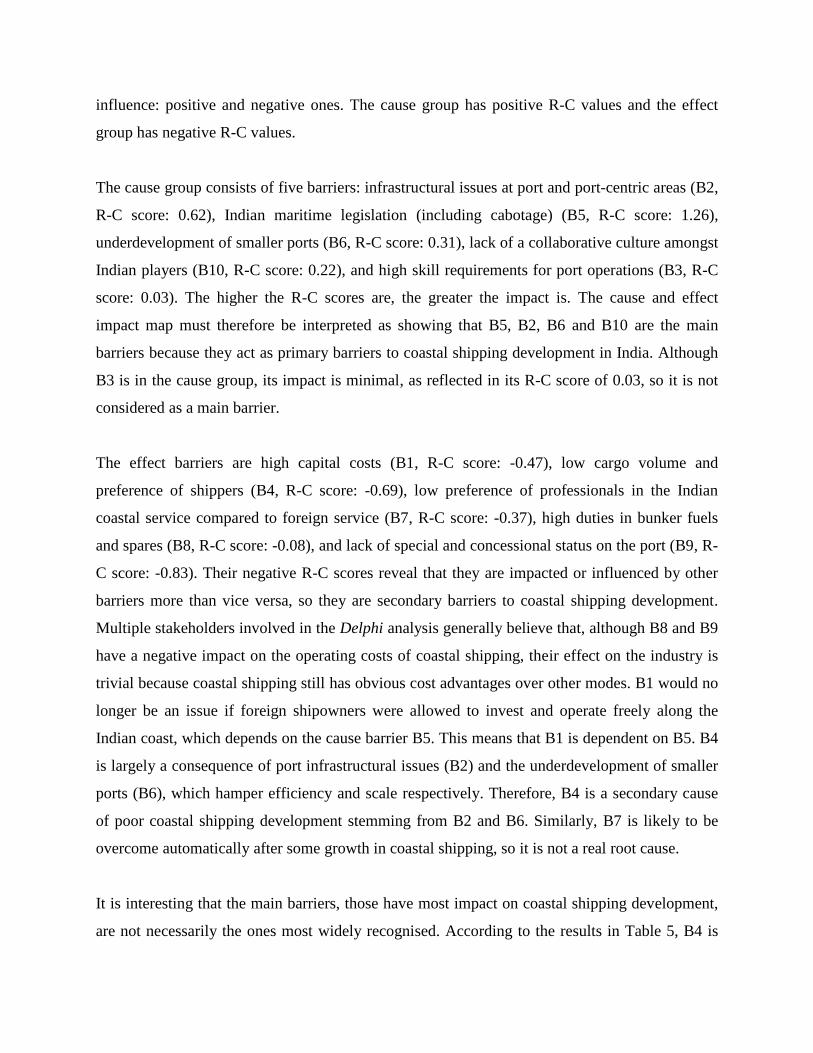
The cause group consists of five barriers: infrastructural issues at port and port-centric areas (B2,
R-C score: 0.62), Indian maritime legislation (including cabotage) (B5, R-C score: 1.26),
underdevelopment of smaller ports (B6, R-C score: 0.31), lack of a collaborative culture amongst
Indian players (B10, R-C score: 0.22), and high skill requirements for port operations (B3, R-C
score: 0.03). The higher the R-C scores are, the greater the impact is. The cause and effect
impact map must therefore be interpreted as showing that B5, B2, B6 and B10 are the main
barriers because they act as primary barriers to coastal shipping development in India. Although
B3 is in the cause group, its impact is minimal, as reflected in its R-C score of 0.03, so it is not
considered as a main barrier.
The effect barriers are high capital costs (B1, R-C score: -0.47), low cargo volume and
preference of shippers (B4, R-C score: -0.69), low preference of professionals in the Indian
coastal service compared to foreign service (B7, R-C score: -0.37), high duties in bunker fuels
and spares (B8, R-C score: -0.08), and lack of special and concessional status on the port (B9, R-
C score: -0.83). Their negative R-C scores reveal that they are impacted or influenced by other
barriers more than vice versa, so they are secondary barriers to coastal shipping development.
Multiple stakeholders involved in the Delphi analysis generally believe that, although B8 and B9
have a negative impact on the operating costs of coastal shipping, their effect on the industry is
trivial because coastal shipping still has obvious cost advantages over other modes. B1 would no
longer be an issue if foreign shipowners were allowed to invest and operate freely along the
Indian coast, which depends on the cause barrier B5. This means that B1 is dependent on B5. B4
is largely a consequence of port infrastructural issues (B2) and the underdevelopment of smaller
ports (B6), which hamper efficiency and scale respectively. Therefore, B4 is a secondary cause
of poor coastal shipping development stemming from B2 and B6. Similarly, B7 is likely to be
overcome automatically after some growth in coastal shipping, so it is not a real root cause.
It is interesting that the main barriers, those have most impact on coastal shipping development,
are not necessarily the ones most widely recognised. According to the results in Table 5, B4 is
most widely recognised (convergence rate: 100%), followed by B1, B5 and B10 (convergence
rate: 92%), and then B2 and B6 (convergence rate: 86%). However, B4 and B1 are both effect
barriers. B5, B10, B2 and B6 do not boast a higher convergence rate than B4 or B1, but,
nevertheless, it is the former which are the main barriers. If policy makers formulate intervention
policies simply based on the rankings of convergence rates, they would be seriously misled as
they may not be tackling the root causes but their effects. This shows the necessity of applying a
prioritisation technique such as DEMATEL to uncover the hidden cause and effect relationships
between barriers.
Based on the cause and effect diagram in Figure 2, Indian policy makers should seriously
consider revisiting the relevant Indian legislation, especially the cabotage rules (B5). One may
argue that most countries, including the US and China, impose at least national flag requirements
for coastal shipping cargoes (Brooks, 2014). However, it is also beyond doubt that cabotage rules
hinder the growth of coastal shipping, as they restrict foreign shipowners from moving cargoes
between domestic ports in India. Given that most domestic players are not experienced in coastal
shipping, relaxing the cabotage rules in India would allow those in this industry sector to learn
skills and knowledge from foreign players. Furthermore, a change in cabotage rules may
stimulate the inflow of foreign capital to fund the growth of coastal shipping in India. Note that
all EU members grant cabotage rights to each other which is in line with the EU’s support of
short sea shipping. Some other countries, for example, Australia and New Zealand, have already
partially or totally liberalised their coastal shipping sector. Even China is now contemplating
loosening its cabotage rules for domestic cargoes to and from the port of Shanghai to support its
development as an international shipping hub. Therefore, it is justifiable for India’s Parliament to
reexamine its cabotage rules to support the growth of a more sustainable transport mode.
The current port system is another area that Indian policy makers should focus on to support the
country’s coastal shipping development. The next two cause barriers, B2 and B6, both reflect
serious deficiencies in the port system. In comparison with the world’s leading ports, Indian
ports are less capable of providing value-added services, which are essential if a multimodal
logistics supply chain is to truly reap the benefits of coastal shipping. To facilitate the
movements of transshipment cargoes, Indian ports need to work together with Indian customs to
streamline clearance procedures, saving transit time and cost. In addition, the Indian Government
may consider chartering a concrete plan to guide the development of small ports; otherwise, the
infrastructural discrepancies between major and small ports will continue to limit the growth of
coastal shipping. Last but not least, the shipping industry must stop treating different transport
functions as isolated, and foster the collaboration among players in different sectors which has
become increasingly important in the era of supply chain management (Robinson, 2002; Zhang
et al., 2014). Due to a weak collaboration culture (B10), the Indian shipping industry has
remained fragmented and its cargo consolidation seriously limited, holding it back from scale
economy in maritime transport operations.
7. Conclusions
Short sea shipping has been increasingly recognised as a sustainable and efficient alternative to
road transport. It generates much less greenhouse gas emissions, saves freight costs over
medium-to-long transport distances, and reduces noise pollution, road accidents and traffic
congestion in urban areas. This study analyses the specific barriers and their impact on the
coastal shipping development in India. It is of practical significance as the Indian coastal
shipping sector needs timely intervention from the government to give momentum to the long-
awaited coastal shipping development. The Indian government is keen to promote coastal
shipping but has not charted a firm strategic plan yet.
The study also makes some unique contributions. First, it is believed to be the very first barrier
study on short sea/coastal shipping development. This domain of research is promising and
warrants further studies. Second, it employs DEMATEL, a sophisticated and proven technique, to
quantitatively prioritise barriers that are shortlisted using a Delphi study involving multiple
stakeholders who are very experienced with the Indian shipping industry. We found that the
main barriers, those that exert primary influence to hinder coastal shipping development, are not
necessarily the most widely recognised. This shows the necessity of using a scientific
prioritisation technique such as DEMATEL to analyse barriers so that policy makers can focus on
the cause barriers instead of their effects. Third, the results and findings have important policy
implications. In the Indian context, the main barriers are in the areas of legislation (especially
cabotage rules), infrastructure and procedures at port and port-centric areas, underdevelopment
of small ports, and lack of a collaborative culture among the various service providers involved
in the logistics supply chain. We have discussed relevant policy measures to overcome these
barriers. Although they are most relevant to Indian coastal shipping development, they shed light
on other economies that face similar obstacles to growing their coastal shipping industries.
As a pioneering work, the present study has its limitations. With its Indian perspective, its results
and findings may be more relevant to developing countries that have similar issues in coastal
shipping development than to developed economies. As the coastal shipping environment differs
from country to country, it is advisable for policy makers of other countries to conduct their own
studies by adapting our methodologies. Consequently, inclusion/exclusion of some barriers may
impact the overall results. One may extend our work to validate the cause-and-effect
relationships among barriers through a large scale survey. The study can also be extended to
analyse the managerial implications for industry stakeholders such as shipping lines, port
terminal operators and freight forwarders.
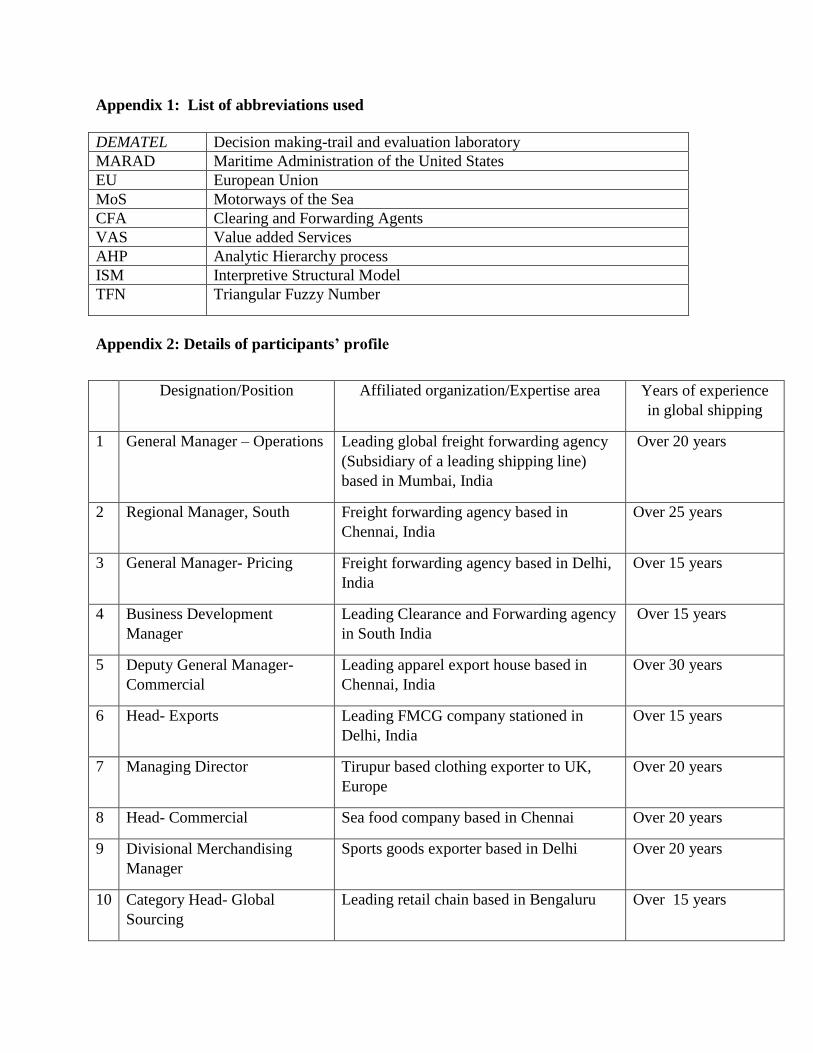
Appendix 1: List of abbreviations used
DEMATEL Decision making-trail and evaluation laboratory
MARAD Maritime Administration of the United States
EU European Union
MoS Motorways of the Sea
CFA Clearing and Forwarding Agents
VAS Value added Services
AHP Analytic Hierarchy process
ISM Interpretive Structural Model
TFN Triangular Fuzzy Number
Appendix 2: Details of participants’ profile
Designation/Position Affiliated organization/Expertise area Years of experience
in global shipping
1 General Manager – Operations Leading global freight forwarding agency
(Subsidiary of a leading shipping line)
based in Mumbai, India
Over 20 years
2 Regional Manager, South Freight forwarding agency based in
Chennai, India
Over 25 years
3 General Manager- Pricing Freight forwarding agency based in Delhi,
India
Over 15 years
4 Business Development
Manager
Leading Clearance and Forwarding agency
in South India
Over 15 years
5 Deputy General Manager-
Commercial
Leading apparel export house based in
Chennai, India
Over 30 years
6 Head- Exports Leading FMCG company stationed in
Delhi, India
Over 15 years
7 Managing Director Tirupur based clothing exporter to UK,
Europe
Over 20 years
8 Head- Commercial Sea food company based in Chennai Over 20 years
9 Divisional Merchandising
Manager
Sports goods exporter based in Delhi Over 20 years
10 Category Head- Global
Sourcing
Leading retail chain based in Bengaluru Over 15 years
11 General Manager – Port
Operations
Leading private port in west coast of India. Over 15 years
12 Senior Executive – Business
Development
Private port in east coast of India Over 10 years
13 Regional Manager, South India One of the leading shipping lines in the
world
Over 25 years
14 Customer Service Manager One of the leading shipping lines in the
world
Over 5 years
15 Operations Head Shipping line based in Chennai, India Over 15 years
16 Senior Manager, Port
Operations
Leading private port in the west coast of
India.
Over 10 years
17 General Manager – Port
Development and Operations
Leading port in South India Over 15 years
18 Consultant – EXIM Experiences in routing, optimization of
container utilization, managing the
businesses with the feeder vessels
Over 25 years
19 Supply Chain Consultant Experiences in supply chain and logistics;
Owner of a consulting firm.
Over 20 years
20 Port Planner / Consultant Leading construction company Over 15 years
21 Logistics Consultant Consulting company Over 10 year
22 Consultant – Transportation Leading consultancy services provider Over 8 years
23 Visiting Faculty – Shipping Expertise in Maritime transport Over 25 years
24 Academician & Senior
Professional in the Industry
Expertise in logistics and supply chain
with a specialization in automobile supply
chains
Over 20 years
25 National Head – Distribution/
Visiting Faculty
Leading FMCG distributor in Mumbai,
India
Over 20 years
26 Vice –President, Supply Chain Leading cold chain service provider,
Mumbai, India
Over 25 years
27 Senior General Manager – End
to End Solutions - Warehouse
Leading retail chain, Bengaluru, India Over 20 years
28 Senior Executive – Operations Packers and Movers company in Delhi,
India
Over 15 years
29 Vice – President – Logistics Third party logistics service provider based
in Bengaluru, India
Over 20 years
30 Regional Head- South,
Warehousing
Leading Third-party warehousing and
packaging company
Over 20 years
References
1. Ahmad, M. (2014). Green ships fuelled by LNG: Stimulus for Indian coastal shipping. India
Quarterly: A Journal of International Affairs, 70(2), 105-122.
2. Alam-Tabriz, A., Rajabani, N., and Farrokh, M. (2014). An integrated fuzzy DEMATEL-
ANP-TOPSIS methodology for supplier selection problem. Global Journal of Management
Studies and Researches, 1(2), 85-99.
3. Awasthi, A., and Grzybowska, K. (2014). Barriers of the supply chain integration process. In
Logistics Operations, Supply Chain Management and Sustainability (pp. 15-30).Springer
International Publishing.
4. Bahadori, M., Ravangard, R., and Asghari, B. (2013). Perceived barriers affecting access to
preventive dental services: Application of DEMATEL Method. Iranian Red Crescent
Medical Journal, 15(8), 655.
5. Baik, J. S., and Park, Y. A. (2002). 6. Elimination of barriers in maritime and multimodal
transport: Korea’s case study. Building an Integrated Transport Market for China, Japan,
and Korea: Elimination of Barriers, Edited by Lee JC and Kim YH, Korea Transport
Institute and East-West Center, 247-280.
6. Baykasoğlu, A., Kaplanoğlu, V., Durmuş Oğlu, Z. D., and ŞAhin, C. (2013). Integrating
fuzzy DEMATEL and fuzzy hierarchical TOPSIS methods for truck selection.Expert Systems
with Applications, 40(3), 899-907.
7. Baindur, D., and Viegas, J. (2011). Challenges to implementing motorways of the sea
concept—lessons from the past. Maritime Policy & Management, 38(7), 673-690.
8. Bendall, H. B., and Brooks, M. R. (2011). Short sea shipping: Lessons for or from Australia.
International Journal of Shipping and Transport Logistics, 3(4), 384-405.
9. Benyoucef, L., Hennet, J. C., & Tiwari, M. K. (2014). Applications of multi-criteria and game theory
approaches. Springer-Verlag London.
10. Beškovnik, B. (2006). Importance of short sea shipping and sea motorways in the European and
Slovenian transport policy.Pomorstvo, 20(1), 23-35.
11. Beškovnik, B. (2013). Possibilities for motorways of the sea development in the eastern part
of the Adriatic Sea.Polish Maritime Research, 20(1), 87-93.
12. Brooks, M. R. (2014). The changing regulation of coastal shipping in Australia."Ocean
Development and International Law, 45(1), 67-83.
13. Brooks, M. R., and Frost, J. D. (2004). Short sea shipping: A Canadian perspective. Maritime
Policy and Management, 31(4), 393–407.
14. Büyüközkan, G., and Çifçi, G. (2012). A novel hybrid MCDM approach based on fuzzy
DEMATEL, fuzzy ANP and fuzzy TOPSIS to evaluate green suppliers. Expert Systems with
Applications, 39(3), 3000-3011.
15. Čepinskis, J., and Masteika, I. (2011). Impacts of globalization on green logistics centers in
Lithuania.Environmental Research, Engineering and Management, 55(1), 34-42.
16. Chandra, P., and Jain, N. (2007). The logistics sector in India: Overview and challenges.
World Scientific Series on 21st Century Business, India. (Working Paper)
17. Chang, Y. C. (2011). Maritime clusters: What can be learnt from the South West of
England.Ocean and Coastal Management, 54(6), 488-494.
18. Chitravanshi, R. (2014, October 23), Government mulls fund to encourage cargo
transportation by ships. Available at: http://articles.economictimes.indiatimes.com [Accessed
on 29/3/ 2015].
19. CII Report (2012). Coastal Shipping.Available at: www.ciilogistics.com/
coastal_shipping.pdf [accessed on 5th March 2015].
20. Deng, H. (1999). Multi criteria analysis with fuzzy pair wise comparison. International
Journal of Approximate Reasoning, 21(3), 215-231.
21. Diabat, A., Khodaverdi, R., andOlfat, L. (2013).An exploration of green supply chain
practices and performances in an automotive industry.The International Journal of Advanced
Manufacturing Technology, 68(1-4), 949-961.
22. Dou, Y., and Sarkis, J. (2013).A multiple stakeholder perspective on barriers to
implementing China RoHS regulations.Resources, Conservation and Recycling, 81, 92-104.
23. Dou, Y., Sarkis, J., and Bai, C. (2014). Government green procurement: A fuzzy-DEMATEL
analysis of barriers. In Supply Chain Management Under Fuzziness (pp. 567-589). Springer
Berlin Heidelberg.
24. Douet, M., and Cappuccilli, J. F. (2011).A review of short sea shipping policy in the
European Union. Journal of Transport Geography, 19(4), 968-976.
25. Fahimi, M., Hesani, E., and Esmaeli, M. T. (2014). Selecting means of transportation by
combinatorial DEMATEL method and Taguchi Loss Function: A case of
DooshehHarazAmol dairy company. Asian Journal of Research in Social Sciences and
Humanities, 4(4), 505-514.
26. Fontela, E., and Gabus, A. (1976).The DEMATEL observer, DEMATEL 1976 report.
Switzerland Geneva: Battelle Geneva Research Center, Geneva, Switzerland.
27. Fu, X., Zhu, Q., & Sarkis, J. (2012). Evaluating green supplier development programs at a
telecommunications systems provider. International Journal of Production
Economics, 140(1), 357-367.
28. Gabus, A., and Fontela, E. (1972). World problems, an invitation to further thought within
the framework of DEMATEL. Battelle Geneva Research Center, Geneva, Switzerland.
29. Gouvernal, E., Slack, B., and Franc, P. (2010). Short sea and deep sea shipping markets in
France.Journal of Transport Geography, 18(1), 97-103.
30. Grisham, T. (2009). The Delphi technique: a method for testing complex and multifaceted
topics. International Journal of Managing Projects in Business, 2(1), 112-130.
31. Grosso, M., Lynce, A. R., Silla, A., andVaggelas, G. K. (2010). Short sea shipping,
intermodality and parameters influencing pricing policies: The Mediterranean case.
NETNOMICS: Economic Research and Electronic Networking, 11(1), 47-67.
32. Herrera- Videma, E. (2015). Fuzzy sets and fuzzy logic in multi-criteria decision making.
The 50th anniversary of Prof. Lotfi Zadeh's theory: introduction. Technological and
Economic Development of Economy, 21(5), 677-683.
33. Hong, J. (2007). Transport and the location of foreign logistics firms: The Chinese
experience. Transportation Research Part A: Policy and Practice, 41(6), 597-609.
34. Hsu, C. W., Kuo, T. C., Chen, S. H., and Hu, A. H. (2013).Using DEMATEL to develop a
carbon management model of supplier selection in green supply chain management.Journal
of Cleaner Production, 56 (1), 164-172.
35. India Transport Report (2014). India Transport Report – Vol I,. Available at
http://planningcommission.nic.in/reports/genrep/NTDPC_Vol_01.pdf [accessed on
14/3/2015]
36. Jim Wu, Y. C., and Lin, C. W. (2008). National port competitiveness: Implications for India.
Management Decision, 46(10), 1482-1507.
37. Kahraman, C. (2008). Fuzzy multi-criteria decision making: theory and applications with
recent developments (Vol. 16). Springer Science and Business Media, Istanbul, Turkey.
38. Kelegama, S. (Ed.). (2009). Trade in services in South Asia: Opportunities and risks of
liberalization. SAGE Publications, New Delhi, India.
39. KPMG Report (2013). All Aboard – Insights into India maritime community. Available on
line at: https://www.kpmg.com/IN/en/IssuesAndInsights/ArticlesPublications/
Documents/KPMG_All_Aboard_Insights_into_India_maritime_community.pdf [accessed on
12/2/2015]
40. Kumar, S., Singh, B., Qadri, M.A., Kumar, Y.S., and Haleem, A. (2013).A framework for
comparative evaluation of lean performance of firms using fuzzy TOPSIS. International
Journal of Productivity and Quality Management, 11(4), 371-392.
41. Lee, E. S. (2010). Knowledge resource in maritime transport industry: A case analysis. Asian
Journal of Shipping and Logistics, 26(2), 297–340.
42. Li, D. F., & Wan, S. P. (2014). A fuzzy inhomogeneous multiattribute group decision making
approach to solve outsourcing provider selection problems. Knowledge-Based Systems, 67,
71-89.
43. Li, G., Kou, G., Lin, C., Xu, L., & Liao, Y. (2015). Multi-attribute decision making with
generalized fuzzy numbers. Journal of the Operational Research Society, 66(11), 1793-1803.
44. Lin, R. J. (2013). Using fuzzy DEMATEL to evaluate the green supply chain management
practices. Journal of Cleaner Production, 40 (February), 32-39.
45. Liou, J. J. H., Tzeng, G. H., and Chang, H. C. (2007).Airline safety measurement using a
hybrid model.Journal of Air Transport management, 13(4), 243–249.
46. Live Mint Report (2014). Government Turns attention to Coastal Shipping.Available at
http://www.livemint.com/Opinion/DsKQalf6u2wdmlR9Z9qlfO/Narendra-Modi-government-
turns-attention-to-coastal-shipping.html accessed on [14/April/2015]
47. Luthra, S., Garg, D., and Haleem, A. (2015). An analysis of interactions among critical
success factors to implement green supply chain management towards sustainability: An
Indian perspective. Resources Policy, 46(1), 37-50.
48. Luthra, S., Kumar, V., Kumar, S., andHaleem, A. (2011). Barriers to implement green supply
chain management in automobile industry using interpretive structural modeling technique:
an Indian perspective. Journal of Industrial Engineering and Management, 4(2), 231-257.
49. Mangla, S. K., Kumar, P., and Barua, M. K. (2015). Risk analysis in green supply chain
using fuzzy AHP approach: A case study. Resources, Conservation and Recycling, 104(B),
375-390.
50. Mangla, S. K., Kumar, P., and Barua, M. K. (2014). An evaluation of attribute for improving
the green supply chain performance via DEMATEL method. International Journal of
Mechanical Engineering and Robotics Research, 1(1), 30-35.
51. Mangla, S., Madaan, J., and Chan, F. T.S. (2013).Analysis of flexible decision strategies for
sustainability-focused green product recovery system. International Journal of Production
Research, 51(11), 3428-3442.
52. MARAD (2005).Glossary of shipping terms. Available at: http://www.marad.dot.gov
[accessed on 6/3/2015].
53. Mavi, R. K., Kazemi, S., Najafabadi, A. F., andMousaabadi, H. B. (2013). Identification and
assessment of logistical factors to evaluate a green supplier using the fuzzy logic DEMATEL
method. Polish Journal of Environmental Studies, 22(2), 445-455.
54. Medda, F., and Trujillo, L. (2010). Short-sea shipping: An analysis of its determinants.
Maritime Policy and Management, 37(3), 285-303.
55. Musso, E., andMarchese, U. (2002).Economics of short sea shipping.In C. Th. Grammenos
(Ed.), Handbook of maritime economics and business (pp. 280–304). London: Lloyd’s of
London.
56. Ng, A. K. Y. (2009). Competitiveness of short sea shipping and the role of port: the case of
North Europe. Maritime Policy & Management, 36(4), 337-352.
57. Okoli, C., and Pawlowski, S. D. (2004). The Delphi method as a research tool: An example,
design considerations and applications. Information and management, 42(1), 15-29.
58. OIFC (Overseas Indian Facility Center) (OIFC, 2012), Ports in India, Available at
http://www.oifc.in/sectors/infrastructure/ports [accessed on 28th Dec 2015]
59. Paixão Casaca, A. C., and Marlow, P. B. (2002).Strengths and weaknesses of short sea
shipping.Marine Policy, 26(3), 167-178.
60. Paixão Casaca, A. C. and Marlow, P. B. (2005). The competitiveness of short sea shipping in
multimodal logistics supply chains: service attributes. Maritime Policy & Management, 32(4),
363-382.
61. Panayides, P. M., and Song, D. W. (2009). Port integration in global supply chains: Measures
and implications for maritime logistics. International Journal of Logistics: Research and
Applications, 12(2), 133-145.
62. Patil, S. K., and Kant, R. (2014). A hybrid approach based on fuzzy DEMATEL and
FMCDM to predict success of knowledge management adoption in supply chain. Applied
Soft Computing, 18 (May), 126-135.
63. Perakis, A. N., and Denisis, A. (2008). A survey of short sea shipping and its prospects in the
USA. Maritime Policy & Management, 35(6), 591-614.
64. Raghuram, G. (2000). Coastal shipping: Scope of integrating with the national transport
network.A Working Paper, Indian Institute of Management Ahmedabad, Research and
Publication Department, No.WP2000-10-04. Available at: http://vslir.iimahd.ernet.in[
accessed on 13/April/15]
65. Raghuram, G., and Shukla, N. (2014).Issues in PPPs in ports in India. A Working Paper,
Indian Institute of Management Ahmedabad, Research and Publication Department,
No.WP2014-01-06. Available at: http://vslir.iimahd.ernet.in[accessed on 13/4/15].
66. Reis, J., Stojanovic, T., and Smith, H. (2014). Relevance of systems approaches for
implementing Integrated Coastal Zone Management principles in Europe. Marine Policy, 43
(January), 3-12.
67. Robinson, R. (2002). Ports as elements in value-driven chain systems: the new paradigm.
Maritime Policy & Management, 29(3), 241-255.
68. Rowlinson, M., and Wixey, S. (2002, November). The politics and economics of developing
coastal shipping.In IAME 2002 Panama Conference Proceedings.
69. Saldanha, J., and Gray, R. (2002). The potential for British coastal shipping in a multimodal
chain. Maritime Policy & Management, 29(1), 77-92.
70. Sakhuja, V. (2011).Asian Maritime Power in the 21st Century: Strategic Transactions:
China, India and Southeast Asia. Institute of Southeast Asian Studies, Singapore.
71. Sanchez, R. J., and Wilmsmeier, G. (2005). Short-sea shipping potentials in Central America
to bridge infrastructural gaps.Maritime Policy & Management, 32(3), 227-244.
72. Seçme, N. Y., Bayrakdaroğlu, A., and Kahraman, C. (2009). Fuzzy performance evaluation
in Turkish banking sector using analytic hierarchy process and TOPSIS. Expert Systems with
Applications, 36(9), 11699-11709.
73. Shao, J., Taisch, M., & Ortega-Mier, M. (2016). A grey-DEcision-MAking Trial and
Evaluation Laboratory (DEMATEL) analysis on the barriers between environmentally
friendly products and consumers: practitioners' viewpoints on the European automobile
industry. Journal of Cleaner Production, 112, 3185-3194.
74. Song, D.W. & Paul T-W Lee (2009) Maritime logistics in the global supply chain,
International Journal of Logistics Research and Applications: A Leading Journal of Supply
Chain Management, 12(2), 83-84
75. Suárez–Alemán, A., Campos, J., and Jiménez, J. L. (2015). The economic competitiveness of
short sea shipping: An empirical assessment for Spanish ports. International Journal of
Shipping and Transport Logistics, 7(1), 42-67.
76. Suárez-Alemán, A., Trujillo, L., and Cullinane, K. P. (2014). Time at ports in short sea
shipping: When timing is crucial. Maritime Economics and Logistics, 16(4), 399-417.
77. Sundar, S., and Jaswal, P. (2007). Bottlenecks in the Growth of Coastal Shipping, Available
at: https://openaccess.adb.org/bitstream/handle/11540/1453/inrm14.pdf?sequence=1
[accessed on 21/Dec/2015]
78. TATA SMG Report (2013). SMG report. Available at: http://www.tsmg.com/download
/article/Coastal%20Shipping.pdf [accessed on 13/Mar/2015]
79. Tzeng, G. H., and Huang, C. Y. (2012). Combined DEMATEL technique with hybrid
MCDM methods for creating the aspired intelligent global manufacturing and logistics
systems. Annals of Operations Research, 197(1), 159-190.
80. Wang, W. P. (2009). Toward developing agility evaluation of mass customization systems
using 2-tuple linguistic computing. Expert Systems with Applications, 36(2), 3439-3447.
81. Webb, R. (2004). Coastal shipping: an overview. Information and Research Services,
Department of the Parliamentary Library.
82. Woodburn, A., Allen, J., Browne, M., andLeonardi, J. (2008).The impacts of globalization on
international road and rail freight transport activity–Past trends and future perspectives.
Transport Studies Department, University of Westminster, London, UK.
83. Wu, K. J., Liao, C. J., Tseng, M. L., and Chiu, A. S. (2015).Exploring decisive factors in
green supply chain practices under uncertainty.International Journal of Production
Economics, 159, 147-157.
84. Wu, W. W. (2012). Segmenting critical factors for successful knowledge management
implementation using the fuzzy DEMATEL method. Applied Soft Computing, 12(1), 527-
535.
85. Wu, W. W., and Lee, Y. T. (2007). Developing global managers’ competencies using the
fuzzy DEMATEL method. Expert Systems with Applications, 32(2), 499-507.
86. Wu, W. W., Lan, L. W., and Lee, Y. T. (2011). Exploring decisive factors affecting an
organization's SaaS adoption: A case study. International Journal of Information
Management, 31(6), 556-563.
87. Xia, X., Govindan, K., and Zhu, Q. (2015). Analyzing internal barriers for automotive parts
remanufacturers in China using grey-DEMATEL approach.Journal of Cleaner Production,
87, 811-825.
88. Yonge, M. and Henesey, L. (2005). A decision tool for identifying the prospects and
opportunities for short sea shipping.A study commissioned to the Canaveral Port Authority,
Canaveral.
89. Zadeh, L. A. (1965). Fuzzy sets. Information and Control, 8(3), 338-353.
90. Zhang, A., Lam, J.S.L. and Huang, G.Q. (2014). “Port strategy in the era of supply chain
management: the case of Hong Kong”. Maritime Policy & Management, 41(4), 367-383.
91. Zhu, Q., Huang, W., and Zhang, Y. (2011). Identifying critical success factors in emergency
management using a fuzzy DEMATEL method. Safety Science, 49(2), 243-252.
92. Zhu, Q., Sarkis, J., and Lai, K. H. (2014). Supply chain-based barriers for truck-engine
remanufacturing in China. Transportation Research Part E: Logistics and Transportation
Review, 68(1), 103-117.
Related Documents