Barrier properties of stratum corneum lipid model membranes based on ceramide [AP] and [EOS] Dissertation zur Erlangung des akademischen Grades doctor rerum naturalium (Dr. rer. nat.) vorgelegt der Naturwissenschaftlichen Fakultät I Biowissenschaften der Martin-Luther-Universität Halle-Wittenberg von MSc. Pharm. Michal Ochalek geboren am 5. März 1984 in Szamocin (Polen) Gutachter 1. Prof. Dr. Dr. h.c. Reinhard Neubert 2. Prof. Dr. Johannes Wohlrab 3. Prof. Dr. Christel Müller-Goymann Tag der öffentlichen Verteidigung: 29.08.2012

Welcome message from author
This document is posted to help you gain knowledge. Please leave a comment to let me know what you think about it! Share it to your friends and learn new things together.
Transcript

Barrier properties of stratum corneum lipid model
membranes based on ceramide [AP] and [EOS]
Dissertation
zur Erlangung des akademischen Grades
doctor rerum naturalium (Dr. rer. nat.)
vorgelegt der
Naturwissenschaftlichen Fakultät I
Biowissenschaften
der Martin-Luther-Universität Halle-Wittenberg
von
MSc. Pharm. Michal Ochalek
geboren am 5. März 1984 in Szamocin (Polen)
Gutachter
1. Prof. Dr. Dr. h.c. Reinhard Neubert
2. Prof. Dr. Johannes Wohlrab
3. Prof. Dr. Christel Müller-Goymann
Tag der öffentlichen Verteidigung: 29.08.2012

Table of contents
Chapter 1 Introduction ....................................................................................... 6
Chapter 2 The stratum corneum – its composition, organization and function .... 9
2.1 The organization and function of the human skin ......................................... 9
2.2 The stratum corneum ................................................................................ 11
2.2.1 Penetration routes through the stratum corneum .......................................... 13
2.2.2 The stratum corneum intercellular lipid matrix composition .......................... 14
2.2.3 The stratum corneum intercellular lipid matrix organization .......................... 17
Chapter 3 Drug delivery into the skin .................................................................22
3.1 Enhancement of drug penetration into the skin ......................................... 22
3.2 In vitro diffusion and permeation studies................................................... 23
Chapter 4 Basic principles of experimental techniques applied ..........................26
4.1 X-ray diffraction ........................................................................................ 26
4.1.1 Small angle X-ray diffraction (SAXD) ................................................................. 27
4.2 Vibrational spectroscopy ........................................................................... 28
4.2.1 ATR-FTIR diffusion cell ...................................................................................... 29
4.2.2 Confocal Raman imaging .................................................................................. 31
4.3 Environmental scanning electron microscopy ............................................ 32
4.4 Analytical separation techniques ............................................................... 33
4.4.1 High performance thin layer chromatography ................................................. 33
4.4.2 High performance liquid chromatography ....................................................... 34
4.4.3 Capillary electrophoresis .................................................................................. 36
References ................................................................................................ 38

Chapter 5 Characterization of lipid model membranes designed for studying
impact of ceramide species on drug diffusion and penetration ..........45
Chapter 6 SC lipid model membranes designed for studying impact of
ceramide species on drug diffusion and permeation, Part II:
Diffusion and permeation of model drugs ..........................................64
Chapter 7 SC lipid model membranes designed for studying impact of
ceramide species on drug diffusion and permeation, Part III:
Influence of penetration enhancer on diffusion and permeation of
model drugs ......................................................................................82
Chapter 8 Summary and perspectives .............................................................. 102
Chapter 9 Zusammenfassung und Ausblick ...................................................... 106
List of Publications .................................................................................. 111
Curriculum Vitae ..................................................................................... 114

Abbreviations and Symbols
[AP] α-hydroxy phytosphingosine
ATR attenuated total reflection
CE capillary electrophoresis
CZE capillary zone electrophoresis
Cer ceramide(s)
Chol cholesterol
ChS cholesterol sulfate
d lamellar repeat distance
dp penetration depth
D diffusion coefficient
e.g. exempli gratia (“for example”)
EOF electroosmotic flow
[EOS] ω-hydroxy sphingosine
ESEM environmental scanning electron microscopy
FFA free fatty acid
FT Fourier transform
HPTLC high performance thin layer chromatography
i.a. inter alia (“among other things”)
i.e. id est (“that is”)
IR infrared
J steady-state flux
Km/d partition coefficient between membrane and donor
kp permeability coefficient
wavelength
L membrane thickness (diffusional pathlength)
LPP long periodicity phase
m/m mass/mass percentage
MIR mid-infrared
n refractive index
NA numerical aperture

OA oleic acid
PA palmitic acid
PBS phosphate-buffered saline
q scattering vector
Rf retention factor
RP-HPLC reversed-phase HPLC
SAXD small angle X-ray diffraction
SC stratum corneum
SEM scanning electron microscopy
SPP short periodicity phase
TEM transmission electron microscopy
TL lag-time
scattering angle
u concentration
UV ultraviolet
wavenumber
v/v volume/volume percentage
x space coordinate
The rest of abbreviations and symbols is explained in relevant chapters.

6
1 Introduction
The skin is the largest organ of the human body in terms of area and mass. It covers
an area of approximately 1.7 m2 and constitutes about 10% of the body mass of an
average adult person [1]. The skin provides many vital functions. Its principal function is
to separate the body fluids and tissues from the external environment and to act as a
protective barrier against harmful outside factors like chemicals, pathogens, UV-radiation,
temperature, as well as against uncontrolled water loss. It plays also a crucial role in the
regulation of body temperature (perspiratory function of sweat glands). The sensing
function of the skin (reception of external stimuli such as pressure, pain and heat) is of
major importance for the prevention of severe damage of the human body caused by e.g.
too long exposure of the skin to the heat source. Some of the minor functions of the
human skin are the synthesis of Vitamin D (as a result of a photochemical reaction taking
place within the keratinocytes), the elimination of biochemical wastes (in glandular
secretions) and the participation in the immune answer of the human body (Langerhans
cells present in the skin are an early-warning component of the immune system) [2-4].
The fundamental function of the skin, the skin barrier function, has been of major
interest for decades. First, it was discovered that it is provided by the outermost layer of
the skin, the stratum corneum (SC), and the barrier properties result from the unique
composition and organization of the SC [5]. Later, the SC intercellular lipid fraction was
proposed to play a key role in the formation and maintenance of the skin barrier [6]. This
discovery led to many studies trying to elucidate the organization of the SC intercellular
lipid matrix. As a consequence, a number of theoretical models of the SC lipid matrix
organization, along with the most important the stacked monolayer model, the domain
mosaic model, the sandwich model, the single gel phase model and the most recent
armature reinforcement model, were suggested [7-12]. However, none of these models
clarifies all structural aspects of the human SC organization.
The semipermeable character of the SC is responsible, on the one hand, for the
protection against exogenous influences and desiccation, and, on the other hand, limits
the penetration of drugs into the skin, both endodermal (the local treatment of skin
diseases) and transdermal drugs (the systemic effect, i.e. the drug is taken up by the
systemic circulation from the dermis after crossing the SC) [13]. The low ability of drugs to
pass the SC barrier constitutes a major problem and, at the same time, a challenge in the
Chapter 1 Introduction 7
dermal/transdermal administration of drugs. This administration route offers many
advantages when compared to other more conventional ways of drug administration (e.g.
oral), namely the avoidance of the first pass effect in the liver, the reduction of side
effects, etc. In order to facilitate the absorption of topically applied drugs, the skin barrier
function needs to be temporarily weakened by the use of physical (e.g. sonophoresis,
iontophoresis, electroporation) or chemical (application of penetration enhancers)
methods [14]. Nevertheless, the mechanisms of action of the drug penetration
enhancement methods, especially modes of action of penetration enhancers, and their
impact on the SC structure are still not well understood.
The molecular organization of the SC lipid matrix, as well as the function of each
lipid species in the formation and maintenance of the SC barrier, are not yet fully
explained. A better comprehension of the SC lipids interactions is crucial for the
elucidation of the impact of all SC lipid species, especially ceramides, on the SC barrier
properties. In former studies focused on the investigation of the SC lipid organization,
native SC lipids isolated from the mammalian skin and lipid model membranes created
from the extracted SC lipids were used [15-23]. Since native SC membranes are very
complex, the use of such SC systems reduces the possibility to relate the differences in
the SC lipid composition to the alterations in the SC molecular organization. A perfect
solution to this problem is the use of SC lipid model membranes composed of artificial SC
lipids as they offer many advantages over the native ones. First of all, they can help to
overcome problems like the limited availability and high inter- and intra-individual
variability of native SC membranes [9]. Furthermore, the use of well-defined synthetic SC
lipid model membranes offers the possibility to alter their composition systematically,
hence it allows to study and elucidate the role of each individual lipid species in the SC
intercellular lipid organization and barrier function. In the recent studies, where artificial
SC lipid systems were used [11, 12, 24-28], the focus was placed on the investigation of
the SC lipid composition–organization relationship. However, no direct information about
the relation between the SC lipid composition/organization and the SC barrier function
was acquired. This thesis aims at getting a better insight into the SC intercellular lipid
matrix composition/organization–barrier function relationship. The purpose is to relate
the changes in the organization of the SC lipid model membranes, on a molecular level, to
modifications in their barrier function.
In the first part of this thesis, the current status of knowledge on the SC
composition and organization will be presented (Chapter 2). In Chapter 3, the methods of
drug penetration enhancement into the skin, as well as the use of in vitro diffusion and

Chapter 1 Introduction 8
permeation experiments in the dermal and transdermal drug delivery studies will be
discussed. In Chapter 4, the fundamental principles of experimental techniques employed
for the purpose of this work will be described.
In the second part, the following objectives of this thesis will be elaborated and
discussed:
(i) Preparation of artificial SC lipid model membranes on a porous substrate to
enable the conduct of in vitro diffusion and permeation studies of model drugs
(Chapter 5).
(ii) Characterization and standardization of SC lipid model membranes prepared on
the porous substrate by means of various analytical techniques, i.a. small angle
X-ray diffraction, high performance thin layer chromatography, environmental
scanning electron microscopy and confocal Raman imaging (Chapter 5).
(iii) Diffusion and permeation studies of model drugs through SC lipid model
membranes designed for investigating the relation between their composition
and the barrier function (Chapter 6).
(iv) Investigation of the influence of the penetration enhancer on the barrier
properties of the SC lipid model membranes (Chapter 7).

9
2 The stratum corneum – its composition, organization and
function
2.1 The organization and function of the human skin
The skin is composed of three distinct layers: the outermost epidermis, the dermis
and the innermost hypodermis (the subcutaneous fat layer) [29, 30]. Its structure is
presented in Fig. 1.
Fig. 1. Structure of human skin (adapted from [31]).
The hypodermis (subcutis) is a connector between the overlying dermis and the
body tissues situated underneath. It is typically several millimeters thick and its thickness
depends on the number of adipocytes (cells storing fat) located within it. The subcutis
provides isolation and, therefore, protection against cold and physical shock. It contains
principal blood vessels and nerves, which traverse to the overlying layers of the skin [32].
The next skin layer, lying over the hypodermis, is the dermis (corium). It is 1–5 mm
thick [33] and consists of a connective tissue with collagen and elastin fibers embedded in
a mucopolysaccharide gel [34]. The collagen fibers provide support to the skin and the
elastin ones – flexibility. There are numerous structures embedded within the dermis
such as blood and lymphatic vessels, nerve endings, hair follicles, sebaceous and sweat
glands.
The outermost layer of the human skin, the epidermis, ranges from about 0.06 mm
to about 0.8 mm in thickness (depending on the area of the body). It is a dynamic, self-

Chapter 2 Stratum corneum 10
renewing tissue layer, where cells that are separated from the surface in consequence of
the desquamation process, are replaced by new cells produced in its lowest layer [35].
There are no blood vessels within this skin layer, hence transdermal drugs must permeate
through the epidermis in order to get into the systemic circulation [32]. The epidermis
can be divided into four histologically distinct layers: starting with the stratum basale at
the dermo-epidermal interface, followed by the stratum spinosum, the stratum
granulosum and the stratum corneum. A schematic diagram of the epidermal layers as
well as a presentation of the changes within the cells undergoing during the cell
differentiation are displayed in Fig. 2.
The stratum basale, also known as the stratum germinativum or the basal layer, is
the innermost epidermal layer. It is composed of a single layer of columnar basal cells
(keratinocytes), attached to the basement membrane by hemidesmosomes.
Keratinocytes, the major cell type within the viable epidermis, contain all typical cell
organelles such as nucleus, mitochondria and ribosomes [36]. A constant mitosis of these
cells in the basal layer compensates a loss of cells from the skin surface, causing a renewal
of the epidermis. The other cells present in the basal layer are: melanocytes (synthesizing
skin pigment melanin), Langerhans cells (antigen-presenting dendritic cells) and Merkell
cells (responsible for cutaneous sensation) [3].
Fig. 2. Schematic representation of the structure of the epidermis and its cell differentiation
(adapted from [32]).

Chapter 2 Stratum corneum 11
The next layer of the epidermis, the stratum spinosum (also referred to as the
spinous layer or the prickle cell layer) is made up of 2–6 rows of keratinocytes that start
to change their morphology and begin to differentiate. The synthesized keratin filaments
tend to aggregate and create tonofilaments. As a result of the condensation of
tonofilaments, structures called desmosomes are formed. They act as the connectors
between the cell membranes of the adjacent keratinocytes, and hence are responsible for
keeping the integrity of the tissue [37, 38]. In the upper layers of the stratum spinosum,
the keratinocytes contain two types of intracellular granules: keratohyalin granules and
membrane-coated granules (also known as lamellar bodies or Odland bodies [39]). The
Odland bodies are composed predominantly of polar lipids (i.e. phospholipids,
glucosylsphingolipids, free sterols) and catabolic enzymes (i.e. hydrolases) and their
contents are of major importance for the formation of intercellular lipid lamellae within
the stratum corneum [40-42].
By the continuation of the cell differentiation process and by moving upward, the
keratinocytes reach the stratum granulosum (or the granular layer), which consists of 1–3
layers of highly differentiated cells that start to flatten. Their viable cell constituents (such
as nuclei) are degraded by enzymes, and the Odland bodies, containing the lipid
precursors for the intercellular lamellae of the SC, migrate to the apical part of the
keratinocytes, being ready for a fusion with the cell membrane. As the cells approach the
stratum granulosum–SC interface, the contents of the lamellar bodies are secreted via
exocytosis to the intercellular space, where hydrolases transform them to ceramides, free
fatty acids, cholesterol and cholesterol esters [6, 43].
2.2 The stratum corneum
The outermost layer of the skin, the stratum corneum (SC, also referred to as the
cornified layer or the horny layer), is thought to constitute the main penetration barrier
for topically administered drugs and other substances, including water [44, 45]. It consists
of 10–25 layers of parallel to the skin surface dead, anucleated corneocytes
(keratinocytes in a terminal stage of cell differentiation), and ranges from 10 to 15 μm in
thickness when dry, however, swells to several times this thickness in a fully hydrated
state [46]. The elongated and flat corneocytes are embedded in a lipid matrix. This
characteristic organization of the SC is often described as the “brick and mortar” structure

Chapter 2 Stratum corneum 12
(Fig. 3), where the corneocytes resembling the bricks are embedded in the mortar of the
SC intercellular lipid bilayers [47-50].
The corneocytes, comprising keratin fibrils, are surrounded by a cornified cell
envelope, which is formed during the terminal stage of keratinization and is composed
predominantly of loricrin, involucrin and cornifine that are cross-linked as a result of the
action of calcium dependent transglutaminases [52, 53]. The cornified cell envelope is a
rigid structure, highly resistant to proteolytic enzymes and organic solvents. Its proteins
(mainly involucrin) are covalently bound to long-chain ω-hydroxyacyl moieties of
ceramides of a lipid envelope [54-56]. The interaction between the cornified cell envelope
and the lipid envelope stabilizes the SC structure and provides the cohesiveness of
corneocytes with the SC intercellular lipids. The corneocytes are kept together by
corneodesmosomes, which are enzymatically degraded during the desquamation process
[30, 57]. Properly functioning desquamation process is of major importance for the
maintenance of the normal skin structure and function. It depends on the hydration state
of the SC and the content of cholesterol sulfate in its upper layers. It was found that
desquamation is inhibited in the excess of cholesterol sulfate and at low environmental
humidity [58]. The mechanism of the inhibition of the cell shedding process is not yet fully
explained, however, most probable reason is the reduced activity of desquamatory
enzymes at lower water content and/or higher cholesterol sulfate content [59].
Fig. 3. Organization of the stratum corneum with a characteristic “brick and mortar” structure
(adapted from [51]).
Chapter 2 Stratum corneum 13
Disturbances in the desquamation process lead to the skin disorders like recessive X-
linked ichthyosis (caused by a deficiency of a cholesterol sulfatase) [60, 61].
The unique composition of the SC contributes to its barrier function. It consists in
75–85% (the SC dry weight) of proteins, whereas lipids constitute only 5–15% [34].
However, the proteins are mainly to be found in the corneocytes, enzymes and the
cornified cell envelope, while the lipids build up the lipid matrix located in the SC
intercellular space.
2.2.1 Penetration routes through the stratum corneum
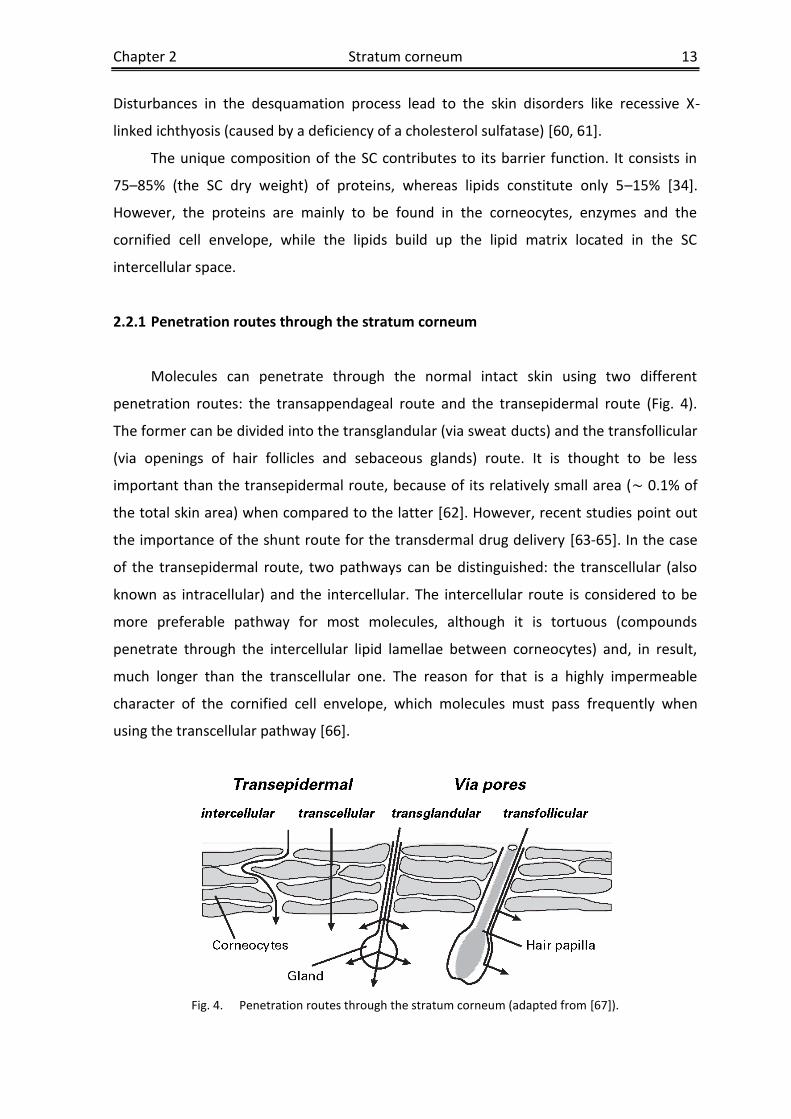
Molecules can penetrate through the normal intact skin using two different
penetration routes: the transappendageal route and the transepidermal route (Fig. 4).
The former can be divided into the transglandular (via sweat ducts) and the transfollicular
(via openings of hair follicles and sebaceous glands) route. It is thought to be less
important than the transepidermal route, because of its relatively small area (~ 0.1% of
the total skin area) when compared to the latter [62]. However, recent studies point out
the importance of the shunt route for the transdermal drug delivery [63-65]. In the case
of the transepidermal route, two pathways can be distinguished: the transcellular (also
known as intracellular) and the intercellular. The intercellular route is considered to be
more preferable pathway for most molecules, although it is tortuous (compounds
penetrate through the intercellular lipid lamellae between corneocytes) and, in result,
much longer than the transcellular one. The reason for that is a highly impermeable
character of the cornified cell envelope, which molecules must pass frequently when
using the transcellular pathway [66].
Fig. 4. Penetration routes through the stratum corneum (adapted from [67]).

Chapter 2 Stratum corneum 14
Because of the lipophilic nature of the SC and the low water content, it is believed
that the penetration of hydrophilic compounds is hampered when compared to the
penetration of the lipophilic ones. However, recent studies suggest the existence of two
distinct penetration pathways within the SC: lipophilic and hydrophilic one.
On the one hand, lipophilic molecules penetrate within the nonpolar tail-group
regions of the SC lipid bilayers; on the other hand, hydrophilic molecules penetrate within
their polar head group regions using the hydrophilic pathway [68]. Therefore, a further
insight into the composition and organization of the SC intercellular lipids is crucial for
better understanding of the human skin barrier function.
2.2.2 The stratum corneum intercellular lipid matrix composition
The key role in functioning of the skin barrier plays the lipid part of the SC.
Furthermore, the SC barrier function is determined not only by the individual lipid
species, but by the organization of different classes of lipid species and corneocytes [69].
As mentioned previously, the SC intercellular lipids originate from Odland bodies.
Following the exocytosis of their contents to the intercellular space at the stratum
granulosum–SC interface, phospholipids, glucosylsphingolipids and free sterols are
enzymatically converted to less polar ceramides, free fatty acids and cholesterol esters
that altogether form lipid lamellae [6, 43].
Therefore, ceramides (Cer), cholesterol (Chol) and long-chain free fatty acids (FFA)
are the major lipid classes present in the SC intercellular space [70, 71]. Interestingly, the
SC does not contain phospholipids, contrary to other biological barriers (e.g. cell
membranes). The SC lipid composition varies inter- and intra-individually [9, 72, 73].
Disturbances of the skin barrier function caused by changes in the SC lipid composition
can lead to skin diseases. Hence, the knowledge on the role each lipid class plays in the SC
lipid barrier function is of great importance.
Ceramides (Cer) are the main constituents of the SC intercellular lipid matrix and
are regarded as principal compounds in the formation and maintenance of the SC barrier
function [56, 74]. Cer belong to structurally heterogeneous sphingolipids and are
composed of a sphingoid base amide-linked to a long chain fatty acid. Only D-forms of Cer
are present in the native SC. The results of a recent study indicate the existence of 12
classes of Cer that have been isolated from the human SC [75]. The original nomenclature
of Cer was based on their polarity measured by the thin layer chromatography, where
each Cer was assigned a number. The higher number of Cer, the more polar molecule

Chapter 2 Stratum corneum 15
[76]. With the increasing number of identified Cer, this way of Cer labeling appeared to be
unsatisfactory. Therefore, nowadays, more preferred and more frequently used
classification of Cer is based on their molecular structure [77].
Fig. 5. Chemical structures of ceramides with their nomenclature according to [77].
Individual classes of Cer differ from each other by the type of a sphingoid moiety
(sphingosine [S], phytosphingosine [P], 6-hydroxysphingosine [H] or dihydrosphingosine

Chapter 2 Stratum corneum 16
[dS]) that is bound to a fatty acid moiety, which can be non-hydroxylated [N] or α-
hydroxylated [A] with its chain length of mostly 24 to 26 carbon atoms. In the case of
acylceramides that have unique, unusually long molecular structures, unsaturated linoleic
acid is ester linked to ω-hydroxy fatty acid of 30–34 carbon atoms [EO] [78, 79]. The
chemical structures of Cer found in the human SC are displayed in Fig. 5. As indicated
above, the Cer have a significant impact on the SC barrier function, however, the role of
each Cer class is not yet known or fully explained.
Cholesterol (Chol), which constitutes approx. 25% of the SC lipid mass [13], is the
most abundant individual lipid species in the SC. The SC cholesterol is synthesized mainly
in the epidermis. Its increased synthesis, as a result of skin barrier function disorders,
returns to normal when barrier function is recovered [80], which confirms the importance
of Chol for the maintenance of the SC barrier function. Chol molecule fits into the lipid
bilayer with its hydrophobic steroid ring and an adjacent short aliphatic chain oriented
towards the long hydrocarbon chains of Cer and FFA, while its hydroxyl group is located
close to the polar head groups of Cer [81]. Of great importance is the right content of
Chol in the SC intercellular lipid matrix. The optimal, for the SC barrier function,
concentration of Chol is just under its solubility in the lipid lamellae (~ 30 mol% [82]).
Higher concentrations of Chol may cause the creation of discontinuities within lipid
bilayers, as a consequence of the formation of pure domains of crystalline Chol. On the
other hand, low content of Chol within lipid bilayers increases their lamellar ordering by
promoting the trans conformation of hydrocarbon chains and reducing the tilt angle. This
effect limits the mobility of the hydrocarbon chains, and hence decreases the
permeability of the lipid membrane [83-85].
A minor component, in terms of concentration (typically 2–5% of the SC lipid mass),
of the SC intercellular lipids is cholesterol sulfate (ChS). Despite its small content within
the SC, it is considered to be a crucial factor in the desquamation process, where ChS is
responsible for the inhibition of desquamatory enzymes. As mentioned before, the
increased concentration of ChS in the SC, caused by the deficiency of sterol sulfatase,
leads to recessive X-linked ichthyosis (a skin disorder with characteristic scaly appearance
of the skin) [86, 87]. Interestingly, ChS improves the dissolution of Chol in lipid mixtures
(phase separated Chol disappears after addition of ChS to the mixtures of Chol, Cer and
FFA) [88].
Free fatty acids (FFA) present in the human SC are predominantly saturated,
straight chained and constitute approximately 10% of the SC lipid mass [13]. The chain
length of the SC FFA ranges from 16 to 30 carbon atoms with C22, C24 and C26 chains as

Chapter 2 Stratum corneum 17
the examples of the most abundant species in the SC [73, 89]. The unsaturated FFA found
in the SC are: oleic acid (C18:1) and linoleic acid (C18:2). The FFA are the only ionizable
molecules, apart from ChS, within the SC, and this might be relevant for the formation of
lipid lamellae [90]. The addition of FFA to the lipid mixtures increases the dissolution of
Chol in the lamellar phases, as well as the fluidity of the lipids at higher temperatures. The
importance of the FFA for the proper SC barrier function was confirmed in the study,
where the recovery of the SC barrier was significantly improved after the addition of
supplementary FFA [91].
2.2.3 The stratum corneum intercellular lipid matrix organization
The organization of the SC intercellular lipid matrix is of special interest, because of
its great importance for the skin barrier function. The freeze fracture electron microscopy
studies revealed that the SC intercellular lipids are organized in lamellar structures [92]. In
other electron microscopy investigations, it was found that the SC intercellular lipids are
arranged in repeat units composed of a broad-narrow-broad sequence of electron lucent
bands with a lamellar periodicity of 130 Å [93]. Furthermore, small angle X-ray diffraction
studies confirmed the presence of this characteristic phase in murine, pig and human SC
[15, 20, 94]. Additionally, these studies revealed the existence of two lamellar phases in
the SC intercellular lipid matrix, one with a periodicity of 130 Å (referred to as the long
periodicity phase, LPP) and the other with a lamellar repeat distance of 60 Å (known as
the short periodicity phase, SPP). The former is suggested to play a significant role in the
SC barrier function. The LPP was also found in mixtures composed of isolated or synthetic
SC lipids [18, 95]. It is thought that one of the requirements for the formation of the LPP is
the presence of the acylceramide, Cer [EOS], in a proper ratio with other Cer, Chol and
long-chain FFA [21]. Nevertheless, the results of recent studies show that the LPP was
formed only when lipid mixtures consisted of synthetic Cer, Chol and FFA, while in the
case of lipid mixtures composed of Cer isolated from the human SC, Chol and FFA, only
the presence of the SPP was confirmed [88, 95, 96]. Therefore, the existence of the LPP in
human SC in vivo is questionable. With the exception of some electron microscopy [7, 93]
and small angle X-ray diffraction studies [15, 20, 94], its presence within human SC was
not confirmed neither in cryo-transmission electron microscopy studies [97] nor in
neutron diffraction studies [98]. Taking these various results into account, it can be
assumed that the presence of the LPP within the SC lipid model membranes should not be

Chapter 2 Stratum corneum 18
regarded as a confirmation of the correct method used for the preparation of the SC lipid
model systems and their biological relevance.
Over the years, various theoretical SC models have been developed in order to
describe the organization of the SC intercellular lipids. The assumptions of the SC lipid
organization on which these models are based, as well as their suitability to explain the
organization and processes occurring in the SC in vivo, are still vigorously discussed [7-12,
18, 21, 23-25, 27, 99-101]. The most relevant models of the SC lipid matrix organization
are the stacked monolayer model, the domain mosaic model, the sandwich model, the
single gel phase model and the most recent armature reinforcement model.
According to the stacked monolayer model (displayed in Fig. 6), alkyl chains of Cer in
the stretched splayed chain conformation interdigitate, and Chol is uniquely distributed in
different layers [7]. Moreover, two adjacent lipid bilayers may form a lipid monolayer by
contributing lipid chains. Interestingly, this process is assumed to be reversible, so in
result, each monolayer can be expanded into a lipid bilayer.
Fig. 6. The stacked monolayer model (according to [7]).
As stated in the domain mosaic model [8], the SC intercellular lipids create a
multilamellar two-phase system with discontinuous lamellar crystalline gel domains
embedded in a continuous liquid crystalline phase (see Fig. 7). The gel domains are
surrounded by “grain borders” composed of lipids in the liquid crystalline state. This
model assumes that the fluid character of these borders enables diffusion of hydrophilic
and lipophilic compounds through the skin barrier.

Chapter 2 Stratum corneum 19
Contrary to the domain mosaic model,
where the crystalline and liquid domains are
situated side by side in one layer, the sandwich
model (Fig. 8) suggests that these domains are
arranged in a trilayer [9]. Such lipid arrangement
is in accordance with the broad-narrow-broad
sequence of the LPP. A centrally situated liquid
layer is formed predominantly by the
unsaturated linoleate moieties of the
acylceramides (Cer [EOS], Cer [EOH], Cer [EOP],
Cer [EOdS]) and Chol. In the two neighboring
layers, the crystallinity rises gradually due to the presence of less mobile saturated
hydrocarbon chains. Because of a discontinuous character of the fluid phase located in
the central unit, the substances permeating through the SC have to pass the crystalline
lamellar region and partly diffuse through the more loosely packed lipid regions [100].
The single gel phase model
(shown in Fig. 9A) differs significantly
from the above described models. It
suggests that a single and coherent
lamellar gel structure, situated in the
SC intercellular space, constitutes the
skin barrier [10]. Moreover, neither
the liquid crystalline and gel phases
nor the crystalline phases with
hydrocarbon chains arranged in
hexagonal and orthorhombic lattice
are separated. The lipid arrangement proposed is also characterized by a low water
content, a low degree of mobility and a dense packing of its constituents, which
altogether results in a low water permeability. In contrast to the domain mosaic and the
sandwich models, where Cer are organized only in the hairpin (two parallel oriented
hydrocarbon chains pointing in the same direction) conformation, in the single gel phase
model both hairpin and fully extended (hydrocarbon chains point away from a central
head group in the opposite directions) conformations are present (Fig. 9B).
Fig. 7. The domain mosaic model (adapted
from [10]).
Fig. 8. The sandwich model (according to [21]).

Chapter 2 Stratum corneum 20
All the theoretical models of
the SC intercellular lipid matrix
organization described above do
not explain the changes in the SC
lipid matrix after hydration with
water excess. The most recent, so-
called armature reinforcement
model [11, 12] explains this
phenomenon. In a partly dehydrat-
ed state, the bilayer leaflets are in
the steric contact (the polar head
groups of Cer from the adjacent
bilayers are close to each other)
created by the fully extended conformation of the short chain Cer [AP], as presented in
Fig. 10. The fully extended conformation of Cer [AP] is of great importance for the
formation of a stable structure of the SC intercellular lipid matrix. It keeps together and
tightens up the adjacent lipid bilayers and that results in the disappearance of the
intermembrane space. Therefore, Cer [AP] can be considered here as an “armature”. An
addition of water excess forces Cer [AP] to change its conformation from the fully
extended to the hairpin conformation (the so-called chain-flip transition [11, 12]).
Simultaneously, the intermembrane space is created between the polar head groups of
Cer.
In conclusion, there are several theoretical models of the SC lipid matrix
organization. However, the models proposed do not elucidate all structural aspects of the
human SC organization. There are still many controversies, regarding this subject, that are
Fig. 9. (A) The single gel phase model (adapted from [10]),
(B) Fully extended (or splayed chain) and hairpin (or one-
sided) conformations of ceramides.
Fig. 10. The armature reinforcement model (modified from [12]); (A) partially hydrated membrane,
(B) fully hydrated membrane after addition of water excess.

Chapter 2 Stratum corneum 21
under discussion. A detailed description of the molecular organization of SC lipids,
particularly of the function that each Cer species has in the formation and maintenance of
the SC barrier, is not yet available. Moreover, a better understanding of the physical
properties of the SC lipids and their interactions is crucial for the elucidation of the
influence of all SC lipid species (especially each Cer species) on the barrier properties of
the SC. In the first studies, native SC lipids isolated from the mammalian skin were used in
order to investigate the SC lipid organization [15-19]. The SC lipids used there were only
characterized in terms of their head group arrangement and the hydrocarbon chain
length distribution. The use of such SC lipid systems limits the possibility to relate the
alterations in the SC lipid composition to the changes in the SC molecular organization.
Therefore, a new approach with well-defined artificial SC lipid systems produced as
oriented multilamellar membranes was introduced [11, 12, 24-28]. The use of such
systems can help to overcome obstacles like the ones listed above. Additionally, the
impact of the individual lipid species, as well as the influence of external parameters such
as temperature, humidity and penetration enhancers, on the SC lipid organization can be
investigated on a previously unattainable level. Such approach allows also for a better
extrapolation of the in vitro obtained results to the in vivo situation, including the
possibility to study the impact of penetration enhancer molecules on the SC lipid
organization on a molecular level, as well as to relate the changes in the SC intercellular
lipid organization to a modification in its barrier function.

22
3 Drug delivery into the skin
3.1 Enhancement of drug penetration into the skin
The highly effective barrier properties of the SC limit the transdermal delivery of
drugs. A way to overcome this limitation is the modulation of the drug penetration within
the SC. There are a number of mechanisms of the temporary impairment of the SC barrier
function. One approach to increase the drug penetration into the skin is the use of
physical SC penetration enhancement techniques (i.a. phonophoresis, iontophoresis). The
phonophoresis (also referred to as the sonophoresis) uses the ultrasound energy in order
to enhance the penetration of drugs [102]. In the case of the iontophoresis, a small
electric current is applied to the skin, what results in the facilitation of the drug
penetration via electrophoresis, electroosmosis or enhanced diffusion [103]. Additionally
to physical methods, a chemical penetration enhancement is of great importance for the
modulation of the penetration of drugs after a topical application.
To the group of widely investigated chemical substances promoting the drug
penetration into the skin (also known as penetration enhancers) belong water, alcohols
(e.g. ethanol), glycols (e.g. propylene glycol), sulfoxides (e.g. dimethylsulfoxide), azone
and its derivatives, urea and its derivatives, terpenes and terpenoids (e.g. d-limonene),
pyrrolidones (e.g. N-methyl-2-pyrrolidone), cyclodextrins, surfactants (e.g. sodium
dodecyl sulfate), fatty acids (e.g. oleic acid) and others (reviewed in [104, 105]). The
mechanisms of the action of penetration enhancers are very complex and not yet fully
understood. It is suggested that there are two distinct penetration pathways within the
SC intercellular lipid matrix, namely hydrophilic one and lipophilic one [105]. The
enhancers can influence either the arrangement of polar head groups of the SC lipids (i.e.
the hydrophilic pathway) facilitating the penetration of hydrophilic drugs, or the
molecular organization of their hydrocarbon chains (i.e. the lipophilic pathway), which
results in the enhancement of the penetration of lipophilic drugs. However, the
enhancers that affect the hydrophilic pathway, can also influence the ordering of the
hydrophobic tails of the SC lipids and vice versa. It explains the improvement of the
penetration of either lipophilic or hydrophilic drugs when using the enhancers for the
hydrophilic and the lipophilic pathway, respectively [104-108]. Possible modes of the
action of penetration enhancers are presented in Fig. 11.

Chapter 3 Drug delivery into the skin 23
3.2 In vitro diffusion and permeation studies
In order to acquire information about the barrier properties of the skin, in vitro
diffusion and permeation studies of model drugs are carried out. The in vitro studies are
often used to predict the drug transport through the skin in vivo. Although the use of
native skin samples in such studies offers evident advantages, artificial SC lipid systems
have been recently preferred, as the SC intercellular lipid matrix is thought to be the main
penetration route for topically applied substances. Besides overcoming problems like the
limited availability and the high inter- and intra-variability of native skin samples [13], the
use of well-defined SC lipid model membranes allows to investigate the impact of each
individual lipid species on the SC lipid organization, and thereby on its barrier function.
Drug transport into the skin is a complex process. Depending on the lipophilicity of a
drug, it can either diffuse (hydrophilic substances) or permeate (lipophilic ones) through
the SC. In the case of the permeation, after the liberation of the drug from the vehicle, it
needs to partition into the SC lipid bilayers before it can diffuse through it. The same
situation applies in the case of the SC lipid model membranes. Finally, the drug has to
partition from the lipophilic SC into the more hydrophilic viable epidermis and the dermis,
where it is absorbed to the systemic circulation. The process of drug diffusion through the
SC can be described by the Fick’s second law of diffusion [110]:
Fig. 11. Mechanisms of action of penetration enhancers on the SC intercellular lipid
matrix (modified from [109]).

Chapter 3 Drug delivery into the skin 24
(1)
where u is the drug concentration, x is the space coordinate, D is the diffusion coefficient
and L stands for the diffusional pathlength (taken as thickness of the SC, for simplicity
reasons, or the thickness of the SC lipid model membrane). By fitting appropriate initial
and boundary conditions to Eq. (1) and using the Laplace transformation or the numerical
analysis, one can obtain an estimate for the diffusion coefficient (D). The exact
description of the mathematical model used to estimate the D value is presented in the
relevant sections in Chapters 5–7. D, as well as other permeability parameters like the
steady-state flux (J), the lag-time (TL) and the permeability coefficient (kp), are used to
describe and compare the diffusion behavior of different drugs. The lag-time occurs at the
beginning of the process of diffusion, when the gradient of the drug concentration across
the SC is established. It is followed by the steady-state phase, in which the flux of the drug
is constant, as long as the permeability of the SC and the drug concentration in the donor
compartment (infinite dose) do not change. In order to calculate J and TL values, the
cumulative amount of the permeated drug needs to be plotted as a function of time. The
slope of the linear part of the plot is taken as the steady-state flux (J) and its intercept
with the time-axis is the lag-time (TL). The permeability coefficient (kp) is calculated as a
quotient of the flux and the initial drug concentration in the donor compartment [111-
113]. There are different types of diffusion cells used in in vitro diffusion and permeation
studies. The most popular ones are the static Franz-type diffusion cell and the flow-
through (also referred to as in-line) diffusion cell [114]. They consist of a donor
compartment and an acceptor compartment that are clamped together. A membrane
(e.g. the SC sample or the SC lipid model membrane) is placed between them. The main
difference between the static and the in-line diffusion cell is the continuous replacement
of the acceptor phase when using the latter, whereas in the case of the static cell, the
accumulation of the drug in the acceptor phase can influence its flux (by decreasing the
gradient of the drug concentration). However, this effect is reduced to minimum by use of
relatively large, in terms of volume, acceptor compartments. Therefore, the drug
concentration reached in the acceptor phase is relatively low, when compared to its
concentration in the donor phase. In result, it has either no or very small impact on the
flux. A diagram of the static Franz-type diffusion cell that was used in the diffusion and
permeation studies of model drugs is displayed in Fig. 12.

Chapter 3 Drug delivery into the skin 25
Fig. 12. A schematic representation of a static Franz-type diffusion cell.
An interesting approach in the diffusion and permeation studies is the use of the
ATR-FTIR diffusion cell that has been recently introduced [115, 116]. This cell combines
the advantages of the Franz-type diffusion cell and the ATR-FTIR technique. The buildup
and other characteristics of the ATR-FTIR diffusion cell are described in more detail in
section 4.2.1.

26
4 Basic principles of experimental techniques applied
4.1 X-ray diffraction
X-ray diffraction belongs to the scattering techniques. It is one of the most powerful
tools for studying the SC lipid organization. Diffraction occurs when a wave of
electromagnetic radiation is deflected after encountering an obstacle on its way. The
effect of diffraction is most pronounced when the size of the diffracting objects is of the
same order of magnitude as the wavelength of the radiation (0.01–10 nm for X-rays). In
the case of the X-ray diffraction, the electromagnetic radiation is scattered by the
electron clouds of atoms. The diffraction of electromagnetic waves from three
dimensional periodic structures (e.g. atoms in a crystal, lipid lamellar phases) is known as
the Bragg diffraction. The condition for the constructive interference of the
electromagnetic radiation reflected from successive planes of a crystalline sample is given
by the Bragg’s law [9]:
(2)
where λ is the wavelength of the radiation, θ is the angle of incidence, n is an integer (i.e.
the order of the diffraction peak) and d is the repeat distance (i.e. distance between two
parallel, successive planes). The interference is possible only when the waves coincide.
The assumptions of the Bragg’s law are shown in Fig. 13.
In the case of the X-ray
diffraction, the electromagnetic
radiation produced by a source
(also referred to as the primary
beam) is directed onto a sample.
While passing through the
sample, a small part of the
primary beam is scattered and these scattered X-rays are sent to the detector. The
intensity of the scattered X-rays is measured as a function of the scattering angle, θ.
However, it is more frequently plotted as a function of the scattering vector, q, which is
given by: ⁄ . In the case of samples consisting of lipids organized in a
repeating structure (like in the SC lipid model membranes), the scattered intensity is
characterized by a series of peaks (i.e. intensity maxima of scattered X-rays). When the
scattered intensity is measured at a small angle (typically 0–5°), the technique is referred
Fig. 13. Explanation of Bragg’s law (adapted from [117]).

Chapter 4 Experimental techniques 27
to as small angle X-ray diffraction (SAXD).
In the case of wide angle X-ray diffraction
(WAXD), it is measured at a larger angle
(Fig. 14) and this technique provides
information about smaller structural units
(e.g. lateral packing of lipids forming a
lamellar phase). Contrary to WAXD, SAXD
gives insight to larger structural units such
as the repeat distance (also known as the
periodicity) of a lamellar phase [118].
4.1.1 Small angle X-ray diffraction (SAXD)
As stated above, the intensity of the scattered X-rays in the case of organized
periodic structures (e.g. a lamellar phase) is characterized by a series of maxima. These
diffraction peaks are referred to as the 1st order located at q1, 2nd order located at q2, 3rd
order located at q3, etc. As the distance between sequential peaks is the same, the
relation between peak positions is
given by: , , etc.
(see Fig. 15). Using the positions of
the diffraction peaks, the repeat
distance (d) of a lamellar phase can
be calculated by: ⁄
⁄ ⁄ , etc. Interestingly,
when the distance between the
sequential peaks is smaller, the
lamellar repeat distance is larger
and vice versa. Furthermore, if the
sample contains two lamellar phases
(e.g. LPP and SPP), the X-ray
diffraction peaks of these phases are
additive, which often results in a
formation of a broader peak [118].
Fig. 15. Small angle X-ray diffraction technique (adapted
from [118]). The diffraction patterns of two lamellar phases
(LP and SP) are presented separately and together on one
diffractogram.
Fig. 14. Diagram presenting the principles of the X-
ray diffraction technique (adapted from [118]).

Chapter 4 Experimental techniques 28
4.2 Vibrational spectroscopy
Infrared (IR) and Raman spectroscopies are referred to as the vibrational
spectroscopy, because of the nature of their action. Both techniques provide information
about vibrations of atoms of a molecule. In the IR spectroscopy, a beam of IR radiation is
directed onto a sample and the amount of incident radiation absorbed at a particular
frequency is analyzed. Contrary to the IR spectroscopy (absorption of the electromagnetic
radiation by the molecule), Raman spectroscopy is based on the Raman effect which is
inelastic scattering of monochromatic light (typically in the visible, near-IR or near-UV
range) by the molecule [119]. The energy of this electromagnetic radiation causes
excitation of the molecule to the virtual energy state. After emitting a photon, the
molecule returns to a different energy state. However, the majority of scattered photons
has the same energy as incident ones (Rayleigh scattering). Only a small part of scattered
photons has a different, usually lower (Stokes Raman scattering), energy than incident
photons [120]. The difference in the energy between the incident and the Raman
scattered photon is equal to the energy required for an excitation of a vibrational mode
of the molecule. From the position and intensity of vibrational bands characteristic for
each bond in the molecule, conformations of atoms and their surroundings, the
information about the molecular structure of the sample can be revealed. In the case of
the IR spectroscopy, the mid-infrared (MIR, 4000–400 cm-1) region is of most interest,
because it corresponds to changes in vibrational energies within atoms of the majority of
compounds. IR and Raman spectroscopies are complementary to each other. A
vibrational mode of the molecule is IR-active, when it is associated with the change in
dipole moment of the molecule. On the other hand, an alteration in the polarizability of
the molecule is required for a vibrational mode to be Raman-active [119]. Therefore, IR
spectroscopy is generally used to describe polar groups of molecules (strong dipole
character), while Raman spectroscopy can be used to characterize the non-polar parts of
molecules. In general, two types of vibrational modes of the molecule can be
distinguished, namely stretching (v) and deformation (δ) modes. The former occurs when
atoms move in the direction of their bond, to and from each other, and can be subdivided
to symmetric (vsym) and antisymmetric (vasym) stretching. In the case of the latter, the
angle between two bonds changes. The examples of deformation modes are: scissoring,
rocking, wagging and twisting. Using IR spectroscopy, one can investigate the amount of
urea (polar compound) in the acceptor phase of the ATR-FTIR diffusion cell (described in

Chapter 4 Experimental techniques 29
the next section) based on the characteristic vibrational band v(CN) at 1466 cm-1. Raman
spectroscopy, as mentioned above, is preferably used to analyze the non-polar parts of
molecules. Therefore, it can be used to investigate molecules with long hydrocarbon
chains like SC lipids [121]. In confocal Raman imaging (described in section 4.2.2) studies
on the distribution of SC lipids within SC lipid model membranes, characteristic
vibrational modes of SC lipids occurring at a specific wavelength were chosen. The region
between 600–1300 cm-1 contains the alicyclic v(CC) vibrations and the δ(CH2) and
δ(CH3)asym vibrations are located in the range 1400–1470 cm-1. The v(C=C) mode can be
detected between 1500–1900 cm-1 and the v(CC) vibration at about 900 cm-1.
4.2.1 ATR-FTIR diffusion cell
ATR-FTIR diffusion cell is a recently introduced real-time measuring device for the
investigation of the transport process of model drugs and other substances of interest
across membranes [115, 116]. Its schematic buildup is shown in Fig. 16. The ATR-FTIR
diffusion cell combines the advantages of the Franz-type diffusion cell and the ATR-FTIR
spectroscopy. It is a non-destructive procedure and requires only very little sample
preparation. As in Franz-type diffusion cell, the ATR-FTIR cell consists of two chambers
separated by a membrane, namely donor and acceptor compartment. The acceptor phase
is in direct contact with the ATR crystal, which is a prerequisite for conducting ATR-FTIR
experiments. ATR-FTIR spectroscopy is a widely used analytical technique (e.g. in the field
of chemistry, medicine and pharmacy). Attenuated total reflectance (ATR) is a technique
used in conjunction with Fourier transform IR (FTIR) spectroscopy.
Nowadays, FTIR spectrometers are frequently used instead of dispersive IR
spectrometers. The main advantage of the FTIR over dispersive IR spectrometers is the
use of a system called an
interferometer (e.g. two-beam
Michelson interferometer), in-
stead of a monochromator. It
allows collecting the information
about the sample at all
wavelengths simultaneously,
whereas the light at only one
wavelength at a time passes
Fig. 14. ATR-FTIR diffusion cell (adapted from [115]).

Chapter 4 Experimental techniques 30
through the sample when using the monochromator. The signal registered by the
detector, an interferogram (representing the radiation intensity as a function of the
position of the interferometer’s movable mirror), is subsequently converted to a
spectrum by using a Fourier transform algorithm. By comparison of the sample spectrum
and the reference spectrum, the IR transmission spectrum of the sample is acquired. It
can be subsequently converted to the absorbance spectrum by taking the negative
common logarithms of the transmission data points [119].
In ATR technique, the IR beam is directed at a certain angle towards an optically
dense crystal with a high refractive index (e.g. ZnSe with n1 = 2.4). A sample with lower
optical density n2 (n2 < n1) is placed on the surface of the ATR crystal. At the sample–ATR
crystal interface, the IR radiation undergoes total internal reflection. Nevertheless, the
evanescent wave, which in fact penetrates beyond the surface of the crystal into the
sample, is created at the same time (shown in Fig. 17). This is a fundamental principle of
the ATR technique. While penetrating through the sample, the radiation is partly
absorbed in some regions of the IR spectrum, which results in the attenuation of the
evanescent wave in these regions.
Fig. 15. Principle of the attenuated total reflectance (adapted from [119]).
The penetration depth of the evanescent wave (dp) depends on the wavelength of
IR radiation (λ), its angle of incidence (θ), the refractive indices of the ATR crystal (n1) and
the sample (n2), and is given by:
√ ( ⁄ ) (3)
Of major importance is the angle of incidence, because the internal total reflection
occurs only when θ exceeds the value of a critical angle given by: ( ⁄ ).
The dp amounts typically to 0.5–5 μm, so the sample must be in direct contact with the
ATR crystal. Moreover, the difference in the values of the refractive indices of the ATR
crystal and the sample has to be significant. The n1 value must be larger than n2 value.

Chapter 4 Experimental techniques 31
Otherwise, the internal reflection will not occur and the radiation will be rather
transmitted through the crystal, than internally reflected.
4.2.2 Confocal Raman imaging
Confocal Raman imaging technique represents a combination of the Raman
spectroscopy and the confocal microscopy. It is a powerful tool for a noninvasive chemical
imaging of biomaterials. A special feature of Raman imaging is that it provides the
information not only about the molecular structure of chemical moieties of a sample, but
also about their spatial arrangement. Generally, two types of imaging techniques can be
distinguished, namely direct (or parallel) imaging and series imaging (also referred to as
mapping) [122-125]. The former consists in a global illumination of a sample. A complete
two-dimensional (2D) image at a chosen wavelength, characteristic of the vibrational
mode of a molecule, is produced immediately. The main advantage of the direct imaging
technique is relatively short acquisition time, when compared to the series imaging
method, which results from the reduction of the signal collection time with respect to
point illumination (the whole area of the sample is subjected to the laser beam at one
time). On the other hand, only a part of spectral information can be acquired at a given
time. Moreover, the direct imaging technique is characterized by strong background
signals (fluorescence, stray light, etc.) and no possibility to benefit from the confocal
arrangement (the resolution is strongly influenced by out-of-focus light). The series
imaging technique is based on the image reconstruction. Individual images are recorded
point-by-point and line-by-line by scanning the sample with a finely focused laser beam.
Most frequently, it is achieved by the use of a motorized x-y stage. As the sample is
moved from point to point, a full spectrum is recorded. Subsequently, an image,
corresponding to each spatial location, is reconstructed by selecting vibrational bands of
compounds of interest. Because of its nature (collection of a complete set of
spatial/spectral data), the series imaging technique is very time-consuming and should be
applied only to the visualization of a small region of a sample. On the other hand, this
method benefits from the concept of the confocal arrangement. Here, the radiation is
focused on the sample and the reflected or scattered light is typically collected by the
same objective and finally directed through the pinhole to the detector. However, the
signal of interest is devoid of blurred signals from out-of-focus planes, because the
pinhole ensures that only light originating from the focal plane reaches the detector.
Using the confocal microscopy, a significant improvement in the spatial resolution can be

Chapter 4 Experimental techniques 32
achieved. Instead of the illumination of the whole area of the sample simultaneously, a
laser beam is directed onto a very small area of the sample. In result, the intensity of the
light scattered by this small fraction of the sample is measured at any one time by the
confocal system. Another advantage of the confocal microscopy is that a sample can be
analyzed along the optical axis (by means of a motorized z-focus stage), so in result depth
profiles or three-dimensional (3D) images can be also generated [125, 126].
4.3 Environmental scanning electron microscopy
In electron microscopy, a beam of electrons is used to illuminate a sample and
produce its image. Contrary to light microscopes, electron microscopes are capable of
magnifications of up to millions of times. The wavelengths of electrons are approx. five
orders of magnitude shorter than the wavelengths of light used in the optical microscopy.
Hence, much better resolution (down to the picometer range) can be achieved using the
electron microscopy [127]. There can be distinguished two main distinct techniques in the
electron microscopy, namely transmission electron microscopy (TEM) and scanning
electron microscopy (SEM). In TEM, a high voltage electron beam is transmitted through a
very thin sample. While passing through it, the electrons interact with the specimen and
these interactions are the basis for the formation of the sample image (the transmitted
electrons carry the information about the structure of the specimen). In SEM, on the
other hand, images are produced by probing the sample with a focused beam of electrons
(with energies typically up to 40 keV) that is scanned across an area of the sample. After
the electron–specimen interaction that causes the energy loss of the incident electrons,
various signals mainly in form of low-energy secondary electrons, high-energy
backscattered electrons, visible light (cathodoluminescence) or X-rays are generated. The
signals emerging from the specimen at a specific position are collected by detectors
located above the sample. The SEM image is created based on the intensity of these
signals that varies from one position to another as the electron–specimen interactions
change due to the alterations in the structure of the sample surface [128]. Although SEM
is characterized by lower image resolution (when compared to TEM), its ability to yield 3D
information from the surface of bulk specimens, over a considerable range of length-
scales, makes it an appealing technique for viewing samples especially in materials
sciences [127, 129].

Chapter 4 Experimental techniques 33
Unlike the conventional SEM, which operates in a high vacuum, the environmental
scanning electron microscopy (ESEM) technique allows the examination of any specimen
in the presence of a gas in the specimen chamber. This eliminates the need for a
troublesome sample preparation like e.g. critical point drying or freeze drying, in the case
of hydrated specimens that need to be dehydrated in order to be viewed in the high
vacuum SEM, as well as coating of non-conductive specimens to avoid charging during the
SEM imaging process [130]. To enable observations of specimens under gaseous
conditions, changes to conventional SEM microscopes had to be introduced. Namely, two
characteristic features of ESEM instruments are the use of a differential pumping, which
allows the separation of the gaseous specimen chamber from the electron optics column
sustained under the high vacuum, and new detection systems (e.g. gaseous secondary
electron detector or GSED). The low-energy secondary electrons emitted by the specimen
are selectively accelerated in the small electric field between the sample and the
detector. Ionizing collisions between these electrons and gas molecules generate
additional electrons causing so-called cascade of electrons, which leads to the
amplification of the signal before it is collected by the GSED. The positively charged gas
ions, resulting from the collisions of secondary electrons with gas molecules, play an
essential role in the ESEM. They can balance the accumulation of negative charges on the
surface of examined specimens, thus enable imaging of insulators without the need for
the use of the conductive coating, which is required in the case of the conventional SEM
[127, 129, 130]. Water vapor is one of the most commonly used gases in the specimen
chamber as it provides strong signal amplification, as well as it permits the hydrated
samples to be observed in their natural state [130, 131], which is of major importance
when imaging biological samples (e.g. SC membranes).
4.4 Analytical separation techniques
4.4.1 High performance thin layer chromatography
High performance thin layer chromatography (HPTLC) belongs to commonly used
chromatographic separation techniques. It is a robust, simple, rapid and efficient
analytical method for the separation, identification and quantification of chemical
compounds [132-135]. HPTLC is an enhanced version of thin layer chromatography (TLC).
The separation of a mixture of compounds is based on the migration of individual

Chapter 4 Experimental techniques 34
components at different rates, resulting from their different distributions between a
stationary phase (typically glass plates coated with silica gel) and a mobile phase (its
movement up the plate is determined by the capillary action). A number of
enhancements have been introduced to TLC technique in order to improve the sensitivity
of the method and the resolution of separated compounds, as well as to allow their
quantitative analysis. The procedures used in HPTLC are, on the one hand, very similar to
those used in TLC. However, HPTLC is characterized by the use of better quality materials
(HPTLC plates with finer particle sizes and narrower size distribution) and more
sophisticated methods of a sample introduction, chromatographic separation and
detection of substances, when compared to TLC [135]. The steps of the sample
application, the plate development and the quantitative analysis have been automated.
Samples are applied on the HPTLC plate by means of an automated instrument (e.g. ATS 4
from Camag), which provides the optimum resolution and the reliable quantification.
Moreover, the plates can be developed repeatedly using solvents of different elution
strength in each run, which leads to the better separation of components with improved
resolution. Finally, the quantitative analysis of separated compounds can be performed in
situ by means of a scanning densitometry (photometric measurement of absorbed light or
emitted fluorescence), which provides reliable and reproducible results. In contrast to
column chromatography (e.g. HPLC), in HPTLC many substances can be applied and run
simultaneously (up to 70 on one HPTLC plate [133]), which makes it a very rapid and
efficient method. Furthermore, the detection in HPTLC is separated from the
chromatographic step (so-called static detection), contrary to HPLC where the detection
time of separated compounds, passing through the detection device, is limited by the rate
at which they are eluted from the column (so-called dynamic detection). It is one of the
most important features of HPTLC, because it allows to use various post-chromatographic
techniques intended to enhance the sensitivity of detection (e.g. derivatization
performed prior to UV or fluorescence detection; wavelength selection), and hence to
obtain the optimal response for each examined compound [132]. The procedures of
separation and quantification of SC lipids by means of HPTLC were previously reported
[136, 137].
4.4.2 High performance liquid chromatography
High performance liquid chromatography (HPLC) is the most popular analytical
separation method of a mixture of compounds. HPLC is a form of a liquid

Chapter 4 Experimental techniques 35
chromatography technique in which a liquid mobile phase is mechanically pumped into
and passed through the column containing a densely packed stationary phase [138]. An
HPLC instrument consists of an injector (which injects a sample into the column), a pump
(which provides the high pressure required to move the mobile phase and sample
components through the column), a column (which contains different types of stationary
phases) and a detector (typically UV detector). Based on the retention mechanisms of
analytes on the column, five major liquid chromatographic methods can be distinguished,
namely partition chromatography, adsorption chromatography, ion exchange
chromatography, affinity chromatography and size exclusion chromatography [138, 139].
The most frequently used chromatographic mode is the reversed-phase HPLC (also
known as RP-HPLC). As the name suggests, RP-HPLC is the reverse of normal-phase HPLC
(or NP-HPLC), which involves the use of a polar stationary phase (e.g. silica) and a non-
polar mobile phase. In RP-HPLC, a non-polar stationary phase (typically chemically
bonded, e.g. silanol groups of silica bonded with a functional group R(CH3)2SiCl, where
most commonly R is a straight alkyl chain group such as –C18H37 or –C8H17) and a polar
mobile phase are used. As a consequence, more polar compounds are characterized by
shorter retention times, while elution of less polar molecules is a slower process. The
retention times of examined compounds can be easily modified (increased or decreased)
by changing the polarity of the mobile phase. In the case of a hydrophobic substance, the
use of the less polar mobile phase results in the decrease of its retention time. The
retention mechanism of molecules on chemically bonded, non-polar stationary phases is
based on two main effects, so-called solvophobic and partitioning effects [138]. In the
solvophobic effect, the retention is mainly related to the hydrophobic effects between the
analytes and the mobile phase. The analyte binds to the surface of the stationary phase,
which results in the decreased surface area of the analyte exposed to the mobile phase.
The adsorption of the analyte on the stationary phase increases with the increasing
surface tension of the mobile phase. Hence, by reducing the surface tension of the mobile
phase in result of the addition of a less polar solvent to the mobile phase (as in the
gradient elution procedure), the retention of the analyte can be decreased (faster elution
from the column). While using the gradient elution procedure, the composition of the
mobile phase is changed during the separation process, contrary to the isocratic flow
procedure, where the composition of the mobile phase remains constant throughout the
experiment. The partitioning effect, on the other hand, assumes that the molecules of the
analyte are fully embedded in the stationary phase chains, hence are partitioned between
the mobile phase and the stationary phase. The retention mechanism in RP-HPLC is most

Chapter 4 Experimental techniques 36
likely the combination of both effects described, with the dominance of the adsorption
effect when using the stationary phase with shorter chain lengths and the partitioning
effect in the case of the stationary phase with longer chain lengths.
4.4.3 Capillary electrophoresis
Capillary electrophoresis (CE) is an analytical technique based on the separation of
charged components of a mixture under the influence of an electric field in the interior of
a capillary filled with an electrolyte [138, 140]. The basic set-up of CE instrumentation is
relatively simple (see Fig. 18). It consists of an injection system, a small-diameter capillary
(20–100 µm ID), inlet and outlet vials, a high voltage power supply (up to 30 kV and 200–
250 µA), electrodes and a detector [141, 142].
Fig. 16. Schematic presentation of CE system (adapted from [142]).
A sample can be injected into the capillary (most frequently used are fused silica
capillaries) by using either hydrodynamic or electrokinetic technique (application of
pressure or potential, respectively, while the injection end of the capillary is located in the
sample vial). There are several modes of operation in CE that are based on the different
separation mechanisms, all of which can be carried out using the same CE
instrumentation (by simply changing the electrolyte and/or the capillary). Besides the
most simple and widely used mode in CE, namely capillary zone electrophoresis (CZE),
other modes of CE such as micellar electrokinetic chromatography (MEKC or MECC),
capillary gel electrophoresis (CGE), capillary electrokinetic chromatography (CEC),
capillary isotachophoresis (cITP), capillary isoelectric focusing (cIEF) and chiral capillary
electrophoresis (chiral CE) are also applied in order to separate investigated compounds
[138, 140-142]. In CZE, the separation mechanism is based on mobility differences of

Chapter 4 Experimental techniques 37
compounds in the electric field that depend on the size and charge-to-mass ratio of
analyzed ions. The migration of analytes under the influence of the electric field is
characterized by their electrophoretic mobility. The other important factor influencing
the movement of the compounds in the capillary is the electroosmotic flow (EOF), which
together with the electrophoretic mobility gives the apparent mobility of the analytes. In
the case of a fused silica capillary, the acidic silanol groups attached to the interior wall of
the capillary dissociate to the silanoate groups at pH values higher than 2. The negatively
charged wall of the capillary attracts the positively charged ions, which results in the
formation of a double layer of cations inside the capillary (so-called compact and diffuse
layer [138]). When the electric field is applied, the cations from the diffuse layer move
towards the negatively charged cathode, pulling the bulk solution of the electrolyte along
and thus creating the flat flow EOF [138, 140-143]. Typically, the EOF is directed toward
the negatively charged cathode, accordingly to the electrolyte flow within the capillary
from the inlet to the outlet vial. Since the EOF is generally larger than the electrophoretic
flow of the analytes (under the electric field applied, anions are attracted to the positively
charged anode, counter to the EOF), all analytes (cations, anions and neutral compounds)
migrate with the electrolyte toward the cathode, and hence can be detected [142]. Small
multiply charged cations migrate very fast to the detector, unlike small multiply charged
anions which are carried along very slowly. The identification and/or quantitation of
separated analytes takes place mostly at the end of the capillary by means of various
detectors (so-called on-capillary detection [140]). Most frequently applied detection
techniques in CE are UV absorbance (single- and multi-wavelength, e.g. photodiode array
detector, PDA), fluorescence (e.g. laser-induced fluorescence, LIF), electrochemical
detection (amperometry, conductivity) and mass spectrometric (MS) detection (off-
capillary detection by online coupling of CE with MS). The conductivity detection
technique is based on the measurement of the solution conductivity by placing a pair of
electrodes in the capillary and measuring the current passing between the electrodes as a
function of potential. When the analyte passes between the electrodes, the change in the
current in the sensing circuit will be observed [138, 140-143].

38
References
[1] L. Moore, Y.W. Chien, Transdermal drug delivery: a review of pharmaceutics, pharmacokinetics, and
pharmacodynamics, Crit. Rev. Ther. Drug Carrier Syst. 4 (1988) 285-349.
[2] N. Pimpinelli, M. Santucci, The skin-associated lymphoid tissue-related B-cell lymphomas, Semin. Cutan. Med.
Surg. 19 (2000) 124-129.
[3] C.M. Chuong, B.J. Nickoloff, P.M. Elias, L.A. Goldsmith, E. Macher, P.A. Maderson, J.P. Sundberg, H. Tagami, P.M.
Plonka, K. Thestrup-Pederson, B.A. Bernard, J.M. Schroder, P. Dotto, C.M. Chang, M.L. Williams, K.R. Feingold,
L.E. King, A.M. Kligman, J.L. Rees, E. Christophers, What is the 'true' function of skin?, Exp. Dermatol. 11 (2002)
159-187.
[4] G.L. Flynn, Topical Drug Absorption and Topical Pharmaceutical Systems, in: G.S. Banker, C.T. Rhodes (Eds.)
Modern Pharmaceutics, Marcel Dekker Inc., New York, 1990, pp. 263-325.
[5] T. Winsor, G.E. Burch, Differential roles of layers of human epigastric skin on diffusion rate of water, Arch.
Intern. Med. 74 (1944) 428-436.
[6] P.M. Elias, D.S. Friend, The permeability barrier in mammalian epidermis, J. Cell Biol. 65 (1975) 180-191.
[7] D.C. Swartzendruber, P.W. Wertz, D.J. Kitko, K.C. Madison, D.T. Downing, Molecular-Models of the Intercellular
Lipid Lamellae in Mammalian Stratum-Corneum, J. Invest. Dermatol. 92 (1989) 251-257.
[8] B. Forslind, A domain mosaic model of the skin barrier, Acta Derm. Venereol. 74 (1994) 1-6.
[9] J.A. Bouwstra, F.E. Dubbelaar, G.S. Gooris, M. Ponec, The lipid organisation in the skin barrier, Acta Derm.
Venereol. Suppl. 208 (2000) 23-30.
[10] L. Norlen, Skin barrier structure and function: the single gel phase model, J. Invest. Dermatol. 117 (2001) 830-
836.
[11] M.A. Kiselev, N.Y. Ryabova, A.M. Balagurov, S. Dante, T. Hauss, J. Zbytovska, S. Wartewig, R.H.H. Neubert, New
insights into the structure and hydration of a stratum corneum lipid model membrane by neutron diffraction,
Eur. Biophys. J. 34 (2005) 1030-1040.
[12] M.A. Kiselev, Conformation of ceramide 6 molecules and chain-flip transitions in the lipid matrix of the
outermost layer of mammalian skin, the stratum corneum, Crystallogr. Rep. 52 (2007) 525-528.
[13] P.W. Wertz, B. van den Bergh, The physical, chemical and functional properties of lipids in the skin and other
biological barriers, Chem. Phys. Lipids. 91 (1998) 85-96.
[14] B.W. Barry, Novel mechanisms and devices to enable successful transdermal drug delivery, Eur. J. Pharm. Sci. 14
(2001) 101-114.
[15] S.H. White, D. Mirejovsky, G.I. King, Structure of lamellar lipid domains and corneocyte envelopes of murine
stratum corneum. An X-ray diffraction study, Biochemistry 27 (1988) 3725-3732.
[16] B. Ongpipattanakul, M.L. Francoeur, R.O. Potts, Polymorphism in stratum corneum lipids, Biochim. Biophys.
Acta, Biomembranes 1190 (1994) 115-122.
[17] T.J. McIntosh, M.E. Stewart, D.T. Downing, X-ray diffraction analysis of isolated skin lipids: reconstitution of
intercellular lipid domains, Biochemistry 35 (1996) 3649-3653.
[18] J.A. Bouwstra, G.S. Gooris, K. Cheng, A. Weerheim, W. Bras, M. Ponec, Phase behavior of isolated skin lipids, J.
Lipid Res. 37 (1996) 999-1011.
[19] T.J. McIntosh, Organization of skin stratum corneum extracellular lamellae: diffraction evidence for asymmetric
distribution of cholesterol, Biophys. J. 85 (2003) 1675-1681.
[20] J.A. Bouwstra, G.S. Gooris, J.A. van der Spek, W. Bras, Structural investigations of human stratum corneum by
small-angle X-ray scattering, J. Invest. Dermatol. 97 (1991) 1005-1012.
[21] J.A. Bouwstra, G.S. Gooris, F.E. Dubbelaar, A.M. Weerheim, A.P. Ijzerman, M. Ponec, Role of ceramide 1 in the
molecular organization of the stratum corneum lipids, J. Lipid Res. 39 (1998) 186-196.

References 39
[22] S.E. Friberg, D.W. Osborne, Interaction of a Model Epidermal Lipid with a Vegetable Oil Adduct, J. Disper. Sci.
Technol. 8 (1987) 249-258.
[23] D. Kuempel, D.C. Swartzendruber, C.A. Squier, P.W. Wertz, In vitro reconstitution of stratum corneum lipid
lamellae, Biochim. Biophys. Acta 1372 (1998) 135-140.
[24] A. Schroeter, D. Kessner, M.A. Kiselev, T. Hauss, S. Dante, R.H.H. Neubert, Basic nanostructure of stratum
corneum lipid matrices based on ceramides [EOS] and [AP]: a neutron diffraction study, Biophys. J. 97 (2009)
1104-1114.
[25] A. Schroeter, M.A. Kiselev, T. Hauss, S. Dante, R.H.H. Neubert, Evidence of free fatty acid interdigitation in
stratum corneum model membranes based on ceramide [AP] by deuterium labelling, Biochim. Biophys. Acta,
Biomembranes 1788 (2009) 2194-2203.
[26] D. Kessner, M.A. Kiselev, S. Dante, T. Hauss, P. Lersch, S. Wartewig, R.H.H. Neubert, Arrangement of ceramide
[EOS] in a stratum corneum lipid model matrix: new aspects revealed by neutron diffraction studies, Eur.
Biophys. J. 37 (2008) 989-999.
[27] T. Engelbrecht, T. Hauss, K. Sueβ, A. Vogel, M. Roark, S.E. Feller, R.H.H. Neubert, B. Dobner, Characterisation of a
new ceramide EOS species: synthesis and investigation of the thermotropic phase behaviour and influence on
the bilayer architecture of stratum corneum lipid model membranes, Soft Matter 7 (2011) 8998-9011.
[28] S. Raudenkolb, S. Wartewig, R.H.H. Neubert, Polymorphism of ceramide 6: A vibrational spectroscopic and X-ray
powder diffraction investigation of the diastereomers of N-(alpha-hydroxyoctadecanoyl)-phytosphingosine,
Chem. Phys. Lipids 133 (2005) 89-102.
[29] R.H.H. Neubert, W. Wohlrab, W. Marsch, Dermatopharmazie. Vehikel, Wirkstoffe, Pharmakologie,
Wissenschaftliche Verlagsgesellschaft mbH, Stuttgart, 2001.
[30] G.K. Menon, New insights into skin structure: scratching the surface, Adv. Drug Deliver. Rev. 54 Suppl. 1 (2002)
S3-S17.
[31] Encarta. Vol. 2009, Microsoft Inc. 2009.
[32] A.C. Williams, Structure and function of human skin, in: Transdermal and Topical Drug Delivery: From Theory to
Clinical Practise, Pharmaceutical Press, London, 2003, pp. 1-25.
[33] R.T. Woodburne, Essentials of Human Anatomy, Oxford University Press, New York, 1965, pp. 6.
[34] G.L. Wilkes, I.A. Brown, R.H. Wildnauer, The biomechanical properties of skin, CRC Crit. Rev. Bioeng. (1973) 453-
495.
[35] H. Baker, A.M. Kligman, Technique for estimating turnover time of human stratum corneum, Arch. Dermatol. 95
(1967) 408-411.
[36] R.L. Eckert, Structure, function, and differentiation of the keratinocyte, Physiol. Rev. 69 (1989) 1316-1346.
[37] I.D.J. Burdett, Aspects of the structure and assembly of desmosomes, Micron 29 (1998) 309-328.
[38] E. Fuchs, S. Raghavan, Getting under the skin of epidermal morphogenesis, Nat. Rev. Genet. 3 (2002) 199-209.
[39] G.F. Odland, A submicroscopic granular component in human epidermis, J. Invest. Dermatol. 34 (1960) 11-15.
[40] R.K. Freinkel, T.N. Traczyk, Lipid composition and acid hydrolase content of lamellar granules of fetal rat
epidermis, J. Invest. Dermatol. 85 (1985) 295-298.
[41] P.W. Wertz, D.T. Downing, R.K. Freinkel, T.N. Traczyk, Sphingolipids of the stratum corneum and lamellar
granules of fetal rat epidermis, J. Invest. Dermatol. 83 (1984) 193-195.
[42] P.W. Wertz, Epidermal lipids, Semin. Dermatol. 11 (1992) 106-113.
[43] P.W. Wertz, Stratum corneum Lipids and Water, Exog. Dermatol. 3 (2004) 53-56.
[44] I.H. Blank, Transport across the stratum corneum, Toxicol. Appl. Pharmacol. Suppl. 3 (1969) 23-29.
[45] R.J. Scheuplein, I.H. Blank, Permeability of the skin, Physiol. Rev. 51 (1971) 702-747.
[46] J.A. Bouwstra, A. de Graaff, G.S. Gooris, J. Nijsse, J.W. Wiechers, A.C. van Aelst, Water distribution and related
morphology in human stratum corneum at different hydration levels, J. Invest. Dermatol. 120 (2003) 750-758.

References 40
[47] A.S. Michaels, S.K. Chandrasekaran, J.E. Shaw, Drug permeation through human skin: Theory and in vitro
experimental measurement, AIChE J. 21 (1975) 985-996.
[48] P.M. Elias, Lipids and the epidermal permeability barrier, Arch. Dermatol. Res. 270 (1981) 95-117.
[49] P.M. Elias, Epidermal lipids, barrier function, and desquamation, J. Invest. Dermatol. 80 (1983) 44s-49s.
[50] Z. Nemes, P.M. Steinert, Bricks and mortar of the epidermal barrier, Exp. Mol. Med. 31 (1999) 5-19.
[51] T. Steriotis, G.C. Charalambopoulou, Investigation of Stratum Corneum structural and dynamic properties with
neutron techniques, in: BENSC User’s Meeting, Berlin, 2004.
[52] C.R. Harding, S. Long, J. Richardson, J. Rogers, Z. Zhang, A. Bush, A.V. Rawlings, The cornified cell envelope: an
important marker of stratum corneum maturation in healthy and dry skin, Int. J. Cosmet. Sci. 25 (2003) 157-167.
[53] T. Hirao, Involvement of transglutaminase in ex vivo maturation of cornified envelopes in the stratum corneum,
Int. J. Cosmet. Sci. 25 (2003) 245-257.
[54] D.C. Swartzendruber, P.W. Wertz, K.C. Madison, D.T. Downing, Evidence that the corneocyte has a chemically
bound lipid envelope, J. Invest. Dermatol. 88 (1987) 709-713.
[55] P.W. Wertz, K.C. Madison, D.T. Downing, Covalently bound lipids of human stratum corneum, J. Invest.
Dermatol. 92 (1989) 109-111.
[56] L. Coderch, O. Lopez, A. de la Maza, J.L. Parra, Ceramides and skin function, Am. J. Clin. Dermatol. 4 (2003) 107-
129.
[57] A.V. Rawlings, Trends in stratum corneum research and the management of dry skin conditions, Int. J. Cosmet.
Sci. 25 (2003) 63-95.
[58] A. Rawlings, C. Harding, A. Watkinson, J. Banks, C. Ackerman, R. Sabin, The effect of glycerol and humidity on
desmosome degradation in stratum corneum, Arch. Dermatol. Res. 287 (1995) 457-464.
[59] J. Sato, M. Denda, J. Nakanishi, J. Nomura, J. Koyama, Cholesterol sulfate inhibits proteases that are involved in
desquamation of stratum corneum, J. Invest. Dermatol. 111 (1998) 189-193.
[60] E. Zettersten, M.Q. Man, J. Sato, M. Denda, A. Farrell, R. Ghadially, M.L. Williams, K.R. Feingold, P.M. Elias,
Recessive x-linked ichthyosis: role of cholesterol-sulfate accumulation in the barrier abnormality, J. Invest.
Dermatol. 111 (1998) 784-790.
[61] S.J. Rehfeld, W.Z. Plachy, M.L. Williams, P.M. Elias, Calorimetric and electron spin resonance examination of lipid
phase transitions in human stratum corneum: molecular basis for normal cohesion and abnormal desquamation
in recessive X-linked ichthyosis, J. Invest. Dermatol. 91 (1988) 499-505.
[62] C.H. Purdon, C.G. Azzi, J. Zhang, E.W. Smith, H.I. Maibach, Penetration enhancement of transdermal delivery--
current permutations and limitations, Crit. Rev. Ther. Drug Carrier Syst. 21 (2004) 97-132.
[63] Y.Y. Grams, S. Alaruikka, L. Lashley, J. Caussin, L. Whitehead, J.A. Bouwstra, Permeant lipophilicity and vehicle
composition influence accumulation of dyes in hair follicles of human skin, Eur. J. Pharm. Sci. 18 (2003) 329-336.
[64] S. Trauer, A. Patzelt, N. Otberg, F. Knorr, C. Rozycki, G. Balizs, R. Buttemeyer, M. Linscheid, M. Liebsch, J.
Lademann, Permeation of topically applied caffeine through human skin--a comparison of in vivo and in vitro
data, Br. J. Clin. Pharmacol. 68 (2009) 181-186.
[65] F. Knorr, J. Lademann, A. Patzelt, W. Sterry, U. Blume-Peytavi, A. Vogt, Follicular transport route--research
progress and future perspectives, Eur. J. Pharm. Biopharm. 71 (2009) 173-180.
[66] M.L. Williams, P.M. Elias, The extracellular matrix of stratum corneum: role of lipids in normal and pathological
function., Crit. Rev. Ther. Drug Carrier Syst. 3 (1987) 95-122.
[67] B.C. Lippold, Biopharmazie. Eine Einführung zu den wichtigsten Arzneiformen, VWG Stuttgart. (1984).
[68] M.R. Prausnitz, S. Mitragotri, R. Langer, Current status and future potential of transdermal drug delivery, Nat.
Rev. Drug Discov. 3 (2004) 115-124.
[69] S.E. Friberg, I. Kayali, W. Beckerman, L.D. Rhein, A. Simion, Water permeation of reaggregated stratum corneum
with model lipids, J. Invest. Dermatol. 94 (1990) 377-380.

References 41
[70] P.W. Wertz, M.C. Miethke, S.A. Long, J.S. Strauss, D.T. Downing, The composition of the ceramides from human
stratum corneum and from comedones, J. Invest. Dermatol. 84 (1985) 410-412.
[71] N.Y. Schurer, G. Plewig, P.M. Elias, Stratum corneum lipid function, Dermatologica 183 (1991) 77-94.
[72] M.A. Lampe, A.L. Burlingame, J. Whitney, M.L. Williams, B.E. Brown, E. Roitman, P.M. Elias, Human stratum
corneum lipids: characterization and regional variations, J. Lipid Res. 24 (1983) 120-130.
[73] A. Weerheim, M. Ponec, Determination of stratum corneum lipid profile by tape stripping in combination with
high-performance thin-layer chromatography, Arch. Dermatol. Res. 293 (2001) 191-199.
[74] W.M. Holleran, M.Q. Man, W.N. Gao, G.K. Menon, P.M. Elias, K.R. Feingold, Sphingolipids are required for
mammalian epidermal barrier function. Inhibition of sphingolipid synthesis delays barrier recovery after acute
perturbation, J. Clin. Invest. 88 (1991) 1338-1345.
[75] J. van Smeden, L. Hoppel, R. van der Heijden, T. Hankemeier, R.J. Vreeken, J.A. Bouwstra, LC/MS analysis of
stratum corneum lipids: ceramide profiling and discovery, J. Lipid Res. 52 (2011) 1211-1221.
[76] P.W. Wertz, D.T. Downing, Ceramides of pig epidermis: structure determination, J. Lipid Res. 24 (1983) 759-765.
[77] S. Motta, M. Monti, S. Sesana, R. Caputo, S. Carelli, R. Ghidoni, Ceramide composition of the psoriatic scale,
Biochim. Biophys. Acta 1182 (1993) 147-151.
[78] M.W. de Jager, G.S. Gooris, I.P. Dolbnya, M. Ponec, J.A. Bouwstra, Modelling the stratum corneum lipid
organisation with synthetic lipid mixtures: the importance of synthetic ceramide composition, Biochim. Biophys.
Acta, Biomembranes 1664 (2004) 132-140.
[79] M.W. de Jager, G.S. Gooris, I.P. Dolbnya, W. Bras, M. Ponec, J.A. Bouwstra, Novel lipid mixtures based on
synthetic ceramides reproduce the unique stratum corneum lipid organization, J. Lipid Res. 45 (2004) 923-932.
[80] G.K. Menon, K.R. Feingold, A.H. Moser, B.E. Brown, P.M. Elias, De novo sterologenesis in the skin. II. Regulation
by cutaneous barrier requirements, J. Lipid Res. 26 (1985) 418-427.
[81] D. Kessner, M.A. Kiselev, T. Hauss, S. Dante, S. Wartewig, R.H.H. Neubert, Localisation of partially deuterated
cholesterol in quaternary SC lipid model membranes: a neutron diffraction study, Eur. Biophys J. 37 (2008)
1051-1057.
[82] R. Lieckfeldt, J. Villalain, J.C. Gomez-Fernandez, G. Lee, Diffusivity and structural polymorphism in some model
stratum corneum lipid systems, Biochim. Biophys. Acta 1150 (1993) 182-188.
[83] T.J. McIntosh, The effect of cholesterol on the structure of phosphatidylcholine bilayers, Biochim. Biophys. Acta
513 (1978) 43-58.
[84] S. Bhattacharya, S. Haldar, Interactions between cholesterol and lipids in bilayer membranes. Role of lipid
headgroup and hydrocarbon chain–backbone linkage, Biochim. Biophys. Acta, Biomembranes 1467 (2000) 39-
53.
[85] J. Czub, M. Baginski, Comparative molecular dynamics study of lipid membranes containing cholesterol and
ergosterol, Biophys. J. 90 (2006) 2368-2382.
[86] M.L. Williams, P.M. Elias, Stratum corneum lipids in disorders of cornification: increased cholesterol sulfate
content of stratum corneum in recessive x-linked ichthyosis, J. Clin. Invest. 68 (1981) 1404-1410.
[87] P.W. Wertz, D.T. Downing, Cholesteryl sulfate: the major polar lipid of horse hoof, J. Lipid Res. 25 (1984) 1320-
1323.
[88] J.A. Bouwstra, G.S. Gooris, F.E. Dubbelaar, A.M. Weerheim, M. Ponec, pH, cholesterol sulfate, and fatty acids
affect the stratum corneum lipid organization, J. Invest. Dermatol Symp. Proc. 3 (1998) 69-74.
[89] L. Norlen, I. Nicander, A. Lundsjo, T. Cronholm, B. Forslind, A new HPLC-based method for the quantitative
analysis of inner stratum corneum lipids with special reference to the free fatty acid fraction, Arch. Dermatol.
Res. 290 (1998) 508-516.
[90] P.W. Wertz, The nature of the epidermal barrier: biochemical aspects, Adv. Drug Deliver. Rev. 18 (1996) 283-
294.

References 42
[91] M. Mao-Qiang, P.M. Elias, K.R. Feingold, Fatty acids are required for epidermal permeability barrier function, J.
Clin. Invest. 92 (1993) 791-798.
[92] A.S. Breathnach, T. Goodman, C. Stolinski, M. Gross, Freeze-fracture replication of cells of stratum corneum of
human epidermis, J. Anat. 114 (1973) 65-81.
[93] K.C. Madison, D.C. Swartzendruber, P.W. Wertz, D.T. Downing, Presence of intact intercellular lipid lamellae in
the upper layers of the stratum corneum, J. Invest. Dermatol. 88 (1987) 714-718.
[94] J.A. Bouwstra, G.S. Gooris, W. Bras, D.T. Downing, Lipid organization in pig stratum corneum, J. Lipid Res. 36
(1995) 685-695.
[95] M.W. de Jager, G.S. Gooris, I.P. Dolbnya, W. Bras, M. Ponec, J.A. Bouwstra, The phase behaviour of skin lipid
mixtures based on synthetic ceramides, Chem. Phys. Lipids 124 (2003) 123-134.
[96] M.W. de Jager, G.S. Gooris, M. Ponec, J.A. Bouwstra, Lipid mixtures prepared with well-defined synthetic
ceramides closely mimic the unique stratum corneum lipid phase behavior, J. Lipid Res. 46 (2005) 2649-2656.
[97] A. Al-Amoudi, J. Dubochet, L. Norlen, Nanostructure of the epidermal extracellular space as observed by cryo-
electron microscopy of vitreous sections of human skin, J. Invest. Dermatol. 124 (2005) 764-777.
[98] G.C. Charalambopoulou, T.A. Steriotis, T. Hauss, A.K. Stubos, N.K. Kanellopoulos, Structural alterations of fully
hydrated human stratum corneum, Physica B: Condensed Matter 350 (2004) E603-E606.
[99] J.A. Bouwstra, F.E. Dubbelaar, G.S. Gooris, A.M. Weerheim, M. Ponec, The role of ceramide composition in the
lipid organisation of the skin barrier, Biochim. Biophys. Acta 1419 (1999) 127-136.
[100] J.A. Bouwstra, P.L. Honeywell-Nguyen, Skin structure and mode of action of vesicles, Adv. Drug Deliv. Rev. 54
Suppl 1 (2002) S41-55.
[101] A. Ruettinger, M.A. Kiselev, T. Hauss, S. Dante, A.M. Balagurov, R.H.H. Neubert, Fatty acid interdigitation in
stratum corneum model membranes: a neutron diffraction study, Eur. Biophys. J. 37 (2008) 759-771.
[102] S. Mitragotri, Healing sound: the use of ultrasound in drug delivery and other therapeutic applications, Nat. Rev.
Drug Discov. 4 (2005) 255-260.
[103] Y.N. Kalia, A. Naik, J. Garrison, R.H. Guy, Iontophoretic drug delivery, Adv. Drug Deliver. Rev. 56 (2004) 619-658.
[104] A.C. Williams, B.W. Barry, Penetration enhancers, Adv. Drug Deliver. Rev. 56 (2004) 603-618.
[105] H. Trommer, R.H.H. Neubert, Overcoming the stratum corneum: the modulation of skin penetration. A review,
Skin Pharmacol. Physiol. 19 (2006) 106-121.
[106] J. Kalbitz, R.H.H. Neubert, W. Wohlrab, Modulation of drug penetration in the skin, Pharmazie 51 (1996) 619-
637.
[107] R.B. Walker, E.W. Smith, The role of percutaneous penetration enhancers, Adv. Drug Deliver. Rev. 18 (1996)
295-301.
[108] B.M. Magnusson, K.A. Walters, M.S. Roberts, Veterinary drug delivery: potential for skin penetration
enhancement, Adv. Drug Deliv. Rev. 50 (2001) 205-227.
[109] G.K. Menon, S.H. Lee, Ultrastructural effects of some solvents and vehicles on the stratum corneum and other
skin components: evidence for an ‘‘extended mosaic-partitioning model of the skin barrier’’, in: M.S. Roberts,
K.A. Walters (Eds.) Dermal Absorption and Toxicity Assessment, Marcel Dekker, New York, 1998, pp. 727-751.
[110] J. Crank, The mathematics of diffusion, 2 ed., Oxford, 1975.
[111] S. Hansen, A. Henning, A. Naegel, M. Heisig, G. Wittum, D. Neumann, K.-H. Kostka, J. Zbytovska, C.-M. Lehr, U.F.
Schaefer, In-silico model of skin penetration based on experimentally determined input parameters. Part I:
Experimental determination of partition and diffusion coefficients, Eur. J. Pharm. Biopharm. 68 (2008) 352-367.
[112] L. Duracher, L. Blasco, A. Abdel Jaoued, L. Vian, G. Marti-Mestres, Irradiation of skin and contrasting effects on
absorption of hydrophilic and lipophilic compounds, Photochem. Photobiol. 85 (2009) 1459-1467.
[113] D. Groen, G.S. Gooris, M. Ponec, J.A. Bouwstra, Two new methods for preparing a unique stratum corneum
substitute, Biochim. Biophys. Acta, Biomembranes 1778 (2008) 2421-2429.

References 43
[114] OECD, (2004), Guidance Document for the Conduct of Skin Absorption Studies, OECD Series on Testing and
Assessment, No. 28, OECD Publishing. doi: 10.1787/9789264078796-en.
[115] M. Hartmann, B.D. Hanh, H. Podhaisky, J. Wensch, J. Bodzenta, S. Wartewig, R.H.H. Neubert, A new FTIR-ATR
cell for drug diffusion studies, Analyst 129 (2004) 902-905.
[116] U. Guenther, M. Hartmann, S. Wartewig, R.H.H. Neubert, Diffusion of urea through membranes, Diffusion
Fundamentals 4 (2006) 4.1-4.5.
[117] R. Jenkins, R.L. Snyder, Introduction to X-ray powder diffractometry, Willey, New York, 1996.
[118] J.A. Bouwstra, M. Ponec, The skin barrier in healthy and diseased state, Biochim. Biophys. Acta, Biomembranes
1758 (2006) 2080-2095.
[119] S. Wartewig, R.H.H. Neubert, Pharmaceutical applications of Mid-IR and Raman spectroscopy, Adv. Drug Deliv.
Rev. 57 (2005) 1144-1170.
[120] R. Singh, C. V. Raman and the Discovery of the Raman Effect, Physics in Perspective (PIP). 4 (2002) 399-420.
[121] R. Mendelsohn, C.R. Flach, D.J. Moore, Determination of molecular conformation and permeation in skin via IR
spectroscopy, microscopy, and imaging, Biochim. Biophys. Acta 7 (2006) 923-933.
[122] J. Barbillat, Raman imaging, Academic, 1996, pp. 175-200.
[123] A. Whitley, F. Adar, Confocal spectral imaging in tissue with contrast provided by Raman vibrational signatures,
Cytometry, Part A 69A (2006) 880-887.
[124] P.J. Treado, M.D. Morris, Infrared and Raman spectroscopic imaging, Appl. Spectrosc. Rev. 29 (1994) 1-38.
[125] B. Gotter, W. Faubel, R.H.H. Neubert, FTIR microscopy and confocal Raman microscopy for studying lateral drug
diffusion from a semisolid formulation, Eur. J. Pharm. Biopharm. 74 (2010) 14-20.
[126] T. Dieing, O. Hollricher, High-resolution, high-speed confocal Raman imaging, Vib. Spectrosc. 48 (2008) 22-27.
[127] A. Bogner, P.H. Jouneau, G. Thollet, D. Basset, C. Gauthier, A history of scanning electron microscopy
developments: Towards "wet-STEM" imaging, Micron 38 (2007) 390-401.
[128] R. Reichelt, Scanning Electron Microscopy Science of Microscopy, in: P.W. Hawkes, J.C.H. Spence (Eds.), Springer
New York, 2007, pp. 133-272.
[129] D.J. Stokes, Recent advances in electron imaging, image interpretation and applications: environmental
scanning electron microscopy, Philos. Trans. R. Soc. London, Ser. A 361 (2003) 2771-2787.
[130] S.E. Kirk, J.N. Skepper, A.M. Donald, Application of environmental scanning electron microscopy to determine
biological surface structure, J. Microsc. 233 (2009) 205-244.
[131] A.M. Donald, Environmental scanning electron microscopy for the study of "wet" systems, Curr. Opin. Colloid
Interface Sci. 3 (1998) 143-147.
[132] D.C. Fenimore, C.M. Davis, High performance thin-layer chromatography, Anal. Chem. 53 (1981) 252A-254A,
256A, 258A, 262A, 265A-266A.
[133] J. Sherma, Thin layer chromatography in environmental analysis, Rev. Anal. Chem. 14 (1995) 75-142.
[134] T.H. Jupille, J.A. Perry, High-Performance Thin-Layer Chromatography: A Review of Principles, Practice, and
Potential, C R C Critical Reviews in Analytical Chemistry 6 (1977) 325-359.
[135] B. Aldhubaib, K. Mueen Ahmed, M. Attimarad, S. Harsha, High-performance thin layer chromatography: A
powerful analytical technique in pharmaceutical drug discovery, Pharmaceutical Methods 2 (2011) 71-75.
[136] A. Opitz, M. Wirtz, D. Melchior, A. Mehling, H. Kling, R.H.H. Neubert, Improved Method for Stratum Corneum
Lipid Analysis by Automated Multiple Development HPTLC, Chromatographia 73 (2011) 559-565.
[137] H. Farwanah, R.H.H. Neubert, S. Zellmer, K. Raith, Improved procedure for the separation of major stratum
corneum lipids by means of automated multiple development thin-layer chromatography, J. Chromatogr. B:
Anal. Technol. Biomed. Life Sci. 780 (2002) 443-450.
[138] A. Weston, P.R. Brown, HPLC and CE: Principle and Practice, Academic, 1997.
[139] V.R. Meyer, Introduction, in: Practical High-Performance Liquid Chromatography, John Wiley & Sons, Ltd, 2010,
pp. 5-16.

References 44
[140] H. Whatley, Basic principles and modes of capillary electrophoresis, Humana Press Inc., 2001, pp. 21-58.
[141] F. Tagliaro, G. Manetto, F. Crivellente, F.P. Smith, A brief introduction to capillary electrophoresis, Forensic Sci.
Int. 92 (1998) 75-88.
[142] C.M. Boone, J.C.M. Waterval, H. Lingeman, K. Ensing, W.J.M. Underberg, Capillary electrophoresis as a versatile
tool for the bioanalysis of drugs - a review, J. Pharm. Biomed. Anal. 20 (1999) 831-863.
[143] W.G. Kuhr, Capillary electrophoresis, Anal. Chem. 62 (1990) 403R-414R.

45
Chapter 5
Characterization of lipid model membranes designed for studying
impact of ceramide species on drug diffusion and penetration
M. Ochalek a, S. Heissler b, J. Wohlrab c, R.H.H. Neubert a
a Institute of Pharmacy, Martin Luther University, Halle (Saale), Germany
b Institute of Functional Interfaces, Karlsruhe Institute of Technology, Eggenstein-Leopoldshafen, Germany
c Department of Dermatology and Venereology, Martin Luther University, Halle (Saale), Germany
(adapted from Eur. J. Pharm. Biopharm. 81 (2012) 113–120)
Abstract
The stratum corneum (SC) intercellular lipid matrix plays a crucial role in the skin barrier
function. In the present study, lipid model membranes mimicking its phase behavior were
prepared and characterized using different analytical techniques (i.a. SAXD, HPTLC, ESEM,
confocal Raman imaging, ATR-FTIR spectroscopy) in order to obtain well-standardized
model membranes for diffusion and penetration studies. The lipid model membranes
should be used in the future for studying the impact of each ceramide species on the
diffusion and penetration of drugs. The SAXD study confirmed that the lipids within
artificial lipid systems are arranged similarly to the lipids in the human SC. The
polarization microscopic and ESEM images showed the homogenous deposition of lipids
on the polycarbonate filter. Both the HPTLC and confocal Raman imaging studies proved
the homogenous distribution of individual lipid classes within the lipid model membranes.
First in vitro diffusion experiments (performed using an ATR-FTIR diffusion cell) of the
hydrophilic compound, urea, revealed that the lipid model membrane represents even
stronger diffusion barrier than the human SC.

Chapter 5 Characterization of lipid model membranes 46
1. Introduction
The main penetration barrier for topically administered drugs and other substances
(e.g. water) is formed by the outermost layer of the skin, the stratum corneum (SC) [1]. It
consists of 10–25 layers of parallel to the skin surface corneocytes embedded in a lipid
matrix and ranges from 10 to 15 μm in thickness in a dry state, however, swells to several
times this thickness in a fully hydrated state [2]. Of special interest is the organization of
the SC intercellular lipid matrix, since the intercellular route of transport through the
normal intact SC is thought to be the most preferable one [3]. Unlike other biological
membranes, the SC does not contain phospholipids. In return, the SC intercellular lipid
matrix is enriched in ceramides, free fatty acids, cholesterol and its derivatives organized
in lamellar phases [4]. One of its main components are ceramides, which are regarded as
fundamental compounds in functioning of the SC barrier [5]. Recent reports indicate the
existence of 12 classes of ceramides that have been isolated from the human SC [6]. As
found in the former studies, a crucial role in the internal membrane structure formation
plays ceramide [AP] due to its headgroup polarity [7-9]. It is assumed that the other
constituent of the SC intercellular lipid matrix, which influences to a high degree the lipid
assembly and the barrier properties of the SC, is the acylceramide, ceramide [EOS] [10].
To deliver insight into the role of each individual lipid species on the functioning and
maintaining of the SC barrier, well-defined artificial SC lipid systems have been produced
as oriented multilamellar membranes [8, 11, 12]. Similar approach was also presented in
other studies [13-16], however, lipid systems used there were much more complex.
In the present study, basic lipid model membranes composed of only 4 constituents
(including Cer [AP] and Cer [EOS]) were prepared on porous substrates. Use of such
elementary systems helps to elucidate the impact of each lipid compound, particularly
the different ceramide species, on the diffusion and penetration of drugs and other
substances of interest. This routine is complementary to the previous studies on the
influence of each lipid component on the nanostructure of the SC intercellular lipid matrix
[10-12, 17]. Therefore, it is very important to characterize and to standardize such lipid
model membranes. The lamellar organization of the prepared lipid model membranes
and distribution of lipids within them were examined using various analytical techniques,
including small angle X-ray diffraction, high performance thin layer chromatography and
microscopic methods (i.a. environmental scanning electron microscopy and confocal
Raman imaging). The barrier properties of these systems were investigated by means of a
comparison of diffusion of the hydrophilic compound, urea, through lipid model

Chapter 5 Characterization of lipid model membranes 47
membranes and the human SC isolated from the full thickness skin. The diffusion
experiments were conducted using the ATR-FTIR diffusion cell with online detection of
the diffusing and penetrating agents, constructed by the technical department of our
institute.
2. Materials and methods
2.1. Materials
Synthetic Cer [EOS] and Cer [AP] were generously provided by Evonik Goldschmidt
(Essen, Germany). Palmitic acid, sodium cholesteryl sulfate and urea were purchased
from Sigma-Aldrich Chemie GmbH (Steinheim, Germany) and cholesterol from Sigma
Chemical CO. (St. Louis, USA). Methanol, ethanol, chloroform, acetone, ethyl acetate and
n-hexane were obtained from Merck (Darmstadt, Germany). Nuclepore polycarbonate
membrane filters (diameter 25 mm, pore size 50 nm) were purchased from Whatman
(Kent, UK). Solvents used for the sample preparation, extraction and the high
performance thin layer chromatography procedure were of analytical grade.
2.2. Preparation of model lipid membranes
Two used quaternary lipid mixtures were composed of: Cer [AP]/Chol/PA/ChS
(55/25/15/5, m/m), referred to as Membrane I, and Cer [AP]/Cer [EOS]/Chol/PA
(10/23/33/33, m/m), referred to as Membrane II. Chemical structures of these lipids are
presented in Fig. 1. Appropriate quantities of individual lipids were dissolved in a mixture
of chloroform/methanol (2/1, v/v). Because of the incompatibility of chloroform and
Nuclepore polycarbonate filters, the organic solvents were evaporated under a stream of
nitrogen, and the lipids were re-dissolved in a mixture of n-hexane/ethanol (2/1, v/v). A
total lipid concentration was 5 mg/ml. Afterward, the lipid mixtures were applied onto
the filter using Automatic TLC Sampler 4 (Camag, Muttenz, Switzerland) with a specially
built holder, at a very low flow rate (80 nl/s) and under the stream of nitrogen. It resulted
in an immediate evaporation of organic solvents from the filters and a fast arrangement
of lipid bilayers. The sprayed area was a square with dimensions 13 x 13 mm (i.e. area of
169 mm2), and the volume of lipid solution used was 100 or 200 µl. The prepared
membranes were subjected to an annealing procedure, which consisted of heating the
samples at 80 °C or 70 °C (Membrane I and Membrane II, respectively) for a period of 30

Chapter 5 Characterization of lipid model membranes 48
min and a subsequent cooling down step (to room temperature, 25 °C). It enhanced the
multilamellar orientation of lipids and decreased the mosaicity of samples.
Fig. 1. Chemical structures of constituents of lipid model membranes.
2.3. Small angle X-ray diffraction studies
The lamellar organization of artificial lipid membranes was investigated using small
angle X-ray diffraction (SAXD). The X-ray diffraction experiments were carried out using
the Stoe Stadi MP Powder diffraction system (STOE & Cie GmbH, Darmstadt, Germany) in
the Bragg–Brentano mode with the linear PSD detector. The measurements were taken at
standard ambient temperature (25 °C), by placing a sample in vertical position. The
intensity of the scattered X-rays (in arbitrary units) was plotted as a function of the
scattering vector q (in Å-1). Its relation to the scattering angle is given by the equation: q =
(4π sin θ)/λ, where θ is the scattering angle and λ is the wavelength of the primary beam.
Each diffraction pattern consists of a series of equidistant peaks. The lamellar repeat
distance (or lamellar periodicity, d) is calculated by using the equation: d = 2nπ/qn, where
n is a diffraction order of the peak and qn gives its location [18].
2.4. High performance thin layer chromatography studies
The distribution of lipids within the synthetic model lipid membranes was examined
using high performance thin layer chromatography (HPTLC) technique. Membrane I and
Membrane II were divided into five parts by cutting out five pieces (Area 1 = 16.6 mm2,
Area 2 = 31.2 mm2, Area 3 = 20.1 mm2, Area 4 = 37.8 mm2 and Area 5 = 63.3 mm2) using a

Chapter 5 Characterization of lipid model membranes 49
puncher (Fig. 2A). Next, an extraction of lipids was conducted by shaking the samples for
60 min in n-hexane/ethanol 2/1 (v/v) mixture. Afterward, the solvents were evaporated
under a stream of nitrogen, and the lipids were re-dissolved in chloroform/methanol 2/1
(v/v). The samples prepared in this manner were then applied on the HPTLC plate using
ATS 4 (Camag, Muttenz, Switzerland). Next, the plate was developed using AMD 2 device
(Camag, Muttenz, Switzerland). The principle of this procedure is that the HPTLC plate is
developed repeatedly (in successive runs) in the same direction, and each successive run
uses a solvent of lower elution strength than that of the one used before, so in result a
stepwise gradient elution takes place. In this study, the HPTLC plates were developed in
16 runs (Fig. 2B). After the development, the plates were immersed in 10% CuSO4
solution and charred for 20 min at 150 °C (derivatization). Finally, the densitometric
evaluation was performed using TLC Scanner 3 (Camag, Muttenz, Switzerland).
Integration of peaks’ areas and quantification of lipids’ amounts in each area of the lipid
membrane were performed using CATS software (Camag). A similar HPTLC procedure was
previously described by Farwanah et al. [19] and Opitz et al. [20].
Fig. 2. (A) Graphical description of a lipid model membrane deposited on a filter
marked with 5 areas used in HPTLC studies. (B) HPTLC elution system composed of
16 gradient steps.

Chapter 5 Characterization of lipid model membranes 50
2.5. Microscopic studies
The arrangement and deposition of lipids on the filters were also determined by
using three different microscopic techniques, namely: polarization microscopy,
environmental scanning electron microscopy (ESEM) and confocal Raman imaging.
The images of lipid model membranes were obtained using a polarizing microscope
Axiolab (Carl Zeiss, Goettingen, Germany).
The ESEM measurements were performed using Philips ESEM XL30 FEG (FEI,
Hillsboro, USA) equipped with a unique gaseous secondary electron detector (GSED). The
samples were measured in so-called WET-Mode and at a voltage of 12 kV. The ESEM
technique is characterized by a very high spatial resolution (2 nm) and a possibility of the
observation of samples under dynamic conditions (at different pressures and
temperatures). Use of water vapor as a standard gas in the microscope chamber allows to
examine hydrated specimens in their natural state.
Raman imaging experiments were conducted using confocal Raman microscope
Senterra (Bruker Optics, Ettlingen, Germany). A diode laser (785 nm, 100 mW) was used
as an excitation source. Its beam was sent through a 20x Olympus MPlan LD objective (NA
= 0.4). The backscattered radiation collected and collimated by the same objective was
focused through a 25 µm pinhole onto CCD (charge-coupled device) detector. Since only
light originating from the focal plane has its focus within the pinhole and thereby reaches
the detector, one can obtain a signal of interest without blurred signals from out-of-focus
planes. It is an essential feature of confocal imaging techniques. The Raman spectra were
taken in the range 75-3200 cm-1 with a spectral resolution of 9 cm-1. The integration times
of the Raman spectra amounted to 120 s (each point was measured twice). In order to
investigate the distribution of individual lipid species within the surface of the lipid model
membranes, areas of 0.107 mm2 and 0.126 mm2 in the case of Membrane I and
Membrane II, respectively, comprising 64 measuring points were scanned. The Raman
data evaluation was performed using the OPUS software (Bruker Optics, Ettlingen,
Germany).
2.6. Diffusion studies
Diffusion experiments were carried out using Vertex 70 FTIR spectrometer (Bruker
Optics, Ettlingen, Germany) with a built-in ATR-FTIR diffusion cell constructed by the
technical department of our institute. Its special features are diffusion area of 0.18 cm2

Chapter 5 Characterization of lipid model membranes 51
and maintenance of the constant temperature (32 °C) throughout the whole experiment.
An ATR crystal, ZnSe (n = 2.4, d = 20 mm), was horizontally oriented with an angle of
incidence of 45°. Each IR spectrum consisted of 32 scans taken in the range 680–4000 cm-1
with a resolution of 2 cm-1. The ATR-FTIR diffusion cell combines the advantages of the
ATR-method with the Franz-type diffusion cell. It is a non-destructive procedure, which
provides online detection of permeating agents (“in situ”) and enables monitoring of
multiple species simultaneously. Other characteristics and a precise buildup of the ATR-
FTIR diffusion cell were reported previously [21-23]. As model membranes, human SC and
artificial lipid system, Membrane I (Cer [AP]/Chol/PA/ChS = 55/25/15/5, m/m) with
thickness of 3 µm, were used. The SC was isolated from the full thickness human skin
(two female donors; samples taken from back, abdomen and thigh), which was acquired
after cosmetic surgery. Prior to the isolation of the SC, the subcutaneous fat tissue was
removed from the skin samples. The protocol of this study was approved by the Ethics
Committee of the Martin Luther University Halle-Wittenberg (Germany). The isolation
procedure was in accordance with a method depicted by Kligman and Christophers [24].
After separation of the SC from the epidermis (incubation in 0.1% trypsin solution in PBS
buffer, pH 7.4, for 12–24 h at 32 °C), the SC samples were stored at –26 °C until use. As
model drug, 10% (m/m) water solution of urea was used and the acceptor compartment
was filled with 50 µl of distilled water. Before adding the donor solution into the donor
chamber, a membrane (human SC or Membrane I) was mounted in the diffusion cell and
equilibrated for a period of 15 min. All diffusion experiments were conducted under
occlusive conditions. Permeability parameters were obtained from plotting the
cumulative permeated amount per cm2 versus time. Diffusion coefficients were acquired
by fitting the normalized diffusion data using Eq. (1), which was derived from the Fick’s
second law of diffusion by fitting appropriate initial and boundary conditions and using
the Laplace transformation:
(
√ ) (1)
where ( √ ), C is the concentration of urea in the acceptor phase, C0 is the initial
concentration of urea, D is the diffusion coefficient and l is the diffusional pathlength. A
partition coefficient between the membrane and the donor solution, Km/d, was calculated
using equation: , where kp is the permeability coefficient.

Chapter 5 Characterization of lipid model membranes 52
3. Results and discussion
3.1. Lamellar organization of lipid model membranes
The lamellar arrangement of lipid model membranes plays a key role in the SC
barrier function. To check the organization of lipids within lipid model membranes, SAXD
studies were carried out. The X-ray diffraction patterns of Membrane I are presented in
Fig. 3. In the case of both membranes (for both used lipid mixture volumes), two lamellar
phases were present, one with shorter lamellar repeat distance (referred to as the small
phase) and one with longer periodicity (referred to as the main phase). Membrane I
(spraying of 100 µl of the lipid mixture) showed the main phase with a periodicity of 46.53
± 0.06 Å, of which the 1st, 2nd, 3rd, 4th, 6th, 7th and 8th diffraction peaks were detected at q
= 0.14, 0.28, 0.41, 0.55, 0.81, 0.95, 1.09 Å-1, and the small phase with the lamellar repeat
distance of 41.73 ± 0.13 Å, of which the 1st, 2nd, 3rd, 5th and 6th diffraction peaks were
located at q = 0.16, 0.31, 0.46, 0.76 and 0.91 Å-1. Use of 200 µl of the lipid mixture
(Membrane I) resulted in the similar lamellar organization, that is the main phase with the
periodicity of 46.50 ± 0.03 Å (1st, 2nd, 3rd, 4th, 6th, 7th and 8th diffraction peaks at q = 0.13,
0.27, 0.41, 0.55, 0.81, 0.95 and 1.08 Å-1) and the small phase with the lamellar spacing of
41.37 ± 0.06 Å (1st, 2nd, 3rd, 5th and 6th diffraction reflections at q = 0.15, 0.30, 0.45, 0.76
and 0.91 Å-1). Membrane II (100 µl) showed the main phase with the periodicity of 45.62
± 0.71 Å, of which the 1st, 2nd, 3rd and 4th diffraction peaks were situated at q = 0.14, 0.28,
0.41, 0.53 Å-1 and the small phase with the lamellar repeat distance of 41.90 ± 0.06 Å, of
which the 1st, 2nd and 3rd diffraction reflections were located at q = 0.15, 0.30 and 0.45 Å-1.
The diffraction pattern of Membrane II (200 µl) was also characterized by the presence of
the main phase with the lamellar spacing of 45.77 ± 0.47 Å (1st, 2nd, 3rd and 4th diffraction
peaks at q = 0.14, 0.28, 0.41 and 0.53 Å-1) and the small phase with the periodicity of
42.21 ± 0.06 Å (1st, 2nd and 3rd diffraction peaks at q = 0.15, 0.30 and 0.45 Å-1). In addition,
in the case of both lipid model membranes, two reflections of phase separated crystalline
cholesterol were present at q = 0.18 and 0.36 Å-1. As can be deduced from the above
listed results, the periodicity of the main phase for Membrane II was slightly shifted to a
lower value, approx. 45.70 Å, when compared to Membrane I (dmain phase ~ 46.50 Å). On
the other hand, the lamellar repeat distance of the small phase was reduced in the case
of Membrane I and amounted to approx. 41.55 Å (for Membrane II dsmall phase ~ 42.05 Å).
The next interesting features of X-ray diffraction patterns of both lipid membranes were
the number of diffraction orders and the intensity of diffraction reflections. The

Chapter 5 Characterization of lipid model membranes 53
diffractogram of Membrane I showed eight peaks of the main phase and six peaks of the
small phase, except for the 5th and the 4th peak of the main and the small phase,
respectively, where the intensities were too low to make these reflections detectable.
Membrane II showed only four peaks assigned to the main phase and three peaks
assigned to the small phase. The intensity of diffraction reflections was much higher for
Membrane I (by few factors when compared to Membrane II). Moreover, the difference
in the peaks’ intensities for Membrane I prepared using 100 µl and 200 µl was also
apparent, namely Membrane I prepared using bigger volume of the lipid mixture showed
diffraction reflections with higher intensity. For Membrane II, the intensity of the
diffraction peaks was similar for both systems prepared using different volumes of the
lipid solution. Additionally, the level of the phase separated cholesterol was similar in the
case of both lipid model membranes.
Fig. 3. X-ray diffraction patterns of Membrane I (100 µl and 200 µl of a lipid mixture). Arabic and Roman
numbers denote orders of diffraction of the main and the small phase, respectively. Asterisks stand for
phase separated crystalline cholesterol.
The aim of this study was to investigate the lamellar organization of artificial lipid
membranes and thereby to standardize the preparation of the model membranes and to
confirm the similarity of the structure of these model systems to the native SC. Both
Membrane I and Membrane II were characterized by the presence of two phases, the
main and the small phase. In terms of the lamellar periodicity, the differences between
those phases were statistically significant. Similar phase behavior of the lipid membrane
consisting of Cer [AP]/Chol/PA/ChS (55/25/15/5, m/m) was previously reported by
Ruettinger et al. [25], where d = 45.6 Å. In the basic membranes used in this study, no

Chapter 5 Characterization of lipid model membranes 54
long periodicity phase (LPP) was observed. The reason of the absence of the LPP might be
the simplicity of the model lipid membranes used in this project, which were composed of
only four individual lipid species and/or the absence or too low concentration of Cer
[EOS] within Membrane I and Membrane II, respectively. From previous studies, it is
known that Cer [EOS] plays a crucial role in the formation of the LPP [10]. Groen et al. [16]
used equimolar mixtures of Chol:synthCer:FFA and have reported the presence of the LPP
with the lamellar spacing of ~ 120 Å. However, in their study, the synthCer fraction was a
mixture of six different ceramides and FFA fraction was composed of seven different free
fatty acids. In the present study, it was proven that the lipid membrane consisting in 55%
(m/m) of Cer [AP] created a stable lamellar structure with a small amount of the phase
separated crystalline Chol, which appearance can be ascribed to the limited solubility of
Chol in the lipid phase. Lipids within Membrane II that main characteristics were the
following: lower concentration of Cer [AP] (10%, m/m), the presence of Cer [EOS] (23%,
m/m) and the absence of ChS, formed similarly lamellar structures. Crystalline Chol
domains were also present, only here the reflections assigned to the main and the small
phase were much weaker and were not that numerous. It indicates that in the case of
Membrane II, smaller fraction of the lipids contributed to the organization of the lamellar
phases.
3.2. Lipid distribution within lipid model membranes
The HPTLC procedure was performed to investigate the distribution of individual
lipid species within lipid model systems. Lipids extracted from all five parts of the lipid
model systems were separated and quantitatively analyzed by means of a comparison
with separated lipids from the control sample (i.e. lipid mixture used for the preparation).
All lipid species were present in all five parts of the lipid model membranes (Fig. 4A and
B). Individual lipid species were identified by comparing their retention factor (Rf) values
to the Rf of standard lipids. The retention factors of ChS, Chol and PA amounted to 0.11,
0.74 and 0.81, respectively. Cer [AP] was separated into two stereoisomers, namely D-
and L-isomers with retention factors of 0.26 and 0.31. The Rf of Cer [EOS] amounted to
0.49. The quantification of lipid amounts was based on the densitometric evaluation. The
calibration curves of all lipids were not linear and were fitted using the Michaelis–Menten
function [19]. The quantitative results are presented in Fig. 4A and B. The distribution of
lipids within Membrane I is shown in Fig. 4A. The quantities of lipids per mm2 evaluated in
all parts of Membrane I amounted to 2.94 ± 0.46 µg, 1.08 ± 0.24 µg, 0.80 ± 0.22 µg and

Chapter 5 Characterization of lipid model membranes 55
0.27 ± 0.05 µg (MEAN ± SD, n = 4) for Cer [AP], Chol, PA and ChS, respectively. The
analysis of variance (ANOVA) with post hoc comparison made using Tukey’s test proved
that the means of the amount/area of all lipid species, within first three areas (total area
of 67.9 mm2), were not significantly different (α = 0.05). Fig. 4B shows the distribution of
lipids within Membrane II. The amounts of lipids per mm2 evaluated in all parts of
Membrane II amounted to 0.48 ± 0.04 µg, 0.63 ± 0.06 µg, 1.16 ± 0.13 µg and 1.29 ± 0.07
µg (MEAN ± SD, n = 4) for Cer [AP], Cer [EOS], Chol and PA, respectively. The ANOVA (with
Tukey’s test) proved that the means of the amount/area of Cer [AP], within first four
areas (total area of 105.7 mm2) and in the case of other lipids in all five areas (total area
of 169 mm2), were not significantly different (α = 0.05).
Fig. 4. Distribution of lipids within (A) Membrane I and (B) Membrane II - the amount of lipids per mm2
(data represent MEAN ± SD, n = 4; * indicates no significant difference at p < 0.05).
0,0
0,5
1,0
1,5
2,0
2,5
3,0
3,5
Area 1 Area 2 Area 3 Area 4 Area 5
Am
ount/are
a [
µg/m
m2]
Cer [AP] Chol PA ChS
A
0,0
0,2
0,4
0,6
0,8
1,0
1,2
1,4
1,6
1,8
Area 1 Area 2 Area 3 Area 4 Area 5
Am
ount/are
a [
µg/m
m2]
Cer [AP] Cer [EOS] Chol PA
B

Chapter 5 Characterization of lipid model membranes 56
The aim of this study was to examine the distribution of lipids within lipid model
systems. To interpret the data properly, it has to be taken into account that only a small
part of the lipid membrane took part in the further diffusion studies. In the case of the
ATR-FTIR diffusion cell, it was an area of only 18.1 mm2. Therefore, it can be assumed that
in terms of the diffusion studies, the most important role plays the central part of the
artificial lipid system. Both Membrane I and Membrane II showed the homogenous
distribution of individual lipid species within the central part of the lipid membrane. The
total area of homogenously distributed lipid species within the lipid membrane amounted
to 67.9 mm2 and 105.7 mm2 in the case of Membrane I and Membrane II, respectively. It
can be concluded that the lipid model membranes used in this study could have been
prepared in a standardized way in terms of the lipid distribution and, therefore, were
suitable model membranes to be tested and to be compared with the human SC in the
diffusion and penetration studies.
The deposition of lipids on the polycarbonate filters was investigated using
microscopic techniques: polarization microscopy and ESEM. The microscopic images of
Membrane I and Membrane II obtained by a polarizing microscope are shown in Fig. 5A–C
and D–F, respectively. Fig. 6 displays electron micrographs of Membrane I (A), Membrane
II (B) and a polycarbonate filter not covered with lipids (C and D). The polarization
microscopic and ESEM images complement one another. One can obtain the information
about the surface of the lipid membrane on both the macro- (polarization microscopy)
and the micro-scale (ESEM). Images shown in Fig. 5 confirm the homogenous deposition
of lipids on the polycarbonate filter. The lipids formed continuous layer with no areas not
covered with the lipid mixture. Moreover, the images show only a small number of
crystals originating from phase separated Chol. In the case of the ESEM images, the
difference in the surface appearance between the lipid membrane and the membrane
filter not covered with lipids is presented. In Fig. 6C and D, the pores of the filter can be
seen as small dark spots with white rings. On the other hand, Fig. 6A and B shows the
surface of the continuous structure composed of the lipid mixture with no apparent
pores. The surfaces of Membrane I and Membrane II differ from each other (clearly
visible in polarization microscopic and ESEM images). It might be caused by the different
composition of the lipid membranes (the presence of Cer [EOS] in Membrane II), resulting
in the distinctive phase behavior (confirmed earlier by the SAXD).
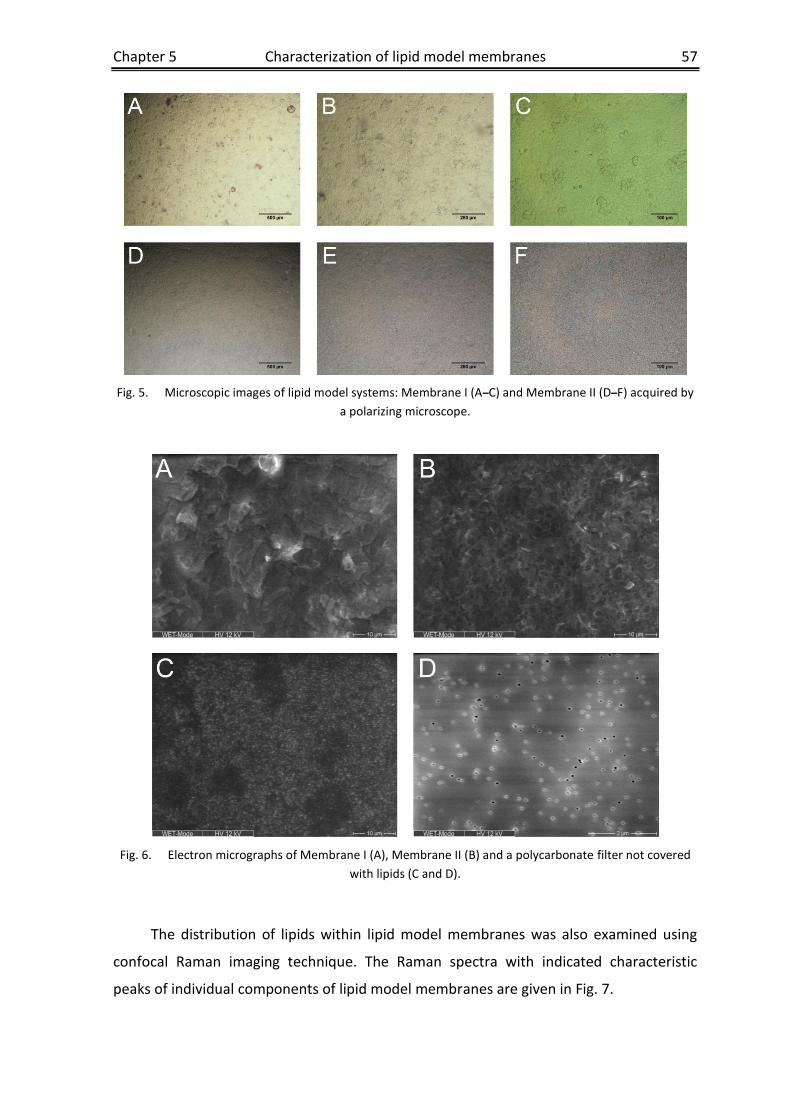
Chapter 5 Characterization of lipid model membranes 57
Fig. 5. Microscopic images of lipid model systems: Membrane I (A–C) and Membrane II (D–F) acquired by
a polarizing microscope.
Fig. 6. Electron micrographs of Membrane I (A), Membrane II (B) and a polycarbonate filter not covered
with lipids (C and D).
The distribution of lipids within lipid model membranes was also examined using
confocal Raman imaging technique. The Raman spectra with indicated characteristic
peaks of individual components of lipid model membranes are given in Fig. 7.

Chapter 5 Characterization of lipid model membranes 58
The spectra of Chol and ChS show the peaks that can be assigned to the alicyclic
stretching vibrations at 607 cm-1 and 617 cm-1, respectively. The δ(CH2) and δ(CH3)asym
vibrations of PA are located around 1422 cm-1, and the ν(C=C) band of Cer [EOS] can be
found at 1658 cm-1. In the case of Cer [AP], the characteristic peak is located at 891 cm-1
and can be assigned to the ν(CC) vibration. These characteristic bands were used for the
integration procedure and thereby the evaluation of the amount of the lipid species
within the surface of the lipid model membranes. The results of the evaluation procedure
are presented in Fig. 8A and B. This figure contains Raman images (contour maps)
displaying the distribution of individual lipid species within lipid model membranes. Fig.
8A shows the distribution of Cer [AP], Chol, PA and ChS within Membrane I, and Fig. 8B
demonstrates the distribution of Cer [AP], Cer [EOS], Chol and PA within Membrane II. A
normalized integrated intensity of lipids’ specific bands is reflected by means of a color
scale (starting with black = 0 and ending with red = 1). Raman images confirm the results
of the polarization microscopy and ESEM experiments. The whole area of the
polycarbonate filter is covered with lipid systems. Individual lipids are distributed
homogenously, with single spots characterized by bigger amounts of lipids. It has to be
taken into account that the color scale reflects the normalized intensity. Therefore, the
amounts of different lipids are relative. One can obtain only the information about the
distribution of lipids, not about their absolute quantities.
Fig. 7. Raman spectra of components of lipid model membranes: (A) PA, (B) Chol, (C)
Cer [EOS], (D) Cer [AP] and (E) ChS. Wavenumbers presented on the graph indicate
characteristic peaks used for the evaluation of individual lipid species.

Chapter 5 Characterization of lipid model membranes 59
Fig. 8. Raman images (contour maps) displaying the distribution of constituents of (A) Membrane I: (i) Cer
[AP], (ii) Chol, (iii) PA and (iv) ChS; and (B) Membrane II: (i) Cer [AP], (ii) Cer [EOS], (iii) Chol and (iv) PA. A
normalized integrated intensity of lipids’ specific bands is color-coded.
3.3. Diffusion of urea examined using the ATR-FTIR diffusion cell
Fig. 9 shows the ATR-FTIR spectra of the water solution of urea in the range 1350–
1900 cm-1 acquired in the time course of the diffusion process with indicated urea-specific
IR band at 1466 cm-1, i.e. ν(CN). At the beginning of the diffusion process, the IR spectrum
of the pure acceptor phase (distilled water) was observed. With the elapsing time of the
experiment, the absorbance of the urea-specific IR bands increased. A concentration of
urea in the acceptor phase was calculated using the multivariate analysis Quant2 OPUS
software in the spectral range from 1017 to 3718 cm-1. The diffusion profiles of urea are
presented in Fig. 10. As can be clearly seen in this figure, the diffusion profiles of urea
through the isolated human SC and Membrane I are not alike. In the case of the artificial
lipid membrane, the diffusion was much slower with a well indicated lag time.
Fig. 9. IR spectra of the water solution of urea in the range 1350-1900 cm
-1 with indicated urea-specific IR
band at 1466 cm-1
. The spectra were acquired in the time course of the diffusion process.

Chapter 5 Characterization of lipid model membranes 60
The physical properties and permeability parameters of urea are summarized in
Table 1. The lag time (TL) in the case of the native SC was much shorter than the TL value
of Membrane I, whereas the steady state flux (Jss) and the permeability coefficient (kp) of
the model membrane were two times lower than the corresponding values in the case of
the SC. The values of the diffusion coefficient (D) of urea for the native and the model
membrane differed significantly. The D value of urea in the case of the human SC was
higher than the D of urea for Membrane I by a factor of 100 and was lower than the D
values of urea for the human SC reported by Guenther et al. [23] and Hartmann et al. [21]
by a factor of 23 and 55, respectively. The differences in the D values in the case of the
human SC are most likely caused by high inter- and intra-variability of the human SC
samples [1]. The low D values, both for the SC and Membrane I, show that the diffusion of
urea (small hydrophilic molecule) through the lipophilic membranes is a slow process.
Both membranes represent a strong diffusion barrier for small hydrophilic substances,
such as urea. From all permeability results, it can be concluded that the artificial lipid
membrane, i.e. Membrane I, represents the stronger diffusion barrier than the native SC.
It has to be stressed once more that the model lipid membranes used in this study were
very simple systems when compared to the SC. It seems that the artificial lipid membrane
containing Cer [AP] had tighter structure than the human SC and, therefore, showed very
strong barrier properties for hydrophilic compounds, such as urea.
Fig. 10. Concentration of urea permeated through the human SC (two female donors; samples taken from
abdomen, thigh and back) and Membrane I. Error bars show the standard deviation (n = 3).

Chapter 5 Characterization of lipid model membranes 61
Table 1 Physical properties and permeability parameters of urea – in vitro study.
Parameter
Urea
human SC Cer [AP]/Chol/PA/ChS
Molar mass [g/mol] 60.06
log P -2.11
pKa (25°C) 0.18
Jss [μg/(cm2h)] 7.90 ± 4.97 (E+02) 3.77 ± 0.47 (E+02)
TL [h] 2.95 ± 0.88 (E-01) 1.84 ± 0.34 (E+01)
kp [cm/h] 7.90 ± 4.97 (E-03) 3.77 ± 0.47 (E-03)
D [cm2/h] 4.40 ± 2.56 (E-08) 4.04 ± 0.64 (E-10)
Km/d 1.62 ± 0.36 (E+02) 2.86 ± 0.60 (E+03)
Permeability data represent MEAN ± SD (n = 3).
4. Conclusions
To sum up, it has been shown in this study that the lipid model membranes
prepared using a described preparation method are reproducible and of good quality. The
microscopic techniques confirmed that the lipids deposited on the polycarbonate filter
formed a continuous lipid layer covering the whole sprayed area of the filter. The HPTLC
and confocal Raman imaging experiments confirmed the uniform distribution of the
individual lipid species on the filter. From the SAXD results, it can be concluded that the
lipids formed the lamellar structure with two present lamellar phases. The diffusion
studies using small hydrophilic compound (i.e. urea) revealed that the artificial lipid
system used in the experiment (i.e. Membrane I) showed very strong barrier properties,
even stronger than the isolated human SC, which can be ascribed to its very simplistic
composition, when compared to a very complex structure of the native SC. Proposed
approach with simple lipid model systems can be used in the future to study the impact
of the different ceramide species on the diffusion and penetration of drugs and other
substances of interest.
Acknowledgements
A scholarship granting for Michal Ochalek by the “Graduiertenförderung des Landes
Sachsen-Anhalt” is gratefully appreciated. The authors would like to thank Frank
Syrowatka for his cooperation and support with the ESEM measurements.

Chapter 5 Characterization of lipid model membranes 62
References
[1] P.W. Wertz, B. van den Bergh, The physical, chemical and functional properties of lipids in the skin and other
biological barriers, Chem. Phys. Lipids 91 (1998) 85-96.
[2] J.A. Bouwstra, A. de Graaff, G.S. Gooris, J. Nijsse, J.W. Wiechers, A.C. van Aelst, Water distribution and related
morphology in human stratum corneum at different hydration levels, J. Invest. Dermatol. 120 (2003) 750-758.
[3] M.L. Williams, P.M. Elias, The extracellular matrix of stratum corneum: role of lipids in normal and pathological
function, Crit. Rev. Ther. Drug Carrier Syst. 3 (1987) 95-122.
[4] N.Y. Schurer, G. Plewig, P.M. Elias, Stratum corneum lipid function, Dermatologica 183 (1991) 77-94.
[5] L. Coderch, O. Lopez, A. de la Maza, J.L. Parra, Ceramides and skin function, Am. J. Clin. Dermatol. 4 (2003) 107-
129.
[6] J. van Smeden, L. Hoppel, R. van der Heijden, T. Hankemeier, R.J. Vreeken, J.A. Bouwstra, LC/MS analysis of
stratum corneum lipids: ceramide profiling and discovery, J. Lipid Res. 52 (2011) 1211-1221.
[7] S. Raudenkolb, S. Wartewig, R.H.H. Neubert, Polymorphism of ceramide 6: A vibrational spectroscopic and X-ray
powder diffraction investigation of the diastereomers of N-(alpha-hydroxyoctadecanoyl)-phytosphingosine,
Chem. Phys. Lipids 133 (2005) 89-102.
[8] M.A. Kiselev, N.Y. Ryabova, A.M. Balagurov, S. Dante, T. Hauss, J. Zbytovska, S. Wartewig, R.H.H. Neubert, New
insights into the structure and hydration of a stratum corneum lipid model membrane by neutron diffraction, Eur.
Biophys. J. 34 (2005) 1030-1040.
[9] M.A. Kiselev, Conformation of ceramide 6 molecules and chain-flip transitions in the lipid matrix of the outermost
layer of mammalian skin, the stratum corneum, Crystallogr. Rep. 52 (2007) 525-528.
[10] D. Kessner, M.A. Kiselev, S. Dante, T. Hauss, P. Lersch, S. Wartewig, R.H.H. Neubert, Arrangement of ceramide
[EOS] in a stratum corneum lipid model matrix: new aspects revealed by neutron diffraction studies, Eur. Biophys.
J. 37 (2008) 989-999.
[11] A. Schroeter, D. Kessner, M.A. Kiselev, T. Hauss, S. Dante, R.H.H. Neubert, Basic nanostructure of stratum
corneum lipid matrices based on ceramides [EOS] and [AP]: a neutron diffraction study, Biophys. J. 97 (2009)
1104-1114.
[12] A. Schroeter, M.A. Kiselev, T. Hauss, S. Dante, R.H.H. Neubert, Evidence of free fatty acid interdigitation in stratum
corneum model membranes based on ceramide [AP] by deuterium labelling, Biochim. Biophys. Acta,
Biomembranes 1788 (2009) 2194-2203.
[13] M.W. de Jager, G.S. Gooris, I.P. Dolbnya, M. Ponec, J.A. Bouwstra, Modelling the stratum corneum lipid
organisation with synthetic lipid mixtures: the importance of synthetic ceramide composition, Biochim. Biophys.
Acta, Biomembranes 1664 (2004) 132-140.
[14] M.W. de Jager, G.S. Gooris, M. Ponec, J.A. Bouwstra, Lipid mixtures prepared with well-defined synthetic
ceramides closely mimic the unique stratum corneum lipid phase behavior, J. Lipid Res. 46 (2005) 2649-2656.
[15] M.W. de Jager, W. Groenink, R. Bielsa i Guivernau, E. Andersson, N. Angelova, M. Ponec, J.A. Bouwstra, A novel in
vitro percutaneous penetration model: evaluation of barrier properties with p-aminobenzoic Acid and two of its
derivatives, Pharm. Res. 23 (2006) 951-960.
[16] D. Groen, G.S. Gooris, J.A. Bouwstra, New Insights into the Stratum Corneum Lipid Organization by X-Ray
Diffraction Analysis, Biophys. J. 97 (2009) 2242-2249.
[17] T. Engelbrecht, T. Hauss, K. Sueβ, A. Vogel, M. Roark, S.E. Feller, R.H.H. Neubert, B. Dobner, Characterisation of a
new ceramide EOS species: synthesis and investigation of the thermotropic phase behaviour and influence on the
bilayer architecture of stratum corneum lipid model membranes, Soft Matter. 7 (2011) 8998-9011.
[18] J.A. Bouwstra, M. Ponec, The skin barrier in healthy and diseased state, Biochim. Biophys. Acta, Biomembranes
1758 (2006) 2080-2095.

Chapter 5 Characterization of lipid model membranes 63
[19] H. Farwanah, R.H.H. Neubert, S. Zellmer, K. Raith, Improved procedure for the separation of major stratum
corneum lipids by means of automated multiple development thin-layer chromatography, J. Chromatogr. B: Anal.
Technol. Biomed. Life Sci. 780 (2002) 443-450.
[20] A. Opitz, M. Wirtz, D. Melchior, A. Mehling, H. Kling, R.H.H. Neubert, Improved Method for Stratum Corneum Lipid
Analysis by Automated Multiple Development HPTLC, Chromatographia 73 (2011) 559-565.
[21] M. Hartmann, B.D. Hanh, H. Podhaisky, J. Wensch, J. Bodzenta, S. Wartewig, R.H.H. Neubert, A new FTIR-ATR cell
for drug diffusion studies, Analyst 129 (2004) 902-905.
[22] U. Guenther, I. Smirnova, R.H.H. Neubert, Hydrophilic silica aerogels as dermal drug delivery systems - Dithranol
as a model drug, Eur. J. Pharm. Biopharm. 69 (2008) 935-942.
[23] U. Guenther, M. Hartmann, S. Wartewig, R.H.H. Neubert, Diffusion of urea through membranes, Diffusion
Fundamentals 4 (2006) 4.1-4.5.
[24] A.M. Kligman, E. Christophers, Preparation of isolated sheets of human stratum corneum, Arch. Dermatol. 88
(1963) 702-705.
[25] A. Ruettinger, M.A. Kiselev, T. Hauss, S. Dante, A.M. Balagurov, R.H.H. Neubert, Fatty acid interdigitation in
stratum corneum model membranes: a neutron diffraction study, Eur. Biophys. J. 37 (2008) 759-771.

64
Chapter 6
SC lipid model membranes designed for studying impact of ceramide
species on drug diffusion and permeation, Part II: Diffusion and
permeation of model drugs
M. Ochalek a, H. Podhaisky b, H.-H. Ruettinger a,
J. Wohlrab c, R.H.H. Neubert a
a Institute of Pharmacy, Martin Luther University, Halle (Saale), Germany
b Institute of Mathematics, Martin Luther University, Halle (Saale), Germany
c Department of Dermatology and Venereology, Martin Luther University, Halle (Saale), Germany
(adapted from Eur. J. Pharm. Biopharm. (2012) doi: 10.1016/j.ejpb.2012.06.008)
Abstract
The barrier function of two quaternary stratum corneum (SC) lipid model membranes,
which were previously characterized with regard to the lipid organization, was
investigated based on diffusion studies of model drugs with varying lipophilicities.
Diffusion experiments of a hydrophilic drug, urea, and more lipophilic drugs than urea
(i.e. caffeine, diclofenac sodium), were conducted using Franz-type diffusion cells. The
amount of permeated drug was analyzed using either HPLC or CE technique. The subjects
of interest in the present study were the investigation of the influence of physicochemical
properties of model drugs on their diffusion and permeation through SC lipid model
membranes, as well as the study of the impact of the constituents of these artificial
systems (particularly ceramide species) on their barrier properties. The diffusion through
both SC lipid model membranes and the human SC of the most hydrophilic model drug,
urea, was faster than the permeation of the more lipophilic drugs. The slowest rate of
permeation through SC lipid systems occurred in the case of caffeine. The composition of
SC lipid model membranes has a significant impact on their barrier function. Model drugs
diffused and permeated faster through Membrane II (presence of Cer [EOS]). In terms of
the barrier properties, Membrane II is much more similar to the human SC than
Membrane I.
Chapter 6 Diffusion and permeation of model drugs 65
1. Introduction
The outermost layer of the skin, the stratum corneum (SC) is considered as the main
penetration barrier for topically administered drugs and other substances (e.g. water) [1].
It is composed of 10 to 25 layers of parallel to the skin surface anucleated dead cells
(corneocytes) embedded in a lipid matrix and ranges from 10 to 15 μm in thickness in a
dry state, however swells to several times this thickness in a fully hydrated state [2]. Since
the intercellular route of transport through the normal intact SC is thought to be the most
preferable one, of special interest is the organization of the SC intercellular lipid matrix
[3]. In comparison to other biological membranes, the SC does not contain phospholipids.
The main lipid classes in the SC intercellular lipid matrix are ceramides (Cer), free fatty
acids (FFA), cholesterol (Chol) and its derivatives organized in lamellar phases [4-7]. Cer
are regarded as fundamental compounds in functioning of the SC barrier [8]. To date, the
existence of 12 subclasses of Cer isolated from the human SC has been reported [9]. From
former studies, it is known that the constituents of the SC intercellular lipid matrix, which
influence to a high degree the internal membrane structure formation and the barrier
properties of the SC are: Cer [AP] (due to its head group polarity) and the acylceramide,
Cer [EOS] [10-13]. In order to characterize the SC lipid organization, an approach with
native SC lipids isolated from the mammalian skin was formerly used [14-18].
Nevertheless, to understand the role of each individual lipid species in the functioning
and maintaining of the SC barrier, a new approach with well-defined artificial SC lipid
membranes produced as oriented multilamellar systems has been introduced [11, 13, 19-
21]. These studies, however, were focused on investigating the relation between lipid
composition and the SC lipid system organization. No information about the SC barrier
function was acquired. The lipid organization–barrier function relationship was
investigated elsewhere [22-24]. The lipid systems used in those studies, however, were
much more complex and consisted of a number of Cer, FFA and Chol. In such complex
model systems, occurring alterations in the SC barrier function cannot be entirely
attributed to one lipid, but may be a result of interactions between different subspecies
of lipids. Therefore, the elucidation of the impact of each lipid compound, particularly the
different ceramide species, on the diffusion and penetration of drugs for such model
systems may be, in our opinion, complicated.
In the present study, the barrier properties of two quaternary lipid model
membranes (composed of i.a. Cer [AP] and Cer [EOS]) were investigated. As mentioned
above, use of such elementary systems facilitates studying the influence of individual lipid

Chapter 6 Diffusion and permeation of model drugs 66
species (e.g. various ceramide species), on the diffusion, penetration and permeation of
drugs and other substances of interest. In our previous study, these two lipid model
membranes were characterized in terms of the lipid organization using various analytical
techniques (i.a. SAXD, HPTLC, ESEM, confocal Raman imaging) [25]. It was confirmed that
the lipid model systems could have been prepared in a standardized way with regard to
the lipid distribution and organization. Therefore, they are suitable model membranes to
be tested and to be compared with the human SC in the diffusion and penetration
studies. In the present study, the barrier properties of these systems were investigated by
means of a comparison of diffusion and permeation of three substances with varying
lipophilicities (i.e. urea, caffeine and diclofenac sodium) across SC lipid model membranes
and the human SC isolated from the full thickness skin. The diffusion studies were
conducted using Franz-type diffusion cells. The amount of permeated drug was analyzed
using high performance liquid chromatography (HPLC) or conventional capillary
electrophoresis (CE) technique. A mathematical model was developed to fit the diffusion
profiles of model drugs and to estimate their diffusion coefficients.
2. Materials and methods
2.1. Materials
Synthetic Cer [EOS] and Cer [AP] were generously provided by Evonik Goldschmidt
(Essen, Germany). Palmitic acid, sodium cholesteryl sulfate, caffeine, diclofenac sodium
salt and urea were purchased from Sigma-Aldrich Chemie GmbH (Steinheim, Germany)
and cholesterol from Sigma Chemical CO. (St. Louis, USA). Methanol, ethanol, chloroform,
acetonitrile, formic acid and n-hexane were obtained from Merck (Darmstadt, Germany).
Urease (from jack beans, 9.0 U mg-1) was purchased from Fluka (Buchs, Switzerland).
Nuclepore polycarbonate membrane filters (diameter 25 mm, pore size 50 nm) were
purchased from Whatman (Kent, UK). Solvents used for the sample preparation and
analytical procedures were of analytical grade.
2.2. Preparation of model lipid membranes
For the preparation of SC lipid model membranes, two compositions of a lipid
mixture were used, namely: Cer [AP]/Chol/PA/ChS in the ratio 55/25/15/5 (m/m),
referred to as Membrane I, and Cer [AP]/Cer [EOS]/Chol/PA in the ratio 10/23/33/33

Chapter 6 Diffusion and permeation of model drugs 67
(m/m), referred to as Membrane II. The SC lipids used for the preparation of the lipid
model membranes are presented in Fig. 1. Appropriate amounts of individual lipids were
dissolved in a mixture of chloroform/methanol (2/1, v/v). Following the evaporation of
the organic solvents under a stream of nitrogen, the lipids were re-dissolved in a mixture
of n-hexane/ethanol (2/1, v/v) at a total lipid concentration of 5 mg/ml. Automatic TLC
Sampler 4 (Camag, Muttenz, Switzerland) with a specially built holder was used to apply
the lipid mixtures onto porous membrane filters. The spraying of lipids was performed at
a very low flow rate (80 nl/s) and under a stream of nitrogen. The sprayed area amounted
to 169 mm2 and the volume of lipid solution used was 100 µl. Afterward, an annealing
procedure was carried out in order to enhance the multilamellar orientation of lipids and
to decrease the mosaicity of samples. It consisted of a heating step (30 min at 80 °C or 70
°C in the case of Membrane I and Membrane II, respectively) and a subsequent cooling
down step (to room temperature) at 100% relative humidity.
Fig. 1. Chemical structures of constituents of lipid model membranes.
2.3. Diffusion and permeation studies
In vitro diffusion and permeation experiments were carried out using Franz-type
diffusion cells (Rettberg, Goettingen, Germany). As model drugs, 2% (m/m) solution of
caffeine, 0.1% (m/m) solution of diclofenac sodium and 10% (m/m) solution of urea were
used. The specified concentrations of model drugs were used in order to provide infinite
dose conditions (i.e. the concentration of the model drug in the donor phase should not
diminish significantly in the course of the experiment), as well as due to analytical
reasons. Under the conditions of an infinite dose, the steady-state phase can be reached
and maintained, which enables the calculation of permeability parameters [26].

Chapter 6 Diffusion and permeation of model drugs 68
Moreover, the mathematical model developed for the purpose of this study is only valid
for infinite dose conditions. All solutions were prepared in phosphate-buffered saline
(PBS, pH 7.4: NaCl, KCl, Na2HPO4 and KH2PO4 in water in concentrations 8.0, 0.2, 1.44 and
0.24 g/l, respectively). For diffusion experiments with urea, PBS solution without
potassium ions was used (due to the analytical procedure of the urea determination in
the acceptor phase). The chemical structures of model drugs are presented in Fig. 2 and
their physicochemical properties are summarized in Table 1 (the pKa and log P values
were either adapted from [27, 28] or estimated using ChemAxon’s Marvin software).
Table 1 Physicochemical properties of model drugs.
Parameter Molar mass [g/mol] log P pKa (25 °C)
Urea 60.06 -2.11 0.18
Caffeine 194.19 -0.07 1.4
Diclofenac sodium 318.14 4.28 4.0
For all diffusion and permeation studies, the donor compartment was filled with 1
ml of the model drug solution in PBS. As the acceptor phase, approx. 5 ml of PBS (pH 7.4)
were used. A magnetic bar stirred the acceptor phase throughout the time of
experiments. At predetermined points in time, the samples were collected from the
acceptor compartment and subsequently quantitatively analyzed using a specific
analytical procedure developed for each drug. The removed volume of the acceptor
phase was replaced with fresh PBS solution. All diffusion and permeation experiments
were conducted under occlusive conditions (the opening of the donor compartment was
closed with adhesive tape). During diffusion and permeation studies, the model
membranes were kept at 32 °C by use of thermostated water baths in order to mimic the
in vivo conditions. As model membranes, human SC and artificial lipid systems,
Membrane I and Membrane II, were used. The full thickness human skin was acquired
after cosmetic surgery from two Caucasian female donors (samples were taken from
back, abdomen and thigh). Prior to the isolation of the SC, the subcutaneous fat tissue
was dissected from the skin samples. The SC was isolated according to the method
depicted by Kligman and Christophers [29]. To separate the SC from the epidermis, the
skin samples were incubated in 0.1% trypsin solution (in PBS, pH 7.4) for 12–24 h at 32 °C.
The isolated SC samples were stored at –26 °C until use. The protocol of this study was

Chapter 6 Diffusion and permeation of model drugs 69
approved by the ethics committee of the Martin Luther University Halle-Wittenberg
(Germany).
Fig. 2. Chemical structures of model drugs.
2.4. Analytics
The amount of caffeine in the acceptor compartment was analyzed by means of a
HPLC method using Agilent 1100 LC System (Agilent, Waldbronn, Germany) equipped
with a vacuum degasser, a binary pump, an autosampler and a diode array detector. A
stationary phase used was: Eurospher 100-5-RP18 column with dimensions: 100 x 2 mm
(Knauer, Berlin, Germany) maintained at a temperature of 30 °C. An isocratic mixture of
water/methanol (60/40, v/v) was used as a mobile phase. The flow rate of the mobile
phase amounted to 0.2 ml min-1 and the injection volume of each sample was 5 µl. The
detection of caffeine was performed at a wavelength of 273 nm (its maximal absorption).
The limit of quantification was 0.07 µg ml-1.
The quantitative analysis of diclofenac sodium was performed using the same HPLC
system, as depicted earlier for the caffeine determination in the acceptor phase. Nucleosil
C8 column with dimensions: 125 x 2 mm (Macherey-Nagel GmbH & Co. KG, Dueren,
Germany) kept at a temperature of 30°C was used as a stationary phase. An isocratic
mobile phase consisted of 0.1 % formic acid in a mixture of water/acetonitrile (50/50, v/v)
and its flow rate amounted to 0.2 ml min-1. 5 µl of each sample were injected into the
HPLC column and the detection was carried out at a wavelength of 278 nm. The limit of
quantification was 0.2 µg ml-1.
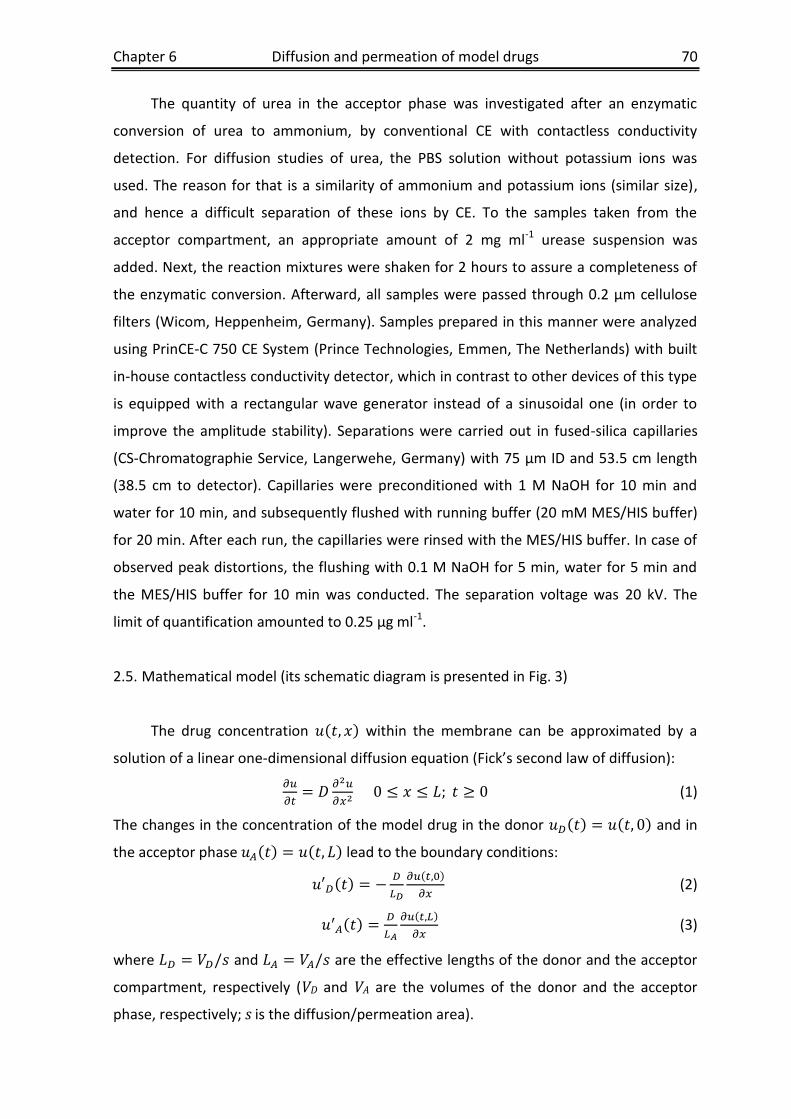
Chapter 6 Diffusion and permeation of model drugs 70
The quantity of urea in the acceptor phase was investigated after an enzymatic
conversion of urea to ammonium, by conventional CE with contactless conductivity
detection. For diffusion studies of urea, the PBS solution without potassium ions was
used. The reason for that is a similarity of ammonium and potassium ions (similar size),
and hence a difficult separation of these ions by CE. To the samples taken from the
acceptor compartment, an appropriate amount of 2 mg ml-1 urease suspension was
added. Next, the reaction mixtures were shaken for 2 hours to assure a completeness of
the enzymatic conversion. Afterward, all samples were passed through 0.2 µm cellulose
filters (Wicom, Heppenheim, Germany). Samples prepared in this manner were analyzed
using PrinCE-C 750 CE System (Prince Technologies, Emmen, The Netherlands) with built
in-house contactless conductivity detector, which in contrast to other devices of this type
is equipped with a rectangular wave generator instead of a sinusoidal one (in order to
improve the amplitude stability). Separations were carried out in fused-silica capillaries
(CS-Chromatographie Service, Langerwehe, Germany) with 75 µm ID and 53.5 cm length
(38.5 cm to detector). Capillaries were preconditioned with 1 M NaOH for 10 min and
water for 10 min, and subsequently flushed with running buffer (20 mM MES/HIS buffer)
for 20 min. After each run, the capillaries were rinsed with the MES/HIS buffer. In case of
observed peak distortions, the flushing with 0.1 M NaOH for 5 min, water for 5 min and
the MES/HIS buffer for 10 min was conducted. The separation voltage was 20 kV. The
limit of quantification amounted to 0.25 µg ml-1.
2.5. Mathematical model (its schematic diagram is presented in Fig. 3)
The drug concentration ( ) within the membrane can be approximated by a
solution of a linear one-dimensional diffusion equation (Fick’s second law of diffusion):
(1)
The changes in the concentration of the model drug in the donor ( ) ( ) and in
the acceptor phase ( ) ( ) lead to the boundary conditions:
( )
( )
(2)
( )
( )
(3)
where and are the effective lengths of the donor and the acceptor
compartment, respectively (VD and VA are the volumes of the donor and the acceptor
phase, respectively; s is the diffusion/permeation area).

Chapter 6 Diffusion and permeation of model drugs 71
Fig. 3. A schematic diagram of the mathematical model.
The initial conditions are given by Eq. (4) and Eq. (5):
( ) (4)
( ) ( ) (5)
where ( ) is the initial drug concentration in the donor compartment.
Replacement of the spatial derivatives in Eq. (1) by standard central differences leads to a
linear system of ordinary differential equations:
( ) ( ) (6)
with a constant matrix M, where ( ) stands for a vector of concentrations in the
membrane at some (numerical) grid points. The velocity of the drug permeation through
the membrane is determined by the slowest eigenmode of M corresponding to the
eigenvalue λ1. We can therefore fit the model given by Eq. (7):
( ) ( ( )) (7)
to the experimental data and obtain an estimate for the diffusion coefficient by:
. The eigenvalue λ1 depends on the geometry (L, LD and LA) of the
configuration. Its value can be computed using the NumPy package.
The other permeability parameters were acquired from plots of the cumulative
permeated amount per cm2 versus time. The steady-state flux (J) is the slope of the linear
part of the plot, whereas the lag-time (TL) is determined from the intercept of this linear
part of the plot with the time-axis. The permeability coefficient (kp) is computed using
equation: ( ).
Comparisons of the estimated permeability parameters were performed using one-
way analysis of variance (ANOVA) followed by Tukey’s test (post hoc analysis).
Significance was accepted when p < 0.05.

Chapter 6 Diffusion and permeation of model drugs 72
3. Results and discussion
3.1. Influence of physicochemical properties of drugs on the diffusion across SC lipid
model membranes
To estimate the influence of physicochemical characteristics of drugs on their
diffusion through SC membranes, the diffusion and permeation of three model drugs
covering a broad range of lipophilicities (Table 1) across SC lipid model membranes and
the human SC were investigated. Moreover, the other important factor which can affect
the rate of diffusion and permeation of substances of interest is their molecular weight. In
the present study, diffusion and permeation of model drugs with varying molecular
weight were examined, starting with a smallest compound (urea), a medium one
(caffeine) and ending with a largest one (diclofenac sodium).
Fig. 4 shows diffusion and permeation profiles of model drugs with the model
fittings across Membrane I (A), Membrane II (B) and the human SC (C). The figure clearly
shows that the diffusion of urea was much faster than the permeation of caffeine and the
slowest rate of permeation occurred in the case of diclofenac sodium. The relationship
observed is characteristic for all membranes investigated (artificial lipid membranes and
native SC). The values of steady-state flux, lag-time, permeability coefficient and diffusion
coefficient are presented in Table 2.
In the present study, the impact of physicochemical properties of drugs on their
diffusion and permeation behavior was investigated. Three model drugs with different
lipophilicities (namely, urea with log P of –2.11, caffeine with log P of –0.07 and
diclofenac sodium with log P of 4.28, where log P stands for log partition coefficient
value) were selected to examine the influence of the partitioning characteristics of drugs
on the rate of diffusion. It is generally suggested, because of the lipophilic character of
the SC intercellular matrix, that the more lipophilic a drug is, the faster should it permeate
through the SC. It can be clearly seen in Fig. 4A–C that urea, which is a representative of
the hydrophilic drug, diffused through both artificial lipid membranes and the human SC
faster than the more lipophilic molecule, caffeine, and much faster than the most
lipophilic drug, diclofenac sodium. A comparison of permeability parameters shows that
the steady-state flux of urea was ~ 23 times larger than J of caffeine and ~ 194 times
larger than J of diclofenac sodium in the case of Membrane I. For Membrane II, J of urea
was ~ 51-fold and ~ 849-fold larger than the corresponding values of caffeine and
diclofenac sodium, respectively. A similar relationship applies for the J values in the case
Chapter 6 Diffusion and permeation of model drugs 73
of the diffusion across the human SC, where J of urea was ~ 21 times and over 5000 times
larger than the J of caffeine and diclofenac sodium, respectively. The permeability
coefficient of urea in the case of Membrane I was higher than kp of caffeine and
diclofenac sodium by a factor of ~ 5 and 2, respectively. For Membrane II, kp of urea was
~ 11 times and ~ 9 times larger than kp of caffeine and diclofenac sodium, respectively.
In the case of the human SC, kp of urea was higher than the corresponding values of
caffeine and diclofenac sodium by a factor of ~ 4 and ~ 53, respectively. A comparison of
diffusion coefficient values shows that D of urea for Membrane I was ~ 11-fold and ~ 4-
fold larger than D of caffeine and diclofenac sodium, respectively. In the case of
Membrane II, a similar relationship was observed, namely D of urea was higher than D of
caffeine and diclofenac sodium by a factor of ~ 10 and ~ 8, respectively. For the human
SC, D of urea was ~ 4 times and ~ 50 times larger than D of caffeine and diclofenac
sodium, respectively.
The D values in the case of permeation of caffeine and diclofenac sodium through
the human SC (0.66 x 10⁻⁷ cm2 s-1 and 5.4 x 10⁻⁹ cm2 s-1, respectively) are in good
agreement with the previously published D values of caffeine (1.4 x 10⁻⁷ cm2 s-1 [30], 1.03
x 10-7 cm2 s-1 [31]) and diclofenac in the nonionized form (9.65 x 10⁻⁹ cm2 s-1 [31]). The D
of urea in the case of diffusion across the human SC (2.71 x 10⁻⁷ cm2 s-1) is significantly
larger than previously reported D values for urea (6.68 x 10⁻¹⁰ cm2 s-1 [32], 2.85 x 10⁻¹⁰ cm2
s-1 [33], 0.12 x 10⁻¹⁰ cm2 s-1 [25]). The reason for that is most likely the use of different
instrumentation in the previous diffusion studies, namely the ATR-FTIR diffusion cell,
associated with the different analytical method of urea amount determination in the
acceptor phase (i.e. ATR-FTIR spectroscopy in the previous studies, HPLC in the present
study). When comparing the lag-times, it can be clearly seen that the differences in the
mean values of TL in some cases are not significant. TL of urea in the case of Membrane I
was ~ twice shorter than TL of caffeine, whereas TL of both caffeine and diclofenac
sodium and urea and diclofenac sodium were not significantly different (α = 0.05). For
Membrane II, the differences in TL of urea and caffeine were not significant (α = 0.05) and
their values can be assumed to equal 0. On the other hand, TL of diclofenac sodium was ~
1.2 h and ~ 0.6 h longer than TL of urea and caffeine, respectively. A similar relation holds
for diffusion and permeation across the human SC, where, on the one hand, TL of urea
and caffeine were different, however, for both drugs had negative values which means
there was no lag-time at all. TL of diclofenac sodium was ~ 1.7 h and 0.7 h longer than TL
of urea and caffeine, respectively.

Chapter 6 Diffusion and permeation of model drugs 74
Fig. 4. Diffusion and permeation through the model lipid membranes, (A) Membrane I and (B) Membrane
II, and (C) the human SC (data shown with mathematical model fittings). Error bars show the standard
deviation (n = 4).
From the diffusion and permeation profiles of three model drugs and their
permeability parameters, it can be concluded that the most hydrophilic one, urea, is
characterized by the fastest diffusion through both SC lipid model membranes and the
human SC. One possible explanation of this phenomenon can be the molecular weight of
urea, which is much smaller when compared to the more lipophilic drugs (i.e. caffeine and

Chapter 6 Diffusion and permeation of model drugs 75
diclofenac sodium). From the Stokes-Einstein relation: ( ), where kB is the
Boltzmann’s constant, T is the absolute temperature, η is the medium’s viscosity and r is
the radius of a spherical diffusing molecule, it is known that D of the diffusing species is
inversely proportional to its radius [34]. Assuming the proportionality of the molecular
weight of the molecule to its volume and taking into account the differences in the molar
mass of used model drugs, the expected D values of urea, caffeine and diclofenac sodium
should occur in descending order. This relation is true for urea, however it does not apply
for other two model drugs in the case of SC lipid model membranes, where D and kp
values of diclofenac sodium are larger than the corresponding values of caffeine. The
other possible explanation for urea’s diffusion behavior can be its permeation enhancing
potential. Urea is a well-known penetration enhancer for the hydrophilic pathway and its
activity probably results from its keratolytic as well as hydrating properties [35-37]. The
mentioned permeation enhancing activity can be responsible for the acceleration of the
diffusion of urea across SC lipid model membranes and the human SC. The larger values
of D and kp of diclofenac sodium in the case of permeation across Membrane I and
Membrane II, when compared to D and kp values of caffeine, may result from their
distinct partitioning characteristics. On the one hand, diclofenac sodium molecule has a
larger molecular weight than caffeine molecule; on the other hand, the latter is much less
lipophilic than diclofenac sodium. This results in slightly larger values of D and kp in favor
of diclofenac sodium. The larger as expected differences between the D values of caffeine
and diclofenac sodium in the case of the human SC can be caused by high inter- and intra-
variability of the human SC samples [1].
Table 2 Permeability parameters of urea, caffeine and diclofenac sodium – in vitro study.
Parameter J [mg cm-2
h-1
] TL [h] kp [cm h-1
] D [x 10-8
cm2
s-1
]
Urea
SC 42.23 ± 1.66 -1.01 ± 0.24 0.42 ± 0.02 27.14 ± 7.16
Membrane I 1.36 ± 0.13 2.88 ± 1.13 0.014 ± 0.001 0.25 ± 0.13
Membrane II 19.52 ± 1.53 -0.47 ± 0.50 0.20 ± 0.02 1.59 ± 0.16
Caffeine
SC 2.00 ± 1.12 -0.01 ± 0.15 0.10 ± 0.06 6.58 ± 4.02
Membrane I 0.06 ± 0.01 5.89 ± 1.12 0.003 ± 0.001 0.023 ± 0.006
Membrane II 0.38 ± 0.04 0.15 ± 0.26 0.019 ± 0.002 0.16 ± 0.02
Diclofenac sodium
SC 0.008 ± 0.004 0.73 ± 0.94 0.008 ± 0.004 0.54 ± 0.69
Membrane I 0.007 ± 0.002 3.56 ± 1.69 0.007 ± 0.002 0.060 ± 0.014
Membrane II 0.023 ± 0.001 0.77 ± 0.23 0.023 ± 0.001 0.19 ± 0.01
Permeability data represent MEAN ± SD (n = 4).

Chapter 6 Diffusion and permeation of model drugs 76
3.2. Influence of the composition of SC lipid model membranes on their barrier function
To investigate the impact of the composition of SC lipid model systems on their
barrier properties, the diffusion and permeation of three model drugs across Membrane I
and Membrane II were analyzed, and subsequently compared with their diffusion and
permeation through the human SC.
Fig. 5 presents diffusion and permeation profiles of urea (A), caffeine (B) and
diclofenac sodium (C) (and their model fittings) across SC lipid model membranes and the
human SC. The values of permeability parameters of model drugs are listed in Table 2. It
can be clearly seen in Fig. 5A that urea diffused faster across the human SC when
compared to its diffusion through SC lipid model membranes. The slowest rate of
diffusion occurred in the case of Membrane I. The steady-state flux of urea in the case of
the human SC was ~ twice and ~ 31 times larger than J in the case of diffusion through
Membrane II and Membrane I, respectively. The same ratio applies for a comparison of
the values of the permeability coefficient of urea. In the case of diffusion across the
human SC, the diffusion coefficient of urea was higher by a factor of ~ 17 and ~ 109 than
D of urea for Membrane II and Membrane I, respectively. Fig. 5A clearly shows that for
the diffusion profiles of urea across the human SC and Membrane II, no lag phase was
observed. The values of TL for the human SC and Membrane II are both negative and not
significantly different (α = 0.05). The lag phase of urea in the case of Membrane I, on the
other hand, was well pronounced and its TL was ~ 3.4–3.9 h longer than for the other
two membranes.
A similar relationship, as presented for the diffusion of urea, was also observed in
the case of permeation of caffeine across both the human SC and SC lipid model
membranes (Fig. 5B). The fastest rate of permeation of caffeine occurred for the human
SC and the slowest one for Membrane I. Both the steady-state flux and the permeability
coefficient of caffeine in the case of the human SC were ~ 5-fold and ~ 33-fold larger
than J and kp for permeation through Membrane II and Membrane I, respectively. A
comparison of diffusion coefficient values shows that D of caffeine for the human SC was
~ 41 times and ~ 286 times larger than the corresponding values in the case of
permeation across Membrane II and Membrane I, respectively. The differences in the lag-
times of caffeine for the human SC and Membrane II were not significant (α = 0.05) and
the values of TL were close to 0. On the contrary, TL of caffeine in the case of permeation
across Membrane I was ~ 6 h longer than for the other membranes. Surprisingly, in the
case of permeation of diclofenac sodium, the fastest rate of permeation occurred for the

Chapter 6 Diffusion and permeation of model drugs 77
experiments with Membrane II. The permeation profiles of diclofenac sodium across the
human SC and Membrane I are similar (Fig. 5C). Their similarity is emphasized by the
same values of J and kp for these two membranes (α = 0.05). The values of J and kp of
diclofenac sodium in the case of permeation through Membrane II were higher than for
the other membranes by a factor of ~ 3. The differences in the values of the diffusion
coefficient of diclofenac sodium in the case of diffusion across the human SC and both
Membrane I and Membrane II were not significant (α = 0.05). On the other hand, D of
diclofenac sodium for Membrane II was ~ 3 times larger than D for Membrane I. The lag-
time of diclofenac sodium in the case of Membrane II was slightly longer than TL for the
human SC. The longest lag phase occurred in the case of permeation across Membrane I
(i.e. ~ 2.8 h longer TL than for the other membranes).
Based on the results presented, it can be assumed that the composition of SC lipid
model membranes influences to a high degree their barrier properties. A comparison of
diffusion and permeation profiles, as well as the permeability parameters, of model drugs
across SC lipid model membranes and the human SC leads to the conclusion that, in terms
of the barrier function, Membrane II is much more similar to the human SC than
Membrane I. The most unequivocal evidence confirming this theory is the comparison of
TL values of model drugs in the case of diffusion and permeation across the human SC
and Membrane II, which are either very much alike (for diclofenac sodium) or the same
(for urea and caffeine; α = 0.05). The other permeability parameters of model drugs,
except for J and kp values in the case of permeation of diclofenac sodium across
Membrane I and the human SC, also point at higher degree of similarity of the barrier
function of Membrane II and the human SC. A possible explanation for this phenomenon
can be the different lipid composition, hence the distinct lipid organization, of SC lipid
model membranes. From the previous studies on the lipid organization [12, 19, 25, 38], it
is known that the polar Cer [AP] (four OH-groups within the head group) is responsible for
the formation of a very stable system with a periodicity of ~ 45–46 Å (Membrane I). The
ability of short-chain Cer (e.g. Cer [AP]) to exist in the fully extended as well as the hairpin
conformation (transformation from one to the other conformation by the chain-flip
transition) is of major importance for the elucidation of the lipid arrangement within SC
lipid model membranes. Cer [AP] in the fully extended conformation keeps the lipid
bilayers together and can be considered as an armature (“armature reinforcement
model”, [12]).

Chapter 6 Diffusion and permeation of model drugs 78
Fig. 5. Diffusion and permeation profiles of (A) urea, (B) caffeine and (C) diclofenac sodium (across model
lipid membranes and human SC) and their model fittings. Error bars show the standard deviation (n = 4).
The presence of Cer [EOS] within the lipid system (Membrane II) does not influence
significantly the lipid organization in terms of the periodicity of the lamellar phase (~ 46
Å, [19, 25]). This finding leads to the conclusion that the long-chain Cer [EOS] is forced to
fit into the membrane created by Cer [AP] with its long alkyl chain traversing the bilayer
and expanding into the adjacent layer [19]. This phenomenon, however, can lead to a
relaxation within the lipid assembly, i.e. the lipids within the lipid systems are not

Chapter 6 Diffusion and permeation of model drugs 79
arranged so tight as it was in the case of Membrane I. This assumption finds its
confirmation in the results of diffusion and permeation studies of model drugs through
Membrane I and Membrane II. The model drugs diffused and permeated faster across
Membrane II, which is considered to be much more similar to the human SC, than
Membrane I, with regard to the barrier function.
4. Conclusions
Diffusion and permeation studies of three model drugs with varying lipophilicities
(urea, caffeine and diclofenac sodium) were conducted in order to acquire information on
both the impact of physicochemical properties of drugs on their diffusion and permeation
across SC lipid model membranes and the influence of the constituents of these systems
(in particular the different ceramide species) on their barrier function. Firstly, the fastest
diffusion through both SC lipid model membranes and the human SC occurred in the case
of the most hydrophilic model drug, urea. This can be attributed to its smallest molecular
weight, as well as its permeation enhancing potential for the hydrophilic pathway (hence
the acceleration of the process of diffusion). The differences in the permeation rates of
caffeine and diclofenac sodium can be explained by their distinct partitioning properties.
The most lipophilic drug, diclofenac sodium, permeated faster across lipophilic SC model
membranes than caffeine (larger values of D and kp in the case of diclofenac sodium).
Secondly, the composition of SC lipid membranes has a significant impact on their barrier
properties. With regard to the barrier function, Membrane II is much more similar to the
human SC than Membrane I. In the presence of Cer [EOS] (as in Membrane II) the lipids
within the SC model systems are not arranged so tight as it is in the case of Membrane I,
which results in the faster diffusion and permeation of model drugs across Membrane II
(similar diffusion profiles of model drugs through Membrane II and the human SC).
Acknowledgements
The financial support for Michal Ochalek provided by the “Graduiertenförderung
des Landes Sachsen-Anhalt” is gratefully appreciated.

Chapter 6 Diffusion and permeation of model drugs 80
References
[1] P.W. Wertz, B. van den Bergh, The physical, chemical and functional properties of lipids in the skin and other
biological barriers, Chem. Phys. Lipids 91 (1998) 85-96.
[2] J.A. Bouwstra, A. de Graaff, G.S. Gooris, J. Nijsse, J.W. Wiechers, A.C. van Aelst, Water distribution and related
morphology in human stratum corneum at different hydration levels, J. Invest. Dermatol. 120 (2003) 750-758.
[3] M.L. Williams, P.M. Elias, The extracellular matrix of stratum corneum: role of lipids in normal and pathological
function, Crit. Rev. Ther. Drug Carrier Syst. 3 (1987) 95-122.
[4] P.W. Wertz, M.C. Miethke, S.A. Long, J.S. Strauss, D.T. Downing, The composition of the ceramides from human
stratum corneum and from comedones, J. Invest. Dermatol. 84 (1985) 410-412.
[5] N.Y. Schurer, G. Plewig, P.M. Elias, Stratum corneum lipid function, Dermatologica 183 (1991) 77-94.
[6] K.J. Robson, M.E. Stewart, S. Michelsen, N.D. Lazo, D.T. Downing, 6-Hydroxy-4-sphingenine in human epidermal
ceramides, J. Lipid Res. 35 (1994) 2060-2068.
[7] Y. Masukawa, H. Narita, E. Shimizu, N. Kondo, Y. Sugai, T. Oba, R. Homma, J. Ishikawa, Y. Takagi, T. Kitahara, Y.
Takema, K. Kita, Characterization of overall ceramide species in human stratum corneum, J. Lipid Res. 49 (2008)
1466-1476.
[8] L. Coderch, O. Lopez, A. de la Maza, J.L. Parra, Ceramides and skin function, Am. J. Clin. Dermatol. 4 (2003) 107-
129.
[9] J. van Smeden, L. Hoppel, R. van der Heijden, T. Hankemeier, R.J. Vreeken, J.A. Bouwstra, LC/MS analysis of
stratum corneum lipids: ceramide profiling and discovery, J. Lipid Res. 52 (2011) 1211-1221.
[10] S. Raudenkolb, S. Wartewig, R.H.H. Neubert, Polymorphism of ceramide 6: A vibrational spectroscopic and X-ray
powder diffraction investigation of the diastereomers of N-(alpha-hydroxyoctadecanoyl)-phytosphingosine,
Chem. Phys. Lipids 133 (2005) 89-102.
[11] M.A. Kiselev, N.Y. Ryabova, A.M. Balagurov, S. Dante, T. Hauss, J. Zbytovska, S. Wartewig, R.H.H. Neubert, New
insights into the structure and hydration of a stratum corneum lipid model membrane by neutron diffraction, Eur.
Biophys. J. 34 (2005) 1030-1040.
[12] M.A. Kiselev, Conformation of ceramide 6 molecules and chain-flip transitions in the lipid matrix of the outermost
layer of mammalian skin, the stratum corneum, Crystallogr. Rep. 52 (2007) 525-528.
[13] D. Kessner, M.A. Kiselev, S. Dante, T. Hauss, P. Lersch, S. Wartewig, R.H.H. Neubert, Arrangement of ceramide
[EOS] in a stratum corneum lipid model matrix: new aspects revealed by neutron diffraction studies, Eur. Biophys.
J. 37 (2008) 989-999.
[14] S.H. White, D. Mirejovsky, G.I. King, Structure of lamellar lipid domains and corneocyte envelopes of murine
stratum corneum. An X-ray diffraction study, Biochemistry 27 (1988) 3725-3732.
[15] B. Ongpipattanakul, M.L. Francoeur, R.O. Potts, Polymorphism in stratum corneum lipids, Biochim. Biophys. Acta,
Biomembranes 1190 (1994) 115-122.
[16] T.J. McIntosh, M.E. Stewart, D.T. Downing, X-ray diffraction analysis of isolated skin lipids: reconstitution of
intercellular lipid domains, Biochemistry 35 (1996) 3649-3653.
[17] J.A. Bouwstra, G.S. Gooris, K. Cheng, A. Weerheim, W. Bras, M. Ponec, Phase behavior of isolated skin lipids, J.
Lipid Res. 37 (1996) 999-1011.
[18] T.J. McIntosh, Organization of skin stratum corneum extracellular lamellae: diffraction evidence for asymmetric
distribution of cholesterol, Biophys. J. 85 (2003) 1675-1681.
[19] A. Schroeter, D. Kessner, M.A. Kiselev, T. Hauss, S. Dante, R.H.H. Neubert, Basic nanostructure of stratum
corneum lipid matrices based on ceramides [EOS] and [AP]: a neutron diffraction study, Biophys. J. 97 (2009)
1104-1114.

Chapter 6 Diffusion and permeation of model drugs 81
[20] A. Schroeter, M.A. Kiselev, T. Hauss, S. Dante, R.H.H. Neubert, Evidence of free fatty acid interdigitation in stratum
corneum model membranes based on ceramide [AP] by deuterium labelling, Biochim. Biophys. Acta,
Biomembranes 1788 (2009) 2194-2203.
[21] T. Engelbrecht, T. Hauss, K. Sueβ, A. Vogel, M. Roark, S.E. Feller, R.H.H. Neubert, B. Dobner, Characterisation of a
new ceramide EOS species: synthesis and investigation of the thermotropic phase behaviour and influence on the
bilayer architecture of stratum corneum lipid model membranes, Soft Matter 7 (2011) 8998-9011.
[22] M.W. de Jager, W. Groenink, R. Bielsa i Guivernau, E. Andersson, N. Angelova, M. Ponec, J.A. Bouwstra, A novel in
vitro percutaneous penetration model: evaluation of barrier properties with p-aminobenzoic acid and two of its
derivatives, Pharm. Res. 23 (2006) 951-960.
[23] D. Groen, G.S. Gooris, M. Ponec, J.A. Bouwstra, Two new methods for preparing a unique stratum corneum
substitute, Biochim. Biophys. Acta, Biomembranes 1778 (2008) 2421-2429.
[24] D. Groen, D.S. Poole, G.S. Gooris, J.A. Bouwstra, Investigating the barrier function of skin lipid models with varying
compositions, Eur. J. Pharm. Biopharm. 79 (2011) 334-342.
[25] M. Ochalek, S. Heissler, J. Wohlrab, R.H.H. Neubert, Characterization of lipid model membranes designed for
studying impact of ceramide species on drug diffusion and penetration, Eur. J. Pharm. Biopharm. 81 (2012) 113-
120.
[26] OECD (2004), Guidance Document for the Conduct of Skin Absorption Studies, OECD Series on Testing and
Assessment, No. 28, OECD Publishing. doi: 10.1787/9789264078796-en.
[27] T. Khazaeinia, F. Jamali, A comparison of gastrointestinal permeability induced by diclofenac-phospholipid
complex with diclofenac acid and its sodium salt, J. Pharm. Pharm. Sci. 6 (2003) 352-359.
[28] A. Kokate, X. Li, B. Jasti, Effect of drug lipophilicity and ionization on permeability across the buccal mucosa: a
technical note, AAPS PharmSciTech. 9 (2008) 501-504.
[29] A.M. Kligman, E. Christophers, Preparation of isolated sheets of human stratum corneum, Arch. Dermatol. 88
(1963) 702-705.
[30] S. Hansen, A. Henning, A. Naegel, M. Heisig, G. Wittum, D. Neumann, K.-H. Kostka, J. Zbytovska, C.-M. Lehr, U.F.
Schaefer, In-silico model of skin penetration based on experimentally determined input parameters. Part I:
Experimental determination of partition and diffusion coefficients, Eur. J. Pharm. Biopharm. 68 (2008) 352-367.
[31] M.E. Johnson, D. Blankschtein, R. Langer, Evaluation of Solute Permeation Through the Stratum Corneum: Lateral
Bilayer Diffusion as the Primary Transport Mechanism, J. Pharm. Sci. 86 (1997) 1162-1172.
[32] M. Hartmann, B.D. Hanh, H. Podhaisky, J. Wensch, J. Bodzenta, S. Wartewig, R.H.H. Neubert, A new FTIR-ATR cell
for drug diffusion studies, Analyst 129 (2004) 902-905.
[33] U. Guenther, M. Hartmann, S. Wartewig, R.H.H. Neubert, Diffusion of urea through membranes, Diffusion
Fundamentals 4 (2006) 4.1-4.5.
[34] W.J. McAuley, K.T. Mader, J. Tetteh, M.E. Lane, J. Hadgraft, Simultaneous monitoring of drug and solvent diffusion
across a model membrane using ATR-FTIR spectroscopy, Eur. J. Pharm. Sci. 38 (2009) 378-383.
[35] A.C. Williams, B.W. Barry, Penetration enhancers, Adv. Drug Deliver. Rev. 56 (2004) 603-618.
[36] H.Y. Thong, H. Zhai, H.I. Maibach, Percutaneous penetration enhancers: an overview, Skin Pharmacol. Physiol. 20
(2007) 272-282.
[37] H. Trommer, R.H.H. Neubert, Overcoming the stratum corneum: the modulation of skin penetration. A review,
Skin Pharmacol. Physiol. 19 (2006) 106-121.
[38] D. Kessner, A. Ruettinger, M.A. Kiselev, S. Wartewig, R.H.H. Neubert, Properties of Ceramides and Their Impact on
the Stratum Corneum Structure: Part 2: Stratum Corneum Lipid Model Systems, Skin Pharmacol. Physiol. 21
(2008) 58-74.

82
Chapter 7
SC lipid model membranes designed for studying impact of ceramide
species on drug diffusion and permeation, Part III: Influence of
penetration enhancer on diffusion and permeation of model drugs
M. Ochalek a, H. Podhaisky b, H.-H. Ruettinger a,
R.H.H. Neubert a, J. Wohlrab c
a Institute of Pharmacy, Martin Luther University, Halle (Saale), Germany
b Institute of Mathematics, Martin Luther University, Halle (Saale), Germany
c Department of Dermatology and Venereology, Martin Luther University, Halle (Saale), Germany
(adapted from Int. J. Pharm. (2012) doi: 10.1016/j.ijpharm.2012.06.044)
Abstract
The impact of the lipophilic penetration enhancer, oleic acid (OA), on the barrier
properties of stratum corneum (SC) lipid model membranes was investigated based on
diffusion and permeation studies of model drugs covering a broad range of lipophilicities.
Diffusion and permeation experiments of urea, caffeine and diclofenac sodium were
conducted using Franz-type diffusion cells. HPLC and capillary electrophoresis techniques
were employed to analyze the amount of permeated drug. An incorporation of OA to the
SC lipid model membranes did not change the relation between the diffusion and
permeation behavior of model drugs presented previously for SC lipid model membranes
without OA. The fastest rate of diffusion through SC lipid model membranes occurred in
the case of the most hydrophilic drug, urea. In the case of permeation studies of caffeine
and diclofenac sodium across SC lipid model systems, the permeability parameters were
either equal or slightly larger in favor of the most lipophilic drug, diclofenac sodium.
OA had a pronounced impact on the barrier properties of SC lipid model membranes. It
caused the impairment of the barrier function of the SC lipid model membrane with Cer
[AP] (phytosphingosine-based ceramide), however, surprisingly improved the barrier
properties of the SC lipid model system with Cer [EOS] (sphingosine-based acylceramide).

Chapter 7 Influence of penetration enhancer 83
1. Introduction
The outermost layer of the skin, the stratum corneum (SC) constitutes the main
penetration barrier for topically administered drugs and other substances (e.g. water)
(Wertz and van den Bergh, 1998). It consists of parallel to the skin surface anucleated
dead cells (corneocytes) that are embedded in a lipid matrix (Elias, 1983). The
intercellular route of transport through the normal intact SC is thought to be the most
preferable one (Williams and Elias, 1987). Therefore, the organization of the SC
intercellular lipid matrix is of special interest. The SC intercellular lipid matrix does not
contain phospholipids, contrary to other biological barriers (e.g. cell membranes). It is
mainly composed of ceramides (Cer), free fatty acids (FFA), cholesterol (Chol) and its
derivatives (e.g. cholesterol sulfate, ChS) that are organized in lamellar phases (Masukawa
et al., 2008; Robson et al., 1994; Schurer et al., 1991; Wertz et al., 1985). Cer, FFA and
Chol make up approx. 50%, 10% and 25% of the SC lipid mass, respectively, with ChS
comprising about 5% of the total Chol (Weerheim and Ponec, 2001; Wertz, 2000). FFA
found in the SC are mainly saturated, straight-chained species. Their chain lengths range
from 16 through 30 carbons and the most abundant species are C22:0, C24:0 and C26:0
(Weerheim and Ponec, 2001; Wertz and van den Bergh, 1998). A key role in the
functioning of the SC barrier play Cer (Coderch et al., 2003). Recent study reported the
existence of 12 subclasses of Cer isolated from the human SC (van Smeden et al., 2011).
In order to investigate the SC lipid organization, native SC lipids isolated from the
mammalian skin were used in former studies (Bouwstra et al., 1996; McIntosh, 2003;
McIntosh et al., 1996; Ongpipattanakul et al., 1994; White et al., 1988). Nevertheless, to
elucidate the role of each lipid species in the functioning and maintaining of the SC
barrier, a new approach with well-defined artificial SC lipid systems produced as oriented
multilamellar membranes has been recently introduced (Engelbrecht et al., 2011a;
Kessner et al., 2008; Kiselev, 2007; Kiselev et al., 2005; Raudenkolb et al., 2005; Schroeter
et al., 2009a; Schroeter et al., 2009b). The use of such systems can help to overcome
obstacles like the poor availability of human skin and the high inter- and intra-variability
of the human SC samples. In these studies, it was found that the short chain and polar
phytosphingosine-based Cer [AP] and the acylceramide, Cer [EOS], influence to a high
degree the internal membrane structure formation and the barrier properties of the SC.
However, the focus in these studies was placed on the relation between the lipid
composition and the SC lipid system organization, and no information about the SC
barrier function was obtained. The lipid organization–barrier function relationship was

Chapter 7 Influence of penetration enhancer 84
investigated elsewhere (de Jager et al., 2006; Groen et al., 2011). However, lipid systems
used there were much more complex and were composed of a number of Cer, FFA and
Chol. The use of such complex model membranes does not allow to assign alterations
occurring in the SC barrier function just to one lipid. On the contrary, they might result
from interactions between different subspecies of lipids. The investigation of the
influence of each lipid constituent (in particular the Cer species) on the diffusion and
permeation of drugs across such model systems may be hampered.
The process of drug diffusion and permeation across the SC can be modulated. The
facilitation of the drug administration into deeper skin layers or to the systemic
circulation is desired in the treatment of many diseases. There are a number of
mechanisms of the temporary impairment of the SC barrier function and they have been
extensively reviewed (Trommer and Neubert, 2006). In addition to physical methods (e.g.
phonophoresis, iontophoresis), a chemical penetration enhancement plays a crucial role
in the modulation of the SC penetration (Walker and Smith, 1996; Williams and Barry,
2004). The enhancement of the drug penetration into the SC or the permeation through
the SC is proven for a number of chemical substances called penetration enhancers.
However, their exact mechanism of action is not yet fully explained. cis-9-octadecenoic
acid (oleic acid, OA) belongs to the group of well-studied penetration enhancers
(Francoeur et al., 1990; Walker and Hadgraft, 1991). Francoeur et al. (1990) found that
following skin treatment with OA, the penetration of piroxicam was significantly
increased. This phenomenon was ascribed to a direct perturbing effects of OA on the SC
lipids, as well as a formation of phase-separated fluid domains in the presence of OA.
Similar findings were reported elsewhere (Naik et al., 1995; Rowat et al., 2006; Tanojo et
al., 1997). A number of studies on the effects of the OA action on the phospholipid-based
systems were also carried out (Funari et al., 2003; Prades et al., 2003; Separovic and
Gawrisch, 1996). It was found in these studies that the double bond of OA substantially
influenced the molecular arrangement of lipid alkyl chains and hence the lipid bilayer
arrangement. As a consequence, an increased chain disorder was produced. The model
lipid system composed of Cer [AP], Chol, PA, ChS and OA was investigated by means of
small angle X-ray scattering (Zbytovska et al., 2009) and neutron scattering (Engelbrecht
et al., 2011b). These studies confirmed the OA mode of action described earlier.
In the present study, the barrier properties of two quaternary lipid model
membranes (composed of i.a. Cer [AP] and Cer [EOS]) with additionally incorporated OA
were investigated. In our previous studies, two lipid model membranes (Membrane I and
Membrane II, see Table 1) were, firstly, characterized in terms of the lipid organization

Chapter 7 Influence of penetration enhancer 85
using numerous analytical techniques (Ochalek et al., 2012a) and, secondly, the impact of
their composition on the barrier function was examined by conducting diffusion and
permeation studies of three model drugs (Ochalek et al., 2012b). The results of the first
study showed that regarding the lipid distribution and organization, the SC lipid model
membranes were prepared in a standardized way. Moreover, it was confirmed in the
second study that the composition of SC lipid model systems had a significant impact on
their barrier function. The objective of the present study was to investigate the impact of
the penetration enhancer, OA, on the barrier properties of SC lipid model membranes. As
stated previously, the use of simple, but well-defined artificial SC lipid systems elucidates
its investigation. It was analyzed by means of a comparison of diffusion and permeation
of three model drugs that cover a broad range of lipophilicities (i.e. urea, caffeine and
diclofenac sodium) across SC lipid model membranes with integrated OA. The studies
were carried out using Franz-type diffusion cells. Analytical procedures, HPLC and
capillary electrophoresis (CE), were employed to analyze the amount of permeated drug
through SC lipid model membranes. A mathematical model was used in order to estimate
diffusion coefficients of the model drugs.
2. Materials and methods
2.1. Materials
Synthetic Cer [EOS] and Cer [AP] were generously provided by Evonik Goldschmidt
(Essen, Germany). Palmitic acid (PA), oleic acid, sodium cholesteryl sulfate, caffeine,
diclofenac sodium salt and urea were obtained from Sigma-Aldrich Chemie GmbH
(Steinheim, Germany) and cholesterol from Sigma Chemical CO. (St. Louis, USA).
Methanol, ethanol, chloroform, acetonitrile, formic acid and n-hexane were purchased
from Merck (Darmstadt, Germany). Urease (from jack beans, 9.0 U mg-1) was purchased
from Fluka (Buchs, Switzerland). Nuclepore polycarbonate membrane filters (diameter 25
mm, pore size 50 nm) were obtained from Whatman (Kent, UK). Solvents used for the
sample preparation and analytical procedures were of analytical grade.
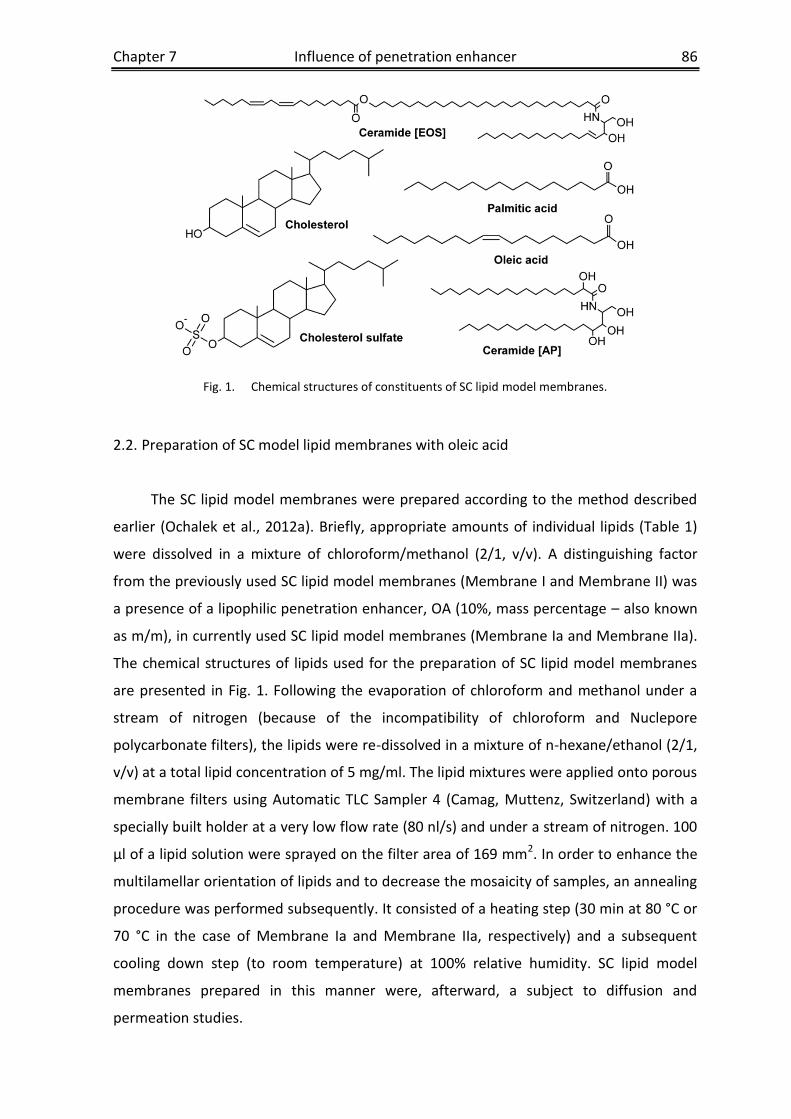
Chapter 7 Influence of penetration enhancer 86
Fig. 1. Chemical structures of constituents of SC lipid model membranes.
2.2. Preparation of SC model lipid membranes with oleic acid
The SC lipid model membranes were prepared according to the method described
earlier (Ochalek et al., 2012a). Briefly, appropriate amounts of individual lipids (Table 1)
were dissolved in a mixture of chloroform/methanol (2/1, v/v). A distinguishing factor
from the previously used SC lipid model membranes (Membrane I and Membrane II) was
a presence of a lipophilic penetration enhancer, OA (10%, mass percentage – also known
as m/m), in currently used SC lipid model membranes (Membrane Ia and Membrane IIa).
The chemical structures of lipids used for the preparation of SC lipid model membranes
are presented in Fig. 1. Following the evaporation of chloroform and methanol under a
stream of nitrogen (because of the incompatibility of chloroform and Nuclepore
polycarbonate filters), the lipids were re-dissolved in a mixture of n-hexane/ethanol (2/1,
v/v) at a total lipid concentration of 5 mg/ml. The lipid mixtures were applied onto porous
membrane filters using Automatic TLC Sampler 4 (Camag, Muttenz, Switzerland) with a
specially built holder at a very low flow rate (80 nl/s) and under a stream of nitrogen. 100
µl of a lipid solution were sprayed on the filter area of 169 mm2. In order to enhance the
multilamellar orientation of lipids and to decrease the mosaicity of samples, an annealing
procedure was performed subsequently. It consisted of a heating step (30 min at 80 °C or
70 °C in the case of Membrane Ia and Membrane IIa, respectively) and a subsequent
cooling down step (to room temperature) at 100% relative humidity. SC lipid model
membranes prepared in this manner were, afterward, a subject to diffusion and
permeation studies.

Chapter 7 Influence of penetration enhancer 87
Table 1 Composition of SC lipid model membranes.
Model membrane Composition Ratio (m/m)
Membrane Ia Cer [AP]/Chol/PA/ChS 55/25/15/5
Membrane IIa Cer [AP]/Cer [EOS]/Chol/PA 10/23/33/33
Membrane Ia Cer [AP]/Chol/PA/ChS/OA 49.5/22.5/13.5/4.5/10
Membrane IIa Cer [AP]/Cer [EOS]/Chol/PA/OA 9/20.7/29.7/29.7/10
a Membrane I and Membrane II were investigated in a previous study (Ochalek et al., 2012b).
2.3. Diffusion and permeation studies
In order to perform in vitro diffusion and permeation experiments, Franz-type
diffusion cells (Rettberg, Goettingen, Germany) were used. 10% (m/m) solution of urea,
2% (m/m) solution of caffeine and 0.1% (m/m) solution of diclofenac sodium were used
as model drugs. Drug solutions were prepared in phosphate-buffered saline (PBS, pH 7.4:
NaCl, KCl, Na2HPO4 and KH2PO4 in water in concentrations 8.0, 0.2, 1.44 and 0.24 g/l,
respectively). In the case of urea, PBS solution without potassium ions was used (owing to
the analytical technique of the urea determination in samples taken from the acceptor
compartment). Model drugs used in the study are shown in Fig. 2. Their physicochemical
properties are presented in Table 2. The pKa and log P values, where log P stands for log
partition coefficient value, were either found in the literature (Khazaeinia and Jamali,
2003; Kokate et al., 2008) or calculated using ChemAxon’s Marvin software. The log D
values (log distribution coefficient values) were calculated using equation:
[ ( )⁄ ], where or in the case of acids and
bases, respectively (Scherrer and Howard, 1977). As can be seen in Table 2, the log D
values of urea and caffeine equal their log P values. The reason for this was neutral
(unionized) character of these two drugs at pH used in the study, contrary to diclofenac
sodium which was mostly ionized in these conditions (negatively charged diclofenac ions).
For all diffusion and permeation studies, the donor phase consisted of 1 ml of the model
drug solution in PBS. The acceptor compartment was filled with approx. 5 ml of PBS (pH
7.4) that were stirred by use of a magnetic bar. The samples from the acceptor
compartment were collected at predetermined points in time. Subsequently, a
quantitative analysis of collected samples was carried out using a specific analytical
routine developed for each model drug. The reduced volume of the acceptor phase was
supplemented with the fresh PBS solution after each sample collection. All diffusion and

Chapter 7 Influence of penetration enhancer 88
permeation experiments were performed under occlusive conditions, provided by sealing
the opening of the donor compartment with an adhesive tape. In order to mimic the in
vivo conditions, the temperature inside the diffusion cells was maintained at 32 °C by use
of thermostated water baths. The artificial SC lipid systems with the incorporated
penetration enhancer, OA, (Membrane Ia and Membrane IIa) were used as model
membranes in diffusion and permeation studies.
Fig. 2. Chemical structures of model drugs.
Table 2 Physicochemical properties of model drugs
Drug Molar mass [g/mol] log P log D7.4a pKa (25 °C)
Urea 60.06 -2.11 -2.11 0.18
Caffeine 194.19 -0.07 -0.07 1.4
Diclofenac sodium 318.14 4.28b 0.88 4.0
a values of log distribution coefficients at pH = 7.4 b log P value of the uncharged drug form
2.4. HPLC and CE assays; data modeling
The concentration of drugs in the samples collected from the acceptor
compartment was determined using either HPLC or CE technique (Ochalek et al., 2012b).
The HPLC method was developed to analyze the quantity of caffeine in the receptor
compartment. The Agilent 1100 LC System (Agilent, Waldbronn, Germany) equipped with
Chapter 7 Influence of penetration enhancer 89
a vacuum degasser, a binary pump, an autosampler and a diode array detector was used
in this study. Separations were carried out in a Eurospher 100-5-RP18 column with
dimensions: 100 x 2 mm (Knauer, Berlin, Germany) kept at a temperature of 30 °C. As a
mobile phase, an isocratic mixture of water/methanol (60/40, v/v) was used, at a flow
rate of 0.2 ml min-1. The injection volume of each sample amounted to 5 µl. The detection
of caffeine was carried out at a wavelength of 273 nm and its limit of quantification
amounted to 0.07 µg ml-1.
The amount of diclofenac sodium in the receptor phase was found using the same
HPLC system, as described in the case of caffeine determination. As a stationary phase,
Nucleosil C8 column with dimensions: 125 x 2 mm (Macherey–Nagel GmbH & Co. KG,
Dueren, Germany) was used. 0.1 % formic acid in a mixture of water/acetonitrile (50/50,
v/v) with a flow rate of 0.2 ml min-1 was applied as a mobile phase. 5 µl of each sample
were injected into the HPLC column maintained at a temperature of 30 °C. The detection
was performed at a wavelength of 278 nm and the limit of quantification of diclofenac
sodium amounted to 0.2 µg ml-1.
A conventional CE with contactless conductivity detection method was developed
to quantitatively analyze the urea samples taken from the receptor phase. The samples
were examined after an enzymatic conversion of urea to ammonium. This procedure was
described in detail in our previous study (Ochalek et al., 2012b). Briefly, 2 mg ml-1 urease
suspension was added to the samples collected from the receptor compartment. In order
to guarantee a completeness of the enzymatic conversion, the mixtures were shaken for
2 hours, subsequently. Next, the samples were filtrated using 0.2 µm cellulose filters
(Wicom, Heppenheim, Germany). To determine the ammonium amount and hence the
urea concentration in the acceptor phase, PrinCE-C 750 CE System (Prince Technologies,
Emmen, The Netherlands) was used. In order to improve the amplitude stability, the built
in-house contactless conductivity detector was equipped with a rectangular wave
generator instead of a sinusoidal one, contrary to other devices of this type. Fused-silica
capillaries (CS-Chromatographie Service, Langerwehe, Germany) with 75 µm ID and 50.8
cm length (35.3 cm to detector) were preconditioned with 1 M NaOH for 10 min and
water for 10 min, and subsequently rinsed with running buffer (20 mM MES/HIS buffer)
for 20 min. The capillaries were flushed with the MES/HIS buffer after each run. The
additional rinsing with 0.1 M NaOH for 5 min, water for 5 min and the MES/HIS buffer for
10 min was performed, when peak deformations were observed. The separation voltage
amounted to 20 kV. The limit of quantification was 0.25 µg ml-1. As mentioned earlier, in
the case of diffusion studies of urea, the PBS solution without potassium ions was used

Chapter 7 Influence of penetration enhancer 90
because of a similarity of ammonium and potassium ions (similar size), and hence a
difficult separation of these ions by CE.
To calculate diffusion coefficients of model drugs, a mathematical model was
developed. Its detailed description was presented previously (Ochalek et al., 2012b). For
simplicity reasons, the potential interaction between diclofenac ions and FFA ions from
the lipid model membranes was not taken into account in the mathematical data
modeling. In accordance with the Fick’s second law of diffusion, the drug concentration
( ) within the model membrane can be approximated by a solution of a linear one-
dimensional diffusion equation:
(1)
where L is the membrane thickness. Fitting appropriate initial and boundary conditions to
Eq. (1) and replacing the spatial derivatives by standard central differences led to a linear
system of ordinary differential equations with a constant matrix M. Taking into account
that the velocity of the drug permeation through the membrane is determined by the
slowest eigenmode of M corresponding to the eigenvalue λ1, one can fit the model given
by:
( ) ( ( )) (2)
to the experimental data and acquire an estimate for the diffusion coefficient by:
.
In order to obtain other permeability parameters, the cumulative permeated
amount of model drugs per cm2 was plotted as a function of time. The slope of the linear
part of the plot was taken as the steady-state flux (J) and its intercept with the time-axis
was the lag-time (TL). The permeability coefficient (kp) was calculated as a quotient of the
flux and the initial drug concentration in the donor compartment.
The estimated permeability parameters were compared using one-way analysis of
variance (ANOVA) with Tukey’s test as post hoc analysis. Significance was accepted when
p < 0.05. In cases when the compared parameters were not normally distributed or the
variances were not equal, a nonparametric Kruskal-Wallis ANOVA test was performed (a
level of significance was set at p < 0.05).

Chapter 7 Influence of penetration enhancer 91
3. Results and discussion
3.1. Diffusion and permeation of model drugs through SC lipid model membranes in the
presence of the penetration enhancer, OA
Diffusion and permeation studies of three model drugs with varying lipophilicities
(Table 2) across SC lipid model membranes with incorporated OA (10%, m/m) were
performed in order to investigate the impact of the penetration enhancer on their
diffusion and permeation profiles.
Fig. 3 displays diffusion and permeation profiles of model drugs with the
mathematical model fittings across Membrane Ia (A) and Membrane IIa (B). It can be
clearly seen in the figure that in the case of both SC lipid model systems, the diffusion of
urea was faster than the permeation of caffeine and diclofenac sodium. Moreover, the
slowest rate of permeation was characteristic for the latter. The values of steady-state
flux (J), lag-time (TL), permeability coefficient (kp) and diffusion coefficient (D) are listed in
Table 3. In the case of Membrane Ia (Fig. 3A), the J values amounted to 10.65 ± 1.33, 0.24
± 0.07 and 0.017 ± 0.003 mg cm-2 h-1 for urea, caffeine and diclofenac sodium,
respectively. The corresponding TL values for urea, caffeine and diclofenac sodium
amounted to –0.37 ± 0.27, 0.18 ± 0.22 and 0.19 ± 0.09 h, and the kp values were 0.11 ±
0.01, 0.012 ± 0.004 and 0.017 ± 0.003 cm h-1, respectively. The D values amounted to 5.44
± 2.55, 0.09 ± 0.02 and 0.16 ± 0.04 x 10⁻⁸ cm2 s-1 in the case of urea, caffeine and
diclofenac sodium, respectively. The diffusion and permeation profiles of model drugs
across Membrane IIa are presented in Fig. 3B. The J values in the case of urea, caffeine
and diclofenac sodium amounted to 9.54 ± 1.52, 0.20 ± 0.06 and 0.013 ± 0.002 mg cm-2
h-1, and the TL values were –0.77 ± 0.17, –0.24 ± 0.13 and –0.14 ± 0.03 h, respectively. The
kp values amounted to 0.095 ± 0.015, 0.010 ± 0.003 and 0.013 ± 0.002 cm h-1, and the
values of D were 12.83 ± 8.37, 0.16 ± 0.15 and 0.21 ± 0.04 x 10⁻⁸ cm2 s-1 for urea, caffeine
and diclofenac sodium, respectively.
In our previous study, the influence of physicochemical properties of model drugs
on their diffusion and permeation behavior was examined (Ochalek et al., 2012b). Three
model drugs covering a broad range of lipophilicities (log D values of model drugs at pH =
7.4 amounted to –2.11, –0.07 and 0.88 for urea, caffeine and diclofenac sodium,
respectively) and characterized by a different molecular weight were chosen to
investigate the impact of the partitioning characteristics of drugs on the rate of diffusion.
It was found that the most hydrophilic drug, urea, diffused through both artificial lipid

Chapter 7 Influence of penetration enhancer 92
membranes (Membrane I and Membrane II) and the human SC faster than the more
lipophilic molecule, caffeine, and much faster than the most lipophilic drug, diclofenac
sodium. The fastest rate of diffusion in the case of urea was explained by its smallest
molecular weight, when compared to the more lipophilic drugs, as well as its permeation
enhancing potential for the hydrophilic pathway. When comparing the permeation
behavior of caffeine and diclofenac sodium, two factors have to be taken into account. On
the one hand, caffeine is characterized by a smaller molecular weight than the latter; on
the other hand, diclofenac sodium is more lipophilic than caffeine and appears mostly in
an ionized form. Altogether, it resulted in slightly larger values of kp and D in favor of
diclofenac sodium.
Fig. 3. Diffusion and permeation through the model lipid membranes, (A) Membrane Ia and (B)
Membrane IIa (data shown with mathematical model fittings). Error bars show the standard deviation (n =
4).
Interestingly, an addition of 10% (m/m) of the lipophilic penetration enhancer, OA,
did not change the relation observed earlier for the SC lipid model membranes devoid of

Chapter 7 Influence of penetration enhancer 93
OA. A comparison of permeability parameters shows that the J of urea was ~ 44 times
larger than J of caffeine and ~ 627 times larger than J of diclofenac sodium in the case of
Membrane Ia. A similar relationship applies for the J values in the case of the diffusion
across Membrane IIa, where J of urea was ~ 48 times and ~ 734 times larger than the J of
caffeine and diclofenac sodium, respectively. The kp of urea in the case of Membrane Ia
was higher than kp of caffeine and diclofenac sodium by a factor of ~ 9 and ~ 7,
respectively. For Membrane IIa, kp of urea was ~ 10 times and ~ 7 times larger than kp of
caffeine and diclofenac sodium, respectively. However, in the case of both SC lipid model
membranes, the kp values of caffeine and diclofenac sodium were not significantly
different (α = 0.05).
Table 3 Permeability parameters of urea, caffeine and diclofenac sodium – in vitro study.
Drug/Parameter J [mg cm-2
h-1
] TL [h] kp [cm h-1
] D [x 10-8
cm2
s-1
]
Urea
SCa 42.23 ± 1.66 -1.01 ± 0.24 0.42 ± 0.02 27.14 ± 7.16
Membrane Ia 1.36 ± 0.13 2.88 ± 1.13 0.014 ± 0.001 0.25 ± 0.13
Membrane IIa 19.52 ± 1.53 -0.47 ± 0.50 0.20 ± 0.02 1.59 ± 0.16
Membrane Ia 10.65 ± 1.33 -0.37 ± 0.27 0.11 ± 0.01 5.44 ± 2.55
Membrane IIa 9.54 ± 1.52 -0.77 ± 0.17 0.095 ± 0.015 12.83 ± 8.37
Caffeine
SCa 2.00 ± 1.12 -0.01 ± 0.15 0.10 ± 0.06 6.58 ± 4.02
Membrane Ia 0.06 ± 0.01 5.89 ± 1.12 0.003 ± 0.001 0.023 ± 0.006
Membrane IIa 0.38 ± 0.04 0.15 ± 0.26 0.019 ± 0.002 0.16 ± 0.02
Membrane Ia 0.24 ± 0.07 0.18 ± 0.22 0.012 ± 0.004 0.09 ± 0.02
Membrane IIa 0.20 ± 0.06 -0.24 ± 0.13 0.010 ± 0.003 0.16 ± 0.15
Diclofenac sodium
SCa 0.008 ± 0.004 0.73 ± 0.94 0.008 ± 0.004 0.54 ± 0.69
Membrane Ia 0.007 ± 0.002 3.56 ± 1.69 0.007 ± 0.002 0.060 ± 0.014
Membrane IIa 0.023 ± 0.001 0.77 ± 0.23 0.023 ± 0.001 0.19 ± 0.01
Membrane Ia 0.017 ± 0.003 0.19 ± 0.09 0.017 ± 0.003 0.16 ± 0.04
Membrane IIa 0.013 ± 0.002 -0.14 ± 0.03 0.013 ± 0.002 0.21 ± 0.04
Permeability data represent MEAN ± SD (n = 4). a J, TL, kp and D values for the human SC, Membrane I and Membrane II were obtained in a previous study (Ochalek et al., 2012b).
A comparison of D values shows that D of urea for Membrane Ia was ~ 60-fold and
~ 34-fold higher than D of caffeine and diclofenac sodium, respectively. In the case of
Membrane IIa, a similar relationship was observed. Namely, D of urea was larger than D
of caffeine and diclofenac sodium by a factor of ~ 80 and ~ 61, respectively, whereas the
Chapter 7 Influence of penetration enhancer 94
D values of caffeine and diclofenac sodium were not significantly different (α = 0.05). TL
of caffeine and diclofenac sodium in the case of Membrane Ia were not significantly
different (α = 0.05), and were slightly longer than TL of urea, which can be assumed to
equal 0 (a negative value). For Membrane IIa, the differences in TL of caffeine and
diclofenac sodium were not significant (α = 0.05) and their values, as well as TL of urea,
can be assumed to equal 0. As mentioned above, in the case of SC lipid model
membranes with incorporated OA, the same relation was observed as for the systems
devoid of OA. The most hydrophilic substance, urea, was characterized by the fastest rate
of diffusion through both SC lipid model membranes (Membrane Ia and Membrane IIa).
When comparing the permeability parameters of caffeine and diclofenac sodium for both
SC lipid model systems, the values of D, kp and TL were either equal or slightly higher in
favor of the most lipophilic drug, diclofenac sodium. The reasons for such diffusion and
permeation behavior of model drugs were described earlier. The incorporation of OA into
the SC lipid model membranes changed the diffusion and permeation behavior of model
drugs to the same extent. As a consequence, a similar relation holds for diffusion and
permeation of model drugs across SC lipid model membranes with and without OA.
3.2. Influence of the penetration enhancer, OA, on the barrier function of two SC lipid
model membranes
To investigate the impact of the penetration enhancer on the barrier properties of
SC lipid model systems, the diffusion and permeation studies of three model drugs across
Membrane Ia and Membrane IIa were carried out. Subsequently, the results of these
studies were compared with the outcomes of the previously performed diffusion and
permeation experiments through the SC lipid model membranes devoid of OA
(Membrane I and Membrane II) and the human SC (Ochalek et al., 2012b).
Fig. 4 displays diffusion and permeation profiles of urea (A), caffeine (B) and
diclofenac sodium (C), with mathematical model fittings, across SC lipid model
membranes and the human SC. The permeability parameters of model drugs for all
membranes used in the diffusion and permeation studies are presented in Table 3.
In the case of diffusion of urea through Membrane Ia and Membrane IIa (Fig. 4A),
diffusion profiles were much alike. Moreover, the values of J, kp and D of urea were not
significantly different (α = 0.05) for Membrane Ia and Membrane IIa. The TL values of
urea for both SC lipid model membranes with OA were negative, and hence can be
assumed to equal 0. On the other hand, when comparing diffusion profiles and

Chapter 7 Influence of penetration enhancer 95
permeability parameters of urea for SC lipid model membranes with and devoid of OA,
one can notice clear differences. J of urea in the case of Membrane Ia was ~ 8 times
larger than J in the case of diffusion through Membrane I. For Membrane IIa, the J value
of urea was ~ 2 times smaller than J in the case of Membrane II. The same ratios apply for
a comparison of the kp values of urea (between Membrane Ia and Membrane I, and
Membrane IIa and Membrane II). In the case of diffusion through Membrane Ia, the D
value of urea was higher by a factor of ~ 22 than D of urea for Membrane I, and for
Membrane IIa ~ 8-fold larger than D of urea for Membrane II. As can be seen in Fig. 4A,
for the diffusion profiles of urea across the human SC and all SC lipid model membranes
but Membrane I, no lag phase was observed. The values of TL for the human SC,
Membrane II, Membrane Ia and Membrane IIa were negative (i.e. can be assumed to
equal 0). Moreover, TL of urea for Membrane IIa and Membrane II, as well as for
Membrane IIa and SC, were not significantly different (α = 0.05). In the case of Membrane
I, TL of urea was well pronounced and was ~ 3.3 h longer than for Membrane Ia. The
other permeability parameters in the case of diffusion of urea across the human SC were
considerably larger than for all SC model lipid membranes. A similar relation as described
for the diffusion of urea holds also for the permeation of caffeine across both the human
SC and SC lipid model membranes (Fig. 4B). In the case of permeation of caffeine through
Membrane Ia and Membrane IIa, the values of J, kp and D were not significantly different
(α = 0.05). Both J and kp values of caffeine in the case of permeation across Membrane Ia
were 4-fold larger than J and kp for permeation through Membrane I, and in the case of
Membrane IIa ~ 2-fold smaller than for Membrane II. A comparison of D values shows
that D of caffeine for Membrane Ia was ~ 4 times larger than the corresponding value in
the case of permeation across Membrane I, and in the case of Membrane IIa and
Membrane II, the D values were not significantly different (α = 0.05). The TL values of
caffeine for the SC, Membrane II, Membrane Ia and Membrane IIa were close to 0. The
differences in TL of caffeine for Membrane Ia and Membrane II, Membrane Ia and the
human SC, and Membrane IIa and the human SC were not significant (α = 0.05). TL of
caffeine in the case of permeation across Membrane I was ~ 5.7 h longer than for
Membrane Ia. The J, kp and D values of caffeine in the case of permeation through the
human SC were considerably larger than for all SC model lipid membranes. The
permeation profiles of diclofenac sodium across the human SC and SC lipid model
membranes are shown in Fig. 4C. For the permeation of diclofenac sodium across
Membrane Ia and Membrane IIa, the values of J, kp and D were not significantly different
(α = 0.05). The J and kp values of diclofenac sodium in the case of permeation through

Chapter 7 Influence of penetration enhancer 96
Membrane Ia were higher than for Membrane I by a factor of ~ 2, and for Membrane IIa
~ 2 times smaller than for Membrane II. The differences in the D values of diclofenac
sodium for the human SC and all SC lipid model membranes were not significant at the
0.05 level. The TL of diclofenac sodium in the case of Membrane Ia was close to 0 and ~
3.4 h shorter than TL for Membrane I. For Membrane IIa, TL can be assumed to equal 0
and was ~ 0.9 h shorter than in the case of Membrane II.
The penetration enhancer, OA, had a pronounced impact on the barrier properties
of SC lipid model membranes. A comparison of diffusion and permeation profiles, as well
as the permeability parameters, of model drugs acquired for the diffusion/permeation
across SC lipid model membranes with and without OA leads to the conclusion that the
presence of OA weakened the barrier function of Membrane I, however, surprisingly
demonstrated an opposite effect on Membrane II. The influence of OA on the bilayer
structure of SC model lipid membranes was investigated by Engelbrecht et al. (2011b). In
their neutron diffraction studies, a lipid membrane composed of Cer [AP], Chol, PA, ChS
and 10% (m/m) OA (i.e. Membrane Ia), was used. It was confirmed by use of deuterated
OA that the unsaturated FFA was incorporated into lipid bilayers of SC lipid model
membranes. It was also found that OA did not induce a change in a lamellar periodicity of
the SC lipid model membrane. However, on the other hand, OA caused increased alkyl
chain disorder and disturbed the lamellar assembly of lipids within bilayers of SC lipid
model membranes. The perturbations observed were most likely caused by the presence
of the cis double bond within OA molecules. These findings are confirmed by the results
of the present study. Because of the impairment of the barrier function of Membrane Ia
due to the presence of the penetration enhancer, diffusion and permeation of model
drugs occurred more rapidly than for the SC lipid model membrane without OA
(Membrane I). The values of J, kp and D for the diffusion and permeation of drugs through
Membrane Ia were considerably higher than for Membrane I, hence pointed at
Membrane Ia as a SC lipid model membrane with weaker barrier. The most noticeable
evidence confirming its weaker barrier properties were differences in TL values between
Membrane Ia and Membrane I. While for Membrane Ia, they were either 0 or close to 0,
in the case of Membrane I, the lag phase was well marked (amounted to ~ 3–6 h for
diffusion and permeation studies of model drugs used). To the best of our knowledge, in
the case of Membrane IIa (composed of i.a. Cer [AP] and Cer [EOS]), no studies on the
bilayer structure and the impact of the penetration enhancer on its barrier function were
carried out.

Chapter 7 Influence of penetration enhancer 97
Fig. 4. Diffusion and permeation profiles of (A) urea, (B) caffeine and (C) diclofenac sodium (across model
lipid membranes and human SC) and their model fittings. Error bars show the standard deviation (n = 4).
The diffusion and permeation profiles for the SC, Membrane I and Membrane II were presented previously
(Ochalek et al., 2012b).
Therefore, it was not possible to relate directly the distinct barrier properties of
Membrane IIa to the changes in its lipid organization. However, the results of the present
study clearly indicate that Membrane IIa has stronger barrier properties than Membrane

Chapter 7 Influence of penetration enhancer 98
II. The lower values of J and kp were characteristic for Membrane IIa. A comparison of D
values shows that for permeation of caffeine and diclofenac sodium through Membrane
IIa and Membrane II, D values were equal (α = 0.05); and for diffusion of urea, D in the
case of Membrane IIa was even larger than for Membrane II. Surprisingly, TL values of
model drugs for Membrane IIa were either equal (α = 0.05) or even slightly shorter than
for Membrane II. The reason why Membrane IIa despite the presence of the penetration
enhancer had stronger barrier properties, is most likely the different lipid composition,
hence the distinct lipid organization, of SC lipid model membranes. Membrane IIa
contained a considerable amount of Cer [EOS] and only 9% (m/m) of Cer [AP]. The long-
chain ceramide, Cer [EOS], is normally forced to fit into the membrane created by Cer
[AP] and its long alkyl chain traverses the lipid bilayer and expands into the adjacent layer
(Schroeter et al., 2009a). The presence of OA within this membrane probably improved
the lamellar ordering of SC lipids. A possible explanation for that can be a possession of
the cis double bond by OA molecule, which can more easily fit to the lipid bilayer where a
ceramide with two cis double bonds (namely Cer [EOS]) is also present. Therefore, in the
case of Membrane IIa, OA did not cause perturbations to the lamellar assembly of lipids
within bilayers of this SC lipid model membrane. The lipids within Membrane IIa were
arranged slightly tighter than in the case of Membrane II.
4. Conclusions
Diffusion and permeation studies of three model drugs covering a broad range of
lipophilicities (urea, caffeine and diclofenac sodium) were performed to investigate the
influence of physicochemical properties of drugs on their diffusion and permeation across
SC lipid model membranes in the presence of the lipophilic penetration enhancer, OA, as
well as to examine the impact of the penetration enhancer on the barrier properties of SC
lipid model membranes. Firstly, an addition of 10% (m/m) of OA to the SC lipid model
membranes did not influence the relation between the diffusion and permeation
behavior of model drugs presented previously for SC lipid model membranes devoid of
the penetration enhancer. The fastest rate of diffusion through both SC lipid model
membranes (Membrane Ia and Membrane IIa) occurred in the case of the most
hydrophilic drug, urea. For permeation studies of caffeine and diclofenac sodium across
both SC lipid model systems, the D, kp and TL values were either equal or slightly higher in
favor of the most lipophilic drug, diclofenac sodium. Secondly, the impact of the lipophilic
penetration enhancer, OA, on the barrier function of SC lipid model membranes was
Chapter 7 Influence of penetration enhancer 99
analyzed. OA caused the impairment of the barrier function of Membrane I (confirmed by
the studies on Membrane Ia), however, surprisingly increased the barrier properties of
Membrane II (easily visible when comparing diffusion and permeation profiles of model
drugs across Membrane II and Membrane IIa). Based on the results presented, it can be
assumed that OA within Membrane IIa improved the lamellar ordering of SC lipids. The cis
double bond of OA can more easily fit to the lipid bilayer where two other cis double
bonds coming from Cer [EOS] are present. As a consequence, the chain disorder of lipids
within bilayers of Membrane IIa was reduced. It resulted in the improvement of the
barrier function of the SC lipid model membrane (with Cer [EOS]) in the presence of OA.
Acknowledgements
The financial support for Michal Ochalek provided by the Institute of Applied
Dermatopharmacy (IADP) of the Martin Luther University Halle-Wittenberg is gratefully
appreciated. The authors would like to express their gratitude to Dr. A. Schroeter for her
invaluable advice and comments on the structure of SC lipid model membranes.
References
Bouwstra, J.A., Gooris, G.S., Cheng, K., Weerheim, A., Bras, W., Ponec, M., 1996. Phase behavior of isolated skin lipids. J.
Lipid Res. 37, 999-1011.
Coderch, L., Lopez, O., de la Maza, A., Parra, J.L., 2003. Ceramides and skin function. Am. J. Clin. Dermatol. 4, 107-129.
de Jager, M.W., Groenink, W., Bielsa i Guivernau, R., Andersson, E., Angelova, N., Ponec, M., Bouwstra, J.A., 2006. A
novel in vitro percutaneous penetration model: evaluation of barrier properties with p-aminobenzoic acid and two of
its derivatives. Pharm. Res. 23, 951-960.
Elias, P.M., 1983. Epidermal lipids, barrier function, and desquamation. J. Invest. Dermatol. 80, 44s-49s.
Engelbrecht, T., Hauss, T., Sueβ, K., Vogel, A., Roark, M., Feller, S.E., Neubert, R.H.H., Dobner, B., 2011a.
Characterisation of a new ceramide EOS species: synthesis and investigation of the thermotropic phase behaviour and
influence on the bilayer architecture of stratum corneum lipid model membranes. Soft Matter 7, 8998-9011.
Engelbrecht, T.N., Schroeter, A., Hauss, T., Neubert, R.H.H., 2011b. Lipophilic penetration enhancers and their impact to
the bilayer structure of stratum corneum lipid model membranes: Neutron diffraction studies based on the example
Oleic Acid. Biochim. Biophys. Acta, Biomembranes 1808, 2798-2806.
Francoeur, M.L., Golden, G.M., Potts, R.O., 1990. Oleic acid: its effects on stratum corneum in relation to (trans)dermal
drug delivery. Pharm. Res. 7, 621-627.
Funari, S.S., Barcelo, F., Escriba, P.V., 2003. Effects of oleic acid and its congeners, elaidic and stearic acids, on the
structural properties of phosphatidylethanolamine membranes. J. Lipid Res. 44, 567-575.
Groen, D., Poole, D.S., Gooris, G.S., Bouwstra, J.A., 2011. Investigating the barrier function of skin lipid models with
varying compositions. Eur. J. Pharm. Biopharm. 79, 334-342.

Chapter 7 Influence of penetration enhancer 100
Kessner, D., Kiselev, M.A., Dante, S., Hauss, T., Lersch, P., Wartewig, S., Neubert, R.H.H., 2008. Arrangement of ceramide
[EOS] in a stratum corneum lipid model matrix: new aspects revealed by neutron diffraction studies. Eur. Biophys. J.
37, 989-999.
Khazaeinia, T., Jamali, F., 2003. A comparison of gastrointestinal permeability induced by diclofenac-phospholipid
complex with diclofenac acid and its sodium salt. J. Pharm. Pharm. Sci. 6, 352-359.
Kiselev, M.A., 2007. Conformation of ceramide 6 molecules and chain-flip transitions in the lipid matrix of the
outermost layer of mammalian skin, the stratum corneum. Crystallogr. Rep. 52, 525-528.
Kiselev, M.A., Ryabova, N.Y., Balagurov, A.M., Dante, S., Hauss, T., Zbytovska, J., Wartewig, S., Neubert, R.H.H., 2005.
New insights into the structure and hydration of a stratum corneum lipid model membrane by neutron diffraction.
Eur. Biophys. J. 34, 1030-1040.
Kokate, A., Li, X., Jasti, B., 2008. Effect of drug lipophilicity and ionization on permeability across the buccal mucosa: a
technical note. AAPS PharmSciTech. 9, 501-504.
Masukawa, Y., Narita, H., Shimizu, E., Kondo, N., Sugai, Y., Oba, T., Homma, R., Ishikawa, J., Takagi, Y., Kitahara, T.,
Takema, Y., Kita, K., 2008. Characterization of overall ceramide species in human stratum corneum J. Lipid Res. 49,
1466-1476.
McIntosh, T.J., 2003. Organization of skin stratum corneum extracellular lamellae: diffraction evidence for asymmetric
distribution of cholesterol. Biophys. J. 85, 1675-1681.
McIntosh, T.J., Stewart, M.E., Downing, D.T., 1996. X-ray diffraction analysis of isolated skin lipids: reconstitution of
intercellular lipid domains. Biochemistry 35, 3649-3653.
Naik, A., Pechtold, L.A.R.M., Potts, R.O., Guy, R.H., 1995. Mechanism of oleic acid-induced skin penetration
enhancement in vivo in humans. J. Control. Release 37, 299-306.
Ochalek, M., Heissler, S., Wohlrab, J., Neubert, R.H.H., 2012a. Characterization of lipid model membranes designed for
studying impact of ceramide species on drug diffusion and penetration. Eur. J. Pharm. Biopharm. 81, 113-120.
Ochalek, M., Podhaisky, H., Ruettinger, H.-H., Wohlrab, J., Neubert, R.H.H., 2012b. SC lipid model membranes designed
for studying impact of ceramide species on drug diffusion and permeation, Part II: Diffusion and permeation of model
drugs. Eur. J. Pharm. Biopharm., doi: 10.1016/j.ejpb.2012.06.008.
Ongpipattanakul, B., Francoeur, M.L., Potts, R.O., 1994. Polymorphism in stratum corneum lipids. Biochim. Biophys.
Acta, Biomembranes 1190, 115-122.
Prades, J., Funari, S.S., Escriba, P.V., Barcelo, F., 2003. Effects of unsaturated fatty acids and triacylglycerols on
phosphatidylethanolamine membrane structure. J. Lipid Res. 44, 1720-1727.
Raudenkolb, S., Wartewig, S., Neubert, R.H.H., 2005. Polymorphism of ceramide 6: A vibrational spectroscopic and X-ray
powder diffraction investigation of the diastereomers of N-(alpha-hydroxyoctadecanoyl)-phytosphingosine. Chem.
Phys. Lipids 133, 89-102.
Robson, K.J., Stewart, M.E., Michelsen, S., Lazo, N.D., Downing, D.T., 1994. 6-Hydroxy-4-sphingenine in human
epidermal ceramides. J. Lipid Res. 35, 2060-2068.
Rowat, A.C., Kitson, N., Thewalt, J.L., 2006. Interactions of oleic acid and model stratum corneum membranes as seen
by 2H NMR. Int. J. Pharm. 307, 225-231.
Scherrer, R.A., Howard, S.M., 1977. Use of distribution coefficients in quantitative structure-activity relationships. J.
Med. Chem. 20, 53-58.
Schroeter, A., Kessner, D., Kiselev, M.A., Hauss, T., Dante, S., Neubert, R.H.H., 2009a. Basic nanostructure of stratum
corneum lipid matrices based on ceramides [EOS] and [AP]: a neutron diffraction study. Biophys. J. 97, 1104-1114.
Schroeter, A., Kiselev, M.A., Hauss, T., Dante, S., Neubert, R.H.H., 2009b. Evidence of free fatty acid interdigitation in
stratum corneum model membranes based on ceramide [AP] by deuterium labelling. Biochim. Biophys. Acta,
Biomembranes 1788, 2194-2203.
Schurer, N.Y., Plewig, G., Elias, P.M., 1991. Stratum corneum lipid function. Dermatologica 183, 77-94.

Chapter 7 Influence of penetration enhancer 101
Separovic, F., Gawrisch, K., 1996. Effect of unsaturation on the chain order of phosphatidylcholines in a
dioleoylphosphatidylethanolamine matrix. Biophys. J. 71, 274-282.
Tanojo, H., Geest, A.B.-v., Bouwstra, J.A., Junginger, H.E., Bodde, H.E., 1997. In vitro human skin barrier perturbation by
oleic acid: Thermal analysis and freeze fracture electron microscopy studies. Thermochimica Acta 293, 77-85.
Trommer, H., Neubert, R.H.H., 2006. Overcoming the stratum corneum: the modulation of skin penetration. A review.
Skin Pharmacol. Physiol. 19, 106-121.
van Smeden, J., Hoppel, L., van der Heijden, R., Hankemeier, T., Vreeken, R.J., Bouwstra, J.A., 2011. LC/MS analysis of
stratum corneum lipids: ceramide profiling and discovery. J. Lipid Res. 52, 1211-1221.
Walker, M., Hadgraft, J., 1991. Oleic-Acid - a Membrane Fluidizer or Fluid within the Membrane. Int. J. Pharm. 71, R1-
R4.
Walker, R.B., Smith, E.W., 1996. The role of percutaneous penetration enhancers. Adv. Drug Deliver. Rev. 18, 295-301.
Weerheim, A., Ponec, M., 2001. Determination of stratum corneum lipid profile by tape stripping in combination with
high-performance thin-layer chromatography. Arch. Dermatol. Res. 293, 191-199.
Wertz, P.W., 2000. Lipids and barrier function of the skin. Acta Derm. Venereol. Suppl. 208, 7-11.
Wertz, P.W., Miethke, M.C., Long, S.A., Strauss, J.S., Downing, D.T., 1985. The composition of the ceramides from
human stratum corneum and from comedones. J. Invest. Dermatol. 84, 410-412.
Wertz, P.W., van den Bergh, B., 1998. The physical, chemical and functional properties of lipids in the skin and other
biological barriers. Chem. Phys. Lipids 91, 85-96.
White, S.H., Mirejovsky, D., King, G.I., 1988. Structure of lamellar lipid domains and corneocyte envelopes of murine
stratum corneum. An X-ray diffraction study. Biochemistry 27, 3725-3732.
Williams, A.C., Barry, B.W., 2004. Penetration enhancers. Adv. Drug Deliver. Rev. 56, 603-618.
Williams, M.L., Elias, P.M., 1987. The extracellular matrix of stratum corneum: role of lipids in normal and pathological
function. Crit. Rev. Ther. Drug Carrier Syst. 3, 95-122.
Zbytovska, J., Vavrova, K., Kiselev, M.A., Lessieur, P., Wartewig, S., Neubert, R.H.H., 2009. The effects of transdermal
permeation enhancers on thermotropic phase behaviour of a stratum corneum lipid model. Colloids Surf., A 351, 30-
37.
102
8 Summary and perspectives
The molecular organization of the SC intercellular lipid matrix and its barrier
function are still vigorously discussed. There are several theoretical models of the SC lipid
matrix organization, however, none of them fully explains all structural aspects of the
human SC lipid organization. A better understanding of the interactions between
different classes of SC lipids is of great importance for the elucidation of the influence of
the SC lipid matrix components on the SC barrier function. In the first studies on the SC
organization and function, native SC lipids isolated from the mammalian skin and/or lipid
model membranes created from the extracted SC lipids were used [1-9]. However, the
complexity of such systems limits the possibility to relate differences in the SC lipid
composition to changes in the SC molecular organization and function. Therefore, well-
defined artificial SC lipid model membranes were used within the framework of this
thesis. The SC lipid model membranes composed of synthetic SC lipids offer many
advantages over the native ones. One can avoid problems like the limited availability and
high inter- and intra-individual variability of native SC membranes [10]. The most
important advantage of such systems seems to be that their composition can be
systematically modified. It offers a lot of possibilities to investigate and elucidate the role
of each individual lipid species in the SC intercellular nanostructure of the lipid matrix and
the SC barrier function on a previously unavailable level. This new approach allows also to
study the impact of the penetration enhancer on the SC lipid organization on a molecular
level, and hence to relate the alterations in the SC intercellular lipid organization to the
change in the SC barrier function. Based on such studies, one can extrapolate the results
obtained in the in vitro experiments to the in vivo situation. The main objective of this
thesis was to get a better insight into the SC intercellular lipid matrix
composition/organization–barrier function relationship based on the investigations of
simple, artificial SC lipid model membranes composed i.a. of Cer [AP] and Cer [EOS].
Firstly, a preparation method of synthetic SC lipid model membranes on a porous
substrate was developed (Chapter 5). The successful conduct of this step was of major
importance for the subsequent diffusion and permeation studies of model drugs. In order
to investigate the barrier properties of SC lipid model systems, the lipid mixture has to be
deposited in a standardized way on the substrate that does not affect the rate of
diffusion/permeation of model drugs (i.e. does not show any barrier properties). The
Nuclepore polycarbonate membrane filters turned out to be a perfect solution. In the

Chapter 8 Summary and perspectives 103
second step, the SC lipid model membranes prepared on the polycarbonate filters were
characterized by means of various analytical techniques like SAXD, HPTLC, ESEM, confocal
Raman imaging and ATR-FTIR spectroscopy. It was confirmed that the SC lipid model
membranes (Cer [AP]/Chol/PA/ChS in the m/m ratio of 55/25/15/5, and Cer [AP]/Cer
[EOS]/Chol/PA in the m/m ratio of 10/23/33/33) prepared using the preparation method
described were reproducible and of good quality. The microscopic techniques,
polarization microscopy and ESEM, confirmed that the lipids deposited on the
polycarbonate filter formed a continuous lipid layer covering the whole sprayed area of
the filter. The results of the HPTLC and confocal Raman imaging studies showed that the
individual lipid species were distributed uniformly on the filter. The SAXD confirmed that
the lipids within the SC lipid model systems formed the lamellar structure with two
present lamellar phases, however, the LPP was not observed. The probable reason of the
absence of the LPP was the simplicity of the lipid model membranes used in this project,
which were composed of only four individual lipid species and/or the absence or too low
concentration of Cer [EOS]. The diffusion experiments of a small hydrophilic compound,
urea, revealed that the SC lipid model membrane composed of Cer [AP], Chol, PA and ChS
showed very strong barrier properties, even stronger than the isolated human SC. This
effect was explained by the very simplistic composition of the lipid model membrane,
when compared to a very complex structure of the native SC. This result created also the
question concerning the importance of the LPP for the proper barrier function. It was
concluded that the proposed approach with simple lipid model systems can be applied in
order to study the SC intercellular lipid matrix composition/organization–barrier function
relationship.
To gain insights into the relation between the composition/organization of the SC
lipid model membranes and their barrier function, diffusion and permeation studies of
model drugs across the artificial and native SC membranes were performed (Chapter 6).
In these studies, three model drugs covering a broad range of lipophilicities (urea,
caffeine and diclofenac sodium) were used to acquire information on both the influence
of physicochemical properties of drugs on their diffusion and permeation across SC lipid
model membranes and the impact of the components of these systems (particularly the
different ceramide species) on their barrier function. The results of these studies showed
that the fastest diffusion through both SC lipid model membranes and the human SC
occurred in the case of the most hydrophilic model drug, urea. This outcome was
attributed to the smallest molecular weight of urea (in comparison to the other model
drugs), as well as its permeation enhancing potential for the hydrophilic pathway (hence

Chapter 8 Summary and perspectives 104
the acceleration of the process of diffusion). On the other hand, the most lipophilic drug
(diclofenac sodium) permeated faster across lipophilic SC model membranes than
caffeine, which was confirmed by larger values of D and kp in the case of diclofenac
sodium. The differences in the permeation rates of caffeine and diclofenac sodium can be
explained by their distinct partitioning properties. Furthermore, it was demonstrated that
the composition of SC lipid membranes had a significant impact on their barrier
properties. With regard to the barrier function, the SC lipid model membrane containing
Cer [AP] and Cer [EOS] was much more similar to the human SC than the SC lipid model
membrane containing only Cer [AP]. In the presence of Cer [EOS], the lipids within the SC
model systems were not arranged so tight as it is in the case of the SC lipid model
membrane consisting of Cer [AP], Chol, PA and ChS. It resulted in the faster diffusion and
permeation of model drugs across the membrane with Cer [AP] and Cer [EOS].
The final objective of this thesis was the investigation of the impact of the
penetration enhancer on the barrier properties of the SC lipid model membranes
(Chapter 7). It was demonstrated that the addition of OA to the SC lipid model
membranes did not influence the relation between the diffusion and permeation
behavior of model drugs presented previously for SC lipid model membranes devoid of
the penetration enhancer. The fastest rate of diffusion through both SC lipid model
membranes occurred in the case of urea. In the case of permeation studies of caffeine
and diclofenac sodium across both SC lipid model systems, the D, kp and TL values were
either equal or slightly higher in favor of the most lipophilic drug, diclofenac sodium. In
this study, the influence of the lipophilic penetration enhancer (OA) on the barrier
function of SC lipid model membranes was also examined. It was found that OA caused
the impairment of the barrier function of the SC lipid model membrane containing Cer
[AP], however, surprisingly improved the barrier properties of the SC lipid model
membrane with Cer [AP] and Cer [EOS]. It was concluded that OA within the SC lipid
model membrane containing Cer [AP] and Cer [EOS] improved the lamellar ordering of SC
lipids. The reason for that is most likely the presence of the cis double bond in OA
molecule, which can more easily fit to the lipid bilayer where two other cis double bonds
coming from Cer [EOS] are present. In result, the chain disorder of lipids within bilayers of
this SC lipid model membrane was reduced, hence the barrier function of the SC lipid
model membrane with Cer [AP] and Cer [EOS], in the presence of OA, was enhanced.
In summary, the results presented in this thesis show that well-defined synthetic SC
lipid model membranes can be used successfully in studies on the impact of individual SC
lipid components on the SC barrier function. Within the framework of this thesis, the

Chapter 8 Summary and perspectives 105
roles of short-chain Cer [AP] and long-chain acylceramide, Cer [EOS], in the SC
organization and barrier function were investigated. As mentioned previously, one of the
main advantages of the simplistic SC lipid model membranes described is the possibility
to modify their composition systematically. In future studies, one can use the SC lipid
model systems that differ from each other in the ratio of the SC lipid constituents and/or
in their composition. From such studies, one can gain further insights into the importance
of each lipid subclass in the proper membrane organization and barrier function.
Furthermore, other model drugs, with different molecular weights and lipophilicities, can
be used in future diffusion and permeation studies in order to confirm the results
obtained in this work describing the impact of the physicochemical properties of model
drugs on their diffusion/permeation behavior. Finally, the SC lipid model membranes
proved to be a perfect system to investigate the mode of action of penetration enhancers
at the molecular level. Therefore, the influence of other penetration enhancers on the SC
intercellular lipid matrix organization and its barrier properties can be examined in future
studies.
References
[1] S.H. White, D. Mirejovsky, G.I. King, Structure of lamellar lipid domains and corneocyte envelopes of murine
stratum corneum. An X-ray diffraction study, Biochemistry 27 (1988) 3725-3732.
[2] B. Ongpipattanakul, M.L. Francoeur, R.O. Potts, Polymorphism in stratum corneum lipids, Biochim. Biophys.
Acta, Biomembranes. 1190 (1994) 115-122.
[3] T.J. McIntosh, M.E. Stewart, D.T. Downing, X-ray diffraction analysis of isolated skin lipids: reconstitution of
intercellular lipid domains, Biochemistry 35 (1996) 3649-3653.
[4] J.A. Bouwstra, G.S. Gooris, K. Cheng, A. Weerheim, W. Bras, M. Ponec, Phase behavior of isolated skin lipids, J.
Lipid Res. 37 (1996) 999-1011.
[5] T.J. McIntosh, Organization of skin stratum corneum extracellular lamellae: diffraction evidence for asymmetric
distribution of cholesterol, Biophys. J. 85 (2003) 1675-1681.
[6] J.A. Bouwstra, G.S. Gooris, J.A. van der Spek, W. Bras, Structural investigations of human stratum corneum by
small-angle X-ray scattering, J. Invest. Dermatol. 97 (1991) 1005-1012.
[7] J.A. Bouwstra, G.S. Gooris, F.E. Dubbelaar, A.M. Weerheim, A.P. Ijzerman, M. Ponec, Role of ceramide 1 in the
molecular organization of the stratum corneum lipids, J. Lipid Res. 39 (1998) 186-196.
[8] S.E. Friberg, D.W. Osborne, Interaction of a Model Epidermal Lipid with a Vegetable Oil Adduct, J. Disper. Sci.
Technol. 8 (1987) 249-258.
[9] D. Kuempel, D.C. Swartzendruber, C.A. Squier, P.W. Wertz, In vitro reconstitution of stratum corneum lipid
lamellae, Biochim. Biophys. Acta 1372 (1998) 135-140.
[10] J.A. Bouwstra, F.E. Dubbelaar, G.S. Gooris, M. Ponec, The lipid organisation in the skin barrier, Acta Derm.
Venereol. Suppl. 208 (2000) 23-30.

106
9 Zusammenfassung und Ausblick
Die molekulare Organisation von der SC interzellulären Lipidmatrix und ihre
Barrierefunktion werden lebhaft diskutiert. Es gibt mehrere theoretische Modelle der SC-
Lipidmatrixorganisation, aber keines von ihnen erläutert völlig alle strukturellen Aspekte
der Organisation von humanem SC. Ein besseres Verständnis von Interaktionen zwischen
den verschiedenen Klassen von SC-Lipiden ist von großer Bedeutung für die Aufklärung
des Einflusses von SC-Lipidmatrixkomponenten auf die Barrierefunktion des SC. In den
ersten Studien über die SC-Organisation und Funktion wurden native, aus der Säugerhaut
isolierte SC-Lipide und/oder Lipid-Modellmembranen eingesetzt, die aus den extrahierten
SC-Lipiden präpariert wurden [1-9]. Die Komplexität solcher Systeme begrenzt die
Möglichkeit, die Unterschiede in der SC-Lipidzusammensetzung auf Veränderungen in der
molekularen Organisation und Funktion des SC zu beziehen. Daher wurden definierte
künstliche SC-Lipidmodellmembranen im Rahmen der vorliegenden Arbeit verwendet. Die
SC-Lipidmodellmembranen aus synthetischen SC-Lipiden bieten viele Vorteile gegenüber
den nativen Membranen. Man kann Probleme, wie die begrenzte Verfügbarkeit und hohe
inter- und intra-individuelle Variabilität von nativen SC-Membranen vermeiden [10]. Der
wichtigste Vorteil solcher Systeme scheint zu sein, dass ihre Zusammensetzung
systematisch modifiziert werden kann. Sie bieten viele Möglichkeiten, um die Rolle der
einzelnen Lipidspezies hinsichtlich der interzellulären Nanostruktur der Lipidmatrix und
der Barrierefunktion des SC auf einer Ebene zu untersuchen und zu erläutern, wie das
bisher nicht möglich war. Diese neue Einstellung ermöglicht auch, den Einfluss der
Penetrationsmodulatoren auf die SC-Lipidorganisation auf molekularer Ebene zu
untersuchen, und damit die Veränderungen der interzellulären Lipidorganisation des SC in
Beziehung zu Änderungen der SC-Barrierefunktion zu setzen. Basierend auf solchen
Studien kann man die erhaltenen Ergebnisse aus den in vitro-Experimente zur in vivo-
Situation extrapolieren. Das Hauptziel der vorliegenden Arbeit war es, einen besseren
Einblick in die Beziehung der interzellulären Lipidmatrixzusammensetzung/Organisation
zur Barrierefunktion zu bekommen, basierend auf den Untersuchungen an einfachen,
künstlichen SC-Lipidmodellmembranen, die unter anderem Cer [AP] und Cer [EOS]
enthielten.
Es wurde erstens ein Herstellungsverfahren von synthetischen SC-Lipidmodell-
membranen auf einem porösen Substrat entwickelt (Kapitel 5). Die erfolgreiche
Durchführung dieses Schrittes war von großer Bedeutung für die nachfolgenden

Chapter 9 Zusammenfassung und Ausblick 107
Diffusions- und Permeationsstudien von Modellarzneistoffen. Um die Barriere-
eigenschaften der SC-Lipidmodellsysteme zu untersuchen, muss die Lipidmischung auf
dem Substrat so standardisiert präpariert werden, dass sie keinen Einfluss auf die
Geschwindigkeit der Diffusion/Permeation von Modellarzneistoffen hat (d.h. dass sie
keine Barriereeigenschaften zeigt). Die Nuclepore-Membranfilter aus Polykarbonat
erwiesen sich als perfekte Lösung. Im zweiten Schritt wurden die SC-
Lipidmodellmembranen auf den Filtern aus Polykarbonat hergestellt und mittels
verschiedenen analytischen Methoden wie SAXD, HPTLC, ESEM, konfokale Raman
Imaging und ATR-FTIR-Spektroskopie charakterisiert. Es wurde bestätigt, dass die SC-
Lipidmodellmembranen (Cer [AP]/Chol/PA/ChS im m/m Verhältnis von 55/25/15/5, und
Cer [AP]/Cer [EOS]/Chol/PA im m/m Verhältnis von 10/23/33/33) unter Verwendung des
beschriebenen Herstellungsverfahrens reproduzierbar und von guter Qualität herstellbar
waren. Die mikroskopischen Techniken, Polarisationsmikroskopie und ESEM, bestätigten,
dass die Lipide eine kontinuierliche Lipidschicht auf der gesamten bearbeiteten
Oberfläche des Filters aus Polykarbonat bildeten. Die Ergebnisse der HPTLC und der
konfokalen Raman Imaging Studien zeigten, dass die einzelnen Lipidspezies homogen auf
dem Filter verteilt wurden. Die SAXD-Studien bestätigten, dass die Lipide in den SC-
Lipidmodellsystemen Nanostrukturen mit zwei lamellaren Phasen ausgebildet haben. Eine
LPP wurde jedoch nicht beobachtet. Die Gründe für das Fehlen der LPP waren
wahrscheinlich die Einfachheit der in diesem Projekt verwendeten Lipidmodell-
membranen, die nur aus vier Lipidspezies bestanden und/oder das Fehlen bzw. die zu
geringe Konzentration von Cer [EOS]. Die Diffusionsexperimente mit der kleinen
hydrophilen Substanz (Harnstoff) ergaben, dass die SC-Lipidmodellmembran, die Cer [AP],
Chol, PA und ChS enthielt, sehr starke Barriereeigenschaften zeigte, sogar stärkere als das
isolierte humane SC. Dieser Effekt wurde durch die sehr vereinfachte Zusammensetzung
der Lipid-Modellmembran, verglichen mit der sehr komplexen Struktur des nativen SC,
erklärt. Dieses Ergebnis stellte auch die Bedeutung der LPP für die ordnungsgemäße
Barrierefunktion des SC in Frage. Es wurde festgestellt, dass die vorgeschlagene
Einstellung mit einfachen Lipidmodellsystemen angewendet werden kann, um die
Relation der Zusammensetzung der interzellulären Lipidmatrix zur Barrierefunktion des
SC zu untersuchen.
Um Einblicke in die Beziehung zwischen der Komposition/Organisation von SC-
Lipidmodellmembranen und ihrer Barrierefunktion zu erhalten, wurden Diffusions- und
Permeationsstudien von Modellarzneistoffen durch die künstlichen und nativen SC-
Membranen durchgeführt (Kapitel 6). In diesen Studien wurden drei Modellarzneistoffe

Chapter 9 Zusammenfassung und Ausblick 108
mit verschiedener Lipophilie (Harnstoff, Koffein und Diclofenac-Natrium) verwendet, um
Informationen sowohl über den Einfluss der physikalisch-chemischen Eigenschaften
dieser Arzneistoffe auf ihre Diffusion und Permeation durch SC-Lipidmodellmembranen
als auch über die Auswirkungen von den Komponenten dieser Lipidmembranen (vor
allem den verschiedenen Ceramid-Klassen) auf ihre Barrierefunktion zu erhalten. Die
Ergebnisse dieser Studien zeigten, dass die schnellste Diffusion durch beide SC-
Lipidmodellmembranen und das humane SC im Fall vom hydrophilsten Modellarzneistoff
(Harnstoff) aufgetreten ist. Dieses Ergebnis wurde dem kleinen Molekulargewicht von
Harnstoff (im Vergleich zu den anderen Modellarzneistoffen) sowie seinem diffusions-
verstärkenden Potential hinsichtlich des hydrophilen Weges (daher die Beschleunigung
der Diffusion) zugeschrieben. Der lipophilste Arzneistoff (Diclofenac-Natrium) durchdrang
dagegen schneller als Koffein die lipophilen SC-Modellmembranen. Dies wurde durch
größere Werte von D und kp für Diclofenac-Natrium bestätigt. Die Unterschiede in den
Permeationsraten von Koffein und Diclofenac-Natrium können durch ihre
unterschiedliche Lipophilie erklärt werden. Es wurde weiterhin gezeigt, dass die
Zusammensetzung der SC-Lipidmembranen eine signifikante Auswirkung auf die
Barriereeigenschaften hat. In Bezug auf die Barrierefunktion, war die SC-
Lipidmodellmembran mit Cer [AP] und Cer [EOS] dem humanen SC weitaus ähnlicher als
die SC-Lipidmodellmembran nur mit Cer [AP]. In Anwesenheit von Cer [EOS] wurden die
Lipide der SC-Modellsysteme nicht so eng angeordnet, wie im Falle der SC-
Lipidmodellmembran, die Cer [AP], Chol, PA und ChS enthielt. Das führte zur schnelleren
Diffusion und Permeation der Modellarzneistoffe durch die Membran mit Cer [AP] und
Cer [EOS].
Das abschließende Ziel dieser Arbeit war die Untersuchung des Einflusses von
Penetrationsmodulatoren auf die Barriereeigenschaften der SC-Lipidmodellmembranen
(Kapitel 7). Es wurde gezeigt, dass die Zugabe von Ölsäure (OA) zu den SC-
Lipidmodellmembranen keinen Einfluss auf das Diffusions- und Permeationsverhalten der
Modellarzneistoffe hatte. Die schnellste Diffusion durch beide SC-Lipidmodellmembranen
ist im Fall von Harnstoff aufgetreten. Bei Permeationsstudien von Koffein und Diclofenac-
Natrium durch beide SC-Lipidmodellsysteme waren die Werte von D, kp und TL entweder
gleich oder etwas höher für den lipophilsten Wirkstoff, Diclofenac-Natrium. In dieser
Studie wurde der Einfluss des lipophilen Penetrationsmodulators (OA) auf die
Barrierefunktion der SC-Lipidmodellmembranen untersucht. Es wurde festgestellt, dass
OA eine Reduktion der Barrierefunktion der SC-Lipidmodellmembran mit Cer [AP]
verursacht hat, jedoch die Barriereeigenschaften der SC-Lipidmodellmembran mit Cer

Chapter 9 Zusammenfassung und Ausblick 109
[AP] und Cer [EOS] überraschend verstärkt hat. Daraus wurde geschlossen, dass OA die
lamellare Anordnung der SC-Lipide innerhalb der SC-Lipidmodellmembran mit Cer [AP]
und Cer [EOS] verbessert hat. Der Grund dafür ist wahrscheinlich die Anwesenheit der cis-
Doppelbindung im OA-Molekül, die sich leichter an die Lipiddoppelschicht anpassen kann,
wo zwei weitere cis-Doppelbindungen von Cer [EOS] vorhanden sind. Deshalb wurde die
Kettenstörung von Lipiden in Doppelschichten vom SC-Lipidmodellmembran reduziert.
Die Barrierefunktion der SC-Lipidmodellmembran mit Cer [AP] und Cer [EOS] wurde somit
in Anwesenheit von OA verstärkt.
Zusammenfassend lässt sich feststellen, dass die in der vorliegenden Arbeit
präsentierten definierten synthetischen SC-Lipidmodellmembranen in Studien über die
Auswirkungen der einzelnen SC-Lipidkomponenten auf die SC-Barrierefunktion
erfolgreich eingesetzt werden können. Im Rahmen dieser Arbeit wurde der Einfluss des
kurzkettigen Cer [AP] und des langkettigen Acylceramids, Cer [EOS], auf die Organisation
und Barrierefunktion des SC untersucht. Wie bereits erwähnt, ist der wesentliche Vorteil
der beschriebenen vereinfachten SC-Lipidmodellmembranen in der Möglichkeit zu sehen,
die Zusammensetzung der Membranen systematisch zu modifizieren. Man kann in
künftigen Studien die SC-Lipidmodellsysteme nutzen, um sowohl das Verhältnis der SC-
Lipidbestandteile als auch ihre Zusammensetzung zu variieren. Aus solchen Studien
können weitere Einblicke in die Bedeutung der einzelnen Lipidklassen für die
Membranorganisation und Barrierefunktion des SC gewonnen werden. Weiterhin können
andere Modellarzneistoffe mit unterschiedlichen Molekulargewichten und
unterschiedlicher Lipophilie in künftigen Diffusions- und Permeationsstudien eingesetzt
werden, um die Ergebnisse dieser Arbeit hinsichtlich des Einflusses der physikalisch-
chemischen Eigenschaften der Modellarzneistoffe auf ihr Diffusions-/Permeations-
verhalten zu bestätigen. Folglich scheinen die SC-Lipidmodellmembranen ein perfektes
System zu sein, um den Wirkungsmechanismus von Penetrationsmodulatoren auf
molekularer Ebene zu untersuchen. Daher kann in künftigen Studien der Einfluss weiterer
Penetrationsmodulatoren auf die interzelluläre Lipidmatrixorganisation und die
Barriereeigenschaften des SC untersucht werden.
Literaturverzeichnis
[1] S.H. White, D. Mirejovsky, G.I. King, Structure of lamellar lipid domains and corneocyte envelopes of murine
stratum corneum. An X-ray diffraction study, Biochemistry 27 (1988) 3725-3732.
[2] B. Ongpipattanakul, M.L. Francoeur, R.O. Potts, Polymorphism in stratum corneum lipids, Biochim. Biophys.
Acta, Biomembranes. 1190 (1994) 115-122.

Chapter 9 Zusammenfassung und Ausblick 110
[3] T.J. McIntosh, M.E. Stewart, D.T. Downing, X-ray diffraction analysis of isolated skin lipids: reconstitution of
intercellular lipid domains, Biochemistry 35 (1996) 3649-3653.
[4] J.A. Bouwstra, G.S. Gooris, K. Cheng, A. Weerheim, W. Bras, M. Ponec, Phase behavior of isolated skin lipids, J.
Lipid Res. 37 (1996) 999-1011.
[5] T.J. McIntosh, Organization of skin stratum corneum extracellular lamellae: diffraction evidence for asymmetric
distribution of cholesterol, Biophys. J. 85 (2003) 1675-1681.
[6] J.A. Bouwstra, G.S. Gooris, J.A. van der Spek, W. Bras, Structural investigations of human stratum corneum by
small-angle X-ray scattering, J. Invest. Dermatol. 97 (1991) 1005-1012.
[7] J.A. Bouwstra, G.S. Gooris, F.E. Dubbelaar, A.M. Weerheim, A.P. Ijzerman, M. Ponec, Role of ceramide 1 in the
molecular organization of the stratum corneum lipids, J. Lipid Res. 39 (1998) 186-196.
[8] S.E. Friberg, D.W. Osborne, Interaction of a Model Epidermal Lipid with a Vegetable Oil Adduct, J. Disper. Sci.
Technol. 8 (1987) 249-258.
[9] D. Kuempel, D.C. Swartzendruber, C.A. Squier, P.W. Wertz, In vitro reconstitution of stratum corneum lipid
lamellae, Biochim. Biophys. Acta 1372 (1998) 135-140.
[10] J.A. Bouwstra, F.E. Dubbelaar, G.S. Gooris, M. Ponec, The lipid organisation in the skin barrier, Acta Derm.
Venereol. Suppl. 208 (2000) 23-30.

111
List of Publications
Research articles
M. Ochalek, S. Heissler, J. Wohlrab, R.H.H Neubert, Characterization of lipid model
membranes designed for studying impact of ceramide species on drug diffusion and
penetration, Eur. J. Pharm. Biopharm. 81 (2012) 113–120.
M. Ochalek, H. Podhaisky, H.-H. Ruettinger, J. Wohlrab, R.H.H. Neubert, SC lipid
model membranes designed for studying impact of ceramide species on drug
diffusion and permeation, Part II: Diffusion and permeation of model drugs, Eur. J.
Pharm. Biopharm. (2012) doi: 10.1016/j.ejpb.2012.06.008.
M. Ochalek, H. Podhaisky, H.-H. Ruettinger, R.H.H. Neubert, J. Wohlrab, SC lipid
model membranes designed for studying impact of ceramide species on drug
diffusion and permeation, Part III: Influence of penetration enhancer on diffusion
and permeation of model drugs, Int. J. Pharm. (2012) doi:
10.1016/j.ijpharm.2012.06.044.
Poster presentations
M. Ochalek, Z.J. Kokot, R.H.H. Neubert,
Influence of ceramide [AP] on the structure of lipid model membranes mimicking
the stratum corneum, 5th Polish-German Symposium, Poznan, Poland, 2009
M. Ochalek, R.H.H. Neubert,
Diffusion of urea through the artificial and native membranes, 7th World Meeting on
Pharmaceutics, Biopharmaceutics and Pharmaceutical Technology, La Valetta,
Malta, 2010

112
M. Ochalek, R.H.H. Neubert,
Diffusion of model drugs through artificial and native stratum corneum membranes,
6th Polish-German Symposium, Duesseldorf, Germany, 2011
M. Ochalek, S. Heissler, J. Wohlrab, R.H.H. Neubert,
Characterization of artificial lipid model membranes mimicking human stratum
corneum intercellular lipid matrix, 12th Gordon Research Conference on Barrier
Function of Mammalian Skin, Waterville Valley, NH, USA, 2011

113
Acknowledgements
I would like to thank all people who contributed to this thesis, in particular my advisor
Prof. Dr. rer. nat. habil. Dr. h.c. Reinhard Neubert for the possibility to conduct my PhD
study in his working group at the Martin Luther University Halle-Wittenberg and for
providing a very interesting subject of my PhD thesis. Without his willingness to help,
guidance and patience, this work could not have been completed.
I would like to express my deepest gratitude to Prof. Dr. Johannes Wohlrab for providing
human skin samples, as well as careful reading of my manuscripts.
I am truly indebted and thankful to Prof. Dr. Hans-Hermann Ruettinger and Stefan
Heissler (Institute of Functional Interfaces, Karlsruhe Institute of Technology, Eggenstein-
Leopoldshafen, Germany) for the help and assistance with the capillary electrophoresis
and confocal Raman imaging measurements, respectively.
I would like to show my gratitude to Dr. Helmut Podhaisky for his help in the
development of the diffusion mathematical model and fruitful discussions on this subject.
I am obliged to Dr. Annett Schroeter and Dr. Yahya Mrestani for their support and
openness to discussions throughout my PhD study.
I am also grateful to Manuela Woigk and Heike Rudolf for a technical assistance with the
HPLC and ATR-FTIR spectroscopy experiments, respectively, and to Dieter Reese for a
construction of the ATR-FTIR diffusion cell.
Many thanks to all colleagues from the “Biopharmacy” group for providing a friendly
working atmosphere and their support during my stay in Halle.
Finally, I would like to thank my family, especially my parents and my sisters, as well as
my friends. Their support, encouragement and trust gave me strength and motivation to
get this work done.

114
Curriculum vitae
Personal details
Name: Michal Ochalek
Born: 05.03.1984 in Szamocin, Poland
Nationality: Polish
Education
1998–2002 Maria Sklodowska-Curie High School, Pila, Poland
29.05.2002 A-levels at Maria Sklodowska-Curie High School, Pila, Poland
2002–2003 Dentistry studies at the Poznan University of Medical
Sciences, Poznan, Poland
2003–2008 Pharmacy studies at the Poznan University of Medical
Sciences, Poznan, Poland
03/2008–08/2008 Conduct of the experimental part of the Master thesis in the
group of Prof. Dr. Dr. h.c. R.H.H. Neubert, Martin Luther
University Halle-Wittenberg, Halle, Germany
15.09.2008 Defense of the Master thesis: ”Synthesis of N-(α-hydroxy-
behenoyl)phytosphingosine, its stereochemical separation
and investigation by using ATR-FTIR spectroscopy and small
angle X-ray diffraction” at the Poznan University of Medical
Sciences, Poznan, Poland, Degree: MSc. Pharm.
10/2008–04/2009 Practical training at the “Herbia” Pharmacy, Poznan, Poland
12.05.2009 Approbation as a pharmacist, Poznan University of Medical
Sciences, Poznan, Poland
Professional experience
04/2009–07/2012 PhD student in the group of Prof. Dr. Dr. h.c. R.H.H. Neubert,
Department of Pharmaceutical Technology and Bio-
pharmacy, Institute of Pharmacy, Martin Luther University
Halle-Wittenberg, Halle, Germany

115
Eidesstattliche Erklärung
Hiermit erkläre ich gemäß § 5 Absatz 2b der Promotionsordnung der Natur-
wissenschaftlichen Fakultät I (Biowissenschaften) der Martin-Luther-Universität Halle-
Wittenberg, dass ich die Ergebnisse der vorliegenden Dissertationsarbeit
am Institut für Pharmazeutische Technologie und Biopharmazie der Martin-Luther-
Universität Halle-Wittenberg selbständig und ohne fremde Hilfe erarbeitet und verfasst
habe. Ferner habe ich nur die in der Dissertation angegebenen Literaturstellen und
Hilfsmittel verwendet und die entnommenen und benutzten Literaturstellen auch als
solche kenntlich gemacht. Weiterhin habe ich die vorliegende Arbeit bisher keiner
anderen Prüfungsbehörde vorgelegt.
Halle (Saale), im Juni 2012 Michal Ochalek
Barrier properties of stratum corneum lipid model membranes
based on ceramide [AP] and [EOS]
Related Documents