Barmah Choke Study INDIVIDUAL OPTIONS PHASE Final 14 April 2011

Welcome message from author
This document is posted to help you gain knowledge. Please leave a comment to let me know what you think about it! Share it to your friends and learn new things together.
Transcript

Barmah Choke Study
INDIVIDUAL OPTIONS PHASE
Final
14 April 2011

The SKM logo trade mark is a registered trade mark of Sinclair Knight Merz Pty Ltd.
Barmah Choke Study
INDIVIDUAL OPTIONS PHASE
Final
14 April 2011
Sinclair Knight Merz ABN 37 001 024 095 452 Flinders Street, Melbourne, VIC, 3000 PO Box 312, Flinders Lane, Melbourne, VIC, 8009 Malvern VIC 3144 Australia Tel: +61 3 8668 3000 Fax: +61 3 8668 3001 Web: www.skmconsulting.com
LIMITATION: This report has been prepared on behalf of and for the exclusive use of Sinclair Knight Merz Pty Ltd‟s Client, and is subject to and issued in connection with the provisions of the agreement between Sinclair Knight Merz and its Client. Sinclair Knight Merz accepts no liability or responsibility whatsoever for or in respect of any use of or reliance upon this report by any third party.

Barmah Choke Study – Individual Options Phase
SINCLAIR KNIGHT MERZ PAGE i
Preface
This report contains the results of the Individual Options Phase (Phase 3) of the Barmah Choke
Study. In that phase, a comprehensive list of 17 identified options and their sub-options were
modelled and assessed. The development of options associated with Mulwala Canal has included
input from Murray Irrigation Limited.
The Phase 3 assessment results were framed around the relative performance of options in terms of
their potential effectiveness, cost and risk. Please note that, in Phase 3, the assessment focuses on
the technical capability of each option, on its own, to address the issues associated with the Barmah
Choke. A key finding of Phase 3 is that no single option adequately addresses all of the issues;
therefore it is now necessary to move to Phase 4 to investigate the better performing options in
combination.
The outcome of Phase 4 will be a „preferred package‟ of options for managing the issues associated
with the Barmah Choke. Any significant elements of the „preferred option package‟ will be subject
to further assessment, including giving greater attention to social and economic factors, prior to
proceeding with implementation.

Barmah Choke Study – Individual Options Phase
SINCLAIR KNIGHT MERZ PAGE ii
Executive Summary
The Barmah Choke is a relatively narrow section of the River Murray through the Barmah-Millewa
Forest. The limited capacity of the Barmah Choke contributes to several operational and policy
challenges related to transferring water from upstream to downstream of the Barmah Choke.
The aim of the Barmah Choke Study is to develop an understanding of current and potential future
water supply and environmental risks associated with the Barmah Choke and other mid-river
operational issues. The study considers options, with the aim of identifying a preferred option, or
option packages, for reducing the impact of these issues while recognising that the Barmah Choke
performs an important role in flooding the Barmah-Millewa Forest.
Barmah Choke Study Objectives:
1) Reduce the incidence and magnitude of undesirable (generally unseasonal) watering of the
Barmah-Millewa Forest, thereby improving the health of the forest, and conserving water by
reducing losses.
2) Reduce the incidence and magnitude of shortfalls and rationing of diversions arising from
insufficient channel capacity for bulk water transfer to Lake Victoria.
3) Reduce the incidence and magnitude of shortfalls and rationing of diversions due to
insufficient channel capacity to meet demand during periods of peak irrigation usage and
during periods of high losses downstream of the Barmah Choke.
4) Enable flexibility to delay transfer of water from the upper Murray storages to Lake Victoria in
order to maximise conservation of water resources.
5) Provide capacity for the delivery of water trade from upstream of the Barmah Choke to
downstream of the Barmah Choke.
6) Improve the efficiency of delivering water to the icon sites.
In working toward the above objectives, future stages of the Barmah Choke Study will:
a) Maintain the beneficial influence of the Barmah Choke on the flooding regime of the Barmah-
Millewa Forest.
b) Identify any significant impacts on the frequency and magnitude of environmental and
unregulated flows in the River Murray System, with the aim to minimise these where possible.
c) Identify any significant impacts to other areas or to third parties, with the aim to minimise
these wherever possible.

Barmah Choke Study – Individual Options Phase
SINCLAIR KNIGHT MERZ PAGE iii
The Barmah Choke Study comprises four phases as shown in Figure 1:
Discovery Phase (Phase 1) (completed)
Investigation Phase (Phase 2) (completed)
Individual Option Phase (Phase 3) (current phase)
Options Integration Phase (Phase 4) (next phase).
Figure 1 Phases of the Barmah Choke Study.
The “Individual Options Phase” of the Barmah Choke Study builds upon the outputs of the
previous phases. A range of operational, policy and structural river management options shortlisted
in the previous phase are described, modelled and assessed individually. This has led to a refined
shortlist of options and recommendations on option packages for modelling and assessment in the
next phase (Phase 4).
Hydrological modelling of the options has been undertaken using MSM-Bigmod, the Murray-
Darling Basin Authority‟s combined hydrological model, which is used to simulate flow and
salinity within the Murray and Lower Darling River Systems. The model contains 114 years of
flow and climate data and has been validated against recorded data. The model is used to inform
policy development and decision making within the MDBA. It represents the current situation,
including existing infrastructure and operating arrangements, and can be used to simulate the
impact of potential or expected future conditions.
A range of options have been selected for investigation, which include changes to the way existing
infrastructure is operated or could be enhanced through construction of, for example, new
regulators or channels. These options have been individually modelled using MSM-Bigmod where
appropriate. This involved making changes to the model to represent an option, for example,
increasing the capacity of an escape or lowering the target level of a weir.
Discovery Phase(Project Plan)
Investigations
PhaseConstraints, scenarios,
problem definition &
options identification
Report
Hold
point
Hold point
Model & assess options individually, then in
combination, and recommend ‘preferred option/s’
Individual Options
PhaseModelling & Assessment
Report
Options
Integration PhaseModelling & Assessment
Report
RMS Operations Review Project
Outputs
‘Preferred Option Development’

Barmah Choke Study – Individual Options Phase
SINCLAIR KNIGHT MERZ PAGE iv
The range of options to reduce or eliminate the issues associated with the limited capacity of the
Barmah Choke can be grouped into a number of broad categories:
bypass capacity options: includes consideration of new bypasses, increasing the capacity of
existing bypasses, new escapes or increasing the capacity of existing escapes that would enable
water to be diverted around the Barmah Choke to reduce unseasonal flooding or to supply peak
demands
upper system storage options targeting unseasonal flooding: includes consideration of new
storages or modifications to existing storages upstream of the Barmah Choke that would allow
re-regulating unregulated flows (including rainfall rejections) to reduce unseasonal flooding
lower system storage options targeting shortfalls: includes consideration of new storages or
modifications to existing storages downstream of the Barmah Choke that provide flexibility to
meet peak irrigation demands
policy options: includes consideration of new policies or modifications to existing policies and
operational rules that would enable the River Murray System to be managed within the limited
capacity of the Barmah Choke without structural (construction) changes.
The following schematic diagrams (Figures 2 to 5), which are aligned to the broad categories
outlined above, provide a summary of the range of options and how they relate to the River Murray
System.
Figure 2: Schematic diagram of the River Murray System showing the location of bypass options. Bracketed numbers and letters refer to the option numbers.
Tocumwal
Mulwala Canal
Lake Mulwala Lake Hume
BARMAH CHOKE
Barmah-Millewa Forest
The DropEdward River
Wakool River
Murray River
GunbowerKoondrook-Perricoota
Forests
NSW-VIC-SA Border
Murray Mouth and Lower Lakes
Campaspe River
Tuppal & BullataleCreeks
Goulburn River
Broken Creek
Lake Eildon
Torrumbarry Weir
Goulburn Weir
Lake Victoria
Yarrawonga Main Channel
Dartmouth Reservoir
Mitta Mitta River
Murrumbidgee River
Menindee Lakes Storage
Darling River
Werai ForestEuston Weir
Lake Boga
Snowy Mountains
SchemeBillabong Creek
Loddon River
Finley Escape
Picnic Point
Kiewa River
Ovens River
Note:Schematic not to scale and does not show all weirs.
Edward Escape
Wakool River (11)(bypass route)
Edward River (12,a,b,c)(bypass route)
Bullatale Creek (9)(bypass route)
Victorian Forest Channels (10)(bypass route)
Broken Creek (13)(bypass route)
Barmah Bypass Channel (14)(indicative route)
Interconnector Channel (15)(indicative route)
Perricoota Escape (16,a,b,c)
(proposed bypass route)

Barmah Choke Study – Individual Options Phase
SINCLAIR KNIGHT MERZ PAGE v
Figure 3: Schematic diagram of the River Murray System showing the location of upper system storage options targeting unseasonal flooding. Bracketed numbers and letters refer to the option numbers.
Figure 4: Schematic diagram of the River Murray System showing the location of lower system storage options targeting shortfalls. Bracketed numbers and letters refer to the option numbers.
Tocumwal
Mulwala Canal
Lake Mulwala Lake Hume
BARMAH CHOKE
Barmah-Millewa Forest
The DropEdward River
Wakool River
Murray River
GunbowerKoondrook-Perricoota
Forests
NSW-VIC-SA Border
Murray Mouth and Lower Lakes
Campaspe River
Tuppal & BullataleCreeks
Goulburn River
Broken Creek
Lake Eildon
Torrumbarry Weir
Goulburn Weir
Lake Victoria
Yarrawonga Main Channel
Dartmouth Reservoir
Mitta Mitta River
Murrumbidgee River
Menindee Lakes Storage
Darling River
Werai ForestEuston Weir
Lake Boga
Snowy Mountains
SchemeBillabong Creek
Loddon River
Finley Escape
Picnic Point
Kiewa River
Ovens River
Note:Schematic not to scale and does not show all weirs.
Edward
Escape
The Drop (7a,b,c,d)(new storage)
Lake Mulwala (5a,b)(revised operation)
Tocumwal
Mulwala Canal
Lake Mulwala Lake Hume
BARMAH CHOKE
Barmah-Millewa Forest
The DropEdward River
Wakool River
Murray River
GunbowerKoondrook-Perricoota
Forests
NSW-VIC-SA Border
Murray Mouth and Lower Lakes
Campaspe River
Tuppal & BullataleCreeks
Goulburn River
Broken Creek
Lake Eildon
Torrumbarry Weir
Goulburn Weir
Lake Victoria
Yarrawonga Main Channel
Dartmouth Reservoir
Mitta Mitta River
Murrumbidgee River
Menindee Lakes Storage
Darling River
Werai ForestEuston Weir
Lake Boga
Snowy Mountains
SchemeBillabong Creek
Loddon River
Finley Escape
Picnic Point
Kiewa River
Ovens River
Note:Schematic not to scale and does not show all weirs.
Edward Escape
Mildura Weir (4a,b)(revised operation)
Euston Weir (6a,b,c)(revised operation)
Mid-River Storage (8)(current operation)
Combined Weirs (17)(revised operation)

Barmah Choke Study – Individual Options Phase
SINCLAIR KNIGHT MERZ PAGE vi
Figure 5: Schematic diagram of the River Murray System showing the location of policy options. Bracketed numbers and letters refer to the option numbers.
The approach adopted to evaluate options aimed to provide pertinent information required to
support and inform decision making. There were three aspects to the assessment:
1) use the hydrological models to assess the performance of the options with respect to a range of
indicators, including those related to flooding and flow delivery
2) obtain cost estimates for each option; this included both capital costs and operating costs
3) undertake a risk assessment that examined: technical feasibility, regulatory conditions,
stakeholder and community issues, demand and supply risk, environmental impact,
construction risk and operation risk.
All risks have been assessed on an unmitigated basis to aid comparison. It is acknowledged that
most (if not all) risks identified could be mitigated to an acceptable level through additional
planning, investigations or management actions but this may require a commitment of resources or
political capital by the MDBA and possibly the jurisdictions. These additional activities to reduce
risk have not been costed.
The three assessment aspects were combined to define each option such that a recommendation
could be made about their suitability for further investigation. Using this approach, recommended
options are those which combine effectiveness, acceptable cost and acceptable risk. Additional
information on the effectiveness, cost and risk of individual options can be found in Sections 6, 4
and 5 respectively.
Barmah Choke Study – Individual Options Phase
SINCLAIR KNIGHT MERZ PAGE vii
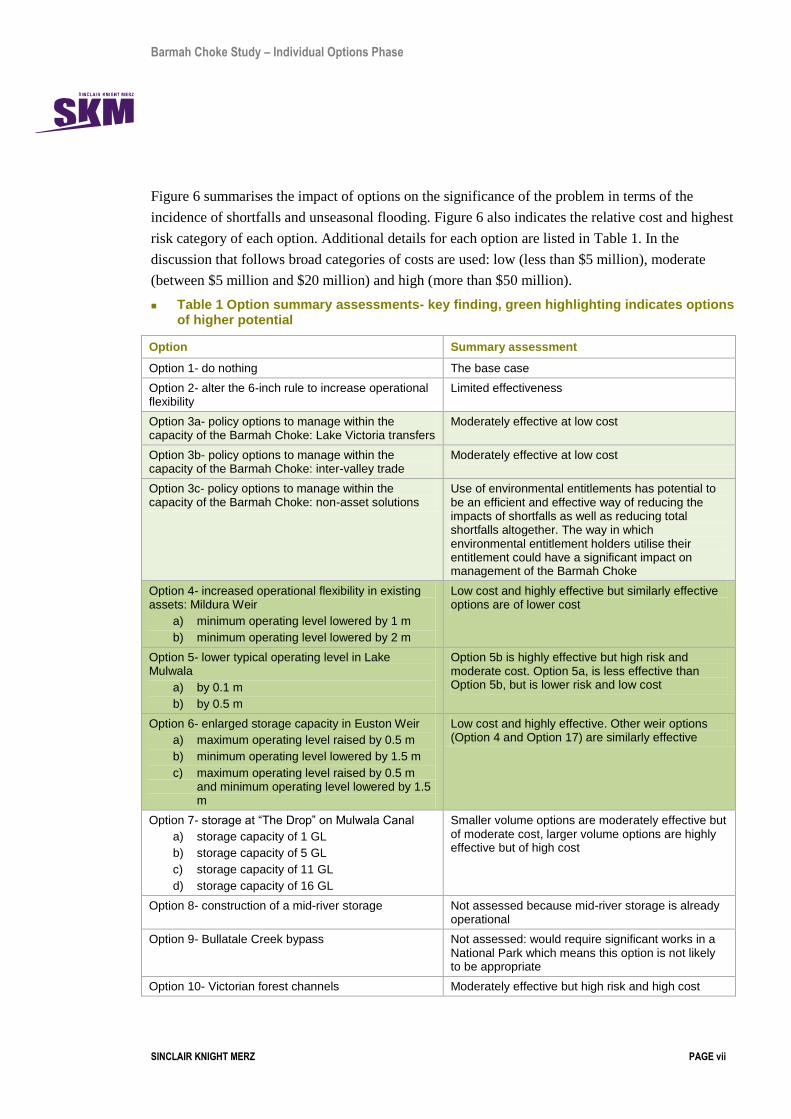
Figure 6 summarises the impact of options on the significance of the problem in terms of the
incidence of shortfalls and unseasonal flooding. Figure 6 also indicates the relative cost and highest
risk category of each option. Additional details for each option are listed in Table 1. In the
discussion that follows broad categories of costs are used: low (less than $5 million), moderate
(between $5 million and $20 million) and high (more than $50 million).
Table 1 Option summary assessments- key finding, green highlighting indicates options of higher potential
Option Summary assessment
Option 1- do nothing The base case
Option 2- alter the 6-inch rule to increase operational flexibility
Limited effectiveness
Option 3a- policy options to manage within the capacity of the Barmah Choke: Lake Victoria transfers
Moderately effective at low cost
Option 3b- policy options to manage within the capacity of the Barmah Choke: inter-valley trade
Moderately effective at low cost
Option 3c- policy options to manage within the capacity of the Barmah Choke: non-asset solutions
Use of environmental entitlements has potential to be an efficient and effective way of reducing the impacts of shortfalls as well as reducing total shortfalls altogether. The way in which environmental entitlement holders utilise their entitlement could have a significant impact on management of the Barmah Choke
Option 4- increased operational flexibility in existing assets: Mildura Weir
a) minimum operating level lowered by 1 m
b) minimum operating level lowered by 2 m
Low cost and highly effective but similarly effective options are of lower cost
Option 5- lower typical operating level in Lake Mulwala
a) by 0.1 m
b) by 0.5 m
Option 5b is highly effective but high risk and moderate cost. Option 5a, is less effective than Option 5b, but is lower risk and low cost
Option 6- enlarged storage capacity in Euston Weir
a) maximum operating level raised by 0.5 m
b) minimum operating level lowered by 1.5 m
c) maximum operating level raised by 0.5 m and minimum operating level lowered by 1.5 m
Low cost and highly effective. Other weir options (Option 4 and Option 17) are similarly effective
Option 7- storage at “The Drop” on Mulwala Canal
a) storage capacity of 1 GL
b) storage capacity of 5 GL
c) storage capacity of 11 GL
d) storage capacity of 16 GL
Smaller volume options are moderately effective but of moderate cost, larger volume options are highly effective but of high cost
Option 8- construction of a mid-river storage Not assessed because mid-river storage is already operational
Option 9- Bullatale Creek bypass Not assessed: would require significant works in a National Park which means this option is not likely to be appropriate
Option 10- Victorian forest channels Moderately effective but high risk and high cost
Barmah Choke Study – Individual Options Phase
SINCLAIR KNIGHT MERZ PAGE viii
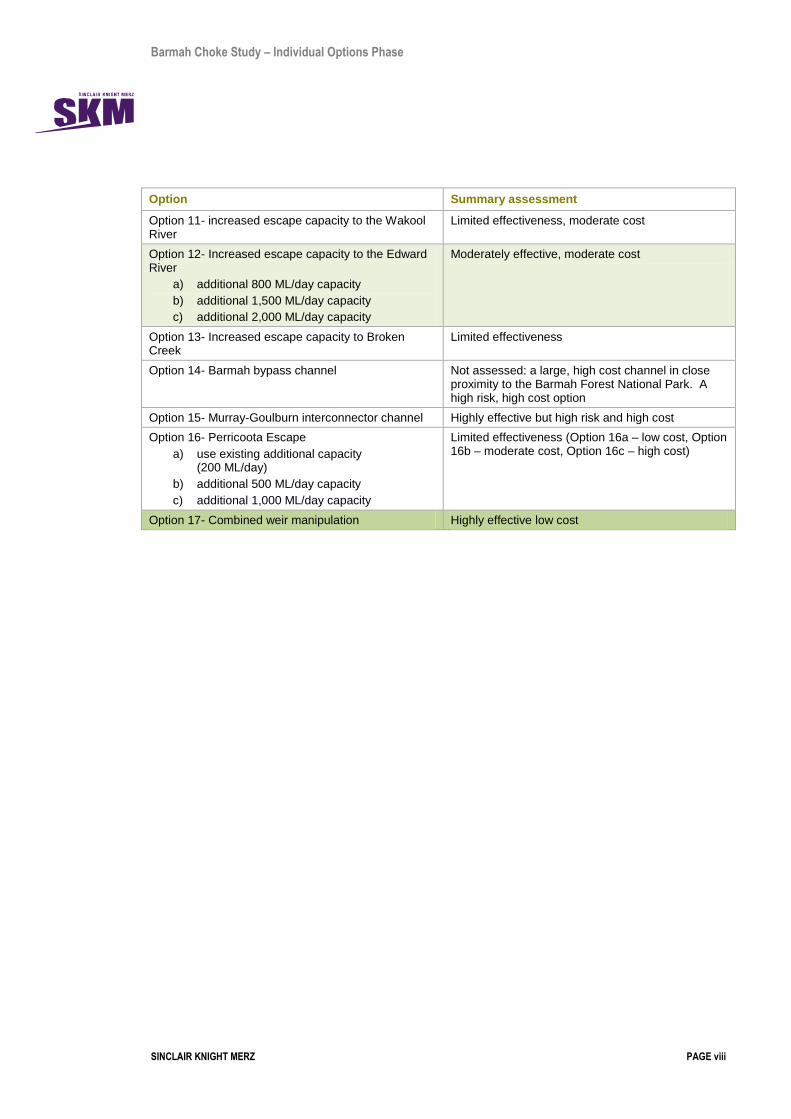
Option Summary assessment
Option 11- increased escape capacity to the Wakool River
Limited effectiveness, moderate cost
Option 12- Increased escape capacity to the Edward River
a) additional 800 ML/day capacity
b) additional 1,500 ML/day capacity
c) additional 2,000 ML/day capacity
Moderately effective, moderate cost
Option 13- Increased escape capacity to Broken Creek
Limited effectiveness
Option 14- Barmah bypass channel Not assessed: a large, high cost channel in close proximity to the Barmah Forest National Park. A high risk, high cost option
Option 15- Murray-Goulburn interconnector channel Highly effective but high risk and high cost
Option 16- Perricoota Escape
a) use existing additional capacity (200 ML/day)
b) additional 500 ML/day capacity
c) additional 1,000 ML/day capacity
Limited effectiveness (Option 16a – low cost, Option 16b – moderate cost, Option 16c – high cost)
Option 17- Combined weir manipulation Highly effective low cost

Barmah Choke Study – Individual Options Phase
SINCLAIR KNIGHT MERZ PAGE ix
Figure 6: The position of the points on each axis shows the effectiveness of options for reducing the incidence of shortfalls and unseasonal flooding; with the size of the point indicating the cost; and the colour the highest risk category for the option.
There are key findings that stand out from the plot of the results:
weir options (Option 4b, Option 6c and Option 17) are effective, low cost and significant risk
approaches to reducing shortfalls
there are no low cost, low risk options that are highly effective at reducing forest flooding
(Option 5b is high risk, Option 7d and 7c are high cost and Option 10 is both high cost and
high risk).
Bypass options involving Mulwala Canal (particularly Option 12c) are moderately effective at
reducing both shortfalls and unseasonal flooding

Barmah Choke Study – Individual Options Phase
SINCLAIR KNIGHT MERZ PAGE x
The best way forward on forest flooding would be to assess the performance of Option 5a
combined with Option 12c. The effectiveness of Option 5a and Option 7b are similar but
Option 12c is of lower cost than Option 7b.
A selection of options were modelled using three future scenarios (drier climate, post-TLM, and a
combined drier climate and post-TLM) to test the robustness of their performance. The scenario
results demonstrate that the frequency and severity of simulated shortfall events are dependent on a
number of factors. A major driver is tributary inflows over the summer period when shortfalls are
most likely to occur. Changes to irrigation demands (via change allocation due to different inflows)
also impact the results but this impact appears to have less of an effect on shortfalls than the
volume and pattern of tributary inflows downstream of Barmah Choke.
Options that involve drawing on storage downstream of the Choke have been shown to be very
effective in the three scenarios modelled.
The incidence and magnitude of unseasonal flooding is also dependent on inflows, with the dry
climate change to 2030 scenario dramatically reducing the number of unseasonal flood events,
while the post-TLM scenario increased the number of unseasonal flood events. Of the options
modelled for the scenarios which reduced unseasonal flooding, the most effective option was the
largest storage option (Option 5b) which had approximately 21 GL of active airspace. Under the
three scenarios this was still the case.
Based on the options assessment, a number of packages of options were developed (see Section 8).
From this it is recommended that the best package of options to take forward combines the
following options:
Better use of weirs downstream of the Barmah Choke to address shortfalls (a combination of
Options 4b, 6c, and 17)
Increased bypass capacity through the Mulwala Canal (Option 12c)
Allow lower (100 mm) typical operating level for Lake Mulwala (Option 5a).
Additional packages of options that may meet other criteria of the MDBA or the States (such as
those that are low cost or those able to be implemented quickly) are listed in the main report.
The results also suggest some options that can be ruled out. These are the options considered to be
inferior relative to other options being assessed. That is, there are many situations where other
options are better (more effective, less costly and less risky) and no situations where the inferior
option is better. Additionally, some options can be ruled out because they are simply too costly,
risky and lack effectiveness. The rationale for not proceeding with these options can be found in
Section 8.1. Overall, we suggest the following options are not considered further as part of the
Barmah Choke Study:

Barmah Choke Study – Individual Options Phase
SINCLAIR KNIGHT MERZ PAGE xi
Option 2: Alter the 6-inch rule to increase operational flexibility
Option 9: Bullatale Creek bypass
Option 10: Victorian Forest Channels
Option 14: Barmah bypass
Option 15: Murray-Goulburn interconnector channel.
No single option adequately addresses all of the issues; therefore it is necessary to investigate
options in combination. The fourth and final phase of the Barmah Choke Study will review the
outputs of the Individual Options Phase (Phase 3) in an integrated manner to identify and assess
potential option packages.
It is anticipated that the final outcome of the Barmah Choke Study, around late 2011, will be a
recommendation of preferred option packages. Following this, the MDBA and partner governments
will decide what further analysis and consultation is needed and whether to proceed with detailed
designs, construction and/or implementation of a range of options.

Barmah Choke Study – Individual Options Phase
SINCLAIR KNIGHT MERZ PAGE xii
List of acronyms and abbreviations
AHD Australian Height Datum
CEWH Commonwealth Environmental Water Holder
DEWHA (former) Department of Environment, Water Heritage and the Arts
EIS Environmental Impact Statement
EPBC Environmental Protection and Biodiversity Conservation (Act)
EVA End of Valley Account
G-MW Goulburn-Murray Water
ISO International Standards Organisation
IVT Inter-Valley Trade
MDB Murray-Darling Basin
MDBA Murray-Darling Basin Authority
MDBC (former) Murray-Darling Basin Commission
MIL Murray Irrigation Limited
MSM Murray Simulation Model
NSW New South Wales
NVIRP Northern Victoria Irrigation Renewal Project
NWC National Water Commission
OH&S Occupational Health and Safety
PRIDE Program for Regional Irrigation Demand Estimation
SDL Sustainable Diversion Limit
SEWPaC (Department of) Sustainability, Environment, Water, Population and Communities
SKM Sinclair Knight Merz
TLM The Living Murray
RMW (former) River Murray Water, now River Murray Division within the Authority
A glossary has also been prepared and is provided at the end of this report.

Barmah Choke Study – Individual Options Phase
SINCLAIR KNIGHT MERZ PAGE xiii
Contents
Executive Summary i
List of acronyms and abbreviations xii
1. Introduction 1
1.1. What is the Barmah Choke? 1
1.2. Objectives of the Barmah Choke Study 2
1.3. Barmah Choke Study Phasing 3
1.4. Objectives of this phase of the Barmah Choke Study 4
2. Option assessment method 5
2.1. Selecting the assessment method 5
2.2. Applying the assessment method 7
3. Options review 11
3.1. Option 1: „do nothing‟ 13
3.2. Option 2: alter 6-inch rule to increase operational flexibility 15
3.3. Option 3a: policy options to manage within the capacity of the Barmah Choke- Lake Victoria Transfers 20
3.4. Option 3b: policy options to manage within the capacity of the Barmah Choke- inter-valley trade 24
3.5. Option 3c: policy options to manage within the capacity of the Barmah Choke- non-asset solutions 29
3.6. Option 4: increased operational flexibility in existing assets: Mildura Weir 31
3.7. Option 5: lower operating level in Lake Mulwala 35
3.8. Option 6: enlarged storage capacity in Euston Weir 39
3.9. Option 7: storage at “The Drop” on Mulwala Canal 44
3.10. Option 8: construction of a mid-river storage 48
3.11. Option 9: Bullatale Creek bypass 51
3.12. Option 10: Victorian forest channels 55
3.13. Option 11: increased escape capacity to the Wakool River 59
3.14. Option 12: increased escape capacity to the Edward River 62
3.15. Option 13: increased escape capacity to Broken Creek 66
3.16. Option 14: Barmah bypass channel 69
3.17. Option 15: Murray-Goulburn interconnector channel 72
3.18. Option 16: Perricoota Escape 76
3.19. Option 17: combined weir manipulation 79
4. Option costing and risk cost analysis 82
4.1. Option costing 82

Barmah Choke Study – Individual Options Phase
SINCLAIR KNIGHT MERZ PAGE xiv
4.2. Assessment process 83
4.3. Summary of results 85
4.4. Limitations 87
4.5. Costing of additional options 87
5. Option risk assessment 88
5.1. Risk assessment process 88
5.2. Risk assessment context 88
5.3. Risk assessment results 90
5.4. Option key risk summary and mitigation 107
6. Option modelling 112
6.1. Summary of modelling methods 112
6.2. Evaluation of option effectiveness 113
6.3. Significance of the problem under the base case 114
6.4. Option evaluation 116
7. Scenarios 125
7.1. Upper system options targeting unseasonal flooding 126
7.2. Lower system storage options targeting shortfalls 127
7.3. Summary of outcomes from scenario modelling 128
8. Option package recommendations 130
8.1. Options that can be ruled out 131
8.2. Low investment options 131
8.3. Options that can be implemented quickly 131
8.4. Options to address forest flooding 132
8.5. Options to address shortfalls 132
8.6. Options with the largest environmental benefit 132
8.7. Options shared between New South Wales and Victoria 133
8.8. Best performance 133
8.9. The works 134
8.10. Other considerations 134
9. Conclusions 135
10. References 139
Glossary 143
Appendix A Detailed review of Option 3c 145
Appendix B Option modelling methods 154
Appendix C Calculation of the significance of the problem 208

Barmah Choke Study – Individual Options Phase
SINCLAIR KNIGHT MERZ PAGE xv
Appendix D Option modelling results summary 228
Appendix E Scenario modelling results summary 233
Appendix F Financial analysis of options 240

Barmah Choke Study – Individual Options Phase
SINCLAIR KNIGHT MERZ PAGE xvi
Document history and status
Revision Date issued Reviewed by Approved by Date approved Revision type
Draft A 19/11/2010 T Ladson
T Sheedy
R Molloy 22/11/2010 Draft A
Final 03/02/2011 T Ladson
T Sheedy
R Molloy
R Molloy 03/02/2011 Final
Final 12/04/2011 R Molloy R Molloy 14/04/2011 Final (edited in response to MDBA comments)
Distribution of copies
Revision Copy no Quantity Issued to
Draft A 1 Electronic MDBA (Lindsay White, Sarah Commens)
Final 1 Electronic MDBA (Lindsay White, Sarah Commens)
Final 1 Electronic MDBA (Joe Davis, Sarah Commens)
Printed: 30 June 2011
Last saved: 30 June 2011 05:33 PM
File name: I:\VWES\Projects\VW04951\Technical\5_Task 5 Reporting\R04_IndividualOptionsReport_Final (14Apr11).docx
Author: Erin Murrihy, Tony Sheedy, Tony Ladson, Dan Beasley, Andrew Herron
Project manager: Rob Molloy
Name of organisation: Murray-Darling Basin Authority
Name of project: Barmah Choke Study
Name of document: Individual Options Phase
Document version: Final
Project number: VW04951

Barmah Choke Study – Individual Option Phase
SINCLAIR KNIGHT MERZ PAGE 1
1. Introduction
1.1. What is the Barmah Choke?
The term „Barmah Choke‟ is used to describe the relatively narrow section of the River Murray
through the Barmah-Millewa Forest. In comparison to other nearby sections, the operating
capacity (near bankfull) of the Barmah Choke is small: approximately 8,000 ML/day at the
downstream end of the Barmah-Millewa Forest. Figure 1-1 shows a schematic diagram of the
River Murray System from Dartmouth Reservoir to the South Australia border, indicating the
location of the Barmah Choke.
Figure 1-1: Schematic diagram of the River Murray System.
The Barmah Choke contributes to a number of operational and policy challenges in the River
Murray System, including:
1) delivery of sufficient water to the lower Murray to meet peek irrigation demands
2) delivery of sufficient water to Lake Victoria to supply South Australia
3) management of rainfall rejection1 events that can lead to unseasonal flooding of the
Barmah-Millewa Forest
4) delivery of future environmental flows
5) constraints on the trade of water.
1 Rainfall rejections occur when a combination of reduced irrigation demands (due to rain over the
irrigation areas) and increases in inflows from unregulated tributaries lead to increased flows in the
River Murray. River levels may rise and exceed the capacity of the Barmah Choke, flooding the
Barmah-Millewa Forest (MDBC, 2008).
Tocumwal
Mulwala Canal
Lake Mulwala Lake Hume
BARMAH CHOKE
Barmah-Millewa Forest
The DropEdward River
Wakool River
Murray River
GunbowerKoondrook-Perricoota
Forests
NSW-VIC-SA Border
Murray Mouth and Lower Lakes
Campaspe River
Tuppal & BullataleCreeks
Goulburn River
Broken Creek
Lake Eildon
Torrumbarry Weir
Goulburn Weir
Lake Victoria
Yarrawonga Main Channel
Dartmouth Reservoir
Mitta Mitta River
Murrumbidgee River
Menindee Lakes Storage
Darling River
Werai ForestEuston Weir
Lake Boga
Snowy Mountains
SchemeBillabong Creek
Loddon River
Finley Escape
Picnic Point
Kiewa River
Ovens River
Note:Schematic not to scale and does not show all weirs.
Edward
Escape

Barmah Choke Study – Individual Option Phase
SINCLAIR KNIGHT MERZ PAGE 2
These operating challenges are not entirely attributable to the Barmah Choke, particularly
those where meeting peak irrigation demands requires long travel times, but may be
exacerbated by the constraints posed by the Barmah Choke.
1.2. Objectives of the Barmah Choke Study
The Barmah Choke Study aims to understand current and potential future water supply and
environmental risks and opportunities associated with the Barmah Choke and other mid-river
operational issues. The study will consider options for reducing the impact of these issues
while recognising that the Barmah Choke performs an important role in flooding the Barmah-
Millewa Forest; a Living Murray icon site incorporating two Ramsar listed sites (the Barmah
Forest in Victoria and the Central Murray Forests in New South Wales).
The Barmah Choke Study seeks to identify a preferred option, or package of integrated
options, which meet a number of objectives as outlined in the following box.
Objectives:
1) Reduce the incidence and magnitude of undesirable (generally unseasonal) watering of the
Barmah-Millewa Forest, thereby improving the health of the forest, and conserving water
by reducing losses.
2) Reduce the incidence and magnitude of shortfalls and rationing of diversions arising from
insufficient channel capacity for bulk water transfer to Lake Victoria.
3) Reduce the incidence and magnitude of shortfalls and rationing of diversions due to
insufficient channel capacity to meet demand during periods of peak irrigation usage and
during periods of high losses downstream of the Barmah Choke.
4) Enable flexibility to delay transfer of water from the upper Murray storages to Lake
Victoria in order to maximise conservation of water resources.
5) Provide capacity for the delivery of water trade from upstream of the Barmah Choke to
downstream of the Barmah Choke.
6) Improve the efficiency of delivering water to the icon sites.
In working toward the above objectives, future stages of the Barmah Choke Study will:
a) Maintain the beneficial influence of the Barmah Choke on the flooding regime of the
Barmah-Millewa Forest.
b) Identify any significant impacts on the frequency and magnitude of environmental and
unregulated flows in the River Murray System, with the aim to minimise these where
possible.
c) Identify any significant impacts to other areas or to third parties, with the aim to minimise
these wherever possible.

Barmah Choke Study – Individual Option Phase
SINCLAIR KNIGHT MERZ PAGE 3
1.3. Barmah Choke Study Phasing
The Barmah Choke Study comprises four phases as shown in Figure 1-2:
Discovery Phase (Phase 1) (completed)
Investigation Phase (Phase 2) (completed)
Individual Option Phase (Phase 3) (current phase)
Options Integration Phase (Phase 4) (next phase).
Figure 1-2: Phases of the Barmah Choke Study.
The Discovery Phase was completed in December 2007 and resulted in the preparation of the
Barmah Choke Study Project Plan (SKM, 2007).
The Investigation Phase was completed in July 2009 (SKM, 2009). The Investigation Phase
developed indicators to assess options and defined the magnitude of the problems associated
with the Barmah Choke under the base case. The Investigation Phase found that the limited
capacity of the Barmah Choke currently restricts the ability of the River Murray System to
meet the demands of irrigators and other water users and to manage high summer flows
through the Barmah-Millewa Forest. This can contribute to rationing or restrictions on supply
to Torrumbarry and Sunraysia irrigation areas and may restrict supply of South Australia‟s
entitlement. There are also local environmental issues such as unseasonal flooding which is
contributing to changes in forest vegetation communities of the Barmah-Millewa Forest
(SKM, 2009). The assessment found that these problems are likely to persist into the future,
including under climate change scenarios.
Discovery Phase(Project Plan)
Investigations
PhaseConstraints, scenarios,
problem definition &
options identification
Report
Hold
point
Hold point
Model & assess options individually, then in
combination, and recommend ‘preferred option/s’
Individual Options
PhaseModelling & Assessment
Report
Options
Integration PhaseModelling & Assessment
Report
RMS Operations Review Project
Outputs
‘Preferred Option Development’

Barmah Choke Study – Individual Option Phase
SINCLAIR KNIGHT MERZ PAGE 4
A key output of the Investigation Phase was a list of options suitable for further investigation.
This phase of the Barmah Choke Study, the Individual Option Phase, builds upon the outputs
of the previous phases. It describes and reviews each of the options identified in the
Investigation Phase and models and assesses individually each option to determine its potential
to improve the management of the River Murray System by reducing or alleviating the issues
associated with the Barmah Choke.
1.4. Objectives of this phase of the Barmah Choke Study
The Individual Option Phase comprised five key tasks, each with a specific objective:
Task 1: Options review – review and describe each of the options identified as a part of
the Investigation Phase, plus additional options and variants of options (sub-options)
identified by the MDBA and other stakeholders
Task 2: Development of an option assessment method –based on interpretation of model
outputs and other pertinent information
Task 3: Options modelling – model each of the options identified as suitable for further
investigation (from Task 1) using MSM-Bigmod as appropriate
Task 4: Options assessment – assess the options modelled in Task 3 using the method
developed in Task 2
Task 5: Reporting – report on the key outcomes and findings of this phase (Individual
Options Phase) of the Barmah Choke Study and make recommendations for the Options
Integration Phase.
This report has been prepared as a part of Task 5 and documents the key outcomes and
findings of this phase of the Barmah Choke Study.

Barmah Choke Study – Individual Option Phase
SINCLAIR KNIGHT MERZ PAGE 5
2. Option assessment method
2.1. Selecting the assessment method
An assessment method was selected to be appropriate for the data and time available following
consideration of established assessment methods. The approaches that were considered
included the following:
Cost-benefit analysis: where the full costs and benefits are quantified in a single standard
unit of measure, such as dollars in present day prices. This type of analysis aims to assess
the overall worth of a project from the perspective of the community irrespective of
whether there are „winners‟ and „losers‟. The best option would have the highest net
present value or cost-benefit ratio.
Cost-effectiveness analysis: this process outlines the costs of achieving a particular
outcome. Typically this process establishes the least cost method to achieve a particular
outcome.
Multi-criteria analysis: is a framework which allows options to be ranked or scored based
on the judged level of performance against a set of criteria. The criteria are usually
weighted to reflect their importance.
All methods are considered well founded and suited to assessment in the environmental
context. A selection process is outlined in Figure 2-1 (adapted from Hajkowicz, 2008).
Figure 2-1: Assessment selection process (adapted from Hajkowicz, 2008).

Barmah Choke Study – Individual Option Phase
SINCLAIR KNIGHT MERZ PAGE 6
Following this process, the method chosen is largely dependent on the ability to evaluate
benefits in monetary or unit terms. In this case, the likely benefits (especially those relating to
changes to agricultural productivity due to reduced shortfalls and environmental benefits
relating to flood events) were difficult to quantify in monetary terms and a single unit for
assessing cost effectiveness was not available. As such, the most appropriate assessment
method for the Barmah Choke Study is a multi-criteria analysis.
The benefits of multi-criteria analysis include the ability to incorporate the views and
perceptions of a range of stakeholders and that it can be applied to complex problems which
include monetary and non-monetary terms. Key criticisms of multi-criteria analysis are the
subjectivity and arbitrariness in the process, particularly in relation to the assigning of weights
and criteria as well as the option scoring process.
For this phase of the Barmah Choke Study, an assessment was undertaken which provided the
data required for a multi-criteria analysis. The assessment involves consideration of three
aspects for each option:
1) modelling outputs and indicators (and their interpretation) as a measure of effectiveness
2) cost estimate
3) risk assessment
These aspects were combined to provide decision makers with the pertinent information
required and to define each option such that a recommendation could be made about their
suitability for further assessment. Using this approach, favourable options are those options
which combine effectiveness, acceptable cost and acceptable risk, as shown in Figure 2-2.
Note that the assessment process stopped short of completing the multi-criteria analysis (i.e.
the options were not ranked) as it was not necessary to rank options at this stage.

Barmah Choke Study – Individual Option Phase
SINCLAIR KNIGHT MERZ PAGE 7
Figure 2-2: Selecting the favourable option(s).
2.2. Applying the assessment method
The process which has been applied to undertake the option assessment is shown in Figure 2-3.
A more detailed description of each process task is provided below.
Figure 2-3: Proposed assessment process.
Detailed modelling outputs for each option
The main indicators that have been used to evaluate the potential effectiveness of each option
is the option‟s ability to address the issues associated with the limited capacity of the Barmah
Choke, specifically, the impact of the option on the number of years with unseasonal flooding
Effective Options
Options of Acceptable
Cost
Options of Acceptable Risk
Favourable Option(s)

Barmah Choke Study – Individual Option Phase
SINCLAIR KNIGHT MERZ PAGE 8
(and the extent of the forest flooded) of the Barmah-Millewa Forest and the number of years
with shortfalls.
The impact of the option on other issues associated with the Barmah Choke including the
delivery of environmental flows, the beneficial influence of the Barmah Choke for flooding of
the Barmah-Millewa Forest and other areas or third parties has also been considered though
the use of project specific indicators developed as a part of the Investigation Phase (SKM,
2009) (summarised in Table 2-1) and the suite of MDBA standard indicators (MDB A, 2010a)
as appropriate. A description of the modelling methods is provided in Section 6.1. See
Appendix C for more detail on the indicators. The expected impact of options on constraints
on water trade is also commented upon.
Table 2-1: Project specific indicators which may be used to assess option performance.
Objective Indicator
Conservation of water resources Key allocation statistics for general security (NSW) and high and low reliability (Victoria) entitlements
Beneficial influence of the Barmah Choke
Flooding regime of the Barmah-Millewa Forest percentage of years with small and large floods in the
Barmah-Millewa Forest
maximum duration (in years) with no flood
Frequency and magnitude of environmental flows in the River Murray System: Frequency of key flooding criteria at key locations
(Koondrook/Gunbower, Hattah Lakes, Chowilla/Lindsay
Flows to South Australia Average flow to SA in excess of entitlement (GL/year)
% Years where flows to SA < 1850 GL/year
Significant impacts to other areas and third parties Maintain water levels in Lake Victoria and Menindee
Lakes for cultural heritage reasons
Avoid Werai Forest unseasonal flooding
Avoid undesirable exceedance of 25,000 ML/d downstream of Hume
Avoid undesirable exceedance of capacity of Edward and Gulpa offtakes
Maintain recreational water levels at lake Mulwala, Euston Weir
For each option, a summary of the modelling results relative to Option 1- „do nothing‟ (the
base case) has been prepared. This was based on the raw modelling and indicator outputs,
without interpretation of the impact.
Some options also required specific issues to be addressed. Where this is the case, the issues
have been explored using appropriate indicators and parameters and reported on.

Barmah Choke Study – Individual Option Phase
SINCLAIR KNIGHT MERZ PAGE 9
Undertake financial assessment including risk cost analysis
The financial assessment incorporated cost estimation and risk cost analysis processes. The
cost estimates are preliminary and have been based on item unit costs which were estimated
based on the team‟s experience from a range of similar projects. This approach is the most
appropriate at this stage of the investigation. The preliminary nature of this analysis results in
cost estimates in the range of +/- 30% accuracy.
A risk cost analysis has also been undertaken on the cost estimates. This process aims to
provide a probabilistic estimation of cost based on known cost variation ranges. The process
works by developing a probability distribution of capital costs for each of the cost items (using
three points: low estimate, best estimate and a high estimate). A Monte Carlo simulation then
runs a process of selecting a cost estimate randomly from each cost item based on its
distribution and summing these to create a total cost estimate. This is repeated up to 10,000
times to create a probabilistic estimate of cost. The median and 90th percentile cost estimates
have been reported.
This analysis of capital costs is combined with any on-going costs, such as pumping, staff or
maintenance costs, have been combined to assess the life-cycle cost of each option using a
discounted cash flow method. The cost analysis is from the perspective of the MDBA (or
government in general) and includes the direct cash costs only, not the impacts to third parties
such as irrigators.
More details on the cost estimation and risk costs analysis process, along with a summary of
the cost estimates for each option is provided in Section 4.
Outline high level risks associated with options
A high level risk assessment has also been undertaken for each option. This assessment has
considered the high level risks associated with implementing each option. This stops short of a
complete implementation risk assessment but is suitable to compare options. The risk
assessment covered the following risk types:
technical feasibility- risk that the project will not be delivered or is technically infeasible
regulatory conditions- risk that the project will be subject to significant approvals
processes
stakeholder and community- risk that the project is subject to significant community or
stakeholder opposition
demand / supply risk- risk that changes to irrigation demand and supply conditions mean
that infrastructure is being used significantly less than designed for, and potentially
obsolete
environmental risk- risk that the project construction or operation is likely to cause
unacceptable environmental damage

Barmah Choke Study – Individual Option Phase
SINCLAIR KNIGHT MERZ PAGE 10
construction cost risk- risk the project is likely to be subject to cost overruns
operation risk- risk relating to the operational requirements to implement and control the
option
The assessment was qualitative and used an evaluation of likelihood and consequence to
determine the risk level.
More detail on the risk assessment process along with a summary of the outcomes of the
assessment is included in Section 5.
Presentation of model interpretation
The results of the model interpretation process have been presented in a number of ways.
Initially, the results of the interpretation against each performance indicator is summarised in
table form as change in the indicator value from Option 1- do nothing and key findings from
these results are discussed.
Further communication of the results focuses on key outcomes. For each option the four most
important indicators are:
performance of the option in reducing shortfalls
performance of the option in decreasing unseasonal flooding
option risk
option cost.
Based on the findings of this assessment, recommendations have been made for packages of
options to meet specific objectives. It is expected that these recommendations will inform the
development of integrated option packages for the next phase of the Barmah Choke Study.
Monetising process or scoring and weighting process
While not proposed or necessary for this phase of the Barmah Choke Study, a cost-benefit
analysis or full multi-criteria analysis could be undertaken using the data gathered to date. For
a cost-benefit analysis, this would involve taking the description of impacts and „monetising‟
them. That is, assigning monetary values which will largely relate to changes in environmental
amenity and to productive changes associated with irrigation use otherwise not available due to
shortfalls. To complete a multi-criteria analysis, if required, a set of criteria and weights would
be agreed and a scoring process undertaken. Given the aims of this phase of the Barmah Choke
Study, undertaking multi-criteria analysis or cost-benefit analysis were not considered to
progress the overall Barmah Choke Study objectives in any meaningful way, nor would these
likely change the overall conclusions.

Barmah Choke Study – Individual Option Phase
SINCLAIR KNIGHT MERZ PAGE 11
3. Options review
Options to reduce or eliminate the issues associated with the limited capacity of the Barmah
Choke have been grouped into a number of broad categories:
policy options
upper system storage options targeting unseasonal flooding
lower system storage options targeting shortfalls
bypass capacity options
Policy options may include new policies or modifications to existing policies and/or
operational rules. Such options are aimed at enabling the River Murray System to be managed
within the limited capacity of the Barmah Choke without structural changes.
System storage options may include either new storages or modifications to existing storages.
Upper system storage options are based on storage upstream of the Barmah Choke and are
aimed at re-regulating unregulated flows (including rainfall rejections) to reduce unseasonal
flooding, while lower system storage options are based on storage downstream of the Barmah
Choke and are aimed at providing flexibility to meet peak irrigation demands.
Bypass capacity options may involve increasing the capacity of one or more of the potential
bypasses or the capacity of an outfall to a bypass or a combination of both or may involve
construction of a new bypass around the Barmah Choke. Such options are aimed at enabling
water to be diverted around the Barmah Choke to reduce unseasonal flooding or to supply peak
demands.
The Discovery Phase of the Barmah Choke Study identified a preliminary list of 22 options.
The Investigation Phase reviewed each of these options in light of the outcomes regarding the
significance and magnitude of the problem. The review identified 15 options with the potential
to reduce or eliminate the issues associated with the Barmah Choke and suitable for further
investigation.
A workshop was held with the River Murray System Operations Review Working Group (30
March 2010) to review each option. A key outcome of this workshop was guidance on which
options should “progress” for individual modelling and assessment and which options should
be “parked” (not considered further) at this stage. The outcomes of this workshop are
summarised in Table 3-1.
Following the workshop two additional options were included: a bypass route utilising
Perricoota Escape (Option 16) and increased operational flexibility in multiple lower system
storages (in combination) (Option 17).

Barmah Choke Study – Individual Option Phase
SINCLAIR KNIGHT MERZ PAGE 12
Table 3-1: Outcomes from the options review workshop 30 March 2010.
Option Status Comment
Option 1- do nothing Progress Base case option for comparison.
Option 2- alter the 6-inch rule to increase operational flexibility
Progress
Option 3a- policy options to manage within the capacity of the Barmah Choke: Lake Victoria transfers
Progress
Option 3b- policy options to manage within the capacity of the Barmah Choke: inter-valley trade
Progress Progression will consider a preliminary exploration of the potential for alternative rules and/or release patterns. Full optimisation will not be undertaken.
Option 3c- policy options to manage within the capacity of the Barmah Choke: non-asset solutions
Progress Concept
Not a modelling option. Progression will identify the key issues that would need to be resolved before the option could be fully considered and developed.
Option 4- increased operational flexibility in existing assets: Mildura Weir
Progress
Option 5- lower operating level in Lake Mulwala
Progress
Option 6- enlarged storage capacity in Euston Weir
Progress
Option 7- storage at “The Drop” on Mulwala Canal
Progress
Option 8- construction of a mid-river storage
Currently Operational
Whilst this option is currently operational, it is not included in the base case model. As such, this option has not been modelled at this stage but may be considered at a later stage.
Option 9- Bullatale Creek bypass Parked Parked as the proposed bypass route travels through a section of the Millewa National Park (established July 1 2010) and the works required along the bypass route may have a significant impact on the park which would be expected to be inappropriate.
Option 10- Victorian forest channels Progress
Option 11- increased escape capacity to the Wakool River
Progress
Option 12- Increased escape capacity to the Edward River
Progress
Option 13- Increased escape capacity to Broken Creek
Progress
Option 14- Barmah bypass channel Parked Parked as this option is a large, very high cost channel in close proximity to the Barmah Forest National Park.
Option 15- Murray-Goulburn interconnector channel
Progress
Option 16- Perricoota Escape Progress
Option 17- Combined weir manipulation Progress

Barmah Choke Study – Individual Option Phase
SINCLAIR KNIGHT MERZ PAGE 13
3.1. Option 1: „do nothing‟
Option description
The „do nothing‟ option represents the continuation of current demand and operating practices
into the future. It provides the base case, and other options must represent an overall
improvement from the „do nothing‟ option to be considered for implementation.
This option is based on the pre-TLM reference run scenario (MDBA, 2010) and represents pre-
TLM operating conditions with historical climate conditions.
Modelling outcomes and potential risks and opportunities
The base case or „do nothing‟ option was modelled as a part of the Investigation Phase (SKM,
2009) to establish base conditions against which the other options can be compared. During the
Investigation Phase it was found that the limited capacity of the Barmah Choke currently
restricts the ability of the River Murray System to meet the demands of irrigators and other
water users and to manage high summer flows through the Barmah-Millewa Forest.
The restricted ability to meet the demands of irrigators and other water users may result in
rationing of peak demands in Torrumbarry and Sunraysia and restrictions of supply to South
Australia. The restricted ability to manage high summer flows through the Barmah-Millewa
Forest is leading to changes in forest vegetation communities, threatening Moira Grass plains
and River Red Gums.
The Investigation Phase (SKM, 2009) also noted that the problems associated with the Barmah
Choke are likely to persist into the future, including under climate change conditions which are
expected to lead to:
increase in shortfalls, which may increase the frequency of demand rationing to
Torrumbarry and Sunraysia and restrictions on supply to South Australia due to the
differential impact of climate change on inflows across the River Murray System
reduction in the frequency and severity of unseasonal flooding, reducing the impact of
unseasonal flooding; however it is unlikely that the forest would return to natural
conditions, as the flood characteristics (volume and duration) would remain different
(lower peak volume and reduced duration) to those observed under natural conditions.
Note that, due to model improvements since the Investigation Phase, the base case has been re-
modelled for the Individual Option Phase and the base case conditions have been revised. The
revised base case conditions are presented in Section 6.3, however the re-modelling of the base
case has not led to a change in the key findings of the Investigation Phase as summarised
above.

Barmah Choke Study – Individual Option Phase
SINCLAIR KNIGHT MERZ PAGE 14
Option 1: do nothing
Description
Option 1 represents the continuation of current demand and operating practices into
the future
this option provides a base case against which options must represent an overall
improvement to be further considered
Modelling outcomes
limited capacity of the Barmah Choke currently restricts the ability of the River Murray
System to meet the demands of irrigators and other water users and to manage high
summer flows through the Barmah-Millewa Forest. These issues are likely to persist
into the future
Potential risks and opportunities
risk the current issues will continue, or potentially worsen, into the future.

Barmah Choke Study – Individual Option Phase
SINCLAIR KNIGHT MERZ PAGE 15
3.2. Option 2: alter 6-inch rule to increase operational flexibility
Option description
The 6-inch rule limits the rate of fall of river level at Doctors Point downstream of Hume
Reservoir to a maximum of 6-inches (150 mm) per day. This rule was “adopted to provide
adequate warning of river level changes, and to minimise bank slumping” (River Murray
Water, 2006) and is the most conservative „rate of fall‟ rule being applied in the Murray-
Darling Basin (Earth Tech, 2007). The location of Doctors Point where the 6-inch rule is
applied is shown in Figure 3-1.
Figure 3-1: Schematic diagram of the River Murray System showing the location of
Doctors Point where the 6-inch rule is applied.
The 6-inch rule limits the ability to respond to rapidly changing conditions in two ways:
may limit the rate of reduction or releases at the end of the irrigation season when demand
for water is rapidly decreasing
limits the rate of reduction of releases during rainfall rejection event.
Despite the conservatism imposed by the 6-inch rule, the exact origin of the selection of 6-
inches as the maximum drawdown rate is unknown, but it relates to concerns about bank
erosion and slumping. According to Nation and Ladson (2008) “The first mention of a 6-inch
drawdown limit at Doctors Point is in a letter from the River Murray Commission to the
Electricity Commission of New South Wales on 25 November 1955 in relation to operation of
a proposed power station at Hume Dam” (page 2).
In more recent years, the basis of the 6-inch rule has been questioned. Green (1999)
investigated river drawdown and bank stability, finding that bank erosion is the result of
Doctors Point(just downstream of
Kiewa River Confluence)
Tocumwal
Mulwala Canal
Lake Mulwala Lake Hume
BARMAH CHOKE
Barmah-Millewa Forest
The DropEdward River
Wakool River
Murray River
GunbowerKoondrook-Perricoota
Forests
NSW-VIC-SA Border
Murray Mouth and Lower Lakes
Campaspe River
Tuppal & BullataleCreeks
Goulburn River
Broken Creek
Lake Eildon
Torrumbarry Weir
Goulburn Weir
Lake Victoria
Yarrawonga Main Channel
Dartmouth Reservoir
Mitta Mitta River
Murrumbidgee River
Menindee Lakes Storage
Darling River
Werai ForestEuston Weir
Lake Boga
Snowy Mountains
SchemeBillabong Creek
Loddon River
Finley Escape
Picnic Point
Kiewa River
Ovens River
Note:Schematic not to scale and does not show all weirs.
Edward Escape

Barmah Choke Study – Individual Option Phase
SINCLAIR KNIGHT MERZ PAGE 16
numerous processes, not just drawdown. This combined with the potential increase in
flexibility that could be achieved, has led to suggestions that the 6 inch rule be reviewed.
Earth Tech (2007) undertook a detailed literature review of the 6 inch rule, complemented by
field and laboratory analysis. This review found bank slumping was not the primary driver of
erosion along this reach and that benefits could be achieved without significant risks of
negative outcomes (such as increased risk of erosion) by increasing the maximum allowable
rate of fall in specific circumstances. Through the analysis undertaken, and discussions with
River Murray Water staff (now the River Murray Division within the Authority), Earth Tech
(2007) proposed a more flexible 6-inch rule as follows:
1) June to December inclusive, no change, the maximum rate of fall will remain restricted to
150 mm/day (6 inches) at Doctors Point2 and 200 mm/day (8 inches) at Heywoods
3
2) January to May inclusive, the maximum daily rate of fall will be increased to 225 mm/day
(9 inches) at Doctors Point and Heywoods, however the average daily rate of fall over four
days will be retained at 150 mm/day (6 inches) at Doctors Point and 200 mm/day (8
inches) at Heywoods
3) When flows at Doctors Point are less than 12,000 ML/day, the maximum rate of fall will
remain restricted to 150 mm/day (6 inches) at Doctors Point and 200 mm/day (8 inches) at
Heywoods at all times.
Modelling of this option is based on adoption of the adjusted rule proposed by Earth Tech.
Modelling outcomes
Increasing the maximum rate of fall during the unseasonal flooding period would enable river
operators to respond more rapidly to decreased demand. This would be expected to reduce
unseasonal flooding of the Barmah-Millewa Forest by a small amount during smaller rainfall
runoff events by allowing releases to be reduced more quickly initially.
This was confirmed by modelling results (see Section 6) which indicated that this option
would lead to less than a 1% reduction in the number of years each side of the Barmah-
Millewa Forest is wet unseasonally.
Whilst it has been suggested that this option would be effective at reducing unseasonal
flooding, the effectiveness of this option is limited by the requirement to retain an average
daily rate of fall over four days of 150 mm/day (6 inches) at Doctors Point. Figure 3-2 and
Figure 3-3 show examples of the revised 6 inch rule in operation.
2 Doctors Point is the site of the flow gauging station on the River Murray approximately 17 km
downstream of Lake Hume, just downstream of the Kiewa River confluence. 3 Heywoods is the site of the flow gauging station on the River Murray approximately 1.2 km
downstream of Lake Hume.

Barmah Choke Study – Individual Option Phase
SINCLAIR KNIGHT MERZ PAGE 17
Figure 3-2. Comparison of River Murray flow at Doctor‟s Point in March and April
2006 under Option 1 (do nothing) and Option 2.
Figure 3-3. Comparison of River Murray flow at Doctor‟s Point in April and May 1999
under Option 1 (do nothing) and Option 2
0
5000
10000
15000
20000
25000
30000D
oct
ors
Po
int
Flo
w (
ML/
day
)
Date
Do Nothing
6 Inch Rule
0
5000
10000
15000
20000
25000
18
/04
/19
99
20
/04
/19
99
22
/04
/19
99
24
/04
/19
99
26
/04
/19
99
28
/04
/19
99
30
/04
/19
99
2/0
5/1
99
9
4/0
5/1
99
9
6/0
5/1
99
9
8/0
5/1
99
9
10
/05
/19
99
12
/05
/19
99
14
/05
/19
99
16
/05
/19
99
18
/05
/19
99
20
/05
/19
99
22
/05
/19
99
24
/05
/19
99
26
/05
/19
99
28
/05
/19
99
30
/05
/19
99
Do
cto
rs P
oin
t Fl
ow
(M
L/d
ay)
Date
Do Nothing
6 Inch Rule

Barmah Choke Study – Individual Option Phase
SINCLAIR KNIGHT MERZ PAGE 18
The modelling results indicate that this option would not impact on the incidence or magnitude
of shortfalls or the delivery of environmental flows (indicated by the incidence of beneficial
flooding of TLM icon sites). Additionally, this option would not be expected to impact on
constraints on water trade, as it does not impact on the volume of water that can be delivered to
below the Barmah Choke during the irrigation season.
Potential risks and opportunities
Reducing the occurrence of unseasonal flooding would be expected to improve the health of
the Barmah-Millewa Forest. Reducing the occurrence of unseasonal flooding would also be
expected to improve opportunities for summer forest tourism activities by reducing the risk of
key recreational sites being inundated. It may also improve summer access through the forest
for tourism, management and emergency response by reducing the risk of key access paths
being inundated. This may improve the recreational value of, and access to, the Barmah-
Millewa Forest.
The 6-inch rule is currently in place to minimise the risk of bank slumping along the river
between Lake Hume and Lake Mulwala. Earth Tech (2007) found that bank slumping was not
the primary driver of erosion along this reach and to increase the operational flexibility they
proposed changes to the 6-inch rule. However, there may still be a risk that altering the 6-inch
rule would lead to an increased risk of erosion in the main stem of the Murray due to bank
slumping (Earth Tech, 2007). This risk would need to be carefully monitored if this option is
implemented.
Additionally, downstream of Hume Reservoir there are a number of anabranch systems which
interact with the main stem of the River Murray. Earth Tech (2007) recognised that increased
rates of fall may be amplified in the anabranch systems and may change the frequency of
cease- and commence-to-flow conditions to the anabranches. One anabranch of particular
concern is Ryan Creek, which is separated from the River Murray by a weir (Ryan Creek
Weir) with a commence-to-flow threshold of approximately 12,000 ML/day.
To ensure the frequency of cease- and commence-to-flow conditions for Ryan Creek were not
affected by the changes to the 6 inch rule, the increased rate of fall would not apply when flow
was below 12,000 ML/day. Due to a lack of data, the potential amplification of rates of rise in
the anabranch systems was not assessed. The nature and magnitude of the potential
amplification of rates of fall in the anabranch systems, and any measure required to mitigate
potential impacts, would need to be further investigated.
Barmah Choke Study – Individual Option Phase
SINCLAIR KNIGHT MERZ PAGE 19
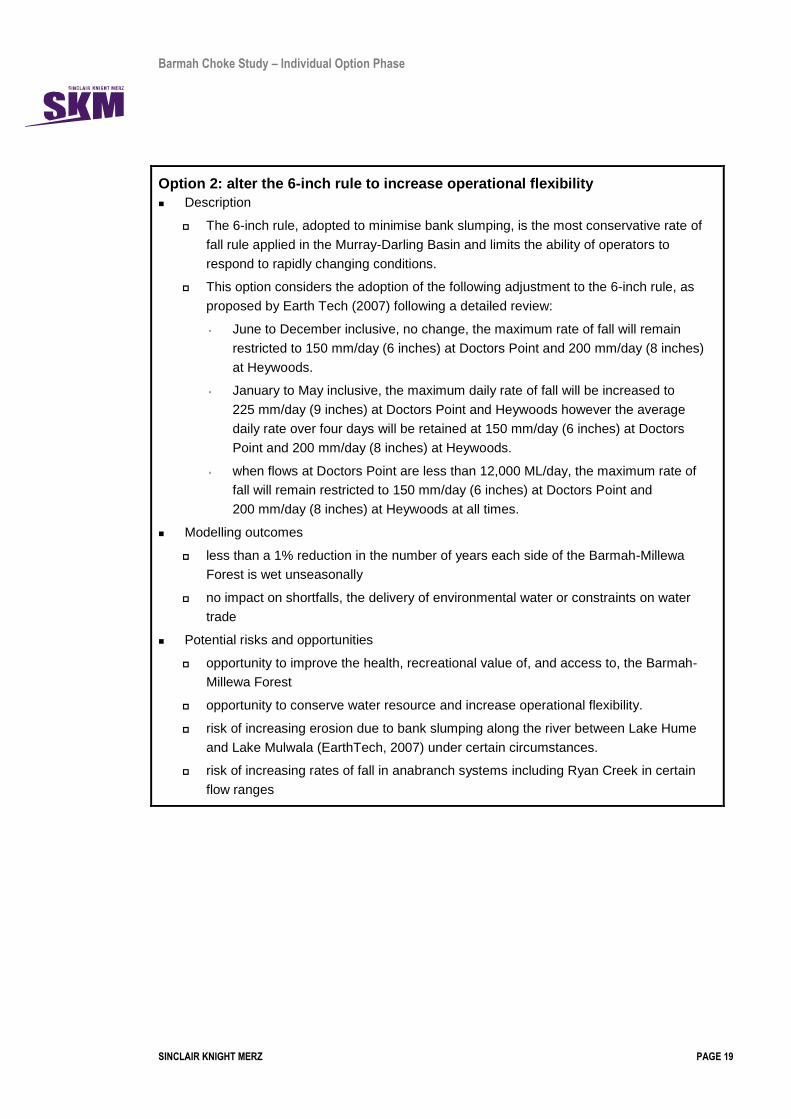
Option 2: alter the 6-inch rule to increase operational flexibility
Description
The 6-inch rule, adopted to minimise bank slumping, is the most conservative rate of
fall rule applied in the Murray-Darling Basin and limits the ability of operators to
respond to rapidly changing conditions.
This option considers the adoption of the following adjustment to the 6-inch rule, as
proposed by Earth Tech (2007) following a detailed review:
◦ June to December inclusive, no change, the maximum rate of fall will remain
restricted to 150 mm/day (6 inches) at Doctors Point and 200 mm/day (8 inches)
at Heywoods.
◦ January to May inclusive, the maximum daily rate of fall will be increased to
225 mm/day (9 inches) at Doctors Point and Heywoods however the average
daily rate over four days will be retained at 150 mm/day (6 inches) at Doctors
Point and 200 mm/day (8 inches) at Heywoods.
◦ when flows at Doctors Point are less than 12,000 ML/day, the maximum rate of
fall will remain restricted to 150 mm/day (6 inches) at Doctors Point and
200 mm/day (8 inches) at Heywoods at all times.
Modelling outcomes
less than a 1% reduction in the number of years each side of the Barmah-Millewa
Forest is wet unseasonally
no impact on shortfalls, the delivery of environmental water or constraints on water
trade
Potential risks and opportunities
opportunity to improve the health, recreational value of, and access to, the Barmah-
Millewa Forest
opportunity to conserve water resource and increase operational flexibility.
risk of increasing erosion due to bank slumping along the river between Lake Hume
and Lake Mulwala (EarthTech, 2007) under certain circumstances.
risk of increasing rates of fall in anabranch systems including Ryan Creek in certain
flow ranges

Barmah Choke Study – Individual Option Phase
SINCLAIR KNIGHT MERZ PAGE 20
3.3. Option 3a: policy options to manage within the capacity of the Barmah Choke- Lake Victoria Transfers
Option description
Lake Victoria may be used to supplement Murray River flows to supply South Australia‟s
requirements. The Lake Victoria Operating Strategy (Murray-Darling Basin Ministerial
Council, 2002) provides rules for the filling and drawing down of Lake Victoria as follows:
from 1 June, Lake Victoria is filled from River Murray unregulated flows (aim to fill as
late as possible)
from February to May, Lake Victoria is drawn down to supply South Australia based on a
target drawdown curve, supplemented by River Murray flows as required (these rules can
be relaxed slightly when upstream resources are low).
These rules mean that in years when volumes in Lake Victoria are low (and South Australian
entitlement flow is high), releases may be needed from upper system storages (Lake Hume) to
meet demands during the peak of the irrigation season. This can result in capacity constraints
in the Barmah Choke leading to shortfalls. The issues are also compounded by the travel time
between upper storages and Lake Victoria. Figure 3-4 shows the Lake Hume to Lake Victoria
transfer route on a schematic diagram of the River Murray System.
Figure 3-4: Schematic diagram of the River Murray System showing the Lake Hume to Lake Victoria transfer route.
This option considers modifications to the rules governing transfers from Lake Hume to Lake
Victoria. These rules would result in the transfer of water to Lake Victoria earlier in the
season, increasing available resources in Lake Victoria and allowing a lower transfer rate
during the peak irrigation season. Whilst this has occurred on occasion in the past, this option
would consider transferring water to Lake Victoria earlier in the season.
Lake Victoria Transfers
Tocumwal
Mulwala Canal
Lake Mulwala Lake Hume
BARMAH CHOKE
Barmah-Millewa Forest
The DropEdward River
Wakool River
Murray River
GunbowerKoondrook-Perricoota
Forests
NSW-VIC-SA Border
Murray Mouth and Lower Lakes
Campaspe River
Tuppal & BullataleCreeks
Goulburn River
Broken Creek
Lake Eildon
Torrumbarry Weir
Goulburn Weir
Lake Victoria
Yarrawonga Main Channel
Dartmouth Reservoir
Mitta Mitta River
Murrumbidgee River
Menindee Lakes Storage
Darling River
Werai ForestEuston Weir
Lake Boga
Snowy Mountains
SchemeBillabong Creek
Loddon River
Finley Escape
Picnic Point
Kiewa River
Ovens River
Note:Schematic not to scale and does not show all weirs.
Edward Escape

Barmah Choke Study – Individual Option Phase
SINCLAIR KNIGHT MERZ PAGE 21
To model the transfer of water from Lake Hume to Lake Victoria earlier in the season, this
option would increase the monthly minimum target storage for Lake Victoria outside of the
unseasonal flooding period (to encourage greater transfers before the start of the unseasonal
flooding period) and would reduce the volume of channel capacity downstream of Yarrawonga
that may be used for transfers over the unseasonal flooding period as summarised in Table 3-2.
Note that while this is just one possible combination of new targets, this option was assessed to
give an indication of the potential of this option, rather than identify the optimal option
arrangements. If the results indicate this option may be suitable for implementation, further
investigation to determine the optimal arrangements would be required.
Table 3-2: Changes to minimum storage target and channel capacity used for transfers used to model the transfer of water from Lake Hume to Lake Victoria earlier in the season for Option 3a.
Month
Lake Victoria monthly minimum storage target (GL)
Monthly channel capacity downstream of Yarrawonga used for
transfers (GL)
Base Case Option 3a Base Case Option 3a
June 140 164 328.6 328.6
July 140 164 425 425
August 180 250 425 425
September 200 300 425 425
October 200 400 501 501
November 200 400 661 661
December 200 300 661 661
January 200 200 425 425
February 200 200 328.6 186
March 200 200 296.8 168
April 180 180 328.6 186
May 250 165 318 160
Modelling outcomes
Transferring water to Lake Victoria earlier in the season would provide increased flexibility to
manage lower system demands by increasing the volume of water in storage in the lower
Murray system, reducing call on upper system storages. This would be expected to lead to a
reduction in the incidence and magnitude of lower system storage (type II) shortfall events.
Modelled results (see Section 6) found that this option would lead to a 21% reduction in the
number of years with shortfall events, in particular the number of years with lower system
storage (type II) shortfall events has halved (from seven years under the base case to three
years).

Barmah Choke Study – Individual Option Phase
SINCLAIR KNIGHT MERZ PAGE 22
The modelling results also found that this option would lead to a 7% reduction in the number
of years each side of the Barmah-Millewa Forest is wet unseasonally. Reducing pressure on
the Barmah Choke to deliver Lake Victoria transfers over the unseasonal flooding period
means that the Barmah Choke may be operated at a lower level in some years. This provides
additional buffer capacity to absorb rainfall rejections within the river channel, leading to a
reduction in unseasonal flooding.
The modelling results indicate that this option would not impact on the delivery of
environmental water (indicated by the incidence of beneficial flooding of TLM icon sites).
This option may reduce the time that the Barmah Choke is at capacity during the irrigation
season, however the magnitude of this impact is not expected to be sufficient to impact
(reduce) constraints on water trade.
Potential risks and opportunities
This option would be expected to lead to a reduction in the incidence and magnitude of lower
system storage (type II) shortfall events which may have a number of positive social and
economic impacts.
Evaporation rates from Lake Victoria are significantly higher than evaporation rates from the
upper system storages. Storing additional water in Lake Victoria rather than in upper system
storages may increase the volume of total evaporation. This, together with the increased risk of
spill from Lake Victoria may result in a very minor reduction in available water resources (the
modelling results indicate no change in water availability (allocations)).
The existing operating rules for Lake Victoria (Murray-Darling Basin Ministerial Council,
2002) were developed to meet the needs of foreshore vegetation and sites of significance for
indigenous cultural heritage which are sensitive to the influences of water levels. The impact
of any modification to the operating strategy on foreshore vegetation and significant
indigenous cultural heritage sites would need to be considered, however, as future operations
would still need to comply with the Lake Victoria Operating Strategy and meet the objectives
and conditions of the (section 90) consent to operate, the risk of significant impact would be
expected to be low.

Barmah Choke Study – Individual Option Phase
SINCLAIR KNIGHT MERZ PAGE 23
Option 3a: policy options to manage within the capacity of the Barmah Choke- Lake Victoria transfers
Description
this option considers increasing the monthly minimum target storage for Lake Victoria
outside of the unseasonal flooding period, and reducing the volume of channel
capacity downstream of Yarrawonga used for Lake Hume to Lake Victoria transfers
during the unseasonal flooding period to transfer more water from Lake Hume to Lake
Victoria earlier in the season
Modelling outcomes
21% reduction in the number of years with shortfall events, with a particular reduction
in the number of years with lower system storage (type II) shortfall events
7% reduction in the number of years each side of the Barmah-Millewa Forest is wet
unseasonally
no impact on the delivery of environmental flows or constraints on water trade
Potential risks and opportunities
opportunity to reduce the incidence and magnitude of lower system storage (type II)
shortfall events leading to social and economic benefit
risk of reduced resource availability due to increased evaporation and increased risk of
spills from Lake Victoria due to less re-regulation capacity
low risk of potential negative impact on foreshore vegetation and sites of significance
for Indigenous cultural heritage (operations would continue to comply with the Lake
Victoria Operating Strategy and section 90 consent)

Barmah Choke Study – Individual Option Phase
SINCLAIR KNIGHT MERZ PAGE 24
3.4. Option 3b: policy options to manage within the capacity of the Barmah Choke- inter-valley trade
Option description
In recent years there have been significant volumes of entitlement (permanent) and allocation
(temporary) trade out of both the Goulburn and Murrumbidgee systems (NWC, 2010). This
has created inter-valley trade credits on both systems which could be used to meet peak
irrigation demands on the River Murray System. The available water from the Goulburn
system is approximately 110 GL per year and while not modelled, since 1997 there has been
up to 70 GL per year from the Murrumbidgee system. Improved use of inter-valley trade has
the potential to decrease problems caused by capacity constraints at the Barmah Choke.
Figure 3-5 shows the main sources of inter-valley trade credits to the River Murray System on
a schematic diagram.
Figure 3-5: Schematic diagram of the River Murray System showing the main
sources of inter-valley trade credits to the River Murray System.
This option considers modifications to the rules for the order and release of inter-valley trade
credits, with the revised release rules developed specifically to manage shortfalls.
Within MSM-Bigmod, supply to the River Murray System from the inter-valley trade accounts
is based on fixed calling rules and patterns. To model this option, the fixed calling patterns for
release of water from the Goulburn inter-valley trade account were adjusted such that more
water could be released during the months shown to have the greatest incidence of shortfalls
under the base case (Option 1). Note that within MSM-Bigmod there is no water in the
Murrumbidgee inter-valley trade account, so this account was not investigated.
Adjust Use of IVT(Goulburn and Murrumbidgee Rivers)
Tocumwal
Mulwala Canal
Lake Mulwala Lake Hume
BARMAH CHOKE
Barmah-Millewa Forest
The DropEdward River
Wakool River
Murray River
GunbowerKoondrook-Perricoota
Forests
NSW-VIC-SA Border
Murray Mouth and Lower Lakes
Campaspe River
Tuppal & BullataleCreeks
Goulburn River
Broken Creek
Lake Eildon
Torrumbarry Weir
Goulburn Weir
Lake Victoria
Yarrawonga Main Channel
Dartmouth Reservoir
Mitta Mitta River
Murrumbidgee River
Menindee Lakes Storage
Darling River
Werai ForestEuston Weir
Lake Boga
Snowy Mountains
SchemeBillabong Creek
Loddon River
Finley Escape
Picnic Point
Kiewa River
Ovens River
Note:Schematic not to scale and does not show all weirs.
Edward
Escape

Barmah Choke Study – Individual Option Phase
SINCLAIR KNIGHT MERZ PAGE 25
An example of how the inter-valley trade works is outlined in Figure 3-6. This shows that for
an example 100 GL account using the IVT release pattern from the Option 1- do nothing
model. In November up to 5 GL can be used for trade out of the Goulburn system. In
December any entitlement from November which is not used plus 21.3 GL can be traded out of
the Goulburn system. This process continues all the way through to March where 44.4 GL plus
any available entitlement from November through to March can be traded out of the Goulburn
system.
Figure 3-6: Example showing the operation of the Goulburn System IVT account under Option 1- do nothing.
The adjustment to the fixed calling pattern for this option is shown in Table 3-3. Note that
while this is just one possible set of new release rules, this option is assessed to give an
indication of the potential, rather than identify the optimal option arrangements. If the results
indicate this option may be suitable for implementation, further investigation would be
required to determine preferred release rules.
5 5 5 5 5
21.3 21.3 21.3 21.3
9.4 9.4 9.4
19.9 19.9
44.4
0
10
20
30
40
50
60
70
80
90
100
November December January February March
Tran
sfe
r En
titl
em
en
t (G
L)
Month
Minimum March Entitlement
Minimum February Entitlement
Minimum January Entitlement
Minimum December Entitlement
Minimum November Entitlement

Barmah Choke Study – Individual Option Phase
SINCLAIR KNIGHT MERZ PAGE 26
Table 3-3: Changes to the maximum fraction of the remaining End of Valley Account (EVA) balance that can be used this month (Goulburn system) for Option 3b.
Month
Maximum fraction of the remaining EVA balance that can be used this month
Base Case Option 3b
January 0.357 0.651
February 0.556 0.957
March 1.000 1.000
April 0.000 0.000
May 0.000 0.000
June 0.000 0.000
July 0.000 0.000
August 0.000 0.000
September 0.000 0.000
October 0.000 0.000
November 0.050 0.000
December 0.263 0.199
Modelling outcomes
Modification of the rules for ordering and releasing inter-valley trade credits would increase
flexibility to manage peak demands by allowing inter-valley transfer flows to be used to help
meet demands downstream of the Barmah Choke. This would be expected to reduce the
incidence and magnitude of shortfall events.
The use of this option to manage peak demand (type I) shortfalls (typically large volume, rapid
onset shortfalls) may be limited by the long travel times between the release points (e.g. Lake
Eildon for the Goulburn River) and the River Murray. However this option would be expected
to provide significant flexibility for managing lower system storage (type II) shortfalls (which
are generally longer in duration).
The use of this option may also be limited by the availability of inter-valley trade water during
times of shortfalls. Historical trade trends indicate that inter-valley trade is highest (number of
trades) when allocations are low and the capacity of the Barmah Choke is not acting as a
constraint.
Modelling results (see Section 6) found that this option would lead to an 11% reduction in the
number of years with shortfall events, in particular the option would lead to a 30% reduction in
the number of years with lower system storage (type II) shortfall events (from seven years
under the base case to five years).

Barmah Choke Study – Individual Option Phase
SINCLAIR KNIGHT MERZ PAGE 27
Modelling results also found that this option would lead to a 3% reduction in the number of
years each side of the Barmah-Millewa Forest is wet unseasonally. Concentrating the delivery
of inter-valley trade transfers during the peak demand months means that the Barmah Choke
may be operated at a lower level in some years. This provides increased capacity to contain the
additional flows caused by rainfall rejections within the river channel, leading to a reduction in
unseasonal flooding.
The modelling results indicate that this option would not impact on the delivery of
environmental water (indicated by the incidence of beneficial flooding of TLM icon sites).
This option would affect the timing of tributary inflows to the River Murray System (from the
Goulburn and Murrumbidgee Rivers) however the total volume of inflows over the irrigation
season would not change (this may slightly change the total volume of water which must be
transferred from upstream to downstream of the Barmah Choke to meet irrigation demands due
to changes in the timing of other tributary inflows). As the changes would be expected to be
minor, this option is not expected to impact on constraints on water trade.
Potential risks and opportunities
This option would be expected to lead to a reduction in the incidence and magnitude of lower
system storage (type II) shortfall events, which may have positive social and economic
impacts.
However, concerns exist about the need to supply large volumes of inter-valley trade credits
through the lower reaches of the Goulburn and Murrumbidgee rivers. Water to supply trade
credits would most likely be released during the summer and autumn peak of the irrigation
season. This may affect the flow regime of these rivers. There may also be losses associated
with delivering inter-valley trade credits at high flow rates through these systems (for example,
loses to the Lowbidgee wetlands along the Murrumbidgee River).
The volume of water available would also depend on allocations in the Murrumbidgee and
Goulburn River systems, and the volume of trade that has occurred (variable). As noted above,
historical trade trends indicate that inter-valley trade is highest (number of trades) when
allocations are low and the capacity of the Barmah Choke is not acting as a constraint to the
downstream transfer of water. This may limit the ability of this option to manage shortfalls.
Implementing this option would also require a high level of cooperation between the MDBA
and State water agencies.

Barmah Choke Study – Individual Option Phase
SINCLAIR KNIGHT MERZ PAGE 28
Option 3b: policy options to manage within the capacity of the Barmah Choke- inter-valley trade
Description
this option considers modifications to the rules for the order and release of inter-valley
trade credits from the Goulburn System. The revised rules would be developed
specifically to manage shortfalls, concentrating the use of releases from inter-valley
trade accounts during periods most likely to experience shortfalls.
Modelling outcomes
11% reduction in the number of years with shortfall events, with a particular reduction
in the number of years with lower system storage (type II) shortfall events
3% reduction in the number of years each side of the Barmah-Millewa Forest is wet
unseasonally
no impact on the delivery of environmental flows or constraints on water trade
Potential risks and opportunities
opportunity to reduce the incidence and magnitude of lower system storage (type II)
shortfall events leading to social and economic benefits
available water will vary annually depending on allocations and the volume of trade,
risk that water will not be available when required
implementation will require the cooperation of State water agencies
risk of potential impacts on the flow regime of the rivers where the inter-valley trade
credits are generated.

Barmah Choke Study – Individual Option Phase
SINCLAIR KNIGHT MERZ PAGE 29
3.5. Option 3c: policy options to manage within the capacity of the Barmah Choke- non-asset solutions
Assessing non-asset solutions is often a critical requirement of funding agencies when
assessing capital program bids. Should a business case be developed in the future for a capital
program for the Barmah Choke, it will need to consider non-asset solutions. Non-asset
solutions require important consideration as they can mean significant avoided costs,
especially where large capital investments are proposed.
This section provides an overview of potential non-asset solutions that could be used to
manage the impacts of capacity constraints in the Barmah Choke and recommends whether
they should be investigated further based on their potential to deliver an efficient and effective
solution.
The non-asset solutions assessed include:
tradable capacity shares
covenants or options on entitlements
use of environmental entitlements
incentive or congestion pricing measures.
It is important to note that the non-asset solutions considered (apart from environmental
entitlements) cannot reduce the incidence or magnitude of shortfalls and they are not expected
to have an impact on undesirable flooding of the Barmah-Millewa Forest. The primary purpose
is to provide a solution that enables river operators and the irrigation community to manage the
impact of shortfalls effectively (and efficiently). By reducing the impact of peak demand (type
I) and lower system storage (type II) shortfalls, these non-asset solutions can achieve a number
of positive social and economic impacts at low cost (noting some will have distributional
impacts which will require consideration).
The solutions considered (except for the use of environmental entitlements) may also
encourage improved irrigation efficiency and alternatives to using water in peak periods (e.g.
on-farm storages). A signal of the value of water during peak times may encourage investment
in local solutions such as on-farm storage.
Each of the solutions is discussed in more detail in Appendix A, however a summary of the
results is provided in Table 3-4. Note, these solutions are an investigation option only; no
hydrological modelling was undertaken and it remains a preliminary assessment only.

Barmah Choke Study – Individual Option Phase
SINCLAIR KNIGHT MERZ PAGE 30
Table 3-4: Summary of assessment of non-asset solutions.
Solution Effectiveness Efficiency Comment
Tradable capacity shares
While this solution offers a neat way of managing the congestion, difficulties in establishing a well functioning market reduces the efficiency
Covenants or options on entitlements
This option is likely to be costly and without an appropriate legislative backing would not be effective.
Use of environmental entitlements
Has potential to be an efficient and effective way of reducing the impacts of shortfalls as well as reducing total shortfalls altogether.
Incentive or congestion pricing measures
Difficult to assess whether pricing would provide the necessary incentives to change behaviour. Therefore not considered effective.
It is recommended that further modelling is undertaken to better understand the impact of
environmental entitlements and their use to reduce the incidence of shortfalls. The key
requirement will be to understand the anticipated use of environmental water and use this
understanding in modelling. Development of appropriate rules is likely to require discussion
between the CEWH and the MDBA.

Barmah Choke Study – Individual Option Phase
SINCLAIR KNIGHT MERZ PAGE 31
3.6. Option 4: increased operational flexibility in existing assets: Mildura Weir
Option description
Mildura Weir (Lock 11) is located on the River Murray at Mildura upstream of the Darling
River confluence. Mildura Weir raises water levels in the River Murray to provide a constant
water level for diversions to the Sunraysia irrigation district and private diverters and to
maintain navigation for recreational users. Figure 3-7 shows the location of Mildura Weir on a
schematic diagram of the River Murray System.
Figure 3-7: Schematic diagram of the River Murray System showing the location of Mildura Weir.
Mildura Weir currently operates to a full supply level of 34.4 m AHD. Current operating
practice is to maintain the weir at full supply level throughout the irrigation season with a
tolerance of ± 50 mm.
The primary aim of this option in relation to the Barmah Choke Study is the management of
shortfalls. This option requires Mildura Weir to be kept at full supply level through the
irrigation season and temporarily drawn down (and refilled at the earliest opportunity) to avoid
shortfalls by supplying demands when sufficient water cannot be supplied from upper system
storage (no change to the target operating level).
SMEC (2002) investigated the potential to lower the operating level of Mildura Weir for
specific periods of time during summer and autumn to dry out wetlands adjacent to the weir
pool; however appropriate maximum drawdown levels were not specified. Note that weir pool
lowering for this purpose would be expected to require longer periods of drawdown than is
proposed for this option to allow wetlands to drain and dry out. The normal maximum
Mildura Weir(Lock 11)
Tocumwal
Mulwala Canal
Lake Mulwala Lake Hume
BARMAH CHOKE
Barmah-Millewa Forest
The DropEdward River
Wakool River
Murray River
GunbowerKoondrook-Perricoota
Forests
NSW-VIC-SA Border
Murray Mouth and Lower Lakes
Campaspe River
Tuppal & BullataleCreeks
Goulburn River
Broken Creek
Lake Eildon
Torrumbarry Weir
Goulburn Weir
Lake Victoria
Yarrawonga Main Channel
Dartmouth Reservoir
Mitta Mitta River
Murrumbidgee River
Menindee Lakes Storage
Darling River
Werai ForestEuston Weir
Lake Boga
Snowy Mountains
SchemeBillabong Creek
Loddon River
Finley Escape
Picnic Point
Kiewa River
Ovens River
Note:Schematic not to scale and does not show all weirs.
Edward
Escape

Barmah Choke Study – Individual Option Phase
SINCLAIR KNIGHT MERZ PAGE 32
drawdown level of Mildura Weir is approximately 3.5 m (30.9 m AHD) and the weir is
routinely (every few years) drawn down to this level for maintenance.
This option considers two alternative sub-options for temporarily lowering the water level at
Mildura Weir (alternative lower levels):
Option 4a: minimum operating level lowered by 1.0 m to 33.4 m AHD, accessing 10 GL
of active storage over the „do nothing‟ option
Option 4b: minimum operating level lowered by 2.0 m to 32.4 m AHD, accessing 20 GL
of active storage over the „do nothing‟ option
Note that before implementing this option the MDBA would need to confirm that the degree of
flexibility proposed for this option can be achieved without significant structural modification
to the weir and lock. The 2010 upgrade to the weir to improve the ease and safety of operation
is believed to have provided the required degree of flexibility.
Modelling outcomes
Lowering the minimum operating level of Mildura Weir while maintaining the target storage at
full supply level would increase the mid-river storage capacity, which may be used to
supplement flow to meet demands when sufficient water cannot be supplied from upper system
storages. This would be expected to reduce the incidence and magnitude of shortfall events.
The use of this option to manage lower system storage (type II) shortfalls (generally long in
duration and of large volume) may be limited by the volume of drawdown water available.
However, this option is expected to provide flexibility for managing peak demand (type I)
shortfalls with the option providing a volume of water that can be drawn upon to mitigate a
shortfall event.
Modelling results (see Section 6) indicate that this option would lead to a reduction in the
number of years with shortfall events of between 43% and 54% (for a 1 m and 2 m lowering of
the minimum operating level respectively).
Due to the spreadsheet based assessment approach adopted for this option the impact on
unseasonal flooding of the Barmah-Millewa Forest and other key project issues has not been
simulated. However, as this option only changes operations through the Barmah Choke by
requiring additional flows to be delivered following the end of the drawdown event to re-fill
Mildura Weir, this option is not expected to significantly impact on unseasonal flooding of the
Barmah-Millewa Forest or the delivery of environmental flows. This is based on an assessment
of the coincidence of shortfall events ending with an unseasonal flooding event. This option
does not impact on the total volume of water which must be transferred from upstream to
downstream of the Barmah Choke to meet irrigation demands (Mildura Weir would need to be

Barmah Choke Study – Individual Option Phase
SINCLAIR KNIGHT MERZ PAGE 33
re-filled after each drawdown event). As such, this option is not expected to impact on
constraints on water trade.
Potential risks and opportunities
This option would be expected to lead to a reduction in the incidence and magnitude of peak
demand (type I) shortfall events, which may have a number of positive social and economic
impacts.
Weir pool lowering to improve the health of surrounding wetlands and forest areas (red gums)
would be expected to require longer periods of drawdown than is proposed for this option to
allow wetlands to drain and dry out. However, some complementary benefits may still be
possible if lowering the water level in Mildura Weir pool during summer or autumn, even for
short periods of time, has the potential to improve the health of the surrounding wetlands and
forest areas (red gums) by moving towards a more natural flow regime (reduced summer
inundation) (SKM, 2005).
Lowering the minimum operating level of Mildura Weir may have some negative impacts on:
recreational use of Mildura Weir; reducing the operating level will reduce the area
available for boating and houseboating (including mooring and boat ramps). Lowering the
operating level may also increase safety risks associated with activities such as boating,
houseboating and water skiing with an increased risk of incidents with submerged debris
(logs and snags). This may affect tourism to the area, with a number of social and
economic impacts.
pumped diversions from the weir pool; the weir pool raises water levels to enable pumped
diversions for private diverters. Depending on the extent of the drawdown some pumps
may need to be modified (including extensions to suction lines) or replaced.
The presence of the weir lowers salinity in the weir pool and river downstream of Mildura.
During weir lowering exercises for routine maintenance, salinity levels in the weir pool rise,
requiring careful monitoring and management, including releases of dilution flows from
upstream. The extent to which this issue limits the suitability of this option is not clear and
should be investigated if the option is progressed. As the weir would only be drawn down for
short periods of time, the salinity impacts are not expected to impact on the option‟s viability
as the current arrangements used when the weir is drawn down for maintenance could be used.

Barmah Choke Study – Individual Option Phase
SINCLAIR KNIGHT MERZ PAGE 34
Option 4: increased operational flexibility in existing assets – Mildura Weir
Description
Mildura Weir would be operated at the target storage (full supply level of 34.4 m AHD)
throughout the irrigation season and drawn down to minimum operating level as
follows to supply demands and avoid shortfalls:
◦ Option 4a: minimum operating level lowered by 1.0 m to 33.4 m AHD (10 GL of
active storage)
◦ Option 4b: minimum operating level lowered by 2.0 m to 32.4 m AHD (20 GL of
active storage)
Modelling outcomes
43% to 54% reduction in the number of years with shortfall events (Option 4a and
Option 4b respectively)
no impact on unseasonal flooding of the Barmah-Millewa Forest, the delivery of
environmental flows or constraints on water trade
Potential risks and opportunities
opportunity to reduce the incidence and magnitude of peak demand (type I) shortfalls
leading to social and economic benefits
◦ opportunity to improve the health of wetland and forest areas (red gum)
surrounding Mildura Weir
risk of negative impacts on weir and river salinity
risk of negative impacts on recreational use

Barmah Choke Study – Individual Option Phase
SINCLAIR KNIGHT MERZ PAGE 35
3.7. Option 5: lower operating level in Lake Mulwala
Option description
Lake Mulwala operating rules state the minimum operating level to be 124.6 m AHD and the
full supply level to be 124.9 m AHD; however it is noted that the level can be surcharged to
125.15 m AHD for short periods if necessary (for example, to reduce unseasonal flooding)
(SKM, 2009). During the irrigation season, the normal operating range of Lake Mulwala is
124.6 m AHD to 124.9 m AHD with a target level of 124.7 m AHD. These levels are required
to maintain gravity supplies to the Yarrawonga Main Channel and Mulwala Canal. Note that
this operating regime is simulated in the model using a target level of 124.6 m AHD.
Lowering the minimum (and normal) operating level of Lake Mulwala over the unseasonal
flooding period would provide air space in the lake which can be used to capture and re-
regulate rainfall rejections upstream of the Barmah Choke, reducing unseasonal flooding of the
Barmah-Millewa Forest. Figure 3-8 shows the location of Lake Mulwala on a schematic
diagram of the River Murray System.
Figure 3-8: Schematic diagram of the River Murray System showing the location of
Lake Mulwala.
The potential to lower the minimum and normal operating level has been investigated in
previous studies including SKM (2006c) and SMEC (2002). SMEC (2002) investigated the
potential for lowering the minimum and normal operating level by 0.5 m to 124.1 m AHD.
SKM (2006c) investigated a range of potential lowering options between 0.1 m and 1.0 m,
finding that lowering options between 0.1 m and 0.5 m were similarly cost effective and
similarly ranked in a multi-criteria analysis.
This option considers two alternative sub-options (alternative lower levels):
Lake Mulwala
Tocumwal
Mulwala Canal
Lake Mulwala Lake Hume
BARMAH CHOKE
Barmah-Millewa Forest
The DropEdward River
Wakool River
Murray River
GunbowerKoondrook-Perricoota
Forests
NSW-VIC-SA Border
Murray Mouth and Lower Lakes
Campaspe River
Tuppal & BullataleCreeks
Goulburn River
Broken Creek
Lake Eildon
Torrumbarry Weir
Goulburn Weir
Lake Victoria
Yarrawonga Main Channel
Dartmouth Reservoir
Mitta Mitta River
Murrumbidgee River
Menindee Lakes Storage
Darling River
Werai ForestEuston Weir
Lake Boga
Snowy Mountains
SchemeBillabong Creek
Loddon River
Finley Escape
Picnic Point
Kiewa River
Ovens River
Note:Schematic not to scale and does not show all weirs.
Edward Escape
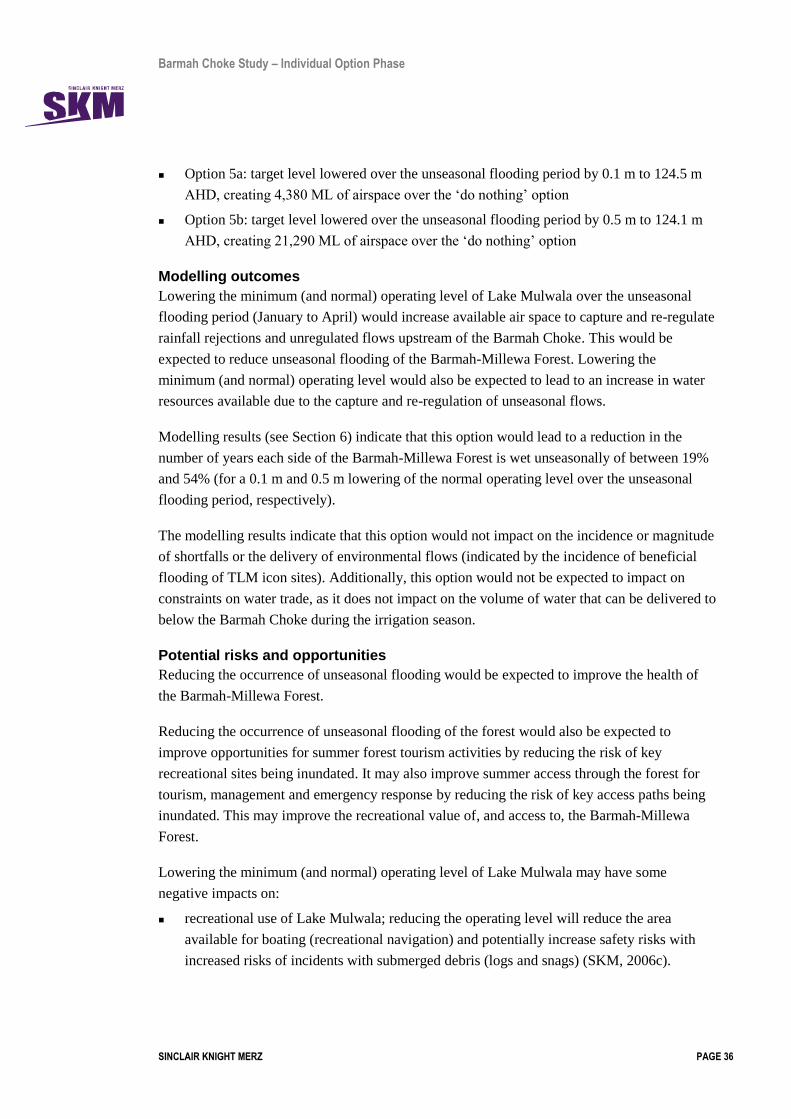
Barmah Choke Study – Individual Option Phase
SINCLAIR KNIGHT MERZ PAGE 36
Option 5a: target level lowered over the unseasonal flooding period by 0.1 m to 124.5 m
AHD, creating 4,380 ML of airspace over the „do nothing‟ option
Option 5b: target level lowered over the unseasonal flooding period by 0.5 m to 124.1 m
AHD, creating 21,290 ML of airspace over the „do nothing‟ option
Modelling outcomes
Lowering the minimum (and normal) operating level of Lake Mulwala over the unseasonal
flooding period (January to April) would increase available air space to capture and re-regulate
rainfall rejections and unregulated flows upstream of the Barmah Choke. This would be
expected to reduce unseasonal flooding of the Barmah-Millewa Forest. Lowering the
minimum (and normal) operating level would also be expected to lead to an increase in water
resources available due to the capture and re-regulation of unseasonal flows.
Modelling results (see Section 6) indicate that this option would lead to a reduction in the
number of years each side of the Barmah-Millewa Forest is wet unseasonally of between 19%
and 54% (for a 0.1 m and 0.5 m lowering of the normal operating level over the unseasonal
flooding period, respectively).
The modelling results indicate that this option would not impact on the incidence or magnitude
of shortfalls or the delivery of environmental flows (indicated by the incidence of beneficial
flooding of TLM icon sites). Additionally, this option would not be expected to impact on
constraints on water trade, as it does not impact on the volume of water that can be delivered to
below the Barmah Choke during the irrigation season.
Potential risks and opportunities
Reducing the occurrence of unseasonal flooding would be expected to improve the health of
the Barmah-Millewa Forest.
Reducing the occurrence of unseasonal flooding of the forest would also be expected to
improve opportunities for summer forest tourism activities by reducing the risk of key
recreational sites being inundated. It may also improve summer access through the forest for
tourism, management and emergency response by reducing the risk of key access paths being
inundated. This may improve the recreational value of, and access to, the Barmah-Millewa
Forest.
Lowering the minimum (and normal) operating level of Lake Mulwala may have some
negative impacts on:
recreational use of Lake Mulwala; reducing the operating level will reduce the area
available for boating (recreational navigation) and potentially increase safety risks with
increased risks of incidents with submerged debris (logs and snags) (SKM, 2006c).

Barmah Choke Study – Individual Option Phase
SINCLAIR KNIGHT MERZ PAGE 37
diversions to Yarrawonga Main Channel; a target level of 124.75 m AHD is required to
maintain full capacity supplies to Yarrawonga Main Channel. (3,100 ML/day). Reducing
the operating level would reduce the ability to run the Yarrawonga Main Channel at
capacity. To ensure supplies are not compromised, the 8 Mile Measuring Weir on the
Yarrawonga Main Channel may need to be removed and additional modifications may be
required on the main channel depending on the extent of the lowering (SMEC, 2002).
Diversions to Mulwala Canal are not expected to be affected.
operation of the fishway; reducing the operating level will reduce the operating head
available for the existing fishway (required to generate appropriate flow conditions to
attract fish). The exit race of the fishway may need to be modified to maintain its
efficiency (SMEC, 2002).
hydro-power station operation; reducing the operating level will reduce the operating head
available for the hydro-power station. The log boom at the entrance to the hydro-power
generator may need to be modified (SMEC, 2002).
The potential impact on recreational use of Lake Mulwala, is likely to raise community
concern. The MDBA remains committed to the “Lake Mulwala Land and On-water
Management Plan”. The plan, originally developed and released in 2004 by Goulburn-Murray
Water and the former MDBC, states that:
“In the specific case of looking for options to better manage rain rejections at Lake
Mulwala in order to achieve healthier outcomes in the Barmah-Millewa Forest, there
will need to be extensive economic and social impact studies, specifically relating to
Lake Mulwala. These studies have not been commenced, nor even scoped.” (G-MW,
2004)
This statement still holds. In 2008, an addendum to the plan was released by Goulburn-Murray
Water and the MDBA which, without changing the original plan, included specific actions and
strategies relevant to the current (dry conditions) operating environment (G-MW, 2008).
The addendum stated that in relation to options to better manage rainfall rejections (all options,
including a lower operating level in Lake Mulwala) the MDBA would:
complete any necessary environmental, social and economic studies
consider a wide range of engineering and operational responses
present the findings of these studies to the community as the basis for meaningful
discussion
hold discussions with the community
report the findings of those discussions to the Murray-Darling Basin Ministerial Council,
which will determine what, if any, changes to current operating rules will be implemented,
including any works to facilitate such changes.

Barmah Choke Study – Individual Option Phase
SINCLAIR KNIGHT MERZ PAGE 38
Option 5: lower operating level in Lake Mulwala
Description
Lake Mulwala would be operated at a lower minimum (and normal) level over the
unseasonal flooding period to provide airspace in the lake, which could be used to
capture and re-regulate rainfall rejections upstream of the Barmah Choke as follows:
◦ Option 5a: target level lowered over the unseasonal flooding period by 0.1 m to
124.5 m AHD (4,380 GL of air space)
◦ Option 5b: target level lowered over the unseasonal flooding period by 0.5 m to
124.1 m AHD (21,290 ML of airspace)
Modelling outcomes
19% to 54% reduction in the number of years each side of the Barmah-Millewa Forest
is wet unseasonally (Option 5a and Option 5b, respectively)
no impact on shortfalls, the delivery of environmental flows or constraints on water
trade
Potential risks and opportunities
opportunity to improve the health, recreational value of, and access to, the Barmah-
Millewa Forest
opportunity to conserve water resources (capture and re-regulate rainfall rejections)
risk of potential negative impacts on recreational use of Lake Mulwala
risk to operation of fishway, hydro-power station and 8 Mile Measuring Weir

Barmah Choke Study – Individual Option Phase
SINCLAIR KNIGHT MERZ PAGE 39
3.8. Option 6: enlarged storage capacity in Euston Weir
Option description
Euston Weir (Lock 15) is located on the River Murray downstream of the Murrumbidgee
River confluence. Euston Weir raises water levels in the River Murray to enable water to be
pumped from the weir pool to supply the Robinvale irrigation area (Victoria), private diverters
(predominantly NSW) and urban supplies (Robinvale and Euston) and to maintain navigation
for recreational users. Figure 3-9 shows the location of Euston Weir on a schematic diagram of
the River Murray System.
Figure 3-9: Schematic diagram of the River Murray System showing the location of
Euston Weir.
Euston Weir is currently operated to a full supply level of 47.6 m AHD. Since the mid-1990s
operational practice has allowed a maximum drawdown of 0.3 m (approximately 4 GL) over
the irrigation season to 47.3 m AHD (SKM, 2006b). Works have recently (2010) been
undertaken at Euston Weir to improve the structural integrity of the weir, upgrade the fishway
and protect against erosion. These works may allow the active storage capacity of Euston Weir
to be enlarged by either raising the maximum operating level, lowering the minimum operating
level or both.
The operating strategy of the enlarged Euston Weir would dictate the outcomes of the option in
relation to the project objectives:
operating Euston Weir lower (or raising the weir without raising the target storage) would
generate additional air space in the weir to capture unregulated flows. This option may
increase the efficiency of River Murray System operations (depending on whether the
unregulated flows could have been re-regulated in Lake Victoria).
Euston Weir
Tocumwal
Mulwala Canal
Lake Mulwala Lake Hume
BARMAH CHOKE
Barmah-Millewa Forest
The DropEdward River
Wakool River
Murray River
GunbowerKoondrook-Perricoota
Forests
NSW-VIC-SA Border
Murray Mouth and Lower Lakes
Campaspe River
Tuppal & BullataleCreeks
Goulburn River
Broken Creek
Lake Eildon
Torrumbarry Weir
Goulburn Weir
Lake Victoria
Yarrawonga Main Channel
Dartmouth Reservoir
Mitta Mitta River
Murrumbidgee River
Menindee Lakes Storage
Darling River
Werai ForestEuston Weir
Lake Boga
Snowy Mountains
SchemeBillabong Creek
Loddon River
Finley Escape
Picnic Point
Kiewa River
Ovens River
Note:Schematic not to scale and does not show all weirs.
Edward Escape

Barmah Choke Study – Individual Option Phase
SINCLAIR KNIGHT MERZ PAGE 40
operating Euston Weir at full supply level and either increasing the weir level (and target
level) or lowering the minimum operating level would increase the volume of water in
storage mid-river which can be called on to meet peak irrigation demands. This operating
strategy may help reduce peak demand shortfalls.
The primary aim of this option in relation to the Barmah Choke Study is the management of
shortfalls. This requires Euston Weir to be kept at full supply level (or an increased level)
throughout the irrigation season and drawn down to prevent shortfalls when sufficient water
cannot be supplied from upper system storages.
SKM (2006b) investigated potential for lowering the minimum operating level by 1.5 m to
46.1 m AHD (providing a drawdown volume of 17,500 ML), finding it effective for reducing
the occurrence of shortfalls. SKM (2005) investigated a range of potential lowering options
between 0.5 m and 2.0 m finding that drawdowns of up to 1.0 m could be achieved without
requiring significant modifications to the major pump stations (Robinvale irrigation pump and
Euston town pump). Lowering the minimum operating level was also considered in SMEC
(2002).
This option considers three alternative sub-options:
Option 6a: maximum (and target) operating level raised by 0.5 m to 48.1 m AHD, creating
7 GL of active storage over the „do nothing‟ option
Option 6b: minimum operating level lowered by 1.5 m to 46.1 m AHD, creating 14 GL of
active storage over the „do nothing‟ option
Option 6c: maximum (and target) operating level raised by 0.5 m to 48.1 m AHD and
minimum operating level lowered by 1.5 m to 46.1 m AHD, creating 21 GL of active
storage.
Note, due to concerns and recent experience regarding the difficulty of re-filling Lake Benanee
following extensive drawdown, the volume of active storage considered for this option is
based on the volume of water in the weir pool excluding Lake Benanee.
Modelling outcomes
Lowering the minimum operating level of Euston Weir, while maintaining the target storage at
full supply level (or increasing the maximum and target levels), would increase the volume of
water in storage mid-river. The increased volume could be used to supply peak demands when
sufficient water cannot be supplied from upper system storages. This would be expected to
reduce the incidence and magnitude of shortfall events.
The use of this option to manage lower system storage (type II) shortfalls (generally long in
duration and of large volume) may be limited by the volume of active storage accessible.
However, this option would be expected to provide flexibility for managing peak demand

Barmah Choke Study – Individual Option Phase
SINCLAIR KNIGHT MERZ PAGE 41
(type I) shortfalls with the option providing a volume of water which can be rapidly drawn
upon to mitigate a shortfall event.
Modelling results (see Section 6) indicate that this option would lead to a reduction in the
number of years with shortfall events of 32% for Option 6a, 50% for Option 6b and 54% for
Option 6c. The majority of the reduction in the number of years arises from reductions in the
number of years with peak demand (type I) shortfall events, with minimal impact on lower
system storage (type II) shortfall event.
Due to the spreadsheet based assessment approach adopted for this option the impact on
unseasonal flooding of the Barmah-Millewa Forest and other key project issues has not been
simulated. However, as this option only changes operations through the Barmah Choke by
requiring additional flows to be delivered following the end of the drawdown event to re-fill
Euston Weir, this option is not expected to significantly impact on unseasonal flooding of the
Barmah-Millewa Forest or the delivery of environmental flows. This is based on an assessment
of the coincidence of shortfall events ending with an unseasonal flooding event. This option
does not impact on the total volume of water which must be transferred from upstream to
downstream of the Barmah Choke to meet irrigation demands (Euston Weir would need to be
re-filled after each drawdown event). As such, this option is not expected to impact on
constraints on water trade.
Potential risks and opportunities
This option would be expected to lead to a reduction in the incidence and magnitude of peak
demand (type I) shortfall events, which may have a number of positive social and economic
impacts.
Lowering the water level in Euston Weir pool during summer or autumn, even for short
periods of time, also has the potential to improve the health of the surrounding wetlands and
forest areas (red gums) by moving towards a more natural flow regime (reduced summer
inundation) (SKM, 2005). However, operating Euston Weir at a higher level (i.e. raising the
weir) during summer and autumn as is proposed for Option 6a and 6c is recognised as having a
number of significant negative environmental impacts on the surrounding wetlands and forest
areas (red gums) (RMC, 1980 and SMEC, 2002).
Lowering the minimum operating level of Euston Weir may also have some negative impacts
on:
recreational use of Euston Weir; reducing the operating level will reduce the area
available for boating and houseboating (including mooring) and impact on navigation with
the „cut‟ (a short channel crossing a large meander in the River Murray near Robinvale)
potentially ceasing to flow at lower drawdown levels. Lowering the operating level may
also increase safety risks associated with activities such as boating, houseboating and

Barmah Choke Study – Individual Option Phase
SINCLAIR KNIGHT MERZ PAGE 42
water skiing with an increased risk of incidents with submerged debris (logs and snags)
(SKM, 2005). In particular, lowering the operating level during the annual Robinvale boat
race (Victorian Labour Day weekend in March) would have significant social and
economic impacts on the townships near Euston Weir (SKM, 2005).
pumped diversions from the weir pool; the weir pool raises water levels to enable pumped
diversions for private diverters, the Robinvale irrigation area and urban supplies.
Depending on the extent of the drawdown, some pumps may need to be modified
(including extensions to suction lines) or replaced (SMEC, 2002 and SKM 2005).
operation of the fishway; reducing the operating level would reduce the operating head
available for the existing fishway (required to generate appropriate flow conditions to
attract fish). If lower operating levels are maintained for extended periods of time (i.e.
several weeks or months) the exit race of the fishway may need to be modified to maintain
its effectiveness (SMEC, 2002).

Barmah Choke Study – Individual Option Phase
SINCLAIR KNIGHT MERZ PAGE 43
Option 6: enlarge storage capacity in Euston Weir
Description
Euston Weir would be kept at full supply level (or an increased level) throughout the
irrigation season and rapidly drawn down to prevent shortfalls when sufficient water
cannot be supplied from upper system storages as follows:
◦ Option 6a: maximum (and target) operating level raised by 0.5 m to 48.1 m AHD
(7 GL of active storage)
◦ Option 6b: minimum operating level lowered by 1.5 m to 46.1 m AHD (14 GL of
active storage)
◦ Option 6c: maximum (and target) operating level raised by 0.5 m to 48.1 m AHD
and minimum operating level lowered by 1.5 m to 46.1 m AHD (21 GL of active
storage)
Modelling outcomes
reduction in the number of years with shortfall events of 32% for Option 6a, 50% for
Option 6b and 54% for Option 6c, with the majority of the reduction due to a reduction
in the number of years with peak demand (type I) shortfall events
no impact on unseasonal flooding of the Barmah-Millewa Forest, the delivery of
environmental flows or constraints on water trade
Potential risks and opportunities
opportunity to reduce the incidence and magnitude of peak demand (type I) shortfalls
leading to social and economic benefits
opportunity to improve the health of wetland and forest areas (red gums) surrounding
Euston Weir) for sub-options which involve lowering (Options 6b and 6c), risk of
negative impacts for sub-options which involve raising over summer and autumn
(Options 6a and 6c)
risk of potential negative impacts on recreational use of Euston Weir

Barmah Choke Study – Individual Option Phase
SINCLAIR KNIGHT MERZ PAGE 44
3.9. Option 7: storage at “The Drop” on Mulwala Canal
Option description
“The Drop” is an energy dissipation structure on Mulwala Canal, built to manage flow over a
sharp fall in land elevation. The Drop structure also enables diversions from Mulwala Canal to
Berrigan Canal which supplies the Berriquin irrigation area. Figure 3-10 shows the location of
The Drop on Mulwala Canal on a schematic diagram of the River Murray System.
Figure 3-10: Schematic diagram of the River Murray System showing the location of
The Drop on Mulwala Canal.
Constructing a storage at The Drop could allow rainfall rejection and other unregulated flows
to be diverted from the River Murray at Lake Mulwala upstream of the Barmah Choke. This
may reduce undesirable flooding of the Barmah-Millewa Forest.
The potential to develop a storage at The Drop was investigated by GHD (2007) who proposed
three alterative storage volumes (6 GL, 11 GL and 16 GL) with an inlet capacity of
9,000 ML/day and an outlet capacity of 3,000 ML/day. The aim of that study was to
investigate the use of the first 6 GL of the storage to capture rainfall rejections and the
remaining storage volume to provide additional operational flexibility within the Murray
Irrigation Limited (MIL) water delivery system4.
4 To capture rainfall rejections the storage would need to be kept empty most of the time, however to
provide operational flexibility within the MIL water delivery system the storage would need to be kept
full most of the time.
The primary aim of this option in relation to the Barmah Choke Study is the management of rainfall
rejections. This requires the proposed storage to be kept empty to provide air space for capturing rainfall
rejections.
The Drop(on Mulwala Canal)
Tocumwal
Mulwala Canal
Lake Mulwala Lake Hume
BARMAH CHOKE
Barmah-Millewa Forest
The DropEdward River
Wakool River
Murray River
GunbowerKoondrook-Perricoota
Forests
NSW-VIC-SA Border
Murray Mouth and Lower Lakes
Campaspe River
Tuppal &
BullataleCreeks
Goulburn River
Broken Creek
Lake Eildon
Torrumbarry Weir
Goulburn Weir
Lake Victoria
Yarrawonga Main Channel
Dartmouth Reservoir
Mitta Mitta River
Murrumbidgee River
Menindee Lakes Storage
Darling River
Werai ForestEuston Weir
Lake Boga
Snowy Mountains
SchemeBillabong Creek
Loddon River
Finley Escape
Picnic Point
Kiewa River
Ovens River
Note:Schematic not to scale and does not show all weirs.
Edward
Escape

Barmah Choke Study – Individual Option Phase
SINCLAIR KNIGHT MERZ PAGE 45
Discussions held with MIL and State Water as a part of this phase of the Barmah Choke Study
raised concerns about the cost of constructing the proposed storage. An alternative option
presented involves construction of a storage on the site of an existing basalt quarry located to
the north of The Drop adjacent to the Berrigan Main Channel. The existing capacity of the
quarry is 1 GL, and supplementary bank works could increase the capacity up to 5 GL.
This option considers both proposals. The operating strategy for the storage (all sizes) would
be to fill the storage up to capacity (limited by the capacity of the inlet infrastructure) to avoid
River Murray flows greater than 10,600 ML/day throughout the unseasonal flooding period
and then drawndown following the end of the event by supplying downstream irrigators
(limited by the capacity of the outlet infrastructure).
This option considers four sub-options (alternative storage capacities):
Option 7a: storage capacity of 1 GL (using quarry)
Option 7b: storage capacity of 5 GL (using quarry with banks to increase capacity)
For Option 7a and 7b: inlet capacity of 1,000 ML/day, outlet capacity of 500 ML/day
Option 7c: storage capacity of 11 GL (purpose built storage)
Option 7d: storage capacity of 16 GL (purpose built storage)
For Option 7c and 7d: inlet capacity of 9,000 ML/day (note, inlet would be further
restricted by the volume of spare channel capacity on Mulwala Canal, outlet capacity
of 3,000 ML/day)
Modelling outcomes
Constructing a storage at The Drop on Mulwala Canal would enable rainfall rejections and
unregulated flows during the unseasonal flooding period to be diverted from the River Murray
at Lake Mulwala, upstream of the Barmah Choke provided there was available channel
capacity in the Mulwala Canal. This would be expected to reduce unseasonal flooding of the
Barmah-Millewa Forest. Development of storage at The Drop would also be expected to lead
to water savings through capture and re-regulation of rainfall rejection flows.
Modelling results (see Section 6) indicate that this option would lead to a reduction in the
number of years each side of the Barmah-Millewa Forest is wet unseasonally of 13% to 20%
for a 1 GL or 5 GL storage respectively (Option 7a and Option 7b respectively), and 55% to
56% for a 11GL or 16 GL storage respectively (Option 7c and Option 7d, respectively)
Due to the spreadsheet based assessment approach adopted for this option, the impact on
shortfalls and other key project issues has not been simulated. However, as this option does not
involve transferring additional flow to downstream of the choke during shortfall events, this
option is not expected to impact on shortfalls or the delivery of environmental flows. This
option does not impact on the total volume of water which must be transferred from upstream

Barmah Choke Study – Individual Option Phase
SINCLAIR KNIGHT MERZ PAGE 46
to downstream of the Barmah Choke to meet irrigation demands (it is assumed that the water
harvested in the storage would be used to meet demands in the MIL system rather than being
transferred through to the River Murray System). As such, this option is not expected to impact
on constraints on water trade.
Potential risks and opportunities
Reducing the occurrence of unseasonal flooding would be expected to improve the health of
the Barmah-Millewa Forest.
Reducing the occurrence of unseasonal flooding of the forest would also be expected to
improve opportunities for summer forest tourism activities by reducing the risk of key
recreational sites being inundated. It may also improve summer access through the forest for
tourism, management and emergency response, by reducing the risk of key access paths being
inundated. This may improve the recreational value of, and access to, the Barmah-Millewa
Forest.
In modelling this option the storage would be operated primarily to meet the objectives of the
Barmah Choke Study, but may also be complimentary to the MIL system operations. The
water released from storage would be available for diversion from the MIL channel system
enabling the system to recommence operations following a rainfall rejection without delay.
There may be added complexity to water accounting for volumes of water diverted, stored and
released from the MIL system.
However, the construction of a storage at The Drop may have some negative impacts on:
groundwater recharge and downstream salinity: groundwater in the area surrounding the
proposed storage is very high in salinity (17,000 to 30,000 EC) and is generally close to
the land surface (GHD, 2007). Surcharge of groundwater levels due to seepage from the
storage may lead to salinisation problems for surrounding landholders (GHD, 2007). GHD
(2007) considered options 7c and 7d only, however this risk is also relevant for options 7a
and 7b. The design and construction of the storage would need to include a suitable liner
to minimise this risk.
hydro-power generation: the proposed option may lead to a slight reduction in flow
through The Drop, reducing the potential for hydro-power generation through the power
station at the structure.
Water quality: options 7a and 7b are proposed to use an old basalt quarry for storage;
water quality risks associated with releasing water stored in the quarry would need to be
considered.

Barmah Choke Study – Individual Option Phase
SINCLAIR KNIGHT MERZ PAGE 47
Option 7: storage at The Drop on Mulwala Canal
Description
Option considers construction of a storage at The Drop on Mulwala Canal. Two sites
considered: at The Drop (two larger volume sub-options) and at the soon to be
decommissioned basalt quarry site adjacent to the Berrigan Main Channel (two
smaller volume sub-options).
The storage would be operated empty as much as possible to provide airspace for
capturing rainfall rejections. The storage would be filled to avoid River Murray flows
greater than 10,600 ML/day throughout the unseasonal flooding period and rapidly
drawn down following the end of the event.
Alternative storage capacities are considered:
◦ Option 7a: storage capacity of 1 GL
◦ Option 7b: storage capacity of 5 GL
◦ For Option 7a and 7b: inlet capacity of 1,000 ML/day, outlet capacity of
500 ML/day
◦ Option 7c: storage capacity of 11 GL
◦ Option 7d: storage capacity of 16 GL
◦ For Option 7c and 7d: inlet capacity of 9,000 ML/day (note, inlet would be
further restricted by the volume of spare channel capacity on Mulwala Canal,
outlet capacity of 3,000 ML/day)
Modelling outcomes
reduce the number of years each side of the Barmah-Millewa Forest is wet
unseasonally by 13% (Option 7a), 20% (Option7b), 55% (Option 7c) and 56% (Option
7d)
no impact on shortfalls, the delivery of environmental flows or constraints on water
trade
Potential risks and opportunities
opportunity to improve the health, recreational value of, and access to, the Barmah-
Millewa forest
opportunity to conserve water resources (capture rainfall rejections)
opportunity for slight improvements to MIL service levels
risk of increased groundwater recharge leading to land salinisation in the immediate
vicinity of the storage
risk of reductions in hydro-power generation

Barmah Choke Study – Individual Option Phase
SINCLAIR KNIGHT MERZ PAGE 48
3.10. Option 8: construction of a mid-river storage
Option description
As a part of the Victorian government‟s water savings initiatives, Lake Mokoan on the Broken
River has been decommissioned. This has lead to an increase in unregulated flows entering the
River Murray from the Broken River via the Goulburn River. To re-regulate these flows to
enable savings to be transferred to the Snowy River, additional use is being made of four mid-
river storages in the Torrumbarry irrigation area: Lake Boga, Kangaroo Lake and Lake Charm
which will be used to storage additional water and Kow Swamp which will be used as a part of
the harvesting process. Figure 3-11 shows the location of Lake Boga and the Torrumbarry
irrigation area on a schematic diagram of the River Murray System.
Figure 3-11: Schematic diagram of the River Murray System showing the location of
Lake Boga and the Torrumbarry irrigation area.
The mid-river storage project has been implemented by Goulburn-Murray Water together with
their project partners: the (Victorian) Department of Sustainability and Environment and the
Goulburn Broken Catchment Management Authority. The majority of the on-ground works
required for this option were constructed in 2008 and 2009 and the project commenced
operation in 2010.
The operational objectives for the mid-river storage project (storages are filled from May to
October each year with unregulated flows and drawn down during the irrigation season to meet
demands) are complementary to the objectives of the Barmah Choke Study.
Whilst this option has already been implemented by the Victorian government, the operation
of this option is not included in the modelling benchmark scenario adopted for the „do nothing‟
option as it is a part of the Victorian government‟s commitment to The Living Murray program
and cannot be modelled without also modelling implementation of other components of The
Living Murray program.
Mid-River Storage(in the Torrumbarry Region)
Tocumwal
Mulwala Canal
Lake Mulwala Lake Hume
BARMAH CHOKE
Barmah-Millewa Forest
The DropEdward River
Wakool River
Murray River
GunbowerKoondrook-Perricoota
Forests
NSW-VIC-SA Border
Murray Mouth and Lower Lakes
Campaspe River
Tuppal & BullataleCreeks
Goulburn River
Broken Creek
Lake Eildon
Torrumbarry Weir
Goulburn Weir
Lake Victoria
Yarrawonga Main Channel
Dartmouth Reservoir
Mitta Mitta River
Murrumbidgee River
Menindee Lakes Storage
Darling River
Werai ForestEuston Weir
Lake Boga
Snowy Mountains
SchemeBillabong Creek
Loddon River
Finley Escape
Picnic Point
Kiewa River
Ovens River
Note:Schematic not to scale and does not show all weirs.
Edward
Escape

Barmah Choke Study – Individual Option Phase
SINCLAIR KNIGHT MERZ PAGE 49
Whilst this option is currently operational, it is not included in the base case model. As such,
this option has not been modelled at this stage. If appropriate, assessment of this option may be
considered at a later stage.
Preliminary issues assessment
The construction of a mid-river storage within the Torrumbarry irrigation area has increased
the volume of water in storage mid-river which may be used to supply peak demands in the
Torrumbarry irrigation area when demands exceed the capacity of the National Channel and
both the Torrumbarry and Sunraysia irrigation areas when sufficient water cannot be supplied
from upper system storages. This option would be expected to be able to respond rapidly
providing a small to moderate volume of water to mitigate shortfalls. As such, this option
would be expected to lead to a reduction in the incidence and magnitude of peak demand
(type I) shortfall events.
This option has not been modelled, but is expected to reduce unseasonal flooding due to the
fact that the proposed operation of the storage is to release regulated flow to the River Murray
during summer. Therefore less flow will need to be passed through the Barmah Choke at some
times during Summer, potentially reducing the magnitude of unseasonal flooding events if they
occur at the same time as releases are made from the mid-Murray storage and flow through the
Barmah Choke has been reduced as a consequence.The option is unlikely to significantly
impact on the delivery of environmental flows. As additional water is supplied from
downstream of the Choke, and a related reduction in flow supplied from the Snowy system
upstream of the Choke there is potential for a reduction in the constraints on water trade.
Potential risks and opportunities
This option would be expected to lead to a reduction in the incidence and magnitude of peak
demand (type I) shortfall events, which may have a number of positive social and economic
impacts.
The potential risks and opportunities of this option were investigated by the Victorian
government prior to implementation. These investigations found that this option may pose the
following risk of impacts on a limited number of landholders downstream of Kangaroo Lake
(inundation of land) and irrigators downstream of Lake Boga (reduced service) (G-MW,
2007a) but will offer the following opportunities:
improve the recreational value of the Kerang Lakes, “recreational and tourism users at the
lakes will have more certainty about water levels because of water being stored there each
year, particularly at Lake Boga,” (G-MW n.d.)
“minimal impact on.....the operation of the Torrumbarry irrigation area” (G-MW, n.d.) in
terms of operations, and positive social and economic impacts for the irrigation area (for
both irrigators and the wider regional population)

Barmah Choke Study – Individual Option Phase
SINCLAIR KNIGHT MERZ PAGE 50
“minimal impact on the [wider] Kerang Lakes environment...” (G-MW, n.d.), and the
increased flow through the Kerang Lakes associated with this option is expected to reduce
salinity and improve general water quality in several of the Kerang Lakes (including Lake
Boga, Kangaroo Lake and Lake Charm) (G-MW, 2007b).
Option 8: construction of a mid-river storage
Description
Whilst this option is currently operational it is not included in the base case model and
as such has not been modelled at this stage
Option would consider the impact of the operation of the mid-river storage (current
operational objectives) on the magnitude of the issues associated with the limited
capacity of the Barmah Choke
Expected results for Key Issues
reduce the incidence and magnitude of peak demand (type I) shortfall events
no impact on unseasonal flooding of the Barmah-Millewa Forest, the delivery of
environmental flows or constraints on water trade
Potential risks and opportunities
reduce the incidence and magnitude of peak demand (type I) shortfalls leading to
social and economic benefits
minimal risk to the operation of the Torrumbarry irrigation area
improve the recreational value of the Kerang Lakes region, particularly Lake Boga
minimal risk of impact on the wider environment of the Kerang Lakes with some
opportunity for improvements to salinity and general water quality in several lakes
risk of increases in salinity in the River Murray downstream of the mid-river storage

Barmah Choke Study – Individual Option Phase
SINCLAIR KNIGHT MERZ PAGE 51
3.11. Option 9: Bullatale Creek bypass
Option description
Bullatale Creek is located to the north of the River Murray. Bullatale Creek receives water
from a number of streams which offtake from the River Murray between Tocumwal and Picnic
Point including Deep Creek, Aratula Creek, Lower Toupna Creek and Aluminy Creek (the
connecting creeks) and discharges to the Edward River just upstream of Tuppal Creek.
This option provides the potential to bypass rainfall rejection (and other summer unregulated)
flows through the Bullatale Creek system and the Edward River to avoid unseasonal flooding
of the Barmah-Millewa Forest. Figure 3-12 shows the proposed bypass route through Bullatale
Creek and the Edward River.
Figure 3-12: Schematic diagram of the River Murray System showing the proposed
bypass route through Bullatale Creek.
SKM (2006a) investigated the potential for the Bullatale Creek bypass to divert rainfall
rejections around the Barmah Choke. Early investigations for SKM (2006a) determined that of
the connecting creeks, Lower Toupna Creek and Aratula Creek were the most efficient
systems for diversions based on the scale of works required to divert flows. Further
investigations (SKM, 2006a) determined that from an environmental perspective it was more
suitable to divert flows through Lower Toupna Creek than Aratula Creek.
Based on this assessment, the proposed bypass route for the Barmah Choke Study is diversion
of flow from the River Murray at Lower Toupna Creek with water passing to Bullatale Creek
and on to the Edward River. This proposed bypass route through Bullatale Creek is shown in
Figure 3-13.
Bullatale Creek(proposed bypass route)
Tocumwal
Mulwala Canal
Lake Mulwala Lake Hume
BARMAH CHOKE
Barmah-Millewa Forest
The DropEdward River
Wakool River
Murray River
GunbowerKoondrook-Perricoota
Forests
NSW-VIC-SA Border
Murray Mouth and Lower Lakes
Campaspe River
Tuppal & BullataleCreeks
Goulburn River
Broken Creek
Lake Eildon
Torrumbarry Weir
Goulburn Weir
Lake Victoria
Yarrawonga Main Channel
Dartmouth Reservoir
Mitta Mitta River
Murrumbidgee River
Menindee Lakes Storage
Darling River
Werai ForestEuston Weir
Lake Boga
Snowy Mountains
SchemeBillabong Creek
Loddon River
Finley Escape
Picnic Point
Kiewa River
Ovens River
Note:Schematic not to scale and does not show all weirs.
Edward Escape

Barmah Choke Study – Individual Option Phase
SINCLAIR KNIGHT MERZ PAGE 52
Figure 3-13: Schematic diagram of the Bullatale Creek system showing the
proposed bypass route through Lower Toupna Creek to Bullatale Creek.
SKM (2006a) investigated four alternative bypass capacities: 750 ML/day, 1,400 ML/day,
2,500 ML/day and 3,000 ML/day. A cost per event diverted analysis undertaken as a part of
SKM (2006a) found that bypass capacity options between 750 ML/day to 2,500 ML/day had
similar costs per event diverted, while larger options became less cost effective.
Following the Option Review Workshop (16 June 2010), it was determined that this option
should be „parked‟ and not considered further at this stage of the Barmah Choke Study (this
does not preclude this option from being considered at a later stage). A National Park has
recently been established covering most of the Millewa Group State Forests. This proposed
bypass route travels through the National Park and associated works may not be appropriate in
a National Park. As such, this option will not be assessed at this stage. This decision may be
revised in the future.
Preliminary issues assessment
Development of a bypass route using Bullatale Creek would enable rainfall rejections and
unregulated flows to be diverted from the River Murray upstream of the Barmah Choke. This
would be expected to reduce unseasonal flooding of the Barmah-Millewa Forest. Bypassing
unseasonal floods around the Barmah Choke may also lead to water savings, as the water can
be used downstream, however due to losses along the bypass route the magnitude of savings
may not be significant.
Whilst the primary aim of the bypass route would be to manage unseasonal flooding, there
may also be the potential to utilise the bypass route to supplement existing channel capacity to
meet peak irrigation demands, thus reducing peak demand (type I) shortfalls. The potential for
using the Bullatale Creek bypass route to mitigate shortfalls may be limited by losses, travel
times along the bypass route and the environmental impact associated with diverting water
through the Edward River.
TocumwalPicnic Point
Bullatale Creek
Edward River
River Murray
Deep Creek
Aluminy Creek
Lower Toupna Creek
Aratula Creek
Proposed Bypass Route

Barmah Choke Study – Individual Option Phase
SINCLAIR KNIGHT MERZ PAGE 53
If this bypass route is used to supplement existing channel capacity constraints it may also be
possible to use this route to supply environmental flows. However, the potential of this option
to supply environmental flows will be limited by the capacity of the bypass route in
comparison to the volume of environmental flows required and as mentioned above, losses,
travel times along the bypass route and the environmental impact associated with diverting
water through the Edward River. As such, this option is not expected to impact on constraints
on water trade.
Potential risks and opportunities
Reducing the occurrence of unseasonal flooding would be expected to improve the health of
the Barmah-Millewa Forest.
Reducing the occurrence of unseasonal flooding of the forest would also be expected to
improve opportunities for summer forest tourism activities by reducing the risk of key
recreational sites being inundated. It may also improve summer access through the forest for
tourism, management and emergency response by reducing the risk of key access paths being
inundated. This may improve the recreational value of, and access to, the Barmah-Millewa
Forest.
There may also be the potential opportunity to use this option to supplement existing channel
capacity to meet peak irrigation demands. This may help lead to a reduction in the incidence
and magnitude of peak demand (type I) shortfall events, which may have a number of positive
social and economic impacts. However, this potential opportunity may be limited by a number
of factors including:
losses along the bypass route
travel times along the bypass route
availability of channel capacity
environmental impact associated with diverting water through the Edward River (see
below).
The provision of additional water to Bullatale Creek may affect the ecological condition of the
Creek and surrounding areas. SKM (2006d) assessed the ecological impacts of the proposed
Bullatale Creek bypass finding that the proposed options were “unlikely to improve or degrade
the ecological condition of Bullatale Creek, as this creek [Bullatale] currently flows for much
of the time and is currently in good condition” (page 19).
However, water diverted through Bullatale Creek will flow on through the Edward River. This
may have impacts on flow conditions in the Edward River and the Werai Forest. The operation
of this option may be limited by the available capacity in the Edward River and care would
need to be taken to ensure that bypass diversions do not contribute to undesirable flooding of

Barmah Choke Study – Individual Option Phase
SINCLAIR KNIGHT MERZ PAGE 54
the Werai Forest. Conversely, this option may also provide opportunity to deliver beneficial
flooding to the Werai Forest and the Eastern Millewa Forest.
Option 9: Bullatale Creek bypass
Description
Modelling of this option is currently parked and will not be considered further at this
stage as this option would require works which are unlikely to be appropriate in a
National Park.
Option would consider a potential bypass route through the Bullatale Creek system
with a capacity of between 750 ML/day and 3,000 ML/day primarily used to avoid
unseasonal flooding of the Barmah-Millewa Forest
Expected Results for Key Issues
reduce unseasonal flooding of the Barmah-Millewa Forest
save water (may be offset by losses along the bypass route)
potential opportunity to reduce peak demand (type I) shortfalls
no impact on the delivery of environmental flows or constraints on water trade
Potential risks and opportunities
improve the health, recreational value of, and access to, the Barmah-Millewa Forest
reduce the incidence and magnitude of peak demand (type I) shortfalls leading to
positive social and economic impacts
no significant impact (positive or negative) on the ecological condition of Bullatale
Creek
risk of increased unseasonal flooding of the Werai Forest
deliver environmental water to the Werai Forest and the Eastern Millewa Forest

Barmah Choke Study – Individual Option Phase
SINCLAIR KNIGHT MERZ PAGE 55
3.12. Option 10: Victorian forest channels
Option description
Between Tocumwal and the Barmah Choke there are a number of major creek systems which
can offtake water from the River Murray. On the Victorian side, these creeks travel through the
Barmah Forest, returning to the River Murray between Picnic Point and the Barmah township.
This option considers the potential to use the major creek systems on the Victorian side of the
Barmah Forest to avoid unseasonal flooding of the Barmah-Millewa Forest. Figure 3-14 shows
the general location of the proposed Victorian forest channels bypass route.
Two potential bypass routes have been indentified (Figure 3-15):
Kynmer Creek route: Kynmer Creek diverts from the River Murray at the upstream end of
the Barmah Forest. Kynmer Creek flows into the upstream end of Tullah Creek, which
travels around the southern side of the Barmah Forest before discharging into the Barmah
Lakes.
Gulf Creek route: Gulf Creek diverts from the River Murray approximately half way
between Tocumwal and Picnic Point. Gulf Creek travels directly through the Barmah
Forest to Tullah Creek, which travels around the southern side of the Barmah Forest
before discharging into the Barmah Lakes.
Figure 3-14: Schematic diagram of the River Murray System showing the general
location of the proposed Victorian forest channels bypass options.
Victorian Forest Channels(proposed bypass route)
Tocumwal
Mulwala Canal
Lake Mulwala Lake Hume
BARMAH CHOKE
Barmah-Millewa Forest
The DropEdward River
Wakool River
Murray River
GunbowerKoondrook-Perricoota
Forests
NSW-VIC-SA Border
Murray Mouth and Lower Lakes
Campaspe River
Tuppal & BullataleCreeks
Goulburn River
Broken Creek
Lake Eildon
Torrumbarry Weir
Goulburn Weir
Lake Victoria
Yarrawonga Main Channel
Dartmouth Reservoir
Mitta Mitta River
Murrumbidgee River
Menindee Lakes Storage
Darling River
Werai ForestEuston Weir
Lake Boga
Snowy Mountains
SchemeBillabong Creek
Loddon River
Finley Escape
Picnic Point
Kiewa River
Ovens River
Note:Schematic not to scale and does not show all weirs.
Edward Escape

Barmah Choke Study – Individual Option Phase
SINCLAIR KNIGHT MERZ PAGE 56
Figure 3-15: Schematic diagram of key Victorian forest channels showing two
potential bypass routes.
The bypass capacity of each route is currently unclear, however the capacity of the Gulf Creek
regulator is 2,500 ML/day and a very early study (RMC, 1980) indicated that up to
2,500 ML/day could be passed through either bypass route.
For the modelling, it is assumed that up to 2,500 ML/day could be bypassed through the
Victorian forest channels using either the Kynmer Creek route or the Gulf Creek route or a
combination of both (both routes use the downstream section of Tullah Creek and would be
limited by its capacity). However detailed hydraulic modelling would be required to confirm
the potential bypass capacity.
Modelling outcomes
The development of a bypass route using the Victorian forest channels would enable
unseasonal floods to be diverted from the River Murray upstream of the Barmah Choke. This
would be expected to reduce unseasonal flooding of the Barmah-Millewa Forest. Bypassing
unseasonal floods around the Barmah Choke may also lead to water savings, as the water can
be used downstream.
Modelling results (see Section 6) indicate that this option would lead to a 35% reduction in the
number of years each side of the Barmah-Millewa Forest is wet unseasonally.
Whilst the primary aim of the bypass route would be to manage unseasonal flooding, there
may be potential to utilise the bypass route to supplement existing channel capacity to meet
peak irrigation demands thus reducing peak demand (type I) shortfalls. The suitability of using
the Victorian forest channels bypass route to mitigate shortfalls may be limited by the
magnitude of losses along the route and environmental impact of additional summer flows
through the forest.
Tocumwal
Picnic Point
River Murray
Barmah Choke
Kynmer Creek
Tullah Creek
Barmah Lake
Tullah Creek
Gulf Creek
Proposed Bypass Routes

Barmah Choke Study – Individual Option Phase
SINCLAIR KNIGHT MERZ PAGE 57
The operating rules for modelling this option did not allow the channel capacity to be used to
supplement existing channel capacity. As such the modelling results (see Section 6) do not
indicate that this option would impact on shortfall events.
The modelling results indicate that this option would not have a significant impact on the
delivery of environmental flows (indicated by the incidence of beneficial flooding of TLM
icon sites). Additionally, as it is unlikely that this bypass route would be suitable to supplement
existing channel capacity to supply peak irrigation demands (due to the magnitude of losses
and the environmental impact of additional summer flows through the forest) it is unlikely that
this route would be suitable to reduce constraints on water trade.
Potential risks and opportunities
Reducing the occurrence of unseasonal flooding would be expected to improve the health of
the Barmah-Millewa Forest.
Reducing the occurrence of unseasonal flooding of the forest would also be expected to
improve opportunities for summer forest tourism activities by reducing the risk of key
recreational sites being inundated. This may improve the recreational value of, and access to,
the Barmah-Millewa Forest.
These potential opportunities could be compromised by the risk that the operation of the
bypass routes will lead to flooding; if the capacity of the bypass route is exceeded, it may
result in flooding in certain parts of the forest. This would be a serious risk which would need
careful management. Early studies recognised that works may be required at certain locations
along the proposed bypass routes to ensure bypass flows remain in channel. These works may
include additional regulators and levees.
The potential impacts associated with flooding along the bypass routes are believed to be less
for the Kynmer Creek route which follows the southern boundary of the Barmah Forest than
for the Gulf Creek route which cuts directly through a portion of the forest (RMC, 1980). In
particular, SKM (2006c) noted that wetlands along the Gulf Creek have been identified as
being of high ecological value, and thus despite being one of the largest regulators on the
Victorian side, it is operated only as a last resort.
The creeks along the proposed bypass routes are typically ephemeral, flowing in winter and
spring and dry during summer. Diverting unseasonal floods through these creeks may
significantly affect the natural flow regime and have negative impacts on their environmental
condition and ecology.
There would be potential opportunity to use this option to supplement existing channel
capacity to meet peak irrigation demands. The Gulf Creek bypass route has been used for this
purpose on two previous occasions (1994 and 2002). However, the high ecological cost of

Barmah Choke Study – Individual Option Phase
SINCLAIR KNIGHT MERZ PAGE 58
passing summer flows through the Barmah Forest means this option would be unlikely to be
suitable on a regular basis.
It should also be noted that this option would require extensive works (construction of
regulators and levees plus channel works) through the Barmah Forest National Park. Similarly
to Option 9 (Bullatale Creek bypass), such works may not be appropriate in a National Park.
Option 10: Victoria forest channels
Description
This option considers a bypass route through the Victorian forest channels with a
bypass capacity of 2,500 ML/day
The bypass would be operated up to capacity to avoid unseasonal flooding of the
Barmah-Millewa Forest
Modelling outcomes
35% reduction in the number of years each side of the Barmah-Millewa Forest is wet
unseasonally
potential opportunity to reduce peak demand (type I) shortfalls (not modelled) (may be
limited by the environmental impact of additional summer flows)
no impact on the delivery of environmental flows or constraints on water trade
Potential risks and opportunities
opportunity to improve the health, recreational value of, and access to, the Barmah-
Millewa Forest
risk that the above benefits could be compromised if the operation of the bypass leads
to flooding along the bypass route
unlikely to be appropriate to operate the bypass to manage shortfalls on a regular
basis
option will require works which may not be appropriate in a National Park

Barmah Choke Study – Individual Option Phase
SINCLAIR KNIGHT MERZ PAGE 59
3.13. Option 11: increased escape capacity to the Wakool River
Option description
The Wakool River is an anabranch of the River Murray diverting from the Edward River
downstream of Deniliquin and returning downstream of Werai Forest. The Wakool River can
receive water from a number of sources including from the Edward River via the Wakool and
Yallakool Offtakes and Colligen Creek and from the Mulwala Canal via the Wakool River
Escape.
This option considers the potential to bypass rainfall rejections (and other summer unregulated
flows) through the Wakool River via the Mulwala Canal to avoid unseasonal flooding of the
Barmah-Millewa Forest. Figure 3-16 shows the proposed bypass route through the Mulwala
Canal and the Wakool River.
Figure 3-16: Schematic diagram of the River Murray System showing the proposed bypass route through the Wakool River.
The MIL has, on occasion, used the Wakool River Escape from Mulwala Canal to bypass
rainfall rejections and unseasonal flows around the Barmah Choke. The use of this bypass
route is limited by the capacity of the Wakool River Escape (500 ML/day), which is often
operated at capacity during the peak of the irrigation season, to supply downstream irrigation
demands which are less impacted by rainfall rejections (SKM, 2006c). The reduced impact of
rainfall events is because many of the irrigators (e.g. rice farmers) supplied via the Wakool
River have sufficient capacity to take orders for water during rainfall events, which in other
areas would normally lead to rainfall rejections.
SKM (2006c) investigated the potential to double the existing capacity of the Wakool Escape
(500 ML/day of additional capacity for a total capacity of 1,000 ML/day).

Barmah Choke Study – Individual Option Phase
SINCLAIR KNIGHT MERZ PAGE 60
Modelling outcomes
Development of a bypass route using the Wakool River would enable rainfall rejections and
unregulated flows to be diverted from the River Murray upstream of the Barmah Choke. This
would be expected to reduce unseasonal flooding of the Barmah-Millewa Forest. Bypassing
unseasonal floods around the Barmah Choke may also lead to water savings. RMC (1980)
determined that loses along this bypass route are 20% compared with 10% along the normal
River Murray flow path.
Whilst the primary aim of the bypass route would be to manage unseasonal flooding, there
may also be the potential to utilise the bypass route to supplement existing channel capacity to
meet peak irrigation demands and reduce the risk of peak demand (type I) shortfalls. This
option may be limited by available capacity within the MIL channel system during the
irrigation season and travel times along the bypass route.
Modelling results (see Section 6) indicate that this option would lead to a 3% reduction in the
number of years each side of the Barmah-Millewa Forest is wet unseasonally and a 7%
reduction in the number of years with shortfall events (due to a reduction in the number of
years with peak demand (type I) shortfall events).
The modelling results indicate that this option would not have a significant impact on the
delivery of environmental flows (indicated by the incidence of beneficial flooding of TLM
icon sites). Additionally, if this bypass route is used to supplement existing channel capacity
constraints it may also be possible to use this route to reduce constraints on water trade.
However, as with using this option to manage shortfalls, the potential of this option to reduce
constraints on water will be limited by the availability of the option during the peak irrigation
season. As such, this option is not expected to impact on constraints on water trade.
Potential risks and opportunities
Reducing the occurrence of unseasonal flooding would be expected to improve the health of
the Barmah-Millewa Forest.
Reducing the occurrence of unseasonal flooding of the forest would also be expected to
improve opportunities for summer forest tourism activities by reducing the risk of key
recreational sites being inundated.
There may also be potential opportunity to use this option to supplement existing channel
capacity to meet peak irrigation demands. This may lead to a reduction in the incidence and
magnitude of peak demand (type I) shortfall events, which may have a number of positive
social and economic impacts. Duplicating the existing capacity of the Wakool River Escape
would provide an additional 500 ML/day escape capacity which may be utilised to supplement
existing channel capacity, however the use of this option may be limited by available capacity
in the MIL channel system and travel times along the route. Additionally, there are also

Barmah Choke Study – Individual Option Phase
SINCLAIR KNIGHT MERZ PAGE 61
currently capacity constraints on the Wakool River at various points ranging from 200ML/day
to 600ML/day which cause issues with access to private property (StateWater) which may
limit the suitability of this option.
Historically, water quality has been an issue in the lower Wakool River, with saline water
accumulating in deep pools from groundwater intrusion. High flows through the Wakool River
may flush out these pools, mobilising higher salinity water (SKM, 2006c). There are also risks
associated with blackwater events in this system, particularly following prolonged dry periods.
Whilst these are natural processes (Green, 2001), the flexibility of river operations to mitigate
negative effects is increasingly being explored. Increased escape capacity to the Wakool River
may be one such „operational lever‟ to assist the delivery of dilution flows to mitigate poor
water quality events.
Option 11: increased escape capacity to the Wakool River
Description
This option considers increasing the capacity of the Wakool Escape from 500 ML/day
to 1,000 ML/day and operating a bypass route through Mulwala Canal to the Wakool
River via the Wakool Escape to avoid unseasonal flooding of the Barmah-Millewa
Forest
Modelling outcomes
3% reduction in the number of years each side of the Barmah-Millewa Forest is wet
unseasonally
7% reduction in the number of years with shortfall events, due to a reduction in the
number of years with peak demand (type I) shortfalls
no impact on the delivery of environmental flows or constraints on water trade
Potential risks and opportunities
opportunity to improve the health, recreational value of, and access to, the Barmah-
Millewa Forest
potential opportunity to reduce the incidence and magnitude of peak demand (type I)
shortfalls leading to positive social and economic impacts
opportunity to assist with mitigation of blackwater (and other poor water quality)
events for the Wakool River.
opportunity to increase delivery of water through the system for environmental
purposes

Barmah Choke Study – Individual Option Phase
SINCLAIR KNIGHT MERZ PAGE 62
3.14. Option 12: increased escape capacity to the Edward River
Option description
The Edward River is an anabranch of the River Murray, diverting from the river near Picnic
Point upstream of the Barmah Choke and returning just upstream of Euston Weir. The Edward
River can receive water from a number of sources including the River Murray (at Picnic Point
via the Edward River and Gulpa Creek Offtake) and from Mulwala Canal via the Edward
River Escape at Lawson‟s siphon.
This option considers the potential to bypass rainfall rejections (and other summer unregulated
flows) through the Edward River via the Mulwala Canal to reduce unseasonal flooding of the
Barmah-Millewa Forest. Figure 3-17 shows the proposed bypass route through the Mulwala
Canal and the Edward River.
Figure 3-17: Schematic diagram of the River Murray System showing the proposed bypass route through the Edward River.
Since the early 1980‟s river operators have, on occasion, used this bypass route during rainfall
rejection events and to supplement existing channel capacity to transfer water from Hume to
Lake Victoria (SKM, 2006c). However, the use of this option is currently limited by the
capacity of the escape (2,100 ML/day to 2,400 ML/day depending on season) which is often
nearly fully utilised during high demand irrigation seasons5.
SKM (2006c) investigated a proposal to increase the capacity of the escape to 3,200 ML/day
(800 ML/day additional capacity) to provide additional capacity to bypass rainfall rejection
5 MIL have historically often been constrained by the need to meet high irrigation demands even during
a rainfall rejection event (SKM, 2006c).
Tocumwal
Mulwala Canal
Lake Mulwala Lake Hume
BARMAH CHOKE
Barmah-Millewa Forest
The DropEdward River
Wakool River
Murray River
GunbowerKoondrook-Perricoota
Forests
NSW-VIC-SA Border
Murray Mouth and Lower Lakes
Campaspe River
Tuppal & BullataleCreeks
Goulburn River
Broken Creek
Lake Eildon
Torrumbarry Weir
Goulburn Weir
Lake Victoria
Yarrawonga Main Channel
Dartmouth Reservoir
Mitta Mitta River
Murrumbidgee River
Menindee Lakes Storage
Darling River
Werai ForestEuston Weir
Lake Boga
Snowy Mountains
SchemeBillabong Creek
Loddon River
Finley Escape
Picnic Point
Kiewa River
Ovens River
Note:Schematic not to scale and does not show all weirs.
Edward Escape
Edward River(proposed bypass route)

Barmah Choke Study – Individual Option Phase
SINCLAIR KNIGHT MERZ PAGE 63
flows. This study found it to be an effective option to reduce the incidence of unseasonal
flooding of the Barmah-Millewa Forest.
There is concern that increasing the capacity of the Edward River Escape may lead to an
increase in unseasonal flooding of the Werai Forest (downstream of Stevens Weir). Key
stakeholders (MIL and State Water) suggested that there is currently greater capacity to extract
water from Stevens Weir than to deliver water into Stevens Weir. The estimate was that the
capacity of the Edward River Escape could be increased by up to 2,000 ML/day.
This option considers three alternative sub-options (alternative bypass capacities):
Option 12a: increase the escape capacity to 3,200 ML/day (800 ML/day additional
capacity)
Option 12b: increase the escape capacity to 3,900 ML/day (1,500 ML/day additional
capacity)
Option 12c: increase the escape capacity to 4,400 ML/day (2,000 ML/day additional
capacity)
Modelling outcomes
Development of a bypass route using the Edward River would enable rainfall rejections and
unregulated flows to be diverted from the River Murray upstream of the Barmah Choke. This
would be expected to reduce unseasonal flooding of the Barmah-Millewa Forest. Bypassing
unseasonal floods around the Barmah Choke may also lead to water savings, as the water can
be used downstream. RMC (1980) determined that losses along this bypass route are 20%
compared with 10% along the normal River Murray flow path.
Whilst the primary aim of the bypass route would be to manage unseasonal flooding, there
may also be the potential to utilise the bypass route to supplement existing channel capacity to
meet peak irrigation demands, thus reducing peak demand (type I) shortfalls. This option may
be limited by available capacity in Mulwala Canal during the irrigation season and the risk of
environmental impacts on the Werai Forest.
Modelling results (see Section 6) indicate that this option would lead to a 19% (Option 12a),
29% (Option 12b) or 33% (Option 12c) reduction in the number of years each side of the
Barmah-Millewa Forest is wet unseasonally and an 18% (all sub-options) reduction in the
number of years with shortfall events (due to a reduction in the number of years with peak
demand (type I) shortfall events).
The modelling results indicate that this option would not have a significant impact on the
delivery of environmental flows (indicated by the incidence of beneficial flooding of TLM
icon sites). Additionally, if this bypass route is used to supplement existing channel capacity
constraints it may also be possible to use this route to reduce constraints on water trade.

Barmah Choke Study – Individual Option Phase
SINCLAIR KNIGHT MERZ PAGE 64
However, as with using this option to manage shortfalls, the potential of this option to reduce
constraints on water will be limited by the availability of the option during the peak irrigation
season and the impact of the bypass of unseasonal flooding of the Werai Forest. As such, this
option is not expected to impact on constraints on water trade.
Potential risks and opportunities
Reducing the occurrence of unseasonal flooding would be expected to improve the health of
the Barmah-Millewa Forest.
Reducing the occurrence of unseasonal flooding of the forest would also be expected to
improve opportunities for summer forest tourism activities by reducing the risk of key
recreational sites being inundated.
There may also be potential opportunity to use this option to supplement existing channel
capacity to meet peak irrigation demands. This may help lead to a reduction in the incidence
and magnitude of peak demand (type I) shortfall events, which may have a number of positive
social and economic impacts; however the use of this option may still be limited by available
capacity in the MIL channel system. This option may also provide additional operational
flexibility to manage increased flow to the Edward-Wakool River system for water quality,
environmental and other purposes.
A risk associated with this option would be the potential to increase unseasonal flooding of the
Werai Forest. The Edward River passes through the Werai Forest downstream of Deniliquin.
High flows through this area that exceed that capacity of the channel (2,900 ML/day
downstream of Stevens Weir) can lead to unseasonal flooding of the Werai Forest.
Investigations undertaken as a part of SKM (2006c) indicated that this option may lead to a
significant increase in the number of years with unseasonal flooding of the Werai Forest. This
risk was investigated and the option was modelled such that the operation of the bypass would
not cause additional unseasonal flooding of the Werai Forest.

Barmah Choke Study – Individual Option Phase
SINCLAIR KNIGHT MERZ PAGE 65
Option 12: increased escape capacity to the Edward River
Description
This option considers increasing the capacity of the Edward Escape from
2,400 ML/day and operating a bypass route through Mulwala Canal to the Edward
River via the Edward Escape to avoid unseasonal flooding of the Barmah-Millewa
Forest as follows:
◦ Option 12a: increase the escape capacity to 3,200 ML/day (800 ML/day additional
capacity)
◦ Option 12b: increase the escape capacity to 3,900 ML/day (1,500 ML/day
additional capacity)
◦ Option 12c: increase the escape capacity to 4,400 ML/day (2,000 ML/day
additional capacity)
Modelling outcomes
19% (Option 12a), 29% (Option 12b) or 33% (Option 12c) reduction in the number of
years each side of the Barmah-Millewa Forest is wet unseasonally
18% reduction in the number of years with shortfall events (due to a reduction in the
number of years with peak demand (type I) shortfalls)
no impact on the delivery of environmental flows or constraints on water trade
Potential risks and opportunities
opportunity to improve the health, recreational value of, and access to, the Barmah-
Millewa Forest
potential opportunity to reduce the incidence and magnitude of peak demand (type I)
shortfalls leading to positive social and economic impacts
risk of an increase in unseasonal flooding of the Werai Forest, to be managed by
constraining the use of the option to avoid this risk
potential to assist management of increased flow to the Wakool River system

Barmah Choke Study – Individual Option Phase
SINCLAIR KNIGHT MERZ PAGE 66
3.15. Option 13: increased escape capacity to Broken Creek
Option description
Broken Creek enters the River Murray downstream of Barmah Lake. In addition to upper
catchment inflows, lower Broken Creek can receive inflows via discharges (outfalls) from the
East Goulburn Main Channel (Shepparton irrigation area) and channels in the Murray Valley
irrigation area which is supplied from the Yarrawonga Main Channel.
This option considers the potential to bypass rainfall rejections (and other summer unregulated
flows) around the Barmah Choke through the Yarrawonga Main Channel and the Murray
Valley irrigation area channels to the Broken Creek. It may also be used to supplement
existing channel capacity to meet peak irrigation demands and manage shortfalls. Figure 3-18
shows the proposed bypass route through the Murray Valley irrigation area and Broken Creek.
Figure 3-18: Schematic diagram of the River Murray System showing the proposed bypass route through Broken Creek.
The river operators have, on occasion, used this bypass option to transfer water to Broken
Creek. However, this option is limited by channel capacity constraints within the Murray
Valley irrigation area, the capacity of the escape (300 ML/day) and capacity constraints within
Broken Creek which already receives outfalls from the East Goulburn Main Channel to supply
private diverters (approximately 100 ML/day). In the spring of 2006, the MDBC had limited
access to this option due to channel capacity constraints despite low allocations.
This option was investigated as a part of SKM (2006b), which identified the following
potential configuration: works to increase the capacity of the Yarrawonga Main Channel and
Murray Valley Channel 3 by 300 ML/day plus construction of a 300 ML/day link channel
between Murray Valley Channel 3 and Boosey Creek near Katamatite. Preliminary
investigations of Boosey Creek capacity and flow in Broken Creek as a part of SKM (2006b)
Tocumwal
Mulwala Canal
Lake Mulwala Lake Hume
BARMAH CHOKE
Barmah-Millewa Forest
The DropEdward River
Wakool River
Murray River
GunbowerKoondrook-Perricoota
Forests
NSW-VIC-SA Border
Murray Mouth and Lower Lakes
Campaspe River
Tuppal & BullataleCreeks
Goulburn River
Broken Creek
Lake Eildon
Torrumbarry Weir
Goulburn Weir
Lake Victoria
Yarrawonga Main Channel
Dartmouth Reservoir
Mitta Mitta River
Murrumbidgee River
Menindee Lakes Storage
Darling River
Werai ForestEuston Weir
Lake Boga
Snowy Mountains
SchemeBillabong Creek
Loddon River
Finley Escape
Picnic Point
Kiewa River
Ovens River
Note:Schematic not to scale and does not show all weirs.
Edward
Escape
Broken Creek(proposed bypass route)

Barmah Choke Study – Individual Option Phase
SINCLAIR KNIGHT MERZ PAGE 67
found that the available capacity of the system downstream of the link channel would be at
least 300 ML/day during periods of peak demand.
The potential to increase escape capacity to Broken Creek was investigated as a part of the
second stage of the Northern Victorian Irrigation Renewal Project (NVIRP) works program,
with the aim of providing capacity to deliver environmental water to Broken Creek. However,
at the time of this report, this proposal is not being progressed any further.
Modelling outcomes
Development of a bypass route using the Murray Valley irrigation system and Broken Creek
would enable rainfall rejections and unregulated flows to be diverted from the River Murray
upstream of the Barmah Choke, reducing unseasonal flooding of the Barmah-Millewa Forest.
Bypassing unseasonal floods around the Barmah Choke may also lead to water savings, as the
water can be used downstream.
There is also the potential to utilise the bypass route to supplement existing channel capacity to
meet peak irrigation demands and thus reduce peak demand (type I) shortfalls. However, the
use of the Broken Creek bypass route to manage shortfalls may be limited by the available
capacity along the bypass route.
Modelling results (see Section 6) indicate that this option would lead to a 7% reduction in the
number of years each side of the Barmah-Millewa Forest is wet unseasonally and a 7%
reduction in the number of years with shortfall events (due to a reduction in the number of
years with peak demand (type I) shortfall events).
The modelling results indicate that this option would not have a significant impact on the
delivery of environmental flows (indicated by the incidence of beneficial flooding of TLM
icon sites). Additionally, if this bypass route is used to supplement existing channel capacity
constraints it may also be possible to use this route to reduce constraints on water trade.
However, as with using this option to manage shortfalls, the potential of this option to reduce
constraints on water will be limited by the availability of the option during the peak irrigation
season. As such, this option is not expected to impact on constraints on water trade.
Potential risks and opportunities
Reducing the occurrence of unseasonal flooding would be expected to improve the health of
the Barmah-Millewa Forest.
Reducing the occurrence of unseasonal flooding of the forest would also be expected to
improve opportunities for summer forest tourism activities by reducing the risk of key
recreational sites being inundated.

Barmah Choke Study – Individual Option Phase
SINCLAIR KNIGHT MERZ PAGE 68
There may also be opportunity to use this option to supplement existing channel capacity to
meet peak irrigation demands. This may help lead to a reduction in the incidence and
magnitude of peak demand (type I) shortfalls events which may have a number of positive
social and economic impacts. This potential opportunity may be limited by channel capacity
constraints along the bypass route.
Additionally, the provision of additional channel and outfall capacity in the Murray Valley
irrigation system may increase operational flexibility.
Broken Creek currently experiences water quality problems including algal blooms, de-
oxygenation and fish kills, particularly during summer months, due to low flow. The provision
of additional water to Broken Creek during summer months may improve the ecological
condition of Broken Creek.
Option 13: increased escape capacity to Broken Creek
Description
This option considers a bypass route of up to 300 ML/day through Yarrawonga Main
Channel and the Murray Valley irrigation channel system to Broken Creek to avoid
unseasonal flooding of the Barmah-Millewa Forest.
Modelling outcomes
7% reduction in the number of years each side of the Barmah-Millewa Forest is wet
unseasonally
7% reduction in the number of years with shortfall events, due to a reduction in the
number of years with peak demand (type I) shortfalls (limited by available capacity
along the bypass route)
no impact on the delivery of environmental flows or constraints on water trade
Potential risks and opportunities
opportunity to improve the health, recreational value of, and access to, the Barmah-
Millewa Forest
potential opportunity to reduce the incidence and magnitude of peak demand (type I)
shortfalls, leading to social and economic benefits
opportunity to increase operational flexibility in the Murray Valley irrigation system
opportunity to improve the ecological condition (water quality) of Broken Creek

Barmah Choke Study – Individual Option Phase
SINCLAIR KNIGHT MERZ PAGE 69
3.16. Option 14: Barmah bypass channel
Option description
This option considers the potential for a large-scale Barmah Choke bypass. The possible
bypass would divert water from Yarrawonga Weir to the River Murray near the Barmah
township downstream of the Barmah Choke. Figure 3-19 shows an indicative bypass route.
Figure 3-19: Schematic diagram of the River Murray System showing an indicative location of the Barmah Bypass Channel.
This option may enable the diversion of rainfall rejections and unregulated flows around the
Barmah Choke and may also be used to supplement existing channel capacity to meet peak
irrigation demands and manage shortfalls.
The potential for this option has been investigated in the past by Goulburn-Murray Water as a
smaller version of the Murray-Goulburn Interconnector (Option 15); however little
information is available from these investigations for the Barmah Choke Study.
Following the Option Review Workshop, it was determined that this option should be parked
and not considered further at this stage of the Barmah Choke Study. This proposed bypass
involves a large, very high cost channel to be constructed in close proximity to the Barmah
Forest which is not expected to be a viable option at this stage. This decision may be revised in
the future should further information become available.
Preliminary issues assessment
Development of a bypass route using a new channel from Yarrawonga Weir would enable
rainfall rejections and unregulated flows to be diverted from the River Murray upstream of the
Barmah Choke. This would be expected to reduce unseasonal flooding of the Barmah-Millewa
Forest. Bypassing unseaonal flows around the Barmah Choke may also lead to water savings
as the water can be used downstream (losses along the proposed bypass route, a new and high
quality constructed channel, are expected to be low).
Tocumwal
Mulwala Canal
Lake Mulwala Lake Hume
BARMAH CHOKE
Barmah-Millewa Forest
The DropEdward River
Wakool River
Murray River
GunbowerKoondrook-Perricoota
Forests
NSW-VIC-SA Border
Murray Mouth and Lower Lakes
Campaspe River
Tuppal & BullataleCreeks
Goulburn River
Broken Creek
Lake Eildon
Torrumbarry Weir
Goulburn Weir
Lake Victoria
Yarrawonga Main Channel
Dartmouth Reservoir
Mitta Mitta River
Murrumbidgee River
Menindee Lakes Storage
Darling River
Werai ForestEuston Weir
Lake Boga
Snowy Mountains
SchemeBillabong Creek
Loddon River
Finley Escape
Picnic Point
Kiewa River
Ovens River
Note:Schematic not to scale and does not show all weirs.
Edward
Escape
Barmah Bypass Channel(indicative route)

Barmah Choke Study – Individual Option Phase
SINCLAIR KNIGHT MERZ PAGE 70
The proposed bypass may also be used to supplement existing channel capacity to meet peak
irrigation demands and reduce shortfalls. The capacity of this bypass, along with the potential
to commence operations quickly and continue operations for extended periods of time mean
this option could be used to manage both peak demand (type I) and lower system storage
(type II) shortfalls.
The modelling results indicate that this option would not have a significant impact on the
delivery of environmental flows (indicated by the incidence of beneficial flooding of TLM
icon sites). Depending on how this option is operated, it may be possible to use this bypass
route to deliver water from upstream to downstream of the Barmah Choke throughout the
irrigation season (including during periods of peak demand, although this may compromise the
potential to use the option to manage shortfalls). If the bypass route is used in this way,
constraints on water trade may be reduced.
Potential risks and opportunities
Reducing the occurrence of unseasonal flooding would be expected to improve the health of
the Barmah-Millewa Forest.
Reducing the occurrence of unseasonal flooding of the forest would also be expected to
improve opportunities for summer forest tourism activities by reducing the risk of key
recreational sites being inundated.
This option would also be expected to lead to a reduction in the incidence and magnitude of
both peak demand (type I) and lower system storage (type II) shortfall events, which may have
a number of positive social and economic impacts.
SMEC (2002) assessed the potential impact of a similar bypass route, finding that the proposed
route would be across the natural fall of the land and through potentially unsuitable soils. This
has the potential to cause a number of flooding issues throughout the region, forming a barrier
to natural overland flow paths. Additionally, construction of such a large, long channel may
have significant environmental impacts associated with construction activities and social
impacts associated with the proposed construction route (for example acquisition of private
land).
It has also been identified that discharge of such large inflows to the River Murray just
downstream of the Barmah Choke at times of high river flows may cause backwater effects on
water levels in the Barmah Lakes (SMEC, 2002).

Barmah Choke Study – Individual Option Phase
SINCLAIR KNIGHT MERZ PAGE 71
Option 14: Barmah bypass channel
Description
this option considers the potential for construction of a large-scale Barmah Choke
bypass diverting water from Yarrawonga Weir to the River Murray near the Barmah
township downstream of the Barmah Choke
Preliminary key issues
reduce unseasonal flooding of the Barmah-Millewa Forest
save water
reduce peak demand (type I) and lower system storage (type II) shortfalls
this option would not be expected to impact on the delivery of environmental flows or
constraints on water trade
Potential risks and opportunities
opportunity to improve the health, recreational value of, and access to the Barmah-
Millewa Forest
opportunity to reduce the incidence and magnitude of peak demand (type I) and lower
system storage (type II) shortfalls leading to social and economic benefits
potential risk to natural overland flow paths
risk of negative environmental impacts associated with construction activities
risk of negative impacts on land holders in the vicinity of the proposed bypass route
(land acquisition)
risk of back water effects on water levels in the Barmah Lakes
opportunity to enable water trade if the operating rules for the channel were altered

Barmah Choke Study – Individual Option Phase
SINCLAIR KNIGHT MERZ PAGE 72
3.17. Option 15: Murray-Goulburn interconnector channel
Option description
The concept of constructing a channel linking the Murray and Goulburn systems was first
investigated in the late 1980‟s. The aim of such a channel would be to provide flexibility to
deliver water from Eildon Reservoir to the Murray System in exchange for delivering water
from the River Murray System upstream of the Barmah Choke to the Goulburn system.
This option considers the potential to use a new channel to manage shortfalls. Figure 3-20
shows the proposed Murray-Goulburn Interconnector channel route.
Figure 3-20: Schematic diagram of the River Murray System showing the general location of the proposed Murray-Goulburn Interconnector channel.
The potential for this option has been investigated a number of times since it was first
proposed. Most recently, the Victorian Government undertook investigations to develop a
business case for the proposed channel to address a range of issues.
This option includes construction of a 2,400 ML/day channel extending from the Yarrawonga
Main Channel just downstream of Yarrawonga Weir to the East Goulburn Main Channel just
downstream of Broken River (upstream of the bulk of the Shepparton irrigation area) with
outlet structures at the points where it crosses Broken Creek and Boosey Creek.
This channel would be run to supply up to 2,000 ML/day to the Shepparton irrigation area over
the irrigation season (August to April) whenever there was sufficient demand. It would also be
operated to deliver up to 400 ML/day to Broken Creek via Boosey Creek (100 ML/day),
Broken Creek (100 ML/day) and the East Goulburn Main Channel Outfall to Broken Creek
(200 ML/day). Diverted water would then be returned to the River Murray System as callable
inter-valley trade credits in Lake Eildon.
Tocumwal
Mulwala Canal
Lake Mulwala Lake Hume
BARMAH CHOKE
Barmah-Millewa Forest
The DropEdward River
Wakool River
Murray River
GunbowerKoondrook-Perricoota
Forests
NSW-VIC-SA Border
Murray Mouth and Lower Lakes
Campaspe River
Tuppal & BullataleCreeks
Goulburn River
Broken Creek
Lake Eildon
Torrumbarry Weir
Goulburn Weir
Lake Victoria
Yarrawonga Main Channel
Dartmouth Reservoir
Mitta Mitta River
Murrumbidgee River
Menindee Lakes Storage
Darling River
Werai ForestEuston Weir
Lake Boga
Snowy Mountains
SchemeBillabong Creek
Loddon River
Finley Escape
Picnic Point
Kiewa River
Ovens River
Note:Schematic not to scale and does not show all weirs.
Edward
Escape
Interconnector Channel(indicative route)
IVT Credits to the Murray System
Barmah Choke Study – Individual Option Phase
SINCLAIR KNIGHT MERZ PAGE 73
Note, that while the Victorian Government business case was developed to address a range of
issues, the Barmah Choke Study focuses on assessing this option in relation to the issues and
outcomes associated with the Barmah Choke only. The Barmah Choke Study has not assessed
any other objectives of the proposed Murray-Goulburn Interconnector.
Modelling outcomes
The construction of the Murray-Goulburn interconnector channel would increase flexibility to
manage peak irrigation demands by increasing the volume of callable inter-valley trade credits.
This would be expected to lead to a reduction in the incidence and magnitude of shortfall
events.
The use of this option to manage peak demand (type I) shortfalls (generally large volume,
rapid onset shortfalls) may be limited by the long travel times between Lake Eildon and the
River Murray (approximately 2 weeks); however this option would be expected to provide
significant flexibility for managing lower system storage (type II) shortfalls (generally longer
in duration).
Modelling results (see Section 6) indicate that this option would lead to a 43% reduction in the
number of years with shortfall events.
This option may also increase flexibility for trade, including the potential for trade from
upstream of the Barmah Choke to the Goulburn system or downstream of the Barmah Choke.
Modelling results (see Section 6) also indicate that this option would lead to a 22% reduction
in the number of years each side of the Barmah-Millewa Forest is wet unseasonally.
Significantly increasing the volume of water delivered to the River Murray System from the
Goulburn system (via increasing the volume of inter-valley transfers) reduces pressure on the
Barmah Choke and means that the Barmah Choke may be operated at a lower level in some
years. This provides additional buffer capacity to absorb rainfall rejections within the river
channel, leading to a reduction in unseasonal flooding.
The modelling results indicate that this option would not have a significant impact on the
delivery of environmental flows (indicated by the incidence of beneficial flooding of TLM
icon sites). Depending on how this option is operated, it may be possible to use this bypass
route to divert water around the Barmah Choke throughout the irrigation season (including
during periods of peak demand, although this may compromise the potential to use the option
to manage shortfalls). If the bypass route is used in this way, constraints on water trade may be
reduced.

Barmah Choke Study – Individual Option Phase
SINCLAIR KNIGHT MERZ PAGE 74
Potential risks and opportunities
This option would be expected to lead to a reduction in the incidence and magnitude of lower
system storage (type II) shortfall events, which may have a number of positive social and
economic impacts for these irrigation areas.
Additionally, this option may free up trade restrictions associated with the Barmah Choke, as
water from upstream of the Barmah Choke could be traded to the Goulburn system (or to parts
of the lower River Murray through back trade).
SMEC (2002) identified that the proposed bypass route would be across the natural fall of the
land and through potentially unsuitable soils. This has the potential to cause a number of
flooding issues throughout the region, forming a barrier to natural overland flow paths.
Additionally, construction of such a large, long channel may have significant environmental
impacts associated with construction activities and social impacts associated with the proposed
construction route (acquisition of private land).
Concerns also exist about the need to supply large volumes of inter-valley trade credits
through the lower Goulburn River. Water to supply trade credits is most likely to be released
through the lower Goulburn River during the summer and autumn peak of the irrigation
season. This may affect the flow regime of the lower Goulburn River.
Broken Creek currently experiences water quality problems including algal blooms, de-
oxygenation and fish kills, particularly during summer months, due to low flow. The provision
of additional water to Broken Creek during summer months may improve the ecological
condition of Broken Creek.

Barmah Choke Study – Individual Option Phase
SINCLAIR KNIGHT MERZ PAGE 75
Option 15: Murray-Goulburn interconnector channel
Description
This option considers the potential for the construction of a 2,000 ML/day channel
extending from the Yarrawonga Main Channel to the East Goulburn Main Channel.
The channel would be run to supply the Shepparton irrigation area over the irrigation
season. Up to 400 ML/day may also be diverted to Broken Creek. Diverted water will
be returned to the River Murray as inter-valley trade credits in Lake Eildon
Modelling outcomes
43% reduction in the number of years with shortfall events
potential opportunity to reduce constraints on water trade
22% reduction in the number of years each side of the Barmah-Millewa Forest is wet
unseasonally
no impact on the delivery of environmental flows
Potential risks and opportunities
opportunity to reduce the incidence and magnitude of lower system storage (type II)
shortfalls leading to social and economic benefits
opportunity to free-up trade restrictions associated with the Barmah Choke
potential risk to natural overland flow paths
risk of negative environmental impacts associated with construction activities
risk of potential impacts on the flow regime of the lower Goulburn River
opportunity to improve the ecological condition (water quality) of Broken Creek

Barmah Choke Study – Individual Option Phase
SINCLAIR KNIGHT MERZ PAGE 76
3.18. Option 16: Perricoota Escape
Option description
The Deniboota Canal offtakes from Mulwala Canal downstream of Deniliquin and runs south-
west connecting to the River Murray just upstream of Torrumbarry Weir via the Perricoota
Escape. The canal has a capacity of 1,200 ML/day at the offtake but decreases downstream.
The Perricoota Escape originally had a capacity of 50 ML/day which was used to deliver water
through the system to the River Murray. The capacity of the escape was upgraded to
200 ML/day in 2006 to provide flexibility in diverting water around the Barmah Choke (MIL,
2007).
The 200 ML/day capacity of the Perricoota Escape, included for this option, was used until
January 2007 (MIL, 2007) but has not been used since (MIL, personal communications), and is
not used in the “do nothing” option (Option 1).
This option considers the potential to bypass rainfall rejections (and other summer unregulated
flows) through the Deniboota Canal and Perricoota Escape to avoid unseasonal flooding of the
Barmah-Milewa Forest. Figure 3-21 shows the proposed bypass route through the Deniboota
Canal and Perricoota Escape.
Figure 3-21: Schematic diagram of the River Murray System showing the proposed bypass route through the Deniboota Canal and Perricoota Escape.
The capacity of the current escape is 200 ML/day. MIL staff have suggested that it may be
possible to upgrade the capacity of Deniboota Canal and Perricoota Escape to provide
additional capacity. MIL staff suggested there would be two thresholds of additional capacity,
beyond which would require a step change in the extent of works required: 500 ML/day and
1,000 ML/day.
Tocumwal
Mulwala Canal
Lake Mulwala Lake Hume
BARMAH CHOKE
Barmah-Millewa Forest
The DropEdward River
Wakool River
Murray River
GunbowerKoondrook-Perricoota
Forests
NSW-VIC-SA Border
Murray Mouth and Lower Lakes
Campaspe River
Tuppal &
BullataleCreeks
Goulburn River
Broken Creek
Lake Eildon
Torrumbarry Weir
Goulburn Weir
Lake Victoria
Yarrawonga Main Channel
Dartmouth Reservoir
Mitta Mitta River
Murrumbidgee River
Menindee Lakes Storage
Darling River
Werai ForestEuston Weir
Lake Boga
Snowy Mountains
SchemeBillabong Creek
Loddon River
Finley Escape
Picnic Point
Kiewa River
Ovens River
Note:Schematic not to scale and does not show all weirs.
Edward
Escape
Perricoota Escape(proposed bypass route)

Barmah Choke Study – Individual Option Phase
SINCLAIR KNIGHT MERZ PAGE 77
Modelling outcomes
Development of a bypass route using the Perricoota Escape would enable rainfall rejections
and unregulated flows to be diverted from the River Murray upstream of the Barmah Choke.
This would be expected to reduce unseasonal flooding of the Barmah-Millewa Forest.
Bypassing unseasonal flows around the Barmah Choke may also lead to water savings.
Whilst the primary aim of the bypass route would be to manage unseasonal flooding, there
may be potential to utilise the bypass route to supplement existing channel capacity to meet
peak irrigation demands, thus reducing peak demand (type I) shortfalls. This option may be
limited by available capacity during the irrigation season.
Modelling results (see Section 6) indicate that this option would lead to up to a 9% reduction
in the number of years each side of the Barmah-Millewa Forest is wet unseasonally and up to
an 18% reduction in the number of years with shortfall events.
The modelling results indicate that this option would not have a significant impact on the
delivery of environmental flows (indicated by the incidence of beneficial flooding of TLM
icon sites). Additionally, if this bypass route is used to supplement existing channel capacity
constraints it may also be possible to use this route to reduce constraints on water trade.
However, as with using this option to manage shortfalls, the potential of this option to reduce
constraints on water will be limited by the availability of the option during the peak irrigation
season. As such, this option is not expected to impact on constraints on water trade.
Potential risks and opportunities
Reducing the occurrence of unseasonal flooding would be expected to improve the health of
the Barmah-Millewa Forest.
Reducing the occurrence of unseasonal flooding of the forest would also be expected to
improve opportunities for summer forest tourism activities by reducing the risk of key
recreational sites being inundated.
There may also be the potential opportunity to use this option to supplement existing channel
capacity to meet peak irrigation demands. This may help lead to a reduction in the incidence
and magnitude of peak demand (type I) shortfall events, which may have a number of positive
social and economic impacts; however the use of this option may still be limited by available
capacity in the MIL channel system. The potential for operating this option in conjunction with
the new regulator at Perricoota Forest constructed under The Living Murray program could be
investigated.

Barmah Choke Study – Individual Option Phase
SINCLAIR KNIGHT MERZ PAGE 78
Option 16: Perricoota Escape
Description
This option considers using the Perricoota Escape (current and increased capacity) as
a bypass route through Mulwala Canal and Deniboota Canal to avoid unseasonal
flooding of the Barmah-Millewa Forest as follows:
◦ Option 16a: use the existing escape capacity (200 ML/day)
◦ Option 16b: increase the escape capacity to 500 ML/day (300 ML/day additional
capacity)
◦ Option 16c: increase the escape capacity to 1,000 ML/day (1,300 ML/day
additional capacity)
Modelling outcomes
up to a 9% reduction in the number of years each side of the Barmah-Millewa Forest
is wet unsesonally
up to an 18% reduction in the number of years with shortfall events
no impact on the delivery of environmental flows or constraints on water trade
Potential risks and opportunities
opportunity to improve the health, recreational value of, and access to, the Barmah-
Millewa Forest
potential opportunity to reduce the incidence and magnitude of peak demand (type I)
shortfalls leading to positive social and economic impacts
potential to operate in conjunction with new regulator at Perricoota Forest

Barmah Choke Study – Individual Option Phase
SINCLAIR KNIGHT MERZ PAGE 79
3.19. Option 17: combined weir manipulation
Option description
Operating rules currently restrict operational flexibility in a number of assets throughout the
River Murray System. Many of these rules are in place to meet operational, social or
environmental requirements and must be retained. However, there are some rules in place that
it may be possible to modify to increase operational flexibility without unacceptable
operational, social or environmental impacts.
In recent years, a number of the mid-river weirs along the River Murray System have been
operated more flexibly to avoid shortfalls. Additionally, there is a general move towards more
flexible operation of weirs for environmental purposes. In line with this, a potential
modification suitable for consideration is modest lowering of the minimum storage target for
multiple weirs in coordination, rather than a large drawdown at a single weir in isolation.
Weirs that could be manipulated include Torrumbarry Weir, Euston Weir, Mildura Weir,
Wentworth Weir, Lock 8 and Lock 9. Figure 3-22 shows the location of each weir on a
schematic diagram of the River Murray System.
Figure 3-22: Schematic diagram of the River Murray System showing the location of each weir.
The River Murray System Annual Operating Plan (MDBA, 2010c) and River Murray
operators suggested the following manipulations could be possible with existing infrastructure:
Torrumbarry Weir, maximum drawdown of 40 cm
Euston Weir, maximum drawdown of 30 cm
Mildura Weir, maximum drawdown of 25 cm
Wentworth Weir, maximum drawdown of 25 cm
Lock 8, maximum drawdown of 50 cm
Tocumwal
Mulwala Canal
Lake Mulwala Lake Hume
BARMAH CHOKE
Barmah-Millewa Forest
The DropEdward River
Wakool River
Murray River
GunbowerKoondrook-Perricoota
Forests
NSW-VIC-SA Border
Murray Mouth and Lower Lakes
Campaspe River
Tuppal & BullataleCreeks
Goulburn River
Broken Creek
Lake Eildon
Torrumbarry Weir
Goulburn Weir
Lake Victoria
Yarrawonga Main Channel
Dartmouth Reservoir
Mitta Mitta River
Murrumbidgee River
Menindee Lakes Storage
Darling River
Werai ForestEuston Weir
Lake Boga
Snowy Mountains
SchemeBillabong Creek
Loddon River
Finley Escape
Picnic Point
Kiewa River
Ovens River
Note:Schematic not to scale and does not show all weirs.
Edward
Escape
Torrumbarry Weir
Euston Weir
Mildura Weir
Wentworth Weir
Lock 8Lock 9

Barmah Choke Study – Individual Option Phase
SINCLAIR KNIGHT MERZ PAGE 80
Lock 9, maximum drawdown of 20 cm
This option considers operating each storage at the appropriate normal operating level
(generally full supply level) throughout the irrigation season and rapid draw down of these
weirs to avoid shortfalls by supplying demands when sufficient water cannot be supplied from
upper system storage (no change to the target operating level). The total volume of active
storage that would be available from this option is 19.2 GL.
Modelling outcomes
Lowering the minimum operating level of multiple weirs in coordination while maintaining the
target storage at full supply level would increase the mid-river storage capacity. This may be
used to supplement supply peak demands when sufficient water cannot be supplied from upper
system storages. This would be expected to reduce the incidence and magnitude of shortfall
events.
The use of this option to manage lower system storage (type II) shortfalls (generally long in
duration and of large volume) may be limited by the volume of drawdown water available.
However, this option is expected to provide flexibility for managing peak demand (type I)
shortfalls with the option providing 19.2 GL of water which can be drawn upon to mitigate a
shortfall event.
Modelling results (see Section 6) indicate that this option would lead to a 54% reduction in the
number of years with shortfall events. The majority of the reduction in the number of years
arises from reductions in the number of years with peak demand (type I) shortfall events, with
minimal impact on lower system storage (type II) shortfall event.
Due to the spreadsheet based assessment approach adopted for this option, the impact on
unseasonal flooding of the Barmah-Millewa Forest and other key project issues has not been
simulated. However, as this option only changes operations through the Barmah Choke by
requiring additional flows to be delivered following the end of the drawdown event to re-fill
the weirs, this option is not expected to significantly impact on unseasonal flooding of the
Barmah-Millewa Forest or the delivery of environmental flows. This is based on an assessment
of the coincidence of shortfall events ending with an unseasonal flooding event. This option
does not impact on the total volume of water which must be transferred from upstream to
downstream of the Barmah Choke to meet irrigation demands (the weirs would need to be re-
filled after each drawdown event). As such, this option is not expected to impact on constraints
on water trade.
Potential risks and opportunities
This option would be expected to lead to a reduction in the incidence and magnitude of peak
demand (type I) shortfall events, which may have a number of positive social and economic
impacts.

Barmah Choke Study – Individual Option Phase
SINCLAIR KNIGHT MERZ PAGE 81
Lowering the minimum operating level of the selected weir pools may have some negative
impacts on recreational use of the weir pool and pumped diversions from the weir pool;
however as the maximum draw downs proposed for this option are within the current operating
range of each weir this is not expected to be a significant risk.
Option 17: combined weir manipulation
Description
Mid-river weirs would be operated at normal operating levels (generally full supply
level) throughout the irrigation season and rapidly drawn down to avoid shortfalls. The
weirs and maximum draw downs to be considered are:
◦ Torrumbarry Weir, maximum drawdown of 40 cm
◦ Euston Weir, maximum drawdown of 30 cm
◦ Mildura Weir, maximum drawdown of 25 cm
◦ Wentworth Weir, maximum drawdown of 25 cm
◦ Lock 8, maximum drawdown of 50 cm
◦ Lock 9, maximum drawdown of 20 cm
This would provide a total of 19.2 GL of water which could be drawn upon to mitigate
a shortfall event
Modelling outcomes
54% reduction in the number of years with shortfall events, primarily due to a
reduction in the number of years with peak demand (type I) shortfall events
no impact on unseasonal flooding of the Barmah-Millewa Forest, the delivery of
environmental flows or constraints on water trade
Potential risks and opportunities
opportunity to reduce the incidence and magnitude of peak demand (type I) shortfalls
leading to social and economic benefits
no significant risk of negative impacts on recreational use or pumped diversions from
the weir pools

Barmah Choke Study – Individual Option Phase
SINCLAIR KNIGHT MERZ PAGE 82
4. Option costing and risk cost analysis
4.1. Option costing
A cost estimation process was undertaken to provide the costs involved with the capital based
options. Table 4-1 provides a summary of the costing undertaken for each option.
Table 4-1: Summary of options costing.
Option Costing Status Comment
Option 1- do nothing No costing required – current conditions
Option 2- alter the 6-inch rule to increase operational flexibility
No costing required – operational change only
Option 3a- policy options to manage within the capacity of the Barmah Choke: Lake Victoria transfers
No costing required – operational change only
Option 3b- policy options to manage within the capacity of the Barmah Choke: inter-valley trade
No costing required – operational change only
Option 3c- policy options to manage within the capacity of the Barmah Choke: non-asset solutions
No costing undertaken – conceptual investigation only
Option 4- increased operational flexibility in existing assets: Mildura Weir
Cost estimate prepared
Option 5- lower operating level in Lake Mulwala
Cost estimates prepared (two sub-options)
Option 6- enlarged storage capacity in Euston Weir
Cost estimates prepared (three sub-options)
Option 7- storage at “The Drop” on Mulwala Canal
Cost estimates prepared for the 11 GL and 16 GL sub-options. Preliminary cost estimates for the 1 GL and 5 GL sub-options provided by MIL
Option 8- construction of a mid-river storage
No costing required – current conditions
Option 9- Bullatale Creek bypass No costing required – option not progressed
Option 10- Victorian forest channels Cost estimates prepared (two construction routes of the same capacity)
Option 11- increased escape capacity to the Wakool River
Cost estimate prepared
Option 12- Increased escape capacity to the Edward River
Cost estimate prepared for the 800 ML/day increase in capacity sub-option. Preliminary cost estimates for the 1,500 ML/day and 2,000 ML/day increases in capacity sub-options provided by MIL
Option 13- Increased escape capacity to Broken Creek
Cost estimate prepared
Option 14- Barmah bypass channel No costing required – option not progressed
Option 15- Murray-Goulburn interconnector channel
Cost estimate prepared
Option 16- Perricoota Escape Preliminary cost estimates provided by MIL
Option 17- Combined weir manipulation No costing required – operational change only
Barmah Choke Study – Individual Option Phase
SINCLAIR KNIGHT MERZ PAGE 83
4.2. Assessment process
The base estimate involved a desk top analysis using previous cost assessments and knowledge
from similar water infrastructure projects. For this assessment allowance was made for design
costs (set to 20 per cent) and a contingency allowance.
The estimation process for calculating contingency follows a process outlined in Evans & Peak
(2008). Following this method, a contingency is used to provide coverage for a given set of
risks which should be identified in two parts:
inherent risk: relates to the risk range of measured values that make up the components of
the base estimate. This can include changes to the quantity and rates to produce a
minimum, expected and maximum cost range.
contingent risk: due to unmeasured items that can include industrial issues, safety,
planning and weather.
A contingency can be set either using a deterministic (by applying a set percentage) or a
probabilistic method. There are several methods to evaluate the contingency using
probabilistic methods including:
scenario analysis where a number of alternative options for the project are proposed,
representing the most likely situation and realistic variations from it, and risks associated
with each scenario which are analysed and compared.
decision trees that compare the various outcomes from one or more decisions in order to
identify the optimum choices when there is uncertainty about some aspect of the outcome.
Monte Carlo simulation analyses of the combined effect of estimate ranges to create a
probabilistic estimate of costs.
For this assessment, both a deterministic and probabilistic approach were used to apply a
contingency. Contingent risk is applied through a deterministic process by applying an
additional contingency of 40 per cent. In most cases, the estimates are very preliminary and
based on little data (i.e. no ground survey, no geotechnical information, no consultation, no
detailed hydraulic studies etc). Therefore this level of contingency is considered reasonable for
this stage of the consideration of options.
Calculating a contingency for inherent risk is undertaken using a probabilistic method, based
on Monte Carlo simulation. The Monte Carlo simulation in this instance models the total
project costs when the cost components are allowed to vary across a defined range between
minimum, expected and maximum. The simulation is repeated many times such that a
distribution of costs results. From this distribution an appropriate level of uncertainty can be
chosen for inclusion in the costs.

Barmah Choke Study – Individual Option Phase
SINCLAIR KNIGHT MERZ PAGE 84
An estimate of the cost components is set using a Beta-PERT distribution based on the
minimum, maximum and most likely cost. As an example, Figure 4-1 shows the probability
distribution of the „Top soiling‟ – a cost element of the Option 10, based on the input cost data
provided in Table 4-2.
Figure 4-1: Example input cost assumption.
Table 4-2: Example cost inputs.
Quantity UNIT Price or Rates Cost Range
Min Expected Max Min Expected Max Min Expected Max
63,000 70,000 91,000 m3 $ 2.00 $ 2.00 $ 4.00 $ 126,000 $ 140,000 $ 364,000
Combining all the input cost assumptions, and running a random simulation, a probabilistic
estimate of cost results. Figure 4-2 provides an example of this. In this case, the 90th percentile
represents the cost which will not be exceeded 90 per cent of the time.

Barmah Choke Study – Individual Option Phase
SINCLAIR KNIGHT MERZ PAGE 85
Figure 4-2: Example probabilistic estimate for Option 10b.
4.3. Summary of results
Table 4-3 provides a summary of the cost modelling undertaken. Appendix F is a detailed
breakdown of the financial analysis of the options. Both the base estimate (including design
and a 40 per cent contingency) and the 90th percentile estimate (including contingency) is
provided. A present value estimate is also given to allow meaningful comparison of options
which result in an on-going operating cost. The present value estimate is undertaken over a 20
year period with a 6 per cent discount rate. Note that no attempt to estimate or quantify
escalation over this period has been made.
The discount rate is consistent with Commonwealth guidelines; however these guidelines do
not provide a single number but rather the method for calculation. Discount rate of 7 per cent
is consistent with NSW guidelines however 6 per cent is usual in Victoria and South Australia.
The discounting is used for comparison purposes and not for investment decision so the actual
rate (within reason) is not particularly important. The 20 year period is consistent with recent
DEWHA water business case requirements. However, a 30 year period could easily be
justified. The capital costs are not discounted as it is suggested they would all be constructed in
one year which is clearly not feasible. Given this present value analysis is for broad
comparison purposes only, small modifications are not likely to influence the assessment
process.

Barmah Choke Study – Individual Option Phase
SINCLAIR KNIGHT MERZ PAGE 86
Table 4-3: Summary of cost modelling (all estimates include contingencies).
Capital
Cost
(base
estimate)
Capital
Cost
( 90th
percentile)
Operating
cost
(base
estimate)
Operating
cost
(90th
percentile)
Present
Value
20 years
@6%
(base
estimate)
Present
Value
20 years
@6%
(90th
percentile)
Option 4: Mildura Weir $ 1.68 m $ 1.91 m - - $ 1.68 m $ 1.91 m
Option 5a: Lower operating level
Lake Mulwala by 100 mm $ 2.62 m $ 2.89 m $ 0.07 m $ 0.07 m $ 3.40 m $ 3.71 m
Option 5b: Lower operating level
Lake Mulwala by 500 mm $ 8.10 m $ 9.18 m $ 0.27 m $ 0.28 m $ 11.23 m $ 12.44 m
Option 6a: Euston Weir - Raise
the minimum operating level of
Euston Weir by 0.5 m to 48.1 m
AHD
$ 0.83 m $ 0.95 m - - $ 0.83 m $ 0.95 m
Option 6b: Euston Weir - Lower
the minimum operating level of
Euston Weir by 1.5 m to 46.1 m
AHD
$ 1.99 m $ 2.24 m - - $ 1.99 m $ 2.24 m
Option 6c: Euston Weir - Raise
the minimum operating level of
Euston Weir by 0.5 m to 48.1 m
AHD and lower the minimum
operating level of Euston Weir by
1.5 m to 46.1 m AHD
$ 2.26 m $ 2.62 m - - $ 2.26 m $ 2.62 m
Option 7c: 11 GL Storage at The
Drop on Mulwala Canal $ 56.37 m $ 63.08 m $ 1.27 m $ 1.42 m $ 70.91 m $ 79.31 m
Option 7d: 16 GL Storage at The
Drop on Mulwala Canal $ 70.14 m $ 78.66 m $ 1.49 m $ 1.67 m $ 87.23 m $ 97.81 m
Option 10a: Victorian Forest
Channels (Kynmer Creek Route) $ 90.08 m $ 109.56 m $ 0.66 m $ 0.86 m $ 97.66 m $ 119.46 m
Option 10b: Victorian Forest
Channels (Gulf Creek Route) $ 57.14 m $ 68.65 m $ 0.46 m $ 0.59 m $ 62.45 m $ 75.36 m
Option 11: Increased diversion
through the Wakool River $ 1.93 m $ 2.15 m $ 0.42 m $ 0.42 m $ 6.75 m $ 6.97 m
Option 12: Increased escape
capacity to the Edward River
(800 ML/d)
$ 2.55 m $ 3.01 m $ 0.42 m $ 0.42 m $ 7.37 m $ 7.83 m
Option 13: Increased escape
capacity to Broken Creek $ 16.54 m $ 18.48 m $ 0.34 m $ 0.37 m $ 20.43 m $ 22.71 m
Option 15: Murray Goulburn
interconnector (2000 ML/d) $ 370.35 m $ 424.86 m $ 2.09 m $ 2.62 m $ 394.27 m $ 454.92 m

Barmah Choke Study – Individual Option Phase
SINCLAIR KNIGHT MERZ PAGE 87
4.4. Limitations
This cost assessment is provided as an input for the evaluation of options. It was undertaken
through a desktop analysis only and is therefore not suitable for making investment decisions.
Other limitations that should be considered when using the data include:
cost information is capital and operating cost estimate only. No provision is made for the
cost of project approvals
each cost item is considered independent of each other. For example, if there is a risk of
an increase in the cost of steel but this commodity is included in other line items then a
high cost for one line item may be selected at the same time as a low cost for another line
item during the same iteration of the model. This can lead to an underestimate of the
contingency as in fact the increase in the cost of an item is likely to be correlated with the
increase in cost of other items (it is possible to stochastically generate correlated variables
but this is outside the scope of the Barmah Choke Study)
using the Beta-PERT distribution suggests a greater confidence in the most likely
estimate. It can be used with a wide range between the minimum and maximum durations
as the probabilities of hitting the extremes is less than if using the Triangular distribution.
Using this distribution results in a reduced cost contingency which is appropriate if there
is confidence in the most likely estimates. The Beta-PERT distribution is a standard
approach to these types of cost estimation problems.
4.5. Costing of additional options
Preliminary cost estimates for additional options were provided by MIL. These represent the
capital cost estimates, and exclude allowances for operating and maintenance costs. To allow
the cost of these options to be compared with the cost of other options it was necessary to
estimate the present value (base estimate costs). In the absence of estimates for operating and
maintenance costs, these costs were set to 2 per cent of the capital cost estimate.
The cost estimates (capital and present value) for the following options are very preliminary
and have been presented for comparative purposes only.
Option 7a- storage at The Drop (1 GL storage): $5 million
Option 7b- storage at The Drop (5 GL storage): $10 million
Option 12b- increased escape capacity to the Edward River (1,500 ML/day additional
capacity): $6.5 million
Option 12c- increased escape capacity to the Edward River (2,000 ML/day additional
capacity): $8.0 million
Option 17b- Perricoota escape (500 ML/day capacity): $8.0 million
Option 17b- Perricoota escape (1,000 ML/day capacity): $50 million

Barmah Choke Study – Individual Option Phase
SINCLAIR KNIGHT MERZ PAGE 88
5. Option risk assessment
5.1. Risk assessment process
The risk assessment process consists of a qualitative evaluation, following the MDBA Risk
Management Guidelines (2010a) which have been based on the joint Australia/New Zealand
Standard, AS/NZ ISO 31000:2009 (Figure 5-1). As this is a high level assessment, this process
has focussed on the Risk Assessment process (part 5.4).
Figure 5-1: Risk assessment process from AS/NZ ISO 3100 (MDBA 2010a).
5.2. Risk assessment context
The aim of the risk assessment process for the Barmah Choke Study was to provide a high
level assessment of the risks as one input to the evaluation of the options. The risk assessment
matrix used is provided in Figure 5-2.
The consequence categories from the MDBA guidelines have been used for Financial,
Stakeholder and Environmental risks. The MDBA guidelines also provide descriptions for
OH&S and Reputation risks however these risks have not been included in this assessment.
OH&S risks tend to be project specific and would be considered during project
implementation. MDBA reputation risks are also not considered at this stage of options
analysis because distinguishing between options on reputation risk is difficult.

Barmah Choke Study – Individual Option Phase
SINCLAIR KNIGHT MERZ PAGE 89
In order to consider the full range of risks, description of consequence has also been developed
for Regulatory Requirements and Project Delivery risks. These risks are not included in the
MDBA guidelines so the consequence descriptions have been aligned as far as possible to
match the relative severity of the other consequence items.
All risks have been assessed on an unmitigated basis to aid comparison. It is acknowledged
that most (if not all) risks identified could be mitigated to an acceptable level but this may
require a commitment of resources or political capital by the MDBA and possibly the
jurisdictions.
Figure 5-2: Risk analysis matrix adapted from MDBA guidelines (2010).
Risk Items
Table 5-1 outlines the risk items that were assessed. The consequence category relates to the
consequence thresholds against which each risk item is assessed. These threshold descriptions
are provided in Figure 5-2. It is acknowledged there is some overlap in the risk items. For
example, a project with high environmental risk is likely to cause stakeholder and community
concern on environmental grounds. Likewise a high cost option will likely have a high
construction cost risk and demand/supply risk.
Consequence Rank Catastrophic Major Moderate Minor Insignificant
Financial FIN
Huge financial loss (total
dollar cost greater than
$50m)
Major financial loss (total
dollar cost in the range
$5m to $50m)
Significant financial loss
(total dollar cost in the
range $500k to $5m)
Medium financial loss (total
dollar cost in the range
$100k to $500k)
Low financial loss (total
dollar cost less than $100k)
Regulatory
requirementREG
Significant regulatory
requirements include EIS or
public inquiry with on-going
legal challenges to the
extent that it fails to have
continued political support
Significant regulatory
requirements include EIS or
public inquiry
Significant approvals
process requiring high level
ministerial approval
Moderate planning
requirements
Low level or no approvals
required
Environment ENV
Catastrophic environmental
impact which has long term
consequences and severely
impacts on the national
economy
Extensive environmental
impact over a prolonged
period which has major
political and/or economic
consequences
Significant environmental
impact but over a limited
period
Only minor, if any,
environmental impactNo environmental impact
Stakeholders and
communitySTK
Key stakeholders suffer
severe impact or loss of
confidence in the program,
and possibly the MDBA,
the extent that its future is
in question
Extensive impact on key
stakeholders with major
political ramifications
and/or extensive
community dissatisfaction
Significant stakeholder
impact which requires
executive attention and has
some political ramifications
Minor stakeholder impact
which is dealt with in a
short timeframe
Little if any stakeholder
impact
Project Delivery
riskDEL
Project unable to meet its
objectives and benefits will
not be realised
Project benefits are
impacted and some targets
not met
Permanent change in
project plan resulting in
small reduction in project
benefits.
Small changes on project
schedule not impacting
overall benefits
Small change to schedule
which are rectified during
project period
LikelihoodProject
Frequency
Semi-
Quantitative
Frequency
Environmental
FrequencyRank 1 2 3 4 5
Almost certain
More than once
during the
project.
Monthly
occurrence.
Common
occurrence, high
volume/ use.
A High High Significant Significant Moderate
LikelyOnce during
the project.
More than once
per year.
Common
occurrence, low
volume/ use.
B High Significant Significant Significant Moderate
Possible
Could happen
during the
project life.
Once every one
to 10 years.
Occasional
occurrence, high
volume/ use.
C High Significant Significant Moderate Low
Unlikely
Unlikely to
occur during
project life.
Once every 10
to 100 years.
Occasional
occurrence, low
volume/ use.
D High Significant Moderate Low Low
Rare
Very unlikely to
occur during
the project life.
Once every 100
to 1000 years.Rare occurrence. E High Significant Moderate Low Low
Determine the Consequence (C)
Risk Analysis Matrix
De
term
ine
th
e L
ike
lih
oo
d (
L)

Barmah Choke Study – Individual Option Phase
SINCLAIR KNIGHT MERZ PAGE 90
Table 5-1: Risk Items assessed.
Risk Item Description Consequence category
Technical Feasibility
Risk that the project will not be delivered, or is technically infeasible, is influenced by the requirement for specialised personnel, methods, and equipment.
Project Delivery
Regulatory conditions
Risk the project will be subject to significant approvals process e.g., EIS or Public Inquiry from EPBC Act or requires change to the Water Act or Murray Darling Basin Agreement.
Regulatory requirement
Stakeholder and community
Risk the project is subject to significant community or stakeholder opposition.
Stakeholder and community
Demand \ supply risk
Risk that changes to irrigation demand and supply conditions mean the infrastructure is used significantly less than designed for, and potentially obsolete.
Financial
Environmental risk
Risk that project construction or operation is likely to cause unacceptable environmental damage.
Environment
Construction cost risk
Risk the project is likely to be subject to cost overruns. Financial
Operation risk Risk relating to the operational requirements to implement and control the option.
Project Delivery
5.3. Risk assessment results
The SKM project team held an internal risk assessment workshop on the 21 May 2010 to
assess each of the options against the risk items. A further workshop was help on 3 September
2010 to review the risks based on the MDBA guidelines and to respond to comments provided
by MDBA and the River Murray System Operations Review Working Group.
In this section, risk items from Table 5-2 are considered in turn and the risk rating for each of
the options is listed and described. The rationale behind the risk ratings is described,
particularly if there are any options that fall within the highest risk category.
A summary of the assessment of likelihood and consequence for each option for each risk is
provided in Figure 5-3.

Barmah Choke Study – Individual Option Phase
SINCLAIR KNIGHT MERZ PAGE 91
Figure 5-3 Classification of risk types for each option.
Project Risks
Risk Issue Description TypeC L Risk C L Risk C L Risk C L Risk C L Risk C L Risk C L Risk C L Risk C L Risk C L Risk C L Risk C L Risk C L Risk C L Risk C L Risk
Technical Feasibility
The degree to which the plans call for
specialised personnel, methods, and
equipment will impact the risks inherent in
the project
DEL 5 D Low 4 CMode
rate3 C
Signifi
cant4 C
Mode
rate4 C
Mode
rate4 D Low 4 D Low 4 D Low 4 D Low 4 D Low 4 D Low 3 C
Signifi
cant3 C
Signifi
cant3 C
Signifi
cant3 C
Signifi
cant
Regulatory conditions
Risk the project will be subject to significant
approvals process e.g., EIS or Public
Inquiry from EPBC Act
REG 5 E Low 4 D Low 4 D Low 4 CMode
rate3 B
Signifi
cant3 C
Signifi
cant3 A
Signifi
cant3 A
Signifi
cant3 B
Signifi
cant3 B
Signifi
cant3 B
Signifi
cant3 B
Signifi
cant3 B
Signifi
cant3 B
Signifi
cant3 B
Signifi
cant
Stakeholders and community
Risk the project is subject to significant
stakeholder, community or political
opposition
STK 3 CSignifi
cant4 D Low 4 D Low 3 D
Mode
rate3 C
Signifi
cant2 B
Signifi
cant3 B
Signifi
cant2 A High 3 C
Signifi
cant2 B
Signifi
cant2 B
Signifi
cant3 D
Mode
rate3 D
Mode
rate3 D
Mode
rate3 D
Mode
rate
Demand \ supply risk
Risk that changes to irrigation demand and
supply conditions mean the infrastructure is
being used significantly less than designed
for, and potentially obsolete
FIN 5 D Low 4 D Low 4 D Low 4 D Low 4 D Low 5 D Low 5 D Low 5 D Low 5 D Low 5 D Low 5 D Low 2 DSignifi
cant2 D
Signifi
cant2 D
Signifi
cant2 D
Signifi
cant
Environmental riskIs project construction likely to cause
unacceptable environmental damageENV 2 B
Signifi
cant4 C
Mode
rate4 D Low 4 D Low 5 E Low 3 C
Signifi
cant4 C
Mode
rate4 C
Mode
rate3 C
Signifi
cant3 C
Signifi
cant3 C
Signifi
cant3 C
Signifi
cant3 C
Signifi
cant3 C
Signifi
cant3 C
Signifi
cant
Construction cost riskIs the project likely to be subject to cost
overruns FIN 5 E Low 5 E Low 5 E Low 5 E Low 5 E Low 4 C
Mode
rate4 C
Mode
rate3 C
Signifi
cant4 C
Mode
rate3 C
Signifi
cant3 C
Signifi
cant2 C
Signifi
cant2 C
Signifi
cant2 C
Signifi
cant2 C
Signifi
cant
Operation risk
Risk relating to the operational
requirements to implement and control the
option within operational requirements
DEL 2 BSignifi
cant5 D Low 3 B
Signifi
cant4 D Low 3 B
Signifi
cant4 D Low 4 D Low 4 D Low 4 D Low 4 D Low 4 D Low 4 C
Mode
rate4 C
Mode
rate4 C
Mode
rate4 C
Mode
rate
Option 5b- lower
operating level in
Lake Mulwala by
500mm
Progress
Concept
Option 6b:
Euston Weir -
Lower the
minimum
operating level
of Euston Weir
by 1.5 m to 46.1
m AHD
Option 6c:
Euston Weir -
Raise the
minimum
operating level
of Euston Weir
by 0.5 m to 48.1
m AHD and
Lower the
minimum
Progress
Concept
Progress
Concept
Option 7c: 11 GL
Storage at The
Drop on Mulwala
Canal
Progress
Concept
Option 7d: 16 GL
Storage at The
Drop on Mulwala
Canal
Progress Progress
Option 1- do
nothing
Option 2- alter
the 6-inch rule to
increase
operational
flexibility
Option 3a- policy
options to
manage within
the capacity of
the Barmah
Choke: Lake
Victoria transfers
Option 3b- policy
options to
manage within
the capacity of
the Barmah
Choke: Inter-
valley trade
Progress Progress
Concept
Progress
Concept
Progress
Concept
Option 3c- policy
options to
manage within
the capacity of
the Barmah
Choke: non-
asset solutions
Option 4-
increased
operational
flexibility in
existing assets:
Mildura Weir
Option 5a- lower
operating level in
Lake Mulwala by
100mm
Option 7b: 5 GL
Storage at The
Drop on Mulwala
Canal
Progress
Concept
Option 6a:
Euston Weir -
Raise the
minimum
operating level
of Euston Weir
by 0.5 m to 48.1
m AHD
Option 7a: 1 GL
Storage at The
Drop on Mulwala
Canal
Progress
Concept
Progress
Concept
MAXIMUM RISK SignificantSignificant Moderate Significant Moderate Significant Significant Significant High Significant Significant Significant Significant Significant
Progress
Concept
Significant

Barmah Choke Study – Individual Option Phase
SINCLAIR KNIGHT MERZ PAGE 92
Figure 5-4 (continued) Classification of risk types for each option.
Project Risks
Risk Issue Description TypeC L Risk C L Risk C L Risk C L Risk C L Risk C L Risk C L Risk C L Risk C L Risk C L Risk C L Risk C L Risk C L Risk C L Risk C L Risk
Technical Feasibility
The degree to which the plans call for
specialised personnel, methods, and
equipment will impact the risks inherent in
the project
DEL 4 D Low 2 BSignifi
cant2 B
Signifi
cant3 B
Signifi
cant3 C
Signifi
cant3 C
Signifi
cant3 C
Signifi
cant3 C
Signifi
cant3 C
Signifi
cant3 C
Signifi
cant3 C
Signifi
cant4 D Low 3 C
Signifi
cant3 C
Signifi
cant4 D Low
Regulatory conditions
Risk the project will be subject to significant
approvals process e.g., EIS or Public
Inquiry from EPBC Act
REG 4 CMode
rate2 A High 2 A High 2 A High 4 C
Mode
rate4 C
Mode
rate4 C
Mode
rate4 C
Mode
rate3 C
Signifi
cant2 B
Signifi
cant2 A High 4 C
Mode
rate4 C
Mode
rate3 C
Signifi
cant3 C
Signifi
cant
Stakeholders and community
Risk the project is subject to significant
stakeholder, community or political
opposition
STK 4 D Low 2 BSignifi
cant2 B
Signifi
cant2 B
Signifi
cant4 C
Mode
rate4 C
Mode
rate4 C
Mode
rate4 C
Mode
rate4 C
Mode
rate2 B
Signifi
cant2 B
Signifi
cant4 C
Mode
rate4 C
Mode
rate4 C
Mode
rate2 B
Signifi
cant
Demand \ supply risk
Risk that changes to irrigation demand and
supply conditions mean the infrastructure is
being used significantly less than designed
for, and potentially obsolete
FIN 4 D Low 2 DSignifi
cant2 D
Signifi
cant2 D
Signifi
cant3 D
Mode
rate3 D
Mode
rate3 D
Mode
rate3 D
Mode
rate3 D
Mode
rate2 D
Signifi
cant2 D
Signifi
cant4 D Low 3 D
Mode
rate3 D
Mode
rate5 D Low
Environmental riskIs project construction likely to cause
unacceptable environmental damageENV 4 C
Mode
rate2 B
Signifi
cant2 B
Signifi
cant2 B
Signifi
cant3 C
Signifi
cant3 C
Signifi
cant3 C
Signifi
cant3 C
Signifi
cant3 C
Signifi
cant2 B
Signifi
cant2 B
Signifi
cant4 C
Mode
rate3 C
Signifi
cant3 C
Signifi
cant2 C
Signifi
cant
Construction cost riskIs the project likely to be subject to cost
overruns FIN 4 D Low 3 C
Signifi
cant2 C
Signifi
cant2 C
Signifi
cant3 C
Signifi
cant3 C
Signifi
cant3 C
Signifi
cant3 C
Signifi
cant2 C
Signifi
cant2 C
Signifi
cant1 C High 4 C
Mode
rate3 C
Signifi
cant2 C
Signifi
cant4 C
Mode
rate
Operation risk
Risk relating to the operational
requirements to implement and control the
option within operational requirements
DEL 4 CMode
rate3 C
Signifi
cant3 C
Signifi
cant3 C
Signifi
cant4 C
Mode
rate4 C
Mode
rate4 C
Mode
rate4 C
Mode
rate4 C
Mode
rate4 B
Signifi
cant4 B
Signifi
cant4 C
Mode
rate4 C
Mode
rate4 C
Mode
rate4 D Low
Progress
Concept
Option 11-
increase escape
capacity to the
Wakool River
Progress
Concept
Option 12a- 800
ML/d increased
escape capacity
to Edward River
Progress
Concept
Option 13-
Increased
escape capacity
to Broken Creek
Progress
Concept
Option 12b-
1,500 ML/d
increased escape
capacity to
Edward River
Progress
Concept
Option 12c- 2,000
ML/d increased
escape capacity
to Edward River
Progress
Concept
Option 14-
Barmah bypass
channel
Parked
Option 15-
Murray-Goulburn
Interconnector
Channel
Option 9-
Bullatale Creek
bypass
Parked
Option 10a:
Victorian Forest
Channels
(Kynmer Creek
Route)
Progress
Concept
Option 8-
construction of a
mid-river storage
On Hold
MAXIMUM RISK High High High Significant Significant Significant SignificantModerate
Option 16c: 1,000
ML/day Pericoota
Escape
Progress
Concept
Significant
Option 17-
Combined weir
option
Progress
Concept
Significant
Option 16a- 200
ML/day Pericoota
Escape
Progress
Concept
Moderate
Option 16b: 500
ML/day Pericoota
Escape
Progress
Concept
SignificantSignificant Significant High
Option 10b:
Victorian Forest
Channels (Gulf
Creek Route)
Progress
Concept

Barmah Choke Study – Individual Option Phase
SINCLAIR KNIGHT MERZ PAGE 93
Technical feasibility risk
All options are considered technically feasible in so far as only current technologies are
required. There are no high risk options with respect to technical feasibility.
The significant risk options are related to major construction projects which are more at risk of
encountering technical feasibility constraints. This relates particularly to projects involving
construction of new, large-scale channels (Options 9, 10, 14, and 15).
Options to increase existing escape capacities (Options 11, 12, 13 and 16) have an overall
lower consequence and likelihood for technical feasibility; however they still remain a
significant risk. Option 3a is rated significant because of the difficulty of managing the
competing priorities of Lake Victoria.
Options assessed as moderate are generally limited to small-scale construction works, while
low risk options relate mainly to operational changes. Option 3b is rated moderate risk largely
due to the challenge of getting the rules changes right. A low risk for Option 4 is only
appropriate if the Mildura Weir is upgraded. Increasing operational flexibility at Mildura Weir
using the existing structure is likely to have a significant risk.
Option 8 is considered as low risk because the infrastructure for this option is largely built
already, and the option is more about developing operating rules.

Barmah Choke Study – Individual Option Phase
SINCLAIR KNIGHT MERZ PAGE 94
Table 5-2: Risk associated with technical feasibility.
Options in category
Low
Option 1- do nothing
Option 4- increased operational flexibility in existing assets: Mildura Weir
Option 5a- lower operating level in Lake Mulwala by 0.1 m
Option 5b- lower operating level in Lake Mulwala by 0.5 m
Option 6a- Euston weir: raise the minimum operating level by 0.5 m
Option 6b- Euston weir: lower the minimum operating level by 1.5 m
Option 6c- Euston weir: raise the minimum operating level by 0.5 m and lower
the minimum operating level by 1.5 m
Option 8- construction of a mid-river storage
Option 16a – 200 ML/day Perricoota Escape
Option 17 – combined weir manipulation
Moderate
Option 2- alter the 6-inch rule to increase operational flexibility
Option 3b- policy options to manage within the capacity of the Barmah Choke:
Inter-valley trade
Option 3c- policy options to manage within the capacity of the Barmah Choke:
non-asset solutions
Significant
Option 3a- policy options to manage within the capacity of the Barmah Choke:
Lake Victoria transfers
Option 7a- 1 GL storage at “The Drop” on Mulwala Canal
Option 7b- 5 GL storage at “The Drop” on Mulwala Canal
Option 7c- 11 GL storage at “The Drop” on Mulwala Canal
Option 7d- 16 GL storage at “The Drop” on Mulwala Canal
Option 9- Bullatale Creek bypass
Option 10- Victorian forest channels
Option 11- increased escape capacity to Wakool River
Option 12a- increased escape capacity to Edward River (800 ML/day)
Option 12b- increased escape capacity to Edward River (1,500 ML/day)
Option 12c- increased escape capacity to Edward River (2,000 ML/day)
Option 13- increased escape capacity to Broken Creek
Option 14- Barmah bypass channel
Option 15- Murray-Goulburn Interconnector Channel
Option 16b – 500 ML/day Perricoota Escape
Option 16c – 1,000 ML/day Perricoota Escape
High

Barmah Choke Study – Individual Option Phase
SINCLAIR KNIGHT MERZ PAGE 95
Regulatory conditions risk
Regulatory conditions risks relate to the requirement that the options will need to undergo
significant policy or regulatory approvals before proceeding. While meeting regulatory
approval processes is a normal part of project planning, and not a risk in and of itself, this risk
item is used to identify which options will require more rigorous approval processes than
others.
Options 9, 10 and 15 are grouped as having high risk because they may have high potential
environmental impacts that trigger the need for extensive reviews and environmental impact
assessments. Given the proximity to National Parks or sensitive environmental areas for
Options 9 and 10, this means the regulatory requirements are „almost certain‟. This makes
these options high risk.
A large number of options are classed as significant as they are judged to have a „possible‟ or
higher likelihood of significant approvals process requiring Ministerial approval. The risk to
Option 6 (enlarged storage capacity in Euston Weir) is rated as high risk because of the
possible impact to the upstream wetlands. Moderately rated options are those that may only
require minimal approvals, while low risk options are those that could be implemented without
regulatory approval.

Barmah Choke Study – Individual Option Phase
SINCLAIR KNIGHT MERZ PAGE 96
Table 5-3: Risk associated with regulatory conditions.
Options in category
Low
Option 1- do nothing
Option 2- alter the 6-inch rule to increase operational flexibility
Option 3a- policy options to manage within the capacity of the Barmah Choke:
Lake Victoria transfers
Moderate
Option 3b- policy options to manage within the capacity of the Barmah Choke:
Inter-valley trade
Option 8- construction of a mid-river storage
Option 11- increased escape capacity to Wakool River
Option 12a- increased escape capacity to Edward River (800 ML/day)
Option 12b- increased escape capacity to Edward River (1,500 ML/day)
Option 12c- increased escape capacity to Edward River (2,000 ML/day)
Option 16a – 200 ML/day Perricoota Escape
Option 16b – 500 ML/day Perricoota Escape
Significant
Option 3c - policy options to manage within the capacity of the Barmah Choke:
non-asset solutions
Option 4- increased operational flexibility in existing assets: Mildura Weir
Option 5a - lower operating level in Lake Mulwala by 0.1 m
Option 5b - lower operating level in Lake Mulwala by 0.5 m
Option 6a- Euston weir: raise the minimum operating level by 0.5 m
Option 6b- Euston weir: lower the minimum operating level by 1.5 m
Option 6c- Euston weir: raise the minimum operating level by 0.5 m and lower
the minimum operating level by 1.5 m
Option 7a- 1 GL storage at “The Drop” on Mulwala Canal
Option 7b- 5 GL storage at “The Drop” on Mulwala Canal
Option 7c- 11 GL storage at “The Drop” on Mulwala Canal
Option 7d- 16 GL storage at “The Drop” on Mulwala Canal
Option 13- increased escape capacity to Broken Creek
Option 14- Barmah bypass channel
Option 16c – 1,000 ML/day Perricoota Escape
Option 17 – combined weir manipulation
High
Option 9 - Bullatale Creek bypass
Option 10- Victorian forest channels
Option 15- Murray-Goulburn Interconnector Channel

Barmah Choke Study – Individual Option Phase
SINCLAIR KNIGHT MERZ PAGE 97
Stakeholder and community risk
The only high risk option from a stakeholder and community perspective is the lowering of
Lake Mulwala by 0.5 m (Option 5b). This option was judged to be „almost certain‟ to cause
„extensive community dissatisfaction‟ making this a high risk option from a stakeholder and
community perspective.
There are a number of significant risk options relating to stakeholders and the communities.
Primarily these are the options that will cause community concern because of the size of the
project and the areas likely to be impacted. Option 10a and 10b relate to a sensitive
environmental area (Barmah National Park) which is „likely‟ to cause community concern on
environmental grounds, as is the Murray-Goulburn Interconnector (Option 15), the Bullatale
Creek bypass (Option 9) and the Barmah bypass (Option 14). The options which will involve
modifications for weirs (Mildura, Euston and Mulwala- Options 4, 5 and 6) are likely to create
significant risks due to the recreational/irrigator impacts that may be caused. Option 1 is rated
a significant risk as communities want to see action on shortfalls and freeing of restrictions on
trade. Option 3c is rated significant as some of the non-asset solutions involve changes to
entitlements which has the potential to cause concern.
Moderate risk projects have the potential to cause regional concern; however the likelihood is
at the low end of the scale. Low risk options largely relate to those which are assessed as
having very little noticeable impact on the community and are therefore unlikely to cause
community or political opposition.

Barmah Choke Study – Individual Option Phase
SINCLAIR KNIGHT MERZ PAGE 98
Table 5-4: Risk associated with stakeholder and community.
Options in category
Low
Option 2- alter the 6-inch rule to increase operational flexibility
Option 3a- policy options to manage within the capacity of the Barmah Choke:
Lake Victoria transfers
Option 8- construction of a mid-river storage
Moderate
Option 3b- policy options to manage within the capacity of the Barmah Choke:
Inter-valley trade
Option 7a- 1 GL storage at “The Drop” on Mulwala Canal
Option 7b- 5 GL storage at “The Drop” on Mulwala Canal
Option 7c- 11 GL storage at “The Drop” on Mulwala Canal
Option 7d- 16 GL storage at “The Drop” on Mulwala Canal
Option 11- increased escape capacity to Wakool River
Option 12a- increased escape capacity to Edward River (800 ML/day)
Option 12b- increased escape capacity to Edward River (1,500 ML/day)
Option 12c- increased escape capacity to Edward River (2,000 ML/day)
Option 13- increased escape capacity to Broken Creek
Option 16a – 200 ML/day Perricoota Escape
Option 16b – 500 ML/day Perricoota Escape
Option 16c – 1,000 ML/day Perricoota Escape
Significant
Option 1- do nothing
Option 3c- policy options to manage within the capacity of the Barmah Choke:
non-asset solutions
Option 4- increased operational flexibility in existing assets: Mildura Weir
Option 5a- lower operating level in Lake Mulwala by 0.1 m
Option 6a- Euston weir: raise the minimum operating level by 0.5 m
Option 6b- Euston weir: lower the minimum operating level by 1.5 m
Option 6c- Euston weir: raise the minimum operating level by 0.5 m and lower
the minimum operating level by 1.5 m
Option 9- Bullatale Creek bypass
Option 10- Victorian forest channels
Option 14- Barmah bypass channel
Option 15- Murray-Goulburn Interconnector Channel
Option 17 – combined weir manipulation
High Option 5b- lower operating level in Lake Mulwala by 0.5 m

Barmah Choke Study – Individual Option Phase
SINCLAIR KNIGHT MERZ PAGE 99
Demand and supply risk
Demand/supply risk occurs because of the potential for future changes in the irrigation
industry that may result in some of these assets not being used to their full potential and
possibly becoming obsolete. Given the amount of planning which would occur before the
implementation of any of these options, the likelihood of obsolescence is considered „unlikely‟
for all options.
The risk level is correlated with the asset cost, regulatory requirements, community opposition
and environmental consequences. The greater the effort to get the options implemented (in
terms of political capital expended, environmental degradation, and cost) the higher the
consequence of any obsolescence.
There has also been consideration of whether the options is just to relieve issues associated
with the Barmah Choke or could be useful for other purposes. This relates particularly to the
storage at „The Drop‟ on Mulwala Canal (Option 7) and the escape options (Option 11, 12 and
13) which may provide some operational benefits to Murray Irrigation Limited.

Barmah Choke Study – Individual Option Phase
SINCLAIR KNIGHT MERZ PAGE 100
Table 5-5: Demand and supply risk.
Options in category
Low
Option 1- do nothing
Option 2- alter the 6-inch rule to increase operational flexibility
Option 3a- policy options to manage within the capacity of the Barmah Choke:
Lake Victoria transfers
Option 3b- policy options to manage within the capacity of the Barmah Choke:
Inter-valley trade
Option 3c- policy options to manage within the capacity of the Barmah Choke:
non-asset solutions
Option 4- increased operational flexibility in existing assets: Mildura Weir
Option 5a- lower operating level in Lake Mulwala by 0.1 m
Option 5b- lower operating level in Lake Mulwala by 0.5 m
Option 6a- Euston weir: raise the minimum operating level by 0.5 m
Option 6b- Euston weir: lower the minimum operating level by 1.5 m
Option 6c- Euston weir: raise the minimum operating level by 0.5 m and lower
the minimum operating level by 1.5 m
Option 8- construction of a mid-river storage
Option 16a – 200 ML/day Perricoota Escape
Option 17 – combined weir manipulation
Moderate
Option 11- increased escape capacity to Wakool River
Option 12a- increased escape capacity to Edward River (800 ML/day)
Option 12b- increased escape capacity to Edward River (1,500 ML/day)
Option 12c- increased escape capacity to Edward River (2,000 ML/day)
Option 13- increased escape capacity to Broken Creek
Option 16b – 500 ML/day Perricoota Escape
Option 16c – 1,000 ML/day Perricoota Escape
Significant
Option 7a- 1 GL storage at “The Drop” on Mulwala Canal
Option 7b- 5 GL storage at “The Drop” on Mulwala Canal
Option 7c- 11 GL storage at “The Drop” on Mulwala Canal
Option 7d- 16 GL storage at “The Drop” on Mulwala Canal
Option 9- Bullatale Creek bypass
Option 10- Victorian forest channels
Option 14- Barmah bypass channel
Option 15- Murray-Goulburn Interconnector Channel
High

Barmah Choke Study – Individual Option Phase
SINCLAIR KNIGHT MERZ PAGE 101
Environmental risk
The environmental risk relates to the potential for unacceptable environmental damage. The
options were assessed based on their proximity to high value and sensitive environmental
assets and the likelihood of damage occurring. Options 9, 10, and 14 would pass through
sensitive environmental areas leading to the assessed high risk. The physical length of the
Option 15 means it is likely to pass through sensitive environmental areas. Moderate risk
options relate to options with a much smaller footprint in less sensitive areas while low
environmental risks are associated with non-asset based options.
Option 1 is considered a significant risk because in the absence of action, the management of
the Barmah Choke will result in continual decline in ecosystem values of the Barmah-Millewa
Forest.

Barmah Choke Study – Individual Option Phase
SINCLAIR KNIGHT MERZ PAGE 102
Table 5-6: Environmental risk.
Options in category
Low
Option 3a- policy options to manage within the capacity of the Barmah Choke:
Lake Victoria transfers
Option 3b- policy options to manage within the capacity of the Barmah Choke:
Inter-valley trade
Option 3c- policy options to manage within the capacity of the Barmah Choke:
non-asset solutions
Moderate
Option 2- alter the 6-inch rule to increase operational flexibility
Option 5a- lower operating level in Lake Mulwala by 0.1 m
Option 5b- lower operating level in Lake Mulwala by 0.5 m
Option 8- construction of a mid-river storage
Option 16a – 200 ML/day Perricoota Escape
Significant
Option 1- do nothing
Option 4- increased operational flexibility in existing assets: Mildura Weir
Option 6a- Euston weir: raise the minimum operating level by 0.5 m
Option 6b- Euston weir: lower the minimum operating level by 1.5 m
Option 6c- Euston weir: raise the minimum operating level by 0.5 m and lower
the minimum operating level by 1.5 m
Option 7a- 1 GL storage at “The Drop” on Mulwala Canal
Option 7b- 5 GL storage at “The Drop” on Mulwala Canal
Option 7c- 11 GL storage at “The Drop” on Mulwala Canal
Option 7d- 16 GL storage at “The Drop” on Mulwala Canal
Option 9- Bullatale Creek bypass
Option 10- Victorian forest channels
Option 11- increased escape capacity to Wakool River
Option 12a- increased escape capacity to Edward River (800 ML/day)
Option 12b- increased escape capacity to Edward River (1,500 ML/day)
Option 12c- increased escape capacity to Edward River (2,000 ML/day)
Option 13- increased escape capacity to Broken Creek
Option 14- Barmah bypass channel
Option 15- Murray-Goulburn Interconnector Channel
Option 16b – 500 ML/day Perricoota Escape
Option 16c – 1,000 ML/day Perricoota Escape
Option 17 – combined weir manipulation
High

Barmah Choke Study – Individual Option Phase
SINCLAIR KNIGHT MERZ PAGE 103
Construction cost risk
Construction cost risk relates to the risk of cost overruns. The higher risks are associated with
the larger and more complex options which have a significant construction cost. Option 15 is
assessed as high risk as while the likelihood of overrun is only „possible‟, the high capital cost,
means it sits in the highest consequence category. These risks may be reduced as construction
projects move from concepts to detailed design.

Barmah Choke Study – Individual Option Phase
SINCLAIR KNIGHT MERZ PAGE 104
Table 5-7: Construction cost risk.
Options in category
Low
Option 1- do nothing
Option 2- alter the 6-inch rule to increase operational flexibility
Option 3a- policy options to manage within the capacity of the Barmah Choke:
Lake Victoria transfers
Option 3b- policy options to manage within the capacity of the Barmah Choke:
Inter-valley trade
Option 3c- policy options to manage within the capacity of the Barmah Choke:
non-asset solutions
Option 8- construction of a mid-river storage
Moderate
Option 4- increased operational flexibility in existing assets: Mildura Weir
Option 5a- lower operating level in Lake Mulwala by 0.1 m
Option 6a- Euston weir: raise the minimum operating level by 0.5 m
Option 16a – 200 ML/day Perricoota Escape
Option 17 – combined weir manipulation
Significant
Option 5b- lower operating level in Lake Mulwala by 0.5 m
Option 6b- Euston weir: lower the minimum operating level by 1.5 m
Option 6c- Euston weir: raise the minimum operating level by 0.5 m and lower
the minimum operating level by 1.5 m
Option 7a- 1 GL storage at “The Drop” on Mulwala Canal
Option 7b- 5 GL storage at “The Drop” on Mulwala Canal
Option 7c- 11 GL storage at “The Drop” on Mulwala Canal
Option 7d- 16 GL storage at “The Drop” on Mulwala Canal
Option 9- Bullatale Creek bypass
Option 10- Victorian forest channels
Option 11- increased escape capacity to Wakool River
Option 12a- increased escape capacity to Edward River (800 ML/day)
Option 12b- increased escape capacity to Edward River (1,500 ML/day)
Option 12c- increased escape capacity to Edward River (2,000 ML/day)
Option 13- increased escape capacity to Broken Creek
Option 14- Barmah bypass channel
Option 16b – 500 ML/day Perricoota Escape
Option 16c – 1,000 ML/day Perricoota Escape
High Option 15- Murray-Goulburn Interconnector Channel

Barmah Choke Study – Individual Option Phase
SINCLAIR KNIGHT MERZ PAGE 105
Operation risk
The operation risk is assigned based on the operational difficulty of implementing the various
options. A significant risk is assigned to the „do nothing‟ option (Option 1) because
continuation of the current operations is likely to continue to create difficulties in meeting the
competing demands for consumptive and environmental water users. Option 3c will be
complicated to implement. The types of non-asset solutions suggested require a high level of
planning and agreement both with irrigators and between State governments. Further, there is
also the likelihood of unforeseen consequences.
Option 3a has a significant operation risk because of inherent optional difficulties associated
with deciding on the timing and volume of any transfers. This option carries the risk of causing
undesirable flooding of the Barmah Forest, loss of water in Lake Victoria through high
evaporation losses, the risk that the water may not actually be needed because of unanticipated
inflows from the Darling River, the management of any internal spills, and the need to abide
by the Lake Victoria Operating Strategy.
Those options assessed as having low risk are where operating rules must be developed but are
not anticipated being complicated or difficult to negotiate. Low risk options require only minor
changes to current operations.

Barmah Choke Study – Individual Option Phase
SINCLAIR KNIGHT MERZ PAGE 106
Table 5-8: Operation risk.
Options in category
Low
Option 2- alter the 6-inch rule to increase operational flexibility
Option 3b- policy options to manage within the capacity of the Barmah Choke:
Inter-valley trade
Option 4- increased operational flexibility in existing assets: Mildura Weir
Option 5a- lower operating level in Lake Mulwala by 0.1 m
Option 5b- lower operating level in Lake Mulwala by 0.5 m
Option 6a- Euston weir: raise the minimum operating level by 0.5 m
Option 6b- Euston weir: lower the minimum operating level by 1.5 m
Option 6c- Euston weir: raise the minimum operating level by 0.5 m and lower
the minimum operating level by 1.5 m
Option 17 – combined weir manipulation
Moderate
Option 7a- 1 GL storage at “The Drop” on Mulwala Canal
Option 7b- 5 GL storage at “The Drop” on Mulwala Canal
Option 7c- 11 GL storage at “The Drop” on Mulwala Canal
Option 7d- 16 GL storage at “The Drop” on Mulwala Canal
Option 8- construction of a mid-river storage
Option 11- increased escape capacity to Wakool River
Option 12a- increased escape capacity to Edward River (800 ML/day)
Option 12b- increased escape capacity to Edward River (1,500 ML/day)
Option 12c- increased escape capacity to Edward River (2,000 ML/day)
Option 13- increased escape capacity to Broken Creek
Option 16a – 200 ML/day Perricoota Escape
Option 16b – 500 ML/day Perricoota Escape
Option 16c – 1,000 ML/day Perricoota Escape
Significant
Option 1- do nothing
Option 3a- policy options to manage within the capacity of the Barmah Choke:
Lake Victoria transfers
Option 3c- policy options to manage within the capacity of the Barmah Choke:
non-asset solutions
Option 9- Bullatale Creek bypass
Option 10- Victorian forest channels
Option 14- Barmah bypass channel
Option 15- Murray-Goulburn Interconnector Channel
High

Barmah Choke Study – Individual Option Phase
SINCLAIR KNIGHT MERZ PAGE 107
5.4. Option key risk summary and mitigation
Table 5-9: Key risks for options and mitigation.
Option Key Risks Comment and Mitigation
Option 1- Do nothing Environmental risk (significant)
Stakeholder and community (significant)
Operation risk (significant)
The risks are mitigated by planning and assessing options to reduce unseasonal flooding and irrigator shortfalls. The Barmah Choke Study also mitigates community concern by undertaking a study of Barmah Choke options.
Option 2- Alter the 6-inch rule
Monitoring of bank erosion rates as recommended in Earth Tech (2008)
Option 3a- Policy options- Lake Victoria transfers
Technical feasibility (significant)
Operation risk significant)
This can be managed by consultation with operational staff and modelling to develop decision support rules that identify operating conditions where there are clear expected benefits from Lake Victoria transfers.
Option 3b- Policy options- inter-valley trade
Key risk is determining whether the IVT water is available when needed. There is no guarantee that IVT will occur in any particular year and will depend on the relative allocation percentages between regions.
Option 3c- Policy options- non-asset solutions
Regulatory risk (significant)
Stakeholder and community (significant)
Operations risk (significant)
These risks can only be mitigated by a commitment to develop policies along with the agreements which would be required to ensure the option is workable.
Option 4- Increased flexibility- Mildura Weir
Regulatory risk (significant)
Stakeholder and community (significant)
Environmental risk (significant)
Detailed communications and consultation program.
Option 5a- lower
operating level in Lake
Mulwala by 0.1 m
Regulatory risk (significant)
Stakeholder and community (significant)
Detailed communications and consultation program.

Barmah Choke Study – Individual Option Phase
SINCLAIR KNIGHT MERZ PAGE 108
Option Key Risks Comment and Mitigation
Option 5b- lower
operating level in Lake
Mulwala by 0.5 m
Regulatory risk (significant)
Construction cost risk (significant)
Detailed communications and consultation program.
Stakeholder and community (high)
Option 6a- Euston weir:
raise the minimum
operating level by
0.5 m
Regulatory conditions (significant)
Stakeholder and community (significant)
Environmental risk (significant)
This project would require standard project planning and consultation processes.
Option 6b- Euston weir:
lower the minimum
operating level by
1.5 m
Regulatory conditions (significant)
Stakeholder and community (significant)
Environmental risk (significant)
Construction cost (significant)
This project would require standard project planning and consultation processes.
Option 6c- Euston weir:
raise the minimum
operating level by
0.5 m and lower the
minimum operating
level by 1.5 m
Regulatory conditions (significant)
Stakeholder and community (significant)
Environmental risk (significant)
Construction cost (significant)
This project would require standard project planning and consultation processes.
Option 7a- 11 GL
storage at “The Drop”
on Mulwala Canal
Technical feasibility (significant)
Regulatory conditions (significant)
Demand/Supply risk (significant)
Environmental risk (significant)
Construction cost risk (significant)
Further technical investigations would be required.

Barmah Choke Study – Individual Option Phase
SINCLAIR KNIGHT MERZ PAGE 109
Option Key Risks Comment and Mitigation
Option 7b- 16 GL
storage at “The Drop”
on Mulwala Canal
Technical feasibility (significant)
Regulatory conditions (significant)
Demand/Supply risk (significant)
Environmental risk (significant)
Construction cost risk (significant)
Further technical investigations would be required.
Option 8- Construction of a mid-river storage
No specific risk mitigation strategies required.
Option 9- Bullatale Creek
Technical Feasibility (significant)
As with any major capital spend, this project would need to undergo a detailed planning, consultation and approvals process. During this process, it may be possible mitigate the risks. Regulatory conditions
(high)
Stakeholder and community (significant)
Demand \ supply risk (significant)
Environmental risk (significant)
Construction cost risk (significant)
Operation risk (significant)
Option 10- Victorian
forest channels (both
routes)
Technical Feasibility (significant)
As with any major capital spend, this project would need to undergo a detailed planning, consultation and approvals process. During this process it may be possible to mitigate the risks. Regulatory conditions
(high)
Stakeholder and community (significant)
Demand \ supply risk (significant)
Environmental risk (significant)
Construction cost risk (significant)
Operation risk (significant)

Barmah Choke Study – Individual Option Phase
SINCLAIR KNIGHT MERZ PAGE 110
Option Key Risks Comment and Mitigation
Option 11- Increased diversions through Wakool system
Technical Feasibility (significant)
Environmental risk (significant)
Construction cost risk (significant)
While no high risks, this option does not have any low risk items either. Mitigation is likely to be possible through normal planning processes.
Option 12a- Increased escape capacity to Edward River (800 ML/day)
Technical Feasibility (significant)
Environmental risk (significant)
Construction cost risk (significant)
As for Option 11
Option 12b- Increased
escape capacity to
Edward River
(1,500 ML/day)
Technical Feasibility (significant)
Environmental risk (significant)
Construction cost risk (significant)
As for Option 11
Option 12c- Increased
escape capacity to
Edward River
(2,000 ML/day)
Technical Feasibility (significant)
Environmental risk (significant)
Construction cost risk (significant)
As for Option 11
Option 13- Increased escape capacity to Broken Creek
Technical Feasibility (significant)
Environmental risk (significant)
Construction cost risk (significant)
Construction cost risk can be mitigated by further investigative work to gain a better understanding of the requirements.
Option 14- Barmah bypass channel
Technical Feasibility (significant)
Regulatory conditions (significant)
Stakeholder and community (significant)
Demand \ supply risk (significant)
Environmental risk (significant)
Construction cost risk (significant)
Operation risk (significant)
As with any major capital spend, this option would need to undergo a detailed planning, consultation and approvals process. During this process it may be possible to mitigate the risks.

Barmah Choke Study – Individual Option Phase
SINCLAIR KNIGHT MERZ PAGE 111
Option Key Risks Comment and Mitigation
Option 15- Murray Goulburn interconnector
Technical Feasibility (significant)
As for Option 14
Regulatory conditions (high)
Stakeholder and community (significant)
Demand \ supply risk (significant)
Environmental risk (significant)
Construction cost risk (high)
Operation risk (significant)
Option 16a –
200 ML/day Perricoota
Escape
No specific risk mitigation strategies required.
Option 16b –
500 ML/day Perricoota
Escape
Technical Feasibility (significant)
Environmental risk (significant)
Construction cost risk (high)
While no high risks, this option does not have any low risk items either. Mitigation is likely to be possible through normal planning processes.
Option 16c –
1,000 ML/day
Perricoota Escape
Technical Feasibility (significant)
Regulatory conditions (significant)
Environmental risk (significant)
Construction cost risk (high)
While no high risks, this option does not have any low risk items either. Mitigation is likely to be possible through normal planning processes.
Option 17 – Combined
weir manipulation Regulatory conditions (significant)
Stakeholder and community (significant)
Environmental risk (significant)
This option would require standard project planning and consultation processes.

Barmah Choke Study – Individual Option Phase
SINCLAIR KNIGHT MERZ PAGE 112
6. Option modelling
6.1. Summary of modelling methods
Each option identified as suitable to “progress” for individual modelling and assessment has
been modelled in MSM-Bigmod as appropriate. MSM-Bigmod is a complex flow and salinity
modelling suite developed and maintained by MDBA, which has been used extensively to
simulate current and potential future system conditions in the River Murray. MSM-Bigmod is
used to inform the policy and decision making process.
All modelling was undertaken based on the pre-TLM reference run model (see description for
Option 1). This reference run represents pre-TLM operating conditions and historical climate
conditions. In the next phase of the Barmah Choke Study, other reference runs may be used as
part of a broader sensitivity analysis.
A very brief summary of the modelling method for each option is provided in Table 6-1. More
detailed, technical, descriptions of the modelling methods for each option are provided in
Appendix A. Modelling methods are not presented for parked and currently operational
options.
Some options (four) have been assessed by processing MSM-Bigmod inputs and outputs in a
spreadsheet to calculate indicators to evaluate the options rather than by direct processing of
MSM-Bigmod outputs.
Table 6-1: Summary of modelling methods for each option.
Option Modelling method
Option 1- do nothing MSM-Bigmod pre-TLM reference run model (user ID 1004TLM, run number 20506, supplied April 2010)
Option 2- alter the 6-inch rule to increase operational flexibility
MSM-Bigmod modelling
Option 3a- policy options to manage within the capacity of the Barmah Choke: Lake Victoria transfers
MSM-Bigmod modelling
Option 3b- policy options to manage within the capacity of the Barmah Choke: inter-valley trade
MSM-Bigmod modelling
Option 3c- policy options to manage within the capacity of the Barmah Choke: non-asset solutions
Not a modelling option
Option 4- increased operational flexibility in existing assets: Mildura Weir
Spreadsheet based modelling approach, calculated shortfall volume adjusted by the volume of active storage available in Mildura Weir.
Option 5- lower operating level in Lake Mulwala MSM-Bigmod modelling
Option 6- enlarged storage capacity in Euston Weir Spreadsheet based modelling approach, calculated shortfall volume adjusted by the volume of active storage available in Euston Weir.

Barmah Choke Study – Individual Option Phase
SINCLAIR KNIGHT MERZ PAGE 113
Option Modelling method
Option 7- storage at “The Drop” on Mulwala Canal Spreadsheet based modelling approach, calculated unseasonal flood volume adjusted by the available capacity in The Drop storage (within inlet and outlet capacity constraints)
Option 10- Victorian forest channels MSM-Bigmod modelling
Option 11- increased escape capacity to the Wakool River
MSM-Bigmod modelling
Option 12- Increased escape capacity to the Edward River
MSM-Bigmod modelling
Option 13- Increased escape capacity to Broken Creek
MSM-Bigmod modelling
Option 15- Murray-Goulburn interconnector channel MSM-Bigmod modelling
Option 16- Perricoota Escape MSM-Bigmod modelling
Option 17- Combined weir manipulation Spreadsheet based modelling approach, calculated shortfall volume adjusted by the net volume of active storage available in the combined weirs.
6.2. Evaluation of option effectiveness
As discussed in Section 2.2, the main indicators that have been used to evaluate the potential
effectiveness of each option are the option‟s ability to address the issues associated with the
limited capacity of the Barmah Choke. Specifically, the impact of the option on the number of
years with unseasonal flooding of the Barmah-Millewa Forest and the number of years with
shortfalls or rationing of diversions has been considered.
The impact of the option on the beneficial influence of the Barmah Choke for flooding of the
Barmah-Millewa Forest and other areas or third parties have also been considered though the
use of project specific indicators developed as a part of the Investigation Phase (SKM, 2009)
(summarised in Table 2-1) and the suite of MDBA standard indicators (MBDA, 2010a) as
appropriate. See Appendix C for more detail on the indicators.

Barmah Choke Study – Individual Option Phase
SINCLAIR KNIGHT MERZ PAGE 114
Table 6-2: Project specific indicators which may be used to assess option performance.
Objective Indicator
Conservation of water resources
Key allocation statistics for general security (NSW) and high and low reliability (Victoria) entitlements
Beneficial influence of the Barmah Choke
Flooding regime of the Barmah-Millewa Forest percentage of years with small and large floods in the Barmah-
Millewa Forest
maximum duration (in years) with no flood
Frequency and magnitude of environmental flows in the River Murray System: Frequency of key flooding criteria at key locations
(Koondrook/Gunbower, Hattah Lakes, Chowilla/Lindsay;
Flows to South Australia Average flow to SA in excess of entitlement (GL/year)
% Years where flows to SA < 1850 GL/year
Significant impacts to other areas and third parties Maintain water levels in Lake Victoria and Menindee Lakes for
cultural heritage reasons
Avoid Werai Forest unseasonal flooding
Avoid undesirable exceedance of 25,000 ML/d downstream of Hume
Avoid undesirable exceedance of capacity of Edward and Gulpa offtakes
Maintain recreational water levels at Lake Mulwala and Euston Weir
For each option modelled, a summary of the modelling results relative to Option 1- „do
nothing‟ (the base case) has been prepared. This was based on the raw modelling and indicator
outputs, without interpretation of the impact.
6.3. Significance of the problem under the base case
The Investigation Phase of the Barmah Choke Study (SKM, 2009), found that the limited
capacity of the Barmah Choke currently restricts the ability of the River Murray System to
meet the demands of irrigators and other water users and to manage high summer flows
through the Barmah-Millewa Forest.
This finding was based on the analysis of the significance of the problem under the base case.
Since the Investigation Phase, the base case used by the MDBA for modelling assessments has
changed. As such, the significance of the problem under the base case has been re-assessed.
The most significant impact of the change to the base case run is a significant reduction in the
volume of water entering the River Murray from the Goulburn River and a significant increase
in inflows from the Murrumbidgee River. These changes (along with the other changes to the

Barmah Choke Study – Individual Option Phase
SINCLAIR KNIGHT MERZ PAGE 115
model) has led to an increase in the number of years with shortfalls. Appendix B presents a
detailed discussion of the changes and the impacts of the changes.
6.3.1. Shortfalls and rationing of diversions
Table 6-3 summarises the extent of the shortfall issue based on flow downstream of
Yarrawonga Weir under the base case (Option 1). These results show that shortfalls are a
problem under the base case, with shortfalls occurring in 24% of years. In 18% of years the
shortfalls are type I (peak demand) shortfalls, while in 6% of years the shortfalls are type II
(lower system storage) shortfalls.
This suggests that options focused on enabling rapid, short-term responses such as mid-river
storage options may be successful in significantly reducing the incidence of shortfall events;
however under such options a number of large, long-duration shortfalls events will remain if
additional measures are not taken.
Table 6-3: Shortfalls based on flow downstream of Yarrawonga Weir under Option 1.
Duration Average Magnitude (ML/day) Total by Duration
< 1,000 ML/day 1,001 –
1,500 ML/day
> 1,500 ML/day
1 – 5 days 7 3 2 12
6 – 10 days 3 4 1 8
11 – 15 days 0 1 1 2
> 15 days 1 0 5 6
Total by magnitude 11 8 9 28
Shortfalls which are expected to be manageable
Number (total) 14
Number (type I- peak demand) 12
Number (type II- lower system storage) 2
Average volume (GL) 2.7
Average duration (days) 3.6
Shortfalls which are expected to be challenging to manage
Number 7
Number (type I- peak demand) 7
Number (type II- lower system storage) 0
Average volume (GL) 9.1
Average duration (days) 8.6
Shortfalls which are expected to be more difficult to manage
Number 7
Number (type I- peak demand) 2
Number (type II- lower system storage) 5
Average volume (GL) 111.6
Average duration (days) 41.3
Total shortfalls Number (total) 28 (24% of years)
Number (type I- peak demand) 21 (18% of years)
Number (type II- lower system storage) 7 (6% of years)

Barmah Choke Study – Individual Option Phase
SINCLAIR KNIGHT MERZ PAGE 116
6.3.2. Unseasonal flooding
Table 6-4 summarises the extent of the unseasonal flooding issue under the base case
(Option 1). Note some results for modelled natural conditions are also presented for
comparison. The results show that unseasonal flooding is a problem under the base case, with
moderate flooding occurring in 33 years over the model run (114 years) - three times more
frequently than under modelled natural conditions, and more severe flooding occurring in 29
years over the model run (114 years) - 5% more often than under modelled natural conditions.
The increase in the number of years of unseasonal flooding, particularly the increase in years
with moderate unseasonal flooding, may be contributing to changes in the ecological character
of the forest.
Table 6-4: Unseasonal flooding of the Barmah-Millewa Forest under Option 1 (some results for modelled natural conditions are also presented for comparison).
Duration Flow (ML/day) Total by
Duration 10,601 –
11,000
11,001 –
13,000
13,001 –
15,000
15,001 –
18,000
>18,000
0-2 days 1 13 4 0 0 18
3-7 days 0 7 9 14 12 42
>7 days 0 0 0 0 3 3
Total by Flow 1 20 13 14 15
Total years of unseasonal flooding (natural conditions- 38 years) 63
Total years of moderate unseasonal flooding (natural conditions- 11 years) 33
Total years of more severe unseasonal flooding (natural conditions- 24 years) 29
Proportion of wet years for each side of the forest (natural conditions- 31%) 40%
6.3.3. Other indicators and issues
A large number of other indicators have been prepared to allow potential option impacts on
other areas or third parties to be considered. The results of these indicators are presented in
Appendix D but are not discussed in this section as they are generally of a specific nature and
are unsuited to a general assessment of options.
6.4. Option evaluation
The main indicators that have been used to evaluate the potential effectiveness of each option
are the option‟s ability to address the issues associated with the limited capacity of the Barmah
Choke. Specifically, the impact of the option on the number of years with unseasonal flooding
of the Barmah-Millewa Forest and the number of years with shortfalls or rationing of
diversions has been considered.
The results of the indicator assessments for each option are presented in Appendix D and key
findings are discussed in this section by option.

Barmah Choke Study – Individual Option Phase
SINCLAIR KNIGHT MERZ PAGE 117
Figure 6-1 summarises the impact of options on the significance of the problem for reducing
the incidence of shortfalls and unseasonal flooding. Figure 6-1 also indicates the relative cost
and highest risk category of each option. This plot allows rapid comparison and evaluation of
the options.
Figure 6-1: The position of the points on each axis shows the effectiveness of options for reducing the incidence of shortfalls and unseasonal flooding; with the size of the point indicating the cost; and the colour the highest risk category for the option.
The impact of each option on the beneficial influence of the Barmah Choke for flooding of the
Barmah-Millewa Forest and other areas or third parties have also been considered though the
use of project specific indicators developed as a part of the Investigation Phase (SKM, 2009)
and the suite of MDBA standard indicators (MBDA, 2010a).
For the purposes of discussing option effectiveness, the following categories have been
adopted:

Barmah Choke Study – Individual Option Phase
SINCLAIR KNIGHT MERZ PAGE 118
low or limited effectiveness: the option leads to less than a 10% reduction in the number
of years with shortfall events or the number of years each side of the forest is wet
unseasonally (as appropriate)
moderate effectiveness: the option leads to a reduction in the number of years with
shortfall events or the number of years each side of the forest is wet unseasonally (as
appropriate) of between 10% and 40%
high effectiveness: the option leads to more than a 40% reduction in the number of years
with shortfall events or the number of years each side of the forest is wet unseasonally (as
appropriate)
Table 6-5: Key findings that can be gained from Figure 6-1.
Option effectiveness
Issue Option
Options which are highly effective
Unseasonal flooding
Option 5b- lower operating level in Lake Mulwala (0.5 m lowering
Option 7c and Option 7d- storage at The Drop on Mulwala Canal (11 GL and 16 GL storage)
Shortfalls Option 4a and Option 4b- increased operational flexibility in existing assets: Mildura Weir
Option 6b and Option 6c- enlarged storage capacity in Euston Weir
Option 17- combined weir manipulation
Option 15- Murray-Goulburn Interconnector
Both Nil
Options which are moderately effective
Unseasonal flooding
Option 10- Victorian forest channels
Option 5a- lower operating level in Lake Mulwala (0.1 m lowering
Option 7a and Option 7b- storage at The Drop on Mulwala Canal (11 GL and 16 GL storage)
Shortfalls Option 6a- enlarged storage capacity in Euston Weir
Option 3a- policy options to manage within the capacity of the Barmah Choke- Lake Victoria transfers
Option 3b- policy options to manage within the capacity of the Barmah Choke- inter-valley trade
Option 16c- Perricoota Escape (1,000 ML/day)
Both Option 12 (all sub-options)- increased escape capacity to the Edward River
Options which are of limited effectiveness
Option 2- alter the 6-inch rule to increase operational flexibility
Option 11- increased escape capacity to the Wakool River
Option 16a and Option 16b- Perricoota Escape (200 and 500 ML/day)
Option 13- increased escape capacity to Broken Creek
Based on the key findings above, along with the assessment of option cost, risk category and
third party impact or issues, summaries have been prepared for each option and are presented
below. Note that third party impacts or issues are described as „nill impacts indicated by

Barmah Choke Study – Individual Option Phase
SINCLAIR KNIGHT MERZ PAGE 119
modelling‟ where the modelling results (see Appendix D) indicated only a small (less than 2%)
change from Option 1.
Option 2 – alter the 6-inch rule to increase operational flexibility
Criteria Comment
Unseasonal Flooding Less than a 1% reduction in the number of years each side of the forest is wet unseasonally
Shortfalls Nil impact indicated by modelling
Third-party impacts or issues Nil impacts indicated by modelling
Risk category Moderate
Cost Minimal (operational change only)
Summary assessment Limited effectiveness
Option 3a – policy options to manage within the capacity of the Barmah Choke, Lake Victoria transfers
Criteria Comment
Unseasonal Flooding 7% reduction in the number of years each side of the forest is wet unseasonally
Shortfalls 21% reduction in number of years with shortfalls
Third-party impacts or issues Nil impacts indicated by modelling
Risk category Significant
Cost Minimal (operational change only)
Summary assessment Moderately effective at minimal cost
Option 3b – policy options to manage within the capacity of the Barmah Choke, inter-valley transfers
Criteria Comment
Unseasonal Flooding 3% reduction in the number of years each side of the forest is wet unseasonally
Shortfalls 21% reduction in the number of years with shortfalls
Third-party impacts or issues Nil impacts indicated by modelling
Risk category Moderate
Cost Minimal (operational change only)
Summary assessment Moderately effective at minimal cost
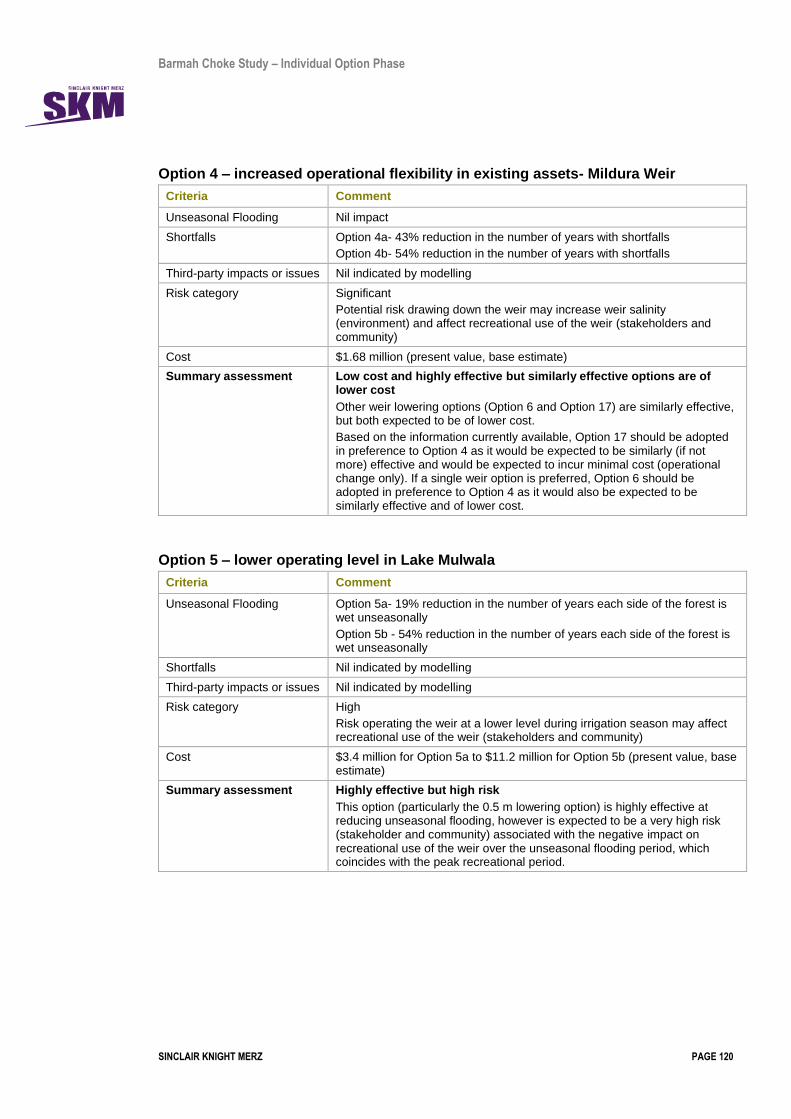
Barmah Choke Study – Individual Option Phase
SINCLAIR KNIGHT MERZ PAGE 120
Option 4 – increased operational flexibility in existing assets- Mildura Weir
Criteria Comment
Unseasonal Flooding Nil impact
Shortfalls Option 4a- 43% reduction in the number of years with shortfalls
Option 4b- 54% reduction in the number of years with shortfalls
Third-party impacts or issues Nil indicated by modelling
Risk category Significant
Potential risk drawing down the weir may increase weir salinity (environment) and affect recreational use of the weir (stakeholders and community)
Cost $1.68 million (present value, base estimate)
Summary assessment Low cost and highly effective but similarly effective options are of lower cost
Other weir lowering options (Option 6 and Option 17) are similarly effective, but both expected to be of lower cost.
Based on the information currently available, Option 17 should be adopted in preference to Option 4 as it would be expected to be similarly (if not more) effective and would be expected to incur minimal cost (operational change only). If a single weir option is preferred, Option 6 should be adopted in preference to Option 4 as it would also be expected to be similarly effective and of lower cost.
Option 5 – lower operating level in Lake Mulwala
Criteria Comment
Unseasonal Flooding Option 5a- 19% reduction in the number of years each side of the forest is wet unseasonally
Option 5b - 54% reduction in the number of years each side of the forest is wet unseasonally
Shortfalls Nil indicated by modelling
Third-party impacts or issues Nil indicated by modelling
Risk category High
Risk operating the weir at a lower level during irrigation season may affect recreational use of the weir (stakeholders and community)
Cost $3.4 million for Option 5a to $11.2 million for Option 5b (present value, base estimate)
Summary assessment Highly effective but high risk
This option (particularly the 0.5 m lowering option) is highly effective at reducing unseasonal flooding, however is expected to be a very high risk (stakeholder and community) associated with the negative impact on recreational use of the weir over the unseasonal flooding period, which coincides with the peak recreational period.

Barmah Choke Study – Individual Option Phase
SINCLAIR KNIGHT MERZ PAGE 121
Option 6 – enlarged storage capacity at Euston Weir
Criteria Comment
Unseasonal Flooding Nil indicated by modelling
Shortfalls Option 6a- 32% reduction in the number of years with shortfalls
Option 6b– 50% reduction in the number of years with shortfalls
Option 6c- 54% reduction in the number of years with shortfalls
Third-party impacts or issues Nil indicated by modelling
Risk category Significant
Potential risk drawing down the weir may affect recreational use of the weir (stakeholders and community)
Cost $0.83 million for Option 6a,$2.0 million for Option 6b, $2.3 million for Option 6c (present value, base estimate)
Summary assessment Low cost and highly effective, but a similarly effective option is of lower cost
Other weir lowering options (Option 4 and Option 17) are similarly effective, but Option 17 is expected to be of lower cost.
Based on the information currently available, Option 17 should be adopted in preference to Option 6 as it would be expected to be similarly effective and would be expected to incur minimal cost (operational change only). If a single weir option is preferred, Option 6 should be adopted in preference to Option 4 as it would also be expected to be similarly effective and of lower cost.
Option 7 – storage at “The Drop” on Mulwala Canal
Criteria Comment
Unseasonal Flooding Reduction in the number of years each side of the forest is wet unseasonally by:
Option 7a- 15%
Option 7b- 15%
Option 7c- 55%
Option 7d- 56%
Shortfalls Nil indicated by modelling
Third-party impacts or issues Nil indicated by modelling
Risk category Significant
Cost Option 7a- $6.2 million (present value, preliminary estimate)
Option 7b-$12.3 million (present value, preliminary estimate)
Option 7c- $70.9 million (present value, base estimate)
Option 7d- $87 million (present value, base estimate)
Summary assessment Smaller volume options are moderately effective but of high cost, larger volume options are highly effective but of higher cost

Barmah Choke Study – Individual Option Phase
SINCLAIR KNIGHT MERZ PAGE 122
Option 10 – Victorian forest channel bypass
Criteria Comment
Unseasonal Flooding 35% reduction in the number of years each side of the forest is wet unseasonally
Shortfalls Nil indicated by modelling
Third-party impacts or issues Nil indicated by modelling
Risk category High
This option would require works (channel works and regulators) in a National Park which may not be appropriate
Cost $ 97.7 million (present value, base estimate)
Summary assessment Moderately effective but high risk and high cost
Option 11 – increased escape capacity to the Wakool River
Criteria Comment
Unseasonal Flooding 3% reduction in the number of years each side of the forest is wet unseasonally
Shortfalls 7% reduction in the number of years with shortfalls
Third-party impacts or issues Nil indicated by modelling
Risk category Significant
Cost $6.8 million (present value, base estimate)
Summary assessment Limited effectiveness
Option 12 – increased escape capacity to the Edward River
Criteria Comment
Unseasonal Flooding Reduction in the number of years each side of the forest is wet unseasonally by:
Option 12a- 19%
Option 12b- 29%
Option 12c- 33%
Shortfalls 18% reduction in the number of years with shortfalls (all sub-options)
Third-party impacts or issues Nil indicated by modelling
Risk category Significant
Cost Option 12a- $7.4 million (present value, base estimate)
Option 12b- $8.0 million (present value, preliminary estimate)
Option 12c- $9.8 million (present value, preliminary estimate)
Summary assessment Moderately effective

Barmah Choke Study – Individual Option Phase
SINCLAIR KNIGHT MERZ PAGE 123
Option 13 – increased escape capacity to Broken Creek
Criteria Comment
Unseasonal Flooding 7% reduction in the number of years each side of the forest is wet unseasonally
Shortfalls 7% reduction in the number of years with shortfalls
Third-party impacts or issues Nil indicated by modelling (there is an increase in diversions through the Murray Valley irrigation system, however this water is returned to the River Murray System via Broken Creek, leading to no net change in water availability)
Risk category Significant
Cost $20.4 million (present value, base estimate)
Summary assessment Limited effectiveness
Option 15 – Murray-Goulburn interconnector channel
Criteria Comment
Unseasonal Flooding 22% reduction in the number of years each side of the forest is wet unseasonally
Shortfalls 43% reduction in the number of years with shortfalls
Third-party impacts or issues Nil indicated by modelling (there is an increase in diversions at Yarrawonga Weir, however this water is returned to the River Murray System via Goulburn River and Broken Creek, leading to no net change in water availability)
Risk category High
Risk that cost overruns could be very large (even a small proportional overrun could be large on such a big project) (construction cost risk) and significant regulatory approvals would be required (regulatory conditions)
Cost $394 million (present value, base estimate)
Summary assessment Highly effective but high risk and very high cost
Option 16 – Perricoota escape
Criteria Comment
Unseasonal Flooding Up to 9% reduction in the number of years each side of the forest is wet unseasonally
Shortfalls Up to 18% reduction in the number of years with shortfalls
Third-party impacts or issues Nil indicated by modelling
Risk category Significant
Cost Option 16a- minimal (operational change only)
Option 16b- $9.8 million (present value, preliminary estimate)
Option 16c- $61.5 million (present value, preliminary estimate)
Summary assessment Limited effectiveness

Barmah Choke Study – Individual Option Phase
SINCLAIR KNIGHT MERZ PAGE 124
Option 17 – combined weir manipulation
Criteria Comment
Unseasonal Flooding Nil indicated by modelling
Shortfalls 54% reduction in the number of years with shortfalls
Third-party impacts or issues Nil indicated by modelling
Risk category Significant
Cost Minimal (operational change only)
Summary assessment Highly effective at minimal cost

Barmah Choke Study – Individual Option Phase
SINCLAIR KNIGHT MERZ PAGE 125
7. Scenarios
The number and severity of shortfall events and unseasonal flooding events depends quite
heavily on level of development, water supply system configuration and capacity, and system
operating rules. It is important to assess how issues associated with the Barmah Choke may
change under different future operating regimes, such as different climate, different operating
rules and different level of demands.
Two different operating regimes were assessed as a part of the Barmah Choke Study prior to
the scenario modelling. The first was the base case in the Investigations Phase and the second
is the base case of this, the Individual Options Phase which assumed altered volume and
pattern of inflows to the system from the Goulburn, Murrumbidgee, Snowy and Darling
Rivers. The altered inflows were based on updated assumptions on how each of these river
systems would be managed.
To test the robustness of options under other alternative possible future conditions a sub-set of
options have been modelled under three alternative reference run scenarios (MDBA, 2010):
1) The post-TLM reference run scenario (reference run ID 20083), which represents post-
TLM operating conditions and historical climate conditions
2) The dry climate change to 2030 reference run scenario (reference run ID 20122), which
represents pre-TLM operating conditions and dry climate change to 2030 conditions
3) The post-TLM and dry climate change to 2030 reference run scenario (reference run ID
20075), which represents post-TLM operating conditions and dry climate change to 2030
conditions
These scenarios show that under the dry climate change to 2030 scenario, the number of
shortfalls increases slightly. There is a noticeable change in the distribution of shortfalls
between peak demand (type I) shortfalls and lower system storage (type II) shortfalls. The
instances and severity of lower system storage (type II) shortfalls decrease while the number
and severity of peak demand (type I) shortfalls increase. Under this scenario the number of
unseasonal flooding events decreases by approximately one third.
The post-TLM scenario does not change the total number of shortfall events significantly (27
compared to 28 in the base case). However, the severity of the shortfalls increases, with 14
shortfalls which are expected to be difficult to manage compared to 7 in the base case. This is
due mainly to the changes in tributary inflow due to TLM. In particular, the changes in flow in
the Goulburn and Murrumbidgee Rivers during summer result in large changes to timing and
magnitude of shortfall events. The TLM scenario increases the number of unseasonal flooding
events which is mainly due to some flow events being triggered that persist into January.

Barmah Choke Study – Individual Option Phase
SINCLAIR KNIGHT MERZ PAGE 126
The combined post-TLM and dry climate change to 2030 conditions scenario results in a small
reduction in the number of total shortfall events but also an increase in peak demand shortfalls
and a decrease in lower system storage shortfalls. Under this scenario, the number of years
with unseasonal flooding events decreases from the base case (63 reduced to 54).
Five options were selected for scenario modelling based on their effectiveness (in terms of
shortfalls, undesirable flooding or both) and to represent different types of options. The options
included:
Option 1 – do nothing, representing the base case
Option 5b – lower operating level in Lake Mulwala (0.5 m lowering of normal operating
level over the unseasonal flooding period), representing an upper system storage option
targeting unseasonal flooding
Option 6c – enlarged storage capacity in Euston Weir (0.5 m raising of normal operating
level and 1.5 m lowering of minimum operating level), representing a lower system
storage option targeting shortfalls
Option 12b – increased escape capacity to Edward River (increase the escape capacity to
3,400 ML/day which is 1,000 ML/day additional capacity), a bypass option targeting
unseasonal flooding with the potential to help manage shortfalls as well
Option 15 – Murray Goulburn Interconnector, a large new bypass option.
The scenario modelling results are summarised below for each of the option type groupings.
7.1. Upper system options targeting unseasonal flooding
These options can be grouped into those options which:
provide storage capacity upstream of the choke
provide bypass capacity around the choke
provide combination of storage capacity upstream and bypass capactiy.
The effectiveness of options depends on:
total active storage available
capacity constraints of the bypass route
capacity constraints of getting flow into or out of the storage.
Figure 7-1 presents the percentage of years each side of the forest is wet unseasonally for the
“do nothing” option and the three options simulated for the scenarios which impact on
unseasonal flooding. It shows that under the dry climate change to 2030 scenario, lowering the
target operating level in Lake Mulwala (Option 5b) is effective in terms of the reduction of
flooding in the forest under each scenario. The increased Edward Escape capacity (Option
12b) and Murray-Goulburn Interconnector (Option 15) are more variable in their effectiveness
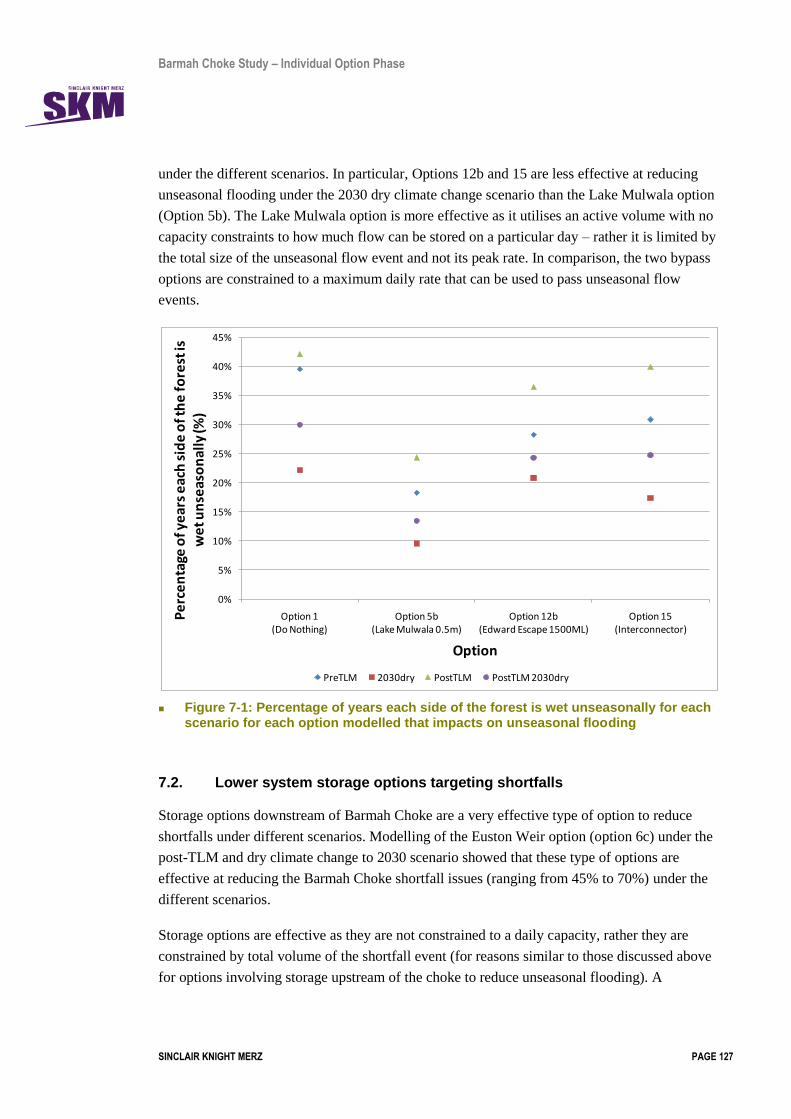
Barmah Choke Study – Individual Option Phase
SINCLAIR KNIGHT MERZ PAGE 127
under the different scenarios. In particular, Options 12b and 15 are less effective at reducing
unseasonal flooding under the 2030 dry climate change scenario than the Lake Mulwala option
(Option 5b). The Lake Mulwala option is more effective as it utilises an active volume with no
capacity constraints to how much flow can be stored on a particular day – rather it is limited by
the total size of the unseasonal flow event and not its peak rate. In comparison, the two bypass
options are constrained to a maximum daily rate that can be used to pass unseasonal flow
events.
Figure 7-1: Percentage of years each side of the forest is wet unseasonally for each scenario for each option modelled that impacts on unseasonal flooding
7.2. Lower system storage options targeting shortfalls
Storage options downstream of Barmah Choke are a very effective type of option to reduce
shortfalls under different scenarios. Modelling of the Euston Weir option (option 6c) under the
post-TLM and dry climate change to 2030 scenario showed that these type of options are
effective at reducing the Barmah Choke shortfall issues (ranging from 45% to 70%) under the
different scenarios.
Storage options are effective as they are not constrained to a daily capacity, rather they are
constrained by total volume of the shortfall event (for reasons similar to those discussed above
for options involving storage upstream of the choke to reduce unseasonal flooding). A
0%
5%
10%
15%
20%
25%
30%
35%
40%
45%
Option 1(Do Nothing)
Option 5b(Lake Mulwala 0.5m)
Option 12b(Edward Escape 1500ML)
Option 15(Interconnector)
Pe
rce
nta
ge o
f ye
ars
eac
h s
ide
of t
he
fo
rest
is
we
t un
seas
on
ally
(%)
Option
PreTLM 2030dry PostTLM PostTLM 2030dry

Barmah Choke Study – Individual Option Phase
SINCLAIR KNIGHT MERZ PAGE 128
potential major benefit of these options are that if they provide enough storage to draw on for a
long enough period, IVT transfers may be able to be called on to supplement supply. A current
constraint with options to address shortfalls is that large volumes of water which may
potentially be available from IVT accounts in the Goulburn and Murrumbidgee systems are not
able to be drawn upon due to the long time lag involved in getting water from headworks
systems in each of the systems to the River Murray.
The interconnector option is constrained by the pattern of IVT from the Goulburn system that
is used to supply the River Murray (which is in exchange for the additional supply to the
Shepparton Irrigation area in the Goulburn system).
Figure 7-2: Percentage of years with shortfalls for each scenario for each option modelled that impacts on shortfalls
7.3. Summary of outcomes from scenario modelling
The frequency and severity of simulated shortfall events are dependent on a number of factors.
A major driver is tributary inflows over the summer period when shortfalls are most likely to
occur. Changes to irrigation demands (via changed allocations due to different inflows) also
impact the results but this impact appears to have less of an effect on shortfalls than the
volume and pattern of tributary flows downstream of Barmah Choke.
0%
5%
10%
15%
20%
25%
30%
Option 1(Do Nothing)
Option 6c(Euston Weir +0.5m & -1.5m)
Option 15(Interconnector)
Pe
rce
nta
ge o
f ye
ars
wit
h s
ho
rtfa
lls
(%)
Option
PreTLM 2030dry PostTLM PostTLM 2030dry

Barmah Choke Study – Individual Option Phase
SINCLAIR KNIGHT MERZ PAGE 129
Options that involve drawing on storage downstream of the Choke have been shown to be very
effective in the scenarios modelled.
The extent of the unseasonal flooding is also dependent on inflows, with the dry climate
change to 2030 scenario dramatically reducing the number of unseasonal flood events, while
the post-TLM scenario increased them. Of the options modelled for the scenarios which
reduced unseasonal flooding, the most effective was the largest storage option (Mulwala 0.5m,
Option 5b) which had approximately 21 GL of active airspace. Under the scenarios this was
still the case.

Barmah Choke Study – Individual Option Phase
SINCLAIR KNIGHT MERZ PAGE 130
8. Option package recommendations
Phase 4 of the Barmah Choke Study aims to build on the results of this, the Individual Options
Phase, to develop an integrated package of options for consideration by the MDBA and
stakeholders. Figure 6-1 in Section 6, which summarises the evaluation of individual options,
shows the potential for an integrated solution to better address Barmah Choke issues over any
single option. However, in most cases it will not be appropriate to just add the effectiveness of
options to estimate the improvement in condition if multiple options were implemented:
For some combinations of options the combined effectiveness is simply, at best, the
effectiveness of the larger option. For example, the Edward Escape (Option 12) and the
Wakool Escape (Option 11) both require capacity in the Mulwala Canal to bypass flow
around the Barmah Choke. There is unlikely to be sufficient capacity to run the large
versions of both options together so there is minimal value in implementing these options
at the same time.
There are likely to be decreasing marginal returns to multiple interventions. When options
are assessed separately, they both have the opportunity to claim the easy gains, the small
unseasonal floods and shortfalls. If implemented together, the amount of „low hanging
fruit‟ remains the same but will be claimed by multiple rather than one option, making
each option within the combination appear less effective.
Quantifying the effect of multiple options will require MSM-Bigmod modelling, which is the
purpose of Options Integration Phase of the Barmah Choke Study. However, based on the
experience of option modelling in the current phase (Phase 3), along with the risk and cost
analysis that has been undertaken, it is possible to make preliminary recommendations of
packages of options for consideration by the MDBA. The packages and the options within
each package have been chosen to meet a particular objective. Details on packages are
provided below. In summary these are:
1) options that can be ruled out and do not require further analysis
2) low investment options
3) options that can be implemented quickly
4) options to address unseasonal forest flooding
5) options to address shortfalls
6) options with the largest environmental benefits
7) options shared between NSW and Victoria
8) package of options that is likely to result in best performance
9) „the works‟ i.e. a combination of the most effective individual options

Barmah Choke Study – Individual Option Phase
SINCLAIR KNIGHT MERZ PAGE 131
8.1. Options that can be ruled out
First, some options can be ruled out. These are the options which at best are „weakly
dominated‟ by other options. That is, there are many situations where other options are better
(more effective, less costly and less risky) and no situations where the weakly dominated
option is better. Some options can be ruled out because they are simply too costly, risky and
lack effectiveness (Table 8-1).
Table 8-1: Options that can be ruled out
Option No. Description
2 Alter the 6-inch rule to increase operational flexibility
9 Bullatale Creek bypass
10 Victorian forest channels
14 Barmah bypass channel
15 Murray-Goulburn interconnector channel
8.2. Low investment options
This package includes those options that have low cost but remain moderately effective. This
may be an attractive option if there is limited budget to address Barmah Forest issues.
Table 8-2: Low investment options
Option No. Description
3a Policy options to manage within the capacity of the Barmah Choke- Lake Victoria transfers
3b Policy options to manage within the capacity of the Barmah Choke- inter-valley trade
5a Lower operating level of Lake Mulwala (0.1 m lowering)
17 Combined weir manipulation
16a Perricoota Escape (200 ML/d capacity)
8.3. Options that can be implemented quickly
This package includes those options that can be implemented quickly. They are low risk,
require limited structural works and limited changes to current operating arrangements. This
package may be appropriate if there is an imperative by the MDBA and the States to address
problems within about 18 months i.e. if the options were approved in one financial year they
could be implemented by the end of the following financial year.

Barmah Choke Study – Individual Option Phase
SINCLAIR KNIGHT MERZ PAGE 132
Table 8-3: Options that can be implemented quickly
Option No. Description
3b Policy options to manage within the capacity of the Barmah Choke- inter-valley trade
12a Increased escape capacity to the Edward River (800 ML/d additional capacity)
16a Perricoota Escape (200 ML/d capacity)
17 Combined weir manipulation
8.4. Options to address forest flooding
The most effective options to reduce unseasonal forest flooding are included in this package.
This package may be appropriate for consideration by the MDBA and other stakeholders if
forest flooding by itself, becomes the main issue. This package of options combines increased
storage upstream of the Choke and bypasses on both the Victorian and NSW sides of the
forest.
Table 8-4: Options to reduce unseasonal forest flooding
Option No. Description
5b Lower operating level of Lake Mulwala (0.5 m lowering)
12c Increased escape capacity to the Edward River (2,000 ML/d additional capacity)
13 Increased escape capacity to Broken Creek
8.5. Options to address shortfalls
The most effective options to reduce shortfalls are included in this package. This is a
combination of bypasses, improved weir operations (downstream of the Barmah Choke) and
improved use of inter-valley trade.
Table 8-5: Options to reduce shortfalls
Option No. Description
3b Policy options to manage within the capacity of the Barmah Choke- inter-valley trade
4b Increased operational flexibility in existing assets- Mildura Weir (2 m lowering)
6c Enlarged storage capacity in Euston Weir (+0.5 m, -1.5 m)
12a Increased escape capacity to the Edward River (800 ML/d additional capacity)
17 Combine weir manipulation (excluding Euston Weir and Mildura Weir as they will be implemented separately)
8.6. Options with the largest environmental benefit
Options with positive environmental benefits have been included in this package. For example,
Broken Creek bypass (Option 13) addresses shortfalls but is also likely to lead to an

Barmah Choke Study – Individual Option Phase
SINCLAIR KNIGHT MERZ PAGE 133
improvement in water quality in Broken Creek. The Wakool River and Edward River bypasses
may allow improved watering of NSW riverine forests. In this package, options where poor
environmental outcomes represent a project risk are avoided. This may be an attractive
package of options if environmental benefits were sought and addressing Barmah-Millewa
Forest issues could be achieved as a secondary objective.
Table 8-6: Options with largest environmental benefits
Option No. Description
11 Increased escape capacity to the Wakool River (500 ML/d additional capacity)
12a Increased escape capacity to the Edward River (800 ML/d additional capacity)
13 Increased escape capacity to Broken Creek
8.7. Options shared between New South Wales and Victoria
This package of options is likely to be highly effective and shares required works, approvals
and expenditure between NSW and Victoria. This may be an appropriate package if
implementation budgets must be negotiated between the States and the Commonwealth.
Table 8-7: Package where options are shared between NSW and Victoria
Option No. Description
5a Lower operating level of Lake Mulwala (0.1 m lowering)
12c Increased escape capacity to the Edward River (2,000 ML/d additional capacity)
13 Increased escape capacity to Broken Creek
17 Combined weir manipulation
8.8. Best performance
The preliminary assessment indicates that this package of options is likely to have the best
performance in addressing both shortfalls and unseasonal flooding for reasonable cost (there
are however significant risks that would need to be addressed).
Table 8-8: Package of best performing options
Option No. Description
5b Lower operating level of Lake Mulwala (0.5 m lowering)
17 Combined weir manipulation
12c Increased escape capacity to the Edward River (2,000 ML/d additional capacity)
Barmah Choke Study – Individual Option Phase
SINCLAIR KNIGHT MERZ PAGE 134
8.9. The works
This package combines those options that are best at addressing shortfalls and those options
that address unseasonal flooding. Although probably not feasible or appropriate to implement
because of the issue of decreasing marginal returns, this package would provide „an upper
bound‟ (in contrast to a baseline) that can be used to compare the effectiveness of other option
packages. This includes all the options in Table 8-4 and Table 8-5.
8.10. Other considerations
8.10.1. Avoiding high risk Option 5b
There is only one „high‟ risk option included in these packages and that is to Option 5b –
reduce operating level at Mulwala by 0.5 m. If this option is considered too risky then Option 7
(storage at the drop) could be included instead- for each package that currently includes Option
5b, substitute Option 7.
8.10.2. Considering Option 3c – non-asset solutions
Of the remaining options, Option 3c, the non-asset solution, is a special case. For this option
further analysis is required to explore ways to reduce the simultaneous demand for irrigation
and environmental water during times when shortfall events are likely. To compare the
management of environmental entitlements, further modelling could be undertaken to
understand the impacts of the CEWH water holdings. The key requirement would be to
develop rules for the use of environmental water and then include these rules in modelling.
Development of appropriate rules is likely to require discussion between the CEWH and the
MDBA. Once these rules were agreed, this option should first be modelled by itself and then in
combination with other options depending on preliminary results.

Barmah Choke Study – Individual Option Phase
SINCLAIR KNIGHT MERZ PAGE 135
9. Conclusions
The aim of the Barmah Choke Study is to develop an understanding of current and potential
future water supply and environmental risks associated with the Barmah Choke and other mid-
river operational issues. The intent is to identify a preferred option, or package of integrated
options, for reducing the impact of operational and policy challenges while recognising that
the Barmah Choke performs an important role in flooding the Barmah-Millewa Forest.
This, the “Individual Options Phase” of the Barmah Choke Study has built upon the outputs of
the previous phases. It has described, modelled and assessed individually a range of
operational, policy and structural river management options shortlisted in the previous
“Investigations Phase”. This has led to a refined shortlist of options and recommendations on
packages of options for integrated modelling and assessment in the next phase of the Barmah
Choke Study.
Options
Options to reduce or eliminate the issues associated with the limited capacity of the Barmah
Choke have been grouped into a number of broad categories:
policy options
upper system storage options targeting unseasonal flooding
lower system storage options targeting shortfalls
bypass capacity options.
Option evaluation
The approach adopted to evaluate options provides decision makers with the pertinent
information required to support and inform decision making. The process involves
consideration of three items for each option:
1) modelling outputs and indicators (and their interpretation) as a measure of effectiveness
2) cost estimates
3) risk assessment
These were combined to define each option such that a recommendation could be made about
their suitability for further assessment. Using this approach, favourable options are those
options which combine effectiveness, acceptable cost and acceptable risk.
Summary of key findings
Figure 6-1, in Section 6 provides a graphical summary of the impact of options on the
significance of the problem for reducing the incidence of shortfalls and unseasonal flooding. It
also shows the relative cost and highest risk category of each option. In addition to the plot, a
summary assessment for each option is provided in Table 9-1.

Barmah Choke Study – Individual Option Phase
SINCLAIR KNIGHT MERZ PAGE 136
Table 9-1: Option summary assessments- key finding, green highlighting indicates options of particular potential.
Option Summary assessment
Option 1- do nothing The base case
Option 2- alter the 6-inch rule to increase operational flexibility
Limited effectiveness
Option 3a- policy options to manage within the capacity of the Barmah Choke: Lake Victoria transfers
Moderately effective at low cost
Option 3b- policy options to manage within the capacity of the Barmah Choke: inter-valley trade
Moderately effective at low cost
Option 3c- policy options to manage within the capacity of the Barmah Choke: non-asset solutions
Use of environmental entitlements has potential to be an efficient and effective way of reducing the impacts of shortfalls as well as reducing total shortfalls altogether. The way in which environmental entitlement holders utilise their entitlement could have a significant impact on management of the Barmah Choke
Option 4- increased operational flexibility in existing assets: Mildura Weir
a) minimum operating level lowered by 1 m
b) minimum operating level lowered by 2 m
Low cost and highly effective but similarly effective options are of lower cost
Option 5- lower typical operating level in Lake Mulwala
a) by 0.1 m
b) by 0.5 m
Option 5b is highly effective but high risk and moderate cost. Option 5a, is less effective than option 5b, but is lower risk and low cost
Option 6- enlarged storage capacity in Euston Weir
a) maximum operating level raised by 0.5 m
b) minimum operating level lowered by 1.5 m
c) maximum operating level raised by 0.5 m and minimum operating level lowered by 1.5 m
Low cost and highly effective. Other weir options (option 4 and option 17) are similarly effective
Option 7- storage at “The Drop” on Mulwala Canal
a) storage capacity of 1 GL
b) storage capacity of 5 GL
c) storage capacity of 11 GL
d) storage capacity of 16 GL
Smaller volume options are moderately effective but of moderate cost, larger volume options are highly effective but of high cost
Option 8- construction of a mid-river storage On-hold: no assessment made because mid-river storage is already operational
Option 9- Bullatale Creek bypass Not assessed: would require significant works in a National Park which means this option is not likely to be appropriate
Option 10- Victorian forest channels Moderately effective but high risk and high cost
Option 11- increased escape capacity to the Wakool River
Limited effectiveness, moderate cost
Option 12- Increased escape capacity to the Edward River
a) additional 800 ML/day capacity
b) additional 1,500 ML/day capacity
c) additional 2,000 ML/day capacity
Moderately effective, moderate cost

Barmah Choke Study – Individual Option Phase
SINCLAIR KNIGHT MERZ PAGE 137
Option Summary assessment
Option 13- Increased escape capacity to Broken Creek
Limited effectiveness
Option 14- Barmah bypass channel Not assessed: a large, high cost channel in close proximity to the Barmah Forest National Park. A high risk, high cost option
Option 15- Murray-Goulburn interconnector channel Highly effective but high risk and high cost
Option 16- Perricoota Escape
a) use existing additional capacity (200 ML/day)
b) additional 500 ML/day capacity
c) additional 1,000 ML/day capacity
Limited effectiveness (option 16a – low cost, option 16b – moderate cost, option 16c – high cost)
Option 17- Combined weir manipulation Highly effective low cost
Option package recommendations
The Options Integration Phase of the Barmah Choke Study should build on the results of this
phase, to develop an integrated package of options for consideration by the MDBA and other
stakeholders. Clearly an integrated solution that combines a set of options is likely to better
address Barmah Choke issues than any single option.
Quantifying the effect of multiple options will require MSM-Bigmod modelling. However,
based on the information gathered as a part of this phase (Phase 3), preliminary
recommendations of packages of options have been prepared for consideration by the MDBA
and are summarised in Table 9-2.
Table 9-2: Option package recommendations.
Package Options
Options that can be ruled out Option 2- Alter the 6-inch rule to increase operational flexibility
Option 9- Bullatale Creek bypass
Option 10- Victorian forest channels
Option 14- Barmah bypass channel
Option 15- Murray-Goulburn interconnector channel
Low investment options Option 3a- Policy options to manage within the capacity of the Barmah Choke- Lake Victoria transfers
Option 3b- Policy options to manage within the capacity of the Barmah Choke- inter-valley trade
Option 5a- Lower operating level of Lake Mulwala (0.1 m lowering)
Option 17- Combined weir manipulation
Option 16a- Perricoota Escape (200 ML/d capacity)
Options that can be implemented quickly
Option 3b- Policy options to manage within the capacity of the Barmah Choke- inter-valley trade
Option 12a- Increased escape capacity to the Edward River (800 ML/d additional capacity)
Option 16a- Perricoota Escape (200 ML/d capacity)
Option 17- Combined weir manipulation

Barmah Choke Study – Individual Option Phase
SINCLAIR KNIGHT MERZ PAGE 138
Package Options
Options to address forest flooding
Option 5a- Lower operating level of Lake Mulwala (0.5 m lowering)
Option 12c- Increased escape capacity to the Edward River (2,000 ML/d additional capacity)
Option 13- Increased escape capacity to Broken Creek
Options to address shortfalls Option 3b- Policy options to manage within the capacity of the Barmah Choke- inter-valley trade
Option 4b- Increased operational flexibility in existing assets- Mildura Weir (2 m lowering)
Option 6c- Enlarged storage capacity in Euston Weir (+0.5 m, -1.5 m)
Option 12a- Increased escape capacity to the Edward River (800 ML/d additional capacity)
Option 17- Combine weir manipulation (excluding Euston Weir and Mildura Weir as they will be implemented separately)
Options with the largest environmental benefit
Option 11- Increased escape capacity to the Wakool River (500 ML/d additional capacity)
Option 12a- Increased escape capacity to the Edward River (800 ML/d additional capacity)
Option 13- Increased escape capacity to Broken Creek
Options shared between NSW and Victoria
Option 5a- Lower operating level of Lake Mulwala (0.1 m lowering)
Option 12c- Increased escape capacity to the Edward River (2,000 ML/d additional capacity)
Option 13- Increased escape capacity to Broken Creek
Option 17- Combined weir manipulation
Best performance Option 5b- Lower operating level of Lake Mulwala (0.5 m lowering)
Option 17- Combined weir manipulation
Option 12c- Increased escape capacity to the Edward River (2,000 ML/d additional capacity)
The works Combination of packages: Options to address forest flooding plus options to address shortfalls

Barmah Choke Study – Individual Option Phase
SINCLAIR KNIGHT MERZ PAGE 139
10. References
Bennett, M., undated, The Legalities: Do Covenants Really Work? Environmental Defender‟s
Office (WA), available at: http://www.edowa.org.au/archives/15_Covenant.pdf
Bren, L.J., 2005, The changing hydrology of the Barmah-Millewa Forest and its effects on
vegetation, Proceedings of the Royal Society of Victoria 117: 61-76.
Bren. L.J., O'Neill, I. and N.L. Gibbs, 1987, Flooding in Barmah Forest and its relation to
flow in the Murray-Edward River system. Aust. For. Res. 17, 127-44.
Earth Tech, 2007, The River Murray Six Inch Rule, unpublished report prepared for the
Murray-Darling Basin Commission.
Evans and Peck, 2008, Best Practice Cost Estimation for Publicly Funded Road and Rail
Construction, Report to Department of Infrastructure, Transport, Regional Development and
Local Government.
GHD, 2007, Investigation of the Potential to Recover Water by Construction of an En-route
Storage at “The Drop” on the Mulwala Canal, Feasibility Assessment, Final Report prepared
for The Living Murray – Project No W83, June 2007, unpublished report for the Murray
Catchment Management Authority.
G-MW, n.d., New $10 million Mid-Murray Storage Works to Begin Soon, archived news
release available from: http://www.lakemokoan.com.au/mid-
murraystorage/current_issues.htm#archive
G-MW, 2007a, Mid-Murray Storage Project, Fact Sheet 3: Project Overview, March 2007,
published by Goulburn-Murray Water, North Central Catchment Management Authority and
the (Victorian) Department of Sustainability and Environment, available from:
http://www.lakemokoan.com/cmocms/Publication/Docs/Project%20Overview.pdf
G-MW, 2007b, Mid-Murray Storage Project, Fact Sheet 7: Environmental, September 2007,
published by Goulburn-Murray Water, North Central Catchment Management Authority and
the (Victorian) Department of Sustainability and Environment, available from:
http://www.lakemokoan.com/cmocms/Publication/Docs/GMW%20Fact%20Sheet%206%20lo
res.pdf
G-MW and MDBA, 2008, Lake Mulwala Land and On-water Management Plan, 2008
Addendum, published by Goulburn-Murray Water, Shepparton, Victoria.
G-MW and MDBC, 2004, Lake Mulwala Land and On-water Management Plan, published by
Goulburn-Murray Water, Shepparton, Victoria.
Barmah Choke Study – Individual Option Phase
SINCLAIR KNIGHT MERZ PAGE 140
Green, D., 2001, The Edward-Wakool System, River Regulation and Environmental Flows,
Department of Land and Water Conservation, Murray Region, Deniliquin, NSW.
Green, S.J., 1999, Drawdown and Riverbank stability, Master of Engineering Science Thesis,
Department of Civil and Environmental Engineering, University of Melbourne.
Hajkowitz, S, 2008, Rethinking the economist’s evaluation toolkit in light of sustainability
policy, Sustainability: Science, Practice & Policy, Spring 2008 Volume 4 Issue 1
Howitt, J. A., D. S. Baldwin, G. N. Rees and J. Williams, 2007, Modelling blackwater:
predicting water quality during flooding of lowland river forests. Ecological Modelling 203:
229-242.
Howitt, J. A., D. S. Baldwin, G. N. Rees and J. Williams, 2005, BLACKWATER MODEL – A
revised computer model to predict dissolved oxygen and dissolved carbon downstream of
Barmah-Millewa Forest following a flood. Report to the Murray-Darling Basin Commission.
139 pp.
MacDonald, H.H., Conner, J., and Morrison, M., 2004, Market-Based Instruments for
Managing Water Quality in New Zealand, final report of the New Zealand Ministry for the
Environment.
MDBA, 2010a, River Murray System Operations Review, Reference Run Report 2010, Version
1, January 2010, unpublished report (Trim Ref D09/19519).
MDBA, 2010b, MDBA Risk Management Guidelines
MDBA, 210c, River Murray System Annual Operating Plan (Public Summary), 2010-11 Water
Year 1 June 2010 – 31 May 2011, D10/28829, 10 October 2010.
MDBC, 2008, Barmah Choke Study, Fact Sheet 1: Project Background, Fact Sheet, February
2008, published on-line by the MDBC, available at:
http://thelivingmurray2.mdbc.gov.au/__data/page/1908/Barmah_Choke_FS1.pdf
MDBC, 2006, The Barmah-Millewa Forest Icon Site Environmental Management Plan, 2006-
2007, Technical report no. 30/2006.
MIL, 2007, Annual Report 2007, published by MIL, Deniliquin.
Murray-Darling Basin Ministerial Council, 2002, Lake Victoria Operating Strategy, published
by the Murray-Darling Basin Commission, Canberra.

Barmah Choke Study – Individual Option Phase
SINCLAIR KNIGHT MERZ PAGE 141
Nation, R.M., and Ladson, A.R., 2008, Saving Water by Changing the Operation of Hume
Dam, paper presented to the Water Down Under 2008 Conference, Adelaide, 15–17 April,
2008.
National Water Commission, 2010, The impacts of water trade in the southern Murray-
Darling Basin, an economic, social and environmental assessment, paper currently under
review for publication as a Waterlines Report in 2010.
Productivity Commission, 2006, Rural Water Use and the Environment: The Role of Market
Mechanisms, research report, Melbourne.
Productivity Commission, 2010, Market Mechanisms for Recovering Water in the Murray-
Darling Basin, research report, Melbourne
River Murray Commission, 1980, River Murray Commission Review Report on River Murray-
Tocumwal to Echuca River Regulation and Associated Forest Management Problems, River
Murray Commission, Canberra, ACT, 2601.
River Murray Water, 2006, Backgrounder 3: Lake Hume – Overview of Operations. Murray-
Darling Basin Commission, available at: http://www.mdbc.gov.au/rmw/river murray
system/dartmouth reservoir/hume and dartmouth dams operations review/backgrounder 3: lake
hume – overview of operations.
Roberts, J. and Marson, F., 2000, Water regime of wetland and floodplain plants in the
Murray-Darling Basin: A source book of ecological knowledge. CSIRO Land and Water
Technical Report 30/00
Robertson, A.I., Bacon, P. and Heagney, G., 2001, The response of floodplain primary
production to flood frequency and timing. Journal of Applied Ecology 38:126-136.
SMEC, 2002, Review of Structures and Operation of Flow Regulating Infrastructure of the
River Murray System, Project E10, Environmental Flows and Water Quality Objectives for the
River Murray Project, Final Report, January 2002, unpublished report prepared for the
Murray-Darling Basin Commission.
SKM, 2009, Barmah Choke Study, Investigation Phase Report, Final 2, 24 July 2009, report
prepared for the Murray-Darling Basin Authority, published online at:
http://www.mdba.gov.au/services/publications/download?publicationid=48&key=1622
SKM, 2007, Barmah Choke Study, Project Plan, Final, 10 December 2007, unpublished report
prepared for the Murray-Darling Basin Commission.

Barmah Choke Study – Individual Option Phase
SINCLAIR KNIGHT MERZ PAGE 142
SKM, 2006a, Assessment of Hydraulic Characteristics of Tuppal Creek and Bullatale Creek
Systems, Final Report, January 2006, unpublished report prepared for the (NSW) Department
of Natural Resources.
SKM, 2006b, Assessment of Victorian Demands in the River Murray and Future Supply
Options, Final (2) Report, January 2006, unpublished report to the (Victorian) Department of
Sustainability and Environment.
SKM, 2006c, Improved Management of Rainfall Rejections Upstream of the Barmah Choke,
Final Report, August 2006, unpublished report for (NSW) Department of Natural Resources.
SKM, 2006d, Assessment of current ecological condition and investigations for potential
outcomes resulting from proposed management changes of the Tuppal and Bullatale Creek
systems, Final Report, July 2006, unpublished report for (NSW) Department of Natural
Resources.
SKM, 2005b, Study of Impacts on River Users arising from Variations of the Euston Weir Pool
Level, Final (H), unpublished report prepared for the Murray-Darling Basin Commission.
SKM, 2005b, Lake Boga/Kerang Lakes options for mid-Murray Storage, unpublished report
prepared for the (Victorian) Department of Sustainability and Environment.
Water Technology, 2008, Barmah-Millewa Hydrodynamic Modelling: Model Re-calibration.
Goulburn-Broken Catchment Management Authority.
Water Technology, 2006, Barmah-Millewa Hydrodynamic Model: Additional Investigations.
Goulburn Broken Catchment Management Authority.
Water Technology, 2005, Barmah-Millewa Forest Hydrodynamic model. Goulburn Broken
Catchment Management Authority.

Barmah Choke Study – Individual Option Phase
SINCLAIR KNIGHT MERZ PAGE 143
Glossary
Terminology Meaning
Allocation “The seasonal allocation represents the amount of water available to be delivered to customers in a regulated system in that season, expressed as a percentage of the system‟s total water entitlement” (G-MW, 2008)
Basin Plan The Basin Plan will be a strategic plan for the integrated and sustainable management of water resources in the Murray-Darling Basin, and is being prepared by the MDBA, as required by the Water Act 2007 (Cwlth) in consultation with Basin States and communities.
Benchmark “defines the dates between which a model run extends (e.g. 1891 to 2009) and can include any number of standard and non-standard reference runs and/or climatic models” (Reference Runs Report, 2010a)
Criteria Basis of the assessment method e.g. multi-criteria analysis. Broad attributes to consider and differentiate options and hence inform decision making (e.g. „environmental benefit)‟.
Effectiveness Effectiveness refers to how well a solution achieves its intended outcomes. For the Barmah Choke Study, this means how well options can reduce or mitigate the impacts of shortfalls or undesirable flooding.
Efficiency Efficiency can be defined in two ways – the first refers to delivering the project at least cost (cost-effective and fair and reasonable value for money). The second refers to whether an investment returns a net benefit. This is whether the costs outweigh the benefits (taking into account financial, social and environmental costs)? The latter definition is the appropriate meaning for the Barmah Choke Study. Efficiency can be measured in a number of ways but is often assessed through a cost-benefit analysis which is beyond the needs of this study. As such the likely costs and benefits are considered qualitatively and a judgement is made on the likely efficiency.
Indicator Expressed in modelling terms e.g. „Frequency of events >10,600 ML/day downstream of Yarrawonga Weir for >7 days during the undesirable flooding assessment period (1 January to 31 March)
Lower system storage shortfall (type II)
Lower system storage shortfalls are typically long in duration affecting the whole River Murray System downstream of the Barmah Choke (through to South Australia) caused by limited resources in Lake Victoria and the Menindee Lakes and insufficient channel capacity to implement bulk transfers to Lake Victoria (SKM, 2009).
Moderate undesirable flooding
Floods with a peak magnitude of greater than 11,000 ML/day but less than 15,000 ML/day are classified as moderate floods. These floods exceed the threshold at which significant impacts on vegetation communities would be expected to occur (11,000 ML/day) but are below the threshold where red gums would be impacted (15,000 ML/day). Floods of this magnitude can be restricted to one side of the forest through the manipulation of regulators.
More severe undesirable flooding
Floods with a peak magnitude of 15,000 ML/day or more are classified as more severe floods. These floods exceed the threshold at which red gums are impacted and will impact both sides of the forest.
Peak demand shortfall (type I)
Peak demand shortfalls are typically short duration events in the mid-reaches of the river between the Barmah Choke and Lake Victoria caused by insufficient channel capacity to meet peak irrigation demands (SKM, 2009).
Proportion of wet years for each side of the forest
Floods with a peak magnitude of less than 15,000 ML/day can be restricted to one side of the forest through the manipulation of regulators. As such, the proportion of wet years for each side of the forest is less than the total proportion of wet years.
The proportion of wet years for each side of the forest is equal to half the proportion of years with floods with a peak magnitude of less than 15,000 ML/day plus the proportion of years with floods of a peak magnitude of 15,000 ML/day or higher.

Barmah Choke Study – Individual Option Phase
SINCLAIR KNIGHT MERZ PAGE 144
Terminology Meaning
Rainfall rejection Rainfall rejections occur when a combination of reduced irrigation demands (due to rain in the irrigation areas) and increases in inflows from unregulated tributaries lead to increased flows in the River Murray, causing river levels to rise and exceed the capacity of the Barmah Choke, flooding the Barmah-Millewa Forest (MDBC, 2008).
Reference Run “a set of modelling assumptions applied to a given benchmark period that defines how the parameters of the river (including which climatic mode we are using) are specifically configured in the model for that given run” e.g. „MDBSY 2030‟ (Reference Runs Report, 2010a)
Shortfall Each year in the River Murray System, an allocation is announced for both NSW and Victoria at the start of the irrigation season and progressively updated during the irrigation season. Irrigator and other demands are restricted based on the announced allocation. Shortfalls occur when the restricted demands cannot be supplied due to channel capacity constraints or a lack of resource storage in the lower system (SKM, 2009).
Shortfalls which are expected to be challenging to manage
Shortfalls of either short duration or low magnitude (but not both) are classified as
„expected to be challenging to manage‟. This category reflects that as the volume or duration of a shortfall event increases it becomes more challenging for operators to manage or avoid and it is more likely that demands will be rationed or shortfalled.
Shortfalls which are expected to be manageable
Shortfalls of short duration and low magnitude are classified as „expected to be
manageable‟. This category reflects that there are a wide range of ad-hoc measures and responses that can be implemented by operators to manage or avoid short duration, low magnitude shortfalls.
Shortfalls which are expected to be more difficult to manage
Shortfalls of long duration and high magnitude are classified as „expected to be more
difficult to manage‟. This reflects that it is unlikely that such conditions could be managed or avoided through the use of ad-hoc measures and responses available to operators and it is very likely that demands will be rationed or shortfalled.
Sub-criteria Sub-components of criteria e.g. „Reduction in undesirable flooding of the Barmah-Millewa Forest‟.
Sub-options Variants of options that for example define the upper, mid and lower bounds of an option, or other instances / characteristics as agreed. Sub-options are defined in the Options Review Report (SKM, 2010).
System operating requirements
“Water released from storage but not recorded through the customer‟s outlets, examples include evaporation, leakage, seepage, meter error and unplanned spills. Sometimes called „losses‟” (G-MW, 2008)
The Living Murray The Living Murray program, established in 2002 aims to achieve a healthy working River Murray System through the recovery of water for the system and the operating of environmental works. The program‟s „first step‟ was implemented from 2004-2009 and recovered almost 500 GL of water for the environment.
Undesirable flooding Flows which exceed the capacity of the Barmah Choke lead to flooding of the Barmah-Millewa Forest. Flooding which occurs between the 15
th of December and
the 30th
of April can be detrimental to the health of the forest and is referred to as undesirable flooding (SKM, 2009).

Barmah Choke Study – Individual Option Phase
SINCLAIR KNIGHT MERZ PAGE 145
Appendix A Detailed review of Option 3c
A.1 Option description
Assessing non-asset solutions is often a critical requirement of funding agencies when
assessing capital program bids. Should a business case be developed in the future for a capital
program for the Barmah Choke, it will need to consider non-asset solutions. Non-asset
solutions require important consideration as they can mean significant avoided costs,
especially where large capital investments are proposed.
This section provides an overview of potential non-asset solution that could be used to manage
the impacts of capacity constraints in the Barmah Choke and recommends whether they should
be investigated further based on their potential to deliver an efficient and effective solution.
The non-asset solutions assessed include:
Tradable capacity shares
Covenants or options on entitlements
Use of environmental entitlements, and
Incentive or congestion pricing measures.
It is important to note that the non-asset solutions considered (apart from environmental
entitlements) cannot reduce the incidence or magnitude of shortfalls and they are not expected
to have an impact on undesirable flooding of the Barmah-Millewa Forest. The primary purpose
is to provide a solution that enables river operators and the irrigation community manage the
impact of shortfalls effectively (and efficiently). By reducing the impact of both peak demand
(type I) and lower system storage (type II) shortfalls, these non-asset solutions can achieve a
number of positive social and economic impacts at low cost.
The solutions considered (except for the use of environmental entitlements) may also
encourage improved irrigation efficiency and alternatives to using water in peak periods (e.g.
on-farm storages). A signal of the value of water during peak times will encourage investment
in local solutions such as on-farm storage.
Each of the solutions is discussed in more detail in the following sections however a summary
of the results is provided in Table A- 1. Note, these solutions are an investigation option only;
no hydrological modelling will be undertaken and it remains a preliminary assessment only.
Table A- 1: Summary of assessment of non-asset solutions.
Solution Effectiveness Efficiency Comment
Tradable capacity shares
While this solution offers a neat way of managing the congestion, difficulties in establishing a well functioning market

Barmah Choke Study – Individual Option Phase
SINCLAIR KNIGHT MERZ PAGE 146
Solution Effectiveness Efficiency Comment
reduces the efficiency
Covenants or options on entitlements
This option is likely to be costly and without an appropriate legislative backing would not be effective.
Use of environmental entitlements
Has potential to be an efficient and effective way of reducing the impacts of shortfalls as well as reducing total shortfalls altogether.
Incentive or congestion pricing measures
Difficult to assess whether pricing would provide the necessary incentives to change behaviour. Therefore not considered effective.
A.2 Tradable capacity shares
The capacity of the Barmah Choke is contributing to undesirable (unseasonal) flooding of the
Barmah-Millewa Forest and shortfalls to downstream irrigation areas. The operating capacity
of the Barmah Choke (10,600 ML/day as measured downstream of Yarrawonga Weir) could
act as a cap for the development of a market based instrument.
Permits could be used to allocate the capacity of the Barmah Choke (a „capacity share‟) to
irrigators, with permit holders given priority access during periods of congestion. The potential
exists for a capacity share product to be created which provides access rights to a share of the
available water flow during periods of congestion. These shares could then be tradable,
ensuring capacity is allocated to the highest value uses through an open market. The price of
capacity shares may provide an incentive for irrigators to manage their own demand during
periods of high water use, for example through the construction of on-farm storage. Depending
on the prices of capacity shares, there will also be an incentive to buy or sell these permits.
Additionally, once a capacity share has been allocated, private option contracts could be
created between irrigators. An options contract is a derivative product that attaches (in this
case) to the capacity share and would typically involve an agreement for future access in a
period of shortfall (i.e. when a trigger is activated). The contract usually involves the payment
of a „premium‟ at the time of signing and an exercise price at the time of option exercise.
During a shortfall period, options could then be exercised so that water would be delivered to
those who place the greatest value on it.
A.2.1 Potential risks and opportunities
There would be a number of potential risks associated with this option, primarily regarding the
development of a market. As noted by the Productivity Commission (2006), markets will
operate more efficiently where traders are heterogeneous (facing different marginal costs and
benefits). In contrast, where the market is thin and traders are comparable, with a similar
ability to pay for the tradable good, an active trading market may not result. This risk is
apparent in irrigation areas where similar types of crops are grown. However, if the market for

Barmah Choke Study – Individual Option Phase
SINCLAIR KNIGHT MERZ PAGE 147
capacity shares extended from the Barmah Choke all the way downstream to the South
Australian Riverland and beyond there is likely to be diversity of crop types and hence the
potential for heterogeneous traders and therefore a better operating market.
Further work in this area would need to consider the following issues and risks associated with
the development of a market:
What are the legal requirements for a new product and design of a trading market?
How would the capacity share be divided between irrigators - should it be granted or
auctioned?
What legal considerations are required particularly relating to the development of a new
property right?
How might trading occur and would this create an unnecessary burden on irrigators?
Would administrative complexity outweigh potential benefits?
Is there likely to be an active market or will trading be thin?
Are there long enough periods between establishing a rationing event and allowing trade
of capacity so that it is managed efficiently?
Can a product be designed to be appropriate for different irrigation areas given difference
rationing procedures that are applied during shortfall events?
Despite this, the solution provides a method of allocating capacity to those irrigators who
require it most while provide a potential new revenue source to other irrigators.
A.2.2 Effectiveness and efficiency
While this approach offers a way of managing capacity constraints there are questions as to the
effectiveness and efficiency of such an approach. Effectiveness may be limited by lack of an
active market, both because shortfalls are not a regular occurrence, and because it may be
difficult for irrigators to assess appropriate prices. There is also the prospect of a lack of
trading due to similar players in the market.
Efficiency is also somewhat questionable. There is will be a high level of costs associated with
the establishment and operation of a trading market. Initially appropriate legislative and
administrative arrangements will need to be put in place to give the property right legal basis.
Further, policy constraints such as division of the available capacity between the basin States
would have to be resolved. If a market was developed, a high level of transaction costs
(relative to trade) level can be expected relating to fees and charges, potential brokerage fees
and costs associated with irrigators managing their new property right.
Overall, it is judged that this option is not likely to be an efficient or effective solution until
policy constraints are removed.

Barmah Choke Study – Individual Option Phase
SINCLAIR KNIGHT MERZ PAGE 148
A.3 Use of environmental entitlements
Another potential solution is to ensure the use of significant holdings of environmental
entitlements (through agreements with holders) in periods when the Barmah Choke is not
congested and avoid their use when the Barmah Choke is congested.
A number of recent programs have meant environmental holdings have increased significantly
(although these are not all at the expense of consumptive entitlements). This has included large
Commonwealth funded programs, State based initiatives and joint Commonwealth and State
Based programs including The Living Murray and Water for the Future.
The water transfers could have a two-fold impact; firstly the transfers could reduce irrigator
demand downstream of the Barmah Choke and thereby reducing peak demand (where
purchases occur downstream of the Barmah Choke). Also, the water needs of environmental
assets may have more flexibility in the timing of watering events, allowing flexibility of when
and how the capacity of the Barmah Choke is used. Purchasing further entitlements
specifically to manage the capacity constraints is not considered a viable option. In the current
reform period, further entitlement purchases are unlikely to have political or irrigator support.
If these environmental water holdings were not used during a likely shortfall period, these
events would be reduced without the need for a significant capital expenditure. This could
occur through agreement with environmental water holders while acknowledging policy and
legislation constraints as to the time of its water use. Some of the current environmental water
acquisitions include:
The Living Murray: 472 GL of (long term cap equivalents).
The water is used to improve environmental health at six icon sites:
Barmah–Millewa Forest
Gunbower–Koondrook–Perricoota Forest
Hattah Lakes
Chowilla Floodplain and Lindsay–Wallpolla Islands
Lower Lakes, Coorong and Murray Mouth
River Murray Channel.
Many of these sites are downstream of the Barmah Choke and so will potentially increase the
pressure on the Barmah Choke as there is a potential timing issue with the possibility of
environmental managers using their entitlements at the same time as other entitlement holders.
Restoring the Balance (water buybacks through the Water for the Future program)
Table A- 2 shows that around 160 GL of entitlements of various security have been transferred
to the CEWH to date through the $3.1 billion program of water buybacks.

Barmah Choke Study – Individual Option Phase
SINCLAIR KNIGHT MERZ PAGE 149
Table A- 2: Water buybacks below the Barmah Choke (at 30 June 2010).
Catchment Entitlement Type Secured Purchases (ML)
Murray NSW general security- below the Barmah Choke 32,598
Murray NSW high security- below the Barmah Choke 386
Murray Victoria high reliability- below the Barmah Choke 79,244
Murray Victorian low reliability- below the Barmah Choke 5,762
Murray SA high security 41,065
TOTAL 159,055
Source: http://www.environment.gov.au/water/policy-programs/entitlement-purchasing/2008-09.html
Further savings are being made through the Sustainable Rural Water Use and Infrastructure
program. Generally these are attained through infrastructure improvements which aim to save
water without impacting irrigator use so may actually worsen congestion if the resulting
environmental allocations pass through the Barmah Choke.
Basin Plan
The Commonwealth Water Act 2007 requires the Murray-Darling Basin Authority (MDBA) to
prepare and oversee a Basin Plan. This plan is a legally enforceable document that provides for
the integrated management of all the Basin‟s water resources.
A key element of the Basin Plan includes defining sustainable diversion limits (SDLs), which
are enforceable environmentally sustainable limits on the quantities of surface water and
groundwater that may be taken from Basin water resources. Implemenation of the Basin Plan
may result in existing entitlements being transferred from irrigators to the CEWH.
A.3.1 Potential risks and opportunities
There are two main constraints for this solution:
1) Understanding the hydrological impacts of increased level of environmental entitlement
2) Gaining agreement with entitlements holders for altered watering plans.
This solution does provide a good opportunity to manage the constraint in the Barmah Choke
without imposing an additional burden on irrigators and without necessarily requiring
legislative change.
A.3.2 Effectiveness and efficiency
Establishing the effectiveness of this solution will require significant modelling effort. This is
beyond the scope of this project and will likely require a re-working of the current
hydrological models. Some evidence of reduced shortfalls is apparent through the modelling of
The Living Murray (TLM) initiative (Table A- 3) which is available within the current Murray
hydrological model. It shows that post-TLM, there will be a slight increase in undesirable
flooding and a slight reduction in the number of years with shortfalls, although a higher
proportion of the shortfalls that do occur will be classed „more difficult to manage‟ albeit with

Barmah Choke Study – Individual Option Phase
SINCLAIR KNIGHT MERZ PAGE 150
lower average volumes and duration. Modelling of this solution would need to take into
account the potential optimisation between competing demands between environmental needs
and the capacity of the Barmah Choke.
Overall, TLM reference run results in a reduction in the total volume of shortfalls (of all types)
by 18 per cent but an increase of 13 per cent in the number of days of shortfalls.
Table A- 3: Shortfall and flooding indicator for Option 1 (pre-TLM) to a post-TLM reference run.
Indicator Option 1
(pre-TLM)
Post-TLM
Reference Run
Total years of undesirable flooding 63 73
Total years of moderate flooding 33 35
Total years of more severe flooding 29 32
% of years each side of the forest is wet 40% 43%
Shortfalls which are
expected to be
manageable
Number 13 6
Average volume (GL) 2.4 1.4
Average Duration (days) 3.4 2.7
Shortfalls which are
expected to be
challenging to manage
Number 8 4
Average volume (GL) 8.7 8.4
Average Duration (days) 8.3 11.8
Shortfalls which are
expected to be more
difficult to manage
Number 7 16
Average volume (GL) 111.6 42.8
Average Duration (days) 41.3 24.2
Total number of shortfalls 28 26
Some limited data is also available on the impact of reduced entitlements on peak demand.
Figure A- 1 shows that only when allocations are well below 100 per cent, does peak demand
fall significantly. If a reduction in allocation is considered a good proxy for the impact of
reduced entitlements, this suggests a very large reduction in entitlements could be required to
significantly reduce the peak demands which are associated with shortfalls.

Barmah Choke Study – Individual Option Phase
SINCLAIR KNIGHT MERZ PAGE 151
Figure A- 1: Victorian peak daily demand and Victorian February allocation.
While further work is required to assess its effectiveness, this option is potentially highly
efficient. The major costs are already included as part of the Water for the Future program
meaning the costs associated with this option are largely the transaction costs associated with
reaching agreement with the CEWH or other bodies managing the Basin Plan (and
environmental watering plan) and overcoming any policy or legislative constraints if the
solution meant less than optimal environmental watering arrangements. The solution is
advantageous in that it would not require irrigator input, and could be managed by operators
and environmental water entitlement holders. In any case, this solution warrants further
investigation.
A.4 Covenants or options on entitlements
A covenant in general terms is an agreement to do or refrain from an act. Covenants have been
applied to land for example to prohibit building outside an agreed area to preserve surrounding
tress. More recently covenants have been used to protect remnant vegetation or achieve other
conservation goals (Bennett 2010). A covenant on entitlements could be placed (or purchased)
on a number of entitlements downstream of the Barmah Choke restricting the use of the
allocations associated with those entitlements in certain situations. In a period of capacity
constraints, the conditions of the covenant could be used to prevent some entitlement holders
gaining access to water deliveries during a shortfall period.
0
1000
2000
3000
4000
5000
6000
7000
8000
9000
10000
0 50 100 150 200 250
Vic
tori
an P
eak
Dai
ly D
em
and
fo
r W
ate
r Ye
ar
(ML/
day
)
Victorian February Allocation (%)

Barmah Choke Study – Individual Option Phase
SINCLAIR KNIGHT MERZ PAGE 152
An option contract could work in a similar manner. Option contracts could be entered into
between entitlement holders and the operators which allow them to prevent delivery of water
entitlements in a period of constraint (the „trigger‟). Options generally involve the payment of
an upfront fee (the „premium‟) and then a further fee if the option is exercised (the „exercise
price‟) by the operator to prevent supply (Scoccimarro and Collins 2006).
A.4.1 Potential risks and opportunities
The main risk associated this approach is the policy and legislative backing required for
covenants. However the solution potentially provides irrigators with an additional revenue
source which could be used to manage irrigation risks associated with shortfalls.
A.4.2 Effectiveness and efficiency
Theoretically, there is potential for covenants to effectively manage capacity constraints but in
practice, the effectiveness of covenant is likely to be limited. Further modelling would be
required to calculate the number of entitlements required to have a covenant applied to ensure
that the volume of allocation causing the current capacity constraint can be reduced. Covenants
would be applied to entitlements however it is the use of entitlement holders‟ allocation which
causes the constraint through the Barmah Choke. These may not align reducing effectiveness
or meaning a much larger number of entitlements would require a covenant.
While each State has provisions allowing conditions to be applied to entitlements, a legislative
change would offer more certainty and could ensure the water registries reflect changes to the
entitlements conditions (Scoccimarro and Collins 2006). The Productivity Commission (2010)
in assessing the suitability for the covenants for environmental flows found „...unless a Torrens
titling system was developed for water rights, it would be difficult to implement and enforce
covenants. Given the challenges in harmonising state approaches to defining and managing
water rights, there are likely to be significant difficulties in implementing a universal system of
covenants.’
Option contracts share the same problems as covenants where the number of entitlements
which would need to be subject to option contracts is uncertain. There are likely to be a high
level of the transaction costs in setting the contractual arrangements required for covenants.
Option contracts would need to be tied to the entitlements, potentially restricting (or adding
costs) to trade. It is unlikely the legal and regulatory constraints can be overcome to ensure the
benefits outweigh the administrative costs created.
A.5 Incentive pricing
Incentive pricing would involve offering differential pricing when it is clear a shortfall event is
about to occur. That is when a short fall event is about to occur, discounts could be offered for
those prepared to delay their order with a corresponding increase in cost for those wanting to
progress with their order. The objective would be to provide an incentive for some irrigators to

Barmah Choke Study – Individual Option Phase
SINCLAIR KNIGHT MERZ PAGE 153
delay orders while remaining revenue neutral for the operators. This approach could utilise
much of the research and information gained in congestion pricing implemented in a range of
fields such as transport and electricity pricing. It endeavours to make users aware of the
negative impact imposed on others when using water during peak demand. An incentive
pricing regime could ensure that those who have the greatest need for water deliveries during
peak demand periods will be able gain access, albeit for a higher price.
A.5.1 Potential risks and opportunities
There are a range of risk and opportunities from this option including:
Irrigators may object to increases in prices (even if overall it is cost neutral)
This option would most likely require regulatory approval from both the Essential
Services Commission in Victoria and NSW‟s water price regulator, IPART. It is unclear
how the a new pricing structure could be implemented
Strategic behaviour on part of irrigators may be a risk
Incentive pricing provides a signal to irrigators in managing the capacity of the Barmah
Choke.
A.5.2 Effectiveness and efficiency
It is questionable how effective this system would be. A significant process would need to be
undertaken to set the discriminatory prices at a level which would alter behaviour. This is
likely to be uncertain and will require ongoing adjustments to provide sufficient incentive for
some irrigators to delay their orders. Given that these events are relatively infrequent, it may
be difficult for irrigators to understand the new system and react in a way that alleviates
shortfall events. The time period between a shortfall event being predicted to when discounted
prices would be offered and could be accepted is likely so short as unworkable.
There are other problems with this approach including the potential for strategic behaviour
whereby some irrigators will have an incentive to create congestion by placing orders when
shortfalls are likely in order to have access to reduced pricing. This is likely a minor issue as
placing unnecessary orders may result in unnecessary deliveries. Distributional and equity
issues would need to be considered further for this solution. Increasing prices would advantage
some irrigators over others. This may result in a perceived lack of fairness which would make
implementation more difficult. Overall this is not considered and effective or efficient solution.

Barmah Choke Study – Individual Option Phase
SINCLAIR KNIGHT MERZ PAGE 154
Appendix B Option modelling methods
B.1 Option 1 – do nothing
The Investigation Phase of the Barmah Choke Study (SKM, 2009), found that the limited
capacity of the Barmah Choke currently restricts the ability of the River Murray System to
meet the demands of irrigators and other water users and to manage high summer flows
through the Barmah-Millewa Forest.
This finding was based on the analysis the significance of the problem under the base case.
Since the Investigation Phase, the base case used by the MDBA for modelling assessments has
changed (the base case model adopted for this assessment was the pre-TLM reference run
model (user ID 1004TLM, run number 20506, run supplied April 2010). As such, the
significance of the problem under the base case has been re-assessed. The results of this
assessment are presented below.
The key difference between the base case used for the Investigation Phase and the base case
adopted for this phase relates to the assumed level of development. The base case used for the
Investigation Phase was developed from a currently conditions run which assumed current
(June 2008) level of development for demands and system operating practices, including TLM.
The base case used for this phase was developed from a pre-TLM reference run scenario which
assumed current (January 2010) level of development for demands and system operating
practices excluding any water recovery (or deployment) for TLM.
The most significant impact of moving to a pre-TLM reference run (from a partial-TLM run) is
a significant reduction (85.1 GL/year) in the volume of water entering the River Murray from
the Goulburn River. This is because under pre-TLM conditions, there is no delivery of TLM
water savings to the River Murray from the Goulburn River. This TLM water was supplied to
the River Murray over the peak summer irrigation period. The reduction in tributary inflows
downstream of the Barmah Choke means more water must be supplied through the Choke,
increasing the incidence and magnitude of shortfalls over what was reported for the
Investigation Phase.
Other changes include:
Murrubidgee inflows revised to incorporate Murrumbidgee Water Sharing Plan
environmental flows. This increased flow at Balranald by 93.6 GL/year, with most
changes occurring a low flows.
Snowy inflow revised to be based on modelled flows only (previously a combination of
modelled and observed flows). This increased River Murray releases by 8.4 GL/year and
unregulated Tooma spills by 11.4 GL/year.

Barmah Choke Study – Individual Option Phase
SINCLAIR KNIGHT MERZ PAGE 155
Snowy model revised to be based on the dry inflow sequence volume. This reduces
forecast Snowy releases and leads to lower allocations.
Revised Menindee inflows as the Darling model has been undergoing continual
development including revision of losses. This increased Menindee inflows by 41
GL/year.
South Australian allocation and restriction system revised and rules for redistributing
South Australian restrictions over a year developed to match demand.
Minor revisions to Victorian tributary inflows:
Goulburn River inflows reduced by 1.1 GL/year
Campaspe River inflows reduced by 2.7 GL/year
Loddon River inflows increased by 0.1 GL/year
Torrumbarry system tributary inflows increased by 0.8 GL/year
Broken Creek inflows increased by 5.7 GL/year
Ovens River inflows reduced by 8.2 GL/year.
To revise the base case model for the Individual Options Phase, the pre-TLM reference run
model (user ID 1004TLM, run number 20506, run supplied April 2010) was initially run as
supplied.
Table B- 1 summarises the changes that were made to include the additional improvements for
modelling rainfall rejections developed as a part of the Investigation Phase (which have not
already been included in the model runs provided).
Table B- 1: Modifications made to the model as a part of the Investigation Phase and their status in the supplied pre-TLM reference run.
Modification made as a part of the Investigation Phase (SKM, 2009) Modifications required to the pre-TLM reference run
Updates to the model to use a new version of modflow which smooth‟s demands between months
Create a new version of modflwparaxxx.txt
Add column 14 to all lines, set to 0 for most, set to 4 (i.e. smoothed over 4 days) for Mulwala Cannal and Yarrawonga Channel at 8 m 3 ch weir
Copy the updated modflow exe (modflow-V357_SKMrev.exe) into the exe folder
Create a new copy of the ini file in the inifile folder (msm_bigmod_SKMrev.ini)
Under [MODFLOW] change EXEFILE and MODFILENAM to
reference the correct files.
The version of modflow and the modflow parameter file supplied (V492b-Modflow-Param.txt) includes the required changes- no further modifications required.
Column 14 is present in the parameter file and set to „4‟ for „Mulwala Canal‟ and „Yarrawonga Channel at 8 m 3 ch weir‟- no further modifications required.

Barmah Choke Study – Individual Option Phase
SINCLAIR KNIGHT MERZ PAGE 156
Modification made as a part of the Investigation Phase (SKM, 2009) Modifications required to the pre-TLM reference run
Updates to the model to set channel capacity to 10,600 ML/day
Bigmod control variable 239 (Yarrawonga Channel capacity) should be 12 x 10600
MSM Card 68 (channel capacity d/s of Yarrawonga used for determining transfers to Lake Victoria) and Card 68a (Mandatory Yarrawonga Channel capacity) in GL/month (May- Apr), Jan = 328.6, Feb = 296.8, Mar = 328.6, Apr = 318.0
The MSM and Bigmod parameter files supplied include these changes.
One additional change is required. MSM Card 73 position 1 to 6, YARRABANKFULL (the flow in ML/day at which the banks are overtopped downstream of Yarrawonga) is currently set to 10200. For Option 1 this will be revised to 10600.
Updates to the Yarrawonga target level to improve rainfall rejection modelling
Bigmod control variable 265 (Targ Yarra Poll YMC > 2000 ML/day) should be 124.6 m AHD
Bigmod control variable 266 (Targ Yarra Pool YMC > 2800 ML/day) should be 124.6 m AHD
The Bigmod parameter file supplied uses these target levels- no further modification required.
Include additional outputs for the forest loss indicator
Under Reach Data
Add 1 to the number of reaches
Add: 153, 0, 1, 1, 0.0, 1886.2 „BARMAH LOSSES IN FOREST‟ after 129 “BARMAH FOREST)
This change is not in the parameter file supplied, however losses are modelled slightly differently and this is not required- no further modification required.
Under Reach Definition Data
Add 1 to the number of reaches defined
Add ? Reach 153- BARMAH LOSSES IN FOREST, after 129 (BARMAH FOREST) (copy same definition)
This change is not in the parameter file supplied, however losses are modelled slightly differently and this is not required- no further modification required.
Under Branch Data
Change 3 „LOSSES IN FOREST‟
from: 18, 0.000, 0, 0, 0, 1, 1, 0, 16, 0
to: 18, 0.000, 153, 0, 0, 1, 1, 0, 16, 0
This change is not in the parameter file supplied, however losses are modelled slightly differently and this is not required- no further modification required.
Under Control Variables
Add 7 to the number of control variables
Change 172 „NATIONAL CHANNEL DIVERSIONS‟
from: 9, 0.000, 0, 0, 0, 0, „F2‟, 6, 86
to: 9, 0.000, 1, 0, 0, 0, „F2‟, 6, 86
The supplied parameter file includes this modification- no further modification required.
Change 232 „MULWALA CANAL DIVERSION‟
from: 9, 0.000, 0, 0, 0, 0, „F2‟, 3, 50
to: 9, 0.000, 1, 0, 0, 0, „F2‟, 3, 50
Supplied parameter file does not include this modification. For Option 1 the modification will be made.

Barmah Choke Study – Individual Option Phase
SINCLAIR KNIGHT MERZ PAGE 157
Modification made as a part of the Investigation Phase (SKM, 2009) Modifications required to the pre-TLM reference run
Add:
350 „INFLOW TO FOREST‟, 26, 0.000, 1, 0, 0, 0, „F1‟, 129, 1
351 „LOSSES IN FOREST‟, 26, 0.000, 1, 0, 0, 0, „F1‟, 153, 1
352 „Tuppal Ck‟, 26, 0.000, 1, 0, 0, 0, „FO‟, 44, 1
353 „Bullatale Ck‟, 26, 0.000, 1, 0, 0, 0, „FO‟, 45, 1
354 „Overbank Barmah‟, 26, 0.000, 1, 0, 0, 0, „FO‟, 19, 1
355 „Overbank Millewa‟, 26, 0.000, 1, 0, 0, 0, „FO‟, 46, 1
356 „Barmah Lake‟, 26, 0.000, 1, 0, 0, 0, „FO‟, 20, 1
After 520 „Moira Lake Rainfall‟ (all 12 x 0.)
The supplied parameter file includes the additional variables (different numbering)- no further modification required.
Updates to the model to predict demands (improved modelling of Lake Mulwala)
Under control variables add:
4 to the number of control variables
505 „Yesterday Mulwala Canal Diversion‟, 9, 0.000, 0, 0, 0, 0, „CV‟, 232, 50
232 „Mulwala Canal Diversions‟, 9, 0.000, 1, 0, 0, 0, „F2‟, 3, 50
508 „Yesterday Yarraw MC diversions‟, 9, 0.000, 0, 0, 0, 0, „CV‟, 245, 50
245 „Yarrawonga Cannel Diversions‟, 9, 0.000, 1, 0, 0, 0, „F2‟, 9, 70
507 „Increase in MC + YMC order >=0‟, 9, 0.000, 0, 0, 124, 0, „F2‟, 3, 50
509 „Pred increase MC + YMC order‟, 9, 0.000, 1, 0, 125, 0, „CV‟, 507, 50
Comment out original 232 „Mulwala Canal Diversion‟ and 245 „Yarrawonga Channel Diversions‟
The supplied parameter file includes these additional variables (different numbers)- no further modification required.
Under control variable combinations add:
2 to the number of combinations
124 „Change in MC + YMC order‟ 3 – CV 505 + CV 245 – CV 508
125 „Pred increase MC + YMC order‟ 1 * CN 2.0
The supplied parameter file includes these additional variable combinations- no further modification required.
B.2 Option 2 – alter the 6-inch rule to increase operational flexibility
Model changes have been made to both MSM and to Bigmod. A change to MSM was made to
adjust the Lake Hume operational loss equation (see Table B- 4) to represent the monthly
savings made due to the changes to the 6 inch rule. A number of changes to the Bigmod code
were required to be made to represent the daily changes to the rule and are described below.
To model the new rules for the rate of fall allowable at Doctors Point and Heywood, changes
were made to the special.f90 file of the Bigmod code as detailed in Table B- 2. The revised
flow-flow rating curves for Doctors Point and Heywood used to develop these changes are
detailed in Table B- 5 and Table B- 6 respectively, based on the flow-level rating curves
shown in Table B- 7 and Table B- 8respectively.

Barmah Choke Study – Individual Option Phase
SINCLAIR KNIGHT MERZ PAGE 158
Table B- 2: Changes made to the Special.f90 Bigmod FORTRAN code to model Option 6 – increased flexibility in the 6 inch rule.
Change Code
Original $Revision: 124 $
!$Date: 2010-04-15 20:40:40 +1000 (Thu, 15 Apr 2010) $
Module SPECIAL_Mod
Contains
!*==SPECIAL.spg processed by SPAG 6.08Dc at 18:29 on 8 Mar 2001
!Last change: MDBC 29/07/2009 2:57:59 PM
SUBROUTINE SPECIAL(Vc,Icnp,Icn,Valcon,Id,Im,Iy,idays,Defcon, &
Fi,Flwin,Flwout, &
Otherd,Efflnt,Div,Evmdat,Dvmdat,Regval,Rlevel, &
Stolak,Wrsto,Vmiss,Flwbrn,Ihist, &
idatesalt,rchlos,rdvfac,irchdv,ievast,datlak, &
hedsto,ilkfld,iwrfld,iwlrch,LAkeTopReg,SIllakBase)
!modifications: dbs jan 1998 upper flow limit at doctors point added
!for use in calculating hume outflows
!special code 9 modified for same reason
!
!: JHM Mar 2001 Call to new Subroutine "TERcalc" added
!to boost the volume of water pre-released
!to provide targeted environmental releases
!(TER) for the Hume to Yarrawonga stretch.
!
!this subroutine contains special hardwired code for calculating
!control variables
!
!when a new variable is defined - add data to spectst to enable
!tests to be made of definition
use UTE
Use INTERP_Mod
Use INTERPOL_Mod
Use HUMESA_Mod
Use TERCALC_Mod
Use DARTFLOW_Mod
Use DARTSPIL_Mod
Use DAYSINM_Mod
Use BARRPUMP_Mod
Use PENTAL_Mod
Use COSTNEW_Mod
IMPLICIT NONE
Revised Module Avge4Day
Real,dimension(4) :: DrAvgeFlow,HeyAvgeFlow
Integer InitAvge,ndpfall,nheyfall
Real InpFlow,InpHeight,minheight,drminflow,heyminflow
End Module Avge4Day

Barmah Choke Study – Individual Option Phase
SINCLAIR KNIGHT MERZ PAGE 159
Change Code
!$Revision: 124 $
!$Date: 2010-04-15 20:40:40 +1000 (Thu, 15 Apr 2010) $
Module SPECIAL_Mod
Contains
!*==SPECIAL.spg processed by SPAG 6.08Dc at 18:29 on 8 Mar 2001
!Last change: MDBC 29/07/2009 2:57:59 PM
SUBROUTINE SPECIAL(Vc,Icnp,Icn,Valcon,Id,Im,Iy,idays,Defcon, &
Fi,Flwin,Flwout, &
Otherd,Efflnt,Div,Evmdat,Dvmdat,Regval,Rlevel, &
Stolak,Wrsto,Vmiss,Flwbrn,Ihist, &
idatesalt,rchlos,rdvfac,irchdv,ievast,datlak, &
hedsto,ilkfld,iwrfld,iwlrch,LAkeTopReg,SIllakBase)
!modifications: dbs jan 1998 upper flow limit at doctors point added
!for use in calculating hume outflows
!special code 9 modified for same reason
!
!: JHM Mar 2001 Call to new Subroutine "TERcalc" added
!to boost the volume of water pre-released
!to provide targeted environmental releases
!(TER) for the Hume to Yarrawonga stretch.
!
!this subroutine contains special hardwired code for calculating
!control variables
!
!when a new variable is defined - add data to spectst to enable
!tests to be made of definition
use UTE
Use INTERP_Mod
Use INTERPOL_Mod
Use HUMESA_Mod
Use TERCALC_Mod
Use DARTFLOW_Mod
Use DARTSPIL_Mod
Use DAYSINM_Mod
Use BARRPUMP_Mod
Use PENTAL_Mod
Use COSTNEW_Mod
Use Avge4Day
IMPLICIT NONE
Original vicoutsto(15),TargetFlow(2), SATargetBP,lvicoutcal, &
vicoutflow(15),vicoutmax,tarlvlast,changemax, &
SAShortfallthismonth,wateruse(2),wateruse01(130), &
watervalue(20,2,2),swampfactor(2),RedbankShort,Aw,Ag,At,Ap, &
Apb,Awo,Agenoe,LVmaxPB,fillday,LAMinFlowFall,conv,InitSal, &
DIMENSION Valcon(Maxcon) , saent(12) , tarmen(12) , &
Defcon(Maxcon,12) , humfst(45) , dprise(6) , dpfall(6) , &

Barmah Choke Study – Individual Option Phase
SINCLAIR KNIGHT MERZ PAGE 160
Change Code
dprisfal(6) , heyfallf(7) , heyfall(7) , Flwin(0:Maxrch) &
, Flwout(0:Maxrch) , Rlevel(0:Maxlev) , Stolak(Maxlak,2) &
, Wrsto(Maxwr,3) , Evmdat(0:Maxevm) , Dvmdat(0:Maxdvm) , &
Efflnt(Maxeff) , Div(Maxdiv) , Regval(Maxreg) , &
Otherd(0:Maxoth) , Flwbrn(Maxbrn) , vouttb(10,2) , &
lim(3) , cst(3) , secvlim(12,2) , mdbclim(12,2) , &
secvcst(12,3) , mdbccst(12,3), &
Revised vicoutsto(15),TargetFlow(2), SATargetBP,lvicoutcal, &
vicoutflow(15),vicoutmax,tarlvlast,changemax, &
SAShortfallthismonth,wateruse(2),wateruse01(130), &
watervalue(20,2,2),swampfactor(2),RedbankShort,Aw,Ag,At,Ap, &
Apb,Awo,Agenoe,LVmaxPB,fillday,LAMinFlowFall,conv,InitSal, &
dpfall9,heyfall9,dpheight,heyheight
DIMENSION Valcon(Maxcon) , saent(12) , tarmen(12) , &
Defcon(Maxcon,12) , humfst(45) , dprise(6) , dpfall(6) , &
dprisfal(6) , heyfallf(7) , heyfall(7) , Flwin(0:Maxrch) &
, Flwout(0:Maxrch) , Rlevel(0:Maxlev) , Stolak(Maxlak,2) &
, Wrsto(Maxwr,3) , Evmdat(0:Maxevm) , Dvmdat(0:Maxdvm) , &
Efflnt(Maxeff) , Div(Maxdiv) , Regval(Maxreg) , &
Otherd(0:Maxoth) , Flwbrn(Maxbrn) , vouttb(10,2) , &
lim(3) , cst(3) , secvlim(12,2) , mdbclim(12,2) , &
secvcst(12,3) , mdbccst(12,3), &
heyfall9(7),dpfall(6),dpheight(6),heyheight(7)
Original !limits for doctors point rise and fall
!
DATA dprisfal/0. , 814. , 5060. , 9990. , 20000. , 25100./
DATA dprise/1630. , 1676. , 2910. , 3410. , 4100. , 4300./
DATA dpfall/0. , 606. , 1300. , 1600. , 2000. , 2100./
!DATA dpfall/0. , 814. , 2199. , 3025. , 3950. , 3738./ ! for SKM study (Uttam), if maxm rate of fall allowed is increased to 300 mm
!
!limits for heywoods fall
!
DATA heyfallf/0. , 1000. , 6000. , 10000. , 15000. , 20000. , &
25100./
DATA heyfall/0. , 676. , 1620. , 2070. , 2300. , 2600. , 3000./
!DATA heyfall/0. , 847. , 2456. , 2975. , 3450. , 3754. , 4407./ ! for SKM study (Uttam), if maxm rate of fall allowed is increased to 300 mm
Revised !limits for doctors point rise and fall
!
DATA dprisfal/0. , 814. , 5060. , 9990. , 20000. , 25100./
DATA dprise/1630. , 1676. , 2910. , 3410. , 4100. , 4300./
DATA dpfall/0. , 606. , 1300. , 1600. , 2000. , 2100./
!DATA dpfall/0. , 814. , 2199. , 3025. , 3950. , 3738./ ! for SKM study (Uttam), if maxm rate of fall allowed is increased to 300 mm
Data dpfall9/0.,712.,1644.,2290.,2850.,2800./
Data dpheight/0.,1.44,2.16,2.67,3.48,2.89/
!
!limits for heywoods fall
!
DATA heyfallf/0. , 1000. , 6000. , 10000. , 15000. , 20000. , &

Barmah Choke Study – Individual Option Phase
SINCLAIR KNIGHT MERZ PAGE 161
Change Code
25100./
DATA heyfall/0. , 676. , 1620. , 2070. , 2300. , 2600. , 3000./
!DATA heyfall/0. , 847. , 2456. , 2975. , 3450. , 3754. , 4407./ ! for SKM study (Uttam), if maxm rate of fall allowed is increased to 300 mm
Data heyfall9/0.,726.,1895.,2277.,2600.,2850.,3300./
Data heyheight/0.,1.34,2.04,2.45,2.90,3.30,3.66/
Original !calculate the acceptable rates of rise and fall at albury
!for pre-release
!
IF ( docflow.GE.25100. ) THEN
pflmin = 23000.
pflmax = 99999999.
ELSEIF ( docflow.LE.0. ) THEN
pflmax = 1630.
pflmin = 0.
ELSE
DO i = 2 , 6
IF ( docflow.LE.dprisfal(i) ) GO TO 20
ENDDO
i = 6
20 pflmax = docflow + dprise(i-1) + (docflow-dprisfal(i-1)) &
*(dprise(i)-dprise(i-1))/(dprisfal(i)-dprisfal(i-1))
pflmin = docflow - dpfall(i-1) - (docflow-dprisfal(i-1)) &
*(dpfall(i)-dpfall(i-1))/(dprisfal(i)-dprisfal(i-1))
ENDIF
pflmax = MAX(0.,pflmax-Valcon(65)+valcon(284))
pflmin = MAX(0.,pflmin-Valcon(65)+valcon(284))
!
!calculate the acceptable rates of fall at heywoods
!for pre-release
!20 cm per day
!
IF ( heyflow.GE.heyfallf(7) ) THEN
pflminhey = heyfallf(7) - heyfall(7)
ELSEIF ( heyflow.LE.0. ) THEN
pflminhey = 0.
ELSE
DO i = 2 , 7
IF ( heyflow.LE.heyfallf(i) ) GO TO 40
ENDDO
i = 7
40 pflminhey = heyflow - heyfall(i-1) - (heyflow-heyfallf(i-1)) &
*(heyfall(i)-heyfall(i-1)) &
/(heyfallf(i)-heyfallf(i-1))
ENDIF
!
!calculate the evaporation loss from the lake today
Revised !calculate the acceptable rates of rise and fall at albury
!for pre-release
!
If (InitAvge.ne.99) Then
DrAvgeFlow(:)=0.
HeyAvgeFlow(:)=0.

Barmah Choke Study – Individual Option Phase
SINCLAIR KNIGHT MERZ PAGE 162
Change Code
InitAvge=99
ndpfall=0
nheyfall=0
End If
IF ( docflow.GE.25100. ) THEN
pflmin = 23000.
pflmax = 99999999.
ndpfall=0
ELSEIF ( docflow.LE.0. ) THEN
pflmax = 1630.
pflmin = 0.
ndpfall=0
ELSE
ndpfall=min(4,ndpfall+1)
DrAvgeFlow(4)=DrAvgeFlow(3)
DrAvgeFlow(3)=DrAvgeFlow(2)
DrAvgeFlow(1)=DrAvgeFlow(1)
DrAvgeFlow(1)=docflow
InpFlow=DrAvgeFlow(ndpfall)
Do i=2,6
If (InpFlow.le.dprisfal(i)) Exit
End Do
i=min(6,i)
InpHeight=dpheight(i-1)+((dpheight(i)-dpheight(i-1))*(InpFlow-dprisfal(i-1))/(dprisfal(i)-dprisfal(i-1)))
minheight=max(0.,InpHeight-0.6)
Do i=2,6
If (minheight.le.dpheight(i)) Exit
End Do
i=min(6,i)
drminflow=dprisfal(i-1)+((dprisfal(i)-dprisfal(i-1))*(minheight-dpheight(i-1))/(dpheight(i)-dpheight(i-1)))
DO i = 2 , 6
IF ( docflow.LE.dprisfal(i) ) GO TO 20
ENDDO
i = 6
20 pflmax = docflow + dprise(i-1) + (docflow-dprisfal(i-1)) &
*(dprise(i)-dprise(i-1))/(dprisfal(i)-dprisfal(i-1))
If ((docflow.lt.12000).or.(Im.ge.6).or.int(Valcon(995).eq.0) Then
pflmin = docflow - dpfall(i-1) - (docflow-dprisfal(i-1)) &
*(dpfall(i)-dpfall(i-1))/(dprisfal(i)-dprisfal(i-1))
Else
pflmin = docflow - dpfall9(i-1) - (docflow-dprisfal(i-1)) &
*(dpfall9(i)-dpfall9(i-1))/(dprisfal(i)-dprisfal(i-1))
End If
ENDIF
pflmin=max(pflmin,drminflow)
pflmax = MAX(0.,pflmax-Valcon(65)+valcon(284))
pflmin = MAX(0.,pflmin-Valcon(65)+valcon(284))
!
!calculate the acceptable rates of fall at heywoods
!for pre-release

Barmah Choke Study – Individual Option Phase
SINCLAIR KNIGHT MERZ PAGE 163
Change Code
!20 cm per day
!
IF ( heyflow.GE.heyfallf(7) ) THEN
pflminhey = heyfallf(7) - heyfall(7)
nheyfall=0
ELSEIF ( heyflow.LE.0. ) THEN
pflminhey = 0.
nheyfall=0
ELSE
nheyfall=min(4,nheyfall+1)
HeyAvgeFlow(4)=HeyAvgeFlow(3)
HeyAvgeFlow(3)=HeyAvgeFlow(2)
HeyAvgeFlow(1)=HeyAvgeFlow(1)
HeyAvgeFlow(1)=heyflow
InpFlow=HeyAvgeFlow(nheyfall)
Do i=2,7
If (InpFlow.le.heyfallf(i)) Exit
End Do
i=min(7,i)
InpHeight=heyheight(i-1)+((heyheight(i)-heyheight(i-1))*(InpFlow-heyfallf(i-1))/(heyfallf(i)-heyfallf(i-1)))
minheight=max(0.,InpHeight-0.8)
Do i=2,7
If (minheight.le.heyheight(i)) Exit
End Do
i=min(7,i)
heyminflow=heyfallf(i-1)+((heyfallf(i)-heyfallf(i-1))*(minheight-heyheight(i-1))/(heyheight(i)-heyheight(i-1)))
DO i = 2 , 7
IF ( heyflow.LE.heyfallf(i) ) GO TO 40
ENDDO
i = 7
40 If ((docflow.lt.12000).or.(Im.gt.6).or.int(Valcon(995).eq.0) Then
pflminhey = heyflow - heyfall(i-1) - (heyflow-heyfallf(i-1)) &
*(heyfall(i)-heyfall(i-1)) &
/(heyfallf(i)-heyfallf(i-1))
Else
pflminhey = heyflow - heyfall9(i-1) - (heyflow-heyfallf(i-1)) &
*(heyfall9(i)-heyfall9(i-1)) &
/(heyfallf(i)-heyfallf(i-1))
End If
ENDIF
pflminhey=max(pflminhey,heyminflow)
!
!calculate the evaporation loss from the lake today
Table B- 3: Changes made to the Spectst.f90 Bigmod FORTRAN code to model Option 6 – increased flexibility in the 6 inch rule.
Change Code
Original !SPECIAL CODE 9

Barmah Choke Study – Individual Option Phase
SINCLAIR KNIGHT MERZ PAGE 164
Change Code
!OUTFLOW FROM HUME DAM
!Control variables 199 to 205 added for TERCalc by JHM, March 2001
!Control variable 58 is the daily rainfall at Hume Dam (-ve)
!Control variable 59 is the daily evaporation at Hume Dam (* pan factor)
!Control variable 61 is the pre-release target at start of month
!Control variable 62 is the inflow to Hume Dam
!Control variable 64 is previous day's storage in Hume Dam
!Control variable 65 is the flow at Kiewa
!Control variable 66 is Yesterdays flow at Doctors Point
!Control variable 68 is the pre-release target at end of month
!Control variable 69 is the pre-release target at start of next month
!Control variable 70 flow at Jingellic
!Control variable 71 flow at Tallandoon
!Control variable 73 is min. Hume channel capacity
!Control variable 74 is max. Albury channel capacity - for irrigation releases
!Control variable 88 is Hume Dam max. safe storage
!Control variable 89 is Hume Dam storage that triggers flood mitigation
!Control variable 90 is estimated number of days to fill dam
!Control variable 91 is added percentage to Hume inflow
!Control variable 92 is yesterday's Hume Dam releases
!Control variable 94 is MSM end of month Hume Storage
!Control variable 113 is Switch for Dartmouth,Hume correction? 0=yes
!Control variable 115 is MSM Spill from Hume
!Control variable 117 is fraction of Hume Dam natural inflow passed
!Control variable 127 is yesterday's Hume natural inflows
!Control variable 128 is Albury pre-release channel capacity
!Control variable 170 is Albury Translucent release channel capacity
!Control variable 171 is Hume Translucent Special Rule
!Control variable 199 is the target flow to be reached by the TER
!Control variable 200 is the target duration of the TER (in days)
!Control variable 201 is the longest acceptable duration between floods (in days)
!Control variable 202 is the first month in which the TER is to be targeted
!Control variable 203 is the last month in which the TER is to be targeted
!UNUSED Control variable 281 is B-M option (if =1 then boost pre-releases when
!env. allocation is being used to flood B-M, if 0= then don't boost
!pre-releases)
!UNUSED Control variable 282 is the monthly use of the B-M allocation
!Control variable 249 is Hume Release for Hume Boost flows
!Control variable 250 is the Albury Flow from MSM
!Control variable 284 is the Hume to Albury Diversion and Loss
DATA (spconchk(9,i),i=1,35)/58,59,61,62,64,65,66,68,69,70,71, &
73,74,88,89,90,91,92,94,113,115,117,127,128,170,171, &
-199,-200,-201,-202,-203,249,250,284,0/
Revised !SPECIAL CODE 9
!OUTFLOW FROM HUME DAM
!Control variables 199 to 205 added for TERCalc by JHM, March 2001
!Control variable 58 is the daily rainfall at Hume Dam (-ve)
!Control variable 59 is the daily evaporation at Hume Dam (* pan factor)
!Control variable 61 is the pre-release target at start of month
!Control variable 62 is the inflow to Hume Dam

Barmah Choke Study – Individual Option Phase
SINCLAIR KNIGHT MERZ PAGE 165
Change Code
!Control variable 64 is previous day's storage in Hume Dam
!Control variable 65 is the flow at Kiewa
!Control variable 66 is Yesterdays flow at Doctors Point
!Control variable 68 is the pre-release target at end of month
!Control variable 69 is the pre-release target at start of next month
!Control variable 70 flow at Jingellic
!Control variable 71 flow at Tallandoon
!Control variable 73 is min. Hume channel capacity
!Control variable 74 is max. Albury channel capacity - for irrigation releases
!Control variable 88 is Hume Dam max. safe storage
!Control variable 89 is Hume Dam storage that triggers flood mitigation
!Control variable 90 is estimated number of days to fill dam
!Control variable 91 is added percentage to Hume inflow
!Control variable 92 is yesterday's Hume Dam releases
!Control variable 94 is MSM end of month Hume Storage
!Control variable 113 is Switch for Dartmouth,Hume correction? 0=yes
!Control variable 115 is MSM Spill from Hume
!Control variable 117 is fraction of Hume Dam natural inflow passed
!Control variable 127 is yesterday's Hume natural inflows
!Control variable 128 is Albury pre-release channel capacity
!Control variable 170 is Albury Translucent release channel capacity
!Control variable 171 is Hume Translucent Special Rule
!Control variable 199 is the target flow to be reached by the TER
!Control variable 200 is the target duration of the TER (in days)
!Control variable 201 is the longest acceptable duration between floods (in days)
!Control variable 202 is the first month in which the TER is to be targeted
!Control variable 203 is the last month in which the TER is to be targeted
!UNUSED Control variable 281 is B-M option (if =1 then boost pre-releases when
!env. allocation is being used to flood B-M, if 0= then don't boost
!pre-releases)
!UNUSED Control variable 282 is the monthly use of the B-M allocation
!Control variable 249 is Hume Release for Hume Boost flows
!Control variable 250 is the Albury Flow from MSM
!Control variable 284 is the Hume to Albury Diversion and Loss
!Control variable 995 is whether the 9 inch rule is engaged or not 1=yes, 0=no
DATA (spconchk(9,i),i=1,36)/58,59,61,62,64,65,66,68,69,70,71, &
73,74,88,89,90,91,92,94,113,115,117,127,128,170,171, &
-199,-200,-201,-202,-203,249,250,284,995,0/
Table B- 4: Changes made to the V542-MSMConstants.csv MSM model to account for changes in losses for Option 6 – increased flexibility in the 6 inch rule.
Change Parameters
Original Constant term in the equation to estimate operational losses (May to April),valmon,"12,0,0,0",,,,,,,,,,,,,,,,,,,,,,,,,,,,,,,,,,,,,,,,,,,,,,,,,,,,,,,,,,,,,
,,,64,17.9,54.5,37.9,59.7,174.6,174.6,174.6,194.6,232.8,276.4,128.9,,,,,,,,,,,,,,,,,,,,,,,,,,,,,,,,,,,,,,,,,,,,,,,,,
Revised Constant term in the equation to estimate operational losses (May to April),valmon,"12,0,0,0",,,,,,,,,,,,,,,,,,,,,,,,,,,,,,,,,,,,,,,,,,,,,,,,,,,,,,,,,,,,,
,,,62.3,17.9,54.5,37.9,59.7,174.6,174.6,174.6,191.8,229.9,273.8,126.3,,,,,,,,,,,,,,,,,,,,,,,,,,,,,,,,,,,,,,,,,,,,,,,,,
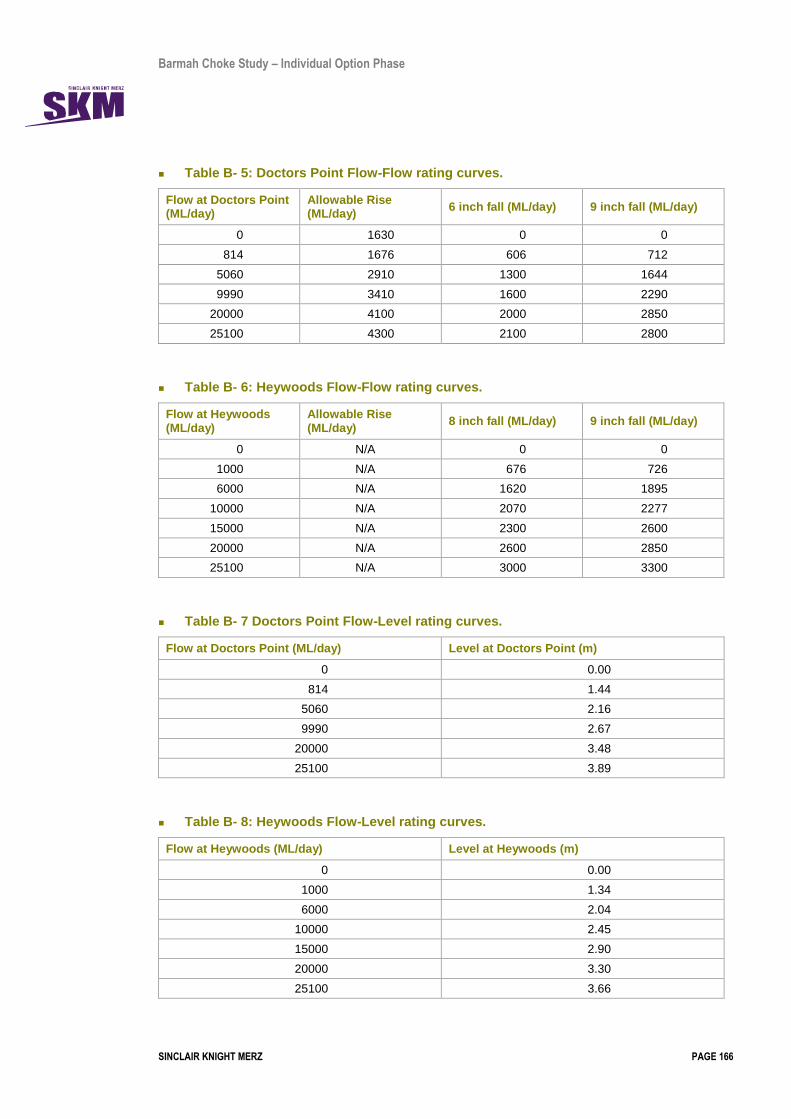
Barmah Choke Study – Individual Option Phase
SINCLAIR KNIGHT MERZ PAGE 166
Table B- 5: Doctors Point Flow-Flow rating curves.
Flow at Doctors Point (ML/day)
Allowable Rise (ML/day)
6 inch fall (ML/day) 9 inch fall (ML/day)
0 1630 0 0
814 1676 606 712
5060 2910 1300 1644
9990 3410 1600 2290
20000 4100 2000 2850
25100 4300 2100 2800
Table B- 6: Heywoods Flow-Flow rating curves.
Flow at Heywoods (ML/day)
Allowable Rise (ML/day)
8 inch fall (ML/day) 9 inch fall (ML/day)
0 N/A 0 0
1000 N/A 676 726
6000 N/A 1620 1895
10000 N/A 2070 2277
15000 N/A 2300 2600
20000 N/A 2600 2850
25100 N/A 3000 3300
Table B- 7 Doctors Point Flow-Level rating curves.
Flow at Doctors Point (ML/day) Level at Doctors Point (m)
0 0.00
814 1.44
5060 2.16
9990 2.67
20000 3.48
25100 3.89
Table B- 8: Heywoods Flow-Level rating curves.
Flow at Heywoods (ML/day) Level at Heywoods (m)
0 0.00
1000 1.34
6000 2.04
10000 2.45
15000 2.90
20000 3.30
25100 3.66
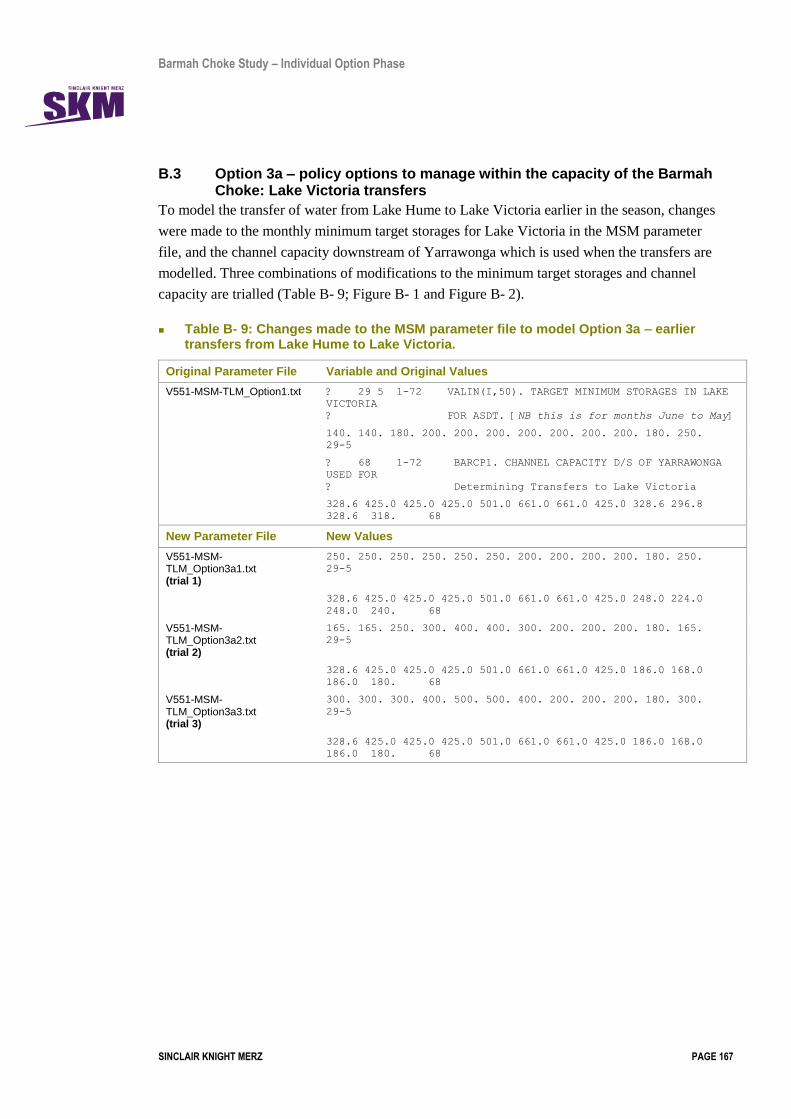
Barmah Choke Study – Individual Option Phase
SINCLAIR KNIGHT MERZ PAGE 167
B.3 Option 3a – policy options to manage within the capacity of the Barmah Choke: Lake Victoria transfers
To model the transfer of water from Lake Hume to Lake Victoria earlier in the season, changes
were made to the monthly minimum target storages for Lake Victoria in the MSM parameter
file, and the channel capacity downstream of Yarrawonga which is used when the transfers are
modelled. Three combinations of modifications to the minimum target storages and channel
capacity are trialled (Table B- 9; Figure B- 1 and Figure B- 2).
Table B- 9: Changes made to the MSM parameter file to model Option 3a – earlier transfers from Lake Hume to Lake Victoria.
Original Parameter File Variable and Original Values
V551-MSM-TLM_Option1.txt ? 29 5 1-72 VALIN(I,50). TARGET MINIMUM STORAGES IN LAKE
VICTORIA
? FOR ASDT. [NB this is for months June to May]
140. 140. 180. 200. 200. 200. 200. 200. 200. 200. 180. 250.
29-5
? 68 1-72 BARCP1. CHANNEL CAPACITY D/S OF YARRAWONGA
USED FOR
? Determining Transfers to Lake Victoria
328.6 425.0 425.0 425.0 501.0 661.0 661.0 425.0 328.6 296.8
328.6 318. 68
New Parameter File New Values
V551-MSM-TLM_Option3a1.txt (trial 1)
250. 250. 250. 250. 250. 250. 200. 200. 200. 200. 180. 250.
29-5
328.6 425.0 425.0 425.0 501.0 661.0 661.0 425.0 248.0 224.0
248.0 240. 68
V551-MSM-TLM_Option3a2.txt (trial 2)
165. 165. 250. 300. 400. 400. 300. 200. 200. 200. 180. 165.
29-5
328.6 425.0 425.0 425.0 501.0 661.0 661.0 425.0 186.0 168.0
186.0 180. 68
V551-MSM-TLM_Option3a3.txt (trial 3)
300. 300. 300. 400. 500. 500. 400. 200. 200. 200. 180. 300.
29-5
328.6 425.0 425.0 425.0 501.0 661.0 661.0 425.0 186.0 168.0
186.0 180. 68

Barmah Choke Study – Individual Option Phase
SINCLAIR KNIGHT MERZ PAGE 168
Figure B- 1: Modelled minimum storage targets for Lake Victoria for the base case
and Option 3a.
Figure B- 2: Modelled channel capacities downstream of Yarrawonga for
determining transfers from Hume to Lake Victoria under the base case and Option 3a.
0
100
200
300
400
500
600
May Jun Jul Aug Sep Oct Nov Dec Jan Feb Mar Apr
Targ
et M
inim
um
Sto
rage
in L
ake
Vic
tori
a (G
L)Option 1 (Base Case)
Option 3a (trial 1)
Option 3a (trial 2)
Option 3a (trial 3)
0
100
200
300
400
500
600
700
May Jun Jul Aug Sep Oct Nov Dec Jan Feb Mar Apr
Ch
ann
el C
apac
ity
D/S
of
Yarr
awo
nga
fo
r D
ete
rmin
ing
Tran
sfe
rs to
Lak
e V
icto
ria
(GL)
Option 1 (base case)
Option 3a (trial 1)
Option 3a (trial 2&3)
Barmah Choke Study – Individual Option Phase
SINCLAIR KNIGHT MERZ PAGE 169
The changes to both the minimum storage target for Lake Victoria and the channel capacity for
transfers should result in:
Transfers being made earlier in the season;
Larger early season transfers; and
Fewer and smaller transfers during the unseasonal flooding period (January to April).
A preliminary test run was undertaken assuming the changes described in Table B- 9. The
preliminary test results indicated that:
In generally wet periods where there are no transfers from Hume to Lake Victoria under
the base case, the modelled changes made no difference to the transfers from Hume or the
Lake Victoria storage (e.g. Figure B- 3).
The modelled changes increase early season transfers, with the increase in transfers
generally being in the order of trial 1 (smallest increase) to trial 3 (largest increase). The
increased transfers from Hume are reflected in the Lake Victoria storage trace until the
storage reaches FSL (677 GL) (e.g. Figure B- 4 and Figure B- 5).
The modelled changes reduce the transfers from Hume to Lake Victoria in the undesirable
flooding period (Figure B- 6), with trial 2 resulting in the fewest transfers between
January and April.
The modelled changes increase the transfers from Hume to Lake Victoria between May
and December, with the largest increase being observed under trial 3 (Figure B- 7).
There is little difference in the storage exceedance curves for the base case and trial 1 of
Option 3a. Under trial 2 and 3, the volume of water stored in Lake Victoria increases
compared with the base case (Figure B- 8).
To increase transfers from Hume to Lake Victoria in the months from May to December
often requires releasing more water during wet periods, which in turn increases the
volumes of water that is predicted to flow overbank (e.g. through the Millewa forest,
Figure B- 9).

Barmah Choke Study – Individual Option Phase
SINCLAIR KNIGHT MERZ PAGE 170
Figure B- 3: June 1956 to May 1958 Lake Victoria storage (LVStor) under base case
(_BC) conditions, and trial 1 (_1), trial 2 (_2) and trial 3 (_3) of Option 3a, compared with transfers from Lake Hume to Lake Victoria (HVLTRN) for the same scenario.
Figure B- 4: June 1994 to May 1996 Lake Victoria storage (LVStor) under base case
(_BC) conditions, and trial 1 (_1), trial 2 (_2) and trial 3 (_3) of Option 3a, compared with transfers from Lake Hume to Lake Victoria (HVLTRN) for the same scenario.
Hum
e to
Lak
e Vi
ctor
ia t
rans
fer
(GL)
0
50
100
150
200
250
300
350
Jul -56 Sep-56 N ov-56 Jan-57 Mar-57 May-57 Jul -57 Sep-57 N ov-57 Jan-58 Mar-58 May-58
HL VT RN _B C
HL VT RN _1
HL VT RN _2
HL VT RN _3
Lake
Vict
oria
storag
e (G
L)
0
100
200
300
400
500
600
700L VStor_B C
L VStor_1
L VStor_2
L VStor_3
Hum
e to
Lak
e Vi
ctor
ia t
rans
fer
(GL)
0
50
100
150
200
250
300
350
Jul -94 Sep-94 N ov-94 Jan-95 Mar-95 May-95 Jul -95 Sep-95 N ov-95 Jan-96 Mar-96 May-96
HL VT RN _B C
HL VT RN _1
HL VT RN _2
HL VT RN _3
Lake
Vict
oria
storag
e (G
L)
0
100
200
300
400
500
600
700L VStor_B C
L VStor_1
L VStor_2
L VStor_3

Barmah Choke Study – Individual Option Phase
SINCLAIR KNIGHT MERZ PAGE 171
Figure B- 5: June 1940 to May 1942 Lake Victoria storage (LVStor) under base case
(_BC) conditions, and trial 1 (_1), trial 2 (_2) and trial 3 (_3) of Option 3a, compared with transfers from Lake Hume to Lake Victoria (HVLTRN) for the same scenario.
Figure B- 6: Frequency exceedance curves for transfers from Lake Hume to Lake
Victoria (HLVTRN) under base case (_BC) conditions, and trial 1 (_1), trial 2 (_2) and trial 3 (_3) of Option 3a, for the months of January to April.
Hum
e to
Lak
e Vi
ctor
ia t
rans
fer
(GL)
0
50
100
150
200
250
300
350
Jul -40 Sep-40 N ov-40 Jan-41 Mar-41 May-41 Jul -41 Sep-41 N ov-41 Jan-42 Mar-42 May-42
HL VT RN _B C
HL VT RN _1
HL VT RN _2
HL VT RN _3
Lake
Vict
oria
storag
e (G
L)
0
100
200
300
400
500
600
700L VStor_B C
L VStor_1
L VStor_2
L VStor_3
T ime Exceeded (%)
0 2 4 6 8 10 12 14 16 18 20
Hum
e to
Lak
e Vi
ctor
ia tra
nsfe
r (G
L/m
onth
)
10-1
100
101
102
HL VTRN _B C
HL VTRN _1
HL VTRN _2
HL VTRN _3

Barmah Choke Study – Individual Option Phase
SINCLAIR KNIGHT MERZ PAGE 172
Figure B- 7: Frequency exceedance curves for transfers from Lake Hume to Lake
Victoria (HLVTRN) under base case (_BC) conditions, and trial 1 (_1), trial 2 (_2) and trial 3 (_3) of Option 3a, for the months of May to December.
Figure B- 8: Frequency exceedance curves for Lake Victoria storage (LVStor) under
base case (_BC) conditions, and trial 1 (_1), trial 2 (_2) and trial 3 (_3) of Option 3a, for all months.
T ime Exceeded (%)
0 2 4 6 8 10 12 14 16 18 20
Hum
e to
Lak
e Vi
ctor
ia t
rans
fer
(GL/
mon
th)
10-1
100
101
102
HL VTRN _B C
HL VTRN _1
HL VTRN _2
HL VTRN _3
T ime Exceeded (%)
20 30 40 50 60 70 80 90 100
Lak
e V
icto
ria
sto
rag
e (G
L)
2* 102
3* 102
4* 102
5* 102
6* 102
7* 102
L VStor_B C
L VStor_1
L VStor_2
L VStor_3

Barmah Choke Study – Individual Option Phase
SINCLAIR KNIGHT MERZ PAGE 173
Figure B- 9: Outflows from Hume (Hume Out) versus overbank flows through the
Millewa Forest (OverBk Mill) under base case (_BC) conditions, and trial 2 (_2) of Option 3a.
B.4 Option 3b – policy options to manage within the capacity of the Barmah Choke: inter-valley trade
Rules relating to the use of inter-valley trade water are included in MSM, as shown below:
MSM Code 92
Volume of Goulburn high reliability entitlement- 109.418 GL
Volume of Goulburn low reliability entitlement- 0 GL
Volume of Murrumbidgee high security entitlement- 0 GL
Volume of Murrumbidgee general security entitlement- 0 GL
MSM Code 92-1, and 92-2 (both same)
Goulburn maximum fraction of remaining EVA balance that can be used this month Jan – Dec) and
Murrumbidgee maximum fraction of remaining EVW balance that can be used this month (Jan – Dec)
0.357 0.556 1.000 0.000 0.000 0.000 0.000 0.000 0.000 0.000 0.050 0.263
MSM Code 92-3 and 92-6 (both same)
Goulburn minimum upstream order before EVA called out (Jan – Dec) and Murrumbidgee minimum
upstream order before EVA called out (Jan –Dec)
-9999. -9999. -9999. -9999. -9999. -9999. -9999. -9999. -9999. -9999. -9999. -9999.
Over
bank
thro
ugh
Mill
ewa
Fore
st (M
L)
0
2000
4000
6000
8000
10000
12000
14000
16000
18000
20000
Mar89 May89 Jul89 Sep89 N ov89 Jan90 Mar90
OverB k M i l l_B C
OverB k M i l l_2
Outfl
ow f
rom
Hum
e (M
L)
0
5000
10000
15000
20000
25000
30000
35000
40000
Hume Out_B C
Hume Out_2

Barmah Choke Study – Individual Option Phase
SINCLAIR KNIGHT MERZ PAGE 174
To examine the potential impact on shortfalls, the pattern for the „maximum fraction of the
remaining EVA balance that can be used this month‟ (MSM Code 92-1 and 92-2) was
modified.
Note that as only the Goulburn system contains inter-valley trade water in the base case
(Option 1), alternative inter-valley trade release rules were trialled on the Goulburn only.
The proposed „maximum fraction of the remaining EVA balance that can be used this month‟
is outlined below (MSM Code 92-1 and 92-2). The values represent accumulated percentage
available from January to December. The percentages were determined based on the
percentage of shortfalls occurring in each month.
0.651 0.957 1.000 0.000 0.000 0.000 0.000 0.000 0.000 0.000 0.000 0.199
B.5 Option 4 – increased operational flexibility in existing assets: Mildura Weir
The proposed modelling methodology for Option 4 is the same as adopted for modelling of
Euston Weir (Option 6). This involved using the MSM-Bigmod output from the „do-nothing‟
option in combination with the shortfall indicator which includes the ability to draw on
Mildura Weir active volume and order replenishment flow to refill the weir pool when channel
capacity is available.
The calculation of required flow at downstream Yarrawonga Weir is a function of the demands
plus losses less expected inflows downstream of Yarrawonga Weir (with allowances for travel
times considered). Table B- 10 outlines the methodology and components used to calculate
required flow at downstream Yarrawonga Weir.
Table B- 10: Calculation of required flow at downstream Yarrawonga Weir.
Component
Contribution to flow at Yarrawonga (+
ve or –
ve)
Lag (days in advance)
Model component used
Edward offtake + 3 Modelled Edward offtake flows from Bigmod
Gulpa offtake + 3 Modelled Gulpa offtake flows from Bigmod
Broken Creek inflows - 4 Modelled inflows from Bigmod
Goulburn River inflows - 4 Modelled inflows from Bigmod
National Channel orders + 6 National Channel Diversions from Bigmod
Loss Yarrawonga – Torrumbarry
+ 6 Loss (evap loss + short evap) for Yarrawonga to Torrumbarry, plus monthly Yarrawonga to Torrumbarry PD demands (restricted for channel capacity) plus Victorian shortfalls due to channel capacity all from MSM. Disaggregated based on a calibrated daily pattern from PRIDE.
Pental Island orders + 9 Pental Island pumps diversions from Bigmod.
Leiwah inflows - 9 Modelled inflows from Bigmod
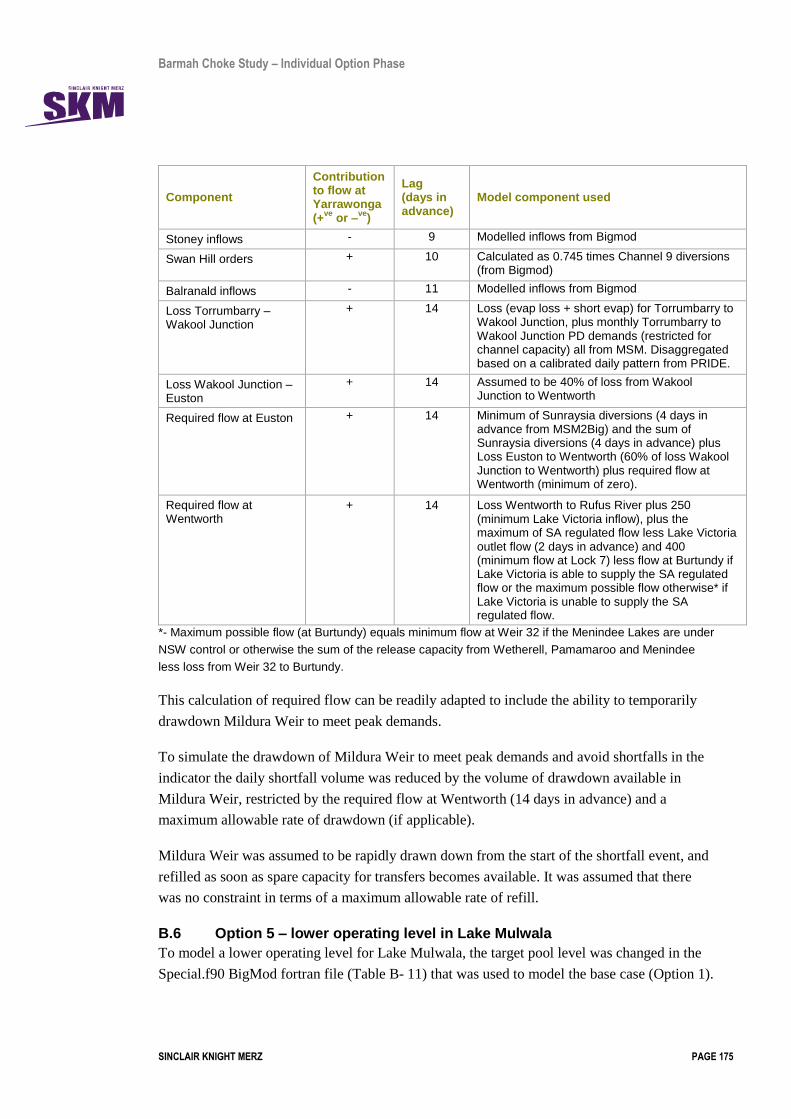
Barmah Choke Study – Individual Option Phase
SINCLAIR KNIGHT MERZ PAGE 175
Component
Contribution to flow at Yarrawonga (+
ve or –
ve)
Lag (days in advance)
Model component used
Stoney inflows - 9 Modelled inflows from Bigmod
Swan Hill orders + 10 Calculated as 0.745 times Channel 9 diversions (from Bigmod)
Balranald inflows - 11 Modelled inflows from Bigmod
Loss Torrumbarry – Wakool Junction
+ 14 Loss (evap loss + short evap) for Torrumbarry to Wakool Junction, plus monthly Torrumbarry to Wakool Junction PD demands (restricted for channel capacity) all from MSM. Disaggregated based on a calibrated daily pattern from PRIDE.
Loss Wakool Junction – Euston
+ 14 Assumed to be 40% of loss from Wakool Junction to Wentworth
Required flow at Euston + 14 Minimum of Sunraysia diversions (4 days in advance from MSM2Big) and the sum of Sunraysia diversions (4 days in advance) plus Loss Euston to Wentworth (60% of loss Wakool Junction to Wentworth) plus required flow at Wentworth (minimum of zero).
Required flow at Wentworth
+ 14 Loss Wentworth to Rufus River plus 250 (minimum Lake Victoria inflow), plus the maximum of SA regulated flow less Lake Victoria outlet flow (2 days in advance) and 400 (minimum flow at Lock 7) less flow at Burtundy if Lake Victoria is able to supply the SA regulated flow or the maximum possible flow otherwise* if Lake Victoria is unable to supply the SA regulated flow.
*- Maximum possible flow (at Burtundy) equals minimum flow at Weir 32 if the Menindee Lakes are under
NSW control or otherwise the sum of the release capacity from Wetherell, Pamamaroo and Menindee
less loss from Weir 32 to Burtundy.
This calculation of required flow can be readily adapted to include the ability to temporarily
drawdown Mildura Weir to meet peak demands.
To simulate the drawdown of Mildura Weir to meet peak demands and avoid shortfalls in the
indicator the daily shortfall volume was reduced by the volume of drawdown available in
Mildura Weir, restricted by the required flow at Wentworth (14 days in advance) and a
maximum allowable rate of drawdown (if applicable).
Mildura Weir was assumed to be rapidly drawn down from the start of the shortfall event, and
refilled as soon as spare capacity for transfers becomes available. It was assumed that there
was no constraint in terms of a maximum allowable rate of refill.
B.6 Option 5 – lower operating level in Lake Mulwala
To model a lower operating level for Lake Mulwala, the target pool level was changed in the
Special.f90 BigMod fortran file (Table B- 11) that was used to model the base case (Option 1).

Barmah Choke Study – Individual Option Phase
SINCLAIR KNIGHT MERZ PAGE 176
Table B- 11: Changes made to the Special.f90 BigMod fortran file to model Option 5a and 5b – lowering the operating level in Lake Mulwala.
Revision Type Code
Original ELSEIF ( Icnp.EQ.42 ) THEN
!SPECIAL CODE 42
!Doctors Point Order AFC Method
!
!Control variable 20 - Order Downstream of Yarrawonga
!Control variable 223 - Diversions from Albury to Yarrawonga
!Control variable 224 - Losses from Albury to Yarrawonga
!Control variable 232 - Mulwala Canal Diversions
!Control variable 245 - Yarrawonga Main Channel Diversions
!Control variable 246 - Wangaratta Flow(0.88 for 1 days 500 ML/d)
!Control variable 247 - Albury Minimum Flow
!Control variable 74 - Albury Channel Capacity for Regulated Releases
!Control variable 177 - Yarrawonga Pool Level yesterday
!Control variable 66 - Yesterdays Doctors Point Flow
!Control variable 265 - Target Level in Yarrawonga Pool If Yarrawonga main Channel < 2000 ML/d => 124.65
!Control variable 266 - Target Level in Yarrawonga Pool If Yarrawonga main Channel > 2800 ML/d => 124.65
!Control variable 781 - Twice the net increase in Yarrawonga Channel and Mulwala Canal yesterday
!
!Calculate Target Level in Yarrawonga Pool
!If Yarrawonga main Channel < 2000 ML/d => 124.65
!If Yarrawonga main Channel > 2800 ML/d => 124.80
!Vary linearly in between 2000 and 2800 Ml/d
!
!yarrawongaTarget=max(124.65,min(124.80,124.65+
!& 0.15*(valcon(245)-2000.)/800.))
yarrawongaTarget=max(valcon(265),min(valcon(266),valcon(265)+ &
0.15*(valcon(245)-2000.)/800.))
!Aim to get back to Target Level in 6 days
!Neither Yarrawonga Main Channel or Mulwala Canal included in reach diversions
!Correction for Yarrawonga Main Channel 16-6-2004
if(valcon(177).lt. 120.)then
valcon(177)=yarrawongaTarget
endif
Revised (5a) ELSEIF ( Icnp.EQ.42 ) THEN
!SPECIAL CODE 42
!Doctors Point Order AFC Method
!
!Control variable 20 - Order Downstream of Yarrawonga

Barmah Choke Study – Individual Option Phase
SINCLAIR KNIGHT MERZ PAGE 177
Revision Type Code
!Control variable 223 - Diversions from Albury to Yarrawonga
!Control variable 224 - Losses from Albury to Yarrawonga
!Control variable 232 - Mulwala Canal Diversions
!Control variable 245 - Yarrawonga Main Channel Diversions
!Control variable 246 - Wangaratta Flow(0.88 for 1 days 500 ML/d)
!Control variable 247 - Albury Minimum Flow
!Control variable 74 - Albury Channel Capacity for Regulated Releases
!Control variable 177 - Yarrawonga Pool Level yesterday
!Control variable 66 - Yesterdays Doctors Point Flow
!Control variable 265 - Target Level in Yarrawonga Pool If Yarrawonga main Channel < 2000 ML/d => 124.65
!Control variable 266 - Target Level in Yarrawonga Pool If Yarrawonga main Channel > 2800 ML/d => 124.65
!Control variable 781 - Twice the net increase in Yarrawonga Channel and Mulwala Canal yesterday
!
!Calculate Target Level in Yarrawonga Pool
!If Yarrawonga main Channel < 2000 ML/d => 124.65
!If Yarrawonga main Channel > 2800 ML/d => 124.80
!Vary linearly in between 2000 and 2800 Ml/d
!
!yarrawongaTarget=max(124.65,min(124.80,124.65+
!& 0.15*(valcon(245)-2000.)/800.))
If (Im.ge.1.and.Im.le.4) Then
valcon(265)=124.50
valcon(266)=124.50
Else
valcon(265)=124.60
valcon(266)=124.60
End If
yarrawongaTarget=max(valcon(265),min(valcon(266),valcon(265)+ &
0.15*(valcon(245)-2000.)/800.))
!Aim to get back to Target Level in 6 days
!Neither Yarrawonga Main Channel or Mulwala Canal included in reach diversions
!Correction for Yarrawonga Main Channel 16-6-2004
if(valcon(177).lt. 120.)then
valcon(177)=yarrawongaTarget
endif
Revised (5b) ELSEIF ( Icnp.EQ.42 ) THEN
!SPECIAL CODE 42
!Doctors Point Order AFC Method
!
!Control variable 20 - Order Downstream of Yarrawonga

Barmah Choke Study – Individual Option Phase
SINCLAIR KNIGHT MERZ PAGE 178
Revision Type Code
!Control variable 223 - Diversions from Albury to Yarrawonga
!Control variable 224 - Losses from Albury to Yarrawonga
!Control variable 232 - Mulwala Canal Diversions
!Control variable 245 - Yarrawonga Main Channel Diversions
!Control variable 246 - Wangaratta Flow(0.88 for 1 days 500 ML/d)
!Control variable 247 - Albury Minimum Flow
!Control variable 74 - Albury Channel Capacity for Regulated Releases
!Control variable 177 - Yarrawonga Pool Level yesterday
!Control variable 66 - Yesterdays Doctors Point Flow
!Control variable 265 - Target Level in Yarrawonga Pool If Yarrawonga main Channel < 2000 ML/d => 124.65
!Control variable 266 - Target Level in Yarrawonga Pool If Yarrawonga main Channel > 2800 ML/d => 124.65
!Control variable 781 - Twice the net increase in Yarrawonga Channel and Mulwala Canal yesterday
!
!Calculate Target Level in Yarrawonga Pool
!If Yarrawonga main Channel < 2000 ML/d => 124.65
!If Yarrawonga main Channel > 2800 ML/d => 124.80
!Vary linearly in between 2000 and 2800 Ml/d
!
!yarrawongaTarget=max(124.65,min(124.80,124.65+
!& 0.15*(valcon(245)-2000.)/800.))
If (Im.ge.1.and.Im.le.4) Then
valcon(265)=124.10
valcon(266)=124.10
Else
valcon(265)=124.60
valcon(266)=124.60
End If
yarrawongaTarget=max(valcon(265),min(valcon(266),valcon(265)+ &
0.15*(valcon(245)-2000.)/800.))
!Aim to get back to Target Level in 6 days
!Neither Yarrawonga Main Channel or Mulwala Canal included in reach diversions
!Correction for Yarrawonga Main Channel 16-6-2004
if(valcon(177).lt. 120.)then
valcon(177)=yarrawongaTarget
endif
B.7 Option 6 – enlarged storage capacity in Euston Weir
As discussed as a part of the Investigation Phase (SKM, 2009), daily shortfalls are not
calculated by MSM-Bigmod.

Barmah Choke Study – Individual Option Phase
SINCLAIR KNIGHT MERZ PAGE 179
Shortfalls are calculated on a monthly time-step by MSM: if demand for a given month is in
excess of available channel capacity a shortfall is recorded. Calculating shortfalls on a monthly
time-step was determined to be unsuitable for the purposes of the Barmah Choke Study as
shortfalls occurring over short time periods are not identified. Daily shortfalls are not
calculated directly by Bigmod as the demands passed to Bigmod from MSM have already been
restricted based on monthly channel capacity.
For this reason it was necessary to develop an alternative method of calculating shortfalls on a
daily time-step. To understand the likelihood of shortfalls on a daily time-step, a method was
developed to determine required flow at downstream Hume Reservoir and downstream
Yarrawonga Weir based on model outputs. Required flow was then compared to operational
channel capacity to calculate shortfalls.
As such, it was proposed to model this option using the MSM-Bigmod output from the „do-
nothing‟ option in combination with the shortfall indicator which includes the ability to draw
on Euston Weir active volume and order replenishment flow to refill the weir pool when
channel capacity is available.
The calculation of required flow at downstream Yarrawonga Weir is a function of the demands
plus losses less expected inflows downstream of Yarrawonga Weir (with allowances for travel
times considered). Table B- 12 outlines the methodology and components used to calculate
required flow at downstream Yarrawonga Weir.
Table B- 12: Calculation of required flow at downstream Yarrawonga Weir.
Component
Contribution to flow at Yarrawonga (+
ve or –
ve)
Lag (days in advance)
Model component used
Edward offtake + 3 Modelled Edward offtake flows from Bigmod
Gulpa offtake + 3 Modelled Gulpa offtake flows from Bigmod
Broken Creek inflows - 4 Modelled inflows from Bigmod
Goulburn River inflows - 4 Modelled inflows from Bigmod
National Channel orders + 6 National Channel Diversions from Bigmod
Loss Yarrawonga – Torrumbarry
+ 6 Loss (evap loss + short evap) for Yarrawonga to Torrumbarry, plus monthly Yarrawonga to Torrumbarry PD demands (restricted for channel capacity) plus Victorian shortfalls due to channel capacity all from MSM. Disaggregated based on a calibrated daily pattern from PRIDE.
Pental Island orders + 9 Pental Island pumps diversions from Bigmod.
Edward River at Leiwah inflows
- 9 Modelled inflows from Bigmod
Wakool River Stoney inflows
- 9 Modelled inflows from Bigmod

Barmah Choke Study – Individual Option Phase
SINCLAIR KNIGHT MERZ PAGE 180
Component
Contribution to flow at Yarrawonga (+
ve or –
ve)
Lag (days in advance)
Model component used
Swan Hill orders + 10 Calculated as 0.745 times Channel 9 diversions (from Bigmod)
Murrumbidgee Balranald inflows
- 11 Modelled inflows from Bigmod
Loss Torrumbarry – Wakool Junction
+ 14 Loss (evap loss + short evap) for Torrumbarry to Wakool Junction, plus monthly Torrumbarry to Wakool Junction PD demands (restricted for channel capacity) all from MSM. Disaggregated based on a calibrated daily pattern from PRIDE.
Loss Wakool Junction – Euston
+ 14 Assumed to be 40% of loss from Wakool Junction to Wentworth
Required flow at Euston + 14 Minimum of Sunraysia diversions (4 days in advance from MSM2Big) and the sum of Sunraysia diversions (4 days in advance) plus Loss Euston to Wentworth (60% of loss Wakool Junction to Wentworth) plus required flow at Wentworth (minimum of zero).
Required flow at Wentworth
+ 14 Loss Wentworth to Rufus River plus 250 (minimum Lake Victoria inflow), plus the maximum of SA regulated flow less Lake Victoria outlet flow (2 days in advance) and 400 (minimum flow at Lock 7) less flow at Burtundy if Lake Victoria is able to supply the SA regulated flow or the maximum possible flow otherwise* if Lake Victoria is unable to supply the SA regulated flow.
*- Maximum possible flow (at Burtundy) equals minimum flow at Weir 32 if the Menindee Lakes are under
NSW control or otherwise the sum of the release capacity from Wetherell, Pamamaroo and Menindee
less loss from Weir 32 to Burtundy.
This calculation of required flow was adapted to include the ability to temporarily drawdown
Euston Weir to meet peak demands. To simulate the drawdown of Euston Weir to meet peak
demands and avoid shortfalls, the daily shortfall volume calculated by the shortfall indicator
was reduced by the volume of drawdown available in Euston Weir. Following a drawdown
event, Euston Weir is refilled as soon as spare capacity for transfers becomes available.
B.8 Option 7 – Storage at “The Drop” on Mulwala Canal
This option includes construction of a storage at The Drop on Mulwala Canal. The storage
would be operated empty as much as possible to provide air space for capturing rainfall
rejections. The storage would be filled up to capacity (limited by the capacity of the inlet
infrastructure) to avoid River Murray flows greater than 10,600 ML/day throughout the
unseasonal flooding period and then rapidly drawn down following the end of the event (by
supplying downstream irrigators, limited by the capacity of the outlet infrastructure).
This option considers four sub-options (alternative storage capacities and inlet and outlet
capacities) as outlined in Table B- 13.

Barmah Choke Study – Individual Option Phase
SINCLAIR KNIGHT MERZ PAGE 181
Table B- 13: The Drop storage and inlet and outlet criteria
Option Storage Capacity
(ML) Inlet Capacity
(ML/day) Outlet Capacity
(ML/day)
A 1000 1000 500
B 5000 1000 500
C 11000 9000 3000
D 16000 9000 3000
These options were examined through a spreadsheet approach looking at unseasonal flooding.
B.9 Option 10 – Victorian forest channels
In MSM-Bigmod, there are three branches that take water from the main stem of the River
Murray to the Barmah Forest: INFLOW TO FOREST, OVERBANK THROUGH BARMAH
and VICTORIAN REGS D/S PICNIC PNT. Table B- 14 shows the specification of these
branches in Bigmod.
Table B- 14: Branches in Bigmod that take water from the main stem of the River Murray through the Barmah Forest. The three rows of values are flow in the main stem (reach 18 (Tocumwal to Picnic Point) for INFLOW TO FOREST and OVERBANK THROUGH BARMAH and reach 128 (Picnic Point to Creeks) for VICTORIAN REGS D/S PICNIC PNT), flow in the branch when regulators are closed and flow in the branch when regulators are open.
V125-bigpar-prod_Option1.txt - Variable and Original Values
40 'INFLOW TO FOREST' 18 0.000 129 0 0 1 1 0 16 0
0. 3000. 11400. 12250. 15000. 25000. 35000. 48000. 50500. 63000. 67100. 90000. 115000. 125000. 140000. 200000.
0. 0. 0. 0. 20. 400. 500. 2900. 2900. 3400. 3400. 3400. 10330. 15900. 30900. 30900.
0. 0. 0. 0. 70. 400. 500. 2900. 2900. 3400. 3400. 3400. 10330. 15900. 30900. 30900.
2 'OVERBANK THROUGH BARMAH' 18 0.000 19 0 0 1 1 0 16 0
0. 3000. 11400. 12250. 15000. 25000. 35000. 48000. 50500. 63000. 67100. 90000. 115000. 125000. 140000. 200000.
0. 140. 490. 760. 2080. 8700. 16100. 18100. 18600. 19300. 20000. 20800. 21870. 22300. 22300. 22300.
0. 280. 1610. 1880. 2430. 9400. 16700. 18100. 18600. 19300. 20000. 20800. 21870. 22300. 22300. 22300.
9 'VICTORIAN REGS D/S PICNIC PNT' 128 1.000 20 0 0 2 1 0 10 0
0. 3600. 4250. 5000. 6000. 7000. 8000. 8500. 8950. 15000.
0. 0. 0. 0. 0. 0. 0. 0. 0. 1500.
0. 0. 106. 142. 207. 336. 503. 647. 873. 1500.
The branch INFLOW TO FOREST flows to a lake titled „Barmah Forest‟, which does not
reconnect to the main stem of the River Murray in most conditions (some water stored in
Barmah Forest „branches‟ over to the Gulpa junction in very large floods). Flow in the
branches OVERBANK THROUGH BARMAH and VICTORIAN REGS D/S PICNIC PNT
discharges to a lake titled „Barmah Lake‟, which reconnects to the River Murray immediately

Barmah Choke Study – Individual Option Phase
SINCLAIR KNIGHT MERZ PAGE 182
downstream of the Barmah Choke. To model a bypass route around the Barmah Choke
through the Victorian forest channels, changes would be made to the Bigmod parameter file,
so that the OVERBANK THROUGH BARMAH branch took additional flow while the
regulators are closed as shown in Table B- 15.
Table B- 15: Modelling a bypass route around the Barmah Choke through the Victorian forest channels.
V125-bigpar-prod_Option1.txt - Variable and Original Values
2 'OVERBANK THROUGH BARMAH' 18 0.000 19 0 0 1 1 0 16 0
0. 3000. 11400. 12250. 15000. 25000. 35000. 48000. 50500. 63000. 67100. 90000. 115000. 125000. 140000. 200000.
0. 140. 490. 760. 2080. 8700. 16100. 18100. 18600. 19300. 20000. 20800. 21870. 22300. 22300. 22300.
0. 280. 1610. 1880. 2430. 9400. 16700. 18100. 18600. 19300. 20000. 20800. 21870. 22300. 22300. 22300.
V551-MSM-TLM_Option10.txt - New Values
0. 3000. 10600. 11000. 11400. 12250. 15000. 25000. 35000. 48000. 50500. 63000. 67100. 90000. 125000. 200000.
0. 140. 457. 857. 1290. 2410. 2500. 8700. 16100. 18100. 18600. 19300. 20000. 20800. 22300. 22300.
0. 280. 1483. 1484. 1610. 1880. 2430. 9400. 16700. 18100. 18600. 19300. 20000. 20800. 22300. 22300.
The changes would be such that, for the regulator closed option:
When flows at Tocumwal are below 10,600 ML/d, the flow branching to Barmah Lake
would be as previously modelled,
When flows at Tocumwal are above 10,600 ML/d, the flow branching to Barmah Lake
would be the sum of that previously modelled, plus the difference between flow at
Tocumwal and 10,600 ML/d, and
A judgement would be made about where the „Option10 – regulator closed‟ and „base case
– regulator closed‟ curves would rejoin (Figure B- 10).

Barmah Choke Study – Individual Option Phase
SINCLAIR KNIGHT MERZ PAGE 183
Figure B- 10: Regulator open and closed comparison
This change to the Bigmod parameter file increased the volume of water flowing to Barmah
Lake when the regulators which are used to control flooding of the forest are closed (Figure B-
11). At times, these increases would coincide with rainfall-rejection events. At other times,
modelled flows to Barmah Lake would be greater than in the base case for long periods,
despite the small likeliness of this happening in practice. However, this second situation is not
expected to affect modelled flows outside the reach between Picnic Point and the Barmah
Choke, and will not be reflected in the indicators used to measure the effectiveness of options
for managing shortfalls used in the Barmah Choke Study.
0
5000
10000
15000
20000
25000
0 10000 20000 30000 40000 50000
Flo
w t
hro
ugh
Bar
mah
Fo
rest
(re
ach
19
) (M
L/d
)
Flow at Tocumwal (ML/d)
Regulator closed (base case)
Regulator open (base case)
Regulator closed (option 10)

Barmah Choke Study – Individual Option Phase
SINCLAIR KNIGHT MERZ PAGE 184
Figure B- 11: Modelled flows at Tocumwal, to Barmah Lake and at Picnic Point
under the base case (_BC) and option 10 (_10). In 2001/02 the increased flows through the Victorian forest channels coincides with apparent rainfall-rejection events in January and March. However, in 2002/03, there is a long period where flow through the channels is greater than in the base case. Refer to the previous page for a discussion.
Flo
w (
ML
/d)
0
2000
4000
6000
8000
10000
12000
14000
D ec00 Jan01 Feb01 Mar01 A pr01 May01
T ocumw al_B C
T o B armah L k_B C
T ocumw al_10
T o B armah L k_10
Picnic_B C
Picnic_10
Flo
w (
ML
/d)
0
2000
4000
6000
8000
10000
12000
14000
16000
Oct02 N ov02 D ec02 Jan03 Feb03
T ocumw al_B C
T o B armah L k_B C
T ocumw al_10
T o B armah L k_10
Picnic_B C
Picnic_10

Barmah Choke Study – Individual Option Phase
SINCLAIR KNIGHT MERZ PAGE 185
B.10 Option 11 – increased escape capacity to the Wakool River
To model increased diversions to the Wakool River, changes were made to the MSM
parameter file (Table B- 17) and the code in modflw20.f90 (Table B- 18).
The EDCAP variable in the MSM parameter file was changed because it includes the escape
capacity to the Wakool River, along with the escape capacities to the Edward River and
Yallakool River (Table B- 16).
Table B- 16: Calculating the change required to the EDCAP variable in the MSM parameter file to model Option 11
Base Case
Month May Jun Jul Aug Sep Oct Nov Dec Jan Feb Mar Apr
Days 31 30 31 31 30 31 30 31 31 28 31 30
Edward Escape (ML/d)
2100 2400 2400 2400 2400 2400 2400 2400 2100 2100 2100 2100
Wakool Escape (ML/d)
550 550 550 550 550 550 550 550 550 550 550 550
Yallakool Escape (ML/d)
70 70 70 70 70 70 70 70 70 70 70 70
Total (ML/d) 2720 3020 3020 3020 3020 3020 3020 3020 2720 2720 2720 2720
Total (GL/month) 84.32 90.6 93.62 93.62 90.6 93.62 90.6 93.62 84.32 76.16 84.32 81.6
Option 11
Wakool Escape (ML/d) 1000 1000 1000 1000 1000 1000 1000 1000 1000 1000 1000 1000
Edward and Yallakool Escapes
As per Base Case
Total (ML/d) 3170 3470 3470 3470 3470 3470 3470 3470 3170 3170 3170 3170
Total (GL/month) 98.27 104.1
107.57
107.57 104.1
107.57 104.1
107.57 98.27 88.76 98.27 95.1
Table B- 17: Changes made to the MSM parameter file to model Option 11 – increased diversions to the Wakool River.
Original Parameter File Variable and Original Values
V551-MSM-TLM_Option1.txt 68 2 1-72 EDCAP1. CAPACITY OF EDWARD ESCAPE (May-Apr) A
84.32 90.6 93.62 93.62 90.6 93.62 90.6 93.62 84.32 76.16 84.32 81.6 68-2
73 7-12 EscapeNonUse - The capacity of the Edward Escapes in ML/d that is not called upon to prevent forest flooding that is not related to Hume-Lake Victoria transfers or meeting downstream demand (ie the capacity of the Yallakool and Wakool Escapes included in EDCAP)
10600. 620. 1000. 0.100 2 73
New Parameter File New Values
V551-MSM-TLM_Option11.txt 98.27 104.1 107.57 107.57 104.1 107.57 104.1 107.57 98.27 88.76 98.27 95.1 68-2
10600. 1070. 1000. 0.100 2 73

Barmah Choke Study – Individual Option Phase
SINCLAIR KNIGHT MERZ PAGE 186
Table B- 18: Changes made to the modflow FORTRAN code to model Option 11 – increased diversions to the Wakool River.
FORTRAN file Original Code (beginning at line 1149)
modflw20.F90 ! If Edward Escape distribute excess Release to Wakool and Yallakool Escapes
if(EDWESC(RCHLCV))THEN
array4(daylcv,2)=max(0.,min(70.,day(daylcv)-uplim-550.))
array4(daylcv,1)=max(0.,min(550.,day(daylcv)-uplim))
totday(DAYLCV,NUM)=day(daylcv)-array4(daylcv,1) &
- array4(daylcv,2)
else
TOTDAY(DAYLCV,NUM) = DAY(DAYLCV)
endif
New Code (beginning at line 1149)
! If Edward Escape distribute excess Release to Wakool and Yallakool Escapes
if(EDWESC(RCHLCV))THEN
array4(daylcv,2)=max(0.,min(70.,day(daylcv)-uplim-1000.))
array4(daylcv,1)=max(0.,min(1000.,day(daylcv)-uplim))
totday(DAYLCV,NUM)=day(daylcv)-array4(daylcv,1) &
- array4(daylcv,2)
else
TOTDAY(DAYLCV,NUM) = DAY(DAYLCV)
endif
B.11 Option 12 – increased escape capacity to the Edward River
To model an increased escape capacity to the Edward River, changes were made to the MSM
parameter file (Table B- 20), the BigMod parameter file (Table B- 21) and the Modflow
parameter file (Table B- 22). Table B- 19 shows how changes to the values of EDCAP in the
MSM parameter file are calculated.

Barmah Choke Study – Individual Option Phase
SINCLAIR KNIGHT MERZ PAGE 187
Table B- 19: Calculating the change required to the EDCAP variable in the MSM parameter file to model Option 12.
Base Case
Month May Jun Jul Aug Sep Oct Nov Dec Jan Feb Mar Apr
Days 31 30 31 31 30 31 30 31 31 28 31 30
Edward Escape (ML/d)
2100 2400 2400 2400 2400 2400 2400 2400 2100 2100 2100 2100
Wakool Escape (ML/d)
550 550 550 550 550 550 550 550 550 550 550 550
Yallakool Escape (ML/d)
70 70 70 70 70 70 70 70 70 70 70 70
Total (ML/d) 2720 3020 3020 3020 3020 3020 3020 3020 2720 2720 2720 2720
Total (GL/month) 84.32 90.6 93.62 93.62 90.6 93.62 90.6 93.62 84.32 76.16 84.32 81.6
Option 12
Edward Escape (ML/d) 3200 3200 3200 3200 3200 3200 3200 3200 3200 3200 3200 3200
Wakool and Yallakool Escapes
As per Base Case
Total (ML/d) 3820 3820 3820 3820 3820 3820 3820 3820 3820 3820 3820 3820
Total (GL/month) 118.42 114.6 118.42 118.42 114.6 118.42 114.6 118.42 118.42 106.96 118.42 114.6
Table B- 20: Changes made to the MSM parameter file to model Option 12 – increased escape capacity to the Edward River.
Original Parameter File Variable and Original Values
V551-MSM-TLM_Option1.txt 68 2 1-72 EDCAP1. CAPACITY OF EDWARD ESCAPE (May-Apr) A
84.32 90.6 93.62 93.62 90.6 93.62 90.6 93.62 84.32 76.16 84.32 81.6 68-2
New Parameter File New Values
V551-MSM-TLM_Option12.txt 118.42 114.6 118.42 118.42 114.6 118.42 114.6 118.42 118.42 106.96 118.42 114.6 68-2
Table B- 21: Changes made to the BigMod parameter file to model Option 12 – increased escape capacity to the Edward River.
Original Parameter File Control Variable Changed From
Changed To New File
V125-bigpar-prod_Option1.txt 402 (column 12) 5*2100.,7*2400. 5*3200.,7*3200. V125-bigpar-prod_Option12.txt
Table B- 22: Changes made to the Modflow parameter file to model Option 12 – increased escape capacity to the Edward River.
Original Parameter File Variable Changed From Changed To New File
V492b-Modflow-Param.txt EDWESC (column 2) 2100 3200 V492b-Modflow-Param.txt
EDWESC (column 3) 2400 3200
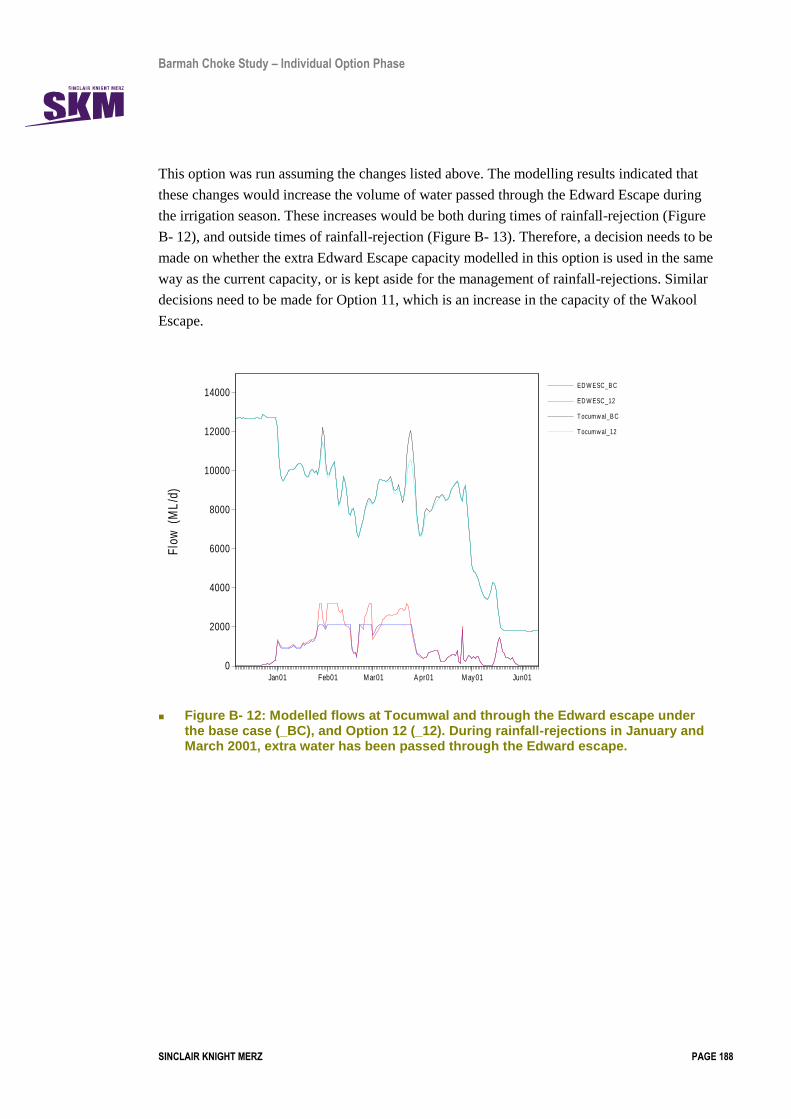
Barmah Choke Study – Individual Option Phase
SINCLAIR KNIGHT MERZ PAGE 188
This option was run assuming the changes listed above. The modelling results indicated that
these changes would increase the volume of water passed through the Edward Escape during
the irrigation season. These increases would be both during times of rainfall-rejection (Figure
B- 12), and outside times of rainfall-rejection (Figure B- 13). Therefore, a decision needs to be
made on whether the extra Edward Escape capacity modelled in this option is used in the same
way as the current capacity, or is kept aside for the management of rainfall-rejections. Similar
decisions need to be made for Option 11, which is an increase in the capacity of the Wakool
Escape.
Figure B- 12: Modelled flows at Tocumwal and through the Edward escape under the base case (_BC), and Option 12 (_12). During rainfall-rejections in January and March 2001, extra water has been passed through the Edward escape.
Flo
w (
ML
/d)
0
2000
4000
6000
8000
10000
12000
14000
Jan01 Feb01 Mar01 A pr01 May01 Jun01
ED W ESC_B C
ED W ESC_12
T ocumw al_B C
T ocumw al_12

Barmah Choke Study – Individual Option Phase
SINCLAIR KNIGHT MERZ PAGE 189
Figure B- 13: Modelled flows at Tocumwal and through the Edward escape under the base case (_BC), and Option 12 (_12). Although there is now rainfall rejection in March 2003, more water has been passed through the Edward escape under Option 12, compared with the base case.
B.12 Option 13 – increased escape capacity to Broken Creek
The modelling methodology for Option 13 is comprised of two steps (A and B). Step A is the
same as documented for the interconnector option (Option 15), which involves changing the
value of BROKEscOpt in the MSM parameter file from 1 (escape flows not added to
Yarrawonga diversions or flow at Rices Weir) to 3 (escape flows added to both), and then
factoring down the Yarrawonga diversions and Rices Weir inflow series until they match those
modelled in Option 1 (do nothing) (Table B- 23).
Changing the Rices Weir inflow series as part of Step A has been found to change the
BARMILL loss function (control variable 447, which is comprised partly of control variable
combination 29) in BigMod. This is because control variable combination 29 includes losses in
reach 168 (BROKEN CREEK - RICES WEIR TO MURRAY). Losses in reach 168 are
determined using control variable 619, which is „MSM reduction in Broken Ck Q‟. To undo
the observed change in BARMILL losses, the „LS‟ 168 component of control variable
combination 29 is removed in Step A (Table B- 24). This is based on the assumption that when
the BROKEscOpt in the MSM parameter file is 1 (Option 1), control variable 619 equates to 0.
Flo
w (
ML
/d)
0
2000
4000
6000
8000
10000
12000
14000
16000
N ov02 D ec02 Jan03 Feb03 Mar03 A pr03 May03
ED W ESC_B C
ED W ESC_12
T ocumw al_B C
T ocumw al_12

Barmah Choke Study – Individual Option Phase
SINCLAIR KNIGHT MERZ PAGE 190
Step B involved increasing the values of BrokEscape on line 68-4 of the MSM parameter file,
so that 300 ML/d is passed down the Yarrawonga Main Channel to the Broken Creek escape
during every day of the unseasonal flooding period (January to April) (Table B- 25).
Table B- 23: Changes made to the MSM parameter file to model Option 13 – step A.
Original Parameter File Variable and Original Values
V551-MSM-TLM_Option1.txt ? 5 12 67-72 BROKEscOpt Option for handling Broken Creek Escape. ? 0=> No Escape flows and data not read in. ? >0 12 monthly values for Broken Creek Escape losses are input at Card 68-4 ? 1=> Escape Flows not added to Yarrawonga Gross or Rices Weir ? 2=> Escape Flows added to Yarrawonga Gross but not to Rices Weir ? 3=> Escape flows added to both Yarrawonga Gross and Rices Weir ? Note that Acoounting and Fixed diversion runs assume Option 2 ? because the Yarrawonga diversions input for those runs is net of ? yarrawonga and Broken Creek Escapes
40. 100. 50. 1. 0. 0.00 1 0. 0 0. 0 1 5-12
3 'Net Murray Valley Diversions' 9 0 0 198307 200006 0 199406 0.0 1.0 1.0667 0
New Parameter File New Values
V551-MSM-TLM_Option13StepA.txt 40. 100. 50. 1. 0. 0.00 1 0. 0 0. 0 3 5-12
3 'Net Murray Valley Diversions' 9 0 0 198307 200006 0 199406 0.0 1.0 1.0405 0
Table B- 24: Changes made to the BigMod parameter file to model Option 13 – step A.
Original Parameter File Control Variable Combination (beginning at line 4552)
V125-bigpar-prod_Option1.txt 29 'Losses - Yarrawonga to Barmah' 8 '+' 'LS' 18 '+' 'LS' 19 '+' 'LS' 20 '+' 'LS' 128 '+' 'LS' 21 '+' 'LS' 168 '+' 'LS' 22 '+' 'LS' 23
New Parameter File New Control Variable Combination (beginning at line 4552)
V125-bigpar-prod_Option13StepA.txt 29 'Losses - Yarrawonga to Barmah' 7 '+' 'LS' 18 '+' 'LS' 19 '+' 'LS' 20 '+' 'LS' 128 '+' 'LS' 21 '+' 'LS' 22 '+' 'LS' 23
Table B- 25: Changes made to the MSM parameter file to model Option 13 – step B.
Original Parameter File Variable and Original Values
V551-MSM-TLM_Option1.txt ? 68 4 1-72 BrokEscape Broken Creek Escape (GL/mth) (May to Apr)
0.53 0.26 0.0 0.20 1.19 1.10 0.99 1.13 1.43 1.45 1.60 1.61 68-4
New Parameter File New Values
V551-MSM-TLM_Option13StepA.txt 0.53 0.26 0.0 0.20 1.19 1.10 0.99 1.13 9.3 8.4 9.3 9.0 68-4
As part of Step A, checks were made that flows in the system and the reliability of supply to
irrigators in Victoria and NSW are the same as for Option 1 (do nothing). Checks of the
preliminary runs show this to be the case (Figure B- 14 to Figure B- 16).
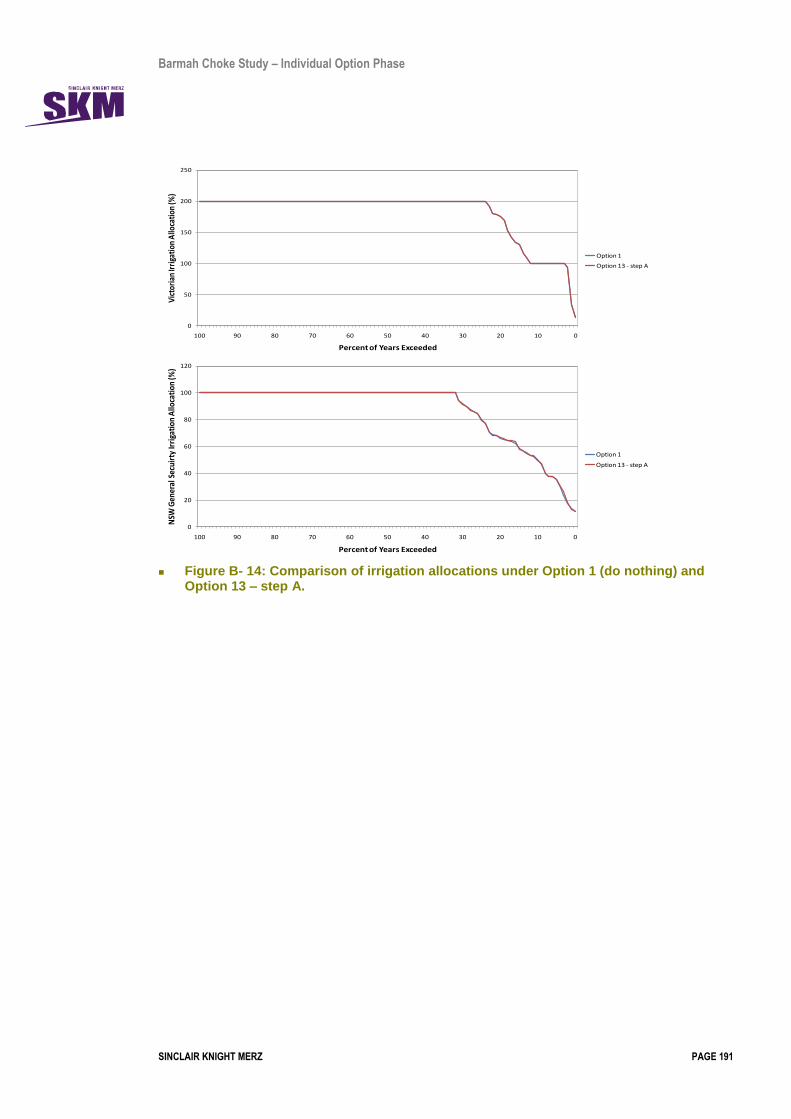
Barmah Choke Study – Individual Option Phase
SINCLAIR KNIGHT MERZ PAGE 191
Figure B- 14: Comparison of irrigation allocations under Option 1 (do nothing) and
Option 13 – step A.
0
50
100
150
200
250
100 90 80 70 60 50 40 30 20 10 0
Vic
tori
an Ir
riga
tion
Allo
cati
on (%
)
Percent of Years Exceeded
Option 1
Option 13 - step A
0
20
40
60
80
100
120
100 90 80 70 60 50 40 30 20 10 0
NSW
Gen
eral
Sec
uirt
y Ir
riga
tion
Allo
cati
on (%
)
Percent of Years Exceeded
Option 1
Option 13 - step A

Barmah Choke Study – Individual Option Phase
SINCLAIR KNIGHT MERZ PAGE 192
Figure B- 15: Comparison of average flows modelled by BigMod under Option 1 (do nothing) and Option 13 – step A

Barmah Choke Study – Individual Option Phase
SINCLAIR KNIGHT MERZ PAGE 193
Figure B- 16: Comparison of average flows modelled by MSM under Option 1 (do nothing) and Option 13 – step A.

Barmah Choke Study – Individual Option Phase
SINCLAIR KNIGHT MERZ PAGE 194
Results from a preliminary run of Step B show that under Option 13 the volume of water
passed through the Broken Creek escape would increase during the unseasonal flooding
period. These increases would be both during times of rainfall-rejection (Figure B- 17), and
outside times of rainfall-rejection (Figure B- 18). Therefore, a decision needs to be made on
whether the extra Broken Creek Escape capacity modelled in this option is kept aside for the
management of rainfall-rejections, or is also used to meet downstream demands.
Figure B- 17: Modelled flows downstream of Yarrawonga and from the Broken Creek to the River Murray under the base case (_BC), and Option 13 step B (_13). During rainfall-rejections in January and March 2001, extra water has been passed through the Broken Creek escape.
Flo
w (
ML
/d)
0
2000
4000
6000
8000
10000
12000
14000
Jan01 Feb01 Mar01 A pr01 May01 Jun01
Y A RRA D S_B C
Y A RRA D S_13
RI CES W R_B C
RI CES W R_13

Barmah Choke Study – Individual Option Phase
SINCLAIR KNIGHT MERZ PAGE 195
Figure B- 18: Modelled flows downstream of Yarrawonga and from the Broken Creek to the River Murray under the base case (_BC), and Option 13 step B (_13). During periods of high demand, 10,600 ML/d is flowing down the River Murray in both scenarios, despite the extra water passing through the Broken Creek escape in Option 13.
B.13 Option 15 – Murray-Goulburn Interconnector channel
This option was modelled by increasing Murray Valley demand to represent the portion of
Shepparton Irrigation Area supplied from the River Murray, increase the Broken Creek Escape
to represent the direct bypass operation and increase Goulburn IVT account to represent the
flow substitution from the Goulburn River.
The flow delivered via Broken Creek and the Goulburn River will be in the pattern:
November: 5%
December: 25%
January: 25%
February: 25%
March: 20%
The total flow on average is 48GL/year via Broken Creek and 50GL/year via Goulburn River.
Flo
w (
ML
/d)
0
2000
4000
6000
8000
10000
12000
14000
D ec02 Jan03 Feb03 Mar03 A pr03 May03
Y A RRA D S_B C
Y A RRA D S_13
RI CES W R_B C
RI CES W R_13

Barmah Choke Study – Individual Option Phase
SINCLAIR KNIGHT MERZ PAGE 196
The changes to MSM-Bigmod to simulate this option were undertaken in two steps. The first
step was based on the method developed for option 13 which set the Broken Creek Escape
Option to 3 which sets Escape flows to be added to both Yarrawonga Gross and Rices Weir.
This step involved changing the model to operate with BROKEscOpt set to 3 to replicate the
Do Nothing scenario as closely as possible (Step A) which is described in more detail below.
Then the model was adjusted in the following three ways:
increasing gross diversion to Yarrawonga Main Channel to simulate additional flow to the
interconnector channel;
including additional return flow from Broken Creek;
including additional IVT return from the Goulburn River.
Step A involved changing the value of BROKEscOpt in the MSM parameter file from 1
(escape flows not added to Yarrawonga diversions or flow at Rices Weir) to 3 (escape flows
added to both), and then factoring down the Yarrawonga diversions and Rices Weir inflow
series until they match those modelled in Option 1 (do nothing) (Table B- 26).
Changing the Rices Weir inflow series as part of Step A has been found to change the
BARMILL loss function (control variable 447, which is comprised partly of control variable
combination 29) in BigMod. This is because control variable combination 29 includes losses in
reach 168 (BROKEN CREEK - RICES WEIR TO MURRAY). Losses in reach 168 are
determined using control variable 619, which is „MSM reduction in Broken Ck Q‟. To undo
the observed change in BARMILL losses, the „LS‟ 168 component of control variable
combination 29 is removed in Step A (Table B- 27). This is based on the assumption that when
the BROKEscOpt in the MSM parameter file is 1 (Option 1), control variable 619 equates to 0.
Table B- 26: Changes made to the MSM parameter file to model Option 13 – step A.
Original Parameter File Variable and Original Values
V551-MSM-TLM_Option1.txt ? 5 12 67-72 BROKEscOpt Option for handling Broken Creek Escape. ? 0=> No Escape flows and data not read in. ? >0 12 monthly values for Broken Creek Escape losses are input at Card 68-4 ? 1=> Escape Flows not added to Yarrawonga Gross or Rices Weir ? 2=> Escape Flows added to Yarrawonga Gross but not to Rices Weir ? 3=> Escape flows added to both Yarrawonga Gross and Rices Weir ? Note that Accounting and Fixed diversion runs assume Option 2 ? because the Yarrawonga diversions input for those runs is net of ? yarrawonga and Broken Creek Escapes
40. 100. 50. 1. 0. 0.00 1 0. 0 0. 0 1 5-12
3 'Net Murray Valley Diversions' 9 0 0 198307 200006 0 199406 0.0 1.0 1.0667 0
New Parameter File New Values
V551-MSM-TLM_Option13StepA.txt 40. 100. 50. 1. 0. 0.00 1 0. 0 0. 0 3 5-12
3 'Net Murray Valley Diversions' 9 0 0 198307 200006 0 199406 0.0 1.0 1.0405 0

Barmah Choke Study – Individual Option Phase
SINCLAIR KNIGHT MERZ PAGE 197
Table B- 27: Changes made to the BigMod parameter file to model Option 13 – step A.
Original Parameter File Control Variable Combination (beginning at line 4552)
V125-bigpar-prod_Option1.txt 29 'Losses - Yarrawonga to Barmah' 8 '+' 'LS' 18 '+' 'LS' 19 '+' 'LS' 20 '+' 'LS' 128 '+' 'LS' 21 '+' 'LS' 168 '+' 'LS' 22 '+' 'LS' 23
New Parameter File New Control Variable Combination (beginning at line 4552)
V125-bigpar-prod_Option13StepA.txt 29 'Losses - Yarrawonga to Barmah' 7 '+' 'LS' 18 '+' 'LS' 19 '+' 'LS' 20 '+' 'LS' 128 '+' 'LS' 21 '+' 'LS' 22 '+' 'LS' 23
As part of Step A, checks were made that flows in the system and the reliability of supply to
irrigators in Victoria and NSW are the same as for Option 1 (do nothing). Checks of the show
this to be the case (Figure B- 19 to Figure B- 21).
Figure B- 19: Comparison of irrigation allocations under Option 1 (do nothing) and
Option 13 – step A.
0
50
100
150
200
250
100 90 80 70 60 50 40 30 20 10 0
Vic
tori
an Ir
riga
tio
n A
lloca
tio
n (%
)
Percent of Years Exceeded
Option 1
Option 13 - step A
0
20
40
60
80
100
120
100 90 80 70 60 50 40 30 20 10 0
NSW
Gen
eral
Sec
uir
ty Ir
riga
tio
n A
lloca
tio
n (%
)
Percent of Years Exceeded
Option 1
Option 13 - step A
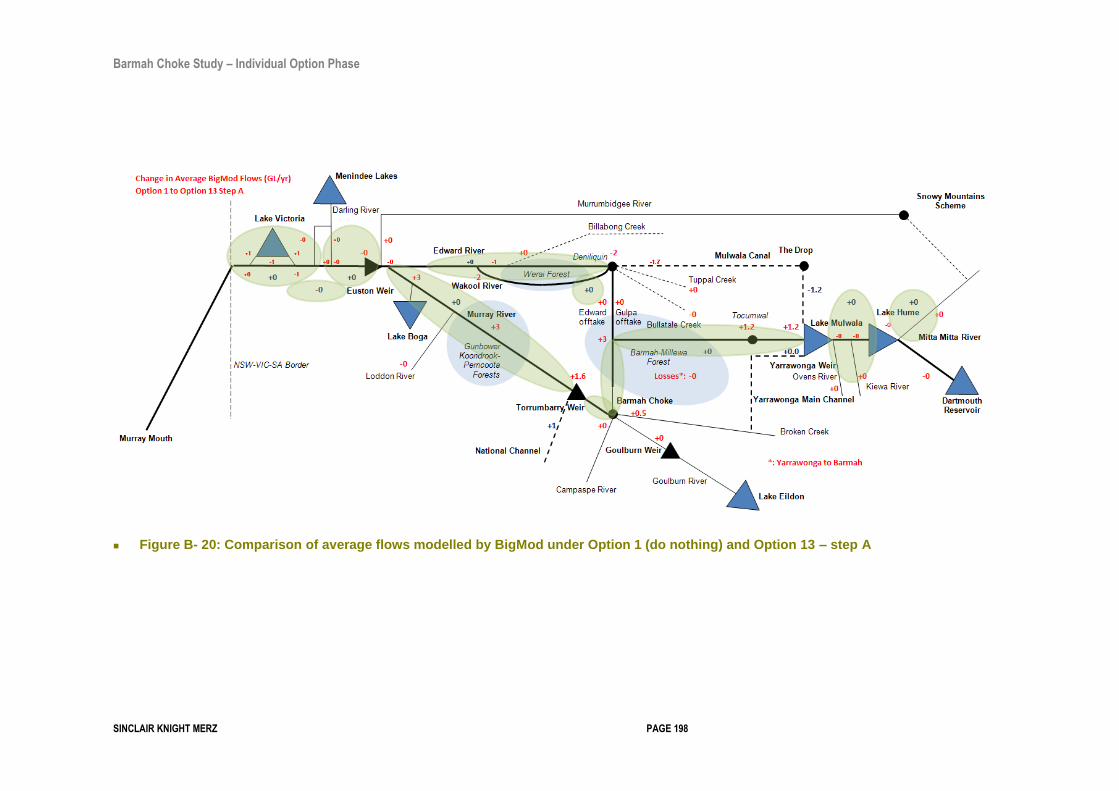
Barmah Choke Study – Individual Option Phase
SINCLAIR KNIGHT MERZ PAGE 198
Figure B- 20: Comparison of average flows modelled by BigMod under Option 1 (do nothing) and Option 13 – step A

Barmah Choke Study – Individual Option Phase
SINCLAIR KNIGHT MERZ PAGE 199
Figure B- 21: Comparison of average flows modelled by MSM under Option 1 (do nothing) and Option 13 – step A.

Barmah Choke Study – Individual Option Phase
SINCLAIR KNIGHT MERZ PAGE 200
Increase diversions to Yarrawonga Channel
The supply to Murray Valley was increased by 50GL/year (increase Murray Valley HRWS by
50GL/year) in line 5-29
245.900 139.498 80.000 18.998 0 4 4 1 0 1 0.0 0.0 5-29
CHANGE TO:
295.900 139.498 80.000 18.998 0 4 4 1 0 1 0.0 0.0 5-29
Using trial and error the demand scaling factor (DEMSCALE) for Murray Valley was adjusted
until the gross diversion to Yarrawonga Main channel is approximately 98GL/year. (50GL/year in
supply to Murray Valley and 48GL/year in Broken Creek escape)
3 'Net Murray Valley Diversions' 9 0 0 198307 200006 0 199406 0.0 1.0
1.0405 0
CHANGE TO:
3 'Net Murray Valley Diversions' 9 0 0 198307 200006 0 199406 0.0 1.0
1.1700 0
The volume and pattern of Broken Creek Escape was changed as to represent the additional direct
bypass flow via Broken Creek, so line 68-4 was changed as shown below.
0.53 0.26 0.0 0.20 1.19 1.10 0.99 1.13 1.43 1.45 1.60 1.61 68-4
CHANGE TO:
0.53 0.26 0.0 0.20 1.19 1.10 3.39 13.13 13.43 13.45 11.20 1.61 68-4
Additional IVT flow on the Goulburn River of 50GL/year was included, so line 92 was changed as
shown below.
? 92 1-8 EVA-Entitlement(1,1)-Goulburn High Reliability WS End of Valley Account
IVT Entitlement
109.418 0. 9999. 9999. 9999. 0. 0. 9999. 9999. 9999. 92
CHANGE TO:
159.418 0. 9999. 9999. 9999. 0. 0. 9999. 9999. 9999. 92

Barmah Choke Study – Individual Option Phase
SINCLAIR KNIGHT MERZ PAGE 201
B.14 Option 16 – Perricoota Escape
To model diversions through the Perricoota Escape, changes are made to the MSM parameter file
(Table B- 29), the code in modflw20.f90 (Table B- 30) and the BigMod parameter file (Table B-
31).
The EDCAP variable in the MSM parameter file are modified to include the Perricoota Escape
capacity (Table B- 28), along with the escape capacities to the Edward River, Wakool River and
Yallakool River. This means the Perricoota Escape will behave in the same way as the Wakool and
Yallakool Escapes.
Table B- 28: Calculating the change required to the EDCAP variable in the MSM parameter file to model Option 16 – Perricoota Escape
Base Case
Month May Jun Jul Aug Sep Oct Nov Dec Jan Feb Mar Apr
Days 31 30 31 31 30 31 30 31 31 28 31 30
Edward Escape (ML/d) 2100 2400 2400 2400 2400 2400 2400 2400 2100 2100 2100 2100
Wakool Escape (ML/d) 550 550 550 550 550 550 550 550 550 550 550 550
Yallakool Escape (ML/d) 70 70 70 70 70 70 70 70 70 70 70 70
Total (ML/d) 2720 3020 3020 3020 3020 3020 3020 3020 2720 2720 2720 2720
Total (GL/month) 84.32 90.6 93.62 93.62 90.6 93.62 90.6 93.62 84.32 76.16 84.32 81.6
Option 11
Edward Escape (ML/d) As per Base Case
Wakool Escape (ML/d) As per Base Case
Yallakool Escape (ML/d) As per Base Case
Perricoota Escape (ML/d) 200 200 200 200 200 200 200 200 200 200 200 200
Total (ML/d) 2920 3220 3220 3220 3220 3220 3220 3220 2920 2920 2920 2920
Total (GL/month) 90.52 96.6 99.82 99.82 96.6 99.82 96.6 99.82 90.52 81.76 90.52 87.6
Table B- 29: Changes made to the MSM parameter file to model Option 16 – Perricoota Escape
Original Parameter File Variable and Original Values
V551-MSM-TLM_Option1.txt 68 2 1-72 EDCAP1. CAPACITY OF EDWARD ESCAPE (May-Apr) A
84.32 90.6 93.62 93.62 90.6 93.62 90.6 93.62 84.32 76.16 84.32 81.6 68-2
73 7-12 EscapeNonUse - The capacity of the Edward Escapes in ML/d that is not called upon to prevent forest flooding that is not related to Hume-Lake Victoria transfers or meeting downstream demand (ie the capacity of the Yallakool and Wakool Escapes included in EDCAP)
10600. 620. 1000. 0.100 2 73
New Parameter File New Values
V551-MSM-TLM_Option11.txt 90.52 96.6 99.82 99.82 96.6 99.82 96.6 99.82 90.52 81.76 90.52 87.6 68-2
10600. 820. 1000. 0.100 2 73

Barmah Choke Study – Individual Option Phase
SINCLAIR KNIGHT MERZ PAGE 202
The modflow code was modified to include the Perricoota Escape, which used after the capacity of
the Wakool and Yallakool Escapes are exceeded.
Table B- 30: Changes made to the modflow FORTRAN code to model Option 16 – Perricoota escape.
Original Code (beginning at line 220)
real array1(31,80),array2(31,60), &
array3(31,103),array4(31,2) ! Array 4 is where Wakesc and Yallesc are stored
real array1Previous(31,80),array2Previous(31,60), &
array3Previous(31,103),array4Previous(31,2) ! Storage of daily values for previous month
Option 16 Code (beginning at line 220)
real array1(31,80),array2(31,60), &
array3(31,103),array4(31,3) ! Array 4 is where Wakesc, Yallesc, Perresc are stored
real array1Previous(31,80),array2Previous(31,60), &
array3Previous(31,103),array4Previous(31,3) ! Storage of daily values for previous month
Original Code (line 231)
data array4/62*0./
Option 16 Code (line 231)
data array4/93*0./
Original Code (beginning at line 535)
WRITE (17, '(I2)') No_Firstfile+8 ! 11 for WEIR32,CAW2DAR,
! Ovens,Kiewa, Murrumbidgee,Darlot,ymcesc,Cawnout, Tandiv, WAKESC,
! YALLESC, MCCOYSB+IVT, BALRAN+IVT variables
Option 16 Code (beginning at line 535)
WRITE (17, '(I2)') No_Firstfile+9 ! 11 for WEIR32,CAW2DAR,
! Ovens,Kiewa, Murrumbidgee,Darlot,ymcesc,Cawnout, Tandiv, WAKESC,
! YALLESC, MCCOYSB+IVT, BALRAN+IVT, PERRESC variables
Additional Code for Option 16 (beginning at line 665)
call u_writecsvhead(ic1,icsv+9,precision, &
ninterp,endmth,'PERRESC',204,'1','PERRESC', &
'PERRESC-204 output from MSM',err)
Original Code (beginning at line 668)
HEAD3 = HEAD3(1:HEAD3END) // ',' // 'WEIR32'//','// &
'CAW2DAR'//','//'CAWNOUT'//','// &
'TANDIV'//','//'WAKESC'//','//'YALLESC'//','// &
'MCCOYSB'//','//'BALRAN'
Option 16 Code (beginning at line 671)
HEAD3 = HEAD3(1:HEAD3END) // ',' // 'WEIR32'//','// &
'CAW2DAR'//','//'CAWNOUT'//','// &
'TANDIV'//','//'WAKESC'//','//'YALLESC'//','// &
'MCCOYSB'//','//'BALRAN'//','//'PERRESC'
Original Code (beginning at line 1147)
DO DAYLCV = 1, NUMDAYS
!
! If Edward Escape distribute excess Release to Wakool and Yallakool Escapes
if(EDWESC(RCHLCV))THEN
array4(daylcv,2)=max(0.,min(70.,day(daylcv)-uplim-550.))
array4(daylcv,1)=max(0.,min(550.,day(daylcv)-uplim))
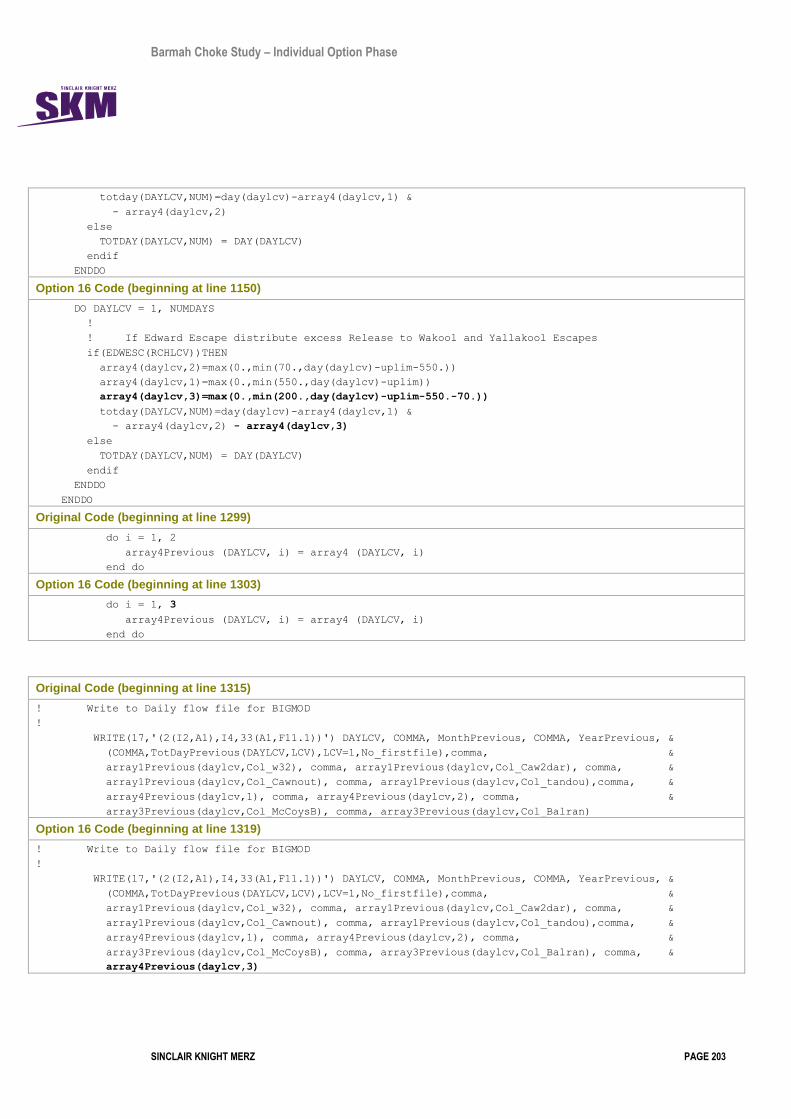
Barmah Choke Study – Individual Option Phase
SINCLAIR KNIGHT MERZ PAGE 203
totday(DAYLCV,NUM)=day(daylcv)-array4(daylcv,1) &
- array4(daylcv,2)
else
TOTDAY(DAYLCV,NUM) = DAY(DAYLCV)
endif
ENDDO
Option 16 Code (beginning at line 1150)
DO DAYLCV = 1, NUMDAYS
!
! If Edward Escape distribute excess Release to Wakool and Yallakool Escapes
if(EDWESC(RCHLCV))THEN
array4(daylcv,2)=max(0.,min(70.,day(daylcv)-uplim-550.))
array4(daylcv,1)=max(0.,min(550.,day(daylcv)-uplim))
array4(daylcv,3)=max(0.,min(200.,day(daylcv)-uplim-550.-70.))
totday(DAYLCV,NUM)=day(daylcv)-array4(daylcv,1) &
- array4(daylcv,2) - array4(daylcv,3)
else
TOTDAY(DAYLCV,NUM) = DAY(DAYLCV)
endif
ENDDO
ENDDO
Original Code (beginning at line 1299)
do i = 1, 2
array4Previous (DAYLCV, i) = array4 (DAYLCV, i)
end do
Option 16 Code (beginning at line 1303)
do i = 1, 3
array4Previous (DAYLCV, i) = array4 (DAYLCV, i)
end do
Original Code (beginning at line 1315)
! Write to Daily flow file for BIGMOD
!
WRITE(17,'(2(I2,A1),I4,33(A1,F11.1))') DAYLCV, COMMA, MonthPrevious, COMMA, YearPrevious, &
(COMMA,TotDayPrevious(DAYLCV,LCV),LCV=1,No_firstfile),comma, &
array1Previous(daylcv,Col_w32), comma, array1Previous(daylcv,Col_Caw2dar), comma, &
array1Previous(daylcv,Col_Cawnout), comma, array1Previous(daylcv,Col_tandou),comma, &
array4Previous(daylcv,1), comma, array4Previous(daylcv,2), comma, &
array3Previous(daylcv,Col_McCoysB), comma, array3Previous(daylcv,Col_Balran)
Option 16 Code (beginning at line 1319)
! Write to Daily flow file for BIGMOD
!
WRITE(17,'(2(I2,A1),I4,33(A1,F11.1))') DAYLCV, COMMA, MonthPrevious, COMMA, YearPrevious, &
(COMMA,TotDayPrevious(DAYLCV,LCV),LCV=1,No_firstfile),comma, &
array1Previous(daylcv,Col_w32), comma, array1Previous(daylcv,Col_Caw2dar), comma, &
array1Previous(daylcv,Col_Cawnout), comma, array1Previous(daylcv,Col_tandou),comma, &
array4Previous(daylcv,1), comma, array4Previous(daylcv,2), comma, &
array3Previous(daylcv,Col_McCoysB), comma, array3Previous(daylcv,Col_Balran), comma, &
array4Previous(daylcv,3)

Barmah Choke Study – Individual Option Phase
SINCLAIR KNIGHT MERZ PAGE 204
The BigMod parameter file was modified to include a new branch from the Mulwala Canal (at the
Edward Escape) to the River Murray at the Wakool Junction. The branch cannot be modelled as
joining the River Murray at Torrumbarry, because for the purposes of modelling, BigMod
considers Torrumbarry to be upstream of the Mulwala Canal (at the Edward Escape).
The changes required to BigMod are:
Increase the number of reaches from 235 to 236;
Increase the number of reaches for which there is definition data from 225 to 226;
Increase the number of branches from 87 to 88.
Increase the number of inputs from modflow („BIGINFLOW2‟) from 18 to 19;
Add the reach, reach definition and branch data as per Table B- 31.
Table B- 31: Changes made to the BigMod parameter file to model Option 16 – Perricoota Escape.
New BigMod Reach Data – Option 16
? 1. = REACH NUMBER
? 2. IDSRCH = DOWNSTREAM REACH NUMBER (ALL OUTFLOW FROM REACH ENTERS HERE)
? 3. IRACT = IS REACH ACTIVE ? (1=YES)
? 4. IRSAL = ARE CONCENTRATIONS CALCULATED FOR REACH (1=YES)
? 5. RCHLEN = LENGTH OF REACH IN KM
? 6. RUSCHN = U/S CHAINAGE DISTANCE FROM RIVER MOUTH IN KM
? 7. TITRCH = TITLE FOR REACH (MAX 50 CHS)
?
? NOTE: The reaches below must be in stream order. That is, no reach must
? have as its downstream reach one that is above it on the list.
? However, the reach numbers do not have to be in numerical order.
?
? ----------------------------------------------------------------------------
? 1 2 3 4 5 6 7
300 76 1 1 60. 0. 'PERRICOOTA ESCAPE - EDW ESCAPE TO TORRUMBARRY'
New BigMod Reach Definition – Option 16
? 1 2
? 2 3 4 5 6 7 8 9 10 (11-20)
? ----------------------------------------------------------------------
? # TITRCH
? DS IEVAST1 IEVAST2 IRCHDV1 IRCHDV2 RDVFAC1 RDVFAC2 EXLSCV EXLSFAC (RCHLOD,RCHINI=1,NWQPD)
? F1 F2 F3 F4 F5 F6 F7 F8 F9 F10 (ML/D)
? TT1 TT2 TT3 TT4 TT5 TT6 TT7 TT8 TT9 TT10 (DAYS)
? AR1 AR2 AR3 AR4 AR5 AR6 AR7 AR8 AR9 AR10 (HA)
? HL1 HL2 HL3 HL4 HL5 HL6 HL7 HL8 HL9 HL10 (ML/D)
? RLJ RLF RLM RLA RLM RLJ RLJ RLA RLS RLO RLN RLD (ML/D)
?
? WHERE :
? # = REACH NUMBER
? DS = DEAD STORAGE IN REACH (ML)
? IEVAST1 = THE FIRST EVAPORATION STATION APPLIED TO THIS REACH
? IEVAST2 = THE SECOND EVAPORATION STATION APPLIED TO THIS REACH
? (Where evaporation and rainfall are read in separately,
? Ievast1 may be evaporation multiplied by a pan factor and
? Ievast2 may be rainfall multiplied by -1)
? IRCHDV1 = THE FIRST MONTHLY DIVERSION FIELD APPLIED TO THIS REACH
? IRCHDV2 = THE SECOND MONTHLY DIVERSION FIELD APPLIED TO THIS REACH
? RDVFAC1 = THE FRACTION OF DIVERSION FIELD 1 REMOVED FROM REACH
? RDVFAC2 = THE FRACTION OF DIVERSION FIELD 2 REMOVED FROM REACH
? GWLSCV = The Control Variable Number defining extra loss from Reach

Barmah Choke Study – Individual Option Phase
SINCLAIR KNIGHT MERZ PAGE 205
? GWLSFAC = The Fraction of the Loss that applies in this reach
?
? -----------THE FOLLOWING DATA ONLY REQUIRED WHEN nwqpd > 0 -------------
? IRCVLD(1)= THE CONTROL VARIABLE DEFINING THE LOAD OF WQ PARAMETER 1
? ENTERING REACH
? RCHLOD(1)= THE FRACTION OF CONTROL VARIABLE IRCVLD(1) ENTERING REACH
? IRCVLD(2)= THE CONTROL VARIABLE DEFINING THE LOAD OF WQ PARAMETER 2
? ENTERING REACH
? RCHLOD(2)= THE FRACTION OF CONTROL VARIABLE IRCVLD(2) ENTERING REACH
? etc for nwqpd sets of load and initial concentration
? ------------------- NEW LINE--------------------------------------
? F1 = FIRST FLOW (ML/D)
? TT1 = TRAVEL TIME FOR FLOW 1 (DAYS)
? AR1 = SURFACE AREA AT FLOW 1 (HECTARES)
? HL1 = HIGH FLOW LOSS FOR FLOW 1 (ML/D)
? F2 = SECOND FLOW ETC.
?
? REACH 300 - PERRICOOTA ESCAPE - EDWARD ESCAPE TO TORRUMBARRY WEIR POOL
300 'PERRICOOTA ESCAPE - EDW ESCAPE TO TORRUMBARRY'
0. 5 4 1 2 0.000 0.000 0 0.000 34 0.000
0. 50. 500. 1000. 2000. 5000. 10000. 15000. 25000. 100000.
1.0 1.0 1.0 1.0 1.0 1.0 1.0 1.0 1.0 1.0
0. 75. 75. 75. 75. 75. 75. 75. 75. 75.
0. 0. 0. 0. 0. 0. 0. 0. 0. 0.
12*0.
New BigMod Branch – Option 16
? 1. IBRNRF = BRANCH NUMBER
? 2. TITBRN = TITLE OF BRANCH
? 3. IBRNCH(1) = REACH FROM WHICH BRANCH SPLITS
? 4. FRCBRN = LOCATION IN REACH FROM WHICH BRANCH SPLITS(0.=U/S,1.=D/S)
? 5. IBRNCH(2) = REACH NUMBER OF BRANCH
? 6. IFILBR = THE NUMBER OF THE INPUT FLOW FILE CONTAINING BRANCH FLOW
? 7. IBRPOS = POSITION OF BRANCH FLOW ON INPUT FLOW FILE "IFILBR"
? (0 IF FLOW NOT READ IN) - IF PRESENT DATA FROM THE INPUT FILE
? OVER-RIDES ANY OTHER DEFINITION OF BRANCH FLOW
? 8. IBRCV = REFERENCE NO. OF CONTROL VARIABLE USED WITH BRANCH FLOW TABLE
? 9. IOVREG = NUMBER OF REGULATOR WHICH MODIFIES BRANCH FLOW RELATIONSHIP
? +ve numbers specify regulators : 0 specifies no regulator
? HOWEVER IF IOVFLD > 1 AND IBRCVO > 0 then:
? 0 => Maximum of tabulated flow and order
? -1 => Minimum of tabulated flow and order
? -2 => Two tables read. Branch = max(table1,min(order,table2))
? 10. IOVSUB = IS CALCULATED BRANCH FLOW REDUCED BY EXISTING FLOW IN D/S
? REACH (0=NO,1=YES)
? IF IOVSUB = -1 THEN NO ERROR MESSAGE IS OUTPUT WHEN BRANCH
? FLOW EXCEEDS FLOW IN REACH (IT IS HOWEVER TRUNCATED)
? 11. IOVFLD = NUMBER OF FIELDS IN THE TABLE DEFINING THE RELATIONSHIP
? BETWEEN THE CONTROL VARIABLE AND THE BRANCH FLOW (Max 25)
? Note: If IOVFLD = 0 the branch flow = the value of
? the control variable
? 12. IBRCVO = REFERENCE NO. FOR CONTROL VARIABLE WHICH SPECIFIES
? DOWNSTREAM ORDER AT BRANCH. FLOW IS SET AT MAXIMUM OF VALUE
? CALCULATED FROM TABLE AND THE DOWNSTREAM ORDER.
? /
? 13+ FOVER = TABLE CONTAINING IOVFLD SETS OF THREE VALUES WHICH DEFINE
? THE RELATIONSHIP BETWEEN FLOW IN THE MAIN REACH AND FLOW
? IN THE BRANCH.
?
? Line 1. FLOWS IN MAIN REACH
? Line 2. CORRESPONDING FLOW IN BRANCH WHEN REGULATOR CLOSED
? Line 3. CORRESPONDING FLOW IN BRANCH WHEN REGULATOR OPEN
? Note: When IOVREG = 0 or -1, only lines 1 and 2 will be read
?
? 1 2 3 4 5 6 7 8 9 10 11 12
? ---------------------------------------------------------------------------
150 'TO PERRICOOTA ESCAPE' 50 1.000 300 2 19 0 0 0 0 0

Barmah Choke Study – Individual Option Phase
SINCLAIR KNIGHT MERZ PAGE 206
B.15 Option 17 – combined weir manipulation
The proposed modelling methodology for Option 17 is the same as adopted for modelling of
Euston Weir (Appendix B.7).
This involved using the MSM-Bigmod output from the „do-nothing‟ option in combination with the
shortfall indicator which includes the ability to draw on the active volume and order replenishment
flow to refill the multiple weir pools when channel capacity is available.
The calculation of required flow at downstream Yarrawonga Weir is a function of the demands
plus losses less expected inflows downstream of Yarrawonga Weir (with allowances for travel
times considered). Table B- 32 outlines the methodology and components used to calculate
required flow at downstream Yarrawonga Weir.
Table B- 32: Calculation of required flow at downstream Yarrawonga Weir.
Component
Contribution to flow at Yarrawonga (+
ve or –
ve)
Lag (days in advance)
Model component used
Edward offtake + 3 Modelled Edward offtake flows from Bigmod
Gulpa offtake + 3 Modelled Gulpa offtake flows from Bigmod
Broken Creek inflows - 4 Modelled inflows from Bigmod
Goulburn River inflows - 4 Modelled inflows from Bigmod
National Channel orders + 6 National Channel Diversions from Bigmod
Loss Yarrawonga – Torrumbarry
+ 6 Loss (evap loss + short evap) for Yarrawonga to Torrumbarry, plus monthly Yarrawonga to Torrumbarry PD demands (restricted for channel capacity) plus Victorian shortfalls due to channel capacity all from MSM. Disaggregated based on a calibrated daily pattern from PRIDE.
Pental Island orders + 9 Pental Island pumps diversions from Bigmod.
Leiwah inflows - 9 Modelled inflows from Bigmod
Stoney inflows - 9 Modelled inflows from Bigmod
Swan Hill orders + 10 Calculated as 0.745 times Channel 9 diversions (from Bigmod)
Balranald inflows - 11 Modelled inflows from Bigmod
Loss Torrumbarry – Wakool Junction
+ 14 Loss (evap loss + short evap) for Torrumbarry to Wakool Junction, plus monthly Torrumbarry to Wakool Junction PD demands (restricted for channel capacity) all from MSM. Disaggregated based on a calibrated daily pattern from PRIDE.
Loss Wakool Junction – Euston
+ 14 Assumed to be 40% of loss from Wakool Junction to Wentworth
Required flow at Euston + 14 Minimum of Sunraysia diversions (4 days in advance from MSM2Big) and the sum of Sunraysia diversions (4 days in advance) plus Loss Euston to Wentworth (60% of loss Wakool Junction to Wentworth) plus required flow at Wentworth (minimum of zero).

Barmah Choke Study – Individual Option Phase
SINCLAIR KNIGHT MERZ PAGE 207
Component
Contribution to flow at Yarrawonga (+
ve or –
ve)
Lag (days in advance)
Model component used
Required flow at Wentworth
+ 14 Loss Wentworth to Rufus River plus 250 (minimum Lake Victoria inflow), plus the maximum of SA regulated flow less Lake Victoria outlet flow (2 days in advance) and 400 (minimum flow at Lock 7) less flow at Burtundy if Lake Victoria is able to supply the SA regulated flow or the maximum possible flow otherwise* if Lake Victoria is unable to supply the SA regulated flow.
*- Maximum possible flow (at Burtundy) equals minimum flow at Weir 32 if the Menindee Lakes are under
NSW control or otherwise the sum of the release capacity from Wetherell, Pamamaroo and Menindee less
loss from Weir 32 to Burtundy.
This calculation of required flow can be readily adapted to include the ability to temporarily
drawdown the weirs to meet peak demands.
To simulate the drawdown of the weirs to meet peak demands and avoid shortfalls in the indicator
the daily shortfall volume was reduced by the volume of drawdown available in the weirs,
restricted by the required flow at Wentworth (14 days in advance) and a maximum allowable rate
of drawdown (if applicable).
The weirs were assumed to be rapidly drawn down from the start of the shortfall event, and refilled
as soon as spare capacity for transfers becomes available. It was assumed that there was no
constraint in terms of a maximum allowable rate of refill.
The weirs, drawdowns and available air space are outlined in Table B- 33.
Table B- 33: Combined weir option drawdown
Weir Drawdown (m) Airspace Created (ML)
Torrumbarry (Lock 26) 0.40 3055
Euston (Lock 15) 0.30 3990
Mildura (Lock 11) 0.25 2780
Wentworth (Lock 10) 0.25 3490
Kulnine (Lock 9) 0.20 2954
Wangumma (Lock 8) 0.50 2927
TOTAL - 19196

Barmah Choke Study – Individual Option Phase
SINCLAIR KNIGHT MERZ PAGE 208
Appendix C Calculation of the significance of the problem
A key task of the Investigation Phase of the Barmah Choke Study (SKM, 2009) was to develop
indicators relating to the overall Barmah Choke Study objectives. These indicators can be used to
assess and compare options and establish a base case (Option 1- do nothing) against which all other
options can be compared. The development and calculation of each of the indicators developed as a
part of the Investigation Phase is detailed in Section C.1 to C.4.
In addition to the Barmah Choke Study specific indicators, the MDBA generally produces a set of
standard hydrological indicators for all runs. These indicators are used by the MDBA to enable a
quick overview and initial assessment of scenario runs (MDBA, 2010a). These can also be used to
assess and compare options and establish a base case. The MDBA standard hydrological indicators
that will be used for the Barmah Choke Study are listed in Section C.5.
All of the indicators discussed in this Appendix (MDBA standard indicators and Barmah Choke
Study specific indicators) have been used to assess and compare options for the Individual Options
Phase of the Barmah Choke Study. The tables and figures that are presented in this Appendix are
designed to be examples of what can be found in the following Appendices. They are example
plots or tables with no results.
C.1 Shortfalls and rationing of diversions
Each year in the River Murray System, an allocation is announced for both NSW and Victoria at
the start of the season. The allocation is dependent on each State‟s available resources and is
updated during the season. Irrigation and other demands are then restricted based on the announced
allocation. A shortfall occurs when the restricted demand cannot be supplied due to channel
capacity constraints or a lack of resource storage in the lower system.
Channel capacity constraints occur at two main points in the River Murray System: downstream of
Hume Reservoir and at the Barmah Choke, however the Barmah Choke is the key constraint. The
channel operating capacity of Hume Reservoir is restricted to 25,000 ML/day. The channel
operating capacity of the Barmah Choke is 8,000 ML/day measured at Barmah, which equates to
10,600 ML/day downstream of Yarrawonga Weir.
To assess the significance of the problem under the base case, and to determine the impact of
options on the significance of the problem, the number of years with shortfalls is calculated.
Shortfalls are calculated on a monthly time-step by MSM; if the demand for a given month is in
excess of available channel capacity a shortfall is recorded. Calculating shortfalls on a monthly
time-step is inadequate for the purposes of the Barmah Choke Study as shortfalls occurring over

Barmah Choke Study – Individual Option Phase
SINCLAIR KNIGHT MERZ PAGE 209
short time periods are not identified. Daily shortfalls are not calculated directly by Bigmod as the
demands passed to Bigmod from MSM have already been restricted based on monthly channel
capacity.
To assess the incidence and magnitude of shortfalls for the Barmah Choke Study, a method was
developed to determine required flow at downstream Hume Reservoir and downstream
Yarrawonga Weir based on model outputs. Required flow was then compared to operational
channel capacity. The method for determining required flow was developed based on the methods
used by the river operators to determine the required releases from Hume Reservoir and
Yarrawonga Weir.
Table C- 1and Table C- 2 outline the method and components used to calculate required flow at
downstream Yarrawonga Weir and downstream Hume Reservoir respectively. The volume of
required flow was then compared to the operational capacity of 10,600 ML/day (downstream
Yarrawonga Weir) and 25,000 ML/day (downstream Hume Reservoir) to estimate the timing and
volume of shortfall events.
Table C- 1: Calculation of required flow at downstream Yarrawonga Weir.
Component Contribution to Flow at
Yarrawonga (+
ve or –
ve)
Lag (days in
advance)
Model Component Used
Edward Offtake + 3 Modelled Edward offtake flows from Bigmod
Gulpa Offtake + 3 Modelled Gulpa offtake flows from Bigmod
Broken Creek Inflows - 4 Modelled inflows from Bigmod
Goulburn River Inflows - 4 Modelled inflows from Bigmod
National Channel Orders + 6 National Channel Diversions from Bigmod
Loss Yarrawonga - Torrumbarry
+ 6 Loss (evap loss + short evap) for Yarrawonga to Torrumbarry, plus monthly Yarrawonga to Torrumbarry PD demands (restricted for channel capacity) plus Victorian shortfalls due to channel capacity all from MSM. Disaggregated based on a calibrated daily pattern from PRIDE.
Pental Island Orders + 9 Pental Island pumps diversions from Bigmod.
Leiwah inflows - 9 Modelled inflows from Bigmod
Stoney inflow - 9 Modelled inflows from Bigmod
Swan Hill Orders + 10 Calculated as 0.745 times Channel 9 diversions (from Bigmod)
Balranald Inflow - 11 Modelled inflows from Bigmod
Loss Torrumbarry – Wakool Junction
+ 14 Loss (evap loss + short evap) for Torrumbarry to Wakool Junction, plus monthly Torrumbarry to Wakool Junction PD demands (restricted for channel capacity) all from MSM. Disaggregated based on a calibrated daily pattern from PRIDE.
Loss Wakool Junction to Euston
+ 14 Assumed to be 40% of loss from Wakool Junction to Wentworth

Barmah Choke Study – Individual Option Phase
SINCLAIR KNIGHT MERZ PAGE 210
Component Contribution to Flow at
Yarrawonga (+
ve or –
ve)
Lag (days in
advance)
Model Component Used
Required flow at Euston + 14 Minimum of Sunraysia diversions (4 days in advance from MSM2Big) and the sum of Sunraysia diversions (4 days in advance) plus Loss Euston to Wentworth (60% of loss Wakool Junction to Wentworth) plus required flow at Wentworth (minimum of zero).
Required flow at Wentworth
+ 14 Loss Wentworth to Rufus River plus 250 (minimum Lake Victoria inflow), plus the maximum of SA regulated flow less Lake Victoria outlet flow (2 days in advance) and 400 (minimum flow at Lock 7) less flow at Burtundy if Lake Victoria is able to supply the SA regulated flow or the maximum possible flow otherwise* if Lake Victoria is unable to supply the SA regulated flow.
*- Maximum possible flow (at Burtundy) equals minimum flow at Weir 32 if the Menindee Lakes are under
NSW control or otherwise the sum of the release capacity from Wetherell, Pamamarro and Menindee less
loss from Weir 32 to Burtundy.
Table C- 2: Calculation of required flow at downstream Hume Reservoir.
Component Contribution to Flow at
Hume
(+ve
or –ve
)
Lag (days in
advance)
Model Component Used
Wangaratta Flow - 1 Modelled inflows from Bigmod
Mulwala Canal Order + 2 Modelled demands from Bigmod
Yarrawonga Main
Channel Order
+ 2 Modelled demands from Bigmod
Loss Doctors Point to
Yarrawonga
+ 3 Loss (evap loss + short evap) for Doctors Point to
Yarrawonga, plus monthly Doctors Point to
Yarrawonga PD demands (restricted for channel
capacity) all from MSM. Disaggregated based on a
calibrated daily pattern from PRIDE.
Required flow at
downstream Yarrawonga
Weir
+ 3 Calculated as per Table C- 1
The resulting shortfalls from the above calculations can be classified by two ways: by the extent to
which operators may be able to manage (avoid) the event and by the type (or cause) of the event.
For the purposes of the Barmah Choke Study manageability was based on the average magnitude
(volume per day) and duration of the event, with manageability thresholds based on advice from

Barmah Choke Study – Individual Option Phase
SINCLAIR KNIGHT MERZ PAGE 211
MDBA river operators. Other factors also contribute to the manageability of a shortfall event such
event timing and peak magnitude.
Shortfalls of short duration and low magnitude are classified as expected to be manageable.
Shortfalls of either short duration or low magnitude are classified as challenging to manage.
Shortfalls of long duration and high magnitude are classified as more difficult to manage.
There is generally considered to be two broad types (related to cause) of shortfalls. The first type
(type I) is peak demand shortfalls. Peak demand shortfalls are typically short duration events in the
mid-reaches of the river between Barmah Choke and the Darling River of Lake Victoria due to
insufficient channel capacity to meet peak irrigation demands. This type of shortfall event is more
likely to be classified as manageable, however the average magnitude of such an event can be very
large, which may make the event challenging to manage.
This type of event may lead to outcomes such as rationing of demands in Torrumbarry and
Sunraysia. To manage this type of shortfall event, options focused on enabling rapid, short-term
responses may be appropriate. This includes mid-river storage options and policy options which
increase operational flexibility.
The second type (type II) of shortfalls is lower system storage shortfalls. Lower system storage
shortfalls are typically long in duration affecting the whole River Murray System downstream of
the Barmah Choke (through to South Australia) due to limited resources in Lake Victoria and the
Menindee Lakes (and insufficient channel capacity to implement bulk transfers to Lake Victoria).
This type of shortfall event is more likely to be classified as challenging or more difficult to
manage due to the typically long duration of the event. These events also tend to have a large
average magnitude.
This type of event may lead to outcomes such as rationing of demands along the entire River
Murray System downstream of the Barmah Choke including supply to South Australia. To manage
this type of event, options focused on enabling long-term increased flexibility may be appropriate.
This includes options to enhance existing bypass capacity and policy options such as modifying the
Hume to Lake Victoria transfer rules.
The final indicator matrix, which summarises total shortfalls as well as shortfall manageability and
shortfall type, is shown in Table C- 3.

Barmah Choke Study – Individual Option Phase
SINCLAIR KNIGHT MERZ PAGE 212
Table C- 3: Shortfalls based on flow downstream of Yarrawonga Weir.
Duration Average Magnitude (ML/day) Total by Duration
< 1,000 ML/day 1,001 –
1,500 ML/day
> 1,500 ML/day
1 – 5 days
6 – 10 days
11 – 15 days
> 15 days
Total by magnitude
Shortfalls which are expected to be manageable
Number (total)
Number (type I- peak demand)
Number (type II- lower system storage)
Average volume (GL)
Average duration (days)
Shortfalls which are expected to be challenging to manage
Number
Number (type I- peak demand)
Number (type II- lower system storage)
Average volume (GL)
Average duration (days)
Shortfalls which are expected to be more difficult to manage
Number
Number (type I- peak demand)
Number (type II- lower system storage)
Average volume (GL)
Average duration (days)
Total shortfalls Number (total)
Number (type I- peak demand)
Number (type II- lower system storage)
C.2 Unseasonal flooding
Flows which exceed the capacity of the Barmah Choke lead to flooding of the Barmah-Millewa
Forest. The existence and health of the forest is heavily dependent on the presence of the Barmah
Choke. Whilst flooding during winter and spring is typically beneficial to the health of the forest,
unseasonal flooding (defined as flooding which occurs between December 15 and April 30
(MDBC, 2006)) can be detrimental to the health of the forest.
The natural watering regime of the Barmah-Millewa Forest saw large-volume, long-duration floods
occurring most commonly over the winter and spring period between August and November, with
a drying period over the summer months. Regulation of the River Murray System has significantly
altered the natural watering regime. River regulation has lead to a reduction in the frequency,
extent and duration of beneficial winter and spring flooding and an increase in summer flooding.
The flooding events that do occur under current conditions also tend to be shorter in duration with a
lower peak flood magnitude.
The alteration of the natural watering regime is considered to be leading to changes in the
ecological character of the forest, altering the mix and health of vegetation communities and

Barmah Choke Study – Individual Option Phase
SINCLAIR KNIGHT MERZ PAGE 213
reducing biodiversity. In particular, the reduction in beneficial winter and spring flooding is leading
to vegetation stress (particularly in the recent dry years) and is significantly affecting species
dependent on the health of the forest and winter/spring flooding (such as colonial water birds). The
increase in summer flooding is lead to the expansion of areas of River Red Gum and Giant Rush
into areas formerly covered by Moria Grass plains (such as War Plain, Steamer Plain and the
central forest plains). Other costs of the increase in summer flooding are also noted, including loss
of water and the impact of access to, and use of, the Barmah-Millewa Forest.
To assess the significance of the problem under the base case, and to determine the impact of
options on the significance of the problem, the number of years where flow exceeds the capacity of
the Barmah Choke (measured downstream of Yarrawonga Weir) is calculated
To assess unseasonal flooding a (detailed) matrix was developed which counted the number of
unseasonal flooding events by timing (month), magnitude and duration. The event magnitude was
equal to the maximum flow during the event. The event length was defined as the number of days
flow was above 10,600 ML/day (measured at downstream Yarrawonga) including any subsequent
spikes which occurred less than 7 days following the initial event. The month that the event
occurred in was defined as the month in which the peak flow occurred.
The final indicator for unseasonal flooding forms a (summary) matrix which counts the number of
years in which undesirable events occur and categorises them according to magnitude and duration.
If there is more than one unseasonal flooding event in a year then only the most sever event
(defined by magnitude) is reported.
The unseasonal flooding period is defined as between 15th December and 30
th April (MDBC,
2006). However, in MSM-Bigmod, channel capacity downstream of Yarrawonga Weir is set on a
monthly basis, resetting on the first of each month. Therefore, for modelling purposes, the
unseasonal flooding period has been defined as between 1st January and 30
th April.
It takes time for the model to reset maximum flow for the Barmah Choke capacity in December to
the Barmah Choke capacity in January. For the first few days in January flow may exceed the
capacity of the Barmah Choke as the model is adjusting. These modelling anomalies were not
counted as undesirable floods.
To ensure that beneficial events were not counted as undesirable flooding and that single events
were not double counted, the following adjustments were also made:
Flows which represent the tail end or start of a beneficial flood event were excluded from the
period of analysis, recognising that undesirable flooding which extends beneficial floods can
be beneficial.

Barmah Choke Study – Individual Option Phase
SINCLAIR KNIGHT MERZ PAGE 214
Flow spikes which occurred up to 7 days after (or before) a beneficial event were excluded
from the period of analysis, as flood events less than or equal to 7 days apart were not
considered independent.
From the total number of years of unseasonal flooding, three useful indicators are considered:
the number of years of moderate flooding
the number of years of more severe flooding
proportion of wet years for each side of the forest
The calculation of the number of years of moderate or more severe flooding are based on key
vegetation thresholds. The critical flow threshold at which Moira Grass plains begin to be
significantly impact is estimated to be 11,000 ML/day. Flows between 11,000 ML/day and
15,000 ML/day significantly affect Moira Grass, while flows greater than 15,000 ML/day also
affect River Red Gums. Based on these thresholds, years with unseasonal flooding events which
peak between 11,000 ML/day and 15,000 ML/day are classified as years of moderate flooding
while years with unseasonal flooding events which peak high than 15,000 ML/day are classified as
years of more severe flooding.
The calculation of the proportion of wet years for each side of the forest is based on key regulation
thresholds. For flood events which peak below 15,000 ML/day forest regulators can be used to
control flooding to one side of the forest. Such events are shared alternately between the Barmah
Forest (Victoria) and the Millewa Forest (NSW) on an annual basis. For flood events which peak
between 15,000 ML/day and 18,000 ML/day regulators can be used to maintain some control over
flows, however it is expected that both sides of the forest will be flooded. For flood events which
peak higher than 18,000 ML/day all regulators are opened and extensive flooding would be
expected on both sides of the forest. Based on these thresholds, the proportion of wet years for each
side of the forest was defined as:
𝑃𝑟𝑜𝑝𝑜𝑟𝑡𝑖𝑜𝑛 𝑜𝑓 𝑤𝑒𝑡 𝑦𝑒𝑎𝑟𝑠 =
𝑌𝑒𝑎𝑟𝑠 𝑓𝑙𝑜𝑤 > 11,000 & < 15,0002 + 𝑌𝑒𝑎𝑟𝑠 𝑓𝑙𝑜𝑤 > 15,000
𝑁𝑜 𝑜𝑓 𝑌𝑒𝑎𝑟𝑠
The final unseasonal flooding indicator is shown in Table C- 4.

Barmah Choke Study – Individual Option Phase
SINCLAIR KNIGHT MERZ PAGE 215
Table C- 4: Unseasonal flooding of the Barmah-Millewa Forest.
Duration Flow (ML/day) Total by
Duration 10,601 –
11,000
11,001 –
13,000
13,001 –
15,000
15,001 –
18,000
>18,000
0-2 days
3-7 days
>7 days
Total by Flow
Total years of unseasonal flooding
Total years of moderate unseasonal flooding
Total years of more severe unseasonal flooding
Proportion of wet years for each side of the forest
C.3 Quantifying change to Barmah Forest watering
An important indicator of option performance is the reduction in the number of years each side of
the Barmah-Millewa Forest experiences undesirable flooding. This section provides additional
detail relating to the evaluation of options in terms of their impact on the ecology of the Barmah-
Millewa Forest.
Changes to Barmah forest watering
Evaluations are often made by comparing the forest under some scenario with what it would have
been like under „natural‟ conditions. For this area there is the question of what is the „natural‟
forest? Traditionally, „natural‟ would be defined as the forest as found by Europeans and formed by
flooding typified in data prior to 1934, which represents pre-Hume Dam operation. However there
has been over seventy years of river management since then and many areas of the forest have
„moved‟ towards a new hydro-ecological state that reflects such changes. Typically these will be
most marked at the wetter end of the spectrum (the drier end of the spectrum does not have the
„biological energy‟ necessary to make rapid changes). We propose that all assessments present
information in terms of deviation from the „existing condition‟ as defined by Option 1.
Quantifying change
The potential influences of the different options on the Barmah-Millewa Forest are diverse but the
most relevant and detectable changes are found in the flow hydrographs in the December to March
period. These flow hydrographs are an output of option modelling.
In this period there is a conscious attempt by river operators to manage flow to keep it at or close to
the limit of channel capacity of the Barmah Choke. Flow deviations above this limit lead to
incursions of water into the forests on either side of the river. The exact penetration of these will
depend on many factors including the setting of regulators, the rate of rise of the river, and the
magnitude of river flows. However forest flooding as a function of river flow is predictable and
consistent along the length of the River Murray through the Barmah-Millewa forest.

Barmah Choke Study – Individual Option Phase
SINCLAIR KNIGHT MERZ PAGE 216
For flows above channel capacity (10,600 ML/d downstream Yarrawonga) water that “spills” into
the forest carries with it a number of consequences. First in comparison with the pre-regulation
period (as defined by the „modelled natural‟ case), there would be few occasions when any such
flooding occurred during this December to March period. Thus, from this point of view such
summertime water penetration is undesirable.
However, the forest ecosystem has already been modified by seventy years of occasional water
penetration so the forest ecology is likely to have adjusted to these conditions to some extent.
In general, the flows that exceed the capacity of the Barmah Choke in this period are not very large
by River Murray flood standards. This means that they do not penetrate far into the forest. Further,
their penetration is usually into areas that have frequently had such flows in the past (since
regulation began). Thus some of the adverse effects on ecosystems in those areas frequently
flooded may have already occurred.
Changes caused by undesirable flooding can be viewed as having an initial impact and an ongoing
influence. Examples include:
Death of red gum trees or small stands of trees in the lowest areas of the forest. This was
reported soon after river regulation was made possible by the construction of Hume Dam.
Although major changes in flow associated with new works or management regimes may
cause this again, most areas that would be very susceptible have already changed. In general,
visible evidence of such change was removed many decades ago (Figure C- 1).
Changes in various ecosystems in complex ways. The most expected or visible would include
favouring of red gum over grass on grass plains (e.g. Bren et al., 1987; Bren, 2005), and
favouring of reeds or rushes over grass plains. There would also be changes in the flora and
fauna of ponds and effluent channels in the river. This would be expected to encompass
species at all levels, from bacterial slimes (e.g. Robertson et al. 2000), to macrophytes, to fish
species. However, as in the above case it is likely that such changes may have already occurred
i.e. the on-going influence of undesirable flooding is small compared to the initial impact.
Alterations to forest access for forest workers and managers, river operation workers and
visitors. The major access roads tend to be constructed on „high ground‟ or have bridges or
other works allowing traffic movement. However, minor roads become „cut‟ by flowing water,
which can decrease the amenity of the forest for visitors and impose costs on forest managers.
„Black water events‟: In these, water enters the forest and re-emerges into the main channel.
The water achieves a loading of tannins and other polyphenolics and organic compounds from
the forest litter. This removes oxygen from the water. The result can be fish kills and emersion
of aquatic species that can survive outside the water for short periods. Howitt et. al., (2005,
2007) show that „pooled floods‟ at the warmest months of the year are substantially more
likely to result in blackwater events.

Barmah Choke Study – Individual Option Phase
SINCLAIR KNIGHT MERZ PAGE 217
Occasional bird-breeding episodes. Late recession of spring floods plus other small floods can
lead to delayed bird-breeding events. These can be positive but also present a management
dilemma as they present the choice of withdrawing water, leading to death of the hatchlings or,
alternatively, modifying river flows to sustain an „unnatural‟ event which results in more water
loss (Water Technology, 2006)
Figure C- 1: Comparison of the forest-grass edge of an area of moira-grass plain in 1947
(left) and 1984 (right). Colonisation by red gums can be clearly seen. „Restoring‟ natural flows may instigate another change that could be perceived as damaging the current forest ecosystem. Photographs courtesy of the then Department of Property and Services of the Victorian Government (Bren, 2005).
A Method for Quantifying Change
The discussion above suggests that assessing option performance soley in terms of the change in
„the number of years each side of the forest experiences undesirable flooding‟ may be too
simplistic. Instead we also quantified the proportion of the forest that is flooded for each option.
Quantifying the proportion of the forest that is flooded
Forest flooding can be quantified by using the relationship developed by Bren et. al., (1987):

Barmah Choke Study – Individual Option Phase
SINCLAIR KNIGHT MERZ PAGE 218
P% = -435.40 + 47.60 ln(Qp) Qp < 68,500 ML/d (1)
P% = 93.5 Qp > 68,500 ML/d
Where, where P% is the percentage of the forest inundated and Qp (ML/d) is the maximum daily
flow at Tocumwal during the period of inundation. Flows at Tocumwal are available from option
modelling.
Forest flooding is of particular concern above about 10,600 ML/d, below this flow, floods can be
retained in less ecologically significant areas of the forest. Substituting 10,600 ML/d into equation
1 suggests that 5.8% of the forest will be flooded at this flow.
Therefore, considering only that part of the forest flooded above 10,600 ML/d, the P value was
calculated as follows.
P=-435.40+47.60ln(Qp)-5.78 (2)
If P <0, P=0.
Calculation method
For each year in the modelling period (1895-2009) the following steps were undertaken:
1) Calculate the peak flow that occurs in the period Jan + Feb + Mar for each year for each option
2) Calculate the undesirable % of the forest based on equation 2
3) Based on all 115 P values for each option, draw a box plot that compares each option i.e. one
box for each option. The results are shown in Appendix D.
Future work: impacts on plant communities
As an additional project, the method described above could be expanded to assess the impacts on
plant communities. Flow limits are available for various plant communities (Bren pers. comm.) so
the change in flooding of these communities could be calculated in a similar way to estimate
changes in the percentage of forest flooded described above. Thus impacts on particular
communities could be described in quantitative terms.
Plant communities are grouped into vegetation alliances that relate to flooding frequency as shown
in Table C- 5. For each option it would be possible to comment on the likely expansion or
contraction of these plant communities. This would use the limits of flooding for the various
communities as determined by a body of work on the hydro-ecology of the forest (e.g. Roberts and
Marson 2000).

Barmah Choke Study – Individual Option Phase
SINCLAIR KNIGHT MERZ PAGE 219
Table C- 5: Vegetation alliance as related to flood frequency class (Bren, 2005).
Flood frequency class
Vegetation Alliance
Approximate flooding frequency n in 22 years
Percentage of forest area (current conditions)
Very high Giant rush 16-19 1.8
High Moira grass
Red gum and moira grass
Red gum regeneration on plains
15-18 23.4
Moderate Red gum in conjunction with sedge, warrego grass, wallaby grass, and swamp wallaby grass in various combinations
12-16 57.7
Low Red gum & introductions
Red gum, wallaby grass and spike rush
Yellow box and black box woodlands
6-10 17.1
C.4 Other project specific indicators
This section briefly outlines the development and calculation of each of the indicators developed as
a part of the Investigation Phase. Further information on the development and calculation of each
of these indicators is provided in SKM (2009).
Forest losses
Barmah-Millewa forest losses are modelled in MSM-Bigmod as part of total losses in the reach
from Yarrawonga to Barmah. The variable “BARMILL” sums the majority of losses in the reach
from Yarrawonga to Barmah; however flow out to Barmah Lake is not included and must be added
separately.
Not all of the losses within the “BARMILL” variable are associated with overbank flooding
through the Barmah-Millewa forest. Part of objective one is to reduce losses in the Barmah-
Millewa Forest. The loss variables from “BARMILL” associated with overbank flooding were
assumed to be:
BARMAH FOREST (FI 129)
LOSSES IN FORESTS (BR 3)
OVERBANK FLOW THROUGH BARMAH (FI 19)
Losses through the Millewa, Tuppal and Bullatale systems (LS 44, 45, 46)
Whilst these variables are close to the magnitude of Barmah-Millewa Forest losses, the amount of
data available to calibrate these individual loss terms is small and at times anecdotal or based on
feedback from local staff. As such, uncertainty around individual components is expected to be
large. The confidence associated with total losses in the river reach from Yarrawonga to Barmah is
much higher as calibration is supported by the long term streamflow data from gauging stations.

Barmah Choke Study – Individual Option Phase
SINCLAIR KNIGHT MERZ PAGE 220
Therefore both total losses from Yarrawonga to Barmah (BARMILL + FO 20) and the sum of the
above overbank flooding loss variables (Barmah forest losses) are considered. The indicator for this
objective is the average volume of water lost through the forest (BARMILL + FO20 and the
overbank flooding loss) over the unseasonal flooding period (December 15th to April 30
th).
Conservation of water resources
In Victoria, reliability assessment typically used announced February allocations for high and low
reliability water shares.
In NSW, it is common to report the announced allocation at October 1, the start of the irrigation
season, to assist irrigators with planting decisions. It is also common to look at the announced
allocation at April 30. The CSIRO Murray-Darling Basin Sustainable Yields Study reported the
maximum announced allocation for general security entitlements in the water years. This is almost
always the same as the April 30 allocations. For the purposes of the Barmah Choke Study, the
maximum allocation for general security entitlements has been adopted for the indicator.
The indicator results will present a table summarising key allocation thresholds for each State.
Table C- 6 shows the key allocation thresholds summary table.
Table C- 6: Key allocation thresholds summary table.
Allocation Threshold Scenario
Years with 100% allocation for general security entitlements (NSW)
Average allocation for general security entitlements (NSW)
Years with 100% allocation for high reliability water shares (Victoria)
Years with 100% allocation for low reliability water shares (Victoria)
Average allocation for high + low reliability water shares (Victoria)
Beneficial influence of the Barmah Choke
In working towards the achievement of the primary objectives, the Barmah Choke Study also aims
to:
maintain the beneficial influence of the Barmah Choke on the flooding regime of the Barmah-
Millewa Forest
identify any significant impacts on the frequency and magnitude of environmental and
unregulated flows in the River Murray System, with the aim to minimise these where possible
identify any significant impacts to other areas or to third parties, with the aim to minimise
these wherever possible
Indicators have been developed to assess the achievement of each of these aims.

Barmah Choke Study – Individual Option Phase
SINCLAIR KNIGHT MERZ PAGE 221
Maintain the beneficial influence of the Barmah Choke on the flooding regimes of the Barmah-Millewa Forest
Seasonal flooding during winter and/or spring is fundamental to the health of the Barmah-Millewa
Forest. The indicator for this objective looks at the proportion of years with small and large floods
in the Barmah-Millewa Forest and the maximum duration (in years) with no flood. Table C- 7
shows the results summary table adopted for this indicator.
Table C- 7: Beneficial flooding of the Barmah-Millewa Forest summary table.
Barmah-Millewa Forest flooding indicator Scenario
% of years with a medium/large flood of 25,000 ML/day at Yarrawonga
for >= 3 months
Maximum duration with no medium/large flood (years)
% of years with a small flood of 18,000 ML/day at Yarrawonga for >= 3
months.
Maximum duration with no small flood (years)
Identify and significant impacts on the frequency and magnitude of environmental and unregulated flows in the River Murray System
Seasonal flooding and unregulated flows are also fundamental to the health of other locations along
the River Murray System. To measure the impact of options on environmental and unregulated
flows a set of indicators have been developed based on the proportions of years different magnitude
flow events occur at a range of locations along the River Murray System and the maximum
duration between flow events. Table C- 8 shows the results summary table adopted for this
indicator.
Table C- 8: Beneficial environmental and unregulated flows assessment summary table.
Location / Indicator Scenario
Koondrook/Gunbower Wetlands
% of years with a medium/large flood of 35,000 ML/day at Torrumbarry
for >= 3 months
Maximum duration with no medium/large flood (years)
% of years with a small flood of 25,000 ML/day at Torrumbarry for >= 3
months
Maximum duration with no small flood (years)
Hattah Lakes
% of years with a medium/large flood of 75,000 ML/day at Euston for
>= 1 month
Maximum duration with no medium/large flood (years)
% of years with a small flood of 45,000 ML/day at Euston for >= 3
months
Maximum duration with no small flood (years)
Chowilla/Lindsay-Wallpolla

Barmah Choke Study – Individual Option Phase
SINCLAIR KNIGHT MERZ PAGE 222
Location / Indicator Scenario
Koondrook/Gunbower Wetlands
% of years with a medium/large flood of 80,000 ML/day at the SA
border for >= 3 months
Maximum duration with no medium/large flood (years)
% of years with a small flood of 50,000 ML/day at the SA border for >=
3 months
Maximum duration with no small flood (years)
Unregulated Flows
Average flow to SA in excess of entitlement (GL/year)
% of years where flows to SA <1,850 GL/year
Third party or other area impacts: maintain water levels in Lake Victoria and the Menindee Lakes for cultural heritage reasons
Lake Victoria
Lake Victoria is a significant cultural and heritage area for Indigenous Australians. Artefacts of
indigenous heritage around the Lake include burial grounds, shell middens, fireplaces and stone
artefacts. Foreshore vegetation is essential for the stabilisation of the Lake foreshore and protection
of indigenous heritage artefacts.
The Lake Victoria operating strategy (MDBC, 2002) was developed with consideration for the
foreshore vegetation and the protection of indigenous heritage artefacts. The operating strategy
includes a range of target storage levels along with a number of conditional rules which dictate
alternative targets during periods of particularly high or low system storage.
To assess the (cultural heritage) impact of options on Lake Victoria, indicators were developed to
check compliance with the operating strategy (including the conditional rules). Table C- 9 shows
the results table adopted for this indicator.
Table C- 9: Compliance with the Lake Victoria operating strategy summary table.
Indicator Scenario
Compliance
with the target
Proportion of time target not
applied due to Conditional Rules
% of years Lake Victoria level on the last day
of February meets the target (≤25.5 m AHD)
% of years Lake Victoria level on the last day
of March meets the target (≤25.6 m AHD)
% of years Lake Victoria level on the last day
of April meets the target (≤24.5 m AHD)
% of time (days) where lake level is > 24.5 m
AHD in May (target = minimal)

Barmah Choke Study – Individual Option Phase
SINCLAIR KNIGHT MERZ PAGE 223
Indicator Scenario
Compliance
with the target
Proportion of time target not
applied due to Conditional Rules
% of time (days) during winter and spring
where lake level is ≥27.0 m AHD (target =
minimal)
Menindee Lakes
The Menindee Lakes are also a significant cultural heritage area for Indigenous Australia with
similar artefacts and threats as Lake Victoria. The operation of Lake Victoria does not explicitly
consider cultural and heritage issues, however a „Consent to Destroy‟ authorisation is required to
exceed the maximum surcharge level in either Lake Menindee or Lake Cawndilla (60.45 m AHD).
An appropriate indicator would be the number of events where lake volume exceeds the maximum
surcharge volume in Lake Menindee or Lake Cawndilla. Rules within the current model prevent
modelled volumes in Lake Menindee or Lake Cawndilla exceeding the maximum surcharge
volume. As such, the model results will never be in violation of this requirement. Additionally,
none of the proposed options would be expected to impact on the Menindee Lakes. As such, this
indicator does not need to be assessed.
Third party or other area impacts: avoid undesirable flooding of the Werai Forest
The Edward River has an in-stream capacity of 2,700 ML/day downstream of Steven‟s Weir. Flows
greater than this will flood the Werai Forest, which is undesirable over the unseasonal flooding
period (15th December to 30
th April). To assess the impact of options, an undesirable flooding
indicator, similar to that for the Barmah-Millewa Forest, has been developed.
Table C- 10 shows the undesirable flooding assessment summary table, with floods classified by
magnitude and duration.
Table C- 10: Undesirable flooding summary matrix.
Duration Flow (ML/day) Total by
Duration 2,701 –
3,100
3,101 –
3,500
3,501 –
4,000
4,001 –
4,500
>4,500
0-2 days
3-7 days
>7 days
Total by Flow
Total years of unseasonal flooding
Total number of years
Total number of events

Barmah Choke Study – Individual Option Phase
SINCLAIR KNIGHT MERZ PAGE 224
Third party or other area impacts: avoid undesirable exceedance of 25,000 ML/day downstream of Hume Reservoir
The bankfull capacity of the River Murray between Hume and Yarrawonga Weir is
25,000 ML/day. Exceedence of this capacity from 1 January to 30 April is undesirable. To assess
this, the number of years the maximum flow during this period exceeded 25,000 ML/day were
counted, based on flow at Doctor‟s Point. Note, declining flow periods exceeding 25,000 ML/day
from January 1st were eliminated to allow for model adjustment
Table C- 11 shows the results summary table for this indicator.
Table C- 11: Undesirable Exceedances of 25,000 ML/day downstream of Hume Reservoir.
Scenario Years Capacity Exceeded (Jan – Apr)
Number of Years % of Years
Third party or other area impacts: avoid undesirable exceedance of the capacity of the Edward River offtake
The operating capacity of the Edward River offtake was 2,000 ML/day, however this has been
reduced in recent years to 1,600 ML/day to address concern about damage to the forest due to high
water levels. Exceedence of this capacity from 1 January to 30 April is undesirable. To assess this,
the number of years the maximum flow during this period exceeded 1,600 ML/day were counted.
Note, declining flow periods exceeding 1,600 ML/day from January 1st were eliminated to allow
for model adjustment
Table C- 12 shows the results summary table for this indicator.
Table C- 12: Undesirable Exceedances of Edward River offtake capacity (1,600 ML/day).
Scenario Years Capacity Exceeded (Jan – Apr)
Number of Years % of Years
Third party or other area impacts: avoid undesirable exceedance of the capacity of the Gulpa River offtake
The operating capacity of the Gulpa River offtake is 350 ML/day. Exceedence of this capacity from
1 January to 30 April is undesirable. To assess this, the number of years the maximum flow during
this period exceeded 350 ML/day were counted. Note, declining flow periods exceeding 350
ML/day from January 1st were eliminated to allow for model adjustment
Table C- 13 shows the results summary table for this indicator.
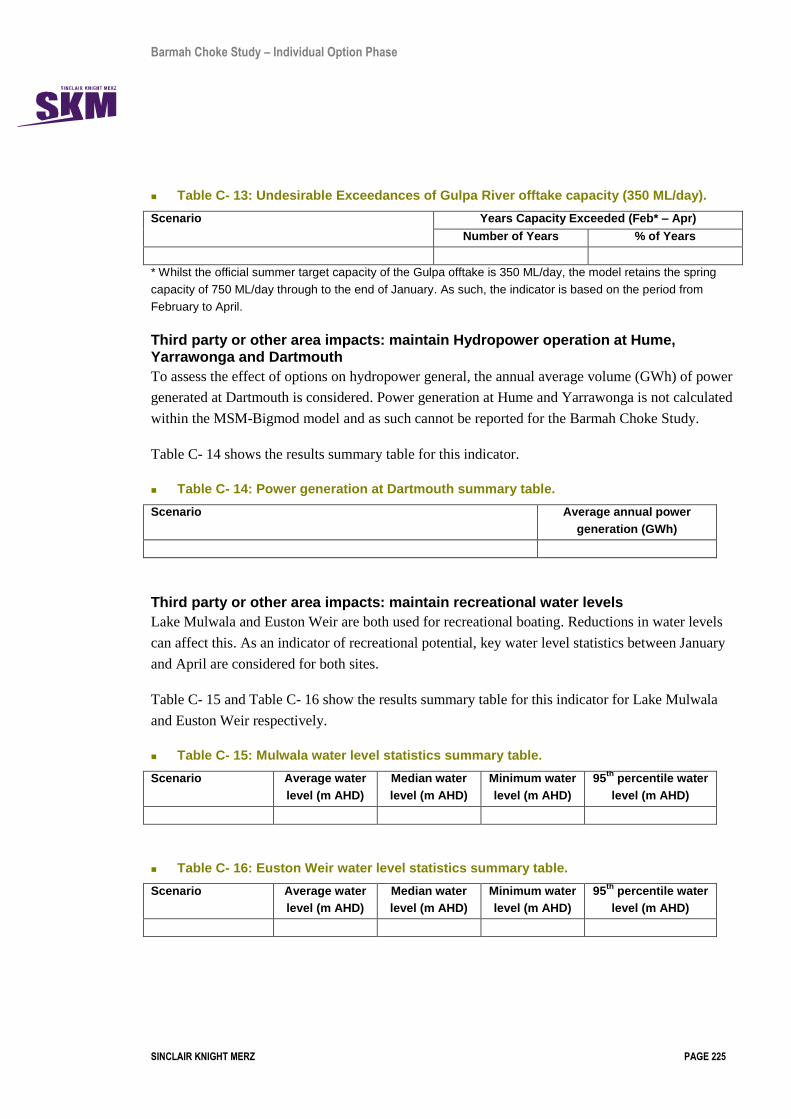
Barmah Choke Study – Individual Option Phase
SINCLAIR KNIGHT MERZ PAGE 225
Table C- 13: Undesirable Exceedances of Gulpa River offtake capacity (350 ML/day).
Scenario Years Capacity Exceeded (Feb* – Apr)
Number of Years % of Years
* Whilst the official summer target capacity of the Gulpa offtake is 350 ML/day, the model retains the spring
capacity of 750 ML/day through to the end of January. As such, the indicator is based on the period from
February to April.
Third party or other area impacts: maintain Hydropower operation at Hume, Yarrawonga and Dartmouth
To assess the effect of options on hydropower general, the annual average volume (GWh) of power
generated at Dartmouth is considered. Power generation at Hume and Yarrawonga is not calculated
within the MSM-Bigmod model and as such cannot be reported for the Barmah Choke Study.
Table C- 14 shows the results summary table for this indicator.
Table C- 14: Power generation at Dartmouth summary table.
Scenario Average annual power
generation (GWh)
Third party or other area impacts: maintain recreational water levels
Lake Mulwala and Euston Weir are both used for recreational boating. Reductions in water levels
can affect this. As an indicator of recreational potential, key water level statistics between January
and April are considered for both sites.
Table C- 15 and Table C- 16 show the results summary table for this indicator for Lake Mulwala
and Euston Weir respectively.
Table C- 15: Mulwala water level statistics summary table.
Scenario Average water
level (m AHD)
Median water
level (m AHD)
Minimum water
level (m AHD)
95th
percentile water
level (m AHD)
Table C- 16: Euston Weir water level statistics summary table.
Scenario Average water
level (m AHD)
Median water
level (m AHD)
Minimum water
level (m AHD)
95th
percentile water
level (m AHD)

Barmah Choke Study – Individual Option Phase
SINCLAIR KNIGHT MERZ PAGE 226
C.5 MDBA standard indicators
Table C- 17 summarises the MDBA standard hydrological indicators that will be used for the
Individual Options Phase of the Barmah Choke Study. These indicators cover a range of the key
hydrological characteristics of the River Murray System including allocations, diversions, flows,
storage and salinity.
Further detail about each of the indicators is provided in MDBA (2010a).
Table C- 17: MDBA standard hydrological indicators for the Barmah Choke Study.
Indicator Unit
NSW Allocations
Percentage of years NSW Murray high security allocations <100% (Jun) %
Mean NSW Murray high security allocation (Jun) GL/year
Mean NSW Murray general security allocation (Nov) GL/year
Mean NSW Lower Darling general security allocation (Nov) GL/year
Victoria Allocations
Percentage of years Victorian high reliability water share <100% (Feb) %
Mean Victoria high reliability water share (Feb) GL/year
Minimum Victorian high reliability water share (Feb) GL/year
Percentage of years Victorian low reliability water share <100% (Feb) %
Mean Victorian low reliability water share (Feb) GL/year
South Australia‟s Entitlement Flows
Percentage of years SA entitlement restricted (all months)
Maximum annual SA restriction (all months) GL/year
Mean annual SA restriction (all months) GL/year
Minimum annual SA flow (all months) GL/year
NSW Diversions
Mean annual NSW Murray diversion (all months) GL/year
Minimum annual NSW Murray diversion (all months) GL/year
Mean annual NSW Lower Darling diversion (all months) GL/year
Minimum annual NSW Lower Darling diversion (all months) GL/year
Victorian Diversions
Mean annual Vic Murray diversion (all months) GL/year
Minimum annual Vic Murray diversion (all months) GL/year
South Australian Diversions
Mean annual SA Murray diversion (all months) GL/year
Minimum annual SA Murray diversion (all months) GL/year
Total Diversions
Mean annual total Murray diversion (all months) GL/year
Minimum annual total Murray diversion (all months) GL/year
General Flow Indicators
Mean annual flow downstream of Doctors Point (all months) GL/year
Mean annual flow downstream of Yarrawonga (all months) GL/year
Mean annual flow downstream of Euston (all months) GL/year
Mean annual Burtundy flow (all months) GL/year
Mean annual Darling Anabranch outflow (all months) GL/year
Mean annual flow to South Australia (all months) GL/year
Mean annual flow at Lock 1 (all months) GL/year

Barmah Choke Study – Individual Option Phase
SINCLAIR KNIGHT MERZ PAGE 227
Indicator Unit
Mean annual flow over the Barrages (all months) GL/year
Storage Indicators
Mean annual Dartmouth Reservoir loss (all months) GL/year
Mena annual Hume Reservoir loss (all months) GL/year
Mean annual Lake Victoria loss (all months) GL/year
Mean annual Total Murray system loss (all months) GL/year
Mean annual Total Darling loss (all months) GL/year
Mean annual Dartmouth Reservoir spill (all months) GL/year
Mean annual Hume Reservoir spill (all months) GL/year
Mean annual Lake Victoria spill (all months) GL/year
Level Indicators
Mean Lower Lakes level (all months) mAHD
Minimum Lower Lakes level (all months) mAHD
General Salinity Indicators
Mean daily Morgan salinity (all months) EC
95 percentile daily Morgan salinity (all months) EC
Mean daily Burtundy salinity (all months) EC
Mean daily Mannum salinity (all months) EC
Mean daily Murray Bridge salinity (all months) EC

Barmah Choke Study – Individual Option Phase
SINCLAIR KNIGHT MERZ PAGE 228
Appendix D Option modelling results summary
Table D- 1: Option modelling results summary- shortfalls downstream of Yarrawonga Weir.
Shortfall Types
Op
tio
n 1
Op
tio
n 2
Op
tio
n 3
a
Op
tio
n 3
b
Op
tio
n 4
a
Op
tio
n 4
b
Op
tio
n 5
a
Op
tio
n 5
b
Op
tio
n 6
a
Op
tio
n 6
b
Op
tio
n 6
c
Op
tio
n 7
a*
Op
tio
n 7
b*
Op
tio
n 7
c*
Op
tio
n 7
d*
Op
tio
n 1
0
Op
tio
n 1
1
Op
tio
n 1
2a
Op
tio
n 1
2b
Op
tio
n 1
2c
Op
tio
n 1
3
Op
tio
n 1
5
Op
tio
n 1
6a
Op
tio
n 1
6b
Op
tio
n 1
6c
Op
tio
n 1
7
Shortfalls which are expected to be manageable
Number (total) 13 14 12 13 7 5 14 15 10 5 5 13 13 13 13 13 12 9 9 8 15 8 14 12 9 4
Number (type I- peak demand) 12 12 12 13 5 4 12 13 8 3 4 12 12 12 12 12 11 9 9 8 14 7 14 12 9 3
Number (type II- lower system storage) 1 2 0 0 2 1 2 2 2 2 1 1 1 1 1 1 1 0 0 0 1 1 0 0 0 1
Average volume (GL) 2.4 2.7 2.2 2.1 1.2 1.1 2.7 2.8 2.0 0.6 0.9 2.4 2.4 2.4 2.4 2.3 2.6 3.6 3.2 3.0 2.8 1.2 2.4 2.6 3.6 0.3
Average duration (days) 3.4 3.6 3.1 2.9 2.0 1.8 3.6 3.5 2.8 1.4 1.8 3.4 3.4 3.4 3.4 3.3 3.5 4.3 3.9 3.8 3.5 1.6 3.2 3.5 4.4 1.0
Shortfalls which are expected to be challenging to manage
Number 8 7 5 5 3 3 7 6 2 4 3 8 8 8 8 8 7 7 9 10 4 2 7 7 8 4
Number (type I- peak demand) 7 7 5 5 3 3 7 6 2 4 3 7 7 7 7 7 6 6 6 7 4 2 6 6 6 4
Number (type II- lower system storage) 1 0 0 0 0 0 0 0 0 0 0 1 1 1 1 1 1 1 3 3 0 0 1 1 2 0
Average volume (GL) 8.7 9.1 10.5 6.9 17.8 14.6 9.1 10.0 2.1 15.1 14.4 8.7 8.7 8.7 8.7 8.7 9.4 8.8 10.7 11.9 5.6 2.7 8.6 9.3 16.7 14.4
Average duration (days) 8.3 8.6 9.8 4.6 2.3 2.0 8.6 9.7 1.0 3.5 2.0 8.3 8.3 8.3 8.3 8.3 10.1 8.9 13.2 14.4 4.3 1.5 8.4 10.0 17.8 3.3
Shortfalls which are expected to be more difficult to manage
Number 7 7 5 7 6 5 7 7 7 5 5 7 7 7 7 7 7 7 5 5 7 6 7 7 6 5
Number (type I- peak demand) 2 2 2 2 1 0 2 2 2 0 0 2 2 2 2 2 2 2 2 2 2 2 2 2 2 0
Number (type II- lower system storage) 5 5 3 5 5 5 5 5 5 5 5 5 5 5 5 5 5 5 3 3 5 4 5 5 4 5
Average volume (GL) 111.6 113.3 82.2 99.3 108.3 117.7 111.6 111.6 103.1 124.0 116.8 111.6 111.6 111.6 111.6 111.5 99.7 78.9 76.9 66.1 99.9 88.0 111.8 108.3 108.8 122.5
Average duration (days) 41.3 41.9 28.2 41.1 40.0 42.0 41.3 41.3 36.7 44.8 41.6 41.3 41.3 41.3 41.3 41.3 38.9 36.4 33.8 31.4 38.7 35.7 41.0 42.0 39.3 44.4
Total shortfalls
Number (total) 28 28 22 25 16 13 28 28 19 14 13 28 28 28 28 28 26 23 23 23 26 16 28 26 23 13
Number (type I- peak demand) 21 21 19 20 9 7 21 21 12 7 7 21 21 21 21 21 19 17 17 17 20 11 22 20 17 7
Number (type II- lower system storage) 7 7 3 5 7 6 7 7 7 7 6 7 7 7 7 7 7 6 6 6 6 5 6 6 6 6
*Effect on shortfalls for these options was not modelled and has been set to the values modelled for Option 1.
Table D- 2: Option modelling results summary- unseasonal flooding of the Barmah-Millewa Forest.
Unseasonal Flooding
Op
tio
n 1
Op
tio
n 2
Op
tio
n 3
a
Op
tio
n 3
b
Op
tio
n 4
a*
Op
tio
n 4
b*
Op
tio
n 5
a
Op
tio
n 5
b
Op
tio
n 6
a*
Op
tio
n 6
b*
Op
tio
n 6
c*
Op
tio
n 7
a
Op
tio
n 7
b
Op
tio
n 7
c
Op
tio
n 7
d
Op
tio
n 1
0
Op
tio
n 1
1
Op
tio
n 1
2a
Op
tio
n 1
2b
Op
tio
n 1
2c
Op
tio
n 1
3
Op
tio
n 1
5
Op
tio
n 1
6a
Op
tio
n 1
6b
Op
tio
n 1
6c
Op
tio
n 1
7*
Total years of unseasonal flooding 63 64 61 68 63 63 55 29 63 63 63 58 56 32 31 44 66 62 59 58 62 57 67 66 66 63
Total years of moderate unseasonal flooding 33 31 33 36 33 33 28 10 33 33 33 27 33 12 13 27 34 32 27 23 33 29 33 35 31 33
Total years of more severe unseasonal flooding 29 30 26 26 29 29 23 16 29 29 29 26 20 16 14 16 27 21 19 19 26 21 29 27 26 29
Proportion of wet years for each side of the forest 40% 40% 37% 39% 40% 40% 32% 18% 40% 40% 40% 35% 32% 19% 18% 26% 39% 32% 29% 27% 37% 31% 40% 39% 36% 40%
* Effect on unseasonal flooding for these options was not modelled and has been set to the values modelled for Option 1.
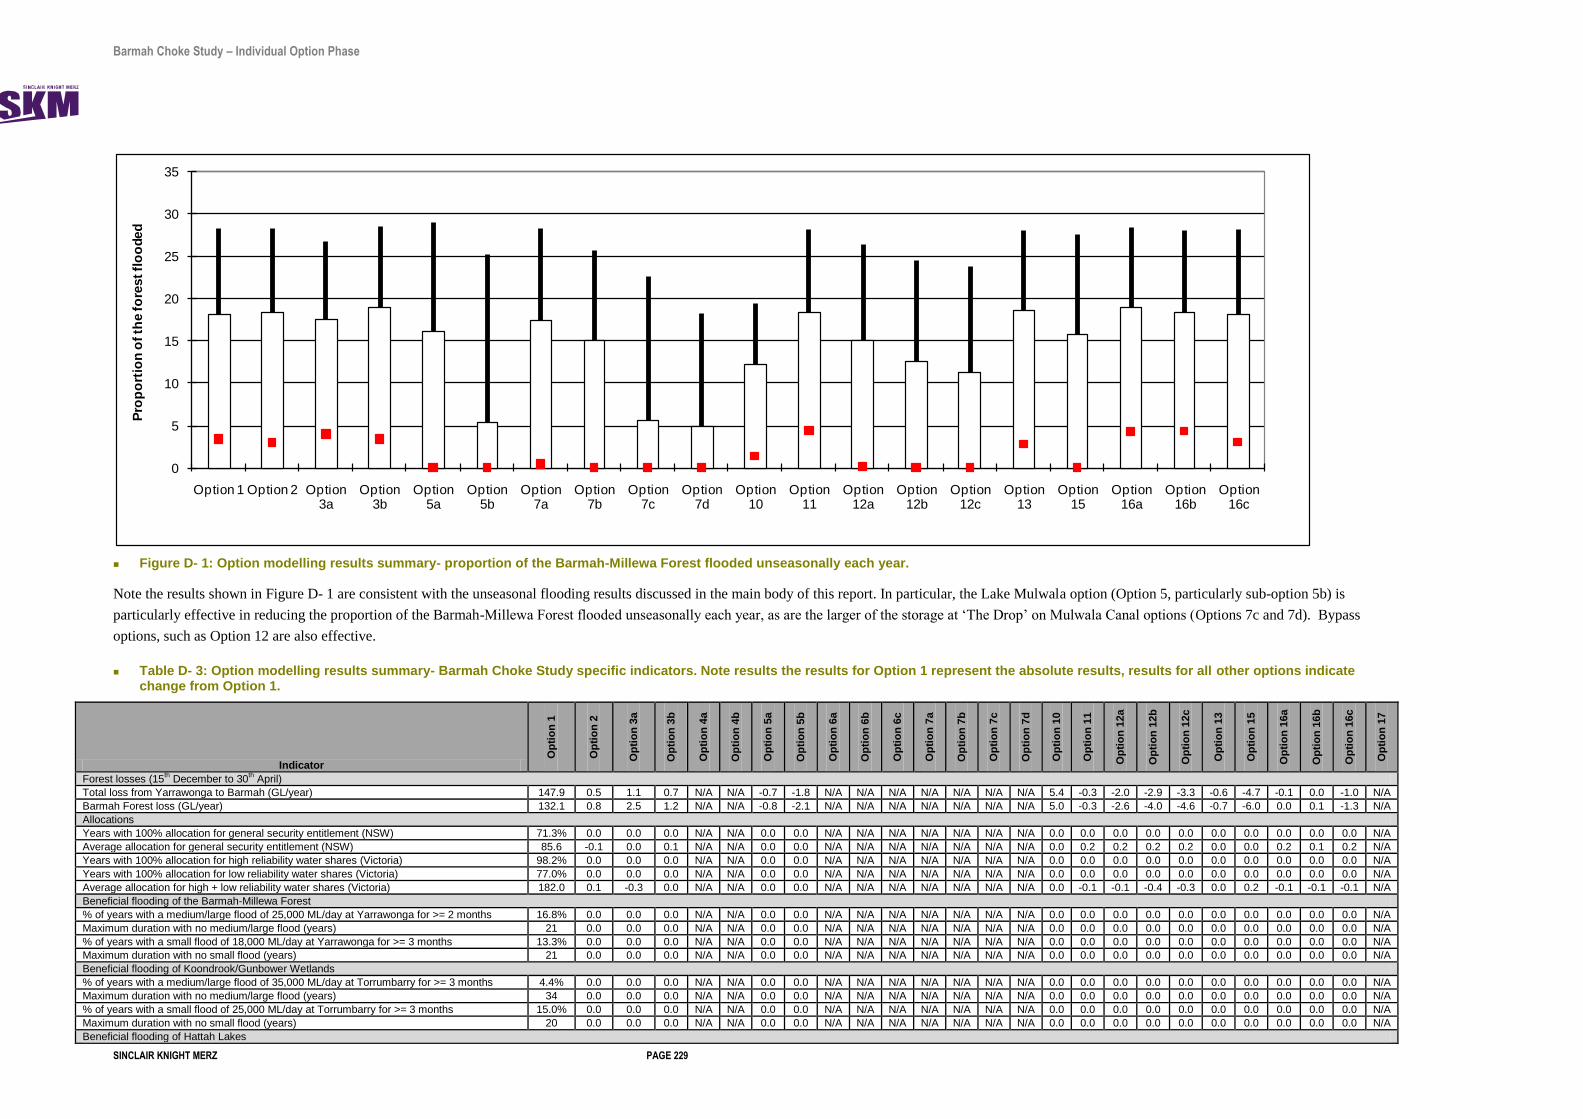
Barmah Choke Study – Individual Option Phase
SINCLAIR KNIGHT MERZ PAGE 229
Figure D- 1: Option modelling results summary- proportion of the Barmah-Millewa Forest flooded unseasonally each year.
Note the results shown in Figure D- 1 are consistent with the unseasonal flooding results discussed in the main body of this report. In particular, the Lake Mulwala option (Option 5, particularly sub-option 5b) is
particularly effective in reducing the proportion of the Barmah-Millewa Forest flooded unseasonally each year, as are the larger of the storage at „The Drop‟ on Mulwala Canal options (Options 7c and 7d). Bypass
options, such as Option 12 are also effective.
Table D- 3: Option modelling results summary- Barmah Choke Study specific indicators. Note results the results for Option 1 represent the absolute results, results for all other options indicate change from Option 1.
Indicator
Op
tio
n 1
Op
tio
n 2
Op
tio
n 3
a
Op
tio
n 3
b
Op
tio
n 4
a
Op
tio
n 4
b
Op
tio
n 5
a
Op
tio
n 5
b
Op
tio
n 6
a
Op
tio
n 6
b
Op
tio
n 6
c
Op
tio
n 7
a
Op
tio
n 7
b
Op
tio
n 7
c
Op
tio
n 7
d
Op
tio
n 1
0
Op
tio
n 1
1
Op
tio
n 1
2a
Op
tio
n 1
2b
Op
tio
n 1
2c
Op
tio
n 1
3
Op
tio
n 1
5
Op
tio
n 1
6a
Op
tio
n 1
6b
Op
tio
n 1
6c
Op
tio
n 1
7
Forest losses (15th December to 30
th April)
Total loss from Yarrawonga to Barmah (GL/year) 147.9 0.5 1.1 0.7 N/A N/A -0.7 -1.8 N/A N/A N/A N/A N/A N/A N/A 5.4 -0.3 -2.0 -2.9 -3.3 -0.6 -4.7 -0.1 0.0 -1.0 N/A
Barmah Forest loss (GL/year) 132.1 0.8 2.5 1.2 N/A N/A -0.8 -2.1 N/A N/A N/A N/A N/A N/A N/A 5.0 -0.3 -2.6 -4.0 -4.6 -0.7 -6.0 0.0 0.1 -1.3 N/A
Allocations
Years with 100% allocation for general security entitlement (NSW) 71.3% 0.0 0.0 0.0 N/A N/A 0.0 0.0 N/A N/A N/A N/A N/A N/A N/A 0.0 0.0 0.0 0.0 0.0 0.0 0.0 0.0 0.0 0.0 N/A
Average allocation for general security entitlement (NSW) 85.6 -0.1 0.0 0.1 N/A N/A 0.0 0.0 N/A N/A N/A N/A N/A N/A N/A 0.0 0.2 0.2 0.2 0.2 0.0 0.0 0.2 0.1 0.2 N/A
Years with 100% allocation for high reliability water shares (Victoria) 98.2% 0.0 0.0 0.0 N/A N/A 0.0 0.0 N/A N/A N/A N/A N/A N/A N/A 0.0 0.0 0.0 0.0 0.0 0.0 0.0 0.0 0.0 0.0 N/A
Years with 100% allocation for low reliability water shares (Victoria) 77.0% 0.0 0.0 0.0 N/A N/A 0.0 0.0 N/A N/A N/A N/A N/A N/A N/A 0.0 0.0 0.0 0.0 0.0 0.0 0.0 0.0 0.0 0.0 N/A
Average allocation for high + low reliability water shares (Victoria) 182.0 0.1 -0.3 0.0 N/A N/A 0.0 0.0 N/A N/A N/A N/A N/A N/A N/A 0.0 -0.1 -0.1 -0.4 -0.3 0.0 0.2 -0.1 -0.1 -0.1 N/A
Beneficial flooding of the Barmah-Millewa Forest
% of years with a medium/large flood of 25,000 ML/day at Yarrawonga for >= 2 months 16.8% 0.0 0.0 0.0 N/A N/A 0.0 0.0 N/A N/A N/A N/A N/A N/A N/A 0.0 0.0 0.0 0.0 0.0 0.0 0.0 0.0 0.0 0.0 N/A
Maximum duration with no medium/large flood (years) 21 0.0 0.0 0.0 N/A N/A 0.0 0.0 N/A N/A N/A N/A N/A N/A N/A 0.0 0.0 0.0 0.0 0.0 0.0 0.0 0.0 0.0 0.0 N/A
% of years with a small flood of 18,000 ML/day at Yarrawonga for >= 3 months 13.3% 0.0 0.0 0.0 N/A N/A 0.0 0.0 N/A N/A N/A N/A N/A N/A N/A 0.0 0.0 0.0 0.0 0.0 0.0 0.0 0.0 0.0 0.0 N/A
Maximum duration with no small flood (years) 21 0.0 0.0 0.0 N/A N/A 0.0 0.0 N/A N/A N/A N/A N/A N/A N/A 0.0 0.0 0.0 0.0 0.0 0.0 0.0 0.0 0.0 0.0 N/A
Beneficial flooding of Koondrook/Gunbower Wetlands
% of years with a medium/large flood of 35,000 ML/day at Torrumbarry for >= 3 months 4.4% 0.0 0.0 0.0 N/A N/A 0.0 0.0 N/A N/A N/A N/A N/A N/A N/A 0.0 0.0 0.0 0.0 0.0 0.0 0.0 0.0 0.0 0.0 N/A
Maximum duration with no medium/large flood (years) 34 0.0 0.0 0.0 N/A N/A 0.0 0.0 N/A N/A N/A N/A N/A N/A N/A 0.0 0.0 0.0 0.0 0.0 0.0 0.0 0.0 0.0 0.0 N/A
% of years with a small flood of 25,000 ML/day at Torrumbarry for >= 3 months 15.0% 0.0 0.0 0.0 N/A N/A 0.0 0.0 N/A N/A N/A N/A N/A N/A N/A 0.0 0.0 0.0 0.0 0.0 0.0 0.0 0.0 0.0 0.0 N/A
Maximum duration with no small flood (years) 20 0.0 0.0 0.0 N/A N/A 0.0 0.0 N/A N/A N/A N/A N/A N/A N/A 0.0 0.0 0.0 0.0 0.0 0.0 0.0 0.0 0.0 0.0 N/A
Beneficial flooding of Hattah Lakes
0
5
10
15
20
25
30
35
Option 1 Option 2 Option 3a
Option 3b
Option 5a
Option 5b
Option 7a
Option 7b
Option 7c
Option 7d
Option 10
Option 11
Option 12a
Option 12b
Option 12c
Option 13
Option 15
Option 16a
Option 16b
Option 16c
Pro
po
rtio
n o
f th
e fo
rest fl
oo
ded

Barmah Choke Study – Individual Option Phase
SINCLAIR KNIGHT MERZ PAGE 230
Indicator
Op
tio
n 1
Op
tio
n 2
Op
tio
n 3
a
Op
tio
n 3
b
Op
tio
n 4
a
Op
tio
n 4
b
Op
tio
n 5
a
Op
tio
n 5
b
Op
tio
n 6
a
Op
tio
n 6
b
Op
tio
n 6
c
Op
tio
n 7
a
Op
tio
n 7
b
Op
tio
n 7
c
Op
tio
n 7
d
Op
tio
n 1
0
Op
tio
n 1
1
Op
tio
n 1
2a
Op
tio
n 1
2b
Op
tio
n 1
2c
Op
tio
n 1
3
Op
tio
n 1
5
Op
tio
n 1
6a
Op
tio
n 1
6b
Op
tio
n 1
6c
Op
tio
n 1
7
% of years with a medium/large flood of 75,000 ML/day at Euston for >= 1 month 9.7% 0.0 0.0 0.0 N/A N/A 0.0 0.0 N/A N/A N/A N/A N/A N/A N/A 0.0 0.0 0.0 0.0 0.0 0.0 0.0 0.0 0.0 0.0 N/A
Maximum duration with no medium/large flood (years) 21 0.0 0.0 0.0 N/A N/A 0.0 0.0 N/A N/A N/A N/A N/A N/A N/A 0.0 0.0 0.0 0.0 0.0 0.0 0.0 0.0 0.0 0.0 N/A
% of years with a small flood of 45,000 ML/day at Euston for >= 3 months 12.4% 0.0 0.0 0.0 N/A N/A 0.0 0.0 N/A N/A N/A N/A N/A N/A N/A 0.0 0.0 0.0 0.0 0.0 0.0 0.0 0.0 0.0 0.0 N/A
Maximum duration with no small flood (years) 20 0.0 0.0 0.0 N/A N/A 0.0 0.0 N/A N/A N/A N/A N/A N/A N/A 0.0 0.0 0.0 0.0 0.0 0.0 0.0 0.0 0.0 0.0 N/A
Beneficial flooding of Chowilla/Lindsay-Wallpolla
% of years with a medium/large flood of 80,000 ML/day at SA border for >= 3 months 4.4% 0.0 0.0 0.0 N/A N/A 0.0 0.0 N/A N/A N/A N/A N/A N/A N/A 0.0 0.0 0.0 0.0 0.0 0.0 0.0 0.0 0.0 0.0 N/A
Maximum duration with no medium/large flood (years) 37 0.0 0.0 0.0 N/A N/A 0.0 0.0 N/A N/A N/A N/A N/A N/A N/A 0.0 0.0 0.0 0.0 0.0 0.0 0.0 0.0 0.0 0.0 N/A
% of years with a small flood of 50,000 ML/day at SA border for >= 3 months 13.3% 0.0 0.0 0.0 N/A N/A 0.0 0.0 N/A N/A N/A N/A N/A N/A N/A 0.0 0.0 0.0 0.0 0.0 0.0 0.0 0.0 0.0 0.0 N/A
Maximum duration with no small flood (years) 21 0.0 0.0 0.0 N/A N/A 0.0 0.0 N/A N/A N/A N/A N/A N/A N/A 0.0 0.0 0.0 0.0 0.0 0.0 0.0 0.0 0.0 0.0 N/A
Unregulated flows
Average flow to SA in excess of entitlement (GL/year) 4435.9 -2.5 -0.2 -0.3 N/A N/A 0.1 0.9 N/A N/A N/A N/A N/A N/A N/A 0.0 -3.5 -5.4 -8.5 -9.1 0.6 4.8 -1.7 -2.0 -3.3 N/A
% of years where flows to SA < 1,850 GL/year 94.7% 0.0 0.0 0.0 N/A N/A 0.0 0.0 N/A N/A N/A N/A N/A N/A N/A 0.0 0.0 0.0 0.0 0.0 0.0 0.0 0.0 0.0 0.0 N/A
Lake Victoria target levels
% of years Lake Victoria level of the last day of February meets target (≤26.5 m AHD) 97.9% 0.0 0.0 0.0 N/A N/A 0.0 0.0 N/A N/A N/A N/A N/A N/A N/A 0.0 0.0 0.0 0.0 0.0 0.0 0.0 0.0 0.0 0.0 N/A
Proportion of time (years) target not applied due to conditional rules 57.5% 0.0 0.0 0.0 N/A N/A 0.0 0.0 N/A N/A N/A N/A N/A N/A N/A 0.0 0.0 0.0 0.0 0.0 0.0 0.0 0.0 0.0 0.0 N/A
% of years Lake Victoria level of the last day of March meets target (≤25.6 m AHD) 94.0% 0.0 0.0 0.0 N/A N/A 0.0 0.0 N/A N/A N/A N/A N/A N/A N/A 0.0 0.0 0.0 0.0 0.0 0.0 0.0 0.0 0.0 0.0 N/A
Proportion of time (years) target not applied due to conditional rules 56.1% 0.0 0.0 0.0 N/A N/A 0.0 0.0 N/A N/A N/A N/A N/A N/A N/A 0.0 0.0 0.0 0.0 0.0 0.0 0.0 0.0 0.0 0.0 N/A
% of years Lake Victoria level of the last day of April meets target (≤24.6 m AHD) 90.2% 0.0 0.0 0.0 N/A N/A 0.0 0.0 N/A N/A N/A N/A N/A N/A N/A 0.0 0.0 0.0 0.0 0.0 0.0 0.0 0.0 0.0 0.0 N/A
Proportion of time (years) target not applied due to conditional rules 55.3% 0.0 0.0 0.0 N/A N/A 0.0 0.0 N/A N/A N/A N/A N/A N/A N/A 0.0 0.0 0.0 0.0 0.0 0.0 0.0 0.0 0.0 0.0 N/A
% of time (days) Lake Victoria level is > 25.5 m AHD in May (target = minimal) 7.7% 0.0 0.0 0.0 N/A N/A 0.0 0.0 N/A N/A N/A N/A N/A N/A N/A 0.0 0.0 0.0 0.0 0.0 0.0 0.0 0.0 0.0 0.0 N/A
Proportion of time (days) target not applied due to conditional rules 50.9% 0.0 0.0 0.0 N/A N/A 0.0 0.0 N/A N/A N/A N/A N/A N/A N/A 0.0 0.0 0.0 0.0 0.0 0.0 0.0 0.0 0.0 0.0 N/A
% of time (days) during winter & spring where lake level is ≥ 27.0 m AHD in (target = minimal) 28.0% 0.0 0.0 0.0 N/A N/A 0.0 0.0 N/A N/A N/A N/A N/A N/A N/A 0.0 0.0 0.0 0.0 0.0 0.0 0.0 0.0 0.0 0.0 N/A
Werai Forest flooding
% of years of undesirable flooding 43.0% 0.0 0.0 0.0 N/A N/A 0.0 -0.1 N/A N/A N/A N/A N/A N/A N/A 0.0 0.0 0.3 0.3 0.3 -0.1 -0.1 0.0 0.0 0.1 N/A
Undesirable exceedences- other locations
% of years capacity downstream of Hume Reservoir exceeded (25,000 ML/day, Jan – Apr) 2.6% 0.0 0.0 0.0 N/A N/A 0.0 0.0 N/A N/A N/A N/A N/A N/A N/A 0.0 0.0 0.0 0.0 0.0 0.0 0.0 0.0 0.0 0.0 N/A
% of years capacity of Edward offtake exceeded (1,600 ML/day Jan – Apr) 45.6% -0.1 -0.1 0.0 N/A N/A 0.0 0.0 N/A N/A N/A N/A N/A N/A N/A 0.0 0.0 -0.1 -0.1 0.0 -0.1 -0.1 0.0 0.0 -0.1 N/A
% of days capacity of Gulpa offtake exceeded (350 ML/day, Feb – Apr) 27.4% 0.0 0.0 0.0 N/A N/A 0.0 0.0 N/A N/A N/A N/A N/A N/A N/A 0.0 0.0 0.0 -0.1 -0.1 0.0 -0.1 0.0 0.0 0.0 N/A
Hydropower generation
Average annual power generation at Dartmouth Reservoir (GWh) 287.3 -0.2 1.1 0.2 N/A N/A 0.0 0.0 N/A N/A N/A N/A N/A N/A N/A 0.0 0.0 -0.5 -1.0 -1.2 0.1 -0.7 0.0 -0.5 -0.5 N/A
Recreational water levels (Jan – Apr)
Lake Mulwala Average water level (m AHD) 124.8 0.0 0.0 0.0 N/A N/A -0.1 -0.5 N/A N/A N/A N/A N/A N/A N/A 0.0 0.0 0.0 0.0 0.0 0.0 0.0 0.0 0.0 0.0 N/A
Median water level (m AHD) 124.8 0.0 0.0 0.0 N/A N/A -0.1 -0.5 N/A N/A N/A N/A N/A N/A N/A 0.0 0.0 0.0 0.0 0.0 0.0 0.0 0.0 0.0 0.0 N/A
Minimum water level (m AHD) 123.9 0.0 -0.7 0.1 N/A N/A -0.2 -1.0 N/A N/A N/A N/A N/A N/A N/A 0.0 0.0 0.0 0.1 0.1 0.2 0.3 0.0 0.0 0.0 N/A
95th percentile water level (m AHD 124.6 0.0 0.0 0.0 N/A N/A -0.1 -0.5 N/A N/A N/A N/A N/A N/A N/A 0.0 0.0 0.0 0.0 0.0 0.0 0.0 0.0 0.0 0.0 N/A
Euston Weir Average water level (m AHD) 47.7 0.0 0.0 0.0 N/A N/A 0.0 0.0 N/A N/A N/A N/A N/A N/A N/A 0.0 0.0 0.0 0.0 0.0 0.0 0.0 0.0 0.0 0.0 N/A
Median water level (m AHD) 47.7 0.0 0.0 0.0 N/A N/A 0.0 0.0 N/A N/A N/A N/A N/A N/A N/A 0.0 0.0 0.0 0.0 0.0 0.0 0.0 0.0 0.0 0.0 N/A
Minimum water level (m AHD) 46.9 0.0 0.0 0.0 N/A N/A 0.0 0.0 N/A N/A N/A N/A N/A N/A N/A 0.0 0.0 0.0 0.0 0.0 0.0 0.0 0.0 0.0 0.0 N/A
95th percentile water level (m AHD 47.7 0.0 0.0 0.0 N/A N/A 0.0 0.0 N/A N/A N/A N/A N/A N/A N/A 0.0 0.0 0.0 0.0 0.0 0.0 0.0 0.0 0.0 0.0 N/A
Table D- 4: Option modelling results summary- MDBA standard indicators. Note results the results for Option 1 represent the absolute results, results for all other options indicate change from Option 1.
Indicator
Op
tio
n 1
Op
tio
n 2
Op
tio
n 3
a
Op
tio
n 3
b
Op
tio
n 4
a
Op
tio
n 4
b
Op
tio
n 5
a
Op
tio
n 5
b
Op
tio
n 6
a
Op
tio
n 6
b
Op
tio
n 6
c
Op
tio
n 7
a
Op
tio
n 7
b
Op
tio
n 7
c
Op
tio
n 7
d
Op
tio
n 1
0
Op
tio
n 1
1
Op
tio
n 1
2a
Op
tio
n 1
2b
Op
tio
n 1
2c
Op
tio
n 1
3
Op
tio
n 1
5
Op
tio
n 1
6a
Op
tio
n 1
6b
Op
tio
n 1
6c
Op
tio
n 1
7
SRA Hydrology Index
Original Murray-Lower Darling Index 0.588 0.001 0.002 0.000 N/A N/A 0.000 -0.001 N/A N/A N/A N/A N/A N/A N/A 0.000 0.000 0.000 0.000 0.000 0.000 0.001 0.000 0.000 0.000 N/A
Zone 1 U/s Hume 0.763 0.000 0.002 0.000 N/A N/A 0.000 0.000 N/A N/A N/A N/A N/A N/A N/A 0.000 0.001 0.000 0.001 0.001 0.000 0.001 0.000 0.001 0.000 N/A
Zone 2 Hume to Yarrawonga 0.738 0.002 0.005 0.000 N/A N/A -0.002 -0.007 N/A N/A N/A N/A N/A N/A N/A 0.000 0.001 0.003 0.003 0.003 0.003 0.006 0.001 0.002 0.003 N/A
Zone 3 Yarrawonga to Wakool Junction 0.605 0.001 0.002 -0.001 N/A N/A 0.000 -0.001 N/A N/A N/A N/A N/A N/A N/A -0.001 0.000 0.001 0.002 0.002 0.000 0.001 0.000 0.000 0.000 N/A
Zone 4 Wakool to Wentworth 0.615 0.001 0.002 0.002 N/A N/A 0.000 -0.003 N/A N/A N/A N/A N/A N/A N/A 0.000 -0.002 -0.002 -0.003 -0.003 -0.003 0.000 0.000 -0.002 -0.002 N/A
Zone 5 Wentworth to Lock 3 0.524 -0.001 0.000 -0.001 N/A N/A -0.001 0.000 N/A N/A N/A N/A N/A N/A N/A 0.000 0.001 0.001 0.000 0.000 0.000 0.001 0.000 0.001 0.001 N/A
Zone 6 Lower Darling 0.444 0.000 0.001 0.002 N/A N/A 0.000 0.000 N/A N/A N/A N/A N/A N/A N/A 0.000 0.000 0.000 0.000 0.000 0.000 -0.001 0.000 0.000 -0.001 N/A
Zone 7 Lock 3 to Lakes 0.510 0.001 0.004 0.000 N/A N/A 0.000 -0.001 N/A N/A N/A N/A N/A N/A N/A 0.000 0.001 0.001 0.001 0.001 0.000 0.001 0.000 0.001 0.001 N/A

Barmah Choke Study – Individual Option Phase
SINCLAIR KNIGHT MERZ PAGE 231
Indicator
Op
tio
n 1
Op
tio
n 2
Op
tio
n 3
a
Op
tio
n 3
b
Op
tio
n 4
a
Op
tio
n 4
b
Op
tio
n 5
a
Op
tio
n 5
b
Op
tio
n 6
a
Op
tio
n 6
b
Op
tio
n 6
c
Op
tio
n 7
a
Op
tio
n 7
b
Op
tio
n 7
c
Op
tio
n 7
d
Op
tio
n 1
0
Op
tio
n 1
1
Op
tio
n 1
2a
Op
tio
n 1
2b
Op
tio
n 1
2c
Op
tio
n 1
3
Op
tio
n 1
5
Op
tio
n 1
6a
Op
tio
n 1
6b
Op
tio
n 1
6c
Op
tio
n 1
7
Zone 8 Lower Lakes 0.358 0.000 0.000 -0.002 N/A N/A -0.001 -0.001 N/A N/A N/A N/A N/A N/A N/A 0.000 -0.001 -0.001 -0.003 -0.002 0.000 -0.002 -0.001 0.000 0.000 N/A
Morgan salinity (EC)
Average Morgan salinity 520.7 0.4 0.5 -0.4 N/A N/A 0.2 0.3 N/A N/A N/A N/A N/A N/A N/A 0.0 -0.3 -0.9 -0.6 -0.7 -1.3 -1.4 -0.2 -0.5 -1.3 N/A
95th percentile Morgan salinity 804 3 0 -3 N/A N/A 2 5 N/A N/A N/A N/A N/A N/A N/A 0 1 -1 -1 -2 -6 -7 1 0 -1 N/A
Average annual diversions (GL/year)
NSW Murray diversions 1787.7 0.8 -0.3 -0.2 N/A N/A 0.0 0.0 N/A N/A N/A N/A N/A N/A N/A 0.0 2.5 3.4 4.5 4.3 1.4 -2.3 1.7 2.0 3.4 N/A
Victorian Murray diversions 1736.1 0.4 -3.2 0.0 N/A N/A 0.0 0.0 N/A N/A N/A N/A N/A N/A N/A 0.0 -0.3 -0.8 -1.7 -1.8 -0.5 50.5* -0.1 -0.5 -0.8 N/A
SA diversions 707.2 0.2 0.1 -0.2 N/A N/A 0.0 0.0 N/A N/A N/A N/A N/A N/A N/A 0.0 0.2 0.2 0.1 0.1 0.4 0.1 0.2 0.3 0.2 N/A
Lower Darling diversions 132.9 -0.1 0.4 -0.6 N/A N/A 0.0 0.0 N/A N/A N/A N/A N/A N/A N/A 0.0 0.0 -0.1 -0.1 -0.1 0.0 -0.1 0.0 -0.1 -0.1 N/A
Total diversions 4363.9 1.3 -3.0 -1.0 N/A N/A 0.0 0.0 N/A N/A N/A N/A N/A N/A N/A 0.0 2.3 2.7 2.7 2.6 1.3 48.3 1.7 1.7 2.7 N/A
SA country towns diversions 48.0 0.0 0.0 0.0 N/A N/A 0.0 0.0 N/A N/A N/A N/A N/A N/A N/A 0.0 0.0 0.0 0.0 0.0 0.0 0.0 0.0 0.0 0.0 N/A
Metropolitan Adelaide diversions 99.1 0.0 0.0 0.0 N/A N/A 0.0 0.0 N/A N/A N/A N/A N/A N/A N/A 0.0 0.0 0.0 0.0 0.0 0.0 0.0 0.0 0.0 0.0 N/A
Other SA diversions 560.1 0.2 0.1 -0.2 N/A N/A 0.0 0.0 N/A N/A N/A N/A N/A N/A N/A 0.0 0.2 0.2 0.1 0.2 0.4 0.1 0.2 0.3 0.2 N/A
Average cap adjustments (GL/year)
NSW Murray -2.4 0.0 0.0 0.0 N/A N/A 0.0 0.0 N/A N/A N/A N/A N/A N/A N/A 0.0 0.0 0.0 0.0 0.0 0.0 0.0 0.0 0.0 0.0 N/A
Victorian Murray 74.4 0.0 0.0 0.0 N/A N/A 0.0 0.0 N/A N/A N/A N/A N/A N/A N/A 0.0 0.0 0.0 0.0 0.0 0.0 0.0 0.0 0.0 0.0 N/A
South Australia 32.4 0.0 0.0 0.0 N/A N/A 0.0 0.0 N/A N/A N/A N/A N/A N/A N/A 0.0 0.0 0.0 0.0 0.0 0.0 0.0 0.0 0.0 0.0 N/A
Lower Darling 14.1 0.0 0.0 0.0 N/A N/A 0.0 0.0 N/A N/A N/A N/A N/A N/A N/A 0.0 0.0 0.0 0.0 0.0 0.0 0.0 0.0 0.0 0.0 N/A
Total cap adjustment 118.6 0.0 0.0 0.0 N/A N/A 0.0 0.0 N/A N/A N/A N/A N/A N/A N/A 0.0 0.0 0.0 0.0 0.0 0.0 0.0 0.0 0.0 0.0 N/A
Tributary inflows (GL/year)
Murrumbidgee 1224.6 0.0 0.0 0.0 N/A N/A 0.0 0.0 N/A N/A N/A N/A N/A N/A N/A 0.0 0.0 0.0 0.0 0.0 0.0 0.0 0.0 0.0 0.0 N/A
Billabong Creek 307.1 0.0 0.0 0.0 N/A N/A 0.0 0.0 N/A N/A N/A N/A N/A N/A N/A 0.0 0.0 0.0 0.0 0.0 0.0 0.0 0.0 0.0 0.0 N/A
Menindee Lakes inflow 1721.1 0.0 0.0 0.0 N/A N/A 0.0 0.0 N/A N/A N/A N/A N/A N/A N/A 0.0 0.0 0.0 0.0 0.0 0.0 0.0 0.0 0.0 0.0 N/A
Goulburn River 1450.2 0.0 0.0 0.0 N/A N/A 0.0 0.0 N/A N/A N/A N/A N/A N/A N/A 0.0 0.0 0.0 0.0 0.0 0.0 48.9* 0.0 0.0 0.0 N/A
Broken Creek 178.2 0.0 0.0 0.0 N/A N/A 0.0 0.0 N/A N/A N/A N/A N/A N/A N/A 0.0 0.0 0.0 0.0 0.0 30.4** 48.5* 0.0 0.0 0.0 N/A
Campaspe River 151.2 0.0 0.0 0.0 N/A N/A 0.0 0.0 N/A N/A N/A N/A N/A N/A N/A 0.0 0.0 0.0 0.0 0.0 0.0 0.0 0.0 0.0 0.0 N/A
Loddon flow at Appin South 57.6 0.0 0.0 0.0 N/A N/A 0.0 0.0 N/A N/A N/A N/A N/A N/A N/A 0.0 0.0 0.0 0.0 0.0 0.0 0.0 0.0 0.0 0.0 N/A
Total tributary flow 5090.1 0.0 0.0 0.0 N/A N/A 0.0 0.0 N/A N/A N/A N/A N/A N/A N/A 0.0 0.0 0.0 0.0 0.0 30.4 97.5 0.0 0.0 0.0 N/A
Allocations
Mean NSW high security allocation 99.1 0.0 0.0 0.0 N/A N/A 0.0 0.0 N/A N/A N/A N/A N/A N/A N/A 0.0 0.0 0.0 0.0 0.0 0.0 0.0 0.0 0.0 0.0 N/A
Mean other NSW general security allocation 81.6 0.0 0.3 0.1 N/A N/A 0.0 0.0 N/A N/A N/A N/A N/A N/A N/A 0.0 0.1 0.1 0.2 0.2 0.1 -0.3 0.1 0.0 0.1 N/A
Minimum other NSW general security allocation 1.7 0.0 1.8 -0.1 N/A N/A 0.0 0.0 N/A N/A N/A N/A N/A N/A N/A 0.0 -0.1 -0.1 0.0 -0.1 0.0 -0.1 -0.1 0.9 -0.1 N/A
Minimum Victorian February allocation 13.0 -1.0 0.0 2.0 N/A N/A 0.0 0.0 N/A N/A N/A N/A N/A N/A N/A 0.0 2.0 1.0 1.0 1.0 0.0 2.0 2.0 1.0 1.0 N/A
% of years Victorian allocation < 100% 2.6 0.0 0.0 0.0 N/A N/A 0.0 0.0 N/A N/A N/A N/A N/A N/A N/A 0.0 0.0 0.0 0.0 0.0 0.0 0.0 0.0 0.0 0.0 N/A
Mean Victorian February allocation 180.5 0.1 -0.3 0.0 N/A N/A 0.0 0.0 N/A N/A N/A N/A N/A N/A N/A 0.0 -0.1 -0.1 -0.4 -0.3 0.0 0.2 0.0 -0.1 -0.1 N/A
% of years SA entitlement restricted 43.0 0.0 -0.9 0.0 N/A N/A 0.0 0.0 N/A N/A N/A N/A N/A N/A N/A 0.0 0.0 0.0 0.0 0.0 0.0 0.9 0.0 0.0 0.0 N/A
Maximum SA restriction (GL) 1031.8 2.8 9.3 1.2 N/A N/A 0.0 0.0 N/A N/A N/A N/A N/A N/A N/A 0.0 1.0 -0.7 -0.9 0.8 -0.5 -4.3 0.2 0.3 -1.2 N/A
% of months Lower Darling restricted 100.0 0.0 0.0 0.0 N/A N/A 0.0 0.0 N/A N/A N/A N/A N/A N/A N/A 0.0 0.0 0.0 0.0 0.0 0.0 0.0 0.0 0.0 0.0 N/A
Economic gross margin ($m/year)
Value of irrigation 940.3 0.2 0.1 -0.1 N/A N/A 0.0 0.0 N/A N/A N/A N/A N/A N/A N/A 0.0 0.4 0.5 0.5 0.5 -1.6 5.2 0.3 0.4 0.5 N/A
Value of hydro electricity 10.6 0.0 0.0 0.0 N/A N/A 0.0 0.0 N/A N/A N/A N/A N/A N/A N/A 0.0 0.0 0.0 0.0 0.0 0.0 0.0 0.0 0.0 0.0 N/A
Hume recreation value 2.8 0.0 0.0 0.0 N/A N/A 0.0 0.0 N/A N/A N/A N/A N/A N/A N/A 0.0 0.0 0.0 0.0 0.0 0.0 0.0 0.0 0.0 0.0 N/A
Flooding benefit -1.6 0.0 0.0 0.0 N/A N/A 0.0 0.0 N/A N/A N/A N/A N/A N/A N/A 0.0 0.0 0.0 0.0 0.0 0.0 0.0 0.0 0.0 0.0 N/A
Salinity benefit -92.4 -0.1 0.4 0.0 N/A N/A 0.0 -0.2 N/A N/A N/A N/A N/A N/A N/A 0.0 -0.1 -0.1 -0.1 -0.1 0.0 0.1 0.0 0.0 0.1 N/A
Total economic benefit 859.6 0.1 0.4 -0.1 N/A N/A 0.0 -0.2 N/A N/A N/A N/A N/A N/A N/A 0.0 0.3 0.4 0.4 0.4 -1.6 5.2 0.3 0.4 0.6 N/A
Mean annual flow (GL/year)
Euston 6340.7 -2.2 1.4 0.2 N/A N/A 0.2 0.9 N/A N/A N/A N/A N/A N/A N/A 0.0 -3.6 -5.3 -8.6 -9.3 1.3 8.7 -1.8 -1.8 -3.0 N/A
Flow to South Australia 6250.3 -2.5 -0.4 -0.3 N/A N/A 0.2 1.0 N/A N/A N/A N/A N/A N/A N/A 0.0 -3.4 -5.5 -8.8 -9.3 1.1 5.2 -1.6 -2.0 -3.4 N/A
Barrages 4469.8 -2.7 -0.5 -0.2 N/A N/A 0.1 0.9 N/A N/A N/A N/A N/A N/A N/A 0.0 -3.6 -5.6 -8.7 -9.2 0.5 4.7 -1.7 -2.2 -3.5 N/A
Average Salinities (EC)
Yarrawonga 63.1 0.0 0.1 0.0 N/A N/A 0.0 -0.1 N/A N/A N/A N/A N/A N/A N/A 0.0 0.0 0.0 0.0 0.0 0.1 0.1 0.0 0.0 0.0 N/A
Torrumbarry 116.5 0.2 0.1 -0.2 N/A N/A -0.1 -0.2 N/A N/A N/A N/A N/A N/A N/A 0.0 0.2 0.3 0.5 0.5 0.9 3.6 0.1 0.2 0.3 N/A
Swan Hill 269.4 0.8 -0.7 0.2 N/A N/A -0.4 -0.9 N/A N/A N/A N/A N/A N/A N/A 0.0 0.9 1.8 2.6 2.6 0.0 1.7 0.5 1.0 1.5 N/A
Stevens Weir 84.8 -0.1 0.1 -0.1 N/A N/A 0.0 -0.2 N/A N/A N/A N/A N/A N/A N/A 0.0 0.0 -0.2 -0.1 -0.1 0.2 0.3 0.0 0.0 0.0 N/A
Kyalite 327.1 -2.7 3.3 -3.5 N/A N/A 0.9 2.1 N/A N/A N/A N/A N/A N/A N/A 0.0 -3.6 -5.1 -5.6 -5.8 4.6 11.7 -1.5 -3.2 -4.0 N/A
Wakool Junction 275.8 0.5 0.0 0.1 N/A N/A -0.1 -0.3 N/A N/A N/A N/A N/A N/A N/A 0.0 -0.1 0.0 0.3 0.3 0.2 2.5 0.0 -0.2 -0.3 N/A
Red Cliffs 307.0 0.4 0.4 0.1 N/A N/A 0.2 0.0 N/A N/A N/A N/A N/A N/A N/A 0.0 -0.2 -0.3 0.0 0.0 -0.6 0.7 -0.1 -0.3 -0.4 N/A
Merbein 329.7 0.5 0.6 0.1 N/A N/A 0.2 0.2 N/A N/A N/A N/A N/A N/A N/A 0.0 -0.3 -0.4 0.0 -0.1 -0.9 0.0 -0.1 -0.4 -0.6 N/A
Lock 9 359.4 0.4 1.2 0.5 N/A N/A 0.4 0.4 N/A N/A N/A N/A N/A N/A N/A 0.0 -0.3 -0.6 -0.3 -0.3 -1.7 -1.0 -0.2 -0.4 -0.9 N/A

Barmah Choke Study – Individual Option Phase
SINCLAIR KNIGHT MERZ PAGE 232
Indicator
Op
tio
n 1
Op
tio
n 2
Op
tio
n 3
a
Op
tio
n 3
b
Op
tio
n 4
a
Op
tio
n 4
b
Op
tio
n 5
a
Op
tio
n 5
b
Op
tio
n 6
a
Op
tio
n 6
b
Op
tio
n 6
c
Op
tio
n 7
a
Op
tio
n 7
b
Op
tio
n 7
c
Op
tio
n 7
d
Op
tio
n 1
0
Op
tio
n 1
1
Op
tio
n 1
2a
Op
tio
n 1
2b
Op
tio
n 1
2c
Op
tio
n 1
3
Op
tio
n 1
5
Op
tio
n 1
6a
Op
tio
n 1
6b
Op
tio
n 1
6c
Op
tio
n 1
7
Renmark 404.2 0.4 1.4 -0.1 N/A N/A 0.1 0.0 N/A N/A N/A N/A N/A N/A N/A 0.0 -0.3 -0.7 -0.4 -0.4 -1.0 -0.2 -0.2 -0.4 -0.9 N/A
Berri 445.4 0.4 1.6 -0.3 N/A N/A 0.1 0.0 N/A N/A N/A N/A N/A N/A N/A 0.0 -0.3 -0.8 -0.5 -0.4 -1.2 -0.6 -0.2 -0.4 -0.9 N/A
Morgan 520.7 0.4 0.5 -0.4 N/A N/A 0.2 0.3 N/A N/A N/A N/A N/A N/A N/A 0.0 -0.3 -0.9 -0.6 -0.7 -1.3 -1.4 -0.2 -0.5 -1.3 N/A
Murray Bridge 553.2 0.4 0.2 -0.8 N/A N/A 0.2 0.3 N/A N/A N/A N/A N/A N/A N/A 0.0 0.4 0.5 1.0 1.0 -0.6 -1.0 0.0 0.0 -0.6 N/A
Milang 695.8 0.4 0.5 0.1 N/A N/A -0.2 -0.6 N/A N/A N/A N/A N/A N/A N/A 0.0 0.5 0.7 0.9 1.1 0.2 0.7 0.2 0.3 0.3 N/A
Weir 32 447.0 0.0 3.1 1.0 N/A N/A 0.0 0.0 N/A N/A N/A N/A N/A N/A N/A 0.0 0.3 -0.5 -0.2 0.0 -0.7 1.7 -0.1 0.0 0.0 N/A
Burtundy 455.8 1.2 4.1 1.0 N/A N/A 0.0 0.0 N/A N/A N/A N/A N/A N/A N/A 0.0 1.5 0.3 1.2 0.7 -0.2 2.2 0.6 0.7 0.3 N/A
Anabranch outflow 931.5 -5.7 -5.5 5.9 N/A N/A 0.0 0.0 N/A N/A N/A N/A N/A N/A N/A 0.0 0.2 0.9 0.8 0.4 0.5 -9.5 0.3 0.4 0.3 N/A
System losses (GL/year)
Hume evaporation loss 75.2 0.0 -1.2 0.0 N/A N/A 0.0 0.0 N/A N/A N/A N/A N/A N/A N/A 0.0 0.1 0.1 0.1 0.1 0.0 -0.1 0.0 0.0 0.1 N/A
Dartmouth evaporation loss 0.5 0.0 0.0 0.0 N/A N/A 0.0 0.0 N/A N/A N/A N/A N/A N/A N/A 0.0 0.0 0.0 0.0 0.0 0.0 0.0 0.0 0.0 0.0 N/A
Lake Victoria evaporation loss 131.1 0.0 0.5 0.1 N/A N/A 0.0 0.0 N/A N/A N/A N/A N/A N/A N/A 0.0 0.1 0.1 0.1 0.0 0.1 0.4 0.0 0.1 0.1 N/A
Menindee Lakes evaporation loss 389.6 -0.1 -0.1 0.8 N/A N/A 0.0 0.0 N/A N/A N/A N/A N/A N/A N/A 0.0 -0.2 -0.2 -0.1 -0.1 -0.1 0.6 -0.1 -0.1 -0.1 N/A
Upper River Murray loss 1026.0 0.1 -0.6 -0.2 N/A N/A 0.0 0.0 N/A N/A N/A N/A N/A N/A N/A 0.0 -3.4 -5.5 -5.1 -4.9 -4.2 -13.0 -1.8 -3.6 -5.4 N/A
Lower Darling/Anabranch loss 251.9 0.0 -0.4 0.1 N/A N/A 0.0 0.0 N/A N/A N/A N/A N/A N/A N/A 0.0 -0.1 0.0 0.0 -0.1 0.0 -0.1 0.0 -0.1 0.0 N/A
South Australian losses 1122.2 0.0 0.1 0.0 N/A N/A 0.0 0.0 N/A N/A N/A N/A N/A N/A N/A 0.0 0.0 0.0 -0.1 -0.1 0.0 0.1 0.0 0.0 0.0 N/A
Total system loss 2996.7 0.0 -1.5 0.8 N/A N/A 0.0 0.0 N/A N/A N/A N/A N/A N/A N/A 0.0 -3.4 -5.4 -5.2 -5.1 -4.2 -12.1 -1.8 -3.8 -5.3 N/A
Darling system
Tandou diversion (GL/year) 72.2 -0.1 0.3 -0.5 N/A N/A 0.0 0.0 N/A N/A N/A N/A N/A N/A N/A 0.0 0.0 0.0 0.0 0.0 0.0 0.0 0.0 0.0 0.0 N/A
Anabranch replenishment (GL/year) 45.8 0.0 0.1 -0.1 N/A N/A 0.0 0.0 N/A N/A N/A N/A N/A N/A N/A 0.0 0.0 -0.1 -0.1 -0.1 0.0 -0.1 0.0 -0.1 -0.1 N/A
Value of hydro electricity ($m/year)
Dartmouth 5.8 0.0 0.0 0.0 N/A N/A 0.0 0.0 N/A N/A N/A N/A N/A N/A N/A 0.0 0.0 0.0 0.0 0.0 0.0 0.0 0.0 0.0 0.0 N/A
Hume 4.8 0.0 0.0 0.0 N/A N/A 0.0 0.0 N/A N/A N/A N/A N/A N/A N/A 0.0 0.0 0.0 0.0 0.0 0.0 0.0 0.0 0.0 0.0 N/A
Total hydro electricity value 10.6 0.0 0.0 0.0 N/A N/A 0.0 0.0 N/A N/A N/A N/A N/A N/A N/A 0.0 0.0 0.0 0.0 0.0 0.0 0.0 0.0 0.0 0.0 N/A
Irrigation value ($m/year)
New South Wales 247.90 0.09 0.05 -0.07 N/A N/A 0.00 0.00 N/A N/A N/A N/A N/A N/A N/A 0.00 0.26 0.34 0.47 0.45 0.16 -0.22 0.20 0.21 0.36 N/A
Victoria 425.51 -0.02 -0.04 0.05 N/A N/A 0.00 0.00 N/A N/A N/A N/A N/A N/A N/A 0.00 0.05 0.05 0.00 0.01 -1.90 5.30 0.02 0.03 0.05 N/A
South Australia 266.85 0.08 0.04 -0.06 N/A N/A 0.00 0.00 N/A N/A N/A N/A N/A N/A N/A 0.00 0.08 0.07 0.04 0.06 0.17 0.08 0.07 0.13 0.09 N/A
Total irrigation value 940.26 0.15 0.06 -0.08 N/A N/A 0.00 0.00 N/A N/A N/A N/A N/A N/A N/A 0.00 0.40 0.46 0.50 0.52 -1.57 5.16 0.29 0.37 0.50 N/A
Flooding
Flooding cost ($m/year) 1.6 0.0 0.0 0.0 N/A N/A 0.0 0.0 N/A N/A N/A N/A N/A N/A N/A 0.0 0.0 0.0 0.0 0.0 0.0 0.0 0.0 0.0 0.0 N/A
Salinity
Salinity cost ($m/year) 92.4 0.1 -0.4 0.0 N/A N/A 0.0 0.2 N/A N/A N/A N/A N/A N/A N/A 0.0 0.1 0.1 0.1 0.1 0.0 -0.1 0.0 0.0 -0.1 N/A
Other
Darling River loss (GL/year) 356.5 -0.1 0.0 -0.1 N/A N/A 0.0 0.0 N/A N/A N/A N/A N/A N/A N/A 0.0 -0.1 0.0 0.0 -0.1 -0.1 0.0 0.0 -0.1 0.0 N/A
Anabranch environmental flows (GL/year) 13.5 0.0 0.0 0.0 N/A N/A 0.0 0.0 N/A N/A N/A N/A N/A N/A N/A 0.0 0.0 0.0 0.0 0.0 0.0 0.0 0.0 0.0 0.0 N/A
Anabranch return flow (GL/year) 118.2 0.0 0.3 -0.1 N/A N/A 0.0 0.0 N/A N/A N/A N/A N/A N/A N/A 0.0 0.0 0.0 0.0 0.0 0.0 0.1 0.0 0.0 0.0 N/A
Mean other NSW general security allocation (EOY) 87.9 -0.1 0.0 0.1 N/A N/A 0.0 0.0 N/A N/A N/A N/A N/A N/A N/A 0.0 0.2 0.2 0.2 0.2 0.0 0.0 0.2 0.1 0.2 N/A
MIL allocation volume (GL) (EOY) 1460.9 1.4 0.3 -0.5 N/A N/A 0.0 0.0 N/A N/A N/A N/A N/A N/A N/A 0.0 2.2 3.0 3.7 3.7 1.0 -3.3 1.3 2.0 2.9 N/A
Mean NSW total allocation (GL) (EOY) 2185.7 1.1 0.3 -0.4 N/A N/A 0.0 0.0 N/A N/A N/A N/A N/A N/A N/A 0.0 2.9 3.8 5.0 4.7 1.4 -3.0 2.0 2.4 3.8 N/A
NSW Murray diversion (Jul – Jun) (GL) 1787.7 0.8 -0.3 -0.2 N/A N/A 0.0 0.0 N/A N/A N/A N/A N/A N/A N/A 0.0 2.5 3.4 4.5 4.3 1.4 -2.3 1.7 2.0 3.4 N/A
* Option 15- these changes reflect the diversion of water around the Barmah Choke through the Murray-Goulbrun Interconnector. Additional water is diverted into the Interconnector Channel at Yarrawonga Weir, however this water is returned
to the River Murray via Broken Creek and the Goulburn River. The increase in diversions is countered by the increase in tributary inflows. There is no net change in water availability in the River Murray System.
** Option 13- the increase in tributary inflows from Broken Creek is the result of the increased diversions through the Murray Valley and Broken Creek system. There is no net change in water availability in the River Muray System.

Barmah Choke Study – Individual Option Phase
SINCLAIR KNIGHT MERZ PAGE 233
Appendix E Scenario modelling results summary
Table F- 1: Scenario modelling results summary- shortfalls downstream of Yarrawonga Weir.
Shortfalls
Op
tio
n 1
2030d
ry O
pti
on
1
2030d
ry O
pti
on
5b
2030d
ry O
pti
on
6c
2030d
ry O
pti
on
12b
2030d
ry O
pti
on
15
Po
stT
LM
Op
tio
n 1
Po
stT
LM
Op
tio
n 5
b
Po
stT
LM
Op
tio
n 6
c
Po
stT
LM
Op
tio
n 1
2b
Po
stT
LM
Op
tio
n 1
5
Po
stT
LM
2030d
ry
Op
tio
n 1
Po
stT
LM
2030d
ry
Op
tio
n 5
b
Po
stT
LM
2030d
ry
Op
tio
n 6
c
Po
stT
LM
2030d
ry
Op
tio
n 1
2b
Po
stT
LM
2030d
ry
Op
tio
n 1
5
Shortfalls which are expected to be manageable
Number (total) 13 13 14 9 13 9 6 8 3 13 6 9 8 5 10 8
Number (type I- peak demand) 12 14 15 8 13 8 8 8 3 11 6 11 11 6 9 6
Number (type II- lower system storage)
1 -1 -1 1 0 1 -2 0 0 2 0 -2 -3 -1 1 2
Average volume (GL) 2.4 0.9 0.8 0.5 1.9 1.8 2.0 2.3 0.5 3.3 2.5 1.8 1.3 1.2 2.7 3.2
Average duration (days) 3.4 1.8 1.7 1.0 3.0 2.8 3.5 3.6 2.0 4.4 3.8 2.8 2.5 1.4 4.6 5.1
Shortfalls which are expected to be challenging to manage
Number 8 11 11 3 7 6 7 6 5 8 3 13 12 3 11 8
Number (type I- peak demand) 7 7 7 4 7 6 6 5 1 5 1 10 11 2 9 9
Number (type II- lower system storage)
1 4 4 -1 0 0 1 1 4 3 2 3 1 1 2 -1
Average volume (GL) 8.7 11.5 11.5 9.8 11.8 12.9 14.0 16.9 16.5 15.0 12.0 12.8 11.7 13.9 12.8 12.0
Average duration (days) 8.3 9.4 9.4 9.3 6.9 7.3 16.3 19.7 15.4 10.6 10.7 8.9 7.8 4.3 6.1 7.9
Shortfalls which are expected to be more difficult to manage
Number 7 6 6 3 4 3 14 14 7 7 12 4 7 0 1 5
Number (type I- peak demand) 2 4 4 0 3 2 7 8 3 6 6 3 4 0 1 2
Number (type II- lower system storage)
5 2 2 3 1 1 7 6 4 1 6 1 3 0 0 3
Average volume (GL) 111.6 52.8 53.1 55.3 41.2 50.3 48.9 50.5 42.1 38.0 62.1 37.6 30.2 0.0 75.8 27.3
Average duration (days) 41.3 28.8 29.2 21.7 14.3 22.7 26.7 26.7 21.0 18.6 30.3 15.0 13.4 0.0 27.0 14.6
Total shortfalls
Number (total) 28 30 31 15 24 18 27 28 15 28 21 26 27 8 22 21
Number (type I- peak demand) 21 25 26 12 23 16 21 21 7 22 13 24 26 8 19 17
Number (type II- lower system storage)
7 5 5 3 1 2 6 7 8 6 8 2 1 0 3 4

Barmah Choke Study – Individual Option Phase
SINCLAIR KNIGHT MERZ PAGE 234
Table F- 2: Scenario modelling results summary- unseasonal flooding of the Barmah-Millewa Forest.
Unseasonal Flooding
Op
tio
n 1
2030d
ry O
pti
on
1
2030d
ry O
pti
on
5b
2030d
ry O
pti
on
6c
*
2030d
ry O
pti
on
12b
2030d
ry O
pti
on
15
Po
stT
LM
Op
tio
n 1
Po
stT
LM
Op
tio
n 5
b
Po
stT
LM
Op
tio
n 6
c*
Po
stT
LM
Op
tio
n 1
2b
Po
stT
LM
Op
tio
n 1
5
Po
stT
LM
2030d
ry O
pti
on
1
Po
stT
LM
2030d
ry O
pti
on
5b
Po
stT
LM
2030d
ry O
pti
on
6c
*
Po
stT
LM
2030d
ry O
pti
on
12b
Po
stT
LM
2030d
ry O
pti
on
15
Total years of unseasonal flooding 63 39 15 63 38 35 77 38 63 72 70 54 23 63 49 46
Total years of moderate unseasonal flooding 33 19 4 33 18 22 43 16 33 34 36 31 13 33 30 29
Total years of more severe unseasonal flooding 29 16 9 29 15 9 27 20 29 25 28 19 9 29 13 14
Proportion of wet years for each side of the forest 40% 22% 10% 40% 21% 18% 43% 25% 40% 37% 40% 30% 14% 40% 25% 25%
* Effect on unseasonal flooding for these options was not modelled and has been set to the values modelled for Option 1.

Barmah Choke Study – Individual Option Phase
SINCLAIR KNIGHT MERZ PAGE 235
Table F- 3: Option modelling results summary- Barmah Choke Study specific indicators. Note results the results for Option 1 under each reference run represent the absolute results, results for all other options indicate change from Option 1.
Indicator
Pre
TL
M O
pti
on
1
Comparison with Pre TLM Option 1
20
30
dry
Op
tio
n 1
Comparison with 2030 dry Option 1
Po
stT
LM
Op
tio
n 1
Comparison with Post TLM
Po
stT
LM
20
30
dry
Op
tio
n 1
Comparison with Post TLM 2030 dry Option 1
20
30
dry
Op
tio
n 1
Po
stT
LM
Op
tio
n 1
Po
stT
LM
20
30
dry
Op
tio
n 1
20
30
dry
Op
tio
n 5
b
20
30
dry
Op
tio
n 6
c
20
30
dry
Op
tio
n 1
2b
20
30
dry
Op
tio
n 1
5
Po
stT
LM
Po
stT
LM
Po
stT
LM
Po
stT
LM
Po
stT
LM
20
30
dry
Op
tio
n 5
b
Po
stT
LM
20
30
dry
Op
tio
n 6
c
Po
stT
LM
20
30
dry
Op
tio
n 1
2b
Po
stT
LM
20
30
dry
Op
tio
n 1
5
Op
tio
n 5
b
Op
tio
n 6
c
Op
tio
n
12
b
Op
tio
n 1
5
Forest losses (15th
December to 30th April)
Total loss from Yarrawonga to Barmah (GL/year) 147.9 -31.9 7.5 -29.6 116.0 -1.2 N/A -1.8 -4.5 155.4 -3.7 N/A -5.8 -4.5 118.3 -2.8 N/A -3.3 -5.2
Barmah Forest loss (GL/year) 132.1 -39.0 10.1 -35.8 93.0 -1.6 N/A -2.6 -4.8 142.1 -4.3 N/A -8.4 -5.3 96.3 -3.6 N/A -5.5 -6.4
Allocations
Years with 100% allocation for general security entitlement (NSW) 71.3% -0.5 0.0 -0.4 26.1% 0.0 N/A 0.0 0.0 73.0% 0.0 N/A 0.0 0.0 28.7% 0.0 N/A 0.0 0.0
Average allocation for general security entitlement (NSW) 85.6 -27.7 1.9 -25.5 57.8 0.0 N/A 0.0 -0.5 87.5 0.0 N/A -0.3 -0.6 60.1 0.0 N/A 0.0 -0.8
Years with 100% allocation for high reliability water shares (Victoria) 98.2% -0.1 0.0 -0.1 85.0% 0.0 N/A 0.0 0.0 98.2% 0.0 N/A 0.0 0.0 85.0% 0.0 N/A 0.0 0.0
Years with 100% allocation for low reliability water shares (Victoria) 77.0% -0.5 0.0 -0.4 25.7% 0.0 N/A 0.0 0.0 81.4% 0.0 N/A 0.0 0.0 32.7% 0.0 N/A 0.0 0.0
Average allocation for high + low reliability water shares (Victoria) 182.0 -52.9 2.2 -48.9 129.0 0.0 N/A -0.4 1.0 184.2 0.0 N/A -0.9 1.2 133.1 0.0 N/A -2.0 3.3
Beneficial flooding of the Barmah-Millewa Forest
% of years with a medium/large flood of 25,000 ML/day at Yarrawonga for >= 2 months 16.8% -0.1 0.0 -0.1 3.5% 0.0 N/A 0.0 0.0 17.7% 0.0 N/A 0.0 0.0 3.5% 0.0 N/A 0.0 0.0
Maximum duration with no medium/large flood (years) 21 17.0 0.0 17.0 38 0.0 N/A 0.0 0.0 21 0.0 N/A -7.0 -7.0 38 0.0 N/A 0.0 0.0
% of years with a small flood of 18,000 ML/day at Yarrawonga for >= 3 months 13.3% -0.1 0.0 -0.1 3.5% 0.0 N/A 0.0 0.0 15.9% 0.0 N/A 0.0 0.0 3.5% 0.0 N/A 0.0 0.0
Maximum duration with no small flood (years) 21 17.0 0.0 17.0 38 0.0 N/A 0.0 0.0 21 0.0 N/A 0.0 0.0 38 0.0 N/A 0.0 0.0
Beneficial flooding of Koondrook/Gunbower Wetlands
% of years with a medium/large flood of 35,000 ML/day at Torrumbarry for >= 3 months 4.4% 0.0 0.0 0.0 1.8% 0.0 N/A 0.0 0.0 6.2% 0.0 N/A 0.0 0.0 2.7% 0.0 N/A 0.0 0.0
Maximum duration with no medium/large flood (years) 34 26.0 0.0 4.0 60 0.0 N/A 0.0 0.0 34 0.0 N/A 0.0 0.0 38 0.0 N/A 0.0 0.0
% of years with a small flood of 25,000 ML/day at Torrumbarry for >= 3 months 15.0% -0.1 0.0 -0.1 2.7% 0.0 N/A 0.0 0.0 18.6% 0.0 N/A 0.0 0.0 2.7% 0.0 N/A 0.0 0.0
Maximum duration with no small flood (years) 20 18.0 -1.0 18.0 38 0.0 N/A 0.0 0.0 19 0.0 N/A 1.0 0.0 38 0.0 N/A 0.0 0.0
Beneficial flooding of Hattah Lakes
% of years with a medium/large flood of 75,000 ML/day at Euston for >= 1 month 9.7% -0.1 0.0 -0.1 0.9% 0.0 N/A 0.0 0.0 10.6% 0.0 N/A 0.0 0.0 1.8% 0.0 N/A 0.0 0.0
Maximum duration with no medium/large flood (years) 21 39.0 0.0 39.0 60 0.0 N/A 0.0 0.0 21 0.0 N/A 0.0 0.0 60 0.0 N/A 0.0 -22.0
% of years with a small flood of 45,000 ML/day at Euston for >= 3 months 12.4% -0.1 0.0 -0.1 2.7% 0.0 N/A 0.0 0.0 13.3% 0.0 N/A 0.0 0.0 2.7% 0.0 N/A 0.0 0.0
Maximum duration with no small flood (years) 20 18.0 0.0 18.0 38 0.0 N/A 0.0 0.0 20 0.0 N/A 0.0 0.0 38 0.0 N/A 0.0 0.0
Beneficial flooding of Chowilla/Lindsay-Wallpolla
% of years with a medium/large flood of 80,000 ML/day at SA border for >= 3 months 4.4% 0.0 0.0 0.0 0.9% 0.0 N/A 0.0 0.0 4.4% 0.0 N/A 0.0 0.0 0.9% 0.0 N/A 0.0 0.0
Maximum duration with no medium/large flood (years) 37 23.0 0.0 23.0 60 0.0 N/A 0.0 0.0 37 0.0 N/A 0.0 0.0 60 0.0 N/A 0.0 0.0
% of years with a small flood of 50,000 ML/day at SA border for >= 3 months 13.3% -0.1 0.0 -0.1 2.7% 0.0 N/A 0.0 0.0 14.2% 0.0 N/A 0.0 0.0 2.7% 0.0 N/A 0.0 0.0

Barmah Choke Study – Individual Option Phase
SINCLAIR KNIGHT MERZ PAGE 236
Maximum duration with no small flood (years) 21 17.0 0.0 17.0 38 0.0 N/A 0.0 0.0 21 0.0 N/A 0.0 0.0 38 0.0 N/A 0.0 0.0
Unregulated flows
Average flow to SA in excess of entitlement (GL/year) 4435.9 -2599.5
306.1 -2429.6
1836.5 0.8 N/A -3.6 6.9 4742.0 1.8 N/A -3.3 7.0 2006.3 1.6 N/A -0.6 15.8
% of years where flows to SA < 1,850 GL/year 94.7% -0.2 0.0 -0.1 76.1% 0.0 N/A 0.0 0.0 96.5% 0.0 N/A 0.0 0.0 83.2% 0.0 N/A 0.0 0.0
Lake Victoria target levels
% of years Lake Victoria level of the last day of February meets target (≤26.5 m AHD) 97.9% 0.0 0.0 0.0 100.0% 0.0 N/A 0.0 0.0 95.8% 0.0 N/A 0.0 0.0 93.3% 0.0 N/A 0.0 0.0
Proportion of time (years) target not applied due to conditional rules 57.5% 0.3 0.0 0.3 87.6% 0.0 N/A 0.0 0.0 57.5% 0.0 N/A 0.0 0.0 86.7% 0.0 N/A 0.0 0.0
% of years Lake Victoria level of the last day of March meets target (≤25.6 m AHD) 94.0% 0.1 0.0 0.1 100.0% 0.0 N/A 0.0 -0.1 94.0% 0.0 N/A 0.0 0.0 100.0% 0.0 N/A 0.0 -0.1
Proportion of time (years) target not applied due to conditional rules 56.1% 0.3 0.0 0.3 89.5% 0.0 N/A 0.0 0.0 56.1% 0.0 N/A 0.0 0.0 88.6% 0.0 N/A 0.0 0.0
% of years Lake Victoria level of the last day of April meets target (≤24.6 m AHD) 90.2% -0.1 0.0 -0.1 76.9% 0.0 N/A 0.0 0.0 88.9% 0.0 N/A 0.0 0.0 80.0% 0.0 N/A 0.0 0.1
Proportion of time (years) target not applied due to conditional rules 55.3% 0.3 0.0 0.3 88.6% 0.0 N/A 0.0 0.0 52.6% 0.0 N/A 0.0 0.0 86.8% 0.0 N/A 0.0 0.0
% of time (days) Lake Victoria level is > 25.5 m AHD in May (target = minimal) 7.7% -0.1 0.0 0.1 1.1% 0.0 N/A 0.0 0.0 7.4% 0.0 N/A 0.0 0.0 13.9% 0.0 N/A 0.1 0.0
Proportion of time (days) target not applied due to conditional rules 50.9% 0.4 -0.1 0.3 86.8% 0.0 N/A 0.0 0.0 45.6% 0.0 N/A 0.0 0.0 85.1% 0.0 N/A 0.0 0.0
% of time (days) during winter and spring where lake level is ≥ 27.0 m AHD in (target = minimal)
28.0% 0.0 0.0 0.0 27.3% 0.0 N/A 0.0 0.0 24.3% 0.0 N/A 0.0 0.0 28.1% 0.0 N/A 0.0 0.0
Werai Forest flooding
% of years of undesirable flooding 43.0% -0.1 0.1 -0.1 30.7% 0.0 N/A 0.2 -0.1 51.8% -0.1 N/A 0.3 0.0 37.7% 0.0 N/A 0.3 0.0
Undesirable exceedences- other locations
% of years capacity downstream of Hume Reservoir exceeded (25,000 ML/day, Jan – Apr) 2.6% 0.0 0.0 0.0 0.0% 0.0 N/A 0.0 0.0 3.5% 0.0 N/A 0.0 0.0 0.9% 0.0 N/A 0.0 0.0
% of years capacity of Edward offtake exceeded (1,600 ML/day Jan – Apr) 45.6% -0.2 -0.1 -0.2 24.6% 0.0 N/A 0.0 -0.1 39.5% 0.0 N/A 0.0 0.0 22.8% 0.0 N/A 0.0 0.0
% of days capacity of Gulpa offtake exceeded (350 ML/day, Feb – Apr) 27.4% -0.1 0.0 -0.1 21.6% 0.0 N/A 0.0 0.0 26.7% 0.0 N/A -0.1 -0.1 21.8% 0.0 N/A -0.1 0.0
Hydropower generation
Average annual power generation at Dartmouth Reservoir (GWh) 287.3 -138.2 5.9 -117.7 149.1 0.0 N/A -1.2 0.2 293.2 0.0 N/A -2.9 -5.1 169.6 0.0 N/A -6.8 -11.9
Recreational water levels (Jan – Apr)
Lake Mulwala Average water level (m AHD) 124.8 -0.1 0.0 -0.1 124.7 -0.4 N/A 0.0 0.0 124.9 -0.4 N/A 0.0 0.0 124.7 -0.4 N/A 0.0 0.0
Median water level (m AHD) 124.8 -0.1 0.0 -0.1 124.8 -0.5 N/A 0.0 0.0 124.9 -0.5 N/A 0.0 0.0 124.8 -0.5 N/A 0.0 0.0
Minimum water level (m AHD) 123.9 -1.6 -0.9 -4.0 122.3 0.0 N/A 0.0 -2.2 123.0 -0.1 N/A -0.8 -0.9 119.9 0.0 N/A 0.8 -4.4
95th
percentile water level (m AHD 124.6 -0.1 0.0 -0.2 124.5 -0.5 N/A 0.0 -0.1 124.6 -0.5 N/A 0.0 0.0 124.4 -0.4 N/A 0.0 -0.2
Euston Weir Average water level (m AHD) 47.7 0.0 0.0 0.0 47.7 0.0 N/A 0.0 0.0 47.7 0.0 N/A 0.0 0.0 47.7 0.0 N/A 0.0 0.0
Median water level (m AHD) 47.7 0.0 0.0 0.0 47.7 0.0 N/A 0.0 0.0 47.7 0.0 N/A 0.0 0.0 47.7 0.0 N/A 0.0 0.0
Minimum water level (m AHD) 46.9 -1.4 -0.3 -1.4 45.5 0.0 N/A 0.0 0.0 46.6 0.0 N/A 0.0 -0.1 45.5 0.0 N/A 0.0 0.0
95th
percentile water level (m AHD 47.7 0.0 0.0 0.0 47.7 0.0 N/A 0.0 0.0 47.7 0.0 N/A 0.0 0.0 47.7 0.0 N/A 0.0 0.0
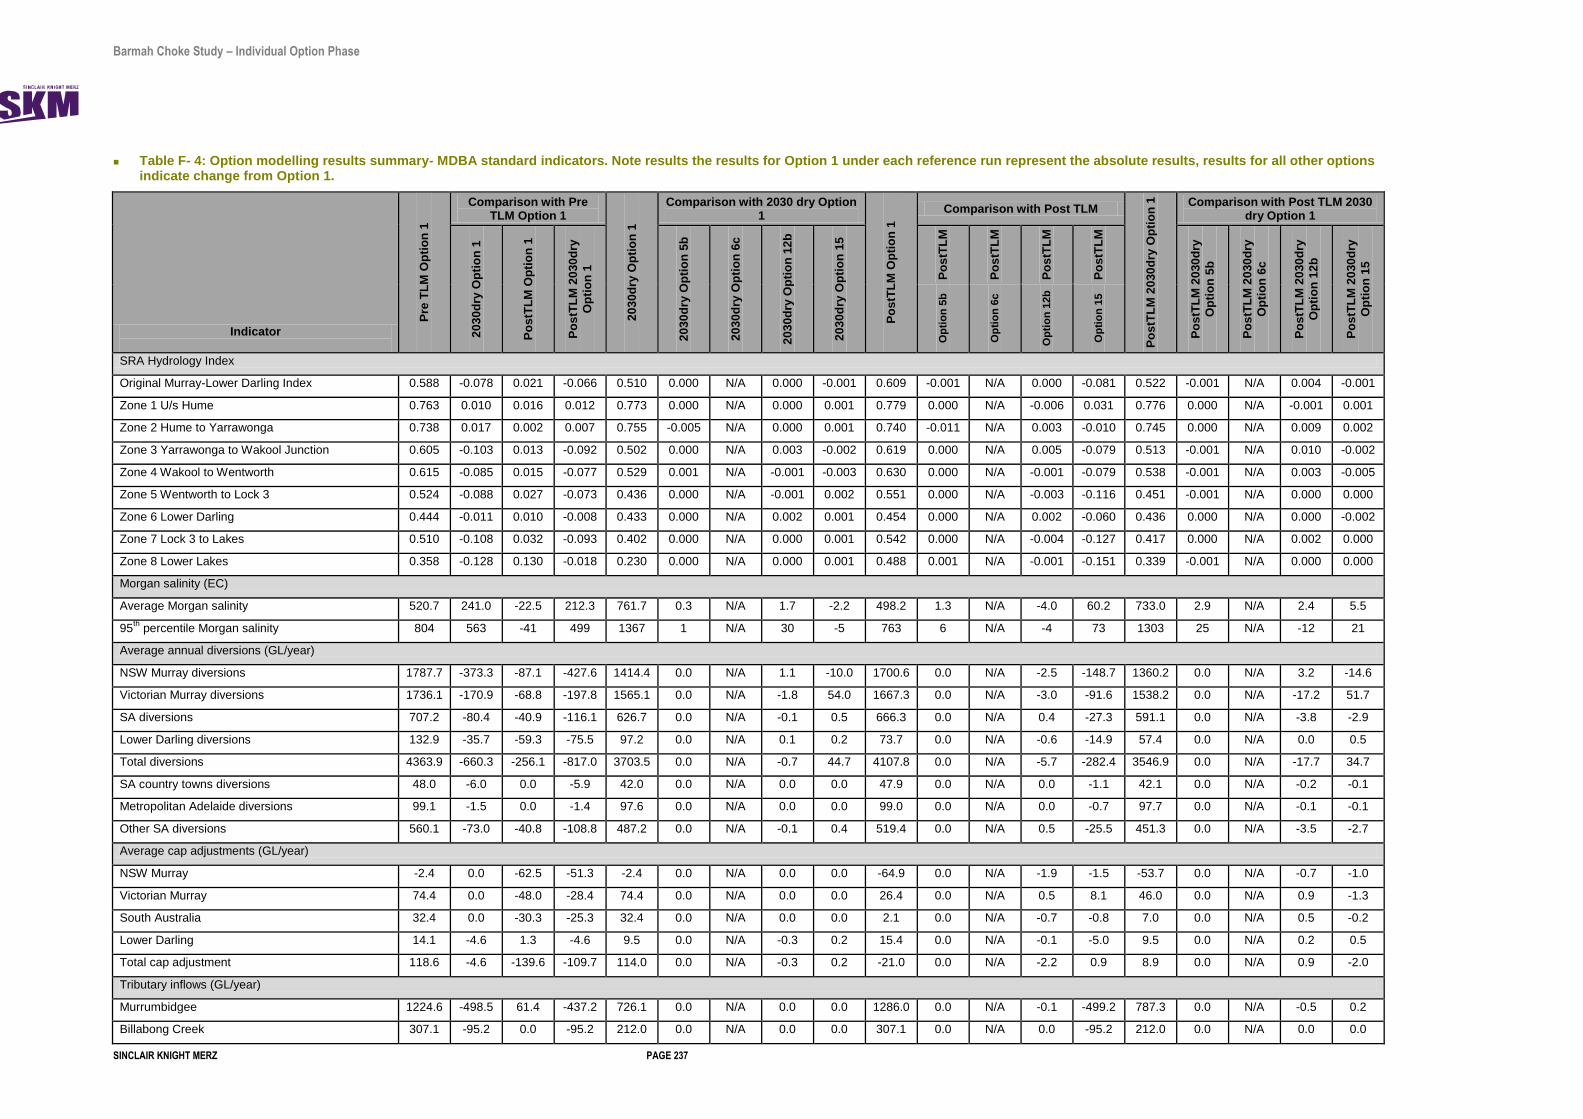
Barmah Choke Study – Individual Option Phase
SINCLAIR KNIGHT MERZ PAGE 237
Table F- 4: Option modelling results summary- MDBA standard indicators. Note results the results for Option 1 under each reference run represent the absolute results, results for all other options indicate change from Option 1.
Indicator
Pre
TL
M O
pti
on
1
Comparison with Pre TLM Option 1
20
30
dry
Op
tio
n 1
Comparison with 2030 dry Option 1
Po
stT
LM
Op
tio
n 1
Comparison with Post TLM
Po
stT
LM
20
30
dry
Op
tio
n 1
Comparison with Post TLM 2030 dry Option 1
20
30
dry
Op
tio
n 1
Po
stT
LM
Op
tio
n 1
Po
stT
LM
20
30
dry
Op
tio
n 1
20
30
dry
Op
tio
n 5
b
20
30
dry
Op
tio
n 6
c
20
30
dry
Op
tio
n 1
2b
20
30
dry
Op
tio
n 1
5
Po
stT
LM
Po
stT
LM
Po
stT
LM
Po
stT
LM
Po
stT
LM
20
30
dry
Op
tio
n 5
b
Po
stT
LM
20
30
dry
Op
tio
n 6
c
Po
stT
LM
20
30
dry
Op
tio
n 1
2b
Po
stT
LM
20
30
dry
Op
tio
n 1
5
Op
tio
n 5
b
Op
tio
n 6
c
Op
tio
n 1
2b
Op
tio
n 1
5
SRA Hydrology Index
Original Murray-Lower Darling Index 0.588 -0.078 0.021 -0.066 0.510 0.000 N/A 0.000 -0.001 0.609 -0.001 N/A 0.000 -0.081 0.522 -0.001 N/A 0.004 -0.001
Zone 1 U/s Hume 0.763 0.010 0.016 0.012 0.773 0.000 N/A 0.000 0.001 0.779 0.000 N/A -0.006 0.031 0.776 0.000 N/A -0.001 0.001
Zone 2 Hume to Yarrawonga 0.738 0.017 0.002 0.007 0.755 -0.005 N/A 0.000 0.001 0.740 -0.011 N/A 0.003 -0.010 0.745 0.000 N/A 0.009 0.002
Zone 3 Yarrawonga to Wakool Junction 0.605 -0.103 0.013 -0.092 0.502 0.000 N/A 0.003 -0.002 0.619 0.000 N/A 0.005 -0.079 0.513 -0.001 N/A 0.010 -0.002
Zone 4 Wakool to Wentworth 0.615 -0.085 0.015 -0.077 0.529 0.001 N/A -0.001 -0.003 0.630 0.000 N/A -0.001 -0.079 0.538 -0.001 N/A 0.003 -0.005
Zone 5 Wentworth to Lock 3 0.524 -0.088 0.027 -0.073 0.436 0.000 N/A -0.001 0.002 0.551 0.000 N/A -0.003 -0.116 0.451 -0.001 N/A 0.000 0.000
Zone 6 Lower Darling 0.444 -0.011 0.010 -0.008 0.433 0.000 N/A 0.002 0.001 0.454 0.000 N/A 0.002 -0.060 0.436 0.000 N/A 0.000 -0.002
Zone 7 Lock 3 to Lakes 0.510 -0.108 0.032 -0.093 0.402 0.000 N/A 0.000 0.001 0.542 0.000 N/A -0.004 -0.127 0.417 0.000 N/A 0.002 0.000
Zone 8 Lower Lakes 0.358 -0.128 0.130 -0.018 0.230 0.000 N/A 0.000 0.001 0.488 0.001 N/A -0.001 -0.151 0.339 -0.001 N/A 0.000 0.000
Morgan salinity (EC)
Average Morgan salinity 520.7 241.0 -22.5 212.3 761.7 0.3 N/A 1.7 -2.2 498.2 1.3 N/A -4.0 60.2 733.0 2.9 N/A 2.4 5.5
95th
percentile Morgan salinity 804 563 -41 499 1367 1 N/A 30 -5 763 6 N/A -4 73 1303 25 N/A -12 21
Average annual diversions (GL/year)
NSW Murray diversions 1787.7 -373.3 -87.1 -427.6 1414.4 0.0 N/A 1.1 -10.0 1700.6 0.0 N/A -2.5 -148.7 1360.2 0.0 N/A 3.2 -14.6
Victorian Murray diversions 1736.1 -170.9 -68.8 -197.8 1565.1 0.0 N/A -1.8 54.0 1667.3 0.0 N/A -3.0 -91.6 1538.2 0.0 N/A -17.2 51.7
SA diversions 707.2 -80.4 -40.9 -116.1 626.7 0.0 N/A -0.1 0.5 666.3 0.0 N/A 0.4 -27.3 591.1 0.0 N/A -3.8 -2.9
Lower Darling diversions 132.9 -35.7 -59.3 -75.5 97.2 0.0 N/A 0.1 0.2 73.7 0.0 N/A -0.6 -14.9 57.4 0.0 N/A 0.0 0.5
Total diversions 4363.9 -660.3 -256.1 -817.0 3703.5 0.0 N/A -0.7 44.7 4107.8 0.0 N/A -5.7 -282.4 3546.9 0.0 N/A -17.7 34.7
SA country towns diversions 48.0 -6.0 0.0 -5.9 42.0 0.0 N/A 0.0 0.0 47.9 0.0 N/A 0.0 -1.1 42.1 0.0 N/A -0.2 -0.1
Metropolitan Adelaide diversions 99.1 -1.5 0.0 -1.4 97.6 0.0 N/A 0.0 0.0 99.0 0.0 N/A 0.0 -0.7 97.7 0.0 N/A -0.1 -0.1
Other SA diversions 560.1 -73.0 -40.8 -108.8 487.2 0.0 N/A -0.1 0.4 519.4 0.0 N/A 0.5 -25.5 451.3 0.0 N/A -3.5 -2.7
Average cap adjustments (GL/year)
NSW Murray -2.4 0.0 -62.5 -51.3 -2.4 0.0 N/A 0.0 0.0 -64.9 0.0 N/A -1.9 -1.5 -53.7 0.0 N/A -0.7 -1.0
Victorian Murray 74.4 0.0 -48.0 -28.4 74.4 0.0 N/A 0.0 0.0 26.4 0.0 N/A 0.5 8.1 46.0 0.0 N/A 0.9 -1.3
South Australia 32.4 0.0 -30.3 -25.3 32.4 0.0 N/A 0.0 0.0 2.1 0.0 N/A -0.7 -0.8 7.0 0.0 N/A 0.5 -0.2
Lower Darling 14.1 -4.6 1.3 -4.6 9.5 0.0 N/A -0.3 0.2 15.4 0.0 N/A -0.1 -5.0 9.5 0.0 N/A 0.2 0.5
Total cap adjustment 118.6 -4.6 -139.6 -109.7 114.0 0.0 N/A -0.3 0.2 -21.0 0.0 N/A -2.2 0.9 8.9 0.0 N/A 0.9 -2.0
Tributary inflows (GL/year)
Murrumbidgee 1224.6 -498.5 61.4 -437.2 726.1 0.0 N/A 0.0 0.0 1286.0 0.0 N/A -0.1 -499.2 787.3 0.0 N/A -0.5 0.2
Billabong Creek 307.1 -95.2 0.0 -95.2 212.0 0.0 N/A 0.0 0.0 307.1 0.0 N/A 0.0 -95.2 212.0 0.0 N/A 0.0 0.0

Barmah Choke Study – Individual Option Phase
SINCLAIR KNIGHT MERZ PAGE 238
Menindee Lakes inflow 1721.1 -532.6 0.0 -532.6 1188.5 0.0 N/A 0.0 0.0 1721.1 0.0 N/A 0.0 -532.6 1188.5 0.0 N/A 0.0 0.0
Goulburn River 1450.2 -620.8 86.4 -593.7 829.4 0.0 N/A 0.0 50.0 1536.7 0.0 N/A 3.3 -681.9 856.5 0.0 N/A -1.1 48.5
Broken Creek 178.2 -48.6 0.0 -48.6 129.6 0.0 N/A 0.0 48.0 178.2 0.0 N/A 0.0 -48.7 129.6 0.0 N/A 0.0 48.0
Campaspe River 151.2 -98.2 -2.3 -98.2 53.0 0.0 N/A 0.0 0.0 148.9 0.0 N/A 0.0 -95.9 53.0 0.0 N/A 0.0 0.0
Loddon flow at Appin South 57.6 -27.8 3.2 -27.8 29.8 0.0 N/A 0.0 0.0 60.8 0.0 N/A 0.0 -31.1 29.8 0.0 N/A 0.0 0.0
Total tributary flow 5090.1 -1921.7
148.8 -1833.4
3168.3 0.0 N/A 0.0 98.1 5238.9 0.0 N/A 3.2 -1984.4
3256.6 0.0 N/A -1.6 96.7
Allocations
Mean NSW high security allocation 99.1 -2.3 0.1 -1.6 96.8 0.0 N/A -0.1 0.1 99.2 0.0 N/A -0.1 -0.6 97.6 0.0 N/A -0.1 -0.2
Mean other NSW general security allocation 81.6 -36.1 1.9 -34.5 45.5 0.0 N/A 0.1 -0.4 83.5 0.0 N/A -0.5 -13.1 47.1 0.0 N/A -0.5 -0.9
Minimum other NSW general security allocation 1.7 -1.5 -0.4 -1.6 0.1 0.0 N/A 0.0 0.0 1.3 0.0 N/A 1.9 -0.7 0.1 0.0 N/A 0.0 0.0
Minimum Victorian February allocation 13.0 -13.0 11.0 -13.0 0.0 0.0 N/A 0.0 0.0 24.0 0.0 N/A -4.0 -24.0 0.0 0.0 N/A 0.0 0.0
% of years Victorian allocation < 100% 2.6 13.2 0.0 13.2 15.8 0.0 N/A 0.0 0.9 2.6 0.0 N/A 0.0 9.6 15.8 0.0 N/A -0.9 -0.9
Mean Victorian February allocation 180.5 -52.6 2.3 -48.5 127.9 0.0 N/A -0.4 1.0 182.8 0.0 N/A -0.9 -26.7 132.0 0.0 N/A -2.0 3.4
% of years SA entitlement restricted 43.0 46.5 -3.5 42.1 89.5 0.0 N/A 0.9 0.9 39.5 0.0 N/A 0.0 30.7 85.1 0.0 N/A 0.0 4.4
Maximum SA restriction (GL) 1031.8 133.4 34.6 141.8 1165.2 0.0 N/A -0.3 -1.6 1066.5 0.0 N/A -19.6 36.8 1173.6 0.0 N/A -15.7 -17.0
% of months Lower Darling restricted 100.0 0.0 0.0 0.0 100.0 0.0 N/A 0.0 0.0 100.0 0.0 N/A 0.0 0.0 100.0 0.0 N/A 0.0 0.0
Economic gross margin ($m/year)
Value of irrigation 940.3 -114.5 -38.1 -140.7 825.7 0.0 N/A -0.1 4.9 902.2 0.0 N/A -0.3 -37.3 799.6 0.0 N/A -2.3 3.4
Value of hydro electricity 10.6 -4.5 0.3 -4.0 6.0 0.0 N/A 0.0 0.0 10.9 0.0 N/A -0.1 -1.3 6.6 0.0 N/A -0.1 -0.2
Hume recreation value 2.8 -0.9 0.1 -0.8 1.9 0.0 N/A 0.0 0.0 2.9 0.0 N/A 0.0 -0.4 2.0 0.0 N/A 0.0 0.0
Flooding benefit -1.6 1.4 -0.2 1.4 -0.2 0.0 N/A 0.0 0.0 -1.7 0.0 N/A 0.1 0.4 -0.2 0.0 N/A 0.0 0.0
Salinity benefit -92.4 -50.5 3.6 -47.0 -143.0 -0.2 N/A -0.2 0.3 -88.8 -0.3 N/A 0.5 -14.9 -139.5 -0.8 N/A -0.8 -0.9
Total economic benefit 859.6 -169.1 -34.2 -191.1 690.5 -0.2 N/A -0.4 5.2 825.4 -0.3 N/A 0.1 -53.4 668.5 -0.8 N/A -3.3 2.3
Mean annual flow (GL/year)
Euston 6340.7 -2465.2
280.4 -2299.7
3875.4 0.9 N/A -6.0 10.7 6621.1 1.8 N/A -7.0 -1763.1
4040.9 0.9 N/A -2.4 20.7
Flow to South Australia 6250.3 -2644.4
307.2 -2459.6
3605.9 0.8 N/A -5.2 8.5 6557.5 1.9 N/A -3.9 -1900.6
3790.7 1.0 N/A -3.4 18.0
Barrages 4469.8 -2657.4
356.4 -2420.6
1812.4 0.8 N/A -3.8 7.2 4826.2 1.9 N/A -2.9 -1852.8
2049.2 1.1 N/A 1.2 20.8
Average Salinities (EC)
Yarrawonga 63.1 2.4 -0.1 2.2 65.5 -0.2 N/A 0.1 0.2 63.1 -0.1 N/A 0.2 0.3 65.3 -0.2 N/A 0.1 0.3
Torrumbarry 116.5 2.6 3.1 3.0 119.0 -0.2 N/A 0.7 4.2 119.6 -0.3 N/A 1.1 -5.6 119.5 -0.2 N/A 0.9 4.8
Swan Hill 269.4 14.3 7.8 29.3 283.7 0.0 N/A 3.2 1.8 277.2 -1.2 N/A 3.7 6.5 298.7 0.3 N/A 3.7 11.9
Stevens Weir 84.8 10.0 -0.7 9.6 94.8 -0.4 N/A -0.3 0.8 84.1 -0.1 N/A -0.1 2.9 94.4 -0.3 N/A -0.1 0.7
Kyalite 327.1 63.4 -16.0 62.9 390.5 2.0 N/A -11.3 14.2 311.1 2.6 N/A -10.4 22.3 390.0 4.0 N/A -9.9 10.5
Wakool Junction 275.8 31.1 3.4 41.0 306.8 0.1 N/A 0.8 2.9 279.2 -0.3 N/A -0.2 13.9 316.8 0.7 N/A 0.5 6.5
Red Cliffs 307.0 45.4 -1.8 45.8 352.4 0.2 N/A 0.3 1.0 305.3 0.3 N/A -1.3 16.9 352.8 0.7 N/A 0.6 5.7
Merbein 329.7 56.1 -4.5 53.0 385.8 0.5 N/A 0.4 -0.1 325.2 0.6 N/A -1.5 20.5 382.7 1.0 N/A 1.0 5.9
Lock 9 359.4 53.3 -6.9 54.0 412.7 0.4 N/A 1.1 0.3 352.5 1.0 N/A -2.7 15.2 413.4 1.7 N/A 0.3 5.0
Renmark 404.2 96.3 -8.8 96.5 500.5 -0.7 N/A 0.1 1.3 395.4 0.6 N/A -3.7 29.3 500.7 1.1 N/A -0.9 3.7
Berri 445.4 135.2 -12.8 129.3 580.6 -0.9 N/A 0.7 0.2 432.6 0.7 N/A -3.7 39.7 574.7 1.1 N/A -1.5 3.9
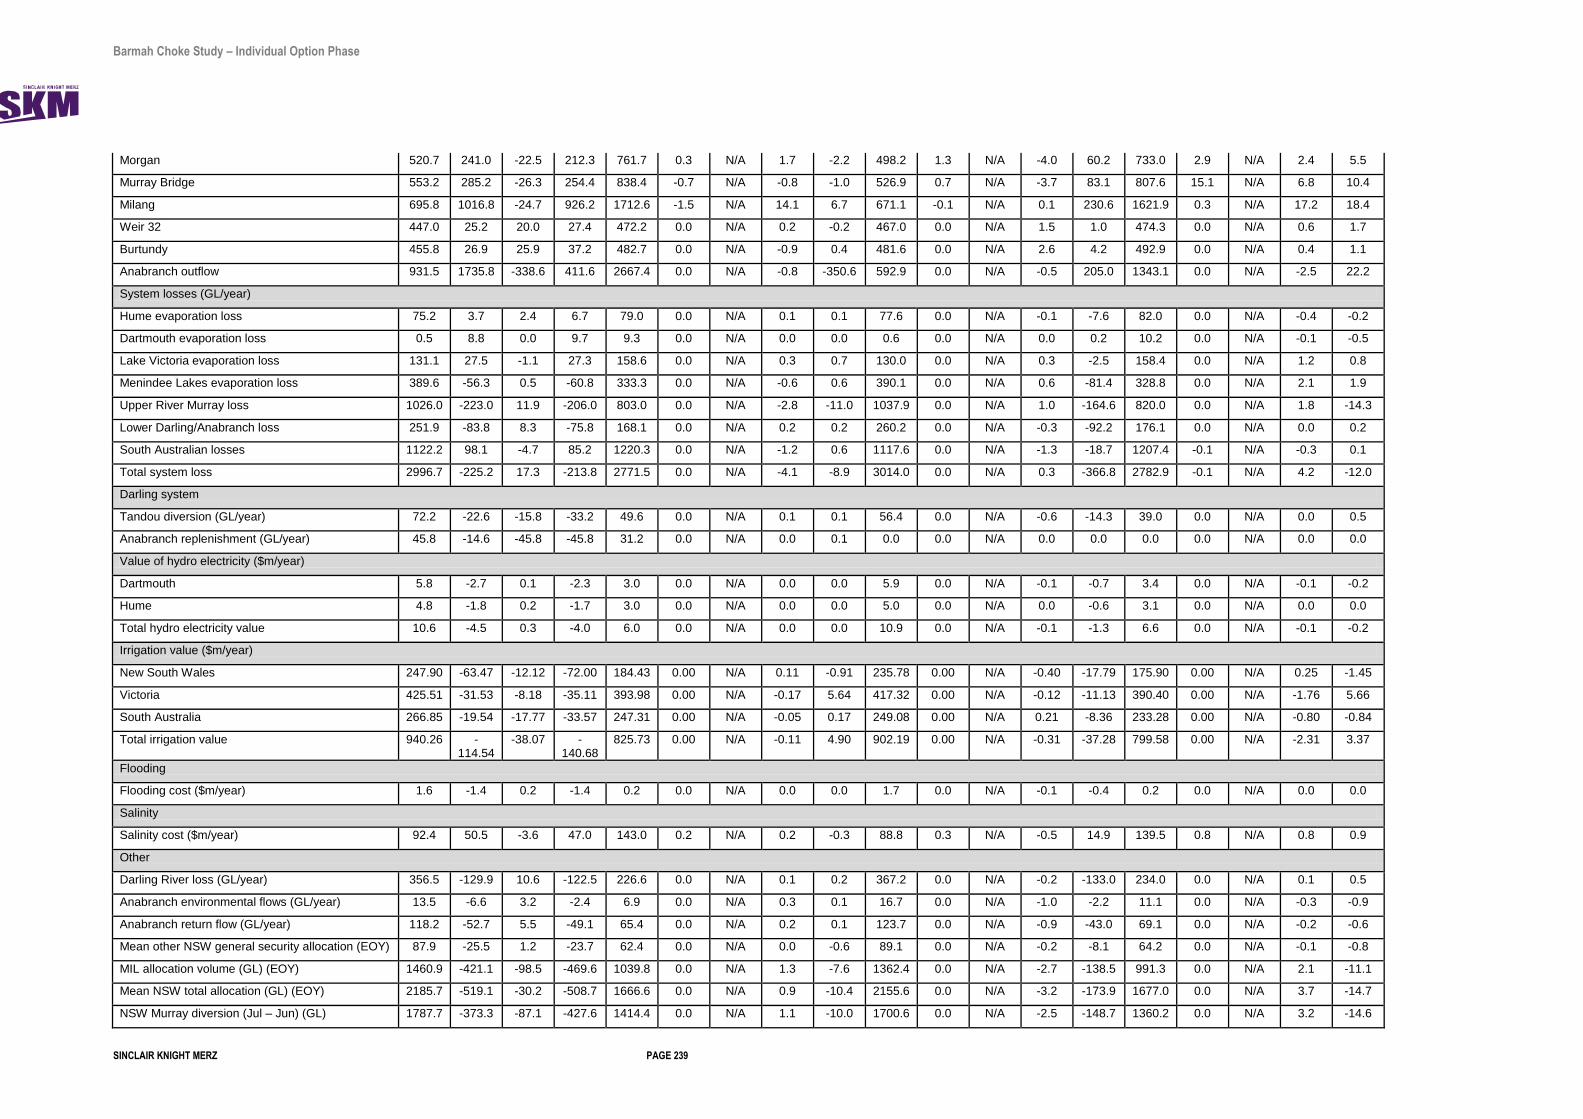
Barmah Choke Study – Individual Option Phase
SINCLAIR KNIGHT MERZ PAGE 239
Morgan 520.7 241.0 -22.5 212.3 761.7 0.3 N/A 1.7 -2.2 498.2 1.3 N/A -4.0 60.2 733.0 2.9 N/A 2.4 5.5
Murray Bridge 553.2 285.2 -26.3 254.4 838.4 -0.7 N/A -0.8 -1.0 526.9 0.7 N/A -3.7 83.1 807.6 15.1 N/A 6.8 10.4
Milang 695.8 1016.8 -24.7 926.2 1712.6 -1.5 N/A 14.1 6.7 671.1 -0.1 N/A 0.1 230.6 1621.9 0.3 N/A 17.2 18.4
Weir 32 447.0 25.2 20.0 27.4 472.2 0.0 N/A 0.2 -0.2 467.0 0.0 N/A 1.5 1.0 474.3 0.0 N/A 0.6 1.7
Burtundy 455.8 26.9 25.9 37.2 482.7 0.0 N/A -0.9 0.4 481.6 0.0 N/A 2.6 4.2 492.9 0.0 N/A 0.4 1.1
Anabranch outflow 931.5 1735.8 -338.6 411.6 2667.4 0.0 N/A -0.8 -350.6 592.9 0.0 N/A -0.5 205.0 1343.1 0.0 N/A -2.5 22.2
System losses (GL/year)
Hume evaporation loss 75.2 3.7 2.4 6.7 79.0 0.0 N/A 0.1 0.1 77.6 0.0 N/A -0.1 -7.6 82.0 0.0 N/A -0.4 -0.2
Dartmouth evaporation loss 0.5 8.8 0.0 9.7 9.3 0.0 N/A 0.0 0.0 0.6 0.0 N/A 0.0 0.2 10.2 0.0 N/A -0.1 -0.5
Lake Victoria evaporation loss 131.1 27.5 -1.1 27.3 158.6 0.0 N/A 0.3 0.7 130.0 0.0 N/A 0.3 -2.5 158.4 0.0 N/A 1.2 0.8
Menindee Lakes evaporation loss 389.6 -56.3 0.5 -60.8 333.3 0.0 N/A -0.6 0.6 390.1 0.0 N/A 0.6 -81.4 328.8 0.0 N/A 2.1 1.9
Upper River Murray loss 1026.0 -223.0 11.9 -206.0 803.0 0.0 N/A -2.8 -11.0 1037.9 0.0 N/A 1.0 -164.6 820.0 0.0 N/A 1.8 -14.3
Lower Darling/Anabranch loss 251.9 -83.8 8.3 -75.8 168.1 0.0 N/A 0.2 0.2 260.2 0.0 N/A -0.3 -92.2 176.1 0.0 N/A 0.0 0.2
South Australian losses 1122.2 98.1 -4.7 85.2 1220.3 0.0 N/A -1.2 0.6 1117.6 0.0 N/A -1.3 -18.7 1207.4 -0.1 N/A -0.3 0.1
Total system loss 2996.7 -225.2 17.3 -213.8 2771.5 0.0 N/A -4.1 -8.9 3014.0 0.0 N/A 0.3 -366.8 2782.9 -0.1 N/A 4.2 -12.0
Darling system
Tandou diversion (GL/year) 72.2 -22.6 -15.8 -33.2 49.6 0.0 N/A 0.1 0.1 56.4 0.0 N/A -0.6 -14.3 39.0 0.0 N/A 0.0 0.5
Anabranch replenishment (GL/year) 45.8 -14.6 -45.8 -45.8 31.2 0.0 N/A 0.0 0.1 0.0 0.0 N/A 0.0 0.0 0.0 0.0 N/A 0.0 0.0
Value of hydro electricity ($m/year)
Dartmouth 5.8 -2.7 0.1 -2.3 3.0 0.0 N/A 0.0 0.0 5.9 0.0 N/A -0.1 -0.7 3.4 0.0 N/A -0.1 -0.2
Hume 4.8 -1.8 0.2 -1.7 3.0 0.0 N/A 0.0 0.0 5.0 0.0 N/A 0.0 -0.6 3.1 0.0 N/A 0.0 0.0
Total hydro electricity value 10.6 -4.5 0.3 -4.0 6.0 0.0 N/A 0.0 0.0 10.9 0.0 N/A -0.1 -1.3 6.6 0.0 N/A -0.1 -0.2
Irrigation value ($m/year)
New South Wales 247.90 -63.47 -12.12 -72.00 184.43 0.00 N/A 0.11 -0.91 235.78 0.00 N/A -0.40 -17.79 175.90 0.00 N/A 0.25 -1.45
Victoria 425.51 -31.53 -8.18 -35.11 393.98 0.00 N/A -0.17 5.64 417.32 0.00 N/A -0.12 -11.13 390.40 0.00 N/A -1.76 5.66
South Australia 266.85 -19.54 -17.77 -33.57 247.31 0.00 N/A -0.05 0.17 249.08 0.00 N/A 0.21 -8.36 233.28 0.00 N/A -0.80 -0.84
Total irrigation value 940.26 -114.54
-38.07 -140.68
825.73 0.00 N/A -0.11 4.90 902.19 0.00 N/A -0.31 -37.28 799.58 0.00 N/A -2.31 3.37
Flooding
Flooding cost ($m/year) 1.6 -1.4 0.2 -1.4 0.2 0.0 N/A 0.0 0.0 1.7 0.0 N/A -0.1 -0.4 0.2 0.0 N/A 0.0 0.0
Salinity
Salinity cost ($m/year) 92.4 50.5 -3.6 47.0 143.0 0.2 N/A 0.2 -0.3 88.8 0.3 N/A -0.5 14.9 139.5 0.8 N/A 0.8 0.9
Other
Darling River loss (GL/year) 356.5 -129.9 10.6 -122.5 226.6 0.0 N/A 0.1 0.2 367.2 0.0 N/A -0.2 -133.0 234.0 0.0 N/A 0.1 0.5
Anabranch environmental flows (GL/year) 13.5 -6.6 3.2 -2.4 6.9 0.0 N/A 0.3 0.1 16.7 0.0 N/A -1.0 -2.2 11.1 0.0 N/A -0.3 -0.9
Anabranch return flow (GL/year) 118.2 -52.7 5.5 -49.1 65.4 0.0 N/A 0.2 0.1 123.7 0.0 N/A -0.9 -43.0 69.1 0.0 N/A -0.2 -0.6
Mean other NSW general security allocation (EOY) 87.9 -25.5 1.2 -23.7 62.4 0.0 N/A 0.0 -0.6 89.1 0.0 N/A -0.2 -8.1 64.2 0.0 N/A -0.1 -0.8
MIL allocation volume (GL) (EOY) 1460.9 -421.1 -98.5 -469.6 1039.8 0.0 N/A 1.3 -7.6 1362.4 0.0 N/A -2.7 -138.5 991.3 0.0 N/A 2.1 -11.1
Mean NSW total allocation (GL) (EOY) 2185.7 -519.1 -30.2 -508.7 1666.6 0.0 N/A 0.9 -10.4 2155.6 0.0 N/A -3.2 -173.9 1677.0 0.0 N/A 3.7 -14.7
NSW Murray diversion (Jul – Jun) (GL) 1787.7 -373.3 -87.1 -427.6 1414.4 0.0 N/A 1.1 -10.0 1700.6 0.0 N/A -2.5 -148.7 1360.2 0.0 N/A 3.2 -14.6

Barmah Choke Study – Individual Option Phase
SINCLAIR KNIGHT MERZ PAGE 240
Appendix F Financial analysis of options

Murray Darling Basin AuthorityBarmah Choke Study: Financial Analysis of Options
Primary Developer: Mani Manivasakan, Daniel Besley
General Cover Notes:
Undertaken as part of the Barmah Choke assessment process
Go to Table of Contents

Table of ContentsBarmah Choke Study: Financial Analysis of Options
Section & Sheet Titles Page
3
4
5
12
13
14
15
16
17
18
19
20
21
22
23
24
25
26
Total Pages: 26
n. Option 15: Murray Goulburn interconnector (2000ML/d)
h. Option 7b: 16 GL Storage at The Drop on Mulwala Canal (Option 3A from previous study)
i. Option 10a: Victorian Forest Channels (Kynmer Creek Route)
j. Option 10b: Victorian Forest Channels (Gulf Creek Route)
m. Option 13: Increased escape capacity to Broken Creek
k. Option 11: Increased diversion through the Wakool River
l. Option 12: Increased escape capacity to the Edward River
g. Option 7a: 11 GL Storage at The Drop on Mulwala Canal (Option 2A from previous study)
1. Cost Summaries and Risk Costs Analysis
a. Summary results
b. Monte Carlo Modelling Results
2. Cost Assumptions
a. Option 4: Mildura Weir
d. Option 6a: Euston Weir - Raise the minimum operating level of Euston Weir by 0.5 m to 48.1 m AHD
e. Option 6b: Euston Weir - Lower the minimum operating level of Euston Weir by 1.5 m to 46.1 m AHD
f. Option 6c: Euston Weir - Raise the minimum operating level of Euston Weir by 0.5 m to 48.1 m AHD and Lower the minimum operating level of Euston Weir by 1.5 m to 46.1 m AHD
Go to Cover Sheet
b. Option 5a: Lower operating level Lake Mulwala by 100 mm
c. Option 5b: Lower operating level Lake Mulwala by 500 mm

Cost Summaries and Risk Costs AnalysisSection 1.Barmah Choke Study: Financial Analysis of Options
Go to Table of Contents
DB_08_BCS_Options_Costing_Model.xlsx
Results_SC
Printed: 4:08 PM on 4/02/2011 Page 3 of 26

Summary results
Barmah Choke Study: Financial Analysis of Options
Capital Cost
(base estimate, incl
contingency)
Capital Cost
(incl, contingency and
risk - 90th percentile)
Operating cost
(base estimate)
Operating Cost
(incl, contingency and
risk - 90th percentile)
Present Value
20 years @6%
(base estimate)
Present Value
20 years @6%
(90th percentile)
Option 4: Mildura Weir $ 1.68 m $ 1.91 m - - $ 1.68 m $ 1.91 m
Option 5a: Lower operating level Lake Mulwala by 100 mm $ 2.62 m $ 2.89 m $ 0.07 m $ 0.07 m $ 3.40 m $ 3.71 m
Option 5b: Lower operating level Lake Mulwala by 500 mm $ 8.10 m $ 9.18 m $ 0.27 m $ 0.28 m $ 11.23 m $ 12.44 m
Option 6a: Euston Weir - Raise the minimum operating level
of Euston Weir by 0.5 m to 48.1 m AHD$ 0.83 m $ 0.95 m - - $ 0.83 m $ 0.95 m
Option 6b: Euston Weir - Lower the minimum operating level
of Euston Weir by 1.5 m to 46.1 m AHD$ 1.99 m $ 2.24 m - - $ 1.99 m $ 2.24 m
Option 6c: Euston Weir - Raise the minimum operating level
of Euston Weir by 0.5 m to 48.1 m AHD and Lower the $ 2.26 m $ 2.62 m - - $ 2.26 m $ 2.62 m
Option 7a: 11 GL Storage at The Drop on Mulwala Canal
(Option 2A from previous study)$ 56.37 m $ 63.08 m $ 1.27 m $ 1.42 m $ 70.91 m $ 79.31 m
Option 7b: 16 GL Storage at The Drop on Mulwala Canal
(Option 3A from previous study)$ 70.14 m $ 78.66 m $ 1.49 m $ 1.67 m $ 87.23 m $ 97.81 m
Option 10a: Victorian Forest Channels (Kynmer Creek
Route)$ 90.08 m $ 109.56 m $ 0.66 m $ 0.86 m $ 97.66 m $ 119.46 m
Option 10b: Victorian Forest Channels (Gulf Creek Route) $ 57.14 m $ 68.65 m $ 0.46 m $ 0.59 m $ 62.45 m $ 75.36 m
Option 11: Increased diversion through the Wakool River $ 1.93 m $ 2.15 m $ 0.42 m $ 0.42 m $ 6.75 m $ 6.97 m
Option 12: Increased escape capacity to the Edward River $ 2.55 m $ 3.01 m $ 0.42 m $ 0.42 m $ 7.37 m $ 7.83 m
Option 13: Increased escape capacity to Broken Creek $ 16.54 m $ 18.48 m $ 0.34 m $ 0.37 m $ 20.43 m $ 22.71 m
Option 15: Murray Goulburn interconnector (2000ML/d) $ 370.35 m $ 424.86 m $ 2.09 m $ 2.62 m $ 394.27 m $ 454.92 m
A 1 GL storage at The Drop (quarry site) $ 5.00 m $ 0.10 m $ 6.15 m
A 5 GL storage at The Drop (quarry site) $ 10.00 m $ 0.20 m $ 12.29 m
Increasing the capacity of the Edward River escape by
1,000 ML/day $ 6.50 m $ 0.13 m $ 7.99 m
Go to Table of Contents
DB_08_BCS_Options_Costing_Model.xlsx
Summ_results_BO
Printed: 4:08 PM on 4/02/2011 Page 4 of 26

Monte Carlo Modelling ResultsBarmah Choke Study: Financial Analysis of Options
Forecast: Capex: Option 4- Mildura Weir
Percentiles: Forecast values
50 $1,710,639.62 90 $1,912,489.79
Forecast: Capex: Option 5a: Lower operating level Lake Mulwala by 100 mm Forecast: Opex: Option 5a: Lower operating level Lake Mulwala by 100 mm
Percentiles: Forecast values Percentiles: Forecast values
50 $2,779,095.96 50 $68,750.07 90 $2,885,125.53 90 $72,261.07
Go to Table of Contents
DB_08_BCS_Options_Costing_Model.xlsx
Model_results_BO
Printed: 4:08 PM on 4/02/2011 Page 5 of 26

Monte Carlo Modelling ResultsBarmah Choke Study: Financial Analysis of Options
Forecast: Capex: Option 5b: Lower operating level Lake Mulwala by 500 mm Forecast: Opex: Option 5b: Lower operating level Lake Mulwala by 500 mm
Forecast: Capex: Option 5b: Lower operating level Lake Mulwala by 500 mm (cont'd) Percentiles: Forecast values
50 $276,003 Percentiles: Forecast values 90 $284,246
50 $8,686,639.19 90 $9,181,640.37
Option 6a: Euston Weir - Raise the minimum operating level of Euston Weir by 0.5 m to 48.1 m AHD
Percentiles: Forecast values
50 $844,301.14 90 $949,084.36
DB_08_BCS_Options_Costing_Model.xlsx
Model_results_BO
Printed: 4:08 PM on 4/02/2011 Page 6 of 26

Monte Carlo Modelling ResultsBarmah Choke Study: Financial Analysis of Options
Option 6b: Euston Weir - Lower the minimum operating level of Euston Weir by 1.5 m to 46.1 m AHD
Percentiles: Forecast values
50 $2,065,278.85 90 $2,241,010.34
Option 6c: Euston Weir - Raise the minimum operating level of Euston Weir by 0.5 m to 48.1 m AHD and Lower the minimum operating level of Euston Weir by 1.5 m to 46.1 m AHD
Percentiles: Forecast values
50 $2,370,971.11 90 $2,619,974.33
DB_08_BCS_Options_Costing_Model.xlsx
Model_results_BO
Printed: 4:08 PM on 4/02/2011 Page 7 of 26

Monte Carlo Modelling ResultsBarmah Choke Study: Financial Analysis of Options
Option 7a: 11 GL Storage at The Drop on Mulwala Canal (Option 2A from previous study) Forecast: Opex: Option 7a: 11 ML Storage at The Drop on Mulwala Canal (Option 2A from previous study)
Percentiles: Forecast values Percentiles: Forecast values
50 $60,532,033.68 50 ###########90 $63,077,829.87 90 ###########
Forecast: Capex: Option 7b: 16 ML Storage at The Drop on Mulwala Canal (Option 3A from previous study) Forecast: Opex: Option 7b: 16 ML Storage at The Drop on Mulwala Canal (Option 3A from previous study)
Percentiles: Forecast values Percentiles: Forecast values
50 $75,248,195.88 50 $1,538,341.02 90 $78,663,338.14 90 $1,669,453.89
DB_08_BCS_Options_Costing_Model.xlsx
Model_results_BO
Printed: 4:08 PM on 4/02/2011 Page 8 of 26

Monte Carlo Modelling ResultsBarmah Choke Study: Financial Analysis of Options
Forecast: Capex: Option 10a -Victorian Forest Channels (Kynmer Creek Route) Forecast: Opex: Option 10a -Victorian Forest Channels (Kynmer Creek Route)
Percentiles: Forecast values Percentiles: Forecast values
50 $100,929,012 50 $724,476.66 90 $109,562,854 90 $862,661.44
Forecast: Capex: Option 10b -Victorian Forest Channels (Gulf Creek Route) Forecast: Opex: Option 10b -Victorian Forest Channels (Gulf Creek Route)
Percentiles: Forecast values
50 $63,603,201 Percentiles: Forecast values
90 $68,651,193 50 $502,658.11 90 $585,314.19
DB_08_BCS_Options_Costing_Model.xlsx
Model_results_BO
Printed: 4:08 PM on 4/02/2011 Page 9 of 26
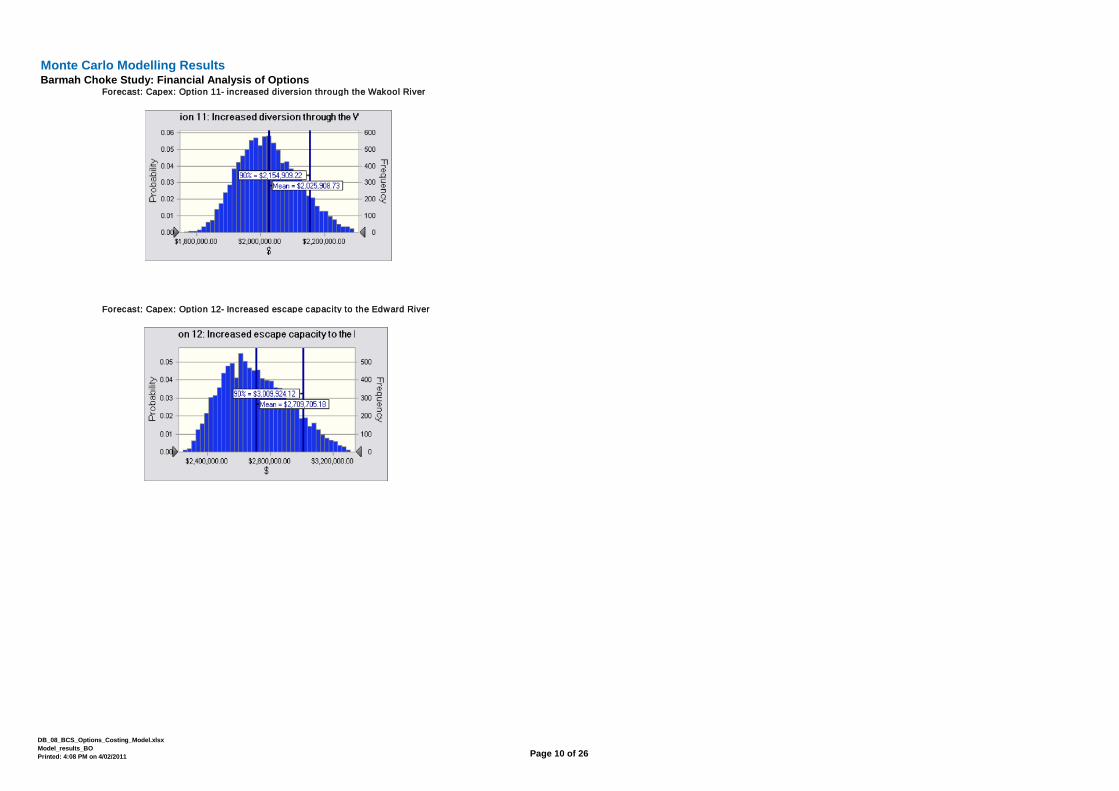
Monte Carlo Modelling ResultsBarmah Choke Study: Financial Analysis of Options
Forecast: Capex: Option 11- increased diversion through the Wakool River
Percentiles: Forecast values
50 $2,018,903.90 90 $2,154,909.22
Forecast: Capex: Option 12- Increased escape capacity to the Edward River
Percentiles: Forecast values
50 $2,685,758.83 90 $3,009,924.12
DB_08_BCS_Options_Costing_Model.xlsx
Model_results_BO
Printed: 4:08 PM on 4/02/2011 Page 10 of 26

Monte Carlo Modelling ResultsBarmah Choke Study: Financial Analysis of Options
Forecast: Capex: Option 13: Increased escape capacity to Broken Creek Forecast: Opex: Option 13: Increased escape capacity to Broken Creek
Percentiles: Forecast values Percentiles: Forecast values
50 $17,698,036.18 50 $346,060.25 90 $18,481,124.81 90 $368,511.42
Forecast: Capex: Option 15: Murray Goulburn interconnector (2000ML/d) Forecast: Opex: Option 15: Murray Goulburn interconnector (2000ML/d)
Percentiles: Forecast values
50 $397,152,697.69 Percentiles: Forecast values
90 $424,860,828.82 50 $2,195,317.20 90 $2,620,614.12
DB_08_BCS_Options_Costing_Model.xlsx
Model_results_BO
Printed: 4:08 PM on 4/02/2011 Page 11 of 26

Cost AssumptionsSection 2.Barmah Choke Study: Financial Analysis of Options
Section Cover Notes:
[Insert section cover note 1]
[Insert section cover note 2]
[Insert section cover note 3]
Go to Table of Contents
DB_08_BCS_Options_Costing_Model.xlsx
Assumptions_SC
Printed: 4:08 PM on 4/02/2011 Page 12 of 26

BA Option 4: Mildura Weir
Barmah Choke Study: Financial Analysis of Options
Design and Administration Costs (%) 20.0%
Contingency (%) 40.0%
CAPITAL COSTS
Cost item Assumptions / Sources Min Expected Max Min Expected Max Min Expected Max
Extension of Irrigators Pumps $ - $ - $ - Pumps 1 1 1 Item $ 750,000.00 $ 900,000.00 $ 1,200,000.00 $ 750,000 $ 900,000 $ 1,200,000
Mooring Bouys and Jetties $ - $ - $ - Works 1 1 1 Item $ 75,000.00 $ 100,000.00 $ 125,000.00 $ 75,000 $ 100,000 $ 125,000
TOTAL RAW CAPITAL COST 825,000$ 1,000,000$ 1,325,000$
Design and Administration Costs (%) 165,000$ 200,000$ 265,000$
Contingency (%) 396,000$ 480,000$ 636,000$
TOTAL CAPITAL COST 1,386,000$ 1,680,000$ 2,226,000$
ANNUAL COSTS
Cost item Assumptions / Sources Min Expected Max Min Expected Max Min Expected Max
NA $ - $ - $ - TOTAL RAW ANNUAL COST -$ -$ -$
Contingency (%) -$ -$ -$
TOTAL ANNUAL COST -$ -$ -$
Cost Analysis
Quantity UNIT Price or Rates Cost Range
Go to Table of Contents
Cost AnalysisQuantity UNIT Price or Rates Cost Range
DB_08_BCS_Options_Costing_Model.xlsx
Option_4_BA
Printed: 4:08 PM on 4/02/2011 Page: 13 of 26

BA Option 5a: Lower operating level Lake Mulwala by 100 mm
Barmah Choke Study: Financial Analysis of Options
Design and Administration Costs (%) 20.0%
Contingency (%) 40.0%
CAPITAL COSTS
Cost item Assumptions / Sources Min Expected Max Min Expected Max Min Expected Max
Remove 8-Mile Weir Regulator 1 1 1 Item $ 22,500.00 $ 25,000.00 $ 32,000.00 $ 22,500 $ 25,000 $ 32,000 Site Establishment 1 1 1 Item $ 45,000.00 $ 50,000.00 $ 65,000.00 $ 45,000 $ 50,000 $ 65,000 Remove and dispose existing structure 2400 2400 3000 m3 $ 14.00 $ 16.00 $ 18.00 $ 33,600 $ 38,400 $ 54,000 Re-instate Channel 1 1 1 Item $ 135,000.00 $ 150,000.00 $ 200,000.00 $ 135,000 $ 150,000 $ 200,000 Ultrasonic Flow Measurement Device
Channel Remodelling $ - $ - $ - Channel Deepening and disposing 30000 30000 36000 m3 $ 7.20 $ 8.00 $ 10.00 $ 216,000 $ 240,000 $ 360,000 Excavation for clay lining (600 mm) 6500 6500 9000 m3 $ 2.00 $ 2.20 $ 3.00 $ 13,000 $ 14,300 $ 27,000 450 mm clay lining 5000 5000 7500 m3 $ 14.00 $ 16.00 $ 18.00 $ 70,000 $ 80,000 $ 135,000 150 mm crush rock lining 1700 1700 2300 m3 $ 54.00 $ 60.00 $ 78.00 $ 91,800 $ 102,000 $ 179,400 Miscellaneous items (incl. Environmental
clearances, fence removal & reinstatement, silt
fences)
3400 3400 4500 m $ 8.00 $ 9.00 $ 12.00 $ 27,200 $ 30,600 $ 54,000
Modify Irrigation Supply $ - $ - $ - Extend pump intakes 10 10 12 No. $ 9,000.00 $ 10,000.00 $ 13,000.00 $ 90,000 $ 100,000 $ 156,000 Replace water wheels with pumps 2 2 3 No. $ 22,500.00 $ 25,000.00 $ 32,000.00 $ 45,000 $ 50,000 $ 96,000 O&M for pumps in lieu of wheels 2 2 3 No. $ 9,000.00 $ 10,000.00 $ 13,000.00 $ 18,000 $ 20,000 $ 39,000
Bridge Works $ - $ - $ - Beaching and pipe works 3 3 4 No. $ 36,000.00 $ 40,000.00 $ 52,000.00 $ 108,000 $ 120,000 $ 208,000
Offtake Works $ - $ - $ - Modify fish passage structure 1 1 1 No. $ 360,000.00 $ 400,000.00 $ 500,000.00 $ 360,000 $ 400,000 $ 500,000
Modify Log Barrier $ - $ - $ - Remove half the log barriers 1 1 1 No. $ 36,000.00 $ 40,000.00 $ 52,000.00 $ 36,000 $ 40,000 $ 52,000 Provide a new floating log barrier upstream 1 1 1 No. $ 72,000.00 $ 80,000.00 $ 100,000.00 $ 72,000 $ 80,000 $ 100,000
Tree Stump Removal $ - $ - $ - Not required 0 0 $ - $ - $ - $ -
Edge Treatment $ - $ - $ - Not required 0 0 $ - $ - $ - $ -
Jetty Extension $ - $ - $ - Not required 0 0 $ - $ - $ - $ -
Navigational Channel Works $ - $ - $ - Confirm new area suitable for navigation 200 200 250 hours $ 90.00 $ 100.00 $ 130.00 $ 18,000 $ 20,000 $ 32,500
$ - $ - $ - TOTAL RAW CAPITAL COST 1,401,100$ 1,560,300$ 2,289,900$
Design and Administration Costs (%) 280,220$ 312,060$ 457,980$
Contingency (%) 672,528$ 748,944$ 1,099,152$
TOTAL CAPITAL COST 2,353,848$ 2,621,304$ 3,847,032$
ANNUAL COSTS
Cost item Assumptions / Sources Min Expected Max Min Expected Max Min Expected Max
Maintance Cost 1% of capital 1 1 1 Item $ 16,396.80 $ 18,259.92 $ 27,331.92 $ 16,397 $ 18,260 $ 27,332 Operational Cost no change to existing 1 1 1 Item $ - $ - $ - $ - $ - $ - Power station - loss of income 1 1 1 Item $ 38,100.00 $ 38,100.00 $ 38,100.00 $ 38,100 $ 38,100 $ 38,100
$ - $ - $ - TOTAL RAW ANNUAL COST 54,497$ 56,360$ 65,432$
Contingency (%) 10,899$ 11,272$ 13,086$
TOTAL ANNUAL COST 65,396$ 67,632$ 78,518$
Cost Analysis
Quantity UNIT Price or Rates Cost Range
Go to Table of Contents
Cost AnalysisQuantity UNIT Price or Rates Cost Range
DB_08_BCS_Options_Costing_Model.xlsx
Option_5a_BA
Printed: 4:08 PM on 4/02/2011 Page: 14 of 26

BA Option 5b: Lower operating level Lake Mulwala by 500 mm
Barmah Choke Study: Financial Analysis of Options
Design and Administration Costs (%) 20.0%
Contingency (%) 40.0%
CAPITAL COSTS
Cost item Assumptions / Sources Min Expected Max Min Expected Max Min Expected Max
Remove 8-Mile Weir Regulator 1 1 1 Item $ 22,500.00 $ 25,000.00 $ 32,000.00 $ 22,500 $ 25,000 $ 32,000 Site Establishment 1 1 1 Item $ 45,000.00 $ 50,000.00 $ 65,000.00 $ 45,000 $ 50,000 $ 65,000 Remove and dispose existing structure 2400 2400 3000 m3 $ 14.00 $ 16.00 $ 18.00 $ 33,600 $ 38,400 $ 54,000 Re-instate Channel 1 1 1 Item $ 135,000.00 $ 150,000.00 $ 200,000.00 $ 135,000 $ 150,000 $ 200,000 Ultrasonic Flow Measurement Device
Channel RemodellingChannel Deepening and disposing 170000 170000 220000 m3 $ 7.20 $ 8.00 $ 10.00 $ 1,224,000 $ 1,360,000 $ 2,200,000 Excavation for clay lining (600 mm) 29000 29000 37000 m3 $ 2.00 $ 2.20 $ 3.00 $ 58,000 $ 63,800 $ 111,000 450 mm clay lining 22500 22500 29000 m3 $ 14.00 $ 16.00 $ 18.00 $ 315,000 $ 360,000 $ 522,000 150 mm crush rock lining 7500 7500 10000 m3 $ 54.00 $ 60.00 $ 78.00 $ 405,000 $ 450,000 $ 780,000 Miscellaneous items (incl. Environmental
clearances, fence removal & reinstatement, silt
fences)
13600 13600 18000 m $ 8.00 $ 9.00 $ 12.00 $ 108,800 $ 122,400 $ 216,000
Modify Irrigation SupplyExtend pump intakes 10 10 12 No. $ 9,000.00 $ 10,000.00 $ 13,000.00 $ 90,000 $ 100,000 $ 156,000 Replace water wheels with pumps 2 2 3 No. $ 22,500.00 $ 25,000.00 $ 32,000.00 $ 45,000 $ 50,000 $ 96,000 O&M for pumps in lieu of wheels 2 2 3 No. $ 9,000.00 $ 10,000.00 $ 13,000.00 $ 18,000 $ 20,000 $ 39,000 Suction work for irrigators from Lake 15 15 20 No. $ 4,500.00 $ 5,000.00 $ 6,500.00 $ 67,500 $ 75,000 $ 130,000
Bridge WorksBeaching and pipe works 11 11 14 No. $ 36,000.00 $ 40,000.00 $ 52,000.00 $ 396,000 $ 440,000 $ 728,000
Offtake WorksMinor modifications to existing structure 1 1 1 No. $ 270,000.00 $ 300,000.00 $ 360,000.00 $ 270,000 $ 300,000 $ 360,000 Modify fish passage structure 1 1 1 No. $ 360,000.00 $ 400,000.00 $ 500,000.00 $ 360,000 $ 400,000 $ 500,000
Modify Log BarrierRemove half the log barriers 1 1 1 No. $ 36,000.00 $ 40,000.00 $ 52,000.00 $ 36,000 $ 40,000 $ 52,000 Provide a new floating log barrier upstream 1 1 1 No. $ 72,000.00 $ 80,000.00 $ 100,000.00 $ 72,000 $ 80,000 $ 100,000
Tree Stump RemovalIdentification, lowering and securing of lowered
logs1000 1000 1300
person
hours $ 67.50 $ 75.00 $ 95.00 $ 67,500 $ 75,000 $ 123,500
Edge Treatmentretaining walls to effected lakeside properties 4000 4000 5200 m2 $ 45.00 $ 50.00 $ 65.00 $ 180,000 $ 200,000 $ 338,000
Jetty Extensionjetty extension 40 40 52 $ 9,000.00 $ 10,000.00 $ 13,000.00 $ 360,000 $ 400,000 $ 676,000
Navigational Channel WorksConfirm new area suitable for navigation 200 200 260 hours $ 90.00 $ 100.00 $ 130.00 $ 18,000 $ 20,000 $ 33,800
$ - $ - $ - TOTAL RAW CAPITAL COST 4,326,900$ 4,819,600$ 7,512,300$
Design and Administration Costs (%) 865,380$ 963,920$ 1,502,460$
Contingency (%) 2,076,912$ 2,313,408$ 3,605,904$
TOTAL CAPITAL COST 7,269,192$ 8,096,928$ 12,620,664$
ANNUAL COSTS
Cost item Assumptions / Sources Min Expected Max Min Expected Max Min Expected Max
Maintance Cost 1% of capital 1 1 1 Item $ 33,873.84 $ 37,820.16 $ 58,998.24 $ 33,874 $ 37,820 $ 58,998 Operational Cost no change to existing 1 1 1 Item $ - $ - $ - $ - $ - $ - Power station - loss of income 1 1 1 Item $ 190,100.00 $ 190,100.00 $ 190,100.00 $ 190,100 $ 190,100 $ 190,100
$ - $ - $ - TOTAL RAW ANNUAL COST 223,974$ 227,920$ 249,098$
Contingency (%) 44,795$ 45,584$ 49,820$
TOTAL ANNUAL COST 268,769$ 273,504$ 298,918$
Cost Analysis
Quantity UNIT Price or Rates Cost Range
Go to Table of Contents
Cost AnalysisQuantity UNIT Price or Rates Cost Range
DB_08_BCS_Options_Costing_Model.xlsx
Option_5b_BA
Printed: 4:08 PM on 4/02/2011 Page: 15 of 26

BA Option 6a: Euston Weir - Raise the minimum operating level of Euston Weir by 0.5 m to 48.1 m AHDBarmah Choke Study: Financial Analysis of Options
Design and Administration Costs (%) 20.0%
Contingency (%) 40.0%
CAPITAL COSTS
Cost item Assumptions / Sources Min Expected Max Min Expected Max Min Expected Max
Both Pump Suction Extenstion and Raising of
Pumps $ - $ - $ -
Small Pumps (<=80 mm) 9 14 18 no. $ 7,300.00 $ 8,000.00 $ 10,000.00 $ 65,700.00 $ 112,000.00 $ 180,000.00 Large Pumps(>80mm) 16 20 27 no. $ 9,800.00 $ 10,500.00 $ 13,000.00 $ 156,800.00 $ 210,000.00 $ 351,000.00
$ - $ - $ - Fencing 1 1 1 Item $ 7,500.00 $ 8,000.00 $ 10,000.00 $ 7,500.00 $ 8,000.00 $ 10,000.00
$ - $ - $ - Ruel Lagoon 1 1 1 Item $ - $ - $ - $ -
$ - $ - $ - Dry Lake 1 1 1 Item $ 40,000.00 $ 45,000.00 $ 55,000.00 $ 40,000.00 $ 45,000.00 $ 55,000.00
$ - $ - $ - Lake Bennane 1 1 1 Item $ 7,000.00 $ 8,000.00 $ 10,000.00 $ 7,000.00 $ 8,000.00 $ 10,000.00
$ - $ - $ - Bonyarical Creek 1 1 1 Item $ 10,000.00 $ 110,000.00 $ 140,000.00 $ 10,000.00 $ 110,000.00 $ 140,000.00
$ - $ - $ - Balranald Pump Station 1 1 1 Item $ 2,000.00 $ 2,500.00 $ 3,500.00 $ 2,000.00 $ 2,500.00 $ 3,500.00
$ - $ - $ - Robinvale Pump Station (Urban) Assumed that the pumps are high enough 1 1 1 Item $ - $ - $ - $ - $ - $ -
$ - $ - $ - Robinvale Pump Station (Irrigation) Assumed that the pumps are high enough 1 1 1 Item $ - $ - $ - $ - $ - $ -
$ - $ - $ - TOTAL RAW CAPITAL COST 289,000.00$ 495,500.00$ 749,500.00$
Design and Administration Costs (%) 57,800.00$ 99,100.00$ 149,900.00$
Contingency (%) 138,720.00$ 237,840.00$ 359,760.00$
TOTAL CAPITAL COST 485,520.00$ 832,440.00$ 1,259,160.00$
ANNUAL COSTS
Cost item Assumptions / Sources Min Expected Max Min Expected Max Min Expected Max
NA $ - $ - $ - TOTAL RAW ANNUAL COST -$ -$ -$
Contingency (%) -$ -$ -$
TOTAL ANNUAL COST -$ -$ -$
Go to Table of Contents
Cost AnalysisQuantity UNIT Price or Rates Cost Range
Cost Analysis
Quantity UNIT Price or Rates Cost Range
DB_08_BCS_Options_Costing_Model.xlsx
Option_6a_BA
Printed: 4:08 PM on 4/02/2011 Page: 16 of 26

BA Option 6b: Euston Weir - Lower the minimum operating level of Euston Weir by 1.5 m to 46.1 m AHDBarmah Choke Study: Financial Analysis of Options
Design and Administration Costs (%) 20.0%
Contingency (%) 40.0%
CAPITAL COSTS
Cost item Assumptions / Sources Min Expected Max Min Expected Max Min Expected Max
Pump Suction Extenstion $ - $ - $ - Small Pumps (<=80 mm) 4 4 6 no. $ 1,800.00 $ 2,000.00 $ 2,500.00 $ 7,200.00 $ 8,000.00 $ 15,000.00 Large Pumps(>80mm) 11 13 16 no. $ 2,300.00 $ 2,500.00 $ 3,000.00 $ 25,300.00 $ 32,500.00 $ 48,000.00
Pumps need LoweringSmall Pumps (<=80 mm) 4 4 6 no. $ 5,500.00 $ 6,000.00 $ 7,500.00 $ 22,000.00 $ 24,000.00 $ 45,000.00 Large Pumps(>80mm) 22 26 32 no. $ 7,500.00 $ 8,000.00 $ 10,000.00 $ 165,000.00 $ 208,000.00 $ 320,000.00
Both Pump Suction Extenstion and Lowering of
PumpsSmall Pumps (<=80 mm) 23 27 32 no. $ 7,300.00 $ 8,000.00 $ 10,000.00 $ 167,900.00 $ 216,000.00 $ 320,000.00 Large Pumps(>80mm) 45 50 60 no. $ 9,800.00 $ 10,500.00 $ 13,000.00 $ 441,000.00 $ 525,000.00 $ 780,000.00
$ - $ - $ - Fencing 1 1 1 Item $ 7,500.00 $ 8,000.00 $ 10,000.00 $ 7,500.00 $ 8,000.00 $ 10,000.00
$ - $ - $ - Dry Lake 1 1 1 Item $ 40,000.00 $ 45,000.00 $ 55,000.00 $ 40,000.00 $ 45,000.00 $ 55,000.00
$ - $ - $ - Lake Bennane 1 1 1 Item $ 7,000.00 $ 8,000.00 $ 10,000.00 $ 7,000.00 $ 8,000.00 $ 10,000.00
$ - $ - $ - Bonyarical Creek 1 1 1 Item $ 10,000.00 $ 110,000.00 $ 140,000.00 $ 10,000.00 $ 110,000.00 $ 140,000.00
$ - $ - $ - Balranald Pump Station 1 1 1 Item $ 2,000.00 $ 2,500.00 $ 3,500.00 $ 2,000.00 $ 2,500.00 $ 3,500.00
TOTAL RAW CAPITAL COST 894,900.00$ 1,187,000.00$ 1,746,500.00$
Design and Administration Costs (%) 178,980.00$ 237,400.00$ 349,300.00$
Contingency (%) 429,552.00$ 569,760.00$ 838,320.00$
TOTAL CAPITAL COST 1,503,432.00$ 1,994,160.00$ 2,934,120.00$
ANNUAL COSTS
Cost item Assumptions / Sources Min Expected Max Min Expected Max Min Expected Max
NA $ - $ - $ - TOTAL RAW ANNUAL COST -$ -$ -$
Contingency (%) -$ -$ -$
TOTAL ANNUAL COST -$ -$ -$
Go to Table of Contents
Cost AnalysisQuantity UNIT Price or Rates Cost Range
Cost Analysis
Quantity UNIT Price or Rates Cost Range
DB_08_BCS_Options_Costing_Model.xlsx
Option_6b_BA
Printed: 4:08 PM on 4/02/2011 Page: 17 of 26

BA Option 6c: Euston Weir - Raise the minimum operating level of Euston Weir by 0.5 m to 48.1 m AHD and Lower the minimum operating level of Euston Weir by 1.5 m to 46.1 m AHD
Barmah Choke Study: Financial Analysis of Options
Design and Administration Costs (%) 20.0%
Contingency (%) 40.0%
CAPITAL COSTS
Cost item Assumptions / Sources Min Expected Max Min Expected Max Min Expected Max
Pump Suction Extenstion $ - $ - $ - Small Pumps (<=80 mm) 1 1 1 no. $ 1,800.00 $ 2,000.00 $ 2,500.00 $ 1,800.00 $ 2,000.00 $ 2,500.00 Large Pumps(>80mm) 16 19 25 no. $ 2,300.00 $ 2,500.00 $ 3,000.00 $ 36,800.00 $ 47,500.00 $ 75,000.00
$ - $ - $ - Pumps need Raising/lowering $ - $ - $ -
Small Pumps (<=80 mm) 14 19 25 no. $ 5,500.00 $ 6,000.00 $ 7,500.00 $ 77,000.00 $ 114,000.00 $ 187,500.00 Large Pumps(>80mm) 15 20 27 no. $ 7,500.00 $ 8,000.00 $ 10,000.00 $ 112,500.00 $ 160,000.00 $ 270,000.00
$ - $ - $ - Both Pump Suction Extenstion and
Raising/Lowering of Pumps $ - $ - $ -
Small Pumps (<=80 mm) 27 31 37 no. $ 7,300.00 $ 8,000.00 $ 10,000.00 $ 197,100.00 $ 248,000.00 $ 370,000.00 Large Pumps(>80mm) 52 57 79 no. $ 9,800.00 $ 10,500.00 $ 13,000.00 $ 509,600.00 $ 598,500.00 $ 1,027,000.00
$ - $ - $ - Fencing 1 1 1 Item $ 7,500.00 $ 8,000.00 $ 10,000.00 $ 7,500.00 $ 8,000.00 $ 10,000.00
$ - $ - $ - Ruel Lagoon 1 1 1 Item $ - $ - $ - $ -
$ - $ - $ - Dry Lake 1 1 1 Item $ 40,000.00 $ 45,000.00 $ 55,000.00 $ 40,000.00 $ 45,000.00 $ 55,000.00
$ - $ - $ - Lake Bennane 1 1 1 Item $ 7,000.00 $ 8,000.00 $ 10,000.00 $ 7,000.00 $ 8,000.00 $ 10,000.00
$ - $ - $ - Bonyarical Creek 1 1 1 Item $ 10,000.00 $ 110,000.00 $ 140,000.00 $ 10,000.00 $ 110,000.00 $ 140,000.00
$ - $ - $ - Balranald Pump Station 1 1 1 Item $ 2,000.00 $ 2,500.00 $ 3,500.00 $ 2,000.00 $ 2,500.00 $ 3,500.00
$ - $ - $ - TOTAL RAW CAPITAL COST 1,001,300.00$ 1,343,500.00$ 2,150,500.00$
Design and Administration Costs (%) 200,260.00$ 268,700.00$ 430,100.00$
Contingency (%) 480,624.00$ 644,880.00$ 1,032,240.00$
TOTAL CAPITAL COST 1,682,184.00$ 2,257,080.00$ 3,612,840.00$
ANNUAL COSTS
Cost item Assumptions / Sources Min Expected Max Min Expected Max Min Expected Max
NA $ - $ - $ - TOTAL RAW ANNUAL COST -$ -$ -$
Contingency (%) -$ -$ -$
TOTAL ANNUAL COST -$ -$ -$
Go to Table of Contents
Cost AnalysisQuantity UNIT Price or Rates Cost Range
Cost Analysis
Quantity UNIT Price or Rates Cost Range
DB_08_BCS_Options_Costing_Model.xlsx
Option_6c_BA
Printed: 4:08 PM on 4/02/2011 Page: 18 of 26

BA Option 7a: 11 GL Storage at The Drop on Mulwala Canal (Option 2A from previous study)
Barmah Choke Study: Financial Analysis of Options
Design and Administration Costs (%) 20.0%
Contingency (%) 40.0%
CAPITAL COSTS
Cost item Assumptions / Sources Min Expected Max Min Expected Max Min Expected Max
EMBANKMENT $ - $ - $ -
Strip topsoil 317306 317306 380767 m3 3 $ 3.00 $ 3.60 $ 951,918 $ 951,918 $ 1,370,761
Excavate foundations 226075 226075 271290 m3 3 $ 3.00 $ 3.60 $ 678,225 $ 678,225 $ 976,644
Zone 1A/1B 989155 989155 1186986 m3 5.5 $ 6.00 $ 7.20 $ 5,440,353 $ 5,934,930 $ 8,546,299
Zone 2B U/S Drain Blanket 26630 26630 31956 m3 30 $ 40.00 $ 67.00 $ 798,900 $ 1,065,200 $ 2,141,052
Zone 2A Chimney Filter 15271 15271 18325 m3 40 $ 45.00 $ 70.00 $ 610,840 $ 687,195 $ 1,282,750
Zone 2A Blanket Filter 57950 57950 69540 m3 30 $ 30.00 $ 32.00 $ 1,738,500 $ 1,738,500 $ 2,225,280
Zone 2B Blanket Filter (+Draincoil) 7070 7070 8484 m3 30 $ 40.00 $ 67.00 $ 212,100 $ 282,800 $ 568,428
Zone 2B Toe Drain Trench,excavate 2.5mx0.5m 7273 7273 8728 m3 40 $ 50.00 $ 70.00 $ 290,920 $ 363,650 $ 610,960 Drainage Manholes 19 19 23 no. 3000 $ 3,000.00 $ 4,500.00 $ 57,000 $ 57,000 $ 103,500
Zone 3 Rip Rap 25779 25779 30935 m3 40 $ 45.00 $ 70.00 $ 1,031,160 $ 1,160,055 $ 2,165,450
Bedding Gravel to Rip Rap 5729 5729 6875 m3 30 $ 40.00 $ 67.00 $ 171,870 $ 229,160 $ 460,625
Topsoil and Seed 198506 198506 238207 m2 0.5 $ 0.50 $ 1.00 $ 99,253 $ 99,253 $ 238,207 Pavement Capping 2545 2545 3054 m3 30 $ 35.00 $ 45.00 $ 76,350 $ 89,075 $ 137,430
Piezometers 19 19 23 no. 300 $ 300.00 $ 500.00 $ 5,700 $ 5,700 $ 11,500
Movement Markers 28 28 34 no. 150 $ 150.00 $ 200.00 $ 4,200 $ 4,200 $ 6,800
GW Drainage Pumps (Prov Sum) 1 1 1 Item 50000 $ 50,000.00 $ 60,000.00 $ 50,000 $ 50,000 $ 60,000
LINER
Rework existing soils 1849404 1849404 2219285 m3 2 $ 2.00 $ 2.60 $ 3,698,808 $ 3,698,808 $ 5,770,141
Zone 1A 1387053 1387053 1664464 m3 5.5 $ 6.00 $ 7.20 $ 7,628,792 $ 8,322,318 $ 11,984,141
Local Scour Protection (lime treat,mesh etc) 1 1 1 Item 100000 $ 100,000.00 $ 150,000.00 $ 100,000 $ 100,000 $ 150,000
INTAKE CANAL AND STRUCTURE
Strip topsoil, stockpile and reuse 3905 3905 4686 m3 9 $ 12.00 $ 20.00 $ 35,145 $ 46,860 $ 93,720
Excavate channel and stockpile 4362 4362 5234 m3 9 $ 12.00 $ 20.00 $ 39,258 $ 52,344 $ 104,680
Place compact fill to canal/canal levees 1589 1589 1907 m3 9 $ 12.00 $ 20.00 $ 14,301 $ 19,068 $ 38,140
Filter fabric 1589 1589 1907 m2 5 $ 5.00 $ 5.00 $ 7,945 $ 7,945 $ 9,535
Quarry and place rock, d50 size 0.2 m 764 764 917 m3 38 $ 45.00 $ 68.00 $ 29,032 $ 34,380 $ 62,356
Quarry and place rock, d50 size 0.4 m 1014 1014 1217 m3 38 $ 45.00 $ 68.00 $ 38,532 $ 45,630 $ 82,756
Reinforced slab & mass concrete 806 806 967 m3 650 $ 800.00 $ 1,400.00 $ 523,900 $ 644,800 $ 1,353,800
Reinforced concrete walls 333 333 400 m3 1050 $ 1,300.00 $ 1,700.00 $ 349,650 $ 432,900 $ 680,000
Reinforced concrete elevated slab 8 8 10 m3 1050 $ 1,300.00 $ 1,700.00 $ 8,400 $ 10,400 $ 17,000
Intake structure E&M equipment 1 1 1 Item $ 920,000.00 $ 920,000.00 $ 1,150,000.00 $ 920,000 $ 920,000 $ 1,150,000
Bridge across Berrigan Road 1 1 1 Item $ 500,000.00 $ 500,000.00 $ 625,000.00 $ 500,000 $ 500,000 $ 625,000
Roadworks Berrigan Road 1 1 1 Item $ 100,000.00 $ 100,000.00 $ 125,000.00 $ 100,000 $ 100,000 $ 125,000
Clay lining for intake canal 3883 3883 4660 m3 10 $ 12.00 $ 15.00 $ 38,830 $ 46,596 $ 69,900
OUTLET STRUCTURE 1
Excavate channel and stockpile 13331 13331 15997 m3 9 $ 12.00 $ 20.00 $ 119,979 $ 159,972 $ 319,940
Backfill to structures 2011 2011 2413 m3 11 $ 15.00 $ 20.00 $ 22,121 $ 30,165 $ 48,260
Filter fabric 2600 2600 3120 m2 5 $ 5.00 $ 5.00 $ 13,000 $ 13,000 $ 15,600
Quarry and place rock, d50 size 0.2 m 1040 1040 1248 m3 38 $ 45.00 $ 68.00 $ 39,520 $ 46,800 $ 84,864
Reinforced slab & mass concrete 2126.7 2126.7 2552 m3 650 $ 800.00 $ 1,400.00 $ 1,382,355 $ 1,701,360 $ 3,572,800
Reinforced concrete walls 483.6 483.6 580 1050 $ 1,300.00 $ 1,700.00 $ 507,780 $ 628,680 $ 986,000
Reinforced concrete elevated slab 51.3 51.3 62 1050 $ 1,300.00 $ 1,700.00 $ 53,865 $ 66,690 $ 105,400
Outlet structure E&M equipment (4 pumps) 1 1 1 Item $ 2,280,000.00 $ 2,280,000.00 $ 2,850,000.00 $ 2,280,000 $ 2,280,000 $ 2,850,000
Bridge across Melrose Road 1 1 1 Item $ 200,000.00 $ 200,000.00 $ 250,000.00 $ 200,000 $ 200,000 $ 250,000
Roadworks Melrose Drive 1 1 1 Item $ 50,000.00 $ 50,000.00 $ 62,500.00 $ 50,000 $ 50,000 $ 62,500
TOTAL RAW CAPITAL COST 30,918,501$ 33,555,577$ 51,517,219$
Design and Administration Costs (%) 6,183,700$ 6,711,115$ 10,303,444$
Contingency (%) 14,840,880$ 16,106,677$ 24,728,265$
TOTAL CAPITAL COST 51,943,082$ 56,373,369$ 86,548,928$
ANNUAL COSTS
Cost item Assumptions / Sources Min Expected Max Min Expected Max Min Expected Max
Maintance Cost 1% of capital 1 1 1 Item $ 519,430.82 $ 563,733.69 $ 865,489.28 $ 519,431 $ 563,734 $ 865,489 Power station - loss of income Set to 75% of Option 7b cost 1 1 1 Item $ 142,575.00 $ 142,575.00 $ 142,575.00 $ 142,575 $ 142,575 $ 142,575 Use of Mulwala canal 1 1 1 Item $ 350,000.00 $ 350,000.00 $ 350,000.00 $ 350,000 $ 350,000 $ 350,000
TOTAL RAW ANNUAL COST 1,012,005.82$ 1,056,308.69$ 1,358,064.28$
Contingency (%) 202,401.16$ 211,261.74$ 271,612.86$
TOTAL ANNUAL COST 1,214,406.98$ 1,267,570.43$ 1,629,677.14$
Cost Analysis
Quantity UNIT Price or Rates Cost Range
Go to Table of Contents
Cost AnalysisQuantity UNIT Price or Rates Cost Range
DB_08_BCS_Options_Costing_Model.xlsx
Option_7a_BA
Printed: 4:08 PM on 4/02/2011 Page: 19 of 26

BA Option 7b: 16 GL Storage at The Drop on Mulwala Canal (Option 3A from previous study)
Barmah Choke Study: Financial Analysis of Options
Design and Administration Costs (%) 20.0%
Contingency (%) 40.0%
CAPITAL COSTS
Cost item Assumptions / Sources Min Expected Max Min Expected Max Min Expected Max
EMBANKMENT $ - $ - $ -
Strip topsoil 454514 454514 545417 m3 3 $ 3.00 $ 3.60 $ 1,363,542 $ 1,363,542 $ 1,963,501
Excavate foundations 277081 277081 332497 m3 3 $ 3.00 $ 3.60 $ 831,243 $ 831,243 $ 1,196,989
Zone 1A/1B 1210789 1210789 1452947 m3 5.5 $ 6.00 $ 7.20 $ 6,659,340 $ 7,264,734 $ 10,461,218
Zone 2B U/S Drain Blanket 32726 32726 39271 m3 30 $ 40.00 $ 67.00 $ 981,780 $ 1,309,040 $ 2,631,157
Zone 2A Chimney Filter 18700 18700 22440 m3 40 $ 45.00 $ 70.00 $ 748,000 $ 841,500 $ 1,570,800
Zone 2A Blanket Filter 70809 70809 84971 m3 30 $ 30.00 $ 32.00 $ 2,124,270 $ 2,124,270 $ 2,719,072
Zone 2B Blanket Filter (+Draincoil) 8658 8658 10390 m3 30 $ 40.00 $ 67.00 $ 259,740 $ 346,320 $ 696,130
Zone 2B Toe Drain Trench,excavate 2.5mx0.5m 8860 8860 10632 m3 40 $ 50.00 $ 70.00 $ 354,400 $ 443,000 $ 744,240 Drainage Manholes 24 24 29 no. 3000 $ 3,000.00 $ 4,500.00 $ 72,000 $ 72,000 $ 130,500
Zone 3 Rip Rap 21059 21059 25271 m3 40 $ 45.00 $ 70.00 $ 842,360 $ 947,655 $ 1,768,970
Bedding Gravel to Rip Rap 4680 4680 5616 m3 30 $ 40.00 $ 67.00 $ 140,400 $ 187,200 $ 376,272
Topsoil and Seed 266430 266430 319716 m2 0.5 $ 0.50 $ 1.00 $ 133,215 $ 133,215 $ 319,716 Pavement Capping 3117 3117 3740 m3 30 $ 35.00 $ 45.00 $ 93,510 $ 109,095 $ 168,300
Piezometers 23 23 28 no. 300 $ 300.00 $ 500.00 $ 6,900 $ 6,900 $ 14,000
Movement Markers 35 35 42 no. 150 $ 150.00 $ 200.00 $ 5,250 $ 5,250 $ 8,400
GW Drainage Pumps (Prov Sum) 1 1 1 Item 50000 $ 50,000.00 $ 60,000.00 $ 50,000 $ 50,000 $ 60,000
LINER
Rework existing soils 2704114 2704114 3244937 m3 2 $ 2.00 $ 2.60 $ 5,408,228 $ 5,408,228 $ 8,436,836
Zone 1A 2028088 2028088 2433706 m3 5.5 $ 6.00 $ 7.20 $ 11,154,484 $ 12,168,528 $ 17,522,683
Local Scour Protection (lime treat,mesh etc) 1 1 1 Item 100000 $ 100,000.00 $ 150,000.00 $ 100,000 $ 100,000 $ 150,000
INTAKE CANAL AND STRUCTURE
Strip topsoil, stockpile and reuse 3905 3905 4686 m3 9 $ 12.00 $ 20.00 $ 35,145 $ 46,860 $ 93,720
Excavate channel and stockpile 4362 4362 5234 m3 9 $ 12.00 $ 20.00 $ 39,258 $ 52,344 $ 104,680
Place compact fill to canal/canal levees 1589 1589 1907 m3 9 $ 12.00 $ 20.00 $ 14,301 $ 19,068 $ 38,140
Filter fabric 1589 1589 1907 m2 5 $ 5.00 $ 5.00 $ 7,945 $ 7,945 $ 9,535
Quarry and place rock, d50 size 0.2 m 764 764 917 m3 38 $ 45.00 $ 68.00 $ 29,032 $ 34,380 $ 62,356
Quarry and place rock, d50 size 0.4 m 1014 1014 1217 m3 38 $ 45.00 $ 68.00 $ 38,532 $ 45,630 $ 82,756
Reinforced slab & mass concrete 806 806 967 m3 650 $ 800.00 $ 1,400.00 $ 523,900 $ 644,800 $ 1,353,800
Reinforced concrete walls 333 333 400 m3 1050 $ 1,300.00 $ 1,700.00 $ 349,650 $ 432,900 $ 680,000
Reinforced concrete elevated slab 8 8 10 m3 1050 $ 1,300.00 $ 1,700.00 $ 8,400 $ 10,400 $ 17,000
Intake structure E&M equipment 1 1 1 Item $ 920,000.00 $ 920,000.00 $ 1,150,000.00 $ 920,000 $ 920,000 $ 1,150,000
Bridge across Berrigan Road 1 1 1 Item $ 500,000.00 $ 500,000.00 $ 625,000.00 $ 500,000 $ 500,000 $ 625,000
Roadworks Berrigan Road 1 1 1 Item $ 100,000.00 $ 100,000.00 $ 125,000.00 $ 100,000 $ 100,000 $ 125,000
Clay lining for intake canal 3883 3883 4660 m3 10 $ 12.00 $ 15.00 $ 38,830 $ 46,596 $ 69,900
OUTLET STRUCTURE 1
Excavate channel and stockpile 13331 13331 15997 m3 9 $ 12.00 $ 20.00 $ 119,979 $ 159,972 $ 319,940
Backfill to structures 2011 2011 2413 m3 11 $ 15.00 $ 20.00 $ 22,121 $ 30,165 $ 48,260
Filter fabric 2600 2600 3120 m2 5 $ 5.00 $ 5.00 $ 13,000 $ 13,000 $ 15,600
Quarry and place rock, d50 size 0.2 m 1040 1040 1248 m3 38 $ 45.00 $ 68.00 $ 39,520 $ 46,800 $ 84,864
Reinforced slab & mass concrete 2126.7 2126.7 2552 m3 650 $ 800.00 $ 1,400.00 $ 1,382,355 $ 1,701,360 $ 3,572,800
Reinforced concrete walls 483.6 483.6 580 1050 $ 1,300.00 $ 1,700.00 $ 507,780 $ 628,680 $ 986,000
Reinforced concrete elevated slab 51.3 51.3 62 1050 $ 1,300.00 $ 1,700.00 $ 53,865 $ 66,690 $ 105,400
Outlet structure E&M equipment (4 pumps) 1 1 1 Item $ 2,280,000.00 $ 2,280,000.00 $ 2,850,000.00 $ 2,280,000 $ 2,280,000 $ 2,850,000
Bridge across Melrose Road 1 1 1 Item $ 200,000.00 $ 200,000.00 $ 250,000.00 $ 200,000 $ 200,000 $ 250,000
Roadworks Melrose Drive 1 1 1 Item $ 50,000.00 $ 50,000.00 $ 62,500.00 $ 50,000 $ 50,000 $ 62,500 $ - $ - $ -
TOTAL RAW CAPITAL COST 38,602,275$ 41,749,310$ 63,646,036$
Design and Administration Costs (%) 7,720,455$ 8,349,862$ 12,729,207$
Contingency (%) 18,529,092$ 20,039,669$ 30,550,097$
TOTAL CAPITAL COST 64,851,821$ 70,138,841$ 106,925,341$
ANNUAL COSTS
Cost item Assumptions / Sources Min Expected Max Min Expected Max Min Expected Max
Maintance Cost 1% of capital 1 1 1 Item $ 648,518.21 $ 701,388.41 $ 1,069,253.41 $ 648,518 $ 701,388 $ 1,069,253 Power station - loss of income 1 1 1 Item $ 190,100.00 $ 190,100.00 $ 190,100.00 $ 190,100 $ 190,100 $ 190,100 Use of Mulwala canal 1 1 1 Item $ 350,000.00 $ 350,000.00 $ 350,000.00 $ 350,000 $ 350,000 $ 350,000
TOTAL RAW ANNUAL COST 1,188,618.21$ 1,241,488.41$ 1,609,353.41$
Contingency (%) 237,723.64$ 248,297.68$ 321,870.68$
TOTAL ANNUAL COST 1,426,341.85$ 1,489,786.09$ 1,931,224.09$
Go to Table of Contents
Cost AnalysisQuantity Price or Rates Cost Range
Quantity Price or Rates Cost Range
UNIT
UNIT
Cost Analysis
DB_08_BCS_Options_Costing_Model.xlsx
Option_7b_BA
Printed: 4:08 PM on 4/02/2011 Page: 20 of 26

BA Option 10a: Victorian Forest Channels (Kynmer Creek Route)
Barmah Choke Study: Financial Analysis of Options
Design and Administration Costs (%) 20.0%
Contingency (%) 40.0%
CAPITAL COSTS
Cost item Assumptions / Sources Min Expected Max Min Expected Max Min Expected Max
EARTHWORKSTopsoil Stripping 135000 150000 195000 m3 $ 1.20 $ 1.20 $ 2.00 $ 162,000 $ 180,000 $ 390,000 Waterway Excavation 4203000 4670000 6071000 m3 $ 2.20 $ 2.20 $ 3.50 $ 9,246,600 $ 10,274,000 $ 21,248,500 Bank 234000 260000 338000 m3 $ 14.00 $ 16.00 $ 18.00 $ 3,276,000 $ 4,160,000 $ 6,084,000 Spoil bank - Place and trim 4104000 4560000 5928000 m3 $ 3.00 $ 3.00 $ 4.00 $ 12,312,000 $ 13,680,000 $ 23,712,000 Top soiling 63000 70000 91000 m3 $ 2.00 $ 2.00 $ 4.00 $ 126,000 $ 140,000 $ 364,000
STRUCTURESRegulators (including offtake and outfall) 5 5 7 No. $ 2,250,000.00 $ 2,500,000 $ 3,500,000.00 $ 11,250,000 $ 12,500,000 $ 24,500,000 Floodway Crossings (Beached spillways) 5 5 7 No. $ 270,000.00 $ 300,000 $ 420,000.00 $ 1,350,000 $ 1,500,000 $ 2,940,000 Irrigators Offtake 5 5 7 No. $ 27,000.00 $ 30,000 $ 42,000.00 $ 135,000 $ 150,000 $ 294,000 Road Crossings 5 5 7 No. $ 675,000.00 $ 750,000 $ 1,050,000.00 $ 3,375,000 $ 3,750,000 $ 7,350,000 Access Crossing 5 5 7 No. $ 360,000.00 $ 400,000 $ 560,000.00 $ 1,800,000 $ 2,000,000 $ 3,920,000
FENCTINGLongitudinal Fencing and gates 114000 114000 140000 m $ 7.20 $ 8.00 $ 10.40 $ 820,800 $ 912,000 $ 1,456,000 Temporary Fencing 1 1 1 Item $ 225,000.00 $ 250,000.00 $ 325,000.00 $ 225,000 $ 250,000 $ 325,000
Land AcquisitionTitle adjustments 50 50 70 No $ 2,250.00 $ 2,500.00 $ 3,250.00 $ 112,500 $ 125,000 $ 227,500 Land acquired as freehold 200 200 280 Ha $ 18,000.00 $ 20,000.00 $ 26,000.00 $ 3,600,000 $ 4,000,000 $ 7,280,000
Add rows as requiredTOTAL RAW CAPITAL COST 47,790,900$ 53,621,000$ 100,091,000$
Design and Administration Costs (%) 9,558,180$ 10,724,200$ 20,018,200$
Contingency (%) 22,939,632$ 25,738,080$ 48,043,680$
TOTAL CAPITAL COST 80,288,712$ 90,083,280$ 168,152,880$
ANNUAL COSTS
Cost item Assumptions / Sources Min Expected Max Min Expected Max Min Expected Max
Maintance Cost 0.5% of capital 1 1 1 Item $ 401,443.56 $ 450,416.40 $ 840,764.40 $ 401,444 $ 450,416 $ 840,764 Operational Cost no change to existing 1 1 1 Item $ 99,000.00 $ 100,000.00 $ 150,000.00 $ 99,000 $ 100,000 $ 150,000
TOTAL RAW ANNUAL COST 500,444$ 550,416$ 990,764$
Contingency (%) 100,089$ 110,083$ 198,153$
TOTAL ANNUAL COST 600,532$ 660,500$ 1,188,917$
Cost Analysis
Quantity UNIT Price or Rates Cost Range
Go to Table of Contents
Cost AnalysisQuantity UNIT Price or Rates Cost Range
DB_08_BCS_Options_Costing_Model.xlsx
Option_10a_BA
Printed: 4:08 PM on 4/02/2011 Page: 21 of 26

BA Option 10b: Victorian Forest Channels (Gulf Creek Route)
Barmah Choke Study: Financial Analysis of Options
Design and Administration Costs (%) 20.0%
Contingency (%) 40.0%
CAPITAL COSTS
Cost item Assumptions / Sources Min Expected Max Min Expected Max Min Expected Max
EARTHWORKSTopsoil Stripping 90000 100000 130000 m3 $ 1.20 $ 1.20 $ 2.00 $ 108,000 $ 120,000 $ 260,000 Waterway Excavation 2655000 2950000 3835000 m3 $ 2.20 $ 2.20 $ 3.50 $ 5,841,000 $ 6,490,000 $ 13,422,500 Bank 153000 170000 221000 m3 $ 14.00 $ 16.00 $ 18.00 $ 2,142,000 $ 2,720,000 $ 3,978,000 Spoil bank - Place and trim 2592000 2880000 3744000 m3 $ 3.00 $ 3.00 $ 4.00 $ 7,776,000 $ 8,640,000 $ 14,976,000 Top soiling 45000 50000 65000 m3 $ 2.00 $ 2.00 $ 4.00 $ 90,000 $ 100,000 $ 260,000
STRUCTURESRegulators (including offtake and outfall) 3 3 4 No. $ 2,250,000.00 $ 2,500,000 $ 3,500,000.00 $ 6,750,000 $ 7,500,000 $ 14,000,000 Floodway Crossings (Beached spillways) 3 3 4 No. $ 270,000.00 $ 300,000 $ 420,000.00 $ 810,000 $ 900,000 $ 1,680,000 Irrigators Offtake 3 3 4 No. $ 27,000.00 $ 30,000 $ 42,000.00 $ 81,000 $ 90,000 $ 168,000 Road Crossings 3 3 4 No. $ 675,000.00 $ 750,000 $ 1,050,000.00 $ 2,025,000 $ 2,250,000 $ 4,200,000 Access Crossing 3 3 4 No. $ 360,000.00 $ 400,000 $ 560,000.00 $ 1,080,000 $ 1,200,000 $ 2,240,000
FENCTINGLongitudinal Fencing and gates 72000 72000 90000 m $ 7.20 $ 8.00 $ 10.40 $ 518,400 $ 576,000 $ 936,000 Temporary Fencing 1 1 1 Item $ 135,000.00 $ 150,000.00 $ 195,000.00 $ 135,000 $ 150,000 $ 195,000
Land AcquisitionTitle adjustments 30 30 30 No $ 2,250.00 $ 2,500.00 $ 3,250.00 $ 67,500 $ 75,000 $ 97,500
Land acquired as freehold 160 160 200 Ha $ 18,000.00 $ 20,000.00 $ 26,000.00 $ 2,880,000 $ 3,200,000 $ 5,200,000
TOTAL RAW CAPITAL COST 30,303,900$ 34,011,000$ 61,613,000$
Design and Administration Costs (%) 6,060,780$ 6,802,200$ 12,322,600$
Contingency (%) 14,545,872$ 16,325,280$ 29,574,240$
TOTAL CAPITAL COST 50,910,552$ 57,138,480$ 103,509,840$
ANNUAL COSTS
Cost item Assumptions / Sources Min Expected Max Min Expected Max Min Expected Max
Maintance Cost 0.5% of capital 1 1 1 Item $ 254,552.76 $ 285,692.40 $ 517,549.20 $ 254,553 $ 285,692 $ 517,549 Operational Cost no change to existing 1 1 1 Item $ 99,000.00 $ 100,000.00 $ 150,000.00 $ 99,000 $ 100,000 $ 150,000
TOTAL RAW ANNUAL COST 353,553$ 385,692$ 667,549$
Contingency (%) 70,711$ 77,138$ 133,510$
TOTAL ANNUAL COST 424,263$ 462,831$ 801,059$
Cost Analysis
Quantity UNIT Price or Rates Cost Range
Go to Table of Contents
Cost AnalysisQuantity UNIT Price or Rates Cost Range
DB_08_BCS_Options_Costing_Model.xlsx
Option_10b_BA
Printed: 4:08 PM on 4/02/2011 Page: 22 of 26

BA Option 11: Increased diversion through the Wakool River
Barmah Choke Study: Financial Analysis of Options
Design and Administration Costs (%) 20.0%
Contingency (%) 40.0%
CAPITAL COSTS
Cost item Assumptions / Sources Min Expected Max Min Expected Max Min Expected Max
Channel Excavation $ - $ - $ - Excavation 55800 62000 80600 m3 $ 4.50 $ 5.00 $ 6.50 $ 251,100 $ 310,000 $ 523,900
Inlet Works $ - $ - $ - Earthworks 1 1 1 Item $ 10,000.00 $ 12,000.00 $ 15,000.00 $ 10,000 $ 12,000 $ 15,000 Radial Gates 2 2 2 No. $ 50,000.00 $ 60,000.00 $ 75,000.00 $ 100,000 $ 120,000 $ 150,000
Structure 90 100 130 m3 $ 800.00 $ 900.00 $ 1,200.00 $ 72,000 $ 90,000 $ 156,000
Outlet Works $ - $ - $ - Earthworks 1 1 1 Item $ 10,800.00 $ 12,000.00 $ 15,600.00 $ 10,800 $ 12,000 $ 15,600 Structure 90 100 130 m3 $ 800.00 $ 900.00 $ 1,200.00 $ 72,000 $ 90,000 $ 156,000 Beaching 180 200 260 m3 $ 50.00 $ 60.00 $ 70.00 $ 9,000 $ 12,000 $ 18,200
Road Crossing $ - $ - $ - Bridge 270 270 300 m2 $ 1,400.00 $ 1,500.00 $ 1,600.00 $ 378,000 $ 405,000 $ 480,000 Earthworks 1 1 1 Item $ 90,000.00 $ 100,000.00 $ 120,000.00 $ 90,000 $ 100,000 $ 120,000
TOTAL RAW CAPITAL COST 992,900$ 1,151,000$ 1,634,700$
Design and Administration Costs (%) 198,580$ 230,200$ 326,940$
Contingency (%) 476,592$ 552,480$ 784,656$
TOTAL CAPITAL COST 1,668,072$ 1,933,680$ 2,746,296$
ANNUAL COSTS
Cost item Assumptions / Sources Min Expected Max Min Expected Max Min Expected Max
Use of Mulwala canal 1 1 1 Item $ 350,000.00 $ 350,000.00 $ 350,000.00 $ 350,000 $ 350,000 $ 350,000 TOTAL RAW ANNUAL COST 350,000.00$ 350,000.00$ 350,000.00$
Contingency (%) 70,000.00$ 70,000.00$ 70,000.00$
TOTAL ANNUAL COST 420,000.00$ 420,000.00$ 420,000.00$
Cost Analysis
Quantity UNIT Price or Rates Cost Range
Go to Table of Contents
Cost AnalysisQuantity UNIT Price or Rates Cost Range
DB_08_BCS_Options_Costing_Model.xlsx
Option_11_BA
Printed: 4:08 PM on 4/02/2011 Page: 23 of 26

BA Option 12: Increased escape capacity to the Edward River
Barmah Choke Study: Financial Analysis of Options
Design and Administration Costs (%) 20.0%
Contingency (%) 40.0%
CAPITAL COSTS
Cost item Assumptions / Sources Min Expected Max Min Expected Max Min Expected Max
Remove Existing Structure $ - $ - $ - Site Establishment 1 1 1 Item $ 10,000.00 $ 12,000.00 $ 15,000.00 $ 10,000 $ 12,000 $ 15,000 Remove existing structure 126 140 180 m3 $ 150.00 $ 150.00 $ 180.00 $ 18,900 $ 21,000 $ 32,400 Cartage 1 1 1 Item $ 5,000.00 $ 5,000.00 $ 7,000.00 $ 5,000 $ 5,000 $ 7,000
Channel Excavation $ - $ - $ - Excavation 8100 9000 11700 m3 $ 4.50 $ 5.00 $ 6.50 $ 36,450 $ 45,000 $ 76,050 Concrete Lining 1035 1150 1495 m3 $ 550.00 $ 650.00 $ 845.00 $ 569,250 $ 747,500 $ 1,263,275
Inlet Works $ - $ - $ - Earthworks 1 1 1 Item $ 10,000.00 $ 12,000.00 $ 15,000.00 $ 10,000 $ 12,000 $ 15,000 Radial Gates 2 2 2 No. $ 76,000.00 $ 85,000.00 $ 100,000.00 $ 152,000 $ 170,000 $ 200,000 Structure 90 100 130 m3 $ 800.00 $ 900.00 $ 1,200.00 $ 72,000 $ 90,000 $ 156,000
Outlet Works $ - $ - $ - Earthworks 1 1 1 Item $ 10,000.00 $ 12,000.00 $ 15,000.00 $ 10,000 $ 12,000 $ 15,000 Structure 90 100 130 m3 $ 800.00 $ 900.00 $ 1,200.00 $ 72,000 $ 90,000 $ 156,000 Beaching 90 100 130 m3 $ 50.00 $ 60.00 $ 70.00 $ 4,500 $ 6,000 $ 9,100
Pericoota Channel Works $ - $ - $ - Earthworks 1 1 1 Item $ 180,000.00 $ 200,000.00 $ 260,000.00 $ 180,000 $ 200,000 $ 260,000 Structure 1 1 1 Item $ 54,000.00 $ 60,000.00 $ 78,000.00 $ 54,000 $ 60,000 $ 78,000 Beaching 1 1 1 Item $ 45,000.00 $ 50,000.00 $ 65,000.00 $ 45,000 $ 50,000 $ 65,000
$ - $ - $ - TOTAL RAW CAPITAL COST 1,239,100$ 1,520,500$ 2,347,825$
Design and Administration Costs (%) 247,820$ 304,100$ 469,565$
Contingency (%) 594,768$ 729,840$ 1,126,956$
TOTAL CAPITAL COST 2,081,688$ 2,554,440$ 3,944,346$
ANNUAL COSTS
Cost item Assumptions / Sources Min Expected Max Min Expected Max Min Expected Max
Use of Mulwala canal 1 1 1 Item $ 350,000.00 $ 350,000.00 $ 350,000.00 $ 350,000 $ 350,000 $ 350,000 TOTAL RAW ANNUAL COST 350,000.00$ 350,000.00$ 350,000.00$
Contingency (%) 70,000.00$ 70,000.00$ 70,000.00$
TOTAL ANNUAL COST 420,000.00$ 420,000.00$ 420,000.00$
Cost Analysis
Quantity UNIT Price or Rates Cost Range
Go to Table of Contents
Cost AnalysisQuantity UNIT Price or Rates Cost Range
DB_08_BCS_Options_Costing_Model.xlsx
Option_12_BA
Printed: 4:08 PM on 4/02/2011 Page: 24 of 26

BA Option 13: Increased escape capacity to Broken Creek
Barmah Choke Study: Financial Analysis of Options
Design and Administration Costs (%) 20.0%
Contingency (%) 40.0%
CAPITAL COSTS
Cost item Assumptions / Sources Min Expected Max Min Expected Max Min Expected Max
EARTHWORKS $ - $ - $ - Yarrawonga Main Canal $ - $ - $ -
Stripping 24300 27000 35100 m3 $ 1.20 $ 1.20 $ 2.00 $ 29,160 $ 32,400 $ 70,200
Waterway Excavation 113400 126000 163800 m3 $ 2.20 $ 2.20 $ 3.50 $ 249,480 $ 277,200 $ 573,300
Bank - Compacted 105300 117000 152100 m3 $ 14.00 $ 16.00 $ 18.00 $ 1,474,200 $ 1,872,000 $ 2,737,800
Bank - Uncompacted (Topsoil) 17496 19440 25272 m3 $ 3.00 $ 3.00 $ 4.00 $ 52,488 $ 58,320 $ 101,088
Spoil bank - Place, compact and trim 9450 10500 13650 m3 $ 3.00 $ 3.00 $ 4.00 $ 28,350 $ 31,500 $ 54,600
Excavation for clay lining (600 mm) 54000 60000 78000 m3 $ 2.20 $ 2.20 $ 3.50 $ 118,800 $ 132,000 $ 273,000
450 mm clay lining 52650 58500 76050 m3 $ 14.00 $ 16.00 $ 18.00 $ 737,100 $ 936,000 $ 1,368,900
150 mm crush rock lining 13500 15000 19500 m3 $ 50.00 $ 60.00 $ 70.00 $ 675,000 $ 900,000 $ 1,365,000 Murray Valley Channel No 3 (0-4800m) $ - $ - $ - Stripping 12960 14400 18720 m3 $ 1.20 $ 1.20 $ 2.00 $ 15,552 $ 17,280 $ 37,440
Waterway Excavation 33300 37000 48100 m3 $ 2.20 $ 2.20 $ 3.50 $ 73,260 $ 81,400 $ 168,350
Bank - Compacted 33696 37440 48672 m3 $ 14.00 $ 16.00 $ 18.00 $ 471,744 $ 599,040 $ 876,096
Bank - Uncompacted (Topsoil) 4665.6 5184 6739.2 m3 $ 3.00 $ 3.00 $ 4.00 $ 13,997 $ 15,552 $ 26,957
Spoil bank - Place, compact and trim 9 10 13 m3 $ 3.00 $ 3.00 $ 4.00 $ 27 $ 30 $ 52 Excavation for clay lining (600 mm) 16200 18000 23400 m3 $ 2.20 $ 2.20 $ 3.50 $ 35,640 $ 39,600 $ 81,900
450 mm clay lining 15795 17550 22815 m3 $ 14.00 $ 16.00 $ 18.00 $ 221,130 $ 280,800 $ 410,670
150 mm crush rock lining 4050 4500 5850 m3 $ 50.00 $ 60.00 $ 70.00 $ 202,500 $ 270,000 $ 409,500 Connector - Channel 3 to Boosey Creek
(3200m)Stripping 8640 9600 12480 m3 $ 1.20 $ 1.20 $ 2.00 $ 10,368 $ 11,520 $ 24,960 Waterway Excavation 63360 70400 91520 m3 $ 2.20 $ 2.20 $ 3.50 $ 139,392 $ 154,880 $ 320,320
Bank - Compacted 18720 20800 27040 m3 $ 14.00 $ 16.00 $ 18.00 $ 262,080 $ 332,800 $ 486,720
Bank - Uncompacted (Topsoil) 3110.4 3456 4492.8 m3 $ 3.00 $ 3.00 $ 4.00 $ 9,331 $ 10,368 $ 17,971
Spoil bank - Place, compact and trim 44640 49600 64480 m3 $ 3.00 $ 3.00 $ 4.00 $ 133,920 $ 148,800 $ 257,920 BRIDGES $ - $ - $ -
MV Channel No. 3 - Occupation 3 3 4 No. $ 108,000.00 $ 120,000.00 $ 156,000.00 $ 324,000 $ 360,000 $ 624,000
MV Channel No. 3 - Road 2 2 3 No. $ 225,000.00 $ 250,000.00 $ 325,000.00 $ 450,000 $ 500,000 $ 975,000
Connector - Occupation 2 2 3 No. $ 90,000.00 $ 100,000.00 $ 130,000.00 $ 180,000 $ 200,000 $ 390,000
Connector - Road 1 1 1 No. $ 180,000.00 $ 200,000.00 $ 260,000.00 $ 180,000 $ 200,000 $ 260,000 SUBWAYS $ - $ - $ -
MV Channel No. 3 3 3 4 No. $ 45,000.00 $ 50,000.00 $ 65,000.00 $ 135,000 $ 150,000 $ 260,000
Connector 2 2 3 No. $ 36,000.00 $ 40,000.00 $ 52,000.00 $ 72,000 $ 80,000 $ 156,000 SIPHONS $ - $ - $ -
MV Channel No. 3 1 1 1 No. $ 450,000.00 $ 500,000.00 $ 650,000.00 $ 450,000 $ 500,000 $ 650,000
REGULATORS $ - $ - $ -
YMC - 8 Mile Weir 1 1 1 No. $ 225,000.00 $ 250,000.00 $ 325,000.00 $ 225,000 $ 250,000 $ 325,000
MV Channel No. 3 2 2 3 No. $ 135,000.00 $ 150,000.00 $ 195,000.00 $ 270,000 $ 300,000 $ 585,000 Connector 1 1 1 No. $ 67,500.00 $ 75,000.00 $ 97,500.00 $ 67,500 $ 75,000 $ 97,500
ON-FARM WORKS $ - $ - $ -
YMC 1 1 1 Item $ 45,000.00 $ 50,000.00 $ 65,000.00 $ 45,000 $ 50,000 $ 65,000
MV Channel No. 3 1 1 1 Item $ 45,000.00 $ 50,000.00 $ 65,000.00 $ 45,000 $ 50,000 $ 65,000
Connector 1 1 1 Item $ 27,000.00 $ 30,000.00 $ 39,000.00 $ 27,000 $ 30,000 $ 39,000 FENCTING $ - $ - $ -
YMC 18000 18000 23400 m $ 7.20 $ 8.00 $ 10.40 $ 129,600 $ 144,000 $ 243,360
MV Channel No. 3 4800 4800 6240 m $ 7.20 $ 8.00 $ 10.40 $ 34,560 $ 38,400 $ 64,896
Connector 6400 6400 8320 m $ 7.20 $ 8.00 $ 10.40 $ 46,080 $ 51,200 $ 86,528 Land Acquisition $ - $ - $ -
Title adjustments 25 25 33 No $ 2,250.00 $ 2,500.00 $ 3,250.00 $ 56,250 $ 62,500 $ 107,250
Land acquired as freehold 30 30 40 Ha $ 18,000.00 $ 20,000.00 $ 26,000.00 $ 540,000 $ 600,000 $ 1,040,000 $ - $ - $ -
TOTAL RAW CAPITAL COST 8,230,509$ 9,842,590$ 15,696,278$
Design and Administration Costs (%) 1,646,102$ 1,968,518$ 3,139,256$
Contingency (%) 3,950,644$ 4,724,443$ 7,534,213$
TOTAL CAPITAL COST 13,827,255$ 16,535,551$ 26,369,747$
ANNUAL COSTS
Cost item Assumptions / Sources Min Expected Max Min Expected Max Min Expected Max
Maintance Cost 1% of capital 1 1 1 Item $ 78,471.29 $ 93,021.60 $ 147,760.27 $ 78,471 $ 93,022 $ 147,760 Power station - loss of income 1 1 1 Item $ 190,100.00 $ 190,100.00 $ 190,100.00 $ 190,100 $ 190,100 $ 190,100
$ - $ - $ - TOTAL RAW ANNUAL COST 268,571$ 283,122$ 337,860$
Contingency (%) 53,714$ 56,624$ 67,572$
TOTAL ANNUAL COST 322,286$ 339,746$ 405,432$
Cost Analysis
Quantity UNIT Price or Rates Cost Range
Go to Table of Contents
Cost AnalysisQuantity UNIT Price or Rates Cost Range
DB_08_BCS_Options_Costing_Model.xlsx
Option_13_BA
Printed: 4:08 PM on 4/02/2011 Page: 25 of 26

BA Option 15: Murray Goulburn interconnector (2000ML/d)
Barmah Choke Study: Financial Analysis of Options
Design and Administration Costs (%) 20.0%
Contingency (%) 40.0%
CAPITAL COSTS
Cost item Assumptions / Sources Min Expected Max Min Expected Max Min Expected Max
EARTHWORKS $ - $ - $ - Connector Channel to EGMC $ - $ - $ - Stripping 477000 530000 689000 m3 $ 1.20 $ 1.20 $ 2.00 $ 572,400 $ 636,000 $ 1,378,000 Waterway Excavation 4590000 5100000 6630000 m3 $ 2.20 $ 2.20 $ 3.50 $ 10,098,000 $ 11,220,000 $ 23,205,000 Bank - Compacted 4050000 4500000 5850000 m3 $ 14.00 $ 16.00 $ 18.00 $ 56,700,000 $ 72,000,000 $ 105,300,000 Bank - Uncompacted (Topsoil) 144000 160000 208000 m3 $ 3.00 $ 3.00 $ 4.00 $ 432,000 $ 480,000 $ 832,000 Spoil bank - Place, compact and trim 639000 710000 923000 m3 $ 3.00 $ 3.00 $ 4.00 $ 1,917,000 $ 2,130,000 $ 3,692,000 Excavation for clay lining (600 mm) 301000 430000 602000 m3 $ 2.20 $ 2.20 $ 3.50 $ 662,200 $ 946,000 $ 2,107,000 450 mm clay lining 224000 320000 448000 m3 $ 14.00 $ 16.00 $ 18.00 $ 3,136,000 $ 5,120,000 $ 8,064,000 150 mm crush rock lining 77000 110000 154000 m3 $ 50.00 $ 60.00 $ 70.00 $ 3,850,000 $ 6,600,000 $ 10,780,000 Beaching protection 105000 150000 210000 m3 $ 50.00 $ 60.00 $ 70.00 $ 5,250,000 $ 9,000,000 $ 14,700,000
BRIDGES $ - $ - $ - Connector - Highway 1 1 2 No. $ 828,000.00 $ 920,000.00 $ 1,196,000.00 $ 828,000 $ 920,000 $ 2,392,000 Connector - Major Road 5 6 9 No. $ 621,000.00 $ 690,000.00 $ 897,000.00 $ 3,105,000 $ 4,140,000 $ 8,073,000 Connector - Minor Road 32 36 45 No. $ 450,000.00 $ 500,000.00 $ 650,000.00 $ 14,400,000 $ 18,000,000 $ 29,250,000 Connector - Occupation 100 110 150 No. $ 288,000.00 $ 320,000.00 $ 416,000.00 $ 28,800,000 $ 35,200,000 $ 62,400,000
SUBWAYS $ - $ - $ - Connector 18 20 30 No. $ 225,000.00 $ 250,000.00 $ 325,000.00 $ 4,050,000 $ 5,000,000 $ 9,750,000
SIPHONS $ - $ - $ - Connector 6 7 10 No. $ 2,250,000.00 $ 2,500,000.00 $ 3,250,000.00 $ 13,500,000 $ 17,500,000 $ 32,500,000
Offtake Works (Lake Mulwala/YMC) $ - $ - $ - Offtake 1 1 1 Item $ 5,760,000.00 $ 6,400,000.00 $ 8,320,000.00 $ 5,760,000 $ 6,400,000 $ 8,320,000
Regulators $ - $ - $ - Connector 3 3 5 No. $ 2,250,000.00 $ 2,500,000.00 $ 3,250,000.00 $ 6,750,000 $ 7,500,000 $ 16,250,000
ON-FARM WORKS $ - $ - $ - Connector 1 1 1 Item $ 4,500,000.00 $ 5,000,000.00 $ 6,500,000.00 $ 4,500,000 $ 5,000,000 $ 6,500,000
FENCTING $ - $ - $ - Connector 129600 144000 172800 m $ 7.20 $ 8.00 $ 10.00 $ 933,120 $ 1,152,000 $ 1,728,000
Land Acquisition $ - $ - $ - Title adjustments 99 110 132 No $ 9,000.00 $ 10,000.00 $ 13,000.00 $ 891,000 $ 1,100,000 $ 1,716,000 Land acquired as freehold 468 520 624 Ha $ 18,000.00 $ 20,000.00 $ 26,000.00 $ 8,424,000 $ 10,400,000 $ 16,224,000
$ - $ - $ - TOTAL RAW CAPITAL COST 174,558,720$ 220,444,000$ 365,161,000$
Design and Administration Costs (%) 34,911,744$ 44,088,800$ 73,032,200$
Contingency (%) 83,788,186$ 105,813,120$ 175,277,280$
TOTAL CAPITAL COST 293,258,650$ 370,345,920$ 613,470,480$
ANNUAL COSTS
Cost item Assumptions / Sources Min Expected Max Min Expected Max Min Expected Max
Maintance Cost 0.3-0.5% of capital 1 1 1 Item $ 1,188,698.11 $ 1,488,406.08 $ 2,495,957.52 $ 1,188,698 $ 1,488,406 $ 2,495,958 Operational Cost one operator and vehicle 1 1 1 Item $ 250,000.00 $ 250,000.00 $ 250,000.00 $ 250,000 $ 250,000 $ 250,000
$ - $ - $ - TOTAL RAW ANNUAL COST 1,438,698$ 1,738,406$ 2,745,958$
Contingency (%) 287,740$ 347,681$ 549,192$
TOTAL ANNUAL COST 1,726,438$ 2,086,087$ 3,295,149$
Cost Analysis
Quantity UNIT Price or Rates Cost Range
Go to Table of Contents
Cost AnalysisQuantity UNIT Price or Rates Cost Range
DB_08_BCS_Options_Costing_Model.xlsx
Option_15_BA
Printed: 4:08 PM on 4/02/2011 Page: 26 of 26
Related Documents