Legend to Supplemental Figures Supplemental Figure 1. MET is not overexpressed in tumors which display KRAS mutations as a mechanism of secondary resistance to EGFR targeted monoclonal antibodies. At relapse from anti-EGFR therapy, we collected tumor samples from three patients (#5, #6 and #7), in which KRAS mutations became detectable after treatment. Immunohistochemical staining for MET was negative in all three cases. Supplemental Figure 2. Schematic representation of the PCR based strategy used to detect the locus-specific rearrangement associated to MET amplification in samples from patient #2 Regional detail (chr7:85,000,000-130,000,000) of the sequencing depth (y-axis) from the whole genome sequencing performed on Patient #2 (post Pmab); three distinct loci show an increased depth, including the region harbouring the MET oncogene (around position chr7:116,000,000). The lower scheme shows the positions and orientations of the primers used to detect both the rearranged and wild-type chromosome. Supplemental Figure 3. Schematic representation of the PCR based strategy used to detect the locus-specific rearrangement associated to MET amplification in samples from patient #3 and identification of MET amplification in circulating tumor DNA during anti-EGFR therapy.

Welcome message from author
This document is posted to help you gain knowledge. Please leave a comment to let me know what you think about it! Share it to your friends and learn new things together.
Transcript
Legend to Supplemental Figures
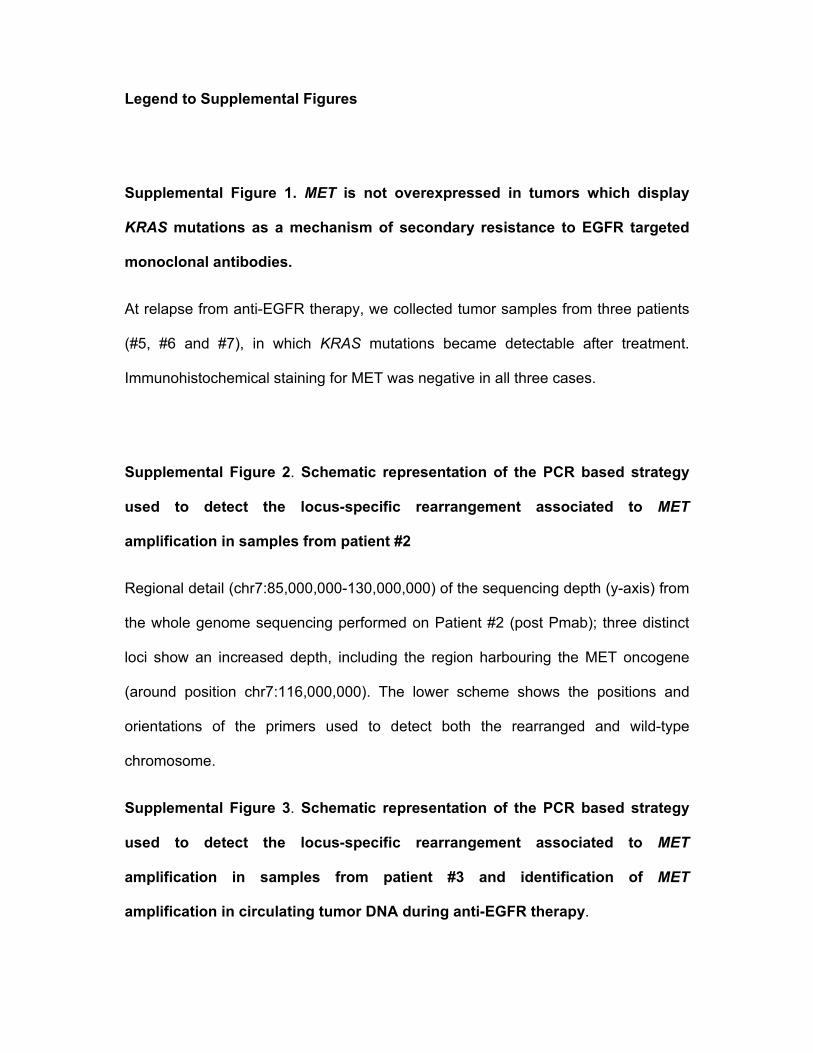
Supplemental Figure 1. MET is not overexpressed in tumors which display
KRAS mutations as a mechanism of secondary resistance to EGFR targeted
monoclonal antibodies.
At relapse from anti-EGFR therapy, we collected tumor samples from three patients
(#5, #6 and #7), in which KRAS mutations became detectable after treatment.
Immunohistochemical staining for MET was negative in all three cases.
Supplemental Figure 2. Schematic representation of the PCR based strategy
used to detect the locus-specific rearrangement associated to MET
amplification in samples from patient #2
Regional detail (chr7:85,000,000-130,000,000) of the sequencing depth (y-axis) from
the whole genome sequencing performed on Patient #2 (post Pmab); three distinct
loci show an increased depth, including the region harbouring the MET oncogene
(around position chr7:116,000,000). The lower scheme shows the positions and
orientations of the primers used to detect both the rearranged and wild-type
chromosome.
Supplemental Figure 3. Schematic representation of the PCR based strategy
used to detect the locus-specific rearrangement associated to MET
amplification in samples from patient #3 and identification of MET
amplification in circulating tumor DNA during anti-EGFR therapy.
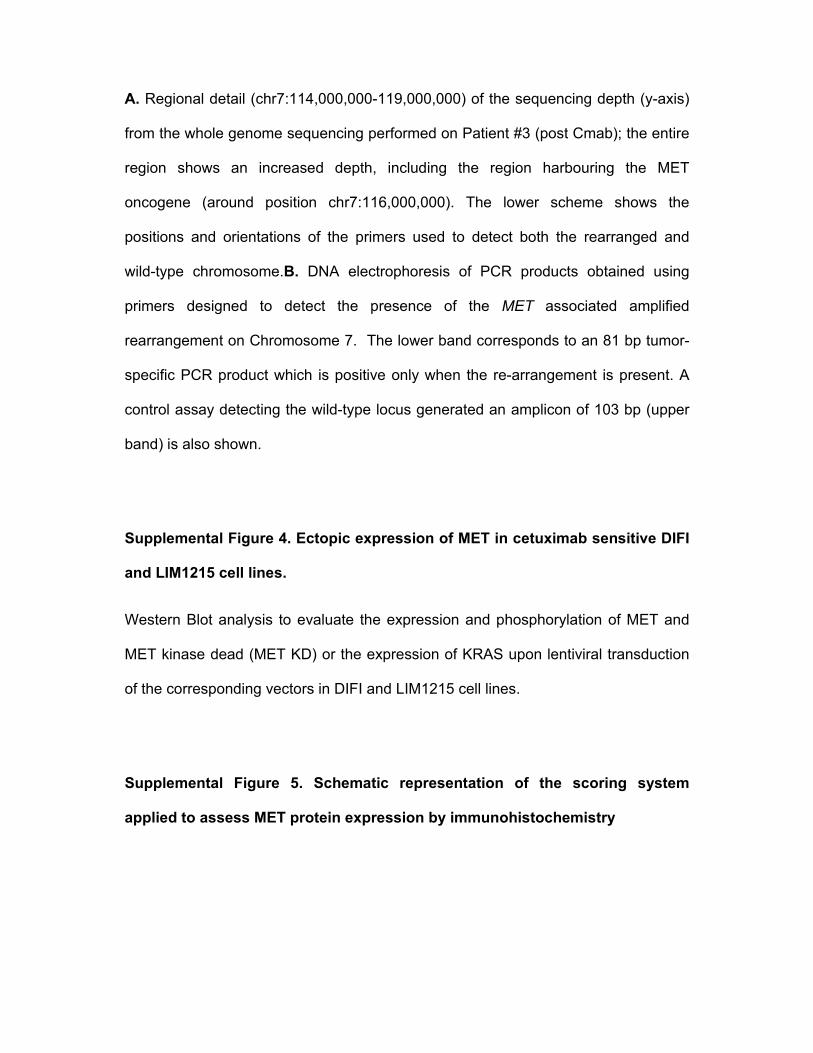
A. Regional detail (chr7:114,000,000-119,000,000) of the sequencing depth (y-axis)
from the whole genome sequencing performed on Patient #3 (post Cmab); the entire
region shows an increased depth, including the region harbouring the MET
oncogene (around position chr7:116,000,000). The lower scheme shows the
positions and orientations of the primers used to detect both the rearranged and
wild-type chromosome.B. DNA electrophoresis of PCR products obtained using
primers designed to detect the presence of the MET associated amplified
rearrangement on Chromosome 7. The lower band corresponds to an 81 bp tumor-
specific PCR product which is positive only when the re-arrangement is present. A
control assay detecting the wild-type locus generated an amplicon of 103 bp (upper
band) is also shown.
Supplemental Figure 4. Ectopic expression of MET in cetuximab sensitive DIFI
and LIM1215 cell lines.
Western Blot analysis to evaluate the expression and phosphorylation of MET and
MET kinase dead (MET KD) or the expression of KRAS upon lentiviral transduction
of the corresponding vectors in DIFI and LIM1215 cell lines.
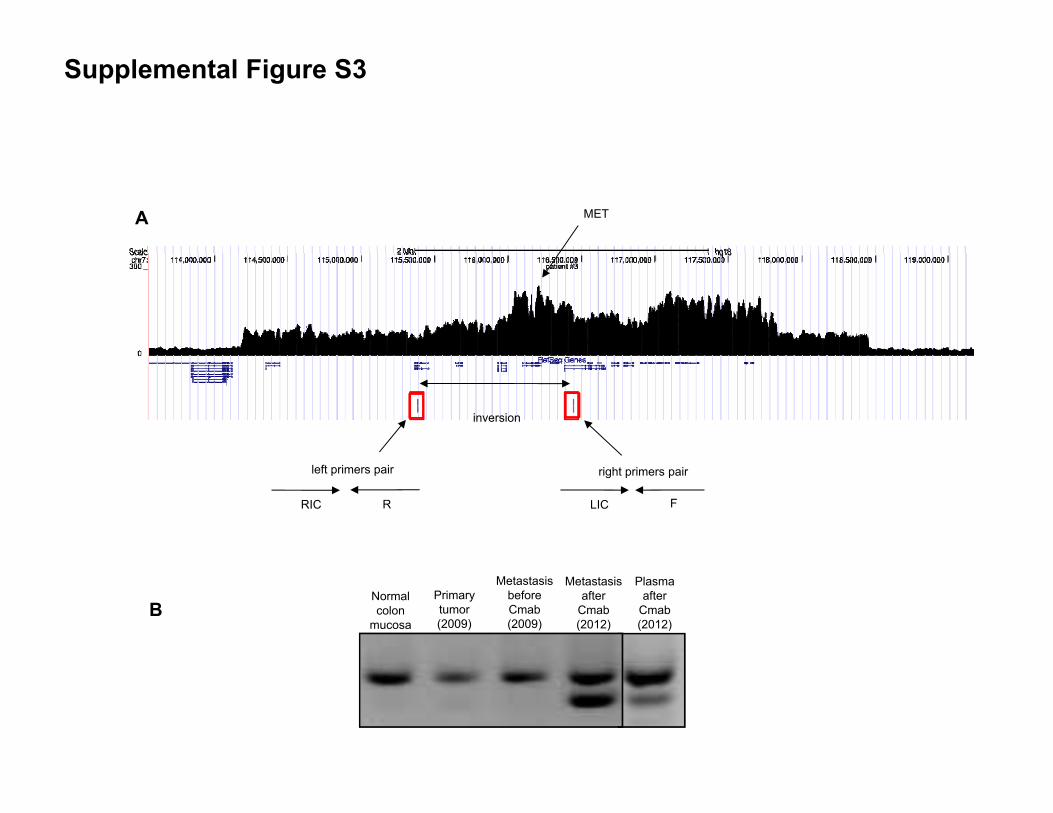
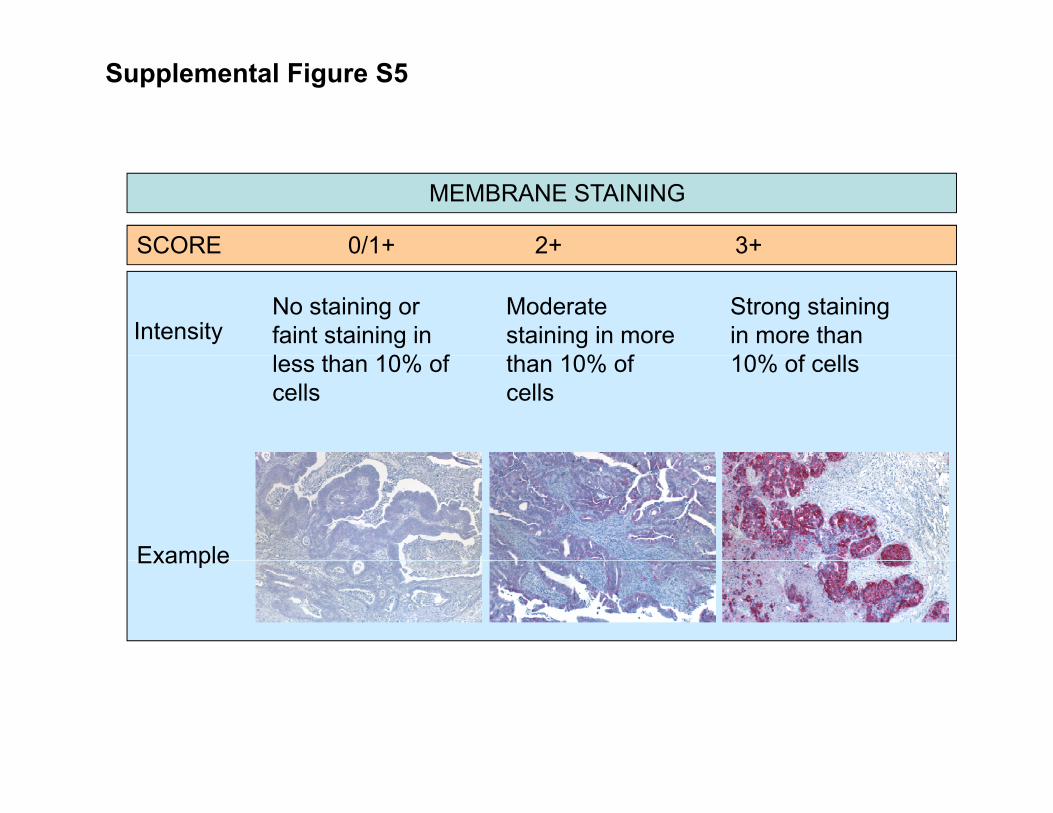
Supplemental Figure 5. Schematic representation of the scoring system
applied to assess MET protein expression by immunohistochemistry

Supplemental Figure S1 t I
HC
Patient #5
Met
40X
et IH
C
Patient #6
Me
40X
et IH
C
Patient #7
Me
40X

Supplemental Figure S2
Patient #2 (post Pmab) MET region(p ) MET region
inversion
left primers pair right primers pair
RIC R LIC F
Supplemental Figure S3
META
inversion
left primers pair right primers pair
RIC R LIC F
Primary tumor (2009)
Normal colon
mucosa
Metastasis before Cmab (2009)
Plasma after
Cmab (2012)
Metastasis after
Cmab (2012)
B

Supplemental Figure S4
MO
CK
ME
T
ME
T K
D
MO
CK
KR
AS
DIFI LIM1215
MET
P-MET
ACTIN
KRAS
ACTIN
MET
P-MET
ACTIN
KRAS
ACTIN
MO
CK
ME
T
ME
T K
D
MO
CK
KR
AS
Supplemental Figure S5
MEMBRANE STAINING
SCORE 0/1+ 2+ 3+SCORE 0/1 2 3
No staining or faint staining in l th 10% f
IntensityModerate staining in more th 10% f
Strong staining in more than 10% f llless than 10% of
cellsthan 10% of cells
10% of cells
ExampleExample
Related Documents