Rev. Integr. Bus. Econ. Res. Vol 3(1) 13 Copyright 2014 Society of Interdisciplinary Business Research (www.sibresearch.org ) ISSN: 2304-1013 (Online); 2304-1269 (CDROM) Bankruptcy Prediction Model: An Industrial Study in Indonesian Publicly-listed Firms During 1999-2010 M. Sienly Veronica* School of Management Studies, Faculty of Economics, Universitas Kristen Maranatha, Bandung, Indonesia Email: [email protected] Samuel PD Anantadjaya Faculty of Business Administration & Humanities Swiss German University, BSD City, Serpong, Tangerang, Indonesia Email: [email protected] ABSTRACT It is a common understanding that bankruptcy is not a sudden occurrence for any organizations. Macro and micro economic studies have suggested numerous influential factors, which have substantial evidence toward firm’s performance (Bekeris, 2012) and survivability (Nehrebecka & Dzik, 2013). With a humble intention to enrich the available literatures, this study attempts to establish a corporate bankruptcy prediction model (Trigo & Costanzo, 2007) to minimize the chances of bankruptcy for Indonesian firms. Literatures have indicated various factors to be used as the foundation toward building the bankruptcy prediction models. Those factors include; (1) macroeconomic factors, which are frequently denoted by GDP, exchange rate, inflation and interest rates, and (2) the company's financial performance factors, which are commonly measured by financial ratios and cash flow ratios. To obtain the corporate bankruptcy prediction model, it was necessary to test the prevailing factors used in this study. This study emphasizes on the publicly-listed firms in Bursa Efek Indonesia (BEI) during the period of 1999- 2010. Relying on the purposive sampling method, this study covered a total of 63 publicly-listed companies in BEI, whereby 34 companies were financially sound, and 29 companies that have filed for bankruptcy. The sample analysis (60% of samples) was incorporated to establish the corporate bankruptcy prediction model. In addition, the sample validation (40% of samples) was used to test the degree of accuracy of the corporate bankruptcy prediction model. The logistic regression results show that firm's financial performance factors influence the likelihood of bankruptcy, while macroeconomic factors did not seem to impact the company's likelihood toward bankruptcy. At the level of accuracy for predicting bankruptcy is approximately 94%, the prediction model is Ln (P/1-P) = -28.142 + 1.442 + 37.547 CR DAR - 88.911 CFROA. These results prescribed the importance of noting and safeguarding the company's financial performance, as well as considering the corporate bankruptcy prediction model to gauge the firm’s financial condition. Keywords: bankruptcy prediction model, logistic regression, macroeconomics, financial performance, financial ratios, cash flow ratios I. INTRODUCTION Bankruptcy is certainly not a sudden event. There are early symptoms, which eventually lead into bankruptcy and liquidation. Empirical studies on the predictions of corporate bankruptcy are numerous as this is not a new topic in the field of management. Nonetheless, though bankruptcy is not a new topic and there have been countless studies, the impact of crisis, which fueled the earlier bankruptcy prediction models, may be interesting to study again (Kaaro, 2004). The monetary crisis in mid-1997, as the level of Rupiah slipped, had led firms to file-up for bankruptcy. To respond, the government of Indonesia tightened the monetary policy by increasing the level of interest rates higher than the rate of inflation. This condition was present in 1998, as the monthly interest rate reached 70% per year, and interest rates on time deposits were even higher (Boediono, 2009). The increase in the interest rates led to an increase in

Welcome message from author
This document is posted to help you gain knowledge. Please leave a comment to let me know what you think about it! Share it to your friends and learn new things together.
Transcript

Rev. Integr. Bus. Econ. Res. Vol 3(1) 13
Copyright 2014 Society of Interdisciplinary Business Research (www.sibresearch.org) ISSN: 2304-1013 (Online); 2304-1269 (CDROM)
Bankruptcy Prediction Model: An Industrial Study in Indonesian Publicly-listed Firms During 1999-2010 M. Sienly Veronica* School of Management Studies, Faculty of Economics, Universitas Kristen Maranatha, Bandung, Indonesia Email: [email protected] Samuel PD Anantadjaya Faculty of Business Administration & Humanities Swiss German University, BSD City, Serpong, Tangerang, Indonesia Email: [email protected]
ABSTRACT
It is a common understanding that bankruptcy is not a sudden occurrence for any organizations. Macro and micro economic studies have suggested numerous influential factors, which have substantial evidence toward firm’s performance (Bekeris, 2012) and survivability (Nehrebecka & Dzik, 2013). With a humble intention to enrich the available literatures, this study attempts to establish a corporate bankruptcy prediction model (Trigo & Costanzo, 2007) to minimize the chances of bankruptcy for Indonesian firms. Literatures have indicated various factors to be used as the foundation toward building the bankruptcy prediction models. Those factors include; (1) macroeconomic factors, which are frequently denoted by GDP, exchange rate, inflation and interest rates, and (2) the company's financial performance factors, which are commonly measured by financial ratios and cash flow ratios. To obtain the corporate bankruptcy prediction model, it was necessary to test the prevailing factors used in this study. This study emphasizes on the publicly-listed firms in Bursa Efek Indonesia (BEI) during the period of 1999-2010. Relying on the purposive sampling method, this study covered a total of 63 publicly-listed companies in BEI, whereby 34 companies were financially sound, and 29 companies that have filed for bankruptcy. The sample analysis (60% of samples) was incorporated to establish the corporate bankruptcy prediction model. In addition, the sample validation (40% of samples) was used to test the degree of accuracy of the corporate bankruptcy prediction model. The logistic regression results show that firm's financial performance factors influence the likelihood of bankruptcy, while macroeconomic factors did not seem to impact the company's likelihood toward bankruptcy. At the level of accuracy for predicting bankruptcy is approximately 94%, the prediction model is Ln (P/1-P) = -28.142 + 1.442 + 37.547 CR DAR - 88.911 CFROA. These results prescribed the importance of noting and safeguarding the company's financial performance, as well as considering the corporate bankruptcy prediction model to gauge the firm’s financial condition.
Keywords: bankruptcy prediction model, logistic regression, macroeconomics, financial performance, financial ratios, cash flow ratios
I. INTRODUCTION Bankruptcy is certainly not a sudden event. There are early symptoms, which eventually lead into bankruptcy and liquidation. Empirical studies on the predictions of corporate bankruptcy are numerous as this is not a new topic in the field of management. Nonetheless, though bankruptcy is not a new topic and there have been countless studies, the impact of crisis, which fueled the earlier bankruptcy prediction models, may be interesting to study again (Kaaro, 2004). The monetary crisis in mid-1997, as the level of Rupiah slipped, had led firms to file-up for bankruptcy. To respond, the government of Indonesia tightened the monetary policy by increasing the level of interest rates higher than the rate of inflation. This condition was present in 1998, as the monthly interest rate reached 70% per year, and interest rates on time deposits were even higher (Boediono, 2009). The increase in the interest rates led to an increase in
Rev. Integr. Bus. Econ. Res. Vol 3(1) 14
Copyright 2014 Society of Interdisciplinary Business Research (www.sibresearch.org) ISSN: 2304-1013 (Online); 2304-1269 (CDROM)
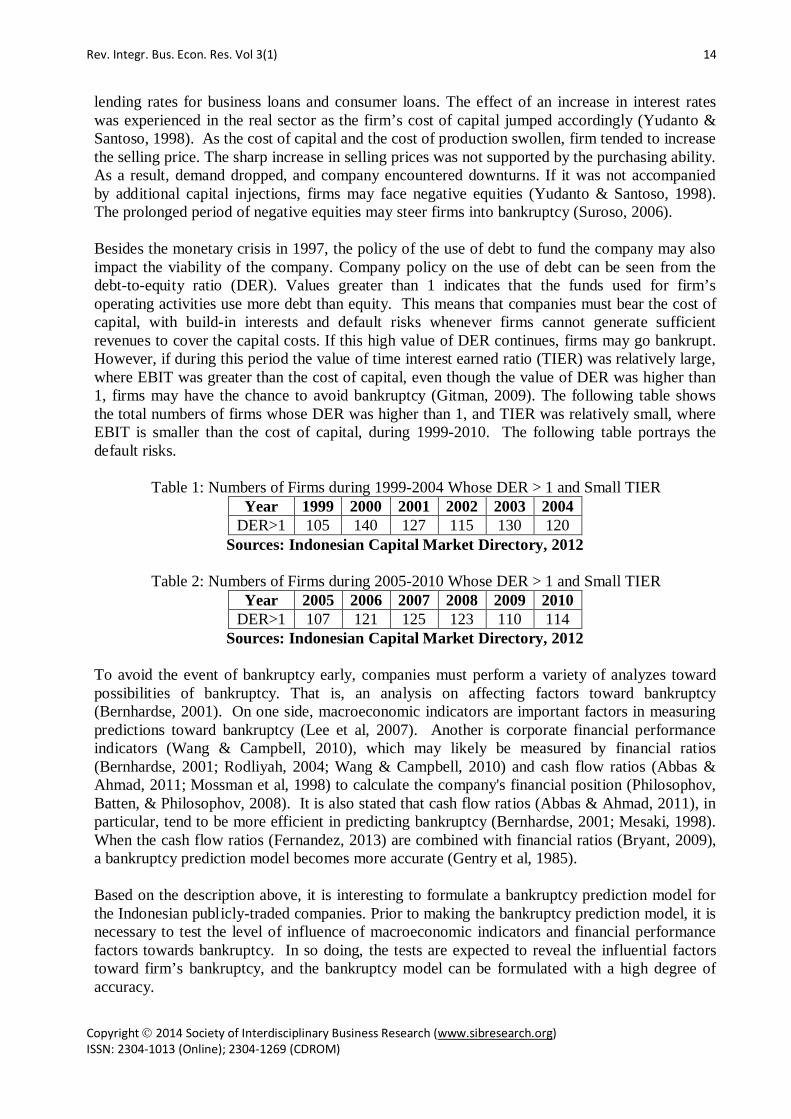
lending rates for business loans and consumer loans. The effect of an increase in interest rates was experienced in the real sector as the firm’s cost of capital jumped accordingly (Yudanto & Santoso, 1998). As the cost of capital and the cost of production swollen, firm tended to increase the selling price. The sharp increase in selling prices was not supported by the purchasing ability. As a result, demand dropped, and company encountered downturns. If it was not accompanied by additional capital injections, firms may face negative equities (Yudanto & Santoso, 1998). The prolonged period of negative equities may steer firms into bankruptcy (Suroso, 2006). Besides the monetary crisis in 1997, the policy of the use of debt to fund the company may also impact the viability of the company. Company policy on the use of debt can be seen from the debt-to-equity ratio (DER). Values greater than 1 indicates that the funds used for firm’s operating activities use more debt than equity. This means that companies must bear the cost of capital, with build-in interests and default risks whenever firms cannot generate sufficient revenues to cover the capital costs. If this high value of DER continues, firms may go bankrupt. However, if during this period the value of time interest earned ratio (TIER) was relatively large, where EBIT was greater than the cost of capital, even though the value of DER was higher than 1, firms may have the chance to avoid bankruptcy (Gitman, 2009). The following table shows the total numbers of firms whose DER was higher than 1, and TIER was relatively small, where EBIT is smaller than the cost of capital, during 1999-2010. The following table portrays the default risks.
Table 1: Numbers of Firms during 1999-2004 Whose DER > 1 and Small TIER Year 1999 2000 2001 2002 2003 2004
DER>1 105 140 127 115 130 120 Sources: Indonesian Capital Market Directory, 2012
Table 2: Numbers of Firms during 2005-2010 Whose DER > 1 and Small TIER
Year 2005 2006 2007 2008 2009 2010 DER>1 107 121 125 123 110 114
Sources: Indonesian Capital Market Directory, 2012 To avoid the event of bankruptcy early, companies must perform a variety of analyzes toward possibilities of bankruptcy. That is, an analysis on affecting factors toward bankruptcy (Bernhardse, 2001). On one side, macroeconomic indicators are important factors in measuring predictions toward bankruptcy (Lee et al, 2007). Another is corporate financial performance indicators (Wang & Campbell, 2010), which may likely be measured by financial ratios (Bernhardse, 2001; Rodliyah, 2004; Wang & Campbell, 2010) and cash flow ratios (Abbas & Ahmad, 2011; Mossman et al, 1998) to calculate the company's financial position (Philosophov, Batten, & Philosophov, 2008). It is also stated that cash flow ratios (Abbas & Ahmad, 2011), in particular, tend to be more efficient in predicting bankruptcy (Bernhardse, 2001; Mesaki, 1998). When the cash flow ratios (Fernandez, 2013) are combined with financial ratios (Bryant, 2009), a bankruptcy prediction model becomes more accurate (Gentry et al, 1985). Based on the description above, it is interesting to formulate a bankruptcy prediction model for the Indonesian publicly-traded companies. Prior to making the bankruptcy prediction model, it is necessary to test the level of influence of macroeconomic indicators and financial performance factors towards bankruptcy. In so doing, the tests are expected to reveal the influential factors toward firm’s bankruptcy, and the bankruptcy model can be formulated with a high degree of accuracy.

Rev. Integr. Bus. Econ. Res. Vol 3(1) 15
Copyright 2014 Society of Interdisciplinary Business Research (www.sibresearch.org) ISSN: 2304-1013 (Online); 2304-1269 (CDROM)
II. THEORY AND HYPOTHESES DEVELOPMENT II.1. Corporate Bankruptcy Bankruptcy is commonly regarded as failures to run profitable company's operations (Almilia & Herdiningtyas, 2005). In this case, the term “failures” has 2 possible meanings (Adnan & Kurniasih, 2000);
1. Economic Failure, which refers to the condition where a company’s revenues cannot cover the operational costs. In other words, the level of company’s earnings is less than the cost of capital, which simply denotes that the present value of cash flows is less than the present value of liabilities.
2. Financial Failure, which refers to the insolvency of a cash flows. The stage of insolvency
can be evaluated from technical insolvency and bankruptcy. Technical insolvency signifies the condition whereby firms cannot meet their financial obligations as they are coming due although the value of total assets exceed total liabilities. Technical insolvency occurs also when firms’ cash flows are insufficient to meet the required payments on certain dates. On the other side, bankruptcy signifies the condition of a negative net worth in the balance sheet. This means that the present value of expected cash flows is less than the present value of liabilities.
Measuring bankruptcy can also be seen from the 2 approaches; the flow approach and the stock approach (Hanafi, 2004). From the perspective of the company's stock approach, bankruptcy can be declared if the firm’s total liabilities exceed total assets. From the perspective of the flow approach, bankruptcy can be declared if the firm cannot generate sufficient cash flow. II.2. Causes of Corporate Bankruptcy From the understanding of strategic management, influential factors toward bankruptcy can be grouped into 2 parts; internal factors and external factors. Those internal factors may be categorized into the following (Darsono & Ashari, 2005);
1. Inefficient management, which may consist of wastes in production costs, or lack of management skills and expertise, which may potentially lead into continuous deficiencies of funds.
2. Imbalance between capital, receivables, and payables. Too much debt pushes up interest
expense, which squeezes the firm’s operating margin. Too much receivable may represent idle assets, which may not generating revenues otherwise.
3. Moral hazard by management, such as; fraud may potentially lead firms into bankruptcy.
Corruptions and providing false information to shareholders and investors may also contribute to bankruptcy.
External factors, which may influence bankruptcy, can be categorized as follows (Harianto & Sudomo, 2001);
1. Directly related external factors include; (1) customers tastes and preferences may lead them to switch to different products of different firms, (2) suppliers’ relationships are not properly maintained and, in turn, firms can experience difficulties in obtaining all the necessary supplies for operational activities, (3) debtors may affect the firm’s receivables and disturb firm’s repayment cycles, (4) creditors may affect the smooth injections of necessary financing, particularly for working capital requirements
2. Indirectly related external factors include; (1) macroeconomic conditions, and (2) global

Rev. Integr. Bus. Econ. Res. Vol 3(1) 16
Copyright 2014 Society of Interdisciplinary Business Research (www.sibresearch.org) ISSN: 2304-1013 (Online); 2304-1269 (CDROM)
competition, which may likely cause increasing pressure toward tight competition in business operations. Also, these indirectly related external factors may put stress toward continuous improvement for the products, for instance.
II.3. Corporate Bankruptcy Prediction Model Bankruptcy prediction models can be grouped into 3 categories (Aziz and Dar, 2006);
1. Statistical models follow the classical standard procedures in modeling. This model emphasizes on symptoms of failures of the company. Such statistical models can be in the form of univariate and/or multivariate analysis on the bankruptcy prediction modeling.
2. Artificially Intelligent Expert System (AIES) models focuses on the symptoms of
corporate failures, which are commonly based on multivariate analysis.
3. Theoretical models concentrates on the causes of failures, qualitatively. This model is formed based on theories of the corporate failures. The theoretical model relies on statistical techniques to support the pertinent theories.
II.4. Errors on the Corporate Bankruptcy Prediction Model In a bankruptcy prediction model, any formulated models may possibly consist of inaccuracies in noting the real prediction on corporate bankruptcy. The possibility of errors can be grouped into 2 general categories (Beaver, 1966);
1. Type I error states predictions that companies will not bankrupt. However, those firms actually turn out to be filling for bankruptcy. Type I error causes relatively high costs since it may predict “no bankruptcy”, which leads investors to invest more into firms, but in fact, firms turn into bankruptcy. Investors lose their money.
2. Type II error states prediction that companies will bankrupt, but those firms actually stay
in business. Type II error also raises costs, though remain at a lower level than the accumulated costs incurred by the type I error in prediction on bankruptcy. In this case, investors may choose not to invest in firms. When the particular companies stay in business, investors loose the money-making opportunity.
II.5. Macroeconomic Indicators, Financial Performance Indicators & Hypotheses The event of corporate bankruptcy is certainly not caused by only one factor, rather intertwines of many factors. Hence, the formation of a corporate bankruptcy prediction model needs to consider all potential factors. As previously mentioned, it is crucial to consider the following; II.5.1. Macroeconomic Indicators Like it or not, companies are relatively sensitive to macroeconomic conditions (Frederica, 2012), as those macroeconomic conditions affect the daily operations (Tandelilin, 2010). Also, it is simply due to the fact that companies are not standing alone in certain industries, or countries, or even the world. For this reason, the bankruptcy prediction model should contain information about the environment (Balcaen & Ooghe, 2004). The common macroeconomic indicators include; inflation, interest rates, gross domestic product (GDP), and exchange rates.
1. Inflation represents an increase in the prices of goods and services due to the increase of production costs, crop failures, natural disasters, or other incidents, which can potentially cause the level of prices to increase. High inflation indicates a large disparity between the high prices of goods and low purchasing power. High inflation can certainly affect firms, especially those firms that produces outcomes at the rising cost of production, but

Rev. Integr. Bus. Econ. Res. Vol 3(1) 17
Copyright 2014 Society of Interdisciplinary Business Research (www.sibresearch.org) ISSN: 2304-1013 (Online); 2304-1269 (CDROM)
unaccompanied by the increasing purchasing power. This leads to inventory pile-up in warehouses. This condition slows down the cash flow cycles for firms, and may potentially create financial difficulties, if such a condition is prolonged. The relationships between inflation and bankruptcy have been confirmed in the studies by Lee et al (2007), Tirapat & Nittayagasetwat (1999), and Liou & Smith (2006). Those studies state that inflation is indeed an important factor in predicting bankruptcy, and inflation contributes to the possibility of firm’s financial difficulties.
2. Interest rate gives effects to companies. For companies that do not have debts, the level
of the interest rate may not significantly affect the survival of the company directly. For companies that use debts, the level of interest rate may significantly affect the survival of companies directly, as companies may have to pay interest charges on their existing debts. High level of interest rates is translated into higher interest expenses and higher cost to the companies. If such higher costs are not accompanied by higher revenues, companies incur losses. This is supported by studies by Shepard & Collins (1982), which states that the interest rate is an important indicator toward the bankruptcy prediction models. An empirical study by Salman et al (2009), also states that high interest-bearing loans leads to corporate bankruptcy. Likewise, Lee et al (2007) states that interest rates is an important factor in the formation of corporate bankruptcy prediction model.
3. GDP provides information on the aggregate amount of goods and services that have been
produced by a certain country (Harianto & Sudomo, 2001). Increasing GDP indicates that the aggregate amounts of goods and services that have been produced domestically have increased. This may be due to an increase demand as the level of purchasing power rises. With the higher purchasing power of the society, companies’ revenues tend to increase, and the general condition of firms is relatively further away from bankruptcy. In short, it is safe to conclude that the higher GDP, the better the company. Previous studies have noted that GDP effects the formulation of a bankruptcy prediction model (Liou & Smith, 2006; Salman et al, 2009). Though logically it is expected to have a positive relationship, Salman et al (2009) finds that GDP had a negative relationship toward corporate bankruptcy.
4. Exchange rate represents the level of Rupiah against other currencies. The value of
exchange rate can certainly go up or down. In other terms, the value of Rupiah, for instance, can certainly strengthen or weaken. During the period of a strong Rupiah, firms that rely on the use of foreign currencies in their venture capital financing and/or payment of imported materials may have experienced higher operating margin since these firms can purchase foreign currencies at a lower price. Though the prices may appear much more expensive in the international marketplaces, domestically, the products become relatively cheaper. This ignites higher demands, and firms may continue to prosper. The opposite is certainly true during the weak Rupiah. With a weak Rupiah, foreign currencies become more expensive to purchase. This pushes up the production costs. When firms also experience hurdles in increasing their revenues accordingly, firms may face financial difficulties
Based on the description above, it is obvious that macroeconomic indicators (Frederica, 2012), such as; inflation, interest rates, GDP, and exchange rates can bring-about impact toward the likelihood of bankruptcy (Nam et al, 2008). II.5.2. Financial Performance

Rev. Integr. Bus. Econ. Res. Vol 3(1) 18
Copyright 2014 Society of Interdisciplinary Business Research (www.sibresearch.org) ISSN: 2304-1013 (Online); 2304-1269 (CDROM)
As previously mentioned, the company’s financial performance can be evaluated from the financial ratios and cash flow ratios to gauge the survivability of firms (Munawir, 1998; Sharma, 2001). If cash flow ratios (Abbas & Ahmad, 2011) denote the efficient use of cash, financial ratios, such as; liquidity, solvency, activity, profitability, and market ratios, symbolize the firm’s financial health.
1. Liquidity ratios (Back, 2001) represent the company's ability to use current assets to cover current liabilities. The greater the liquidity ratio, it shows that the company has a relatively large current asset. This is translated into a higher level of liquidity. In their study, Glezakos et al (2010) conclude that liquidity ratios are a good indicator toward bankruptcy prediction models. This finding is supported by Hadad et al (2003), where they state that the liquidity ratios are the best discriminator in distinguishing companies, whether those firms are heading toward bankruptcy or not. Also, Almilia & Kristijadi (2003), Kaaro (2004), and Mensha (1984) conclude that the liquidity ratios are relatively consistent in predicting the company's financial health.
2. Solvency ratios, or otherwise referred to as leverage, measure the level of debts. In a
broader sense, the solvency ratio is used to assess firms’ ability to pay all of their liabilities, both short-term and long-term (Kasmir, 2008). The debt-financing-assets may impact the company's capital structure because too large debt financing may lead to less-than-optimal capital structure, even though debts can reduce tax payments. This is supported by research by Ohlson (1980), Tanthanongsakkun et al (2009), Manurung (2003), Gamayuni (2006) and Parulian (2007), where they state that the solvency ratios can be used in the formulation of a corporate bankruptcy model. Mensha (1984) also state that the solvency ratios are important indicators toward bankruptcy prediction models. In addition, Kaaro (2004) and Munthe (2008) conclude that liquidity ratios are relatively consistent in predicting the company's health.
3. Activity ratios, or otherwise referred to as efficiency ratios, measure the availability of
liquid assets, which may be used to support firm’s operational activities in creating sales. The higher level of sales may show that more assets are utilized by firms in generating profits. Hence, the probability of bankruptcy becomes smaller. The relationships between the activity ratios and the possibility of corporate bankruptcies are studied by Rodliyah (2004), which states that the activity ratios are relatively dominant in the formation of a bankruptcy prediction model, particularly the total asset turnover ratio (TATO). This confirms Altman's bankruptcy prediction equation (Sari, 2012) whereby the TATO is one of the indicators used in predicting firm’s bankruptcy.
4. Profitability ratios measure of the effectiveness of management of a company (Kasmir,
2008), and are closely associated to the firm’s ultimate goal to generate the maximum level of earnings. When the profitability ratios increase, firms generate higher earnings. The relationships between profitability ratios and corporate bankruptcy are studied by Keasy & McGuinness (1990) where the indicators of profitability provide significant results in explaining insolvency. Atmini & Wuryana (2005), in their studies, also conclude that one of the dominant financial ratios, which is significantly affecting the company's financial distress, is the profitability ratios, such as; return on investment (ROI). Also, Munthe (2008) state that the profitability ratios can be used to predict corporate bankruptcy.
5. Market ratios provide information on how well companies manage investor outcomes
and risks. These market ratios reflect the market valuation on the performance of all

Rev. Integr. Bus. Econ. Res. Vol 3(1) 19
Copyright 2014 Society of Interdisciplinary Business Research (www.sibresearch.org) ISSN: 2304-1013 (Online); 2304-1269 (CDROM)
aspects of the company's past performance and expectations (Sundjaja et al, 2010). The greater the market values, the higher the market ratios. This indicates a better firm’s performance. The relationships between the market ratios and corporate bankruptcies are researched by Atiya (2001), and Mensah (1983) which states that the ratio of the market can be used to help shape the corporate bankruptcy prediction model.
Based on these descriptions, it can be concluded that financial ratios, which are extracted from the firm’s financial statements, have the ability to affect the possibilities of corporate bankruptcy (Libby, 1975; Zavgren, 1985). In addition to the company's financial ratios, cash flow statements are often used by analysts to assess firm’s performance. The more positive operating cash flows signify the greater operational margins. This reduces the chances of bankruptcy in the future. The importance of cash flow ratios (Jooste, 2006) in predicting bankruptcy of enterprises is supported by studies by Beaver (1966) and Deakin (1972), where they state that cash flow to total debt is a relatively accurate predictor in predicting bankruptcy. Mesaki (1998) and Mossman et al (1998) also conclude that a bankruptcy prediction model using the cash flow ratios make an efficient insolvency prediction model. Sung et al (1999) also state that the cash flow ratios are the most important indicators in shaping the corporate bankruptcy prediction models. The combinations of financial ratios and cash flow ratios can form a bankruptcy prediction model with better accuracy (Gentry et al, 1985). In addition, Subagyo (2007) state that the financial ratios and economic indicators can be used as contributing variables toward corporate bankruptcy prediction model. Noting the details, Djumahir (2007) also state that micro indicators, such as; equity, retained earnings, operating margins, working capitals, and macro indicators, such as; interest rates, inflation and exchange rates, simultaneously can predict corporate financial distress. Therefore, a research framework using the combinations of macroeconomic indicators, financial ratios, and cash flow ratios, can be illustrated in the following diagram.
Figure 1: Research Frameworks
Macroeconomic Indicators
X1: mean of Inflation
X2: mean of Interest Rates
X3: mean of GDP
X4: mean of Exchange Rates
Financial Performance
Indicators
Financial Ratios:X5: Current Ratio
X6: Cash RatioX7: Debt-to-Asset
X8: Times Interest EarnedX9: Total Asset TurnoverX10: Inventory Turnover
X11: Return on EquityX12: Return on Assets
X13: Market-to-Book ValueX14: Price Earnings Ratio
Cash Flow Ratios:X15: Cash Flow Adequacy
X16: Dividend Payout RatioX17: Reinvestment Ratio
X18: Debt Coverage RatioX19: Cash Flow Return on Assets
Firm Condition0 = Non-Bankrupt
1 = Bankrupt

Rev. Integr. Bus. Econ. Res. Vol 3(1) 20
Copyright 2014 Society of Interdisciplinary Business Research (www.sibresearch.org) ISSN: 2304-1013 (Online); 2304-1269 (CDROM)
Under these conditions, and with regards to the research framework, the following hypotheses are formulated; H1 : Macroeconomic indicators and financial performance indicators simultaneously impact
the corporate bankruptcy. H2 : Macroeconomic indicators and financial ratios impact the corporate bankruptcy. H3 : Macroeconomic indicators and cash flow ratios impact the corporate bankruptcy. H4 : Financial performance indicators impact the corporate bankruptcy. III. METHODS III.1. Types of Research This study follows the descriptive-associative research method. Descriptive-associative method is used to explain the characteristics of variables, and have the ability to determine the relationships among variables (Sekaran, 2006; Suliyanto, 2009). III.2. Operations of Research Variables The variables used in this study consist of (1) macroeconomic indicators, (2) firm performance indicators, which contain of financial ratios and cash flow ratios, and corporate bankruptcy.
Table 3: Research Variables
No Type of Variables Variables Measurements Scale
1 Dependent Firm Condition Bankrupt and non-bankrupt company
Nominal (1 for “bankrupt
company”, and 0 for non-bankrupt
company)
2 Independent
a. Macroeconomic Indicators
Means of inflation, means of exchange rate, means of interest rate and means of GDP
Ratio
b. Financial Performance Indicators:
• Financial Ratios
Liquidity ratios, activity ratios, solvency ratios, profitability ratios and market ratios.
Ratio
• Cash Flow Ratios Efficiency ratios and sufficiency ratios
Ratio
III.3. Population, Sample & Data Analysis The population in this study is all publicly-traded companies in Bursa Efek Indonesia (BEI), which consists of the 9 industrial sectors, and at a total of 442 companies as of April 2012. The samples are drawn based on several criteria; (1) the companies are consistently issuing financial statements during 1999-2010, (2) the companies in the financial sector, financial services, and non-bank financial institutions are excluded, (3) the companies have a total fixed asset of at least Rp. 100 billion (or about US$8.7 million)1 to be recorded as blue-chip companies, and at least Rp. 5 billion (or about US$ 434,782)2
1 At the prevailing exchange rate of about Rp. 11,500/US$1 (SeputarForex.com, 2013).
to be recorded as small-cap companies (these are used as
2 At the prevailing exchange rate of about Rp. 11,500/US$1 (SeputarForex.com, 2013).
Rev. Integr. Bus. Econ. Res. Vol 3(1) 21
Copyright 2014 Society of Interdisciplinary Business Research (www.sibresearch.org) ISSN: 2304-1013 (Online); 2304-1269 (CDROM)
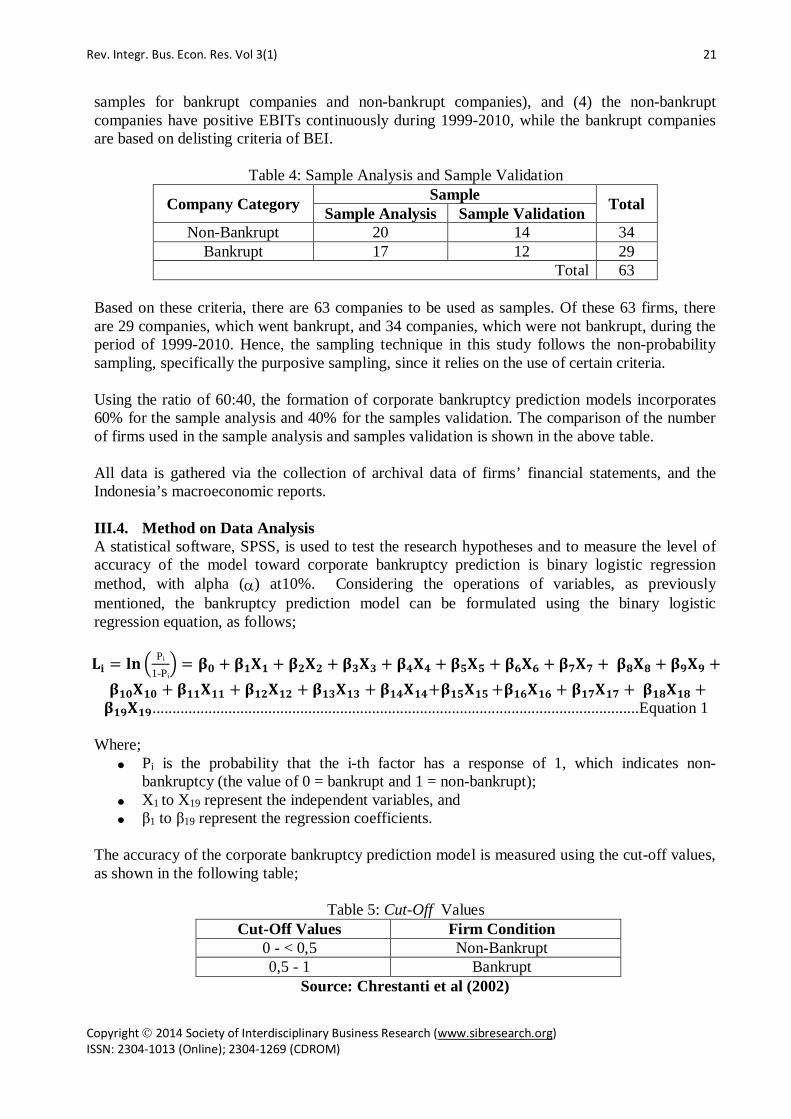
samples for bankrupt companies and non-bankrupt companies), and (4) the non-bankrupt companies have positive EBITs continuously during 1999-2010, while the bankrupt companies are based on delisting criteria of BEI.
Table 4: Sample Analysis and Sample Validation
Company Category Sample Total Sample Analysis Sample Validation Non-Bankrupt 20 14 34
Bankrupt 17 12 29 Total 63
Based on these criteria, there are 63 companies to be used as samples. Of these 63 firms, there are 29 companies, which went bankrupt, and 34 companies, which were not bankrupt, during the period of 1999-2010. Hence, the sampling technique in this study follows the non-probability sampling, specifically the purposive sampling, since it relies on the use of certain criteria. Using the ratio of 60:40, the formation of corporate bankruptcy prediction models incorporates 60% for the sample analysis and 40% for the samples validation. The comparison of the number of firms used in the sample analysis and samples validation is shown in the above table. All data is gathered via the collection of archival data of firms’ financial statements, and the Indonesia’s macroeconomic reports. III.4. Method on Data Analysis A statistical software, SPSS, is used to test the research hypotheses and to measure the level of accuracy of the model toward corporate bankruptcy prediction is binary logistic regression method, with alpha (α) at10%. Considering the operations of variables, as previously mentioned, the bankruptcy prediction model can be formulated using the binary logistic regression equation, as follows; 𝐋𝐋𝐢𝐢 = 𝐥𝐥𝐥𝐥 � Pi
1-Pi� = 𝛃𝛃𝟎𝟎 + 𝛃𝛃𝟏𝟏𝐗𝐗𝟏𝟏 + 𝛃𝛃𝟐𝟐𝐗𝐗𝟐𝟐 + 𝛃𝛃𝟑𝟑𝐗𝐗𝟑𝟑 + 𝛃𝛃𝟒𝟒𝐗𝐗𝟒𝟒 + 𝛃𝛃𝟓𝟓𝐗𝐗𝟓𝟓 + 𝛃𝛃𝟔𝟔𝐗𝐗𝟔𝟔 + 𝛃𝛃𝟕𝟕𝐗𝐗𝟕𝟕 + 𝛃𝛃𝟖𝟖𝐗𝐗𝟖𝟖 + 𝛃𝛃𝟗𝟗𝐗𝐗𝟗𝟗 +
𝛃𝛃𝟏𝟏𝟎𝟎𝐗𝐗𝟏𝟏𝟎𝟎 + 𝛃𝛃𝟏𝟏𝟏𝟏𝐗𝐗𝟏𝟏𝟏𝟏 + 𝛃𝛃𝟏𝟏𝟐𝟐𝐗𝐗𝟏𝟏𝟐𝟐 + 𝛃𝛃𝟏𝟏𝟑𝟑𝐗𝐗𝟏𝟏𝟑𝟑 + 𝛃𝛃𝟏𝟏𝟒𝟒𝐗𝐗𝟏𝟏𝟒𝟒+𝛃𝛃𝟏𝟏𝟓𝟓𝐗𝐗𝟏𝟏𝟓𝟓 +𝛃𝛃𝟏𝟏𝟔𝟔𝐗𝐗𝟏𝟏𝟔𝟔 + 𝛃𝛃𝟏𝟏𝟕𝟕𝐗𝐗𝟏𝟏𝟕𝟕 + 𝛃𝛃𝟏𝟏𝟖𝟖𝐗𝐗𝟏𝟏𝟖𝟖 +𝛃𝛃𝟏𝟏𝟗𝟗𝐗𝐗𝟏𝟏𝟗𝟗..........................................................................................................................Equation 1
Where;
• Pi is the probability that the i-th factor has a response of 1, which indicates non-bankruptcy (the value of 0 = bankrupt and 1 = non-bankrupt);
• X1 to X19 represent the independent variables, and • β1 to β19 represent the regression coefficients.
The accuracy of the corporate bankruptcy prediction model is measured using the cut-off values, as shown in the following table;
Table 5: Cut-Off Values Cut-Off Values Firm Condition
0 - < 0,5 Non-Bankrupt 0,5 - 1 Bankrupt
Source: Chrestanti et al (2002)
Rev. Integr. Bus. Econ. Res. Vol 3(1) 22
Copyright 2014 Society of Interdisciplinary Business Research (www.sibresearch.org) ISSN: 2304-1013 (Online); 2304-1269 (CDROM)
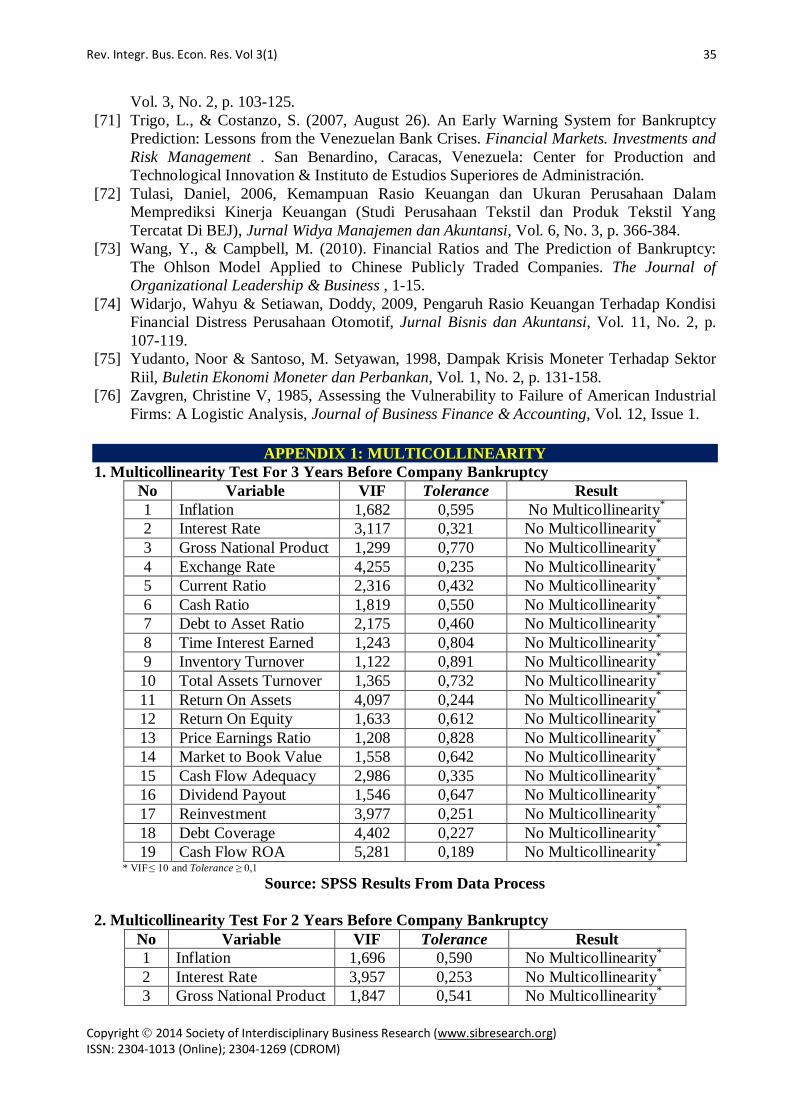
IV. RESULTS IV.1. Data Processing Data on average values for macroeconomic indicators, financial ratios, and cash flow ratios, are compiled in Excel for further processing in SPSS. Once the tests on multicollinearity and conformance are performed, the hypothesis tests are followed for simultaneous and partial tests on the sample analysis for the period of 3 years, 2 years and 1 year before the company went bankrupt. IV.2. Multicollinearity Test Multicollinearity test is necessary to determine the potential similarities with other independent variables in the model (Nugroho, 2005). According to Nugroho (2005), multicollinearity can be evaluated from the Variance Inflation Factor (VIF, no more than 10) and Tolerance values (no less than 0.1). Based on the result of the multicollinearity test, for the period of 1 year prior to bankruptcy, it is necessary to exclude inflation (X1), interest rates (X2), return on equity (X11), and market to book value (X13). Thus, the binary logistic regression equation becomes: 𝐋𝐋𝐢𝐢 = 𝐥𝐥𝐥𝐥 � Pi
1-Pi� = 𝛃𝛃𝟎𝟎 + 𝛃𝛃𝟑𝟑𝐗𝐗𝟑𝟑 + 𝛃𝛃𝟒𝟒𝐗𝐗𝟒𝟒 + 𝛃𝛃𝟓𝟓𝐗𝐗𝟓𝟓 + 𝛃𝛃𝟔𝟔𝐗𝐗𝟔𝟔 + 𝛃𝛃𝟕𝟕𝐗𝐗𝟕𝟕 + 𝛃𝛃𝟖𝟖𝐗𝐗𝟖𝟖 + 𝛃𝛃𝟗𝟗𝐗𝐗𝟗𝟗 + 𝛃𝛃𝟏𝟏𝟎𝟎𝐗𝐗𝟏𝟏𝟎𝟎 +
𝛃𝛃𝟏𝟏𝟐𝟐𝐗𝐗𝟏𝟏𝟐𝟐+𝛃𝛃𝟏𝟏𝟒𝟒𝐗𝐗𝟏𝟏𝟒𝟒+𝛃𝛃𝟏𝟏𝟓𝟓𝐗𝐗𝟏𝟏𝟓𝟓++𝛃𝛃𝟏𝟏𝟔𝟔𝐗𝐗𝟏𝟏𝟔𝟔+𝛃𝛃𝟏𝟏𝟕𝟕𝐗𝐗𝟏𝟏𝟕𝟕+ 𝛃𝛃𝟏𝟏𝟖𝟖𝐗𝐗𝟏𝟏𝟖𝟖 + 𝛃𝛃𝟏𝟏𝟗𝟗𝐗𝐗𝟏𝟏𝟗𝟗……………..….Equation 2
Where;
• Pi is the probability that the i-th factor has a response of 1, which indicates non-bankruptcy (the value of 0 = bankrupt, and 1 = non-bankrupt);
• X3 to X19 represents the independent variable; and • Β3 to β19 represents regression coefficients.
IV.3. Model Fit Test Suitability test is to evaluate whether the model binary logistic regression has been used in accordance with the available data (Ghozali, 2007). Conformance tests for the period of 3 years, 2 years and 1 year before bankruptcy pursue the following procedures (Ghozali, 2007);
1. Determine the hypotheses to assess the suitability of the model, or otherwise known as model fit. Hence, the hypotheses are; H0: The hypothesized model fit with the data. H1: The hypothesized model does not fit with the data.
2. Using the Hosmer and Lemeshow's Goodness of Fit test to determine whether H0 is
accepted or rejected. The criteria for acceptance and rejection are; a. If the value of Hosmer and Lemeshow's Goodness of Fit test is less than 0.05,
then H0 is rejected. This means that there is a significant difference between the models because the model cannot predict the value of observations.
b. If the value of Hosmer and Lemeshow's Goodness of Fit test is greater than 0.05, then H0 is accepted. This means that the model is able to predict the value of an observation. Or, it can be said to be acceptable since the model fits to the data observations.

Rev. Integr. Bus. Econ. Res. Vol 3(1) 23
Copyright 2014 Society of Interdisciplinary Business Research (www.sibresearch.org) ISSN: 2304-1013 (Online); 2304-1269 (CDROM)
The results of suitability tests for the period of 3 years, 2 years and 1 year before bankruptcy are as follows;
Table 6: Model Fit For The Period of 3 years, 2 years, and 1 Year Before Bankruptcy Based on Hosmer and Lemeshow’s Goodness of Fit Test
Chi-Square df Sig Results 3 year 1,14 8 0,997 H0 is accepted 2 year 2,481 8 0,963 H0 is accepted 1 year 9,69 8 0,287 H0 is accepted
Source: SPSS From the above table, it is known that the model fit with observational data for the period of 3 years, 2 years and 1 year before the bankruptcy since the values of Hosmer and Lemeshow's Goodness of Fit test are 1.14, 2.481, and 9.69 respectively, with a significance probability values of 0.997, 0.963, and 0.287, and the level of alpha above 0.05. These results mean that H0 is accepted. IV.4. Hypothesis Testing IV.4.1. Simultaneous Hypothesis Testing For 3 Years, 2 Years, and 1 Year Prior Corporate Bankruptcy Simultaneous hypothesis tests in this study, as stated in the research hypothesis above, state that “macroeconomic indicators and financial performance indicators impact the corporate bankruptcy”. This can be statistically formulated as follows; H0: β1=β2=β3=β4=β5=β6=β7=β8=β9=β10=β11=β12=β13=β14=β15=0, which means that macroeconomic indicators and financial performance indicators do not impact the corporate bankruptcy H1: β1 ≠ β2 ≠ β3 ≠ β4 ≠ β5 ≠ β6 ≠ β7 ≠ β8 ≠ β9 ≠ β10 ≠ β11 ≠ β12 ≠ β13 ≠β14≠β15 ≠ 0, which means that macroeconomic indicators and financial performance indicators impact the corporate bankruptcy Simultaneous hypothesis test is performed by evaluating the value of χ2 in SPSS outputs, with the following criteria toward acceptance and rejection of H0;
1. Count the value of χ2 > χ2 α;df then H0 is rejected. This means that macroeconomic
indicators and financial performance indicators impact the corporate bankruptcy. 2. Count value χ2 ≤ χ 2
α;df, then H0 is accepted. This means that macroeconomic indicators and financial performance indicators do not impact the corporate bankruptcy.
Hence, the statistical result on the first hypothesis is that the macroeconomic indicators and financial performance indicators impact the corporate bankruptcy for the period of 3 years, 2 years and 1 year before bankruptcy. IV.4.2. Partial Hypothesis Testing For 3 Years, 2 Years, and 1 Year Before Corporate Bankruptcy IV.4.2.1. Testing Hypothesis 2 The second research hypothesis states that “macroeconomic indicators and financial ratios impact the corporate bankruptcy”. This can be statistically formulated as follows; H0: β1=β2=β3=β4=β5=β6=β7=β8=β9=β10=0, which means that macroeconomic indicators and financial ratios do not impact the corporate bankruptcy.

Rev. Integr. Bus. Econ. Res. Vol 3(1) 24
Copyright 2014 Society of Interdisciplinary Business Research (www.sibresearch.org) ISSN: 2304-1013 (Online); 2304-1269 (CDROM)
H1: β1 ≠ β2 ≠ β3 ≠ β4 ≠ β5 ≠ β6 ≠ β7 ≠β8 ≠ β9 ≠ β10 ≠ 0, which means that macroeconomic indicators and financial ratios impact the corporate bankruptcy. Hence, the statistical result on the second hypothesis is that the macroeconomic indicators do not impact the corporate bankruptcy, but the financial ratios impact the corporate bankruptcy for the period of 3 years, 2 years and 1 year before bankruptcy. Thus, the corporate bankruptcy prediction models are shown in the following table;
Table 7: Corporate Bankruptcy Prediction Model Based On Macroeconomic Indicators and Financial Ratios For The Period of 3 Years, 2 Years and 1 Year Before Bankruptcy Corporate Bankruptcy Prediction Model
3 years before bankruptcy Ln (P
1-P )= -9,792 + 0,295 CR + 10,759 DAR
2 years before bankruptcy Ln �P
1-P�= -4,546 + 4,435 DAR - 0,234 ROA
1 year before bankruptcy Ln �P
1-P�= -8,184 + 11,764 DAR - 2,537 TATO
Source: SPSS IV.4.2.2. Testing Hypothesis 3 The third research hypothesis states that “macroeconomic indicators and cash flow ratios impact the corporate bankruptcy”, which can be expressed statistically as follows; H0: β1=β2=β11=β12=β13=β14=β15=0, which means that macroeconomic indicators and cash flow ratios do not impact the corporate bankruptcy. H1: β1 ≠ β2 ≠ β11 ≠ β12 ≠ β13 ≠ β14 ≠ β15 ≠ 0, which means that macroeconomic indicators and cash flow ratios impact the corporate bankruptcy. Hence, the statistical result on the third hypothesis is that macroeconomic indicators do not impact the corporate bankruptcy, but the cash flow ratios impact the corporate bankruptcy for the period of 3 years, 2 years and 1 year before bankruptcy. Corporate bankruptcy prediction models are shown in the following table; Table 8: Corporate Bankruptcy Prediction Model Based On Macroeconomic Indicators and Cash
Flow Ratios For The Period of 3 Years, 2 Years and 1 Year before Bankruptcy Corporate Bankruptcy Prediction Model
3 years before bankruptcy Ln �P
1-P�= -45,057 CFROA
2 years before bankruptcy Ln �P
1-P�= -42,172 CFROA
1 year before bankruptcy Ln �P
1-P�= -89,824 CFROA
Source: SPSS IV.4.2.3. Testing Hypothesis 4 The fourth research hypothesis states that “financial performance indicators impact the corporate bankruptcy”, which can be expressed statistically as follows;

Rev. Integr. Bus. Econ. Res. Vol 3(1) 25
Copyright 2014 Society of Interdisciplinary Business Research (www.sibresearch.org) ISSN: 2304-1013 (Online); 2304-1269 (CDROM)
H0: β3=β4=β5=β6=β7=β8=β9=β10=β11=β12=β13=β14=β15=0, which means that financial performance indicators do not impact the corporate bankruptcy. H1: β3 ≠ β4 ≠ β5 ≠ β6 ≠ β7 ≠ β8 ≠ β9 ≠ β10 ≠ β11 ≠ β12 ≠ β13 ≠ β14 ≠ β15 ≠ 0, which means that financial performance indicators impact the corporate bankruptcy. Hence, the statistical result on the fourth hypothesis is that the financial performance indicators impact the corporate bankruptcy for the period of 3 years, 2 years and 1 year before bankruptcy. Corporate bankruptcy prediction models are shown in the following table; Table 9: Corporate Bankruptcy Prediction Model Based On Financial Performance Indicators For
The Period of 3 Years, 2 Years, and 1 Year Before Bankruptcy Corporate Bankruptcy Prediction Model
3 years before bankruptcy Ln �P
1-P�= -28,142 + 1,442 CR + 37,547 DAR - 88,911 CFROA
2 years before bankruptcy Ln �P
1-P�= -4,763 + 6,538 DAR - 23,326 CFROA
1 year before bankruptcy Ln �P
1-P�= 6,790 DAR - 54,074 CFROA
Source: SPSS IV.5. The Accuracy Level of Corporate Bankruptcy Prediction Models The accuracy of the corporate bankruptcy prediction model is measured by a cut-off point of 0.5, which means that any values below 0.5 are grouped in “non-bankrupt companies”, and use a code of “0” in the binary logistic regression equation, and any values higher than or equal to 0.5 are grouped in “bankrupt companies”, and use a code of “1” in the binary logistic regression equation. The predicted results are compared to observational data to obtain the necessary level of accuracy. IV.5.1. Simultaneous Condition Based on the results of the first hypothesis test, the level of accuracy on the corporate bankruptcy prediction model for sample analysis and samples validation in the period of 3 years, 2 years and 1 year before bankruptcy, are shown in the following table; Table 10: The Accuracy Level of Corporate Bankruptcy Prediction Model For H1 In The Period of
3 Years, 2 Years, and 1 Year Before Bankruptcy For The Sample Analysis and Sample Validation
3 Years 2 Years 1 Year The Accuracy Level (Sample Analysis) 96,3% 98,2% 99,1% The Accuracy Level (Sample Validation) 97,6% 97,6% 97,6%
Source: SPSS IV.5.2. Partial Based on the results of the second hypothesis test, the level of accuracy of the corporate bankruptcy prediction model in the period of 3 years, 2 years, and 1 year before bankruptcy, are shown in the following table; Table 11: The Accuracy Level of Corporate Bankruptcy Prediction Model For H2 In The Period of
Rev. Integr. Bus. Econ. Res. Vol 3(1) 26
Copyright 2014 Society of Interdisciplinary Business Research (www.sibresearch.org) ISSN: 2304-1013 (Online); 2304-1269 (CDROM)
3 Years, 2 Years, and 1 Year Before Bankruptcy For The Sample Analysis and Sample Validation
3 Years 2 Years 1 Year The Accuracy Level (Sample Analysis) 95,9% 97,2% 98,2% The Accuracy Level (Sample Validation) 95,16% 96,77% 98,39%
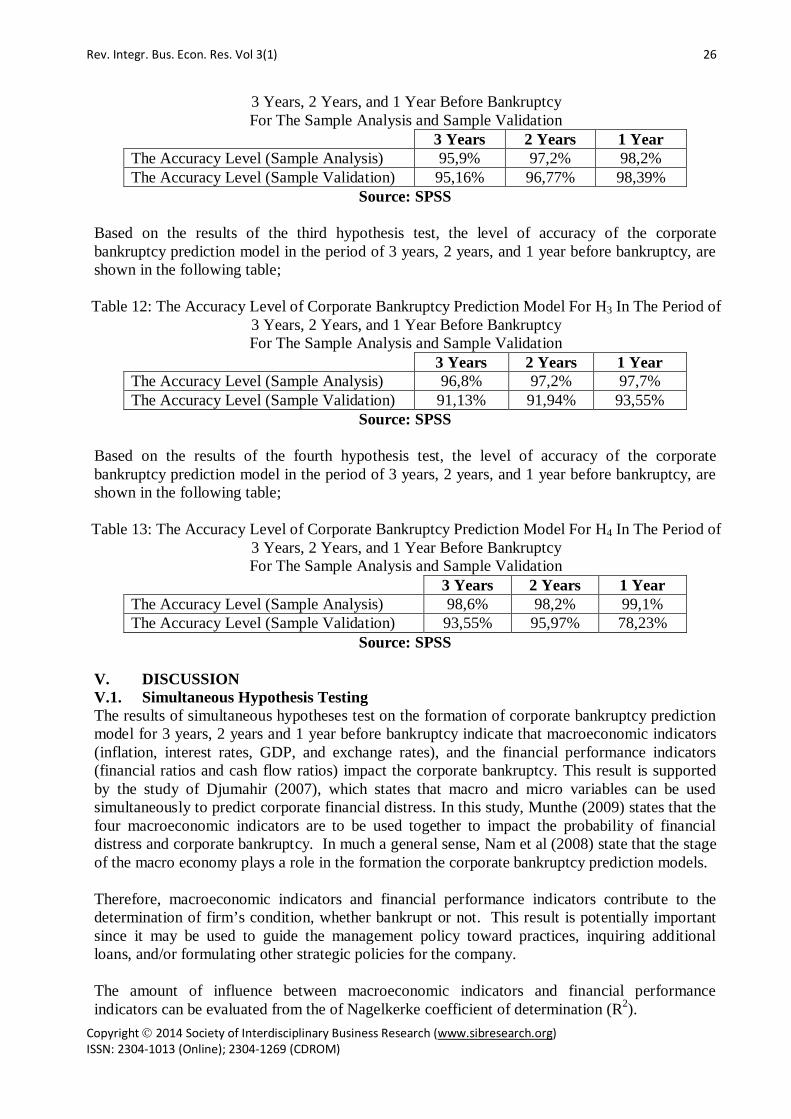
Source: SPSS Based on the results of the third hypothesis test, the level of accuracy of the corporate bankruptcy prediction model in the period of 3 years, 2 years, and 1 year before bankruptcy, are shown in the following table;
Table 12: The Accuracy Level of Corporate Bankruptcy Prediction Model For H3 In The Period of
3 Years, 2 Years, and 1 Year Before Bankruptcy For The Sample Analysis and Sample Validation
3 Years 2 Years 1 Year The Accuracy Level (Sample Analysis) 96,8% 97,2% 97,7% The Accuracy Level (Sample Validation) 91,13% 91,94% 93,55%
Source: SPSS Based on the results of the fourth hypothesis test, the level of accuracy of the corporate bankruptcy prediction model in the period of 3 years, 2 years, and 1 year before bankruptcy, are shown in the following table; Table 13: The Accuracy Level of Corporate Bankruptcy Prediction Model For H4 In The Period of
3 Years, 2 Years, and 1 Year Before Bankruptcy For The Sample Analysis and Sample Validation
3 Years 2 Years 1 Year The Accuracy Level (Sample Analysis) 98,6% 98,2% 99,1% The Accuracy Level (Sample Validation) 93,55% 95,97% 78,23%
Source: SPSS V. DISCUSSION V.1. Simultaneous Hypothesis Testing The results of simultaneous hypotheses test on the formation of corporate bankruptcy prediction model for 3 years, 2 years and 1 year before bankruptcy indicate that macroeconomic indicators (inflation, interest rates, GDP, and exchange rates), and the financial performance indicators (financial ratios and cash flow ratios) impact the corporate bankruptcy. This result is supported by the study of Djumahir (2007), which states that macro and micro variables can be used simultaneously to predict corporate financial distress. In this study, Munthe (2009) states that the four macroeconomic indicators are to be used together to impact the probability of financial distress and corporate bankruptcy. In much a general sense, Nam et al (2008) state that the stage of the macro economy plays a role in the formation the corporate bankruptcy prediction models. Therefore, macroeconomic indicators and financial performance indicators contribute to the determination of firm’s condition, whether bankrupt or not. This result is potentially important since it may be used to guide the management policy toward practices, inquiring additional loans, and/or formulating other strategic policies for the company. The amount of influence between macroeconomic indicators and financial performance indicators can be evaluated from the of Nagelkerke coefficient of determination (R2).
Rev. Integr. Bus. Econ. Res. Vol 3(1) 27
Copyright 2014 Society of Interdisciplinary Business Research (www.sibresearch.org) ISSN: 2304-1013 (Online); 2304-1269 (CDROM)
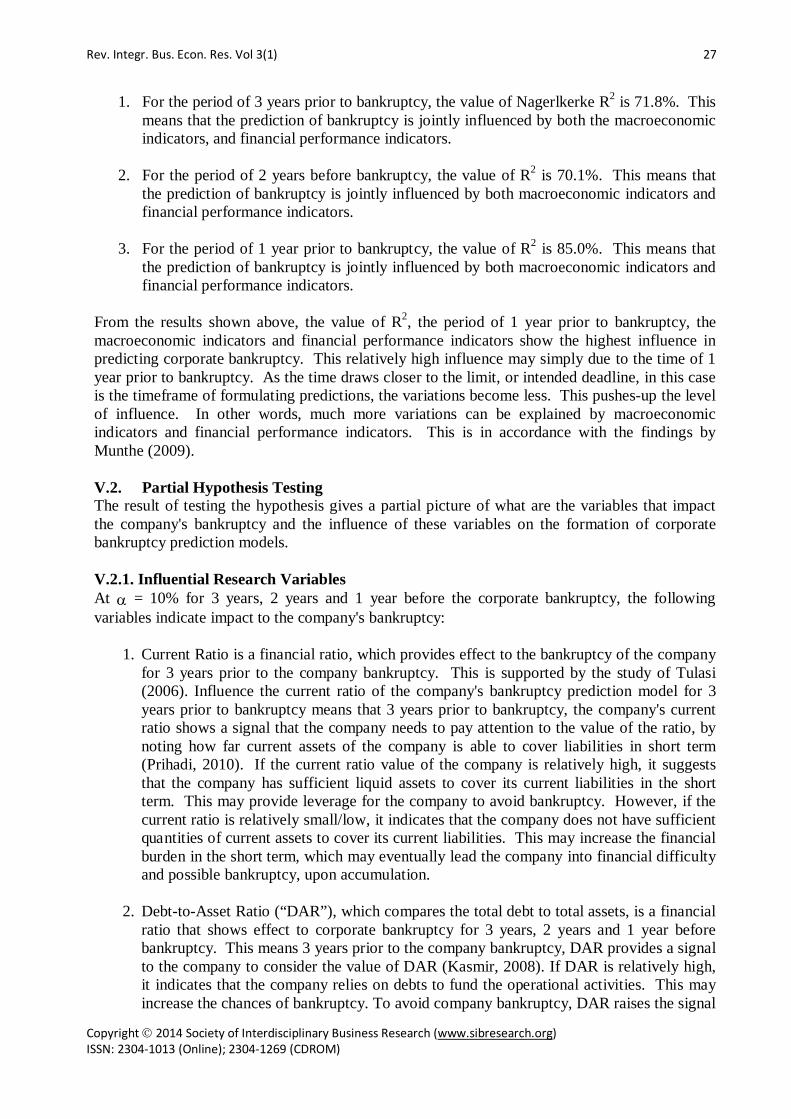
1. For the period of 3 years prior to bankruptcy, the value of Nagerlkerke R2 is 71.8%. This means that the prediction of bankruptcy is jointly influenced by both the macroeconomic indicators, and financial performance indicators.
2. For the period of 2 years before bankruptcy, the value of R2 is 70.1%. This means that
the prediction of bankruptcy is jointly influenced by both macroeconomic indicators and financial performance indicators.
3. For the period of 1 year prior to bankruptcy, the value of R2 is 85.0%. This means that
the prediction of bankruptcy is jointly influenced by both macroeconomic indicators and financial performance indicators.
From the results shown above, the value of R2, the period of 1 year prior to bankruptcy, the macroeconomic indicators and financial performance indicators show the highest influence in predicting corporate bankruptcy. This relatively high influence may simply due to the time of 1 year prior to bankruptcy. As the time draws closer to the limit, or intended deadline, in this case is the timeframe of formulating predictions, the variations become less. This pushes-up the level of influence. In other words, much more variations can be explained by macroeconomic indicators and financial performance indicators. This is in accordance with the findings by Munthe (2009). V.2. Partial Hypothesis Testing The result of testing the hypothesis gives a partial picture of what are the variables that impact the company's bankruptcy and the influence of these variables on the formation of corporate bankruptcy prediction models. V.2.1. Influential Research Variables At α = 10% for 3 years, 2 years and 1 year before the corporate bankruptcy, the following variables indicate impact to the company's bankruptcy:
1. Current Ratio is a financial ratio, which provides effect to the bankruptcy of the company for 3 years prior to the company bankruptcy. This is supported by the study of Tulasi (2006). Influence the current ratio of the company's bankruptcy prediction model for 3 years prior to bankruptcy means that 3 years prior to bankruptcy, the company's current ratio shows a signal that the company needs to pay attention to the value of the ratio, by noting how far current assets of the company is able to cover liabilities in short term (Prihadi, 2010). If the current ratio value of the company is relatively high, it suggests that the company has sufficient liquid assets to cover its current liabilities in the short term. This may provide leverage for the company to avoid bankruptcy. However, if the current ratio is relatively small/low, it indicates that the company does not have sufficient quantities of current assets to cover its current liabilities. This may increase the financial burden in the short term, which may eventually lead the company into financial difficulty and possible bankruptcy, upon accumulation.
2. Debt-to-Asset Ratio (“DAR”), which compares the total debt to total assets, is a financial
ratio that shows effect to corporate bankruptcy for 3 years, 2 years and 1 year before bankruptcy. This means 3 years prior to the company bankruptcy, DAR provides a signal to the company to consider the value of DAR (Kasmir, 2008). If DAR is relatively high, it indicates that the company relies on debts to fund the operational activities. This may increase the chances of bankruptcy. To avoid company bankruptcy, DAR raises the signal

Rev. Integr. Bus. Econ. Res. Vol 3(1) 28
Copyright 2014 Society of Interdisciplinary Business Research (www.sibresearch.org) ISSN: 2304-1013 (Online); 2304-1269 (CDROM)
every year to the management that the composition may have been too large to handle. This is supported by Parulian (2007), Selina & Murdayanti (2006), Gamayuni (2006) and Tanthanongsakkum et al (2009), Ohlson (1980) and Manurung (2003), where these researchers state that DAR is a significant financial ratio in predicting company bankruptcy.
3. Return on Assets (“ROA”), which compares the total returns that the company can generate during a particular period to the value of total assets, is a financial ratio that signals effect 2 years prior to the corporate bankruptcy. This is supported by research conducted by Widarjo & Setiawan (2009). This means that 2 years before bankruptcy, ROA provides clues that the company needs to pay attention to the actual use of total assets since those combinations of total assets cannot generate the sufficient amount of income. This simply means that the company may not be efficient in utilizing its assets on the routine operational activities. High ROA indicates that a company uses its assets more efficiently in generating profits. On the contrary, a small value ROA indicates that the company uses assets inefficiently. This small ROA may put the company into financial difficulties and the probability of bankruptcy may likely increase over time.
4. Total Assets Turnover Ratio (“TATO”) is a financial ratio that shows effect to the corporate bankruptcy for 1 year prior to bankruptcy. This means that 1 year prior to bankruptcy, TATO signals the company to pay attention to the speed of asset turnover, which may well be translated into the company's ability in creating sales (Kasmir, 2008). If TATO is relatively high, it indicates the company’s relatively high ability in converting the existing assets to create sales. Hence, sales increase, and the company can generate higher revenue to finance the routine operations. If TATO is relatively small, it indicates the company’s inability in converting assets into sales. In this situation, sales drop, and the company cannot generate revenue to finance the operational activities. If this condition prolongs, this may lead to a high degree of probability toward bankruptcy. This finding is supported by Pasaribu (2008), whereby high TATO is classified as “healthy”. Hence, low TATO denotes a high predictive power toward financial distress and possible bankruptcy.
5. Cash Flow Return on Assets Ratio (“CFR-AR”) shows effect to the company bankruptcy for 3 years, 2 years and 1 year before bankruptcy. This means 3 years before company bankruptcy, CFR-AR provides a signal to the company to pay attention to the level of profit generated from the company’s total assets. This can be evaluated from the company’s operating cash flow (Prihadi, 2010). If CFR-AR is low, it indicates that company is relatively inefficient in managing the existing assets to generate income. Due to the inefficiency, the company may have less cash flow. With the less cash inflows, the company may likely suffer financial hardship, which may lead to bankruptcy. This is supported by Sung et al (1999), which states that cash flow to total assets are the most important variable to establish the company bankruptcy prediction models.
Macroeconomic indicators used in this study do not appear to show any impact toward the establishment of a corporate bankruptcy prediction model. It may mainly due to the company’s ability in managing and maintaining the stability of the financial performance, which may take forms in the successful and/or failure of promotional activities (Brahmana, 2007). If failures exist, this leads to declining sales (Brahmana, 2007). According to Sandin & Porporato (2007), corporate bankruptcy is often a consequence of corporate inefficiencies and errors in decision-

Rev. Integr. Bus. Econ. Res. Vol 3(1) 29
Copyright 2014 Society of Interdisciplinary Business Research (www.sibresearch.org) ISSN: 2304-1013 (Online); 2304-1269 (CDROM)
making. Thus, given the same economic and financial conditions, companies can face different situations. Looking it from a different perspective, macroeconomic indicators may not affect the establishment of a corporate bankruptcy prediction model in this study, perhaps, it may be due to the sampled firms are those companies which target the upper-middle segment of the general population. Since this particular segment may have substantial income, including sufficient level of residual income, the impact of an increasing level of inflation may not considerably affect the purchasing power. Perhaps, this segment may also have developed a strong brand awareness that have position in the top of their mind. V.2.2. Value of Coefficient of Determination The level of influence of corporate bankruptcy indicators can be seen in the coefficient of determination. In the second hypothesis, between macroeconomic indicators and financial performance indicators as measured by the financial ratios for 3 years, 2 years and 1 year before bankruptcy, the values of the coefficient of determination, as shown in Nagelkerke R2 value, are 57.8% for 3 years prior to bankruptcy, 68.3% for 2 years prior to bankruptcy, and 78.1% for 1 year prior to bankruptcy. In the third hypothesis, between macroeconomic indicators and financial performance indicators as measured by the company’s cash flow ratios for 3 years, 2 years and 1 year before bankruptcy, the values of the coefficient of determination, Nagelkerke R2, are 57.4% for 3 years prior to bankruptcy, 59.5% for 2 years prior to bankruptcy, and 79.7% for 1 year prior to bankruptcy. In the fourth hypothesis, the combination of indicators of financial performance as measured by financial ratios and cash flow ratios for 3 years, 2 years and 1 year before bankruptcy, the values of the coefficient of determination, Nagelkerke R2, are 92.2% for the 3 years prior to bankruptcy, 70.1% for 2 years prior to bankruptcy, and 85% for 1 year prior to bankruptcy. Considering the above results, it appears that the combination of financial performance indicators, which are measured by financial ratios and cash flow ratios, show the largest and strongest influence toward the formation of the bankruptcy prediction model for the 3 years period prior to corporate bankruptcy. It means that current ratio, DAR, and CFR-AR show 92.2% influence toward the likelihood of corporate bankruptcy, 3 years before it actually occur. V.2.3. The Accuracy Level On Bankruptcy Prediction Model The level of accuracy of the corporate bankruptcy prediction model can be evaluated in accordance with the simultaneous and partial tests, such as the following;
1. Simultaneous test shows that the result of the accuracy of corporate bankruptcy prediction models for sample analysis is high. This means that the corporate bankruptcy prediction model for 3 years, 2 years and 1 year before bankruptcy can be actually used to really make proper predictions on corporate bankruptcy for 3 years, 2 years and 1 year prior to the actual corporate bankruptcy. This is supported by the statement stated by Munthe (2009) that the level of model accuracy above 50% is considered as highly accurate. This model can be used to predict corporate bankruptcy. This result indicates that the prediction model can certainly be applied into the sample validation. In addition, with a relatively high level of accuracy for the corporate bankruptcy prediction model for 1 year prior to bankruptcy, it indicates that even in one year before bankruptcy, all

Rev. Integr. Bus. Econ. Res. Vol 3(1) 30
Copyright 2014 Society of Interdisciplinary Business Research (www.sibresearch.org) ISSN: 2304-1013 (Online); 2304-1269 (CDROM)
indicators used in this study provide a reliable signal toward the likelihood of actual bankruptcies.
2. Partial tests on the level of accuracy on the company's bankruptcy prediction model are
generated from the partial sample analysis and samples validation for 3 years, 2 years and 1 year before bankruptcy. They are;
a. In the second hypothesis, the results indicate that companies need to pay more attention to current ratio, DAR, ROA, and TATO since these indicators are able to provide the prediction toward corporate bankruptcy.
b. In the third hypothesis, the results indicate that companies need to consider CFR-AR because this ratio shows how much profit can be generated from the available assets. Knowing the level of earnings and operating cash flow, firms can determine the financial condition toward the likelihood of bankruptcy.
c. In the fourth hypothesis, the results indicate that companies need to pay attention to current ratio, DAR, and CFR-AR as these ratios provide an accurate illustration toward the likelihood of bankruptcy.
VI. CONCLUSIONS AND RECOMMENDATIONS Based on the analysis, it can be safely concluded that;
1. Simultaneously, at the level of alpha of 10%, all indicators used in this study, which are macroeconomic indicators, and financial performance indicators, have shown the level of influence of 71.8% for the 3 years prior to corporate bankruptcy, 70.1% for 2 years prior to corporate bankruptcy, and 85% for 1 year prior to corporate bankruptcy.
2. Partially, at the level of alpha of 10%, the influential indicators toward corporate
bankruptcy are the current ratio, debt-to-assets ratio, return on assets, total asset turnover and cash flow return on assets. The influence levels of these indicators on the formation of corporate bankruptcy prediction models for 3 years, 2 years and 1 year before bankruptcy, as determined in the second hypothesis are; 57.8%, 68.3%, 78.1%, respectively, in the third hypothesis are; 57.4%, 59.5%, 79.7%, and in the fourth hypothesis are; 92.2%, 70.1%, 85.0%. Based on the results for the 3 years prior to bankruptcy, the fourth hypothesis that consists the financial performance indicators, which are measured by financial ratios and cash flow ratios, provide a significant influence toward the formation of corporate bankruptcy prediction model. This indicates that the measures of financial performance used should be the focus of firm’s concern. Also, it should be noted that macroeconomic indicators do not show effect to the formation of corporate bankruptcy prediction model for 3 years, 2 years and 1 year before the company bankruptcy.
3. Corporate bankruptcy prediction model is established based on macroeconomic
indicators and financial performance indicators. The levels of accuracy on the corporate bankruptcy prediction model for 3 years, 2 years and 1 year prior to bankruptcy are high on both the simultaneous tests, and the partial tests. These high levels of accuracy indicate that the formation of the corporate bankruptcy prediction model may be applied to the sample validation. The level of accuracy of the corporate bankruptcy prediction model in the sample validation is high, particularly based on the company's financial performance indicators, which are measured by financial ratios and cash flow ratios in this study.
4. Publicly-listed firms should emphasize on the financial performance indicators, which are
Rev. Integr. Bus. Econ. Res. Vol 3(1) 31
Copyright 2014 Society of Interdisciplinary Business Research (www.sibresearch.org) ISSN: 2304-1013 (Online); 2304-1269 (CDROM)
measured by financial ratios and cash flow ratio, to maintain the viability of the company. To secure firm’s survival, it is crucial to manage the capital structure, the level of costs, and constant analysis on the firm’s financial fitness.
5. For further research, it is recommended to use the formation of the corporate bankruptcy
prediction model in this study on different economic situations and conditions. This provides the opportunities in analyzing the potentials on fluctuating results, which may mirror the stage of the economy and the influence of global economy in certain countries/regions. In addition, it is also advisable to focus on consistency in dividend payments and corporate bonds ranking when grouping companies into “bankrupt company” or “non-bankruptcy”.
REFERENCES [1] Abbas, Q., & Ahmad, A. R. (2011, January 1). Modeling Bankruptcy Prediction for Non-
Financial Firms: The Case of Pakistan. Retrieved August 15, 2013, from Social Science Research Network: http://ssrn.com/abstract=1917458
[2] Adnan, Muhammad Akhyar, & Kurniasih, Eha, 2000, Analisis Rasio CAMEL Terhadap Prediksi Kondisi Bermasalah Pada Lembaga Perbankan Periode 2000-2002, Jurnal Akuntansi dan Keuangan, Vol. 7, No. 2.
[3] Adnan, Muhammad Akhyar & Kurniasih, Eha, 2003, Analisis Tingkat Kesehatan Perusahaan Untuk Memprediksi Potensi Kebangkrutan Dengan Pendekatan Altman (The Analysis of Corporates’ Health to Predict Their Bankruptcy Potentials Using The Altman Model), Jurnal Akuntansi dan Auditing Indonesia (JAAI), Vol. 7, No. 2.
[4] Almilia, Luciana Spica & Herdiningtyas, Winny, 2005, Analisis Rasio CAMEL Terhadap Prediksi Kondisi Bermasalah Pada Lembaga Perbankan Periode 2000-2002, Jurnal Akuntansi dan Keuangan, Vol. 7, No. 2.
[5] Atiya, Amir F, 2001, Bankruptcy Prediction for Credit Risk Using Neural Networks: A Survey and New Results, IEEE Transactions on Neural Networks, Vol. 12, No. 4.
[6] Atmini, Sari & Wuryana, 2005, Manfaat Laba dan Arus Kas Untuk Memprediksi Kondisi Financial Distress Pada Perusahaan Textile Mill Products dan Apparel and Other Textile Products Yang Terdaftar Di BEJ, SNA VIII, Solo.
[7] Aziz, M. Adnan & Dar, Humayon A, 2006, Predicting Corporate Bankruptcy: Where We Stand? Corporate Governance, Vol. 16, No. 1: 18-33.
[8] Back, P. (2001). Testing Liquidity Measures As Bankruptcy Prediction Variables. LTA, Vol. 3, No. 01 , 301-327.
[9] Balcaen, Sofie & Ooghe, Hubert, 2004, 35 Years of Studies on Business Failure: An Overview of The Classical Statistical Methodologies and Their Related Problems, Working Paper 04/248, Department of Accountancy and Corporate Finance, Ghent University, Belgium.
[10] Beaver, William H, 1963, Financial Ratios As Predictors of Failure, Journal of Accounting Research, and Empirical Research in Accounting: Selected Studies, Vol. 4: 71-111.
[11] Bekeris, R. (2012). The Impact of Macroeconomic Indicators Upon SME's Profitability. Ekonomika, Vol. 91, No. 3 , 117-128.
[12] Bernhardse, E. (2001). A Model of Bankruptcy Prediction. Norges Bank, Financial Analysis, Structure Department & Research Department, Working Papers # ANO 2001/10 (pp. 1-54). Oslo, Norway: Norges Bank (ISSN: 0801-2504).
[13] Boediono, 2009, Ekonomi Indonesia, Mau ke Mana? Kumpulan Esai Ekonomi, Cetakan Pertama, PT. Gramedia, Jakarta.

Rev. Integr. Bus. Econ. Res. Vol 3(1) 32
Copyright 2014 Society of Interdisciplinary Business Research (www.sibresearch.org) ISSN: 2304-1013 (Online); 2304-1269 (CDROM)
[14] Brahmana, Rayenda K, 2007, Identifying Financial Distress Condition In Indonesia Manufacture Industry, Birmingham Business School, University of Birmingham.
[15] Bryant, B. J. (2009, December 30). How Can Financial Ratios Be Used to Predict Bankruptcy? Retrieved August 15, 2013, from eHow Money: http://www.ehow.com/way_5814790_can-ratios-used-predict-bankruptcy_.html
[16] Chrestanti, Ruth., Santoso, Alb. Joko, & Ernawati, L, 2002, Implementasi Back-Propagation dalam Memprediksi Kebangkrutan Bank di Indonesia, Jurnal Teknologi Industri, Vol. VI, No. 4: 195-202.
[17] Darsono & Ashari, 2005, Pedoman Praktis Memahami Laporan Keuangan, Edisi I, Andi, Yogyakarta.
[18] Deakin, E.B, 1972, A Discriminant Analysis of Predictors of Business Failure, Journal of Accounting Research.
[19] Djumahir, 2007, Pengaruh Variabel-Variabel Mikro, Variabel-Variabel Makro Terhadap Financial Distress Pada Perusahaan Industri Food and Beverages Yang Terdaftar Di BEJ, Jurnal Aplikasi Manajemen, Vol. 5, No. 3: 484-492.
[20] Fernandez, P. (2013, January 29). Optimal Capital Structure: Problems with the Harvard and Damodaran Approaches. Retrieved August 15, 2013, from Social Science Research Network: http://ssrn.com/abstract=270833
[21] Frederica, W. (2012, January). The Roles of Screening and Monitoring Functions in Bank Loans: An Industrial Analysis on Firm’s Value in Indonesian Publicly Listed Manufacturing Firms. Undergraduate Thesis . BSD City, Serpong, Tangerang, Indonesia, Banten, Indonesia: Faculty of Business Administration & Humanities, Swiss German University.
[22] Gamayuni, Rindu Rika, 2006, Rasio Keuangan Sebagai Prediksi Kegagalan Perusahaan di Indonesia, Jurnal Bisnis dan Manajemen, Vol. 3, No. 1: 15-38.
[23] Gentry, James A., Newbold, Paul., & Whitford, David T, 1985, Predicting Bankruptcy: If Cash Flow's Not The Bottom Line, What Is?, Financial Analysts Journal, Vol. 41, No. 5: 47-56.
[24] Ghozali, H. Imam, 2006, Aplikasi Analisis Multivariate Dengan Program SPSS, Cetakan IV, Badan Penerbit Universitas Diponegoro, Semarang.
[25] Gitman, Lawrence J, 2009, Principles of Managerial Finance, Twelfth Edition, Pearson Prentice Hall.
[26] Glezakos, Michalis., Mylonakis, John., & Oikonomou, Katerina, 2010, An Empirical Research on Early Bankruptcy Forecasting Models: Does Logit Analysis Enhance Business Failure Predictability, European Journal of Finance and Banking Research, Vol. 3, No. 3.
[27] Hadad, Muliaman D., Santoso, Wimboh., Sawerdi., Sukarno, Hari., & Adenan, Mohd, 2004, Model Prediksi Kepailitan Bank Umum Di Indonesia, Research Paper Bank Indonesia, Nomor 6/1.
[28] Hanafi, Mamduh M, 2004, Manajemen Keuangan, Cetakan Pertama, BPFE-Yogyakarta, Yogyakarta.
[29] Harianto, Farid & Sudomo, Siswanto, 2001, Perangkat dan Teknik Analisis Investasi di Pasar Modal Indonesia, Edisi Revisi Pertama, PT. Bursa Efek Jakarta, Jakarta.
[30] Indonesian Capital Market Directory, 2012, http://www. ekonomi.kompasiana.com/moneter/.
[31] Jooste, L. (2006). Cash Flow Ratios As A Yardstick For Evaluating Financial Performance in African Businesses. Journal of Managerial Finance, Vol. 32, No. 7 , 569-576.
[32] Kaaro, Hermeindito, 2004, Kebangkrutan Versus Restrukturisasi: Evaluasi dan Prediksi Kelangsungan Hidup Perusahaan Pasca Krisis Keuangan 1997, Kinerja, Vol. 8, No. 1: 1-26.

Rev. Integr. Bus. Econ. Res. Vol 3(1) 33
Copyright 2014 Society of Interdisciplinary Business Research (www.sibresearch.org) ISSN: 2304-1013 (Online); 2304-1269 (CDROM)
[33] Kasmir, 2008, Analisis Laporan Keuangan, Edisi 1, Rajawali Pers, Jakarta. [34] Keasy, Kevin., & McGuinness, Paul, 1990, The Failure of UK Industrial Firms for The
Period 1976-1984, Journal of Business Finance & Accounting, Vol. 17, Issue 1: 119-136. [35] Lee, Chengfew, Sun, Lili, & Tsai, Bi-Huei, 2007, Do Auditors’ Opinions, Industry Factors
and Macroeconomic Factors Signal Financial Distress? Evidence From Taiwan, Working Paper.
[36] Libby, Robert, 1975, Accounting Ratios and The prediction of Failure Some Behavioral Evidence, Journal of Accounting Research.
[37] Liou, Dah-Kwei & Smith, Malcolm, 2006, Macroeconomic Variables in the Identification of Financial Distress, SSRN Working Paper No. 900284.
[38] Manurung, Elizabeth Tiur, 2003, Penyusunan Model Prediksi Kredibilitas Perusahaan dengan Menggunakan Keuangan Berdasarkan Akuntansi Biaya Historis dan Akuntansi Tingkat Harga Umum (Inflasi) (Survei Pada Tekstile di Bandung), Disertasi, Fakultas Ekonomi, Universitas Padjajaran, Bandung.
[39] Mensah, Yaw M, 1983, The Differential Bankruptcy Predictive Ability of Specific Price Level Adjustments: Some Empirical Evidence, The Accounting Review, Vol. 58, No. 2: 228-246.
[40] Mensah, Yaw M, 1984, An Examination of The Stationary of Multivariate Bankruptcy Prediction Models: A Methodological Study, Journal of Accounting Research, Vol. 22, No.1, p. 380-395.
[41] Mesaki, Miwako, 1998, Bankruptcy Prediction, Analysis of Cash Now Models, International Review of Business.
[42] Mossman, Charles E., Bell, Geoffrey G., Swartz, L. Mick., Turtle, Harry, 1998, An Empirical Comparison of Bankruptcy Models, The Financial Review, Vol. 33, No. 2: 35.
[43] Munawir, S, 1998, Analisis Laporan Keuangan, Edisi Ke Empat, Cetakan Ke Sembilan, Liberty, Yogyakarta.
[44] Munthe, Kornel, 2008, Pengaruh Struktur Kepemilikan, Makro Ekonomi dan Kinerja Keuangan Terhadap Kesulitan Keuangan Perusahaan (Studi Pada Perusahaan Manufaktur yang Tercatat di BEI), Media Unika, Edisi 4, No. 73.
[45] Munthe, Kornel, 2009, Pengaruh Sejumlah Variabel Makro Ekonomi dan Kinerja Keuangan Perusahaan Publik Terhadap Probabilitas Kesulitan Keuangan dan Kebangkrutan Periode Tahun 2001-2006 (Studi Pada Perusahaan Publik yang Tercatat di Bursa Efek Indonesia), Disertasi, Program Doktor Ilmu Ekonomi, Universitas Katolik Parahyangan, Bandung.
[46] Nam, Chae Woo., Kim, Tong Suk., Park, Nam Jung., & Lee, Hoe Kyung, 2008, Bankruptcy Prediction Using A Discrete-Time Duration Model Incorporating Temporal and Macroeconomic Dependencies, Journal of Forecasting, Vol. 27, Issue 6, p. 493-506.
[47] Nehrebecka, N., & Dzik, A. M. (2013). Business Demography In Poland: Microeconomic and Macroeconomic Determinants of Firm Survival. working papers no. 8/2013 (93), Faculty of Economic Sciences, University of Warsaw . Warsaw, Poland: Universitas Varsoviensis.
[48] Nugroho, Bhuono Agung, 2005, Strategi Jitu Memilih Metode Statistik Penelitian Dengan SPSS, Edisi I, Penerbit Andi, Yogyakarta.
[49] Ohlson, James A, 1980, Financial Ratios and The probabilistic Prediction of Bankruptcy, Journal of Accounting Research, Vol. 18, No. 1, p. 109-131.
[50] Parulian, Safrida Rumondang, 2007, Hubungan Struktur Kepemilikan, Komisaris Independen, dan Kondisi Financial Distress Perusahaan Publik, Integrity-Jurnal Akuntansi dan Keuangan, Vol. 1, No. 3, p. 263-274.
[51] Pasaribu, Rowland Bismark Fernando, 2008, Penggunaan Binary Logit Untuk Prediksi Financial Distress Perusahaan Yang Tercatat di BEJ (Studi Kasus Emiten Industri
Rev. Integr. Bus. Econ. Res. Vol 3(1) 34
Copyright 2014 Society of Interdisciplinary Business Research (www.sibresearch.org) ISSN: 2304-1013 (Online); 2304-1269 (CDROM)
Perdagangan), VENTURA, Vol. 11, No. 2. [52] Philosophov, L. V., Batten, J. A., & Philosophov, V. L. (2008). Predicting The Event and
Time Horizon of Bankruptcy Using Financial Ratios and The Maturity Schedule of Long-Term Debt. Math Financial Economics, Vol 1 , 181-212.
[53] Prihadi, Toto, 2010, Analisis Laporan Keuangan: Teori & Aplikasi, Cetakan I, PPM, Jakarta.
[54] Rodliyah, Siti, 2004, Penerapan Analisis Diskriminan Altman Untuk Memprediksi Tingkat Kebangkrutan (Studi Kasus Pada Perusahaan Tekstile yang Tercatat di BEJ), Skripsi, Program Studi Akuntansi, Universitas Muhammadiyah Malang, Malang.
[55] Salman, A. Khalik., Friedrichs., Yvonnevon, & Shukur, Ghazi, 2009, Macroeconomic Factors and Swedish Small and Medium-Sized Manufacturing Failure, Working Paper No. 185, The Royal Institute of technology, Centre of Excellence for Science and Innovation Studies (CESIS).
[56] Sandin, Ariel R & Porporato, Marcela, 2007, Corporate Bankruptcy Prediction Models Applied To Emerging Economies: Evidence from Argentina in the Year 1991-1998, International Journal of Commerce and Management, Vol. 17, Issues 4, p. 295-311.
[57] Sari, D. Y. (2012, August). Analisis Prediksi Kebangkrutan Perusahaan Dengan Menggunakan Altman Z-Score Model Pada Perusahaan Pulp dan Kertas yang Terdaftar di Bursa Efek Indonesia. Undergraduate Thesis . Bandung, Jawa Barat, Indonesia: Harapan Bangsa Business School.
[58] Sekaran, Uma, 2006, Metodologi Penelitian untuk Bisnis, Edisi 4, Salemba Empat, Jakarta. [59] Selina & Murdayanti, 2006, Penerapan Logit Model Dalam Memprediksi Kebangkrutan
Pada Perusahaan-Perusahaan Non-Financial Yang Terdaftar Di BEJ, Media Riset Akuntansi, Auditing dan Informasi, Vol. 6, No. 3, p. 269-287.
[60] Sharma, Divesh S, 2001, The Role of Cash Flow Information in Predicting Corporate Failure: The State of The Literature, Managerial Finance, Vol. 27, No. 4, p. 3-28.
[61] Shepard, Lawrence E & Collins, Robert A, 1982, Why Do Farmers Fail? Farm Bankruptcies 1910-1978, American Journal of Agricultural Economics, Vol. 64, No. 4, p. 609-615.
[62] Subagyo, Rr. Iramani, 2007, Model Prediksi Financial Distress di Indonesia Era Globalisasi (Studi Perusahaan Go Publik Pada Sektor Manufaktur), The 1st PPM National Conference of Management Research, “Manajemen di Era Globalisasi“, Sekolah Tinggi Manajemen, PPM.
[63] Suliyanto, 2006, Metode Riset Bisnis, Cetakan Kedua, Penerbit Andi, Yogyakarta. [64] Sundjaja, Ridwan., Barlian, Inge., & Sundjaja, Dharma Putra, 2010, Manajemen Keuangan
1, Edisi 7, Literata Lintas Media, Bandung. [65] Sundjaja, Ridwan, Barlian, Inge, & Sundjaja, Dharma Putra, 2010, Manajemen Keuangan
2, Edisi 6, Literata Lintas Media, Bandung. [66] Sung, Tae Kyung., Chang Namsik., & Lee, Gunhee, 1999, Dynamics of Modeling in Data
Mining: Interpretive Approach to Bankruptcy Prediction, Journal of Management Information Systems, Vol. 16, No. 1, p. 63-85.
[67] Suroso, 2006, Investasi Pada Saham Perusahaan yang Menghadapi Financial Distress, Usahawan, No. 2, Th. XXXV, p. 7-11.
[68] Tandelilin, Eduardus, 2010, Portofolio dan Investasi: Teori dan Aplikasi, Edisi Pertama, Kanisius, Yogyakarta.
[69] Tanthanongsakkun, Suparatana., Pitt, David., & Treepongkaruna, Sirimon, 2009, A Comparison of Corporate Bankruptcy Models in Australia: The Merton Vs Accounting-Based Models, Asia-Pacific Journal of Risk and Insurance, Vol. 3, Issue 2, Art. 7.
[70] Tirapat, Sunti & Nittayagasetwat, Aekkachai, 1999, An Investigation of Thai Listed Firm’s Financial Distress Using Macro and Micro Variables, Multinational Financial Journal,
Rev. Integr. Bus. Econ. Res. Vol 3(1) 35
Copyright 2014 Society of Interdisciplinary Business Research (www.sibresearch.org) ISSN: 2304-1013 (Online); 2304-1269 (CDROM)
Vol. 3, No. 2, p. 103-125. [71] Trigo, L., & Costanzo, S. (2007, August 26). An Early Warning System for Bankruptcy
Prediction: Lessons from the Venezuelan Bank Crises. Financial Markets. Investments and Risk Management . San Benardino, Caracas, Venezuela: Center for Production and Technological Innovation & Instituto de Estudios Superiores de Administración.
[72] Tulasi, Daniel, 2006, Kemampuan Rasio Keuangan dan Ukuran Perusahaan Dalam Memprediksi Kinerja Keuangan (Studi Perusahaan Tekstil dan Produk Tekstil Yang Tercatat Di BEJ), Jurnal Widya Manajemen dan Akuntansi, Vol. 6, No. 3, p. 366-384.
[73] Wang, Y., & Campbell, M. (2010). Financial Ratios and The Prediction of Bankruptcy: The Ohlson Model Applied to Chinese Publicly Traded Companies. The Journal of Organizational Leadership & Business , 1-15.
[74] Widarjo, Wahyu & Setiawan, Doddy, 2009, Pengaruh Rasio Keuangan Terhadap Kondisi Financial Distress Perusahaan Otomotif, Jurnal Bisnis dan Akuntansi, Vol. 11, No. 2, p. 107-119.
[75] Yudanto, Noor & Santoso, M. Setyawan, 1998, Dampak Krisis Moneter Terhadap Sektor Riil, Buletin Ekonomi Moneter dan Perbankan, Vol. 1, No. 2, p. 131-158.
[76] Zavgren, Christine V, 1985, Assessing the Vulnerability to Failure of American Industrial Firms: A Logistic Analysis, Journal of Business Finance & Accounting, Vol. 12, Issue 1.
APPENDIX 1: MULTICOLLINEARITY
1. Multicollinearity Test For 3 Years Before Company Bankruptcy No Variable VIF Tolerance Result 1 Inflation 1,682 0,595 No Multicollinearity* 2 Interest Rate 3,117 0,321 No Multicollinearity* 3 Gross National Product 1,299 0,770 No Multicollinearity* 4 Exchange Rate 4,255 0,235 No Multicollinearity* 5 Current Ratio 2,316 0,432 No Multicollinearity* 6 Cash Ratio 1,819 0,550 No Multicollinearity* 7 Debt to Asset Ratio 2,175 0,460 No Multicollinearity* 8 Time Interest Earned 1,243 0,804 No Multicollinearity* 9 Inventory Turnover 1,122 0,891 No Multicollinearity* 10 Total Assets Turnover 1,365 0,732 No Multicollinearity* 11 Return On Assets 4,097 0,244 No Multicollinearity* 12 Return On Equity 1,633 0,612 No Multicollinearity* 13 Price Earnings Ratio 1,208 0,828 No Multicollinearity* 14 Market to Book Value 1,558 0,642 No Multicollinearity* 15 Cash Flow Adequacy 2,986 0,335 No Multicollinearity* 16 Dividend Payout 1,546 0,647 No Multicollinearity* 17 Reinvestment 3,977 0,251 No Multicollinearity* 18 Debt Coverage 4,402 0,227 No Multicollinearity* 19 Cash Flow ROA 5,281 0,189 No Multicollinearity*
* VIF ≤ 10 and Tolerance ≥ 0,1 Source: SPSS Results From Data Process
2. Multicollinearity Test For 2 Years Before Company Bankruptcy
No Variable VIF Tolerance Result 1 Inflation 1,696 0,590 No Multicollinearity* 2 Interest Rate 3,957 0,253 No Multicollinearity* 3 Gross National Product 1,847 0,541 No Multicollinearity*
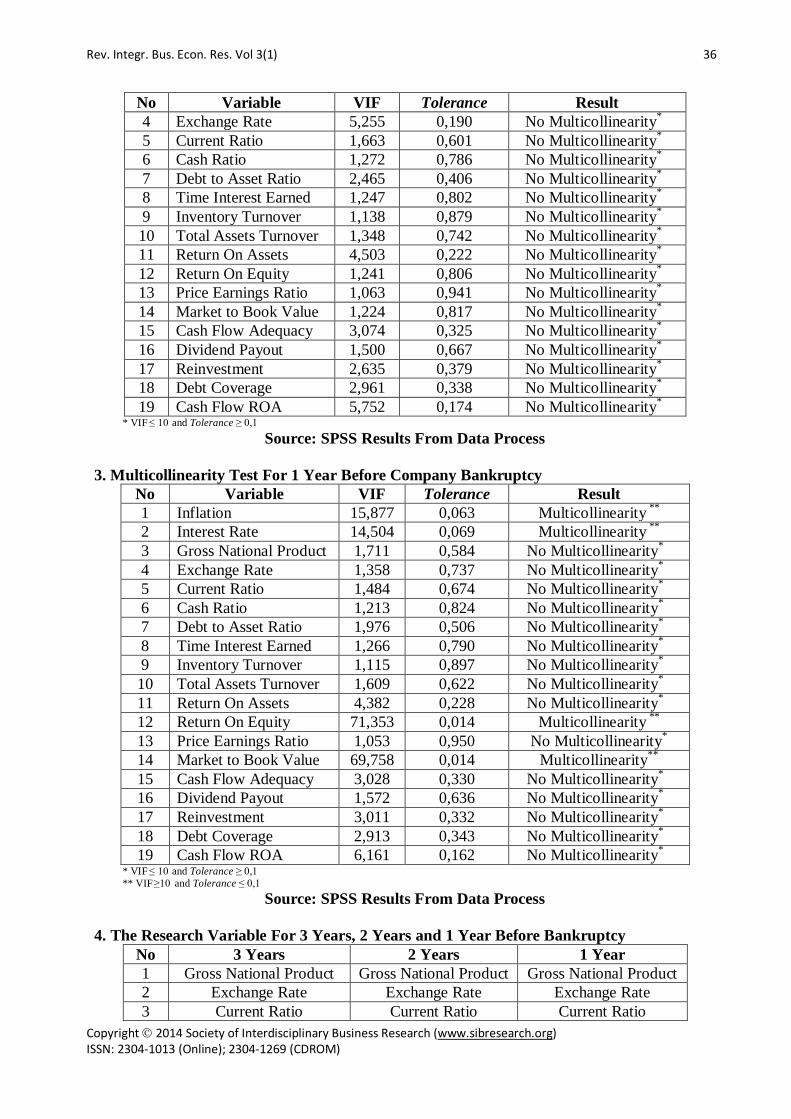
Rev. Integr. Bus. Econ. Res. Vol 3(1) 36
Copyright 2014 Society of Interdisciplinary Business Research (www.sibresearch.org) ISSN: 2304-1013 (Online); 2304-1269 (CDROM)
No Variable VIF Tolerance Result 4 Exchange Rate 5,255 0,190 No Multicollinearity* 5 Current Ratio 1,663 0,601 No Multicollinearity* 6 Cash Ratio 1,272 0,786 No Multicollinearity* 7 Debt to Asset Ratio 2,465 0,406 No Multicollinearity* 8 Time Interest Earned 1,247 0,802 No Multicollinearity* 9 Inventory Turnover 1,138 0,879 No Multicollinearity* 10 Total Assets Turnover 1,348 0,742 No Multicollinearity* 11 Return On Assets 4,503 0,222 No Multicollinearity* 12 Return On Equity 1,241 0,806 No Multicollinearity* 13 Price Earnings Ratio 1,063 0,941 No Multicollinearity* 14 Market to Book Value 1,224 0,817 No Multicollinearity* 15 Cash Flow Adequacy 3,074 0,325 No Multicollinearity* 16 Dividend Payout 1,500 0,667 No Multicollinearity* 17 Reinvestment 2,635 0,379 No Multicollinearity* 18 Debt Coverage 2,961 0,338 No Multicollinearity* 19 Cash Flow ROA 5,752 0,174 No Multicollinearity*
* VIF ≤ 10 and Tolerance ≥ 0,1
Source: SPSS Results From Data Process 3. Multicollinearity Test For 1 Year Before Company Bankruptcy
No Variable VIF Tolerance Result 1 Inflation 15,877 0,063 Multicollinearity ** 2 Interest Rate 14,504 0,069 Multicollinearity ** 3 Gross National Product 1,711 0,584 No Multicollinearity* 4 Exchange Rate 1,358 0,737 No Multicollinearity* 5 Current Ratio 1,484 0,674 No Multicollinearity* 6 Cash Ratio 1,213 0,824 No Multicollinearity* 7 Debt to Asset Ratio 1,976 0,506 No Multicollinearity* 8 Time Interest Earned 1,266 0,790 No Multicollinearity* 9 Inventory Turnover 1,115 0,897 No Multicollinearity* 10 Total Assets Turnover 1,609 0,622 No Multicollinearity* 11 Return On Assets 4,382 0,228 No Multicollinearity* 12 Return On Equity 71,353 0,014 Multicollinearity ** 13 Price Earnings Ratio 1,053 0,950 No Multicollinearity* 14 Market to Book Value 69,758 0,014 Multicollinearity** 15 Cash Flow Adequacy 3,028 0,330 No Multicollinearity* 16 Dividend Payout 1,572 0,636 No Multicollinearity* 17 Reinvestment 3,011 0,332 No Multicollinearity* 18 Debt Coverage 2,913 0,343 No Multicollinearity* 19 Cash Flow ROA 6,161 0,162 No Multicollinearity*
* VIF ≤ 10 and Tolerance ≥ 0,1 ** VIF ≥10 and Tolerance ≤ 0,1
Source: SPSS Results From Data Process 4. The Research Variable For 3 Years, 2 Years and 1 Year Before Bankruptcy
No 3 Years 2 Years 1 Year 1 Gross National Product Gross National Product Gross National Product 2 Exchange Rate Exchange Rate Exchange Rate 3 Current Ratio Current Ratio Current Ratio
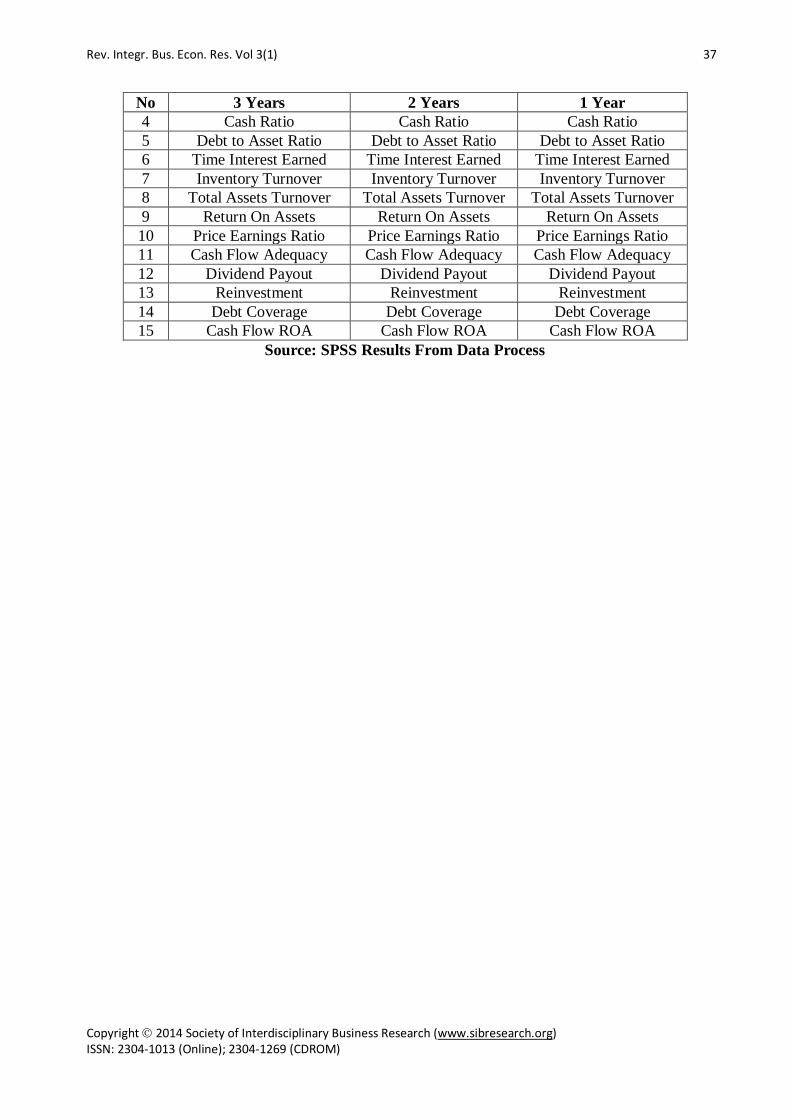
Rev. Integr. Bus. Econ. Res. Vol 3(1) 37
Copyright 2014 Society of Interdisciplinary Business Research (www.sibresearch.org) ISSN: 2304-1013 (Online); 2304-1269 (CDROM)
No 3 Years 2 Years 1 Year 4 Cash Ratio Cash Ratio Cash Ratio 5 Debt to Asset Ratio Debt to Asset Ratio Debt to Asset Ratio 6 Time Interest Earned Time Interest Earned Time Interest Earned 7 Inventory Turnover Inventory Turnover Inventory Turnover 8 Total Assets Turnover Total Assets Turnover Total Assets Turnover 9 Return On Assets Return On Assets Return On Assets 10 Price Earnings Ratio Price Earnings Ratio Price Earnings Ratio 11 Cash Flow Adequacy Cash Flow Adequacy Cash Flow Adequacy 12 Dividend Payout Dividend Payout Dividend Payout 13 Reinvestment Reinvestment Reinvestment 14 Debt Coverage Debt Coverage Debt Coverage 15 Cash Flow ROA Cash Flow ROA Cash Flow ROA
Source: SPSS Results From Data Process

Rev. Integr. Bus. Econ. Res. Vol 3(1) 38
Copyright 2014 Society of Interdisciplinary Business Research (www.sibresearch.org) ISSN: 2304-1013 (Online); 2304-1269 (CDROM)
APPENDIX 2: RESULTS OF HYPOTHESIS TESTS
1. Results from first hypothesis testing for 3 years, 2 years and 1 year before company bankruptcy
Model Value of χ2 Sig Value of χ2α Result
3 years 51,428 0,000 22,31* Reject H0 ** 2 years 62,161 0,000 22,31* Reject H0 ** 1 year 59,424 0,000 22,31* Reject H0 **
* α= 10%, df = 15 ** χ2 > χ2
α or Sig < α ( 0,1 )
Source: SPSS Results From Data Process 2. Results from second hypothesis testing for 3 years before company bankruptcy
Variable B df Sig. Result Gross National Product 0.479 1 0.489 Accept H0 * Exchange Rate 0.079 1 0.779 Accept H0 * Current Ratio 0.295 1 0.001 Reject H0 ** Cash Ratio 0.164 1 0.686 Accept H0 * Debt To Assets Ratio 10.759 1 0.000 Reject H0 ** Time Interest Earned 1.557 1 0.212 Accept H0 * Inventory Turnover 1.507 1 0.220 Accept H0 * Total Asset Turnover 1.984 1 0.159 Accept H0 * Return On Assets 0.001 1 0.977 Accept H0 * Price Earnings Ratio 1.246 1 0.264 Accept H0 * Constant -9.792 1 0.000 Reject H0 **
* Sig > α (0,1) **Sig < α (0,1)
Source: SPSS Results From Data Process 3. Results from second hypothesis testing for 2 years before company bankruptcy
Variable B df Sig. Result Gross National Product 0.034 1 0.854 Accept H0 * Exchange Rate 0.328 1 0.567 Accept H0 * Current Ratio 0.469 1 0.493 Accept H0 * Cash Ratio 0.099 1 0.753 Accept H0 * Debt To Assets Ratio 4.435 1 0.093 Reject H0 ** Time Interest Earned 0.037 1 0.847 Accept H0 * Inventory Turnover 0.614 1 0.433 Accept H0 * Total Asset Turnover 1.166 1 0.280 Accept H0 * Return On Assets -0.234 1 0.025 Reject H0 ** Price Earnings Ratio 0.333 1 0.564 Accept H0 * Constant -4.546 1 0.010 Reject H0 **
* Sig > α (0,1) **Sig < α (0,1)
Source: SPSS Results From Data Process 4. Results from second hypothesis testing for 1 year before company bankruptcy
Variable B Df Sig. Result Gross National Product 0.203 1 0.653 Accept H0 * Exchange Rate 0.507 1 0.476 Accept H0 *
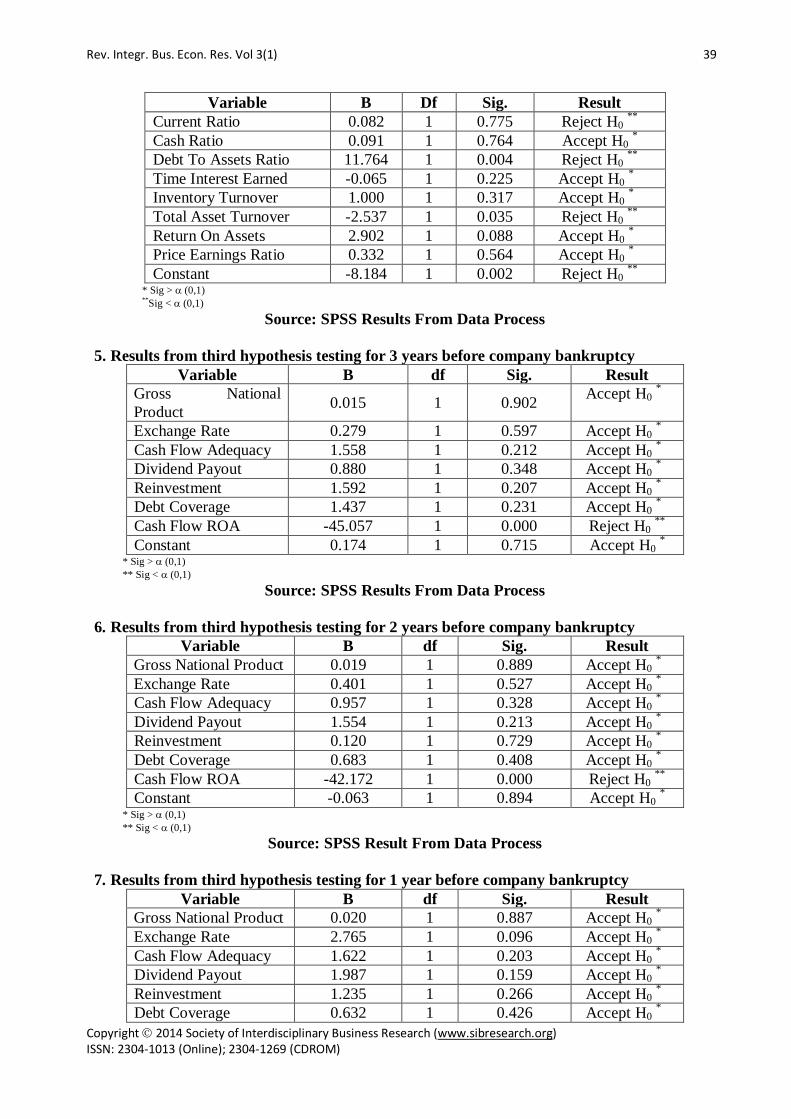
Rev. Integr. Bus. Econ. Res. Vol 3(1) 39
Copyright 2014 Society of Interdisciplinary Business Research (www.sibresearch.org) ISSN: 2304-1013 (Online); 2304-1269 (CDROM)
Variable B Df Sig. Result Current Ratio 0.082 1 0.775 Reject H0 ** Cash Ratio 0.091 1 0.764 Accept H0 * Debt To Assets Ratio 11.764 1 0.004 Reject H0 ** Time Interest Earned -0.065 1 0.225 Accept H0 * Inventory Turnover 1.000 1 0.317 Accept H0 * Total Asset Turnover -2.537 1 0.035 Reject H0 ** Return On Assets 2.902 1 0.088 Accept H0 * Price Earnings Ratio 0.332 1 0.564 Accept H0 * Constant -8.184 1 0.002 Reject H0 **
* Sig > α (0,1) **Sig < α (0,1)
Source: SPSS Results From Data Process
5. Results from third hypothesis testing for 3 years before company bankruptcy Variable B df Sig. Result
Gross National Product 0.015 1 0.902 Accept H0 *
Exchange Rate 0.279 1 0.597 Accept H0 * Cash Flow Adequacy 1.558 1 0.212 Accept H0 * Dividend Payout 0.880 1 0.348 Accept H0 * Reinvestment 1.592 1 0.207 Accept H0 * Debt Coverage 1.437 1 0.231 Accept H0 * Cash Flow ROA -45.057 1 0.000 Reject H0 ** Constant 0.174 1 0.715 Accept H0 *
* Sig > α (0,1) ** Sig < α (0,1)
Source: SPSS Results From Data Process 6. Results from third hypothesis testing for 2 years before company bankruptcy
Variable B df Sig. Result Gross National Product 0.019 1 0.889 Accept H0 * Exchange Rate 0.401 1 0.527 Accept H0 * Cash Flow Adequacy 0.957 1 0.328 Accept H0 * Dividend Payout 1.554 1 0.213 Accept H0 * Reinvestment 0.120 1 0.729 Accept H0 * Debt Coverage 0.683 1 0.408 Accept H0 * Cash Flow ROA -42.172 1 0.000 Reject H0 ** Constant -0.063 1 0.894 Accept H0 *
* Sig > α (0,1) ** Sig < α (0,1)
Source: SPSS Result From Data Process 7. Results from third hypothesis testing for 1 year before company bankruptcy
Variable B df Sig. Result Gross National Product 0.020 1 0.887 Accept H0 * Exchange Rate 2.765 1 0.096 Accept H0 * Cash Flow Adequacy 1.622 1 0.203 Accept H0 * Dividend Payout 1.987 1 0.159 Accept H0 * Reinvestment 1.235 1 0.266 Accept H0 * Debt Coverage 0.632 1 0.426 Accept H0 *
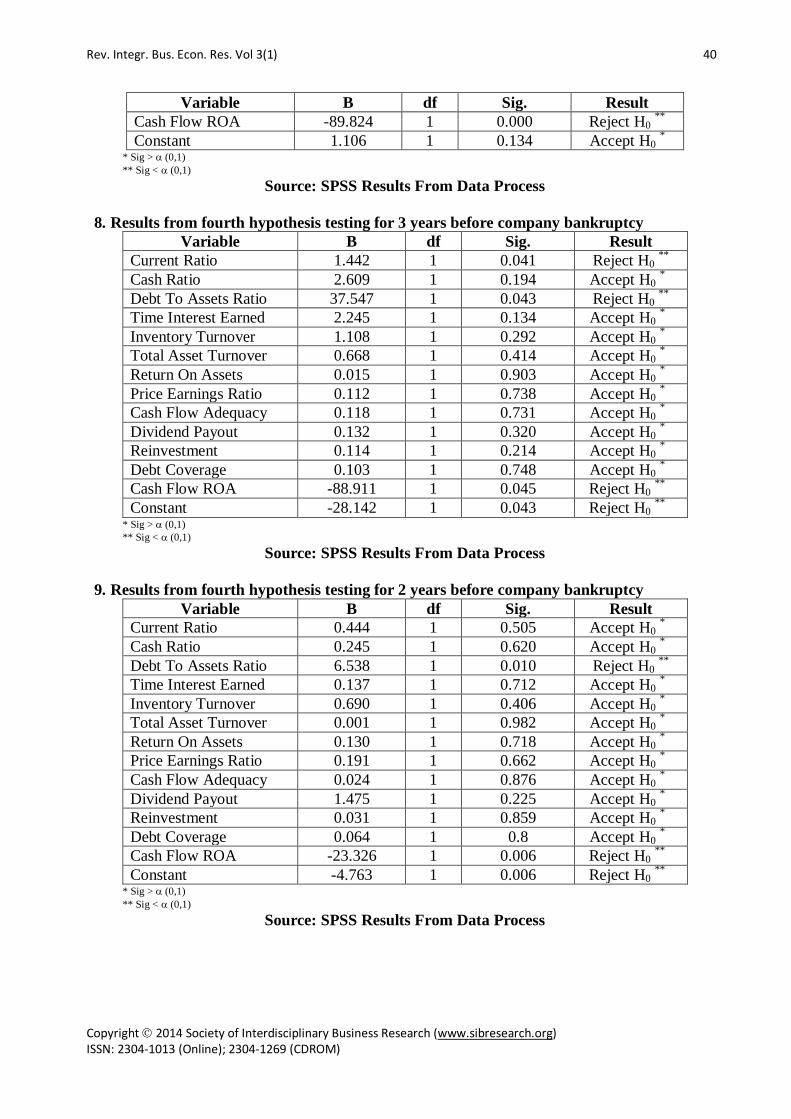
Rev. Integr. Bus. Econ. Res. Vol 3(1) 40
Copyright 2014 Society of Interdisciplinary Business Research (www.sibresearch.org) ISSN: 2304-1013 (Online); 2304-1269 (CDROM)
Variable B df Sig. Result Cash Flow ROA -89.824 1 0.000 Reject H0 ** Constant 1.106 1 0.134 Accept H0 *
* Sig > α (0,1) ** Sig < α (0,1)
Source: SPSS Results From Data Process
8. Results from fourth hypothesis testing for 3 years before company bankruptcy Variable B df Sig. Result
Current Ratio 1.442 1 0.041 Reject H0 ** Cash Ratio 2.609 1 0.194 Accept H0 * Debt To Assets Ratio 37.547 1 0.043 Reject H0 ** Time Interest Earned 2.245 1 0.134 Accept H0 * Inventory Turnover 1.108 1 0.292 Accept H0 * Total Asset Turnover 0.668 1 0.414 Accept H0 * Return On Assets 0.015 1 0.903 Accept H0 * Price Earnings Ratio 0.112 1 0.738 Accept H0 * Cash Flow Adequacy 0.118 1 0.731 Accept H0 * Dividend Payout 0.132 1 0.320 Accept H0 * Reinvestment 0.114 1 0.214 Accept H0 * Debt Coverage 0.103 1 0.748 Accept H0 * Cash Flow ROA -88.911 1 0.045 Reject H0 ** Constant -28.142 1 0.043 Reject H0 **
* Sig > α (0,1) ** Sig < α (0,1)
Source: SPSS Results From Data Process 9. Results from fourth hypothesis testing for 2 years before company bankruptcy
Variable B df Sig. Result Current Ratio 0.444 1 0.505 Accept H0 * Cash Ratio 0.245 1 0.620 Accept H0 * Debt To Assets Ratio 6.538 1 0.010 Reject H0 ** Time Interest Earned 0.137 1 0.712 Accept H0 * Inventory Turnover 0.690 1 0.406 Accept H0 * Total Asset Turnover 0.001 1 0.982 Accept H0 * Return On Assets 0.130 1 0.718 Accept H0 * Price Earnings Ratio 0.191 1 0.662 Accept H0 * Cash Flow Adequacy 0.024 1 0.876 Accept H0 * Dividend Payout 1.475 1 0.225 Accept H0 * Reinvestment 0.031 1 0.859 Accept H0 * Debt Coverage 0.064 1 0.8 Accept H0 * Cash Flow ROA -23.326 1 0.006 Reject H0 ** Constant -4.763 1 0.006 Reject H0 **
* Sig > α (0,1) ** Sig < α (0,1)
Source: SPSS Results From Data Process

Rev. Integr. Bus. Econ. Res. Vol 3(1) 41
Copyright 2014 Society of Interdisciplinary Business Research (www.sibresearch.org) ISSN: 2304-1013 (Online); 2304-1269 (CDROM)
10. Results from four hypothesis testing for 1 year before company bankruptcy
Variable B df Sig. Result Current Ratio 0.134 1 0.714 Accept H0 * Cash Ratio 0.259 1 0.611 Accept H0 * Debt To Assets Ratio 6.790 1 0.072 Reject H0 ** Time Interest Earned -0.002 1 0.921 Accept H0 * Inventory Turnover 0.938 1 0.333 Accept H0 * Total Asset Turnover 0.589 1 0.443 Accept H0 * Return On Assets 0.412 1 0.521 Accept H0 * Price Earnings Ratio 0.001 1 0.979 Accept H0 * Cash Flow Adequacy 1.364 1 0.243 Accept H0 * Dividend Payout 1.049 1 0.306 Accept H0 * Reinvestment 0.241 1 0.623 Accept H0 * Debt Coverage 0.229 1 0.632 Accept H0 * Cash Flow ROA -54.074 1 0.013 Reject H0 ** Constant -4.123 1 0.116 Accept H0 *
* Sig > α (0,1) ** Sig < α (0,1)
Source: SPSS Results From Data Process
Related Documents