MNGT 213 By Raghav Lakhotia LU ID-33548951 Submission Type - Individual Module Leader - Mrs.Kim Menenzes LLL

Welcome message from author
This document is posted to help you gain knowledge. Please leave a comment to let me know what you think about it! Share it to your friends and learn new things together.
Transcript

MNGT 213 By
Raghav Lakhotia LU ID-33548951Submission Type - Individual
Module Leader- Mrs.Kim Menenzes
LLL
Research QuestionDoes the movement of SENSEX affect the movement of BANKEX??
Objective of Study To assess the correlation between the SENSEX and the BANKEX from the year 2007 to 2014 where SENSEX is the independent variable and BANKEX is the dependent variable. Also to observe the impact of SENSEX on BANKEX.
IntroductionBombay Stock Exchange (BSE) was established in 1875. It is one of the leading exchanges in India and first stock exchange of Asia. For trading in equity, mutual funds, debt instruments and derivatives BSE is a translucent and competent market. BSE has more than 5000 companies listed in it and making it the world’s no.1 exchange in terms of listed member.SENSEX was formed in 1986. It is the most popular bench mark index of India’s stock market. Internationally, it is traded on the EUREX and also in BRCS nations (Brazil, Russia, China and South Africa). Free float capitalization method is used to calculate the SENSEX. It comprises of stocks which are the largest and the most frequently traded stocks like Bajaj Auto, GAIL, Hindalco etc. BANKEX is an index which was designed for bank stocks. Performance of Stocks of leading banks that are listed in the BSE are tracked by BANKEX. It is calculated on the basis of free float methodology. It comprises of 12 banking stocks like Canara Bank, HDFC Bank Ltd, Axis Bank Ltd etc.
Data descriptionSENSEX has been chosen as one of the variables as it is a strong indicator of the Bombay Stock Exchange (BSE). The data for SENSEX has been collected from the online database of BSE website. BANKEX rates are calculated through the free float capitalization method where top 12 banks shares are considered. The BANKEX rates also have been collected from the online database of BSE website. The data of both the variables is time series data. In both the variables zero can be defined so the data is in the form of ratio. Also both the data are quantitative. Both the variables collected are of 32 consecutive quarters from 2007 to 2014. In the data, SENSEX is the independent variable and BANKEX is the dependent variable.
1
Data Analysis IBM SSPS and MS EXCEL has been used to analyze the data.From the statistics table in appendix 2, we can analyze that:-
1. The mean of SENSEX is 17717.27, which is quite low compared to the maximum which is 28748.22, hence depicting that the average SENSEX rate in India was moderate.
2. The mean of BANKEX rate is 11031.9541 and the maximum is 21257.32 showing that BANKEX rate was also moderate.
3. The lowest value in SENSEX was 8762.88 and highest was 28748.22 which shows that there are extreme values around the mean which is 17717.27.
4. The lowest value in BANKEX was 4151.28 & the highest was 21257.32 which shows that there are extreme values around the mean which is 11031.9541
5. This mean has not been altered by extreme values as mean and median of both SENSEX & BANKEX are very close together.
6. Standard deviation of both SENSEX and BANKEX are 4047.02838 and 3614.01478 respectively. Hence it shows that the data of the variables are spread out widely rather than being clustered near the mean.
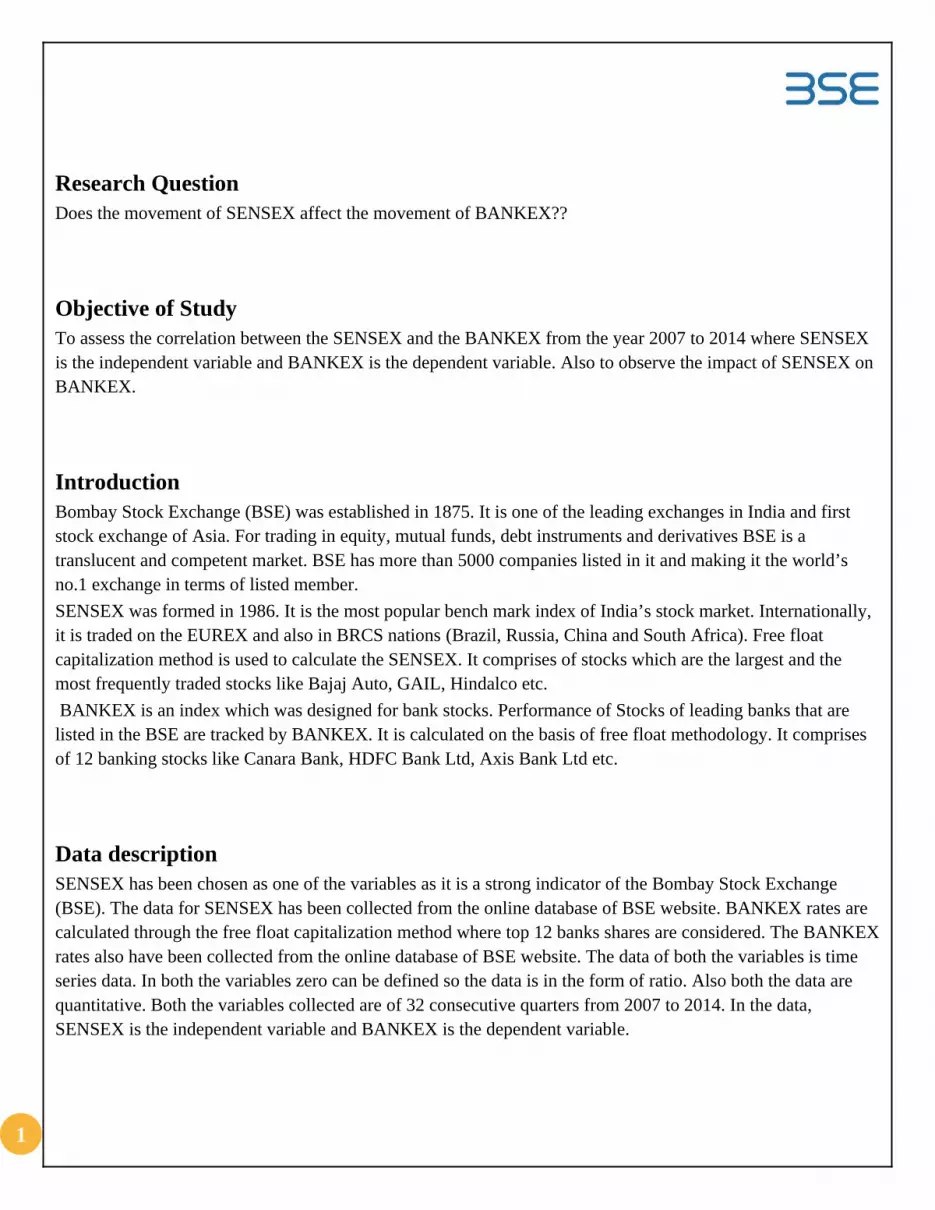
From the analysis of the above descriptive statistics we obtained the statistics spread over 32 quarters from the time period 2007-2014. This may misdirect us to accept that the SENSEX and the BANKEX were doing fine. From the below given graphs we can observe that there are quite good number of fluctuations, in both SENSEX and BANKEX.
Graph 1
sensex0
5000
10000
15000
20000
25000
30000
35000
SENSEX
Mar-07 Jun-07 Sep-07 Dec-07 Mar-08 Jun-08 Sep-08 Dec-08Mar-09 Jun-09 Sep-09 Dec-09 Mar-10 Jun-10 Sep-10 Dec-10Mar-11 Jun-11 Sep-11 Dec-11 Mar-12 Jun-12 Sep-12 Dec-12Mar-13 Jun-13 Sep-13 Dec-13 Mar-14 Jun-14 Sep-14 Dec-14
From the above graph, we can observe that from the past 32 quarters, SENSEX has faced a quite good number of fluctuations. But from Mar-07 to Dec-14 we can note that SENSEX has grown almost 1.5 times. This is
2
because the Economy has faced ups and downs repeatedly. Even from the graph we can see that SENSEX had increased steadily to due the betterment of economy after June-12.
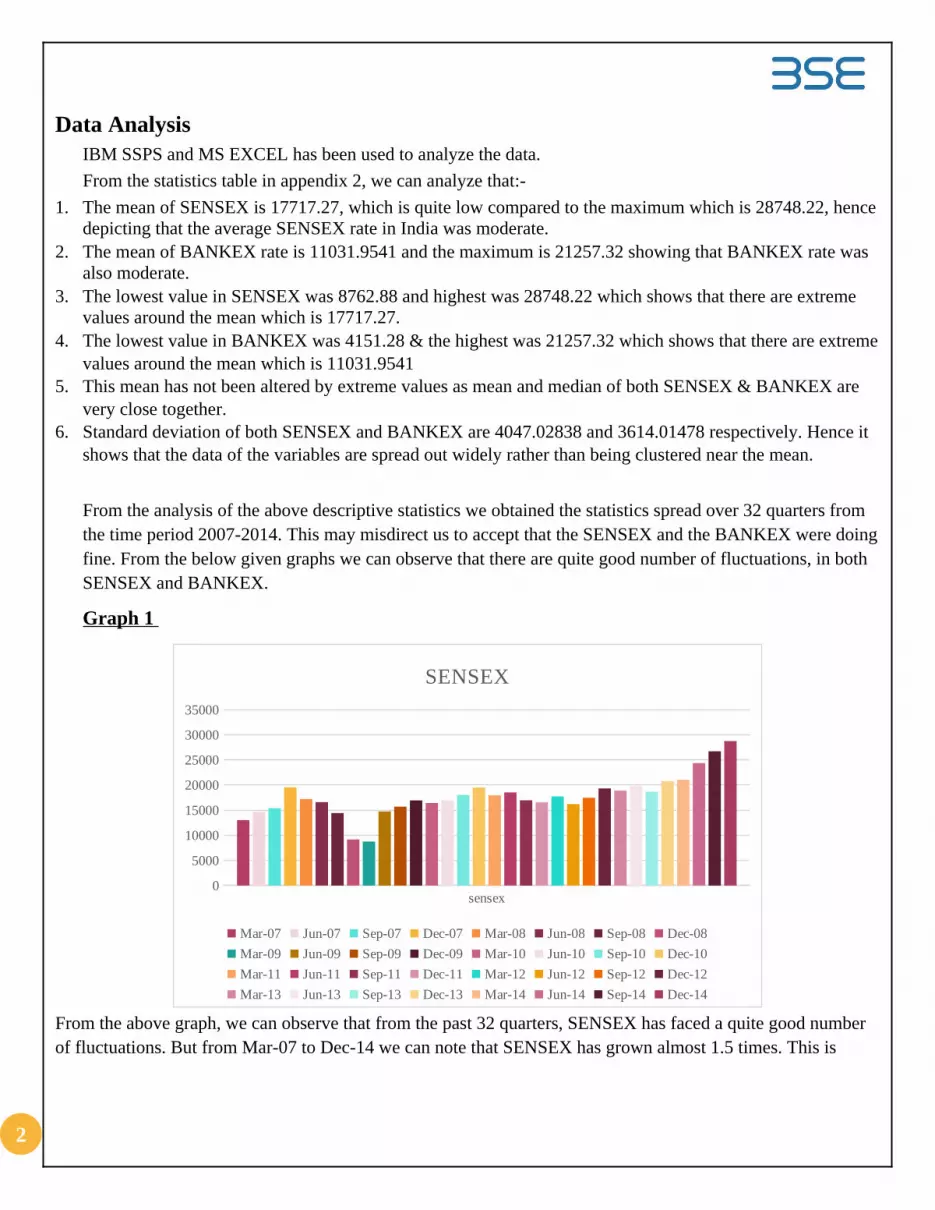
Graph 2
bankex0
5000
10000
15000
20000
25000
BANKEX
Mar-07 Jun-07 Sep-07 Dec-07 Mar-08 Jun-08 Sep-08 Dec-08Mar-09 Jun-09 Sep-09 Dec-09 Mar-10 Jun-10 Sep-10 Dec-10Mar-11 Jun-11 Sep-11 Dec-11 Mar-12 Jun-12 Sep-12 Dec-12Mar-13 Jun-13 Sep-13 Dec-13 Mar-14 Jun-14 Sep-14 Dec-14
Even in this graph we can see that BANKEX is facing many fluctuations. We can also interpret that BANKEX has grown almost 4 times within a span of 8 years. This movement in BANKEX is due to the SENSEX as SENSEX is one of the best indicators to measure the performance of the market.
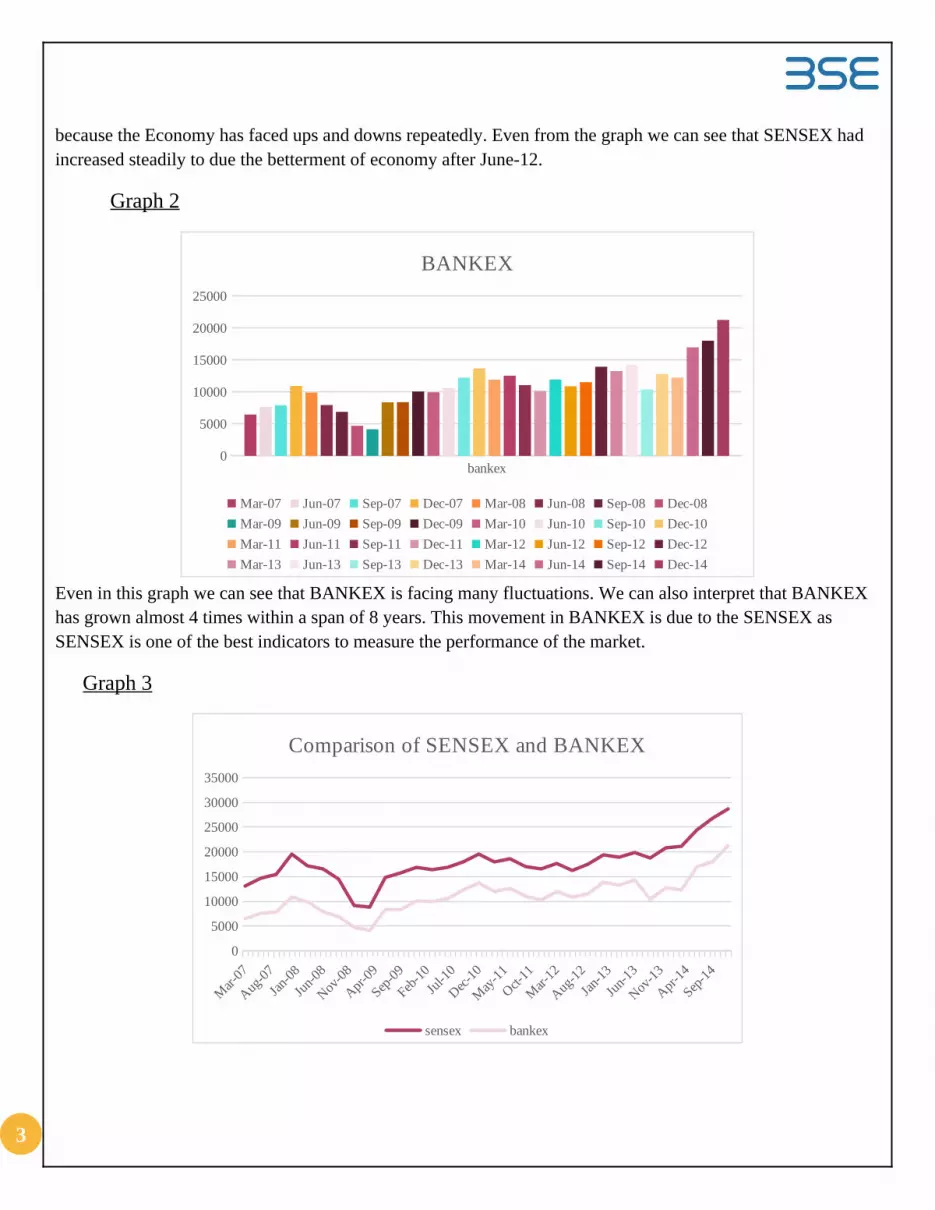
Graph 3
Mar-07
Aug-07
Jan-08
Jun-08
Nov-08
Apr-09
Sep-09
Feb-10
Jul-10
Dec-10
May-11
Oct-11
Mar-12
Aug-12
Jan-13
Jun-13
Nov-13
Apr-14
Sep-14
0
5000
10000
15000
20000
25000
30000
35000
Comparison of SENSEX and BANKEX
sensex bankex
3
From the above graph we can observe that BANKEX was affected by the movement of SENSEX.For example in Aug-07 SENSEX incresed significantly as a result BANKEX also increased in a significant manner, but in Nov-08 when SENSEX felt down same happened with BANKEX , it also collapsed simultaneously.
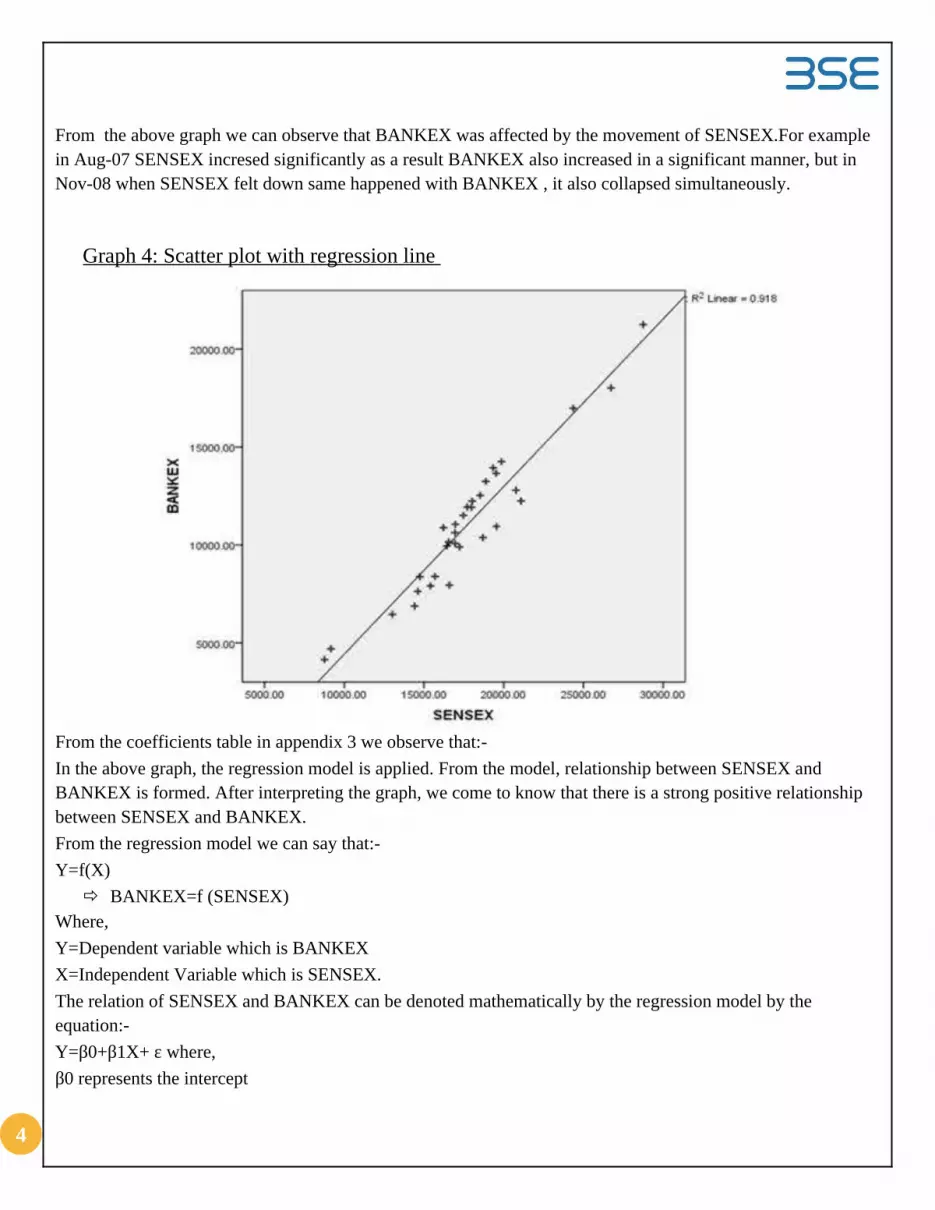
Graph 4: Scatter plot with regression line
From the coefficients table in appendix 3 we observe that:-In the above graph, the regression model is applied. From the model, relationship between SENSEX and BANKEX is formed. After interpreting the graph, we come to know that there is a strong positive relationship between SENSEX and BANKEX.From the regression model we can say that:-Y=f(X)
BANKEX=f (SENSEX)Where,Y=Dependent variable which is BANKEXX=Independent Variable which is SENSEX.The relation of SENSEX and BANKEX can be denoted mathematically by the regression model by the equation:-Y=β0+β1X+ ε where,β0 represents the intercept
4
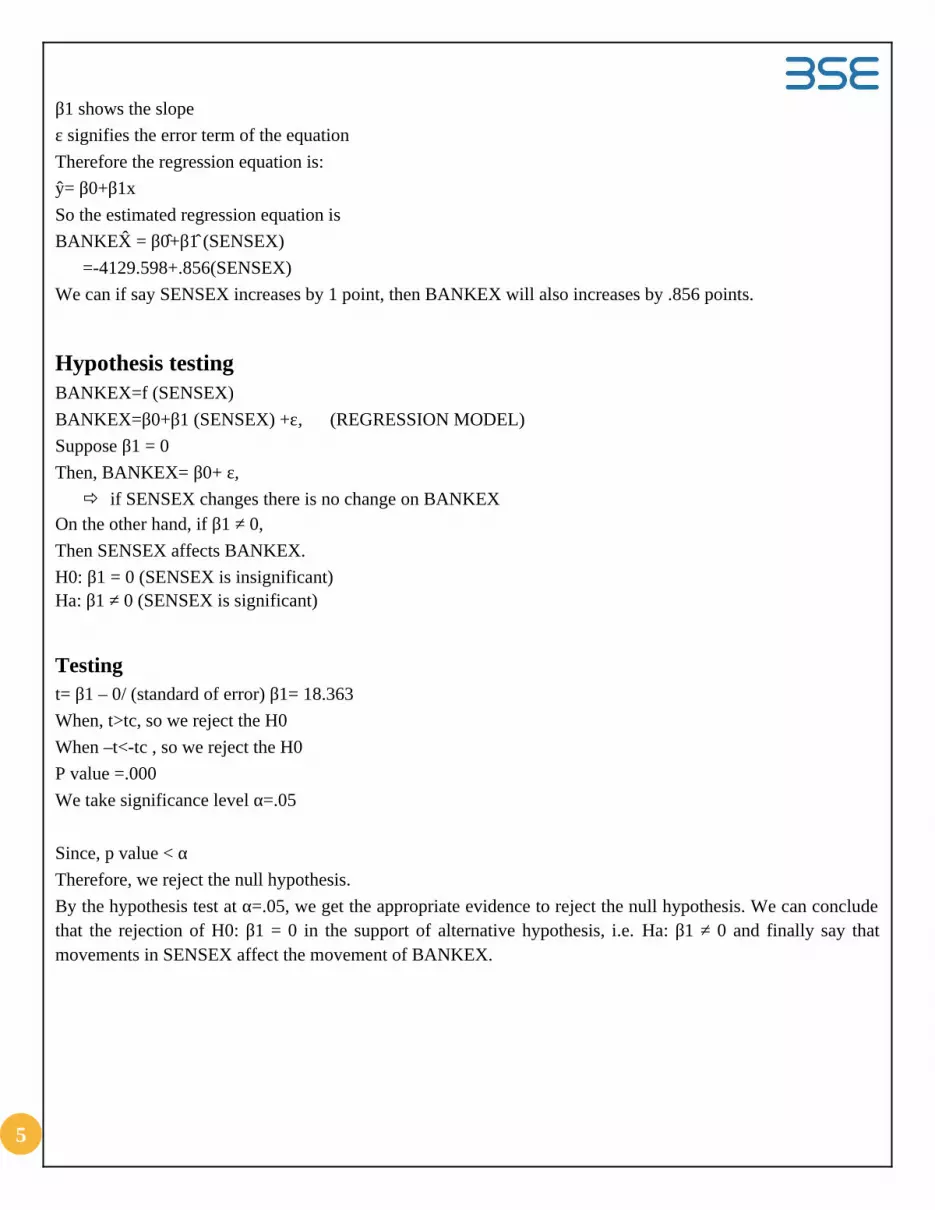
β1 shows the slopeε signifies the error term of the equationTherefore the regression equation is:y= β0+β1xSo the estimated regression equation is BANKEX = β0+β1 (SENSEX) =-4129.598+.856(SENSEX)We can if say SENSEX increases by 1 point, then BANKEX will also increases by .856 points.
Hypothesis testing BANKEX=f (SENSEX)BANKEX=β0+β1 (SENSEX) +ε, (REGRESSION MODEL)Suppose β1 = 0Then, BANKEX= β0+ ε,
if SENSEX changes there is no change on BANKEXOn the other hand, if β1 ≠ 0,Then SENSEX affects BANKEX.H0: β1 = 0 (SENSEX is insignificant)Ha: β1 ≠ 0 (SENSEX is significant)
Testing t= β1 – 0/ (standard of error) β1= 18.363When, t>tc, so we reject the H0When –t<-tc , so we reject the H0P value =.000We take significance level α=.05
Since, p value < αTherefore, we reject the null hypothesis.By the hypothesis test at α=.05, we get the appropriate evidence to reject the null hypothesis. We can conclude that the rejection of H0: β1 = 0 in the support of alternative hypothesis, i.e. Ha: β1 ≠ 0 and finally say that movements in SENSEX affect the movement of BANKEX.
5

Correlation For estimating the regression model R2 is used to evaluate the goodness of fit and also the coefficient of determination. From this study we come to know that R2=.918 or 91.8% of variation in the movement of BANKEX is explained by the movement in SENSEX. From this we can conclude that the regression has a very strong positive linear relationship.
Conclusion
From the study we can conclude that there is a strong impact of SENSEX on BANKEX as in most of the cases where SENSEX is increasing, BANKEX is also increasing and when SENSEX is falling then BANKEX is also collapsing. After interpreting the regression model, we have come to know that the data collected has strong positive relation of 91.8%. To prove this we used the hypothesis test & rejected the null hypothesis to support the alternative hypothesis. Here we have seen the BANKEX had lot of fluctuations due to the twelve banks not controlling their funds appropriately towards the proper growth of the economy and they were affected by the stock market drastically. But now the Reserve Bank of India (RBI) has become strict towards the gold reserves of the bank & the lending powers the bank have, so that the BANKEX is not affected by the ups and downs in the stock market or the economy conditions of a country in short period . This assignment has also exposed me to the stock market and software used in business like IBM SPSS and MS EXCEL. I have come to know about the importance of the SENSEX in the stock market and how statistics play an important role in it.
6
Appendix
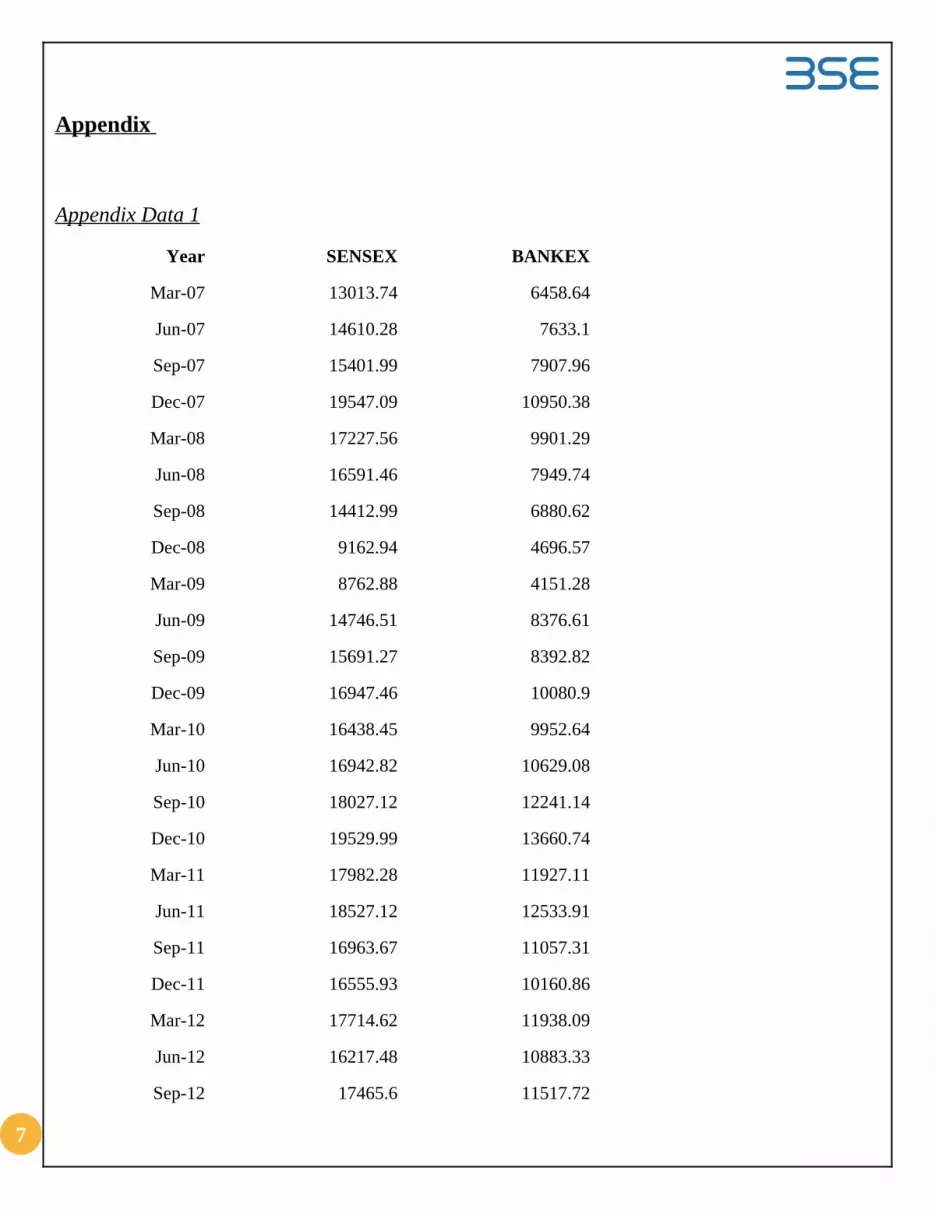
Appendix Data 1
Year SENSEX BANKEX
Mar-07 13013.74 6458.64
Jun-07 14610.28 7633.1
Sep-07 15401.99 7907.96
Dec-07 19547.09 10950.38
Mar-08 17227.56 9901.29
Jun-08 16591.46 7949.74
Sep-08 14412.99 6880.62
Dec-08 9162.94 4696.57
Mar-09 8762.88 4151.28
Jun-09 14746.51 8376.61
Sep-09 15691.27 8392.82
Dec-09 16947.46 10080.9
Mar-10 16438.45 9952.64
Jun-10 16942.82 10629.08
Sep-10 18027.12 12241.14
Dec-10 19529.99 13660.74
Mar-11 17982.28 11927.11
Jun-11 18527.12 12533.91
Sep-11 16963.67 11057.31
Dec-11 16555.93 10160.86
Mar-12 17714.62 11938.09
Jun-12 16217.48 10883.33
Sep-12 17465.6 11517.72
7

Dec-12 19342.83 13942.59
Mar-13 18876.68 13250.6
Jun-13 19859.22 14264.18
Sep-13 18691.83 10379.39
Dec-13 20771.27 12798.33
Mar-14 21079.27 12246.82
Jun-14 24368.96 16980.9
Sep-14 26733.18 18020.56
Dec-14 28748.22 21257.32
8
SPSS GENERATED OUTPUT
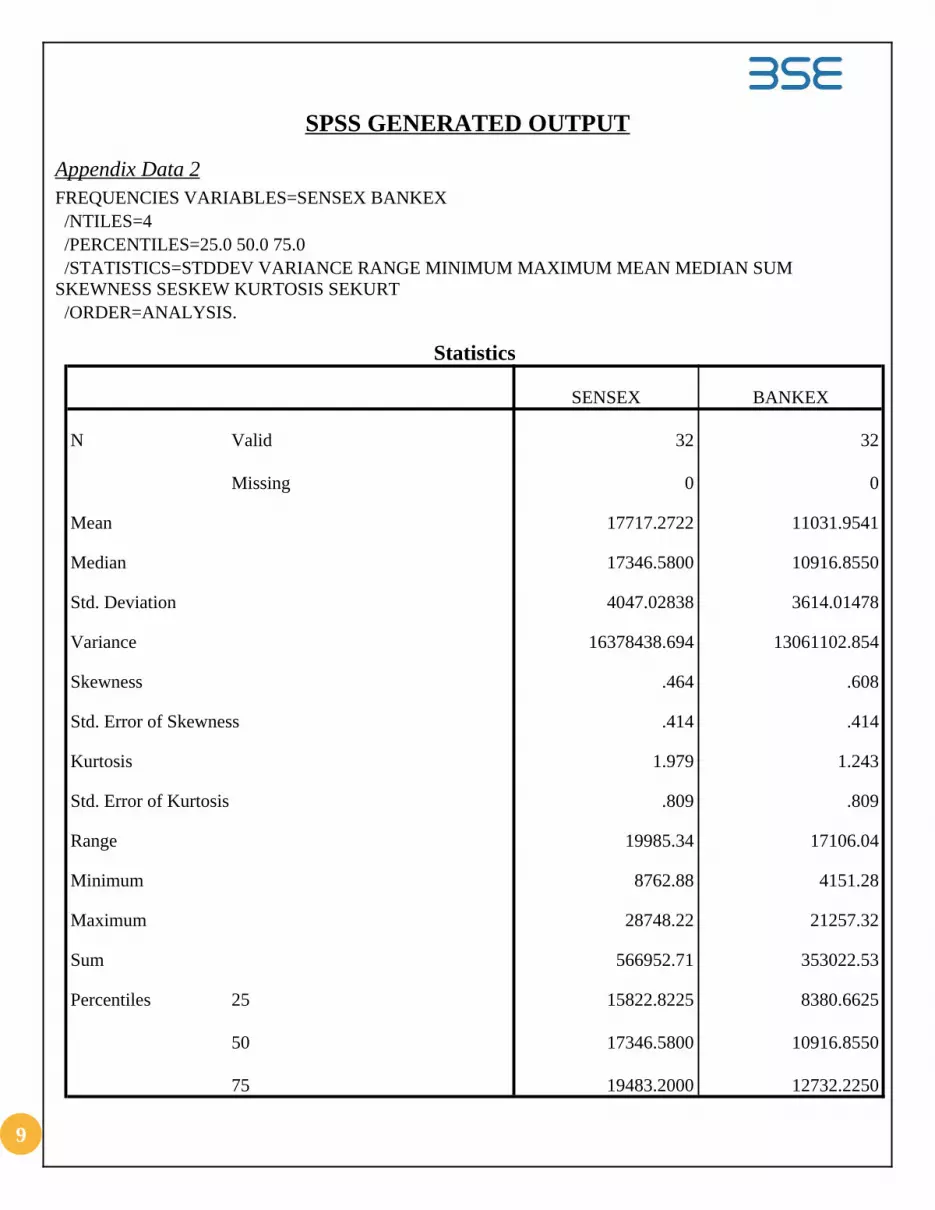
Appendix Data 2FREQUENCIES VARIABLES=SENSEX BANKEX /NTILES=4 /PERCENTILES=25.0 50.0 75.0 /STATISTICS=STDDEV VARIANCE RANGE MINIMUM MAXIMUM MEAN MEDIAN SUM SKEWNESS SESKEW KURTOSIS SEKURT /ORDER=ANALYSIS.
Statistics
SENSEX BANKEX
N Valid 32 32
Missing 0 0
Mean 17717.2722 11031.9541
Median 17346.5800 10916.8550
Std. Deviation 4047.02838 3614.01478
Variance 16378438.694 13061102.854
Skewness .464 .608
Std. Error of Skewness .414 .414
Kurtosis 1.979 1.243
Std. Error of Kurtosis .809 .809
Range 19985.34 17106.04
Minimum 8762.88 4151.28
Maximum 28748.22 21257.32
Sum 566952.71 353022.53
Percentiles 25 15822.8225 8380.6625
50 17346.5800 10916.8550
75 19483.2000 12732.2250
9
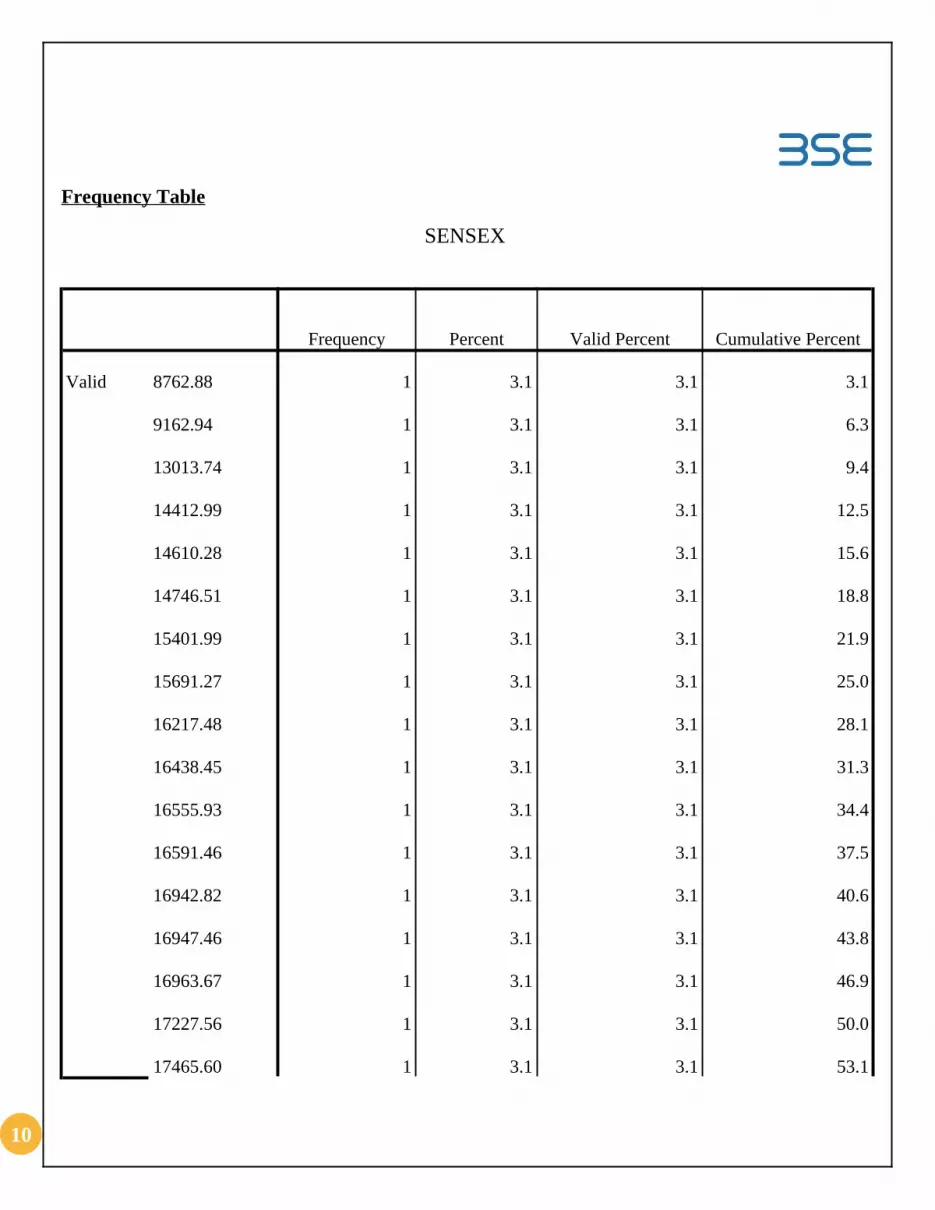
Frequency Table
SENSEX
Frequency Percent Valid Percent Cumulative Percent
Valid 8762.88 1 3.1 3.1 3.1
9162.94 1 3.1 3.1 6.3
13013.74 1 3.1 3.1 9.4
14412.99 1 3.1 3.1 12.5
14610.28 1 3.1 3.1 15.6
14746.51 1 3.1 3.1 18.8
15401.99 1 3.1 3.1 21.9
15691.27 1 3.1 3.1 25.0
16217.48 1 3.1 3.1 28.1
16438.45 1 3.1 3.1 31.3
16555.93 1 3.1 3.1 34.4
16591.46 1 3.1 3.1 37.5
16942.82 1 3.1 3.1 40.6
16947.46 1 3.1 3.1 43.8
16963.67 1 3.1 3.1 46.9
17227.56 1 3.1 3.1 50.0
17465.60 1 3.1 3.1 53.1
10

17714.62 1 3.1 3.1 56.3
17982.28 1 3.1 3.159.4
18027.12 1 3.1 3.1 62.5
18527.12 1 3.1 3.1 65.6
18691.83 1 3.1 3.1 68.8
18876.68 1 3.1 3.1 71.9
19342.83 1 3.1 3.1 75.0
19529.99 1 3.1 3.1 78.1
19547.09 1 3.1 3.1 81.3
19859.22 1 3.1 3.1 84.4
20771.27 1 3.1 3.1 87.5
21079.27 1 3.1 3.1 90.6
24368.96 1 3.1 3.1 93.8
26733.18 1 3.1 3.1 96.9
28748.22 1 3.1 3.1 100.0
Total 32 100.0 100.0
BANKEX
Frequency Percent Valid Percent Cumulative Percent
Valid 4151.28 1 3.1 3.1 3.1
4696.57 1 3.1 3.1 6.3
6458.64 1 3.1 3.1 9.4
11
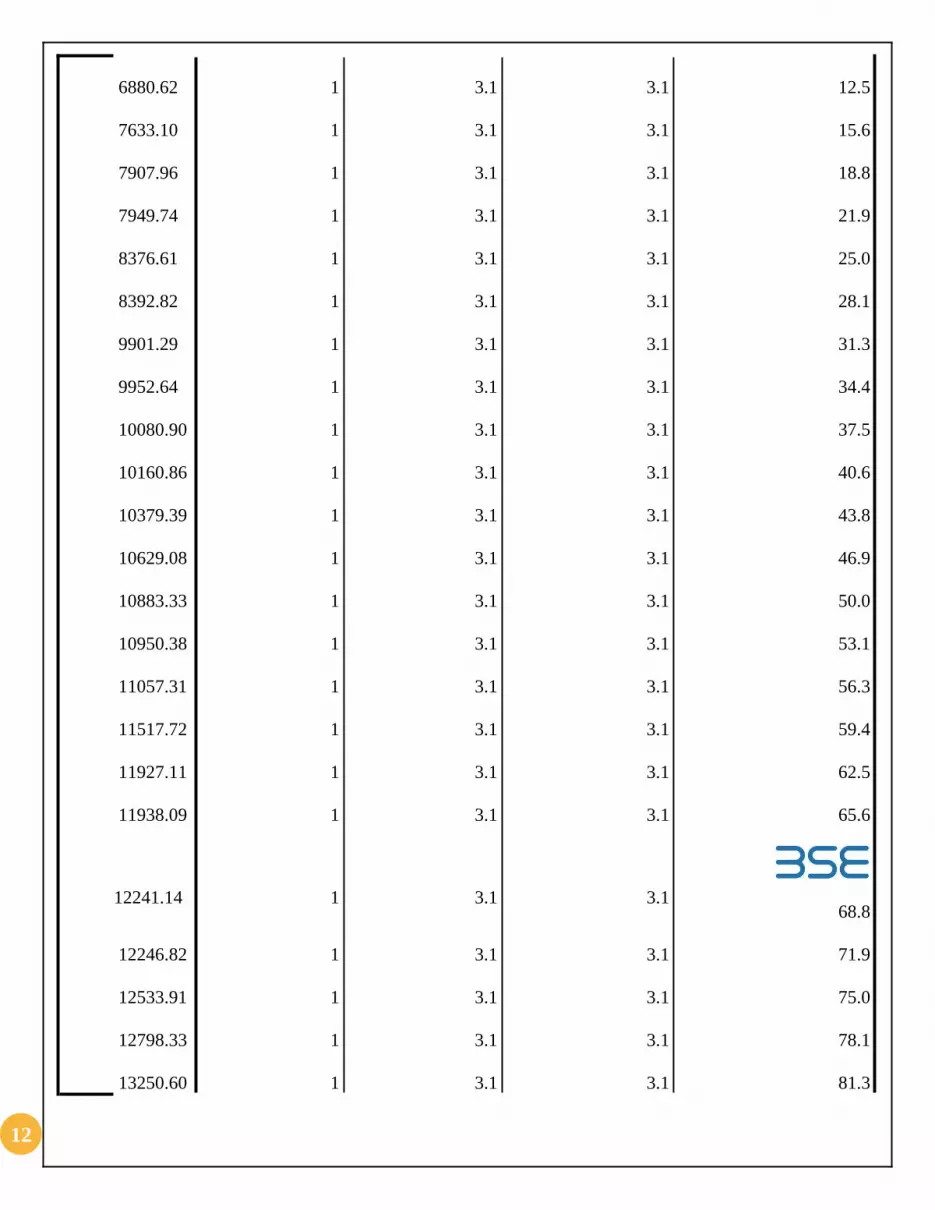
6880.62 1 3.1 3.1 12.5
7633.10 1 3.1 3.1 15.6
7907.96 1 3.1 3.1 18.8
7949.74 1 3.1 3.1 21.9
8376.61 1 3.1 3.1 25.0
8392.82 1 3.1 3.1 28.1
9901.29 1 3.1 3.1 31.3
9952.64 1 3.1 3.1 34.4
10080.90 1 3.1 3.1 37.5
10160.86 1 3.1 3.1 40.6
10379.39 1 3.1 3.1 43.8
10629.08 1 3.1 3.1 46.9
10883.33 1 3.1 3.1 50.0
10950.38 1 3.1 3.1 53.1
11057.31 1 3.1 3.1 56.3
11517.72 1 3.1 3.1 59.4
11927.11 1 3.1 3.1 62.5
11938.09 1 3.1 3.1 65.6
12241.14 1 3.1 3.168.8
12246.82 1 3.1 3.1 71.9
12533.91 1 3.1 3.1 75.0
12798.33 1 3.1 3.1 78.1
13250.60 1 3.1 3.1 81.3
12

13660.74 1 3.1 3.1 84.4
13942.59 1 3.1 3.1 87.5
14264.18 1 3.1 3.1 90.6
16980.90 1 3.1 3.1 93.8
18020.56 1 3.1 3.1 96.9
21257.32 1 3.1 3.1 100.0
Total 32 100.0 100.0
Appendix Data 3
REGRESSION
/DESCRIPTIVES MEAN STDDEV CORR SIG N
/MISSING LISTWISE
13

/STATISTICS COEFF OUTS R ANOVA
/CRITERIA=PIN(.05) POUT(.10)
/NOORIGIN
/DEPENDENT BANKEX
/METHOD=ENTER SENSEX.
Regression
[DataSet0]
Variables Entered/Removedb
Model Variables Entered Variables Removed Method
1 SENSEXa . Enter
a. All requested variables entered.
b. Dependent Variable: BANKEX
14
Model Summary
Model R R Square Adjusted R Square Std. Error of the Estimate
1 .958a .918 .916 1050.05469
a. Predictors: (Constant), SENSEX

ANOVAb
Model Sum of Squares df Mean Square F Sig.
1 Regression 3.718E8 1 3.718E8 337.213 .000a
Residual 33078445.252 30 1102614.842
Total 4.049E8 31
a. Predictors: (Constant), SENSEX
b. Dependent Variable: BANKEX
Coefficientsa
Model
Unstandardized CoefficientsStandardized Coefficients
t Sig.B Std. Error Beta
1 (Constant) -4129.598 846.251 -4.880 .000
SENSEX .856 .047 .958 18.363 .000a. Dependent Variable: BANKEX
15
Bibliography
BSE BANKEX, BSE Banking Index, Bank Shares, Commentary, Stock Quotes-Banknet India. 2014. BSE BANKEX, BSE Banking Index, Bank Shares, Commentary, Stock Quotes-Banknet India. [ONLINE] Available at: http://www.banknetindia.com/stock/bankexabt.htm. [Accessed 10 December 2014].
BSE-Introduction . 2014. BSE-Introduction. [ONLINE] Available at: http://www.bseindia.com/static/about/introduction.aspx?expandable=0. [Accessed 10 December 2014].
BSE/NSE, India Stock Market Recommendations, Live Stock Markets, Sensex/Nifty, Commodity Market, Financial News, Mutual Funds. 2014. BSE/NSE, India Stock Market Recommendations, Live Stock Markets, Sensex/Nifty, Commodity Market, Financial News, Mutual Funds. [ONLINE] Available at: http://www.indiainfoline.com/research/sectorindices/bse/bse-bankex. [Accessed 10 December 2014].
Sensex Definition | Investopedia. 2014. Sensex Definition | Investopedia. [ONLINE] Available at: http://www.investopedia.com/terms/s/sensex.asp. [Accessed 10 December 2014].
Index Composition Bse, Stock/Share Indices, Sensex Indices, Composition Index, Stocks Gain / Lost. 2014. Index Composition Bse, Stock/Share Indices, Sensex Indices, Composition Index, Stocks Gain / Lost. [ONLINE] Available at: http://www.moneycontrol.com/stocks/marketstats/indexcomp.php?optex=BSE&opttopic=indexcomp&index=4. [Accessed 10 December 2014].
16
Related Documents