ADDENDUM DATED 29 SEPTEMBER 2017 If you are in any doubt about any of the contents of this document, you should obtain independent profes- sional advice. Hong Kong Exchanges and Clearing Limited (“HKEX”), The Stock Exchange of Hong Kong Limited (the “Stock Exchange”) and Hong Kong Securities Clearing Company Limited (“HKSCC”) take no responsibil- ity for the contents of this document, make no representation as to its accuracy or completeness and ex- pressly disclaim any liability whatsoever for any loss howsoever arising from or in reliance upon the whole or any part of the contents of this document. Non-collateralised Structured Products Addendum to the Base Listing Document dated 18 August 2017 relating to Structured Products to be issued by Bank Vontobel AG (incorporated in Zurich, Switzerland) unconditionally and irrevocably guaranteed by Vontobel Holding AG (incorporated in Zurich, Switzerland) Sponsor Vontobel Limited This addendum (the “Addendum”) is a supplement to and should be read in conjunction with our base listing document dated 18 August 2017 (the “Base Listing Document”). This addendum for which Bank Vontobel AG (the “Issuer”) and Vontobel Holding AG (the “Guarantor”) accept full responsibility, includes particulars given in compliance with the Rules Governing the Listing of Securities on The Stock Exchange of Hong Kong Limited (the “Listing Rules”) for the purpose of giving information with regard to us, the Guarantor and our derivative warrants (the “Warrants”), callable bull/bear contracts (the “CBBCs”) and other structured products (the Warrants, the CBBCs and such other structured products are, collectively, the “Structured Products”) to be listed on the Stock Exchange from time to time. You must read this Addendum in conjunction with the Base Listing Document. Our obligations under the Structured Products are guaranteed by the Guarantor under a guarantee executed by the Guarantor dated as of 18 August 2017 (the “Guarantee”). We and the Guarantor, having made all reasonable enquiries, confirm that to the best of our knowledge and belief the information contained in this document is accurate and complete in all material respects and not misleading or deceptive, and there are no other matters the omission of which would make any statement herein or this document misleading. The Structured Products involve derivatives. Investors should not invest in the Structured Products unless they fully understand and are willing to assume the risks associated with them. Investors are warned that the price of the Structured Products may fall in value as rapidly as it may rise and holders may sustain a total loss of their investment. Prospective purchasers should therefore ensure that they understand the nature of the Structured Products and carefully study the risk factors set out in this document and, where necessary, seek professional advice, before they invest in the Structured Products. The Structured Products constitute our general unsecured contractual obligations and of no other person, and the Guarantee in respect of the Structured Products constitutes the general unsecured contractual obligations of the Guarantor and of no other person. The Structured Products will rank equally among themselves and with all our other unsecured obligations and all other unsecured obligations of the Guarantor (save for those obligations preferred by law) upon liquidation. If you purchase the Structured Products, you are relying upon our creditworthiness and the creditworthiness of the Guarantor and have no rights under the Struc-tured Products against (a) the company which has issued the underlying securities; (b) the trustee or the man-ager of the underlying unit trust; or (c) the index compiler of any underlying index. If we become insolvent or default on our obligations under the Structured Products or the Guarantor becomes insolvent or defaults on its obligations under the Guarantee, you may not be able to recover all or even part of the amount due under the Structured Products (if any). – 1 –

Welcome message from author
This document is posted to help you gain knowledge. Please leave a comment to let me know what you think about it! Share it to your friends and learn new things together.
Transcript

ADDENDUM DATED 29 SEPTEMBER 2017
If you are in any doubt about any of the contents of this document, you should obtain independent profes-sional advice.
Hong Kong Exchanges and Clearing Limited (“HKEX”), The Stock Exchange of Hong Kong Limited (the “Stock Exchange”) and Hong Kong Securities Clearing Company Limited (“HKSCC”) take no responsibil-ity for the contents of this document, make no representation as to its accuracy or completeness and ex-pressly disclaim any liability whatsoever for any loss howsoever arising from or in reliance upon the whole or any part of the contents of this document.
Non-collateralised Structured Products Addendum to the Base Listing Document dated 18 August 2017
relating to Structured Products to be issued by Bank Vontobel AG
(incorporated in Zurich, Switzerland)
unconditionally and irrevocably guaranteed by Vontobel Holding AG
(incorporated in Zurich, Switzerland)
Sponsor Vontobel Limited
This addendum (the “Addendum”) is a supplement to and should be read in conjunction with our base listing document dated 18 August 2017 (the “Base Listing Document”). This addendum for which Bank Vontobel AG (the “Issuer”) and Vontobel Holding AG (the “Guarantor”) accept full responsibility, includes particulars given in compliance with the Rules Governing the Listing of Securities on The Stock Exchange of Hong Kong Limited (the “Listing Rules”) for the purpose of giving information with regard to us, the Guarantor and our derivative warrants (the “Warrants”), callable bull/bear contracts (the “CBBCs”) and other structured products (the Warrants, the CBBCs and such other structured products are, collectively, the “Structured Products”) to be listed on the Stock Exchange from time to time. You must read this Addendum in conjunction with the Base Listing Document.
Our obligations under the Structured Products are guaranteed by the Guarantor under a guarantee executed by the Guarantor dated as of 18 August 2017 (the “Guarantee”). We and the Guarantor, having made all reasonable enquiries, confirm that to the best of our knowledge and belief the information contained in this document is accurate and complete in all material respects and not misleading or deceptive, and there are no other matters the omission of which would make any statement herein or this document misleading.
The Structured Products involve derivatives. Investors should not invest in the Structured Products unless they fully understand and are willing to assume the risks associated with them.
Investors are warned that the price of the Structured Products may fall in value as rapidly as it may rise and holders may sustain a total loss of their investment. Prospective purchasers should therefore ensure that they understand the nature of the Structured Products and carefully study the risk factors set out in this document and, where necessary, seek professional advice, before they invest in the Structured Products.
The Structured Products constitute our general unsecured contractual obligations and of no other person, and the Guarantee in respect of the Structured Products constitutes the general unsecured contractual obligations of the Guarantor and of no other person. The Structured Products will rank equally among themselves and with all our other unsecured obligations and all other unsecured obligations of the Guarantor (save for those obligations preferred by law) upon liquidation. If you purchase the Structured Products, you are relying upon our creditworthiness and the creditworthiness of the Guarantor and have no rights under the Struc-tured Products against (a) the company which has issued the underlying securities; (b) the trustee or the man-ager of the underlying unit trust; or (c) the index compiler of any underlying index. If we become insolvent or default on our obligations under the Structured Products or the Guarantor becomes insolvent or defaults on its obligations under the Guarantee, you may not be able to recover all or even part of the amount due under the Structured Products (if any).
– 1 –

IMPORTANT INFORMATION
You should carefully study the risk factors set out in this document and the Listing Documents
What is this document about?
This document is for information purposes only and does not constitute an offer, an advertisement or invita-tion to the public to subscribe for or to acquire any Structured Products.
What documents should you read before investing in the Structured Products?
A launch announcement and supplemental listing docu-ment of each series of Structured Products will set out the detailed commercial terms of the relevant series. You must read this Addendum together with the Base Listing Document (including any further addendum to it to be issued from time to time) together with such launch announcement and supplemental listing docu-ment (including this and any further addendum to such launch announcement and supplemental listing docu-ment to be issued from time to time) (together, the “Listing Documents”) before investing in any Struc-tured Products. You should carefully study the risk fac-tors set out in the Listing Documents.
Is there any guarantee or collateral for the Struc-tured Products?
Our obligations under the Structured Products are un-conditionally and irrevocably guaranteed by the Guaran-tor. If we become insolvent or default on our obliga-tions under the Structured Products and the Guarantor becomes insolvent or defaults on its obligations under the Guarantee, you can only claim as an unsecured cred-itor of the Issuer and the Guarantor. In such event, you may not be able to recover all or even part of the amount due under the Structured Products (if any).
What are the Guarantor’s credit ratings?
The Guarantor’s long term credit ratings as of the date immediately preceding the date of this document is:
Rating agency Rating
The credit ratings are only an assessment by the rating agencies of the Guarantor’s overall financial capacity to pay its debts respectively.
A3 is among the top three major credit rating categories and is the seventh highest investment-grade ranking of the ten investment-grade ratings (including 1, 2 and 3 sub-grades) assigned by Moody’s.
Please refer to the brief guide in Appendix 4 to the Base Listing Document to what such credit ratings mean.
Rating agencies usually receive a fee from the companies that they rate. When evaluating the Guarantor’s credit-worthiness, you should not solely rely on the Guaran-tor’s credit ratings because:
(a) a credit rating is not a recommendation to buy,sell or hold the Structured Products;
(b) credit ratings of companies may involve difficult-to-quantify factors such as market competition, thesuccess or failure of new products and marketsand managerial competence;
(c) a high credit rating is not necessarily indicative oflow risk. The Guarantor’s credit ratings as of theabove date are for reference only and may be sub-ject to change thereafter. Any downgrading of theGuarantor’s credit ratings could result in a reduc-tion in the value of the Structured Products;
(d) a credit rating is not an indication of the liquidityor volatility of the Structured Products; and
(e) a credit rating may be downgraded if the creditquality of the Guarantor declines.
Moody’s Investors Service, Inc. (“Moody’s”)
A3 (stable outlook)
The Structured Products are not rated.
The Guarantor’s credit ratings are subject to change or withdrawal at any time within each rating agency’s sole discretion. You should conduct your own research using publicly available sources to obtain the latest information with respect to the Guarantor’s credit ratings from time to time. You may visit https://www.vontobel.com/INT/EN/Investor-Relations-Credit-Ratings to obtain information about the credit ratings of the Guarantor.
– 2 –

Is the Issuer or the Guarantor regulated by the Hong Kong Monetary Authority referred to in Rule 15A.13(2) or the Securities and Futures Commission referred to in Rule 15A.13(3)?
The Issuer is subject to prudential supervision and regu-lated by the Swiss Federal Financial Markets Regulator (“FINMA”), while the Guarantor, as the parent group company, is subject to complementary, consolidated group supervision by FINMA. Neither the Issuer nor the Guarantor is regulated by the Hong Kong Monetary Authority referred to in Rule 15A.13(2) or the Securities and Futures Commission referred to in Rule 15A.13(3).
Is the Issuer or the Guarantor subject to any litiga-tion?
Save as disclosed in this document, the Issuer, the Guar-antor and their respective subsidiaries (“Vontobel Group”) are not aware of any litigation or claims of material importance pending or threatened against any of them.
Authorisation for the issue of the Structured Prod-ucts
The issue of the Structured Products was authorised by our board of directors on 28 January 2016.
Has the financial position of the Issuer or the Guar-antor changed since last financial year-end?
Save as disclosed in this document, there has been no material adverse change in the Issuer’s or the Guaran-tor’s financial or trading position since 31 December 2016.
Do you need to pay any transaction cost?
The Stock Exchange charges a trading fee of 0.005 per cent. and the Securities and Futures Commission (“SFC”) charges a transaction levy of 0.0027 per cent. in respect of each transaction effected on the Stock Exchange payable by each of the seller and the buyer and calculated on the value of the consideration for the Structured Products. The levy for the investor compen-sation fund is currently suspended.
Do you need to pay any tax?
You may be required to pay stamp duties, taxes and other charges in accordance with the laws and practices of the country of your purchase in addition to the issue price of each Structured Product. See the section headed “Taxation” in the Base Listing Document for further information.
Placing, sale and grey market dealings
No action has been or will be taken by us that would permit a public offering of any series of Structured Products or possession or distribution of any offering material in relation to any Structured Products in any
jurisdiction (other than Hong Kong) where action for the purpose is required. No offers, sales, re-sales, transfers or deliveries of any Structured Products, or distribution of any offering material relating to the Structured Products may be made in or from any jurisdiction except in cir-cumstances which will result in compliance with any applicable laws or regulations and which will not impose any obligation on us or the Guarantor. See the section headed “Placing and Sale” in the Base Listing Document for further information.
Following the launch of a series of Structured Products, we may place all or part of that series with our related party. The Structured Products may be sold to investors in the grey market in the period between the launch date and the listing date. We will report any dealings in Structured Products by any member of the Vontobel Group in the grey market to the Stock Exchange on the listing date through the website of the HKEX at www.hkex.com.hk.
Where can you inspect the relevant documents?
The following documents are available for inspection during usual business hours on any weekday (except public holidays) at Vontobel Limited, 1901 Gloucester Tower, The Landmark, 15 Queen’s Road Central, Hong Kong:
(a) our latest audited financial statements and interim orquarterly financial statements (if any)
(b) the Guarantor’s latest audited financial statementsand interim or quarterly financial statements (ifany);
(c) the consent letters from auditors of the Issuer andthe Guarantor, Ernst & Young Ltd (the “Auditors”);
(d) the Base Listing Document, this document and anyfurther addendum;
(e) the launch announcement and supplemental listingdocument as long as the relevant series of Struc-tured Products is listed on the Stock Exchange;
(f) the instrument executed by us on 18 August 2017which constitutes the Structured Products; and
(g) the Guarantee.
Requests for photocopies of the above documents will be subject to a reasonable fee which reflects the costs of making such copies.
The Listing Documents are also available on the website of the HKEX at http://www.hkex.com.hk/eng/dwrc/search/listsearch.asp and our website at www.vontobelwarrants.com. 各上市文件亦可於香港交易所網站(http://www.hkex.com.hk/chi/dwrc/search/listsearch_c.as p) 及我們的網站 (www.vontobelwarrants.com) 瀏覽。
– 3 –

How can you get further information about us and/or the Guarantor?
You may visit our website at https://www.vontobel.com/INT/EN/Home to obtain further information about us and/or the Guarantor.
You must note that the information on our website will be of a general nature and cannot be relied upon as accurate and/or correct and will not have been prepared exclusively for the purposes of any particular financial instrument issued by us, including the Structured Prod-ucts.
Governing law of the Structured Products
All contractual documentation for the Structured Prod-ucts will be governed by, and construed in accordance with, the laws of Hong Kong.
The Listing Documents are not the sole basis for making an investment decision
The Listing Documents do not take into account your investment objectives, financial situation or particular needs. Nothing in the Listing Documents should be construed as a recommendation by us, the Guarantor or our respective affiliates to invest in the Structured Products or the underlying asset of the Structured Prod-ucts.
No person has been authorised to give any information or to make any representations other than those con-tained in this document in connection with the Struc-tured Products, and, if given or made, such information or representations must not be relied upon as having been authorised by us or the Guarantor.
The Stock Exchange and HKSCC have made no as-sessment of, nor taken any responsibility for, our finan-cial soundness or the merits of investing in any Struc-tured Products, nor have they verified the accuracy or the truthfulness of statements made or opinions ex-pressed in this document.
– 4 –

Capitalised terms
Unless otherwise specified, capitalised terms used in this document have the meanings set out in the General Conditions set out in Appendix 1 of the Base Listing Document and the Product Conditions applicable to the relevant series of Structured Products set out in Appendices 2 and 3 of the Base Listing Document respectively (together, the “Conditions”).
– 5 –
– 6 –
TABLE OF CONTENTS
Page
EXHIBIT 1 — SUPPLEMENTAL INFORMATION ABOUT THE ISSUER AND THE GUARANTOR. . . . . . . . . . . . . . . . . . . . . . . . . . . . . . . . . . . . . . . . . . . . . . . . . . . .7
EXHIBIT 2 — THE ISSUER’S HALF-YEAR REPORT FOR THE SIX MONTHS ENDED 30 JUNE 2017 . . . . . . . . . . . . . . . . . . . . . . . . . . . . . . . . . . . . . . . . . . . . 8
EXHIBIT 3 — THE GUARANTOR’S HALF-YEAR REPORT FOR THE SIX MONTHS ENDED 30 JUNE 2017 . . . . . . . . . . . . . . . . . . . . . . . . . . . . . . . . . . . . . . . . . . . ..9
PARTIES . . . . . . . . . . . . . . . . . . . . . . . . . . . . . . . . . . . . . . . . . . . . . . . . . . . . . . . . . . . . . . . . . . . . . . Back Page

– 7 –
EXHIBIT 1 — SUPPLEMENTAL INFORMATION ABOUT THE ISSUER AND THE GUARANTOR
There is no supplemental information about the Issuer or the Guarantor.

– 8 –
EXHIBIT 2 — THE ISSUER’S HALF-YEAR REPORT FOR THE SIX MONTHS ENDED 30 JUNE 2017
This Exhibit contains our Half-Year Report 2017 as at and for the six-months ended 30 June 2017. References to page numbers on the pages in this Exhibit 2 are to the page numbers in our Half-Year Report 2017. Our Half-Year Report 2017 has been prepared in accordance with our usual accounting policies and procedures.

Half-Year Report 2017
Bank Vontobel AG, Zurich

This page has been left intentionally blank.

4 Balance sheet
5 Income statement
6 Where to find us
Content
Bank Vontobel AG, Zurich, Half-Year Report 2017 3

Balance sheet
Assets
30-06-17 31-12-16 Change to 31-12-16CHF 1'000 CHF 1'000 CHF 1'000 in %
Liquid assets 3,095,914 2,944,215 151,699 5.2 Amounts due from banks 1,004,563 1,358,212 (353,649) (26.0)Amounts due from securities financing transactions 933,402 823,059 110,343 13.4 Amounts due from customers 3,055,191 2,903,050 152,140 5.2 Mortgage loans 128,882 56,586 72,296 127.8 Trading portfolio assets 2,944,788 2,351,781 593,007 25.2 Positive replacement values of derivative financial instruments 395,037 398,941 (3,904) (1.0)Financial investments 1,823,758 2,043,271 (219,513) (10.7)Accrued income and prepaid expenses 87,239 89,934 (2,695) (3.0)Participations 8,489 8,489Tangible fixed assets 141,280 145,377 (4,096) (2.8)Other assets 725,723 285,180 440,543 154.5 Total assets 14,344,267 13,408,096 936,171 7.0
Liabilities
Amounts due to banks 992,389 1,227,334 (234,945) (19.1)Amounts due in respect of customer deposits 9,826,680 9,638,994 187,686 1.9 Trading portfolio liabilities 141,880 99,657 42,223 42.4 Negative replacement value of derivative financial instruments 688,193 587,872 100,322 17.1 Liabilities from other financial instruments at fair value 945,612 720,216 225,396 31.3 Accrued expenses and deferred income 113,099 148,956 (35,857) (24.1)Other liabilities 863,306 217,162 646,143 297.5 Provisions 135,300 133,704 1,597 1.2 Bank's capital 149,000 149,000Statutory capital reserve 98,768 98,768
of which tax-exempt capital contribution reserve 98,768 98,768Statutory retained earnings reserve 213,206 213,206Voluntary retained earnings reserve 57,600 57,600Profit carried forward 95,512 97,679 (2,167) (2.2)Six-month profit 23,722 17,948 5,774 32.2 Total liabilities 14,344,267 13,408,096 936,171 7.0
Off-balance sheet operations
Contingent liabilities 272,479 254,470 18,009 7.1 Irrevocable commitments 57,411 30,932 26,478 85.6
Half-Year Report 2017
4 Bank Vontobel AG, Zurich, Half-Year Report 2017

Income statement
30-06-17 30-06-16 Change to 30-06-16CHF 1'000 CHF 1'000 CHF 1'000 in %
Result from interest operationsInterest and discount income 18,990 16,150 2,840 17.6 Interest and dividend income from trading portfolio 38,612 34,851 3,761 10.8 Interest and dividend income from financial investments 14,409 14,038 371 2.6 Interest expense 2,701 502 2,199 438.2
Gross result from interest operations 74,712 65,540 9,171 14.0 Changes in value adjustments for default risks and losses and losses from interest operations (1,011) (1,144) 133 (11.7)
Subtotal net result from interest operations 73,701 64,396 9,305 14.4 Result from commission business and services
Commission income from securities trading and investment activi-ties 169,736 150,272 19,464 13.0 Commission income from lending activities 294 289 5 1.7 Commission income from other services 36,573 25,004 11,569 46.3 Commission expense (48,489) (40,058) (8,431) 21.0
Subtotal result from commission business and services 158,115 135,507 22,608 16.7 Result from trading activities and the fair value option 17,462 26,422 (8,960) (33.9)Other result from ordinary activities
Result from the disposal of financial investments 10,177 5,221 4,955 94.9 Income from participations 3,416 3,192 223 7.0 Other ordinary income 4,813 5,088 (275) (5.4)Other ordinary expenses (236) (236)
Subtotal other income from ordinary activities 18,170 13,502 4,668 34.6 Operating expenses
Personnel expenses (162,501) (151,568) (10,933) 7.2 General and administrative expenses (55,105) (56,209) 1,104 (2.0)
Subtotal operating expenses (217,607) (207,777) (9,829) 4.7 Value adjustments on participations and depreciation and amortisa-tion of tangible fixed assets and intangible assets (24,435) (25,035) 600 (2.4)Changes to provisions and other value adjustments, and losses (1,273) (4,973) 3,700 (74.4)
Operating result 24,133 2,041 22,092Extraordinary income 145 18,005 (17,859) (99.2)Taxes (557) (673) 116 (17.2)Six-month profit 23,722 19,373 4,349 22.4
Bank Vontobel AG, Zurich, Half-Year Report 2017 5

ZurichBank Vontobel AGGotthardstrasse 43CH-8022 ZürichTelephone +41 58 283 71 11vontobel.com
BaselBank Vontobel AGBasel BranchSt. Alban-Anlage 58CH-4052 BaselTelephone +41 58 283 21 11
BerneBank Vontobel AGBerne BranchSpitalgasse 40CH-3001 BerneTelephone +41 58 283 22 11
GenevaBanque Vontobel SA Geneva BranchRue du Rhône 31CH-1204 Geneva Telephone +41 58 283 25 00
LucerneBank Vontobel AGLucerne BranchSchweizerhofquai 3aCH-6002 LucerneTelephone +41 58 283 27 11
LuganoBank Vontobel AG Lugano BranchVia Feruccio Pelli 1CH-6900 LuganoTelephone +41 58 283 23 11
Where to find us
Where to find us
This report also appears in German. The German version is prevailing.
6 Bank Vontobel AG, Zurich, Half-Year Report 2017

Publishing-System
Multimedia Solutions AG, Zurich
Legal information
This Half-Year Report is intended solely for information purposes. The information and views contained in it do not constitute a request, offer or re-
commendation to use a service, to buy or sell investment instruments or to conduct other transactions. By their very nature, forward-looking state-
ments involve inherent risks and uncertainties, both general and specific, and risks exist that predictions, forecasts, projections and other outcomes
described or implied in forward-looking statements will not be achieved.
Bank Vontobel AG, Zurich, Half-Year Report 2017 7

Bank Vontobel AG, Gotthardstrasse 43, 8022 Zurich, Telephone +41 58 283 59 00, vontobel.com
This page has been left intentionally blank.

– 9 –
EXHIBIT 3 — THE GUARANTOR’S HALF-YEAR REPORT FOR THE SIX MONTHS ENDED 30 JUNE 2017
This Exhibit contains the Guarantor’s Half-Year Report 2017 as at and for the six-months ended 30 June 2017. References to page numbers on the pages in this Exhibit 3 are to the page numbers in the Guarantor's Half-Year Report 2017. The Guarantor's Half-Year Report 2017 has been prepared in accordance with the Guarantor's usual accounting policies and procedures.

Half-Year Report 2017
Vontobel Holding AG, Gotthardstrasse 43, 8022 Zurich, Telephone +41 58 283 59 00, vontobel.com

This report also appears in German. The German version is prevailing.

1Vontobel, Half-Year Report 2017
Half-Year Report 2017
Shareholders’ letter
Dear shareholders and clients
Vontobel delivered a solid result in the first half of 2017 in a market environment shaped by low interest rates and the passive behaviour of investors. We are continuing to achieve organic growth in our Swiss home market and foreign target markets. Our profitability is increasing – although we are faced with an ever fiercer competitive environment, resulting in general pressure on margins within our industry. At Vontobel, we are countering this trend by restricting our focus to selected markets and products while, at the same time, assigning a high level of importance to the improvement of internal efficiency. We want to continue pursuing this strategy of profitable growth through the remainder of 2017.
Our strategic planning process is based on a three-year cycle. The fact that we already reached our ambitious tar-gets for the 2014-2017 planning period during 2016 – even excluding positive exceptional impacts – is especially pleasing. With regard to the next planning period for the years 2017-2020, we are currently defining new and am-bitious targets and will provide detailed information about them on 31 August 2017. In parallel to the execution of this strategic planning process, we have sharpened our
positioning. At a time when our industry and the conduct of our clients can change with unusual rapidity due to new developments in the area of digitalization, it is of vital importance that we have a clear idea throughout our company of what we stand for, what we expect of our-selves and what our clients and investors can expect of Vontobel. This positioning process is underpinned by a new brand presence, which we will launch in September.
Good organic growthThe trust that our clients place in Vontobel is reflected by our profit and growth figures. For a meaningful compari-son with the first half of the previous year, two excep-tional items have to be considered: the non-recurrence from 2017 of dividend income (2016: CHF 7.0 million after tax) from Helvetia following the sale of this partici-pation in autumn 2016, as well as integration costs of CHF 4.6 million (after tax) following the acquisition of Vescore. On an adjusted basis, our result of CHF 106.1 million exceeded the adjusted net profit in the first half of 2016 (CHF 98.7 million) by 7%.
2 Vontobel, Half-Year Report 2017
Half-Year Report 2017
Asset Management was once again the main earnings driver among our individual businesses in the first half of 2017, producing a pre-tax profit of CHF 69.5 million (CHF 85.3 million). Wealth Management generated increased income despite the negative factors mentioned previ-ously, i.e. margin pressures, the impact of negative inter-est rates and the passive behaviour of investors. Pre-tax profit rose to CHF 38.4 million in the first half of 2017 (CHF 34.2 million). In Financial Products, we grew our pre-tax profit by an impressive 72% to CHF 51.5 million (CHF 30.0 million).
Inflows of new money and the positive performance of existing client assets – which reached a record CHF 207.7 billion at the end of the first half of 2017 (End of June 2016: CHF 179.3 billion) – form the basis of Vontobel’s good organic growth. The net inflow of new money at Group level was neutral at CHF 0.3 billion in the first half of 2017. We are attracting steady net inflows of new money in Wealth Management as well as in the Asset Management boutiques Fixed Income, Twenty Four Asset Management, Sustainable Investing and Multi Asset Class.
Wealth Management strategy continues to bear fruitIn the first half of 2017, Wealth Management continued to achieve organic growth that exceeded the benchmark and our target range. In particular, we achieved high net new money growth rates among wealth management clients in our home market of Switzerland, the Emerging markets and Italy, underscoring their confidence in our capabili-ties. In total, clients entrusted CHF 1.6 billion of new money to Wealth Management, corresponding to an an-nualized growth rate of 6.8%. As of 30 June 2017, Wealth Management had around CHF 50 billion of client assets. We believe that this positive trend is also attributable to the above-average performance achieved by our portfolio management mandates – especially the Focus Mandate Switzerland, which has generated a cumulative excess return of 49.4% since its launch in 2012.
This continued positive trend confirms that we are pursu-ing the right strategy in Wealth Management. In Switzer-land, we offer our clients our complete range of wealth management products and services. In selected foreign markets, we focus on assuming the role of a specialist that helps clients to achieve greater international diversifica-tion of their assets. In this context, we are actively captur-
ing the opportunities created by digitalization – whether it is to provide a better basis for decision-making in the area of advisory or digital solutions for an enhanced client experience. With our Private Banking App, which is now used by our clients in 20 countries, or with EAMNet, which is available to external asset managers, we are in a posi-tion to export our personal advice and expertise to our focus markets.
Looking ahead, Vontobel will strive to achieve further growth in Wealth Management – essentially with a focus on generating growth organically by hiring new relation-ship managers. On the client side, we want to further intensify our dialogue with clients based on the new requirements resulting from MiFID II, which have been comprehensively implemented at Vontobel. In terms of our range of services for external asset managers, we will further expand our business in Asia and the US. However, Vontobel also continues to see opportunities to support organic growth on a targeted basis through value-creat-ing acquisitions in our home market.
Good performance – Asset Management focuses on qualityIn Asset Management, we are seeing the positive impact of the diversification strategy we have pursued in recent years. In the Quality Growth boutique, which remains highly profitable, we grew our assets under management to CHF 33.8 billion in the first half of 2017. The highly professional and extremely stable team led by our CIO Matthew Benkendorf is continuing to work very success-fully with an investment process that has proved effective for many years. In the first half of 2017, all the investment strategies in the Quality Growth boutique generated a significant outperformance. In the second quarter, emerging markets strategies also increased in popularity again among our international investors. Vontobel Asset Management has excellent capabilities in this promising investment category, both in the area of fixed income and equities. There were also positive developments in our partnership with Raiffeisen in the investment business, which resulted in notable inflows of assets. Asset Man-agement will continue to focus on performance and diver-sification in the second half of 2017. Vontobel is now also operating in the US through our successful London-based fixed income boutique TwentyFour Asset Management. We are responding to the trends that are visible in the area

3Vontobel, Half-Year Report 2017
of asset management – such as the general pressure on margins and passive portfolio management – through our positioning as a specialized high-conviction asset man-ager. We are convinced that active portfolio management creates added value – with greater benefits for our invest-ment clients.
Growth in Financial Products driven by innovation and expansionWe view innovation and digitalization as drivers of growth and therefore devote a very high level of attention to them at Vontobel. As part of this strategy, we launched the “Vontobel Investment Scout” app in the Swiss market in 2017, once again demonstrating our innovation leadership in the field of structured products. With this new app, private investors can – for this first time – create their own individual investment product on their smartphone. Over-all, Financial Products is very successful in the structured products business. Vontobel is number 2 in Switzerland, measured in terms of SIX trading volumes, and is one of the leading providers in Europe. We have further expanded our market share in Italy, the Nordics and Germany. In addition, we made our market debut in France and the Netherlands in the first half of 2017, thus capturing fur-ther growth potential.
In the second half of 2017, Financial Products will expand its footprint in Asia by establishing a presence in Hong Kong. This step shows how systematically Vontobel is pursuing its organic growth strategy on the basis of digital innovation and broad international expansion. Our priori-ties are to further strengthen our cost leadership and to harness economies of scale.
Solid capital positionOne of the main pillars of our successful growth is our solid BIS common equity tier 1 ratio (CET1 ratio) of 19.3%, which substantially exceeds the regulatory minimum re-quirement – allowing us to finance acquisitions. The return on equity was 12.9% in the first half of 2017, significantly exceeding the cost of capital and our own target return of over 10%.
2017 remains challengingEven if some of the uncertainty surrounding the future of Europe was dispelled as a result of the elections in the Netherlands and France in the first half of the year, we expect 2017 to remain challenging in view of the global geopolitical environment and the unchanged situation in the markets. Despite rising markets and continued low interest rates, investors are still adopting a wait-and-see approach. The pressure on margins is also generally evi-dent. As before, we anticipate that we will achieve a solid result for 2017. In contrast to 2016, we do not expect to record any larger exceptional impacts.
Vontobel is well positioned as an internationally active specialist focusing on the areas of Wealth Management, Asset Management and Financial Products. We intend to continue on our growth path and are gathering momen-tum for our next growth phase. This includes investing – even during challenging periods – in new talents and es-pecially in our employees, whom we owe considerable thanks for their hard work and commitment. We will also make further targeted use of the opportunities created by digitalization. In this context, we can benefit from our groundwork in recent years in the area of basic technol-ogy, which today allows us to rapidly and successfully offer digital solutions directly to our clients. We want to continue to capitalize on this advantage.
Vontobel remains Vontobel. This will also be reflected by our ambitious new mid-term targets and our sharper brand positioning. We have a clear compass that will continue to guide us in the future and that our clients and shareholders can count on. Thank you for your trust in Vontobel.
Herbert J. Scheidt Dr Zeno StaubChairman of the Board Chief Executive Officerof Directors

4 Vontobel, Half-Year Report 2017
Half-Year Report 2017
200
180
160
140
120
100
80
Vontobel Holding AG registered share (Total Return)
01-01-15 31-12-1530-06-15 30-06-1731-12-16
Swiss Performance Index (SPI) Source: Bloomberg
30-06-16
Performance of Vontobel Holding AG registered share (indexed)
Ratios
(6 months) 30-06-17 30-06-16 31-12-16Return on shareholders’ equity (ROE) (%)1 12.9 14.4 21.6Cost2/income ratio (%) 76.1 72.9 64.1Equity ratio (%) 7.2 7.7 7.8Basel III leverage ratio (%) 5.1 5.3 5.2
1 Group net profit annualized as a percentage of average equity based on monthly figures, both without minority interests2 Operating expense, excl. valuation adjustments, provisions and losses
Share data
(6 months) 30-06-17 30-06-16 31-12-16Basic earnings per share (CHF)1 1.78 1.87 2.85Diluted earnings per share (CHF)1 1.75 1.84 2.75Equity per share outstanding at balance sheet date (CHF) 27.31 25.50 27.65Price/book value per share 2.3 1.6 1.9Price/earnings2 per share 17.5 11.2 9.4Share price at balance sheet date (CHF) 62.30 42.05 53.45High (CHF) 63.45 49.00 54.15Low (CHF) 53.25 36.90 38.85Market capitalization nominal capital (CHF mn) 3,543.3 2,391.6 3,040.0Market capitalization less treasury shares (CHF mn) 3,458.0 2,325.8 2,927.4Undiluted weighted average number of shares 55,357,315 55,140,244 55,024,282
1 Basis: weighted average number of shares2 Annualized
Share information
Stock exchange listing SIX Swiss ExchangeISIN CH001 233 554 0Security number 1 233 554Par value CHF 1.00Bloomberg VONN SWReuters VONTZn.STelekurs VONN
BIS capital ratios
30-06-17 30-06-16 31-12-16CET1 capital ratio (%) 19.3 18.3 19.0CET1 capital (CHF mn) 1,088.4 976.8 1,018.4Risk weighted positions (CHF mn) 5,636.0 5,348.0 5,360.8
At present, Vontobel’s equity consists exclusively of Common Equity Tier 1 capital. Calculations are based on the fully applied Basel III framework.
Risk ratio
CHF mn 30-06-17 30-06-16 31-12-16Average Value at Risk market risk 2.5 2.8 2.7
Average Value at Risk 6 months for positions in the Financial Products business unit of the Investment Banking division. Historical simulation of Value at Risk; 99% confidence level; 1-day holding period; 4-year historical observation period.
Rating
30-06-17 30-06-16 31-12-16Moody’s Rating Bank Vontobel AG (long-term deposit rating) Aa3 Aa3 Aa3
Vontobel at a glance

5Vontobel, Half-Year Report 2017
Income statement
30-06-17 30-06-16 31-12-16 Change in % to(6 months) CHF mn CHF mn CHF mn 30-06-16Total operating income 517.5 496.8 584.3 4Operating expense 395.0 367.1 392.7 8Group net profit 101.5 105.7 158.7 (4)
of which allocated to minority interests 2.8 2.4 2.2 17of which allocated to the shareholders of Vontobel Holding AG 98.7 103.3 156.5 (4)
Segments (profit before taxes)
30-06-17 30-06-16 31-12-16 Change in % to(6 months) CHF mn CHF mn CHF mn 30-06-16Private Banking 27.1 26.6 20.6 2Asset Management 69.5 85.3 78.2 (19)Investment Banking 62.8 37.6 47.0 67Corporate Center (36.9) (19.8) 45.8
Balance sheet
30-06-17 30-06-16 31-12-16 Change in % toCHF mn CHF mn CHF mn 31-12-16
Total assets 21,166.1 18,389.9 19,393.9 9Shareholders’ equity (excl. minority interests) 1,515.7 1,410.4 1,514.1 0Loans 2,925.2 2,359.2 2,601.9 12Due to customers 9,638.0 8,720.1 9,058.5 6
Client assets
30-06-17 30-06-16 31-12-16 Change in % toCHF bn CHF bn CHF bn 31-12-16
Assets under management 146.5 127.8 138.5 6of which under discretionary management 95.1 84.9 90.2 5of which under non-discretionary management 51.4 42.9 48.3 6
Other advised client assets 11.0 6.4 10.4 6Structured products outstanding 7.2 5.9 6.4 13Total advised client assets 164.7 140.1 155.3 6Custody assets 43.0 39.2 40.1 7Total client assets 207.7 179.3 195.4 6
Net new money
CHF bn (6 months) 30-06-17 30-06-16 31-12-16Net new money 0.3 (8.7) (1.9)
Headcount (full-time equivalents)
Change in % to30-06-17 30-06-16 31-12-16 31-12-16
Number of employees Switzerland 1,315.5 1,201.3 1,347.0 (2)Number of employees abroad 327.4 293.1 327.4 0Total number of employees 1,642.9 1,494.4 1,674.4 (2)

6 Vontobel, Half-Year Report 2017
Half-Year Report 2017
Award-winning businesses
17
very goodEdition 12/2016
1. Private BanksPrivate-Banking-Rating
2014
In recent months, we once again received a number of in-dustry awards in recognition of our expertise across differ-ent businesses, which enables us to generate sustained value for our clients.
Following our top ranking in 2014, 2015 and 2016, we are back among the winners again in 2017, ranked as one of the leading private banks by the Swiss business magazine Bilanz.
Vontobel Mobile Private Banking rated among the top 3 leading online wealth management solutions worldwide by MyPrivateBanking in their study “Behind the Log-in 2017”.
Morningstar and Lipper named Vontobel Asset Manage-ment the leading provider in the category “Best EUR Corporate Bond Fund” for the second consecutive year.
In the Pension and Investment Provider Awards (PIPA), TwentyFour Asset Management was named best pro-vider in the category “Global Multi Asset Credit”. Vontobel Asset Management was named “Equity Man-ager of the Year” in the areas of Quality Growth and The-matic Investing in the UK Pension Awards.
TwentyFour Asset Management won the “Chief Invest-ment Officer Magazine’s 2016 European Innovation Award” for Fixed Income for the second consecutive time.
At the Swiss Derivative Awards 2017, Vontobel received the award for “Best Product On Alternative Underlyings ”, as well as ranking first in the category “Best Market Maker Leverage Products” for the fourth time and as“Top Ser-vice” for the seventh time in succession.
In the Extel Survey 2017, Vontobel’s Brokerage team took first place in the segment “Swiss Equities” for the seventh consecutive time.
7
Half-Year Report 2017
Vontobel, Half-Year Report 2017 7
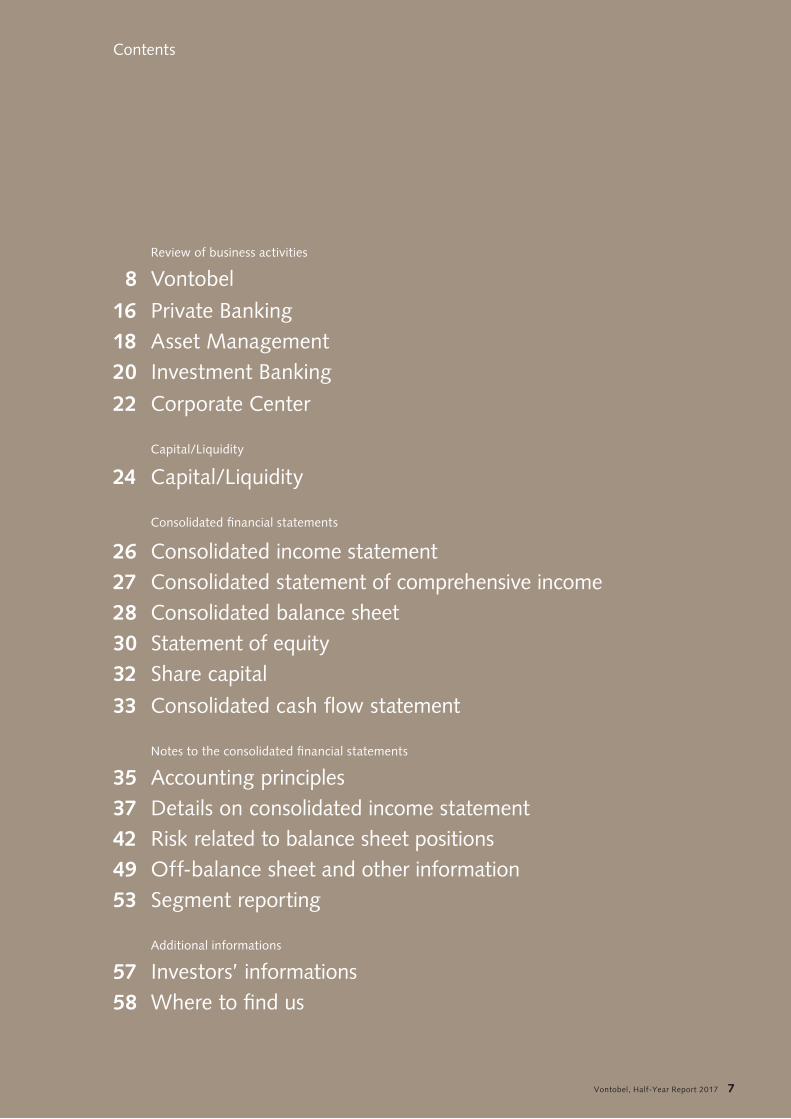
Contents
Review of business activities
8 Vontobel
16 Private Banking18 Asset Management20 Investment Banking
22 Corporate Center
Capital/Liquidity
24 Capital/Liquidity
Consolidated financial statements
26 Consolidated income statement 27 Consolidated statement of comprehensive income28 Consolidated balance sheet30 Statement of equity32 Share capital
33 Consolidated cash flow statement
Notes to the consolidated financial statements
35 Accounting principles37 Details on consolidated income statement42 Risk related to balance sheet positions49 Off-balance sheet and other information53 Segment reporting
Additional informations
57 Investors’ informations58 Where to find us

A solid result in a challenging environmentIn the first half of 2017, decisive elections halted the wave of populism directed against the European Union, thus removing significant sources of political and economic uncertainty in Europe in the short term. The generally brighter global economic outlook and the overall continu-ation of expansionary monetary policies – coupled with moderate inflationary pressures – provided a favourable backdrop for most equity markets, which experienced low levels of volatility. At the same time, interest rates in Switzerland and Europe remained at a very low level.
The finance industry is faced with increasingly fierce com-petition. The low interest rate environment and the trend towards passive investments are resulting in general pres-sure on margins. At the same time, preparations for MIFID II and the automatic exchange of information are leading to additional costs. In this environment, an ever greater focus is being placed on the generation of above-average performance for investors. As an established wealth and asset manager, Vontobel achieved success once again in the first half of 2017 thanks to its forward-looking busi-ness model and its focus on its own strengths – providing responsible advice, managing assets actively and deliver-ing tailor-made investment solutions for clients. The high level of trust that clients place in Vontobel and its success-ful positioning in the market are reflected by its solid net profit of CHF 101.5 million (CHF 1.78 per share), com-pared to CHF 105.7 million in the first half of 2016. On a comparable basis, i.e. excluding the Helvetia dividend of CHF 7.0 million after taxes last received by Vontobel in the first half of 2016 and excluding Vescore integration costs of CHF 4.6 million after taxes in the current year, Vontobel increased its net profit by 7% from the adjusted figure of CHF 98.7 million in the first half of 2016 to CHF 106.1 million (CHF 1.87 per share) in the first half of 2017. The return on equity was 12.9% on an annualized basis, once again significantly exceeding the cost of capital. Vontobel has maintained its comfortable equity position. The BIS common equity tier 1 ratio (CET1 ratio) remained very solid at 19.3% at the end of June 2017, substantially exceeding the regulatory minimum requirement for the total capital ratio of 12%.
Client assets exceed CHF 200 billion for the first time – good investment performanceIn recent years, Vontobel has invested systematically across all divisions in the targeted expansion of its activi-ties in its home market of Switzerland and its defined focus markets. This is now reflected by its client base, which has a good balance of private and institutional clients. Vontobel’s strategy proved successful in the first half of 2017, as it absorbed the impacts from the Quality Growth boutique – which was faced with exceptional circumstances following the departure of the former CIO and the “Trump effect” on the emerging markets that lasted until early 2017.
Total client assets reached a record CHF 207.7 billion at the end of June 2017, an increase of 6% compared to the end of 2016. Total advised client assets – which consist of assets under management, other advised client assets and structured products – rose by 6% to CHF 164.7 billion. The volume of total advised client assets is an important indicator for Vontobel in view of the significant value generated by these assets; Vontobel provides advisory services and/or has portfolio management agreements in place for these assets. Other advised client assets mainly comprise assets acquired in the context of the cooperation with the Australian banking group ANZ; Vontobel pro-vides advice on asset allocation to ANZ in respect of these assets. The volume of structured products outstanding rose by 13% to CHF 7.2 billion, reflecting the further strengthening of Vontobel Financial Products’ position in its Swiss home market and in European markets. Vontobel is a leader in terms of innovation and technology in the structured products and derivatives business and also demonstrates cost leadership as a result of its high vol-umes and efficient platform. Vontobel currently provides custody services to around 50 banks. Its custody assets of CHF 43.0 billion include the portfolios of Raiffeisen Switzerland, for which Vontobel provides custody and other services as part of their long-term partnership.
Vontobel
8 Vontobel, Half-Year Report 2017
Review of business activities

Client assets
CHF bn 30-06-17 30-06-16 31-12-16Assets under management 146.5 127.8 138.5Other advised client assets 11.0 6.4 10.4Structured products outstanding 7.2 5.9 6.4Total advised client assets 164.7 140.1 155.3Custody assets 43.0 39.2 40.1Total client assets 207.7 179.3 195.4
Assets under management grew to CHF 146.5 billion as of 30 June 2017, an increase of CHF 8.0 billion, or 6%, compared to the end of 2016. This growth was mainly attributable to good investment performance. The net inflow of new money totalled CHF 0.3 billion in the first six months of the year, as the CHF 2.1 billion net inflow of new money achieved across all divisions in the second quarter of 2017 more than offset outflows in the Quality Growth boutique in the first quarter, driven by exceptional factors. Overall, fluctuations in the exchange rates of foreign currencies against the Swiss franc had a negative impact of CHF 2.1 billion.
Development of assets under management
CHF bn 30-06-17 30-06-16 31-12-16Wealth Management 48.5 42.3 46.8
Private Banking 39.8 35.0 39.0External Asset Managers 8.7 7.3 7.8
Institutional clients 98.0 85.5 91.7Asset Management1 97.2 86.4 92.3Investment Banking2 3.7 2.5 3.1Corporate Center3 (2.9) (3.4) (3.7)
Total assets under management 146.5 127.8 138.5
1 Including intermediaries2 Excluding External Asset Managers3 Assets under management that are managed on behalf of other segments.
At the end of June 2017, CHF 48.5 billion of assets were entrusted to Vontobel by private clients (+4% compared to the end of December 2016), the highest-ever volume in Vontobel’s more than 90-year history. Institutional clients accounted for CHF 98.0 billion of assets, an increase of 7% compared to the end of 2016.
Development of net new money
CHF bn 6 months 30-06-17 30-06-16 31-12-16Wealth Management 1.6 1.0 1.2
Private Banking 1.0 0.9 1.1External Asset Managers 0.6 0.1 0.1
Institutional clients (1.3) (9.7) (3.1)Asset Management1 (1.7) (9.7) (3.5)Investment Banking2 0.4 0.0 0.4Corporate Center3 0.0 0.0 0.0
Total net new money 0.3 (8.7) (1.9)1 Including intermediaries2 Excluding External Asset Managers3 Net new money from assets that are managed on behalf of other segments.
The needs of all our clients are at the centre of our business philosophy and actions, as evidenced by our employees’ consistent focus on delivering service and performance. This philosophy – combined with our continued invest-ments in growth and in an efficient sales structure at a global and product-oriented level – form the basis for Vontobel’s long-term success. As a result, Vontobel once again generated considerable growth in new money of CHF 2.1 billion in the second quarter of 2017.
Vontobel Wealth Management has attracted an above-av-erage volume of new assets in recent years relative to its peers and has achieved this organically. In the period under review, Wealth Management once again recorded impressive growth in new money in our Swiss home mar-ket and our focus markets, where it produced an annual-ized growth rate of 6.8%. This is the result of Vontobel’s successful positioning in the wealth management sector, which is undergoing major structural changes. It also shows that our rigorous client focus and ongoing measures to strengthen our advisory expertise are bearing fruit.
In Asset Management, growth in new money of CHF 1.0 billion in the second quarter of 2017 partly offset the outflows in the first three months of the year. Significant inflows were generated in particular by fixed income products offered by the successful boutique TwentyFour Asset Management, which is continuing to achieve strong growth and is now active not only in our UK focus market but also in Continental Europe and the US. The Multi Asset Class and Sustainable Investing boutiques also generated strong inflows, and Raiffeisen’s investment business made a positive contribution to the acquisition of new money.
Vontobel, Half-Year Report 2017 9

Assets under management by investment category
in % 30-06-17 30-06-16 31-12-16Swiss equities 14 13 13Foreign equities 37 40 39Bonds 31 29 30Alternative investments 3 3 3Liquid assets, fiduciary investments 11 11 11Other1 4 4 4
1 Including structured products
The structure of assets by investment category reflects the systematic diversification of the Asset Management boutiques as well as changes in the Quality Growth bou-tique, which is focused on equity strategies. As a result, the proportion of fixed income securities increased by a further one percentage point during the period under review, while the weighting of foreign equities continued to decline slightly. The proportion of liquid assets and fiduciary investments was unchanged at 11% of Group assets under management, demonstrating the continued strong preference for low-risk investments and cash among private clients.
Assets under management by currency
in % 30-06-17 30-06-16 31-12-16CHF 26 25 27EUR 22 20 22USD 30 29 28GBP 8 8 7Other 14 18 16
Our investment expertise is geared towards our interna-tional client base – as reflected by our broadly diversified allocation of assets under management in terms of cur-rencies. In the first half of 2017, the proportion of invest-ments in US dollars and in British pounds increased, while the proportion in euro remained stable. In contrast, the proportion of investments in Swiss Francs and other currencies (mainly the Indian rupee and the Hong Kong dollar) decreased slightly.
Organic growth and investments in the futureIn recent years, Vontobel has successfully transformed itself from a financial institution that focused predomi-nantly on the Swiss market into an established and glob-ally active wealth and asset manager. This is demonstrated not only by our international client base, the successful international expansion of Financial Products and the balanced structure of assets under management in terms of currencies but also by the significant contribution from fee and commission income, which accounted for almost two-thirds of operating income of over CHF 500 million in the period under review.
Net fee and commission income grew by 2% to CHF 333.6 million compared to the first half of 2016, driven by the further strengthening of Vontobel’s market position as well as an upturn in volumes in some financial markets, resulting in a 6% rise in brokerage volumes and an CHF 8.2 million increase in income from corporate finance. Due to changes in the composition of assets – with an increased focus on fixed income securities – and general pressure on margins, advisory and management fees decreased by 2% to CHF 268.1 million, while average assets under manage-ment grew by 8% over the same period. Custody fees rose by 5% to CHF 77.5 million compared to the first half of 2016.
At CHF 143.5 million, trading income exceeded the strong result for the first half of 2016 by 20% after Vontobel gained further market share in Switzerland and interna-tional markets. Vontobel’s trading income mainly com-prises income from the issuing, market making and hedg-ing of structured products and warrants – represented by the total of “Securities” and “Other financial instruments at fair value”. In the period under review, these activities contributed CHF 133.1 million (+29%) to trading income. Income from forex and precious metals trading decreased by 34% to CHF 10.4 million.
10 Vontobel, Half-Year Report 2017
Review of business activities

Managing the bank’s balance sheet while maintaining a conservative risk profile is especially challenging in the current environment of extremely low or negative interest rates. Compared to the previous year, loans to clients rose by 24% to almost CHF 3 billion. As a result, interest income from financial instruments at amortized cost increased by 36% to CHF 23.2 million. In contrast, the 69% reduction in dividend income from available-for-sale financial assets to CHF 3.4 million was attributable to the non-recurrence of the dividend from the participation in
Helvetia, which was sold at the end of 2016. In the previous year, Vontobel received a dividend of CHF 7.6 million. Fur-thermore, in Treasury it was not possible to reinvest the capital from maturing bonds at the same attractive condi-tions and this also had a negative impact on interest income. In total, net interest income declined by 12% to CHF 34.7 million. Other income decreased by 43% to CHF 5.7 million, reflecting significantly lower income from the sale of treasury assets (available-for-sale financial as-sets) of CHF 3.5 million (first half of 2016: CHF 8.1 million).
Structure of the income statement
30-06-17 30-06-17 30-06-16 31-12-16(6 months) CHF mn in %1 in %1 in %1
Net interest income 34.7 7 8 5Fee and commission income 333.6 64 66 55Trading income 143.5 28 24 22Other income 5.7 1 2 18Total operating income 517.5 100 100 100
Personnel expense 262.1 50 48 42General expense 101.8 20 19 16Depreciation, amortization 29.7 6 6 6Valuation adjustments, provisions and losses 1.4 0 1 3Operating expense 395.0 76 74 67
Taxes 21.0 4 5 6Group net profit 101.5 20 21 27
1 Share of operating income
Investments in new markets, talent, technology and our brand in order to generate growth are reflected by the development of operating expense, which rose by 8% to CHF 395.0 million compared to the first half of 2016. This also includes expenses of CHF 5.1 million before taxes re-lated to the Vescore integration. Personnel expense – the largest cost component – increased by 10% to CHF 262.1 million due to the growth in headcount. At the end of June 2017, Vontobel employed 1,643 full-time equivalents, an increase of 149 (+10%) compared to 30 June 2016.
General expense rose by 9% to CHF 101.8 million. This increase was mainly driven by higher expenses for IT and telecommunications, as well as for travel and representa-tion, public relations and marketing – including the planned implementation in the second half of 2017 of our branding initiative, which will reflect our sharper brand positioning.
Vontobel, Half-Year Report 2017 11

Capital expenditure and depreciation
CHF mn (6 months) 30-06-17 30-06-16 31-12-16Capital expenditure 21.8 13.2 28.9Depreciation 29.7 29.9 32.4
Depreciation of property, equipment and intangible assets decreased by 1% to CHF 29.7 million, as planned. Capital expenditure totalled CHF 21.8 million in the period under review, mainly comprising IT investments related to our digitalization strategy.
In view of the continued challenging market environment and the resulting latent pressure on margins within the industry, as well as the shift of weightings within our busi-ness model, Vontobel’s income base proved very resilient. At the same time, Vontobel invested in future growth, resulting in a slight reduction in operating efficiency. The cost/income ratio rose to 76.1%.
Pre-tax profit declined by 6% to CHF 122.5 million com-pared to the strong result for the first half of 2016. The tax charge decreased by 13% to CHF 21.0 million; the tax rate was 17.1%, compared to 18.5% in the first half of 2016.
Net profit after taxes totalled CHF 101.5 million (–4%) and basic earnings per share were CHF 1.78 (–5%). On a comparable basis, i.e. excluding the Helvetia dividend last received in the first half of 2016 and excluding Vescore integration costs in the current year, Vontobel increased its net profit by 7% from the adjusted figure of CHF 98.7 million in the first half of 2016 to CHF 106.1 million in the first half of 2017. A respectable return on equity of 12.9% was generated in the first half of 2017.
As a wealth and asset manager with an international client structure and strong roots in its Swiss home market, Vontobel is systemically affected by the strong Swiss franc, like companies in the Swiss export industry. The proportion of income and costs generated in US dollars decreased further in the first half of 2017. As a result, 46% of income and 78% of operating expense at Vontobel were generated in Swiss francs. The US dollar continued to represent the second most important currency, account-ing for 28% of income and 10% of operating expense. This was followed by the euro, with 16% of income and 8% of costs.
Structure of income statement by currency
in % 30-06-17 30-06-16 31-12-16Operating incomeCHF 46 43 49EUR 16 14 13USD 28 33 29GBP 5 5 4Other 5 5 5Operating expenseCHF 78 76 77EUR 8 6 7USD 10 14 12GBP 3 3 3Other 1 1 1
Divisional results reflect Vontobel’s strong positioning as a wealth and asset manager as well as the successful expansion of Financial Products
Profit before taxes by segment
CHF mn (6 months) 30-06-17 30-06-16 31-12-16Private Banking 27.1 26.6 20.6Asset Management 69.5 85.3 78.2Investment Banking 62.8 37.6 47.0
of which External Asset Managers 11.3 7.6 7.7
Corporate Center (36.9) (19.8) 45.8Total 122.5 129.7 191.6
In the Private Banking division, the asset base grew signif-icantly thanks to the acquisition of new client assets and an impressive investment performance. The continued strength of the Swiss franc, general pressure on margins, and investments in future growth once again had a nega-tive impact on the result in the period under review. Private Banking nevertheless delivered a slight increase in pre-tax profit to CHF 27.1 million (+2%).
In Asset Management, strong investment performance and high product and service quality, as well as a success-ful diversification strategy, are the hallmarks of the busi-ness. In the first half of 2017, Asset Management was once again the main earnings driver at Vontobel, contributing CHF 69.5 million to its pre-tax profit.
12 Vontobel, Half-Year Report 2017
Review of business activities

The Financial Products business in Investment Banking has, for years, demonstrated a high level of innovation as well as technology and cost leadership while maintaining its close proximity to clients. It has successfully established itself as one of the leading providers of structured prod-ucts and derivatives in Europe. In the first half of 2017, Investment Banking delivered a significant increase in pre-tax profit (+67%) to CHF 62.8 million as a result of further market share gains in Financial Products as well as the good performance of Corporate Finance and Brokerage. Financial Products accounted for nearly one-third of Vontobel’s pre-tax profit (excluding the Corporate Center) in the first half of 2017. Wealth & Asset Management (Private Banking, Asset Management and the External Asset Managers business) contributed 68% of the pre-tax profit generated by the divisions.
The result for the Corporate Center declined, reflecting the negative impact of the non-recurrence of the dividend from the participation in Helvetia, which was sold at the end of 2016, as well as Vescore integration costs of CHF 4.6 million after taxes.
Conservative risk managementVontobel remains committed to a conservative risk man-agement approach. This is reflected by the further decrease in average Value at Risk in the Financial Products business to CHF 2.5 million in the first half of 2017, compared to CHF 2.8 million in the first half of 2016 and CHF 2.7 million in the second half of 2016. At CHF 1.5 million, the equity component accounted for the largest proportion of Value at Risk this time, while the interest rate component, which mainly reflects credit spread risks in the bond portfolio, accounted for CHF 1.2 million of Value at Risk.
Value at Risk (VaR) for the positions of Financial Products
CHF mn 30-06-17 30-06-16 31-12-16Equities 1.5 1.4 1.3Interest rates 1.2 2.3 2.0Currencies 0.9 0.5 0.5Commodities 0.8 1.5 0.9Diversification effect (1.9) (2.9) (2.0)Total 2.5 2.8 2.7
Average Value at Risk (6 months) for positions in the Financial Products business unit of the Investment Banking division. Historical simulation of Value at Risk; 99% confidence level; 1-day holding period; 4-year historical observation period.
Continued comfortable capital positionVontobel has maintained its comfortable equity position. At 30 June 2017, the BIS common equity tier 1 ratio (CET1 ratio) was 19.3%. This represents a very good level in an industry comparison and substantially exceeds the regula-tory minimum requirement.
Consolidated shareholders’ equity was CHF 1.52 billion, in line with the level at the end of 2016. Vontobel’s very solid capital position is also reflected by its equity ratio of 7.2% and a leverage ratio under Basel III of 5.1%. Furthermore, Vontobel’s balance sheet can be described as highly liquid, since the liquidity coverage ratio averages 194.1% and thus significantly exceeds the minimum requirement of 80% defined by FINMA for 2017.
Total assets grew by 9% to CHF 21.2 billion in the first six months of 2017 due to the expansion of the business. On the liabilities side of the balance sheet, client deposits rose by CHF 0.6 billion to CHF 9.6 billion, while liabilities from the structured products business rose by 13% from CHF 6.4 billion to CHF 7.2 billion. On the assets side of the balance sheet, there was a slight increase in cash to CHF 6.5 billion. Trading portfolio assets and financial assets at fair value held for hedging purposes grew signif-icantly by 22% and 28%, respectively. Loans to clients totalled almost CHF 3 billion, an increase of 12% from the end of 2016.
Vontobel, Half-Year Report 2017 13

Allocation of regulatory capital required (BIS) as of 30 June 2017
CHF mn Credit risks Market risksOperational
risksGoodwill
etc. TotalPrivate Banking 33.5 0.0 35.5 76.2 145.2Asset Management 9.5 0.0 62.3 198.2 270.0Investment Banking 33.3 139.2 38.8 (1.4) 209.9Corporate Center 31.2 62.1 5.5 0.0 98.8Total 107.5 201.3 142.1 273.0 723.9
Of the total regulatory capital of CHF 723.9 million re-quired under BIS rules (31-12-16: CHF 703.9 million), 37%
96% of client assets come from Swiss home market and international focus markets
was allocated to Asset Management, 29% to Investment Banking and 20% to Private Banking.
Client assets by client domicile as of 30 June 2017
CHF bnAssets under management
Other advised client assets
Structured products
outstandingTotal advised client assets
Custody assets
Total client assets
Home marketSwitzerland1 63.0 0.4 5.7 69.1 42.6 111.7
Focus marketsGermany 13.7 4.0 1.5 19.2 0.0 19.2Italy 8.6 0.0 0.0 8.6 0.0 8.6UK 15.1 0.0 0.0 15.1 0.0 15.1US 18.9 0.0 0.0 18.9 0.0 18.9Emerging Markets2 19.2 6.4 0.0 25.6 0.0 25.6
Other markets 8.0 0.2 0.0 8.2 0.4 8.6Total client assets 146.5 11.0 7.2 164.7 43.0 207.7
1 Including Liechtenstein2 Asia Pacific region, CEE, LATAM, Middle East, Africa
At 30 June 2017, 54% of client assets comprised the assets of clients domiciled in Switzerland, underscoring the high level of confidence that clients in our home market have in Vontobel’s expertise and financial solidity. Today, 96% of our client assets come from our Swiss home market and
focus markets. With the exception of Emerging Markets, we succeeded in growing our asset base in all our markets in the first half of 2017 as a result of positive performance and the inflow of new money.
14 Vontobel, Half-Year Report 2017
Review of business activities
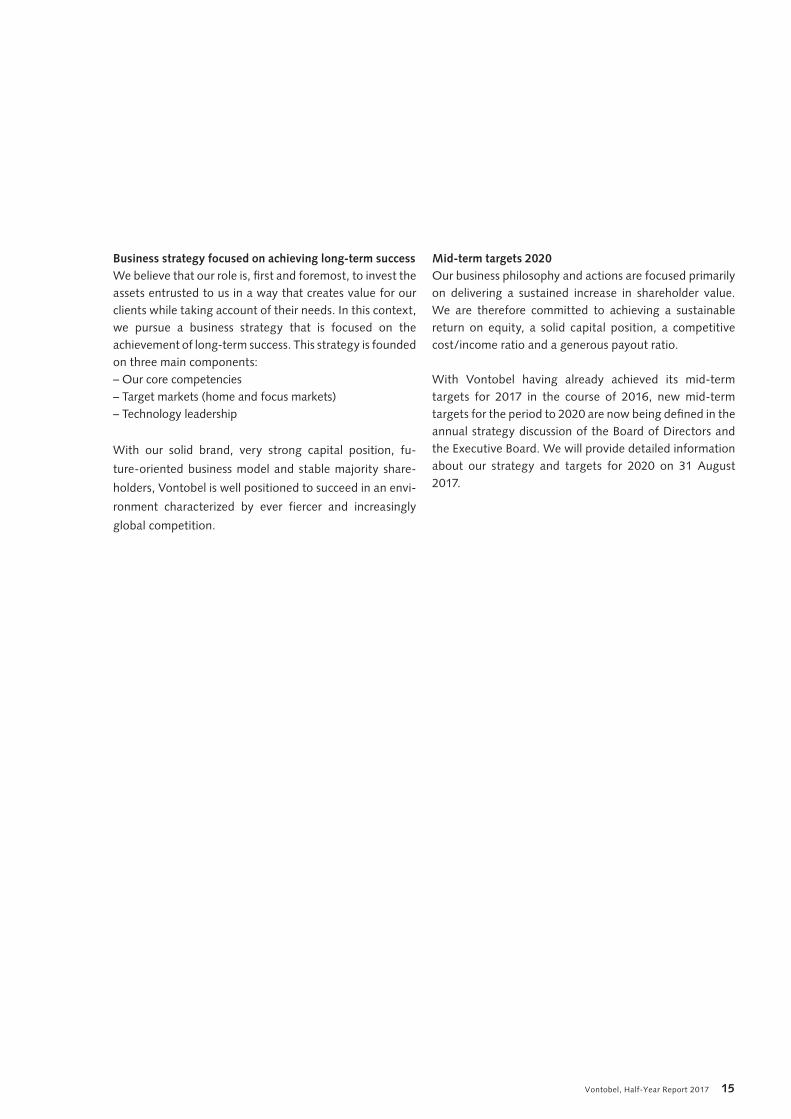
Business strategy focused on achieving long-term successWe believe that our role is, first and foremost, to invest the assets entrusted to us in a way that creates value for our clients while taking account of their needs. In this context, we pursue a business strategy that is focused on the achievement of long-term success. This strategy is founded on three main components:– Our core competencies– Target markets (home and focus markets)– Technology leadership
With our solid brand, very strong capital position, fu-
ture-oriented business model and stable majority share-
holders, Vontobel is well positioned to succeed in an envi-
ronment characterized by ever fiercer and increasingly
global competition.
Mid-term targets 2020Our business philosophy and actions are focused primarily on delivering a sustained increase in shareholder value. We are therefore committed to achieving a sustainable return on equity, a solid capital position, a competitive cost/income ratio and a generous payout ratio.
With Vontobel having already achieved its mid-term targets for 2017 in the course of 2016, new mid-term targets for the period to 2020 are now being defined in the annual strategy discussion of the Board of Directors and the Executive Board. We will provide detailed information about our strategy and targets for 2020 on 31 August 2017.
Vontobel, Half-Year Report 2017 15

Private Banking
Our business philosophy and actions centre on the needs of our clients and on ensuring they are satisfied with our of-fering. We strive to deliver the highest standards of Swiss quality when advising our clients. With our family share-holders, who have a long-term commitment to Vontobel, as well as our strong capital position and the transparency we must provide as a listed company, we are a trusted and unique partner to our clients. Swiss clients benefit from our comprehensive advice and services, ranging from portfolio management and specific investment recommendations to wealth planning, tax planning and various financing solu-tions. In the case of our international clientele, our mar-ket-specific offerings primarily give them opportunities for global wealth diversification based on our active, broadly diversified investment strategy and our expertise as an integrated wealth and investment manager.
Our relationship managers have a pivotal role to play in the provision of high-quality service. We invest in their advisory expertise and in their knowledge of the financial markets as well as our products and solutions. In 2017, Vontobel Private Banking was assigned a top-three place in the “Bilanz Pri-vate Banking Rating” by the Swiss business magazine Bilanz for the fourth year in succession, demonstrating our client focus and attractive offering. In addition, the results of the client survey we conducted at the end of 2016 revealed a very pleasing increase in client satisfaction since 2013.
In the move towards increased digitalization, we have sig-nificantly expanded our client offering. Today, Vontobel cli-ents in all relevant countries can access our market-specific services via “Vontobel Mobile Private Banking” – a solution for smartphones, tablets and computers. This solution pro-vides investment information and ideas, portfolio access, trading functions and access to all banking documents. It also allows clients to engage with their relationship man-ager securely. Vontobel clients now enjoy continuous and uniform access to all the functions available in their specific market across all channels. “Vontobel Mobile Private Bank-ing” is today a pioneering solution in our peer group. In March 2017, the digital solution “Vontobel Mobile Private Banking” was assigned the number three ranking globally among online wealth management solutions for ultra-high-net-worth and high-net-worth individuals by the renowned research institute MyPrivateBanking. We want to defend the competitive advantage this gives us and will therefore continue to develop our digital channel in the future.
After taking profitability in Vontobel Private Banking to a new level in 2013 by focusing our activities, we have since made effective use of our new earning power to expand our business organically. In 2017, we have continued to deliver above-market growth – thus maintaining the trend in recent years – thanks to our excellent positioning. At 5.1%, the annualized growth in new money was above our own target range of 3–5% and was thus significantly above the market growth rate. Our high level of invest-ment expertise is reflected by the impressive performance of client portfolios with asset management mandates, of which 69% outperformed their benchmarks in the period under review. In total, clients in Private Banking entrusted us with CHF 41.2 billion of assets, an increase of 3% com-pared to the end of 2016, as Vontobel gained further mar-ket share. Overall, the number of relationship managers amounted to 186 FTE, further hires are planned for the second half of the year. In addition, we are carefully eval-uating possible acquisitions to complement our organic growth.
Despite historically low interest rates and continued low levels of client activity, operating income rose to CHF 132.0 million. The result continues to be negatively im-pacted by the strong Swiss franc, general pressure on mar-gins, and investments in future growth. Private Banking nevertheless generated a slight improvement (+2%) in pre-tax profit to CHF 27.1 million.
Vontobel Private Banking is committed to protecting and building the assets entrusted to it and therefore offers clients long-term and forward-looking advice across the generations, with a focus on individual solutions. Our offering encompasses a wide variety of services – from portfolio management and active investment advisory to integrated financial advice, inheritance planning and financing solutions. Through our integrated business model, private clients also benefit from access to the proven expertise of the Asset Management and Invest-ment Banking divisions. Vontobel Private Banking has a presence in Zurich, Basel, Berne, Geneva, Lugano, Lucerne, Vaduz, Munich, Hamburg and Hong Kong. It is also present in New York and Dallas through its SEC-reg-istered company Vontobel Swiss Wealth Advisors AG.
16 Vontobel, Half-Year Report 2017
Review of business activities

Segment results
30-06-17 30-06-16 31-12-16 Change to 30-06-16(6 months) CHF mn CHF mn CHF mn CHF mn in %Net interest income 16.0 11.9 13.4 4.1 34Other operating income 116.0 110.7 108.3 5.3 5Operating income 132.0 122.6 121.7 9.4 8Personnel expense 55.4 49.6 54.5 5.8 12General expense 7.7 6.2 7.4 1.5 24Services from/to other segment(s) 40.0 38.5 36.9 1.5 4Depreciation of property, equipment and intangible assets 1.5 1.5 1.6 0.0 0Valuation adjustments, provisions and losses 0.3 0.2 0.7 0.1 50Operating expense 104.9 96.0 101.1 8.9 9Segment profit before taxes 27.1 26.6 20.6 0.5 2
Key figures
in % 30-06-17 30-06-16 31-12-16Cost1/income ratio 79.2 78.1 82.5Change of assets under management 2.1 2.3 11.4
of which net new money 2.6 2.6 3.1of which change in market value 0.8 (0.3) 8.3of which other effects (1.3)2 0.0 0.0
Operating income/average assets under management (bp)3,4 67 71 67Profit before taxes/average assets under management (bp)3,4 14 15 11
Client assets
30-06-17 30-06-16 31-12-16 Change to 31-12-16CHF bn CHF bn CHF bn CHF bn in %
Assets under management 39.8 35.0 39.0 0.8 2Other advised client assets 1.4 1.0 1.0 0.4 40Total advised client assets 41.2 36.0 40.0 1.2 3Average assets under management4 39.4 34.4 36.6 2.8 8
Net new money
CHF bn (6 months) 30-06-17 30-06-16 31-12-16Net new money 1.0 0.9 1.1
Personnel
Change to 31-12-1630-06-17 30-06-16 31-12-16 in %
Employees (full-time equivalents) 390.3 369.2 387.0 3.3 1of which relationship managers 186.4 187.2 199.0 (12.6) (6)
1 Operating expense excl. valuation adjustments, provisions and losses2 The decrease in assets under management reflects the reclassification of certain assets (CHF 0.5 bn) that are not held for investment purposes.3 Annualized4 Calculation based on average values for individual months
Vontobel, Half-Year Report 2017 17

The growth achieved by Vontobel Asset Management in re-cent years has far exceeded the market average. Income has almost doubled from the first half of 2011 to the first half of 2017. Over the same period, Asset Management has gener-ated a four-fold increase in pre-tax profit from CHF 17.5 mil-lion to CHF 69.5 million. This disproportionately large rise in profit is the result of our successful global growth strategy and a simultaneous increase in operating efficiency, with the cost/income ratio improving from 82.3% to 65.5%.
Our diversification strategy and performance orientation are continuing to prove successful. Assets under manage-ment increased across all boutiques – including the Quality Growth boutique, which was faced with exceptional cir-cumstances following the departure of the former CIO and the “Trump effect” on the emerging markets that lasted until early 2017. Client assets in Asset Management grew by 5% compared to the end of 2016 and reached a record CHF 106.8 billion, reflecting the impressive quality of our products. In the first six months, 79% of our assets outper-formed their benchmarks. As a result of the systematic ex-ecution of its proven investment style and investment pro-cess, the Quality Growth team delivered another significant outperformance of up to 700 basis points with its strate-gies, measured in terms of the gross performance of the composite. The growth in new money of CHF 1.0 billion in the second quarter partly offset outflows in the first quar-ter of 2017. Significant inflows were generated in particular by the fixed income products of the successful boutique TwentyFour Asset Management – which is continuing to achieve strong growth and is now present not only in our UK focus market but also in Europe and the US – as well as by the Multi Asset Class boutiques. Raiffeisen’s investment business also made a positive contribution to the acquisi-tion of new money.
As part of the redefinition of the collaboration between Vontobel and Raiffeisen in the area of asset management, Vontobel acquired Raiffeisen’s asset management subsid-iary Vescore AG in September 2016. Vontobel Asset Man-agement’s successful international boutique model has been strengthened by the Sustainable Investing team and by Vescore Quantitative Investments, which are contrib-uting to its further diversification. In mid-May 2017, Vontobel completed the legal integration of the remaining Vescore business, which will already contribute to its prof-itability in 2018.
The search for income is more important than ever in the current low return environment. Against this backdrop, Vontobel’s Quality Growth boutique recently launched a Global Equity Income Strategy based on its proven funda-mental, research-based investment philosophy. Vontobel has been investing in emerging markets strategies since 1992. At present, investments in equities and bonds from these regions, which continue to have significant growth po-tential in our view, total CHF 21.0 billion. The impressive in-vestment performance and quality of our products were once again recognized by renowned rating agencies, which presented us with numerous awards. For example, the Vontobel Fund mtx China Leaders was assigned to the “Best Group” in the category China Equity and the Vontobel Fund Emerging Market Debt was assigned to the “Best Group” in the category Emerging Markets Global Hard Currency by Citywire Asia. In addition, Vontobel received the Lipper Fund Award 2017 for the Vontobel Fund mtx Sustainable Emerg-ing Markets Leaders as the “Best performer over three years” in the Equity Emerging Markets Global category, while the Vontobel Fund Dynamic Commodity was named “Best per-former over three years” in the Commodity Blended cate-gory. Vontobel Asset Management will pursue its successful growth strategy as an active asset manager. Our positioning as a high-conviction manager clearly sets us apart from a passive investment approach. At the same time, we are in-vesting in big data and digitalization. In future, even more of the findings from big data research will be incorporated into the investment process and portfolio management.
Asset Management was once again the main earnings driver at Vontobel in the first half of 2017. Operating in-come totalled CHF 201.7 million and pre-tax profit was CHF 69.5 million. The gross margin declined to 43 basis points, mainly reflecting changes in the composition of assets.
Asset Management
As an active asset manager, the division creates financialvalue for clients. To achieve this, it develops first-class solu-tions to optimize returns and manage risk. Asset Manage-ment is positioned as a multi-boutique provider that focuses on the following areas: Quality Growth Equities, Multi Asset Class, Fixed Income, TwentyFour Asset Man-agement, Thematic Equities and Alternatives. Each bou-tique is run as an independent centre of expertise. The As-set Management division has a presence in Zurich, Basel, Berne, Geneva, New York, Frankfurt, London, Luxem-bourg, Madrid, Milan, Munich, Hong Kong and Sydney.
18 Vontobel, Half-Year Report 2017
Review of business activities

Segment results
30-06-17 30-06-16 31-12-16 Change to 30-06-16(6 months) CHF mn CHF mn CHF mn CHF mn in %Net interest income 0.1 0.3 0.0 (0.2) (67)Other operating income 201.6 210.3 204.1 (8.7) (4)Operating income 201.7 210.6 204.1 (8.9) (4)Personnel expense 82.3 80.5 77.7 1.8 2General expense 21.9 19.3 22.6 2.6 13Services from/to other segment(s) 25.4 23.2 23.3 2.2 9Depreciation of property, equipment and intangible assets 2.5 2.1 2.1 0.4 19Valuation adjustments, provisions and losses 0.1 0.2 0.2 (0.1) (50)Operating expense 132.2 125.3 125.9 6.9 6Segment profit before taxes 69.5 85.3 78.2 (15.8) (19)
Key figures
in % 30-06-17 30-06-16 31-12-16Cost1/income ratio 65.5 59.4 61.6Change of assets under management2 6.4 (9.8) 6.7
of which net new money (1.9) (10.4) (4.3)
of which change in market value 8.3 0.6 1.5of which other effects 0.0 0.0 9.53
Operating income/average assets under management (bp)4,5 43 46 45Profit before taxes/average assets under management (bp)4,5 15 19 17
Client assets
30-06-17 30-06-16 31-12-16 Change to 31-12-16CHF bn CHF bn CHF bn CHF bn in %
Assets under management 97.2 86.4 92.3 4.9 5of which Vontobel funds 22.7 23.3 20.6 2.1 10of which private label funds 17.7 12.1 16.7 1.0 6of which managed on behalf of other segments 2.9 3.4 3.7 (0.8) (22)
Other advised client assets 9.6 5.4 9.4 0.2 2Total advised client assets 106.8 91.8 101.7 5.1 5Average assets under management5 94.8 90.9 89.9 4.9 5
Net new money
CHF bn (6 months) 30-06-17 30-06-16 31-12-16Net new money (1.7) (9.7) (3.5)
Personnel
Change to 31-12-1630-06-17 30-06-16 31-12-16 in %
Employees (full-time equivalents) 398.5 323.7 397.5 1.0 01 Operating expense excl. valuation adjustments, provisions and losses2 Adjusted for assets that are managed on behalf of other segments3 Acquisition of Vescore AG as per 20 September 20164 Annualized5 Calculation based on average values for individual months
Vontobel, Half-Year Report 2017 19

Vontobel is one of the world’s leading providers of struc-tured investment products and leverage products, with a market share of over 10% in Europe and 25% in our Swiss home market, measured in terms of the exchange-traded volume in the target segment. As an innovative and pro-fessional issuer, Vontobel offers investors a broad invest-ment universe with more than 190,000 issued products spanning all geographical regions and risk classes. The in-ternational expansion of Financial Products is advancing rapidly. We have been operating successfully in Germany and the Nordic market for a number of years. We entered the Italian market in 2016 and this year made our market debut in the Netherlands and France. We plan to offer our leading range of leverage products on the Hong Kong stock exchange – one of the world’s largest markets in terms of trading volumes – in the second half of 2017.
Thanks to our innovative strength and our state-of-the-art digital ecosystem, we can now rapidly enter new mar-kets and serve new target groups. With our unique and leading multi issuer platform Vontobel deritrade® MIP, we enable asset managers and banks to independently com-pare, create and manage structured products from differ-ent issuers for their clients. In the first half of 2017, a total of CHF 2.2 billion of products were purchased on our platform – a significant increase of 29% compared to the same period of the previous year and more than the turn-over on the SIX Swiss Exchange in the segment for yield enhancement products. We are now also offering our multi issuer capabilities to our clients in Germany through the issuing platform “mein-zertifikat.de”. In Switzerland, private investors have been able to use a new type of app, “Vontobel Investment Scout”, since the end of March 2017 in order to select a structured product tailored to their individual preferences and have it issued immedi-ately via their iPhone or iPad. In Vontobel Financial Prod-ucts, business processes have been fully automated as a result of innovation and digitalization, resulting in a signif-icant reduction in unit costs, which have fallen by 96% since 2009.
Vontobel Corporate Finance has succeeded in expanding its leading position in the Swiss equity capital market, in the area of public takeover bids and as a lead manager for bond issues. In the first half of 2017, the team advised on 14 corporate finance transactions worth between CHF 20 million and CHF 30 billion.
Vontobel’s External Asset Managers (EAM) business pro-vides support and advice to external asset managers. We increased our number of relationship managers in the first half of 2017. The EAMs we serve benefit from our excel-lent service offering, such as Investment Advisory – with our global investment expertise – and our first-class com-petence in active asset management, as well as our exten-sive compliance knowhow. In addition, our new digital platform “Vontobel EAMNet” provides external asset managers with access to a pioneering solution compared to peer offerings that also features a very client-friendly design. This was rewarded by our clients with impressive annualized growth in new money of considerably more than 10%.
In the first half of 2017, Investment Banking generated a significant increase in operating income of 27% to CHF 168.8 million as a result of further gains in market share and our successful performance in Corporate Finance and Brokerage. At the same time, operating expense rose by only 12% despite the expansion of our offering and our international growth, reflecting a high level of cost disci-pline. This resulted in a 67% increase in pre-tax profit to CHF 62.8 million.
Investment Banking
Investment Banking creates customized investment solu-tions for our clients. Vontobel is one of the leading issu-ers of structured products and derivatives in Europe and has a presence in Asia. Investment Banking also provides comprehensive services for external asset managers. In addition to its award-winning Brokerage function, Vontobel is active in the field of corporate finance. Secu-rities and foreign exchange trading, as well as the securi-ties services supplied by Transaction Banking, complete its range of offerings. Prudent risk management is assigned the utmost importance in all of these activities. Vontobel Investment Banking is a global leader in the digitalization of investment solutions. Investment Bank-ing has operations in Zurich, Basel, Geneva, Lugano, Cologne, Frankfurt, Dubai, London, New York, Hong Kong and Singapore.
20 Vontobel, Half-Year Report 2017
Review of business activities

Segment results
30-06-17 30-06-16 31-12-16 Change to 30-06-16(6 months) CHF mn CHF mn CHF mn CHF mn in %Net interest income 4.7 1.8 3.3 2.9 161Other operating income 164.1 130.8 141.4 33.3 25Operating income 168.8 132.6 144.7 36.2 27Personnel expense 59.4 46.7 53.1 12.7 27General expense 24.7 23.2 22.1 1.5 6Services from/to other segment(s) 19.2 22.6 20.3 (3.4) (15)Depreciation of property, equipment and intangible assets 2.7 2.3 2.3 0.4 17Valuation adjustments, provisions and losses 0.0 0.2 (0.1) (0.2) (100)Operating expense 106.0 95.0 97.7 11.0 12Segment profit before taxes 62.8 37.6 47.0 25.2 67
Key figures
in % 30-06-17 30-06-16 31-12-16Cost1/income ratio 62.8 71.5 67.6Change of assets under management 13.8 (3.0) 11.2
of which net new money 9.2 1.0 5.1of which change in market value 4.6 (4.0) 6.1
Client assets
30-06-17 30-06-16 31-12-16 Change to 31-12-16CHF bn CHF bn CHF bn CHF bn in %
Assets under management 12.4 9.8 10.9 1.5 14Structured products outstanding 7.2 5.9 6.4 0.8 13Total advised client assets 19.6 15.7 17.3 2.3 13Custody assets 43.0 39.2 40.1 2.9 7Total client assets 62.6 54.9 57.4 5.2 9
Net new money
CHF bn (6 months) 30-06-17 30-06-16 31-12-16Net new money 1.0 0.1 0.5
Personnel
Change to 31-12-1630-06-17 30-06-16 31-12-16 in %
Employees (full-time equivalents) 376.9 349.6 372.8 4.1 1
Of which External Asset Managers
Change to 30-06-16(6 months) 30-06-17 30-06-16 31-12-16 in %Operating income (CHF mn) 25.9 21.7 21.7 4.2 19Profit before taxes (CHF mn) 11.3 7.6 7.7 3.7 49Cost1/income ratio (%) 56.0 65.0 64.1Assets under management (CHF bn) 8.7 7.3 7.8Net new money (CHF bn) 0.6 0.1 0.1Operating income/average assets under management (bp)2,3 62 59 57
1 Operating expense excl. valuation adjustments, provisions and losses2 Annualized3 Calculation based on average values for individual months
Vontobel, Half-Year Report 2017 21

Vontobel has a long tradition of corporate responsibility and sustainability, which are part of our corporate culture. We strive to take greater account of sustainability aspects across every area of our business and we view this as a permanent and pressing commitment. Since the 1990s, Vontobel has continuously expanded its sustainable in-vesting activities and is seeking to play a leading role in this area. Vontobel has been a signatory to the UN Princi-ples for Responsible Investment (UN PRI) since 2010 and achieved an above-average score in the PRI reporting for 2016. In June 2017, Vontobel joined the global network of the United Nations Global Compact as well as the Global Compact Network Switzerland. The UN Global Compact is a strategic initiative for companies that pledge to align their operations and strategies with ten universal princi-ples in the areas of human rights, labour, environment and anti-corruption.
With the rollout of Avaloq in 2009 and the subsequent upgrading of peripheral systems, Vontobel laid the foun-dations for the current digital transformation of the busi-ness. This reflects the vital importance today of having a modern back- and middle-office landscape in order to successfully implement innovative front-office applica-tions. To drive forward the digital transformation process in a coordinated and targeted manner, a dedicated pro-gramme was launched that encompasses more than 20 digitalization projects. In March 2017, for example, Finan-cial Products introduced “Vontobel Investment Scout” – the world’s first app that allows private investors to use their iPhone and iPad to create structured products, tailor them to their specific requirements and monitor them. At the same time, the range of products offered on the “Vontobel Mobile Private Banking” and “Vontobel EAMNet“ platforms has been continuously refined and expanded. A substantial proportion of IT investment is now being channelled into the digitalization of the busi-ness; with these future-oriented investments, we are se-curing a strong and competitive position for Vontobel in the market.
Vontobel has long adopted a future-oriented approach in its business – especially with German clients. Some time ago, it therefore began to systematically review the tax status of all German clients, as well as other clients, and actively supported their efforts to regularize their tax sta-tus where applicable. Irrespective of this, the German tax
authorities launched an investigation into Vontobel and a large number of other Swiss financial institutions in 2014. Like the other banks, Vontobel is currently holding talks with the relevant German authorities to obtain transpar-ency and legal certainty for the bank, its clients and its employees.
The negative interest rates that apply to certain sight deposits held by banks at the Swiss National Bank (SNB), as well as the negative key interest rate in the Eurozone, adversely affected our result once again. They primarily had an impact in Private Banking and in the External Asset Managers business, as well as in Treasury. This effect was partly offset by an increase in lending to clients in the form of secured loans (“lombard loans”) as well as by the active management of excess liquidity. The decline in interest in-come in the Corporate Center was primarily due to the non-recurrence of the dividend from the participation in Helvetia, which was sold at the end of 2016. In the previ-ous year, a dividend of CHF 7.6 million (pre-tax) was received. In addition, in Treasury, it was not possible to reinvest the capital from maturing bonds at the same attractive conditions and this also had a negative impact on interest income.
The integration of Vescore was completed in May 2017, just nine months after it was acquired. This resulted in a charge of approximately CHF 4.6 million after taxes in the period under review. Consequently, the Corporate Center’s pre-tax result decreased by CHF 17.1 million compared to the first half of 2016 to CHF –36.9 million.
Corporate Center
The Corporate Center provides central services for the divisions and comprises the units Operations, Finance & Risk and Corporate Services, as well as the Board of Directors support unit. Operations consists of the central IT unit and Facility Management, as well as Legal, Com-pliance & Tax. Finance & Risk combines the areas of Finance, Controlling, Treasury, Risk Control and Investor Relations. Corporate Services is divided into the areas Corporate Human Resources, Corporate Marketing & Communications, and Corporate Business Development. The Board of Directors support unit assists the Board of Directors with all administrative and legal matters and includes Internal Audit.
22 Vontobel, Half-Year Report 2017
Review of business activities

Segment results
30-06-17 30-06-16 31-12-16 Change to 30-06-16(6 months) CHF mn CHF mn CHF mn CHF mn in %Net interest income 13.9 25.6 11.4 (11.7) (46)Other operating income 1.1 5.4 102.4 (4.3) (80)Operating income 15.0 31.0 113.8 (16.0) (52)Personnel expense 65.0 61.8 60.9 3.2 5General expense 47.5 45.0 43.9 2.5 6Services from/to other segment(s) (84.6) (84.3) (80.5) (0.3)Depreciation of property, equipment and intangible assets 23.0 24.0 26.4 (1.0) (4)Valuation adjustments, provisions and losses 1.0 4.3 17.3 (3.3) (77)Operating expense 51.9 50.8 68.0 1.1 2Segment profit before taxes (36.9) (19.8) 45.8 (17.1)
Personnel
Change to 31-12-1630-06-17 30-06-16 31-12-16 in %
Employees (full-time equivalents) 477.2 451.9 517.1 (39.9) (8)
Vontobel, Half-Year Report 2017 23

Eligible and required capital
CHF mn 30-06-17 31-12-16Eligible capitalEquity according to balance sheet 1,515.7 1,514.1
Paid-in capital 56.9 56.9Disclosed reserves 1,425.8 1,291.2Net profit for the current financial year 98.7 259.8Deduction for treasury shares (65.7) (93.8)
Deduction for minority interests 0.0 0.0Deduction for dividends (current estimate) (56.9) (113.8)Deduction for goodwill (222.7) (223.3)Deduction for intangible assets (51.7) (55.7)Deduction for deferred tax assets (22.8) (24.4)Addition (deduction) for losses (gains) due to changes in own credit risk 1.4 3.9Deduction for unrealised gains related to financial investments AFS (6.1) (9.2)Deduction for defined benefit pension fund assets (IAS 19) (33.3) (22.1)Other adjustments (35.2) (51.1)Net eligible BIS common equity tier 1 capital (CET1) 1,088.4 1,018.4Additional tier 1 capital (AT1) 0.0 0.0Net eligible BIS tier 1 capital 1,088.4 1,018.4Supplementary capital (tier 2) 0.0 0.0Other deductions from total capital 0.0 0.0Net eligible regulatory capital (BIS tier 1 + 2) 1,088.4 1,018.4
Risk-weighted positionsCredit risks 1,717.2 1,622.4
Receivables 1,613.5 1,519.7Price risk relating to equity instruments in the banking book 103.7 102.7
Non-counterparty related risks 147.9 152.9Market risks 1,995.2 1,862.0
Interest rates 1,077.8 1,076.1Equities 338.4 314.7Currencies 283.7 248.6Gold 29.1 13.0Commodities 266.2 209.6
Operational risk 1,775.7 1,723.5Total risk-weighted positions 5,636.0 5,360.8
Capital/Liquidity
24 Vontobel, Half-Year Report 2017
Capital/Liquidity

The disclosures for capital adequacy, leverage ratio and liquidity coverage ratio are in accordance with the require-ments set out in FINMA Circular 16/01. The values used to calculate the liquidity coverage ratio are simple monthly averages for the relevant quarter or halfyear. The average is calculated based on the values shown in the monthly liquidity status reports submitted to FINMA and the SNB. This results in three data points per quarter.
For 2017, the liquidity coverage ratio had to exceed 80%. The main factors influencing Vontobel’s liquidity coverage ratio are cash holdings as high-quality liquid assets, customer cash accounts as weighted cash outflows, and reverse-repurchase agreements maturing within 30 calen-dar days as cash inflows.
Capital ratios in accordance with FINMA Circular 16/01
(as a percentage of risk-weighted positions) 30-06-17 31-12-16CET1 capital ratio (minimum requirement BIS Basel III excl. capital conservation buffer: 4.5%)1 19.3 19.0Tier 1 capital ratio (minimum requirement BIS Basel III excl. capital conservation buffer: 6.0%)2 19.3 19.0Total capital ratio (minimum requirement BIS Basel III excl. capital conservation buffer: 8.0%)3 19.3 19.0CET1 available to cover BCBS minimum capital and buffer requirements after deduction of AT1 and T2 capital requirements which are filled by CET1 15.8 15.5CET1 available 15.1 14.8T1 available 16.9 16.6Eligible regulatory capital available 19.3 19.0
1 CET1 capital ratio target according to Annex 8 CAO plus countercyclical buffer: 7.8%2 T1 capital ratio target according to Annex 8 CAO plus countercyclical buffer: 9.6%3 Total capital ratio target according to Annex 8 CAO plus countercyclical buffer: 12.0%
The countercyclical buffer requirement (as a percentage of risk-weighted positions) is 0.0.All investments in the financial sector (< 10%) are risk-weighted for CAD calcuations (30-06-2017: CHF 8.5 mn; 31-12-2016: CHF 8.5 mn).
Leverage ratio in accordance with FINMA Circular 15/03
30-06-17 31-12-16Net eligible BIS tier 1 capital in CHF mn 1,088.4 1,018.4Total leverage ratio exposure in CHF mn 21,362.1 19,437.9Leverage ratio (unweighted capital ratio in accordance with Basel III) in % 5.1 5.2
Liquidity Coverage Ratio in accordance with FINMA Circular 15/02
Average 1st Half year
20172nd Quarter
20171st Quarter
2017Total stock of high quality liquid assets (HQLA) in CHF mn 7,017.8 7,121.0 6,914.7Total net cash outflows in CHF mn 3,616.3 3,809.3 3,423.3Liquidity Coverage Ratio LCR in % 194.1 186.9 202.0
Vontobel, Half-Year Report 2017 25

Consolidated income statement
Consolidated income statement
30-06-17 30-06-16 31-12-16 Change to 30-06-16(6 months) Note CHF mn CHF mn CHF mn CHF mn in %
Interest income 41.0 42.3 33.5 (1.3) (3)Interest expense 6.3 2.7 5.4 3.6 133
Net interest income 1 34.7 39.6 28.1 (4.9) (12)Fee and commission income 433.2 417.0 414.9 16.2 4Fee and commission expense 99.6 88.9 94.3 10.7 12
Net fee and commission income 2 333.6 328.1 320.6 5.5 2Trading income 3 143.5 119.1 130.9 24.4 20Other income 5 5.7 10.0 104.7 (4.3) (43)Total operating income 517.5 496.8 584.3 20.7 4
Personnel expense 6 262.1 238.6 246.2 23.5 10General expense 7 101.8 93.7 96.0 8.1 9Depreciation of property, equipment and intangible assets 8 29.7 29.9 32.4 (0.2) (1)Valuation adjustments, provisions and losses 9 1.4 4.9 18.1 (3.5) (71)
Operating expense 395.0 367.1 392.7 27.9 8
Profit before taxes 122.5 129.7 191.6 (7.2) (6)Taxes 10 21.0 24.0 32.9 (3.0) (13)
Group net profit 101.5 105.7 158.7 (4.2) (4)of which allocated to minority interests 2.8 2.4 2.2 0.4 17of which allocated to shareholders of Vontobel Holding AG 98.7 103.3 156.5 (4.6) (4)
Share information (CHF)
Basic earnings per share1 1.78 1.87 2.85 (0.09) (5)Diluted earnings per share1 1.75 1.84 2.75 (0.09) (5)
1 Basis: weighted average number of shares
26 Vontobel, Half-Year Report 2017
Consolidated financial statements

Consolidated statement of comprehensive income
Consolidated statement of comprehensive income
30-06-17 30-06-16 31-12-16 Change to 30-06-16(6 months) Note CHF mn CHF mn CHF mn CHF mn in %Group net profit according to the income statement 101.5 105.7 158.7 (4.2) (4)
Other comprehensive income, net of tax 11
Other comprehensive income that will be reclassified to the income statementCurrency translation adjustments
Income during the reporting period (7.6) (9.8) 3.6 2.2Gains and losses transferred to the income statement 0.0 0.0 0.0 0.0
Total currency translation adjustments (7.6) (9.8) 3.6 2.2Financial investments carried at fair value (“available-for-sale”)
Income during the reporting period 2.4 1.3 (27.4) 1.1 85Gains and losses transferred to the income statement (2.3) (2.6) (94.4) 0.3
Total financial investments carried at fair value (“available-for-sale”) 0.1 (1.3) (121.8) 1.4Cash flow hedges
Income during the reporting period 0.2 1.2 (1.5) (1.0) (83)Gains and losses transferred to the income statement 0.0 (0.1) 0.1 0.1
Total cash flow hedges 0.2 1.1 (1.4) (0.9) (82)Total other comprehensive income that will be reclassified to the income statement (7.3) (10.0) (119.6) 2.7
Other comprehensive income that will not be reclassified to the income statementDefined benefit pension plansTotal gains/(losses) on defined benefit pension plans 11.8 (10.4) 71.0 22.2Total other comprehensive income that will not be reclassified to the income statement 11.8 (10.4) 71.0 22.2
Total other comprehensive income, net of tax 4.5 (20.4) (48.6) 24.9
Comprehensive income 106.0 85.3 110.1 20.7 24of which allocated to minority interests 2.7 1.1 1.8 1.6 145of which allocated to shareholders of Vontobel Holding AG 103.3 84.2 108.3 19.1 23
Vontobel, Half-Year Report 2017 27

Consolidated balance sheet
Assets
30-06-17 31-12-16 Change to 31-12-16CHF mn CHF mn CHF mn in %
Cash 6,536.3 6,374.0 162.3 3Due from banks 1,127.7 1,502.7 (375.0) (25)Cash collateral for reverse-repurchase agreements 933.4 823.1 110.3 13Trading portfolio assets 3,077.5 2,515.8 561.7 22Positive replacement values 203.3 172.3 31.0 18Other financial assets at fair value 2,929.7 2,293.4 636.3 28Loans 2,925.2 2,601.9 323.3 12Financial investments 1,920.8 2,111.3 (190.5) (9)Investments in associates 0.5 0.6 (0.1) (17)Property and equipment 149.7 153.9 (4.2) (3)Goodwill and other intangible assets 274.4 279.0 (4.6) (2)Other assets 1,087.6 565.9 521.7 92Total assets 21,166.1 19,393.9 1,772.2 9
28 Vontobel, Half-Year Report 2017
Consolidated financial statements

Liabilities and equity
30-06-17 31-12-16 Change to 31-12-16CHF mn CHF mn CHF mn in %
Due to banks 804.4 1,139.0 (334.6) (29)Trading portfolio liabilities 141.9 99.7 42.2 42Negative replacement values 616.0 515.4 100.6 20Other financial liabilities at fair value 7,163.1 6,354.8 808.3 13Due to customers 9,638.0 9,058.5 579.5 6Provisions 34.8 33.4 1.4 4Other liabilities 1,252.2 679.0 573.2 84Total liabilities 19,650.4 17,879.8 1,770.6 10
Share capital 56.9 56.9 0.0 0Treasury shares (65.7) (93.8) 28.1Capital reserve (175.8) (157.8) (18.0)Retained earnings 1,753.2 1,754.5 (1.3) (0)Other components of shareholders’ equity (52.9) (45.7) (7.2)Shareholders’ equity 1,515.7 1,514.1 1.6 0Minority interests 0.0 0.0 0.0Total equity 1,515.7 1,514.1 1.6 0
Total liabilities and equity 21,166.1 19,393.9 1,772.2 9
Vontobel, Half-Year Report 2017 29

Statement of equity
Statement of equity
CHF mn Share capitalTreasury
sharesCapital reserve Retained earnings
Net unrealizedgains/(losses)on available-
for-sale financialinvestments1
Currencytranslation
adjustments1 Cash flow hedges1
Shareholders’equity
Minority interests Total equity
Balance as of 01-01-16 56.9 (94.6) (156.1) 1,536.8 127.7 (45.1) (0.4) 1,425.2 0.0 1,425.2
Group net profit 103.3 103.3 2.4 105.7Income recognized in other comprehensive income during the period under review 1.3 (8.5) 1.2 (6.0) (1.3) (7.3)Gains and losses transferred to the income statement (2.6) 0.0 (0.1) (2.7) 0.0 (2.7)Other comprehensive income from defined benefit pension plans (10.4) (10.4) 0.0 (10.4)
Other comprehensive income, net of tax 0.0 0.0 0.0 (10.4) (1.3) (8.5) 1.1 (19.1) (1.3) (20.4)Comprehensive income 0.0 0.0 0.0 92.9 (1.3) (8.5) 1.1 84.2 1.1 85.3
Dividend payment2 (102.7) (102.7) (3.8) (106.5)Purchase of treasury shares (28.9) (28.9) 0.0 (28.9)Sale of treasury shares 9.1 (0.6) 8.5 0.0 8.5Share-based compensation expense 3.2 3.2 0.0 3.2Allocations from share-based compensation 47.2 (26.6) 20.6 0.0 20.6Change in minority interests 0.0 0.0 0.0 0.0 0.0 0.0Change in liability to purchase minority interests 0.3 0.3 2.5 2.8Other effects 0.0 0.0 0.0 0.0 0.0 0.0 0.2 0.2
Ownership-related changes 0.0 27.4 (23.7) (102.7) 0.0 0.0 0.0 (99.0) (1.1) (100.1)Balance as of 30-06-16 56.9 (67.2) (179.8) 1,527.0 126.4 (53.6) 0.7 1,410.4 0.0 1,410.4
Balance as of 01-01-17 56.9 (93.8) (157.8) 1,754.5 4.6 (49.6) (0.7) 1,514.1 0.0 1,514.1
Group net profit 98.7 98.7 2.8 101.5Income recognized in other comprehensive income during the period under review 2.4 (7.5) 0.2 (4.9) (0.1) (5.0)Gains and losses transferred to the income statement (2.3) 0.0 0.0 (2.3) 0.0 (2.3)Other comprehensive income from defined benefit pension plans 11.8 11.8 0.0 11.8
Other comprehensive income, net of tax 0.0 0.0 0.0 11.8 0.1 (7.5) 0.2 4.6 (0.1) 4.5Comprehensive income 0.0 0.0 0.0 110.5 0.1 (7.5) 0.2 103.3 2.7 106.0
Dividend payment2 (111.8) (111.8) (4.3) (116.1)Purchase of treasury shares (38.3) (38.3) 0.0 (38.3)Sale of treasury shares 7.2 1.0 8.2 0.0 8.2Share-based compensation expense 18.9 18.9 0.0 18.9Allocations from share-based compensation 59.2 (33.8) 25.4 0.0 25.4Change in minority interests 0.0 0.0 0.0 0.0 0.0 0.0Change in liability to purchase minority interests (4.1) (4.1) 1.6 (2.5)Other effects 0.0 0.0 0.0 0.0 0.0 0.0 0.0 0.0
Ownership-related changes 0.0 28.1 (18.0) (111.8) 0.0 0.0 0.0 (101.7) (2.7) (104.4)Balance as of 30-06-17 56.9 (65.7) (175.8) 1,753.2 4.7 (57.1) (0.5) 1,515.7 0.0 1,515.7
1 “Net unrealized gains/(losses) on available-for-sale financial investments”, “Currency translation adjustments” and “Cash flow hedges” are reported in the balance sheet item “Other components of shareholders’ equity”.
2 Vontobel Holding AG paid a dividend (gross) of CHF 2.00 (previous year CHF 1.85), consisting of an ordinary dividend of CHF 1.90 and a special dividend of CHF 0.10 per registered share with a par value of CHF 1.00 in April 2017.
30 Vontobel, Half-Year Report 2017
Consolidated financial statements

Statement of equity
CHF mn Share capitalTreasury
sharesCapitalreserve Retained earnings
Net unrealized gains/(losses) on available-
for-sale financial investments1
Currency translation
adjustments1 Cash flow hedges1
Shareholders’ equity
Minority interests Total equity
Balance as of 01-01-16 56.9 (94.6) (156.1) 1,536.8 127.7 (45.1) (0.4) 1,425.2 0.0 1,425.2
Group net profit 103.3 103.3 2.4 105.7Income recognized in other comprehensive income during the period under review 1.3 (8.5) 1.2 (6.0) (1.3) (7.3)Gains and losses transferred to the income statement (2.6) 0.0 (0.1) (2.7) 0.0 (2.7)Other comprehensive income from defined benefit pension plans (10.4) (10.4) 0.0 (10.4)
Other comprehensive income, net of tax 0.0 0.0 0.0 (10.4) (1.3) (8.5) 1.1 (19.1) (1.3) (20.4)Comprehensive income 0.0 0.0 0.0 92.9 (1.3) (8.5) 1.1 84.2 1.1 85.3
Dividend payment2 (102.7) (102.7) (3.8) (106.5)Purchase of treasury shares (28.9) (28.9) 0.0 (28.9)Sale of treasury shares 9.1 (0.6) 8.5 0.0 8.5Share-based compensation expense 3.2 3.2 0.0 3.2Allocations from share-based compensation 47.2 (26.6) 20.6 0.0 20.6Change in minority interests 0.0 0.0 0.0 0.0 0.0 0.0Change in liability to purchase minority interests 0.3 0.3 2.5 2.8Other effects 0.0 0.0 0.0 0.0 0.0 0.0 0.2 0.2
Ownership-related changes 0.0 27.4 (23.7) (102.7) 0.0 0.0 0.0 (99.0) (1.1) (100.1)Balance as of 30-06-16 56.9 (67.2) (179.8) 1,527.0 126.4 (53.6) 0.7 1,410.4 0.0 1,410.4
Balance as of 01-01-17 56.9 (93.8) (157.8) 1,754.5 4.6 (49.6) (0.7) 1,514.1 0.0 1,514.1
Group net profit 98.7 98.7 2.8 101.5Income recognized in other comprehensive income during the period under review 2.4 (7.5) 0.2 (4.9) (0.1) (5.0)Gains and losses transferred to the income statement (2.3) 0.0 0.0 (2.3) 0.0 (2.3)Other comprehensive income from defined benefit pension plans 11.8 11.8 0.0 11.8
Other comprehensive income, net of tax 0.0 0.0 0.0 11.8 0.1 (7.5) 0.2 4.6 (0.1) 4.5Comprehensive income 0.0 0.0 0.0 110.5 0.1 (7.5) 0.2 103.3 2.7 106.0
Dividend payment2 (111.8) (111.8) (4.3) (116.1)Purchase of treasury shares (38.3) (38.3) 0.0 (38.3)Sale of treasury shares 7.2 1.0 8.2 0.0 8.2Share-based compensation expense 18.9 18.9 0.0 18.9Allocations from share-based compensation 59.2 (33.8) 25.4 0.0 25.4Change in minority interests 0.0 0.0 0.0 0.0 0.0 0.0Change in liability to purchase minority interests (4.1) (4.1) 1.6 (2.5)Other effects 0.0 0.0 0.0 0.0 0.0 0.0 0.0 0.0
Ownership-related changes 0.0 28.1 (18.0) (111.8) 0.0 0.0 0.0 (101.7) (2.7) (104.4)Balance as of 30-06-17 56.9 (65.7) (175.8) 1,753.2 4.7 (57.1) (0.5) 1,515.7 0.0 1,515.7
1 “Net unrealized gains/(losses) on available-for-sale financial investments”, “Currency translation adjustments” and “Cash flow hedges” are reported in the balance sheetitem “Other components of shareholders’ equity”.
2 Vontobel Holding AG paid a dividend (gross) of CHF 2.00 (previous year CHF 1.85), consisting of an ordinary dividend of CHF 1.90 and a special dividend of CHF 0.10 perregistered share with a par value of CHF 1.00 in April 2017.
Vontobel, Half-Year Report 2017 31
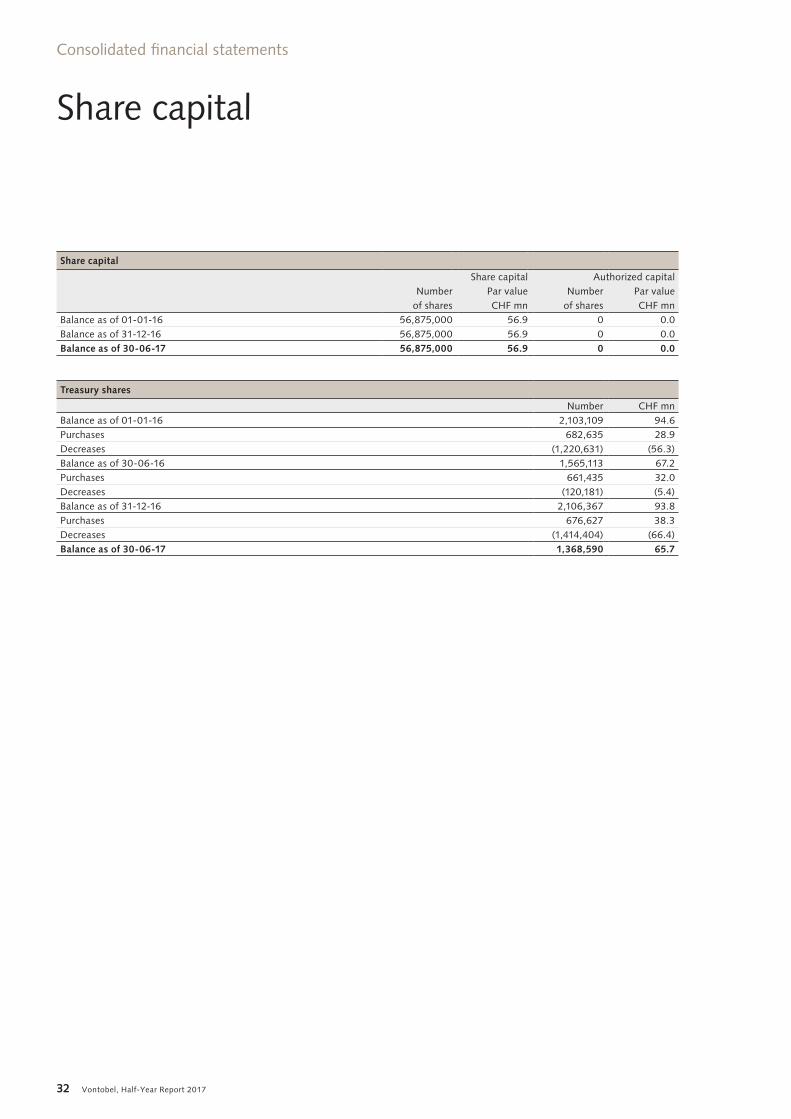
Share capital
Share capital
Share capital Authorized capitalNumber Par value Number Par value
of shares CHF mn of shares CHF mnBalance as of 01-01-16 56,875,000 56.9 0 0.0Balance as of 31-12-16 56,875,000 56.9 0 0.0Balance as of 30-06-17 56,875,000 56.9 0 0.0
Treasury shares
Number CHF mnBalance as of 01-01-16 2,103,109 94.6Purchases 682,635 28.9Decreases (1,220,631) (56.3)Balance as of 30-06-16 1,565,113 67.2Purchases 661,435 32.0Decreases (120,181) (5.4)Balance as of 31-12-16 2,106,367 93.8Purchases 676,627 38.3Decreases (1,414,404) (66.4)Balance as of 30-06-17 1,368,590 65.7
32 Vontobel, Half-Year Report 2017
Consolidated financial statements

Consolidated cash flow statement
Consolidated cash flow statement
CHF mn (6 months) 30-06-17 30-06-16Cash flow from operating activitiesGroup net profit (incl. minorities) 101.5 105.7Reconciliation to net cash flow from operating activitiesNon-cash positions in Group results
Depreciation and valuation adjustments of property, equipment and intangible assets 29.7 29.9Credit loss expense 0.0 0.1Income from investments in associates 0.1 0.1Deferred income taxes 2.5 3.0Change in provisions 0.9 (1.4)Net income from investing activities 0.4 (1.7)Other non-cash income 18.3 4.1
Net (increase)/decrease in assets relating to banking activitiesDue from/to banks, net (295.5) 72.5Reverse-repurchase agreements, cash collateral for securities borrowing agreements (110.3) (377.1)Trading positions and replacement values, net (376.3) 216.8Other financial assets/liabilities at fair value, net 172.0 565.7Loans/due to customers, net 256.2 (49.8)Other assets (482.3) (751.9)
Net increase/(decrease) in liabilities relating to banking activitiesRepurchase agreements, cash collateral from securities lending agreements 0.0 (76.1)Other liabilities 590.0 499.3
Taxes paid (30.8) (30.8)Cash flow from operating activities (123.6) 208.4
Cash flow from investing activitiesInvestments in subsidiaries and associates (28.7) 0.0Purchase of property, equipment and intangible assets (21.8) (13.2)Disposal of property, equipment and intangible assets 0.0 0.0Investment in financial instruments (234.5) (392.0)Divestment of financial instruments 352.7 371.9Cash flow from investing activities 67.7 (33.3)
Cash flow from financing activitiesNet movements in treasury shares (30.1) (20.4)Dividends paid (116.1) (106.5)Cash flow from financing activities (146.2) (126.9)
Effects of exchange rate differences (0.1) (2.6)Net increase/(decrease) in cash and cash equivalents (202.2) 45.6Cash and cash equivalents, beginning of the year 7,787.0 6,283.7Cash and cash equivalents at the balance sheet date 7,584.8 6,329.3
Vontobel, Half-Year Report 2017 33

Consolidated cash flow statement
CHF mn (6 months) 30-06-17 30-06-16Cash and cash equivalents comprise at the balance sheet dateCash 6,536.3 5,232.0Due from banks on demand 1,048.5 1,097.3Total 7,584.8 6,329.3
Further information:Dividends received 44.6 47.0Interest received 73.7 70.9Interest paid 8.4 5.1
34 Vontobel, Half-Year Report 2017
Consolidated financial statements

Accounting principles
1. Basis of presentation
Vontobel’s consolidated financial statements have been prepared in accordance with the International Financial Reporting Standards (IFRS), which are published by the International Accounting Standards Board (IASB). This half-year report meets the requirements set out in IAS 34 – Interim Financial Reporting. Since it does not contain allof the information and disclosures required in the Annual Report, this interim report should be read in conjunctionwith the audited consolidated financial statements in theAnnual Report 2016. With the exception of the followingchanges, the accounting principles applied in this reportare the same as in the consolidated financial statementsdated 31 December 2016.
2. Changes in financial reporting
2.1 Changes in accounting principles2.1.1 Standards and interpretations that have been im-plemented The following new or revised standards and interpreta-tions did not have any material impact on Vontobel or were not relevant to Vontobel when applied for the first time:– IAS 7 – Disclosure Initiative;– IAS 12 – Recognition of Deferred Tax Assets for
Unrealised Losses;– Annual Improvements 2014–2016.
2.1.2 Other changesNone.
2.2 Changes in estimatesNo material changes in estimates.
Notes to the consolidated financial statements
Vontobel, Half-Year Report 2017 35

This page has been left intentionally blank.

Details on consolidated income statement
1 Net interest income
30-06-17 30-06-16 31-12-16 Change to 30-06-16(6 months) CHF mn CHF mn CHF mn CHF mn in %Interest income from banks and customers 17.8 14.2 15.4 3.6 25Interest income from securities borrowing and reverse-repurchase agreements 3.1 1.7 3.0 1.4 82Interest income from financial liabilities 2.3 1.2 1.7 1.1 92Interest income from financial instruments at amortized cost 23.2 17.1 20.1 6.1 36Dividend income from financial assets available-for-sale 3.4 10.9 0.0 (7.5) (69)Interest income from financial assets available-for-sale 14.4 14.3 13.4 0.1 1Interest and dividend income from financial assets at fair value 17.8 25.2 13.4 (7.4) (29)Total interest income 41.0 42.3 33.5 (1.3) (3)Interest expense from securities lending and repurchase agreements 1.0 0.5 0.8 0.5 100Interest expense from other financial liabilities at amortized cost 2.0 0.8 0.9 1.2 150Interest expense from financial assets 3.3 1.4 3.7 1.9 136Interest expense from financial instruments at amortized cost 6.3 2.7 5.4 3.6 133Total 34.7 39.6 28.1 (4.9) (12)
2 Net fee and commission income
30-06-17 30-06-16 31-12-16 Change to 30-06-16(6 months) CHF mn CHF mn CHF mn CHF mn in %Commission income from lending activities 0.3 0.3 0.7 0.0 0Brokerage fees 59.4 55.8 53.5 3.6 6Custody fees 77.5 73.5 76.0 4.0 5Advisory and management fees 268.1 274.2 272.0 (6.1) (2)Corporate finance 9.9 1.7 3.0 8.2 482Fiduciary transactions 0.6 0.4 0.5 0.2 50Other commission income from securities and investment transactions 14.8 9.5 8.0 5.3 56Total fee and commission income from securities and investment transactions 430.3 415.1 413.0 15.2 4Other fee and commission income 2.6 1.6 1.2 1.0 63Brokerage fees 9.8 8.4 8.8 1.4 17Other commission expense 89.8 80.5 85.5 9.3 12Total commission expense 99.6 88.9 94.3 10.7 12Total 333.6 328.1 320.6 5.5 2
Vontobel, Half-Year Report 2017 37

3 Trading income
30-06-17 30-06-16 31-12-16 Change to 30-06-16(6 months) CHF mn CHF mn CHF mn CHF mn in %Securities 353.9 138.2 532.0 215.7 156Other financial instruments at fair value (220.8) (34.8) (423.9) (186.0)Forex and precious metals 10.4 15.7 22.8 (5.3) (34)Total 143.5 119.1 130.9 24.4 20
Trading income as of 30-06-17 includes income of CHF 1.9 mn (6 months ending 30-06-16: CHF –1.4 mn; 6 months ending 31-12-16: CHF –2.2 mn), which is attributable to changes in fair value due to a change in Vontobel’s own credit risk. Of the total impact, CHF –0.6 mn was realized as of 30-06-17 (6 months ending 30-06-16: CHF –0.6 mn; 6 months ending 31-12-16: CHF –0.8 mn), while the remaining CHF 2.5 mn (6 months ending 30-06-16: CHF –0.8 mn; 6 months ending 31-12-16: CHF –1.4 mn) comprises unrealized income. The changes in own credit risk resulted in cumulative income of CHF 2.7 mn, of which CHF 4.1 mn was realized and CHF –1.4 mn was unrealized. Cumulative unrealized income is shown in the balance sheet item “Other financial liabilities at fair value” and will be completely reversed over the term of the relevant instruments provided they are not redeemed or repurchased prior to their contractual maturity.
4 Comprehensive income from financial instruments before tax
30-06-17 30-06-16 31-12-16 Change to 30-06-16(6 months) CHF mn CHF mn CHF mn CHF mn in %Financial instruments held-for-trading 353.9 138.2 532.0 215.7 156Other financial instruments at fair value (220.8) (34.8) (423.9) (186.0)Forex and precious metals 10.4 15.7 22.8 (5.3) (34)Trading income 143.5 119.1 130.9 24.4 20Financial instruments available-for-sale 21.3 32.9 116.1 (11.6) (35)Loans and receivables 17.6 14.4 14.8 3.2 22Financial liabilities measured at amortized cost (0.7) (0.1) 0.0 (0.6)Total financial instruments income statement 181.7 166.3 261.8 15.4 9Unrealized gains/(losses) on available-for-sale financial instruments, recorded in other comprehensive income 3.3 6.0 (33.8) (2.7) (45)(Gains)/losses on available-for-sale financial instruments, transferred from other comprehensive income to the income statement (3.1) (3.7) (102.5) 0.6Unrealized gains/(losses) on cash flow hedges, recorded in other comprehensive income 0.2 1.2 (1.5) (1.0) (83)(Gains)/losses on cash flow hedges, transferred from other comprehensive income to the income statement 0.0 (0.1) 0.1 0.1Total 182.1 169.7 124.1 12.4 7
Comprehensive income includes interest income, dividend income, net realized and unrealized gains and currency translation adjustments, as well as impairment losses and reversals.
38 Vontobel, Half-Year Report 2017
Notes to the consolidated financial statements

5 Other income
30-06-17 30-06-16 31-12-16 Change to 30-06-16(6 months) CHF mn CHF mn CHF mn CHF mn in %Real estate income 0.0 0.0 0.0 0.0Income from the sale of property and equipment 0.0 0.0 (0.1) 0.0Income from the sale of financial instruments available-for-sale 3.5 8.1 102.7 (4.6) (57)Impairments of financial instruments available-for-sale 0.0 (0.4) 0.0 0.4Income from investments in associates 0.2 0.1 0.1 0.1 100Other income 2.0 2.2 2.0 (0.2) (9)Total 5.7 10.0 104.7 (4.3) (43)
6 Personnel expense
30-06-17 30-06-16 31-12-16 Change to 30-06-16(6 months) CHF mn CHF mn CHF mn CHF mn in %Salaries and bonuses 217.4 206.4 206.4 11.0 5Pension and other employee benefit plans 17.8 7.61 14.6 10.2 134Other social contributions 19.0 16.8 16.2 2.2 13Other personnel expense 7.9 7.8 9.0 0.1 1Total 262.1 238.6 246.2 23.5 10
Personnel expense includes the expense for share-based compensation of CHF 15.9 mn (6 months ending 30-06-16: CHF 3.7 mn; 6 months ending 31-12-16: CHF 16.1 mn), of which CHF 12.7 mn (6 months ending 30-06-16: CHF 9.3 mn; 6 months ending 31-12-16: CHF 14.7 mn) relates to performance shares and CHF 3.2 mn (6 months ending 30-06-16: CHF 3.2 mn; 6 months ending 31-12-16: CHF 1.5 mn) to the awarding of bonus shares at preferential terms and CHF 0.0 mn (6 months ending 30-06-16: CHF –8.8 mn; 6 months ending 31-12-16: CHF –0.1 mn) to other share-based compensation as well as deferred compensation in cash of CHF 1.3 mn (6 months ending 30-06-16: CHF –2.2 mn; 6 months ending 31-12-16: CHF 0.5 mn).
1 Expense from pension and other employee benefit plans includes the impacts of changes to Swiss pension fund regulations in the amount of CHF 11.1 mn (primarily the reduction of conversion rates).
7 General expense
30-06-17 30-06-16 31-12-16 Change to 30-06-16(6 months) CHF mn CHF mn CHF mn CHF mn in %Occupancy expense 16.7 17.4 18.5 (0.7) (4)IT, telecommunications and other equipment 38.9 33.7 30.9 5.2 15Travel and representation, public relations, marketing 18.8 16.0 20.2 2.8 18Consulting and audit fees 12.9 11.4 12.9 1.5 13Other general expense 14.5 15.2 13.5 (0.7) (5)Total 101.8 93.7 96.0 8.1 9
Vontobel, Half-Year Report 2017 39

8 Depreciation of property, equipment and intangible assets
30-06-17 30-06-16 31-12-16 Change to 30-06-16(6 months) CHF mn CHF mn CHF mn CHF mn in %Depreciation of property and equipment 25.9 26.3 27.0 (0.4) (2)Amortization of other intangible assets 3.8 3.6 3.6 0.2 6Impairments of property and equipment 0.0 0.0 1.8 0.0Total 29.7 29.9 32.4 (0.2) (1)
9 Valuation adjustments, provisions and losses
30-06-17 30-06-16 31-12-16 Change to 30-06-16(6 months) CHF mn CHF mn CHF mn CHF mn in %Impairments on credit risks 0.0 0.1 0.0 (0.1) (100)Decrease of allowances for credit losses 0.0 0.0 (0.1) 0.0Increase in provisions 1.3 0.4 17.5 0.9 225Release of provisions (0.2) (0.9) (0.7) 0.7Recoveries 0.0 0.0 0.1 0.0Other 0.3 5.3 1.3 (5.0) (94)Total 1.4 4.9 18.1 (3.5) (71)
10 Taxes
30-06-17 30-06-16 31-12-16 Change to 30-06-16(6 months) CHF mn CHF mn CHF mn CHF mn in %Current income taxes 18.5 21.0 33.6 (2.5) (12)Deferred income taxes 2.5 3.0 (0.7) (0.5) (17)Total 21.0 24.0 32.9 (3.0) (13)
40 Vontobel, Half-Year Report 2017
Notes to the consolidated financial statements

11 Tax effects to other comprehensive income
30-06-17
CHF mn (6 months)Amount
before taxTax yield/
tax expenseAmount
net of taxTranslation differences during the reporting period (7.6) 0.0 (7.6)Translation differences transferred to the income statement 0.0 0.0 0.0Income from available-for-sale financial instruments during the reporting period 3.3 (0.9) 2.4Income from available-for-sale financial instruments transferred to the income statement (3.1) 0.8 (2.3)Income from cash flow hedges during the reporting period 0.2 0.0 0.2Income from cash flow hedges transferred to the income statement 0.0 0.0 0.0Defined benefit pension plans 15.1 (3.3) 11.8Total other comprehensive income 7.9 (3.4) 4.5
30-06-16
CHF mn (6 months)Amount
before taxTax yield/
tax expenseAmount
net of taxTranslation differences during the reporting period (9.8) 0.0 (9.8)Translation differences transferred to the income statement 0.0 0.0 0.0Income from available-for-sale financial instruments during the reporting period 6.0 (4.7) 1.3Income from available-for-sale financial instruments transferred to the income statement (3.7) 1.1 (2.6)Income from cash flow hedges during the reporting period 1.2 0.0 1.2Income from cash flow hedges transferred to the income statement (0.1) 0.0 (0.1)Defined benefit pension plans (13.3) 2.9 (10.4)Total other comprehensive income (19.7) (0.7) (20.4)
31-12-16
CHF mn (6 months)Amount
before taxTax yield/
tax expenseAmount
net of taxTranslation differences during the reporting period 3.6 0.0 3.6Translation differences transferred to the income statement 0.0 0.0 0.0Income from available-for-sale financial instruments during the reporting period (33.8) 6.4 (27.4)Income from available-for-sale financial instruments transferred to the income statement (102.5) 8.1 (94.4)Income from cash flow hedges during the reporting period (1.5) 0.0 (1.5)Income from cash flow hedges transferred to the income statement 0.1 0.0 0.1Defined benefit pension plans 91.1 (20.1) 71.0Total other comprehensive income (43.0) (5.6) (48.6)
Vontobel, Half-Year Report 2017 41

Risk related to balance sheet positions
12 Fair value of financial instruments
12a Financial instruments measured at fair valueThe following table shows the fair value hierarchy of those financial instruments that are measured at fair value. Fair
value is defined as the price that would be received to sell an asset or paid to transfer a liability in an orderly transac-tion between market participants at the measurement date.
Financial instruments measured at fair value
CHF mn Level 1 Level 2 Level 330-06-17
TotalAssetsTrading portfolio assets
Equity instruments 2,027.0 - 0.0 2,027.0Units in investment funds 121.9 0.1 0.1 122.1Debt instruments 254.7 151.2 - 405.9Precious metals 522.5 - - 522.5
Positive replacement values 29.8 173.5 0.0 203.3Other financial assets at fair value
Units in investment funds 49.7 9.4 5.5 64.6Debt instruments1 1,991.7 857.7 - 2,849.4Structured products - 15.7 - 15.7
Financial assets available-for-saleEquity instruments and other participations 0.2 - 14.8 15.0Units in investment funds 0.9 0.3 0.0 1.2Debt instruments 1,876.2 28.4 - 1,904.6
Other assets at fair value 0.0 0.0 3.7 3.7Total financial assets at fair value 6,874.6 1,236.3 24.1 8,135.0
LiabilitiesTrading portfolio liabilities
Equity instruments 19.2 - 0.0 19.2Debt instruments 116.8 5.9 - 122.7
Negative replacement values 34.5 581.5 - 616.0Other financial liabilities at fair value2 - 7,163.1 - 7,163.1Other liabilities at fair value - 0.0 53.2 53.2Total financial liabilities at fair value 170.5 7,750.5 53.2 7,974.2
1 In the case of interest rate instruments measured at fair value through profit and loss, the difference between the book value (fair value) and the contractually agreed redemption amount at maturity was CHF 44.7 mn.
2 Level 2 of the balance sheet item “Other financial liabilities at fair value” contains listed issued products with a fair value of CHF 4,188.7 mn.
42 Vontobel, Half-Year Report 2017
Notes to the consolidated financial statements

Financial instruments measured at fair value
CHF mn Level 1 Level 2 Level 331-12-16
TotalAssetsTrading portfolio assets
Equity instruments 1,341.8 - 0.0 1,341.8Units in investment funds 101.9 0.1 0.1 102.1Debt instruments 333.9 258.8 - 592.7Precious metals 479.2 - - 479.2
Positive replacement values 21.2 151.1 0.0 172.3Other financial assets at fair value
Units in investment funds 42.3 9.1 6.1 57.5Debt instruments1 1,873.1 357.2 - 2,230.3Structured products - 5.6 - 5.6
Financial assets available-for-saleEquity instruments and other participations 0.2 - 14.9 15.1Units in investment funds 6.4 0.0 0.0 6.4Debt instruments 2,057.5 32.3 - 2,089.8
Other assets at fair value 0.0 0.0 3.7 3.7Total financial assets at fair value 6,257.5 814.2 24.8 7,096.5
LiabilitiesTrading portfolio liabilities
Equity instruments 28.1 - 0.0 28.1Debt instruments 68.4 3.2 - 71.6
Negative replacement values 18.1 497.3 - 515.4Other financial liabilities at fair value2 - 6,354.8 - 6,354.8Other liabilities at fair value - 0.0 50.3 50.3Total financial liabilities at fair value 114.6 6,855.3 50.3 7,020.2
1 In the case of interest rate instruments measured at fair value through profit and loss, the difference between the book value (fair value) and the contractually agreed redemption amount at maturity was CHF 33.7 mn.
2 Level 2 of the balance sheet item “Other financial liabilities at fair value” contains listed issued products with a fair value of CHF 4,129.7 mn.
Vontobel, Half-Year Report 2017 43

Level 1 instrumentsIn the fair value hierarchy defined in IFRS 13, level 1 in-struments are those financial instruments whose fair value is based on quoted prices in active markets. This category essentially comprises almost all equity instruments and government bonds, liquid interest rate instruments issued by public sector entities and companies, investment funds for which a binding net asset value is published at least daily, exchange-traded derivatives and precious metals.
Mid-market prices are used for the valuation of interest rate instruments in the trading book provided the market price risks from these positions are offset fully or to a sig-nificant extent by other positions in the trading book. For the valuation of other interest rate instruments, bid prices are used in the case of long positions and ask prices are used in the case of short positions. For equity instruments, listed investment funds and exchange-traded derivatives, the closing or settlement prices of the relevant markets are used. Published net asset values are used in the case of un-listed investment funds. In the case of foreign currencies
and precious metals, generally accepted prices are applied.
No valuation adjustments are made in the case of level 1 instruments.
Level 2 instrumentsLevel 2 instruments are financial instruments whose fair value is based on quoted prices in markets that are not active or on a valuation method where significant input parameters can be observed directly or indirectly. They mainly comprise products issued by Vontobel, interest rate instruments issued by public sector entities and com-panies with reduced market liquidity and OTC derivatives, as well as investment funds for which a binding net asset value is published at least quarterly.
Since there is no active market pursuant to the definition of IFRS 13 for the products issued by Vontobel, their fair value is determined using valuation methods. In the case of issued options (warrants) and option components of structured products, generally recognized option pricing models and quoted prices in markets that are not active are used to determine their fair value, while the present value method is used to determine the fair value of the in-terest rate components of structured products. To meas-ure the fair value of interest rate instruments where
quoted prices are available but the low trading volume means there is no active market, the same rules apply to the use of mid-market prices and bid or ask prices as for the corresponding level 1 instruments. The valuation of interest rate instruments for which no quoted prices are available is carried out using generally recognized meth-ods. For the valuation of OTC derivatives, generally recog-nized valuation models and quoted prices in markets that are not active are used. Published net asset values are used in the case of investment funds.
The valuation models take account of the relevant param-eters such as contract specifications, the market price of the underlying asset, foreign exchange rates, market in-terest rates or funding rates, default risks and volatility. Vontobel’s credit risk is only taken into account when determining the fair value of financial liabilities if market participants would consider it when calculating prices. OTC derivatives are traded only on a collateralized basis, which is why own credit risk (as well as third-party credit risk in the case of receivables) is not included in the valuation.
Level 3 instrumentsLevel 3 instruments are financial instruments whose fair value is based on a valuation method that uses at least one significant input parameter that cannot be observed di-rectly or indirectly in the market. They include the liability to acquire the minority interests in TwentyFour Asset Management LLP, an asset from an earn-out agreement related to the acquisition of Finter Bank Zurich AG (a liabil-ity from an earn-out agreement related to the acquisition of TwentyFour Asset Management LLP was settled in the financial year 2016), investment funds for which a binding net asset value is not published at least quarterly, and sev-eral unlisted equity instruments.
The fair value of the liability to acquire minority interests in TwentyFour Asset Management LLP is calculated using a discounted cash flow analysis in which expected future cash flows based on internal business plans are discounted. This involves various input parameters that cannot be observed such as the future development of assets under management, their profitability, the cost/income ratio and long-term growth.
The fair value of the asset from the earn-out agreement related to the acquisition of Finter Bank Zurich AG is
44 Vontobel, Half-Year Report 2017
Notes to the consolidated financial statements

dependent on individual contractually agreed key perfor-mance indicators. The measurement of this asset is based on internal business plans. The fair value of investment funds is generally calculated using estimates from external experts regarding the level of future payouts from fund units. The measurement of unlisted shares is based on the acquisition costs less any impairment. To test unlisted
equity instruments for impairment, current financial infor-mation – provided Vontobel has access to such data as a result of its participation – or annual reports are consulted.
The following table shows the change in level 3 financial instruments in Vontobel’s balance sheet and the income on the positions as of the balance sheet date.
Level 3 financial instruments
CHF mn (6 months)
Fair value financial
instruments
Available- for-sale
financial instruments
Other assets1
Total financial
assetsOther
liabilities2
30-06-17Total
financial liabilities
Balance sheetHoldings at the beginning of the year 6.2 14.9 3.7 24.8 (50.3) (50.3)Additions in scope of consolidations 0.0 0.0 0.0 0.0 0.0 0.0Investments 0.0 0.0 0.0 0.0 0.0 0.0Disposals 0.0 0.0 0.0 0.0 0.0 0.0Redemptions (0.3) 0.0 0.0 (0.3) 0.0 0.0Expense recognized in the income statement (0.4) 0.0 0.0 (0.4) (0.4) (0.4)Expense recognized in other comprehensive income 0.0 (0.1) 0.0 (0.1) 0.0 0.0Income recognized in the income statement 0.1 0.0 0.0 0.1 0.0 0.0Income recognized in other comprehensive income 0.0 0.0 0.0 0.0 0.0 0.0Change recognized in shareholders’ equity 0.0 0.0 0.0 0.0 (3.0) (3.0)Reclassifications to level 3 0.0 0.0 0.0 0.0 0.0 0.0Reclassifications from level 3 0.0 0.0 0.0 0.0 0.0 0.0Translation differences 0.0 0.0 0.0 0.0 0.5 0.5Total book value at balance sheet date 5.6 14.8 3.7 24.1 (53.2) (53.2)
Income in the financial year on holdings on balance sheet dateUnrealized losses recognized in the trading income (0.4) 0.0 0.0 (0.4) 0.0 0.0Unrealized losses recognized in other income 0.0 0.0 0.0 0.0 0.0 0.0Expense recognized in operating expense 0.0 0.0 0.0 0.0 (0.4) (0.4)Unrealized losses recognized as other comprehensive income 0.0 (0.1) 0.0 (0.1) 0.0 0.0Unrealized gains recognized in the trading income 0.0 0.0 0.0 0.0 0.0 0.0Unrealized gains recognized in other income 0.0 0.0 0.0 0.0 0.0 0.0Unrealized gains recognized as other comprehensive income 0.0 0.0 0.0 0.0 0.0 0.0
Of the gains and losses recognized in the income statement, CHF –0.3 mn were included in trading income, CHF 0.0 mn in other income and CHF –0.4 mn in operating expense.
1 This item contains an asset from an earn-out agreement relating to the acquisition of Finter Bank Zurich AG.2 This item contains the liability to acquire the minority interests in TwentyFour Asset Management LLP.
Vontobel, Half-Year Report 2017 45
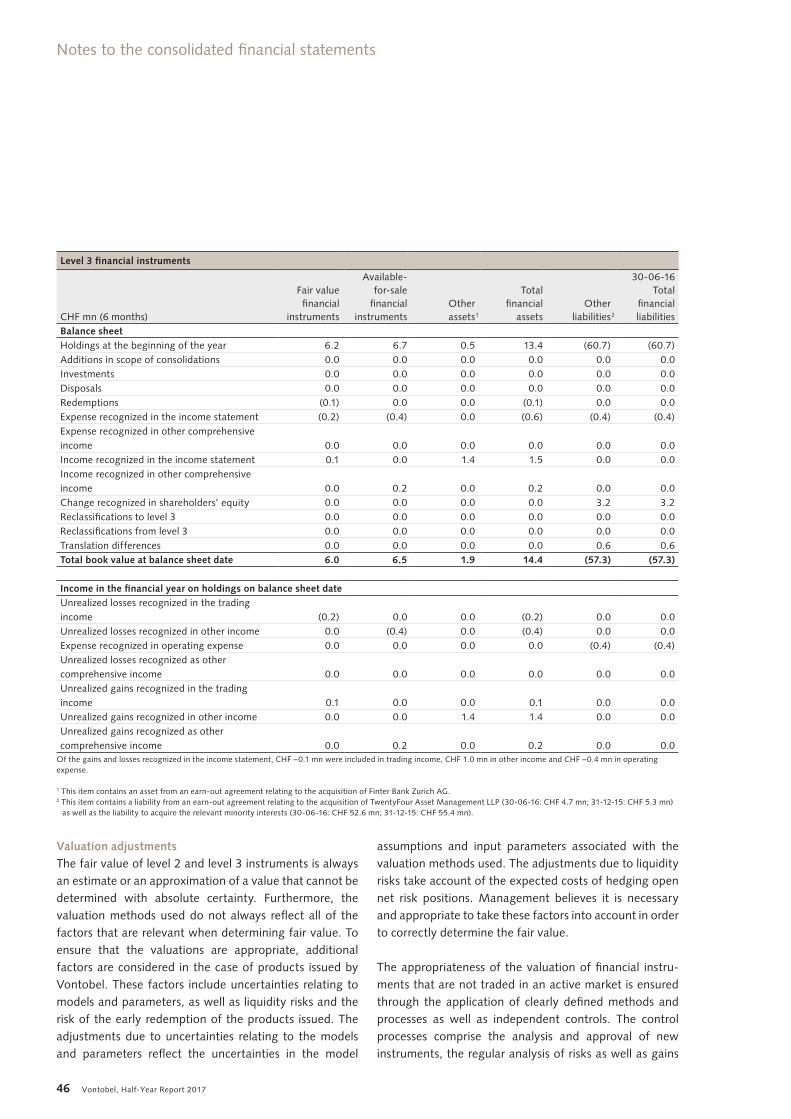
Level 3 financial instruments
CHF mn (6 months)
Fair value financial
instruments
Available- for-sale
financial instruments
Other assets1
Total financial
assetsOther
liabilities2
30-06-16Total
financial liabilities
Balance sheetHoldings at the beginning of the year 6.2 6.7 0.5 13.4 (60.7) (60.7)Additions in scope of consolidations 0.0 0.0 0.0 0.0 0.0 0.0Investments 0.0 0.0 0.0 0.0 0.0 0.0Disposals 0.0 0.0 0.0 0.0 0.0 0.0Redemptions (0.1) 0.0 0.0 (0.1) 0.0 0.0Expense recognized in the income statement (0.2) (0.4) 0.0 (0.6) (0.4) (0.4)Expense recognized in other comprehensive income 0.0 0.0 0.0 0.0 0.0 0.0Income recognized in the income statement 0.1 0.0 1.4 1.5 0.0 0.0Income recognized in other comprehensive income 0.0 0.2 0.0 0.2 0.0 0.0Change recognized in shareholders’ equity 0.0 0.0 0.0 0.0 3.2 3.2Reclassifications to level 3 0.0 0.0 0.0 0.0 0.0 0.0Reclassifications from level 3 0.0 0.0 0.0 0.0 0.0 0.0Translation differences 0.0 0.0 0.0 0.0 0.6 0.6Total book value at balance sheet date 6.0 6.5 1.9 14.4 (57.3) (57.3)
Income in the financial year on holdings on balance sheet dateUnrealized losses recognized in the trading income (0.2) 0.0 0.0 (0.2) 0.0 0.0Unrealized losses recognized in other income 0.0 (0.4) 0.0 (0.4) 0.0 0.0Expense recognized in operating expense 0.0 0.0 0.0 0.0 (0.4) (0.4)Unrealized losses recognized as other comprehensive income 0.0 0.0 0.0 0.0 0.0 0.0Unrealized gains recognized in the trading income 0.1 0.0 0.0 0.1 0.0 0.0Unrealized gains recognized in other income 0.0 0.0 1.4 1.4 0.0 0.0Unrealized gains recognized as other comprehensive income 0.0 0.2 0.0 0.2 0.0 0.0
Of the gains and losses recognized in the income statement, CHF –0.1 mn were included in trading income, CHF 1.0 mn in other income and CHF –0.4 mn in operating expense.
1 This item contains an asset from an earn-out agreement relating to the acquisition of Finter Bank Zurich AG.2 This item contains a liability from an earn-out agreement relating to the acquisition of TwentyFour Asset Management LLP (30-06-16: CHF 4.7 mn; 31-12-15: CHF 5.3 mn)
as well as the liability to acquire the relevant minority interests (30-06-16: CHF 52.6 mn; 31-12-15: CHF 55.4 mn).
Valuation adjustmentsThe fair value of level 2 and level 3 instruments is always an estimate or an approximation of a value that cannot be determined with absolute certainty. Furthermore, the valuation methods used do not always reflect all of the factors that are relevant when determining fair value. To ensure that the valuations are appropriate, additional factors are considered in the case of products issued by Vontobel. These factors include uncertainties relating to models and parameters, as well as liquidity risks and the risk of the early redemption of the products issued. The adjustments due to uncertainties relating to the models and parameters reflect the uncertainties in the model
assumptions and input parameters associated with the valuation methods used. The adjustments due to liquidity risks take account of the expected costs of hedging open net risk positions. Management believes it is necessary and appropriate to take these factors into account in order to correctly determine the fair value.
The appropriateness of the valuation of financial instru-ments that are not traded in an active market is ensured through the application of clearly defined methods and processes as well as independent controls. The control processes comprise the analysis and approval of new instruments, the regular analysis of risks as well as gains
46 Vontobel, Half-Year Report 2017
Notes to the consolidated financial statements

and losses, the verification of prices and the examination of the models on which the estimates of the fair value of financial instruments are based. These controls are conducted by units that possess the relevant specialist knowledge and operate independently from the trading and investment functions.
Sensitivity of fair values of level 3 instrumentsKey assumptions for the measurement of the liability to acquire minority interests in TwentyFour Asset Manage-ment LLP are the discount interest rate (30-06-17: 12.0%; 31-12-16: 12.0%) that will be used to discount future cash flows, as well as the long-term growth of these cash flows (30-06-17: 1.0%; 31-12-16: 1.0%). The following table shows how the measurement is affected by changes in these two assumptions.
Key assumptions
Variation of the Change in the fair value Change in the fair valuekey assumption as of 30-06-17 as of 31-12-16
in CHF mn in CHF mnDiscount rate +1 percentage point (4.0) (4.1)Discount rate –1 percentage point 4.7 4.9Long-term growth +1 percentage point 2.1 2.1Long-term growth –1 percentage point (1.9) (1.8)
In the case of the asset from the earn-out agreement re-lated to the acquisition of Finter Bank Zurich AG, a reason-ably realistic change in input parameters has no significant impact on Vontobel’s consolidated financial statements.
A change in the net asset value of investment funds or in the price of unlisted shares leads to a proportional change in fair value of these financial instruments. A reasonably realistic change in input parameters has no significant impact on Vontobel’s consolidated financial statements.
Day 1 profitWhen a financial instrument is recognized for the first time, the transaction price provides the best indication of the fair value unless the fair value of this financial instrument can be evidenced by comparison with other observable current market transactions involving the same instrument (level 1 instrument) or is based on a val-uation method that uses market data (level 2 instrument). If this is the case, the difference between the transaction price and the fair value – referred to as “day 1 profit” – is recorded in “Trading income” in the case of trading port-folio assets and liabilities, other financial instruments at fair value and derivative financial instruments and is recorded in “Other comprehensive income” in the case of financial investments.
In the case of level 3 instruments, the “day 1 profit” is deferred and is not recognized in the income statement. It is only recorded as “Trading income” or as “Other com-prehensive income” when the fair value can be deter-mined using observable market data. During the financial year and the previous year, no positions with deferred day 1 profit were recorded.
Reclassifications within the fair value hierarchyIn the first half 2017 (first respectively second half-year of 2016), positions with a fair value of CHF 55.3 mn (6 months ending 30-06-16: CHF 88.9 mn; 6 months end-ing 31-12-16: CHF 60.8 mn) were reclassified from level 1 to level 2, positions with a fair value of CHF 21.5 mn (6 months ending 30-06-16: CHF 57.4 mn; 6 months end-ing 31-12-16: CHF 58.0 mn) were reclassified from level 2 to level 1, and positions with a fair value of CHF 0.0 mn (6 months ending 30-06-16: CHF 0.0 mn; 6 months ending 31-12-16: CHF 0.0 mn) were reclassified from level 2 to level 3. In the event of changes in the availability of market prices (market liquidity) or of binding net asset values of investment funds, reclassifications are made at the end of the period under review.
Vontobel, Half-Year Report 2017 47

12b Financial instruments measured at amortized costThe following table shows the book value, the estimated
fair value and the fair value hierarchy of those financial instruments that are measured at amortized cost.
Financial instruments measured at amortized cost
30-06-17 31-12-16Fair value Book value Fair value Book value
CHF mn Level 1 Level 2 Level 3 Total Total Total TotalAssetsCash 6,536.3 0.0 - 6,536.3 6,536.3 6,374.0 6,374.0Due from banks - 1,127.7 - 1,127.7 1,127.7 1,502.7 1,502.7Cash collateral for reverse-repurchase agreements - 933.4 - 933.4 933.4 823.1 823.1Loans - 2,956.3 - 2,956.3 2,925.2 2,626.1 2,601.9Other financial assets1 27.6 700.1 - 727.7 727.7 305.1 305.1Total 6,563.9 5,717.5 0.0 12,281.4 12,250.3 11,631.0 11,606.8
LiabilitiesDue to banks - 804.4 - 804.4 804.4 1,139.0 1,139.0Due to customers - 9,638.0 - 9,638.0 9,638.0 9,058.5 9,058.5Other financial liabilities1 0.9 818.9 - 819.8 819.8 271.5 271.5Total 0.9 11,261.3 0.0 11,262.2 11,262.2 10,469.0 10,469.0
1 The position mainly includes the accrued interest as well as open settlement positions.
Short-term financial instruments at amortized cost or par value Included here are accounts due from/to banks, loans and accounts due to customers as well as cash collateral from repurchase and for reverse-repurchase agreements that have a maturity or a refinancing profile of at most one year, the balance sheet item “cash”, as well as financial instruments included in other assets/liabilities (primarily accrued interest and open settlement positions). In the case of short-term financial instruments, it is assumed that the book value is close enough to the fair value.
Long-term financial instruments at amortized costIncluded here are accounts due from/to banks, loans and accounts due to customers as well as cash collateral from repurchase and for reverse-repurchase agreements that have a maturity or a refinancing profile of over one year. Fair value is determined using the present value method.
48 Vontobel, Half-Year Report 2017
Notes to the consolidated financial statements

13 Off-balance sheet information
Off-balance sheet information
30-06-17 31-12-16 Change to 31-12-16CHF mn CHF mn CHF mn in %
Contingent liabilities 423.4 422.3 1.1 0Irrevocable commitments 58.4 32.0 26.4 83Fiduciary transactions 1,166.0 1,046.8 119.2 11Contract volumes of derivatives 23,381.8 19,536.1 3,845.7 20
14 Litigation
In 2014, the German tax authorities launched an investi-gation into Vontobel and a large number of other Swiss financial institutions. Vontobel is currently holding talks with the German authorities to obtain transparency and legal certainty for the bank, its employees and its clients. Vontobel is doing so although it has long adopted a future-oriented approach in its business – especially with German clients – and has systematically reviewed the tax status of its clients and actively supported their efforts to regularize their tax status. We have recorded an appropri-ate level of provisions relating to remaining litigation risks in Germany.
In connection with the fraud committed by Bernard Madoff, the liquidators of investment vehicles that invested directly or indirectly in Madoff funds have filed lawsuits with various courts against more than 100 banks and custodians. The litigation is targeted at investors who redeemed their investments in these vehicles between 2004 and 2008. The liquidators are demanding that the investors repay the sums involved because they consider them to have been obtained unjustly as a result of the redemptions. Since the liquidators often only know the names of the investors’ custodian banks, they have filed the lawsuits against them. Several legal entities of Vontobel are or may be affected by the litigation in their capacity as a bank or custodian. The claims filed against Vontobel since 2010 concern the redemption of investments worth around USD 43.1 mn. However, based on the information currently available to it, Vontobel believes the probability of a lawsuit resulting in an outflow of funds is low and has therefore decided not to set aside any provisions for such a lawsuit, but rather to disclose the amount under contin-gent liabilities.
Vontobel, Half-Year Report 2017 49
Off-balance sheet and other information

15 Client assets
Client assets
30-06-17 31-12-16 Change to 31-12-16CHF bn CHF bn CHF bn in %
Assets under management 146.5 138.5 8.0 6Other advised client assets 11.0 10.4 0.6 6Structured products outstanding 7.2 6.4 0.8 13Total advised client assets 164.7 155.3 9.4 6Custody assets 43.0 40.1 2.9 7Total client assets 207.7 195.4 12.3 6
Client assetsClient assets is a broader term than assets under manage-ment and comprises all bankable assets that are managed by or deposited with Vontobel, including assets that are
held solely for transaction or custody purposes and for which further services are provided, as well as investment products offered by Financial Products to give private and institutional clients access to all asset classes and markets.
Assets under management
30-06-17 31-12-16 Change to 31-12-16CHF bn CHF bn CHF bn in %
Assets in self-managed collective investment instruments 40.6 37.4 3.2 9Assets with management mandate 59.6 57.5 2.1 4Other assets under management 46.3 43.6 2.7 6Total assets under management (including double counts) 146.5 138.5 8.0 6
of which double counts 4.2 3.7 0.5 14
Calculation in accordance with the guidelines issued by the Swiss Financial Market Supervisory Authority (FINMA) concerning accounting standards for financial institutions and Vontobel internal guidelines
Development of assets under management
CHF bn 30-06-17 30-06-16 31-12-16Total assets under management (incl. double counts) at the beginning of the period 138.5 136.3 127.8
Change attributable to net new money 0.3 (8.7) (1.9)Change attributable to market value 8.2 0.2 4.7Change attributable to other effects (0.5)1 0.0 7.92
Total assets under management (incl. double counts) at the balance sheet date 146.5 127.8 138.51 The decrease in assets under management reflects the reclassification of certain assets (CHF 0.5 bn) that are not held for investment purposes.2 Acquisition of Vescore AG as per 20 September 2016
Assets under management and net inflows/outflows of new moneyAssets under management are calculated and reported in accordance with the guidelines issued by the Swiss Finan-cial Market Supervisory Authority (FINMA) concerning accounting standards for financial institutions. Assets under management comprise all of the assets managed or held for investment purposes of private, corporate and institutional clients excluding borrowings, as well as assets in self-managed collective investment instruments. This includes all amounts due to customers on savings and deposit accounts, fixed-term and fiduciary deposits, and
all valued assets. Assets under management that are deposited with third parties are included to the extent that they are managed by a Vontobel company. Assets under management only include those assets on which Vontobel generates considerably higher income than on assets that are held solely for custody purposes or the execution of transactions. These types of custody assets are reported separately. Assets that are counted more than once, i. e. in several categories of assets under management to be disclosed, are shown under double counts. They primarily include shares in self-managed collective investment in-struments in client portfolios.
50 Vontobel, Half-Year Report 2017
Notes to the consolidated financial statements
Net inflows or outflows of assets under management during the reporting period consist of the acquisition of new clients, the departure of clients as well as inflows and outflows of assets from existing clients. This also includes borrowing and the repayment of loans. The calculation of the net inflow or outflow of new money is performed at the level “total assets under management” (excl. double counts). If there is a change in the service provided, result-ing in the reclassification of assets under management as assets held for custody purposes or vice versa, this is recorded as an outflow of new money or an inflow of new money, respectively. Securities-related and currency-related changes in market value, interest income and dividends, fee charges, loan interest paid and the impacts of acquisitions and disposals in Vontobel’s subsidiaries or businesses do not constitute inflows or outflows of assets.
16 Events after the balance sheet date
No events have occurred since the balance sheet date that affect the relevance of the information provided in the half-year 2017 financial statements and would therefore need to be disclosed.
Vontobel, Half-Year Report 2017 51

This page has been left intentionally blank.

Segment reporting
17 Segment reporting principles
External segment reporting reflects the organizational structure of Vontobel as well as internal management reporting, which forms the basis for the assessment of the financial performance of the segments and the allocation of resources to the segments.
The segments correspond to the divisions, which comprise the following activities:
Private BankingPrivate Banking encompasses portfolio management ser-vices for private clients, investment advisory, custodian services, financial advisory services relating to legal, inheri-tance and tax matters, lending against collateral, mortgage loans, pension advice and wealth consolidation services.
Asset ManagementAsset Management specializes in active asset management, and is positioned as a multi-boutique provider. Its products are distributed to institutional clients, indirectly through wholesale channels, and also by cooperation partners.
Investment BankingInvestment Banking focuses on the structured products and derivatives business, services for external asset man-agers, brokerage, corporate finance, securities and foreign exchange trading, and securities services supplied by Transaction Banking.
Corporate CenterThe Corporate Center provides core services for the divisions, and comprises the support units Operations, Finance & Risk, and Corporate Services as well as the Board of Directors support units.
Income, expenses, assets and liabilities are allocated to the divisions on the basis of client responsibility or accord-ing to the principle of origination. Items that cannot be allocated directly to the divisions are reported in the Corporate Center accounts. The Corporate Center also includes consolidating entries.
The costs of the services supplied internally are reported in the item “Services from/to other segment(s)” as a re-duction in costs for the service provider and as an increase in costs for the recipient. This cost allocation is based on agreements that are renegotiated periodically according to the same principle as if they were concluded between independent third parties (“at arm’s length”).
Vontobel, Half-Year Report 2017 53

Segment reporting
CHF mn (6 months)Private
BankingAsset
ManagementInvestment
BankingCorporate
Center 30-06-17
TotalNet interest income 16.0 0.1 4.7 13.9 34.7Other operating income 116.0 201.6 164.1 1.1 482.8Operating income 132.0 201.7 168.8 15.0 517.5Personnel expense 55.4 82.3 59.4 65.0 262.1General expense 7.7 21.9 24.7 47.5 101.8Services from/to other segment(s) 40.0 25.4 19.2 (84.6) 0.0Depreciation of property, equipment and intangible assets 1.5 2.5 2.7 23.0 29.7Valuation adjustments, provisions and losses 0.3 0.1 0.0 1.0 1.4Operating expense 104.9 132.2 106.0 51.9 395.0Segment profit before taxes 27.1 69.5 62.8 (36.9) 122.5Taxes 21.0Net profit 101.5
of which minority interests 2.8
Additional informationSegment assets 2,559.9 477.0 6,895.2 11,234.0 21,166.1Segment liabilities 7,002.8 743.7 10,070.6 1,833.3 19,650.4Allocated equity according to BIS1 145.2 270.0 209.9 98.8 723.9Client assets (CHF bn) 41.2 106.8 62.6 (2.9) 207.7Net new money (CHF bn) 1.0 (1.7) 1.0 0.0 0.3Capital expenditure 0.0 0.0 0.0 21.8 21.8Employees (full-time equivalents) 390.3 398.5 376.9 477.2 1,642.9
1 The allocation of the regulatory capital required in accordance with BIS standards to the individual segments is based on the principle of origination. With regard to capital requirements for credit risks related to balance sheet assets, allocation is based on guidelines analogous to those used for reporting segmental assets. The prescribed deduction of CHF 274.4 mn from core capital for intangible assets has been included in the figures above of the divisions Private Banking and Asset Management. The valuation adjustments of own liabilities are assigned to the Investment Banking division. The deduction of CHF 65.7 mn from core capital for treasury shares is not included in the figures above.
Information on regions1
CHF mn (6 months) SwitzerlandEurope excl. Switzerland Americas
Other countries2 Consolidation
30-06-17Total
Operating income related to external customers 260.4 112.4 63.3 81.4 517.5Assets 14,806.0 606.2 142.3 7,114.8 (1,503.2) 21,166.1Property, equipment and intangible assets 342.4 77.3 2.9 1.5 424.1Capital expenditure 21.2 0.1 0.2 0.3 21.8
1 Reporting is based on operating locations.2 Mainly U.A.E.
54 Vontobel, Half-Year Report 2017
Notes to the consolidated financial statements

Segment reporting
CHF mn (6 months)Private
BankingAsset
ManagementInvestment
BankingCorporate
Center 30-06-16
TotalNet interest income 11.9 0.3 1.8 25.6 39.6Other operating income 110.7 210.3 130.8 5.4 457.2Operating income 122.6 210.6 132.6 31.0 496.8Personnel expense1 49.6 80.5 46.7 61.8 238.6General expense 6.2 19.3 23.2 45.0 93.7Services from/to other segment(s) 38.5 23.2 22.6 (84.3) 0.0Depreciation of property, equipment and intangible assets 1.5 2.1 2.3 24.0 29.9Valuation adjustments, provisions and losses 0.2 0.2 0.2 4.3 4.9Operating expense 96.0 125.3 95.0 50.8 367.1Segment profit before taxes 26.6 85.3 37.6 (19.8) 129.7Taxes 24.0Net profit 105.7
of which minority interests 2.4
Additional informationSegment assets 2,183.8 377.5 5,145.1 10,683.5 18,389.9Segment liabilities 6,736.6 603.6 8,304.5 1,334.8 16,979.5Allocated equity according to BIS2 138.2 194.0 194.4 104.0 630.6Client assets (CHF bn) 36.0 91.8 54.9 (3.4) 179.3Net new money (CHF bn) 0.9 (9.7) 0.1 0.0 (8.7)Capital expenditure 0.1 0.7 0.0 12.4 13.2Employees (full-time equivalents) 369.2 323.7 349.6 451.9 1,494.4
1 Personnel expense includes the impacts of changes to Swiss pension fund regulations in the amount of CHF 11.1 mn (primarily the reduction of conversion rates). This positive impact was broken down according to the employer contributions made during the reporting period and allocated to the divisions (Private Banking CHF 3.0 mn; Asset Management CHF 2.0 mn; Investment Banking CHF 2.6 mn; Corporate Center CHF 3.5 mn).
2 The allocation of the regulatory capital required in accordance with BIS standards to the individual segments is based on the principle of origination. With regard to capital requirements for credit risks related to balance sheet assets, allocation is based on guidelines analogous to those used for reporting segmental assets. The prescribed deduction of CHF 205.2 mn from core capital for intangible assets has been included in the figures above of the divisions Private Banking and Asset Management. The valuation adjustments of own liabilities are assigned to the Investment Banking division. The deduction of CHF 67.2 mn from core capital for treasury shares is not included in the figures above.
Information on regions1
CHF mn (6 months) SwitzerlandEurope excl. Switzerland Americas
Other countries2 Consolidation
30-06-16Total
Operating income related to external customers 252.4 103.8 87.1 53.5 496.8Assets 13,199.7 582.3 150.0 6,243.9 (1,786.0) 18,389.9Property, equipment and intangible assets 269.3 83.0 4.0 1.5 357.8Capital expenditure 11.9 0.1 0.5 0.7 13.2
1 Reporting is based on operating locations.2 Mainly U.A.E.
Vontobel, Half-Year Report 2017 55

Segment reporting
CHF mn (6 months)Private
BankingAsset
ManagementInvestment
BankingCorporate
Center 31-12-16
TotalNet interest income 13.4 0.0 3.3 11.4 28.1Other operating income 108.3 204.1 141.4 102.4 556.2Operating income 121.7 204.1 144.7 113.8 584.3Personnel expense 54.5 77.7 53.1 60.9 246.2General expense 7.4 22.6 22.1 43.9 96.0Services from/to other segment(s) 36.9 23.3 20.3 (80.5) 0.0Depreciation of property, equipment and intangible assets 1.6 2.1 2.3 26.4 32.4Valuation adjustments, provisions and losses 0.7 0.2 (0.1) 17.3 18.1Operating expense 101.1 125.9 97.7 68.0 392.7Segment profit before taxes 20.6 78.2 47.0 45.8 191.6Taxes 32.9Net profit 158.7
of which minority interests 2.2
Additional informationSegment assets 2,380.5 383.0 5,409.0 11,221.4 19,393.9Segment liabilities 6,985.4 685.9 8,513.3 1,695.2 17,879.8Allocated equity according to BIS1 142.5 270.5 191.3 99.6 703.9Client assets (CHF bn) 40.0 101.7 57.4 (3.7) 195.4Net new money (CHF bn) 1.1 (3.5) 0.5 0.0 (1.9)Capital expenditure 0.0 2.0 0.0 26.9 28.9Employees (full-time equivalents) 387.0 397.5 372.8 517.1 1,674.4
1 The allocation of the regulatory capital required in accordance with BIS standards to the individual segments is based on the principle of origination. With regard to capital requirements for credit risks related to balance sheet assets, allocation is based on guidelines analogous to those used for reporting segmental assets. The prescribed deduction of CHF 279.0 mn from core capital for intangible assets has been included in the figures above of the divisions Private Banking and Asset Management. The valuation adjustments of own liabilities are assigned to the Investment Banking division. The deduction of CHF 93.8 mn from core capital for treasury shares is not included in the figures above.
Information on regions1
CHF mn (6 months) SwitzerlandEurope excl. Switzerland Americas
Other countries2 Consolidation
31-12-16 Total
Operating income related to external customers 337.7 109.4 67.1 70.1 584.3Assets 13,845.4 597.6 135.3 6,415.1 (1,599.5) 19,393.9Property, equipment and intangible assets 347.8 80.0 3.7 1.4 432.9Capital expenditure 26.6 2.0 0.3 0.0 28.9
1 Reporting is based on operating locations.2 Mainly U.A.E.
56 Vontobel, Half-Year Report 2017
Notes to the consolidated financial statements

Additional informations
Vontobel Holding AG registered shares
Stock exchange listing SIX Swiss ExchangeISIN CH001 233 554 0Security number 1 233 554Par value CHF 1.00
Ticker symbols
Bloomberg VONN SWReuters VONTZn.STelekurs VONN
Moody ’s Ratings
Bank Vontobel AGLong-term deposit rating Aa3Short-term deposit rating Prime-1Long-term counterparty risk assessment A2 (cr)Short-term counterparty risk assessment Prime-1 (cr)Vontobel Holding AGLong-term rating (issuer rating) A3
Financial calendar
Investor Day 2017 31 August 2017Business update third quarter 2017 25 October 2017Publication annual results 2017 13 February 2018Annual General Meeting 2018 18 April 2018
Contacts
Investor RelationsMichel Roserens, Head Investor RelationsTelephone +41 58 283 76 97
Susanne Borer, Deputy Head Investor RelationsTelephone +41 58 283 73 29
E-mail [email protected] RelationsPeter Dietlmaier, Head Corporate CommunicationsTelephone +41 58 283 59 30
Rebeca Garcia, Deputy Head Corporate CommunicationsTelephone +41 58 283 76 69
E-mail [email protected]
Investors’ informations
Vontobel, Half-Year Report 2017 57

SwitzerlandZurichVontobel Holding AGGotthardstrasse 43, CH-8022 ZurichTelephone +41 58 283 59 00vontobel.com
Bank Vontobel AGGotthardstrasse 43, CH-8022 ZurichTelephone +41 58 283 71 11
Vontobel Asset Management AGGotthardstrasse 43, CH-8022 ZurichTelephone +41 58 283 71 50
Vontobel Swiss Wealth Advisors AGGotthardstrasse 43, CH-8022 ZurichTelephone +41 44 287 81 11
Vontobel Fonds Services AGGotthardstrasse 43, CH-8022 ZurichTelephone +41 58 283 74 77
Vontobel Securities AGGotthardstrasse 43, CH-8022 ZurichTelephone +41 58 283 71 11
BaselBank Vontobel AG, Basel BranchSt. Alban-Anlage 58, CH-4052 BaselTelephone +41 58 283 21 11
Vontobel Asset Management AGBirsstrasse 320B, CH-4052 BaselTelephone +41 58 702 00 00
BerneBank Vontobel AG, Berne BranchSpitalgasse 40, P.O. Box, CH-3001 BerneTelephone +41 58 283 22 11
GenevaBanque Vontobel SA, Geneva Branch Rue du Rhône 31, CH-1204 Geneva Telephone +41 58 283 25 00
Vontobel Swiss Wealth Advisors SAGeneva BranchRue du Rhône 31, CH-1204 GenevaTelephone +41 22 809 81 51
LucerneBank Vontobel AG, Lucerne BranchSchweizerhofquai 3a, CH-6002 LucerneTelephone +41 58 283 27 11
LuganoBank Vontobel AG, Lugano BranchVia Ferruccio Pelli 1, CH-6900 LuganoTelephone +41 58 283 23 11
AustraliaSydneyVontobel Asset Management Australia Pty Ltd. Level 20, Tower 2, 201 Sussex St,NSW-Sydney 2000Telephone: +61 2 9006 1284
ChinaHong KongVontobel Asset Management Asia Pacific Ltd.1901 Gloucester Tower, The Landmark15 Queen’s Road Central, HK-Hong KongTelephone +852 3655 3990
Vontobel Wealth Management (Hong Kong) Ltd.1901 Gloucester Tower, The Landmark15 Queen’s Road Central, HK-Hong KongTelephone +852 3655 3900
Vontobel Limited1901 Gloucester Tower, The Landmark15 Queen’s Road Central, HK-Hong KongTelephone +852 3655 3969
GermanyCologneBank Vontobel Europe AG, Cologne BranchAuf dem Berlich 1, D-50667 CologneTelephone +49 221 20 30 00
Frankfurt am MainBank Vontobel Europe AGFrankfurt am Main Branch WestendDuo, Bockenheimer Landstrasse 24D-60323 Frankfurt am MainTelephone +49 69 695 99 60
Vontobel Financial Products GmbHWestendDuo, Bockenheimer Landstrasse 24D-60323 Frankfurt am MainTelephone +49 69 920 373 0
HamburgBank Vontobel Europe AGHamburg Branch, SudanhausGrosse Bäckerstrasse 13, D-20095 HamburgTelephone +49 40 638 587 0
MunichBank Vontobel Europe AGAlter Hof 5, D-80331 MunichTelephone +49 89 411 890 0
Vescore Deutschland GmbHLeopoldstrasse 8 –10, D-80802 MunichTelephone +49 89 211 133 0vescore.com
Great BritainLondonBank Vontobel Europe AG, London Branch22 Sackville Street, 3rd FloorGB-London W1S 3DNTelephone +44 207 255 83 00
Vontobel Asset Management S.A.London Branch22 Sackville Street, 3rd FloorGB-London W1S 3DNTelephone +44 207 255 83 00
TwentyFour Asset Management LLP8th Floor, The Monument Building11 Monument Street, GB-London EC3R 8AFTelephone +44 207 015 89 00twentyfouram.com
ItalyMilanVontobel Asset Management S.A.Milan BranchPiazza degli Affari, 3, I-20123 MilanTelephone +39 02 6367 3411
LiechtensteinVaduzBank Vontobel (Liechtenstein) AGPflugstrasse 20, FL-9490 VaduzTelephone +423 236 41 11
LuxembourgLuxembourgVontobel Asset Management S.A.2 – 4, rue Jean l’Aveugle, L-1148 Luxembourg Telephone +352 26 34 74 1
SingaporeSingaporeVontobel Financial Products (Asia Pacific) Pte. Ltd. 8 Marina View, Asia Square Tower 1, Level 07-04, SGP-Singapore 018960 Telephone +65 6407 1170
SpainMadridVontobel Asset Management S.A.Madrid BranchPaseo de la Castellana, 95, Planta 18, E-28046 MadridTelephone +34 91 520 95 95
United Arab EmiratesDubaiVontobel Financial Products Ltd.Liberty House, Office 913,Dubai International Financial CentreP.O. Box 506814, Dubai, United Arab EmiratesTelephone +971 (4) 703 85 00
USADallasVontobel Swiss Wealth Advisors LtdDallas Branch, 100 Crescent Court, Suite 825Dallas, TX 75201, USATelephone +1 469 399 3800
New YorkVontobel Asset Management, Inc.1540 Broadway, 37th/38th FloorNew York, NY 10036, USATelephone +1 212 415 70 00vusa.com
Vontobel Securities AG, New York Branch1540 Broadway, 40th FloorNew York, NY 10036, USATelephone +1 212 792 58 20
Vontobel Swiss Wealth Advisors LtdNew York Branch1540 Broadway, 40th FloorNew York, NY 10036, USATelephone +1 646 568 38 41
Where to find us
Additional informations
58 Vontobel, Half-Year Report 2017

Legal information
This Half-Year Report is intended solely for information purposes and is expressly not addressed to any person who by domicile or nationality is pro-
hibited to receive such information according to the applicable law. The information and views contained in it do not constitute a request, offer or
recommendation to use a service, to buy or sell investment instruments or to conduct other transactions. By their very nature, forward-looking state-
ments involve inherent risks and uncertainties, both general and specific, and risks exist that predictions, forecasts, projections and other outcomes
described or implied in forward-looking statements will not be achieved.

Vontobel Holding AG, Gotthardstrasse 43, 8022 Zurich, Telephone +41 58 283 59 00, vontobel.com
This page has been left intentionally blank.

PARTIES
THE ISSUER’S REGISTERED OFFICE OUR GUARANTOR’S REGISTERED OFFICE
Gotthardstrasse 43 CH-8002
Zurich, Switzerland
SPONSOR
Vontobel Limited 1901 Gloucester Tower
The Landmark 15 Queen’s Road Central
Central, Hong Kong
Gotthardstrasse 43 CH-8002
Zurich, Switzerland
AUDITORS TO THE ISSUER AND THE GUARANTOR
Ernst & Young Ltd Maagplatz 1
P.O. Box CH-8010 Zurich
Related Documents