SHARING OF FINANCIAL WISDOM Others may quote and refer to the contents on this website provided that they have the author's consent and proper reference is made to investingbythebooks.com. Bank Primer Thank you to Swedbank and Kepler Cheuvreux Swedbank for releasing the material What we will cover This text was originally published September 30, 2016 as a thematic piece in Swedbank’s quarterly smalland midcap product called The Companion. It is, with slight cosmetic alterations, republished by InvestingByTheBooks thanks to Swedbank’s and Kepler Cheuvreux Swedbank’s kind permission. Note that this altered text is solely the responsibility of the author and not of the above mentioned firms. Mats Larsson, September 29, 2018 Contents 8.1 Introduction 8.2 The Spread Business 8.3 Investment Banking 8.4 The Other Stuff 8.5 Financial Statements 8.6 Banking on Troubles 8.7 Risk Management 8.8 Regulation 8.9 Fintech 8.10 Bank Valuation 8.11 Investing in Banks 8.1 Introduction Financials is one of the really big global sectors in equity markets. In fact, measured in market capitalization it’s the largest one. It’s also a more diverse sector than many perhaps realize hosting a number of different business models. In the GICS framework the sector is made up of four industry groups, namely banks, diversified financials, insurance and real estate. Each industry group in turn contains between one and three so-called industries as pictured by the boxes in the picture below. One common theme is that the businesses in the financial sector are interest rate sensitive.

Welcome message from author
This document is posted to help you gain knowledge. Please leave a comment to let me know what you think about it! Share it to your friends and learn new things together.
Transcript
SHARING OF FINANCIAL WISDOM
Others may quote and refer to the contents on this website provided that they have the author's consent and proper reference is made to investingbythebooks.com.
Bank Primer
Thank you to Swedbank and Kepler Cheuvreux Swedbank for releasing the material What we will cover
This text was originally published September 30, 2016 as a thematic piece in Swedbank’s quarterly small-‐and mid-‐cap product called The Companion. It is, with slight cosmetic alterations, republished by InvestingByTheBooks thanks to Swedbank’s and Kepler Cheuvreux Swedbank’s kind permission. Note that this altered text is solely the responsibility of the author and not of the above-‐mentioned firms. Mats Larsson, September 29, 2018
Contents § 8.1 Introduction § 8.2 The Spread Business § 8.3 Investment Banking § 8.4 The Other Stuff § 8.5 Financial Statements § 8.6 Banking on Troubles § 8.7 Risk Management § 8.8 Regulation § 8.9 Fintech § 8.10 Bank Valuation § 8.11 Investing in Banks
8.1 Introduction Financials is one of the really big global sectors in equity markets. In fact, measured in market capitalization it’s the largest one. It’s also a more diverse sector than many perhaps realize hosting a number of different business models. In the GICS framework the sector is made up of four industry groups, namely banks, diversified financials, insurance and real estate. Each industry group in turn contains between one and three so-called industries as pictured by the boxes in the picture below. One common theme is that the businesses in the financial sector are interest rate sensitive.
SHARING OF FINANCIAL WISDOM
Others may quote and refer to the contents on this website provided that they have the author's consent and proper reference is made to investingbythebooks.com.
A large industry group dominated by banks
Bankassurance
We keep real estate in financials
Starting with banks
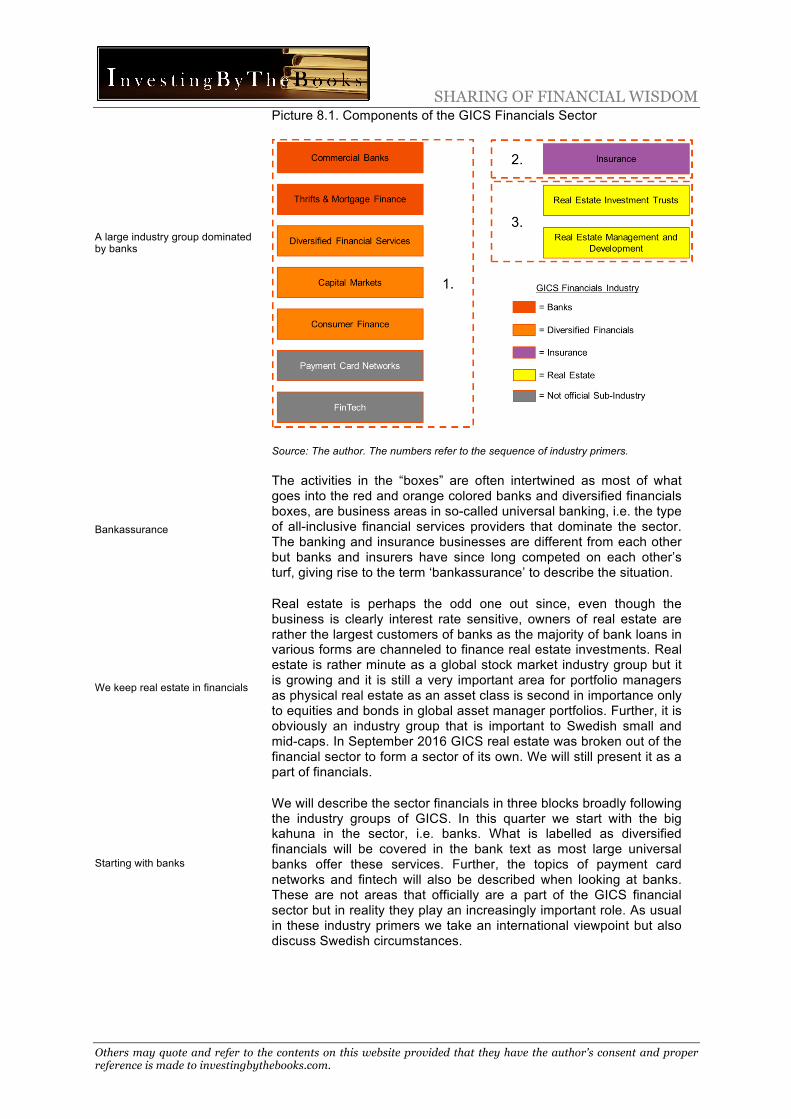
Picture 8.1. Components of the GICS Financials Sector
Source: The author. The numbers refer to the sequence of industry primers.
The activities in the “boxes” are often intertwined as most of what goes into the red and orange colored banks and diversified financials boxes, are business areas in so-called universal banking, i.e. the type of all-inclusive financial services providers that dominate the sector. The banking and insurance businesses are different from each other but banks and insurers have since long competed on each other’s turf, giving rise to the term ‘bankassurance’ to describe the situation.
Real estate is perhaps the odd one out since, even though the business is clearly interest rate sensitive, owners of real estate are rather the largest customers of banks as the majority of bank loans in various forms are channeled to finance real estate investments. Real estate is rather minute as a global stock market industry group but it is growing and it is still a very important area for portfolio managers as physical real estate as an asset class is second in importance only to equities and bonds in global asset manager portfolios. Further, it is obviously an industry group that is important to Swedish small and mid-caps. In September 2016 GICS real estate was broken out of the financial sector to form a sector of its own. We will still present it as a part of financials.
We will describe the sector financials in three blocks broadly following the industry groups of GICS. In this quarter we start with the big kahuna in the sector, i.e. banks. What is labelled as diversified financials will be covered in the bank text as most large universal banks offer these services. Further, the topics of payment card networks and fintech will also be described when looking at banks. These are not areas that officially are a part of the GICS financial sector but in reality they play an increasingly important role. As usual in these industry primers we take an international viewpoint but also discuss Swedish circumstances.

SHARING OF FINANCIAL WISDOM
Others may quote and refer to the contents on this website provided that they have the author's consent and proper reference is made to investingbythebooks.com.
ROE pre and post 2008…
…today they are lower
What are banks for?
A market place for money…
Let’s start with some background. Financials as a global sector – dominated by the large banks in the western world - has seen some ups and downs. From early 1980’s to mid-1990’s ROE declined due to pressure on profit margins. Then followed a marked and long lasting trend of improving ROE up until 2008 (albeit with a bump in the road during the crisis 2002/03). Leverage levels that had stayed fairly constant from the early 1980’s, in the late 1990’s started to edge up and the levels between 2002 and 2008 was clearly higher than historical precedents. Hence, the first part of the secular ROE improvement was driven by profitability improvements and the second part by a higher risk taking. Especially US banks saw uncharacteristically high ROE prior to the GFC. As a share of the total market capitalization in the US (as measured by MSCI) the financial sector rose from 8% early 1990 to 23% late 2006 and back to the current 15%.
The global ROE that up to 2008 had averaged above 11% nosedived to negative levels in the financial crisis to subsequently stabilize at a lower than historic average level in later years while the leverage gradually has returned to the 1980’s and 1990’s level. The lower ROE is in part driven by reduced risk taking but mainly by higher capital requirements. The leverage in the US is now at historically relatively low levels while banks in other regions probably still will shrink balance sheets further. New capital requirements are enforced and the massively delayed US Volcker-rule to curb banks’ proprietary trading will be implemented. The global post-crisis loan growth has with time become quite decent but the main part of the growth comes from emerging markets, not least China. The last two years US loan growth has picked up as well.
Which functions do banks perform? Which customer needs are met? The basic function of a bank is to transfer money from those who have an excess and want to save for a later date to those who have a shortage and want to invest now (or consume for that matter). The former often deposit money with the bank and the latter borrow from the bank. By this the customers of the bank can allocate their usage of funds over time. The spread between the interest of the party who wants to save and the interest of the one who wants to borrow is generally the main earnings in a bank. This spread is a function of that the bank through its diversification over a large number of financiers and customers are more credit worthy than the customers borrowing the money.
Thus, to some extent a bank is a market square where those that supply money meet those who demand money, i.e. it’s a matching service. In addition to acting as the meeting place, the bank’s service is to change the risk profile of the customer’s transactions by pooling the money from a large number of lenders and borrowers and by this changing the counterparty risk. For example the credit risk of the depositor is largely diversified away. The pooling of money also allows lenders and borrowers with different maturity/liquidity expectations to meet. Generally those who deposit money want immediate access to their money and those who borrow want the option to keep the funds for as long as they would want. The pooling of many deposits further allows banks to make larger individual loans.
SHARING OF FINANCIAL WISDOM
Others may quote and refer to the contents on this website provided that they have the author's consent and proper reference is made to investingbythebooks.com.
…and more
But there are alternatives
Retail banking…
…is a mature business in the western world…
…and investment banking is seeing some troubles
Banking license
Additionally, the bank is also the party that executes the transactions made on the square, i.e. handles payments, the record keeper who keeps track of all the transactions and a safe storage of money in-between transactions.
Apart from using bank lending the two alternatives to matching savers and borrowers are direct lending or capital markets. Direct lending has been very cumbersome historically, as finding a counterparty that matches the size of the sum someone wants to borrow/lend and also matches the same expectation on the maturity of the transaction is hard. On top of this, direct lending that lacks the diversification, places a cost on the two parties to gather the information to handle the counterparty risk, i.e. the risk that the other will not fulfil his obligations. With the aid of improved technology direct lending in the form of peer-to-peer lending is emerging as a more viable alternative. We will cover this area further below. The capital market alternative for the one who wants to borrow is to issue an interest bearing security. This way to raise funds is however seldom an alternative for anyone apart from large or medium sized corporations.
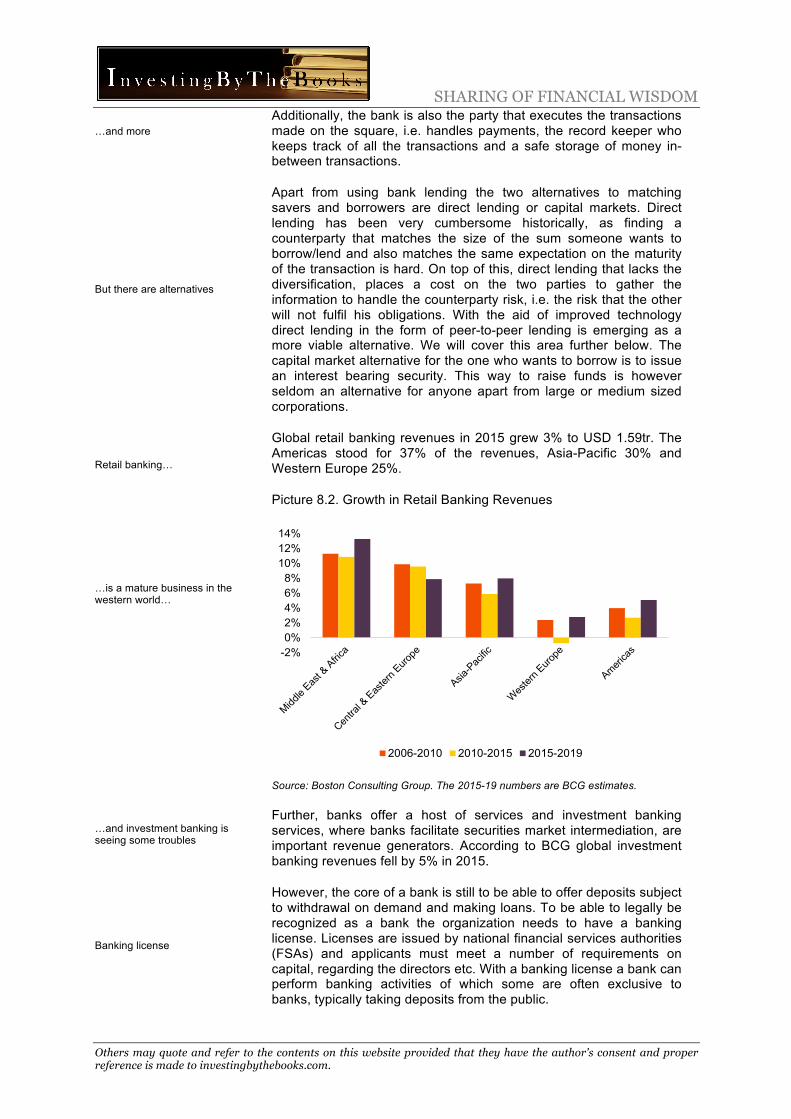
Global retail banking revenues in 2015 grew 3% to USD 1.59tr. The Americas stood for 37% of the revenues, Asia-Pacific 30% and Western Europe 25%.
Picture 8.2. Growth in Retail Banking Revenues
Source: Boston Consulting Group. The 2015-19 numbers are BCG estimates.
Further, banks offer a host of services and investment banking services, where banks facilitate securities market intermediation, are important revenue generators. According to BCG global investment banking revenues fell by 5% in 2015.
However, the core of a bank is still to be able to offer deposits subject to withdrawal on demand and making loans. To be able to legally be recognized as a bank the organization needs to have a banking license. Licenses are issued by national financial services authorities (FSAs) and applicants must meet a number of requirements on capital, regarding the directors etc. With a banking license a bank can perform banking activities of which some are often exclusive to banks, typically taking deposits from the public.
-2%0%2%4%6%8%10%12%14%
2006-2010 2010-2015 2015-2019
SHARING OF FINANCIAL WISDOM
Others may quote and refer to the contents on this website provided that they have the author's consent and proper reference is made to investingbythebooks.com.
Banks create more money than…
…central banks
The money multiplier…
On a societal level banks aid central banks in creating money. What money is, is however no easy thing to pin down. Your economics textbook will traditionally say something along the line that money is a social good that a) acts like a medium of exchange by which buyers and sellers can pay and receive payment for goods and services, b) store value over time and c) works as a unit of account for pricing, accounting etc. This in a modern society obviously applies to notes and coins, but also to bank deposits and central bank reserves that are largely virtual and, some would argue, to crypto-currencies like Bitcoin.
Central banks only create a minority of countries monetary base through their physical or digital printing press. Banks create money through leverage and extending credit. The process is often called fractional reserve banking and the tool used is called the money multiplier. If someone comes by $ 1,000 and deposits them at a bank, then the bank can turn around and lend that money to someone else. Hence, the depositor still has his money left but the borrower also has new money to spend. Note that the bank has capital requirements placed on itself from a regulator (and financiers) which means that it cannot lend the full $1,000 (hence the name fractional reserve banking). Say that 10% has to be retained then obviously the borrower only gets his hand on $900. Both the passive side and the active side of the bank’s balance sheet will expand as a consequence.
Now, say that the new debtor doesn’t need to spend the money immediately but instead again deposits them in the bank. The bank can now lend a further $810 to someone else and so on. In theory $1,000 will in the end turn into $ 10,000 ($1,000/10%). This is the effect of the money multiplier.
Theoretical money multiplier, m = 1/reserve requirement
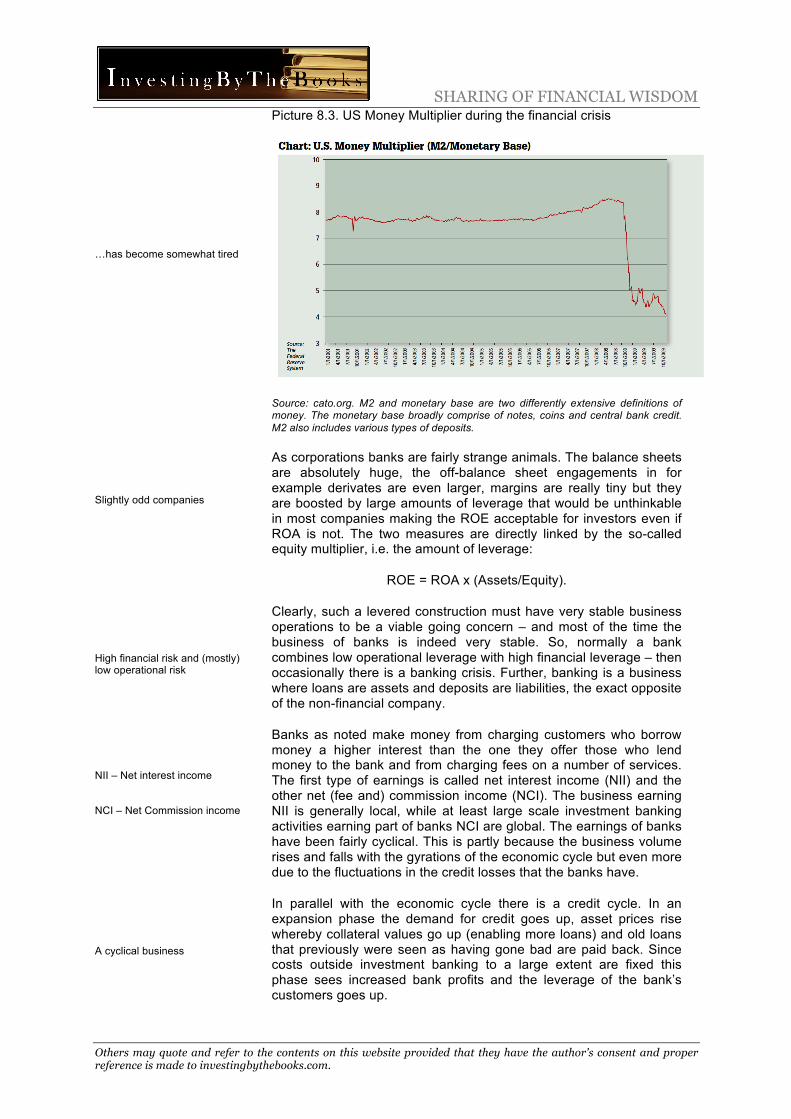
The lower/higher the reserve requirements on the bank the more/less money the banking system will create. The central bank directly affects this process by injecting or subtracting money into the banking system, by influencing the interest rates banks charge and sometimes by regulating the amount of reserves that has to be retained in the banks. As the aftermath of the 2008 financial crisis clearly showed the willingness and ability of banks to part with money (as opposed to repair their balance sheet) and the demand from customers to borrow will obviously also affect the effect of the multiplier by adding more or less friction into the process.
SHARING OF FINANCIAL WISDOM
Others may quote and refer to the contents on this website provided that they have the author's consent and proper reference is made to investingbythebooks.com.
…has become somewhat tired
Slightly odd companies
High financial risk and (mostly) low operational risk
NII – Net interest income
NCI – Net Commission income
A cyclical business
Picture 8.3. US Money Multiplier during the financial crisis
Source: cato.org. M2 and monetary base are two differently extensive definitions of money. The monetary base broadly comprise of notes, coins and central bank credit. M2 also includes various types of deposits.
As corporations banks are fairly strange animals. The balance sheets are absolutely huge, the off-balance sheet engagements in for example derivates are even larger, margins are really tiny but they are boosted by large amounts of leverage that would be unthinkable in most companies making the ROE acceptable for investors even if ROA is not. The two measures are directly linked by the so-called equity multiplier, i.e. the amount of leverage:
ROE = ROA x (Assets/Equity).
Clearly, such a levered construction must have very stable business operations to be a viable going concern – and most of the time the business of banks is indeed very stable. So, normally a bank combines low operational leverage with high financial leverage – then occasionally there is a banking crisis. Further, banking is a business where loans are assets and deposits are liabilities, the exact opposite of the non-financial company.
Banks as noted make money from charging customers who borrow money a higher interest than the one they offer those who lend money to the bank and from charging fees on a number of services. The first type of earnings is called net interest income (NII) and the other net (fee and) commission income (NCI). The business earning NII is generally local, while at least large scale investment banking activities earning part of banks NCI are global. The earnings of banks have been fairly cyclical. This is partly because the business volume rises and falls with the gyrations of the economic cycle but even more due to the fluctuations in the credit losses that the banks have.
In parallel with the economic cycle there is a credit cycle. In an expansion phase the demand for credit goes up, asset prices rise whereby collateral values go up (enabling more loans) and old loans that previously were seen as having gone bad are paid back. Since costs outside investment banking to a large extent are fixed this phase sees increased bank profits and the leverage of the bank’s customers goes up.
SHARING OF FINANCIAL WISDOM
Others may quote and refer to the contents on this website provided that they have the author's consent and proper reference is made to investingbythebooks.com.
Mark Twain has a quote for everything!
But there are structural changes as well
A department store
Money-flows through a bank
The rest of the text
GFC – Global financial crisis
At some point the cycle turns whereby credit demand dries up, credit supply dries up, credit losses increase and potentially assets have to be written down - all dragging down the banks’ profits. The fact that banks in unison tend to tighten lending requirements when the economic going gets tough has given rise to the well-known Mark Twain quote, “A banker is a fellow who lends you his umbrella when the sun is shining, but wants it back the minute it begins to rain”.
Although both NII and NCI increase with a buoyant economy the latter usually increases faster. Hence, the business mix says something about where in the cycle we are. For example, over time NII has been a larger contributor to the total profits of SEB than has the NCI, but both in 2000 and in 2006/07 NCI surpassed NII. These points in time were obviously the peaks of those economic cycles.
One feature of a modern universal bank is that it’s like a department store or supermarket for multiple financial services, increasing the complexity of the organizations. Several of these services are separate business areas and have different business models.
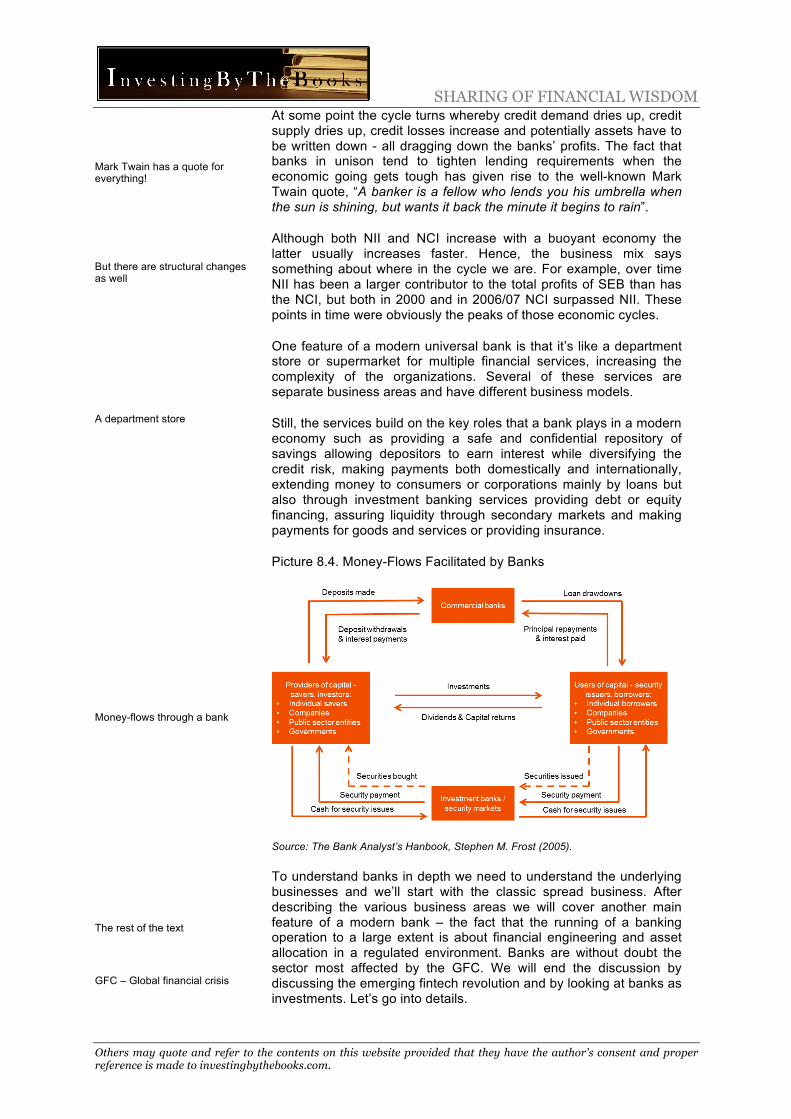
Still, the services build on the key roles that a bank plays in a modern economy such as providing a safe and confidential repository of savings allowing depositors to earn interest while diversifying the credit risk, making payments both domestically and internationally, extending money to consumers or corporations mainly by loans but also through investment banking services providing debt or equity financing, assuring liquidity through secondary markets and making payments for goods and services or providing insurance.
Picture 8.4. Money-Flows Facilitated by Banks
Source: The Bank Analyst’s Hanbook, Stephen M. Frost (2005).
To understand banks in depth we need to understand the underlying businesses and we’ll start with the classic spread business. After describing the various business areas we will cover another main feature of a modern bank – the fact that the running of a banking operation to a large extent is about financial engineering and asset allocation in a regulated environment. Banks are without doubt the sector most affected by the GFC. We will end the discussion by discussing the emerging fintech revolution and by looking at banks as investments. Let’s go into details.

SHARING OF FINANCIAL WISDOM
Others may quote and refer to the contents on this website provided that they have the author's consent and proper reference is made to investingbythebooks.com.
+ Interest income
- Interest expenses
= Net interest income
NII = asset margin + liability margin
NIM – Net interest margin
Transformations
Steepening yield curves…
8.2 The Spread Business The main business of commercial banks is to match savers and borrowers so that the majority of bank profits is created by the spread between interest earned on assets (mainly loans and securities) and interest paid on liabilities (mainly deposits and so-called wholesale funding). The interest earned on assets is called – surprise – interest income, the interest paid on liabilities is called interest expense and if we deduct interest expenses from interest income we get net interest income (NII).
NII is driven by asset volume times the spread that banks earn on assets over funding costs. NII can be further broken down by into an asset margin and a liability margin by using some intermediary interest rate factor (like for example a two year government bond yield) to separate the two sides. NII divided by the interest bearing assets (or sometimes alternatively average assets) is called net interest margin (NIM) and is a key profitability metric for banks.
The capital that has been made available to the bank is pooled as it is recognized on the balance sheet. This allows a number of transformations to take place. Some are simple, like for example taking funds from deposits with a varying interest rate and lending to a corporation at a fixed rate or taking many small deposits and lending a larger amount to a party.
The main benefit of the pooled capital is however that it allows a bank to guarantee immediate liquidity to the depositors while also guaranteeing borrowers continued access to funds for an extended period. This so-called maturity transformation is vital to customers, to society and as such a potential revenue source for the banks. Interest rates on financial arrangements with short maturities are generally lower than those with longer maturities. Hence, by borrowing on short maturities and lending on long the spread banks earn increases. From this follows that a steep upward sloping yield curve means a larger spread between the funding at the short end and the lending at the long end.
As a rule of thumb, steepening yield curves increase bank profits and vice versa. However, as we will discuss later regulatory changes has put a lid on much of this effect and the correlation between the slope of the yield curve and banking profits is nowadays actually very low. The rule of thumb that many investors look to is turning less relevant.

SHARING OF FINANCIAL WISDOM
Others may quote and refer to the contents on this website provided that they have the author's consent and proper reference is made to investingbythebooks.com.
…are generally profitable
Maturity gap
Picture 8.5. What the Bank Pays and What the Bank Charges
Source: The author
Banks disclose the maturity profile of their assets and liabilities by presenting the sums owned and owed in different maturity buckets. If you’ve read textbooks on banking they will say that using so-called maturity gap analysis investors and analysts can see how much assets and liabilities re-price at different maturities and by this they can estimate the bank’s interest rate sensitivity. In this analysis the assets in each maturity bucket are divided by the liabilities with the same maturity.
An interest rate sensitivity below one means more liabilities than assets. Hence, the liability heavy short end of maturities will have interest rate sensitivity below one and the asset heavy long end will come in above one. As noted above, steepening yield curves increase bank profits and vice versa. The sensitivities can then, in a way we will not cover, be summed up to give a total understanding of how changes in interest rates affect the NII.
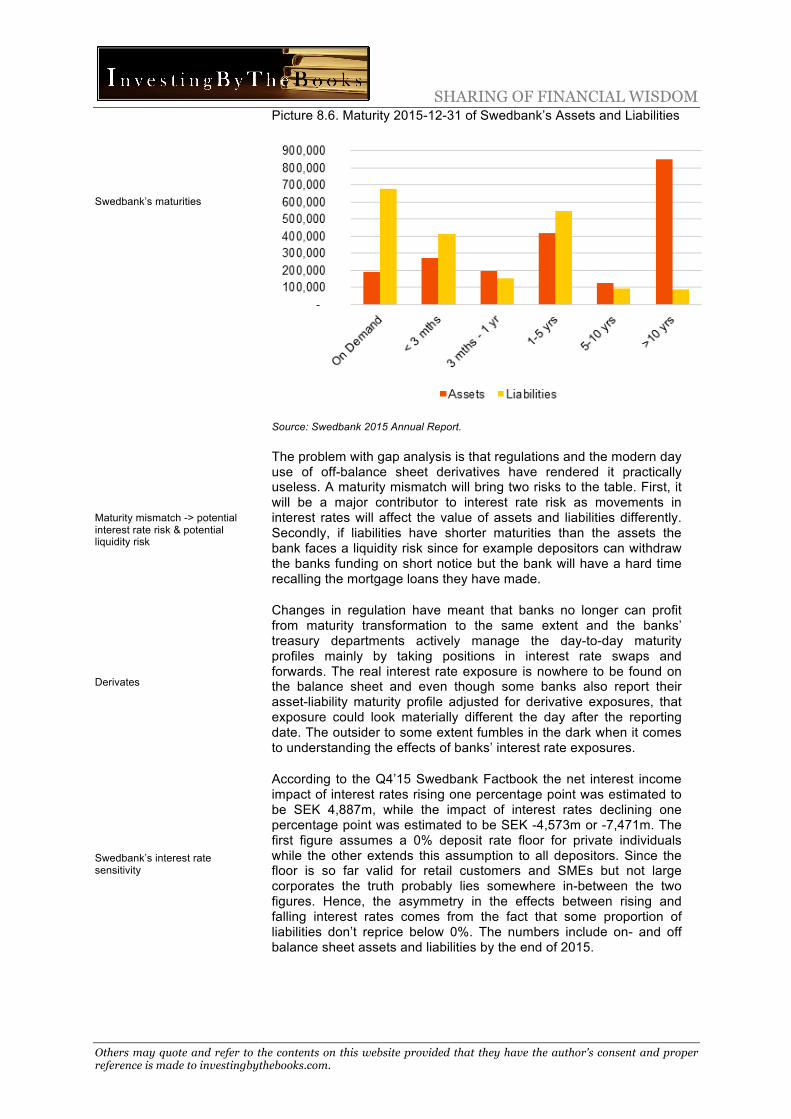
The picture below clearly shows that the assets on Swedbank’s balance sheet have much longer maturities that the liabilities.
SHARING OF FINANCIAL WISDOM
Others may quote and refer to the contents on this website provided that they have the author's consent and proper reference is made to investingbythebooks.com.
Swedbank’s maturities
Maturity mismatch -> potential interest rate risk & potential liquidity risk
Derivates
Swedbank’s interest rate sensitivity
Picture 8.6. Maturity 2015-12-31 of Swedbank’s Assets and Liabilities
Source: Swedbank 2015 Annual Report.
The problem with gap analysis is that regulations and the modern day use of off-balance sheet derivatives have rendered it practically useless. A maturity mismatch will bring two risks to the table. First, it will be a major contributor to interest rate risk as movements in interest rates will affect the value of assets and liabilities differently. Secondly, if liabilities have shorter maturities than the assets the bank faces a liquidity risk since for example depositors can withdraw the banks funding on short notice but the bank will have a hard time recalling the mortgage loans they have made.
Changes in regulation have meant that banks no longer can profit from maturity transformation to the same extent and the banks’ treasury departments actively manage the day-to-day maturity profiles mainly by taking positions in interest rate swaps and forwards. The real interest rate exposure is nowhere to be found on the balance sheet and even though some banks also report their asset-liability maturity profile adjusted for derivative exposures, that exposure could look materially different the day after the reporting date. The outsider to some extent fumbles in the dark when it comes to understanding the effects of banks’ interest rate exposures.
According to the Q4’15 Swedbank Factbook the net interest income impact of interest rates rising one percentage point was estimated to be SEK 4,887m, while the impact of interest rates declining one percentage point was estimated to be SEK -4,573m or -7,471m. The first figure assumes a 0% deposit rate floor for private individuals while the other extends this assumption to all depositors. Since the floor is so far valid for retail customers and SMEs but not large corporates the truth probably lies somewhere in-between the two figures. Hence, the asymmetry in the effects between rising and falling interest rates comes from the fact that some proportion of liabilities don’t reprice below 0%. The numbers include on- and off balance sheet assets and liabilities by the end of 2015.
SHARING OF FINANCIAL WISDOM
Others may quote and refer to the contents on this website provided that they have the author's consent and proper reference is made to investingbythebooks.com.
Assets earn interest
Charges for risks
Corporate lending
Self-reinforcing loops
The Asset Side of the Balance Sheet Earning Interest
In the spread business assets earn interest. The level of interest earned will come down to the interest a bank can charge on the various assets and the mix of assets it holds.
Maturity transformation is not the only way banks can increase the spread between the interest earned on assets and the interest paid on liabilities. To start off, since the credit rating of banks as noted above is higher than the average borrowers and banks diversify the customer credit risk over a large number of loans, banks make a credit risk arbitrage. Banks further charge a spread to compensate for the interest rate risk they take, for the liquidity risk and above all for the credit risk. Sadly, not all customers repay all what they owe the bank, so the pricing of the loans that the bank makes must compensate for this. By having the capability to price the credit risk effectively banks can earn more in extra interest than they lose due to credit losses and by this add to the total profits of the bank.
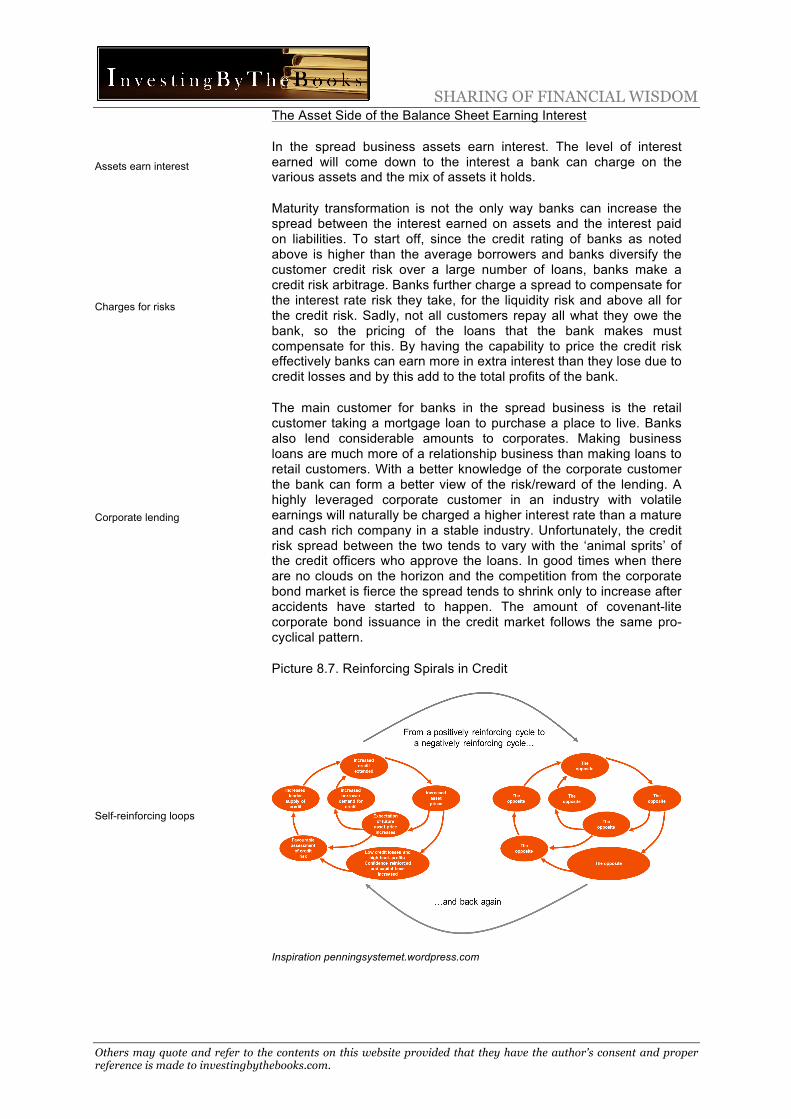
The main customer for banks in the spread business is the retail customer taking a mortgage loan to purchase a place to live. Banks also lend considerable amounts to corporates. Making business loans are much more of a relationship business than making loans to retail customers. With a better knowledge of the corporate customer the bank can form a better view of the risk/reward of the lending. A highly leveraged corporate customer in an industry with volatile earnings will naturally be charged a higher interest rate than a mature and cash rich company in a stable industry. Unfortunately, the credit risk spread between the two tends to vary with the ‘animal sprits’ of the credit officers who approve the loans. In good times when there are no clouds on the horizon and the competition from the corporate bond market is fierce the spread tends to shrink only to increase after accidents have started to happen. The amount of covenant-lite corporate bond issuance in the credit market follows the same pro-cyclical pattern.
Picture 8.7. Reinforcing Spirals in Credit
Inspiration penningsystemet.wordpress.com
SHARING OF FINANCIAL WISDOM
Others may quote and refer to the contents on this website provided that they have the author's consent and proper reference is made to investingbythebooks.com.
Good times feed on themselves
Penetration – bank lending/GDP
Taking on more and more debt that costs less and less
Securities…
Clearly, banks’ loan volume growth depends on both supply and demand. Supply increases in good economic times when banks are in good financial shape, they have plenty of funds to lend and since customers are equally prosperous the prospects for them to repay the loans are deemed satisfactory. Demand also increases in good economic times as companies see good business opportunities which create investment needs and finally real estate prices rise bringing the needed size of mortgage loans up with them in a self-fulfilling spiral. Unfortunately the spiral at times spins in the opposite direction.
The correlation between GDP growth and bank lending growth is very high and there is also some correlation between GDP/capita and household loans/GDP, i.e. wealthier people borrow more in relative terms. However, there are also secular trends in loan penetration (i.e. in the loan volume in relation to GDP) as economies de-lever and re-lever. If loan growth far outstrips GDP growth, so-called increasing penetration, this can be a warning signal of a coming credit bubble. Prior to the financial crisis 2007/08 Spain and Ireland saw significantly increasing loan penetration.
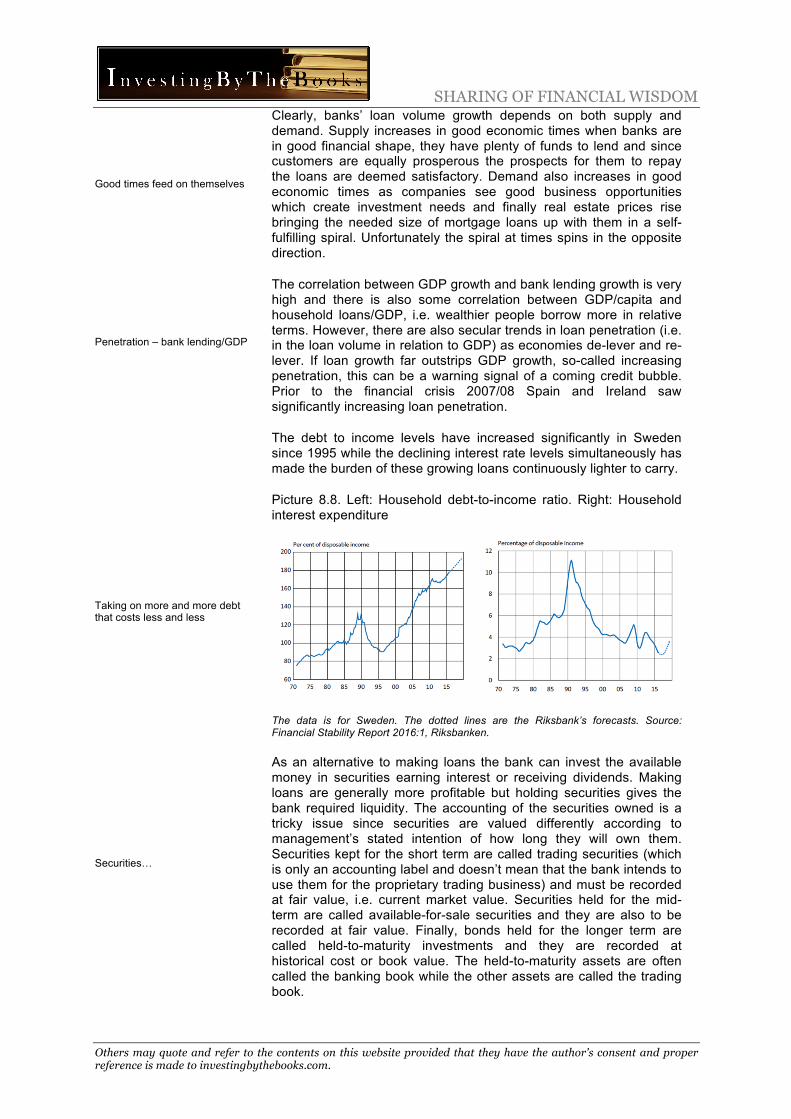
The debt to income levels have increased significantly in Sweden since 1995 while the declining interest rate levels simultaneously has made the burden of these growing loans continuously lighter to carry.
Picture 8.8. Left: Household debt-to-income ratio. Right: Household interest expenditure
The data is for Sweden. The dotted lines are the Riksbank’s forecasts. Source: Financial Stability Report 2016:1, Riksbanken.
As an alternative to making loans the bank can invest the available money in securities earning interest or receiving dividends. Making loans are generally more profitable but holding securities gives the bank required liquidity. The accounting of the securities owned is a tricky issue since securities are valued differently according to management’s stated intention of how long they will own them. Securities kept for the short term are called trading securities (which is only an accounting label and doesn’t mean that the bank intends to use them for the proprietary trading business) and must be recorded at fair value, i.e. current market value. Securities held for the mid-term are called available-for-sale securities and they are also to be recorded at fair value. Finally, bonds held for the longer term are called held-to-maturity investments and they are recorded at historical cost or book value. The held-to-maturity assets are often called the banking book while the other assets are called the trading book.

SHARING OF FINANCIAL WISDOM
Others may quote and refer to the contents on this website provided that they have the author's consent and proper reference is made to investingbythebooks.com.
…vary in accounting treatment
Liabilities costing interest
Deposits…
Any change in the value of securities held for trading is shown in the income statement while changes in the value of securities available-for-sale is recognized to the equity through the other comprehensive income statement as long as they aren’t sold and obviously securities held-to-maturity show no change in accounting value as long as they are kept. There are two issues here. First, if there isn’t a reliable market value then management has the choice to use theoretical models to establish fair value. Models like this introduce subjectivity in the valuation. Secondly, the intended investment horizon is a choice made by the holder of a security. Not in theory but in practice this opens up for switching the intended horizon depending on which gives the highest asset value. This was a feature among US banks in 2008/09 when plenty of troubled bonds suddenly became “investments” and by this could be recognized at historical cost.
The Liability Side of the Balance Sheet Costing Interest
It stands to reason that the spread between the interest earned on assets and the interest paid on liabilities isn’t only determined by the pricing and mix of the assets but also by the pricing and the mix of the liabilities. In today’s low interest rate environment it might not be obvious, and banks naturally want to point to their other advantages such as for example excellent customer service, but there is a competitive market for attracting deposits and some of this competition comes down to pricing, i.e. the interest offered on deposits.
Most think of deposits as a way to save and receive interest but for banks deposits are loans made to the bank that allow them to be in business. Banks compete for deposits because normally this is the cheapest form of financing and banks can in theory make money simply by having inflows of money from deposits and investing them in the overnight interbank market or with the central bank. However, it’s not only deposits that compete for the customers’ money. There are numerous other investment alternatives available. In for example Sweden an unusually large part of the retail customers’ money is invested in mutual funds making Swedish banks relatively dependent on funding sources other than deposits. Then again, the banks themselves have a large part of the mutual fund market earning them nice fees.

SHARING OF FINANCIAL WISDOM
Others may quote and refer to the contents on this website provided that they have the author's consent and proper reference is made to investingbythebooks.com.
…have competition
Current accounts or demand deposits
Term deposits
Cheap funding
Retail deposit rates still not below 0%
Corporate deposits
Picture 8.9. Fund managers competing with bank deposits
Source: Google Images
Deposits are of two primary types. On the one hand there are current accounts or demand deposits where savers even in normal interest rate environments receive close to zero interest but can access their funds whenever they like. On the other hand there are term deposits that comes with some type of liquidity condition such as the obligation to give notice for example three month prior to a withdrawal or deposits that are locked for a fixed period. Term deposits give the customers higher interest and for the bank they are clearly more expensive but on the other hand their longer duration makes the bank less interest rate sensitive.
Access to cheaper funding from deposits was an important driver of bank profitability when interest rates were higher. Also, variations in interest rate levels added to the profitability as banks usually were slightly quicker to adjust market interest increases on loans than they were on deposits, while interest rate declines always were promptly visible in deposit rates.
With all interest rates so close to zero today the value of deposits has decreased from an earnings point of view. In theory, the interest on the interbank market could, as some central banks’ policy rates, turn negative while banks so far have refrained from negative interest rates on deposits for retail customers to curb cash outflows. For the cynical reader negative interest rates could be interpreted as one reason why banks are so keen on the digitalization of money. With no physical bills and coins left outstanding people cannot withdraw their money out of the financial system and place their money in the mattress in case of negative interest rates charged on deposits.
Corporate deposits are considered less valuable than retail deposits as corporations demand higher interest and often have deposits at several banks which make it easy for them to quickly leave the bank in times of trouble. Still, even in the case of highly liquid demand deposits most customers – retail or corporate - don’t normally withdraw their money on a daily basis. The true average maturity of deposits is several years but it varies over time and averages don’t matter much in times of stress.

SHARING OF FINANCIAL WISDOM
Others may quote and refer to the contents on this website provided that they have the author's consent and proper reference is made to investingbythebooks.com.
Loan-to-deposit ratio
TED is an acronym formed from T-bill and ED, the ticker symbol for the Eurodollar futures contract
Other funding
Secured and unsecured loans
Covered bonds
Mortgage bonds
Considering how money is created through the above-described money multiplier and that the asset side and the liability side of a balance sheet must balance it should surprise few that deposit growth and asset growth tend to move in tandem. However, since banks have other means of funding themselves the liability mix changes over time. A common ratio that illuminates this mix is the loan-to-deposit ratio that at least to some extent is a measure of banks’ loan capacity.
Alternative, generally more expensive, sources of funds for banks are borrowing from other banks with excess liquidity in the interbank market or borrowing from the central bank. These loans tend to have short maturity. The interest rate differential between loans made on the U.S interbank market and short term government bills are called the TED-spread.
As a corporation a bank can also issue various types of interest bearing securities to provide funding. Swedish banks have larger non-deposit funding than most other banks since Swedes tend to favor mutual funds over deposits. These securities can be secured or unsecured, they can be senior or junior and they vary in maturities.
Secured loans are those that are protected by an asset or collateral of some sort, like a mortgage or an auto loan. Unsecured loans offer no such protection and examples include credit cards, student loans and personal loans. If there are several loans taken by a bank the question arises which lender will be paid first if the bank ends up in economic difficulties. A senior loan will have the legal claim to the bank’s assets prior to a junior (or subordinated) loan. This is a relative game so a loan can be senior to one other loan but junior to a second. Even though it’s not a security, deposits are seen as unsecured subordinated debt, albeit with a government guarantee up to a certain amount.
Banks can issue unsecured bonds and they can be senior and subordinated. So-called covered bonds are secured and provide the bondholder with collateral protection in a pool of loans and as secured they are a reasonably low-cost funding for banks. The pools of loans are generally mortgages that are legally segregated from the bank but stay on the balance sheet. The bank issues the loans to the public with the mortgage loans as collateral and the loans of course in their turn have collateral in the underlying real estate. The cash flow from the mortgages back up the interest rate payments to the bondholders and the bonds trade on a relatively liquid secondary market.
There are often regulatory restrictions on the loan-to-value ratio of the mortgages that can be pooled for covered bonds. Also in most cases banks, in all secured types of lending, will seek to ensure that the value of the collateral is at least 20-30% higher than the loan principal. In case of a bank failure the bondholder receives the pool of loans, as it will be ejected from the bank. The only way for the bondholder to lose money is if the bank first defaults and runs out of equity, the mortgage loan then defaults and the price of the collateralized real estate has finally dropped so low that the loan-to-value exceeds 100%.
SHARING OF FINANCIAL WISDOM
Others may quote and refer to the contents on this website provided that they have the author's consent and proper reference is made to investingbythebooks.com.
U.S. securitization
MBS – Mortgage-backed security
RMBS – Residential mortgage-backed security
Market-risk anyone?
Fannie and Freddie in the subprime crisis
In contrast to European banks that have kept their mortgage loans on their balance sheets American banks to a large extent have not. Instead loans are securitized and sold to other investors creating a secondary market for loans. Asset backed securities (ABS) are bonds that have collateral in a pool of income producing assets. These assets could be car loans, credit card receivables or student loans etc. but the most common pool of loan is to no ones surprise mortgages.
The most common ABS is the mortgage-backed security (MBS or RMBS where the R stands for residential). The mortgage payments pay the coupons on the securities. The mortgages are transferred to a legal entity separate from the bank called special purpose vehicle (SPV). In contrast to the above European bonds the US bondholder - since the assets now don’t belong to the bank and are not on its balance sheet - has no claim on the bank but instead directly on the pool of loans.
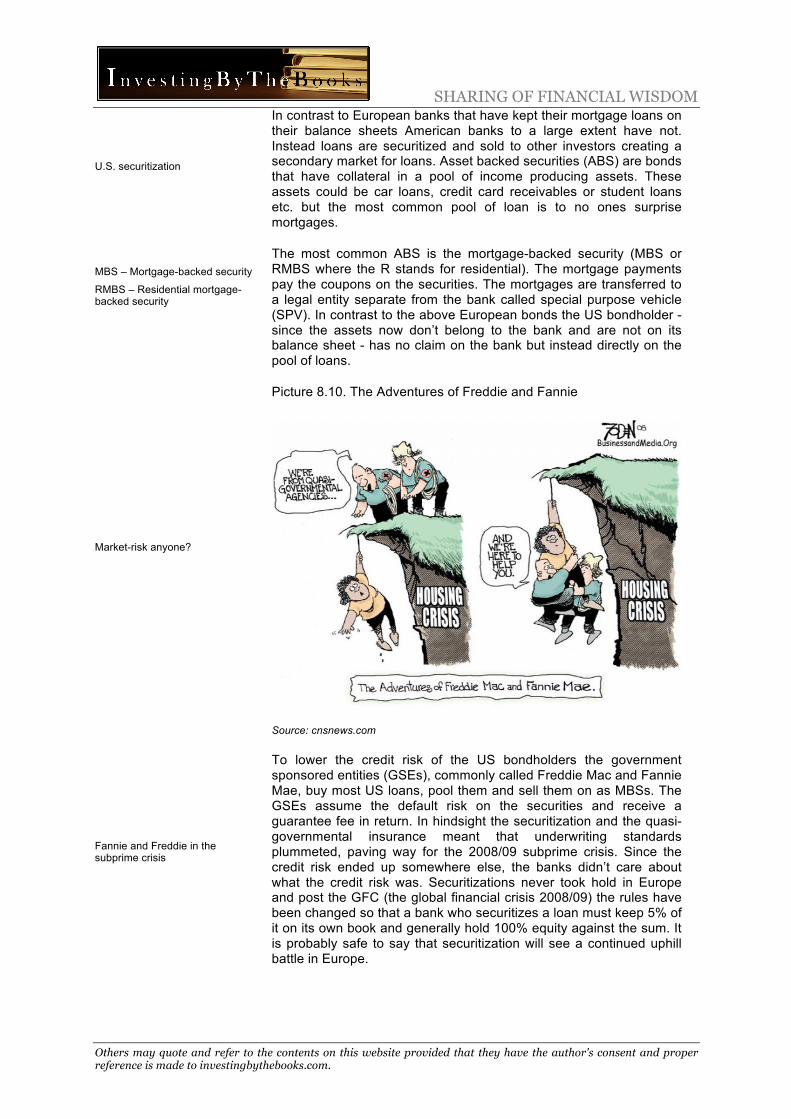
Picture 8.10. The Adventures of Freddie and Fannie
Source: cnsnews.com
To lower the credit risk of the US bondholders the government sponsored entities (GSEs), commonly called Freddie Mac and Fannie Mae, buy most US loans, pool them and sell them on as MBSs. The GSEs assume the default risk on the securities and receive a guarantee fee in return. In hindsight the securitization and the quasi-governmental insurance meant that underwriting standards plummeted, paving way for the 2008/09 subprime crisis. Since the credit risk ended up somewhere else, the banks didn’t care about what the credit risk was. Securitizations never took hold in Europe and post the GFC (the global financial crisis 2008/09) the rules have been changed so that a bank who securitizes a loan must keep 5% of it on its own book and generally hold 100% equity against the sum. It is probably safe to say that securitization will see a continued uphill battle in Europe.
SHARING OF FINANCIAL WISDOM
Others may quote and refer to the contents on this website provided that they have the author's consent and proper reference is made to investingbythebooks.com.
CP – Commercial paper
CD – Certificates of Deposit
Deals on primary and secondary markets
Some of what investment banks do
U.S. dominants
Commercial paper (CP) and Certificates of Deposit (CD) are short-term unsecured wholesale funding. Securities with shorter maturities offer banks cheaper funding than those with longer and prior to the global financial crisis this was a growing part of the bank liabilities. New liquidity rules and stress tests that assume that this funding cannot be renewed in a negative scenario have made the instruments much less attractive.
Unsecured debt in banks has historically been cheaper than for companies in general as investors – rightly - were counting on governments to bail out banks in case of trouble. The new bail-in rules post the crisis are trying to pass the buck back to the banks, which is changing the status of senior and junior unsecured debt in banks. We will come back to this below.
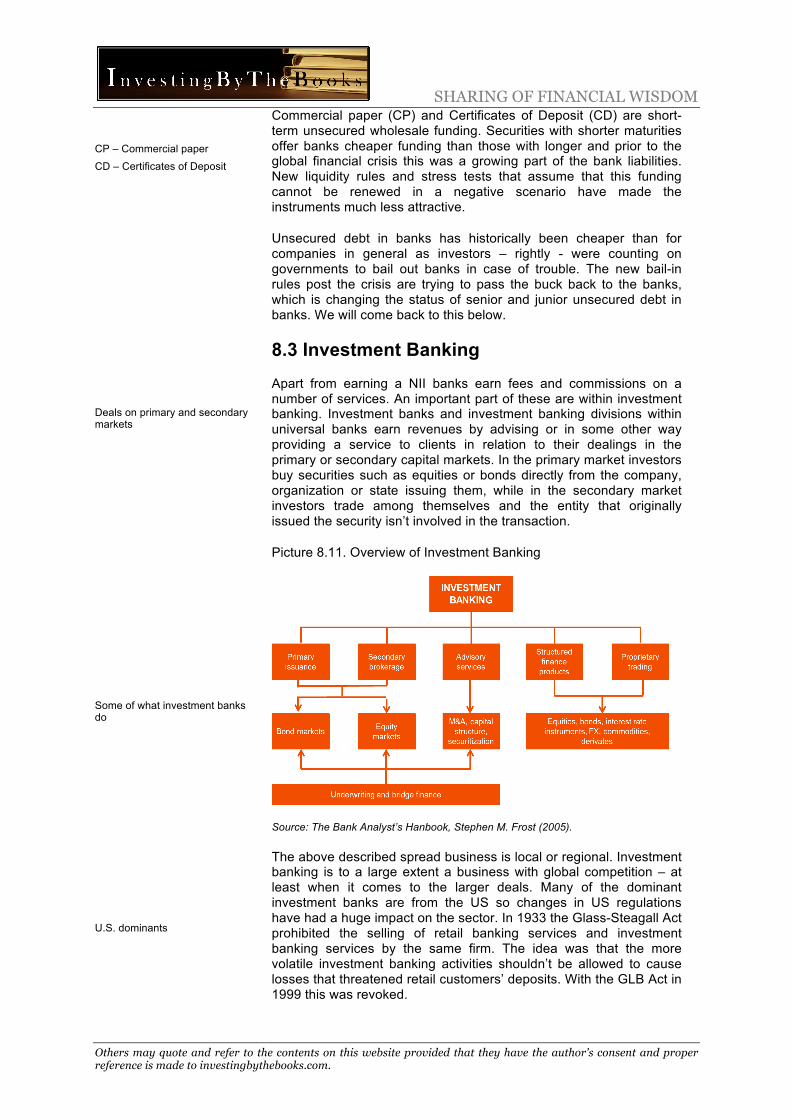
8.3 Investment Banking Apart from earning a NII banks earn fees and commissions on a number of services. An important part of these are within investment banking. Investment banks and investment banking divisions within universal banks earn revenues by advising or in some other way providing a service to clients in relation to their dealings in the primary or secondary capital markets. In the primary market investors buy securities such as equities or bonds directly from the company, organization or state issuing them, while in the secondary market investors trade among themselves and the entity that originally issued the security isn’t involved in the transaction.
Picture 8.11. Overview of Investment Banking
Source: The Bank Analyst’s Hanbook, Stephen M. Frost (2005).
The above described spread business is local or regional. Investment banking is to a large extent a business with global competition – at least when it comes to the larger deals. Many of the dominant investment banks are from the US so changes in US regulations have had a huge impact on the sector. In 1933 the Glass-Steagall Act prohibited the selling of retail banking services and investment banking services by the same firm. The idea was that the more volatile investment banking activities shouldn’t be allowed to cause losses that threatened retail customers’ deposits. With the GLB Act in 1999 this was revoked.

SHARING OF FINANCIAL WISDOM
Others may quote and refer to the contents on this website provided that they have the author's consent and proper reference is made to investingbythebooks.com.
IB turned UB
M&A – Mergers & Acquisitions
ECM – Equity Capital Markets
DCM – Debt Capital Markets
USD 61 billion
Corporate finance
Love the suspenders!
Pro-cyclical M&A
Post the financial crisis and despite the recent IPO-boom the revenues from investment banking have been lower than previously. Given the changing rules and turmoil in the crisis that threatened many IB-firms, many of the largest investment banks are today parts of universal banks. The only big investment banks that still generate more than half their sales from investment banking are Goldman Sachs and Credit Suisse.
Primary Markets
In the primary market banks earn revenues through fees mainly within M&A, ECM and DCM. The revenue line in the income statement often says “advisory and origination fees” where the former relates to M&A and the latter to ECM and DCM. Since such revenues are quite high profile and require relatively low levels of bank capital to support them, they are highly sought after and competition is fierce. The competition is however not on prices as fee levels have been relatively stable over the last decade.
The leaders of the advisory and origination business are large US and European banks. According to Dealogic the global market amounted to USD 61.1bn in 2014 and the top ten companies held slightly more than half of the global market shares.
In academia the term corporate finance is an area within finance that according to Wikipedia deals “with the sources of funding and the capital structure of corporations and the actions that managers take to increase the value of the firm to shareholders”. The corporate finance department in banks is an advisory business in the corporate finance discipline that mainly deals with M&A and ECM. In their characteristically modest fashion the employees of corporate finance departments simply call themselves “bankers”. With private equity’s (PE) rise to economic power, corporate finance professionals have seen increased competition. PE is involved in a growing amount of interesting deals and the PE professionals often have the skill to handle many of the previous corporate finance tasks internally.
Picture 8.12. Legendary Bankers
Felix Rohathyn, Lazard, Steve Rattner, Lazard, Bob Greenhill, Smith Barney, Bruce Wasserstein, Wasserstein Perella & Co, Joe Perella, Wasserstein Perella & Co and Ken Wilson, Goldman Sachs. Source: Google Images
The highly cyclical M&A practice is the embodiment of a relationship business as it deals with advice on major corporate events like acquisitions, mergers, restructurings and takeover defense strategies. The M&A banker has to nurture a wide network of corporate executives and board directors. You might think that companies would take the opportunity to do these deals in weak economic environments when asset prices are low but it is rather the opposite as greater trust in the economic outlook and filled war

SHARING OF FINANCIAL WISDOM
Others may quote and refer to the contents on this website provided that they have the author's consent and proper reference is made to investingbythebooks.com.
IPO – Initial Public Offering
Pitching power and placing power
Remuneration systems
Issuing bonds have been…
…a good business
chests give managers greater confidence to carry out the deals. In fairness they at times also pay for the acquisitions with their equally inflated own stock. The payment to the bank for M&A services is generally a fee comprising of a certain percentage of the transaction value.
ECM is a service provided to corporations related to raising equity capital including deals such as private placements, IPOs, rights issuances and so on. The term origination simply means that the ECM team creates the deal. The ECM team will help companies execute equity transactions in the primary market by structuring and syndication of the deal, handling regulatory demands and by marketing and distributing the deal. For this service they charge a fee that is also a certain percentage of the transaction value.
The main ECM business is IPOs. In both ECM and DCM it’s easier for the bank to market and distribute the deal if they have a large distribution platform and a leading secondary market capability with highly regarded security analysts. Leading research on the secondary market is both vital when pitching for deals and when marketing them to institutional clients. Since the sellers of shares on the primary market want to sell at high prices, the ECM business tends to vary with the stock market valuation level. Expensive and non-volatile stock markets are prosperous IPO environments. IPO fees vary with deal size and with the risk profile of the company (the smaller and riskier company the higher percentage fee) but according to Dealogic they averaged 2.4% in Europe 2014.
Corporate finance departments often also supply ancillary services to corporations like for example structuring of management remuneration systems. These services are often seen as less flashy but provide stable income in less buoyant market environments.
DCM is the debt equivalent of the ECM function of corporate finance departments. Contrary to the US where corporations for a long time have used the capital markets for funding through issuance of corporate bonds, banks have been the primary and often only corporate funding vehicles in Europe. After the financial crisis the banks on the one hand have been forced to shrink their balance sheets making the supply of bank lending scarcer and on the other hand the corporate lenders themselves saw the benefit of a diversified supply to capital as banks were unwilling to make loans mid-crisis. Luckily then banks have the debt capital market (DCM) departments whose job it is to help companies issue corporate bonds.
In parallel European insurance regulation has created a need among insurance companies to shift some of their portfolio assets from equities to fixed income, creating a demand for corporate bonds. Consequently the European corporate bond market has seen good growth the last few years - although the tepid economic cycle has made the growth somewhat less impressive than some DCM-officers may have hoped for a few years back since bank loans still offer more flexibility.
SHARING OF FINANCIAL WISDOM
Others may quote and refer to the contents on this website provided that they have the author's consent and proper reference is made to investingbythebooks.com.
Commission, price spread and prop trading
FICC – Fixed Income, Currencies and Commodities
Declining inventory
The issuance of corporate debt is divided between the investment grade market where issuers have (or at least should have) lower credit risk and the high yield market with higher credit risk. The fees in European DCM vary mainly with the level of credit risk and in 2014 they were 0.4% according to Dealogic. The larger size of the investment grade issues skews this average number to the downside.
Secondary Markets
The secondary markets provide liquidity to existing owners of securities. Equities that are perpetual securities have a active secondary market with good liquidity at least for the larger companies. Corporate bonds are to a higher degree bought at issuance and kept for their full maturities. The weighted average maturity of a corporate bond portfolio is usually around 5-7 years. In secondary markets 1) bank employed brokers trade clients’ securities earning a commission, 2) banks act as market makers earning a spread from the price paid for a security when buying it from one customer and the price received when selling it to another or 3) banks trade in the market with their own money aiming to earn investment income – so called proprietary trading, or prop trading.
Starting in the 1990s up until the financial crisis 2007/08 trading revenue increased very sharply as a percent of banks’ risk weighted assets. Banks added assets with low regulatory risk weights to trading books, a form of regulatory arbitrage and an unintended consequence of capital rules that were meant to keep risks at bay. Today the trend is the opposite and according to Boston Consulting Group global investment banking revenues declined 5% to USD 228bn in 2015 and the investment banking ROE fell to a 6% post crisis low. Apart from relatively high costs the reason was mainly a decline in secondary trading. Fixed Income, Currencies and Commodities (FICC) profitability fell from 70% of the investment banking profit pool three years ago to 44% in 2015.
FICC is a mixture of operations trading in various assets either on the behalf of a client or on the behalf of the bank itself. Rates have been the biggest FICC revenue generator for banks and include government bond trading, interest rate derivatives such as interest rate swaps, money market instruments and municipal finance. This is still a manual telephone market to a large extent. Banks take a small spread between the seller (bid) and the buyer (ask) when executing a client’s deal. To facilitate the trades banks as market makers often hold a small inventory of securities. Most products have low risk but the volumes are large.
In credit, investment grade and high yield corporate bonds are traded as well as other types of tradable loans. As noted above the liquidity is at times relatively low and this is a telephone-based market. The lower the liquidity the higher the bid-ask spread. Since regulators have raised the capital requirements for a bank’s holding of securities the market making inventories of corporate bonds have been lowered further threatening the liquidity of the market. Given the popularity of packaged corporate bond products like corporate bond funds, high yield ETFs, emerging market credit ETFs and so on, it could turn ugly if too many retail investors want to exit at the same time.
SHARING OF FINANCIAL WISDOM
Others may quote and refer to the contents on this website provided that they have the author's consent and proper reference is made to investingbythebooks.com.
FX – Foreign exchange
Small stable spreads
DMA – Direct market access
Brokers
§ Sales
§ Sales traders
§ Traders
Yours…
Foreign exchange (FX) includes cash transactions plus a number of delta one and delta two derivatives. Banks again take a small spread between the seller (bid) and the buyer (ask). Electronic trading increasingly drives this market - the margins are low but the volumes massive. In the US and some European countries trading of securitized products is a large segment. Finally there is the commodities segment with spot and derivatives trading in for example oil, metals or agricultural products. This is usually a small part of FICC.
From one point of view revenues earned from a bid-ask spread in market making for clients is a trading income as the bank owns the securities it has bought until it sells them. However, the spreads are relatively stable and are more dependent on trading volumes so the character is more similar to the commissions earned in equities. The bid-ask spread on highly liquid securities like 5-year rate swaps has varied between 0.5 bps and 1.5 bps the last decade. The FX spread on USDEUR has varied between 1 and 2 bps. To support the FICC business there are a number of commodity, fixed income and FX research analysts and a few economists. The chief economist of a bank is often a high profile position that comes with plenty of media coverage.
Moving on, the equity segment generates revenues from cash equities, equity derivatives and from prime services. In cash equities banks trade in equities earning commissions on trades executed or investment income on prop trading. The business also includes block trades and revenues from giving customers direct market access (DMA) to execute their own trades. The buying and selling of cash equities is fully computerized since many years which has increased customer transparency and significantly lowered commission levels. This has also spilled over on the funds available for equity research. According to the Economist, quoting Frost Consulting, the global equity-research budgets have dropped from USD 8.2bn in 2007 to an expected USD 3.4bn in 2017 – that equates to an annual decline of 8.4%.
The cash equity department is generally where the equity research department is located. General media often name those who execute the deals “brokers” but due to varying roles the internal lingo is more nuanced. The sales staff that market both the bank’s equity research and its transaction capabilities to institutional investors are simply called “sales”, the brokers executing the transactions that institutional investors make are called “sales traders” and those who trade equities with the bank’s own money are generally just called “traders”.
Picture 8.13. Just Another Day at the Job For the Brokers?
Source: Google Images

SHARING OF FINANCIAL WISDOM
Others may quote and refer to the contents on this website provided that they have the author's consent and proper reference is made to investingbythebooks.com.
CSA – Commission sharing agreements
OTC – Over the counter
Securities exchanges…
…have digitalized
When equity sales traders execute a transaction on behalf of an institutional investor the bank never owns the securities but only facilitates the matching between an external buyer and an external seller and by this earns a commission amounting to a certain percent of the transaction value. This commission pays for both the execution handled by the sales trader, the marketing of the sales representative and the advice of the research analyst. Within short this bundling of equity research and execution services will not be allowed towards mutual funds in the EU, who will then have to pay for the two services separately in an arrangement called commission sharing agreements (CSA). For the immediate future other institutional investors like pension funds and insurance companies can still pay for the bundled service through commissions.
Banks also trade in equity derivatives such as options, futures, forwards and swaps plus in convertible bonds and structured products. The bulk of these derivates have been so-called over the counter (OTC) that is it’s a transaction done directly between two parties without the usage of an exchange. Here it could be harder to track the business model from the outside. Some derivatives and structured products offered to clients could see the bank take the other side of the trade and hold the exposure (or it may instead sell the exposure to the market). In prime services banks help hedge fund clients with the financing of trades and with clearing and reporting. They also help in raising capital and stock lending. Revenues come from financing revenues and fees related to borrowing, stock lending, capital raisings etc.
The bank sales traders and proprietary traders execute their transactions on securities exchanges. There are separate exchanges for the various types of securities. The exchanges make money by charging a small fee on the transaction volume but also by fees charged when companies list their shares on the exchange, fees as payment for market data, technology services, co-location of servers, risk management services etc.
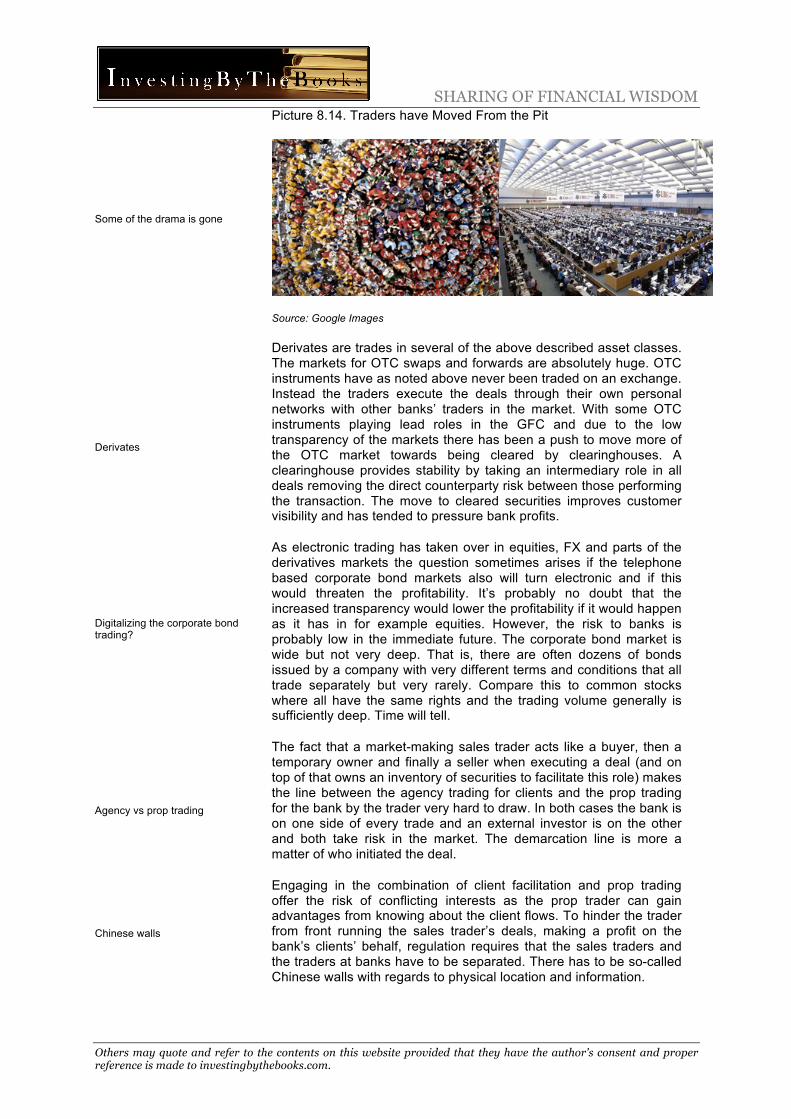
Historically some of the bank employees would have to be physically present at the exchange to participate in the manual open outcry process in trading pits like the one to the left in the picture below. Over time the markets have in general seen a digitalization or at least moved to be performed over the phone (meaning bank staff now stays on their own premises like the UBS trading floor to the right in the picture). To a large extent an exchange today is a virtual feature only present on a server. Exchanges have seen their fair amount of issues the last decade. A narrowing of bid-ask spreads and lowering of commission levels, a fragmentation over several competing exchanges has meant lower liquidity on any one of them separately.
SHARING OF FINANCIAL WISDOM
Others may quote and refer to the contents on this website provided that they have the author's consent and proper reference is made to investingbythebooks.com.
Some of the drama is gone
Derivates
Digitalizing the corporate bond trading?
Agency vs prop trading
Chinese walls
Picture 8.14. Traders have Moved From the Pit
Source: Google Images
Derivates are trades in several of the above described asset classes. The markets for OTC swaps and forwards are absolutely huge. OTC instruments have as noted above never been traded on an exchange. Instead the traders execute the deals through their own personal networks with other banks’ traders in the market. With some OTC instruments playing lead roles in the GFC and due to the low transparency of the markets there has been a push to move more of the OTC market towards being cleared by clearinghouses. A clearinghouse provides stability by taking an intermediary role in all deals removing the direct counterparty risk between those performing the transaction. The move to cleared securities improves customer visibility and has tended to pressure bank profits.
As electronic trading has taken over in equities, FX and parts of the derivatives markets the question sometimes arises if the telephone based corporate bond markets also will turn electronic and if this would threaten the profitability. It’s probably no doubt that the increased transparency would lower the profitability if it would happen as it has in for example equities. However, the risk to banks is probably low in the immediate future. The corporate bond market is wide but not very deep. That is, there are often dozens of bonds issued by a company with very different terms and conditions that all trade separately but very rarely. Compare this to common stocks where all have the same rights and the trading volume generally is sufficiently deep. Time will tell.
The fact that a market-making sales trader acts like a buyer, then a temporary owner and finally a seller when executing a deal (and on top of that owns an inventory of securities to facilitate this role) makes the line between the agency trading for clients and the prop trading for the bank by the trader very hard to draw. In both cases the bank is on one side of every trade and an external investor is on the other and both take risk in the market. The demarcation line is more a matter of who initiated the deal.
Engaging in the combination of client facilitation and prop trading offer the risk of conflicting interests as the prop trader can gain advantages from knowing about the client flows. To hinder the trader from front running the sales trader’s deals, making a profit on the bank’s clients’ behalf, regulation requires that the sales traders and the traders at banks have to be separated. There has to be so-called Chinese walls with regards to physical location and information.

SHARING OF FINANCIAL WISDOM
Others may quote and refer to the contents on this website provided that they have the author's consent and proper reference is made to investingbythebooks.com.
Volcker rule
More on the shelf
Asset management and wealth management
Who would you nominate as the 10th investor?
AuM – Assets under management
Big size portfolios
Mainly due to the ethical aspects of the risk for trading losses and the solvency consequences of these, but also because of the conflict of interest the US Volcker rule has meant that US prop trading has been spun off from the investment banks (but market making remains). In Europe prop trading is still allowed but with changing rules, the capital that the bank has to hold against the trading assets has increased making the new asset-heavier business significantly less attractive as it cannot be levered as high as before.
8.4 The Other Stuff The financial department store has more products on its shelf earning additional fees and commissions. Some of the more prevalent services are asset and wealth management, payment services, card issuance, cash management for companies, custody services, insurance and sometimes real estate brokerage.
Asset management refers to providing investment products such as for example mutual funds or ETFs to retail clients and institutional investors. Wealth management is a hybrid between asset management and retail banking and refers to specialized and individually tailored services provided to meet the wealth-planning, investing & financial management needs of wealthy individuals. Those individuals are often segmented according to their wealth. The descriptive labels include affluent, wealthy, high net worth and ultra-high net worth.
Picture 8.15. Some Legendary (Equity) Investors
Upper left to right: Philip Fisher, Warren Buffett, Ben Graham, Peter Lynch, Ed Thorpe, Jim Simmons, Seth Klarman, George Soros and Julian Robertson. Source: Google Pictures.
Fees are generally set as a certain percentage point of managed assets. Both asset and wealth management are highly attractive to banks since they generate recurring fees without requiring much capital and the client relationships are relatively sticky. After a certain scale of assets under management (AuM) is reached the profit margins can be very attractive. Global wealth management is dominated by the big investment banks like for example UBS, Merrill Lynch, Morgan Stanley, Credit Suisse and Royal Bank of Canada.
On the other hand, and even though the investment banks are major players, the global asset management industry is dominated by non-banks like for example Blackrock, Vanguard, Fidelity, Capital and PIMCO. These rival the pension funds, the insurance companies and the sovereign wealth funds for the top spots as the world’s largest asset portfolio managers.
SHARING OF FINANCIAL WISDOM
Others may quote and refer to the contents on this website provided that they have the author's consent and proper reference is made to investingbythebooks.com.
A good business getting tougher
Alternatives…
…and passive investments taking share
BCG – Boston Consulting Group
Asset and wealth management services are savings alternatives to placing money on deposit accounts. Despite fee pressure and a mix shift towards index based savings products the combination of rising asset values and to some extent inflows into the portfolios means that the combined global investment management industry has seen slow but okay growth the last few years.
2015 was tougher for the asset management sector with both stalling asset prices and asset inflows plus continued fee pressure. Fees have been in a slow decline for quite some time. According to a report from Morningstar European equity fond fees averaged 1.27%, down from 1.43% three years earlier. Sweden had the third lowest fees where the average fee was 0.94%, down from 1.09% three years earlier.
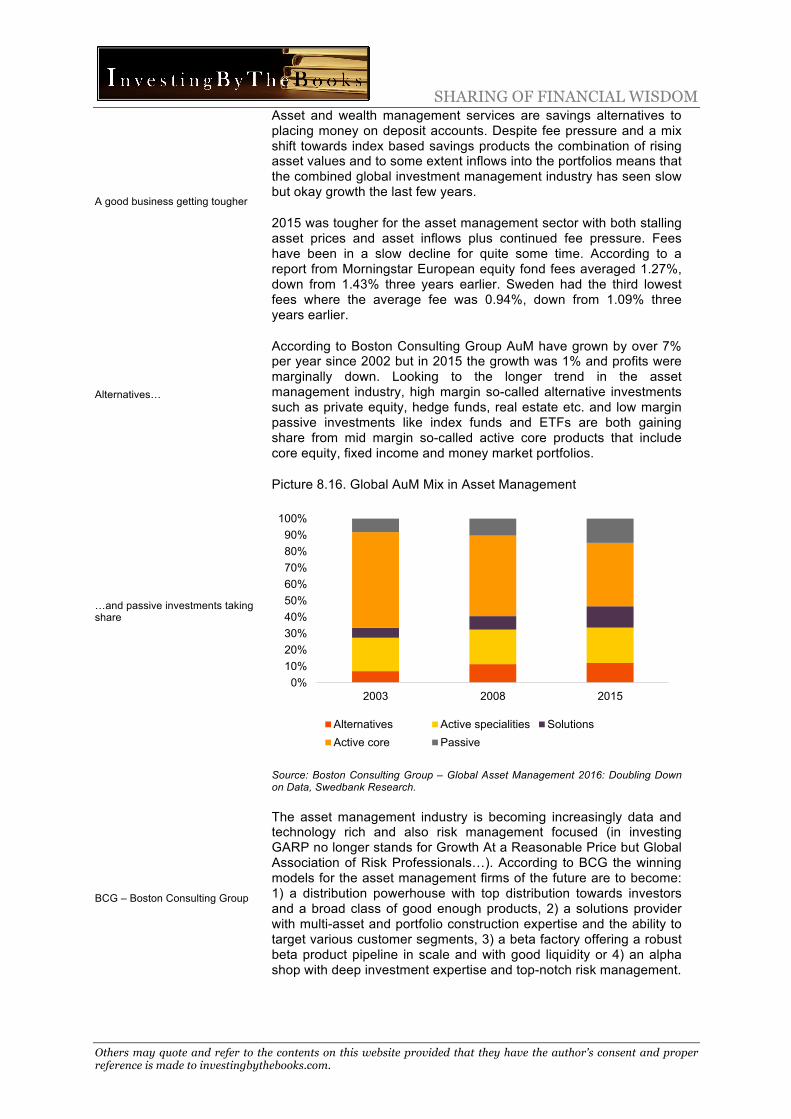
According to Boston Consulting Group AuM have grown by over 7% per year since 2002 but in 2015 the growth was 1% and profits were marginally down. Looking to the longer trend in the asset management industry, high margin so-called alternative investments such as private equity, hedge funds, real estate etc. and low margin passive investments like index funds and ETFs are both gaining share from mid margin so-called active core products that include core equity, fixed income and money market portfolios.
Picture 8.16. Global AuM Mix in Asset Management
Source: Boston Consulting Group – Global Asset Management 2016: Doubling Down on Data, Swedbank Research.
The asset management industry is becoming increasingly data and technology rich and also risk management focused (in investing GARP no longer stands for Growth At a Reasonable Price but Global Association of Risk Professionals…). According to BCG the winning models for the asset management firms of the future are to become: 1) a distribution powerhouse with top distribution towards investors and a broad class of good enough products, 2) a solutions provider with multi-asset and portfolio construction expertise and the ability to target various customer segments, 3) a beta factory offering a robust beta product pipeline in scale and with good liquidity or 4) an alpha shop with deep investment expertise and top-notch risk management.
0%10%20%30%40%50%60%70%80%90%
100%
2003 2008 2015
Alternatives Active specialities SolutionsActive core Passive

SHARING OF FINANCIAL WISDOM
Others may quote and refer to the contents on this website provided that they have the author's consent and proper reference is made to investingbythebooks.com.
Trusts
Payments
Overdraft fees
Card payments
Corporate banking
Trade finance
Trust services is a related service similar to wealth management where banks manage the property held by trusts. This is often securities portfolios but could also involve real estate, land etc.
We now move on to payments. Since banks provide the accounts that individuals and corporations use to deposit their funds in it is also natural that they have come to provide the payment service for when money should be moved between deposit accounts as payment for goods and services. From the society’s point of view this is one of the more vital functions performed by banks and it’s one that is generally paid for by fees on the transaction. The payment fee income is sometimes specified in the financial accounts of banks and sometimes not, but it is usually a big part of total fee income.
Another important fee income is overdraft fees charged when a customer makes a payment but have non-sufficient funds on his account. Banks then allow the transaction but charge an overdraft fee. Less common today but still existent are monthly deposit fees, i.e. a fee for providing the client the service of having a deposit account to start with. The argument for such a fee is that there is a customer value related to the service of safe storage of money.
Related, but still separate, are fees from payment card payments. A payment card transaction involves a number of players who all split the fee that is deducted from the price that the consumer pays for the product or service. Generally the bank that issued the payment card to the consumer gets about 2/3rds of the fee and the bulk of the rest is shared between the network companies like VISA and Mastercard and the so-called merchant acquirers. This split is motivated by the fact that the banks shoulder the credit risks of the transaction. Fraudulent use of payment cards is a growing problem. We will take a closer look at the payments market in the segment fintech below.
Further, banks provide corporate clients with cash management, working capital financing and trade finance. Over 80% of global trade is reliant of the latter service. Trade financing reconciles the divergent needs of an exporter and an importer lowering the friction of transactions where the parties often don’t have intimate knowledge of each other. An exporter would prefer to be paid upfront by the importer for an export shipment. The risk to the importer is then that the exporter may simply pocket the payment and refuse shipment. Conversely, if the exporter extends credit to the importer, the latter may refuse to make payment or delay it inordinately.
The most common form of trade finance is letters of credit where the bank guarantees payment to the seller as long as delivery conditions have been met. If the buyer defaults and the seller risk a credit loss the bank will cover the cost. This is similar to selling insurance and similar to insurance the bank seldom has to shoulder its responsibility but when it happens it can prove costly. The bank could also buy the receivables (or the exposure of the receivables) from the seller at a discount to the cash value of the transaction.
SHARING OF FINANCIAL WISDOM
Others may quote and refer to the contents on this website provided that they have the author's consent and proper reference is made to investingbythebooks.com.
NCI on the decline
Swedbank’s 2015 statements
Loans to the public
70% real estate
Retail dominated
Cash and balances with central banks
Overall, net commission income (NCI), i.e. the total fee income from various products – in investment banking or other – rose as a percent of total income from the early 1980s up until the financial crisis. In many well-known banks it accounted for more than half of income. After the crisis many banks have refocused on the more mundane net interest income.
8.5 Financial Statements It is obviously critical to understand the business operations of banks. But to understand a bank it’s also beneficial to understand the financial statements. In banking the balance sheet is to a large extent a part of the operations and as such drives the income statement. We will exemplify the financial statements of a bank by looking at the 2015 balance sheet and income statement of a prestigious Swedish bank – Swedbank. In this we are only using public sources: the 2015 annual report, the 2015 risk management and capital adequacy report and the Q4, 2015 fact book (all in all 455 pages…).
The Balance Sheet
Assets are what are owed to the bank by others. In principle (if not in the accounting) they are loan receivables, securities that are on the balance sheet and derivatives that are mainly off the balance sheet. The assets for Swedbank consist of a long number of line items. Three of them make up 82% of the balance sheet and Loans to the public itself accounts for 66% of the balance sheet or SEK 1.4tr – equivalent to more of a third of Swedish GDP that year. Out of the sum, 84% was lent in Sweden and the rest abroad – mainly the Baltics. The largest and fastest growing part of the loans was made to private customers who accounted for 58% of the loans (private mortgages 49% and the remaining 9% was mainly lending to private tenant associations). The second largest part of the loans was to corporate customers that accounted for 33%. Out of this property management stood for 14%, agriculture, forestry, fishing 5%, manufacturing 3% and lending to corporations in other sectors 11%.
Apart from lending to private customers and corporations 9% of the lending is to financial institutions such as other banks. In 2015 70% of the loans (and 49% of total assets, not counting mortgage bonds that add another 2%) was related to real estate in some form and this is slightly up from 66% in 2014 and 67% in 2013.
For a bank loans should be seen as a sold product that will produce income in the future. Loans are shown on a net basis, i.e. net of loan loss reserves. Swedbank is a universal bank but it is, as most medium sized European banks, still relatively retail dominated as can be seen from the relative size of the loans in the asset mix. Among the 21 largest European banks loans accounted for 49% of assets 2014.
Since loans are illiquid and deposits and other funding are liquid banks need to keep a certain portion of liquid assets as a hedge against outflows. Looking at the picture of the balance sheet below, the second largest asset after the dominating loans is Cash and balances with central banks that accounts for 9% of the asset base. This is held in part for business related liquidity reasons and increasingly in part for regulatory related liquidity reasons.

SHARING OF FINANCIAL WISDOM
Others may quote and refer to the contents on this website provided that they have the author's consent and proper reference is made to investingbythebooks.com.
Investments
Insurance assets
Derivates
A huge gross amount…
…but smaller net
Before turning to the third largest asset we look to some other line items often lumped together as “investments”. Like loans they generate interest income but also like the cash balance add liquidity to the balance sheet. Firstly, Treasury bills and other bills eligible for refinancing with central banks etc. This is also a part of the liquidity reserve partly motivated by regulation and the major balance consists of short-term holdings of Swedish government bonds and bills. Secondly, Loans to credit institutions that refer to money lent on the interbank market to other banks – mainly the Swedish ones but also some to foreign banks. Finally, there is a line called Bonds and other interest-bearing securities. These are investments in securities issued by mortgage institutions and financial institutions. As before they are to some extent held due to liquidity requirements but they give higher interest rates than treasury bills and are also held as pure investments.
The third largest asset in the picture of the balance sheet is the somewhat mysteriously named Financial assets for which the customer bears the investment risk and to a large extent consists of fund units but also bonds and equities. This is the asset side of the insurance business of Swedbank.
The only remaining line item of any significance is called Derivatives and the asset of SEK 86bn is matched by a liability of SEK 69bn – small numbers compared to the size of the balance sheet. In the 21 largest European banks derivatives accounted for 14-15% of assets and liabilities 2014. The number for Swedbank 2015 was 4%.
Those who look further into the footnote on derivates will however be met by totally different numbers. The total nominal gross amount of outstanding derivatives held by Swedbank was SEK 10,1tr or almost 2.5 times the Swedish GDP – and that’s just in one bank. This was made up by, in rank order, interest rate forwards, interest rate swaps, FX forwards, interest rate options and FX swaps. Some of the derivatives relate to customer business, say if a Swedish pension fund wants to hedge the FX exposure of an US equity portfolio or if another customer wants protection against a falling oil price, some small part is held by the trading departments and some relates to Swedbank treasury’s management of the banks duration and currency exposures.
Now the gross amount is spectacular and the global gross notional value of outstanding derivatives is estimated to be over 10 times global GDP. The thing is, derivatives held by a bank to a very large extent have offsetting exposures and net each other out. It’s only when they don’t that they effect the financial accounts. If the underlying price that the derivatives trade on move in a profitable direction for the bank compared to when they were issued the unrealized gain will be shown as an asset and if it moves in an unprofitable direction then the unrealized loss will be shown as a liability. This is the only part of the values of the derivatives that end up on the balance sheet. US GAAP allows more generous netting of derivatives so US banks for that reason (amongst others) have smaller balance sheets than European banks. The size of both the asset and the liability will tend to increase when securities markets are highly volatile but as they move in tandem they never posed a threat to banks equity during the GFC.

SHARING OF FINANCIAL WISDOM
Others may quote and refer to the contents on this website provided that they have the author's consent and proper reference is made to investingbythebooks.com.
Trading assets
Assets
Liabilities
Equity
Liabilities and equity
In the US these assets have disappeared, they are declining in volume in Europe as well and in Swedbank’s balance sheet they are invisible – the trading assets. Still, trading assets were the third largest assets in 2014 after loans and derivatives among the 21 largest European banks with about 14% of the asset base.
Picture 8.17. The Balance Sheet of Swedbank 2015
Source: Swedbank Annual Report 2015, Swedbank Research
We now move on to the liabilities and the equity. Liabilities are what the banks owe to others. As is evident from the picture the two dominating liabilities are Deposits and borrowings from the public and Debt securities in issue. Deposits are what make a bank a bank. All corporations or individuals can give out loans but only banks and credit market companies are through their licenses allowed to take deposits. This is a cheap and generally reliable source of funding.
SEKm 2015 % of AssetsAssetsCash and balances with central banks 186,312 9%Treasury bills and other bills eligible for refinancing with central banks, etc. 76,552 4%Loans to credit institutions 86,418 4%Loans to the public 1,413,955 66%Value change of interest hedged item in portfolio hedge 1,009 0%Bonds and other interest-‐bearing securities 88,610 4%Financial assets for which the customers bear the investment risk 153,442 7%Shares and participating interests 11,074 1%Investments in associates 5,382 0%Derivatives 86,107 4%Intangible fixed assets 13,690 1%Investment properties 8 0%Tangible assets 1,981 0%Current tax assets 1,662 0%Deferred tax assets 192 0%Pension assets 1,274 0%Other assets 14,677 1%Prepaid expenses and accrued income 6,362 0%Group of assets classified as held for sale 148 0%Total assets 2,148,855 100%
Liabilities and equity % of Liabilities and EquityLiabilitiesAmounts owed to credit institutions 150,493 7%Deposits and borrowings from the public 748,271 35%Financial liabilities for which the customers bear the investment risk 157,836 7%Debt securites in issue 826,535 38%Short positions securities 8,191 0%Derivatives 68,681 3%Current tax liabilities 105 0%Deferred tax liabilities 3,071 0%Pension provisions 17 0%Insurance provisions 1,728 0%Other liabilities and provisions 22,715 1%Accrued expenses and prepaid income 13,243 1%Subordinated liabilities 24,613 1%Liabilities directly associated with group of assets classified as held for sale 14 0%Total liabilities 2,025,513 94%EquityNon-‐controlling interests 179 0%Equity attributable to shareholders of the parent company 123,163 6%Total equity 123,342 6%Total liabilities and equity 2,148,855 100%

SHARING OF FINANCIAL WISDOM
Others may quote and refer to the contents on this website provided that they have the author's consent and proper reference is made to investingbythebooks.com.
Deposits are smaller…
…than issued securities
Loan-to-deposit ratio
Covered mortgage bonds
Foreign denominations
The equity ratio
Deposits accounted for 35% of the combined liabilities and equity of Swedbank in 2015. Out of the deposits Swedes stood for 74% and the rest was mainly deposited in the Baltics. Private individuals had deposited 53% of the money (or 19% of total liabilities and equity) and corporate clients 46%. The deposits were also roughly split 50/50 between term deposits (55%) and savings account (45%) but a full 87% was still deemed payable on demand. Swedbank’s funding from deposits is only slightly smaller compared to the 21 largest European banks but it is low compared to international medium sized retail dominated banks. The reason is, again, Swedish retail clients’ custom of investing in mutual funds, over time earning a higher return than they do on deposits.
The largest liability for Swedbank and the main funding were issued securities, often called wholesale funding. Most of the time lending decisions in a bank proceeds funding decisions, meaning that as loans expand beyond the deposit volume additional sources of funding must be tapped. Loan departments in banks don’t get their funding from external sources directly. Instead they request funding from the bank’s treasury department. Debt securities in issue accounted for 38% of the combined liabilities and equity.
The credit expansion leading up to the global financial crisis was to a large extent financed with wholesale funding. The loan-to-deposit ratio of European banks that in the early 1990s were below 100% shot up to about 115% by the early 2000s and stayed there until 2008 and now we are back below 100% again. Loans in excess of deposits will have to be funded in the wholesale market. Deposits in excess of loans will have to be invested in securities – often at a lower interest rate. Swedish banks’ loan-to-deposit ratios are much higher than the international averages. Swedbank’s loan-to-deposit ratio is 189%.
The absolute bulk of the debt securities issued by Swedbank were covered bonds of SEK 532bn (or 25% of total liabilities and equity). These are mortgage related bonds, the cash flow from the mortgage lending provide the funding for servicing the interest payments from the bank to the bondholders. The bonds give the bondholder a claim on the mortgage loan and its collateral (that is the value of the underlying real estate in the mortgage lending) in case the bank cannot service the loan. The client’s credit risk is with Swedbank in a first phase of financial distress so the bonds stay on the balance sheet. Further, otherwise issued short-term unsecured commercial paper and longer-term bonds make up the rest of the debt issuance where they respectively amounted to a sum equivalent of 5% and 7% of the total liabilities and equity.
Several of both the assets and the liabilities can be denominated in either a bank’s national currency or in foreign currencies. Hence, a Swedish bank can lend, borrow and invest in for example euros or USD. This is of course an important part of the customer offering but it also exposes the bank for FX-risks.
Banks have a heavy dependency on funds provided by others. The combination of amounts owed to other banks, to bond investors and to depositors sums up to 80% of the balance sheet. By the end of 2015 the straight equity ratio of Swedbank was 5.7%. During the years 2010 to 2015 the average has been 5,6% while the three years prior to this period the average was 4.7%. Straight equity ratios were seldom discussed historically as the risk in assets varies so much.
SHARING OF FINANCIAL WISDOM
Others may quote and refer to the contents on this website provided that they have the author's consent and proper reference is made to investingbythebooks.com.
Interest, commission and fees plus trading income
Net interest income 61% of total income
Interest bearing assets
Interest paying liabilities
Still, a 4.2% equity ratio in 2007 with a major presence in a booming Baltic economy was in retrospect stretching it slightly. We will later on take a close look at all the risk-adjusted varieties of the equity ratio that banks use.
The Income Statement
Banks generate revenue by intermediating risks, by providing access to various types of services and by taking risk on their own account. This means earning interest on securities and loans, earning commissions and fees on the services and generating trading income on proprietary positions in securities markets. The services have over time expanded from core banking areas to also include for example insurance. In Swedbank the main contributors to total income are net interest income and net commission income. Further, there is income from trading, insurance and more.
Net interest income (NII, line c in the picture of Swedbank’s income statement) is the core of banking revenue and it makes up 61% of Swedbank’s Total income. However, since NII is the net of the interest income (a) and the interest expenses (b), it is actually more equivalent to the gross profit in a manufacturing company. Interest is generated from the asset side of the balance sheet when borrowers pay interest and when bond investments pay coupons.
Interest expenses are paid to depositors and on debt issued to the market. NII is generated by the volume of assets times the interest rated earned minus the volume of liabilities times the paid interest rate. The earned and paid interest rates and hence the interest spread depends on the mix of interest bearing assets and interest paying liabilities. NII is normally stable and seen as a high-quality source of revenue.
The interest bearing assets in Swedbank were 73% of all assets. The interest bearing assets were 85% Loans to the public earning an average annual interest rate of 2.32%, then 9% interest-bearing securities earning 0.80% and finally 6% loans to credit institutions (i.e. other banks and the central bank) that earned an interest of 0.31%. The average annual interest earned on all the interest bearing assets in 2015 was 2.06%. When instead compared to the total assets of the bank, the earned interest was 1.53%.
The interest paying liabilities in Swedbank were 87% of all liabilities. The interest paying liabilities were 47% issued securities costing an average annual interest rate of 1.62%, then 44% deposits costing 0.15%, further 8% where loans from credit institutions costing 0.20% and finally 1% subordinated liabilities costing 4.3%. The average annual interest paid on all the interest paying liabilities was 0.89%. Compared to the total liabilities the paid interest was 0.55% and put in relation to all liabilities and equity the paid interest was 0.52%. Funding a bank is cheap nowadays – at least if you mistakenly view the cost of equity as zero.
SHARING OF FINANCIAL WISDOM
Others may quote and refer to the contents on this website provided that they have the author's consent and proper reference is made to investingbythebooks.com.
NIM – Net interest margin
NII-to-RWA
NCI – Net commission income
Robur
NII says relatively little as an absolute number and it is reasonable to compare it to the size of the balance sheet. The measure analysts usually look at is called net interest margin (NIM) and puts net interest income in relation to average interest earning assets. For Swedbank this would be SEK 23.0bn divided with SEK 1,687bn or 1.36%. Swedbank states a NIM of 1.01% in the annual report which is net interest income (including net interest from trading) of SEK 23.6bn, instead divided by total assets of SEK 2,323bn.
Since the NII is generated by an interest spread between assets and liabilities it is perhaps somewhat misleading to simply put the NII in relation to the assets. It could be equally motivated to use the average of interest bearing assets and liabilities as the denominator. NIM is as noticed somewhat similar to a gross margin in traditional companies and as such varies with mix changes and different levels of price competition on both deposits and lending. Also, a higher NII could be a reflection of larger risks and sometimes NII is put in relation to the risk weighted assets which would result in a ratio of 5.91% for Swedbank.
Net commission income (NCI, f in the picture) from fees and commission makes up 30% of Swedbank’s total income. Banks charge a whole range of fees in both retail banking and investment banking and the mix will differ due to the type of the bank. This is also a net number where commission costs € like payment processing costs, payment card costs and costs in asset management are deducted from commission income (d).
In Swedbank two commission sources dominate the commission income and the net commission income. Asset management is the first and in 2015 generated 35% of commission income with SEK 5.8bn and also stood for 40% of net commission income with SEK 4.5bn. Out of the latter the mutual fund company Robur stood for SEK 2.0bn and the private banking for the rest. Since costs for personnel, IT etc. is not included in commission expenses the difference between commission income and net commission doesn’t reflect the true profitability of a business like asset management. However, profitability in asset management is obviously very good when sufficient scale has been reached. Robur with 226 FTEs in 2015 had an EBIT-margin of 68% and a net margin of 53% excluding an impairment charge.
Payment card fees were second in line and generated 29% of commission income and 22% of net commission income in 2015. Compared to the asset management’s commission income that only grew by 1% y-o-y the card business grew by over 9%. On third and fourth place when it comes to generating commissions are Payment processing and Loan fees. The first relates to fees on for example payments of bills in the retail banking and trade finance in corporate banking. Loan fees are origination and underwriting fees for corporate clients and to some extent late payment fees for retail customers etc. Since Swedbank is more of a retail bank the brokerage business generated 3% (SEK 332mn) of net commission income in 2015 and the corporate finance business 2% (ECM, DCM and M&A with SEK 246mn).
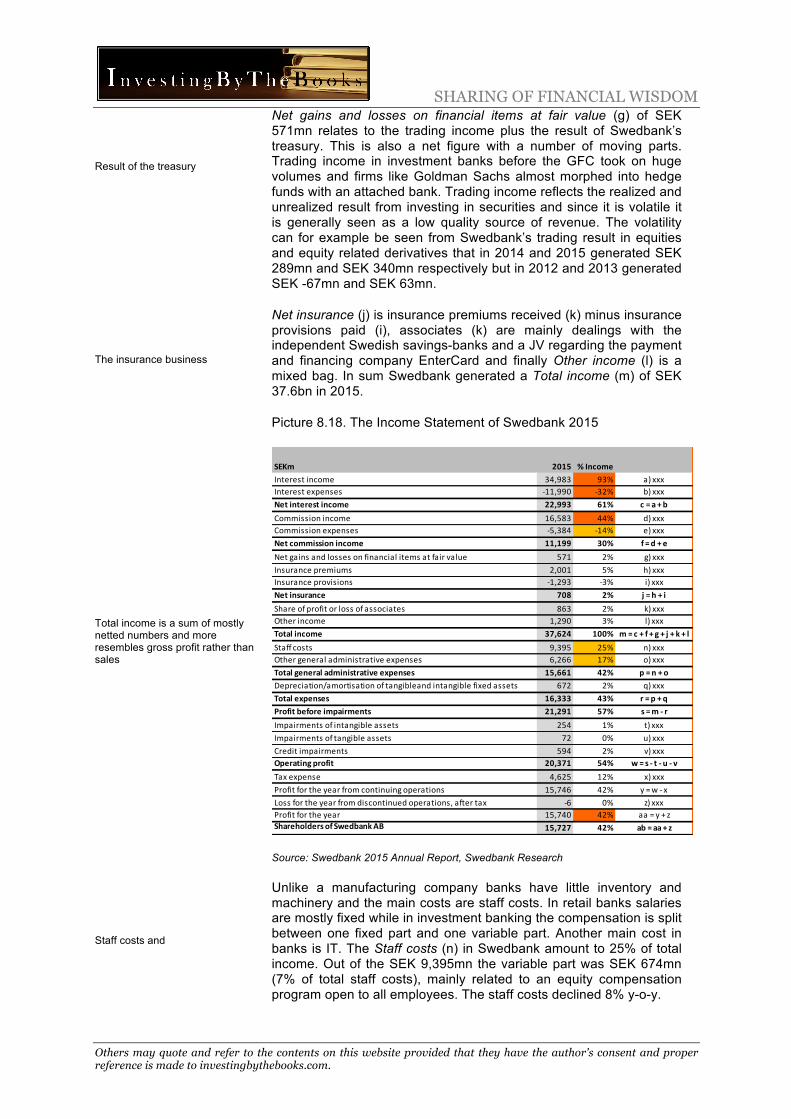
SHARING OF FINANCIAL WISDOM
Others may quote and refer to the contents on this website provided that they have the author's consent and proper reference is made to investingbythebooks.com.
Result of the treasury
The insurance business
Total income is a sum of mostly netted numbers and more resembles gross profit rather than sales
Staff costs and
Net gains and losses on financial items at fair value (g) of SEK 571mn relates to the trading income plus the result of Swedbank’s treasury. This is also a net figure with a number of moving parts. Trading income in investment banks before the GFC took on huge volumes and firms like Goldman Sachs almost morphed into hedge funds with an attached bank. Trading income reflects the realized and unrealized result from investing in securities and since it is volatile it is generally seen as a low quality source of revenue. The volatility can for example be seen from Swedbank’s trading result in equities and equity related derivatives that in 2014 and 2015 generated SEK 289mn and SEK 340mn respectively but in 2012 and 2013 generated SEK -67mn and SEK 63mn.
Net insurance (j) is insurance premiums received (k) minus insurance provisions paid (i), associates (k) are mainly dealings with the independent Swedish savings-banks and a JV regarding the payment and financing company EnterCard and finally Other income (l) is a mixed bag. In sum Swedbank generated a Total income (m) of SEK 37.6bn in 2015.
Picture 8.18. The Income Statement of Swedbank 2015
Source: Swedbank 2015 Annual Report, Swedbank Research
Unlike a manufacturing company banks have little inventory and machinery and the main costs are staff costs. In retail banks salaries are mostly fixed while in investment banking the compensation is split between one fixed part and one variable part. Another main cost in banks is IT. The Staff costs (n) in Swedbank amount to 25% of total income. Out of the SEK 9,395mn the variable part was SEK 674mn (7% of total staff costs), mainly related to an equity compensation program open to all employees. The staff costs declined 8% y-o-y.
SEKm 2015 % IncomeInterest income 34,983 93% a) xxxInterest expenses -‐11,990 -‐32% b) xxxNet interest income 22,993 61% c = a + bCommission income 16,583 44% d) xxxCommission expenses -‐5,384 -‐14% e) xxxNet commission income 11,199 30% f = d + eNet gains and losses on financial items at fair value 571 2% g) xxxInsurance premiums 2,001 5% h) xxxInsurance provisions -‐1,293 -‐3% i) xxxNet insurance 708 2% j = h + iShare of profit or loss of associates 863 2% k) xxxOther income 1,290 3% l) xxxTotal income 37,624 100% m = c + f + g + j + k + lStaff costs 9,395 25% n) xxxOther general administrative expenses 6,266 17% o) xxxTotal general administrative expenses 15,661 42% p = n + oDepreciation/amortisation of tangible and intangible fixed assets 672 2% q) xxxTotal expenses 16,333 43% r = p + qProfit before impairments 21,291 57% s = m -‐ rImpairments of intangible assets 254 1% t) xxxImpairments of tangible assets 72 0% u) xxxCredit impairments 594 2% v) xxxOperating profit 20,371 54% w = s -‐ t -‐ u -‐ vTax expense 4,625 12% x) xxxProfit for the year from continuing operations 15,746 42% y = w -‐ xLoss for the year from discontinued operations, after tax -‐6 0% z) xxxProfit for the year 15,740 42% aa = y + zProfit for the year attributable to: Shareholders of Swedbank AB 15,727 42% ab = aa + z
SHARING OF FINANCIAL WISDOM
Others may quote and refer to the contents on this website provided that they have the author's consent and proper reference is made to investingbythebooks.com.
Other expenses
Cost/income ratio (C/I-ratio)…
…super low at 43%
Pre-provision profits
NPL – Non-performing loan
Impairment test
Losses and lower earnings
Other general administrative expenses (o) amounted to 17% of total income. Out of this rents stood for 3 percentage points and IT expenses for 5 percentage points, where the latter is perhaps lower than what some might have guessed (but not atypical among Swedish banks). Other general administrative expenses declined 5% y-o-y and IT expenses were more or less the only growing line item within this category.
The most common ratio to keep track of cost levels is the cost/income ratio that divides costs with total income. This ratio is also called the efficiency ratio or the overhead ratio. The cost/income ratio of US and European banks has gradually declined with improved efficiency. In the 1980s and the early 1990s the ratio was in the 65-70% interval, during the 2000s in the 50-65% range. Retail banks have lower ratios and investment banks have higher.
Swedbank’s cost/income ratio 2015 was 43%. This is very cost efficient. A sub-ratio of cost/income is the comp/income that divides staff costs with total income. Swedbank’s comp/income ratio was 25%. Global investment banking heavy organizations has a comp/income ratio of 40-50%.
After deducting depreciation and amortization Swedbank ends up with a Profit before impairments (s) of SEK 21.3bn. This number (also called pre-provision profits, PPP) is not really a good profit measure as it in effect is “profits before the effects of taking risk” and the banking business is all about the ability to take risk. Impairments are of two kinds. The first are impairments on intangible and tangible assets that we will not discuss further. The other is Credit impairments (v) – a hugely important line item for banks.
The accounting for non-performing loans (NPLs) is a bit tricky and the regulation for how banks perform this is changing. We will first describe the flows between the P&L and the balance sheet as they are now and then look to the changes brought by the implementation of the accounting recommendation IFRS 9.
A bank regularly performs impairment tests on all the loans it has made to account for credit losses. If a required payment is past-due by a specified number of days (typically 90 or 180) or if it otherwise finds that a loan with high probability will not be repaid, it must analyze the collateral available (if any) and estimate the gap between the loan amount and the potential recovery value. The loan is classified as a NPL and the bank makes a provision in through the income statement for the gap that has arisen. This loan loss charge will be lowering the profits.
The lower profits will also lower the retained earnings and the equity of the bank. To balance this a parallel amount is set off as a loan loss reserve. This reserve is a negative asset that lowers the value of the loans made. Thus, the loans shown as an asset in the balance sheet is a net figure. As the situation of the NPL resolves the previous estimate of loan losses will turn out to be either too optimistic meaning further loan loss charges or too pessimistic creating reversals effectively giving the opposite flows in the income statement and the balance sheets as the customer pays the bank more of the loan and the interest than previously expected.

SHARING OF FINANCIAL WISDOM
Others may quote and refer to the contents on this website provided that they have the author's consent and proper reference is made to investingbythebooks.com.
Volatile to say the least
The small kind
Credit risk ratios
§ LLC ratio
§ NPL ratio
§ Coverage ratio
§ Provision coverage rate
IAS 39 -> IFRS 9
Not counting interest paid, staff and IT costs are usually the largest costs for a bank but now and then the less flattering honor goes to credit impairments. To illustrate the volatility of credit losses; the 2009 credit impairments of Swedbank was SEK 24,641m or about 71% of total income while the 2015 impairments was SEK 594m or about 2% of total income. The below picture shows how the latter came about.
Picture 8.19. Swedbank Credit impairments 2015
Source: Swedbank Annual Report 2015.
Financial ratios used by analysts to gauge credit risk trends are:
• LLC ratio (Loan Loss Charge/Loans) – that tracks how large a percent of the loan portfolio that is being reserved through the income statement for expected losses during a year. This rises when the economy contracts.
• NPL ratio (Non-performing Loans/Loans) – which shows the percent of non-performing loans in relation to all loans made. The NPL ratio is a measure of the quality of the bank’s assets. This can be complemented by comparing NPL to the equity. Italian banks have a ratio over 100% on this latter measure.
• Coverage ratio (Loan Loss Reserve/NPL) – that shows the amount of accumulated provisions to cover loan losses in relation to the current amount of non-performing loans. With higher provisions the bank will be better insulated from credit quality problems.
• Provision coverage rate (Loan Loss Reserve/Loans) - the amount of accumulated provisions to cover loan losses in percent of all loans made. The ratio gives a picture of the bank’s cushion against bad loans.
The above-described model for impairment accounting looks to the incurred loan losses during a period. The recognition of credit losses is only made when they have already occurred and banks often get criticized for making too small and too late provisions. By 2018 the accounting recommendation IFRS 9 replaces the previous IAS 39. The principle change that the new rules bring is that provisions now will be forward looking instead of backward looking.
Credit impairments, SEKm 2015Provisions for loans that individually are assessed as impairedProvisions 942Reversal of previous provisions -‐204Provision for homogenous groups of impaired loans, net -‐36Total 702Portfolio provisions for loans that individually are not assessed as impaired -‐132Write-‐offsEstablished losses 954Utilisation of previous provisions -‐501Recoveries -‐428Total 25Credit impairments for contingent liabilities and other credit risk exposures -‐1Credit impairments 594
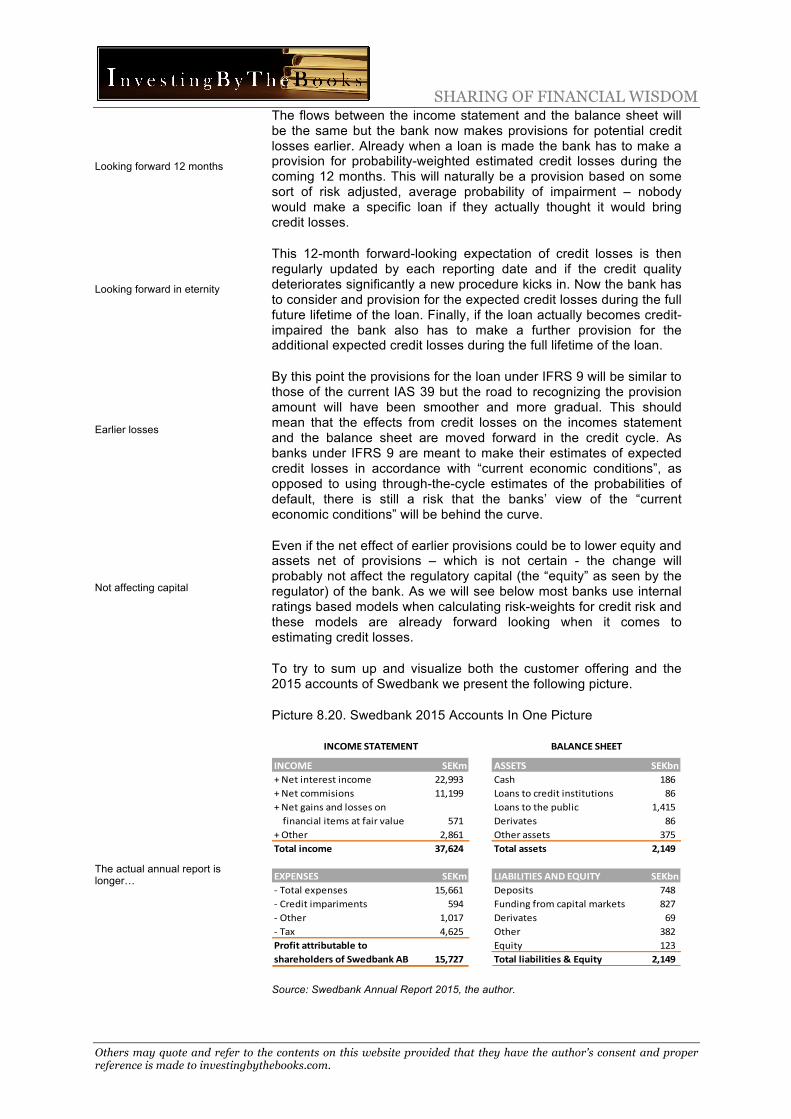
SHARING OF FINANCIAL WISDOM
Others may quote and refer to the contents on this website provided that they have the author's consent and proper reference is made to investingbythebooks.com.
Looking forward 12 months
Looking forward in eternity
Earlier losses
Not affecting capital
The actual annual report is longer…
The flows between the income statement and the balance sheet will be the same but the bank now makes provisions for potential credit losses earlier. Already when a loan is made the bank has to make a provision for probability-weighted estimated credit losses during the coming 12 months. This will naturally be a provision based on some sort of risk adjusted, average probability of impairment – nobody would make a specific loan if they actually thought it would bring credit losses.
This 12-month forward-looking expectation of credit losses is then regularly updated by each reporting date and if the credit quality deteriorates significantly a new procedure kicks in. Now the bank has to consider and provision for the expected credit losses during the full future lifetime of the loan. Finally, if the loan actually becomes credit-impaired the bank also has to make a further provision for the additional expected credit losses during the full lifetime of the loan.
By this point the provisions for the loan under IFRS 9 will be similar to those of the current IAS 39 but the road to recognizing the provision amount will have been smoother and more gradual. This should mean that the effects from credit losses on the incomes statement and the balance sheet are moved forward in the credit cycle. As banks under IFRS 9 are meant to make their estimates of expected credit losses in accordance with “current economic conditions”, as opposed to using through-the-cycle estimates of the probabilities of default, there is still a risk that the banks’ view of the “current economic conditions” will be behind the curve.
Even if the net effect of earlier provisions could be to lower equity and assets net of provisions – which is not certain - the change will probably not affect the regulatory capital (the “equity” as seen by the regulator) of the bank. As we will see below most banks use internal ratings based models when calculating risk-weights for credit risk and these models are already forward looking when it comes to estimating credit losses.
To try to sum up and visualize both the customer offering and the 2015 accounts of Swedbank we present the following picture.
Picture 8.20. Swedbank 2015 Accounts In One Picture
Source: Swedbank Annual Report 2015, the author.
INCOME SEKm ASSETS SEKbn+ Net interest income 22,993 Cash 186 + Net commisions 11,199 Loans to credit institutions 86 + Net gains and losses on Loans to the public 1,415 financial items at fair value 571 Derivates 86 + Other 2,861 Other assets 375 Total income 37,624 Total assets 2,149
EXPENSES SEKm LIABILITIES AND EQUITY SEKbn-‐ Total expenses 15,661 Deposits 748 -‐ Credit impariments 594 Funding from capital markets 827 -‐ Other 1,017 Derivates 69 -‐ Tax 4,625 Other 382 Profit attributable to Equity 123 shareholders of Swedbank AB 15,727 Total liabilities & Equity 2,149
BALANCE SHEETINCOME STATEMENT
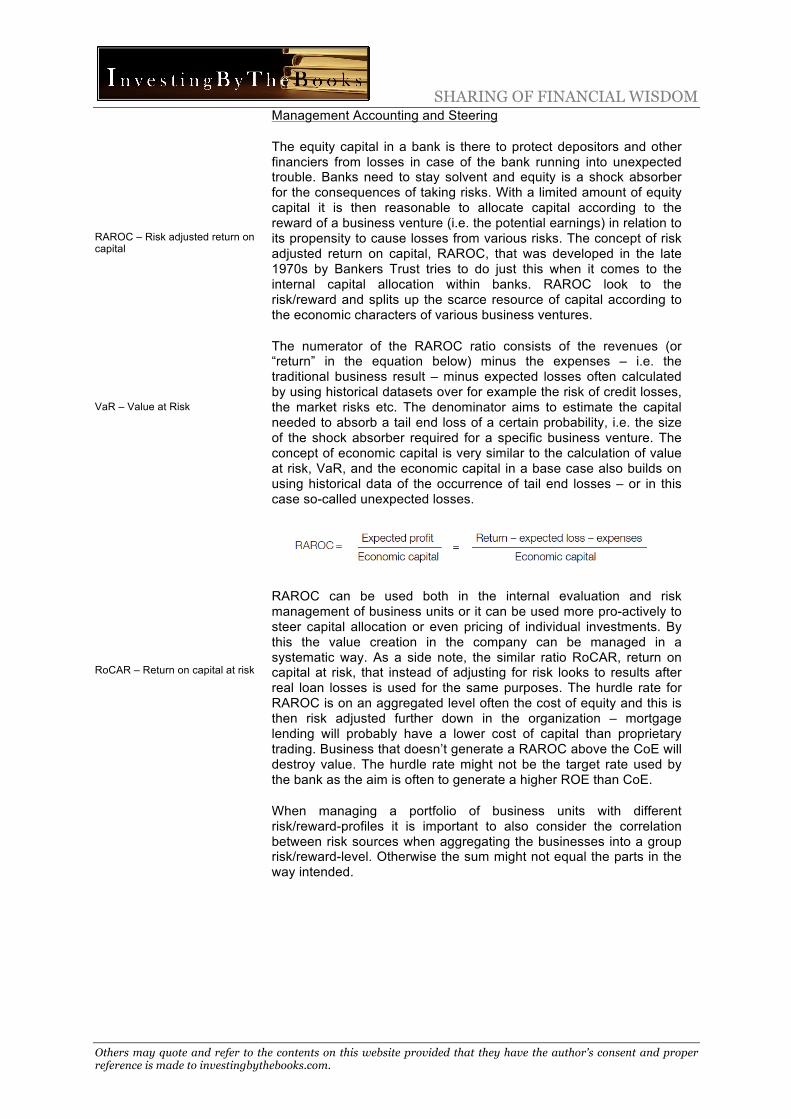
SHARING OF FINANCIAL WISDOM
Others may quote and refer to the contents on this website provided that they have the author's consent and proper reference is made to investingbythebooks.com.
RAROC – Risk adjusted return on capital
VaR – Value at Risk
RoCAR – Return on capital at risk
Management Accounting and Steering
The equity capital in a bank is there to protect depositors and other financiers from losses in case of the bank running into unexpected trouble. Banks need to stay solvent and equity is a shock absorber for the consequences of taking risks. With a limited amount of equity capital it is then reasonable to allocate capital according to the reward of a business venture (i.e. the potential earnings) in relation to its propensity to cause losses from various risks. The concept of risk adjusted return on capital, RAROC, that was developed in the late 1970s by Bankers Trust tries to do just this when it comes to the internal capital allocation within banks. RAROC look to the risk/reward and splits up the scarce resource of capital according to the economic characters of various business ventures.
The numerator of the RAROC ratio consists of the revenues (or “return” in the equation below) minus the expenses – i.e. the traditional business result – minus expected losses often calculated by using historical datasets over for example the risk of credit losses, the market risks etc. The denominator aims to estimate the capital needed to absorb a tail end loss of a certain probability, i.e. the size of the shock absorber required for a specific business venture. The concept of economic capital is very similar to the calculation of value at risk, VaR, and the economic capital in a base case also builds on using historical data of the occurrence of tail end losses – or in this case so-called unexpected losses.
RAROC can be used both in the internal evaluation and risk management of business units or it can be used more pro-actively to steer capital allocation or even pricing of individual investments. By this the value creation in the company can be managed in a systematic way. As a side note, the similar ratio RoCAR, return on capital at risk, that instead of adjusting for risk looks to results after real loan losses is used for the same purposes. The hurdle rate for RAROC is on an aggregated level often the cost of equity and this is then risk adjusted further down in the organization – mortgage lending will probably have a lower cost of capital than proprietary trading. Business that doesn’t generate a RAROC above the CoE will destroy value. The hurdle rate might not be the target rate used by the bank as the aim is often to generate a higher ROE than CoE.
When managing a portfolio of business units with different risk/reward-profiles it is important to also consider the correlation between risk sources when aggregating the businesses into a group risk/reward-level. Otherwise the sum might not equal the parts in the way intended.
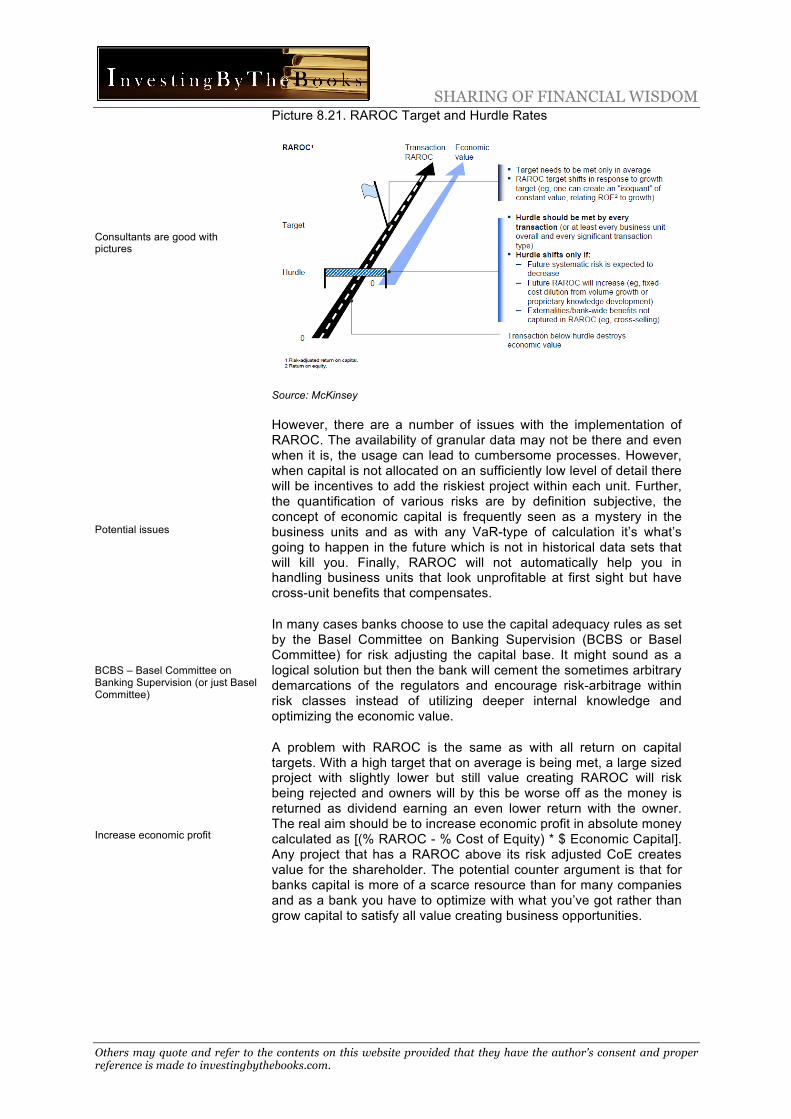
SHARING OF FINANCIAL WISDOM
Others may quote and refer to the contents on this website provided that they have the author's consent and proper reference is made to investingbythebooks.com.
Consultants are good with pictures
Potential issues
BCBS – Basel Committee on Banking Supervision (or just Basel Committee)
Increase economic profit
Picture 8.21. RAROC Target and Hurdle Rates
Source: McKinsey
However, there are a number of issues with the implementation of RAROC. The availability of granular data may not be there and even when it is, the usage can lead to cumbersome processes. However, when capital is not allocated on an sufficiently low level of detail there will be incentives to add the riskiest project within each unit. Further, the quantification of various risks are by definition subjective, the concept of economic capital is frequently seen as a mystery in the business units and as with any VaR-type of calculation it’s what’s going to happen in the future which is not in historical data sets that will kill you. Finally, RAROC will not automatically help you in handling business units that look unprofitable at first sight but have cross-unit benefits that compensates.
In many cases banks choose to use the capital adequacy rules as set by the Basel Committee on Banking Supervision (BCBS or Basel Committee) for risk adjusting the capital base. It might sound as a logical solution but then the bank will cement the sometimes arbitrary demarcations of the regulators and encourage risk-arbitrage within risk classes instead of utilizing deeper internal knowledge and optimizing the economic value.
A problem with RAROC is the same as with all return on capital targets. With a high target that on average is being met, a large sized project with slightly lower but still value creating RAROC will risk being rejected and owners will by this be worse off as the money is returned as dividend earning an even lower return with the owner. The real aim should be to increase economic profit in absolute money calculated as [(% RAROC - % Cost of Equity) * $ Economic Capital]. Any project that has a RAROC above its risk adjusted CoE creates value for the shareholder. The potential counter argument is that for banks capital is more of a scarce resource than for many companies and as a bank you have to optimize with what you’ve got rather than grow capital to satisfy all value creating business opportunities.
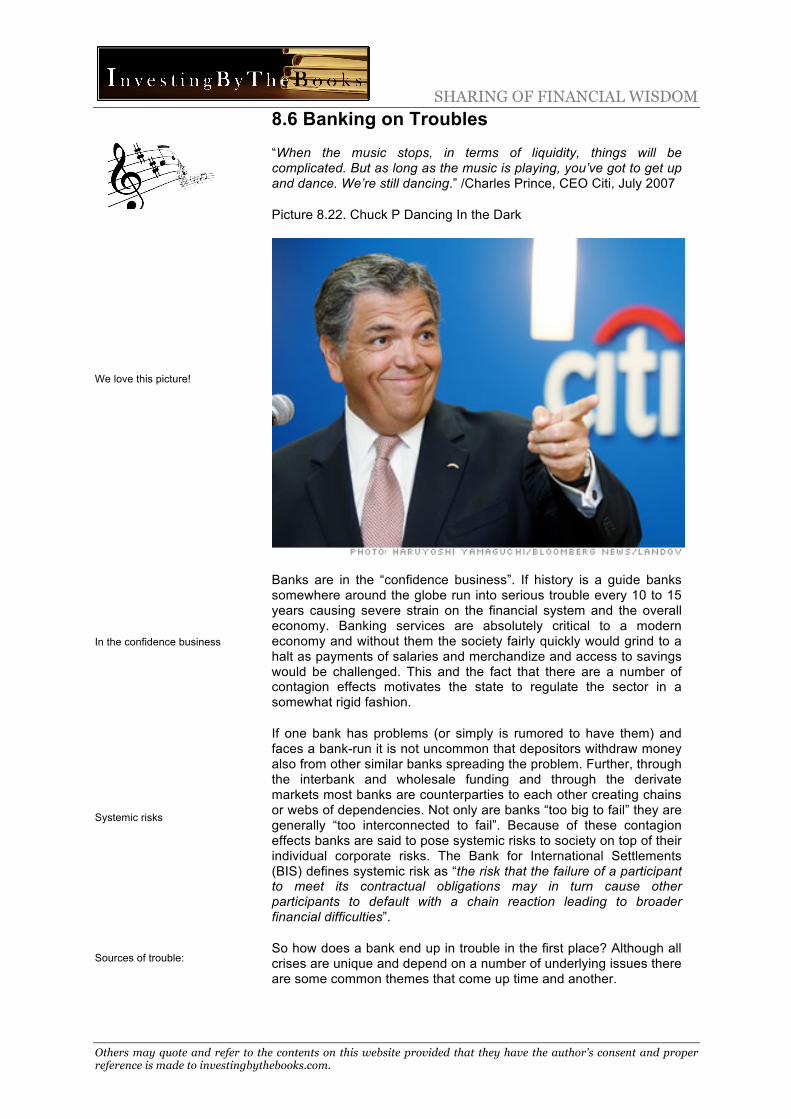
SHARING OF FINANCIAL WISDOM
Others may quote and refer to the contents on this website provided that they have the author's consent and proper reference is made to investingbythebooks.com.
We love this picture!
In the confidence business
Systemic risks
Sources of trouble:
8.6 Banking on Troubles “When the music stops, in terms of liquidity, things will be complicated. But as long as the music is playing, you’ve got to get up and dance. We’re still dancing.” /Charles Prince, CEO Citi, July 2007
Picture 8.22. Chuck P Dancing In the Dark
Banks are in the “confidence business”. If history is a guide banks somewhere around the globe run into serious trouble every 10 to 15 years causing severe strain on the financial system and the overall economy. Banking services are absolutely critical to a modern economy and without them the society fairly quickly would grind to a halt as payments of salaries and merchandize and access to savings would be challenged. This and the fact that there are a number of contagion effects motivates the state to regulate the sector in a somewhat rigid fashion.
If one bank has problems (or simply is rumored to have them) and faces a bank-run it is not uncommon that depositors withdraw money also from other similar banks spreading the problem. Further, through the interbank and wholesale funding and through the derivate markets most banks are counterparties to each other creating chains or webs of dependencies. Not only are banks “too big to fail” they are generally “too interconnected to fail”. Because of these contagion effects banks are said to pose systemic risks to society on top of their individual corporate risks. The Bank for International Settlements (BIS) defines systemic risk as “the risk that the failure of a participant to meet its contractual obligations may in turn cause other participants to default with a chain reaction leading to broader financial difficulties”.
So how does a bank end up in trouble in the first place? Although all crises are unique and depend on a number of underlying issues there are some common themes that come up time and another.

SHARING OF FINANCIAL WISDOM
Others may quote and refer to the contents on this website provided that they have the author's consent and proper reference is made to investingbythebooks.com.
1) Asset-liability mismatches
The bank run
Northern Rock
Differences in maturities and repricing
The mismatch can lay with the customer
The first are asset-liability mismatches. With the substantial leverage used by banks it is vital that the value of assets and liabilities react in relatively similar ways to changes in the environment. Any divergence could risk wiping out the slim equity. The main mismatches are related to maturity, duration and currency exposures. Banks engage in maturity transformation, borrowing short and liquid and lending long and illiquid. This is a potential source of income for the bank that has an incentive to increase the maturity mismatch but if the bank for some reason cannot refinance itself it will with all the assets tied-up long-term have a liquidity shortfall leading to acute risk of failure.
Almost every time the liquidity issue will arise as a consequence of a loss of confidence in a bank’s solvency, i.e. credit losses, trading losses etc. that threaten to wipe out the equity. The loss of confidence doesn’t have to build on factually correct information to have life threatening effects. Historically, the loss of confidence would have manifested itself in a bank-run when depositors stood in line to withdraw their deposits. Today, the more likely scenario is simply that other banks and financial institutions will not allow the bank to refinance its capital markets funding at the commercial paper market or the interbank market. However, we had a modern day traditional bank run in 2007 when UK based Northern Rock was on the brink of collapsing.
Picture 8.23. Plus ca Change, Plus C’est Le Même Chose
Source: Google Images
The maturity mismatch between assets and liabilities are further part of a duration mismatch where assets and liabilities react differently to changes in interest rates. Also, the duration mismatch could be further accentuated by differences between assets and liabilities when it comes to the proportion of fixed vs. variable interest agreements. Now as noted above banks are no longer allowed to profit from maturity mismatches to the same extent as historically and banks treasury departments manage the duration and currency mismatches through derivative positions on a daily basis. Outsiders get a glimpse of what the risk from unhedged mismatches looked like at the accounting date in the financial reporting. However, by then the picture will already be obsolete and the real risk invisible.
Even if the bank manages its mismatches it might have lent money to a client that isn’t equally prudent, causing the bank credit losses. Hedge funds can have strategies with similar maturity and duration mismatches as banks and can fail due to this. Otherwise the classic in this failure category are currency mismatches where borrowers sidestep the high interest rates of their own country by borrowing in a foreign currency in a country with lower interest rates. In Latin America there was lending in USD in the 1980s. In Sweden there was substantial borrowing in Deutschmarks prior to the crisis early

SHARING OF FINANCIAL WISDOM
Others may quote and refer to the contents on this website provided that they have the author's consent and proper reference is made to investingbythebooks.com.
2) Making bad loans
Real estate again…
Good spiral and bad spiral
Inflows and outflows
1990s. Currencies unfortunately now and then make big and sudden moves (ask those asset managers making their living from FX arbitrages). When the domestic currency in which the lender has all his income depreciates against the foreign currency in which the loans are denominated the borrowers often can no longer service its debt.
The second theme, moving on from mismatches, is lending (too much) to a customer who cannot afford the loan. The obvious example here was the US sub-prime crisis where the customers often couldn’t service their loans from regular income. Instead the deals were a blind one-way bet that real estate prices would keep going up facilitating increased leverage. The situation wasn’t much better in parts of Europe where individuals in some countries owned several properties through bank loans without any demands on amortization. The habit of propping up unsustainable consumption needs by borrowing on once real estate is still alive and kicking.
The real estate market is time after time a source of credit losses. Banks lend to customers who use real estate as collateral. This surprisingly often goes wrong – why is this? It is because the real estate market in many cases looks good because banks make it look good. Rising prices are fueled by the access to capital. The higher asset prices have a higher collateral value, which in turn motivates higher amounts of loans that increase prices even further in a self-reinforcing cycle.
During the entire cycle people will say “yes, the debt is high but it is more than supported by the value of the assets so there is nothing to worry about – there is no credit bubble”. Since banks don’t always realize that they have created the situation themselves they place unwarranted trust in the sustainability of the improving fundamentals and the asset values. When the cycle has spiraled for so long that it feels like something that has always been there the lending standards are relaxed and loan-to-value ratios shoot up. Sooner or later the price decline comes. Now the spiral starts to spin in the opposite direction.
Similar mechanisms are often seen in the lending to Emerging Markets. When economic times are good funds are transferred to EM from the western world on a large scale and the liquidity boost will further enhance economic growth. This naturally draws even more funds in a continuous spiral and since everything look fine banks, with local politicians as cheerleaders, relax lending standards, loan-to-value ratios shoot up and banks make large profits. The cycles can be so stretched out that it will feel almost unbearable to stay out of them during the good times. Then, sooner or later, the cycle reverses in a crisis, asset prices fall causing credit losses and the topic du jour becomes “flight to quality”, i.e. withdraw all money you can to countries that feel safer.

SHARING OF FINANCIAL WISDOM
Others may quote and refer to the contents on this website provided that they have the author's consent and proper reference is made to investingbythebooks.com.
Catch22
3) Trading losses
Keeping the other side of created OTC-derivates
Underlying factors
Assets = credit risk
Liabilities = liquidity risk
The credit losses in both real estate and emerging markets come from the human tendency to extrapolate even relatively short trends and expect them to continue into the future. This makes banks lend money to customers that in changed circumstances cannot afford the loan. Further, as the classic Chuck Prince quote above indicates, it’s a market share race that you as a CEO have a hard time staying out of. If the competitors are relaxing their lending standards, you don’t and the good times continue for yet some time the board will start to discuss if it’s not time to change to a less stodgy leadership.
A third theme in bank failures is losses in the non-banking activities, especially investment banking trading losses. The classic example is Barings Bank where losses on futures contracts out of the Singapore office caused the world’s second oldest bank to collapse as the slim sliver of equity got wiped out. There have since the GFC been numerous cases of trading losses that have been big but not life threatening to the big banks. No, Swedish examples like Carnegie and HQ hardly qualify as big banks.
However, despite not being the full story, to some extent you could say that the trouble that the big US investment banks got themselves into during the global financial crisis also was due to trading losses. Although the general exposure to the mortgage segment was securitized and the credit risks thereby transferred to other parties, the market frenzy and the illusionary security of the diversification of baskets of mortgage loans made several investment banks keep the other side of the trade when some of their customers wanted to short the mortgage market. A not insignificant amount of certain banks’ assets consisted of positions where they speculated against their customers and where they were proven dead wrong.
Asset-liability mismatches, improper lending and trading losses are direct triggers of a banking crisis. Often there are also underlying macro factors behind the troubles. Many banking crises have followed on a period of deregulation. It’s probably not the level of regulation per se that is the crucial point but the change and the bonanza of business opportunities that follow with occasional (or predictable as some would argue) overshooting. Lax monetary policies and the boom-bust-cycle in asset values that tend to follow is another example of underlying drivers of financial predicaments.
So in conclusion, risks in banks are generally interrelated, the asset side of the balance sheet presents risks due to losses in value of assets like loans or trading capital and the liability side of the balance sheet presents risks through the inability to continue funding the business. Or to make it even shorter: the assets bring credit risk and the liabilities bring liquidity risk.
SHARING OF FINANCIAL WISDOM
Others may quote and refer to the contents on this website provided that they have the author's consent and proper reference is made to investingbythebooks.com.
And talking about risks
ALCO – Asset liability committee
90 or 180 days behind
Credit risk
§ PD – probability of default
§ EAD – exposure at default
§ LGD – loss given default
Collateral
8.7 Risk Management “I am not so much concerned with the return on capital as I am with the return of capital.” / Will Rogers
The overall risk management process of a bank differs little from any other company. In a first step reviews try to identify various sources of risk. Then the task is to try to quantify the potential losses (generally in money but also in reputation etc.) that can come from these risks. Without taking any risk no business would earn any money. The bank must decide on the acceptable maximum level of losses from the identified risks. Finally, procedures and constraints have to be implemented to ensure that the risks are kept within what is deemed acceptable boundaries.
Operating a bank comes with a number of risks such as for example credit risks, interest rate risks and operational risks. The asset-liability risk management processes of banks run by an asset liability committee (called ALCO – no relation to the Finish retail chain of invigorating beverages as we know of…) aim to control some of these risks in a coordinated way while ensuring that profits are maximized within the constraints that the process brings. Risk management requires investments in technology and processes where the successful outcome is that nothing happens – a somewhat unrewarding situation for a risk manager.
Credit risks
When a customer to a bank borrows money it’s expected that he intends to pay them back at some time (otherwise it’s called stealing). Unfortunately borrowers cannot always repay what they have borrowed or pay the interest they owe causing the banks credit losses. Especially in trying economic times the borrower might lose his job or see his income decline substantially for some reason. The cyclical timing of credit losses adds to the cyclicality of the earnings in the banking sector. Once the customer misses a payment he’s said to be in arrears, i.e. he has fallen behind, and once he is 90 (or 180) days behind, the outstanding portion becomes a non-performing loan (NPL). Banks then set aside provisions for such losses that reduce profits.
Managing credit losses is arguably the most important risk management task in a bank. To be able to price credit risk correctly, that is price it high enough to not sustain any fatal blows to the body (or the profit in this case) but low enough to be a competitive lender, it needs to be analyzed. Credit risk can be analyzed as a function of a) the probability of default (PD), b) the size of the banks’ exposure in the case of default (EAD) and c) the loss given default (LGD).
The probability of default will depend on both external factors such as the economic environment and customer related factors related to his expected future cash flows. The size of the exposure is naturally what the customer has borrowed (that sometimes tends to escalate in times of emerging financial trouble), while the loss given default also comes down to what can be rescued by selling the collateral on the loan – if there is any.

SHARING OF FINANCIAL WISDOM
Others may quote and refer to the contents on this website provided that they have the author's consent and proper reference is made to investingbythebooks.com.
5C’s of Credit
§ Character
§ Capacity
§ Capital
§ Collateral
§ Conditions
Correlations matter
Charge for risk
LTV – Loan-to-value ratio
Covenants
The bank should factor in that the value of this collateral will probably go down during a sometimes lengthy selling process exactly at those times that the probability of default increases. Expected loss on a lent amount is simply the expected probability of default multiplied by the expected loss given a default.
EL = PD x LGD
Banks have internal risk systems analyzing all this. A borrower's creditworthiness will be judged based on the so-called 5C's of Credit: character, capacity, capital, collateral, and conditions. Character, capacity, and capital refer to the borrower's willingness and ability to repay the debt. Conditions include the borrower's situation as well as general economic factors. Collateral is the bank’s safety if the borrower fails on the loan. Some add a 6th C called control that refers to the degree if sensitivity to external factors such as changes in laws and regulations.
When analyzing expected credit losses it is crucial to also have an understanding of the correlation between sources of potential losses. Prior to the financial crisis, potential losses from a mortgage loan in the US were seen as largely uncorrelated to other mortgage loans. This view was fully supported by the historic datasets that were used to estimate risks. When thereafter a large section of loans became impaired in parallel all over the country this assumption was clearly proven false.
The riskier the borrower and the less collateral, the higher interest rate the bank should demand to compensate for the credit risk. The largest borrowers in banks are retail consumers (as opposed to corporations) and the risk in these loans will vary. For example a mortgage loan where the real estate property is used as collateral will have a lower interest rate than a straight consumer loan without collateral to the same person. The first loan is called “secured” as the bank has the right to take ownership of the property if the customer fails to honor his loan agreement. Since there is no collateral in the second case the loan is called “unsecured”.
The bigger the collateral in relation to the loan the safer the loan and the lower the interest rate. The level of safety is measured with the loan-to-value-ratio (LTV). With a LTV of 100% at the time of making the loan the bank will have potential difficulties in case of a later default. Defaults tend to happen in weaker economic times and the value of the collateral, say a house, may well be declining, the selling of the house is costly and takes time further increasing the risk of declines in the house’s selling price.
With some loan agreements come so-called covenants that either requires the borrower to take certain actions like providing information, maintaining insurance and liquidity, or restricts the borrower from taking other actions without approval for example like taking on further debt, participating in M&A, paying certain levels of dividends etc. The obvious thought is that a borrower that behaves in a more lender-friendly way will cause less credit risk.

SHARING OF FINANCIAL WISDOM
Others may quote and refer to the contents on this website provided that they have the author's consent and proper reference is made to investingbythebooks.com.
CDS – Credit Default Swap
Interest sensitive industry
Price risk and reinvestment risk
The gap
Duration matching
Holding liquidity
Generally there is an organizational hierarchy of credit committees in a bank that oversee and decide on increasingly important loans. Credit risk exposures can also be managed by the treasury department taking positions in credit risk derivates like credit default swaps (CDS). These can be seen as taking an insurance against credit losses but also come with counterparty risks.
Interest rate risk
When the market interest rates change, the main sources of revenue for traditional universal banks like interest income on loans and investment securities also potentially change. So do some of the main costs of the bank related to interest costs from various borrowings. This affects both the value of assets, of liabilities and thereby of equity but also feeds through the income statement and the statement of comprehensive income.
The interest risk comes both from 1) price risk as the value of fixed interest securities and loans see changes in their value as market rates fluctuate and 2) reinvestment risk that arises when a firm is forced to invest incoming funds in lower-yielding assets. Managing the interest rate risk generally falls on the bank’s treasury department and the asset-liability committee.
One measure of interest rate risk is as we have discussed above the maturity of the assets and the liabilities. Positions with longer maturities react stronger to interest rate changes than those with short. Without any intervention a bank’s default position is to borrow on shorter maturities and lend on longer maturities meaning the bank profits from a steepening yield curve and vice versa. Banks with more interest sensitive assets than liabilities are said to have asset-sensitive (or positive) gap. Further, the interest rate sensitivity of the assets and liabilities depend on the level of the coupons and the yields plus on the mix of fixed vs. variable interest rate contracts.
Unwanted interest risk is handled by what is called duration matching. By taking extensive derivate position in interest rate forwards and swaps, banks manage their net interest risk coming from maturity positioning. Due to regulation the maturity profiles of assets and liabilities in most banks are relatively matched today when including derivates. However, the treasury department takes active positions in accordance to their view of how interest will change going forward. Thus, the bank might as well have a liability-sensitive (negative) gap.
With the underlying shorter maturities on liabilities than in the assets come funding liquidity risks if customers withdraw deposits or wholesale funding dries up. The net liquidity position also has to be managed by holding enough liquid assets to be able to handle funding issues. Unfortunately the opportunity cost is that these liquid assets come with lower interest rate income. As we shall see this has been one of the many themes of recent regulation and some of the liquid assets reserves in banks are there by legal requirements.
SHARING OF FINANCIAL WISDOM
Others may quote and refer to the contents on this website provided that they have the author's consent and proper reference is made to investingbythebooks.com.
Protect society
GFC – Global financial crisis
Regulation is a growth business
Agenda
Consumer back-up and deterrent
No money left…
8.8 Regulation Most sectors are mainly regulated to protect the customers and sometimes the environment. Customer protection is a part of bank regulation but only a small part. The main part of bank regulation is in place to protect society. The investor into a bank will face more than average regulatory risk as the rules are in constant flux.
As we have seen a bank may fail from either solvency issues or from the liquidity issues. Both the market and regulators police the capital levels of banks. Before the GFC the equity market was seen as a more potent police than it turned out to be, belief in self-regulation was widespread but the last few years have seen an avalanche of new less sanguine regulatory action, spearheaded by the Bank for International Settlements in Basel Switzerland.
Prior to the financial crisis the cost of regulation such as the stifling of innovation or the market price distortions was emphasized. Afterwards, consumer and taxpayer protection got the entire spotlight. Detailed rules-based regulation expanded on the expense of self-regulation and principles-based rules. Bank regulation today is an enormously complex area. The regulations come in many varieties and we cannot cover them all but will schematically run through the most important aspects.
In turn we will look at:
§ Deposit insurance
§ Capital requirements
§ Bail-in-Capital
§ Funding and liquidity requirements
§ Other rules and regulations
Deposit Insurance
One centerpiece of the bank regulation is the deposit insurance that is meant as a back-up protection in case of solvency issues and as a deterrent for bank runs. Depositors deposit their money since it is easy, presumably safe, relatively cheap (although some would perhaps object to this) and because they want to have immediate access to their money - they have a liquidity preference, as the economist would say. In many Western World countries it is hard for someone to function in society without a current account used to carry out transactions.
Since most available funds in a fractional reserve system are lent to borrowers, very little of the depositors’ money are lying around as idle cash at the bank. From this follows that not that many of the depositors can withdraw their money at the same time before the bank runs into trouble. Hence, savers must have enough confidence that their money is safe with the bank so that they leave it there. The banking business is in many ways built on confidence.

SHARING OF FINANCIAL WISDOM
Others may quote and refer to the contents on this website provided that they have the author's consent and proper reference is made to investingbythebooks.com.
…but no worries
Regulatory arbitrage
Risk/reward
Capital to absorb unexpected losses
Same-ish thing:
RWE – Risk weighted assets
REA – Risk exposure amount
This is where the deposit insurance comes in. Deposit insurance is a governmental guarantee for a certain amount of deposited money administered by a central pool of funds. In the EU the guaranteed amount is generally EUR 100,000 per retail customer per bank. So, even though deposits are a form of unsecured funding in a bank they are in this way protected in case of a bank failure. With the money guaranteed the need to withdraw them from the bank is prevented.
The fact that the deposit insurance makes deposits equally safe in any bank that is included in the scheme has in Sweden meant that deposits in smaller consumer finance focused banks have grown substantially despite the higher credit risk in their lending. Firms like Collector, Bluestep, Nordax and Resurs bank have captured a substantial part of new deposit volumes the last few years. As have Hoist who instead of lending the deposited money to customers use them to buy NPLs from banks at deep discounts and then try to recover as much of the loans as possible.
Capital Requirements
The amount of equity capital a company has in relation to the assets is a leverage ratio often called the equity ratio – the higher the more financially secure the company. However, the higher risk that comes with a higher leverage also gives the company the opportunity of earning a higher return on the equity capital of their owners as long as the business is good. It’s a balance between risk and reward. The capital in a bank must limit the risk of failures, preserve public confidence (or the bank will fail anyway) and from the public’s point of view limit losses to the government and the tax payers in times of trouble.
Thus, capital in a bank is maintained to be able to absorb unexpected losses without causing a bank to fail. Banking regulation since the 1980s uses a number of ratios with a parallel logic to the equity ratio but where the definition of both equity capital and assets has been adjusted in increasingly complex ways.
The “capital” (the regulator’s version of equity) in these ratios adds additional types of capital to the equity but also makes deductions. The assets are risk weighted, i.e. their weights are adjusted according to their estimated riskiness. In the large majority of instances the sum of the assets are adjusted down. The adjustments to the capital will in relative terms be smaller and as the risk adjusted sum of assets decrease, this gives a significantly higher risk-weighted capital ratio compared to a straight equity ratio. Over time the definitions of the capital, the risk weighted assets (RWA or risk exposure amount, REA) and the required levels of ratios have changed multiples times. The goalposts are still moving but we will try to describe the current situation in a simplified way.
SHARING OF FINANCIAL WISDOM
Others may quote and refer to the contents on this website provided that they have the author's consent and proper reference is made to investingbythebooks.com.
CET1 – Common equity tier 1 (or core tier one capital)
The CET1 ratio
The numerator
Now it starts to become complicated…
…and there’s more
The denominator
The most important rules today regard the Basel 3 common equity tier 1 (CET1) or core tier one capital, where the assets are weighted according to their credit risk, market risk and operational risk. The Basel 3 Tier 1 Common ratio could be expressed as:
We will start with the numerator – tier 1 common capital (CET1) or core tier one capital. The CET1 is seen as the highest quality capital in the bank. Common shareholder’s equity in a bank is relatively straight forward as it includes share capital and retained earnings like for any other company. To this there are a number of adjustments made. Unrealized accumulated gains and losses on available-for-sale securities recognized through the comprehensive income statement are added (or subtracted in case of losses). Preference shares also count as equity capital.
Minority interests, some deferred tax assets and a proportion of mortgage servicing assets are included, albeit after some netting. A net amount of defined benefit fund assets are deducted and so are accrued dividends for the current year, treasury shares and minority holdings in other financial institutions. Finally, intangibles are deducted. In banks this is mainly goodwill. The last deduction actually acts as a deterrent against M&A in the banking sector as the goodwill will have to earn the full target ROE without the help of any leverage. The end result of all these intricate additions and subtractions (that also differ between the US and Europe) is that the CET1 will on average be slightly smaller than the common shareholder’s equity – but it doesn’t have to be.
In addition to CET1 there is so-called other tier 1 capital (OT1) and on top of that there is also tier 2 capital (and on the insistence of the French there used to be tier 3 capital but it is now scrapped). Tier 2 capital mainly consists of subordinated hybrid debt that isn’t eligible for tier 1 capital and of loan reserves from the revaluation of loans. There are required ratios for tier 2 capital as well but as these are deemed less important we will not discuss them further.
We now move on to the denominator of the CET1 ratio, the risk weighted assets (RWA). The main risks in today’s regulatory regime are credit risk, market risk and operational risk. Since the business mix of one bank will differ from that of another the credit risk, market risk and operational risk will contribute in varying ways to the total risk weighted assets of the bank. A retail bank will have a larger proportion of the RWA generated from credit risk and an investment bank more from market risk and possibly also from operational risk. About 80% of the risk weighted assets in Swedish banks arise due to credit risk.
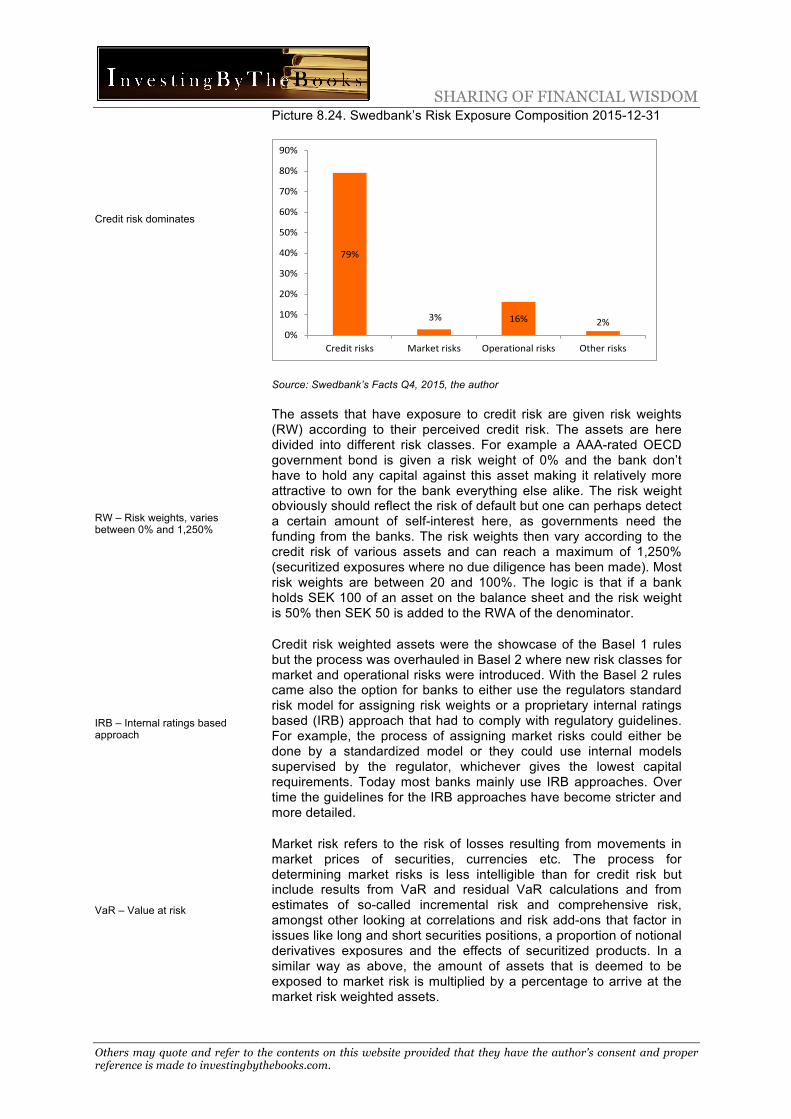
SHARING OF FINANCIAL WISDOM
Others may quote and refer to the contents on this website provided that they have the author's consent and proper reference is made to investingbythebooks.com.
Credit risk dominates
RW – Risk weights, varies between 0% and 1,250%
IRB – Internal ratings based approach
VaR – Value at risk
Picture 8.24. Swedbank’s Risk Exposure Composition 2015-12-31
Source: Swedbank’s Facts Q4, 2015, the author
The assets that have exposure to credit risk are given risk weights (RW) according to their perceived credit risk. The assets are here divided into different risk classes. For example a AAA-rated OECD government bond is given a risk weight of 0% and the bank don’t have to hold any capital against this asset making it relatively more attractive to own for the bank everything else alike. The risk weight obviously should reflect the risk of default but one can perhaps detect a certain amount of self-interest here, as governments need the funding from the banks. The risk weights then vary according to the credit risk of various assets and can reach a maximum of 1,250% (securitized exposures where no due diligence has been made). Most risk weights are between 20 and 100%. The logic is that if a bank holds SEK 100 of an asset on the balance sheet and the risk weight is 50% then SEK 50 is added to the RWA of the denominator.
Credit risk weighted assets were the showcase of the Basel 1 rules but the process was overhauled in Basel 2 where new risk classes for market and operational risks were introduced. With the Basel 2 rules came also the option for banks to either use the regulators standard risk model for assigning risk weights or a proprietary internal ratings based (IRB) approach that had to comply with regulatory guidelines. For example, the process of assigning market risks could either be done by a standardized model or they could use internal models supervised by the regulator, whichever gives the lowest capital requirements. Today most banks mainly use IRB approaches. Over time the guidelines for the IRB approaches have become stricter and more detailed.
Market risk refers to the risk of losses resulting from movements in market prices of securities, currencies etc. The process for determining market risks is less intelligible than for credit risk but include results from VaR and residual VaR calculations and from estimates of so-called incremental risk and comprehensive risk, amongst other looking at correlations and risk add-ons that factor in issues like long and short securities positions, a proportion of notional derivatives exposures and the effects of securitized products. In a similar way as above, the amount of assets that is deemed to be exposed to market risk is multiplied by a percentage to arrive at the market risk weighted assets.
79%
3% 16% 2%0%
10%
20%
30%
40%
50%
60%
70%
80%
90%
Credit risks Market risks Operational risks Other risks

SHARING OF FINANCIAL WISDOM
Others may quote and refer to the contents on this website provided that they have the author's consent and proper reference is made to investingbythebooks.com.
Operations come back to bite
P1 – First pillar
P2 – Second pillar
FSA – Financial Securities Authority
A stack of ratios
Makes any sense?
Systemic risk surcharge capital requirement
G-SIB – Globally systematic important bank
Operational risk is the risk of a loss resulting from inadequate or failed internal processes, from people and systems or from external events. Trading losses where the traders violate their mandates spring to mind but it could be basically everything in any part of the business. Counterparty risks shows up in this segment and increased risk weights in this area are pushing OTC derivatives towards cleared trading. Banks can apply their own definitions of operational risk under certain guidelines, so they range from simple percentages applied on total revenues to detailed internal frameworks. The end result is an absolute sum of operational risk weighed assets.
Note that the above are three parallel processes to assign risk weights and it’s not the case that one set of assets is exclusively subject to one of the risks or that the assets are divided between the risks. Further, in the operational risk models not only assets add to the RWA but also exposures in the P&L. The combo of credit, market and operational risk handling are lumped under what the Basel Committee calls the first pillar (P1). A second pillar (P2) was added to give national regulators a more flexible tool for other types of risks that they deemed important. The national FSAs were by this given large powers to regulate banks beyond P1.
So now that we are done describing both the regulatory capital and the RWA, what is the capital ratio that banks need to have? Well, there is more than one ratio and the required level depends on several issues (you didn’t think it would be that easy did you?). In fact there are nowadays a full stack of required ratios – there are buffers on top of buffers. We will show them for the Swedish banks in a picture below.
The core tier 1 capital ratio, dividing the core tier 1 capital with the RWA has to be at least 4.5% plus a capital conservation buffer of 2.5% (the latter can be used to absorb losses during periods of financial and economic stress). Total capital requirements for banks are 3.5% higher than the 7% core tier 1 capital ratio threshold but the additional requirement may be met with up to 1.5 % OT1 capital and up to 2 % Tier 2 capital.
Basel 2 gave the national regulators a mandate to impose even higher additional capital buffers for risks under both pillar 1 and under pillar 2 if they deemed it necessary. The Swedish FSA has currently chosen to add one systemic risk surcharge capital requirement of 3% under P1 due to the high credit growth of the country and three additional capital requirements under P2, the first one also related to systemic risk, the second to household mortgages and then there is another category. In combination these P2 capital requirements amount to between 5.3% and 8.8% for the Swedish banks in Q2’16.
For some banks that are deemed as globally systemically important banks the required ratios for systemic risk have an international floor. Banks are scored after their size, interconnectedness, complexity, multinational activity and substitutability in the economy and the 75 banks with the highest score are globally systematic important banks (G-SIBs) that have to add between 1.0% up to 3.5%. Nordea as the only Nordic bank has a 1% buffer requirement. HSBC and JP Morgan Chase currently tops with 2.5%.
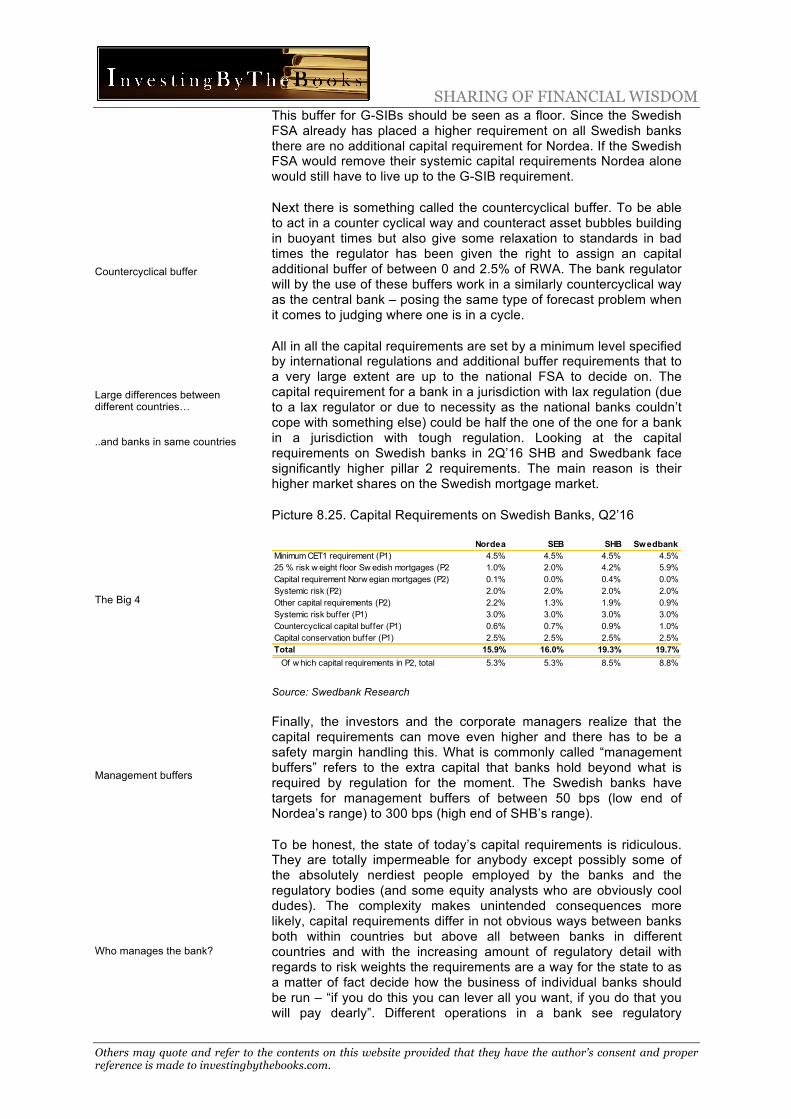
SHARING OF FINANCIAL WISDOM
Others may quote and refer to the contents on this website provided that they have the author's consent and proper reference is made to investingbythebooks.com.
Countercyclical buffer
Large differences between different countries…
..and banks in same countries
The Big 4
Management buffers
Who manages the bank?
This buffer for G-SIBs should be seen as a floor. Since the Swedish FSA already has placed a higher requirement on all Swedish banks there are no additional capital requirement for Nordea. If the Swedish FSA would remove their systemic capital requirements Nordea alone would still have to live up to the G-SIB requirement.
Next there is something called the countercyclical buffer. To be able to act in a counter cyclical way and counteract asset bubbles building in buoyant times but also give some relaxation to standards in bad times the regulator has been given the right to assign an capital additional buffer of between 0 and 2.5% of RWA. The bank regulator will by the use of these buffers work in a similarly countercyclical way as the central bank – posing the same type of forecast problem when it comes to judging where one is in a cycle.
All in all the capital requirements are set by a minimum level specified by international regulations and additional buffer requirements that to a very large extent are up to the national FSA to decide on. The capital requirement for a bank in a jurisdiction with lax regulation (due to a lax regulator or due to necessity as the national banks couldn’t cope with something else) could be half the one of the one for a bank in a jurisdiction with tough regulation. Looking at the capital requirements on Swedish banks in 2Q’16 SHB and Swedbank face significantly higher pillar 2 requirements. The main reason is their higher market shares on the Swedish mortgage market.
Picture 8.25. Capital Requirements on Swedish Banks, Q2’16
Source: Swedbank Research
Finally, the investors and the corporate managers realize that the capital requirements can move even higher and there has to be a safety margin handling this. What is commonly called “management buffers” refers to the extra capital that banks hold beyond what is required by regulation for the moment. The Swedish banks have targets for management buffers of between 50 bps (low end of Nordea’s range) to 300 bps (high end of SHB’s range).
To be honest, the state of today’s capital requirements is ridiculous. They are totally impermeable for anybody except possibly some of the absolutely nerdiest people employed by the banks and the regulatory bodies (and some equity analysts who are obviously cool dudes). The complexity makes unintended consequences more likely, capital requirements differ in not obvious ways between banks both within countries but above all between banks in different countries and with the increasing amount of regulatory detail with regards to risk weights the requirements are a way for the state to as a matter of fact decide how the business of individual banks should be run – “if you do this you can lever all you want, if you do that you will pay dearly”. Different operations in a bank see regulatory
Nordea SEB SHB SwedbankMinimum CET1 requirement (P1) 4.5% 4.5% 4.5% 4.5%25 % risk w eight f loor Sw edish mortgages (P2) 1.0% 2.0% 4.2% 5.9%Capital requirement Norw egian mortgages (P2) 0.1% 0.0% 0.4% 0.0%Systemic risk (P2) 2.0% 2.0% 2.0% 2.0%Other capital requirements (P2) 2.2% 1.3% 1.9% 0.9%Systemic risk buffer (P1) 3.0% 3.0% 3.0% 3.0%Countercyclical capital buffer (P1) 0.6% 0.7% 0.9% 1.0%Capital conservation buffer (P1) 2.5% 2.5% 2.5% 2.5%Total 15.9% 16.0% 19.3% 19.7% Of w hich capital requirements in P2, total 5.3% 5.3% 8.5% 8.8%
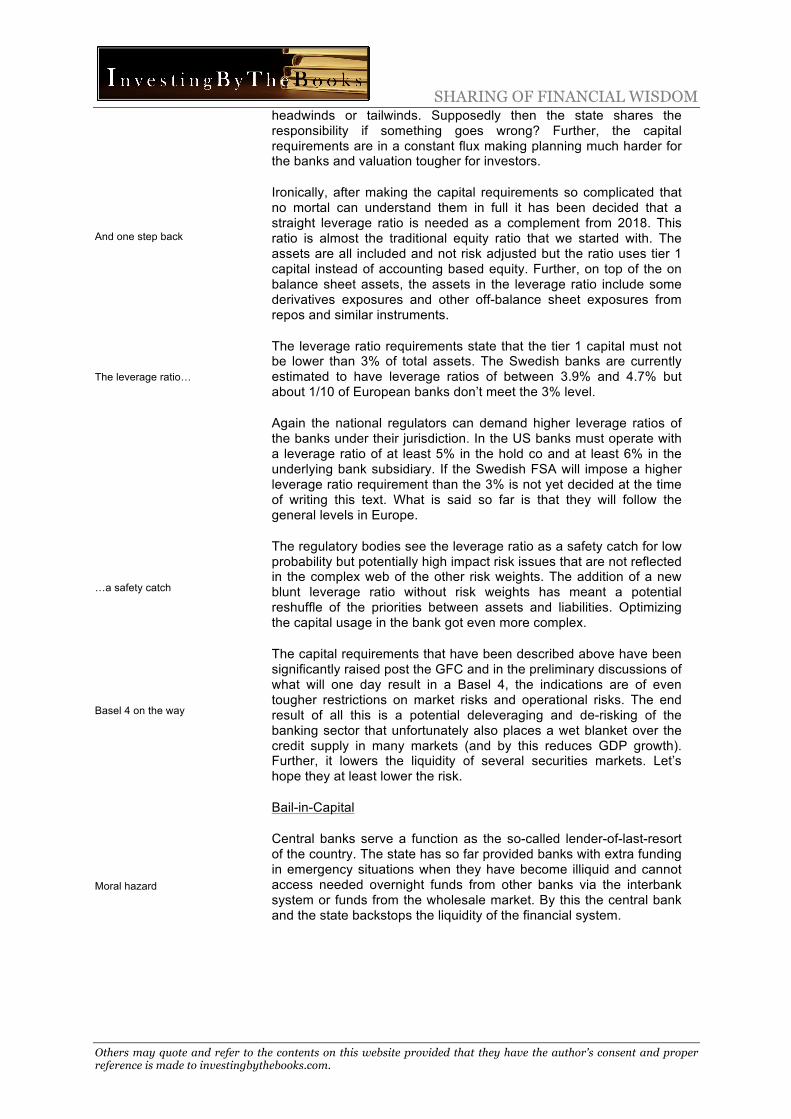
SHARING OF FINANCIAL WISDOM
Others may quote and refer to the contents on this website provided that they have the author's consent and proper reference is made to investingbythebooks.com.
And one step back
The leverage ratio…
…a safety catch
Basel 4 on the way
Moral hazard
headwinds or tailwinds. Supposedly then the state shares the responsibility if something goes wrong? Further, the capital requirements are in a constant flux making planning much harder for the banks and valuation tougher for investors.
Ironically, after making the capital requirements so complicated that no mortal can understand them in full it has been decided that a straight leverage ratio is needed as a complement from 2018. This ratio is almost the traditional equity ratio that we started with. The assets are all included and not risk adjusted but the ratio uses tier 1 capital instead of accounting based equity. Further, on top of the on balance sheet assets, the assets in the leverage ratio include some derivatives exposures and other off-balance sheet exposures from repos and similar instruments.
The leverage ratio requirements state that the tier 1 capital must not be lower than 3% of total assets. The Swedish banks are currently estimated to have leverage ratios of between 3.9% and 4.7% but about 1/10 of European banks don’t meet the 3% level.
Again the national regulators can demand higher leverage ratios of the banks under their jurisdiction. In the US banks must operate with a leverage ratio of at least 5% in the hold co and at least 6% in the underlying bank subsidiary. If the Swedish FSA will impose a higher leverage ratio requirement than the 3% is not yet decided at the time of writing this text. What is said so far is that they will follow the general levels in Europe.
The regulatory bodies see the leverage ratio as a safety catch for low probability but potentially high impact risk issues that are not reflected in the complex web of the other risk weights. The addition of a new blunt leverage ratio without risk weights has meant a potential reshuffle of the priorities between assets and liabilities. Optimizing the capital usage in the bank got even more complex.
The capital requirements that have been described above have been significantly raised post the GFC and in the preliminary discussions of what will one day result in a Basel 4, the indications are of even tougher restrictions on market risks and operational risks. The end result of all this is a potential deleveraging and de-risking of the banking sector that unfortunately also places a wet blanket over the credit supply in many markets (and by this reduces GDP growth). Further, it lowers the liquidity of several securities markets. Let’s hope they at least lower the risk.
Bail-in-Capital
Central banks serve a function as the so-called lender-of-last-resort of the country. The state has so far provided banks with extra funding in emergency situations when they have become illiquid and cannot access needed overnight funds from other banks via the interbank system or funds from the wholesale market. By this the central bank and the state backstops the liquidity of the financial system.

SHARING OF FINANCIAL WISDOM
Others may quote and refer to the contents on this website provided that they have the author's consent and proper reference is made to investingbythebooks.com.
Lehman experiment backfired
Solution: bad bank
Solution: recapitalize
Solution without taxpayers
Further, major banks through size and interconnectedness to other banks are too vital for the functioning of the overall economy to be allowed to go bankrupt (in an un-orderly way) – they are “too-big-to-fail”. Hence, the central bank in reality also has protected banks that aren’t solvent. However, this creates a moral hazard problem as employees and shareholders of the banks, by taking or allowing improper risks, can reap the rewards of the risky behavior but the taxpayer picks up the tab if something goes wrong.
In the 2007/08 financial crisis the US government after actively solving a situation regarding the collapsing Bear Stearns tried to set an example against improper risk taking by refraining from providing funding to the illiquid Lehman Bank. This lead to an acute acceleration of the crisis when illiquidity spread through the system as banks suddenly didn’t have the confidence to lend to each other. Confidence and liquidity dried up for banks that had large parts of their funding on very short maturities. Suddenly all US investment banks, several insurance companies and some of the universal banks had severe issues. The US government had to make a U-turn and the Federal Reserve effectively became the main lender to the banking system. Not taking responsibility as the lender-of-last resort was clearly not an option.
Historically a number of methods have been used to handle bank failures. These could either target the bad loans specifically or they could focus on the bank that is in trouble. One successful Swedish solution in the banking crisis of the early 1990s was to create state-owned “bad banks”. These generally buy the NPLs from the banks relieving them of the burden and then try to maximize the return from the purchased portfolio of loans. Giving state guarantees and by this securing the value of the NPLs is another solution recently used in the Chinese state-owned banks. Magically, it is then possible to book these loans at par value in the financial accounts.
Solutions can instead try to recapitalize the bank at hand. One way to do this is to inject the troubled bank into another bank with finances strong enough to handle the losses. Another way is to inject new capital into the bank. The capital could be in the form of “soft loans” or of equity. If equity is injected this generally means that the bank is being nationalized and the prior shareholders are being wiped out. This was more or less the case of Carnegie and HQ Bank. Just as in these cases the plan is generally to sell the bank back to the private sector when the troubles later on are solved. Unfortunately all the above solutions put the taxpayers’ money on the line.
To solve this too-big-too-fail issue in a way that doesn’t jeopardize taxpayers money the post crisis regulation was broadened materially and the new rules aim to privatize the cost of bank failures and provide capital market or bank funded airbags that should take the hit prior to the central bank assumes its role as the lender-of-last-resort. The regulatory area has as usual developed into a capital soup nightmare. First the capital requirements have been increased, potentially bringing down the leverage in banks (described above), then came requirements regarding the maturity profile of the funding (NSFR below), on having enough liquid assets to handle fund outflows (LCR below) and on bail-in-capital to be converted into equity in case of solvency issues (TLAC and MREL). What follows are short descriptions of these new bail-in-capital rules.
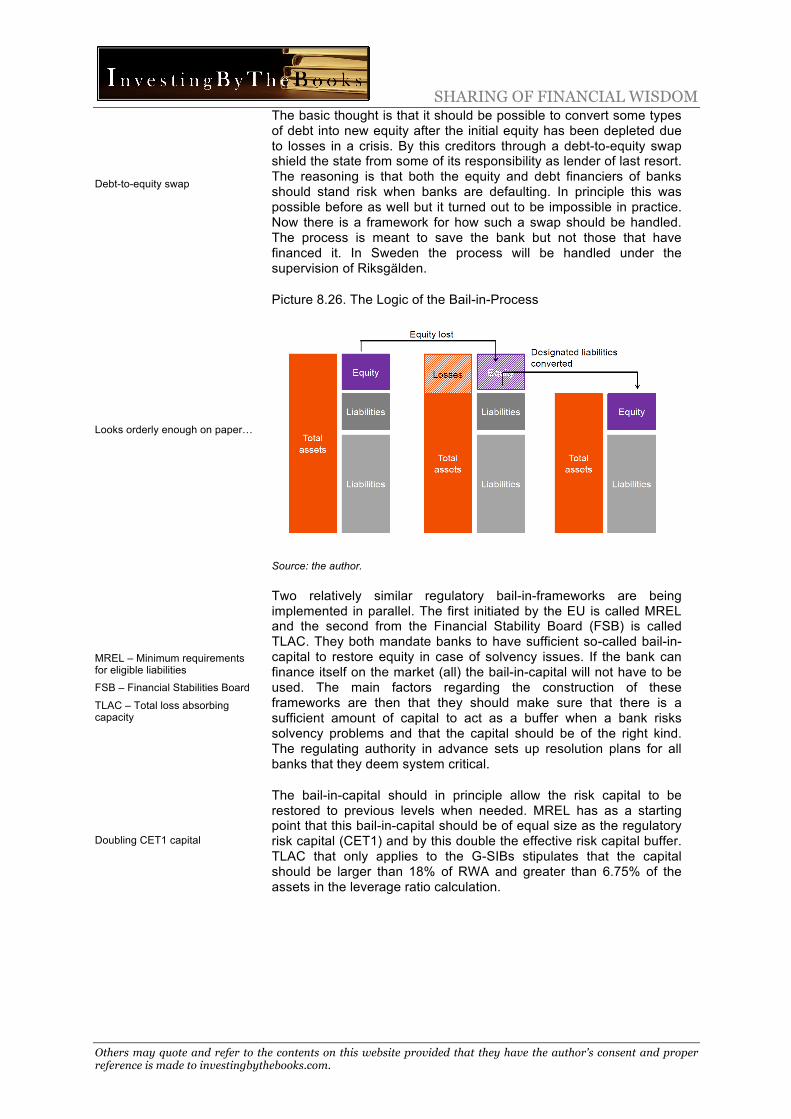
SHARING OF FINANCIAL WISDOM
Others may quote and refer to the contents on this website provided that they have the author's consent and proper reference is made to investingbythebooks.com.
Debt-to-equity swap
Looks orderly enough on paper…
MREL – Minimum requirements for eligible liabilities
FSB – Financial Stabilities Board
TLAC – Total loss absorbing capacity
Doubling CET1 capital
The basic thought is that it should be possible to convert some types of debt into new equity after the initial equity has been depleted due to losses in a crisis. By this creditors through a debt-to-equity swap shield the state from some of its responsibility as lender of last resort. The reasoning is that both the equity and debt financiers of banks should stand risk when banks are defaulting. In principle this was possible before as well but it turned out to be impossible in practice. Now there is a framework for how such a swap should be handled. The process is meant to save the bank but not those that have financed it. In Sweden the process will be handled under the supervision of Riksgälden.
Picture 8.26. The Logic of the Bail-in-Process
Source: the author.
Two relatively similar regulatory bail-in-frameworks are being implemented in parallel. The first initiated by the EU is called MREL and the second from the Financial Stability Board (FSB) is called TLAC. They both mandate banks to have sufficient so-called bail-in-capital to restore equity in case of solvency issues. If the bank can finance itself on the market (all) the bail-in-capital will not have to be used. The main factors regarding the construction of these frameworks are then that they should make sure that there is a sufficient amount of capital to act as a buffer when a bank risks solvency problems and that the capital should be of the right kind. The regulating authority in advance sets up resolution plans for all banks that they deem system critical.
The bail-in-capital should in principle allow the risk capital to be restored to previous levels when needed. MREL has as a starting point that this bail-in-capital should be of equal size as the regulatory risk capital (CET1) and by this double the effective risk capital buffer. TLAC that only applies to the G-SIBs stipulates that the capital should be larger than 18% of RWA and greater than 6.75% of the assets in the leverage ratio calculation.

SHARING OF FINANCIAL WISDOM
Others may quote and refer to the contents on this website provided that they have the author's consent and proper reference is made to investingbythebooks.com.
Some unsecured debt
Certificate on entitlement
Secondary effects
Greenspan put fading
Still lender-of-last-resort
Resolution funds
Some of the liabilities in banks will by this change character and become similar to contingent convertibles (CoCo’s) and they will be priced with a higher yield. Bail-in-capital will mainly consist of unsecured debt. Traditional retail consumer deposits will not be part of the bail-in-capital – the rules are rather there to protect the depositors. Also, tax liabilities (surprise…) and derivatives will be excluded, the latter to avoid domino effects on counterparty banks.
In the case of a default the creditor will receive some type of tradable instrument – “a certificate of entitlement” - that later will be converted to equity plus what potentially remains of the debt. Since the ultimate losses in a banking crisis only can be estimated the process contains huge amounts of uncertainty. There is a risk for errors and that the state will face lawsuits. Pending lawsuits cannot however stop the process and claims are meant to be settled later on.
There are some potential secondary effects of the new rules. One of the consequences is that banks with a high level of secure and cheap deposit funding might have to raise other types of debt through issuing unsecured securities to comply with the regulation. If the bail-in-capital is converted to equity the owners of the bank will in effect be a number of creditors such as interest rate funds that probably don’t even have the mandate to hold equities. There could be a lot of forced sellers in these types of situations.
The concept of bail-in-capital is a major change in the risk-reward profile of the banking sector. The “Greenspan put” is disappearing - and not only for shareholders but for creditors as well. Potentially this will mean that the cost of equity will rise. It will definitely mean that the interest rates of many unsecured securities issued by the banks will go up, as the implicit backstop from the government will be less tangible.
The lowered value of the governments backstop was recently publicized as the Swedish finance minister stated the state’s role as the lender-of-last-resort as the somewhat strained explanation for imposing an industry specific tax on the Swedish banks. The banks protested by saying that the state now through the bail-in-rules has stepped away from this responsibility. Surely, the responsibility is still there but the probability that the state will have to live up to its obligation has been lowered significantly with the new rules. The bail-in-rules include a backdoor that allows for state support of banks if considerable haircuts have been made and if there is a risk of a systemic crisis. This support has to be approved by the EU. In the end it will be a political decision.
The above creation of quasi-risk capital under MREL and TLAC are processes that go on top of the so-called resolution funds under the EU Single Resolution Mechanism where banks have been mandated to set aside money in a public fund to be used in times of banking failures. The single resolution fund is gradually being build up and it should in the end reach at least 1% of the total deposits in all credit institutions in a country. The state hasn’t escaped its role as lender of last resort but it has on top of raised capital requirements created several privately funded buffers to take the hit before it has to step in.

SHARING OF FINANCIAL WISDOM
Others may quote and refer to the contents on this website provided that they have the author's consent and proper reference is made to investingbythebooks.com.
Maturity mismatches and liquidity issues
NSFR – Net stable funding ratio
ASF – Available stable funding
RSF – Required stable funding
LCR – Liquidity coverage ratio
HQLA – High quality liquid asset
Can’t trust the wholesale market
Funding and Liquidity Requirements
Bank failures either come from solvency issues caused by the decline in value of assets from trading losses or from liquidity shortages that make it impossible for the bank to refinance itself. The latter is often caused by an asset-liability maturity mismatch. The capital requirements and the bail-in-capital targeted the solvency issues by focusing on the capital. The net stable funding ratio (NSFR) and the liquidity coverage ratio (LCR) target the maturity mismatch and liquidity issues.
NSFR requires banks to hold more stable and longer maturity funding sources against their more illiquid assets like for example mortgage loans. The maturities of assets and liabilities in a bank by this should match better. This is meant to reduce the need for emergency liquidity back-up from the central banks in times of funding shortages but also takes away some of the banks chance to earn money on maturity transformation. It has also meant that the interest rates on mortgages have decoupled from short maturity interest rates like the central bank’s policy rates. In popular media this decoupling often comes down to the malice of the banks when in reality it is a legal requirement that everything else alike decreases the banks’ profitability from funding itself short and lending long.
The NSFR is calculated as the available stable funding (ASF) divided by the required stable funding (RSF) and the ratio has to be above 100%. The ASF measures the portion of the bank’s liabilities that are seen as reliable over a one-year horizon. The RSF measures the portion of the banks on and off-balance sheet assets that are seen as illiquid over a one-year horizon and by this a stable source of funding. When calculating ASF and RSF different assets and liabilities get weighted in a similar manner as when capital requirements are calculated. Retail deposits have a 95% weight in ASF while corporate deposits have 50%, deposits from, the apparently untrustworthy, financial institutions receive a weight of 0% and so on.
The LCR aims to ensure that banks hold enough of high quality liquid assets (HQLA) to withstand a stress scenario of acute funding outflows during 30 days. The HQLA must be free of any restrictions so they can be liquidated at “non-fire sale” prices to meet the outflows. Cash, central bank reserves and some OECD government securities can be included at the full amount; other government securities, corporate bonds and stocks receive increasingly large haircuts. Further, there are limits on how much of the HQLA that can come from various types of assets.
The estimated outflow is calculated by multiplying the outstanding amount of various on and off balance sheet liabilities with an expected monthly run-off rate (net of expected inflows during the same scenario period). The faster funds are expected to disappear out the door the higher amount is included in the outflow amount. Stable deposits have a 5% assigned run-off rate while short-term borrowings on the wholesale market have a 100% assigned run-off rate. The ratio of HQLA divided by the estimated outflows must be over 100%. The LCR ratio is only applicable for the G-SIBs. There are however local LCR requirements placed on other banks by national regulators.
SHARING OF FINANCIAL WISDOM
Others may quote and refer to the contents on this website provided that they have the author's consent and proper reference is made to investingbythebooks.com.
SLR – Statuary liquidity ratio
CRR – Cash reserve ratio
A multifactor equation
Stress tests
Living wills
Volcker rule
The LCR is similar to the cruder statuary liquidity ratio (SLR) that some countries have had for many years and that mandates banks to hold a certain amount of their assets in liquid assets such as government securities and gold. The effects of both sets of rules are that a certain amounts of the bank’s assets cannot be lent out as loans. This is also the effect of so called cash reserve ratios (CRR) that states that a bank in the particular country has to deposit a varying amount of its capital with the central bank. This latter is rather a way for the central bank to influence the amount of money in the economy. Swedish banks are not subject to SLRs or CRRs.
Again, NSFR and LCR – like the often-contradictory capital requirements - change the relative attraction of the different assets and liabilities in the banks. The ability of banks to optimize the use of their available capital in their operations is turning into a complex multifactor equation that is changing in real time depending on the input variables. Banks are morphing from businesses into regulatory driven financial constructs steered by people with supercomputers. So far relative winners from all the changes should be capital light businesses like commission based agency trading, advisory services and wealth and asset management.
Other Rules and Regulations
Larger banks annually undergo a stress test to ensure their solvency under three differently severe scenarios regarding economic activity, market prices, spreads and volatility, interest rates, housing markets, FX changes, international contagion and counterparty defaults. There is one quantitative test looking at the capital adequacy post the scenario has played out and one qualitative test reviewing the ability of processes in the bank to handle the scenarios. The purpose is to ensure that banks don’t return too much capital to their shareholders. In effect the banks must ask for permission to give out dividends or buy back shares. The degree of harshness of the stress tests is then an additional way for the regulator of steering the capital base of the banks on top of the capital requirements. Those that don’t pass the test will have to revise their dividend and buy-back plans.
Somewhat similar to the bail-in-framework is that US regulators mandate larger US banks and overseas banks that operate in the US to periodically submit so-called “living will”-plans that describe their strategy for a quick and orderly resolution in the event of the failure of the company.
There are a number of regulatory changes that have implications for the investment banking business. These include increases in the amount of capital that bank must hold against their trading books and the market risks in these. This naturally makes proprietary trading less profitable. In the US the Volcker rule will even ban banks from holding proprietary trading books. Market making is still allowed if the bank can justify their inventory on expected customer flows. Further, the US has since a few years switched to mandatory central clearing for standardized derivatives and Europe is following suit.
SHARING OF FINANCIAL WISDOM
Others may quote and refer to the contents on this website provided that they have the author's consent and proper reference is made to investingbythebooks.com.
CSA – Commission sharing agreements
An acronym paradise
Fintech – Financial technology
Mostly retail
The EU has decided to unbundle how mutual funds pay for equity research and execution. Instead of a bundled payment the payments from mutual fund clients will be split in two, separating the business models of equity research and equity execution. Often the increased transparency of unbundling of two services leads to price pressure.
Picture 8.27. And Basel 4 on the Way
Source: hollandfintech.com
8.9 Fintech In this section we will explore the digitalization of the banking business, the emergence of so-called financial technology (or fintech) startups and take a special look at the payment business that has attracted new competition. However, since fintech companies as a collective pose a very real strategic threat to banks we will first discuss the strategy used in the banking industry.
It’s not that investment banking is spared from the effects of technological changes but as banks still have strong command over this area we will not focus on the investment banking market in the below segment. Many investment banking services are used infrequently; they rely on personal contacts and require relatively large amounts of customization, so far making them less suitable for automation.
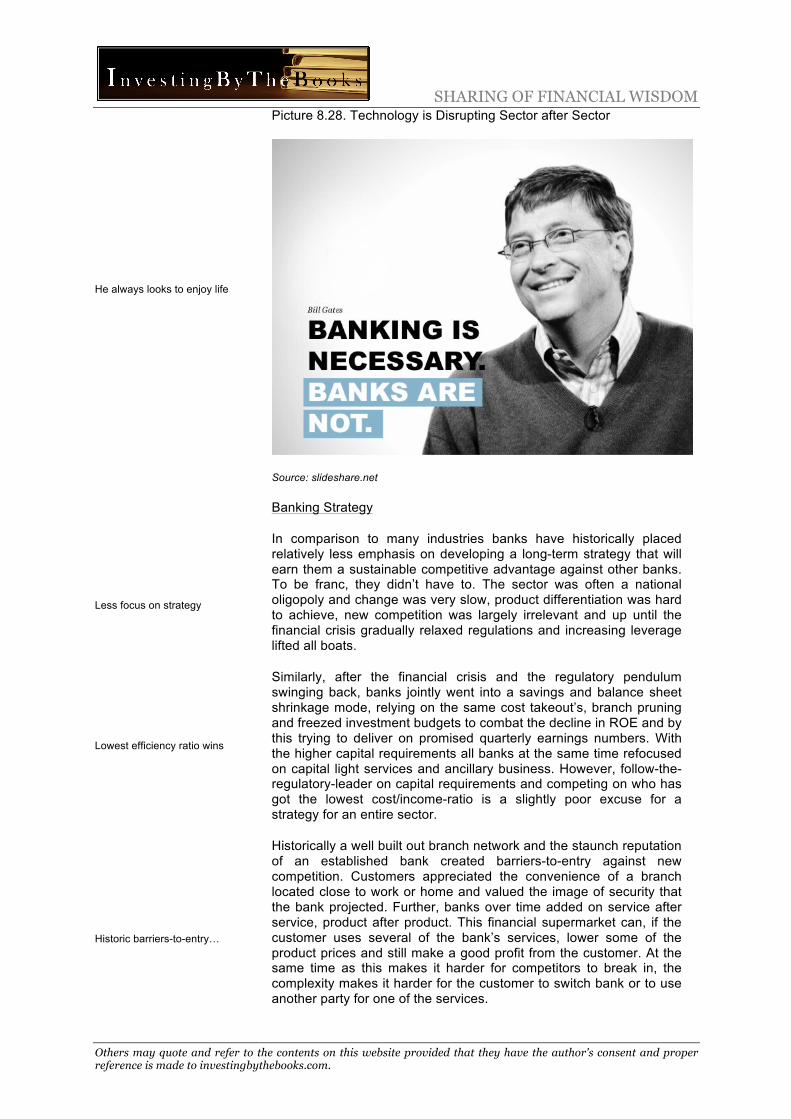
SHARING OF FINANCIAL WISDOM
Others may quote and refer to the contents on this website provided that they have the author's consent and proper reference is made to investingbythebooks.com.
He always looks to enjoy life
Less focus on strategy
Lowest efficiency ratio wins
Historic barriers-to-entry…
Picture 8.28. Technology is Disrupting Sector after Sector
Source: slideshare.net
Banking Strategy
In comparison to many industries banks have historically placed relatively less emphasis on developing a long-term strategy that will earn them a sustainable competitive advantage against other banks. To be franc, they didn’t have to. The sector was often a national oligopoly and change was very slow, product differentiation was hard to achieve, new competition was largely irrelevant and up until the financial crisis gradually relaxed regulations and increasing leverage lifted all boats.
Similarly, after the financial crisis and the regulatory pendulum swinging back, banks jointly went into a savings and balance sheet shrinkage mode, relying on the same cost takeout’s, branch pruning and freezed investment budgets to combat the decline in ROE and by this trying to deliver on promised quarterly earnings numbers. With the higher capital requirements all banks at the same time refocused on capital light services and ancillary business. However, follow-the-regulatory-leader on capital requirements and competing on who has got the lowest cost/income-ratio is a slightly poor excuse for a strategy for an entire sector.
Historically a well built out branch network and the staunch reputation of an established bank created barriers-to-entry against new competition. Customers appreciated the convenience of a branch located close to work or home and valued the image of security that the bank projected. Further, banks over time added on service after service, product after product. This financial supermarket can, if the customer uses several of the bank’s services, lower some of the product prices and still make a good profit from the customer. At the same time as this makes it harder for competitors to break in, the complexity makes it harder for the customer to switch bank or to use another party for one of the services.

SHARING OF FINANCIAL WISDOM
Others may quote and refer to the contents on this website provided that they have the author's consent and proper reference is made to investingbythebooks.com.
…and competitive advantages
Distribution has changed
A tech teach in
Hyper-connectivity brings…
The established banks have scale benefits in being able to handle the national regulatory burden, the customer switching costs makes it hard for new competitors to build a strong deposit franchise depriving them of this cheaper financing. Generally, in-market market shares have been important for profitability. Strong market share in one local geographic market has often been to prefer over a big but dispersed business over a larger area. Hence, retail banks are often regional businesses and even when they have global scale the operations are national or regional.
The Changing Environment
The change in the banking environment is predominantly a change in usage in distribution channels from physical branch offices to digital channels like online and above all mobile. The digitalization also brings shifting customer behaviors and attitudes. Underlying all this is however technological changes so we have to start with a short tech teach-in.
It might feel like the internet has been around forever but compared to the over 600 years it has been since Giovanni Medici set up Medici Bank in Florence the history is a blink of an eye. The effects of the internet cannot be emphasized enough. Ever increasing computing power and storage abilities, combined with the expanding bandwidths and connectivity of the internet has fundamentally altered both how products are produced and how corporations’ customer interaction is managed. Recently, the combination of what has been called cloud computing, internet of things and big data, plus the increasing proliferation of smartphones is disrupting sector after sector.
With the hyper-connectivity of the digital world physical distances have lost some of their relevance. This means a shift in how to approach customers and new possibilities in how to manage supporting IT-platforms. Airbnb and Uber are examples of companies that have disrupted industries whose business model build on matching two parties. Interestingly, the core business of banks is just to match borrowers and lenders. Also, the connectivity has meant a centralization of IT-resources to shared external service providers that can utilize significant scale economies. This has aided a democratization of the access to both IT-resources and advanced software.
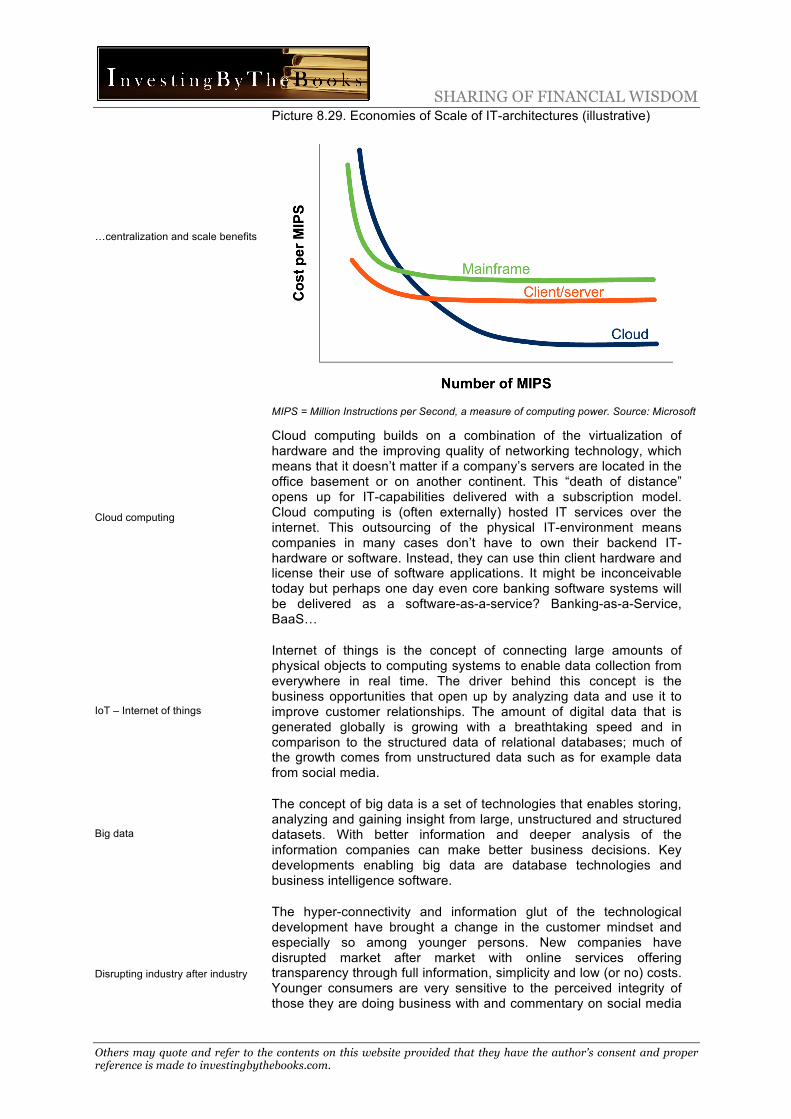
SHARING OF FINANCIAL WISDOM
Others may quote and refer to the contents on this website provided that they have the author's consent and proper reference is made to investingbythebooks.com.
…centralization and scale benefits
Cloud computing
IoT – Internet of things
Big data
Disrupting industry after industry
Picture 8.29. Economies of Scale of IT-architectures (illustrative)
MIPS = Million Instructions per Second, a measure of computing power. Source: Microsoft
Cloud computing builds on a combination of the virtualization of hardware and the improving quality of networking technology, which means that it doesn’t matter if a company’s servers are located in the office basement or on another continent. This “death of distance” opens up for IT-capabilities delivered with a subscription model. Cloud computing is (often externally) hosted IT services over the internet. This outsourcing of the physical IT-environment means companies in many cases don’t have to own their backend IT-hardware or software. Instead, they can use thin client hardware and license their use of software applications. It might be inconceivable today but perhaps one day even core banking software systems will be delivered as a software-as-a-service? Banking-as-a-Service, BaaS…
Internet of things is the concept of connecting large amounts of physical objects to computing systems to enable data collection from everywhere in real time. The driver behind this concept is the business opportunities that open up by analyzing data and use it to improve customer relationships. The amount of digital data that is generated globally is growing with a breathtaking speed and in comparison to the structured data of relational databases; much of the growth comes from unstructured data such as for example data from social media.
The concept of big data is a set of technologies that enables storing, analyzing and gaining insight from large, unstructured and structured datasets. With better information and deeper analysis of the information companies can make better business decisions. Key developments enabling big data are database technologies and business intelligence software.
The hyper-connectivity and information glut of the technological development have brought a change in the customer mindset and especially so among younger persons. New companies have disrupted market after market with online services offering transparency through full information, simplicity and low (or no) costs. Younger consumers are very sensitive to the perceived integrity of those they are doing business with and commentary on social media

SHARING OF FINANCIAL WISDOM
Others may quote and refer to the contents on this website provided that they have the author's consent and proper reference is made to investingbythebooks.com.
Online the first choice
Barriers crumbling
GFC – Global financial crisis
Investment banking culture
Big Tech is cool
platforms drives much of their views. Transparency and simplicity creates trust among younger consumers. As challengers many of the new startup companies have also been successful in building a “power to the people” aura around themselves.
Bank customers are increasingly time pressed and digital channels supply faster service and the convenience of 24/7 access. Compare this to standing in line on a bank branch office during a short lunch break or in-between finishing work and picking up your children from the karate practice. Also, the successful execution of a transaction without help of a bank employee gives the customer a feeling of control and self-achievement. Well-designed online services make the customer feel that he is in command, he is well informed and by this he gets better deals and saves money.
Prior barriers-to-entry for incumbent banks such as a dense branch network, offering convenience, and high levels of trust are starting to shake in their foundations. Digital channels are quickly becoming the primary access point to financial services for large customer groups and some customers hardly ever set foot inside the bank’s physical premises. The convenience and constant access of an easily used digital solution trumps the convenience that comes with close proximity to a branch office for almost all retail bank services.
In the aftermath of the GFC customer confidence in the incumbent banks have been damaged. The Occupy Wall Street-movement might have lost steam but banks are no longer seen as the trustworthy corporate citizens that they used to be. Further, younger age cohorts tend to view big corporations as something to shy away from. “Big Oil” is bad, “Big Pharma” is bad, how about “Big Banks”?
The corporate culture in investment banking has been much discussed post the 2008/09 crisis. In retail banking divisions, that are the more relevant ones when it comes to fintech competition, we would argue that the culture is relatively sound. At times it might be a bit complacent and slow but retail bank employees in general care about the customers. The problem is that the uglier side of the culture in investment banking rubs off on the brand of a bank and also on the brand of all banks. Instances such as the manipulation of LIBOR-rates, the reckless US subprime lending and rouge trader losses where the ten most severe cases in combination amount to losses of a staggering USD 46.7bn in 2007 prices (Nick Leeson is number 14 with a loss of USD 1.8bn) taint the brand name of banks in general.
Perhaps naively, startups with sometimes very rudimentary routines are then seen as more trustworthy. Research carried out in the US for Millennial Disruption Index last year revealed that, among people in-between their teens and mid-thirties, almost ¾ would prefer Apple or Google to deliver their financial services instead of their incumbent bank. “Big Tech” is good.
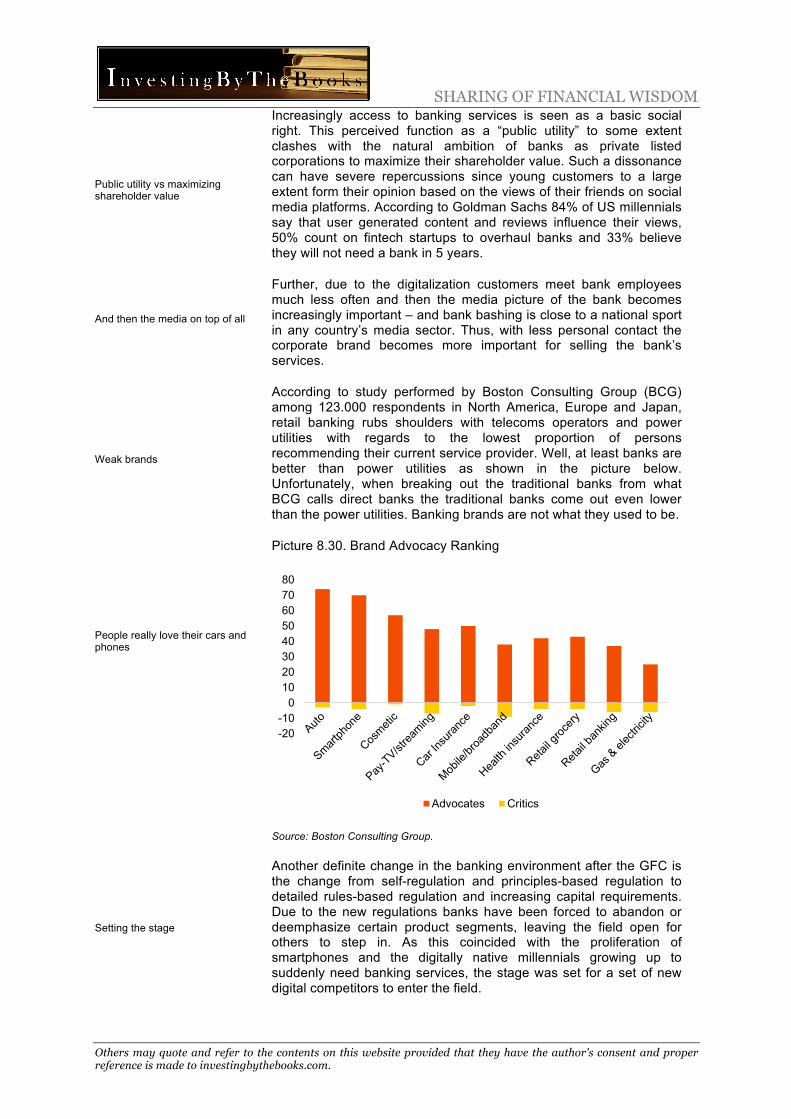
SHARING OF FINANCIAL WISDOM
Others may quote and refer to the contents on this website provided that they have the author's consent and proper reference is made to investingbythebooks.com.
Public utility vs maximizing shareholder value
And then the media on top of all
Weak brands
People really love their cars and phones
Setting the stage
Increasingly access to banking services is seen as a basic social right. This perceived function as a “public utility” to some extent clashes with the natural ambition of banks as private listed corporations to maximize their shareholder value. Such a dissonance can have severe repercussions since young customers to a large extent form their opinion based on the views of their friends on social media platforms. According to Goldman Sachs 84% of US millennials say that user generated content and reviews influence their views, 50% count on fintech startups to overhaul banks and 33% believe they will not need a bank in 5 years.
Further, due to the digitalization customers meet bank employees much less often and then the media picture of the bank becomes increasingly important – and bank bashing is close to a national sport in any country’s media sector. Thus, with less personal contact the corporate brand becomes more important for selling the bank’s services.
According to study performed by Boston Consulting Group (BCG) among 123.000 respondents in North America, Europe and Japan, retail banking rubs shoulders with telecoms operators and power utilities with regards to the lowest proportion of persons recommending their current service provider. Well, at least banks are better than power utilities as shown in the picture below. Unfortunately, when breaking out the traditional banks from what BCG calls direct banks the traditional banks come out even lower than the power utilities. Banking brands are not what they used to be.
Picture 8.30. Brand Advocacy Ranking
Source: Boston Consulting Group.
Another definite change in the banking environment after the GFC is the change from self-regulation and principles-based regulation to detailed rules-based regulation and increasing capital requirements. Due to the new regulations banks have been forced to abandon or deemphasize certain product segments, leaving the field open for others to step in. As this coincided with the proliferation of smartphones and the digitally native millennials growing up to suddenly need banking services, the stage was set for a set of new digital competitors to enter the field.
-20-1001020304050607080
Advocates Critics
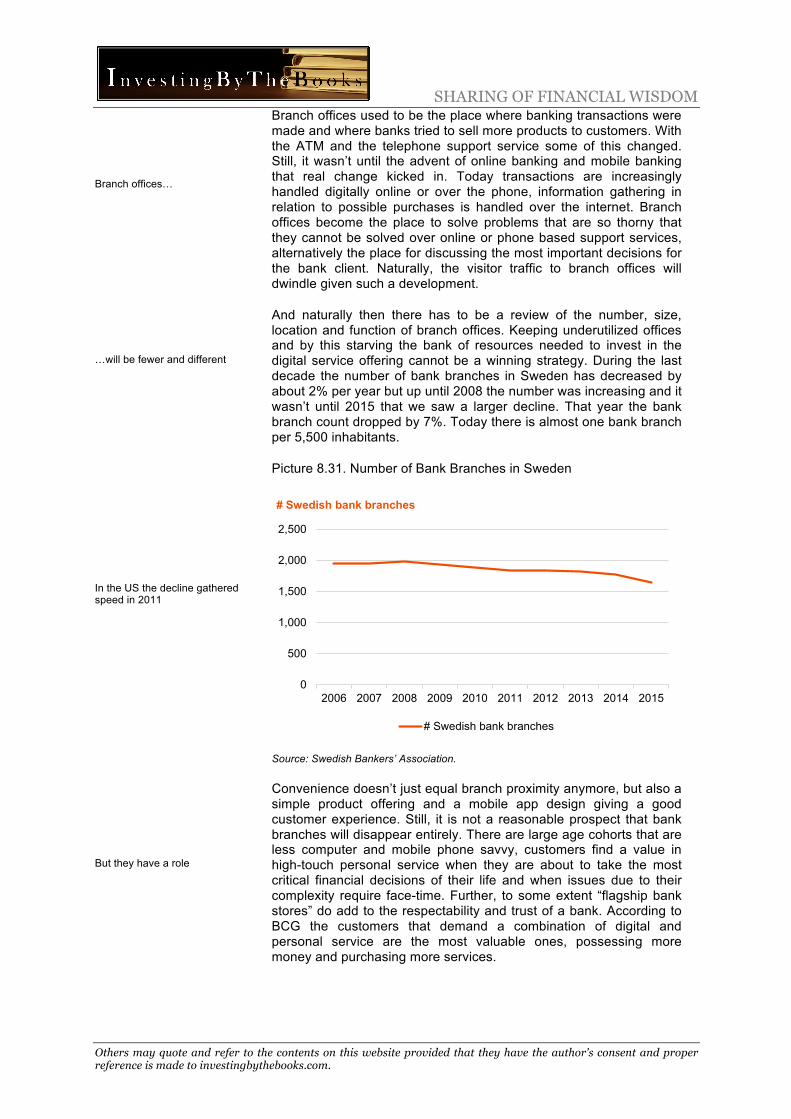
SHARING OF FINANCIAL WISDOM
Others may quote and refer to the contents on this website provided that they have the author's consent and proper reference is made to investingbythebooks.com.
Branch offices…
…will be fewer and different
In the US the decline gathered speed in 2011
But they have a role
Branch offices used to be the place where banking transactions were made and where banks tried to sell more products to customers. With the ATM and the telephone support service some of this changed. Still, it wasn’t until the advent of online banking and mobile banking that real change kicked in. Today transactions are increasingly handled digitally online or over the phone, information gathering in relation to possible purchases is handled over the internet. Branch offices become the place to solve problems that are so thorny that they cannot be solved over online or phone based support services, alternatively the place for discussing the most important decisions for the bank client. Naturally, the visitor traffic to branch offices will dwindle given such a development.
And naturally then there has to be a review of the number, size, location and function of branch offices. Keeping underutilized offices and by this starving the bank of resources needed to invest in the digital service offering cannot be a winning strategy. During the last decade the number of bank branches in Sweden has decreased by about 2% per year but up until 2008 the number was increasing and it wasn’t until 2015 that we saw a larger decline. That year the bank branch count dropped by 7%. Today there is almost one bank branch per 5,500 inhabitants.
Picture 8.31. Number of Bank Branches in Sweden
Source: Swedish Bankers’ Association.
Convenience doesn’t just equal branch proximity anymore, but also a simple product offering and a mobile app design giving a good customer experience. Still, it is not a reasonable prospect that bank branches will disappear entirely. There are large age cohorts that are less computer and mobile phone savvy, customers find a value in high-touch personal service when they are about to take the most critical financial decisions of their life and when issues due to their complexity require face-time. Further, to some extent “flagship bank stores” do add to the respectability and trust of a bank. According to BCG the customers that demand a combination of digital and personal service are the most valuable ones, possessing more money and purchasing more services.
0
500
1,000
1,500
2,000
2,500
2006 2007 2008 2009 2010 2011 2012 2013 2014 2015
# Swedish bank branches
# Swedish bank branches
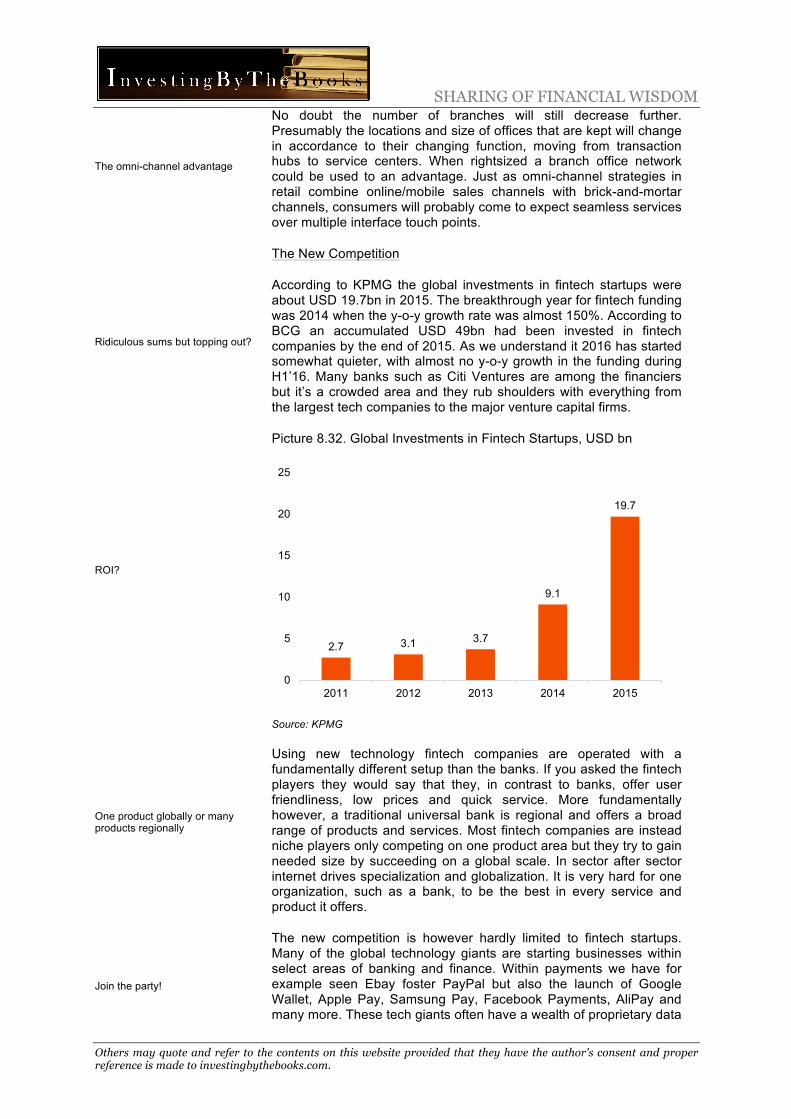
SHARING OF FINANCIAL WISDOM
Others may quote and refer to the contents on this website provided that they have the author's consent and proper reference is made to investingbythebooks.com.
The omni-channel advantage
Ridiculous sums but topping out?
ROI?
One product globally or many products regionally
Join the party!
No doubt the number of branches will still decrease further. Presumably the locations and size of offices that are kept will change in accordance to their changing function, moving from transaction hubs to service centers. When rightsized a branch office network could be used to an advantage. Just as omni-channel strategies in retail combine online/mobile sales channels with brick-and-mortar channels, consumers will probably come to expect seamless services over multiple interface touch points.
The New Competition
According to KPMG the global investments in fintech startups were about USD 19.7bn in 2015. The breakthrough year for fintech funding was 2014 when the y-o-y growth rate was almost 150%. According to BCG an accumulated USD 49bn had been invested in fintech companies by the end of 2015. As we understand it 2016 has started somewhat quieter, with almost no y-o-y growth in the funding during H1’16. Many banks such as Citi Ventures are among the financiers but it’s a crowded area and they rub shoulders with everything from the largest tech companies to the major venture capital firms.
Picture 8.32. Global Investments in Fintech Startups, USD bn
Source: KPMG
Using new technology fintech companies are operated with a fundamentally different setup than the banks. If you asked the fintech players they would say that they, in contrast to banks, offer user friendliness, low prices and quick service. More fundamentally however, a traditional universal bank is regional and offers a broad range of products and services. Most fintech companies are instead niche players only competing on one product area but they try to gain needed size by succeeding on a global scale. In sector after sector internet drives specialization and globalization. It is very hard for one organization, such as a bank, to be the best in every service and product it offers.
The new competition is however hardly limited to fintech startups. Many of the global technology giants are starting businesses within select areas of banking and finance. Within payments we have for example seen Ebay foster PayPal but also the launch of Google Wallet, Apple Pay, Samsung Pay, Facebook Payments, AliPay and many more. These tech giants often have a wealth of proprietary data
2.7 3.1 3.7
9.1
19.7
0
5
10
15
20
25
2011 2012 2013 2014 2015
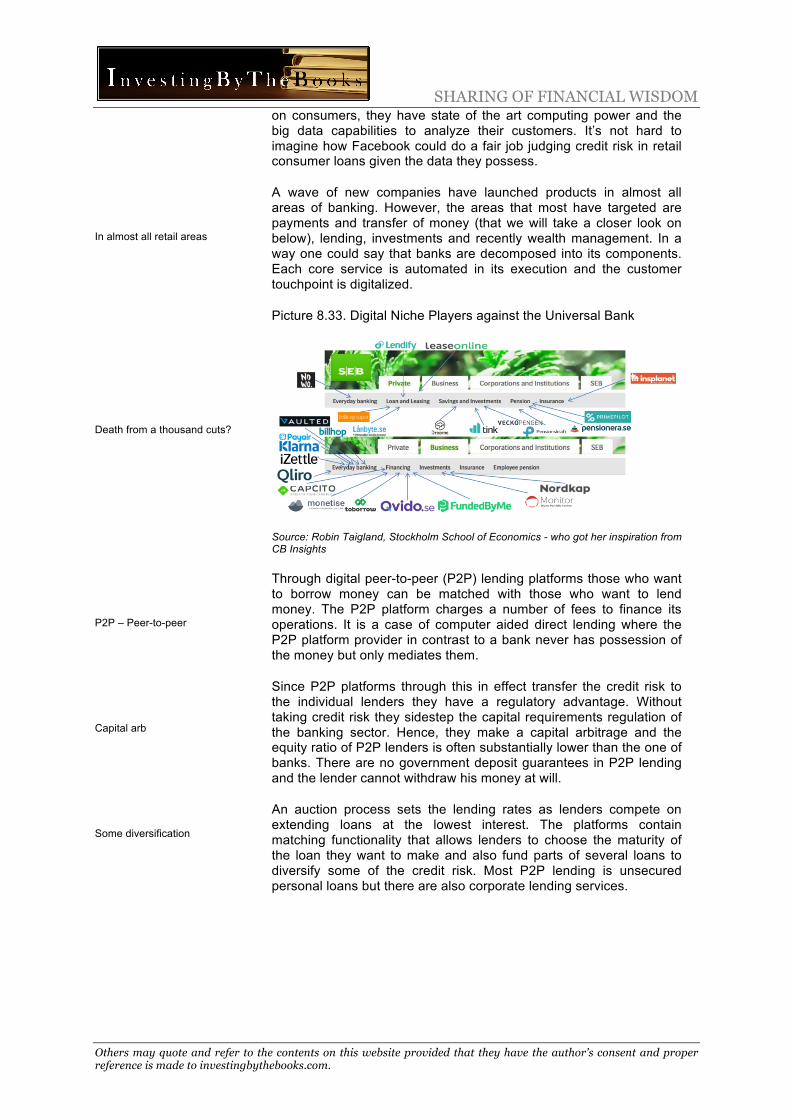
SHARING OF FINANCIAL WISDOM
Others may quote and refer to the contents on this website provided that they have the author's consent and proper reference is made to investingbythebooks.com.
In almost all retail areas
Death from a thousand cuts?
P2P – Peer-to-peer
Capital arb
Some diversification
on consumers, they have state of the art computing power and the big data capabilities to analyze their customers. It’s not hard to imagine how Facebook could do a fair job judging credit risk in retail consumer loans given the data they possess.
A wave of new companies have launched products in almost all areas of banking. However, the areas that most have targeted are payments and transfer of money (that we will take a closer look on below), lending, investments and recently wealth management. In a way one could say that banks are decomposed into its components. Each core service is automated in its execution and the customer touchpoint is digitalized.
Picture 8.33. Digital Niche Players against the Universal Bank
Source: Robin Taigland, Stockholm School of Economics - who got her inspiration from CB Insights
Through digital peer-to-peer (P2P) lending platforms those who want to borrow money can be matched with those who want to lend money. The P2P platform charges a number of fees to finance its operations. It is a case of computer aided direct lending where the P2P platform provider in contrast to a bank never has possession of the money but only mediates them.
Since P2P platforms through this in effect transfer the credit risk to the individual lenders they have a regulatory advantage. Without taking credit risk they sidestep the capital requirements regulation of the banking sector. Hence, they make a capital arbitrage and the equity ratio of P2P lenders is often substantially lower than the one of banks. There are no government deposit guarantees in P2P lending and the lender cannot withdraw his money at will.
An auction process sets the lending rates as lenders compete on extending loans at the lowest interest. The platforms contain matching functionality that allows lenders to choose the maturity of the loan they want to make and also fund parts of several loans to diversify some of the credit risk. Most P2P lending is unsecured personal loans but there are also corporate lending services.
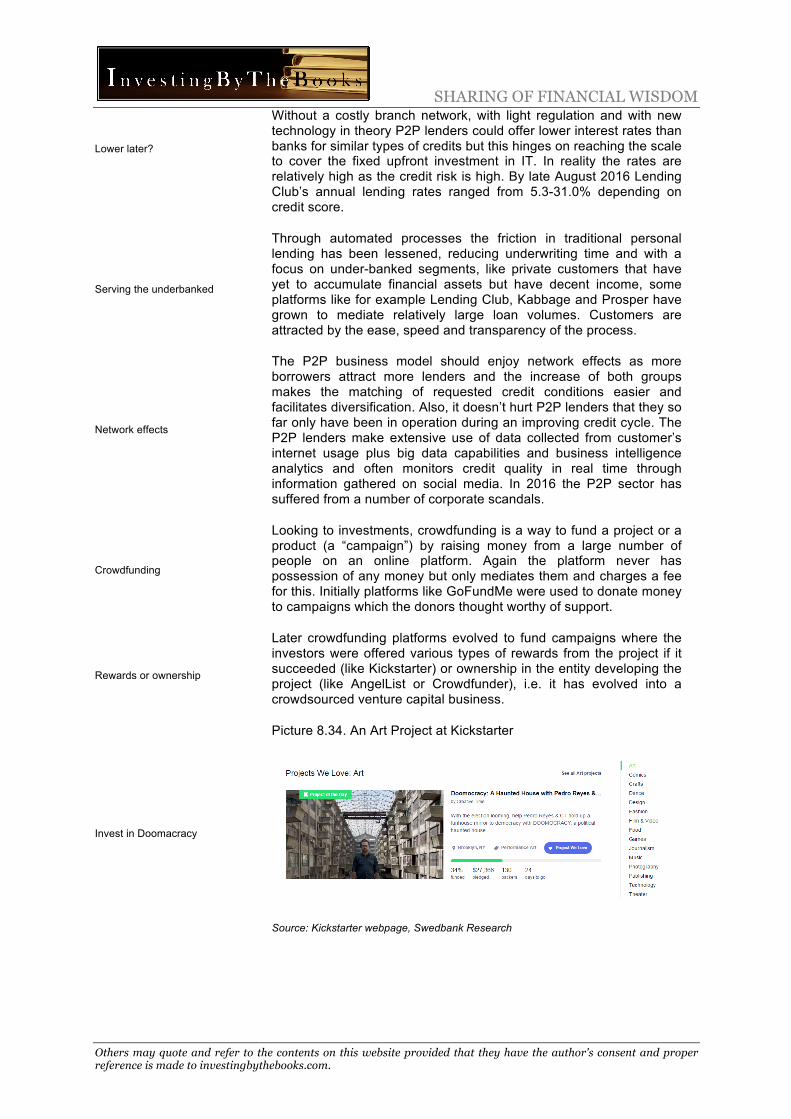
SHARING OF FINANCIAL WISDOM
Others may quote and refer to the contents on this website provided that they have the author's consent and proper reference is made to investingbythebooks.com.
Lower later?
Serving the underbanked
Network effects
Crowdfunding
Rewards or ownership
Invest in Doomacracy
Without a costly branch network, with light regulation and with new technology in theory P2P lenders could offer lower interest rates than banks for similar types of credits but this hinges on reaching the scale to cover the fixed upfront investment in IT. In reality the rates are relatively high as the credit risk is high. By late August 2016 Lending Club’s annual lending rates ranged from 5.3-31.0% depending on credit score.
Through automated processes the friction in traditional personal lending has been lessened, reducing underwriting time and with a focus on under-banked segments, like private customers that have yet to accumulate financial assets but have decent income, some platforms like for example Lending Club, Kabbage and Prosper have grown to mediate relatively large loan volumes. Customers are attracted by the ease, speed and transparency of the process.
The P2P business model should enjoy network effects as more borrowers attract more lenders and the increase of both groups makes the matching of requested credit conditions easier and facilitates diversification. Also, it doesn’t hurt P2P lenders that they so far only have been in operation during an improving credit cycle. The P2P lenders make extensive use of data collected from customer’s internet usage plus big data capabilities and business intelligence analytics and often monitors credit quality in real time through information gathered on social media. In 2016 the P2P sector has suffered from a number of corporate scandals.
Looking to investments, crowdfunding is a way to fund a project or a product (a “campaign”) by raising money from a large number of people on an online platform. Again the platform never has possession of any money but only mediates them and charges a fee for this. Initially platforms like GoFundMe were used to donate money to campaigns which the donors thought worthy of support.
Later crowdfunding platforms evolved to fund campaigns where the investors were offered various types of rewards from the project if it succeeded (like Kickstarter) or ownership in the entity developing the project (like AngelList or Crowdfunder), i.e. it has evolved into a crowdsourced venture capital business.
Picture 8.34. An Art Project at Kickstarter
Source: Kickstarter webpage, Swedbank Research

SHARING OF FINANCIAL WISDOM
Others may quote and refer to the contents on this website provided that they have the author's consent and proper reference is made to investingbythebooks.com.
Multi-sided business models
Monetary and altruistic
Anti-authorial millennials
Robo-advisors
Low hurdles, user friendly, always open and cheap
Similar to P2P lending, or any business that lives by bringing two independent groups of customers together, crowdfunding has a so-called multi-sided business model and naturally this hookup of diverse customer group has become significantly easier in the hyper-connected world of the internet. Again, there should be network effects in the model since more campaigns brings more interesting investment options, driving more investors and more investors with capability to fund projects drives more campaigns.
Crowdfunding is to some extent a social activity where campaigns to fund projects go viral within groups on social networks. Millennials are often attracted by the concept of being involved in a creative process in a project that resonates with their set of values. By this they can fund small corporations or interesting ventures. There is clearly a mixture of monetary and altruistic motives among crowdfunding investors. Campaigns on Kickstarter are dominated by video production, games, design, music production and media publishing. Funding these projects becomes a way to connect with the people behind the campaign. Investing in stocks in general isn’t equally interesting, as this would be funding big incumbent corporations.
Moving on to wealth management. Millennials, with an anti-authorial and cynical bent, have grown up during a time that included the technology crash of 2000/02 and the financial crisis of 2008/09 and are because of this less likely to listen to the financial expert advice of wealth management. Also, although they in some cases might be high earners, they haven’t accumulated the wealth to attract the attention of banks yet. They feel more at home with simple, transparent and standardized wealth management products delivered over their smartphone and don’t necessarily desire a relationship with a middle-aged, bank employed wealth manager situated in his downtown office financed by perceived complex pricing and hidden fees. Rather, they want to have control over their own decisions.
Robot advisor firms (or robo-advisors) like Betterment and Wealthfront have started to fill this niche customer need. The main features of this financial advisory service are that they offer an automated tool that is used directly by the consumer without any human intervention by the advisor, an algorithm uses information provided by the consumer to give an advisory output and some firms also execute the transactions, including automated rebalancings. The financial advice tools are generally built in the form of a decision tree where the customer responds to a sequence of questions regarding investment goals, time horizon, risk comfort level etc. and this gives the basis for the advice given. Investments within the various asset classes are through index portfolios.
Customers see benefits in the low fees, low minimum investment requirements and the user friendly digital interface and 24/7 functionality. With the online customer acquisition, the simple product and completely automated process, robo-advisors can offer much lower fee levels (0.15-0.35% on managed assets) and by this they can also cater to a wider customer group than most wealth managers. Also, through the computerized and standardized services the data trail is very orderly, simplifying functions like compliance and auditing.
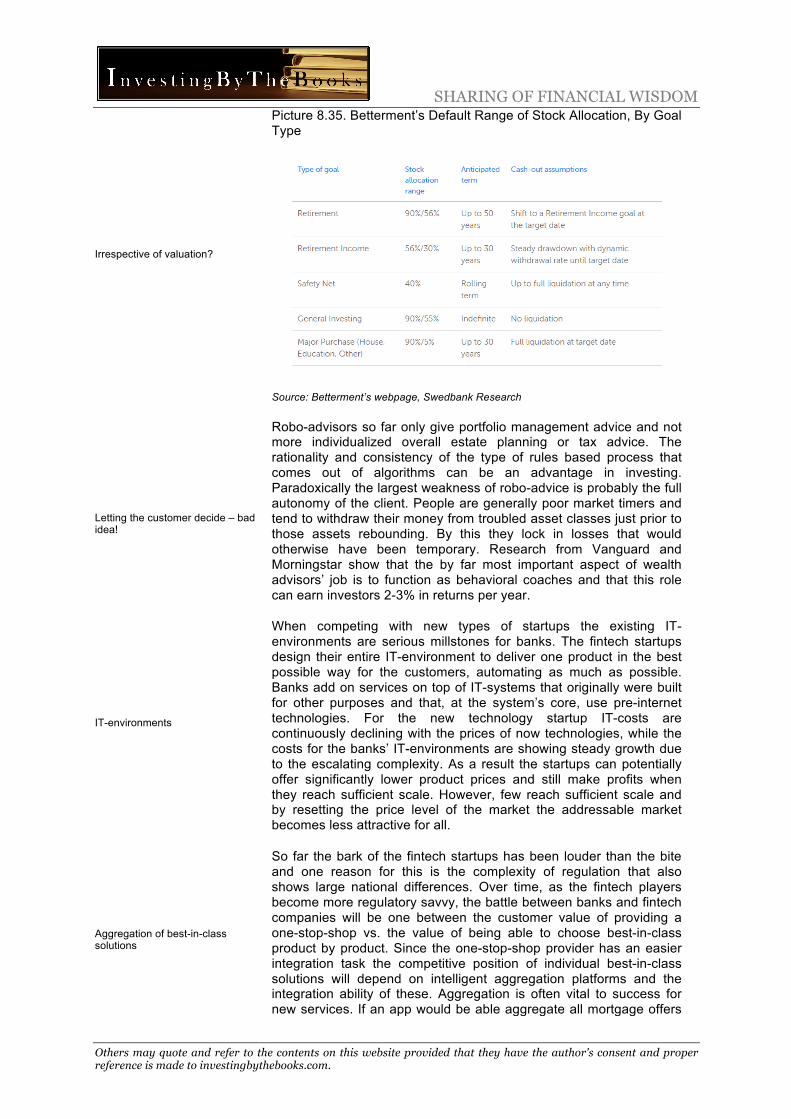
SHARING OF FINANCIAL WISDOM
Others may quote and refer to the contents on this website provided that they have the author's consent and proper reference is made to investingbythebooks.com.
Irrespective of valuation?
Letting the customer decide – bad idea!
IT-environments
Aggregation of best-in-class solutions
Picture 8.35. Betterment’s Default Range of Stock Allocation, By Goal Type
Source: Betterment’s webpage, Swedbank Research
Robo-advisors so far only give portfolio management advice and not more individualized overall estate planning or tax advice. The rationality and consistency of the type of rules based process that comes out of algorithms can be an advantage in investing. Paradoxically the largest weakness of robo-advice is probably the full autonomy of the client. People are generally poor market timers and tend to withdraw their money from troubled asset classes just prior to those assets rebounding. By this they lock in losses that would otherwise have been temporary. Research from Vanguard and Morningstar show that the by far most important aspect of wealth advisors’ job is to function as behavioral coaches and that this role can earn investors 2-3% in returns per year.
When competing with new types of startups the existing IT-environments are serious millstones for banks. The fintech startups design their entire IT-environment to deliver one product in the best possible way for the customers, automating as much as possible. Banks add on services on top of IT-systems that originally were built for other purposes and that, at the system’s core, use pre-internet technologies. For the new technology startup IT-costs are continuously declining with the prices of now technologies, while the costs for the banks’ IT-environments are showing steady growth due to the escalating complexity. As a result the startups can potentially offer significantly lower product prices and still make profits when they reach sufficient scale. However, few reach sufficient scale and by resetting the price level of the market the addressable market becomes less attractive for all.
So far the bark of the fintech startups has been louder than the bite and one reason for this is the complexity of regulation that also shows large national differences. Over time, as the fintech players become more regulatory savvy, the battle between banks and fintech companies will be one between the customer value of providing a one-stop-shop vs. the value of being able to choose best-in-class product by product. Since the one-stop-shop provider has an easier integration task the competitive position of individual best-in-class solutions will depend on intelligent aggregation platforms and the integration ability of these. Aggregation is often vital to success for new services. If an app would be able aggregate all mortgage offers
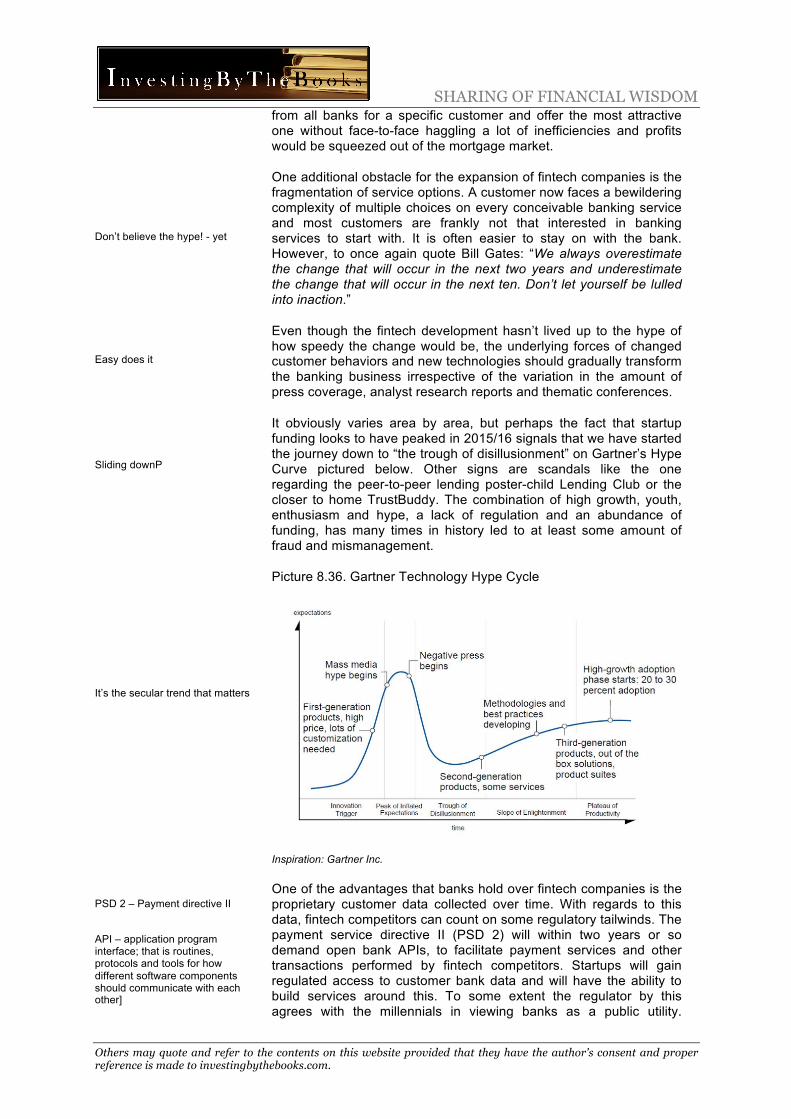
SHARING OF FINANCIAL WISDOM
Others may quote and refer to the contents on this website provided that they have the author's consent and proper reference is made to investingbythebooks.com.
Don’t believe the hype! - yet
Easy does it
Sliding downP
It’s the secular trend that matters
PSD 2 – Payment directive II
API – application program interface; that is routines, protocols and tools for how different software components should communicate with each other]
from all banks for a specific customer and offer the most attractive one without face-to-face haggling a lot of inefficiencies and profits would be squeezed out of the mortgage market.
One additional obstacle for the expansion of fintech companies is the fragmentation of service options. A customer now faces a bewildering complexity of multiple choices on every conceivable banking service and most customers are frankly not that interested in banking services to start with. It is often easier to stay on with the bank. However, to once again quote Bill Gates: “We always overestimate the change that will occur in the next two years and underestimate the change that will occur in the next ten. Don’t let yourself be lulled into inaction.”
Even though the fintech development hasn’t lived up to the hype of how speedy the change would be, the underlying forces of changed customer behaviors and new technologies should gradually transform the banking business irrespective of the variation in the amount of press coverage, analyst research reports and thematic conferences.
It obviously varies area by area, but perhaps the fact that startup funding looks to have peaked in 2015/16 signals that we have started the journey down to “the trough of disillusionment” on Gartner’s Hype Curve pictured below. Other signs are scandals like the one regarding the peer-to-peer lending poster-child Lending Club or the closer to home TrustBuddy. The combination of high growth, youth, enthusiasm and hype, a lack of regulation and an abundance of funding, has many times in history led to at least some amount of fraud and mismanagement.
Picture 8.36. Gartner Technology Hype Cycle
Inspiration: Gartner Inc.
One of the advantages that banks hold over fintech companies is the proprietary customer data collected over time. With regards to this data, fintech competitors can count on some regulatory tailwinds. The payment service directive II (PSD 2) will within two years or so demand open bank APIs, to facilitate payment services and other transactions performed by fintech competitors. Startups will gain regulated access to customer bank data and will have the ability to build services around this. To some extent the regulator by this agrees with the millennials in viewing banks as a public utility.
SHARING OF FINANCIAL WISDOM
Others may quote and refer to the contents on this website provided that they have the author's consent and proper reference is made to investingbythebooks.com.
Over-the-top-banking
Paying for infrastructure
A regulatory headache
Service the customer
Imagine the outrage if regulators instead would demand that Facebook, Google or Apple must open up their proprietary customer data for competitors to use.
In theory, PSD 2 could create a situation similar to that of telecoms operators and so-called over-the-top players. The telecom operators provide the underlying utility of the internet and over-the-top companies like Netflix provide services on top of the infrastructure that someone else maintains. To some extent a bank is just a data vault and with PSD 2 the vault is opened for everyone as long as the customer agrees to this. Tink is already live with a service utilizing data from the banks’ systems.
But perhaps the parallel of banks as telecom operators is a bit skewed? Telecom operators charge their customers for connectivity, i.e. for keeping the network infrastructure. Banks charge fees for transactions and services, not for maintaining infrastructure. Thus, if over-the-top fintech companies use bank infrastructure banks must develop new wholesale customer offerings. Presumably these offers must then be regulated or else banks could simply offer wholesale prices that made competition impossible. By this the state would further come to steer the operations of banks.
Talking about the state - the potential fragmentation of financial services clearly makes it harder to control and mitigate financial systemic risks and ensure consumer protection. The regulatory bodies will face a cumbersome task, as they will have to adjust the regulation to better cater to a new financial environment. It is very clear that the regulation of fintech’s will increase as their role in the financial system increases. New firms offering loans tend to be riskier as they often expand by taking on a larger portion of riskier loans that the established players reject. Growing regulatory burden will predictably meet teeth grinding among fintech companies and gloat among banks. In the long run however, superior technology enabling an improved customer offering will prevail.
The Way Forward
In banking the technology and consumer trends will probably mean a reboot of how the business is performed. It will be a slow reboot and it will not be without pain but it will, as we see it, be compulsory. Bank customers don’t care about branch networks, TED-spreads or capital adequacy rules; they want convenient access to simple and safe solutions to their financial needs.
Digital services often better satisfy these needs, meaning investing in technology and digitizing the service offering isn’t really optional for banks. The timing of making the reboot might still be somewhat optional but as new competitors over time cut in and disturb the bank’s existing customer relationships this optionality melts away as well.
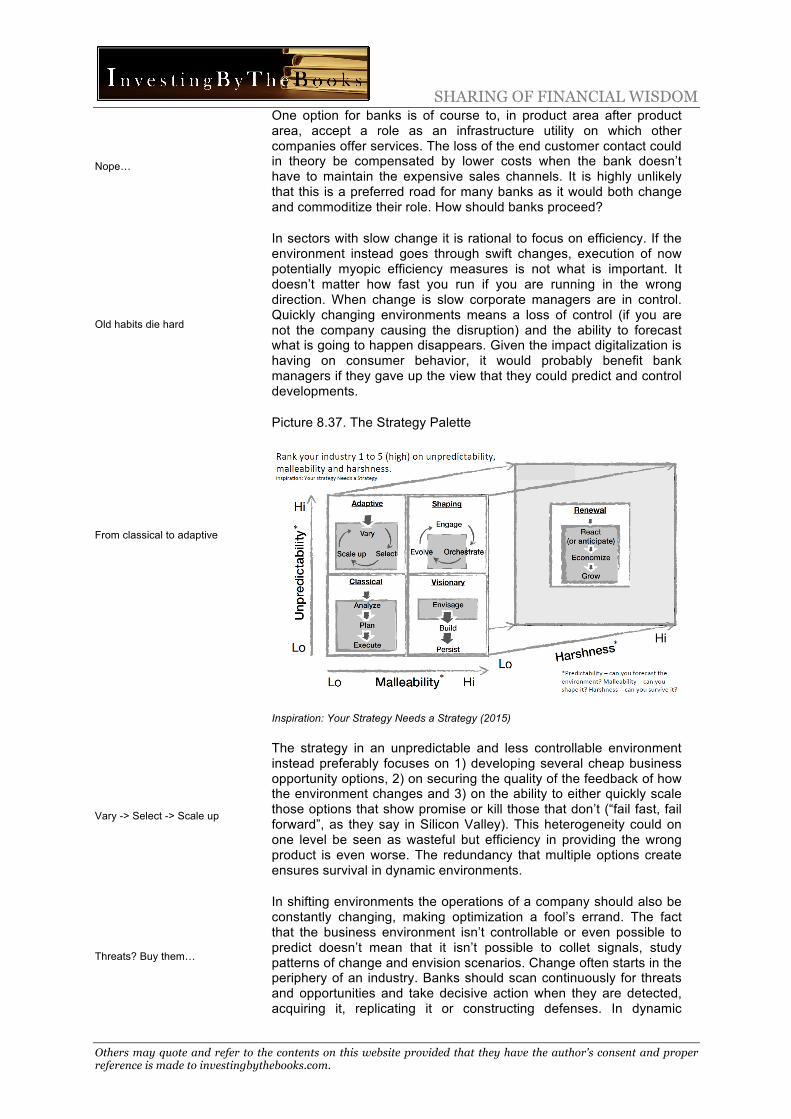
SHARING OF FINANCIAL WISDOM
Others may quote and refer to the contents on this website provided that they have the author's consent and proper reference is made to investingbythebooks.com.
Nope…
Old habits die hard
From classical to adaptive
Vary -> Select -> Scale up
Threats? Buy them…
One option for banks is of course to, in product area after product area, accept a role as an infrastructure utility on which other companies offer services. The loss of the end customer contact could in theory be compensated by lower costs when the bank doesn’t have to maintain the expensive sales channels. It is highly unlikely that this is a preferred road for many banks as it would both change and commoditize their role. How should banks proceed?
In sectors with slow change it is rational to focus on efficiency. If the environment instead goes through swift changes, execution of now potentially myopic efficiency measures is not what is important. It doesn’t matter how fast you run if you are running in the wrong direction. When change is slow corporate managers are in control. Quickly changing environments means a loss of control (if you are not the company causing the disruption) and the ability to forecast what is going to happen disappears. Given the impact digitalization is having on consumer behavior, it would probably benefit bank managers if they gave up the view that they could predict and control developments.
Picture 8.37. The Strategy Palette
Inspiration: Your Strategy Needs a Strategy (2015)
The strategy in an unpredictable and less controllable environment instead preferably focuses on 1) developing several cheap business opportunity options, 2) on securing the quality of the feedback of how the environment changes and 3) on the ability to either quickly scale those options that show promise or kill those that don’t (“fail fast, fail forward”, as they say in Silicon Valley). This heterogeneity could on one level be seen as wasteful but efficiency in providing the wrong product is even worse. The redundancy that multiple options create ensures survival in dynamic environments.
In shifting environments the operations of a company should also be constantly changing, making optimization a fool’s errand. The fact that the business environment isn’t controllable or even possible to predict doesn’t mean that it isn’t possible to collet signals, study patterns of change and envision scenarios. Change often starts in the periphery of an industry. Banks should scan continuously for threats and opportunities and take decisive action when they are detected, acquiring it, replicating it or constructing defenses. In dynamic

SHARING OF FINANCIAL WISDOM
Others may quote and refer to the contents on this website provided that they have the author's consent and proper reference is made to investingbythebooks.com.
…or join them…
…but don’t do nothing
Where to be and where not
Short-term pain for long-term gain
Rebuild brands
environments it is unlikely that the same company will develop the best solution within each and every product segment. Collaborations are then more often needed to stay relevant.
Those working in fintech companies have long viewed banks as a combination of the evil empire in Star Wars and dinosaurs on the verge of extinction. The “us vs. them”, “disruptors vs public utilities”-sentiment among many fintech startups are now perhaps starting to fade somewhat and there have been a large number of partnerships between banks and fintech companies the last few years. Both can benefit from their respective strengths’ but since banks are not always used to collaborations they have to develop their partnership ability.
With Fintech competition entering the picture more-of-the-same strategies will not suffice and the question is if the predominantly execution oriented leaders that have risen through the bank hierarchies are up to the task. We are no longer in a strategic vacuum with oligopolies living in static environments. Technology is changing customer behaviors; the value of bank branches and new technology is bringing in new competition but also great opportunities to advance ahead of less decisive banks.
The fact that the road travelled is less certain doesn’t mean that a bank couldn’t have a long-term view of where it wants to end up. Instead, a bank should set up ambitions where it wants to be long-term that go beyond feel-good corporate slogans. It should target a mix of businesses and geographies and a desired competitive position. A bank doesn’t have to play everywhere. Looking to the combination of future business attractiveness and the specific bank’s ability to compete, some areas could warrant a strategic review. It is resource intensive to try to be the best at everything. Some services should potentially be insourced from specialized fintech companies.
Strategy is to a large extent about making choices on where to be and in what fashion. The targeted ambition obviously has to be matched with hands on execution plans and a fitting investment budget. A long-term growth strategy generally means enduring some pain over the short-term and explaining to shareholders why it will take time to deliver results – done right, banks will probably be surprised over just how long-term shareholders can be. Banks need to take a 5-10 year planning horizon building a strategy to deliver customer value using the technological changes to their advantage, taking regulatory changes and competition into account.
Writings about strategy for a sector overall risk being full of buzzwords and clichés but empty of actionable details. Still, strategic choices are more important for banks today than for a very long time. The demand for banking services is clearly there and will grow, especially in emerging markets. However, it is very clear that banks somehow need to rebuild their brands so that they convey a more positive image, and especially so among younger consumers. We don’t see any quick fixes and banks patiently have to work to strengthen customer service and the consumer trust in the firm.

SHARING OF FINANCIAL WISDOM
Others may quote and refer to the contents on this website provided that they have the author's consent and proper reference is made to investingbythebooks.com.
What do they want
Tear down silos…
…no, not those ones
Simplify
Modernize
To offer great services it is obviously vital to know what the customers want. We’re not saying that banks don’t, but there are perhaps instances when what is sellable or cost efficient takes precedence over what best solves customers’ problems. In the long run this can turn out to be counterproductive. Banks should strengthen customer insights further with expanded usage of big data and business intelligence. The customer insights gained must be at the heart of the service offering.
Customers cannot care less about the bank’s organizational set up and they frankly shouldn’t have to. A bank should organize their service offering around customers, not distribution channels or product lines. Remember, the breadth of the service offering is one of the competitive advantages against the best-of-breed fintech companies. If this advantage is neglected and infrastructures continue to be siloed banks shoot themselves in the foot. Branch offices should focus on service, advice and troubleshooting within this eco-system of distribution channels, while transactions and sales initiatives perhaps are better suited for the digital channels.
Picture 8.38. Tearing Down Silos
Source: devops.com
In many banks the product offering is too scattered and not clearly organized. Depending on the bank, rightsizing product portfolios should improve the customer experience, cut costs due to less complexity and make the integration of the products into the IT-systems easier. When looking at the product offering from an overall perspective it might be wise to dare to decommission products that depend on the oldest legacy IT-platforms. To organize the service offering around the customer and create the seamless omni-channel banking experience, pathways across the sales channels must be designed and this will be much easier with a simpler product offering.
The core technical hurdle to overcome in all this is obviously a modernization of the IT-environment in incumbent banks. IT-systems must go from being work tools for employees that focus on creating efficiencies and keeping costs low to radically simplify customer offerings, improve user friendliness of digital platforms and automate as much as possible of work processes (from front end to back end and including compliance issues). When in operation, automation could save huge amounts of costs.
SHARING OF FINANCIAL WISDOM
Others may quote and refer to the contents on this website provided that they have the author's consent and proper reference is made to investingbythebooks.com.
Data at the core
New core banking systems
Ready to serve
Modular and flexible
Profits down today but shareholder value up
Banking involves monetary services in various forms. With physical money almost gone, banking is about bits and bytes. Without IT banks would be nothing today. Many banks are organized in the same way as when transactions involving physical money at distributed branch offices were the main activity. The structure of a retail bank should start with the handling of data at the core and then facilitate the customer interaction on which ever touchpoint the customer chooses to use.
The bank is digital at the core and the same customer data, product and service offering must flow to all potential touchpoints. Of course it should be seamlessly integrated – the bank must be one. If data is locked into product silos this will be impossible. In the long run the only reasonable solution is to change the often ancient core banking systems. It will be hard, but it will be even harder to restructure the bank around the customer data if it’s locked into legacy systems in product silos.
Picture 8.39. Banking Software Companies
Source: letstalkpayment.com. Several of the companies offer core banking solutions, most also offer software-as-a-service solutions.
The thing is, in an ever-changing world the IT-environment must also be modular enough to be able to be easily and cheaply upgraded when the service offering changes. Also, to handle the information gathering and analysis of a broader set of customer data, databases capable of using unstructured data must be a priority. Relational databases have a hard time adjusting to the dynamic change that the future will probably bring.
A reboot of the IT-platform will lower profits and increase investments probably even over a mid-term horizon such as a few years, but the shareholder value will probably instead increase as this looks to the present value of discounted perpetual cash flows. A bank with a clear vision of what they want to accomplish and a credible execution plan and with this communicated in an honest way should find the approval of the stock market. The first reaction to an announcement might be negative but as milestones are reached the sentiment will change and share prices rebound.
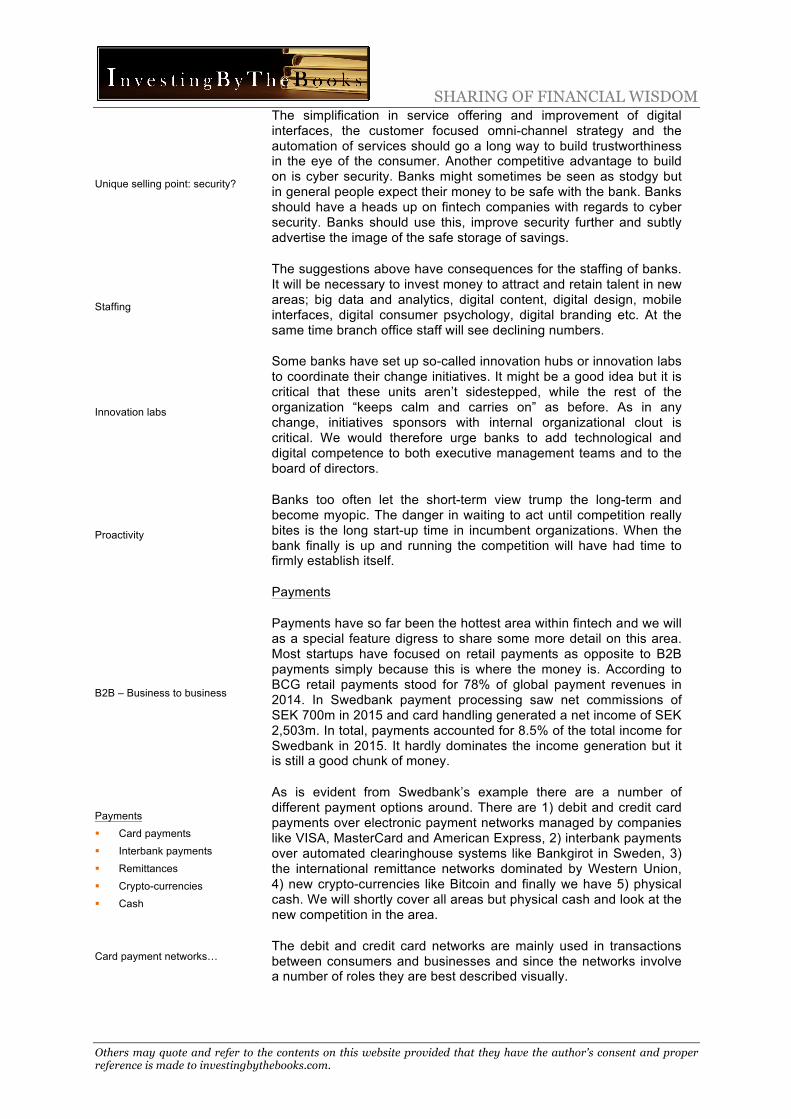
SHARING OF FINANCIAL WISDOM
Others may quote and refer to the contents on this website provided that they have the author's consent and proper reference is made to investingbythebooks.com.
Unique selling point: security?
Staffing
Innovation labs
Proactivity
B2B – Business to business
Payments
§ Card payments
§ Interbank payments
§ Remittances
§ Crypto-currencies
§ Cash
Card payment networks…
The simplification in service offering and improvement of digital interfaces, the customer focused omni-channel strategy and the automation of services should go a long way to build trustworthiness in the eye of the consumer. Another competitive advantage to build on is cyber security. Banks might sometimes be seen as stodgy but in general people expect their money to be safe with the bank. Banks should have a heads up on fintech companies with regards to cyber security. Banks should use this, improve security further and subtly advertise the image of the safe storage of savings.
The suggestions above have consequences for the staffing of banks. It will be necessary to invest money to attract and retain talent in new areas; big data and analytics, digital content, digital design, mobile interfaces, digital consumer psychology, digital branding etc. At the same time branch office staff will see declining numbers.
Some banks have set up so-called innovation hubs or innovation labs to coordinate their change initiatives. It might be a good idea but it is critical that these units aren’t sidestepped, while the rest of the organization “keeps calm and carries on” as before. As in any change, initiatives sponsors with internal organizational clout is critical. We would therefore urge banks to add technological and digital competence to both executive management teams and to the board of directors.
Banks too often let the short-term view trump the long-term and become myopic. The danger in waiting to act until competition really bites is the long start-up time in incumbent organizations. When the bank finally is up and running the competition will have had time to firmly establish itself.
Payments
Payments have so far been the hottest area within fintech and we will as a special feature digress to share some more detail on this area. Most startups have focused on retail payments as opposite to B2B payments simply because this is where the money is. According to BCG retail payments stood for 78% of global payment revenues in 2014. In Swedbank payment processing saw net commissions of SEK 700m in 2015 and card handling generated a net income of SEK 2,503m. In total, payments accounted for 8.5% of the total income for Swedbank in 2015. It hardly dominates the income generation but it is still a good chunk of money.
As is evident from Swedbank’s example there are a number of different payment options around. There are 1) debit and credit card payments over electronic payment networks managed by companies like VISA, MasterCard and American Express, 2) interbank payments over automated clearinghouse systems like Bankgirot in Sweden, 3) the international remittance networks dominated by Western Union, 4) new crypto-currencies like Bitcoin and finally we have 5) physical cash. We will shortly cover all areas but physical cash and look at the new competition in the area.
The debit and credit card networks are mainly used in transactions between consumers and businesses and since the networks involve a number of roles they are best described visually.
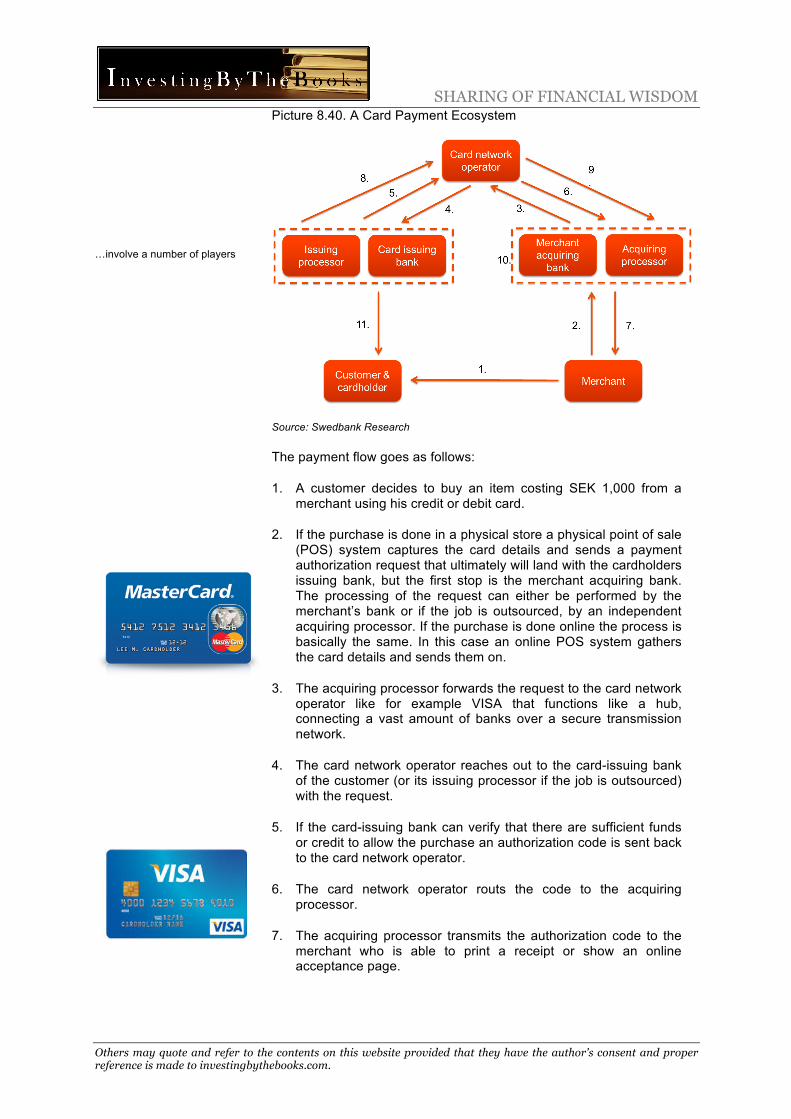
SHARING OF FINANCIAL WISDOM
Others may quote and refer to the contents on this website provided that they have the author's consent and proper reference is made to investingbythebooks.com.
…involve a number of players
Picture 8.40. A Card Payment Ecosystem
Source: Swedbank Research
The payment flow goes as follows:
1. A customer decides to buy an item costing SEK 1,000 from a merchant using his credit or debit card.
2. If the purchase is done in a physical store a physical point of sale (POS) system captures the card details and sends a payment authorization request that ultimately will land with the cardholders issuing bank, but the first stop is the merchant acquiring bank. The processing of the request can either be performed by the merchant’s bank or if the job is outsourced, by an independent acquiring processor. If the purchase is done online the process is basically the same. In this case an online POS system gathers the card details and sends them on.
3. The acquiring processor forwards the request to the card network operator like for example VISA that functions like a hub, connecting a vast amount of banks over a secure transmission network.
4. The card network operator reaches out to the card-issuing bank of the customer (or its issuing processor if the job is outsourced) with the request.
5. If the card-issuing bank can verify that there are sufficient funds or credit to allow the purchase an authorization code is sent back to the card network operator.
6. The card network operator routs the code to the acquiring processor.
7. The acquiring processor transmits the authorization code to the merchant who is able to print a receipt or show an online acceptance page.

SHARING OF FINANCIAL WISDOM
Others may quote and refer to the contents on this website provided that they have the author's consent and proper reference is made to investingbythebooks.com.
MSC – Merchant service charge
Why the bank gets the most
ACH – Automated clearinghouse
zzzlowly
8. The card-issuing bank deducts SEK 1,000 from the customer’s account (if it is a debit card), sends SEK 982 to the card network operator and keeps SEK 18 in accordance with the interchange fee structure. If the processing is outsourced to an independent issuing processor their processing fee will come out of the SEK 18.
9. The card network operator sends SEK 981 to the merchant acquiring bank and keeps SEK 1 as a network fee.
10. The merchant acquiring bank deposits SEK 980 on the merchant’s bank account and keeps SEK 1 in an acquiring fee. If the processing is outsourced to an independent acquiring processor their processing fee will come out of the SEK 1.
11. If the card is a credit card the card issuer who in this case doesn’t have to be a bank (say for example Eurocard) sends a bill for the SEK 1,000 to the customer to be paid from another bank account. This exposes the card issuer to credit risk if the customer should fail to settle his bill.
VISA, Mastercard and UnionPay in China only take the role as card network operators that manage an association of member banks. American Express takes on the role as both network operator and credit card issuer. The percentage fees in combination called merchant service charge (MSC) are merely illustrative.
The MSC will in reality contain a mix of fixed percentages on transactions that vary with volume discounts plus fixed payments. If the payment is cross border there is an additional fee. Merchants that often have low profit margins have always complained over the fees but the carrot of potential increased sales volumes (and the whip of potentially lower sales volumes) has given almost a universal acceptance in the western world.
The card payment system is complex but it is widespread, it works and consumers are protected from fraud losses. The reason for the high fee deducted by the card issuer is that they shoulder any losses from unlawful activities. The exception is if the merchant is the fraudulent party, as the merchant acquirer then has to take the loss. The interchange fees collected by banks have recently been subject to EU regulation, lowering the rates.
Interbank payments over national clearinghouse systems are quite similar to card networks in the respect that they engage a paying end-customer, a receiving end-customer, their respective two banks and a central network hub connecting the depositing banks. The hub is in this case a so-called automated clearinghouse (ACH) and these have been around for almost half a century. In Europe the European ACH Association counts 27 members including Bankgirot. In the US the ACH is simply named The ACH.
During a day an ACH accumulates all the initiated transactions and settles them in a batch process at the end of each day. The banks then only pay or receive their net amount cash flow the following day. The process eliminates unnecessary gross cash flows, it is cheaper than the card network with lower fees but the downside is that the payment will take between 1 to 2 days (or 3 in the US) depending on the time of the day it was initiated. Increasingly this is looking out of

SHARING OF FINANCIAL WISDOM
Others may quote and refer to the contents on this website provided that they have the author's consent and proper reference is made to investingbythebooks.com.
1-2 days is pretty good for this guy anyway
Money transmission and remittances
Batch payments
Fees 2-12%!
character in an always on, low latency digital world. If a national ACH has to send funds to a bank abroad it simply hooks up to the ACH in that country which forwards the money to a bank.
Picture 8.41. The Hyper-Connected World Needs Faster Payments
Source: zoho.com
The international money transmission market including Western Union and MoneyGram consists of non-bank networks transmitting funds internationally from migrant workers at their place of work to family and friends at home (so-called remittances) and between under-banked individuals who are in different geographies (not necessarily different countries). It’s a market where the payment volume has grown by about 5% per year the last decade and this trend is expected to continue.
The money transmission firm like Western Union doesn’t connect banks but independent franchise agents. The end-customers pay and receive money at the agent’s premises in their respective country. The transfer can also be initiated online when only the recipient lacks a bank account. Just as in the slow ACH process, transaction requests are collected during a day and only the net amounts are transferred to and from agents at the end of each day.
The agents at both ends deduct a fee from the transmitted sum. The central money transmission firm will also deduct fees plus earn money on the FX conversion. International money transmitters have been criticized for exploiting the lack of alternative for poorer under-banked consumers charging relatively high fees with averages of 5-6%. Various payments see a range of between 2% to 12% deducted. International remittances are much more expensive than domestic transfers and speedier transactions to international locations subject to the lowest competition see the highest prices. The high fees have opened up for competition with WalMart entering the market and the model is also under some pressure as a (slowly) growing proportion of the global population has a bank account.
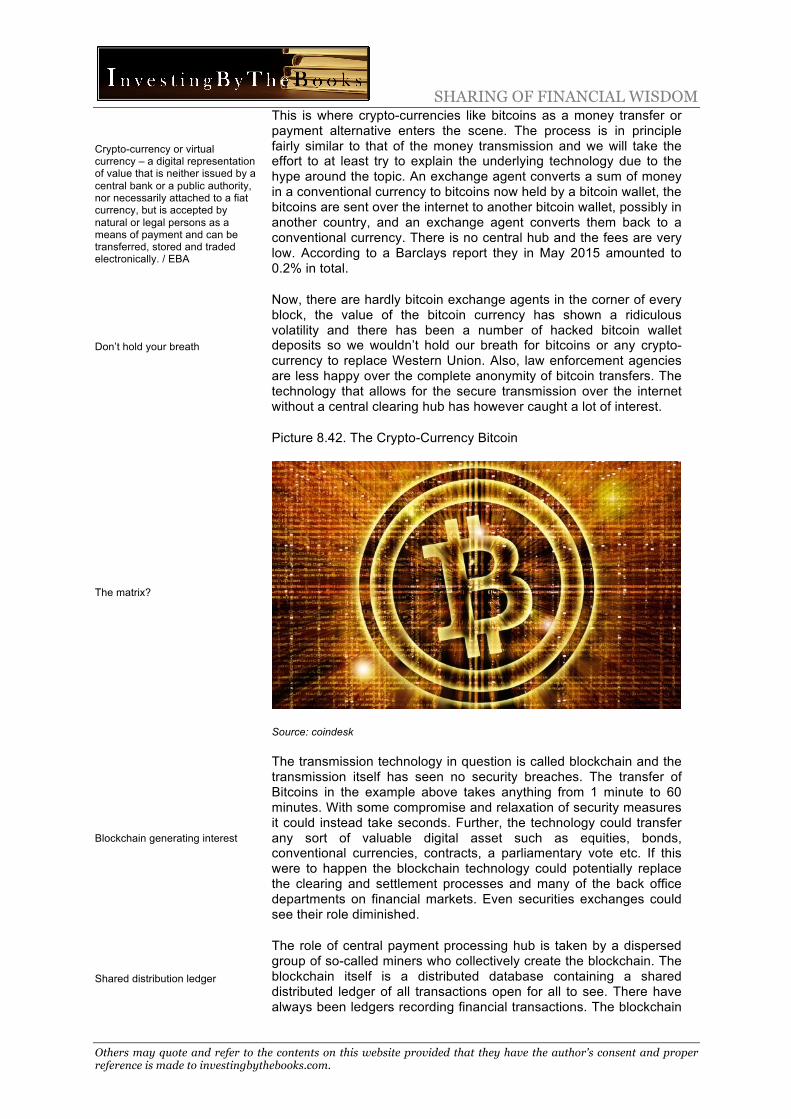
SHARING OF FINANCIAL WISDOM
Others may quote and refer to the contents on this website provided that they have the author's consent and proper reference is made to investingbythebooks.com.
Crypto-currency or virtual currency – a digital representation of value that is neither issued by a central bank or a public authority, nor necessarily attached to a fiat currency, but is accepted by natural or legal persons as a means of payment and can be transferred, stored and traded electronically. / EBA
Don’t hold your breath
The matrix?
Blockchain generating interest
Shared distribution ledger
This is where crypto-currencies like bitcoins as a money transfer or payment alternative enters the scene. The process is in principle fairly similar to that of the money transmission and we will take the effort to at least try to explain the underlying technology due to the hype around the topic. An exchange agent converts a sum of money in a conventional currency to bitcoins now held by a bitcoin wallet, the bitcoins are sent over the internet to another bitcoin wallet, possibly in another country, and an exchange agent converts them back to a conventional currency. There is no central hub and the fees are very low. According to a Barclays report they in May 2015 amounted to 0.2% in total.
Now, there are hardly bitcoin exchange agents in the corner of every block, the value of the bitcoin currency has shown a ridiculous volatility and there has been a number of hacked bitcoin wallet deposits so we wouldn’t hold our breath for bitcoins or any crypto-currency to replace Western Union. Also, law enforcement agencies are less happy over the complete anonymity of bitcoin transfers. The technology that allows for the secure transmission over the internet without a central clearing hub has however caught a lot of interest.
Picture 8.42. The Crypto-Currency Bitcoin
Source: coindesk
The transmission technology in question is called blockchain and the transmission itself has seen no security breaches. The transfer of Bitcoins in the example above takes anything from 1 minute to 60 minutes. With some compromise and relaxation of security measures it could instead take seconds. Further, the technology could transfer any sort of valuable digital asset such as equities, bonds, conventional currencies, contracts, a parliamentary vote etc. If this were to happen the blockchain technology could potentially replace the clearing and settlement processes and many of the back office departments on financial markets. Even securities exchanges could see their role diminished.
The role of central payment processing hub is taken by a dispersed group of so-called miners who collectively create the blockchain. The blockchain itself is a distributed database containing a shared distributed ledger of all transactions open for all to see. There have always been ledgers recording financial transactions. The blockchain

SHARING OF FINANCIAL WISDOM
Others may quote and refer to the contents on this website provided that they have the author's consent and proper reference is made to investingbythebooks.com.
No central hub
51% attack
Private blockchains
The more immediate challengers
NFC – Near field communication
is special because it creates a unique ledger that is used by everyone involved in the transaction. Normally each party keeps their own ledger and all these duplicated ledgers must be reconciled with each other paving the way for error and dispute. With a blockchain there are no duplications or reconciliations. Further, as it is distributed to many parties the ledger is intact even if one party would experience technical failures.
With high security created by cryptography using highly complex mathematics entries are near impossible to fake or change in retrospect - all ledger entries’ are kept forever. It makes the technology ideal for making transactions between parties that don’t know or necessarily trust each other. The creation of a ledger for bitcoins without a central trusted clearing hub is performed through a process called mining performed by external independent miners. Details of a transaction are split and released to the miners. These compete to encrypt the transaction and turn it into a block and if they succeed they earn bitcoins as a reward.
The competition is around finding a solution to a mathematical problem that completes the random numbers and letters of a resulting encryption. When a miner is first to succeed he receives a prof-of-work when all the other miners have accepted the solution in an automated synchronization process. If one party would try to alter the entry it would be corrected by the consensus of the other miners. After acceptance of the solution, the data forms a block that is added to the blockchain, i.e. the ledger of transactions.
The block chain is kept secure because the puzzle of the entire blockchain is too hard to solve for any one miner. No single party has the overview to make changes. A fake transaction cannot be entered without the consent of the parties involved. This opens up for the risk of collaboration. In smaller crypto-currencies like Terracoin and Coiledcoin there has been so called 51% attacks where mining pools have tried to dominate the mining and gain insight over the information in the ledger. This is a problem that will have to be solved going forward.
The source code of the blockchain technology is open and free to use. Many banks and financial institutions have started to investigate how the technology could be used for financial transactions in the future. Bitcoin is an open blockchain but there are no hindrances if a select group like a bank consortium would want to form their own private blockchain. Longer-term blockchain technology could be a real disruptor of the payment market and much more.
In the more immediate future there are however a host of companies trying to break in and steel market share from the incumbent companies in the payment market. How does for example the much-publicized Apple Pay work, what is Google Wallet and where does PayPal or Square fit in?
Fortunately, or regrettably depending on where you stand - the absolute majority of the fintech startups that have had some success compete within the card payment system. With very few exceptions they take on the role as a merchant acquirer within the existing system. Instead of a physical POS system or an online version, Apple Pay acts as an in-app payment card, collecting data via near field communication (NFC) technology and using the card network
SHARING OF FINANCIAL WISDOM
Others may quote and refer to the contents on this website provided that they have the author's consent and proper reference is made to investingbythebooks.com.
Mobile wallets
Value and information storage
Threat to card networks
PSD 2 – Payment Service Directive II
operator’s tokenization process to handle the security of the card information. Tokenization is the process of substituting a device-identification for the consumer’s credit card number. This means that the merchant never sees the credit card number which improves the security.
Square takes on the same position as a merchant acquirer or acquiring processor in the card payment network and with a cheaper hardware solution to handle the POS system rather expands the reach of the card payment network to include smaller payments. Square handles micropayment transactions via a dongle attached to a smartphone. This is parallel to what Swedish iZettle offers. We would say that services like Apple Pay, Samsung Pay and Square instead of disrupting the system, in its place strengthen the position of card network operators and leave the position of banks fairly unchanged (the acquiring fee over which the competition is heating up is small). These solutions instead compete with acquiring processors with better functionality, lower costs, better security and wider reach.
Mobile and digital wallets like Google Wallet, Alipay and PayPal also fit into the card payment network but not as a direct participant. A digital wallet allows the consumer to use his debit or credit card or the ACH system to load a wallet balance with money and then access the funds to make a payment for merchandise. The payment is authorized by the m-wallet platform. Just as you can load money on an oyster card to travel the London subway over the next month, money can be loaded on an all-purpose payment card and this “card” can be a piece of virtual software, i.e. a mobile wallet.
On top of being a temporary storage of money the wallet also (like a physical wallet) stores receipts, tickets and loyalty program details that are used when paying with the wallets balance. Hence, mobile wallets are not only value storages, but also information storages. Potentially this information could be of great value to merchants as they can use it to tailor personalized offers to consumers based on their profile. PayPal and Alipay have been very successful with online payments but their attempts to expand into the physical payment market have so far been less fruitful. Both VISA and Mastercard have launched their own mobile wallets called V.me and MasterPass to handle the competition.
The main beneficiary of both the card payment system and the ACH system are the banks. If mobile wallets would be a big hit and they to a larger extent would be funded by the ACH system, or if online payments to a larger extent would be done directly through solutions using the ACH systems, like Trustly in Sweden, this would hurt card network operators like VISA but also to some extent banks through the lower transaction fees. The immediate monetary effects would probably be quite small but the bank and the card payment operator would lose some of the consumer contact, potentially leading to a higher switching rate between banks.
PSD 2 gives fintech startups access to bank payment functionality and this means they could start to use the cheaper ACH process instead of card networks. The question is however if the transaction speed of the system is especially enticing for a fintech startup? Although merchants complain over the high fees in the card payment system, customers like the security of banks shouldering the risk for

SHARING OF FINANCIAL WISDOM
Others may quote and refer to the contents on this website provided that they have the author's consent and proper reference is made to investingbythebooks.com.
M-Pesa…
…an agency system
Swish
Operated by Bankgirot
Longer-term Blockchain could be the real disruptor
fraud. Since new products generally must be better than the old to displace them this is a function that an alternative payment network should include to be competitive.
A prerequisite for a viable payment service is a secure network connecting the sender and the recipient. Mobile operators should be able to develop solutions to this effect, bypassing banks. The person-to-person payment system M-Pesa (pesa means money in Swahili) operated by Vodafone and Safaricom has been a major success in Kenya and later in Tanzania and has spread further to a handful of countries where banking is underdeveloped. Through the often-dense network of mobile service provider kiosks a person can deposit money on an account on his mobile phone, via a PIN-secured SMS he then sends the money to another person’s mobile phone and the recipient can withdraw them from his nearby service provider kiosk.
M-Pesa is an agency-based system very similar to the ones operated by WesternUnion and MoneyGram. There are significantly more mobile service subscribers in the world than bank account holders, and especially so in emerging markets. In its current form M-Pesa is a cash based solution at the end points, allowing the under-banked to perform financial transactions. By temporarily keeping the money on the mobile phone account the customer has turned the mobile operator into a depositary institution.
In principle there is nothing that prevents a digitalization of such a mobile network based person-to-person payment service or connectivity to bank accounts. Swish is a joint venture by all major banks in Sweden. Bankgirot has developed a brand new technical platform for real-time clearing of micropayments for the purpose. Both the sender and the recipient must have downloaded an app, each phone should be connected to a bank account and the users must have a BankID as this provides the security.
The sender enters the mobile phone number of the receiver, enters an amount and authorizes the transaction with a transmitted PIN-code that is not stored on the phone. Via SMS the payment instructions goes to Bankgirot who forwards a payment request to the sender’s bank. If approved the bank makes the payment to the receiver’s bank via Bankgirot who guarantees and clears the sum. The money is instantly credited to the receiver’s bank account. A payment confirmation is then sent from Bankgirot to the receiver. The service only works between banks connected to the clearing system.
Originally the service was meant to be financed by a fixed fee but after consumer protests it is as of now still free of charge. With Swish the Swedish banks have both taken the initiative on micropayments and further decreased the incentives of the public to hold cash.
So far the level of security and high penetration of traditional payment methods plus the fragmentation of alternatives confusing both customers and merchants, have meant that fintech startups have not been able to seriously disrupt the payment market. However, the increased competition and regulatory changes have meant some pressure on fees to the benefit of consumers. Most successful, or even surviving, alternative payment solutions utilize the present bank affiliated systems and the banks’ role in providing funding and authorizing various transactions have stayed largely unchanged.

SHARING OF FINANCIAL WISDOM
Others may quote and refer to the contents on this website provided that they have the author's consent and proper reference is made to investingbythebooks.com.
Valuing equity or the firm
Popular
§ Justified P/B
§ Relative multiples
§ Sum-of-the-parts
Gordon growth model
Justified P/B called:
§ P/NAV
§ P/TNAV
§ Price-to-tangible book
Longer-term, Blockchain and distributed ledger technology is highly interesting as a totally independent network, clearing and bookkeeping mechanism that doesn’t rely on a central hub. This could be the real disruptor.
8.10 Bank Valuation The challenge when valuing bank stocks is the fact that the operations and financing isn’t separate but intrinsically linked. A bank has operations on both sides of the balance sheet and borrowed money is the “raw material” of the business. It then makes no sense to value the operations and subtract the liabilities to get to an equity value as in other companies. Instead of valuing the free cash flow to firm and then deducting net debt, a bank DCF directly values the cash flow to equity that includes both operational and financial cash flows.
Given the inherent difficulties of bank valuation investors and analysts usually seek to use less complex methods than a DCF and the most popular valuation method is 1) a fundamentally justified price-to-book method, but 2) a large number of relative valuation multiples are used as well and 3) sum-of-the-parts valuations are used to account for the fact that although banks are made up of pretty much the same building blocks they have different mixes – in one bank corporate lending might be larger part of the mix, in another investment banking fees might be the main part etc.
The fundamentally justified price-to-book method, that is a derivative of the Gordon growth model, estimates the value of a bank’s equity by looking to the return on equity (ROE) the bank can be expected to generate in relation to the estimated cost of using the same equity (COE) and also factors in the growth in earnings. Looking to the book value makes sense as banks as businesses are as much a balance sheet operation as an earnings operation. The calculation of the justified price-to-book is as follows:
Justified P/B = (ROE-g)/(COE-g)
Analysts alternatively call this method P/NAV (net asset value), P/TNAV (tangible net asset value) or Price-to-tangible book. Although simple, the method throws out an absolute value for a stock that is independent of how other bank stocks are priced by the equity market. Say that a bank can be expected to have 12% ROE, the required cost of using the equity is 9% and the earnings are expected to grow by 3% per year going forward. The equation (12%-3%)/(9%-3%) equals a justified price-to-book ratio of 1.5x. Multiply this multiple by the equity per share and that is how the stock market “should” price the share. Now, say that the shares instead trade at 1.3x price-to-book in the stock market, then the shares could be considered to have a 15% upside.

SHARING OF FINANCIAL WISDOM
Others may quote and refer to the contents on this website provided that they have the author's consent and proper reference is made to investingbythebooks.com.
Current or cyclically adjusted?
COE and g
Adjusting the capital
Can you trust those numbers?
Relative multiples
Depending on the analyst the ROE is either based on cyclically adjusted profits or current profits or something in-between. If using “good time profits” including strong business volumes and low credit losses the ROE will obviously be considerably higher than if through-the-cycle numbers are used. Using good time numbers or bad time numbers reflecting the current economy will be more useful for shorter term relative bank recommendations while using average profits that potentially also factor in future secular profitability expectations will give an estimate of the fundamental intrinsic value.
The COE uses current or potentially normalized interest rate levels but also reflects differences in risk between banks. A bank relying on unpredictable trading income should have a higher cost of capital than one that is more reliant on stable net interest income. For most banks the earnings growth will be relatively slow as banking in the Western World is a mature business.
So why is the denominator of the ratio called tangible net asset value or tangible book? Because adjustments are made to the equity number that is used in the ratio. Banks steer their operations in waters defined by regulations and the value of banks must take the regulatory constraints into account. Analysts because of this make a deduction from the justified price of the share if the bank is expected to have a capital shortfall in light of future capital requirements. The deduction (mark-up) generally equals the sum of the shortfall (excess capital). One could say that the method looks to the return on capital that the analyst thinks the bank should have. Through this adjustment the capital bases of various banks are also possible to compare.
Using price-to-book multiples as the main valuation method implies that the value of the (net) assets can be trusted. In reality it is close to impossible for an outsider to assess the quality of the assets in a bank. The credit quality implies assumptions that not always come true (or are truthful) and mark-to-market valuations of securities can quickly change beyond what at the moment appears probable. Lehman’s assets were rated triple-A and the bank was funding itself on a hyper-liquid market - a rock solid situation from the outside. The assets turned out to have junk bond status and the interbank and wholesale markets quickly turned bone dry for the bank.
Despite their complexity and different business mixes the services of banks are very similar and investors benchmark them against each other using relative valuation multiples like PE-ratios. The procedure is simply to calculate the average multiple for a peer group of banks and then assume that the market will arbitrage away the differences. If one bank has a PE-ratio of 13x and the average in the peer group is priced at 11.5x then the bank’s shares are thought to have an 11% downside. The PE-ratio is popular as it allows comparisons against the pricing non-bank-stocks.

SHARING OF FINANCIAL WISDOM
Others may quote and refer to the contents on this website provided that they have the author's consent and proper reference is made to investingbythebooks.com.
Nuances
Changing fashions
Dividend yield
Sum-of-the-parts
But will they split?
DCF – Discounted cash flow
These calculations don’t account for nuances around leverage, expected return levels, growth etc. and investors make up for this by discretionary and subjectively allowing the “better” bank to have slightly higher valuation multiple than the “less good” bank. For example a bank that is more conservative when categorizing bad loans will have lower earnings and consequently a higher PE-ratio but this should be well accepted and the investor shouldn’t draw the conclusion that the stock is overvalued. Although this injects subjectivity into the equation it also allows the investor or analyst to take less tangible factors into account.
The multiple in vogue among investors varies over the economic cycle. In – the generally lengthier - good times investors try to arbitrage differences between banks’ price-to-tangible-book, PE-ratios and price-to-book-ratios. When the going gets tough and earnings predictions become highly unreliable due to credit losses, investors search for the more stable investment alternatives and start looking at absolute values set by price-to-tangible book. Finally when the market has troughed, it’s important to look past the current troubles into the brighter future so P/PPP, that is price to pre-provision profits, becomes popular.
Dividend yield has historically also been an important ratio as banks have been high dividend yielding stocks. They need to distribute money to their shareholders to keep a leverage that allows for a targeted ROE. The dividend yield is a valuation measure but as it is expressed in percent investors often view it as a bond coupon, forgetting that when banks distribute xyz money to its shareholders the market capitalization of the bank’s shares generally declines by a similar amount – shareholders already own the money that is being distributed.
As the financially trained reader of The Companion certainly knows, a sum-of-the-parts valuation adds nothing fundamentally to the absolute and relative valuations methods above. The method simply breaks the bank up in its different parts with different business modes to apply the most appropriate valuation method to each one (or the one that produces the wanted result). For example asset management divisions are generally priced by taking the profit (measured as AuM x % fee, minus costs) divided by a discount rate minus a growth expectation.
The upside of sum-of-the-parts valuation is that the method is more granular and accounts for differences in business mix between banks. The downside is that it is a very theoretical exercise as it somehow implies that you could buy the different parts separately and that they would earn a similar return even if broken up from each other.
A discounted cash flow valuation is generally seen as the theoretically correct way to estimate a company’s absolute value. In a DCF of a traditional company the analyst separates the operation from the financing of the operation and values them independently. The operations is valued by discounting the future free cash flows to the firm (as financed by both debt and equity) by a cost of capital that factors in both the cost of equity and the cost of debt. From the value of the operations the market value of the net debt is deducted and the remainder is the value that belongs to the shareholder.

SHARING OF FINANCIAL WISDOM
Others may quote and refer to the contents on this website provided that they have the author's consent and proper reference is made to investingbythebooks.com.
An equity DCF
Money to the shareholders
Sustaining the leverage
Don’t forget the other comprehensive income
Triangulate
As noted above this cannot be done in banks as the financing is an integral part of the operations (deposits can often be one of the most profitable products even though this is not the case at the moment). Further, capex is negligible and which items that make up the working capital is unclear.
This doesn’t mean a DCF cannot be used – simply that it has to account for the character of banks. In an equity DCF, the estimate of the value of a company is the present value of its future cash flows to equity, discounted by the cost of equity. The discount factor here doesn’t differ from any other definition of the cost of equity but what is the CF to equity in a bank?
It’s simply the money available for shareholders. An equity DCF is in that respect a nuanced version of a dividend discount model. One way to calculate the CF to equity is to sum up all future cash that is expected to be paid to and received from shareholders, including dividends, share repurchases and share issuances. As in any DCF the model could be built using one forecast period and then an eternity value or it could use several forecast periods before arriving at the eternity value.
The other way to calculate the CF to equity in a bank is to deduct expected required retained earnings from the expected future net income and then adjust for expected future changes in other comprehensive income. A bank normally needs to retain some of its net income to increase its equity in line with the overall balance sheet and by this sustain a leverage that both caters to the risk in the bank and makes the regulator happy about those risks. These retained earnings aren’t available for shareholders without a regulatory crackdown so they should be deducted. If not, the analyst is effectively implying zero future growth of the business.
Further, not all equity CF feeds through the income statement in a bank as they use mark-to-market accounting more frequently than most firms. In the other comprehensive income statement a number of items hide, like unrealized results on securities, hedging results, adjustments to pension liabilities, currency transaction results etc. Expected future changes in these items will have to be taken into account. The discounted present value of the equity cash flow divided by the number of outstanding fully diluted shares will give an estimate of the value of the share.
As with any company, valuation is an inexact science, as we cannot foresee the future. A general advice is to use several valuation methods and try to triangulate a reasonable valuation range for a stock. Equally, the use of bull, base and bear case scenarios generates a potentially useful valuation range. Calculating a value range doesn’t strike some observers as equally distinct and knowledgeable as pinpointing one exact target price but it certainly is more realistic.
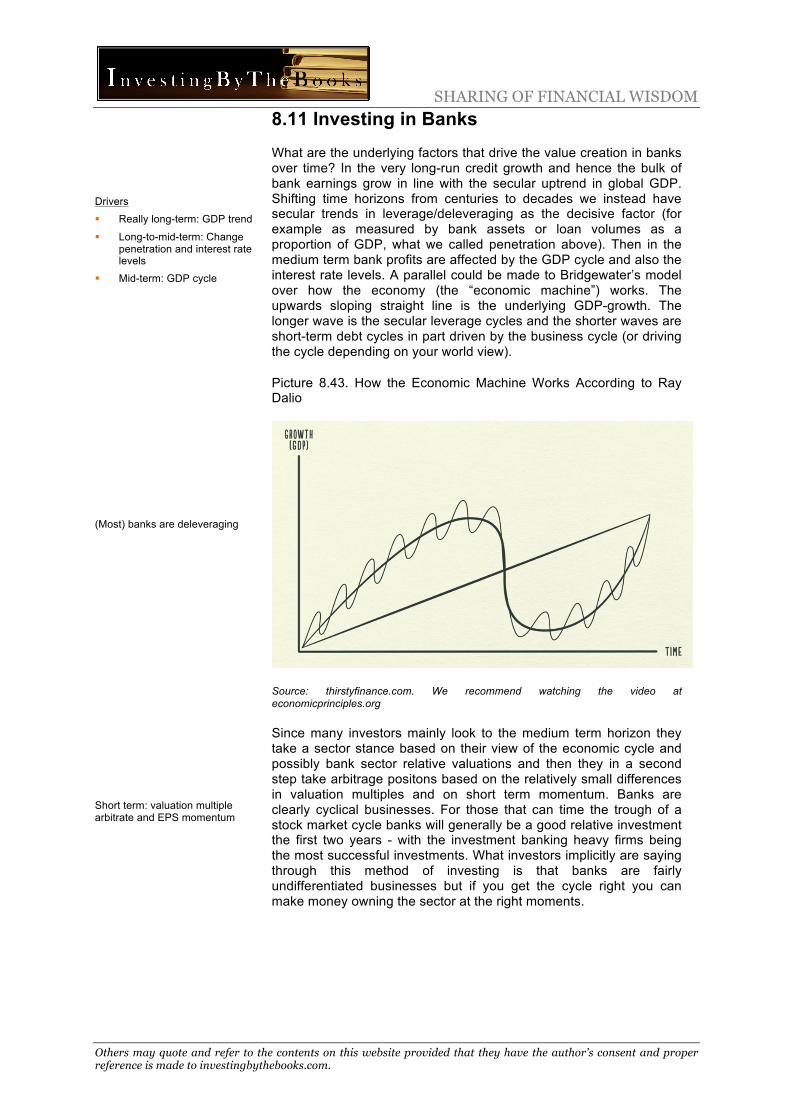
SHARING OF FINANCIAL WISDOM
Others may quote and refer to the contents on this website provided that they have the author's consent and proper reference is made to investingbythebooks.com.
Drivers
§ Really long-term: GDP trend
§ Long-to-mid-term: Change penetration and interest rate levels
§ Mid-term: GDP cycle
(Most) banks are deleveraging
Short term: valuation multiple arbitrate and EPS momentum
8.11 Investing in Banks What are the underlying factors that drive the value creation in banks over time? In the very long-run credit growth and hence the bulk of bank earnings grow in line with the secular uptrend in global GDP. Shifting time horizons from centuries to decades we instead have secular trends in leverage/deleveraging as the decisive factor (for example as measured by bank assets or loan volumes as a proportion of GDP, what we called penetration above). Then in the medium term bank profits are affected by the GDP cycle and also the interest rate levels. A parallel could be made to Bridgewater’s model over how the economy (the “economic machine”) works. The upwards sloping straight line is the underlying GDP-growth. The longer wave is the secular leverage cycles and the shorter waves are short-term debt cycles in part driven by the business cycle (or driving the cycle depending on your world view).
Picture 8.43. How the Economic Machine Works According to Ray Dalio
Source: thirstyfinance.com. We recommend watching the video at economicprinciples.org
Since many investors mainly look to the medium term horizon they take a sector stance based on their view of the economic cycle and possibly bank sector relative valuations and then they in a second step take arbitrage positons based on the relatively small differences in valuation multiples and on short term momentum. Banks are clearly cyclical businesses. For those that can time the trough of a stock market cycle banks will generally be a good relative investment the first two years - with the investment banking heavy firms being the most successful investments. What investors implicitly are saying through this method of investing is that banks are fairly undifferentiated businesses but if you get the cycle right you can make money owning the sector at the right moments.

SHARING OF FINANCIAL WISDOM
Others may quote and refer to the contents on this website provided that they have the author's consent and proper reference is made to investingbythebooks.com.
Efficiency ratio -> ROE -> PE-ratio
No excesses
The times they are a changing
Outperformers
§ Survived the bust
§ Taking share
§ Prepared for bust
Price is what you pay, value is what you get
Lower leverage -> better expansion opportunities
To some extent we must agree. Most bank services are highly important to the customer but fairly undifferentiated in between service providers and pricing variations are small. In banking successful products quickly get copied by competitors. Differences in customer value between suppliers exist but they more than anything arise from differences in the ease of use rather than a differentiated product. In any industry with low product differentiation cost efficiency becomes paramount. Thus, differences between banks in efficiency ratios show a 90% correlation to ROE levels - and the latter is the basis for bank valuations as we have shown above.
The low differentiation in combination with the heavy duty regulation has made sure that the returns on capital in global banking are no higher than in the average sector (no matter how often the media or left wing politicians are crying “excess profits”). The sub-sets within banking that have had really high returns are those businesses that require little invested capital such as asset management.
The thing is, we believe the differentiation in the bank sector will increase. There will be winners and losers. At the same time as new fintech competition conspire to remove the pricing power and profits from those that don’t face up to the challenge, the technological developments open up opportunities for banks that invest to improve customer experiences. Looking at how the market price bank stocks and the formula for the justified P/B = (ROE-g)/(COE-g), it is clearly rational for a bank to minimize the C/I-ratio to boost ROE as long as this doesn’t hurt the future growth (g) to an even larger extent.
The High Quality Bank
This brings us to the topic of investors who try to find individual longer term winners among banks. Good investment cases in banks can include investing in turnaround cases where banks that by a narrow margin survive a crisis, now face an improving environment, banks that muster some type of market share expansion that doesn’t build on increasing risk and taking over the credits that others don’t want or investing in the quality banks that showcase the effects of their prudent underwriting in a downturn.
To some extent all equity investing is about risk/reward; that is balancing the quality of what you are buying against the price of what you are paying. To start with, some bank markets are more attractive than others. Banks with an exposure to end markets with faster growth are more attractive than those with less as the bank then can generate organic growth without increasing leverage ratios.
Exposures to markets with a high level of market concentration allows for higher pricing power and, on a general level, low national corporate and residential debt levels as a percent of GDP indicates lower risk levels and better expansion opportunity. Further, exposures to regions or business lines with a proven long-term historic stability in earnings could be a sign of quality but it’s important to not put blind trust in history. Normally, you could also point to markets where deposits fund a large part of the banking business as more profitable than others.

SHARING OF FINANCIAL WISDOM
Others may quote and refer to the contents on this website provided that they have the author's consent and proper reference is made to investingbythebooks.com.
Financial ratios
Quality retial
In culture we trust
Does the culture fit the environment?
Sloping yield curve
Obviously a number of other factors affect the desirability of a bank as well. Throughout this primer we have presented a number of financial ratios and many of them are useful when analyzing the quality of a bank. As a way to look to the profitability of the bank versions of ROE and ROA plus net operating margin (split in-between net interest margin and net non-interest margin) are useful and so is the cost/income ratio. Looking at ratios like loans-to-deposits and deposits-to-liabilities can give a picture of a bank’s reliance on more fleeting outside funding. When describing Swedbank’s income statement previously we presented the LLC ratio, the NPL ratio, the coverage ratio and the provision coverage ratio, that all aim to judge the asset quality of a bank. Then we have the regulatory capital adequacy ratios like the CET1 requirement or the leverage ratio.
Naturally estimating quality isn’t just analyzing financial ratios. What makes a high quality bank differs hugely between a retail banking business and an investment banking operation. In our view a high quality retail bank should have a high level of deposit funding, it should have a history of prudent underwriting with low credit losses, a conservative asset-liability management, diversified revenue sources, operating efficiency and wise capital allocation – both internally and to shareholders. Some of this can be seen from financial ratios but qualitative judgements are equally important.
Even with further analysis of the quality, banks are in effect fairly impenetrable for an outside observer looking at the financials. It is hard to assess the credit quality of loans, an outsider is always behind the curve regarding the banks derivatives exposures and cannot know the duration risks and the operational risks seldom get advertised in advance of a trading loss. Perhaps then a more relevant and promising way of appraising the risk/reward of a bank is to try to analyze its corporate culture. Even showing similar financials one bank might have a short-term, aggressive, high risk/reward culture while the other prides itself in its high lending standards and can show a history of low credit losses in troubling times.
Yes, corporate cultures can change and make history obsolete as a guide to the future, but anyone that has worked in a large company knows how entrenched corporate cultures often are. Cultures are incredibly sticky, potentially changed only by very dominating leaders or life threating corporate disasters. Thus, our advice would be to take historic risk behavior very seriously and factor this into the analysis when assessing the future of a bank. A cautionary note however, a culture that brings success in one type of environment doesn’t necessarily bring success if the environment changes and the culture prevents the organization to adapt to the new conditions.
One metric we feel investors look too much to is the slope of the yield curve. We have above pointed to the fact that the correlation between NII in banks and the steepness of the yield curve is very low. Thus most of the time banks don’t earn more money when the curve steepens. Banks can play the yield curve from a trading perspective but other factors are more important for profits like economic growth, competition, mix changes and potentially absolute levels of interest rates.

SHARING OF FINANCIAL WISDOM
Others may quote and refer to the contents on this website provided that they have the author's consent and proper reference is made to investingbythebooks.com.
From costs to income?
Legacy IT creating…
…a technology debt
Cheap because used to cost more?
Lower ROE..
…as leverage going down and growth sluggish
Why is this important? Because it is one of the most common rules of thumb among investors that banks earn more money when the yield curve becomes steeper – not so. However, if enough investors keep using the rule of thumb the stocks might get a temporary boost from a steepening yield curve anyway.
In stable environments with low product differentiation operational efficiency separates companies. In changing environments operational efficiency can instead be an impediment for flexibility and needed adjustments. The question is if the definition of quality in banking with the changing technology landscape and customer behaviors will shift from efficiency ratios to more income generating factors?
Fintech is hardly something new. Technology has been used by banks for decades and the IT-environment is to a large extent what holds a bank together. Still, the fact that new technologies have been patched upon old ones as new products and regulations have been added has made the IT-environment complex, difficult to control and very problematic to modernize to cater to an environment that starts to develop in a faster pace. The complexity means that now and then a bank system goes down hurting customer confidence.
At some time the hairball of technologies used by banks are due for a full reboot. The risk of this reboot is however massive. It is always possible to patch up the system one more year and the gradual decline in competitiveness is to slow to trigger major changes. Hence, the technology debt of banks is building up every year. It would no doubt be a long term positive for a bank to go for a thorough modernization of its IT-environment as it would give it the chance to become a market leader longer term. However, you probably want to invest in the bank only prior to it announcing the needed IT-investments.
Low Multiples Equal Cheap?
Many bank stocks in Europe are not too far from their low points post the financial crisis and even in the US the pricing of bank stocks are miles from the peak around 2007. Doesn’t this point to a long-term buying opportunity? Are banks cheap because they used to cost more? We are not saying that banks today couldn’t be cheap but unfortunately simple comparisons with valuations from the last cycle are somewhat irrelevant.
In international banking the late 1990s and early 2000s was a different world from today. The high ROE levels of especially US banks during this period are a historical anomaly to start with. The financial crisis caused a U-turn in bank regulation as the pendulum swung from ever-laxer demands to a constant increase. Tighter regulation should mean lower ROE and earnings that in turn mean lowered justified valuations.
As we know the ROA is generally low in banking (an average of 0.6% between 2001 and 2015 for the four large Swedish banks) and leverage is used to generate a fairly normal industry ROE. Since capital requirements are rising it stands to reason that leverage is going down and with the decline ROE and bank earnings (growth) should be going down as well. So, is this what has happened? On a global scale, yes - primarily because the US taxpayers recapitalized
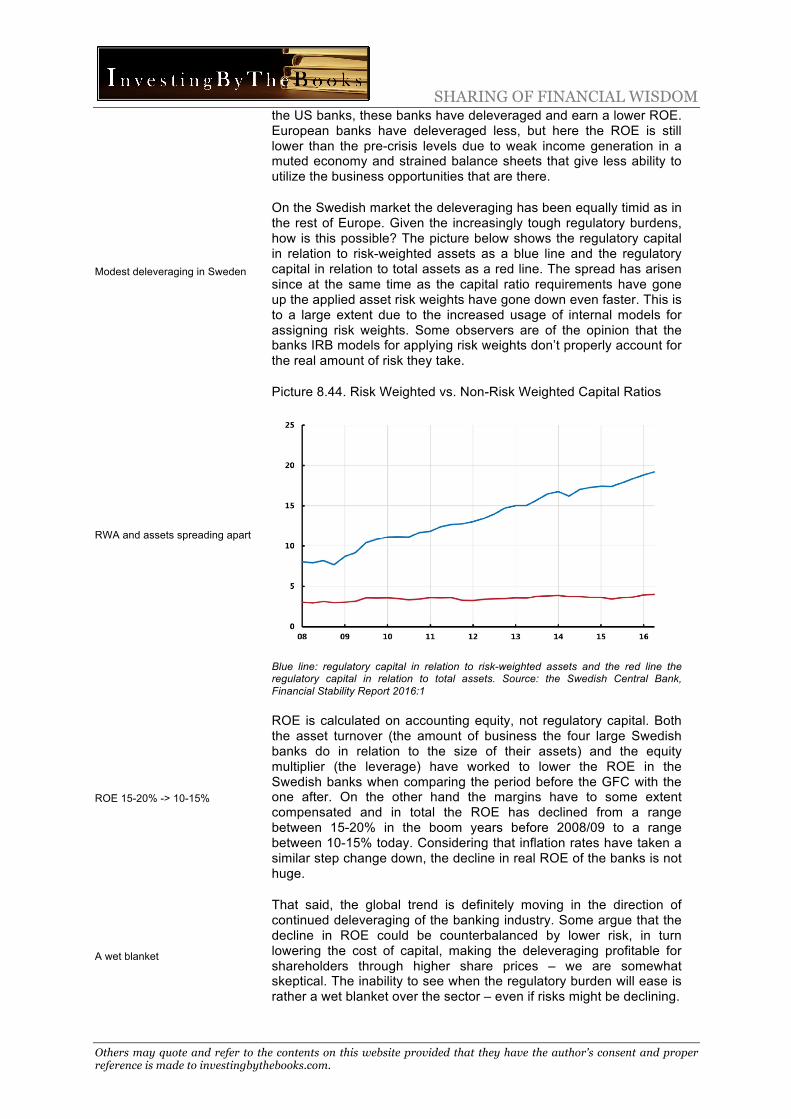
SHARING OF FINANCIAL WISDOM
Others may quote and refer to the contents on this website provided that they have the author's consent and proper reference is made to investingbythebooks.com.
Modest deleveraging in Sweden
RWA and assets spreading apart
ROE 15-20% -> 10-15%
A wet blanket
the US banks, these banks have deleveraged and earn a lower ROE. European banks have deleveraged less, but here the ROE is still lower than the pre-crisis levels due to weak income generation in a muted economy and strained balance sheets that give less ability to utilize the business opportunities that are there.
On the Swedish market the deleveraging has been equally timid as in the rest of Europe. Given the increasingly tough regulatory burdens, how is this possible? The picture below shows the regulatory capital in relation to risk-weighted assets as a blue line and the regulatory capital in relation to total assets as a red line. The spread has arisen since at the same time as the capital ratio requirements have gone up the applied asset risk weights have gone down even faster. This is to a large extent due to the increased usage of internal models for assigning risk weights. Some observers are of the opinion that the banks IRB models for applying risk weights don’t properly account for the real amount of risk they take.
Picture 8.44. Risk Weighted vs. Non-Risk Weighted Capital Ratios
Blue line: regulatory capital in relation to risk-weighted assets and the red line the regulatory capital in relation to total assets. Source: the Swedish Central Bank, Financial Stability Report 2016:1
ROE is calculated on accounting equity, not regulatory capital. Both the asset turnover (the amount of business the four large Swedish banks do in relation to the size of their assets) and the equity multiplier (the leverage) have worked to lower the ROE in the Swedish banks when comparing the period before the GFC with the one after. On the other hand the margins have to some extent compensated and in total the ROE has declined from a range between 15-20% in the boom years before 2008/09 to a range between 10-15% today. Considering that inflation rates have taken a similar step change down, the decline in real ROE of the banks is not huge.
That said, the global trend is definitely moving in the direction of continued deleveraging of the banking industry. Some argue that the decline in ROE could be counterbalanced by lower risk, in turn lowering the cost of capital, making the deleveraging profitable for shareholders through higher share prices – we are somewhat skeptical. The inability to see when the regulatory burden will ease is rather a wet blanket over the sector – even if risks might be declining.

SHARING OF FINANCIAL WISDOM
Others may quote and refer to the contents on this website provided that they have the author's consent and proper reference is made to investingbythebooks.com.
Regulatory pendulum and fintech competition
The prospects of banks once again becoming secular winners depend on the long-term leverage and deleverage cycles which in turn are partly dependent on regulation trends. As a group the next secular golden banking era to invest into will then probably come when the regulatory pendulum starts to swing back and the dust around the fintech competition has settled.
Bank loans must over time grow with the GDP or else the risks become unmanageable. In recent history they grew faster than this. Today the Western world and parts of the Emerging markets need to deleverage and this includes the banks. Banks can still outperform during parts of the economic cycle but they probably will not structurally outperform in times of continued balance sheet shrinkage. When will the regulatory pendulum swing back? We don’t know, but not right yet.
Irrespective of when longer trends in the loan penetration and in regulation will create a tailwind for the combined banking sector, individual banks can still prove to be good relative investments in these times of changing customer behaviors and fast technological developments.
The technological development and the threat from Fintech companies will bring a larger differentiation in how different banks cope with the future. Some will invest and thrive over the longer-term, while others will fall behind with a gradual decline in competitiveness as the result (but always with excellent cost/income ratios…). Surely, the time for myopic profit maximization in the banking industry is not right now. Digitalization is the new differentiator for banks.
Happy investing!
Related Documents