July - August 2009 Vol 18 No. 7 - 8 BANK OF SLOVENIA EUROSYSTEM MONTHLY BULLETIN

Welcome message from author
This document is posted to help you gain knowledge. Please leave a comment to let me know what you think about it! Share it to your friends and learn new things together.
Transcript
July - August 2009Vol 18 No. 7 - 8
BANK OF SLOVENIA
EUROSYSTEM
MONTHLY
BULLETIN
BANKA SLOVENIJE
2 Monthly Bulletin, July - August 2009
BANK OF SLOVENIAEUROSYSTEM
Published by: BANKA SLOVENIJESlovenska 35,1000 LjubljanaSlovenija
tel.: +386 (1) 4719000fax.: +386 (1) 2515516E-mail: [email protected]://www.bsi.si/SWIFT: BSLJ SI 2X
Editorial Board:
Printed by: Tiskarna Radovljica d.o.o.
Publication and other public use of data from this publication ispermitted subject to statement of the source.Publication is available on the Web.For PGP key see last page.
ISSN 1318-0770 (print)ISSN 1518-209X (online)
Ta publikacija je na voljo tudi v slovenščini.
Mr. Janez FABIJAN, Financial StatisticsMrs. Danica PRELOVŠEK, Advisor to the GovernorMr.Franc DRENOVEC, Advisor to the GovernorMr. Damjan KOZAMERNIK, Analysis and ResearchMr. Tomaž KOŠAK, Financial StabilityMr. Ernest ERMENC,Accounting
BANKA SLOVENIJE
3Monthly Bulletin, July - August 2009
BANK OF SLOVENIAEUROSYSTEM
Important information
Monthly Bulletin of Bank of Slovenia has been, from the number 2-3 for February-March 2007, volume 16, partly changed in itscontent and form.
The preannouncement of the change has been published on the web page of the Bank of Slovenia in January 2007.
The main changes are as follows:· The beginning of publishing the statistical data of value, which refer to the period after the entry to the euro area, in the
official domestic currency - euro. The data of value for the previous period will continue to be published in tolars, as theofficial Slovenian currency in that period. The data in euros are in the tables separated from the data in tolars by line.
· The change in the concept of the international monetary reserves because of the entry to the Economic and monetaryunion. Among the Slovenian international monetary reserves after the entry to the euro area, compared to the periodbefore, there are no longer assets in euro as well as the claims on the euro area residents. More explanation is availablein: “The statistical treatment of the international monetary reserves at the entry of Slovenia to the euro area” (slovenian),in the chapter Methodological information on the internet page: http://www.bsi.si/en/financial-data.asp?MapaId=64.
· The change in the presentation of the currency in the circulation to the standards of the euro area.· The accommodation of the balance sheet of Bank of Slovenia to its activities in the framework of the Eurosystem.· The beginning of the publishing of the interest rates of the euro area money market as well as the publishing of the whole
set of the interest rates of the Monetary financial institutions according to the ECB’s methodology.· The beginning of the publishing of the financial accounts statistics in the new chapter.· Colour separation of the individual statistical chapters, to alleviate search and because of the link of the chapters to the
specialised publications.
More information can be found in Methodological Notes in the Bank of Slovenia monthly Bulletin.
The entry to the euro area (on 1.1.2007) caused a break in the time series of the statistical tables in the Monthly bulletin in caseswhere the “currency” is an attribute. An expected reclassification takes place, for example of the stock of outstanding loans ineuros from the time series of “foreign currency” before the introduction to the time series of “domestic currency” after the intro-duction of euro. To enable easier reconstruction of this change, the shares of the Euro amounts in stocks of the foreign currencyin the tables 1.3, 1.4, 1.5 and 1.6 on 31.12.2004, 31.12.2005 and 31.12.2006 are published in the chapter Methodologicalnotes.
BANKA SLOVENIJE
4 Monthly Bulletin, July - August 2009
BANK OF SLOVENIAEUROSYSTEM
BANKA SLOVENIJE
5Monthly Bulletin, July - August 2009
BANK OF SLOVENIAEUROSYSTEM
TABLE OF CONTENTS
REPUBLIC OF SLOVENIA:General Information
I. ECONOMIC AND FINANCIAL DEVELOPMENTS1. International Environment2. Economic Activity and Labour Market3. Price Developments4. Balance of Payments5. Public Finance6. Banking System7. Domestic Financial Markets
II. STATISTICAL TABLESMoney and Monetary Financial InstitutionsFinancial Markets and Payment SystemsBalance of Payments and External PositionPublic FinanceFinancial AccountsNon-Financial Accounts and General Economic Statistics
III. BANKING INSTITUTIONS IN SLOVENIA
VI. NOTES ON METHODOLOGYReview of the linksAdvance release calendar
6
1-22
132447798694
1
12527
Legend:
-....*/01,2,3,...n.a.
Sums of part figures may differ from totals due to roundings.The data in euros and the data in tolars are separated with line.
no occurencenot availableprovisional or estimatedcorrected dataaveragevalue less than 0.5footnote, explained in Notes Methologynot applicable

BANKA SLOVENIJE
6 Monthly Bulletin, July - August 2009
BANK OF SLOVENIAEUROSYSTEM
REPUBLIC OF SLOVENIA:
GENERAL INFORMATION
Measured in:Date or period of
data:
Area 20,273 km2 2008Population 2,032,362 number 12.31.2008Population growth 1.1 % 12.31.2008Population density 100.2 number / km2 12.31.2008Population of City Community Ljubljana 276,091 number 12.31.2008
Origin of value added: 2008Agriculture 2.0 % Industry 28.9 %Construction 8.1 %Services 61.0 %Total 100.0 %
GDP real annual change 3.5 % 2008
Industrial production annual change -22.3 % June, 2009Total employment annual change -2.6 % June, 2009Unemployment rate (ILO definition) 5.6 % Apr. - Jun., 2008Annual inflation rate 0.0 % August, 2009
General government:revenue 42.7 % BDP 2008surplus/deficit -0.9 % BDP 2008
Trade balance -85.4 mio EUR Jan. - Jun., 2009BOP current account 55.5 mio EUR Jan. - Jun., 2009International reserves 593.4 mio EUR 07.31.2009Foreign exchange reserves 470.9 mio EUR 07.31.2009Net foreign debt 9,599 mio EUR 06.30.2009Gross foreign debt 37,598 mio EUR 06.30.2009
Currency unit since January 2007: Euro (EUR) 1EUR = 239.64 SIT
BANKA SLOVENIJE
1-I.Monthly Bulletin, July - August 2009
ECONOMIC AND FINANCIAL DEVELOPMENTSBANK OF SLOVENIA
EUROSYSTEM
I. ECONOMIC AND FINANCIAL
I. ECONOMIC AND FINANCIAL DEVELOPMENTS
1. International Environment2. Economic Activity and Labour Market3. Price Developments4. Balance of Payments5. Public Finance6. Banking System7. Domestic Financial Markets
DEVELOPMENTS
Downward revisions to economic growth forecasts for the euro area and the US ceased in August, at
-4.3% and -2.6% respectively, while the forecast for eastern Europe was lowered to -5.4%. The halt
in downward revisions to GDP growth forecasts for the euro area was the result of the current GDP
growth of 0.3% in the second quarter of this year in Germany and France, the first GDP growth recorded
by these two countries since the first quarter of 2008. According to the latest releases regarding US
economic growth in the first and second quarters of this year, possible improvements in activity have
been seen primarily in the corporate sector, while household consumption remains cautious despite
government stimuli. The most significant factors in the lowering of forecasts of economic growth for
the countries of eastern Europe are lower foreign demand and deteriorating expectations regarding
corporate investment, which is strongly dependent on inflows of foreign capital. Oil prices rose again
in August, while the prices of other commodities continue to fall. The rise in the price of Brent crude
by more than one-half since the beginning of the year is primarily the result of estimated growth in
demand and industrial production in India and China. The year-on-year fall in euro area consumer
prices stood at 0.1% in June, 0.7% in July and 0.2% in August. The main reason for July’s year-on-
year decline in prices was lower fuel and energy prices. Year-on-year core inflation as measured by
growth in prices excluding energy and unprocessed food was down by 0.2 percentage points in July
to 1.3%. The ECB and Federal Reserve left their key interest rates unchanged in July and August, at
1.00% and between zero and 0.25% respectively.
Indicators of economic activity have not improved significantly in Slovenia. GDP was up 0.7% in
current terms in the second quarter, but primarily due to higher government spending and a positive
contribution from net foreign trade. According to original figures GDP was down 9.3% in year-on-year
terms. The decline in gross investment has deepened, while household consumption is also down in
line with deteriorating labour market conditions. Industrial production was down 0.9% in current terms
in June, bringing the year-on-year contraction over the first half of the year to more than 21%. The
real value of new orders received in June was down 4.3% on May, and down 29.7% in year-on-year
terms. Activity in individual service sectors was down slightly further in May and June, most notably
in the travel agency sector, while tourist arrivals and overnight stays were down 5% in year-on-year
terms in July. Following a temporary improvement in May and June, the consumer confidence indica-
tor deteriorated in August for the second consecutive month. Real sales revenues in the retail sector
were up slightly in June. Having remained unchanged in current terms in July, the seasonally adjusted
economic sentiment indicator rose by 1 percentage point in August.
The deterioration in conditions on the labour market has slowed in recent months. Growth in the num-
ber of registered unemployed in June and July was up slightly on May, in part due to seasonal effects,
but remained lower than in the first four months of the year. Owing to the adjustment of labour costs
to lower economic activity, average year-on-year growth in nominal gross wages in the private sector
remained low in May and June, while high public sector wage growth continued.
Year-on-year inflation as measured by the HICP stood at 0.1% in August, up 0.7 percentage points on
July. The current inflation rate also rose to 0.1% in August, while core inflation fell from 1.6% to 1.4%.
Given the current growth in energy and food prices on the global market, the gradual rise in inflation
is expected to continue in the coming months.
The current account surplus in the first half of the year in the amount of EUR 56 million was primarily
the result of the improving trade balance in the second quarter. Due to lower commodity prices and
the resulting improved terms of trade and owing to the sharp drop in industrial production and lower
domestic demand, imports are declining significantly faster than exports in nominal terms. With an
improving current account in the context of a contraction in economic activity since March, gross
external claims and the gross external debt remain unchanged.
The primary source of the general government deficit in the first half of the year of more than EUR 1
billion is the state budget, while expenditure also exceeds revenues at the Health Insurance Institute
and in local government. The fiscal position of other EU Member States is also deteriorating in the
context of the economic crisis and financial turmoil. Thus this year many Member States, including
Slovenia, will exceed the reference value for the general government deficit of 3% of GDP. On 16
July the National Assembly adopted the revised state budget, which envisages a deficit of EUR 1.8
billion or 5.0% of GDP. Taking into account the planned deficits of the Health Insurance Institute and
local government, and in the context of a balanced position at the Pension and Disability Insurance
Institute, this year’s consolidated general government deficit is expected to stand at 5.5% of GDP. On
27 July the government discussed the draft budget memorandum for the period 2010 to 2013, and
introduced fiscal rule to improve the control of general government expenditure. The state budget
deficit is expected to gradually fall below 3% of GDP by 2013.
In July the banking system’s total assets were up EUR 1,289 million owing to the issue of government-
guaranteed NLB bonds in the amount of EUR 1.5 billion. Claims against foreign banks and investments
in securities in particular rose as a result. Lending to non-financial corporations was modest, while
in July household lending was up sharply compared with previous months. At EUR 164 million, the
banking system’s pre-tax profit over the first seven months of this year was down 47% on the same
period last year, primarily due to higher impairment and provisioning costs.
The wording of the Economic and Financial Developments section was approved by the Governing Board of the Bank of Slovenia on 1 September 2009.

ECONOMIC AND FINANCIAL DEVELOPMENTS BANKA SLOVENIJE
5-I.Monthly Bulletin, July - August 2009
BANK OF SLOVENIAEUROSYSTEM
1 l International Environment
Among Slovenia’s most important export partners
from the euro area, Germany and France recorded an
increase in economic activity in the second quarter.
GDP in both countries was up 0.3% in current terms, the
first increase since the first quarter of 2008. The decline
in GDP in Italy and Austria was smaller than in the previous
quarter, at 0.5% and 0.4% respectively. GDP was down
0.1% overall in the euro area in the second quarter, and
0.3% in the US, marking an improvement on the previous
quarter in both cases.
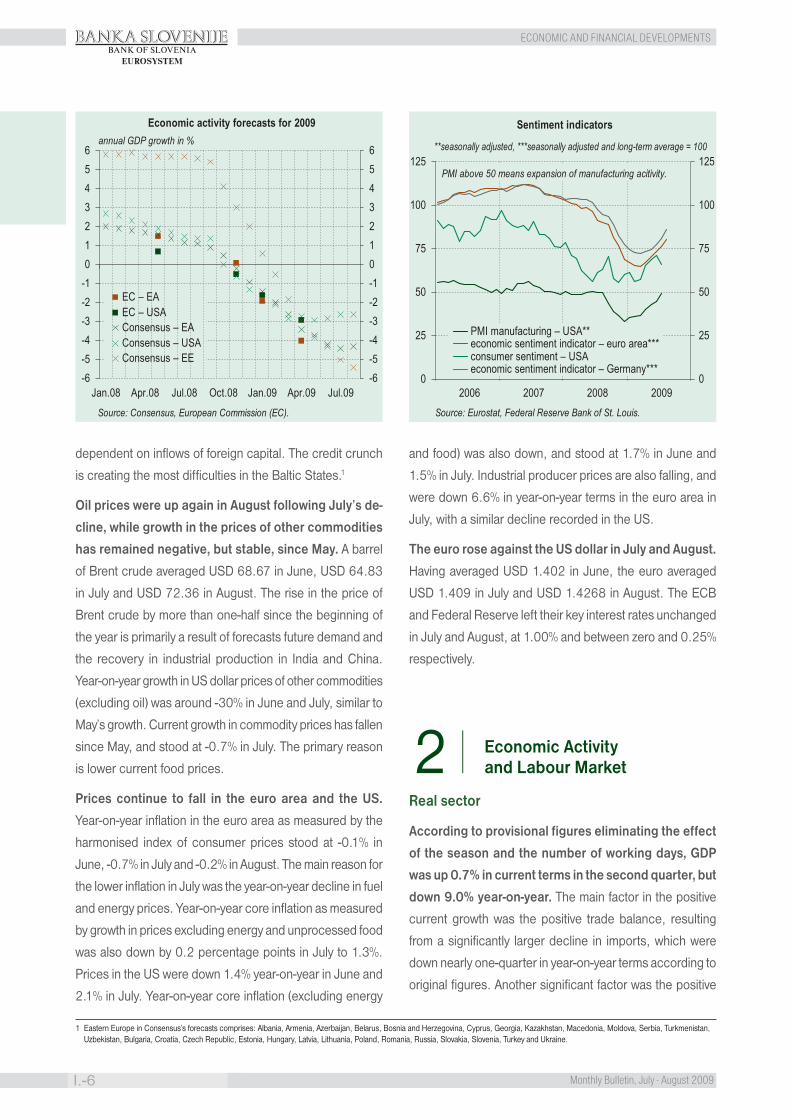
The deterioration in economic growth forecasts for the
euro area and the US came to a halt during the summer.
Consensus’s economic growth forecasts for the euro area
and the US remained fairly stable during the summer, the
first easing following the rapid deterioration since the start
of autumn 2008. August’s economic growth forecasts for
the euro area and the US stood at -4.3% and -2.6% respec-
tively. The reasons for the stabilisation of forecasts for the
euro area lie in the first releases of GDP growth figures for
the second quarter of this year for Germany and France,
which were higher than expected, and in the continued
improvement in confidence indicators. According to the
latest releases regarding US economic growth in the first
and second quarter of this year, possible improvements in
activity have been seen primarily in the corporate sector,
which has led to a halt in downward revisions to economic
growth forecasts for the US. Household consumption rema-
ins cautious despite government stimuli, primarily owing to
the fear of job losses and falling real estate prices.
Forecasts of economic activity for eastern Europe con-
tinue to be revised downwards. By August Consensus’s
forecasts for the countries of eastern Europe had been lo-
wered to -5.4%. The most significant factors in the cutting of
forecasts are lower foreign demand and deteriorating expec-
tations regarding corporate investment, which is strongly
International Environment 2006 2007 2008 2009 projections
GDP annual growth rates, %Euro area 2.9 2.7 0.8 -4.6 Q2 * -4.3 ** August 2009
USA 2.7 2.1 0.4 -3.9 Q2 * -2.6 ** August 2009
Commodities, USD prices:
Primary, total 27.7 18.8 12.2 -30.6 July
- industry 46.3 12.7 -7.2 -36.8 July
Food 11.4 25.9 32.4 -25.9 July
Oil (Brent, USD/barrel) 64.9 72.7 97.6 72.4 August
Inflation
Euro area 2.2 2.1 3.3 -0.7 July
USA 3.2 2.9 3.8 -2.1 July
Central banks' interest rates % at the end of period
Euro area 3.50 4.00 2.50 1.00 JulyUSA 5.25 4.25 0.00-0.25 0.00-0.25 JulySources: Bloomberg, Consensus, The Economist, Eurostat, European Commission, Bureau of Economic Analysis (BEA) ** Consensus, August 2009.Note: * Seasonally adjusted – Eurostat for the euro area, BEA for USA.
-6
-4
-2
0
2
4
-30
-20
-10
0
10
20
2006 2007 2008 2009
real GDP – USA (lhs)real GDP – euro area (lhs)industrial production – USA (rhs)industrial production – euro area (rhs)
Industrial production and GDPy-o-y growth rates in %, seasonally adjusted data
Source: Eurostat, BEA, Federal Reserve Bank of St. Louis.
ECONOMIC AND FINANCIAL DEVELOPMENTS
I.-6 Monthly Bulletin, July - August 2009
BANKA SLOVENIJEBANK OF SLOVENIA
EUROSYSTEM
dependent on inflows of foreign capital. The credit crunch
is creating the most difficulties in the Baltic States.1
Oil prices were up again in August following July’s de-
cline, while growth in the prices of other commodities
has remained negative, but stable, since May. A barrel
of Brent crude averaged USD 68.67 in June, USD 64.83
in July and USD 72.36 in August. The rise in the price of
Brent crude by more than one-half since the beginning of
the year is primarily a result of forecasts future demand and
the recovery in industrial production in India and China.
Year-on-year growth in US dollar prices of other commodities
(excluding oil) was around -30% in June and July, similar to
May’s growth. Current growth in commodity prices has fallen
since May, and stood at -0.7% in July. The primary reason
is lower current food prices.
Prices continue to fall in the euro area and the US.
Year-on-year inflation in the euro area as measured by the
harmonised index of consumer prices stood at -0.1% in
June, -0.7% in July and -0.2% in August. The main reason for
the lower inflation in July was the year-on-year decline in fuel
and energy prices. Year-on-year core inflation as measured
by growth in prices excluding energy and unprocessed food
was also down by 0.2 percentage points in July to 1.3%.
Prices in the US were down 1.4% year-on-year in June and
2.1% in July. Year-on-year core inflation (excluding energy
and food) was also down, and stood at 1.7% in June and
1.5% in July. Industrial producer prices are also falling, and
were down 6.6% in year-on-year terms in the euro area in
July, with a similar decline recorded in the US.
The euro rose against the US dollar in July and August.
Having averaged USD 1.402 in June, the euro averaged
USD 1.409 in July and USD 1.4268 in August. The ECB
and Federal Reserve left their key interest rates unchanged
in July and August, at 1.00% and between zero and 0.25%
respectively.
2 l Economic Activity
and Labour Market
Real sector
According to provisional figures eliminating the effect
of the season and the number of working days, GDP
was up 0.7% in current terms in the second quarter, but
down 9.0% year-on-year. The main factor in the positive
current growth was the positive trade balance, resulting
from a significantly larger decline in imports, which were
down nearly one-quarter in year-on-year terms according to
original figures. Another significant factor was the positive
0
25
50
75
100
125
0
25
50
75
100
125
2006 2007 2008 2009
PMI manufacturing – USA**economic sentiment indicator – euro area***consumer sentiment – USAeconomic sentiment indicator – Germany***
**seasonally adjusted, ***seasonally adjusted and long-term average = 100
Sentiment indicators
Source: Eurostat, Federal Reserve Bank of St. Louis.
PMI above 50 means expansion of manufacturing acitivity.
-6-5-4-3-2-10123456
-6-5-4-3-2-10123456
Jan.08 Apr.08 Jul.08 Oct.08 Jan.09 Apr.09 Jul.09
EC – EAEC – USAConsensus – EAConsensus – USAConsensus – EE
Economic activity forecasts for 2009
Source: Consensus, European Commission (EC).
annual GDP growth in %
0
25
50
75
100
125
0
25
50
75
100
125
2006 2007 2008 2009
PMI manufacturing – USA**economic sentiment indicator – euro area***consumer sentiment – USAeconomic sentiment indicator – Germany***
**seasonally adjusted, ***seasonally adjusted and long-term average = 100
Sentiment indicators
Source: Eurostat, Federal Reserve Bank of St. Louis.
PMI above 50 means expansion of manufacturing acitivity.
-6-5-4-3-2-10123456
-6-5-4-3-2-10123456
Jan.08 Apr.08 Jul.08 Oct.08 Jan.09 Apr.09 Jul.09
EC – EAEC – USAConsensus – EAConsensus – USAConsensus – EE
Economic activity forecasts for 2009
Source: Consensus, European Commission (EC).
annual GDP growth in %
1 Eastern Europe in Consensus’s forecasts comprises: Albania, Armenia, Azerbaijan, Belarus, Bosnia and Herzegovina, Cyprus, Georgia, Kazakhstan, Macedonia, Moldova, Serbia, Turkmenistan, Uzbekistan, Bulgaria, Croatia, Czech Republic, Estonia, Hungary, Latvia, Lithuania, Poland, Romania, Russia, Slovakia, Slovenia, Turkey and Ukraine.
ECONOMIC AND FINANCIAL DEVELOPMENTS BANKA SLOVENIJE
7-I.Monthly Bulletin, July - August 2009
BANK OF SLOVENIAEUROSYSTEM
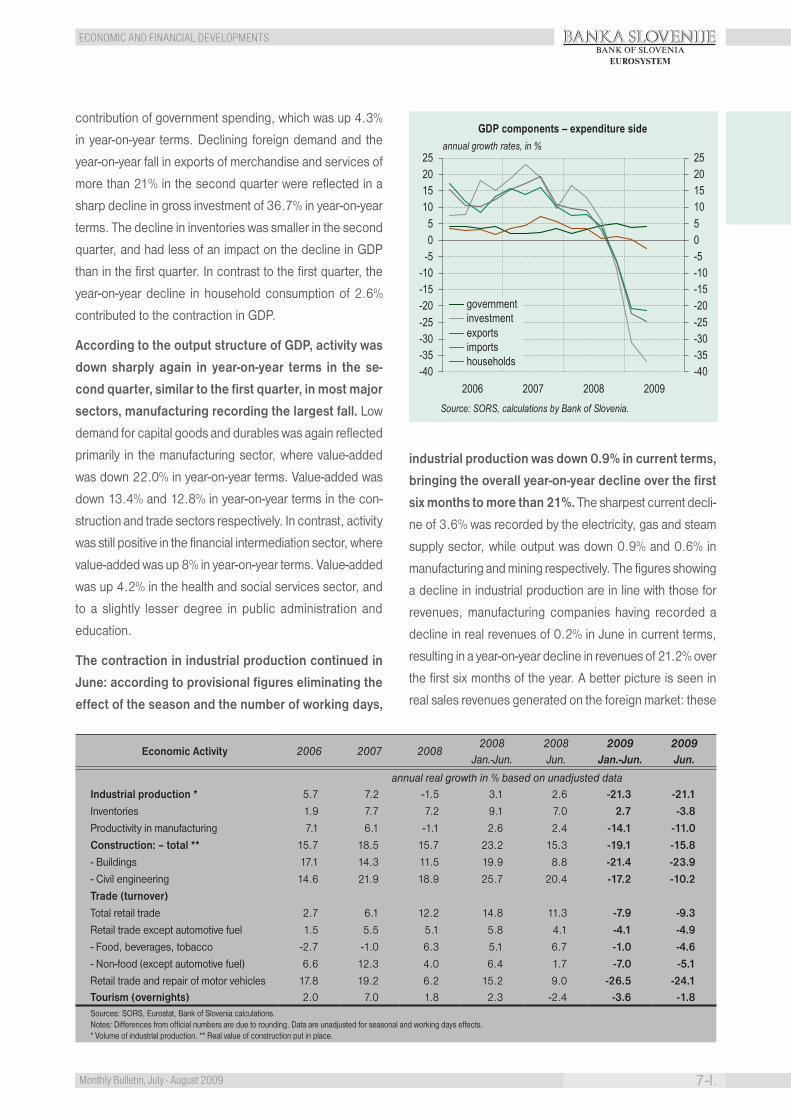
contribution of government spending, which was up 4.3%
in year-on-year terms. Declining foreign demand and the
year-on-year fall in exports of merchandise and services of
more than 21% in the second quarter were reflected in a
sharp decline in gross investment of 36.7% in year-on-year
terms. The decline in inventories was smaller in the second
quarter, and had less of an impact on the decline in GDP
than in the first quarter. In contrast to the first quarter, the
year-on-year decline in household consumption of 2.6%
contributed to the contraction in GDP.
According to the output structure of GDP, activity was
down sharply again in year-on-year terms in the se-
cond quarter, similar to the first quarter, in most major
sectors, manufacturing recording the largest fall. Low
demand for capital goods and durables was again reflected
primarily in the manufacturing sector, where value-added
was down 22.0% in year-on-year terms. Value-added was
down 13.4% and 12.8% in year-on-year terms in the con-
struction and trade sectors respectively. In contrast, activity
was still positive in the financial intermediation sector, where
value-added was up 8% in year-on-year terms. Value-added
was up 4.2% in the health and social services sector, and
to a slightly lesser degree in public administration and
education.
The contraction in industrial production continued in
June: according to provisional figures eliminating the
effect of the season and the number of working days,
industrial production was down 0.9% in current terms,
bringing the overall year-on-year decline over the first
six months to more than 21%. The sharpest current decli-
ne of 3.6% was recorded by the electricity, gas and steam
supply sector, while output was down 0.9% and 0.6% in
manufacturing and mining respectively. The figures showing
a decline in industrial production are in line with those for
revenues, manufacturing companies having recorded a
decline in real revenues of 0.2% in June in current terms,
resulting in a year-on-year decline in revenues of 21.2% over
the first six months of the year. A better picture is seen in
real sales revenues generated on the foreign market: these
Economic Activity 2006 2007 2008 2008 2008 2009 2009
Jan.-Jun. Jun. Jan.-Jun. Jun.
annual real growth in % based on unadjusted dataIndustrial production * 5.7 7.2 -1.5 3.1 2.6 -21.3 -21.1 Inventories 1.9 7.7 7.2 9.1 7.0 2.7 -3.8 Productivity in manufacturing 7.1 6.1 -1.1 2.6 2.4 -14.1 -11.0 Construction: – total ** 15.7 18.5 15.7 23.2 15.3 -19.1 -15.8 - Buildings 17.1 14.3 11.5 19.9 8.8 -21.4 -23.9 - Civil engineering 14.6 21.9 18.9 25.7 20.4 -17.2 -10.2 Trade (turnover) Total retail trade 2.7 6.1 12.2 14.8 11.3 -7.9 -9.3 Retail trade except automotive fuel 1.5 5.5 5.1 5.8 4.1 -4.1 -4.9 - Food, beverages, tobacco -2.7 -1.0 6.3 5.1 6.7 -1.0 -4.6 - Non-food (except automotive fuel) 6.6 12.3 4.0 6.4 1.7 -7.0 -5.1 Retail trade and repair of motor vehicles 17.8 19.2 6.2 15.2 9.0 -26.5 -24.1 Tourism (overnights) 2.0 7.0 1.8 2.3 -2.4 -3.6 -1.8 Sources: SORS, Eurostat, Bank of Slovenia calculations.Notes: Differences from official numbers are due to rounding. Data are unadjusted for seasonal and working days effects.* Volume of industrial production. ** Real value of construction put in place.
-40-35-30-25-20-15-10-505
10152025
2006 2007 2008 2009-40-35-30-25-20-15-10-50510152025
governmentinvestmentexportsimportshouseholds
GDP components – expenditure side
Source: SORS, calculations by Bank of Slovenia.
annual growth rates, in %

ECONOMIC AND FINANCIAL DEVELOPMENTS
I.-8 Monthly Bulletin, July - August 2009
BANKA SLOVENIJEBANK OF SLOVENIA
EUROSYSTEM
60
70
80
90
100
110
120
130
140
200
205
210
215
220
225
230
235
240
2006 2007 2008 2009
industry – totalmining and quarryingmanufacturing activitieselectricity, gas, steampersons in employment in industry, in thousand, rhs
*seasonally and working days adjusted data
real indices, 2005 = 100*
Source: SORS.
Volume of production and employment in industry
-40
-30
-20
-10
0
10
20
30
40
-40
-30
-20
-10
0
10
20
30
40
2006 2007 2008 2009
retail trade – totalretail trade, except fueltrade and repair of motor vehicles and motorcycles
Trade volumey-o-y % change, data adjusted for working days
Source: SORS, Bank of Slovenia calculations.
-25
-20
-15
-10
-5
0
5
10
15
20
25
-25
-20
-15
-10
-5
0
5
10
15
20
25
2006 2007 2008 2009
Sloveniaeuro area (16 countries)
Nominal turnover in service activities*
Source: Eurostat, Bank of Slovenia calculations.
y-o-y growth rates in %
*Services required by STS regulation;working days adjusted data.
were up 1.2% in June on the previous month, whiles sales
revenues on the domestic market were down 7.4% in current
terms. The trend of new orders in industry is also in line
with current financial and economic trends in the European
Union and the wider economic environment, which remain
uncertain. The real value of new orders received in June was
down 4.3% on the previous month, and down 29.7% in year-
on-year terms. The real value of new orders was down 3.5%
in current terms on the domestic market and down 4.4%
on the foreign market, with the drop in orders from the euro
area even higher at 7%. The value of new orders in other
foreign currencies was up 1.7%. Industrial inventories are
declining simultaneously with the decline in domestic and
foreign orders. According to provisional figures eliminating
the effect of the season and the number of working days,
in June inventories were down 3.8% in year-on-year terms
and 1.5% in current terms, bringing the overall year-on-year
increase over the first six months of the year to 2.7%.
Activity in certain service sectors has declined so-
mewhat more in recent months, although real sales
revenues in the retail sector were actually up slightly
in June in current terms. According to provisional figures,
sales revenues were down in May in the majority of service
sectors, the largest month-on-month drop of 11% recorded
by travel agencies and travel-related services. Activity in the
retail sector has remained at a relatively low level, with July’s
real sales revenues at the level recorded in June. Real sales
revenues in the retail sector, excluding motor fuels, were
up 1.2% in July in current terms, while real sales revenues
from the retail and repair of motor vehicles were practically
unchanged. Real sales revenues in the retail sector were
up 1.7% in June in current terms, the highest level recor-
ded by countries of the euro area, where revenues in the
retail sector were down 0.2% on average in current terms.
Nevertheless, sales revenues in the Slovenian retail sector
were down 9.4% in year-on-year terms in June. Revenues
from the retail of food, beverages and tobacco were down
3.7% in current terms and 5.4% year-on-year in June. In
June the largest year-on-year decline in real sales revenues
of 25.9% was recorded by the trade and repair of motor
ECONOMIC AND FINANCIAL DEVELOPMENTS BANKA SLOVENIJE
9-I.Monthly Bulletin, July - August 2009
BANK OF SLOVENIAEUROSYSTEM
vehicles sector, while revenues were practically unchanged
in current terms. The effects of the economic crisis can also
be seen in the tourism sector, where the number of arrivals
was down 5% year-on-year in July, while the number of
overnight stays was also down around 5% in year-on-year
terms in July, and down 4% in year-on-year terms over the
first seven months of this year. Activity also remains low in the
transport sector. In June the volume of merchandise moved
at ports and at airports was down 8.3% and around 32%
in year-on-year terms respectively, while fewer passengers
were carried by public road transport and aviation (year-on-
year declines of 1.6% and 15% respectively). The number
of new road vehicle registrations was also down again in
June, by 17.1% in year-on-year terms.
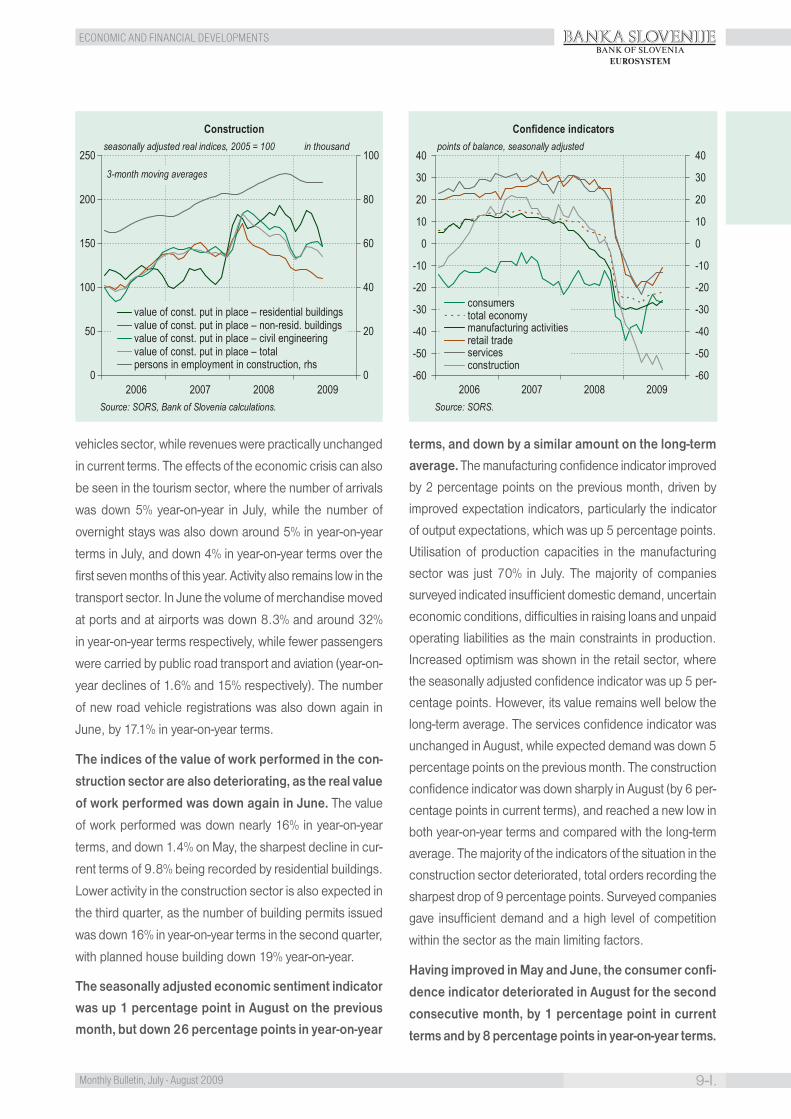
The indices of the value of work performed in the con-
struction sector are also deteriorating, as the real value
of work performed was down again in June. The value
of work performed was down nearly 16% in year-on-year
terms, and down 1.4% on May, the sharpest decline in cur-
rent terms of 9.8% being recorded by residential buildings.
Lower activity in the construction sector is also expected in
the third quarter, as the number of building permits issued
was down 16% in year-on-year terms in the second quarter,
with planned house building down 19% year-on-year.
The seasonally adjusted economic sentiment indicator
was up 1 percentage point in August on the previous
month, but down 26 percentage points in year-on-year
terms, and down by a similar amount on the long-term
average. The manufacturing confidence indicator improved
by 2 percentage points on the previous month, driven by
improved expectation indicators, particularly the indicator
of output expectations, which was up 5 percentage points.
Utilisation of production capacities in the manufacturing
sector was just 70% in July. The majority of companies
surveyed indicated insufficient domestic demand, uncertain
economic conditions, difficulties in raising loans and unpaid
operating liabilities as the main constraints in production.
Increased optimism was shown in the retail sector, where
the seasonally adjusted confidence indicator was up 5 per-
centage points. However, its value remains well below the
long-term average. The services confidence indicator was
unchanged in August, while expected demand was down 5
percentage points on the previous month. The construction
confidence indicator was down sharply in August (by 6 per-
centage points in current terms), and reached a new low in
both year-on-year terms and compared with the long-term
average. The majority of the indicators of the situation in the
construction sector deteriorated, total orders recording the
sharpest drop of 9 percentage points. Surveyed companies
gave insufficient demand and a high level of competition
within the sector as the main limiting factors.
Having improved in May and June, the consumer confi-
dence indicator deteriorated in August for the second
consecutive month, by 1 percentage point in current
terms and by 8 percentage points in year-on-year terms.
-60
-50
-40
-30
-20
-10
0
10
20
30
40
-60
-50
-40
-30
-20
-10
0
10
20
30
40
2006 2007 2008 2009
consumerstotal economymanufacturing activitiesretail tradeservicesconstruction
Confidence indicatorspoints of balance, seasonally adjusted
Source: SORS.
0
20
40
60
80
100
0
50
100
150
200
250
2006 2007 2008 2009
value of const. put in place – residential buildingsvalue of const. put in place – non-resid. buildingsvalue of const. put in place – civil engineering value of const. put in place – totalpersons in employment in construction, rhs
Construction
Source: SORS, Bank of Slovenia calculations.
seasonally adjusted real indices, 2005 = 100 in thousand
3-month moving averages
-60
-50
-40
-30
-20
-10
0
10
20
30
40
-60
-50
-40
-30
-20
-10
0
10
20
30
40
2006 2007 2008 2009
consumerstotal economymanufacturing activitiesretail tradeservicesconstruction
Confidence indicatorspoints of balance, seasonally adjusted
Source: SORS.
0
20
40
60
80
100
0
50
100
150
200
250
2006 2007 2008 2009
value of const. put in place – residential buildingsvalue of const. put in place – non-resid. buildingsvalue of const. put in place – civil engineering value of const. put in place – totalpersons in employment in construction, rhs
Construction
Source: SORS, Bank of Slovenia calculations.
seasonally adjusted real indices, 2005 = 100 in thousand
3-month moving averages
ECONOMIC AND FINANCIAL DEVELOPMENTS
I.-10 Monthly Bulletin, July - August 2009
BANKA SLOVENIJEBANK OF SLOVENIA
EUROSYSTEM
While July’s month-on-month fall in the consumer confidence
indicator was driven primarily by deteriorating assessments
of the financial standing of households and the economic
situation in Slovenia, August’s fall was primarily the result of
increased consumer pessimism with regard to the suitability
of saving, given the general economic situation. The average
euro area consumer confidence indicator has risen in cur-
rent terms in recent months. However, consumers remain
cautious due to still-uncertain economic conditions, as seen
in part by a drop in sales revenues in the retail sector.
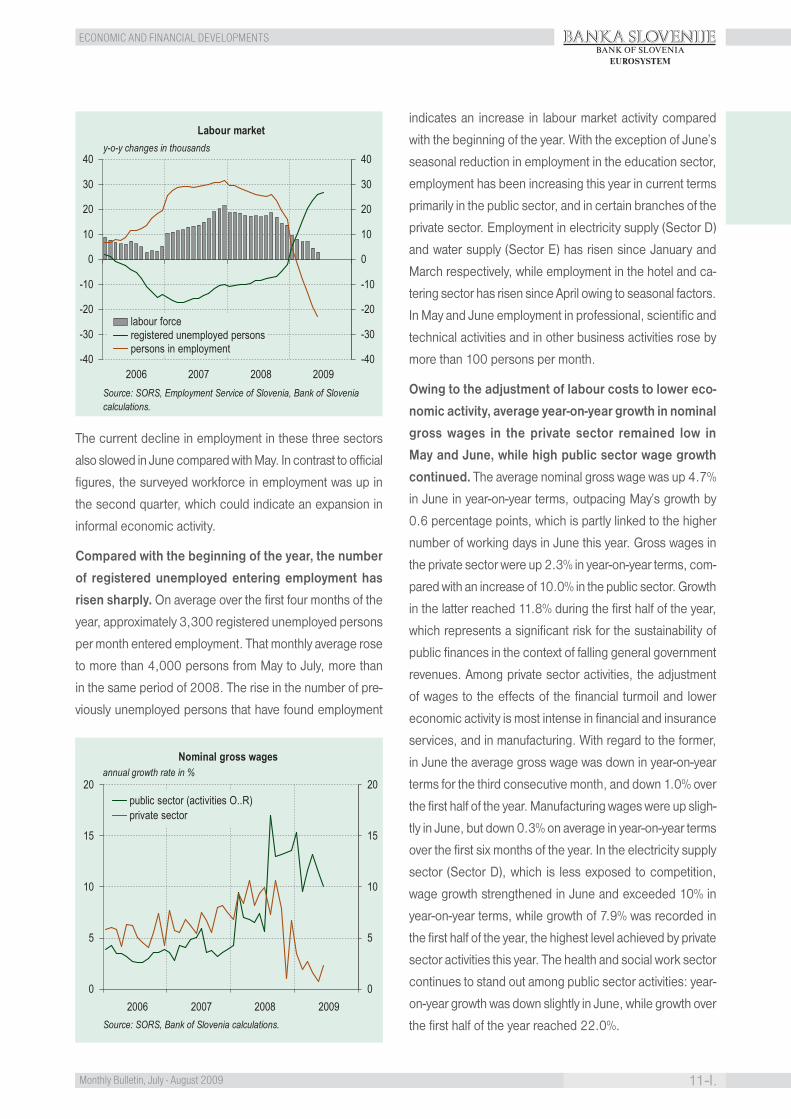
Labour market
Growth in the number of registered unemployed in June
and July was up slightly on May, in part due to seasonal
effects, but remained lower than in the first four months
of the year. The number of registered unemployed was up
2.3% in both months in current terms. In July, in particular,
this was also the result of seasonal factors, as companies
release temporary employees prior to the start of the sum-
mer holiday season. The number of registered unemployed
was up by 22,200 over the first seven months of this year
to reach 88,500 at the end of July, a year-on-year increase
of 43.7%. According to the latest available figures, the re-
gistered unemployment rate reached 9.1% in June, up 0.2
percentage points on May. The surveyed unemployment
rate was also up from 5.4% in the first quarter to 5.6% in
the second quarter.
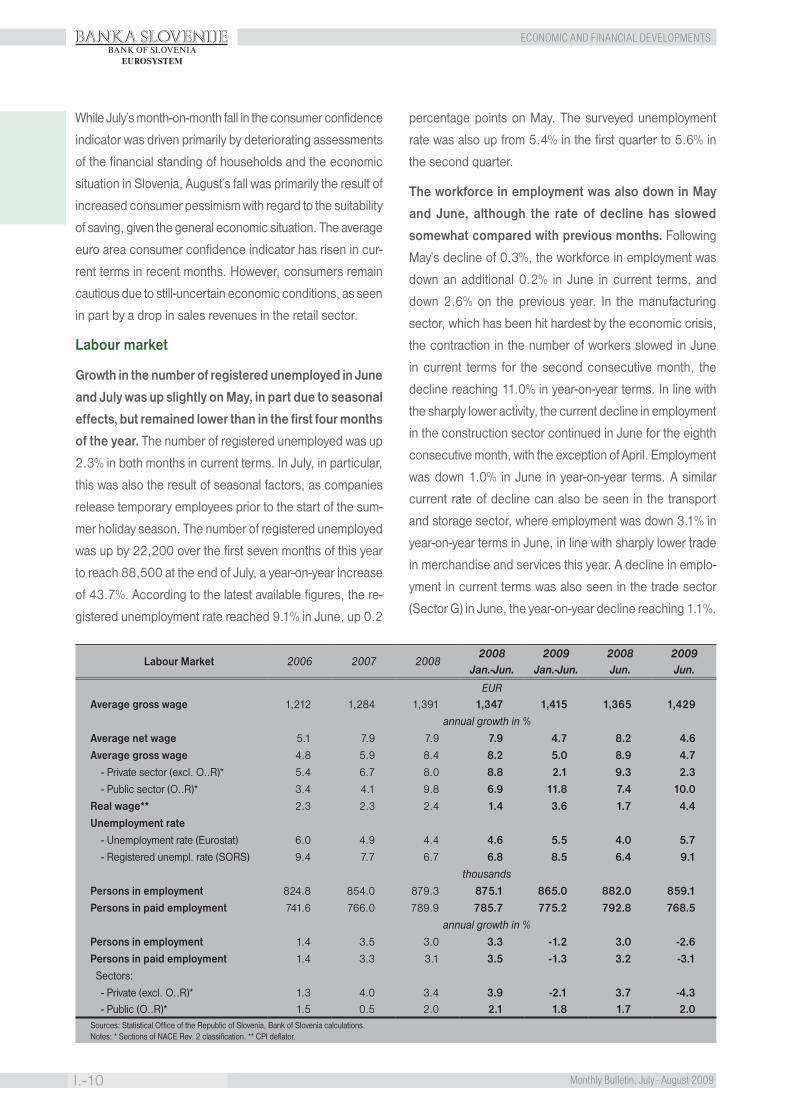
The workforce in employment was also down in May
and June, although the rate of decline has slowed
somewhat compared with previous months. Following
May’s decline of 0.3%, the workforce in employment was
down an additional 0.2% in June in current terms, and
down 2.6% on the previous year. In the manufacturing
sector, which has been hit hardest by the economic crisis,
the contraction in the number of workers slowed in June
in current terms for the second consecutive month, the
decline reaching 11.0% in year-on-year terms. In line with
the sharply lower activity, the current decline in employment
in the construction sector continued in June for the eighth
consecutive month, with the exception of April. Employment
was down 1.0% in June in year-on-year terms. A similar
current rate of decline can also be seen in the transport
and storage sector, where employment was down 3.1% in
year-on-year terms in June, in line with sharply lower trade
in merchandise and services this year. A decline in emplo-
yment in current terms was also seen in the trade sector
(Sector G) in June, the year-on-year decline reaching 1.1%.
Labour Market 2006 2007 2008 2008 2009 2008 2009
Jan.-Jun. Jan.-Jun. Jun. Jun.
EURAverage gross wage 1,212 1,284 1,391 1,347 1,415 1,365 1,429
annual growth in % Average net wage 5.1 7.9 7.9 7.9 4.7 8.2 4.6 Average gross wage 4.8 5.9 8.4 8.2 5.0 8.9 4.7 - Private sector (excl. O..R)* 5.4 6.7 8.0 8.8 2.1 9.3 2.3 - Public sector (O..R)* 3.4 4.1 9.8 6.9 11.8 7.4 10.0 Real wage** 2.3 2.3 2.4 1.4 3.6 1.7 4.4 Unemployment rate - Unemployment rate (Eurostat) 6.0 4.9 4.4 4.6 5.5 4.0 5.7 - Registered unempl. rate (SORS) 9.4 7.7 6.7 6.8 8.5 6.4 9.1
thousands Persons in employment 824.8 854.0 879.3 875.1 865.0 882.0 859.1 Persons in paid employment 741.6 766.0 789.9 785.7 775.2 792.8 768.5
annual growth in % Persons in employment 1.4 3.5 3.0 3.3 -1.2 3.0 -2.6 Persons in paid employment 1.4 3.3 3.1 3.5 -1.3 3.2 -3.1 Sectors: - Private (excl. O..R)* 1.3 4.0 3.4 3.9 -2.1 3.7 -4.3 - Public (O..R)* 1.5 0.5 2.0 2.1 1.8 1.7 2.0 Sources: Statistical Office of the Republic of Slovenia, Bank of Slovenia calculations.Notes: * Sections of NACE Rev. 2 classification. ** CPI deflator.
ECONOMIC AND FINANCIAL DEVELOPMENTS BANKA SLOVENIJE
11-I.Monthly Bulletin, July - August 2009
BANK OF SLOVENIAEUROSYSTEM
The current decline in employment in these three sectors
also slowed in June compared with May. In contrast to official
figures, the surveyed workforce in employment was up in
the second quarter, which could indicate an expansion in
informal economic activity.
Compared with the beginning of the year, the number
of registered unemployed entering employment has
risen sharply. On average over the first four months of the
year, approximately 3,300 registered unemployed persons
per month entered employment. That monthly average rose
to more than 4,000 persons from May to July, more than
in the same period of 2008. The rise in the number of pre-
viously unemployed persons that have found employment
indicates an increase in labour market activity compared
with the beginning of the year. With the exception of June’s
seasonal reduction in employment in the education sector,
employment has been increasing this year in current terms
primarily in the public sector, and in certain branches of the
private sector. Employment in electricity supply (Sector D)
and water supply (Sector E) has risen since January and
March respectively, while employment in the hotel and ca-
tering sector has risen since April owing to seasonal factors.
In May and June employment in professional, scientific and
technical activities and in other business activities rose by
more than 100 persons per month.
Owing to the adjustment of labour costs to lower eco-
nomic activity, average year-on-year growth in nominal
gross wages in the private sector remained low in
May and June, while high public sector wage growth
continued. The average nominal gross wage was up 4.7%
in June in year-on-year terms, outpacing May’s growth by
0.6 percentage points, which is partly linked to the higher
number of working days in June this year. Gross wages in
the private sector were up 2.3% in year-on-year terms, com-
pared with an increase of 10.0% in the public sector. Growth
in the latter reached 11.8% during the first half of the year,
which represents a significant risk for the sustainability of
public finances in the context of falling general government
revenues. Among private sector activities, the adjustment
of wages to the effects of the financial turmoil and lower
economic activity is most intense in financial and insurance
services, and in manufacturing. With regard to the former,
in June the average gross wage was down in year-on-year
terms for the third consecutive month, and down 1.0% over
the first half of the year. Manufacturing wages were up sligh-
tly in June, but down 0.3% on average in year-on-year terms
over the first six months of the year. In the electricity supply
sector (Sector D), which is less exposed to competition,
wage growth strengthened in June and exceeded 10% in
year-on-year terms, while growth of 7.9% was recorded in
the first half of the year, the highest level achieved by private
sector activities this year. The health and social work sector
continues to stand out among public sector activities: year-
on-year growth was down slightly in June, while growth over
the first half of the year reached 22.0%.
0
5
10
15
20
0
5
10
15
20
2006 2007 2008 2009
public sector (activities O..R)private sector
Nominal gross wagesannual growth rate in %
Source: SORS, Bank of Slovenia calculations.
-40
-30
-20
-10
0
10
20
30
40
-40
-30
-20
-10
0
10
20
30
40
2006 2007 2008 2009
labour forceregistered unemployed personspersons in employment
Labour markety-o-y changes in thousands
Source: SORS, Employment Service of Slovenia, Bank of Slovenia calculations.
0
5
10
15
20
0
5
10
15
20
2006 2007 2008 2009
public sector (activities O..R)private sector
Nominal gross wagesannual growth rate in %
Source: SORS, Bank of Slovenia calculations.
-40
-30
-20
-10
0
10
20
30
40
-40
-30
-20
-10
0
10
20
30
40
2006 2007 2008 2009
labour forceregistered unemployed personspersons in employment
Labour markety-o-y changes in thousands
Source: SORS, Employment Service of Slovenia, Bank of Slovenia calculations.
ECONOMIC AND FINANCIAL DEVELOPMENTS
I.-12 Monthly Bulletin, July - August 2009
BANKA SLOVENIJEBANK OF SLOVENIA
EUROSYSTEM
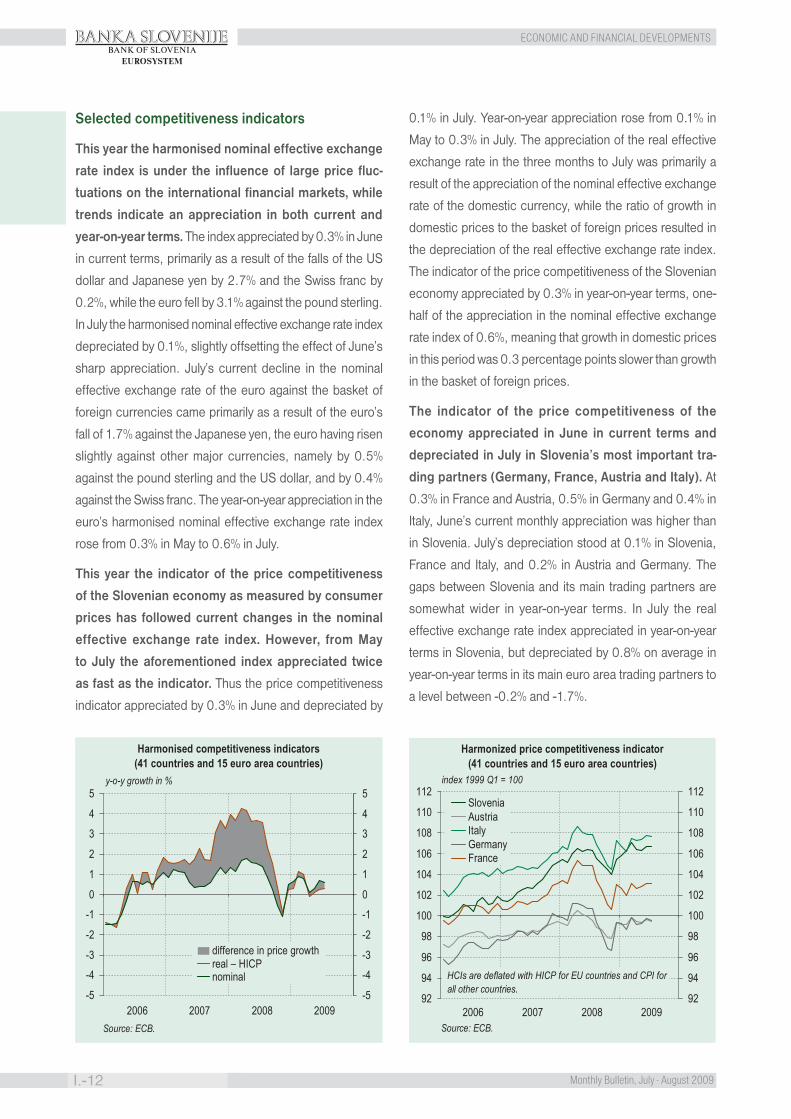
Selected competitiveness indicators
This year the harmonised nominal effective exchange
rate index is under the influence of large price fluc-
tuations on the international financial markets, while
trends indicate an appreciation in both current and
year-on-year terms. The index appreciated by 0.3% in June
in current terms, primarily as a result of the falls of the US
dollar and Japanese yen by 2.7% and the Swiss franc by
0.2%, while the euro fell by 3.1% against the pound sterling.
In July the harmonised nominal effective exchange rate index
depreciated by 0.1%, slightly offsetting the effect of June’s
sharp appreciation. July’s current decline in the nominal
effective exchange rate of the euro against the basket of
foreign currencies came primarily as a result of the euro’s
fall of 1.7% against the Japanese yen, the euro having risen
slightly against other major currencies, namely by 0.5%
against the pound sterling and the US dollar, and by 0.4%
against the Swiss franc. The year-on-year appreciation in the
euro’s harmonised nominal effective exchange rate index
rose from 0.3% in May to 0.6% in July.
This year the indicator of the price competitiveness
of the Slovenian economy as measured by consumer
prices has followed current changes in the nominal
effective exchange rate index. However, from May
to July the aforementioned index appreciated twice
as fast as the indicator. Thus the price competitiveness
indicator appreciated by 0.3% in June and depreciated by
0.1% in July. Year-on-year appreciation rose from 0.1% in
May to 0.3% in July. The appreciation of the real effective
exchange rate in the three months to July was primarily a
result of the appreciation of the nominal effective exchange
rate of the domestic currency, while the ratio of growth in
domestic prices to the basket of foreign prices resulted in
the depreciation of the real effective exchange rate index.
The indicator of the price competitiveness of the Slovenian
economy appreciated by 0.3% in year-on-year terms, one-
half of the appreciation in the nominal effective exchange
rate index of 0.6%, meaning that growth in domestic prices
in this period was 0.3 percentage points slower than growth
in the basket of foreign prices.
The indicator of the price competitiveness of the
economy appreciated in June in current terms and
depreciated in July in Slovenia’s most important tra-
ding partners (Germany, France, Austria and Italy). At
0.3% in France and Austria, 0.5% in Germany and 0.4% in
Italy, June’s current monthly appreciation was higher than
in Slovenia. July’s depreciation stood at 0.1% in Slovenia,
France and Italy, and 0.2% in Austria and Germany. The
gaps between Slovenia and its main trading partners are
somewhat wider in year-on-year terms. In July the real
effective exchange rate index appreciated in year-on-year
terms in Slovenia, but depreciated by 0.8% on average in
year-on-year terms in its main euro area trading partners to
a level between -0.2% and -1.7%.
-5
-4-3
-2
-10
1
2
34
5
-5
-4-3
-2
-10
1
2
34
5
2006 2007 2008 2009
difference in price growthreal – HICPnominal
Harmonised competitiveness indicators(41 countries and 15 euro area countries)
y-o-y growth in %
Source: ECB.
92
94
96
98
100
102
104
106
108
110
112
92
94
96
98
100
102
104
106
108
110
112
2006 2007 2008 2009
SloveniaAustriaItalyGermanyFrance
index 1999 Q1 = 100
Harmonized price competitiveness indicator(41 countries and 15 euro area countries)
Source: ECB.
HCIs are deflated with HICP for EU countries and CPI for all other countries.
-1
0
1
2
3
4
5
6
7
-1
0
1
2
3
4
5
6
7
2006 2007 2008 2009
HICP - SloveniaHICP - euro area
y-o-y growth in %
Inflation
Source: Eurostat.

ECONOMIC AND FINANCIAL DEVELOPMENTS BANKA SLOVENIJE
13-I.Monthly Bulletin, July - August 2009
BANK OF SLOVENIAEUROSYSTEM
Although among the aforementioned partners, Slovenia
is the only country to record year-on-year appreciation
in the real effective exchange rate index this year, its
competitive position improved in relative terms from
April to July with regard to its main trading partners.
From April to July in Slovenia, year-on-year appreciation was
up 0.4 percentage points, while year-on-year depreciation
in its main trading partners was down between 0.8 and 1.1
percentage points over the same period. Year-on-year de-
preciation fell from 2.1% in April to 1.1% in July in Germany,
from 2.6% to 1.7% in France, from 1.3% to 0.2% in Italy,
and from 1.0% to 0.2% in Austria. A slight deterioration in
the year-on-year price competitiveness indicator in Slovenia
with regard to its main trading partners, assuming the same
effect of the nominal effective exchange rate, indicates slo-
wer year-on-year price growth in Slovenia against the basket
of foreign prices than in the trading partners.
3 l Price Developments
Year-on-year inflation as measured by the HICP stood
at 0.1% in August, up 0.7 percentage points on July.
The current inflation rate also rose to 0.1% in August,
while core inflation fell from 1.6% to 1.4%. The higher
year-on-year inflation was primarily the result of higher
current growth in oil prices, and in part, other commodity
prices on global markets. August’s decline of 7.2% in energy
prices was 4.7 percentage points less compared to that in
July, while year-on-year growth in food prices was up 0.6
percentage points to 1.6%. The reasons for rising food
prices lie primarily in a smaller decline in fruit and vegetable
prices compared with last year and rising prices of certain
groups of processed food. In contrast to rising food prices
and the smaller decline in energy prices, growth in prices
of services was down from 3.3% to 3.0%, while growth in
prices of non-energy industrial goods was unchanged from
July at -0.3%. The effects of additional end-of-season sales
of clothing and footwear can be seen in the latter.
The decline in core inflation remains in line with con-
ditions in the domestic macroeconomic environment.
Year-on-year growth in the harmonised index of prices exclu-
ding energy, food, alcohol and tobacco in August was down
92
94
96
98
100
102
104
106
108
110
112
92
94
96
98
100
102
104
106
108
110
112
2006 2007 2008 2009
SloveniaAustriaItalyGermanyFrance
index 1999 Q1 = 100
Harmonized price competitiveness indicator(41 countries and 15 euro area countries)
Source: ECB.
HCIs are deflated with HICP for EU countries and CPI for all other countries.
-1
0
1
2
3
4
5
6
7
-1
0
1
2
3
4
5
6
7
2006 2007 2008 2009
HICP - SloveniaHICP - euro area
y-o-y growth in %
Inflation
Source: Eurostat.
Price Developments Jul.09 Aug.09 Average of last
12 months Aug.08 Aug.09
y-o-y growth, % monthly growth, %HICP -0.6 0.1 1.7 -0.7 0.1 services 3.3 3.0 4.0 0.7 0.4 industrial goods excluding energy -0.3 -0.3 1.5 -0.1 -0.1 food 1.0 1.6 3.0 -1.1 -0.5 energy -11.9 -7.2 -5.0 -4.4 0.6 Core inflation indicators excluding energy 1.4 1.4 2.8 0.0 0.0 excluding energy, food, alcohol, tobacco 1.6 1.4 2.8 0.3 0.2 PPI Jun.09 Jul.09 Jul.08 Jul.09 total -2.4 -3.0 1.3 0.4 -0.2 domestic -0.7 -1.3 2.2 0.5 -0.2 non-domestic -4.0 -4.7 0.4 0.4 -0.3 Sources: SORS, Eurostat, Bank of Slovenia calculations. Note: Figures may not sum up to official figures due to rounding.
ECONOMIC AND FINANCIAL DEVELOPMENTS
I.-14 Monthly Bulletin, July - August 2009
BANKA SLOVENIJEBANK OF SLOVENIA
EUROSYSTEM
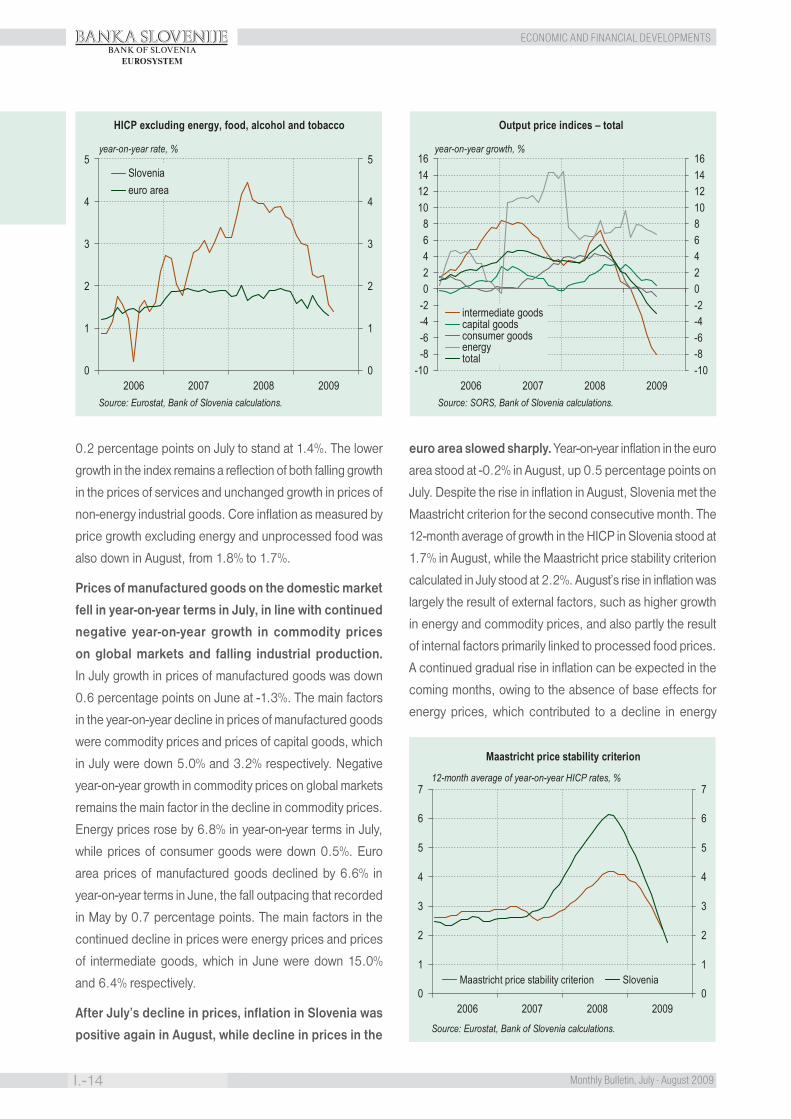
0.2 percentage points on July to stand at 1.4%. The lower
growth in the index remains a reflection of both falling growth
in the prices of services and unchanged growth in prices of
non-energy industrial goods. Core inflation as measured by
price growth excluding energy and unprocessed food was
also down in August, from 1.8% to 1.7%.
Prices of manufactured goods on the domestic market
fell in year-on-year terms in July, in line with continued
negative year-on-year growth in commodity prices
on global markets and falling industrial production.
In July growth in prices of manufactured goods was down
0.6 percentage points on June at -1.3%. The main factors
in the year-on-year decline in prices of manufactured goods
were commodity prices and prices of capital goods, which
in July were down 5.0% and 3.2% respectively. Negative
year-on-year growth in commodity prices on global markets
remains the main factor in the decline in commodity prices.
Energy prices rose by 6.8% in year-on-year terms in July,
while prices of consumer goods were down 0.5%. Euro
area prices of manufactured goods declined by 6.6% in
year-on-year terms in June, the fall outpacing that recorded
in May by 0.7 percentage points. The main factors in the
continued decline in prices were energy prices and prices
of intermediate goods, which in June were down 15.0%
and 6.4% respectively.
After July’s decline in prices, inflation in Slovenia was
positive again in August, while decline in prices in the
euro area slowed sharply. Year-on-year inflation in the euro
area stood at -0.2% in August, up 0.5 percentage points on
July. Despite the rise in inflation in August, Slovenia met the
Maastricht criterion for the second consecutive month. The
12-month average of growth in the HICP in Slovenia stood at
1.7% in August, while the Maastricht price stability criterion
calculated in July stood at 2.2%. August’s rise in inflation was
largely the result of external factors, such as higher growth
in energy and commodity prices, and also partly the result
of internal factors primarily linked to processed food prices.
A continued gradual rise in inflation can be expected in the
coming months, owing to the absence of base effects for
energy prices, which contributed to a decline in energy
0
1
2
3
4
5
0
1
2
3
4
5
2006 2007 2008 2009
Sloveniaeuro area
year-on-year rate, %
HICP excluding energy, food, alcohol and tobacco
Source: Eurostat, Bank of Slovenia calculations.
-10-8-6-4-202468
10121416
year-on-year growth, %
-10-8-6-4-20246810121416
2006 2007 2008 2009
intermediate goodscapital goodsconsumer goodsenergytotal
Output price indices – total
Source: SORS, Bank of Slovenia calculations.
0
1
2
3
4
5
0
1
2
3
4
5
2006 2007 2008 2009
Sloveniaeuro area
year-on-year rate, %
HICP excluding energy, food, alcohol and tobacco
Source: Eurostat, Bank of Slovenia calculations.
-10-8-6-4-202468
10121416
year-on-year growth, %
-10-8-6-4-20246810121416
2006 2007 2008 2009
intermediate goodscapital goodsconsumer goodsenergytotal
Output price indices – total
Source: SORS, Bank of Slovenia calculations.
-8-7-6-5-4-3-2-1012345
-8-7-6-5-4-3-2-1012345
2006 2007 2008 2009
current accountgoodsservicesincome and transfers
Components of current account
12-month moving sum, GDP %
Source: Bank of Slovenia.
0
1
2
3
4
5
6
7
0
1
2
3
4
5
6
7
2006 2007 2008 2009
Maastricht price stability criterion Slovenia
12-month average of year-on-year HICP rates, %
Maastricht price stability criterion
Source: Eurostat, Bank of Slovenia calculations.
ECONOMIC AND FINANCIAL DEVELOPMENTS BANKA SLOVENIJE
15-I.Monthly Bulletin, July - August 2009
BANK OF SLOVENIAEUROSYSTEM
prices in recent months, and in part due to higher growth
in other commodity prices on global markets.
4 l Balance of Payments
Current account
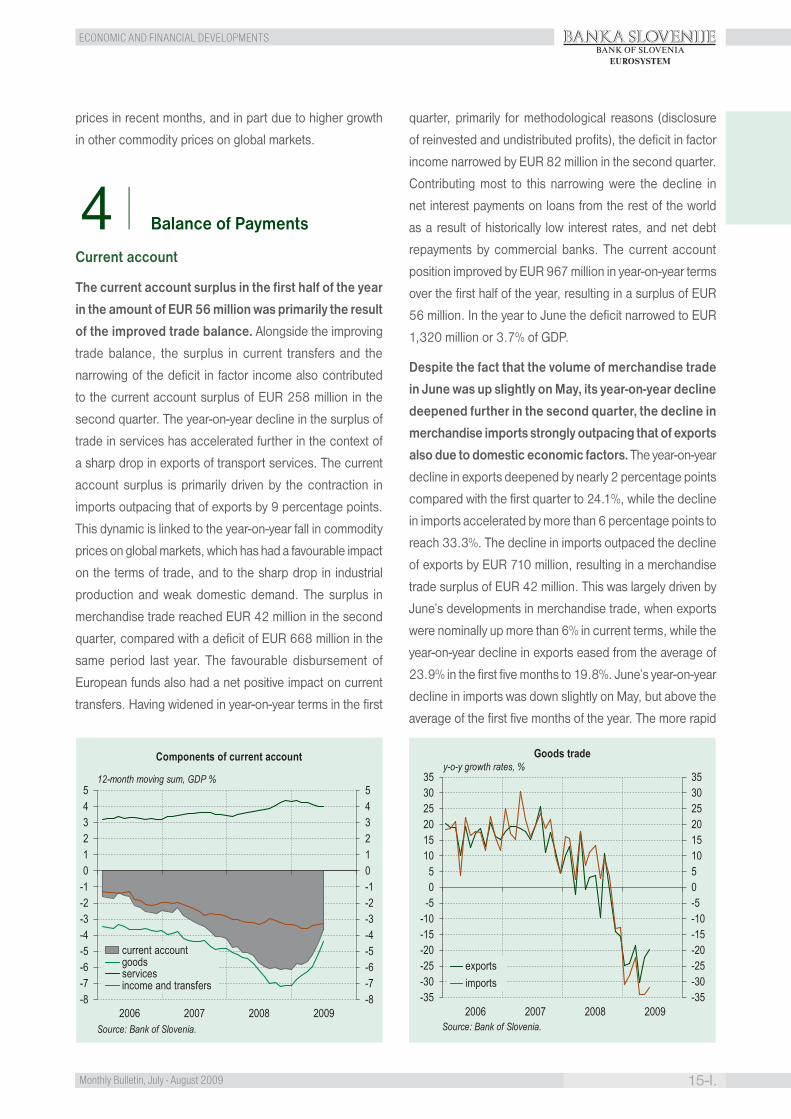
The current account surplus in the first half of the year
in the amount of EUR 56 million was primarily the result
of the improved trade balance. Alongside the improving
trade balance, the surplus in current transfers and the
narrowing of the deficit in factor income also contributed
to the current account surplus of EUR 258 million in the
second quarter. The year-on-year decline in the surplus of
trade in services has accelerated further in the context of
a sharp drop in exports of transport services. The current
account surplus is primarily driven by the contraction in
imports outpacing that of exports by 9 percentage points.
This dynamic is linked to the year-on-year fall in commodity
prices on global markets, which has had a favourable impact
on the terms of trade, and to the sharp drop in industrial
production and weak domestic demand. The surplus in
merchandise trade reached EUR 42 million in the second
quarter, compared with a deficit of EUR 668 million in the
same period last year. The favourable disbursement of
European funds also had a net positive impact on current
transfers. Having widened in year-on-year terms in the first
quarter, primarily for methodological reasons (disclosure
of reinvested and undistributed profits), the deficit in factor
income narrowed by EUR 82 million in the second quarter.
Contributing most to this narrowing were the decline in
net interest payments on loans from the rest of the world
as a result of historically low interest rates, and net debt
repayments by commercial banks. The current account
position improved by EUR 967 million in year-on-year terms
over the first half of the year, resulting in a surplus of EUR
56 million. In the year to June the deficit narrowed to EUR
1,320 million or 3.7% of GDP.
Despite the fact that the volume of merchandise trade
in June was up slightly on May, its year-on-year decline
deepened further in the second quarter, the decline in
merchandise imports strongly outpacing that of exports
also due to domestic economic factors. The year-on-year
decline in exports deepened by nearly 2 percentage points
compared with the first quarter to 24.1%, while the decline
in imports accelerated by more than 6 percentage points to
reach 33.3%. The decline in imports outpaced the decline
of exports by EUR 710 million, resulting in a merchandise
trade surplus of EUR 42 million. This was largely driven by
June’s developments in merchandise trade, when exports
were nominally up more than 6% in current terms, while the
year-on-year decline in exports eased from the average of
23.9% in the first five months to 19.8%. June’s year-on-year
decline in imports was down slightly on May, but above the
average of the first five months of the year. The more rapid
-8-7-6-5-4-3-2-1012345
-8-7-6-5-4-3-2-1012345
2006 2007 2008 2009
current accountgoodsservicesincome and transfers
Components of current account
12-month moving sum, GDP %
Source: Bank of Slovenia.
0
1
2
3
4
5
6
7
0
1
2
3
4
5
6
7
2006 2007 2008 2009
Maastricht price stability criterion Slovenia
12-month average of year-on-year HICP rates, %
Maastricht price stability criterion
Source: Eurostat, Bank of Slovenia calculations.
-35-30-25-20-15-10-505101520253035
-35-30-25-20-15-10
-505
101520253035
2006 2007 2008 2009
exportsimports
Goods trade
Source: Bank of Slovenia.
y-o-y growth rates, %
-400
0
400
800
1,200
1,600
2,000
2,400
2006 2007 2008 2009
exportsimportsgoods trade balance
Goods trade
Source: Bank of Slovenia.
EUR millions

ECONOMIC AND FINANCIAL DEVELOPMENTS
I.-16 Monthly Bulletin, July - August 2009
BANKA SLOVENIJEBANK OF SLOVENIA
EUROSYSTEM
contraction in imports than exports is partly linked to the
year-on-year fall in commodity prices on global markets and
the resulting improvement in the terms of trade, and partly
linked to lower domestic demand. The decline in activity
in the manufacturing and construction sectors and in retail
sector revenues was sharper in Slovenia than in the euro
area overall.
The year-on-year decline in trade in services also dee-
pened in the second quarter. Among major services,
transport services recorded the sharpest decline on
both the import and export sides, indicating continued
weak demand on the domestic and foreign markets.
The year-on-year decline in exports of services deepened by
nearly 6 percentage points, compared with the first quarter,
to reach 17.3%, while the decline in imports accelerated
by more than 6 percentage points to reach 13.8%. Having
declined by 25% in the first quarter, exports of transport
services were down further, by more than one-third, in the
second quarter in year-on-year terms. A similar, but somew-
hat less negative trend can be seen in imports. According
to the latest balance of payments figures, exports of tourism
Balance of Payments 2007 2008 last 12 2008 2009 2008 2009months Jan.-Jun. Jan.-Jun. Jun. Jun.
flows in EUR millionsCurrent account -1,455 -2,287 -1,320 -911 56 -165 133 % of GDP -4.2 -6.2 -3.7 -5.0 0.3 … … Goods and services -473 -1,041 -147 -349 546 -71 198 % of GDP -1.4 -2.8 -0.4 -1.9 3.2 … … Openness coefficient 141 138 124 141 113 … … Exports 24,089 25,089 22,313 12,784 10,009 2,210 1,797 % of GDP 69.9 67.6 62.0 69.6 58.0 … … Goods 19,798 20,048 17,619 10,433 8,004 1,767 1,417 Services 4,291 5,040 4,694 2,351 2,005 444 380 - Tourism 1,811 1,932 1,893 855 816 171 186 - Transportation 1,259 1,437 1,220 721 504 126 83 Imports -24,562 -26,130 -22,460 -13,133 -9,464 -2,281 -1,599 % of GDP -71.3 -70.4 -62.4 -71.5 -54.9 … … Goods -21,464 -22,698 -19,198 -11,590 -8,090 -1,990 -1,357 Services -3,098 -3,431 -3,262 -1,543 -1,374 -291 -242 - Tourism -831 -894 -910 -338 -353 -69 -69 - Transportation -734 -846 -723 -440 -317 -78 -48 Labour income 78 -4 -2 -12 -10 -4 -5 Investment income -786 -1,035 -1,018 -397 -380 -103 -46 Current transfers -274 -206 -154 -153 -101 12 -14
nominal year-on-year growth in %Exports of Goods and Services 16.9 4.1 -11.2 8.9 -21.7 7.0 -18.7 Imports of Goods and Services 18.3 6.4 -13.6 12.2 -27.9 13.2 -29.9 Exports of Goods 16.3 1.3 -13.7 6.4 -23.3 3.2 -19.8 Imports of Goods 18.1 5.7 -15.2 11.3 -30.2 11.1 -31.8 Exports of Services 20.1 17.5 -0.3 21.5 -14.7 25.4 -14.4 Imports of Services 20.1 10.8 -2.5 19.3 -11.0 30.3 -16.9 Source: Bank of Slovenia.
-35-30-25-20-15-10-505101520253035
-35-30-25-20-15-10
-505
101520253035
2006 2007 2008 2009
exportsimports
Goods trade
Source: Bank of Slovenia.
y-o-y growth rates, %
-400
0
400
800
1,200
1,600
2,000
2,400
2006 2007 2008 2009
exportsimportsgoods trade balance
Goods trade
Source: Bank of Slovenia.
EUR millions
ECONOMIC AND FINANCIAL DEVELOPMENTS BANKA SLOVENIJE
17-I.Monthly Bulletin, July - August 2009
BANK OF SLOVENIAEUROSYSTEM
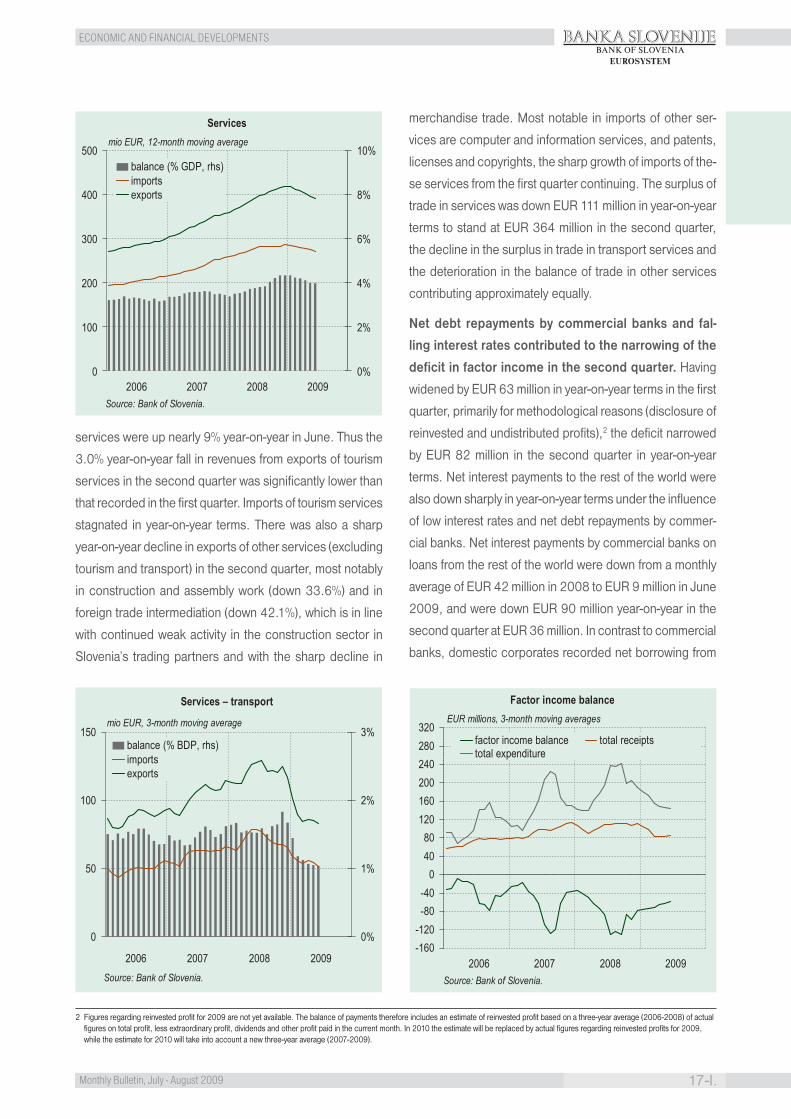
services were up nearly 9% year-on-year in June. Thus the
3.0% year-on-year fall in revenues from exports of tourism
services in the second quarter was significantly lower than
that recorded in the first quarter. Imports of tourism services
stagnated in year-on-year terms. There was also a sharp
year-on-year decline in exports of other services (excluding
tourism and transport) in the second quarter, most notably
in construction and assembly work (down 33.6%) and in
foreign trade intermediation (down 42.1%), which is in line
with continued weak activity in the construction sector in
Slovenia’s trading partners and with the sharp decline in
merchandise trade. Most notable in imports of other ser-
vices are computer and information services, and patents,
licenses and copyrights, the sharp growth of imports of the-
se services from the first quarter continuing. The surplus of
trade in services was down EUR 111 million in year-on-year
terms to stand at EUR 364 million in the second quarter,
the decline in the surplus in trade in transport services and
the deterioration in the balance of trade in other services
contributing approximately equally.
Net debt repayments by commercial banks and fal-
ling interest rates contributed to the narrowing of the
deficit in factor income in the second quarter. Having
widened by EUR 63 million in year-on-year terms in the first
quarter, primarily for methodological reasons (disclosure of
reinvested and undistributed profits),2 the deficit narrowed
by EUR 82 million in the second quarter in year-on-year
terms. Net interest payments to the rest of the world were
also down sharply in year-on-year terms under the influence
of low interest rates and net debt repayments by commer-
cial banks. Net interest payments by commercial banks on
loans from the rest of the world were down from a monthly
average of EUR 42 million in 2008 to EUR 9 million in June
2009, and were down EUR 90 million year-on-year in the
second quarter at EUR 36 million. In contrast to commercial
banks, domestic corporates recorded net borrowing from
2 Figures regarding reinvested profit for 2009 are not yet available. The balance of payments therefore includes an estimate of reinvested profit based on a three-year average (2006-2008) of actual figures on total profit, less extraordinary profit, dividends and other profit paid in the current month. In 2010 the estimate will be replaced by actual figures regarding reinvested profits for 2009, while the estimate for 2010 will take into account a new three-year average (2007-2009).
0
100
200
300
400
500
0%
2%
4%
6%
8%
10%
2006 2007 2008 2009
balance (% GDP, rhs)importsexports
Servicesmio EUR, 12-month moving average
Source: Bank of Slovenia.
-100
-50
0
50
100
150
-4%
-2%
0%
2%
4%
6%
2006 2007 2008 2009
balance (% GDP, rhs)expendituresreceipts
Interest payments on loans
mio EUR, 3-month moving average
Source: Bank of Slovenia.
0
50
100
150
0%
1%
2%
3%
2006 2007 2008 2009
balance (% BDP, rhs)importsexports
Services – transport
mio EUR, 3-month moving average
Source: Bank of Slovenia.
-160-120-80-40
04080
120160200240280320
2006 2007 2008 2009
factor income balance total receiptstotal expenditure
Factor income balance
Source: Bank of Slovenia.
EUR millions, 3-month moving averages
0
100
200
300
400
500
0%
2%
4%
6%
8%
10%
2006 2007 2008 2009
balance (% GDP, rhs)importsexports
Servicesmio EUR, 12-month moving average
Source: Bank of Slovenia.
-100
-50
0
50
100
150
-4%
-2%
0%
2%
4%
6%
2006 2007 2008 2009
balance (% GDP, rhs)expendituresreceipts
Interest payments on loans
mio EUR, 3-month moving average
Source: Bank of Slovenia.
0
50
100
150
0%
1%
2%
3%
2006 2007 2008 2009
balance (% BDP, rhs)importsexports
Services – transport
mio EUR, 3-month moving average
Source: Bank of Slovenia.
-160-120-80-40
04080
120160200240280320
2006 2007 2008 2009
factor income balance total receiptstotal expenditure
Factor income balance
Source: Bank of Slovenia.
EUR millions, 3-month moving averages

ECONOMIC AND FINANCIAL DEVELOPMENTS
I.-18 Monthly Bulletin, July - August 2009
BANKA SLOVENIJEBANK OF SLOVENIA
EUROSYSTEM
the rest of the world in the first six months of 2009, while
their interest payments to the rest of the world were down
slightly, primarily owing to lower interest rates. Net inflows
from investments in bonds and notes were also down, by
EUR 31 million in year-on-year terms to reach EUR 22
million. One-half of the decline was the result of higher net
general government expenditure, linked to this year’s issues
of government bonds. The deficit in factor income stood at
EUR 177 million in the second quarter, and had narrowed to
EUR 1,020 million or 2.8% of GDP for the year to June.
Owing to relatively high inflows from the EU budget in
April and June, a surplus in current transfers of EUR 29
million was recorded in the second quarter, the year-on-
year improvement in the position of private sector trans-
fers also contributing to the surplus. Primarily on account
of February’s high outflow of funds to the EU budget, a deficit
in current transfers of EUR 130 million was recorded in the
first quarter, up EUR 9 million on the same period in 2008.
The net position of the state budget against the EU budget
improved in the second quarter, largely due to April’s inflow
of funds for the implementation of agricultural policy in the
amount of EUR 62 million and June’s inflow of funds in the
amount of EUR 47 million for the implementation of cohesion
policy. The surplus in current transfers in the second quarter
was also the result of the year-on-year improvement in the
balance of private sector transfers in the amount of EUR 28
million, the decline in net insurance payments contributing
nearly two-thirds to the aforementioned improvement. The
position of current transfers stood at EUR -101 million in the
first half of the year, the deficit having narrowed by EUR 53
million in year-on-year terms.
Capital and financial account
In recent months weak economic activity and the
financial turmoil have continued to result in decrea-
sed financing of the private sector in the rest of the
world, which has primarily been offset by government
borrowing in the rest of the world. The private sector’s
net financial outflows totalled EUR 900 million in the first
quarter of this year, and EUR 1,676 million in the second
quarter, while net financial inflows into the government
sector amounted to EUR 441 million and EUR 1,162 million
respectively during the same periods. The largest net inflows
into the government sector were recorded in February and
April as the result of government bond issues.
In recent months the private sector’s liabilities to the
rest of the world have declined rapidly, while claims
were more volatile, having risen in the previous quar-
ter. The private sector’s claims against the rest of the world
declined by EUR 342 million in the first quarter, but rose
by EUR 212 million in the second quarter, while its liabilities
to the rest of the world declined by EUR 1,242 million and
EUR 1,464 million respectively during the same periods.
June’s increase in claims in the amount of EUR 919 million
was primarily the result of an increase in deposits of banks
in the rest of the world, while the decline in liabilities in the
amount of EUR 1,434 million was largely on account of the
repayment of loans to the rest of the world by banks.
The private sector’s increase in claims against the
rest of the world in the second quarter was primarily
on account of an increase in FDI. FDI amounted to EUR
324 million in the second quarter, the highest level recorded
since the second quarter of last year. A negative trend is
present in portfolio investments, which decreased by EUR
431 million in the first quarter and an additional EUR 360
million in the second quarter. Loans to the rest of the world
decreased by EUR 277 million in the first quarter and inc-
reased by EUR 72 million in the second quarter.
All categories of private sector liabilities to the rest
of the world, other than FDI and loans to corporates,
0
100
200
300
400
500
0%
2%
4%
6%
8%
10%
2006 2007 2008 2009
balance (% GDP, rhs)importsexports
Servicesmio EUR, 12-month moving average
Source: Bank of Slovenia.
-100
-50
0
50
100
150
-4%
-2%
0%
2%
4%
6%
2006 2007 2008 2009
balance (% GDP, rhs)expendituresreceipts
Interest payments on loans
mio EUR, 3-month moving average
Source: Bank of Slovenia.
0
50
100
150
0%
1%
2%
3%
2006 2007 2008 2009
balance (% BDP, rhs)importsexports
Services – transport
mio EUR, 3-month moving average
Source: Bank of Slovenia.
-160-120-80-40
04080
120160200240280320
2006 2007 2008 2009
factor income balance total receiptstotal expenditure
Factor income balance
Source: Bank of Slovenia.
EUR millions, 3-month moving averages
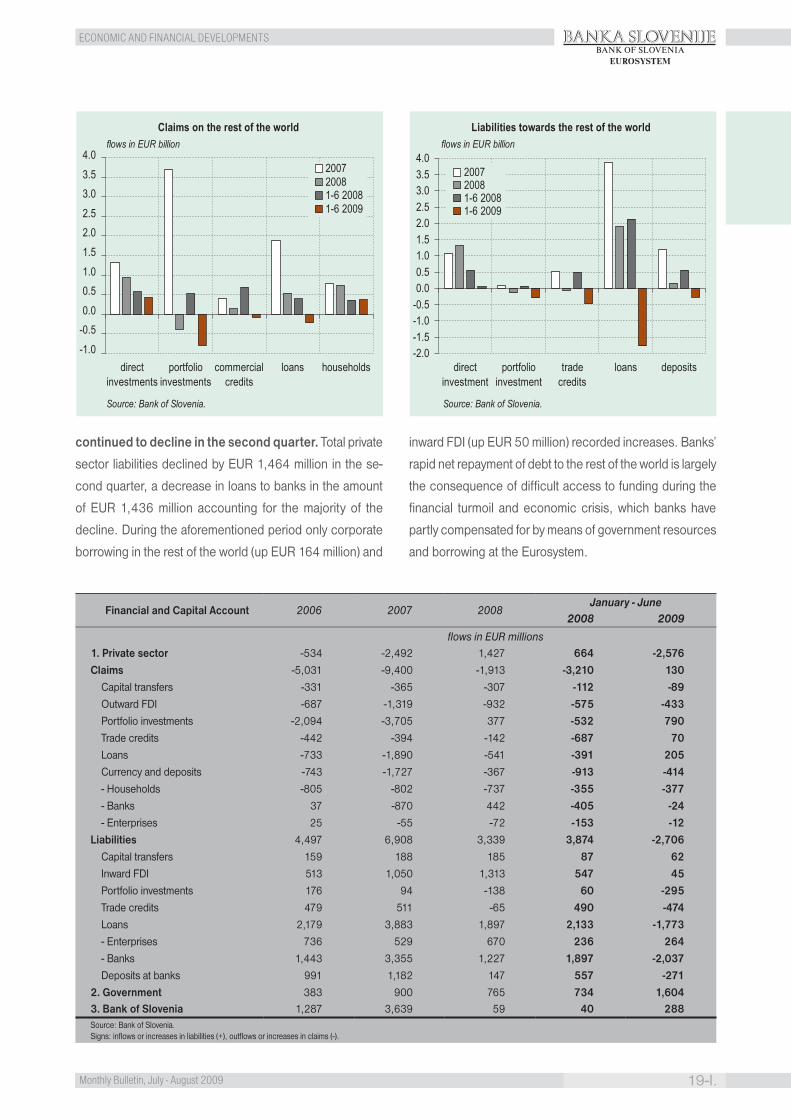
ECONOMIC AND FINANCIAL DEVELOPMENTS BANKA SLOVENIJE
19-I.Monthly Bulletin, July - August 2009
BANK OF SLOVENIAEUROSYSTEM
continued to decline in the second quarter. Total private
sector liabilities declined by EUR 1,464 million in the se-
cond quarter, a decrease in loans to banks in the amount
of EUR 1,436 million accounting for the majority of the
decline. During the aforementioned period only corporate
borrowing in the rest of the world (up EUR 164 million) and
inward FDI (up EUR 50 million) recorded increases. Banks’
rapid net repayment of debt to the rest of the world is largely
the consequence of difficult access to funding during the
financial turmoil and economic crisis, which banks have
partly compensated for by means of government resources
and borrowing at the Eurosystem.
Financial and Capital Account 2006 2007 2008 January - June
2008 2009
flows in EUR millions1. Private sector -534 -2,492 1,427 664 -2,576 Claims -5,031 -9,400 -1,913 -3,210 130 Capital transfers -331 -365 -307 -112 -89 Outward FDI -687 -1,319 -932 -575 -433 Portfolio investments -2,094 -3,705 377 -532 790 Trade credits -442 -394 -142 -687 70 Loans -733 -1,890 -541 -391 205 Currency and deposits -743 -1,727 -367 -913 -414 - Households -805 -802 -737 -355 -377 - Banks 37 -870 442 -405 -24 - Enterprises 25 -55 -72 -153 -12 Liabilities 4,497 6,908 3,339 3,874 -2,706 Capital transfers 159 188 185 87 62 Inward FDI 513 1,050 1,313 547 45 Portfolio investments 176 94 -138 60 -295 Trade credits 479 511 -65 490 -474 Loans 2,179 3,883 1,897 2,133 -1,773 - Enterprises 736 529 670 236 264 - Banks 1,443 3,355 1,227 1,897 -2,037 Deposits at banks 991 1,182 147 557 -271 2. Government 383 900 765 734 1,604 3. Bank of Slovenia 1,287 3,639 59 40 288 Source: Bank of Slovenia.Signs: inflows or increases in liabilities (+), outflows or increases in claims (-).
-2.0-1.5-1.0-0.50.00.51.01.52.02.53.03.54.0
directinvestment
portfolioinvestment
tradecredits
loans deposits
200720081-6 20081-6 2009
Liabilities towards the rest of the worldflows in EUR billion
Source: Bank of Slovenia.
-1.0-0.50.00.51.01.52.02.53.03.54.0
directinvestments
portfolioinvestments
commercialcredits
loans households
200720081-6 20081-6 2009
Claims on the rest of the worldflows in EUR billion
Source: Bank of Slovenia.
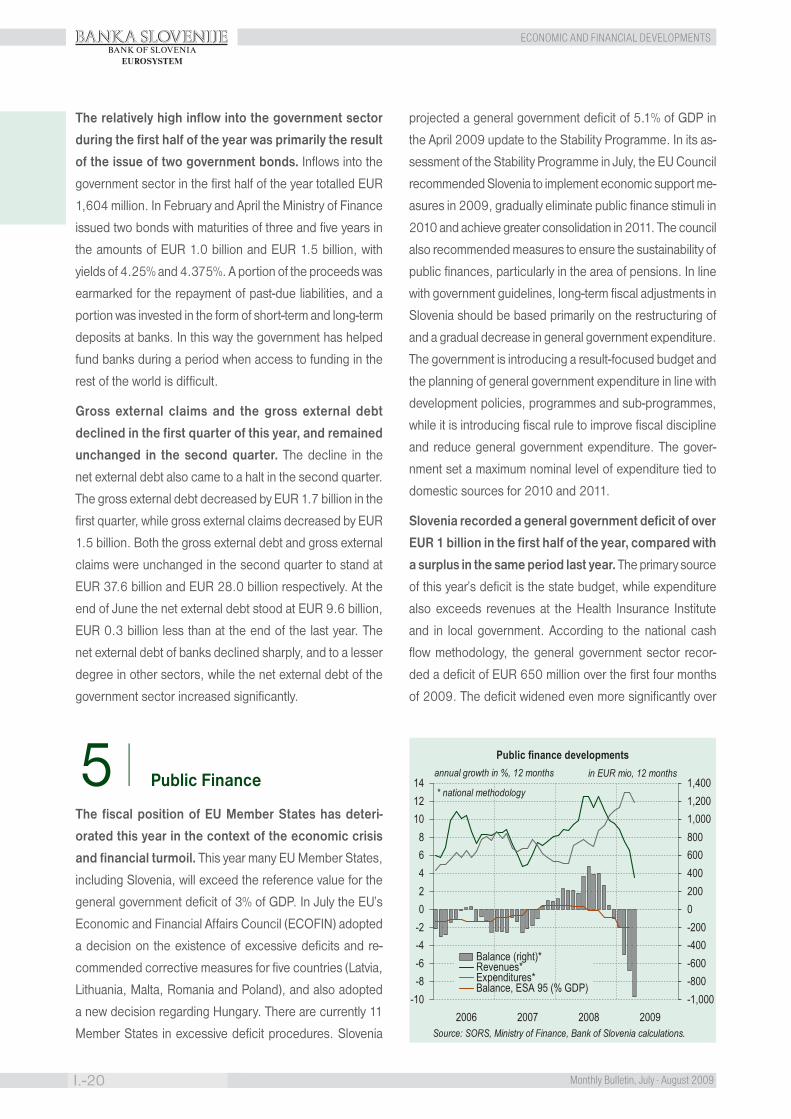
ECONOMIC AND FINANCIAL DEVELOPMENTS
I.-20 Monthly Bulletin, July - August 2009
BANKA SLOVENIJEBANK OF SLOVENIA
EUROSYSTEM
The relatively high inflow into the government sector
during the first half of the year was primarily the result
of the issue of two government bonds. Inflows into the
government sector in the first half of the year totalled EUR
1,604 million. In February and April the Ministry of Finance
issued two bonds with maturities of three and five years in
the amounts of EUR 1.0 billion and EUR 1.5 billion, with
yields of 4.25% and 4.375%. A portion of the proceeds was
earmarked for the repayment of past-due liabilities, and a
portion was invested in the form of short-term and long-term
deposits at banks. In this way the government has helped
fund banks during a period when access to funding in the
rest of the world is difficult.
Gross external claims and the gross external debt
declined in the first quarter of this year, and remained
unchanged in the second quarter. The decline in the
net external debt also came to a halt in the second quarter.
The gross external debt decreased by EUR 1.7 billion in the
first quarter, while gross external claims decreased by EUR
1.5 billion. Both the gross external debt and gross external
claims were unchanged in the second quarter to stand at
EUR 37.6 billion and EUR 28.0 billion respectively. At the
end of June the net external debt stood at EUR 9.6 billion,
EUR 0.3 billion less than at the end of the last year. The
net external debt of banks declined sharply, and to a lesser
degree in other sectors, while the net external debt of the
government sector increased significantly.
5 l Public Finance
The fiscal position of EU Member States has deteri-
orated this year in the context of the economic crisis
and financial turmoil. This year many EU Member States,
including Slovenia, will exceed the reference value for the
general government deficit of 3% of GDP. In July the EU’s
Economic and Financial Affairs Council (ECOFIN) adopted
a decision on the existence of excessive deficits and re-
commended corrective measures for five countries (Latvia,
Lithuania, Malta, Romania and Poland), and also adopted
a new decision regarding Hungary. There are currently 11
Member States in excessive deficit procedures. Slovenia
projected a general government deficit of 5.1% of GDP in
the April 2009 update to the Stability Programme. In its as-
sessment of the Stability Programme in July, the EU Council
recommended Slovenia to implement economic support me-
asures in 2009, gradually eliminate public finance stimuli in
2010 and achieve greater consolidation in 2011. The council
also recommended measures to ensure the sustainability of
public finances, particularly in the area of pensions. In line
with government guidelines, long-term fiscal adjustments in
Slovenia should be based primarily on the restructuring of
and a gradual decrease in general government expenditure.
The government is introducing a result-focused budget and
the planning of general government expenditure in line with
development policies, programmes and sub-programmes,
while it is introducing fiscal rule to improve fiscal discipline
and reduce general government expenditure. The gover-
nment set a maximum nominal level of expenditure tied to
domestic sources for 2010 and 2011.
Slovenia recorded a general government deficit of over
EUR 1 billion in the first half of the year, compared with
a surplus in the same period last year. The primary source
of this year’s deficit is the state budget, while expenditure
also exceeds revenues at the Health Insurance Institute
and in local government. According to the national cash
flow methodology, the general government sector recor-
ded a deficit of EUR 650 million over the first four months
of 2009. The deficit widened even more significantly over
-10-8-6-4-202468
101214
-1,000-800-600-400-20002004006008001,0001,2001,400
2006 2007 2008 2009
Balance (right)*Revenues*Expenditures*Balance, ESA 95 (% GDP)
Public finance developmentsannual growth in %, 12 months in EUR mio, 12 months
* national methodology
Source: SORS, Ministry of Finance, Bank of Slovenia calculations.
ECONOMIC AND FINANCIAL DEVELOPMENTS BANKA SLOVENIJE
21-I.Monthly Bulletin, July - August 2009
BANK OF SLOVENIAEUROSYSTEM
Box 1: Second revision to the state budget for 2009 and budget memorandum for 2010 and 2011 adopted
On 16 July the National Assembly approved the second revision to the state budget for 2009, which envisages a deficit of EUR 1.8 billion or 5.0% of GDP. State budget revenues and expenditure are expected to total EUR 7.9 billion and EUR 9.8 billion respecti-vely this year. The sharp decline in revenues from the previous projection is a reflection of less favourable economic trends, while expenditure is also slightly lower in the revision. Certain measures aimed at mitigating the effects of the crisis were also modified in the revision. According to estimates, less funding will be required for the measure to partly subsidise full-time employment, while a new measure to subsidise the waiting period for employment and de minimis aid are being introduced. Also adopted was the Act on a Special Allowance for the Socially Disadvantaged, based on which the most socially disadvantaged will be paid a special bonus in September in an amount ranging from EUR 80 to EUR 200. EUR 15 million is envisaged for the aforementioned measure. The revision to the Health Insurance Institute’s financial plan envisages a deficit of EUR 125 million. Taking into account the planned deficits of the Health Insurance Institute and local government, and in the context of a balanced position at the Pension and Disability Insurance Institute, this year’s consolidated general government deficit is expected to stand at 5.5% of GDP.
On 27 July the government discussed the draft budget memorandum for the period 2010 to 2013, and introduced fiscal rule to im-prove the control of general government expenditure. With the fiscal rule, the government has established a ceiling for state budget expenditure. The aim of the fiscal rule is to maintain budget expenditure from domestic budget sources (excluding expenses financed from EU budget funds) at the 2009 level in nominal terms until 2011. The aforementioned expenditure is expected to be EUR 8,956 million in 2010 and 2011. The indicative expenditure figures for 2012 (EUR 9,476 million) and 2013 (EUR 9,835 million) were also defined. The state budget deficit is expected to gradually fall below 3% of GDP by 2013. The state budget deficit is estimated at 4.8% of GDP in 2010, 3.5% of GDP in 2011 and 2012, and 2.9% of GDP in 2013. At the end of July the government established a framework level of expenditure in accordance with development policies for the next two years, as the basis for drafting the proposed state budget. On 24 August the government discussed the overall cutting of budget expenditure in accordance with development policies and programmes, and proposed financial plans for 2010 and 2011. The government will submit the proposed state budget for 2010 and 2011 to the National Assembly by the end of September 2009.
Box 2: Implementation of certain guarantee scheme measures
Banks were awarded guarantees in the amount of EUR 310 million, or around one-third of the available quota, as part of the gua-rantee scheme for lending to corporates and cooperatives. The aforementioned quota was divided into three auctions held in June and July. The quotas were EUR 60 million at the first auction (the government assuming a maximum of 40% of the risk), EUR 150 million at the second (maximum 35% risk assumed) and EUR 100 million at the third auction (maximum 33% of risk assumed). The banks awarded the guarantee quota must conclude loan agreements with borrowers with credit ratings of A, B or C, whereby the guaranteed portion of a loan will be covered by the value of the awarded guarantee quota. EUR 133 million in loans to corpora-tes was approved or in the process of approval from the first two auctions, meaning that the quotas from the first two auctions were only partly utilised.
On July 17 2009 the National Assembly adopted the Guarantee Scheme for Natural Persons Act. The government will earmark EUR 350 million in guarantees to banks to cover possible defaults by certain vulnerable groups of the population. The measure is expected to help maintain the current level of consumption. Guarantees in the amount of EUR 300 million are earmarked for the temporary employees and young families defined in the National Housing Saving Scheme Act, with the government assuming risk in the amount of 50% of the loan value. EUR 50 million will be earmarked for those persons who lost their jobs after 1 October 2008, the government assuming 100% of the risk. Priority in the awarding of the guarantee quota will be given to those banks that approve loans with an overall effective interest rate lower than the interest rate set out in the tender. Claimants will be able to receive loans under nearly the same conditions as other borrowers. In the event of default, they will be able to invoke the government guarantee. The government can temporarily suspend the payment of the loan, until the borrowers are once again in a position to repay the loan. SID banka will hold the auctions for banks. The guarantee scheme could take effect in the middle of September 2009. In the event of failure to fulfil loan obligations, recovery will be carried out in line with procedure for the recovery of tax debts for that part of the loan guaranteed by the government. Prior to enforcement, individuals will have the possibility of deferring payment for 24 months and paying by instalments. It will also be possible to write off the debt if the borrower’s social security is threatened. The government will issue guarantees under the aforementioned act until the end of 2010.

ECONOMIC AND FINANCIAL DEVELOPMENTS
I.-22 Monthly Bulletin, July - August 2009
BANKA SLOVENIJEBANK OF SLOVENIA
EUROSYSTEM
the next two months, and exceeded EUR 1 billion during
the first half of this year, according to available figures. The
majority of the deficit was generated by the state budget,
which recorded a deficit of EUR 993 million in the first half
of the year, compared with a surplus of EUR 113 million in
the same period last year. More than one-half of the deficit
envisaged in the second revision to the state budget adopted
on 16 July 2009 was generated in the first half of the year.
The Health Insurance Institute also recorded a deficit of EUR
57 million over the first five months of the year, while local
government recorded a deficit of EUR 45 million over the
first four months of the year. The Health Insurance Institute
and local government are expected to generate a deficit
over the entire year, meaning that the general government
deficit is expected to double to around EUR 2 billion by the
end of the year.
General government revenues remain sharply down on
last year, while certain figures regarding tax and social
contribution payments for June and July point to a
continued slowdown. Tax and contribution payments were
down nearly 8% year-on-year over the first seven months
of the year. The most significant decline was recorded by
corporate income tax, payments of which in the first seven
months of the year were down more than one-half on the
previous year. Payments were particularly low in April and
May, when settlements from the previous year are made. Tax
prepayments in June and July totalled approximately EUR
60 million, down nearly one-third in year-on-year terms. The
sharp decline in prepayments from last year is a reflection
of the further deterioration in economic conditions and
the lowering of the tax rate by 1 percentage point. With
regard to indirect taxes, VAT payments remain low, the fall
in revenues partly offset by higher excise duties. In line with
expectations, payments of contributions continue to slow.
Consolidated general government (GG) accounts
2008 last 12 months to Apr.092008 2009 Jan.-
Apr.09May.09* Jun.09* Jul.09 *
Jan.-Apr. Jan.-Apr.
EUR millions % GDP y-o-y, % EUR millions y-o-y growth, %
Revenue 15,339 14,989 41.1 3.5 4,832 4,482 -7.2 … … … Tax revenue 13,937 13,588 37.3 3.0 4,484 4,135 -7.8 -14.3 -7.0 -3.2 - goods and services 4,805 4,734 13.0 1.6 1,511 1,440 -4.7 -20.0 8.8 -3.5 - social security contributions 5,095 5,191 14.2 8.9 1,622 1,718 5.9 2.8 1.7 1.0 - personal income 2,185 2,217 6.1 18.1 651 683 4.9 -12.3 -36.8 11.2 - corporate income 1,257 936 2.6 -20.9 542 221 -59.3 -56.3 -30.0 -33.6 From EU budget 365 414 1.1 24.8 83 132 58.5 … … … Other 1,036 987 2.7 3.2 265 215 -18.8 … … … Expenditure 15,442 15,957 43.8 11.8 4,617 5,132 11.2 … … … Current expenditure 6,557 6,791 18.6 11.9 2,104 2,338 11.1 … … … - wages and other personnel 3,579 3,760 10.3 13.0 1,097 1,278 16.5 … … … expenditure (incl. contributions) - purchases of goods, services 2,527 2,578 7.1 13.4 708 759 7.2 … … … Current transfers 6,742 6,991 19.2 11.2 2,070 2,319 12.0 … … … - transfers to individuals 5,619 5,794 15.9 11.1 1,748 1,923 10.0 … … … and households Capital expenditure, transfers 1,714 1,740 4.8 15.4 268 294 9.8 … … … To EU budget 428 434 1.2 6.8 175 181 3.6 … … … GG surplus/deficit -103 -968 -2.7 215 -650 Source: Ministry of finance, except: * PPA, Report on classified general government revenues and coverage (B-2); Bank of Slovenia calculations.
The first government-guaranteed bond was issued in July, while the government also issued a guarantee to one additional bank. On 16 July 2009 NLB issued a government-guaranteed bond. The 3-year bond was issued in the amount of EUR 1.5 billion, with a coupon rate of 3.25%. The bond yield at issue was set at 105 basis points above the mid swap rate. Abanka Vipa d.d. also received a guarantee for liabilities arising from the issue of a bond on the international financial market in the amount of EUR 750 million. The bank is obliged to pay a commission on the issued guarantee in the amount 100 basis points annually on the total nominal value of the issued bond.
ECONOMIC AND FINANCIAL DEVELOPMENTS BANKA SLOVENIJE
23-I.Monthly Bulletin, July - August 2009
BANK OF SLOVENIAEUROSYSTEM
Given labour market conditions, such trends are expected to
continue in the coming months or until the end of the year.
Having increased by more than one-tenth in year-on-year
terms last year, and by an additional 7% in the first quarter of
this year, growth in payments of social contributions halved
in the second quarter, and July’s payments were only slightly
higher than last year. The latter is the result of a decrease in
employment, which subsidies earmarked to preserve jobs
only partly limit, while year-on-year wage growth continues
to slow. Growth in personal income tax prepayments on
earnings also continues to slow in year-on-year terms.
Growth in general government expenditure remains
high owing to the financing of assumed liabilities, the
effects of a new wage system and measures linked to
the crisis. General government expenditure was up 11.2%
over the first four months of the year, expenditure on wages,
subsidies and transfers to the unemployed recording the hi-
ghest growth. Expenditure on wages and contributions was
up 16.5% over the first four months of the year. Alongside
growth in the number of public sector employees, growth in
expenditure on wages and contributions was primarily the
result of past wage adjustments, particularly those aimed
at eliminating wage discrepancies. Year-on-year growth will
decline significantly in the second half of the year owing
to a base effect. Expenditure on subsidies was also up.
At the beginning of August, 669 employers with 60,396
employees were included in the measure to partly subsidise
full-time employment, with subsidies approved in the amount
of EUR 30 million. An additional 130 applications are be-
ing processed. With the entry into force of the new Partial
Subsidisation of Full-Time Employment Act on 25 July, the
deadline for submission of applications for subsidies was
extended until the end of March 2010, while the period for
receiving subsidies was extended by six months. Some
110 agreements involving 4,666 workers were signed and
slightly less than EUR 12 million approved for the subsi-
disation of wage compensation while employees wait for
work. An additional 129 applications are being processed.
Figures for the realisation of the state budget in May and
June, and figures from the Health Insurance Institute and
the Pension and Disability Insurance Institute for May point
to continued growth in general government expenditure in
the aforementioned months, albeit less than in the first four
months of the year according to available figures.
Expenditure on transfers to individuals and households
rose slightly faster in year-on-year terms in the second
quarter compared with the first, primarily as a reflection
of unfavourable labour market conditions. Transfers
to the unemployed recorded the largest increase among
transfers to individuals and households. The number of
registered unemployed was up one-third on last December,
and even more in year-on-year terms, hence the increase
in payments to the unemployed. Approximately one-third of
the registered unemployed were entitled to benefit payments
in May, the unemployed receiving average gross benefits
of EUR 560. Payments of welfare benefits were also up. A
sharp increase has also been recorded by other transfers
from the state budget to individuals, which include payments
of subsidies for student meals and day care payments for
a second and each additional child, if more than one child
from the same family attends day care at the same time. In
May reimbursements were made in the amount of EUR 22
million for investments in the public telecommunications
network. Pension expenditure was up around 9% in the
second quarter, similar to the first quarter. The number of
old age pensioners was up 3.3% in May, while the total
number of pensioners was up 1.6%.
Both Slovenia’s debt and contingent liabilities have
risen sharply this year. Slovenia’s borrowing in the first
half of this year was significantly higher than in previous
years. The reasons for the borrowing lie in the financing of
budget implementation, the financing of measures related
to the crisis and pre-financing for the repayment of principal
on the general government debt. Borrowing in the amount
of EUR 3,473 million was realised in the first half of the year
(Ministry of Finance: State Budget Implementation Report
for the period January to June 2009). The government is-
sued two bonds, the first in February in the amount of EUR
1 billion, and the second in April in the amount of EUR 1.5
billion. Two issues of 12-month treasury bills were relea-
sed in January and March in the total amount of EUR 739
million. In line with the first revision to the programme for
financing the state budget for 2009, the borrowing ceiling
for this year is EUR 4,962 million. The issue of an additional
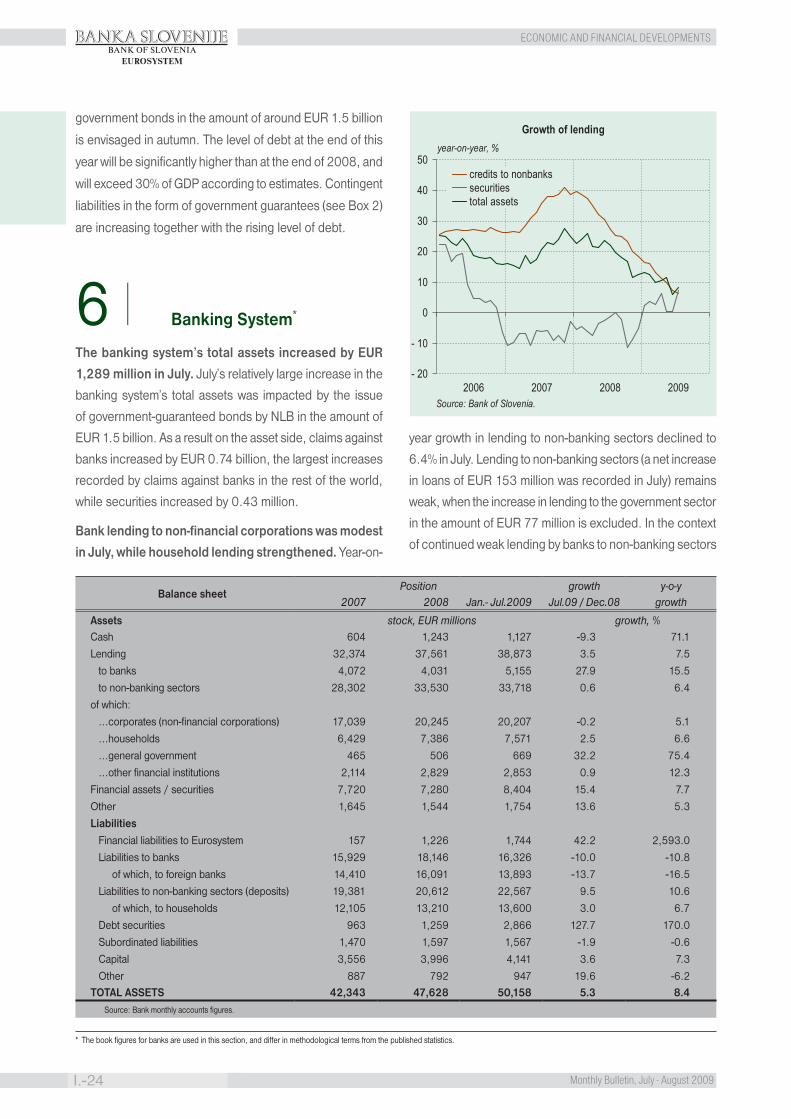
ECONOMIC AND FINANCIAL DEVELOPMENTS
I.-24 Monthly Bulletin, July - August 2009
BANKA SLOVENIJEBANK OF SLOVENIA
EUROSYSTEM
government bonds in the amount of around EUR 1.5 billion
is envisaged in autumn. The level of debt at the end of this
year will be significantly higher than at the end of 2008, and
will exceed 30% of GDP according to estimates. Contingent
liabilities in the form of government guarantees (see Box 2)
are increasing together with the rising level of debt.
6 l Banking System*
The banking system’s total assets increased by EUR
1,289 million in July. July’s relatively large increase in the
banking system’s total assets was impacted by the issue
of government-guaranteed bonds by NLB in the amount of
EUR 1.5 billion. As a result on the asset side, claims against
banks increased by EUR 0.74 billion, the largest increases
recorded by claims against banks in the rest of the world,
while securities increased by 0.43 million.
Bank lending to non-financial corporations was modest
in July, while household lending strengthened. Year-on-
year growth in lending to non-banking sectors declined to
6.4% in July. Lending to non-banking sectors (a net increase
in loans of EUR 153 million was recorded in July) remains
weak, when the increase in lending to the government sector
in the amount of EUR 77 million is excluded. In the context
of continued weak lending by banks to non-banking sectors
* The book figures for banks are used in this section, and differ in methodological terms from the published statistics.
- 20
- 10
0
10
20
30
40
50
2006 2007 2008 2009
credits to nonbankssecuritiestotal assets
Growth of lendingyear-on-year, %
Source: Bank of Slovenia.
Balance sheetPosition growth y-o-y
2007 2008 Jan.- Jul.2009 Jul.09 / Dec.08 growth
Assets stock, EUR millions growth, % Cash 604 1,243 1,127 -9.3 71.1 Lending 32,374 37,561 38,873 3.5 7.5 to banks 4,072 4,031 5,155 27.9 15.5 to non-banking sectors 28,302 33,530 33,718 0.6 6.4 of which: …corporates (non-financial corporations) 17,039 20,245 20,207 -0.2 5.1 …households 6,429 7,386 7,571 2.5 6.6 …general government 465 506 669 32.2 75.4 …other financial institutions 2,114 2,829 2,853 0.9 12.3 Financial assets / securities 7,720 7,280 8,404 15.4 7.7 Other 1,645 1,544 1,754 13.6 5.3 Liabilities Financial liabilities to Eurosystem 157 1,226 1,744 42.2 2,593.0 Liabilities to banks 15,929 18,146 16,326 -10.0 -10.8 of which, to foreign banks 14,410 16,091 13,893 -13.7 -16.5 Liabilities to non-banking sectors (deposits) 19,381 20,612 22,567 9.5 10.6 of which, to households 12,105 13,210 13,600 3.0 6.7 Debt securities 963 1,259 2,866 127.7 170.0 Subordinated liabilities 1,470 1,597 1,567 -1.9 -0.6 Capital 3,556 3,996 4,141 3.6 7.3 Other 887 792 947 19.6 -6.2 TOTAL ASSETS 42,343 47,628 50,158 5.3 8.4 Source: Bank monthly accounts figures.
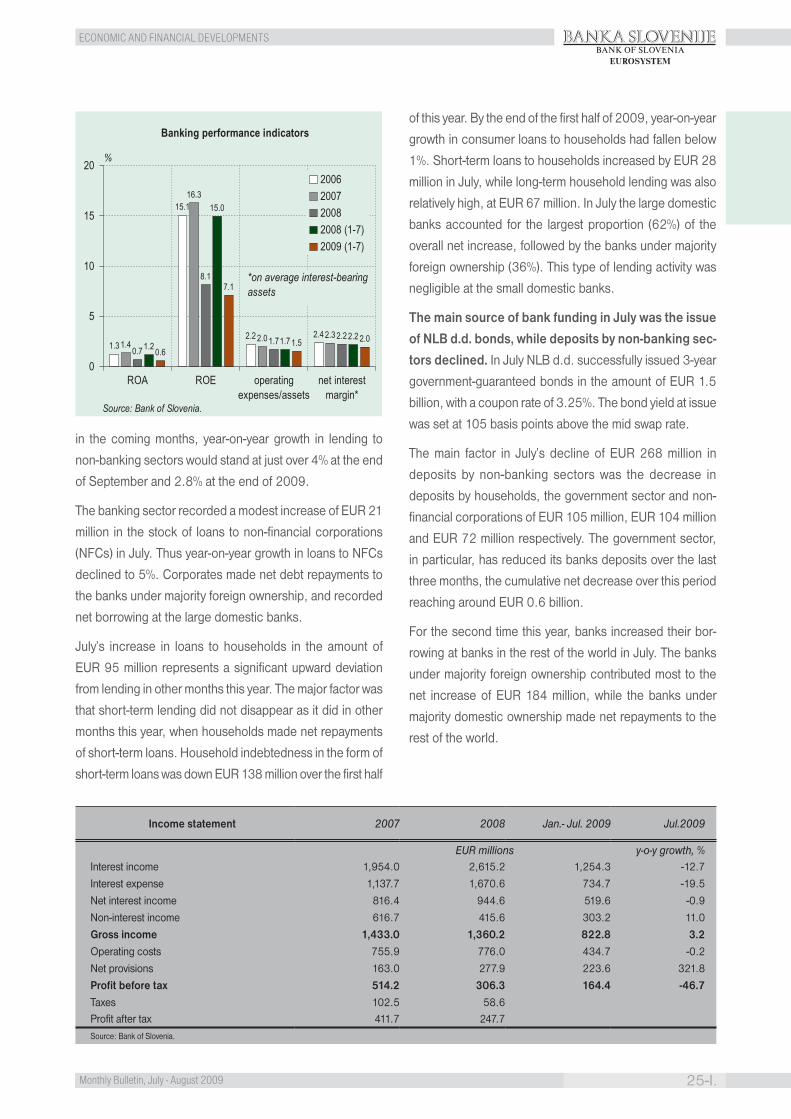
ECONOMIC AND FINANCIAL DEVELOPMENTS BANKA SLOVENIJE
25-I.Monthly Bulletin, July - August 2009
BANK OF SLOVENIAEUROSYSTEM
in the coming months, year-on-year growth in lending to
non-banking sectors would stand at just over 4% at the end
of September and 2.8% at the end of 2009.
The banking sector recorded a modest increase of EUR 21
million in the stock of loans to non-financial corporations
(NFCs) in July. Thus year-on-year growth in loans to NFCs
declined to 5%. Corporates made net debt repayments to
the banks under majority foreign ownership, and recorded
net borrowing at the large domestic banks.
July’s increase in loans to households in the amount of
EUR 95 million represents a significant upward deviation
from lending in other months this year. The major factor was
that short-term lending did not disappear as it did in other
months this year, when households made net repayments
of short-term loans. Household indebtedness in the form of
short-term loans was down EUR 138 million over the first half
of this year. By the end of the first half of 2009, year-on-year
growth in consumer loans to households had fallen below
1%. Short-term loans to households increased by EUR 28
million in July, while long-term household lending was also
relatively high, at EUR 67 million. In July the large domestic
banks accounted for the largest proportion (62%) of the
overall net increase, followed by the banks under majority
foreign ownership (36%). This type of lending activity was
negligible at the small domestic banks.
The main source of bank funding in July was the issue
of NLB d.d. bonds, while deposits by non-banking sec-
tors declined. In July NLB d.d. successfully issued 3-year
government-guaranteed bonds in the amount of EUR 1.5
billion, with a coupon rate of 3.25%. The bond yield at issue
was set at 105 basis points above the mid swap rate.
The main factor in July’s decline of EUR 268 million in
deposits by non-banking sectors was the decrease in
deposits by households, the government sector and non-
financial corporations of EUR 105 million, EUR 104 million
and EUR 72 million respectively. The government sector,
in particular, has reduced its banks deposits over the last
three months, the cumulative net decrease over this period
reaching around EUR 0.6 billion.
For the second time this year, banks increased their bor-
rowing at banks in the rest of the world in July. The banks
under majority foreign ownership contributed most to the
net increase of EUR 184 million, while the banks under
majority domestic ownership made net repayments to the
rest of the world.
1.3
15.1
2.2 2.41.4
16.3
2.0 2.3
8.1
1.7 2.21.2
15.0
1.7 2.2
0.6
7.1
1.5 2.00.7
0
5
10
15
20
ROA ROE operatingexpenses/assets
net interestmargin*
2006200720082008 (1-7)2009 (1-7)
*on average interest-bearing assets
Banking performance indicators
%
Source: Bank of Slovenia.
Income statement 2007 2008 Jan.- Jul. 2009 Jul.2009
EUR millions y-o-y growth, %Interest income 1,954.0 2,615.2 1,254.3 -12.7 Interest expense 1,137.7 1,670.6 734.7 -19.5 Net interest income 816.4 944.6 519.6 -0.9 Non-interest income 616.7 415.6 303.2 11.0 Gross income 1,433.0 1,360.2 822.8 3.2 Operating costs 755.9 776.0 434.7 -0.2 Net provisions 163.0 277.9 223.6 321.8 Profit before tax 514.2 306.3 164.4 -46.7 Taxes 102.5 58.6 Profit after tax 411.7 247.7 Source: Bank of Slovenia.

ECONOMIC AND FINANCIAL DEVELOPMENTS
I.-26 Monthly Bulletin, July - August 2009
BANKA SLOVENIJEBANK OF SLOVENIA
EUROSYSTEM
The banking system’s pre-tax profit remains down on
the same period last year, owing to significantly higher
impairment and provisioning costs. At EUR 164 million
over the first seven months of the year, the banking system’s
profit was down 47%. Growth in banks’ net interest remains
negative, resulting in a lower interest margin than last year.
Net non-interest income is up 11% this year, driven by gains
from financial assets and liabilities held for trading in the
amount of EUR 46 million, while the same balance sheet
items generated net losses in the amount of EUR 40 million
in the same period last year. The main factor in the lower
pre-tax profit compared with the same period last year is
increased impairment and provisioning costs, which stood
at EUR 224 million at the end of July, an increase of EUR
171 million on the same period last year. This year’s total
operating costs are comparable to those recorded last year.
The banking system’s ROE is down one-half on the same
period last year, at 7.1%.
The government’s guarantee scheme took effect in the
second half of June. Under this scheme the government
assumes a portion of the banking system’s corporate lending
risk. The scheme is in effect until the end of 2010, or until
the sum of EUR 1.2 billion set by law has been exhausted.
SID banka allocated the government guarantees through
three auctions, at which banks bid on the portion of risk
that they are prepared to assume. Taking into account the
portion of risk tied to bids received at the three auctions, the
government will “assume risk” in the amount of EUR 309.8
million, and banks in the amount of EUR 831.7 million.
The maximum value of bank loans based on the guarantee
scheme is EUR 1,141.5 million. To what extent the potential
guarantee amount will be exploited depends on factors
that affect credit supply (e.g. lending terms, the adequacy
of bank funding) and demand (e.g. volume, interest rate
levels, margin, maturity, the indebtedness of the borrower
and possible methods of loan collateralisation).
7 l Domestic Financial Markets
The average monthly market yield on German long-
term government securities rose by 10 basis points in
June, while that on Slovenian government securities
declined by 7 basis points. The spread thus narrowed
to 122 basis points. In May the expectations of market
participants regarding the economic recovery prevailed
over specific negative information. The US S&P stock
market index rose by 5.3%, while the western European
DJ EuroStoxx index rose by 3.3%. By mid-June the former
had fallen by 0.9% and the latter by 3.0% due to releases
of negative economic results.
3.0
3.5
4.0
4.5
5.0
5.5
2006 2007 2008 2009
GermanySlovenia
in %Harmonised long-term interest rates*
* Secondary market yields ofgovernment bonds with maturitiesof close to ten years.
Source: Bank of Slovenia, ECB.
0
5
10
15
20
25
30
35
0.0
0.5
1.0
1.5
2.0
2.5
3.0
3.5
2006 2007 2008 2009
Market cap. sharesMarket cap. bondsTR shares (right)TR total (right)
The Ljubljana Stock Exchange:Market capitalisation and turnover ratio*
EUR billion, ratio (right)
* TR – turnover ratio;monthly turnover divided bymarket capitalisation at the end of period.
Source: Ljubljana Stock Exchange.
3.0
3.5
4.0
4.5
5.0
5.5
2006 2007 2008 2009
GermanySlovenia
in %Harmonised long-term interest rates*
* Secondary market yields ofgovernment bonds with maturitiesof close to ten years.
Source: Bank of Slovenia, ECB.
0
5
10
15
20
25
30
35
0.0
0.5
1.0
1.5
2.0
2.5
3.0
3.5
2006 2007 2008 2009
Market cap. sharesMarket cap. bondsTR shares (right)TR total (right)
The Ljubljana Stock Exchange:Market capitalisation and turnover ratio*
EUR billion, ratio (right)
* TR – turnover ratio;monthly turnover divided bymarket capitalisation at the end of period.
Source: Ljubljana Stock Exchange.
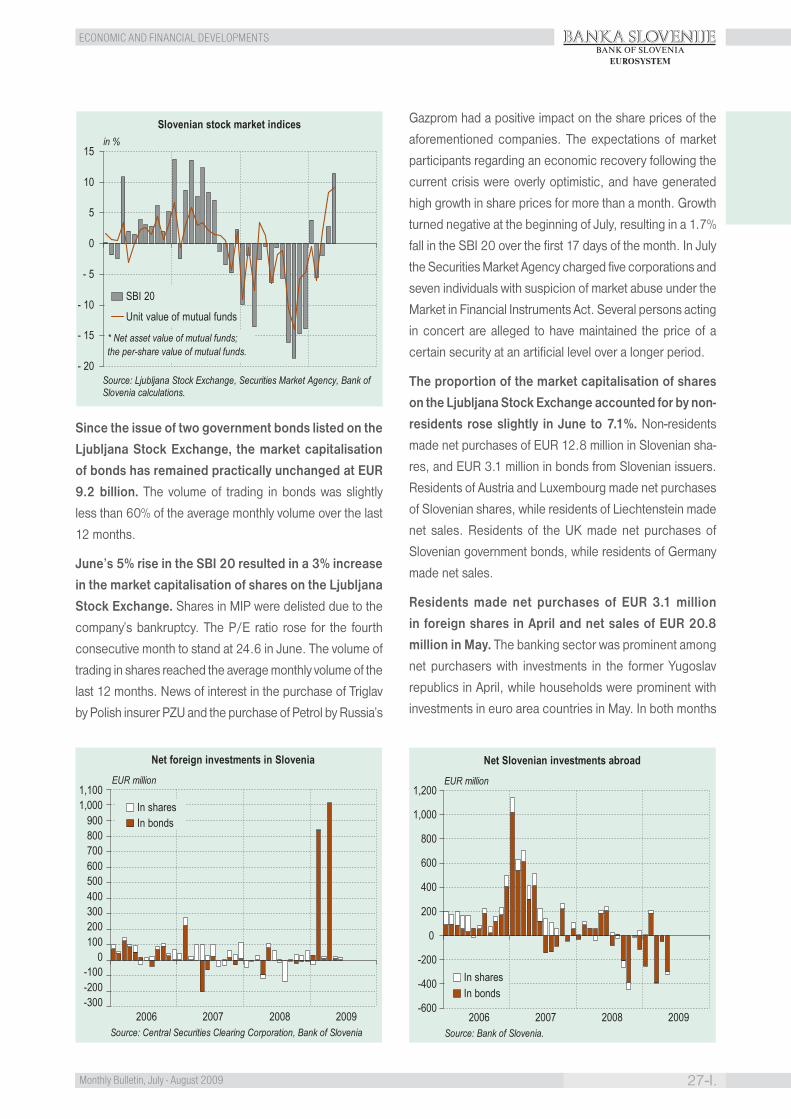
ECONOMIC AND FINANCIAL DEVELOPMENTS BANKA SLOVENIJE
27-I.Monthly Bulletin, July - August 2009
BANK OF SLOVENIAEUROSYSTEM
Since the issue of two government bonds listed on the
Ljubljana Stock Exchange, the market capitalisation
of bonds has remained practically unchanged at EUR
9.2 billion. The volume of trading in bonds was slightly
less than 60% of the average monthly volume over the last
12 months.
June’s 5% rise in the SBI 20 resulted in a 3% increase
in the market capitalisation of shares on the Ljubljana
Stock Exchange. Shares in MIP were delisted due to the
company’s bankruptcy. The P/E ratio rose for the fourth
consecutive month to stand at 24.6 in June. The volume of
trading in shares reached the average monthly volume of the
last 12 months. News of interest in the purchase of Triglav
by Polish insurer PZU and the purchase of Petrol by Russia’s
Gazprom had a positive impact on the share prices of the
aforementioned companies. The expectations of market
participants regarding an economic recovery following the
current crisis were overly optimistic, and have generated
high growth in share prices for more than a month. Growth
turned negative at the beginning of July, resulting in a 1.7%
fall in the SBI 20 over the first 17 days of the month. In July
the Securities Market Agency charged five corporations and
seven individuals with suspicion of market abuse under the
Market in Financial Instruments Act. Several persons acting
in concert are alleged to have maintained the price of a
certain security at an artificial level over a longer period.
The proportion of the market capitalisation of shares
on the Ljubljana Stock Exchange accounted for by non-
residents rose slightly in June to 7.1%. Non-residents
made net purchases of EUR 12.8 million in Slovenian sha-
res, and EUR 3.1 million in bonds from Slovenian issuers.
Residents of Austria and Luxembourg made net purchases
of Slovenian shares, while residents of Liechtenstein made
net sales. Residents of the UK made net purchases of
Slovenian government bonds, while residents of Germany
made net sales.
Residents made net purchases of EUR 3.1 million
in foreign shares in April and net sales of EUR 20.8
million in May. The banking sector was prominent among
net purchasers with investments in the former Yugoslav
republics in April, while households were prominent with
investments in euro area countries in May. In both months
- 20
- 15
- 10
- 5
0
5
10
15
SBI 20
Unit value of mutual funds
Slovenian stock market indicesin %
Source: Ljubljana Stock Exchange, Securities Market Agency, Bank of Slovenia calculations.
* Net asset value of mutual funds; the per-share value of mutual funds.
-300-200-100
0100200300400500600700800900
1,0001,100
2006 2007 2008 2009
In sharesIn bonds
EUR million
Net foreign investments in Slovenia
Source: Central Securities Clearing Corporation, Bank of Slovenia
-600
-400
-200
0
200
400
600
800
1,000
1,200
2006 2007 2008 2009
In sharesIn bonds
EUR million
Net Slovenian investments abroad
Source: Bank of Slovenia.
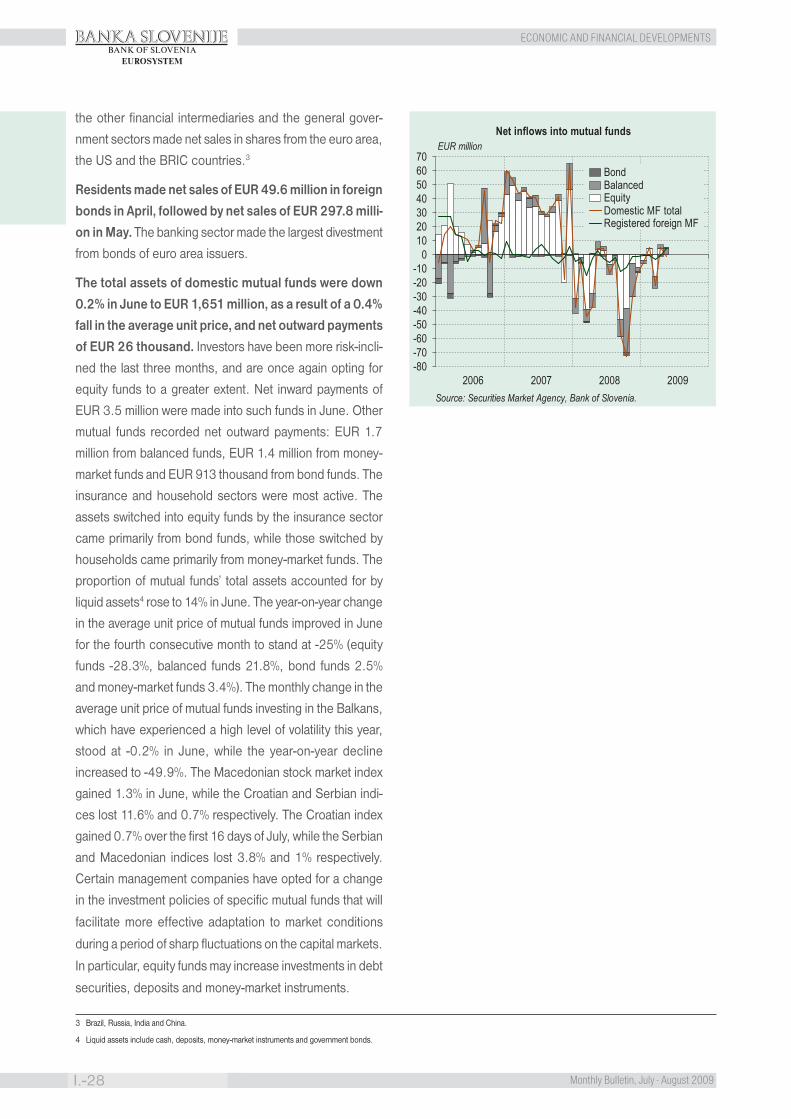
ECONOMIC AND FINANCIAL DEVELOPMENTS
I.-28 Monthly Bulletin, July - August 2009
BANKA SLOVENIJEBANK OF SLOVENIA
EUROSYSTEM
the other financial intermediaries and the general gover-
nment sectors made net sales in shares from the euro area,
the US and the BRIC countries.3
Residents made net sales of EUR 49.6 million in foreign
bonds in April, followed by net sales of EUR 297.8 milli-
on in May. The banking sector made the largest divestment
from bonds of euro area issuers.
The total assets of domestic mutual funds were down
0.2% in June to EUR 1,651 million, as a result of a 0.4%
fall in the average unit price, and net outward payments
of EUR 26 thousand. Investors have been more risk-incli-
ned the last three months, and are once again opting for
equity funds to a greater extent. Net inward payments of
EUR 3.5 million were made into such funds in June. Other
mutual funds recorded net outward payments: EUR 1.7
million from balanced funds, EUR 1.4 million from money-
market funds and EUR 913 thousand from bond funds. The
insurance and household sectors were most active. The
assets switched into equity funds by the insurance sector
came primarily from bond funds, while those switched by
households came primarily from money-market funds. The
proportion of mutual funds’ total assets accounted for by
liquid assets4 rose to 14% in June. The year-on-year change
in the average unit price of mutual funds improved in June
for the fourth consecutive month to stand at -25% (equity
funds -28.3%, balanced funds 21.8%, bond funds 2.5%
and money-market funds 3.4%). The monthly change in the
average unit price of mutual funds investing in the Balkans,
which have experienced a high level of volatility this year,
stood at -0.2% in June, while the year-on-year decline
increased to -49.9%. The Macedonian stock market index
gained 1.3% in June, while the Croatian and Serbian indi-
ces lost 11.6% and 0.7% respectively. The Croatian index
gained 0.7% over the first 16 days of July, while the Serbian
and Macedonian indices lost 3.8% and 1% respectively.
Certain management companies have opted for a change
in the investment policies of specific mutual funds that will
facilitate more effective adaptation to market conditions
during a period of sharp fluctuations on the capital markets.
In particular, equity funds may increase investments in debt
securities, deposits and money-market instruments.
EUR million
-80-70-60-50-40-30-20-10
010203040506070
2006 2007 2008 2009
BondBalancedEquityDomestic MF totalRegistered foreign MF
Net inflows into mutual funds
Source: Securities Market Agency, Bank of Slovenia.
3 Brazil, Russia, India and China.
4 Liquid assets include cash, deposits, money-market instruments and government bonds.
BANKA SLOVENIJE
1-II.Monthly Bulletin, July - August 2009
STATISTICAL TABLESBANK OF SLOVENIA
EUROSYSTEM
II. STATISTICAL TABLES
1.1.1.1.2.1.3.1.4.1.5.1.6.1.7.
2.2.1.2.2.2.3.2.3.1.
2.4.1.
2.4.2.
2.4.3.
2.4.4.
2.5.2.6.2.7.2.8.2.9.1a.2.9.1b.2.9.2a.2.9.2b.2.10.2.11.2.12.2.13.2.14.2.15.2.16.
3.3.1.3.2.3.3.3.4.3.5.3.6.1.3.6.2.
Money and Monetary Financial InstitutionsMonetary AggregatesConsolidated Balance Sheet of Monetary Financial InstitutionsBalance Sheet of the Bank of SloveniaBalance Sheet of Other Monetary Financial InstitutionsSelected Assets of Other Monetary Financial Institutions by SectorSelected Obligations of Other Monetary Financial Institutions by SectorBalance Sheet of the Bank of Slovenia - instruments
Financial Markets and Payment SystemsBank of Slovenia Interest RatesInterbank Money Market Rates and Indexation ClausesEuropean Central Bank Interest RatesHarmonised Long-term Interest Ratesfor Convergence Assessment PurposesMonetary Financial Institutions - Interest rates on Outstanding Amountsin Domestic CurrencyMonetary Financial Institutions - Interest Rates and Volumes on New Depositsin Domestic CurrencyMonetary Financial Institutions - Interest Rates and Volumes on New Loansto Households in Domestic CurrencyMonetary Financial Institutions - Interest Rates and Volumes on New Loansto Non-financial corporations in Domestic CurrencyGovernment Securities RatesThe Ljubljana Stock Exchange: Turnover by Market Segment and Type of SecuritiesThe Ljubljana Stock Exchange: Market Capitalisation and Turnover RatioThe Ljubljana Stock Exchange: Slovenian Stock Exchange Index and Bond IndexSelected Bank of Slovenia Exchange Rates - Average Rates to 31.12.2006Selected Bank of Slovenia Exchange Rates - End of Month Rates to 31.12.2006European Central Bank exchange rates - Average RatesEuropean Central Bank exchange rates - End of Month RatesTARGET and Giro Clearing transactionsPayment CardsOther Payment Instruments and Innovative Payment SchemesElectronic BankingCredit TransfersDebit TransfersNetwork of Commercial Banks
Balance of Payments and External PositionBalance of Payments 1988-1993Balance of PaymentsCurrent Account by countriesCapital and Financial Account by countriesTrade in goods by countriesInternational Investment Position of Slovenia – AssetsInternational Investment Position of Slovenia - Liabilities
BANKA SLOVENIJE
II.-2 Monthly Bulletin, July - August 2009
STATISTICAL TABLESBANK OF SLOVENIA
EUROSYSTEM
3.7.1.3.7.2.3.8.3.9.3.10.3.11.3.12.
4.4.1.4.2.4.3.4.4.4.5.4.6.4.7.4.8.
5.5.1.5.2.5.3.5.4.5.5.5.6.
6.6.1.6.2.6.3.6.4.6.5.6.6.6.7.6.8.6.9.6.10.6.11.6.12.6.13.6.14.6.15.6.16.6.17.6.18.
International Investment Position by countries - AssetsInternational Investment Position by countries - LiabilitiesNet external debt position 1994 - 2000Net external debt positionGross External Debt 1994 - 2000Gross External DebtInternational reserves
Public FinanceNon-financial and Financial Accounts (ESA 95) of the General Government sectorNon-financial Account of the General Government sector (ESA 95)Non-financial Account of the General Government sector - share in GDP (ESA 95)Financial Account of the General Government sector (ESA 95)Financial Account of the General Government sector - share in GDP (ESA 95)Revenues and Expenditures of the General GovernmentLending, Repayments and Financing of the General GovernmentCentral budget debt
Financial AccountsNon-consolidated financial assets - outstanding amountsNon-consolidated liabilities - outstanding amountsNet financial assetsNon-consolidated transactions in financial assetsNon-consolidated transactions in liabilitiesNet financial transactions
Non-Financial Accounts and General Economic StatisticsExpenditure on gross domestic productExpenditure on gross domestic product (growth rates)Gross domestic product by activityGross domestic product by activity (growth rates)Industrial production indexIndustrial production index (growth rates)Turnover and new orders in industryTurnover and new orders in industry (growth rates)Business tendency and consumer surveys (part 1)Business tendency and consumer surveys (part 2)Employment by Labour Force Survey (ILO)Unemployment by Labour Force Survey (ILO)Average Wages and SalariesNominal effective exchange rate and Real harmonised competitiveness indicatorsConsumer price indexConsumer price index (growth rates)Industrial producer price indexIndustrial producer price index (growth rates)
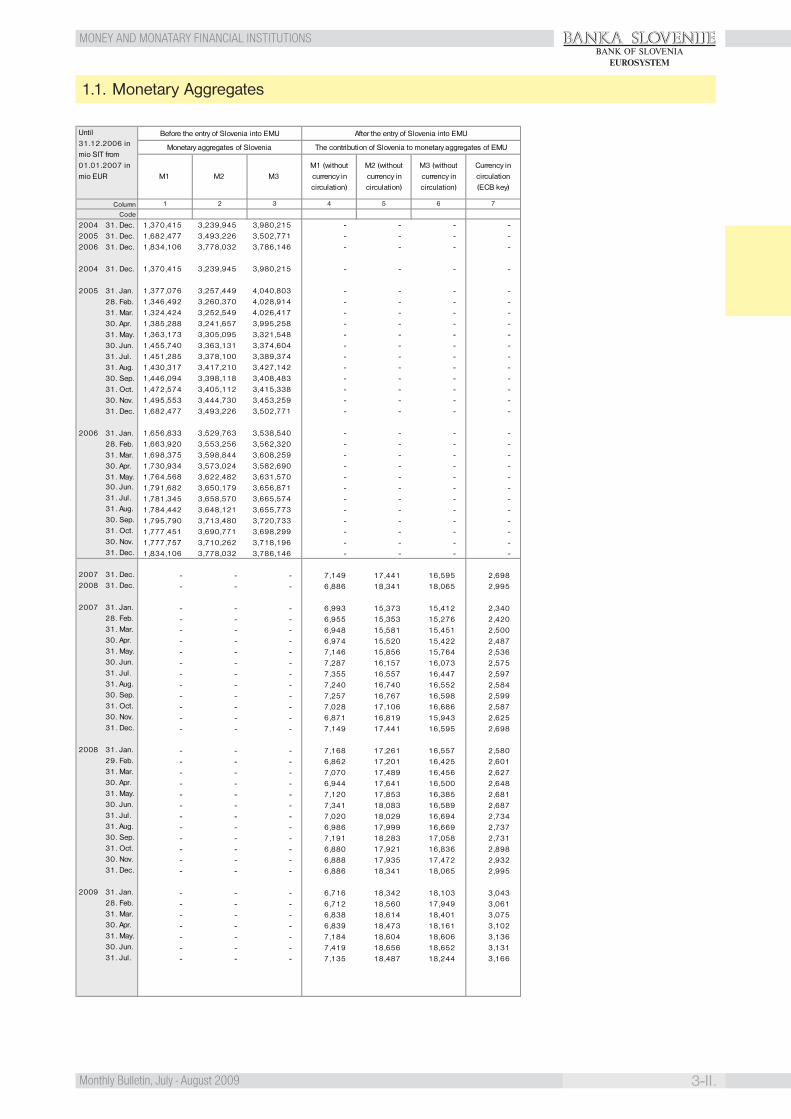
BANKA SLOVENIJE
3-II.Monthly Bulletin, July - August 2009
MONEY AND MONATARY FINANCIAL INSTITUTIONSBANK OF SLOVENIA
EUROSYSTEM
1.1. Monetary Aggregates
Column
Code
2004 31. Dec. 1,370,415 3,239,945 3,980,215 - - - -2005 31. Dec. 1,682,477 3,493,226 3,502,771 - - - -2006 31. Dec. 1,834,106 3,778,032 3,786,146 - - - -
2004 31. Dec. 1,370,415 3,239,945 3,980,215 - - - -
2005 31. Jan. 1,377,076 3,257,449 4,040,803 - - - -28. Feb. 1,346,492 3,260,370 4,028,914 - - - -31. Mar. 1,324,424 3,252,549 4,026,417 - - - -30. Apr. 1,385,288 3,241,657 3,995,258 - - - -31. May. 1,363,173 3,305,095 3,321,548 - - - -30. Jun. 1,455,740 3,363,131 3,374,604 - - - -31. Jul. 1,451,285 3,378,100 3,389,374 - - - -31. Aug. 1,430,317 3,417,210 3,427,142 - - - -30. Sep. 1,446,094 3,398,118 3,408,483 - - - -31. Oct. 1,472,574 3,405,112 3,415,338 - - - -30. Nov. 1,495,553 3,444,730 3,453,259 - - - -31. Dec. 1,682,477 3,493,226 3,502,771 - - - -
2006 31. Jan. 1,656,833 3,529,763 3,538,540 - - - -28. Feb. 1,663,920 3,553,256 3,562,320 - - - -31. Mar. 1,698,375 3,598,844 3,608,259 - - - -30. Apr. 1,730,934 3,573,024 3,582,690 - - - -31. May. 1,764,568 3,622,482 3,631,570 - - - -30. Jun. 1,791,682 3,650,179 3,656,871 - - - -31. Jul. 1,781,345 3,658,570 3,665,574 - - - -31. Aug. 1,784,442 3,648,121 3,655,773 - - - -30. Sep. 1,795,790 3,713,480 3,720,733 - - - -31. Oct. 1,777,451 3,690,771 3,698,299 - - - -30. Nov. 1,777,757 3,710,262 3,718,196 - - - -31. Dec. 1,834,106 3,778,032 3,786,146 - - - -
2007 31. Dec. - - - 7,149 17,441 16,595 2,6982008 31. Dec. - - - 6,886 18,341 18,065 2,995
2007 31. Jan. - - - 6,993 15,373 15,412 2,34028. Feb. - - - 6,955 15,353 15,276 2,42031. Mar. - - - 6,948 15,581 15,451 2,50030. Apr. - - - 6,974 15,520 15,422 2,48731. May. - - - 7,146 15,856 15,764 2,53630. Jun. - - - 7,287 16,157 16,073 2,57531. Jul. - - - 7,355 16,557 16,447 2,59731. Aug. - - - 7,240 16,740 16,552 2,58430. Sep. - - - 7,257 16,767 16,598 2,59931. Oct. - - - 7,028 17,106 16,686 2,58730. Nov. - - - 6,871 16,819 15,943 2,62531. Dec. - - - 7,149 17,441 16,595 2,698
2008 31. Jan. - - - 7,168 17,261 16,557 2,58029. Feb. - - - 6,862 17,201 16,425 2,60131. Mar. - - - 7,070 17,489 16,456 2,62730. Apr. - - - 6,944 17,641 16,500 2,64831. May. - - - 7,120 17,853 16,385 2,68130. Jun. - - - 7,341 18,083 16,589 2,68731. Jul. - - - 7,020 18,029 16,694 2,73431. Aug. - - - 6,986 17,999 16,669 2,73730. Sep. - - - 7,191 18,283 17,058 2,73131. Oct. - - - 6,880 17,921 16,836 2,89830. Nov. - - - 6,888 17,935 17,472 2,93231. Dec. - - - 6,886 18,341 18,065 2,995
2009 31. Jan. - - - 6,716 18,342 18,103 3,04328. Feb. - - - 6,712 18,560 17,949 3,06131. Mar. - - - 6,838 18,614 18,401 3,07530. Apr. - - - 6,839 18,473 18,161 3,10231. May. - - - 7,184 18,604 18,606 3,13630. Jun. - - - 7,419 18,656 18,652 3,13131. Jul. - - - 7,135 18,487 18,244 3,166
Until 31.12.2006 in mio SIT from 01.01.2007 in mio EUR
1 2
Before the entry of Slovenia into EMU
M1 M2 M3
Monetary aggregates of Slovenia
3
M1 (without currency in circulation)
M2 (without currency in circulation)
M3 (without currency in circulation)
Currency in circulation (ECB key)
7
After the entry of Slovenia into EMU
The contribution of Slovenia to monetary aggregates of EMU
4 5 6

BANKA SLOVENIJE
II.-4 Monthly Bulletin, July - August 2009
MONEY AND MONETARY FINANCIAL INSTITUTIONSBANK OF SLOVENIA
EUROSYSTEM
1.2. Consolidated Balance Sheet of Monetary Financial Institutions
Loans
ColumnCode
2004 31.Dec. 1,553,852 509,937 2,063,789 25,891 301,577 426,617 36,481 0 764,6752005 31.Dec. 1,637,708 848,375 2,486,083 17,423 140,707 639,815 23,141 - 803,6632006 31.Dec. 1,290,334 1,182,156 2,472,490 16,591 131,884 644,754 24,940 - 801,579
2007 31.Dec. 5,591 9,735 15,326 67 401 1,966 118 - 2,4862008 31.Dec. 5,350 9,280 14,630 68 373 1,789 212 - 2,374
2008 31.May 5,931 10,009 15,940 66 440 1,722 129 - 2,29230.Jun. 5,765 10,929 16,693 65 344 1,708 133 - 2,18431.Jul. 5,702 10,690 16,392 66 338 1,692 136 - 2,16731.Aug. 5,692 10,734 16,426 66 372 1,697 143 - 2,21130.Sep. 5,459 10,094 15,553 67 341 1,705 178 - 2,22431.Oct. 5,544 9,952 15,496 69 333 1,725 184 - 2,24230.Nov. 5,600 9,439 15,039 69 415 1,761 181 - 2,35731.Dec. 5,350 9,280 14,630 68 373 1,789 212 - 2,374
2009 31.Jan. 5,424 8,966 14,390 69 426 2,278 223 - 2,92728.Feb. 4,459 9,323 13,782 87 601 2,267 229 - 3,09631.Mar. 4,419 8,759 13,178 103 454 2,681 233 - 3,36730.Apr. 4,441 9,002 13,443 121 450 2,838 243 - 3,53131.May 4,464 9,430 13,894 140 585 2,956 254 - 3,79630.Jun. 4,769 8,380 13,149 142 486 2,986 251 - 3,72331.Jul. 4,808 9,584 14,392 151 544 2,911 257 - 3,712
Claims on domestic non-MFIsClaims on foreign sectors (foreign assets)
Total
Claims of other MFIs on general government
Central government
Until 31.12.2006 in mio SIT from 01.01.2007 in mio EUR
TotalClaims of the
Bank of SloveniaClaims of other
MFIs
Claims of the Bank of Slovenia
on central government
Assets
Other government
Securities Loans Securities
7 8 9=5+..+8652 43=1+21
Column
Code
2004 31.Dec. 1,652 1,161,434 1,163,086 197,738 1,194,410 6,486 2,760 9,246 1,401,3942005 31.Dec. 2,061 2,062,303 2,064,364 217,313 1,491,012 2,847 2,690 5,537 1,713,8622006 31.Dec. 3,738 2,649,902 2,653,641 172,771 1,694,551 5,048 1,345 6,393 1,873,715
2007 31.Dec. 3,560 16,217 19,777 2,947 7,057 47 6 53 10,0572008 31.Dec. 3,603 17,879 21,482 3,255 6,799 37 6 43 10,097
2008 31.May 3,544 17,591 21,135 2,870 7,044 31 5 36 9,95030.Jun. 3,602 18,784 22,385 2,899 7,247 47 5 52 10,19831.Jul. 3,652 18,693 22,345 2,934 6,942 31 5 36 9,91331.Aug. 3,814 18,886 22,700 2,921 6,916 25 6 30 9,86730.Sep. 3,618 18,490 22,108 2,923 7,111 34 6 40 10,07531.Oct. 3,532 18,762 22,294 3,107 6,793 41 6 47 9,94730.Nov. 3,759 18,014 21,773 3,122 6,804 35 6 41 9,96831.Dec. 3,603 17,879 21,482 3,255 6,799 37 6 43 10,097
2009 31.Jan. 3,672 17,689 21,361 3,247 6,633 37 6 43 9,92328.Feb. 2,737 17,286 20,023 3,256 6,632 34 5 39 9,92731.Mar. 2,976 17,020 19,996 3,277 6,761 33 5 39 10,07730.Apr. 2,767 16,443 19,209 3,328 6,762 31 6 37 10,12731.May 3,071 16,722 19,794 3,338 7,100 33 9 41 10,47930.Jun. 3,717 15,374 19,091 3,348 7,336 31 7 38 10,72131.Jul. 3,486 17,070 20,556 3,387 7,051 29 9 38 10,476
LiabilitiesUntil 31.12.2006 in mio SIT from 01.01.2007 in mio EUR Banknotes and coins and overnight deposits
Banknotes and coins (after
1.1.2007 ECB key)
Other government sector (Central
government excluded)
Non-monetary financial
institutionsTotal
5 6 7 8=6+7
Other MFIs Total Overnight deposits at other
MFIs
Banknotes and coins and instruments up to 2 years
Overnight deposits at the Bank of Slovenia
Banknotes and coins and deposits up to 2 years
Obligations to foreign sectors (foreign liabilities)
Bank of Slovenia
9=4+5+81 2 3=1+2 4
Total
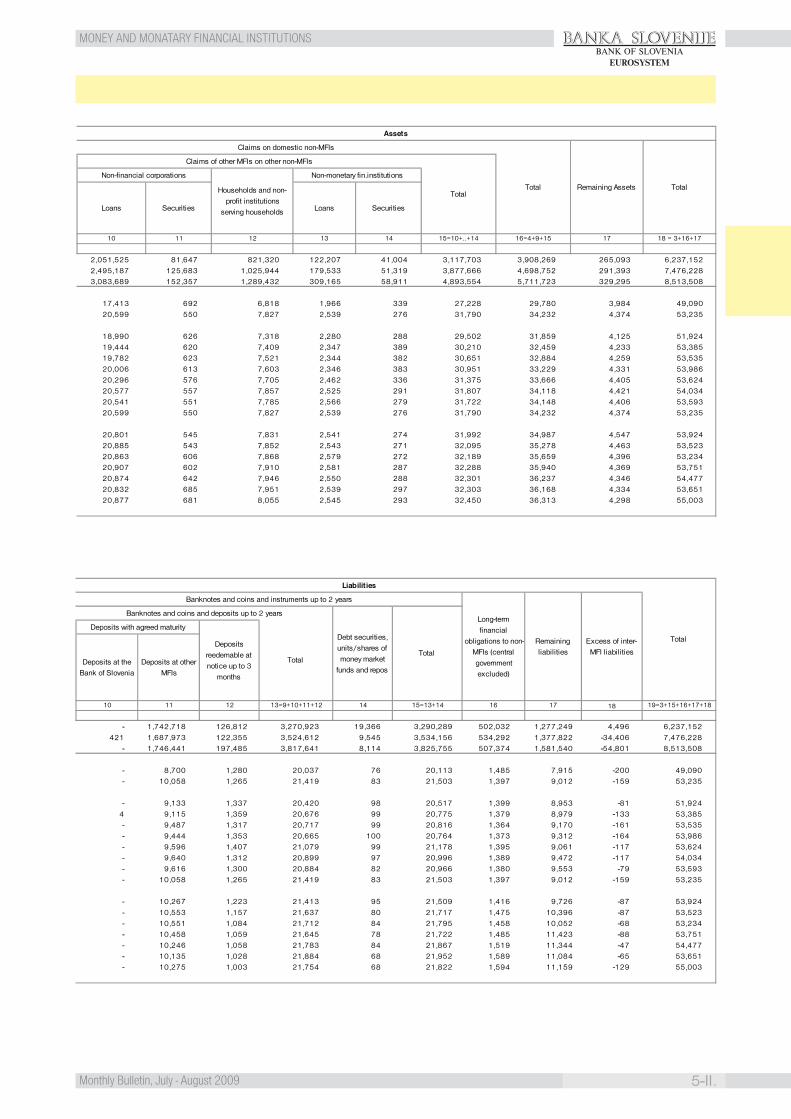
BANKA SLOVENIJE
5-II.Monthly Bulletin, July - August 2009
MONEY AND MONATARY FINANCIAL INSTITUTIONSBANK OF SLOVENIA
EUROSYSTEM
2,051,525 81,647 821,320 122,207 41,004 3,117,703 3,908,269 265,093 6,237,1522,495,187 125,683 1,025,944 179,533 51,319 3,877,666 4,698,752 291,393 7,476,2283,083,689 152,357 1,289,432 309,165 58,911 4,893,554 5,711,723 329,295 8,513,508
17,413 692 6,818 1,966 339 27,228 29,780 3,984 49,09020,599 550 7,827 2,539 276 31,790 34,232 4,374 53,235
18,990 626 7,318 2,280 288 29,502 31,859 4,125 51,92419,444 620 7,409 2,347 389 30,210 32,459 4,233 53,38519,782 623 7,521 2,344 382 30,651 32,884 4,259 53,53520,006 613 7,603 2,346 383 30,951 33,229 4,331 53,98620,296 576 7,705 2,462 336 31,375 33,666 4,405 53,62420,577 557 7,857 2,525 291 31,807 34,118 4,421 54,03420,541 551 7,785 2,566 279 31,722 34,148 4,406 53,59320,599 550 7,827 2,539 276 31,790 34,232 4,374 53,235
20,801 545 7,831 2,541 274 31,992 34,987 4,547 53,92420,885 543 7,852 2,543 271 32,095 35,278 4,463 53,52320,863 606 7,868 2,579 272 32,189 35,659 4,396 53,23420,907 602 7,910 2,581 287 32,288 35,940 4,369 53,75120,874 642 7,946 2,550 288 32,301 36,237 4,346 54,47720,832 685 7,951 2,539 297 32,303 36,168 4,334 53,65120,877 681 8,055 2,545 293 32,450 36,313 4,298 55,003
Assets
Claims on domestic non-MFIs
Total Remaining Assets Total
Claims of other MFIs on other non-MFIs
Total
Non-financial corporations
Households and non-profit institutions
serving households
Non-monetary fin.institutions
Loans Securities Loans Securities
10 11 12 13 14 15=10+..+14 16=4+9+15 17 18 = 3+16+17
- 1,742,718 126,812 3,270,923 19,366 3,290,289 502,032 1,277,249 4,496 6,237,152421 1,687,973 122,355 3,524,612 9,545 3,534,156 534,292 1,377,822 -34,406 7,476,228
- 1,746,441 197,485 3,817,641 8,114 3,825,755 507,374 1,581,540 -54,801 8,513,508
- 8,700 1,280 20,037 76 20,113 1,485 7,915 -200 49,090- 10,058 1,265 21,419 83 21,503 1,397 9,012 -159 53,235
- 9,133 1,337 20,420 98 20,517 1,399 8,953 -81 51,9244 9,115 1,359 20,676 99 20,775 1,379 8,979 -133 53,385- 9,487 1,317 20,717 99 20,816 1,364 9,170 -161 53,535- 9,444 1,353 20,665 100 20,764 1,373 9,312 -164 53,986- 9,596 1,407 21,079 99 21,178 1,395 9,061 -117 53,624- 9,640 1,312 20,899 97 20,996 1,389 9,472 -117 54,034- 9,616 1,300 20,884 82 20,966 1,380 9,553 -79 53,593- 10,058 1,265 21,419 83 21,503 1,397 9,012 -159 53,235
- 10,267 1,223 21,413 95 21,509 1,416 9,726 -87 53,924- 10,553 1,157 21,637 80 21,717 1,475 10,396 -87 53,523- 10,551 1,084 21,712 84 21,795 1,458 10,052 -68 53,234- 10,458 1,059 21,645 78 21,722 1,485 11,423 -88 53,751- 10,246 1,058 21,783 84 21,867 1,519 11,344 -47 54,477- 10,135 1,028 21,884 68 21,952 1,589 11,084 -65 53,651- 10,275 1,003 21,754 68 21,822 1,594 11,159 -129 55,003
Liabilities
Banknotes and coins and deposits up to 2 years
Debt securities, units/shares of money market
funds and repos
TotalRemaining liabilities
Excess of inter-MFI liabilities
Banknotes and coins and instruments up to 2 years
TotalTotal
10
Long-term financial
obligations to non-MFIs (central government excluded)
Deposits with agreed maturity
Deposits reedemable at notice up to 3
months
Deposits at the Bank of Slovenia
Deposits at other MFIs
11 12 13=9+10+11+12 14 15=13+14 16 17 18 19=3+15+16+17+18
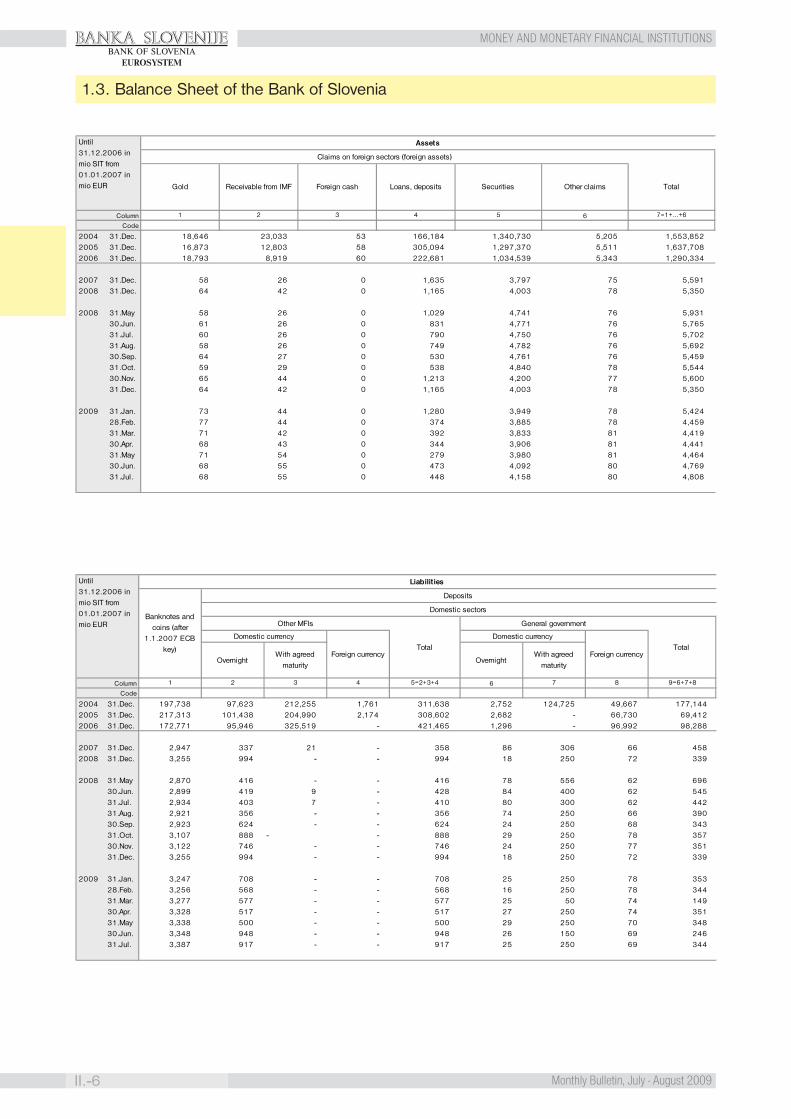
BANKA SLOVENIJE
II.-6 Monthly Bulletin, July - August 2009
MONEY AND MONETARY FINANCIAL INSTITUTIONSBANK OF SLOVENIA
EUROSYSTEM
1.3. Balance Sheet of the Bank of Slovenia
ColumnCode
2004 31.Dec. 18,646 23,033 53 166,184 1,340,730 5,205 1,553,8522005 31.Dec. 16,873 12,803 58 305,094 1,297,370 5,511 1,637,7082006 31.Dec. 18,793 8,919 60 222,681 1,034,539 5,343 1,290,334
2007 31.Dec. 58 26 0 1,635 3,797 75 5,5912008 31.Dec. 64 42 0 1,165 4,003 78 5,350
2008 31.May 58 26 0 1,029 4,741 76 5,93130.Jun. 61 26 0 831 4,771 76 5,76531.Jul. 60 26 0 790 4,750 76 5,70231.Aug. 58 26 0 749 4,782 76 5,69230.Sep. 64 27 0 530 4,761 76 5,45931.Oct. 59 29 0 538 4,840 78 5,54430.Nov. 65 44 0 1,213 4,200 77 5,60031.Dec. 64 42 0 1,165 4,003 78 5,350
2009 31.Jan. 73 44 0 1,280 3,949 78 5,42428.Feb. 77 44 0 374 3,885 78 4,45931.Mar. 71 42 0 392 3,833 81 4,41930.Apr. 68 43 0 344 3,906 81 4,44131.May 71 54 0 279 3,980 81 4,46430.Jun. 68 55 0 473 4,092 80 4,76931.Jul. 68 55 0 448 4,158 80 4,808
Assets
Total
Until 31.12.2006 in mio SIT from 01.01.2007 in mio EUR Foreign cash Securities
7=1+…+61
Claims on foreign sectors (foreign assets)
Gold Loans, deposits Other claims Receivable from IMF
5 62 3 4
ColumnCode
2004 31.Dec. 197,738 97,623 212,255 1,761 311,638 2,752 124,725 49,667 177,1442005 31.Dec. 217,313 101,438 204,990 2,174 308,602 2,682 - 66,730 69,4122006 31.Dec. 172,771 95,946 325,519 - 421,465 1,296 - 96,992 98,288
2007 31.Dec. 2,947 337 21 - 358 86 306 66 4582008 31.Dec. 3,255 994 - - 994 18 250 72 339
2008 31.May 2,870 416 - - 416 78 556 62 69630.Jun. 2,899 419 9 - 428 84 400 62 54531.Jul. 2,934 403 7 - 410 80 300 62 44231.Aug. 2,921 356 - - 356 74 250 66 39030.Sep. 2,923 624 - - 624 24 250 68 34331.Oct. 3,107 888 - - 888 29 250 78 35730.Nov. 3,122 746 - - 746 24 250 77 35131.Dec. 3,255 994 - - 994 18 250 72 339
2009 31.Jan. 3,247 708 - - 708 25 250 78 35328.Feb. 3,256 568 - - 568 16 250 78 34431.Mar. 3,277 577 - - 577 25 50 74 14930.Apr. 3,328 517 - - 517 27 250 74 35131.May 3,338 500 - - 500 29 250 70 34830.Jun. 3,348 948 - - 948 26 150 69 24631.Jul. 3,387 917 - - 917 25 250 69 344
Until 31.12.2006 in mio SIT from 01.01.2007 in mio EUR
Banknotes and coins (after
1.1.2007 ECB key) Total
Overnight With agreed
maturity
Other MFIs
Liabilities
Overnight With agreed
maturity
Domestic currency
5=2+3+4 6 7
Foreign currency
Domestic currency
1 2 3 4 9=6+7+88
General government
Foreign currency
Domestic sectors
Deposits
Total
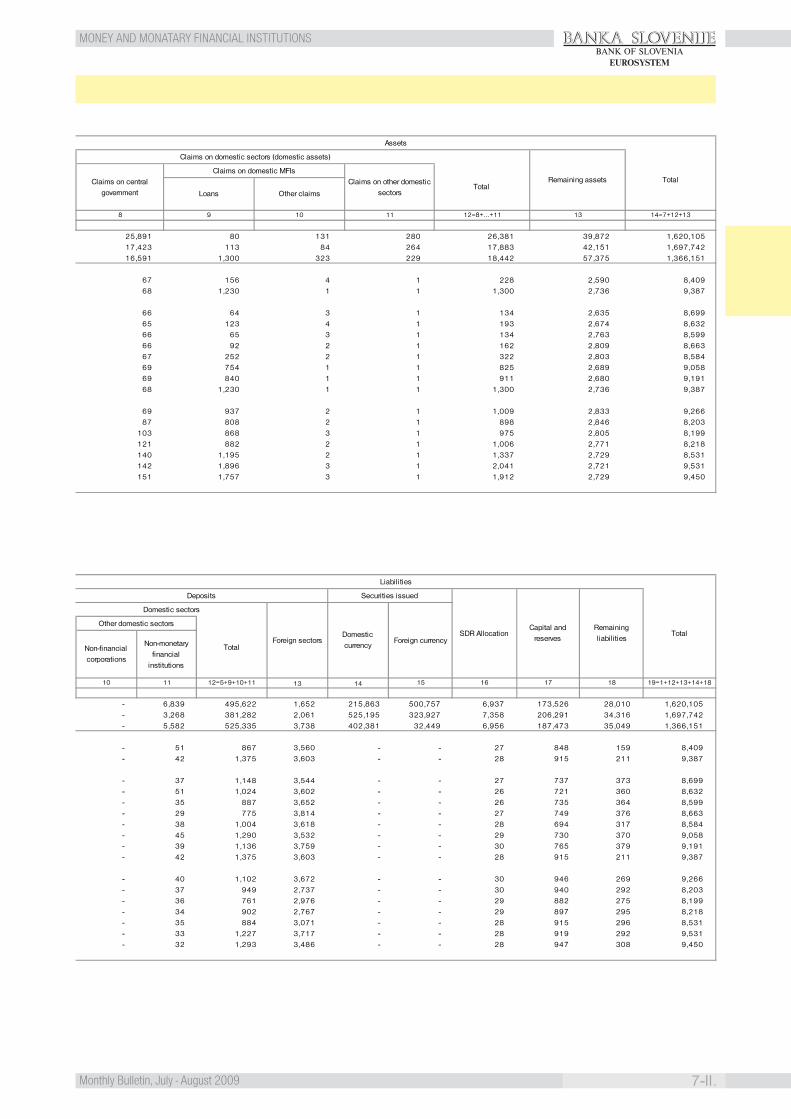
BANKA SLOVENIJE
7-II.Monthly Bulletin, July - August 2009
MONEY AND MONATARY FINANCIAL INSTITUTIONSBANK OF SLOVENIA
EUROSYSTEM
25,891 80 131 280 26,381 39,872 1,620,10517,423 113 84 264 17,883 42,151 1,697,74216,591 1,300 323 229 18,442 57,375 1,366,151
67 156 4 1 228 2,590 8,40968 1,230 1 1 1,300 2,736 9,387
66 64 3 1 134 2,635 8,69965 123 4 1 193 2,674 8,63266 65 3 1 134 2,763 8,59966 92 2 1 162 2,809 8,66367 252 2 1 322 2,803 8,58469 754 1 1 825 2,689 9,05869 840 1 1 911 2,680 9,19168 1,230 1 1 1,300 2,736 9,387
69 937 2 1 1,009 2,833 9,26687 808 2 1 898 2,846 8,203
103 868 3 1 975 2,805 8,199121 882 2 1 1,006 2,771 8,218140 1,195 2 1 1,337 2,729 8,531142 1,896 3 1 2,041 2,721 9,531151 1,757 3 1 1,912 2,729 9,450
Claims on central government
Assets
12=8+…+11 13 14=7+12+13
Claims on domestic sectors (domestic assets)
Remaining assets Total
8 9 10 11
Claims on domestic MFIsClaims on other domestic
sectorsTotal
Loans Other claims
- 6,839 495,622 1,652 215,863 500,757 6,937 173,526 28,010 1,620,105- 3,268 381,282 2,061 525,195 323,927 7,358 206,291 34,316 1,697,742- 5,582 525,335 3,738 402,381 32,449 6,956 187,473 35,049 1,366,151
- 51 867 3,560 - - 27 848 159 8,409- 42 1,375 3,603 - - 28 915 211 9,387
- 37 1,148 3,544 - - 27 737 373 8,699- 51 1,024 3,602 - - 26 721 360 8,632- 35 887 3,652 - - 26 735 364 8,599- 29 775 3,814 - - 27 749 376 8,663- 38 1,004 3,618 - - 28 694 317 8,584- 45 1,290 3,532 - - 29 730 370 9,058- 39 1,136 3,759 - - 30 765 379 9,191- 42 1,375 3,603 - - 28 915 211 9,387
- 40 1,102 3,672 - - 30 946 269 9,266- 37 949 2,737 - - 30 940 292 8,203- 36 761 2,976 - - 29 882 275 8,199- 34 902 2,767 - - 29 897 295 8,218- 35 884 3,071 - - 28 915 296 8,531- 33 1,227 3,717 - - 28 919 292 9,531- 32 1,293 3,486 - - 28 947 308 9,450
Capital and reserves
Remaining liabilities
10 11 12=5+9+10+11
TotalNon-financial corporations
Non-monetary financial
institutions
Securities issued
SDR AllocationOther domestic sectors
13 14 15 16 17 18 19=1+12+13+14+18
Liabilities
Domestic sectors
Deposits
TotalForeign sectors
Domestic currency
Foreign currency
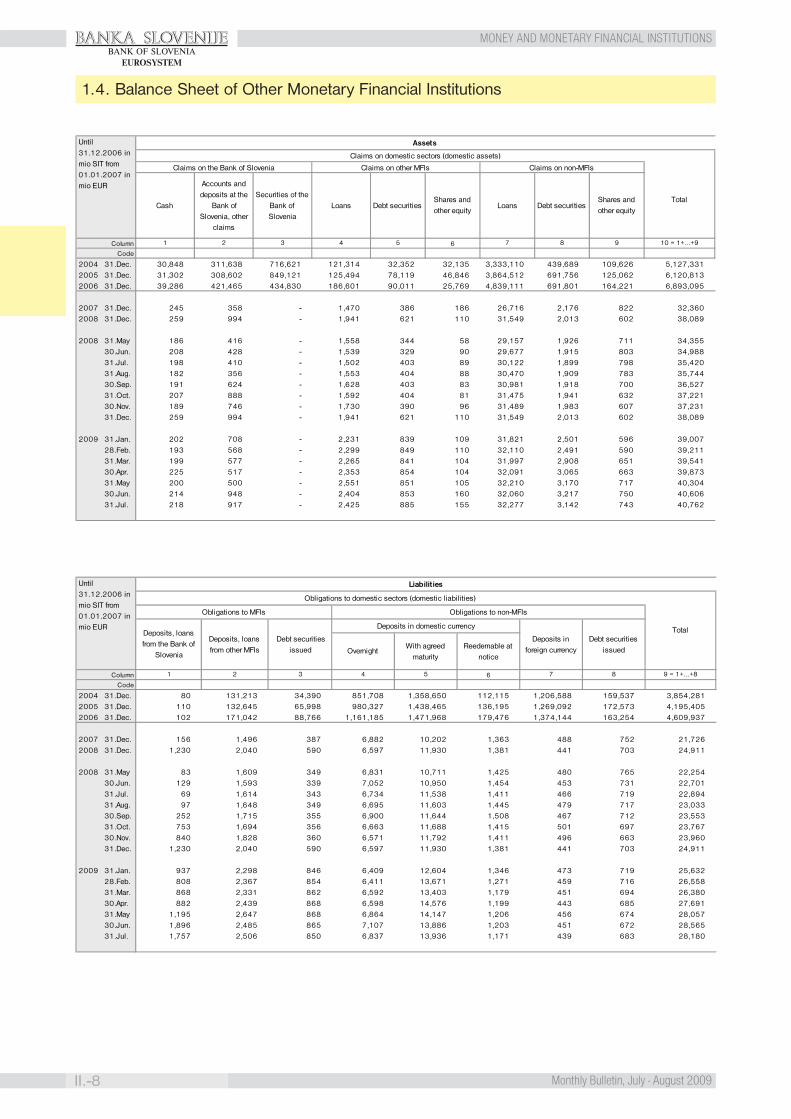
BANKA SLOVENIJE
II.-8 Monthly Bulletin, July - August 2009
MONEY AND MONETARY FINANCIAL INSTITUTIONSBANK OF SLOVENIA
EUROSYSTEM
1.4. Balance Sheet of Other Monetary Financial Institutions
Column
Code
2004 31.Dec. 30,848 311,638 716,621 121,314 32,352 32,135 3,333,110 439,689 109,626 5,127,3312005 31.Dec. 31,302 308,602 849,121 125,494 78,119 46,846 3,864,512 691,756 125,062 6,120,8132006 31.Dec. 39,286 421,465 434,830 186,601 90,011 25,769 4,839,111 691,801 164,221 6,893,095
2007 31.Dec. 245 358 - 1,470 386 186 26,716 2,176 822 32,3602008 31.Dec. 259 994 - 1,941 621 110 31,549 2,013 602 38,089
2008 31.May 186 416 - 1,558 344 58 29,157 1,926 711 34,35530.Jun. 208 428 - 1,539 329 90 29,677 1,915 803 34,98831.Jul. 198 410 - 1,502 403 89 30,122 1,899 798 35,42031.Aug. 182 356 - 1,553 404 88 30,470 1,909 783 35,74430.Sep. 191 624 - 1,628 403 83 30,981 1,918 700 36,52731.Oct. 207 888 - 1,592 404 81 31,475 1,941 632 37,22130.Nov. 189 746 - 1,730 390 96 31,489 1,983 607 37,23131.Dec. 259 994 - 1,941 621 110 31,549 2,013 602 38,089
2009 31.Jan. 202 708 - 2,231 839 109 31,821 2,501 596 39,00728.Feb. 193 568 - 2,299 849 110 32,110 2,491 590 39,21131.Mar. 199 577 - 2,265 841 104 31,997 2,908 651 39,54130.Apr. 225 517 - 2,353 854 104 32,091 3,065 663 39,87331.May 200 500 - 2,551 851 105 32,210 3,170 717 40,30430.Jun. 214 948 - 2,404 853 160 32,060 3,217 750 40,60631.Jul. 218 917 - 2,425 885 155 32,277 3,142 743 40,762
Claims on non-MFIs
TotalShares and other equity
Loans Debt securitiesShares and other equity
9 10 = 1+…+97 85 63 41 2
Until 31.12.2006 in mio SIT from 01.01.2007 in mio EUR
Assets
Claims on domestic sectors (domestic assets)
Cash
Accounts and deposits at the
Bank of Slovenia, other
claims
Securities of the Bank of Slovenia
Loans Debt securities
Claims on the Bank of Slovenia Claims on other MFIs
Column
Code
2004 31.Dec. 80 131,213 34,390 851,708 1,358,650 112,115 1,206,588 159,537 3,854,2812005 31.Dec. 110 132,645 65,998 980,327 1,438,465 136,195 1,269,092 172,573 4,195,4052006 31.Dec. 102 171,042 88,766 1,161,185 1,471,968 179,476 1,374,144 163,254 4,609,937
2007 31.Dec. 156 1,496 387 6,882 10,202 1,363 488 752 21,7262008 31.Dec. 1,230 2,040 590 6,597 11,930 1,381 441 703 24,911
2008 31.May 83 1,609 349 6,831 10,711 1,425 480 765 22,25430.Jun. 129 1,593 339 7,052 10,950 1,454 453 731 22,70131.Jul. 69 1,614 343 6,734 11,538 1,411 466 719 22,89431.Aug. 97 1,648 349 6,695 11,603 1,445 479 717 23,03330.Sep. 252 1,715 355 6,900 11,644 1,508 467 712 23,55331.Oct. 753 1,694 356 6,663 11,688 1,415 501 697 23,76730.Nov. 840 1,828 360 6,571 11,792 1,411 496 663 23,96031.Dec. 1,230 2,040 590 6,597 11,930 1,381 441 703 24,911
2009 31.Jan. 937 2,298 846 6,409 12,604 1,346 473 719 25,63228.Feb. 808 2,367 854 6,411 13,671 1,271 459 716 26,55831.Mar. 868 2,331 862 6,592 13,403 1,179 451 694 26,38030.Apr. 882 2,439 868 6,598 14,576 1,199 443 685 27,69131.May 1,195 2,647 868 6,864 14,147 1,206 456 674 28,05730.Jun. 1,896 2,485 865 7,107 13,886 1,203 451 672 28,56531.Jul. 1,757 2,506 850 6,837 13,936 1,171 439 683 28,180
Overnight
Debt securities issued
Obligations to domestic sectors (domestic liabilities)
Total
Obligations to non-MFIs
Liabilities
9 = 1+…+87 85 63 41 2
Until 31.12.2006 in mio SIT from 01.01.2007 in mio EUR
With agreed maturity
Reedemable at notice
Debt securities issued
Obligations to MFIs
Deposits, loans from the Bank of
Slovenia
Deposits, loans from other MFIs
Deposits in domestic currency
Deposits in foreign currency
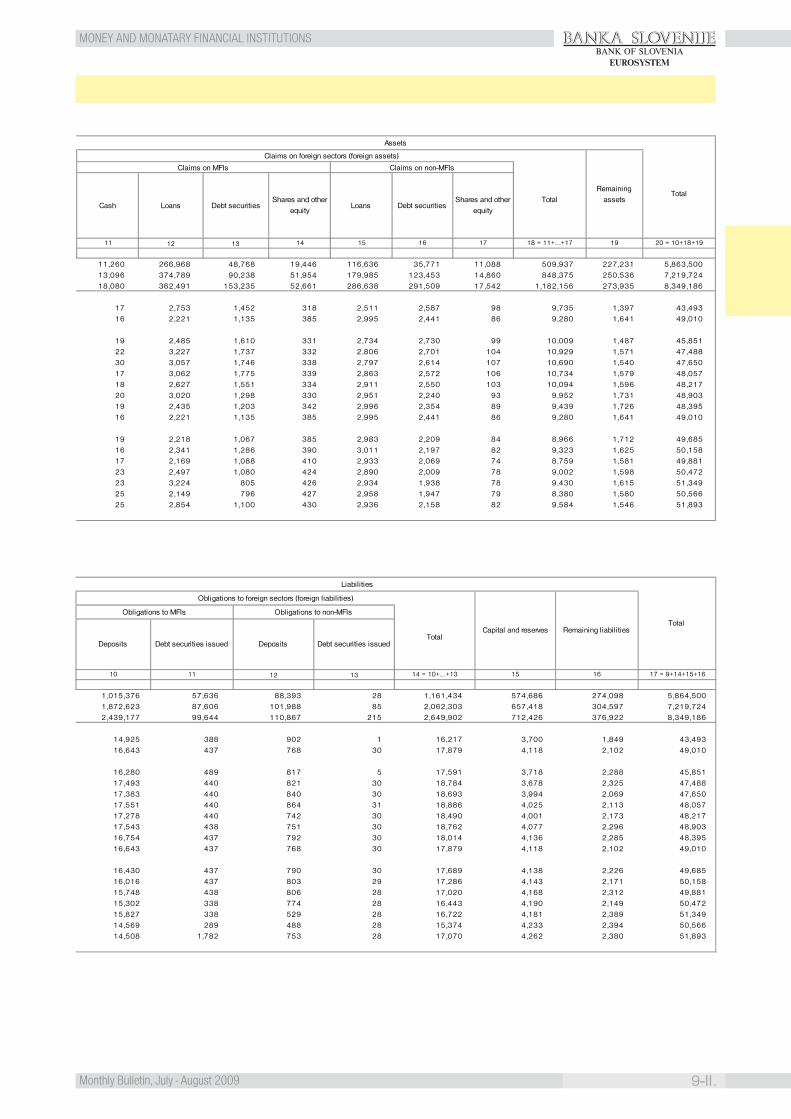
BANKA SLOVENIJE
9-II.Monthly Bulletin, July - August 2009
MONEY AND MONATARY FINANCIAL INSTITUTIONSBANK OF SLOVENIA
EUROSYSTEM
11,260 266,968 48,768 19,446 116,636 35,771 11,088 509,937 227,231 5,863,50013,096 374,789 90,238 51,954 179,985 123,453 14,860 848,375 250,536 7,219,72418,080 362,491 153,235 52,661 286,638 291,509 17,542 1,182,156 273,935 8,349,186
17 2,753 1,452 318 2,511 2,587 98 9,735 1,397 43,49316 2,221 1,135 385 2,995 2,441 86 9,280 1,641 49,010
19 2,485 1,610 331 2,734 2,730 99 10,009 1,487 45,85122 3,227 1,737 332 2,806 2,701 104 10,929 1,571 47,48830 3,057 1,746 338 2,797 2,614 107 10,690 1,540 47,65017 3,062 1,775 339 2,863 2,572 106 10,734 1,579 48,05718 2,627 1,551 334 2,911 2,550 103 10,094 1,596 48,21720 3,020 1,298 330 2,951 2,240 93 9,952 1,731 48,90319 2,435 1,203 342 2,996 2,354 89 9,439 1,726 48,39516 2,221 1,135 385 2,995 2,441 86 9,280 1,641 49,010
19 2,218 1,067 385 2,983 2,209 84 8,966 1,712 49,68516 2,341 1,286 390 3,011 2,197 82 9,323 1,625 50,15817 2,169 1,088 410 2,933 2,069 74 8,759 1,581 49,88123 2,497 1,080 424 2,890 2,009 78 9,002 1,598 50,47223 3,224 805 426 2,934 1,938 78 9,430 1,615 51,34925 2,149 796 427 2,958 1,947 79 8,380 1,580 50,56625 2,854 1,100 430 2,936 2,158 82 9,584 1,546 51,893
19 20 = 10+18+1915 16 17 18 = 11+…+1711 12 13 14
Shares and other equity
Loans Debt securitiesShares and other
equity
Assets
Claims on foreign sectors (foreign assets)
Remaining assets
Total
Claims on MFIs Claims on non-MFIs
TotalCash Loans Debt securities
1,015,376 57,636 88,393 28 1,161,434 574,686 274,098 5,864,5001,872,623 87,606 101,988 85 2,062,303 657,418 304,597 7,219,7242,439,177 99,644 110,867 215 2,649,902 712,426 376,922 8,349,186
14,925 388 902 1 16,217 3,700 1,849 43,49316,643 437 768 30 17,879 4,118 2,102 49,010
16,280 489 817 5 17,591 3,718 2,288 45,85117,493 440 821 30 18,784 3,678 2,325 47,48817,383 440 840 30 18,693 3,994 2,069 47,65017,551 440 864 31 18,886 4,025 2,113 48,05717,278 440 742 30 18,490 4,001 2,173 48,21717,543 438 751 30 18,762 4,077 2,296 48,90316,754 437 792 30 18,014 4,136 2,285 48,39516,643 437 768 30 17,879 4,118 2,102 49,010
16,430 437 790 30 17,689 4,138 2,226 49,68516,016 437 803 29 17,286 4,143 2,171 50,15815,748 438 806 28 17,020 4,168 2,312 49,88115,302 338 774 28 16,443 4,190 2,149 50,47215,827 338 529 28 16,722 4,181 2,389 51,34914,569 289 488 28 15,374 4,233 2,394 50,56614,508 1,782 753 28 17,070 4,262 2,380 51,893
Liabilities
15 1613 14 = 10+…+13
Debt securities issued Deposits Debt securities issued
17 = 9+14+15+1611 12
Total
Obligations to foreign sectors (foreign liabilities)
Capital and reserves Remaining liabilities
Obligations to MFIs Obligations to non-MFIs
Total
10
Deposits

BANKA SLOVENIJE
II.-10 Monthly Bulletin, July - August 2009
MONEY AND MONETARY FINANCIAL INSTITUTIONSBANK OF SLOVENIA
EUROSYSTEM
1.5. Selected Assets of Other Monetary Financial Institutions by Sector
ColumnCode
2004 31.dec. 2,382,894 1,383,215 440,648 191,232 3,134,228 616,548 572,113 141,713 5,096,4842005 31.dec. 2,099,189 2,199,419 471,462 327,736 3,499,410 1,203,222 415,774 171,907 6,089,5112006 31.dec. 2,298,192 3,148,985 547,955 468,689 4,430,534 1,096,779 119,864 189,989 6,853,809
2007 31.dec. 26,555 1,990 2,743 2,668 23,134 2,562 - 1,008 32,1152008 31.dec. 32,113 2,370 2,884 3,395 28,204 2,634 - 712 37,830
2008 31.maj. 28,871 2,259 2,813 3,002 25,315 2,270 - 768 34,16930.jun. 29,380 2,263 2,844 3,074 25,726 2,244 - 893 34,78031.jul. 29,805 2,228 2,868 3,110 26,055 2,301 - 887 35,222
31.avg. 30,108 2,271 2,882 3,167 26,329 2,313 - 871 35,56230.sep. 30,888 2,344 2,905 3,237 27,091 2,322 - 782 36,33631.okt. 31,444 2,512 2,928 3,357 27,670 2,345 - 714 37,01430.nov. 31,594 2,371 2,891 3,337 27,737 2,373 - 704 37,04231.dec. 32,113 2,370 2,884 3,395 28,204 2,634 - 712 37,830
2009 31.jan. 32,388 2,372 2,867 3,419 28,474 3,341 - 705 38,80528.feb. 32,663 2,315 2,866 3,441 28,670 3,340 - 700 39,017
31.mar. 32,648 2,190 2,854 3,462 28,522 3,749 - 755 39,34230.apr. 32,790 2,172 2,856 3,504 28,602 3,919 - 767 39,648
31.maj. 33,140 2,122 2,859 3,554 28,850 4,021 - 822 40,10530.jun. 33,353 2,059 2,863 3,587 28,962 4,069 - 910 40,39231.jul. 33,601 2,017 2,869 3,637 29,113 4,027 - 898 40,544
2004 31.dec. 378,567 54,385 - - 432,952 242,901 506,070 32,135 1,214,0592005 31.dec. 345,097 88,999 - - 434,096 594,946 332,295 46,846 1,408,1822006 31.dec. 511,086 96,980 - - 608,066 482,995 41,846 25,769 1,158,676
2007 31.dec. 1,758 71 - - 1,829 386 - 186 2,4012008 31.dec. 2,918 16 - - 2,935 621 - 110 3,666
2008 31.maj. 1,946 27 - - 1,974 344 - 58 2,37530.jun. 1,938 28 - - 1,966 329 - 90 2,38631.jul. 1,892 20 - - 1,912 403 - 89 2,403
31.avg. 1,890 18 - - 1,909 404 - 88 2,40030.sep. 2,228 23 - - 2,251 403 - 83 2,73731.okt. 2,455 25 - - 2,480 404 - 81 2,96530.nov. 2,456 20 - - 2,477 390 - 96 2,96331.dec. 2,918 16 - - 2,935 621 - 110 3,666
2009 31.jan. 2,913 26 - - 2,939 839 - 109 3,88728.feb. 2,844 23 - - 2,868 849 - 110 3,826
31.mar. 2,825 17 - - 2,841 841 - 104 3,78630.apr. 2,848 22 - - 2,871 854 - 104 3,829
31.maj. 3,031 21 - - 3,052 851 - 105 4,00830.jun. 3,334 19 - - 3,352 853 - 160 4,36531.jul. 3,324 18 - - 3,342 885 - 155 4,382
2004 31.dec. 38,952 83,255 - - 122,207 1,573 725 38,706 163,2112005 31.dec. 39,180 140,353 - - 179,533 2,419 1,799 47,101 230,8522006 31.dec. 46,800 262,365 - - 309,165 2,753 857 55,301 368,076
2007 31.dec. 1,867 99 - - 1,966 15 - 324 2,3052008 31.dec. 2,413 126 - - 2,539 20 - 255 2,815
2008 31.maj. 2,164 116 - - 2,280 12 - 277 2,56830.jun. 2,233 115 - - 2,347 16 - 373 2,73631.jul. 2,231 114 - - 2,344 16 - 366 2,726
31.avg. 2,231 115 - - 2,346 20 - 362 2,72930.sep. 2,338 124 - - 2,462 20 - 316 2,79831.okt. 2,393 132 - - 2,525 20 - 270 2,81530.nov. 2,439 127 - - 2,566 20 - 258 2,84531.dec. 2,413 126 - - 2,539 20 - 255 2,815
2009 31.jan. 2,412 129 - - 2,541 20 - 254 2,81528.feb. 2,415 129 - - 2,543 20 - 251 2,814
31.mar. 2,458 120 - - 2,579 20 - 252 2,85130.apr. 2,461 120 - - 2,581 20 - 267 2,869
31.maj. 2,433 117 - - 2,550 10 - 278 2,83830.jun. 2,424 115 - - 2,539 10 - 287 2,83531.jul. 2,433 112 - - 2,545 10 - 284 2,838
Non-MFIs (S.123, S.124, S.125)
Until 31.12.2006 in mio SIT from 01.01.2007 in mio EUR
Claims on domestic sectors (domestic assets)Loans Debt securities
Shares and other equity
TotalBy currency By purpose
Domestic currency Foreign currencyDomestic currency
Foreign currency Consumer creditLending for house
purchaseOther lending
1 2 3 4 5 6 7 8 9=1+2+6+7+8
Total
MFIs (S.121, S.122)

BANKA SLOVENIJE
11-II.Monthly Bulletin, July - August 2009
MONEY AND MONATARY FINANCIAL INSTITUTIONSBANK OF SLOVENIA
EUROSYSTEM
3,814 379,791 15,568 68,971 30,534 498,67711,963 542,811 12,943 200,748 66,814 835,27920,446 628,683 14,760 429,984 70,203 1,164,076
4,570 693 3,984 54 416 9,7184,472 743 3,555 21 471 9,263
4,590 629 4,297 43 430 9,9905,378 655 4,400 38 436 10,9065,197 657 4,323 37 445 10,6595,198 727 4,310 37 445 10,7184,822 716 4,067 34 437 10,0765,211 760 3,512 27 422 9,9324,652 779 3,532 25 431 9,4194,472 743 3,555 21 471 9,263
4,450 751 3,248 28 469 8,9474,610 742 3,456 26 472 9,3064,395 707 3,127 29 484 8,7424,678 709 3,062 27 502 8,9795,411 748 2,723 21 504 9,4064,331 776 2,722 21 506 8,3565,050 739 3,237 21 512 9,559
2,568 264,401 15,367 33,400 19,446 335,18210,739 364,050 12,742 77,495 51,954 516,98118,981 343,510 12,870 140,364 52,661 568,387
2,376 377 1,425 26 318 4,5221,850 370 1,128 7 385 3,741
2,168 317 1,591 19 331 4,4272,886 341 1,722 15 332 5,2952,691 367 1,732 14 338 5,1422,679 383 1,761 14 339 5,1772,267 360 1,538 14 334 4,5122,591 429 1,291 8 330 4,6482,037 398 1,195 8 342 3,9811,850 370 1,128 7 385 3,741
1,848 370 1,060 8 385 3,6711,995 346 1,278 8 390 4,0171,822 346 1,080 7 410 3,6662,158 340 1,073 7 424 4,0022,851 373 803 3 426 4,4561,769 381 794 3 427 3,3732,490 364 1,097 3 430 4,383
- 23,125 - 1,473 4,194 28,792- 29,770 - 17,340 5,854 52,965- 75,559 1,492 26,809 6,697 110,556
367 178 111 3 33 692473 212 97 2 35 819
372 191 98 2 29 692388 194 107 2 28 719388 191 105 2 28 715400 194 106 2 29 732423 205 102 2 37 769462 219 76 2 36 795470 215 93 2 36 816473 212 97 2 35 819
473 224 95 2 36 829489 225 86 2 36 838456 219 84 2 35 796459 207 85 2 36 787510 208 82 1 39 841514 204 82 1 40 841518 198 88 1 40 846
Non-MFIs (S.2)
Claims on foreign sectors (foreign assets)
Loans Debt securities
Shares and other equity TotalDomestic currency Foreign currency Domestic currency Foreign currency
10 11 12 13 14 15=10+..+14
Total (S.2)
MFIs (S.2)
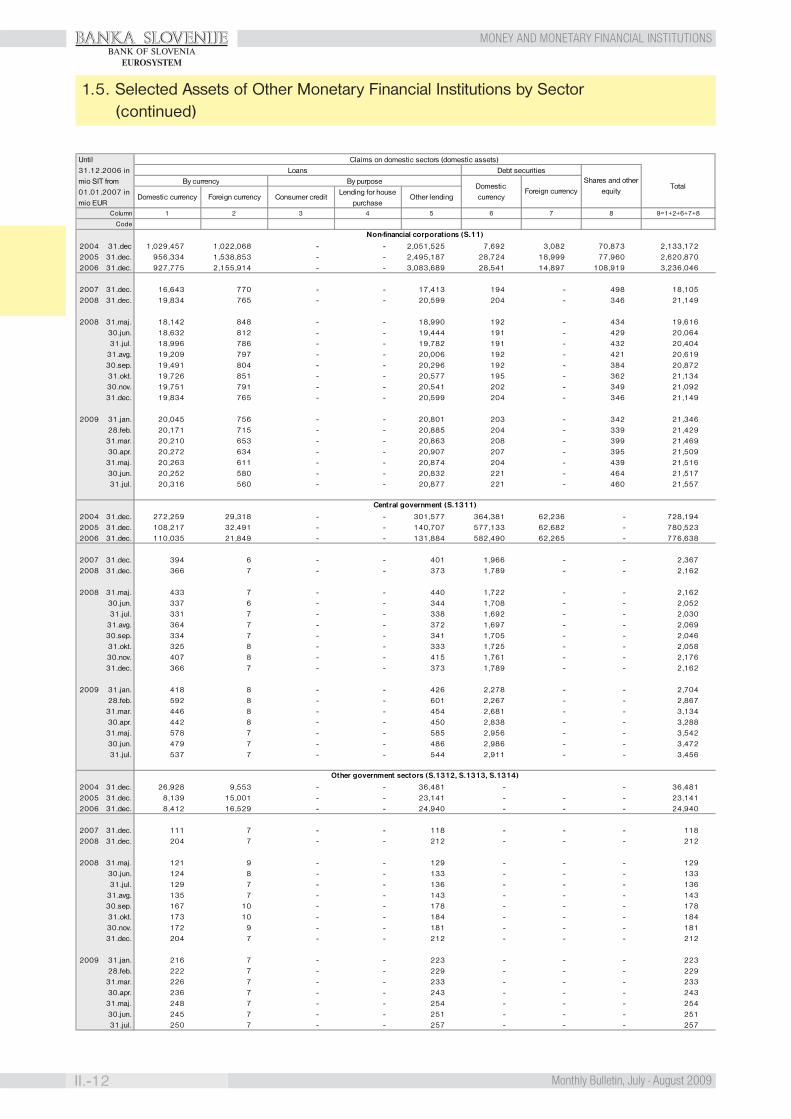
BANKA SLOVENIJE
II.-12 Monthly Bulletin, July - August 2009
MONEY AND MONETARY FINANCIAL INSTITUTIONSBANK OF SLOVENIA
EUROSYSTEM
1.5. Selected Assets of Other Monetary Financial Institutions by Sector(continued)
Column
Code
2004 31.dec 1,029,457 1,022,068 - - 2,051,525 7,692 3,082 70,873 2,133,1722005 31.dec. 956,334 1,538,853 - - 2,495,187 28,724 18,999 77,960 2,620,8702006 31.dec. 927,775 2,155,914 - - 3,083,689 28,541 14,897 108,919 3,236,046
2007 31.dec. 16,643 770 - - 17,413 194 - 498 18,1052008 31.dec. 19,834 765 - - 20,599 204 - 346 21,149
2008 31.maj. 18,142 848 - - 18,990 192 - 434 19,61630.jun. 18,632 812 - - 19,444 191 - 429 20,06431.jul. 18,996 786 - - 19,782 191 - 432 20,404
31.avg. 19,209 797 - - 20,006 192 - 421 20,61930.sep. 19,491 804 - - 20,296 192 - 384 20,87231.okt. 19,726 851 - - 20,577 195 - 362 21,13430.nov. 19,751 791 - - 20,541 202 - 349 21,09231.dec. 19,834 765 - - 20,599 204 - 346 21,149
2009 31.jan. 20,045 756 - - 20,801 203 - 342 21,34628.feb. 20,171 715 - - 20,885 204 - 339 21,429
31.mar. 20,210 653 - - 20,863 208 - 399 21,46930.apr. 20,272 634 - - 20,907 207 - 395 21,509
31.maj. 20,263 611 - - 20,874 204 - 439 21,51630.jun. 20,252 580 - - 20,832 221 - 464 21,51731.jul. 20,316 560 - - 20,877 221 - 460 21,557
2004 31.dec. 272,259 29,318 - - 301,577 364,381 62,236 - 728,1942005 31.dec. 108,217 32,491 - - 140,707 577,133 62,682 - 780,5232006 31.dec. 110,035 21,849 - - 131,884 582,490 62,265 - 776,638
2007 31.dec. 394 6 - - 401 1,966 - - 2,3672008 31.dec. 366 7 - - 373 1,789 - - 2,162
2008 31.maj. 433 7 - - 440 1,722 - - 2,16230.jun. 337 6 - - 344 1,708 - - 2,05231.jul. 331 7 - - 338 1,692 - - 2,030
31.avg. 364 7 - - 372 1,697 - - 2,06930.sep. 334 7 - - 341 1,705 - - 2,04631.okt. 325 8 - - 333 1,725 - - 2,05830.nov. 407 8 - - 415 1,761 - - 2,17631.dec. 366 7 - - 373 1,789 - - 2,162
2009 31.jan. 418 8 - - 426 2,278 - - 2,70428.feb. 592 8 - - 601 2,267 - - 2,867
31.mar. 446 8 - - 454 2,681 - - 3,13430.apr. 442 8 - - 450 2,838 - - 3,288
31.maj. 578 7 - - 585 2,956 - - 3,54230.jun. 479 7 - - 486 2,986 - - 3,47231.jul. 537 7 - - 544 2,911 - - 3,456
2004 31.dec. 26,928 9,553 - - 36,481 - - 36,4812005 31.dec. 8,139 15,001 - - 23,141 - - - 23,1412006 31.dec. 8,412 16,529 - - 24,940 - - - 24,940
2007 31.dec. 111 7 - - 118 - - - 1182008 31.dec. 204 7 - - 212 - - - 212
2008 31.maj. 121 9 - - 129 - - - 12930.jun. 124 8 - - 133 - - - 13331.jul. 129 7 - - 136 - - - 136
31.avg. 135 7 - - 143 - - - 14330.sep. 167 10 - - 178 - - - 17831.okt. 173 10 - - 184 - - - 18430.nov. 172 9 - - 181 - - - 18131.dec. 204 7 - - 212 - - - 212
2009 31.jan. 216 7 - - 223 - - - 22328.feb. 222 7 - - 229 - - - 229
31.mar. 226 7 - - 233 - - - 23330.apr. 236 7 - - 243 - - - 243
31.maj. 248 7 - - 254 - - - 25430.jun. 245 7 - - 251 - - - 25131.jul. 250 7 - - 257 - - - 257
Other government sectors (S.1312, S.1313, S.1314)
Until 31.12.2006 in mio SIT from 01.01.2007 in mio EUR
Claims on domestic sectors (domestic assets)Loans Debt securities
Shares and other equity
TotalBy currency By purpose
Domestic currency
Foreign currencyDomestic currency Foreign currency Consumer credit
Lending for house purchase
Other lending
1 2 3 4 5 6 7 8 9=1+2+6+7+8
Non-financial corporations (S.11)
Central government (S.1311)
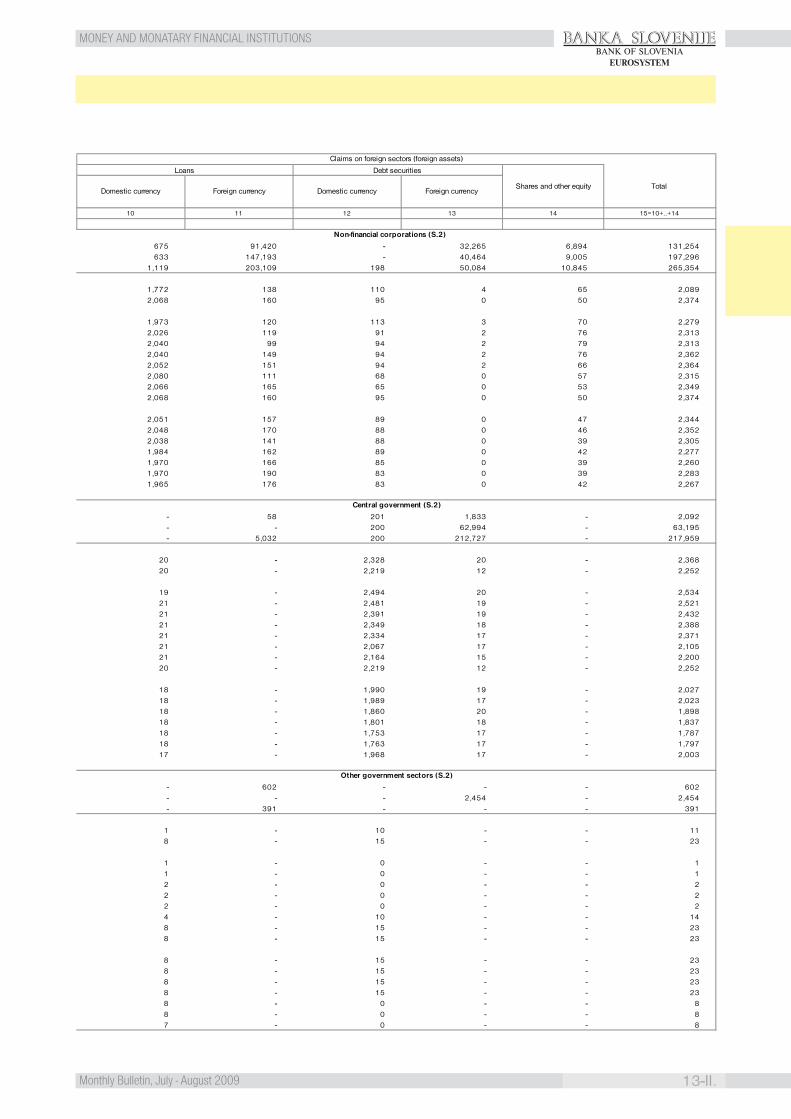
BANKA SLOVENIJE
13-II.Monthly Bulletin, July - August 2009
MONEY AND MONATARY FINANCIAL INSTITUTIONSBANK OF SLOVENIA
EUROSYSTEM
675 91,420 - 32,265 6,894 131,254633 147,193 - 40,464 9,005 197,296
1,119 203,109 198 50,084 10,845 265,354
1,772 138 110 4 65 2,0892,068 160 95 0 50 2,374
1,973 120 113 3 70 2,2792,026 119 91 2 76 2,3132,040 99 94 2 79 2,3132,040 149 94 2 76 2,3622,052 151 94 2 66 2,3642,080 111 68 0 57 2,3152,066 165 65 0 53 2,3492,068 160 95 0 50 2,374
2,051 157 89 0 47 2,3442,048 170 88 0 46 2,3522,038 141 88 0 39 2,3051,984 162 89 0 42 2,2771,970 166 85 0 39 2,2601,970 190 83 0 39 2,2831,965 176 83 0 42 2,267
- 58 201 1,833 - 2,092- - 200 62,994 - 63,195- 5,032 200 212,727 - 217,959
20 - 2,328 20 - 2,36820 - 2,219 12 - 2,252
19 - 2,494 20 - 2,53421 - 2,481 19 - 2,52121 - 2,391 19 - 2,43221 - 2,349 18 - 2,38821 - 2,334 17 - 2,37121 - 2,067 17 - 2,10521 - 2,164 15 - 2,20020 - 2,219 12 - 2,252
18 - 1,990 19 - 2,02718 - 1,989 17 - 2,02318 - 1,860 20 - 1,89818 - 1,801 18 - 1,83718 - 1,753 17 - 1,78718 - 1,763 17 - 1,79717 - 1,968 17 - 2,003
- 602 - - - 602- - - 2,454 - 2,454- 391 - - - 391
1 - 10 - - 118 - 15 - - 23
1 - 0 - - 11 - 0 - - 12 - 0 - - 22 - 0 - - 22 - 0 - - 24 - 10 - - 148 - 15 - - 238 - 15 - - 23
8 - 15 - - 238 - 15 - - 238 - 15 - - 238 - 15 - - 238 - 0 - - 88 - 0 - - 87 - 0 - - 8
Other government sectors (S.2)
Claims on foreign sectors (foreign assets)
Loans Debt securities
Shares and other equity TotalDomestic currency Foreign currency Domestic currency Foreign currency
10 11 12 13 14 15=10+..+14
Central government (S.2)
Non-financial corporations (S.2)
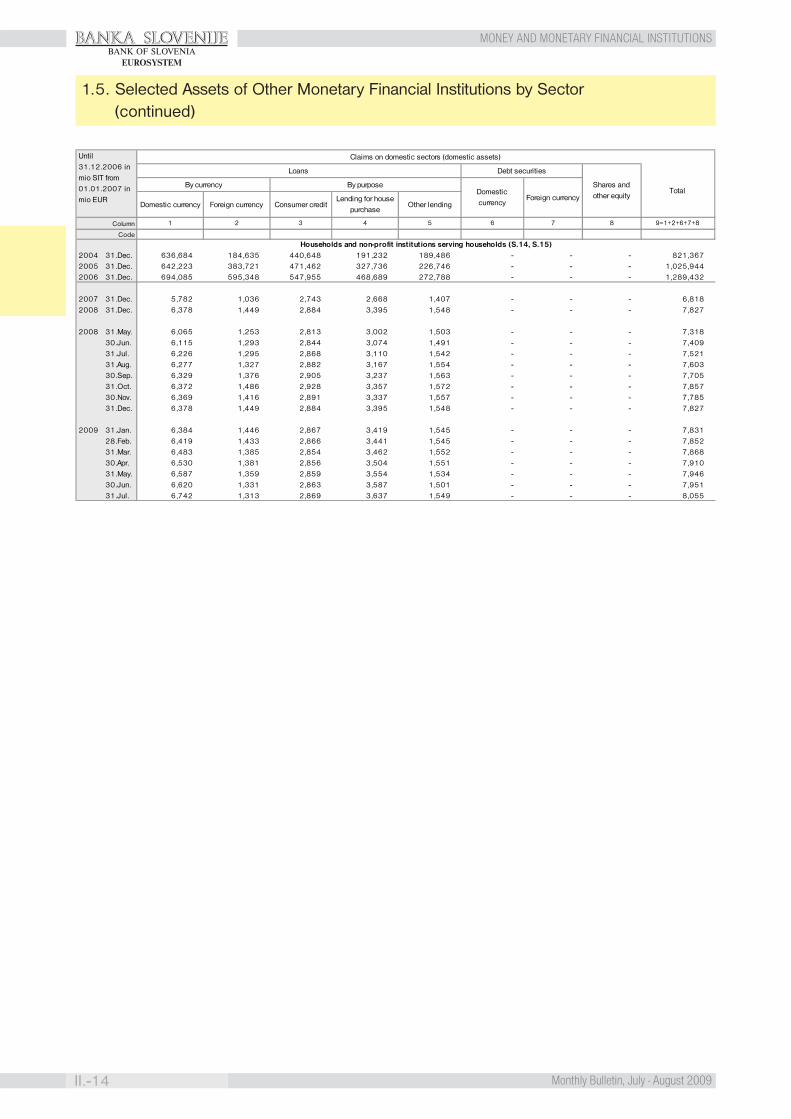
BANKA SLOVENIJE
II.-14 Monthly Bulletin, July - August 2009
MONEY AND MONETARY FINANCIAL INSTITUTIONSBANK OF SLOVENIA
EUROSYSTEM
1.5. Selected Assets of Other Monetary Financial Institutions by Sector(continued)
Column
Code
2004 31.Dec. 636,684 184,635 440,648 191,232 189,486 - - - 821,3672005 31.Dec. 642,223 383,721 471,462 327,736 226,746 - - - 1,025,9442006 31.Dec. 694,085 595,348 547,955 468,689 272,788 - - - 1,289,432
2007 31.Dec. 5,782 1,036 2,743 2,668 1,407 - - - 6,8182008 31.Dec. 6,378 1,449 2,884 3,395 1,548 - - - 7,827
2008 31.May. 6,065 1,253 2,813 3,002 1,503 - - - 7,31830.Jun. 6,115 1,293 2,844 3,074 1,491 - - - 7,40931.Jul. 6,226 1,295 2,868 3,110 1,542 - - - 7,52131.Aug. 6,277 1,327 2,882 3,167 1,554 - - - 7,60330.Sep. 6,329 1,376 2,905 3,237 1,563 - - - 7,70531.Oct. 6,372 1,486 2,928 3,357 1,572 - - - 7,85730.Nov. 6,369 1,416 2,891 3,337 1,557 - - - 7,78531.Dec. 6,378 1,449 2,884 3,395 1,548 - - - 7,827
2009 31.Jan. 6,384 1,446 2,867 3,419 1,545 - - - 7,83128.Feb. 6,419 1,433 2,866 3,441 1,545 - - - 7,85231.Mar. 6,483 1,385 2,854 3,462 1,552 - - - 7,86830.Apr. 6,530 1,381 2,856 3,504 1,551 - - - 7,91031.May. 6,587 1,359 2,859 3,554 1,534 - - - 7,94630.Jun. 6,620 1,331 2,863 3,587 1,501 - - - 7,95131.Jul. 6,742 1,313 2,869 3,637 1,549 - - - 8,055
Households and non-profit institutions serving households (S.14, S.15)
54
Until 31.12.2006 in mio SIT from 01.01.2007 in mio EUR
1 2 3
Claims on domestic sectors (domestic assets)
6 7 8
Domestic currency
Foreign currency
Loans Debt securities
Shares and other equity
By currency By purpose
Domestic currency Foreign currency Consumer creditLending for house
purchaseOther lending
9=1+2+6+7+8
Total
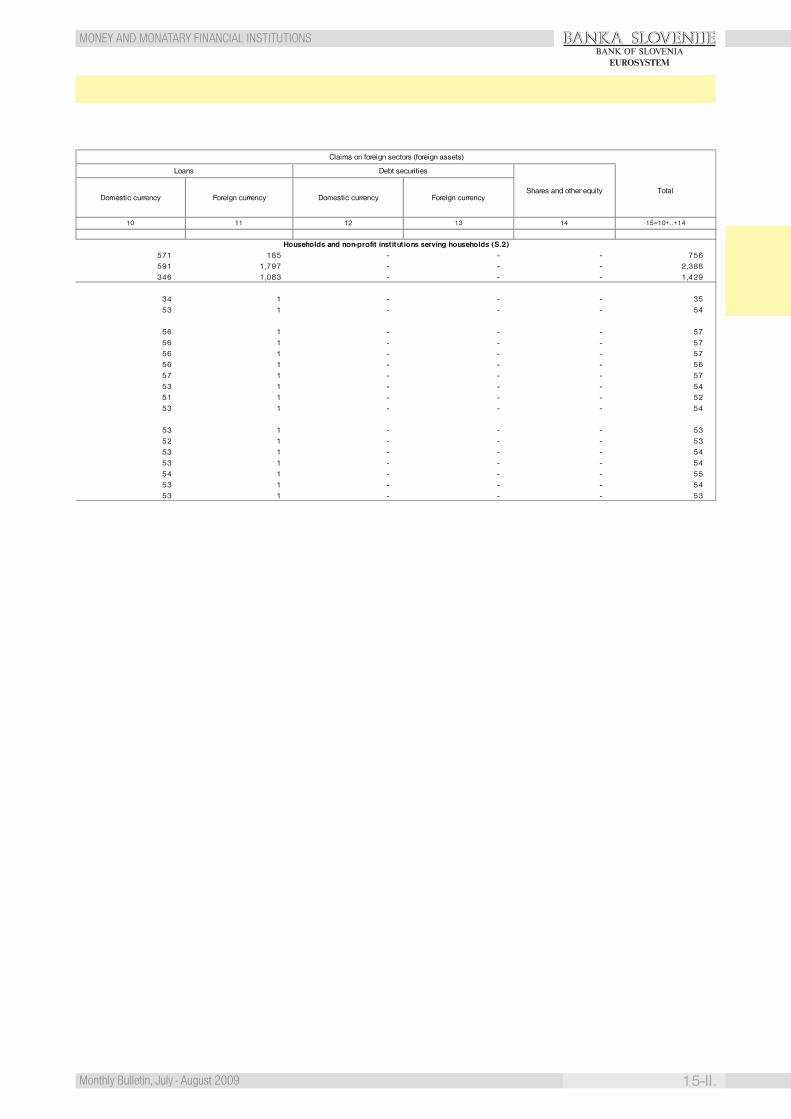
BANKA SLOVENIJE
15-II.Monthly Bulletin, July - August 2009
MONEY AND MONATARY FINANCIAL INSTITUTIONSBANK OF SLOVENIA
EUROSYSTEM
571 185 - - - 756591 1,797 - - - 2,388346 1,083 - - - 1,429
34 1 - - - 3553 1 - - - 54
56 1 - - - 5756 1 - - - 5756 1 - - - 5756 1 - - - 5657 1 - - - 5753 1 - - - 5451 1 - - - 5253 1 - - - 54
53 1 - - - 5352 1 - - - 5353 1 - - - 5453 1 - - - 5454 1 - - - 5553 1 - - - 5453 1 - - - 53
Households and non-profit institutions serving households (S.2)
Claims on foreign sectors (foreign assets)
Loans Debt securities
Shares and other equity TotalForeign currencyDomestic currency Foreign currency Domestic currency
10 11 12 13 14 15=10+..+14

BANKA SLOVENIJE
II.-16 Monthly Bulletin, July - August 2009
MONEY AND MONETARY FINANCIAL INSTITUTIONSBANK OF SLOVENIA
EUROSYSTEM
1.6. Selected Obligations of Other Monetary Financial Institutions by Sector
Column
Code
2004 31.dec. 856,363 1,070,941 355,475 114,064 362,894 627,003 239,626 33,987 122,515 71,413 3,854,2812005 31.dec. 986,985 1,175,499 309,939 137,836 534,802 481,200 295,169 35,404 177,327 61,245 4,195,4052006 31.dec. 1,178,571 1,251,225 292,397 181,198 552,743 545,504 318,261 38,019 193,038 58,982 4,609,937
2007 31.dec. 6,887 8,913 2,857 1,372 218 248 56 37 1,139 - 21,7262008 31.dec. 6,605 10,971 4,157 1,396 215 198 41 36 1,293 - 24,911
2008 31.maj. 6,841 9,292 3,046 1,434 225 224 42 36 1,115 - 22,25430.jun. 7,071 9,439 3,170 1,464 218 196 42 32 1,070 - 22,70131.jul. 6,744 9,936 3,241 1,420 220 192 43 36 1,062 - 22,894
31.avg. 6,703 9,929 3,378 1,455 228 190 42 42 1,066 - 23,03330.sep. 6,918 10,038 3,519 1,517 218 196 43 36 1,068 - 23,55331.okt. 6,666 10,530 3,555 1,426 244 213 44 36 1,053 - 23,76730.nov. 6,577 10,659 3,727 1,422 247 227 42 35 1,023 - 23,96031.dec. 6,605 10,971 4,157 1,396 215 198 41 36 1,293 - 24,911
2009 31.jan. 6,415 11,246 4,542 1,360 242 181 42 39 1,565 - 25,63228.feb. 6,421 12,053 4,729 1,284 230 195 43 34 1,570 - 26,558
31.mar. 6,609 11,705 4,827 1,193 233 177 42 39 1,556 - 26,38030.apr. 6,610 12,951 4,876 1,212 231 180 42 36 1,554 - 27,691
31.maj. 6,876 13,053 4,868 1,223 251 166 41 37 1,543 - 28,05730.jun. 7,163 12,015 6,142 1,216 249 170 39 34 1,537 - 28,56531.jul. 6,862 10,560 7,560 1,184 239 166 39 36 1,533 - 28,180
2004 31.dec. 4,655 44,476 23,290 1,949 6,262 17,101 33,163 396 30,368 4,023 165,6842005 31.dec. 6,658 26,368 20,605 1,641 10,605 17,442 49,437 - 62,759 3,239 198,7542006 31.dec. 17,386 49,451 22,204 1,721 13,434 18,484 48,464 - 85,143 3,623 259,910
2007 31.dec. 5 458 1,110 9 9 47 15 - 387 - 2,0392008 31.dec. 8 1,492 1,705 16 5 35 9 - 590 - 3,860
2008 31.maj. 10 490 1,136 9 5 32 9 - 349 - 2,04130.jun. 18 486 1,173 10 7 19 9 - 339 - 2,06031.jul. 10 432 1,207 9 4 10 9 - 343 - 2,026
31.avg. 8 448 1,256 10 4 10 9 - 349 - 2,09430.sep. 18 636 1,277 9 5 12 10 - 355 - 2,32231.okt. 4 1,117 1,280 11 4 21 10 - 356 - 2,80430.nov. 6 1,193 1,401 11 5 41 9 - 360 - 3,02831.dec. 8 1,492 1,705 16 5 35 9 - 590 - 3,860
2009 31.jan. 6 1,270 1,914 14 4 17 10 - 846 - 4,08128.feb. 9 1,206 1,905 13 4 29 10 - 854 - 4,029
31.mar. 16 1,244 1,885 14 7 24 9 - 862 - 4,06130.apr. 12 1,365 1,886 14 4 31 9 - 868 - 4,189
31.maj. 12 1,869 1,904 17 6 24 9 - 868 - 4,71030.jun. 56 1,127 3,144 13 6 26 8 - 865 - 5,24731.jul. 26 1,018 3,167 13 5 27 8 - 850 - 5,113
2004 31.dec. 10,037 96,099 113,383 16,535 3,061 14,928 93,406 63 44,682 41,998 434,1922005 31.dec. 10,513 73,011 75,832 18,349 5,086 11,650 110,765 35 63,255 34,923 403,4182006 31.dec. 21,978 86,140 55,483 36,869 18,536 10,513 134,836 138 71,909 32,264 468,666
2007 31.dec. 181 504 259 213 16 3 - 7 493 - 1,6762008 31.dec. 118 491 303 151 17 1 0 0 481 - 1,562
2008 31.maj. 147 466 269 177 41 7 - 1 523 - 1,63130.jun. 148 438 304 175 28 9 0 1 486 - 1,58931.jul. 142 458 297 151 25 6 0 0 476 - 1,556
31.avg. 146 424 298 185 32 6 0 0 473 - 1,56430.sep. 192 440 292 212 22 5 0 0 474 - 1,63731.okt. 141 477 302 139 30 4 0 - 459 - 1,55230.nov. 113 448 310 140 26 2 0 - 445 - 1,48431.dec. 118 491 303 151 17 1 0 0 481 - 1,562
2009 31.jan. 105 489 329 150 22 1 0 0 490 - 1,58628.feb. 96 514 373 173 19 2 0 0 487 - 1,664
31.mar. 102 542 381 140 19 1 0 0 476 - 1,66130.apr. 99 465 365 153 21 1 0 0 466 - 1,569
31.maj. 124 413 376 166 37 2 0 0 459 - 1,57830.jun. 132 409 383 182 38 - - 0 471 - 1,61531.jul. 115 404 398 203 27 0 - 0 471 - 1,618
MFIs (S.121,S.122)
Non-MFIs (S.123,S.124,S.125)
Total
8 9 10 11=3+..+101 2 3 4 5 6 7
Long-term Short-term Long-termOvernight
With agreed maturity Reedemable at noticeShort-term
Foreign currencyDomestic currency
Foreign currencyOvernight
With agreed maturity Reedemable at notice
Until 31.12.2006 in mio SIT from 01.01.2007 in mio EUR
Obligations to domestic sectors (domestic liabilities)
Deposits Debt securities issued
TotalDomestic currency

BANKA SLOVENIJE
17-II.Monthly Bulletin, July - August 2009
MONEY AND MONATARY FINANCIAL INSTITUTIONSBANK OF SLOVENIA
EUROSYSTEM
10,836 16,311 36,035 2 32,878 130,822 875,825 1,060 1,350 56,314 1,161,43421,896 42,339 55,272 463 36,869 232,897 1,584,184 691 249 87,443 2,062,30328,714 5,474 9,620 110 38,450 313,813 2,153,848 14 1,093 98,766 2,649,902
257 2,573 11,288 5 23 251 1,432 0 390 - 16,217210 3,087 12,076 4 22 269 1,744 0 468 - 17,879
200 3,115 11,796 6 33 339 1,608 0 495 - 17,591316 3,871 12,124 6 29 351 1,617 0 470 - 18,784187 3,878 12,147 6 25 330 1,649 0 471 - 18,693214 3,973 12,128 17 35 375 1,673 0 470 - 18,886205 3,407 12,262 10 29 397 1,710 0 470 - 18,490211 3,763 12,098 8 27 358 1,828 0 468 - 18,762212 2,950 12,313 8 28 275 1,761 0 468 - 18,014210 3,087 12,076 4 22 269 1,744 0 468 - 17,879
209 2,983 12,023 4 27 240 1,734 0 468 - 17,689192 2,741 11,959 6 27 212 1,683 0 466 - 17,286195 2,316 12,185 4 33 195 1,625 0 466 - 17,020181 2,230 11,913 6 29 161 1,557 0 366 - 16,443205 2,621 11,829 4 34 154 1,508 0 366 - 16,722228 1,384 11,808 9 37 145 1,446 0 317 - 15,374200 2,235 11,247 5 34 144 1,395 0 1,810 - 17,070
4,120 13,596 35,410 - 7,698 103,342 848,210 - 1,350 56,286 1,004,01214,836 38,958 54,705 308 8,108 217,019 1,538,579 110 201 87,406 1,960,22920,031 2,562 9,249 - 11,281 293,780 2,102,275 - 1,020 98,624 2,538,821
45 2,225 11,071 - 5 231 1,348 - 388 - 15,31471 2,893 11,815 - 7 251 1,607 - 437 - 17,081
50 2,818 11,574 - 15 317 1,505 - 489 - 16,769148 3,580 11,903 2 11 335 1,515 - 440 - 17,933
38 3,611 11,899 2 6 306 1,522 - 440 - 17,82351 3,714 11,874 2 9 359 1,541 - 440 - 17,99163 3,253 12,011 3 6 365 1,576 - 440 - 17,71773 3,614 11,842 - 6 326 1,683 - 438 - 17,98175 2,756 12,055 - 9 243 1,616 - 437 - 17,19171 2,893 11,815 - 7 251 1,607 - 437 - 17,081
74 2,804 11,731 - 9 223 1,589 - 437 - 16,86858 2,561 11,655 3 7 195 1,538 - 437 - 16,45466 2,131 11,876 2 13 176 1,485 - 438 - 16,18747 2,074 11,607 2 7 147 1,417 - 338 - 15,64165 2,467 11,650 - 13 141 1,492 - 338 - 16,16587 1,272 11,629 5 15 132 1,429 - 289 - 14,85859 2,116 10,928 - 12 131 1,262 - 1,782 - 16,290
50 33 15 - 5 12 526 - - - 64135 - - - 35 - 295 1 - - 36638 - - - 106 13 197 2 2 0 359
1 267 2 0 - 4 0 - 0 - 27512 1 - 0 0 3 - - 2 - 19
1 17 2 0 - 6 0 - 2 - 2816 12 2 0 - - 0 - 2 - 33
1 22 2 0 - 10 0 - 2 - 3718 12 - 1 7 - 0 - 2 - 40
1 12 - 1 - 15 - - 2 - 311 7 - 1 - 15 - - 2 - 27
12 7 - 3 0 14 - - 2 - 3912 1 - 0 0 3 - - 2 - 19
12 1 - 0 0 - - - 2 - 1612 1 - 0 0 - - - 2 - 1612 6 - 0 0 4 - - 1 - 2412 1 - 0 0 - - - 1 - 1512 1 - 0 0 - - - 1 - 1512 1 - 0 0 - - - 1 - 1512 1 - 0 0 - - - 1 - 16
MFIs (S.2)
Non-MFIs (S.2)
Total (S.2)
20 21 22=12+..+2116 17 18 1912 13 14 15
Long-term Short-term Long-termShort-term
Foreign currencyDomestic currency Foreign currency
OvernightWith agreed maturity Reedemable at
notice
Domestic currency
OvernightWith agreed maturity Reedemable at
notice
Obligations to foreign sectors (foreign liabilities)
Deposits Debt securities issued
Total
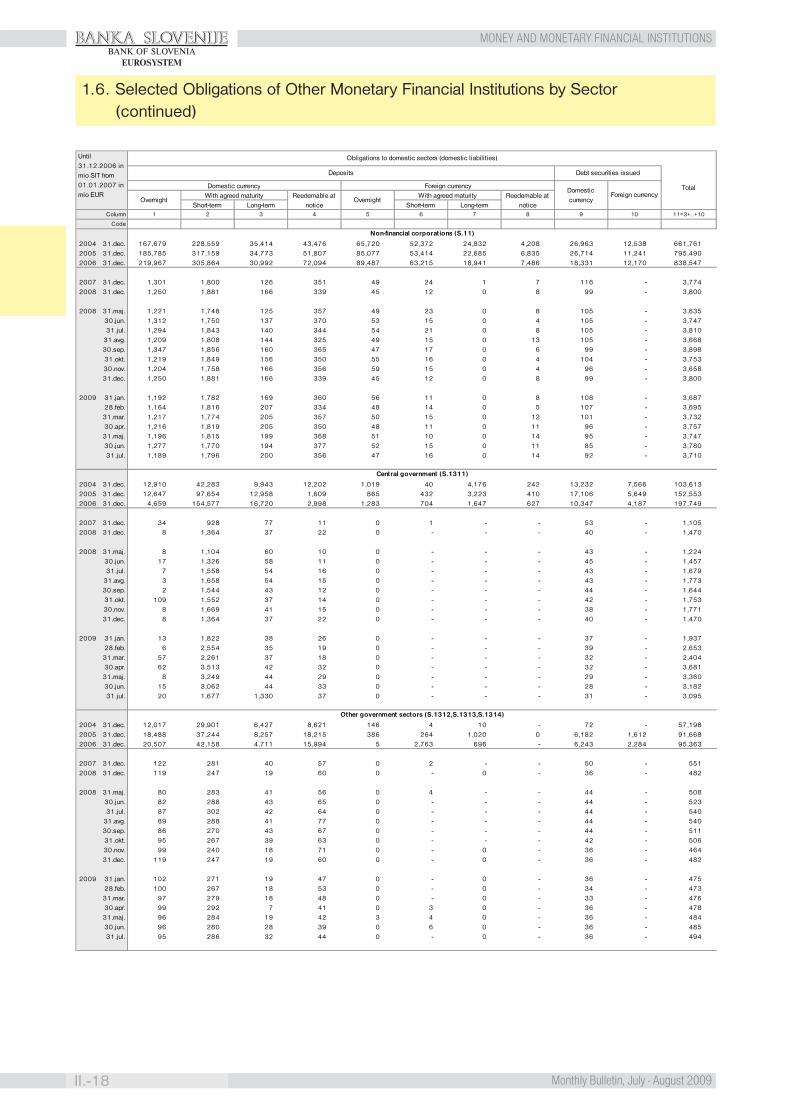
BANKA SLOVENIJE
II.-18 Monthly Bulletin, July - August 2009
MONEY AND MONETARY FINANCIAL INSTITUTIONSBANK OF SLOVENIA
EUROSYSTEM
1.6. Selected Obligations of Other Monetary Financial Institutions by Sector(continued)
Column
Code
2004 31.dec. 167,679 228,559 35,414 43,476 65,720 52,372 24,832 4,208 26,963 12,538 661,7612005 31.dec. 185,785 317,159 34,773 51,807 85,077 53,414 22,685 6,835 26,714 11,241 795,4902006 31.dec. 219,967 305,864 30,992 72,094 89,487 63,215 18,941 7,486 18,331 12,170 838,547
2007 31.dec. 1,301 1,800 126 351 49 24 1 7 116 - 3,7742008 31.dec. 1,250 1,881 166 339 45 12 0 8 99 - 3,800
2008 31.maj. 1,221 1,748 125 357 49 23 0 8 105 - 3,63530.jun. 1,312 1,750 137 370 53 15 0 4 105 - 3,74731.jul. 1,294 1,843 140 344 54 21 0 8 105 - 3,810
31.avg. 1,209 1,808 144 325 49 15 0 13 105 - 3,66830.sep. 1,347 1,856 160 365 47 17 0 6 99 - 3,89831.okt. 1,219 1,849 156 350 55 16 0 4 104 - 3,75330.nov. 1,204 1,758 166 356 59 15 0 4 96 - 3,65831.dec. 1,250 1,881 166 339 45 12 0 8 99 - 3,800
2009 31.jan. 1,192 1,782 169 360 56 11 0 8 108 - 3,68728.feb. 1,164 1,816 207 334 48 14 0 5 107 - 3,695
31.mar. 1,217 1,774 205 357 50 15 0 12 101 - 3,73230.apr. 1,216 1,819 205 350 48 11 0 11 96 - 3,757
31.maj. 1,196 1,815 199 368 51 10 0 14 95 - 3,74730.jun. 1,277 1,770 194 377 52 15 0 11 85 - 3,78031.jul. 1,189 1,796 200 356 47 16 0 14 92 - 3,710
2004 31.dec. 12,910 42,283 9,943 12,202 1,019 40 4,176 242 13,232 7,566 103,6132005 31.dec. 12,647 97,654 12,958 1,609 865 432 3,223 410 17,106 5,649 152,5532006 31.dec. 4,659 154,577 16,720 2,998 1,283 704 1,647 627 10,347 4,187 197,749
2007 31.dec. 34 928 77 11 0 1 - - 53 - 1,1052008 31.dec. 8 1,364 37 22 0 - - - 40 - 1,470
2008 31.maj. 8 1,104 60 10 0 - - - 43 - 1,22430.jun. 17 1,326 58 11 0 - - - 45 - 1,45731.jul. 7 1,558 54 16 0 - - - 43 - 1,679
31.avg. 3 1,658 54 15 0 - - - 43 - 1,77330.sep. 2 1,544 43 12 0 - - - 44 - 1,64431.okt. 109 1,552 37 14 0 - - - 42 - 1,75330.nov. 8 1,669 41 15 0 - - - 38 - 1,77131.dec. 8 1,364 37 22 0 - - - 40 - 1,470
2009 31.jan. 13 1,822 38 26 0 - - - 37 - 1,93728.feb. 6 2,554 35 19 0 - - - 39 - 2,653
31.mar. 57 2,261 37 18 0 - - - 32 - 2,40430.apr. 62 3,513 42 32 0 - - - 32 - 3,681
31.maj. 8 3,249 44 29 0 - - - 29 - 3,36030.jun. 15 3,062 44 33 0 - - - 28 - 3,18231.jul. 20 1,677 1,330 37 0 - - - 31 - 3,095
2004 31.dec. 12,017 29,901 6,427 8,621 146 4 10 - 72 - 57,1982005 31.dec. 18,488 37,244 8,257 18,215 386 264 1,020 0 6,182 1,612 91,6682006 31.dec. 20,507 42,158 4,711 15,994 5 2,763 696 - 6,243 2,284 95,363
2007 31.dec. 122 281 40 57 0 2 - - 50 - 5512008 31.dec. 119 247 19 60 0 - 0 - 36 - 482
2008 31.maj. 80 283 41 56 0 4 - - 44 - 50830.jun. 82 288 43 65 0 - - - 44 - 52331.jul. 87 302 42 64 0 - - - 44 - 540
31.avg. 89 288 41 77 0 - - - 44 - 54030.sep. 86 270 43 67 0 - - - 44 - 51131.okt. 95 267 39 63 0 - - - 42 - 50630.nov. 99 240 18 71 0 - 0 - 36 - 46431.dec. 119 247 19 60 0 - 0 - 36 - 482
2009 31.jan. 102 271 19 47 0 - 0 - 36 - 47528.feb. 100 267 18 53 0 - 0 - 34 - 473
31.mar. 97 279 18 48 0 - 0 - 33 - 47630.apr. 99 292 7 41 0 3 0 - 36 - 478
31.maj. 96 284 19 42 3 4 0 - 36 - 48430.jun. 96 280 28 39 0 6 0 - 36 - 48531.jul. 95 286 32 44 0 - 0 - 36 - 494
Central government (S.1311)
Other government sectors (S.1312,S.1313,S.1314)
Non-financial corporations (S.11)
8 9 10 11=3+..+101 2 3 4 5 6 7
Long-term Short-term Long-termOvernight
With agreed maturity Reedemable at noticeShort-term
Foreign currencyDomestic currency
Foreign currencyOvernight
With agreed maturity Reedemable at notice
Until 31.12.2006 in mio SIT from 01.01.2007 in mio EUR
Obligations to domestic sectors (domestic liabilities)
Deposits Debt securities issued
TotalDomestic currency
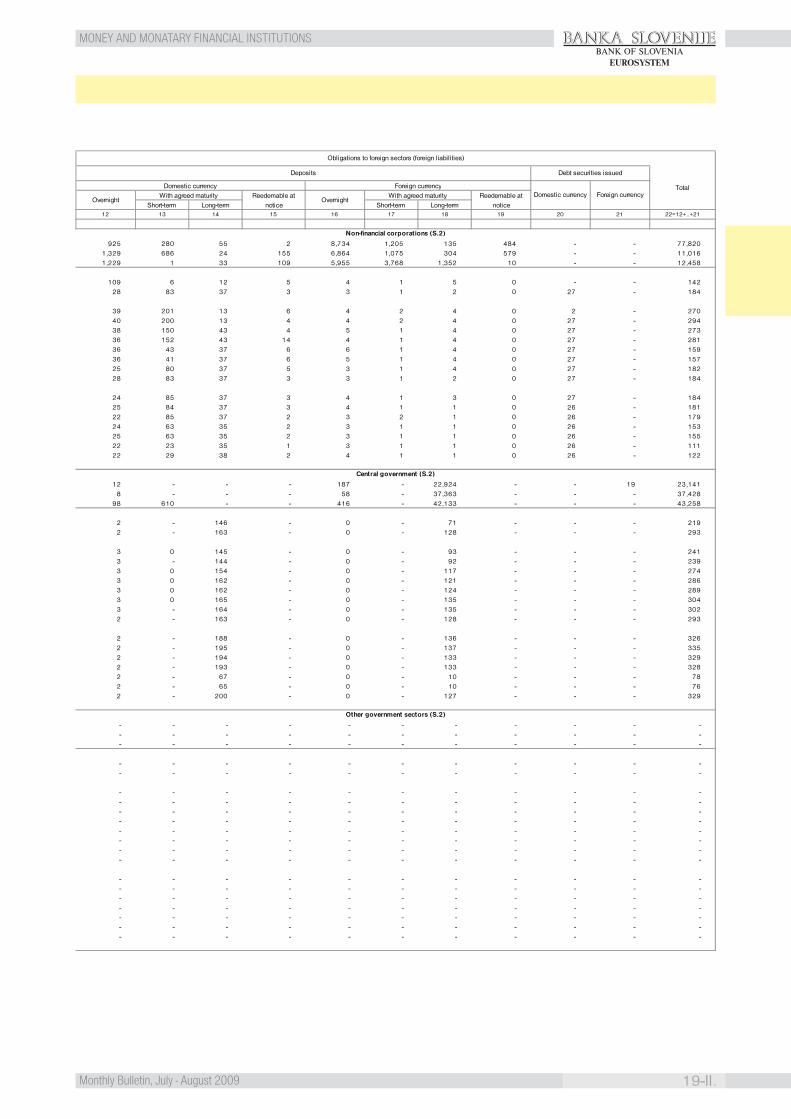
BANKA SLOVENIJE
19-II.Monthly Bulletin, July - August 2009
MONEY AND MONATARY FINANCIAL INSTITUTIONSBANK OF SLOVENIA
EUROSYSTEM
925 280 55 2 8,734 1,205 135 484 - - 77,8201,329 686 24 155 6,864 1,075 304 579 - - 11,0161,229 1 33 109 5,955 3,768 1,352 10 - - 12,458
109 6 12 5 4 1 5 0 - - 14228 83 37 3 3 1 2 0 27 - 184
39 201 13 6 4 2 4 0 2 - 27040 200 13 4 4 2 4 0 27 - 29438 150 43 4 5 1 4 0 27 - 27336 152 43 14 4 1 4 0 27 - 28136 43 37 6 6 1 4 0 27 - 15936 41 37 6 5 1 4 0 27 - 15725 80 37 5 3 1 4 0 27 - 18228 83 37 3 3 1 2 0 27 - 184
24 85 37 3 4 1 3 0 27 - 18425 84 37 3 4 1 1 0 26 - 18122 85 37 2 3 2 1 0 26 - 17924 63 35 2 3 1 1 0 26 - 15325 63 35 2 3 1 1 0 26 - 15522 23 35 1 3 1 1 0 26 - 11122 29 38 2 4 1 1 0 26 - 122
12 - - - 187 - 22,924 - - 19 23,1418 - - - 58 - 37,363 - - - 37,428
98 610 - - 416 - 42,133 - - - 43,258
2 - 146 - 0 - 71 - - - 2192 - 163 - 0 - 128 - - - 293
3 0 145 - 0 - 93 - - - 2413 - 144 - 0 - 92 - - - 2393 0 154 - 0 - 117 - - - 2743 0 162 - 0 - 121 - - - 2863 0 162 - 0 - 124 - - - 2893 0 165 - 0 - 135 - - - 3043 - 164 - 0 - 135 - - - 3022 - 163 - 0 - 128 - - - 293
2 - 188 - 0 - 136 - - - 3262 - 195 - 0 - 137 - - - 3352 - 194 - 0 - 133 - - - 3292 - 193 - 0 - 133 - - - 3282 - 67 - 0 - 10 - - - 782 - 65 - 0 - 10 - - - 762 - 200 - 0 - 127 - - - 329
- - - - - - - - - - -- - - - - - - - - - -- - - - - - - - - - -
- - - - - - - - - - -- - - - - - - - - - -
- - - - - - - - - - -- - - - - - - - - - -- - - - - - - - - - -- - - - - - - - - - -- - - - - - - - - - -- - - - - - - - - - -- - - - - - - - - - -- - - - - - - - - - -
- - - - - - - - - - -- - - - - - - - - - -- - - - - - - - - - -- - - - - - - - - - -- - - - - - - - - - -- - - - - - - - - - -- - - - - - - - - - -
Central government (S.2)
Other government sectors (S.2)
Non-financial corporations (S.2)
20 21 22=12+..+2116 17 18 1912 13 14 15
Long-term Short-term Long-termShort-term
Foreign currencyDomestic currency Foreign currency
OvernightWith agreed maturity Reedemable at
notice
Domestic currency
OvernightWith agreed maturity Reedemable at
notice
Obligations to foreign sectors (foreign liabilities)
Deposits Debt securities issued
Total

BANKA SLOVENIJE
II.-20 Monthly Bulletin, July - August 2009
MONEY AND MONETARY FINANCIAL INSTITUTIONSBANK OF SLOVENIA
EUROSYSTEM
1.6. Selected Obligations of Other Monetary Financial Institutions by Sector(continued)
Column
Code
2004 31.Dec. 649,064 629,624 167,017 31,281 286,685 542,558 84,040 29,079 7,198 5,288 2,431,8342005 31.Dec. 752,894 624,063 157,515 46,215 432,783 397,997 108,039 28,124 1,310 4,581 2,553,5222006 31.Dec. 894,073 613,034 162,287 51,521 429,998 449,825 113,676 29,769 1,065 4,455 2,749,703
2007 31.Dec. 5,244 4,942 1,246 732 143 171 40 24 40 - 12,5822008 31.Dec. 5,103 5,495 1,927 809 147 150 31 29 48 - 13,737
2008 31.May. 5,377 5,201 1,415 825 130 158 33 26 51 - 13,21530.Jun. 5,493 5,150 1,456 833 130 154 32 27 51 - 13,32531.Jul. 5,203 5,342 1,502 835 136 154 33 27 51 - 13,28331.Aug. 5,248 5,303 1,585 842 143 159 33 29 51 - 13,39330.Sep. 5,274 5,293 1,703 851 143 162 33 30 51 - 13,54131.Oct. 5,100 5,268 1,742 849 154 172 33 32 50 - 13,39930.Nov. 5,147 5,351 1,792 829 156 169 33 31 49 - 13,55631.Dec. 5,103 5,495 1,927 809 147 150 31 29 48 - 13,737
2009 31.Jan. 4,996 5,612 2,073 763 159 153 33 31 48 - 13,86728.Feb. 5,046 5,696 2,190 691 159 150 33 29 50 - 14,04431.Mar. 5,119 5,605 2,301 615 157 138 32 27 52 - 14,04630.Apr. 5,121 5,498 2,371 622 158 134 32 25 55 - 14,01631.May. 5,439 5,423 2,325 601 153 127 31 23 55 - 14,17830.Jun. 5,588 5,368 2,349 572 153 123 30 23 52 - 14,25631.Jul. 5,418 5,379 2,434 531 160 122 30 22 53 - 14,149
Households and non-profit institutions serving households (S.14,S.15)
OvernightWith agreed maturity Reedemable
at noticeOvernight
With agreed maturity Reedemable at notice
Foreign currencyDomestic currency
Foreign currency
8
Until 31.12.2006 in mio SIT from 01.01.2007 in mio EUR
Obligations to domestic sectors (domestic liabilities)
Deposits Debt securities issued
Total
1 53 4 6 7
Short-term Long-term Short-term Long-term
2
Domestic currency
9 10 11=3+..+10
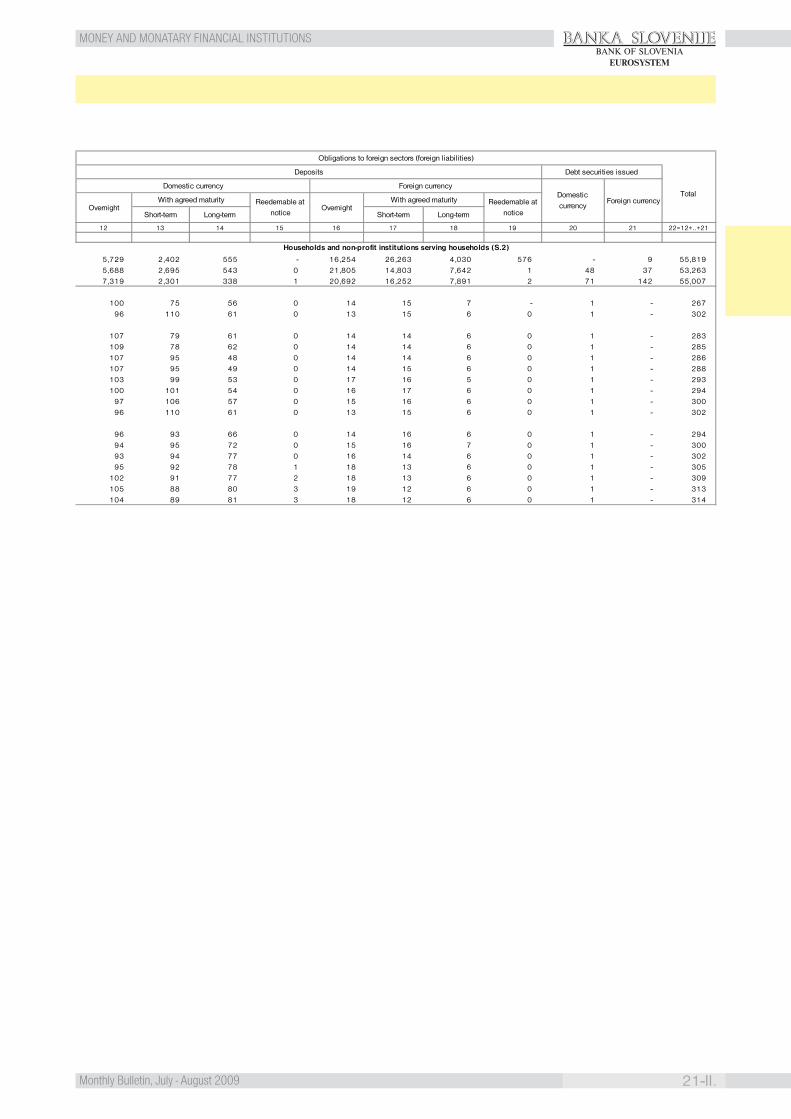
BANKA SLOVENIJE
21-II.Monthly Bulletin, July - August 2009
MONEY AND MONATARY FINANCIAL INSTITUTIONSBANK OF SLOVENIA
EUROSYSTEM
5,729 2,402 555 - 16,254 26,263 4,030 576 - 9 55,8195,688 2,695 543 0 21,805 14,803 7,642 1 48 37 53,2637,319 2,301 338 1 20,692 16,252 7,891 2 71 142 55,007
100 75 56 0 14 15 7 - 1 - 26796 110 61 0 13 15 6 0 1 - 302
107 79 61 0 14 14 6 0 1 - 283109 78 62 0 14 14 6 0 1 - 285107 95 48 0 14 14 6 0 1 - 286107 95 49 0 14 15 6 0 1 - 288103 99 53 0 17 16 5 0 1 - 293100 101 54 0 16 17 6 0 1 - 294
97 106 57 0 15 16 6 0 1 - 30096 110 61 0 13 15 6 0 1 - 302
96 93 66 0 14 16 6 0 1 - 29494 95 72 0 15 16 7 0 1 - 30093 94 77 0 16 14 6 0 1 - 30295 92 78 1 18 13 6 0 1 - 305
102 91 77 2 18 13 6 0 1 - 309105 88 80 3 19 12 6 0 1 - 313104 89 81 3 18 12 6 0 1 - 314
Households and non-profit institutions serving households (S.2)
20 21 22=12+..+2116 17 18 19
OvernightWith agreed maturity Reedemable at
noticeShort-term Long-term
Foreign currencyDomestic currency
Foreign currencyOvernight
Domestic currency
With agreed maturity Reedemable at notice
Obligations to foreign sectors (foreign liabilities)
Deposits Debt securities issued
Total
15
Short-term Long-term
12 13 14

BANKA SLOVENIJE
II.-22 Monthly Bulletin, July - August 2009
MONEY AND MONETARY FINANCIAL INSTITUTIONSBANK OF SLOVENIA
EUROSYSTEM
1.7. Balance Sheet of the Bank of Slovenia - instruments
ColumnCode
2007 31.Dec. 58 1,740 498 80 76 ... ...2008 31.Dec. 64 1,758 262 134 1,064 ... ...
2007 30.Jun. 49 1,892 480 61 52 ... ...31.Jul. 49 2,151 614 69 77 ... ...31.Aug. 49 2,148 607 38 94 ... ...30.Sep. 53 2,229 489 57 136 ... ...31.Oct. 53 2,134 472 42 136 ... ...30.Nov. 53 1,707 459 85 128 ... ...31.Dec. 58 1,740 498 80 76 ... ...
2008 31.Jan. 58 1,772 494 ... 78 ... ...29.Feb. 58 1,732 529 10 212 ... ...31.Mar. 61 1,839 418 45 187 ... ...30.Apr. 61 1,725 428 38 188 ... ...
31.May. 61 1,685 479 30 34 ... ...30.Jun. 61 1,693 456 81 42 ... ...31.Jul. 61 1,869 378 15 49 ... ...31.Aug. 61 1,788 468 1 91 ... ...30.Sep. 64 1,782 408 ... 248 ... ...31.Oct. 64 1,905 373 175 567 ... ...30.Nov. 64 1,911 325 170 634 ... ...31.Dec. 64 1,758 262 134 1,064 ... ...
2009 31.Jan. 64 1,716 214 111 822 ... ...28.Feb. 64 1,372 320 146 644 ... ...31.Mar. 71 1,384 308 193 658 ... ...30.Apr. 71 1,306 270 174 691 ... ...
31.May. 71 1,282 325 175 1,004 ... ...30.Jun. 68 1,452 313 177 1,702 ... ...31.Jul. 68 1,531 234 109 1,632 ... ...
Millions of EUR
5 6 7
Structural reverse operations
Longer-term refinancing operations
1 2 3 4
Assets
Lending to euro area credit institutionsrelated to monetary policy operations in euro
Gold and gold receivables
Claims on non-euro area residents
Claims on euro area residents in foreign
currencyFine-tuning reverse
operationsMain refinancing
operations
ColumnCode
2007 31.Dec. 2,900 97 66 335 16 5 ...2008 31. Dec. 3,215 62 72 403 582 ... ...
2007 30. Jun. 2,719 50 69 346 0 0 ...31. Jul. 2,749 61 69 333 0 0 ...31. Aug. 2,735 59 69 329 0 0 ...30. Sep. 2,735 34 65 337 0 0 ...31. Oct. 2,754 93 67 398 0 0 ...30. Nov. 2,769 42 66 462 20 0 ...31. Dec. 2,900 97 66 335 16 5 ...
2008 31. Jan. 2,741 89 63 382 ... ... ...29. Feb. 2,756 41 64 387 ... ... ...31. Mar. 2,785 47 59 392 ... ... ...30. Apr. 2,822 47 61 418 ... ... ...
31. May. 2,832 29 61 417 3 ... ...30. Jun. 2,860 47 62 431 9 ... ...31. Jul. 2,894 37 62 439 7 ... ...31. Aug. 2,880 38 62 384 10 ... ...30. Sep. 2,883 61 68 461 150 ... ...31. Oct. 3,067 69 69 431 445 ... ...30. Nov. 3,082 88 69 391 343 ... ...31. Dec. 3,215 62 72 403 582 ... ...
2009 31. Jan. 3,207 119 72 385 312 ... ...28. Feb. 3,216 37 71 417 136 ... ...31. Mar. 3,238 33 74 446 114 ... ...30. Apr. 3,290 38 74 383 123 ... ...
31. May. 3,300 44 74 451 34 ... ...30. Jun. 3,311 37 69 466 461 ... ...31. Jul. 3,350 40 69 464 437 ... ...
Fine-tuning reverse operations
Banknotes in circulation
Liabilities to non-euro area residents
Liabilities to euro area residents in foreign
currency
Liabilities
1 2 3 4
Liabilities to euro area credit instiutions related to monetary policy operations in euro
Current accounts (covering the minimum reserve
system)Deposit facility Fixed-term deposits
76
Millions of EUR
5
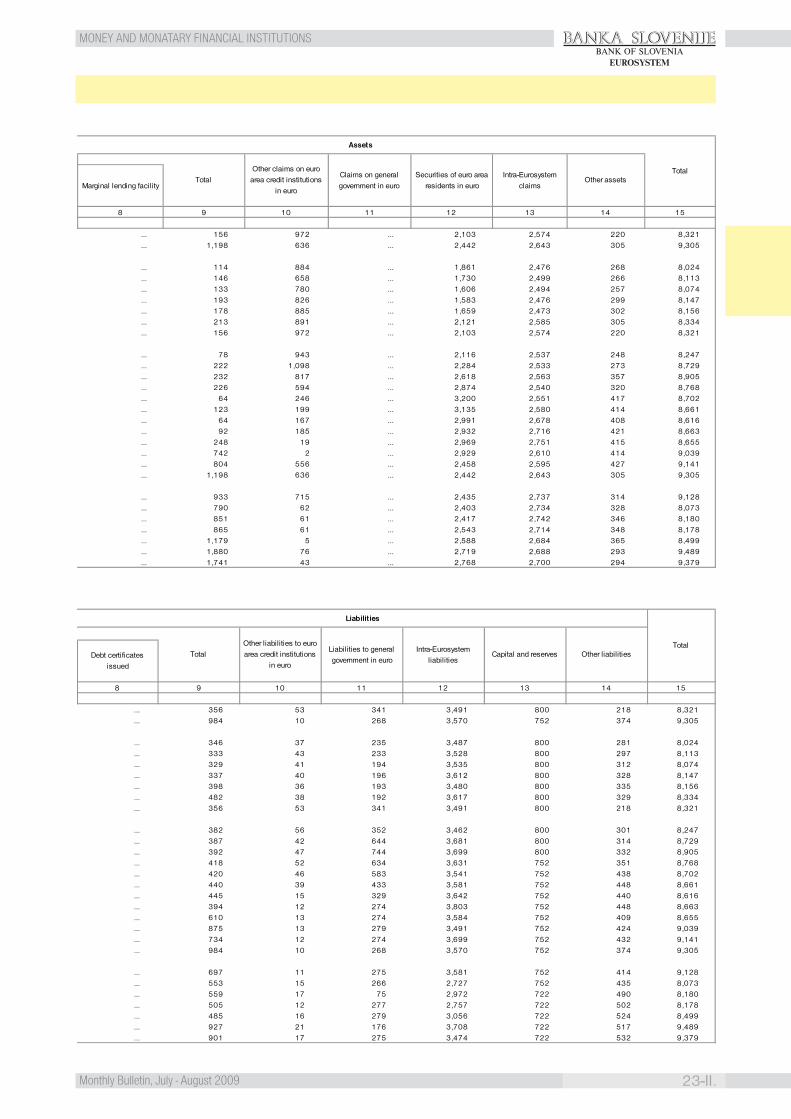
BANKA SLOVENIJE
23-II.Monthly Bulletin, July - August 2009
MONEY AND MONATARY FINANCIAL INSTITUTIONSBANK OF SLOVENIA
EUROSYSTEM
... 156 972 ... 2,103 2,574 220 8,321
... 1,198 636 ... 2,442 2,643 305 9,305
... 114 884 ... 1,861 2,476 268 8,024
... 146 658 ... 1,730 2,499 266 8,113
... 133 780 ... 1,606 2,494 257 8,074
... 193 826 ... 1,583 2,476 299 8,147
... 178 885 ... 1,659 2,473 302 8,156
... 213 891 ... 2,121 2,585 305 8,334
... 156 972 ... 2,103 2,574 220 8,321
... 78 943 ... 2,116 2,537 248 8,247
... 222 1,098 ... 2,284 2,533 273 8,729
... 232 817 ... 2,618 2,563 357 8,905
... 226 594 ... 2,874 2,540 320 8,768
... 64 246 ... 3,200 2,551 417 8,702
... 123 199 ... 3,135 2,580 414 8,661
... 64 167 ... 2,991 2,678 408 8,616
... 92 185 ... 2,932 2,716 421 8,663
... 248 19 ... 2,969 2,751 415 8,655
... 742 2 ... 2,929 2,610 414 9,039
... 804 556 ... 2,458 2,595 427 9,141
... 1,198 636 ... 2,442 2,643 305 9,305
... 933 715 ... 2,435 2,737 314 9,128
... 790 62 ... 2,403 2,734 328 8,073
... 851 61 ... 2,417 2,742 346 8,180
... 865 61 ... 2,543 2,714 348 8,178
... 1,179 5 ... 2,588 2,684 365 8,499
... 1,880 76 ... 2,719 2,688 293 9,489
... 1,741 43 ... 2,768 2,700 294 9,379
13 1411 1298
Other assets
1510
Intra-Eurosystem claimsMarginal lending facility
TotalOther claims on euro area credit institutions
in euro
Claims on general government in euro
Securities of euro area residents in euro
Assets
Total
... 356 53 341 3,491 800 218 8,321
... 984 10 268 3,570 752 374 9,305
... 346 37 235 3,487 800 281 8,024
... 333 43 233 3,528 800 297 8,113
... 329 41 194 3,535 800 312 8,074
... 337 40 196 3,612 800 328 8,147
... 398 36 193 3,480 800 335 8,156
... 482 38 192 3,617 800 329 8,334
... 356 53 341 3,491 800 218 8,321
... 382 56 352 3,462 800 301 8,247
... 387 42 644 3,681 800 314 8,729
... 392 47 744 3,699 800 332 8,905
... 418 52 634 3,631 752 351 8,768
... 420 46 583 3,541 752 438 8,702
... 440 39 433 3,581 752 448 8,661
... 445 15 329 3,642 752 440 8,616
... 394 12 274 3,803 752 448 8,663
... 610 13 274 3,584 752 409 8,655
... 875 13 279 3,491 752 424 9,039
... 734 12 274 3,699 752 432 9,141
... 984 10 268 3,570 752 374 9,305
... 697 11 275 3,581 752 414 9,128
... 553 15 266 2,727 752 435 8,073
... 559 17 75 2,972 722 490 8,180
... 505 12 277 2,757 722 502 8,178
... 485 16 279 3,056 722 524 8,499
... 927 21 176 3,708 722 517 9,489
... 901 17 275 3,474 722 532 9,379
TotalTotal
Other liabilities to euro area credit institutions
in euro
Liabilities to general government in euro
Intra-Eurosystem liabilities
1510
Capital and reservesDebt certificates issued
8
Other liabilities
9
Liabilities
13 1411 12
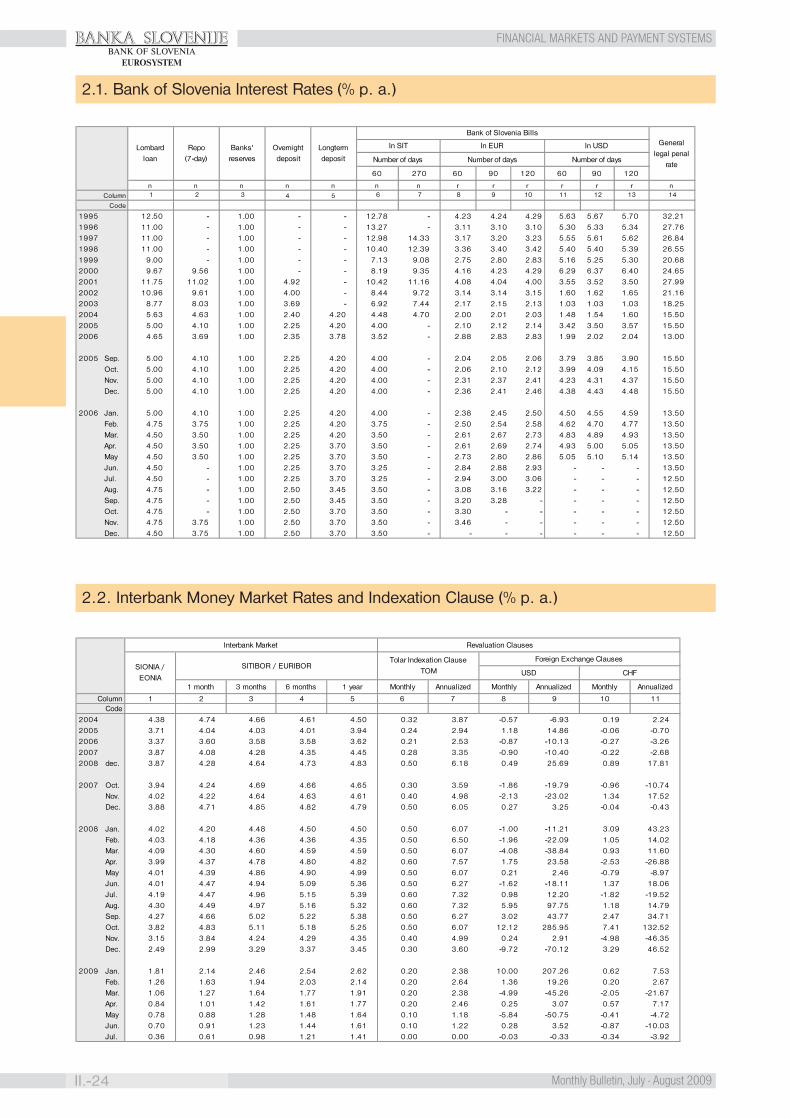
BANKA SLOVENIJE
II.-24 Monthly Bulletin, July - August 2009
FINANCIAL MARKETS AND PAYMENT SYSTEMSBANK OF SLOVENIA
EUROSYSTEM
2.1. Bank of Slovenia Interest Rates (% p. a.)
2.2. Interbank Money Market Rates and Indexation Clause (% p. a.)
Column
Code
1995 12.50 - 1.00 - - 12.78 - 4.23 4.24 4.29 5.63 5.67 5.70 32.211996 11.00 - 1.00 - - 13.27 - 3.11 3.10 3.10 5.30 5.33 5.34 27.761997 11.00 - 1.00 - - 12.98 14.33 3.17 3.20 3.23 5.55 5.61 5.62 26.841998 11.00 - 1.00 - - 10.40 12.39 3.36 3.40 3.42 5.40 5.40 5.39 26.551999 9.00 - 1.00 - - 7.13 9.08 2.75 2.80 2.83 5.16 5.25 5.30 20.682000 9.67 9.56 1.00 - - 8.19 9.35 4.16 4.23 4.29 6.29 6.37 6.40 24.652001 11.75 11.02 1.00 4.92 - 10.42 11.16 4.08 4.04 4.00 3.55 3.52 3.50 27.992002 10.96 9.61 1.00 4.00 - 8.44 9.72 3.14 3.14 3.15 1.60 1.62 1.65 21.162003 8.77 8.03 1.00 3.69 - 6.92 7.44 2.17 2.15 2.13 1.03 1.03 1.03 18.252004 5.63 4.63 1.00 2.40 4.20 4.48 4.70 2.00 2.01 2.03 1.48 1.54 1.60 15.502005 5.00 4.10 1.00 2.25 4.20 4.00 - 2.10 2.12 2.14 3.42 3.50 3.57 15.502006 4.65 3.69 1.00 2.35 3.78 3.52 - 2.88 2.83 2.83 1.99 2.02 2.04 13.00
2005 Sep. 5.00 4.10 1.00 2.25 4.20 4.00 - 2.04 2.05 2.06 3.79 3.85 3.90 15.50Oct. 5.00 4.10 1.00 2.25 4.20 4.00 - 2.06 2.10 2.12 3.99 4.09 4.15 15.50Nov. 5.00 4.10 1.00 2.25 4.20 4.00 - 2.31 2.37 2.41 4.23 4.31 4.37 15.50Dec. 5.00 4.10 1.00 2.25 4.20 4.00 - 2.36 2.41 2.46 4.38 4.43 4.48 15.50
2006 Jan. 5.00 4.10 1.00 2.25 4.20 4.00 - 2.38 2.45 2.50 4.50 4.55 4.59 13.50Feb. 4.75 3.75 1.00 2.25 4.20 3.75 - 2.50 2.54 2.58 4.62 4.70 4.77 13.50Mar. 4.50 3.50 1.00 2.25 4.20 3.50 - 2.61 2.67 2.73 4.83 4.89 4.93 13.50Apr. 4.50 3.50 1.00 2.25 3.70 3.50 - 2.61 2.69 2.74 4.93 5.00 5.05 13.50May 4.50 3.50 1.00 2.25 3.70 3.50 - 2.73 2.80 2.86 5.05 5.10 5.14 13.50Jun. 4.50 - 1.00 2.25 3.70 3.25 - 2.84 2.88 2.93 - - - 13.50Jul. 4.50 - 1.00 2.25 3.70 3.25 - 2.94 3.00 3.06 - - - 12.50Aug. 4.75 - 1.00 2.50 3.45 3.50 - 3.08 3.16 3.22 - - - 12.50Sep. 4.75 - 1.00 2.50 3.45 3.50 - 3.20 3.28 - - - - 12.50Oct. 4.75 - 1.00 2.50 3.70 3.50 - 3.30 - - - - - 12.50Nov. 4.75 3.75 1.00 2.50 3.70 3.50 - 3.46 - - - - - 12.50Dec. 4.50 3.75 1.00 2.50 3.70 3.50 - - - - - - - 12.50
Overnight deposit
n
54 10 14nr
12r
13r
11r
In EUR In USDLombard loan
Repo (7-day)
Banks' reserves
Longterm deposit
60 9012090
n n n n n n r r6 7 8 91 2 3
General legal penal
rateNumber of days Number of days Number of days
60 270 60
Bank of Slovenia Bills
120
In SIT
Revaluation Clauses
ColumnCode
2004 4.38 4.74 4.66 4.61 4.50 0.32 3.87 -0.57 -6.93 0.19 2.242005 3.71 4.04 4.03 4.01 3.94 0.24 2.94 1.18 14.86 -0.06 -0.702006 3.37 3.60 3.58 3.58 3.62 0.21 2.53 -0.87 -10.13 -0.27 -3.262007 3.87 4.08 4.28 4.35 4.45 0.28 3.35 -0.90 -10.40 -0.22 -2.682008 dec. 3.87 4.28 4.64 4.73 4.83 0.50 6.18 0.49 25.69 0.89 17.81
2007 Oct. 3.94 4.24 4.69 4.66 4.65 0.30 3.59 -1.86 -19.79 -0.96 -10.74Nov. 4.02 4.22 4.64 4.63 4.61 0.40 4.98 -2.13 -23.02 1.34 17.52Dec. 3.88 4.71 4.85 4.82 4.79 0.50 6.05 0.27 3.25 -0.04 -0.43
2008 Jan. 4.02 4.20 4.48 4.50 4.50 0.50 6.07 -1.00 -11.21 3.09 43.23Feb. 4.03 4.18 4.36 4.36 4.35 0.50 6.50 -1.96 -22.09 1.05 14.02Mar. 4.09 4.30 4.60 4.59 4.59 0.50 6.07 -4.08 -38.84 0.93 11.60Apr. 3.99 4.37 4.78 4.80 4.82 0.60 7.57 1.75 23.58 -2.53 -26.88May 4.01 4.39 4.86 4.90 4.99 0.50 6.07 0.21 2.46 -0.79 -8.97Jun. 4.01 4.47 4.94 5.09 5.36 0.50 6.27 -1.62 -18.11 1.37 18.06Jul. 4.19 4.47 4.96 5.15 5.39 0.60 7.32 0.98 12.20 -1.82 -19.52Aug. 4.30 4.49 4.97 5.16 5.32 0.60 7.32 5.95 97.75 1.18 14.79Sep. 4.27 4.66 5.02 5.22 5.38 0.50 6.27 3.02 43.77 2.47 34.71Oct. 3.82 4.83 5.11 5.18 5.25 0.50 6.07 12.12 285.95 7.41 132.52Nov. 3.15 3.84 4.24 4.29 4.35 0.40 4.99 0.24 2.91 -4.98 -46.35Dec. 2.49 2.99 3.29 3.37 3.45 0.30 3.60 -9.72 -70.12 3.29 46.52
2009 Jan. 1.81 2.14 2.46 2.54 2.62 0.20 2.38 10.00 207.26 0.62 7.53Feb. 1.26 1.63 1.94 2.03 2.14 0.20 2.64 1.36 19.26 0.20 2.67Mar. 1.06 1.27 1.64 1.77 1.91 0.20 2.38 -4.99 -45.26 -2.05 -21.67Apr. 0.84 1.01 1.42 1.61 1.77 0.20 2.46 0.25 3.07 0.57 7.17May 0.78 0.88 1.28 1.48 1.64 0.10 1.18 -5.84 -50.75 -0.41 -4.72Jun. 0.70 0.91 1.23 1.44 1.61 0.10 1.22 0.28 3.52 -0.87 -10.03Jul. 0.36 0.61 0.98 1.21 1.41 0.00 0.00 -0.03 -0.33 -0.34 -3.92
9 10 11
Monthly
AnnualizedMonthly Annualized Monthly Annualized
1 2 3 4 5 6 7 8
1 year
Foreign Exchange Clauses
Interbank Market
SIONIA / EONIA
SITIBOR / EURIBORTolar Indexation Clause
TOM USD CHF
1 month 3 months 6 months

BANKA SLOVENIJE
25-II.Monthly Bulletin, July - August 2009
FINANCIAL MARKETS AND PAYMENT SYSTEMSBANK OF SLOVENIA
EUROSYSTEM
2.3. European Central Bank Interest Rates (% p. a.)
2.3.1. Harmonised Long-term Interest Rates for Convergence Assessment Purposes (% p. a.)
ColumnCode
2003 6.382004 4.682005 3.812006 3.852007 4.532008 4.61
2007 Oct. 4.58Nov. 4.40Dec. 4.55
2008 Jan. 4.39Feb. 4.32Mar. 4.33Apr. 4.47May 4.61Jun. 4.95Jul. 5.02Aug. 4.68Sep. 4.68Oct. 4.66Nov. 4.61Dec. 4.56
2009 Jan. 4.70Feb. 4.87Mar. 4.71Apr. 4.77May 4.76Jun. 4.69Jul. 4.33
Yield to maturity
1
ColumnCode
2006 13 Dec. 2.50 3.50 4.50
2007 14 Mar. 2.75 3.75 4.7513 Jun. 3.00 4.00 5.00
2008 9 Jul. 3.25 4.25 5.258 Oct. 2.75 4.759 Oct. 3.25 4.25
15 Oct. 3.7512 Nov. 2.75 3.25 3.7510 Dec. 2.00 2.50 3.00
2009 21 Jan. 1.00 2.00 3.0011 Mar. 0.50 1.50 2.50
8 Apr. 0.25 1.25 2.2513 May. 0.25 1.00 1.75
Deposit facility
Main refinancing operations
Marginal lending facility
1 2 3

BANKA SLOVENIJE
II.-26 Monthly Bulletin, July - August 2009
FINANCIAL MARKETS AND PAYMENT SYSTEMSBANK OF SLOVENIA
EUROSYSTEM
2.4.1. Monetary Financial Institutions - Interest rates on Outstanding Amounts in Domestic Currency (% p. a.)
For house purchase
ColumnCode
2006 5.68 5.50 6.12 9.65 7.90 7.94 5.41 5.34 5.352007 6.00 6.20 6.71 8.10 7.42 7.67 5.33 5.33 5.192008 7.02 6.93 7.42 8.32 7.69 8.10 6.23 6.04 5.77
2005 May. 4.89 6.30 6.68 11.03 8.33 8.23 6.11 5.99 5.82Jun. 7.09 6.05 6.76 10.86 8.51 8.44 6.26 6.09 5.89Jul. 7.03 6.01 6.71 10.97 8.43 8.71 6.14 6.05 5.86Aug. 6.82 5.86 6.67 10.98 8.38 8.38 5.91 5.86 5.78Sep. 4.97 5.84 6.58 10.99 8.36 8.32 5.88 5.73 5.70Oct. 6.71 6.47 7.33 11.03 8.63 8.63 6.03 5.76 5.72Nov. 6.95 6.87 7.26 10.98 8.65 8.64 5.81 5.85 5.80Dec 5.33 5.60 6.23 10.66 8.15 8.09 5.69 5.59 5.52
2006 Jan. 5.12 5.38 6.13 10.99 8.11 8.06 5.59 5.49 5.50Feb. 5.19 5.50 6.30 10.89 8.13 8.10 5.58 5.48 5.52Mar. 5.15 5.35 6.06 10.73 8.16 7.98 5.46 5.43 5.44Apr 4.69 5.36 6.09 9.64 7.99 7.94 5.44 5.46 5.38May. 6.03 5.40 6.07 9.37 7.88 7.92 5.41 5.38 5.36Jun. 6.07 6.23 6.75 9.21 8.12 8.18 5.41 5.41 5.45Jul. 6.10 5.36 5.99 9.20 7.80 7.85 5.39 5.27 5.30Aug. 6.56 5.37 6.03 9.27 7.79 7.87 5.37 5.23 5.29Sep. 6.61 6.12 6.68 9.32 7.95 8.10 5.38 5.30 5.36Oct. 5.93 5.48 5.99 9.16 7.74 7.86 5.31 5.21 5.25Nov. 4.83 4.92 5.37 9.12 7.49 7.55 5.27 5.19 5.15Dec. 5.84 5.54 6.04 8.91 7.66 7.82 5.30 5.22 5.22
2007 Jan. 5.18 5.82 6.30 8.37 7.33 7.33 4.95 4.86 4.66Feb 5.62 5.95 6.38 8.44 7.38 7.45 5.01 4.97 4.77Mar. 4.93 5.89 6.36 8.28 7.36 7.48 5.09 5.05 4.90Apr. 5.54 5.96 6.43 8.15 7.37 7.52 5.12 5.12 5.00May. 5.70 5.96 6.43 8.00 7.34 7.52 5.16 5.17 5.06Jun. 5.77 5.99 6.47 7.95 7.34 7.52 5.24 5.24 5.15Jul. 5.74 6.23 6.81 7.95 7.43 7.72 5.33 5.34 5.26Aug. 6.27 6.35 6.87 8.05 7.43 7.75 5.40 5.43 5.34Sep. 6.68 6.37 6.92 8.12 7.46 7.84 5.59 5.58 5.45Oct. 6.33 6.48 7.04 8.04 7.50 7.90 5.63 5.69 5.52Nov. 6.94 6.63 7.20 7.93 7.55 7.96 5.59 5.70 5.54Dec. 7.35 6.76 7.30 7.97 7.58 8.03 5.83 5.79 5.63
2008 Jan. 7.38 6.81 7.35 8.07 7.62 8.04 5.80 5.75 5.63Feb. 7.40 6.85 7.36 8.11 7.64 8.02 5.74 5.70 5.57Mar. 7.36 6.78 7.28 8.10 7.61 7.99 5.79 5.77 5.59Apr. 7.08 6.86 7.38 8.07 7.62 8.03 5.99 5.87 5.67May. 6.24 6.74 7.34 8.14 7.60 8.02 6.11 5.94 5.73Jun. 6.32 6.81 7.35 8.15 7.61 8.04 6.23 6.04 5.80Jul. 6.65 6.88 7.54 8.29 7.69 8.17 6.40 6.21 5.93Aug. 6.89 7.13 7.60 8.44 7.74 8.23 6.51 6.25 5.97Sep. 7.15 7.11 7.56 8.56 7.79 8.25 6.61 6.38 6.07Oct. 7.39 7.17 7.64 8.64 7.86 8.31 6.82 6.52 6.13Nov. 7.32 7.08 7.42 8.71 7.78 8.10 6.59 6.29 5.88Dec. 7.02 7.00 7.22 8.60 7.69 7.93 6.21 5.80 5.22
2009 Jan. 6.93 6.41 6.36 8.12 7.38 7.31 5.56 4.83 4.40Feb. 6.98 5.49 5.97 7.99 7.22 7.04 5.50 4.62 4.04Mar. 7.02 5.35 5.70 8.02 7.12 6.79 5.59 4.43 3.80Apr. 7.11 4.88 5.06 7.96 6.94 6.46 5.59 4.18 3.40May. 7.14 4.84 4.83 7.96 6.90 6.34 5.65 4.33 3.13Jun. 7.10 4.73 4.63 7.90 6.86 6.26 5.74 4.34 2.97Jul 8.45 4.42 4.19 7.24 6.73 5.97 5.72 4.15 2.68
Over 1 and up to 5 years
5
Over 1 and up to 5 years
1
Up to 1 year
42
Over 5 years
3
Up to 1 year
Until 31.12.2006 SIT after 01.01.2007 EUR
Loans
Over 5 years Up to 1 yearOver 1 and up to
5 yearsOver 5 years
HouseholdsNon-financial corporations
For consumption
6 7 8 9

BANKA SLOVENIJE
27-II.Monthly Bulletin, July - August 2009
FINANCIAL MARKETS AND PAYMENT SYSTEMSBANK OF SLOVENIA
EUROSYSTEM
IR IR
StolpecKoda
0.32 2.99 4.31 0.56 3.33 3.91 3.89 2.99 4.09 2006 0.36 3.29 4.38 0.43 3.93 4.19 - 3.60 4.47 2007 0.46 4.35 5.19 0.50 4.69 4.78 - 4.05 5.56 2008
0.50 3.36 4.87 0.83 3.68 4.76 - 3.02 4.11 2005 May.0.46 3.27 4.86 0.96 3.69 4.61 - 3.16 3.76 Jun.0.47 3.30 4.99 0.85 3.69 4.44 - 3.03 4.07 Jul.0.47 3.27 4.95 0.88 3.71 4.25 - 2.61 4.11 Aug.0.47 3.32 4.64 0.85 3.67 3.90 - 2.58 4.19 Sep.0.46 3.32 5.63 0.70 3.66 4.40 - 3.08 4.65 Oct.0.52 3.31 5.70 0.60 3.63 4.57 - 2.81 3.80 Nov.0.43 3.28 4.46 0.63 3.64 4.16 - 2.94 3.47 Dec
0.40 3.28 4.47 0.63 3.62 4.00 - 3.13 4.10 2006 Jan.0.38 3.25 4.65 0.65 3.54 4.01 - 3.11 4.35 Feb.0.36 3.13 4.38 0.61 3.39 3.80 - 2.94 4.06 Mar.0.34 3.08 4.22 0.61 3.36 3.78 3.87 3.02 3.96 Apr0.30 3.03 4.18 0.48 3.30 3.79 3.87 3.05 3.92 May.0.30 3.02 5.27 0.62 3.25 4.11 3.87 2.98 4.97 Jun.0.30 2.92 4.11 0.57 3.16 3.78 3.87 2.99 3.94 Jul.0.30 2.88 4.10 0.54 3.23 3.79 3.87 3.00 3.97 Aug.0.28 2.86 4.96 0.55 3.27 4.30 3.87 2.93 5.04 Sep.0.27 2.82 4.07 0.51 3.29 3.82 3.87 2.93 3.91 Oct.0.28 2.83 3.24 0.50 3.30 3.81 3.95 2.91 2.97 Nov.0.27 2.84 4.05 0.44 3.27 3.96 3.95 2.92 3.83 Dec.
0.33 2.81 3.89 0.43 3.36 3.87 - 2.99 3.91 2007 Jan.0.33 2.87 4.06 0.42 3.43 4.01 - 3.21 4.14 Feb0.33 2.94 3.88 0.39 3.55 3.99 - 3.33 3.93 Mar.0.34 3.02 3.93 0.39 3.66 4.06 - 3.45 3.97 Apr.0.34 3.10 4.02 0.46 3.76 4.02 - 3.47 3.97 May.0.34 3.19 4.01 0.39 3.88 4.03 - 3.52 4.01 Jun.0.35 3.29 4.54 0.47 3.99 4.28 - 3.70 4.58 Jul.0.35 3.36 4.55 0.37 4.10 4.29 - 3.74 4.67 Aug.0.37 3.48 4.60 0.46 4.24 4.33 - 3.94 4.72 Sep.0.42 3.70 4.59 0.45 4.32 4.24 - 4.06 4.72 Oct.0.40 3.78 5.07 0.41 4.38 4.60 - 3.89 5.32 Nov.0.40 3.92 5.38 0.39 4.50 4.57 - 3.87 5.70 Dec.
0.44 4.01 5.35 0.75 4.43 4.71 - 4.21 5.63 2008 Jan.0.41 4.00 5.45 0.42 4.41 4.68 - 3.93 5.68 Feb.0.41 4.02 5.28 0.43 4.49 4.68 - 3.92 5.31 Mar.0.43 4.11 5.36 0.47 4.54 4.80 - 4.04 5.69 Apr.0.46 4.22 5.06 0.49 4.61 4.64 - 4.07 5.41 May.0.46 4.31 5.11 0.46 4.72 4.63 - 4.07 5.44 Jun.0.48 4.42 5.37 0.48 4.80 4.94 - 4.19 5.77 Jul.0.48 4.49 5.38 0.46 4.85 4.94 - 4.18 5.91 Aug.0.48 4.58 5.17 0.51 5.02 4.91 - 4.15 5.63 Sep.0.51 4.70 5.13 0.54 5.07 4.94 - 4.19 5.59 Oct.0.52 4.70 4.94 0.49 4.89 4.86 - 4.27 5.45 Nov.0.43 4.65 4.70 0.48 4.46 4.66 - 3.40 5.18 Dec.
0.48 4.54 4.45 0.46 4.20 4.27 - 2.66 4.90 2009 Jan.0.40 4.31 4.40 0.44 3.84 4.30 - 2.09 3.19 Feb.0.34 4.02 4.31 0.38 3.52 4.22 - 1.60 3.22 Mar.0.28 3.78 4.29 0.33 3.13 4.11 - 1.31 3.12 Apr.0.25 3.56 4.03 0.34 3.00 4.20 - 1.15 2.57 May.0.23 3.34 4.05 0.31 2.81 4.19 - 1.07 2.68 Jun.0.23 3.20 3.79 0.27 2.67 4.12 - 1.10 2.51 Jul
18
Up to 2 years Over 2 years Up to 2 years Over 2 years
14
Notice up to 3 months Notice over 3 months
Deposits
Repos
Overnight deposits
Time deposits with agreed maturity
Until 31.12.2006 SIT after 01.01.2007 EUR
Households Non-financial corporations
Overnight deposits
Time deposits with agreed maturity
Deposits redeemable at notice1,2
Households and non-financial corporations
10 11 15 16 1712 13
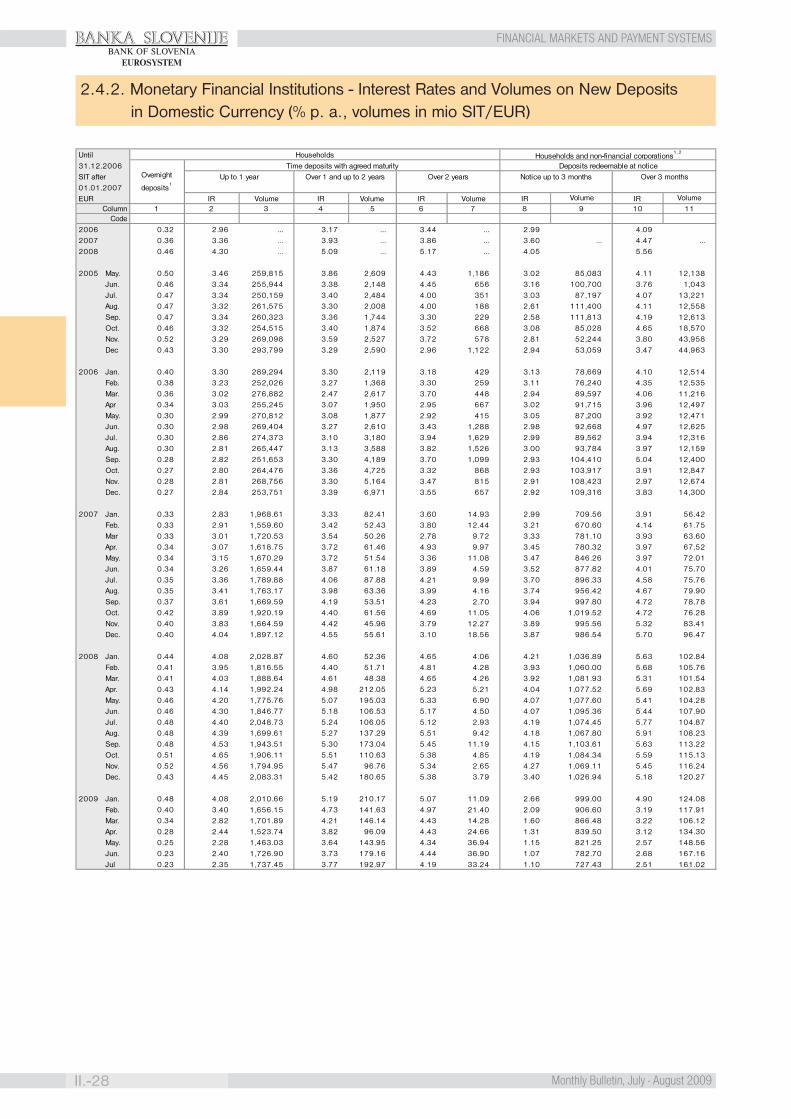
BANKA SLOVENIJE
II.-28 Monthly Bulletin, July - August 2009
FINANCIAL MARKETS AND PAYMENT SYSTEMSBANK OF SLOVENIA
EUROSYSTEM
2.4.2. Monetary Financial Institutions - Interest Rates and Volumes on New Deposits in Domestic Currency (% p. a., volumes in mio SIT/EUR)
Households Households and non-financial corporations1,2
Time deposits with agreed maturity Deposits redeemable at noticeUp to 1 year Over 1 and up to 2 years Over 2 years Notice up to 3 months Over 3 months
ColumnCode
2006 0.32 2.96 ... 3.17 ... 3.44 ... 2.99 4.09 2007 0.36 3.36 ... 3.93 ... 3.86 ... 3.60 ... 4.47 ...2008 0.46 4.30 ... 5.09 ... 5.17 ... 4.05 5.56
2005 May. 0.50 3.46 259,815 3.86 2,609 4.43 1,186 3.02 85,083 4.11 12,138Jun. 0.46 3.34 255,944 3.38 2,148 4.45 656 3.16 100,700 3.76 1,043Jul. 0.47 3.34 250,159 3.40 2,484 4.00 351 3.03 87,197 4.07 13,221Aug. 0.47 3.32 261,575 3.30 2,008 4.00 188 2.61 111,400 4.11 12,558Sep. 0.47 3.34 260,323 3.36 1,744 3.30 229 2.58 111,813 4.19 12,613Oct. 0.46 3.32 254,515 3.40 1,874 3.52 668 3.08 85,028 4.65 18,570Nov. 0.52 3.29 269,098 3.59 2,527 3.72 578 2.81 52,244 3.80 43,958Dec 0.43 3.30 293,799 3.29 2,590 2.96 1,122 2.94 53,059 3.47 44,963
2006 Jan. 0.40 3.30 289,294 3.30 2,119 3.18 429 3.13 78,669 4.10 12,514Feb. 0.38 3.23 252,026 3.27 1,368 3.30 259 3.11 76,240 4.35 12,535Mar. 0.36 3.02 276,882 2.47 2,617 3.70 448 2.94 89,597 4.06 11,216Apr 0.34 3.03 255,245 3.07 1,950 2.95 667 3.02 91,715 3.96 12,497May. 0.30 2.99 270,812 3.08 1,877 2.92 415 3.05 87,200 3.92 12,471Jun. 0.30 2.98 269,404 3.27 2,610 3.43 1,288 2.98 92,668 4.97 12,625Jul. 0.30 2.86 274,373 3.10 3,180 3.94 1,629 2.99 89,562 3.94 12,316Aug. 0.30 2.81 265,447 3.13 3,588 3.82 1,526 3.00 93,784 3.97 12,159Sep. 0.28 2.82 251,653 3.30 4,189 3.70 1,099 2.93 104,410 5.04 12,400Oct. 0.27 2.80 264,476 3.36 4,725 3.32 868 2.93 103,917 3.91 12,847Nov. 0.28 2.81 268,756 3.30 5,164 3.47 815 2.91 108,423 2.97 12,674Dec. 0.27 2.84 253,751 3.39 6,971 3.55 657 2.92 109,316 3.83 14,300
2007 Jan. 0.33 2.83 1,968.61 3.33 82.41 3.60 14.93 2.99 709.56 3.91 56.42Feb. 0.33 2.91 1,559.60 3.42 52.43 3.80 12.44 3.21 670.60 4.14 61.75Mar 0.33 3.01 1,720.53 3.54 50.26 2.78 9.72 3.33 781.10 3.93 63.60Apr. 0.34 3.07 1,618.75 3.72 61.46 4.93 9.97 3.45 780.32 3.97 67.52May. 0.34 3.15 1,670.29 3.72 51.54 3.36 11.08 3.47 846.26 3.97 72.01Jun. 0.34 3.26 1,659.44 3.87 61.18 3.89 4.59 3.52 877.82 4.01 75.70Jul. 0.35 3.36 1,789.88 4.06 87.88 4.21 9.99 3.70 896.33 4.58 75.76Aug. 0.35 3.41 1,763.17 3.98 63.36 3.99 4.16 3.74 956.42 4.67 79.90Sep. 0.37 3.61 1,669.59 4.19 53.51 4.23 2.70 3.94 997.80 4.72 78.78Oct. 0.42 3.89 1,920.19 4.40 61.56 4.69 11.05 4.06 1,019.52 4.72 76.28Nov. 0.40 3.83 1,664.59 4.42 45.96 3.79 12.27 3.89 995.56 5.32 83.41Dec. 0.40 4.04 1,897.12 4.55 55.61 3.10 18.56 3.87 986.54 5.70 96.47
2008 Jan. 0.44 4.08 2,028.87 4.60 52.36 4.65 4.06 4.21 1,036.89 5.63 102.84Feb. 0.41 3.95 1,816.55 4.40 51.71 4.81 4.28 3.93 1,060.00 5.68 105.76Mar. 0.41 4.03 1,888.64 4.61 48.38 4.65 4.26 3.92 1,081.93 5.31 101.54Apr. 0.43 4.14 1,992.24 4.98 212.05 5.23 5.21 4.04 1,077.52 5.69 102.83May. 0.46 4.20 1,775.76 5.07 195.03 5.33 6.90 4.07 1,077.60 5.41 104.28Jun. 0.46 4.30 1,846.77 5.18 106.53 5.17 4.50 4.07 1,095.36 5.44 107.90Jul. 0.48 4.40 2,048.73 5.24 106.05 5.12 2.93 4.19 1,074.45 5.77 104.87Aug. 0.48 4.39 1,699.61 5.27 137.29 5.51 9.42 4.18 1,067.80 5.91 108.23Sep. 0.48 4.53 1,943.51 5.30 173.04 5.45 11.19 4.15 1,103.61 5.63 113.22Oct. 0.51 4.65 1,906.11 5.51 110.63 5.38 4.85 4.19 1,084.34 5.59 115.13Nov. 0.52 4.56 1,794.95 5.47 96.76 5.34 2.65 4.27 1,069.11 5.45 116.24Dec. 0.43 4.45 2,083.31 5.42 180.65 5.38 3.79 3.40 1,026.94 5.18 120.27
2009 Jan. 0.48 4.08 2,010.66 5.19 210.17 5.07 11.09 2.66 999.00 4.90 124.08Feb. 0.40 3.40 1,656.15 4.73 141.63 4.97 21.40 2.09 906.60 3.19 117.91Mar. 0.34 2.82 1,701.89 4.21 146.14 4.43 14.28 1.60 866.48 3.22 106.12Apr. 0.28 2.44 1,523.74 3.82 96.09 4.43 24.66 1.31 839.50 3.12 134.30May. 0.25 2.28 1,463.03 3.64 143.95 4.34 36.94 1.15 821.25 2.57 148.56Jun. 0.23 2.40 1,726.90 3.73 179.16 4.44 36.90 1.07 782.70 2.68 167.16Jul 0.23 2.35 1,737.45 3.77 192.97 4.19 33.24 1.10 727.43 2.51 161.02
Until 31.12.2006 SIT after 01.01.2007 EUR
2VolumeIR
6Volume
5IR4
IR
Overnight
deposits1
Volume IR Volume IR Volume1 3 7 8 9 10 11
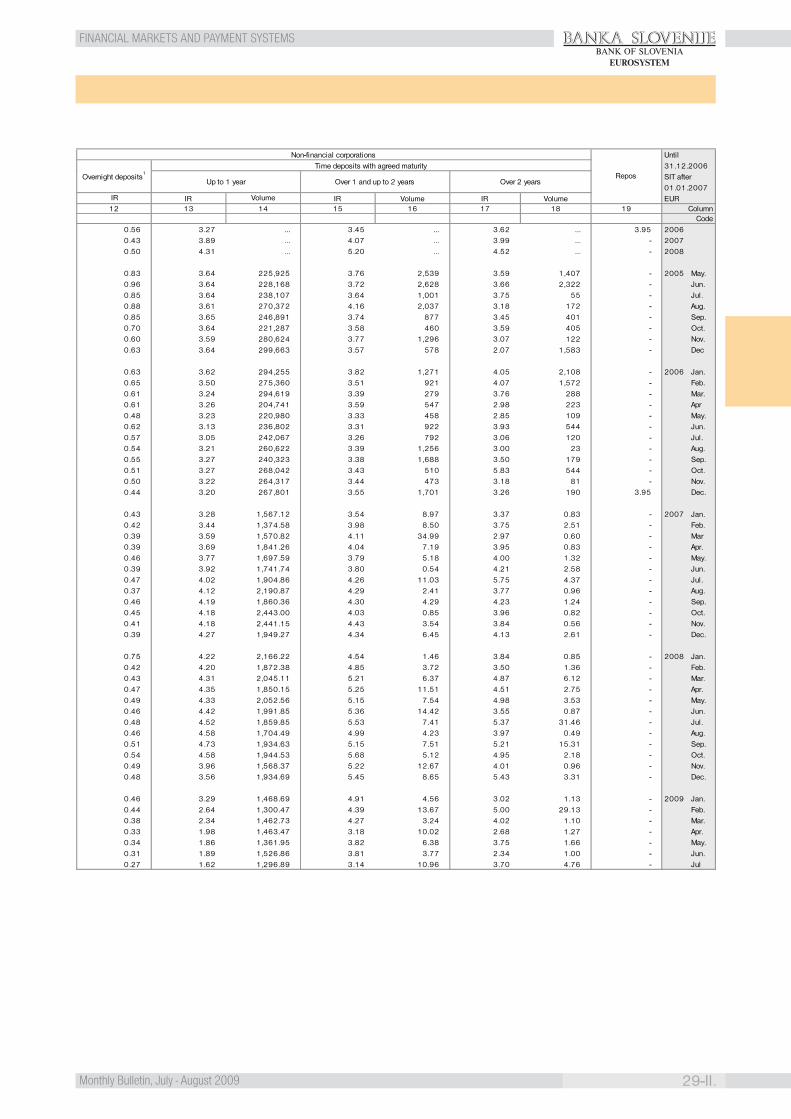
BANKA SLOVENIJE
29-II.Monthly Bulletin, July - August 2009
FINANCIAL MARKETS AND PAYMENT SYSTEMSBANK OF SLOVENIA
EUROSYSTEM
ColumnCode
0.56 3.27 ... 3.45 ... 3.62 ... 3.95 2006 0.43 3.89 ... 4.07 ... 3.99 ... - 2007 0.50 4.31 ... 5.20 ... 4.52 ... - 2008
0.83 3.64 225,925 3.76 2,539 3.59 1,407 - 2005 May.0.96 3.64 228,168 3.72 2,628 3.66 2,322 - Jun.0.85 3.64 238,107 3.64 1,001 3.75 55 - Jul.0.88 3.61 270,372 4.16 2,037 3.18 172 - Aug.0.85 3.65 246,891 3.74 877 3.45 401 - Sep.0.70 3.64 221,287 3.58 460 3.59 405 - Oct.0.60 3.59 280,624 3.77 1,296 3.07 122 - Nov.0.63 3.64 299,663 3.57 578 2.07 1,583 - Dec
0.63 3.62 294,255 3.82 1,271 4.05 2,108 - 2006 Jan.0.65 3.50 275,360 3.51 921 4.07 1,572 - Feb.0.61 3.24 294,619 3.39 279 3.76 288 - Mar.0.61 3.26 204,741 3.59 547 2.98 223 - Apr0.48 3.23 220,980 3.33 458 2.85 109 - May.0.62 3.13 236,802 3.31 922 3.93 544 - Jun.0.57 3.05 242,067 3.26 792 3.06 120 - Jul.0.54 3.21 260,622 3.39 1,256 3.00 23 - Aug.0.55 3.27 240,323 3.38 1,688 3.50 179 - Sep.0.51 3.27 268,042 3.43 510 5.83 544 - Oct.0.50 3.22 264,317 3.44 473 3.18 81 - Nov.0.44 3.20 267,801 3.55 1,701 3.26 190 3.95 Dec.
0.43 3.28 1,567.12 3.54 8.97 3.37 0.83 - 2007 Jan.0.42 3.44 1,374.58 3.98 8.50 3.75 2.51 - Feb.0.39 3.59 1,570.82 4.11 34.99 2.97 0.60 - Mar0.39 3.69 1,841.26 4.04 7.19 3.95 0.83 - Apr.0.46 3.77 1,697.59 3.79 5.18 4.00 1.32 - May.0.39 3.92 1,741.74 3.80 0.54 4.21 2.58 - Jun.0.47 4.02 1,904.86 4.26 11.03 5.75 4.37 - Jul.0.37 4.12 2,190.87 4.29 2.41 3.77 0.96 - Aug.0.46 4.19 1,860.36 4.30 4.29 4.23 1.24 - Sep.0.45 4.18 2,443.00 4.03 0.85 3.96 0.82 - Oct.0.41 4.18 2,441.15 4.43 3.54 3.84 0.56 - Nov.0.39 4.27 1,949.27 4.34 6.45 4.13 2.61 - Dec.
0.75 4.22 2,166.22 4.54 1.46 3.84 0.85 - 2008 Jan.0.42 4.20 1,872.38 4.85 3.72 3.50 1.36 - Feb.0.43 4.31 2,045.11 5.21 6.37 4.87 6.12 - Mar.0.47 4.35 1,850.15 5.25 11.51 4.51 2.75 - Apr.0.49 4.33 2,052.56 5.15 7.54 4.98 3.53 - May.0.46 4.42 1,991.85 5.36 14.42 3.55 0.87 - Jun.0.48 4.52 1,859.85 5.53 7.41 5.37 31.46 - Jul.0.46 4.58 1,704.49 4.99 4.23 3.97 0.49 - Aug.0.51 4.73 1,934.63 5.15 7.51 5.21 15.31 - Sep.0.54 4.58 1,944.53 5.68 5.12 4.95 2.18 - Oct.0.49 3.96 1,568.37 5.22 12.67 4.01 0.96 - Nov.0.48 3.56 1,934.69 5.45 8.65 5.43 3.31 - Dec.
0.46 3.29 1,468.69 4.91 4.56 3.02 1.13 - 2009 Jan.0.44 2.64 1,300.47 4.39 13.67 5.00 29.13 - Feb.0.38 2.34 1,462.73 4.27 3.24 4.02 1.10 - Mar.0.33 1.98 1,463.47 3.18 10.02 2.68 1.27 - Apr.0.34 1.86 1,361.95 3.82 6.38 3.75 1.66 - May.0.31 1.89 1,526.86 3.81 3.77 2.34 1.00 - Jun.0.27 1.62 1,296.89 3.14 10.96 3.70 4.76 - Jul
Over 1 and up to 2 years
Non-financial corporations
Repos
Until 31.12.2006 SIT after 01.01.2007 EURIR IR Volume IR Volume IR
Overnight deposits1
Time deposits with agreed maturity
Up to 1 year Over 2 years
Volume12 13 14 15 16 17 18 19
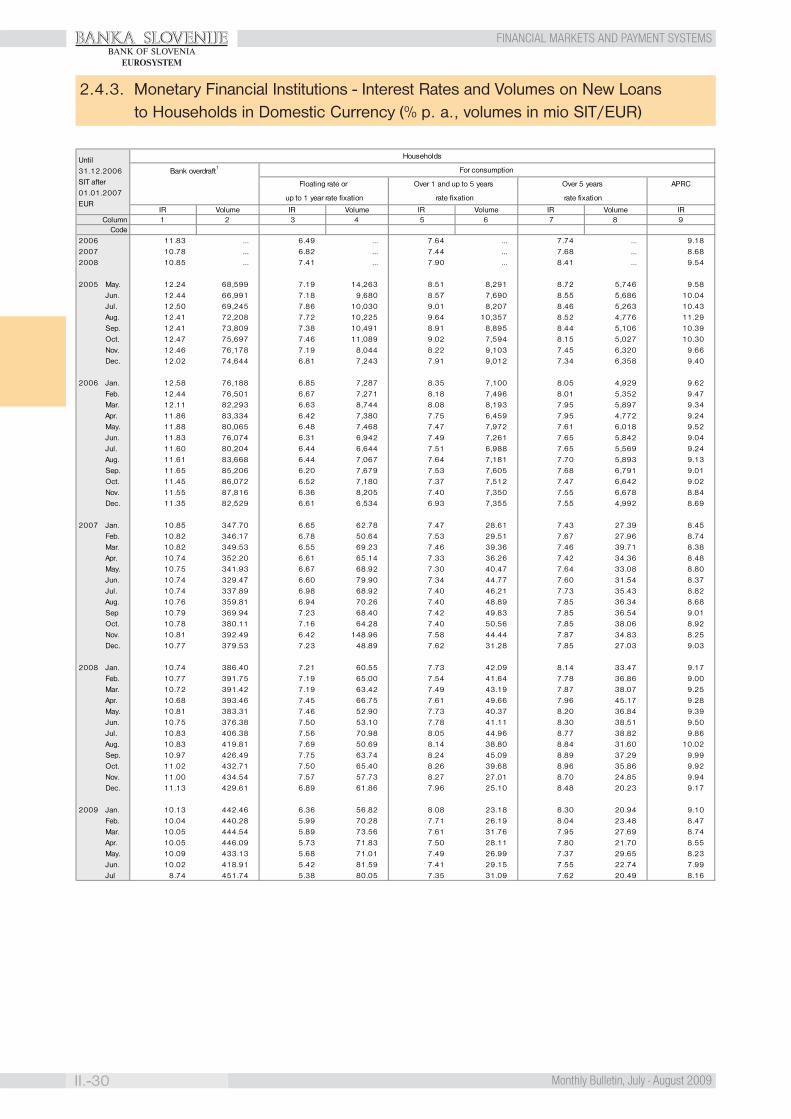
BANKA SLOVENIJE
II.-30 Monthly Bulletin, July - August 2009
FINANCIAL MARKETS AND PAYMENT SYSTEMSBANK OF SLOVENIA
EUROSYSTEM
2.4.3. Monetary Financial Institutions - Interest Rates and Volumes on New Loansto Households in Domestic Currency (% p. a., volumes in mio SIT/EUR)
Households
Bank overdraft1
Floating rate or Over 1 and up to 5 years Over 5 years
up to 1 year rate fixation rate fixation rate fixation
ColumnCode
2006 11.83 ... 6.49 ... 7.64 ... 7.74 ... 9.182007 10.78 ... 6.82 ... 7.44 ... 7.68 ... 8.682008 10.85 ... 7.41 ... 7.90 ... 8.41 ... 9.54
2005 May. 12.24 68,599 7.19 14,263 8.51 8,291 8.72 5,746 9.58Jun. 12.44 66,991 7.18 9,680 8.57 7,690 8.55 5,686 10.04Jul. 12.50 69,245 7.86 10,030 9.01 8,207 8.46 5,263 10.43Aug. 12.41 72,208 7.72 10,225 9.64 10,357 8.52 4,776 11.29Sep. 12.41 73,809 7.38 10,491 8.91 8,895 8.44 5,106 10.39Oct. 12.47 75,697 7.46 11,089 9.02 7,594 8.15 5,027 10.30Nov. 12.46 76,178 7.19 8,044 8.22 9,103 7.45 6,320 9.66Dec. 12.02 74,644 6.81 7,243 7.91 9,012 7.34 6,358 9.40
2006 Jan. 12.58 76,188 6.85 7,287 8.35 7,100 8.05 4,929 9.62Feb. 12.44 76,501 6.67 7,271 8.18 7,496 8.01 5,352 9.47Mar. 12.11 82,293 6.63 8,744 8.08 8,193 7.95 5,897 9.34Apr. 11.86 83,334 6.42 7,380 7.75 6,459 7.95 4,772 9.24May. 11.88 80,065 6.48 7,468 7.47 7,972 7.61 6,018 9.52Jun. 11.83 76,074 6.31 6,942 7.49 7,261 7.65 5,842 9.04Jul. 11.60 80,204 6.44 6,644 7.51 6,988 7.65 5,569 9.24Aug. 11.61 83,668 6.44 7,067 7.64 7,181 7.70 5,893 9.13Sep. 11.65 85,206 6.20 7,679 7.53 7,605 7.68 6,791 9.01Oct. 11.45 86,072 6.52 7,180 7.37 7,512 7.47 6,642 9.02Nov. 11.55 87,816 6.36 8,205 7.40 7,350 7.55 6,678 8.84Dec. 11.35 82,529 6.61 6,534 6.93 7,355 7.55 4,992 8.69
2007 Jan. 10.85 347.70 6.65 62.78 7.47 28.61 7.43 27.39 8.45Feb. 10.82 346.17 6.78 50.64 7.53 29.51 7.67 27.96 8.74Mar. 10.82 349.53 6.55 69.23 7.46 39.36 7.46 39.71 8.38Apr. 10.74 352.20 6.61 65.14 7.33 36.26 7.42 34.36 8.48May. 10.75 341.93 6.67 68.92 7.30 40.47 7.64 33.08 8.80Jun. 10.74 329.47 6.60 79.90 7.34 44.77 7.60 31.54 8.37Jul. 10.74 337.89 6.98 68.92 7.40 46.21 7.73 35.43 8.82Aug. 10.76 359.81 6.94 70.26 7.40 48.89 7.85 36.34 8.68Sep 10.79 369.94 7.23 68.40 7.42 49.83 7.85 36.54 9.01Oct. 10.78 380.11 7.16 64.28 7.40 50.56 7.85 38.06 8.92Nov. 10.81 392.49 6.42 148.96 7.58 44.44 7.87 34.83 8.25Dec. 10.77 379.53 7.23 48.89 7.62 31.28 7.85 27.03 9.03
2008 Jan. 10.74 386.40 7.21 60.55 7.73 42.09 8.14 33.47 9.17Feb. 10.77 391.75 7.19 65.00 7.54 41.64 7.78 36.86 9.00Mar. 10.72 391.42 7.19 63.42 7.49 43.19 7.87 38.07 9.25Apr. 10.68 393.46 7.45 66.75 7.61 49.66 7.96 45.17 9.28May. 10.81 383.31 7.46 52.90 7.73 40.37 8.20 36.84 9.39Jun. 10.75 376.38 7.50 53.10 7.78 41.11 8.30 38.51 9.50Jul. 10.83 406.38 7.56 70.98 8.05 44.96 8.77 38.82 9.86Aug. 10.83 419.81 7.69 50.69 8.14 38.80 8.84 31.60 10.02Sep. 10.97 426.49 7.75 63.74 8.24 45.09 8.89 37.29 9.99Oct. 11.02 432.71 7.50 65.40 8.26 39.68 8.96 35.86 9.92Nov. 11.00 434.54 7.57 57.73 8.27 27.01 8.70 24.85 9.94Dec. 11.13 429.61 6.89 61.86 7.96 25.10 8.48 20.23 9.17
2009 Jan. 10.13 442.46 6.36 56.82 8.08 23.18 8.30 20.94 9.10Feb. 10.04 440.28 5.99 70.28 7.71 26.19 8.04 23.48 8.47Mar. 10.05 444.54 5.89 73.56 7.61 31.76 7.95 27.69 8.74Apr. 10.05 446.09 5.73 71.83 7.50 28.11 7.80 21.70 8.55May. 10.09 433.13 5.68 71.01 7.49 26.99 7.37 29.65 8.23Jun. 10.02 418.91 5.42 81.59 7.41 29.15 7.55 22.74 7.99Jul 8.74 451.74 5.38 80.05 7.35 31.09 7.62 20.49 8.16
1 6 7 8 9Volume IR
For consumption
APRC
Volume IR
Until 31.12.2006 SIT after 01.01.2007 EUR
IR54IRVolume IR Volume
2 3
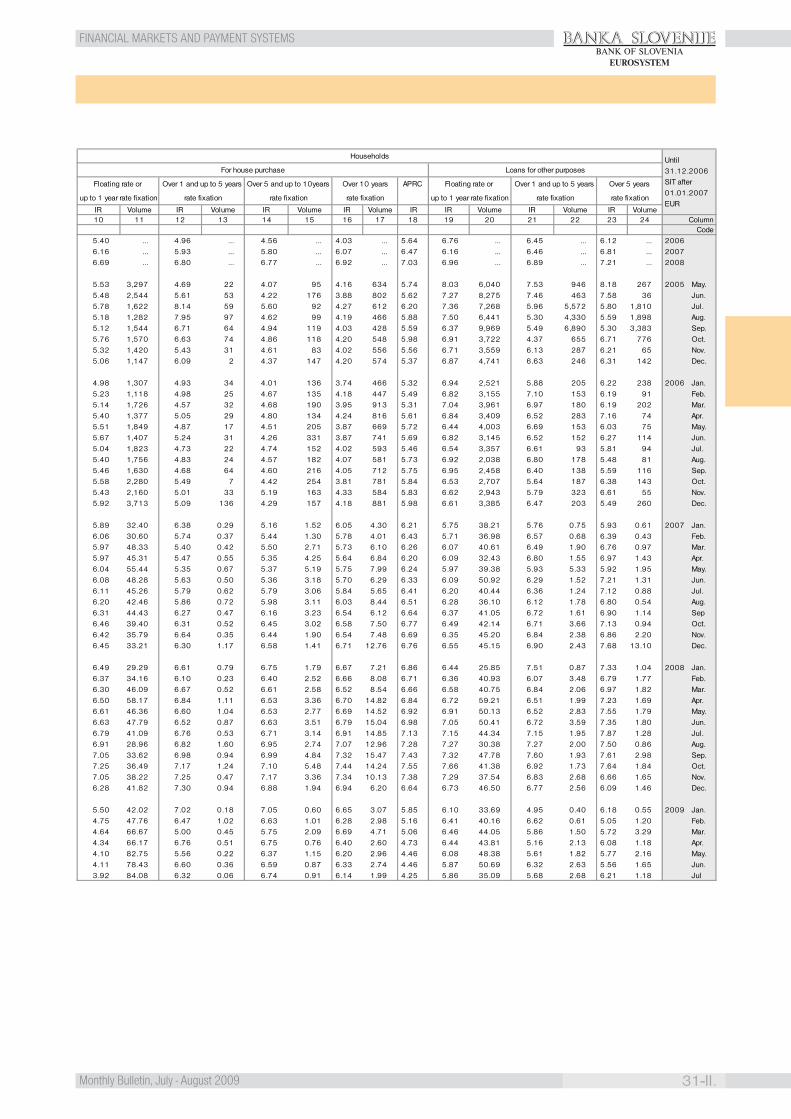
BANKA SLOVENIJE
31-II.Monthly Bulletin, July - August 2009
FINANCIAL MARKETS AND PAYMENT SYSTEMSBANK OF SLOVENIA
EUROSYSTEM
Households
Floating rate or Over 1 and up to 5 years Over 5 and up to 10years Over 10 years Floating rate or Over 1 and up to 5 years Over 5 years
up to 1 year rate fixation rate fixation rate fixation rate fixation up to 1 year rate fixation rate fixation rate fixation
ColumnCode
5.40 ... 4.96 ... 4.56 ... 4.03 ... 5.64 6.76 ... 6.45 ... 6.12 ... 2006 6.16 ... 5.93 ... 5.80 ... 6.07 ... 6.47 6.16 ... 6.46 ... 6.81 ... 2007 6.69 ... 6.80 ... 6.77 ... 6.92 ... 7.03 6.96 ... 6.89 ... 7.21 ... 2008
5.53 3,297 4.69 22 4.07 95 4.16 634 5.74 8.03 6,040 7.53 946 8.18 267 2005 May.5.48 2,544 5.61 53 4.22 176 3.88 802 5.62 7.27 8,275 7.46 463 7.58 36 Jun.5.78 1,622 8.14 59 5.60 92 4.27 612 6.20 7.36 7,268 5.96 5,572 5.80 1,810 Jul.5.18 1,282 7.95 97 4.62 99 4.19 466 5.88 7.50 6,441 5.30 4,330 5.59 1,898 Aug.5.12 1,544 6.71 64 4.94 119 4.03 428 5.59 6.37 9,969 5.49 6,890 5.30 3,383 Sep.5.76 1,570 6.63 74 4.86 118 4.20 548 5.98 6.91 3,722 4.37 655 6.71 776 Oct.5.32 1,420 5.43 31 4.61 83 4.02 556 5.56 6.71 3,559 6.13 287 6.21 65 Nov.5.06 1,147 6.09 2 4.37 147 4.20 574 5.37 6.87 4,741 6.63 246 6.31 142 Dec.
4.98 1,307 4.93 34 4.01 136 3.74 466 5.32 6.94 2,521 5.88 205 6.22 238 2006 Jan.5.23 1,118 4.98 25 4.67 135 4.18 447 5.49 6.82 3,155 7.10 153 6.19 91 Feb.5.14 1,726 4.57 32 4.68 190 3.95 913 5.31 7.04 3,961 6.97 180 6.19 202 Mar.5.40 1,377 5.05 29 4.80 134 4.24 816 5.61 6.84 3,409 6.52 283 7.16 74 Apr.5.51 1,849 4.87 17 4.51 205 3.87 669 5.72 6.44 4,003 6.69 153 6.03 75 May.5.67 1,407 5.24 31 4.26 331 3.87 741 5.69 6.82 3,145 6.52 152 6.27 114 Jun.5.04 1,823 4.73 22 4.74 152 4.02 593 5.46 6.54 3,357 6.61 93 5.81 94 Jul.5.40 1,756 4.83 24 4.57 182 4.07 581 5.73 6.92 2,038 6.80 178 5.48 81 Aug.5.46 1,630 4.68 64 4.60 216 4.05 712 5.75 6.95 2,458 6.40 138 5.59 116 Sep.5.58 2,280 5.49 7 4.42 254 3.81 781 5.84 6.53 2,707 5.64 187 6.38 143 Oct.5.43 2,160 5.01 33 5.19 163 4.33 584 5.83 6.62 2,943 5.79 323 6.61 55 Nov.5.92 3,713 5.09 136 4.29 157 4.18 881 5.98 6.61 3,385 6.47 203 5.49 260 Dec.
5.89 32.40 6.38 0.29 5.16 1.52 6.05 4.30 6.21 5.75 38.21 5.76 0.75 5.93 0.61 2007 Jan.6.06 30.60 5.74 0.37 5.44 1.30 5.78 4.01 6.43 5.71 36.98 6.57 0.68 6.39 0.43 Feb.5.97 48.33 5.40 0.42 5.50 2.71 5.73 6.10 6.26 6.07 40.61 6.49 1.90 6.76 0.97 Mar.5.97 45.31 5.47 0.55 5.35 4.25 5.64 6.84 6.20 6.09 32.43 6.80 1.55 6.97 1.43 Apr.6.04 55.44 5.35 0.67 5.37 5.19 5.75 7.99 6.24 5.97 39.38 5.93 5.33 5.92 1.95 May.6.08 48.28 5.63 0.50 5.36 3.18 5.70 6.29 6.33 6.09 50.92 6.29 1.52 7.21 1.31 Jun.6.11 45.26 5.79 0.62 5.79 3.06 5.84 5.65 6.41 6.20 40.44 6.36 1.24 7.12 0.88 Jul.6.20 42.46 5.86 0.72 5.98 3.11 6.03 8.44 6.51 6.28 36.10 6.12 1.78 6.80 0.54 Aug.6.31 44.43 6.27 0.47 6.16 3.23 6.54 6.12 6.64 6.37 41.05 6.72 1.61 6.90 1.14 Sep6.46 39.40 6.31 0.52 6.45 3.02 6.58 7.50 6.77 6.49 42.14 6.71 3.66 7.13 0.94 Oct.6.42 35.79 6.64 0.35 6.44 1.90 6.54 7.48 6.69 6.35 45.20 6.84 2.38 6.86 2.20 Nov.6.45 33.21 6.30 1.17 6.58 1.41 6.71 12.76 6.76 6.55 45.15 6.90 2.43 7.68 13.10 Dec.
6.49 29.29 6.61 0.79 6.75 1.79 6.67 7.21 6.86 6.44 25.85 7.51 0.87 7.33 1.04 2008 Jan.6.37 34.16 6.10 0.23 6.40 2.52 6.66 8.08 6.71 6.36 40.93 6.07 3.48 6.79 1.77 Feb.6.30 46.09 6.67 0.52 6.61 2.58 6.52 8.54 6.66 6.58 40.75 6.84 2.06 6.97 1.82 Mar.6.50 58.17 6.84 1.11 6.53 3.36 6.70 14.82 6.84 6.72 59.21 6.51 1.99 7.23 1.69 Apr.6.61 46.36 6.60 1.04 6.53 2.77 6.69 14.52 6.92 6.91 50.13 6.52 2.83 7.55 1.79 May.6.63 47.79 6.52 0.87 6.63 3.51 6.79 15.04 6.98 7.05 50.41 6.72 3.59 7.35 1.80 Jun.6.79 41.09 6.76 0.53 6.71 3.14 6.91 14.85 7.13 7.15 44.34 7.15 1.95 7.87 1.28 Jul.6.91 28.96 6.82 1.60 6.95 2.74 7.07 12.96 7.28 7.27 30.38 7.27 2.00 7.50 0.86 Aug.7.05 33.62 6.98 0.94 6.99 4.84 7.32 15.47 7.43 7.32 47.78 7.60 1.93 7.61 2.98 Sep.7.25 36.49 7.17 1.24 7.10 5.48 7.44 14.24 7.55 7.66 41.38 6.92 1.73 7.64 1.84 Oct.7.05 38.22 7.25 0.47 7.17 3.36 7.34 10.13 7.38 7.29 37.54 6.83 2.68 6.66 1.65 Nov.6.28 41.82 7.30 0.94 6.88 1.94 6.94 6.20 6.64 6.73 46.50 6.77 2.56 6.09 1.46 Dec.
5.50 42.02 7.02 0.18 7.05 0.60 6.65 3.07 5.85 6.10 33.69 4.95 0.40 6.18 0.55 2009 Jan.4.75 47.76 6.47 1.02 6.63 1.01 6.28 2.98 5.16 6.41 40.16 6.62 0.61 5.05 1.20 Feb.4.64 66.67 5.00 0.45 5.75 2.09 6.69 4.71 5.06 6.46 44.05 5.86 1.50 5.72 3.29 Mar.4.34 66.17 6.76 0.51 6.75 0.76 6.40 2.60 4.73 6.44 43.81 5.16 2.13 6.08 1.18 Apr.4.10 82.75 5.56 0.22 6.37 1.15 6.20 2.96 4.46 6.08 48.38 5.61 1.82 5.77 2.16 May.4.11 78.43 6.60 0.36 6.59 0.87 6.33 2.74 4.46 5.87 50.69 6.32 2.63 5.56 1.65 Jun.3.92 84.08 6.32 0.06 6.74 0.91 6.14 1.99 4.25 5.86 35.09 5.68 2.68 6.21 1.18 Jul
22 23 2418 19 20 2114 15 16 17Volume
10 11 12 13Volume IR Volume IRIR Volume IR IRIR Volume IR VolumeIR Volume
Until 31.12.2006 SIT after 01.01.2007 EUR
For house purchase Loans for other purposes
APRC

BANKA SLOVENIJE
II.-32 Monthly Bulletin, July - August 2009
FINANCIAL MARKETS AND PAYMENT SYSTEMSBANK OF SLOVENIA
EUROSYSTEM
2.4.4. Monetary Financial Institutions - Interest Rates and Volumes on New Loansto Non-financial corporations in Domestic Currency (% p. a., mio SIT/EUR)
Non-financial corporations
Other loans over an amount of EUR 1 million
Floating rate or Over 1 and up to 5 Over 5 years Floating rate or Over 1 and up to 5 Over 5 years
up to 1 year rate fixation years rate fixation rate fixation up to 1 year rate fixation years rate fixation rate fixation
Volume Volume Volume Volume Volume VolumeColumn
Code2006 6.33 5.99 ... 5.66 ... 5.74 ... 4.56 ... 4.64 ... 5.21 ...2007 5.92 5.91 ... 6.08 ... 6.35 ... 5.22 ... 5.76 ... 5.18 ...2008 6.58 6.66 ... 6.91 ... 6.45 ... 6.24 ... 6.62 ... 6.54 -
2005 May. 7.17 5.92 61,635 5.92 1,852 6.95 690 5.00 52,401 5.00 4,412 - -Jun. 7.30 6.14 57,715 6.62 9,869 6.75 4,335 5.05 66,248 5.39 3,320 4.91 785Jul. 7.26 6.22 40,276 6.60 1,786 6.28 1,476 5.29 33,145 4.65 2,120 5.64 700Aug. 5.80 5.68 43,767 6.04 1,631 5.12 559 5.00 35,032 5.16 1,037 - -Sep. 5.69 5.73 48,738 5.66 9,328 6.15 1,633 4.72 35,525 6.27 2,068 - -Oct. 6.63 6.29 33,993 5.69 940 6.66 310 4.61 34,383 6.15 820 5.56 5,292Nov. 6.67 6.18 32,955 5.69 812 5.64 1,036 4.56 50,385 5.57 3,582 - -Dec. 6.70 5.91 47,604 5.46 3,433 5.86 1,466 4.75 68,492 5.08 5,375 4.38 3,170
2006 Jan. 6.56 6.05 29,151 5.98 816 6.63 285 4.73 48,721 4.70 851 - -Feb. 6.51 6.12 23,571 5.78 1,765 5.26 569 4.50 45,384 4.22 1,503 - -Mar. 6.34 6.09 36,059 5.95 935 5.26 251 4.55 57,721 5.12 3,533 - -Apr 6.51 5.95 32,396 5.44 1,281 6.63 278 4.64 51,404 4.98 2,254 5.96 550May. 6.39 5.96 34,308 5.82 1,168 5.87 558 4.42 34,597 4.43 1,240 5.38 1,700Jun. 6.33 6.05 37,753 5.24 1,044 5.66 169 4.51 51,498 - - - -Jul. 6.29 6.09 25,355 5.78 1,283 6.19 396 4.41 35,020 4.66 1,483 4.65 599Aug. 6.24 6.02 21,627 5.56 1,242 5.74 231 4.62 35,554 4.47 3,350 - -Sep. 6.29 5.89 30,735 5.46 676 5.14 32 4.91 45,186 3.61 2,802 - -Oct. 6.25 5.89 27,312 5.48 966 5.34 319 4.47 45,007 4.66 4,660 4.80 1,075Nov. 6.08 5.81 33,479 5.59 1,171 5.70 664 4.51 45,031 5.04 2,550 5.12 1,588Dec. 6.22 5.90 30,048 5.85 1,768 5.48 662 4.47 99,605 5.11 3,435 5.34 9,070
2007 Jan. 5.67 5.59 278.20 5.25 3.00 5.21 1.68 4.74 875.73 5.49 4.40 - -Feb. 5.74 5.60 277.66 6.24 2.72 5.98 1.30 4.62 871.23 0.00 3.61 5.22 2.00Mar. 5.63 5.57 347.78 5.52 6.41 5.83 0.25 4.95 863.40 - - 5.09 2.00Apr 5.80 5.64 339.52 5.76 4.08 6.70 0.01 4.89 1,253.23 - - - -May. 5.85 5.71 319.42 5.92 13.66 6.06 2.57 5.10 760.10 4.86 5.56 - -Jun. 5.82 5.77 355.02 6.05 6.43 7.98 0.09 5.07 886.34 5.12 1.12 - -Jul. 5.92 5.88 305.78 6.11 3.93 6.68 0.40 5.11 1,241.36 6.49 1.24 - -Aug. 5.92 6.14 237.22 6.39 3.14 6.73 1.35 5.32 822.76 - - - -Sep. 6.05 6.25 280.13 6.44 2.37 6.66 2.51 5.68 797.01 5.76 3.00 5.23 10.00Oct. 6.18 6.22 320.21 6.47 6.23 6.12 0.90 5.65 1,041.85 5.59 7.00 - -Nov. 6.17 6.18 328.25 6.97 3.35 6.09 0.62 5.59 1,064.39 - - - -Dec. 6.29 6.40 345.51 5.91 4.37 6.13 2.61 5.96 1,463.74 6.25 4.80 - -
2008 Jan. 6.19 6.22 268.30 6.29 2.95 6.35 0.27 5.62 1,270.31 - - - -Feb. 6.22 6.15 310.76 6.44 3.77 4.99 0.31 5.59 1,085.17 - - - -Mar. 6.19 6.24 358.57 6.42 2.50 5.73 1.63 5.76 1,281.71 5.63 2.17 - -Apr. 6.30 6.47 450.03 6.66 4.40 6.95 0.73 6.07 1,449.20 6.32 5.40 - -May 6.40 6.63 382.61 7.03 5.45 6.05 0.81 6.24 1,022.31 5.47 7.00 5.93 8.65Jun. 6.55 6.73 457.89 6.85 3.29 7.02 2.13 6.25 1,405.80 6.63 3.13 6.53 1.50Jul. 6.72 6.83 378.49 7.18 2.30 6.90 4.36 6.57 1,357.51 6.91 10.72 - -Aug. 6.78 6.90 271.29 7.07 2.29 7.46 1.01 6.64 1,267.33 6.53 1.15 - -Sep. 6.76 7.04 375.81 7.28 2.46 6.82 3.64 6.71 1,215.43 6.94 1.50 7.17 3.26Oct. 6.98 7.32 354.14 7.30 5.97 7.18 2.22 6.88 1,064.15 6.76 11.18 - -Nov. 7.02 6.98 341.95 7.03 6.81 6.60 0.80 6.58 1,022.14 7.24 19.02 - -Dec. 6.88 6.39 505.04 7.30 9.29 5.39 1.21 5.93 1,811.14 7.74 11.39 - -
2009 Jan. 6.00 5.89 379.36 7.03 4.39 5.33 2.51 5.44 1,662.80 6.61 27.22 - -Feb. 6.09 5.84 384.01 7.27 4.01 5.37 1.21 5.38 1,732.07 6.35 15.15 6.01 3.34Mar. 6.00 6.02 468.50 6.60 23.66 6.18 4.00 5.53 1,507.53 6.34 73.39 6.50 5.59Apr. 5.89 6.00 445.90 6.62 20.92 6.09 3.34 5.54 1,221.16 6.05 200.88 4.11 6.00May. 5.97 6.00 397.94 6.43 26.82 6.37 7.57 5.54 1,269.87 6.10 293.55 4.36 2.62Jun. 6.02 5.98 475.98 6.30 44.11 6.62 4.69 5.49 1,396.00 6.19 204.22 6.12 22.84Jul. 5.95 5.84 407.94 6.37 27.23 4.53 8.18 5.27 1,407.13 6.36 153.73 4.84 11.71
13IR IR
1 8 9 10 11 1276IR
2 3 54IR IR
Until 31.12.2006 SIT after 01.01.2007 EUR
Bank overdraft
Other loans up to an amount of EUR 1 million
IR

BANKA SLOVENIJE
33-II.Monthly Bulletin, July - August 2009
FINANCIAL MARKETS AND PAYMENT SYSTEMSBANK OF SLOVENIA
EUROSYSTEM
2.5. Government Securities Rates (% p. a.)
Government securitiesRS18 26.04.2000 26.04.2010 6.00% 45,016,600 EUR - EURRS21 1 Feb 2001 1 Mar 2015 TOM + 1,00% 31,493,434 EUR - EURRS23 13.02.2001 14 Feb 2011 6.00% 40,000,000 EUR - EURRS26 01.06.2001 01.06.2011 5.375% 50,000,000 EUR - EURRS29 15 Jan 2002 15 Jan 2012 5.375% 55,000,000 EUR - EURRS32 15 Jan 2002 15 Jan 2012 5.375% 23,865,500 EUR - EURRS33 1 Jan 2002 31 Dec 2022 8.00% 127,166,004 EUR - EURRS38 19 Apr 2002 19 Apr 2017 5.625% 68,847,000 EUR - EURRS44 8 Nov 2002 8 Nov 2012 6.65% 4,443,536 EUR - EURRS48 2 Dec 2002 2 Dec 2012 4.75% 56,465,200 EUR - EURRS49 10 Jan 2003 10 Jan 2022 4.75% 29,632,020 EUR - EURRS50 24 Feb 2003 24 Feb 2013 4.50% 48,527,000 EUR - EURRS53 8 Apr 2003 8 Apr 2018 4.875% 79,340,200 EUR - EURRS54 15 Oct 2003 15 Oct 2013 5.75% 76,295,376 EUR - EURRS57 15 Mar 2004 15 Oct 2014 4.875% 259,697,224 EUR - EURRS59 17 Jan 2005 17 Feb 2016 4.00% 1,066,332,031 EUR - EURRS60 31 Mar 2005 31 Mar 2010 3.50% 368,623,416 EUR - EURRS61 18 Jan 2006 23 Jan 2011 3.25% 328,861,569 EUR - EURRS62 18 Jan 2006 23 Mar 2017 3.50% 390,540,053 EUR - EURRS63 6 Feb 2008 6 Feb 2019 4.375% 1,000,000,000 EUR - EURRS64 5 Feb 2009 5 Feb 2012 4.25% 1,000,000,000 EUR - EURRS65 2 Apr 2009 2 Apr 2014 4.375% 1,500,000,000 EUR - EUREurobondsEUROBOND - EUR 24 Mar 2000 24 Mar 2010 6.00% 500,000,000 EUR - EUREUROBOND - EUR 11 Apr 2001 11 Apr 2011 5.375% 450,000,000 EUR - EURSLOVEN4 03/22/18 22 Mar 2007 22 Mar 2018 4.00% 1,000,000,000 EUR - EURTREASURY BILLSTreasury Bills - 3 months124. issue 11 Jun 2009 10 Sep 2009 1.21% 21,300,000 EUR - EURTreasury Bills - 6 months49. issue 14 May 2009 12 Nov 2009 1.12% 50,000,000 EUR - EUR50. issue 11 Jun 2009 10 Dec 2009 1.29% 14,200,000 EUR - EURTreasury Bills - 12 months41. issue 15 Jan 2009 14 Jan 2010 1.80% 400,200,000 EUR - EUR42. issue 12 Mar 2009 11 Mar 2010 0.96% 349,800,000 EUR - EUR
In case of dematerialised securities, the interest rate is applied from the day of issue.
Government security Issued Maturity Interest rateIndexation of the principal
Currency of the payments
Amount outstandingCurrency of the issue

BANKA SLOVENIJE
II.-34 Monthly Bulletin, July - August 2009
FINANCIAL MARKETS AND PAYMENT SYSTEMSBANK OF SLOVENIA
EUROSYSTEM
2.6. The Ljubljana Stock Exchange:Turnover by Market Segment and Type of Securities
Column
Code
1995 88,092 61,726 70.1 26,366 29.9 45,216 51.3 - - 22,738 25.8 20,138 22.91996 87,004 64,716 74.4 22,288 25.6 67,081 77.1 - - 13,221 15.2 6,702 7.71997 108,296 62,931 58.1 45,366 41.9 87,555 80.8 - - 11,526 10.6 9,216 8.51998 173,375 135,373 78.1 38,002 21.9 133,757 77.1 10,036 5.8 22,070 12.7 7,512 4.31999 265,631 164,842 62.1 100,789 37.9 168,383 63.4 55,503 20.9 35,298 13.3 6,446 2.42000 269,617 146,187 54.2 123,430 45.8 145,323 53.9 64,665 24.0 56,442 20.9 3,187 1.22001 348,644 233,299 66.9 115,344 33.1 237,140 68.0 57,054 16.4 51,620 14.8 2,830 0.82002 481,041 322,660 67.1 158,381 32.9 278,838 58.0 90,971 18.9 110,571 23.0 662 0.12003 340,237 214,846 63.1 125,391 36.9 149,327 43.9 60,844 17.9 129,717 38.1 348 0.12004 396,652 256,666 64.7 139,986 35.3 223,103 56.2 59,965 15.1 113,584 28.6 0 0.02005 440,847 326,969 74.2 113,878 25.8 225,445 51.1 35,772 8.1 179,593 40.7 37 0.02006 435,292 320,450 73.6 114,842 26.4 347,468 79.8 38,649 8.9 48,833 11.2 342 0.1
2005 Apr. 33,057 24,213 73.2 8,844 26.8 9,254 28.0 3,472 10.5 20,331 61.5 0 0.0May 35,975 25,272 70.2 10,703 29.8 10,109 28.1 3,824 10.6 22,042 61.3 0 0.0Jun. 50,537 41,440 82.0 9,097 18.0 10,717 21.2 2,581 5.1 37,239 73.7 0 0.0Jul. 27,878 20,212 72.5 7,665 27.5 9,923 35.6 1,226 4.4 16,729 60.0 0 0.0Aug. 35,140 30,376 86.4 4,764 13.6 8,710 24.8 934 2.7 25,496 72.6 0 0.0Sep. 30,732 18,622 60.6 12,110 39.4 19,537 63.6 2,247 7.3 8,913 29.0 35 0.1Oct. 22,977 15,706 68.4 7,272 31.6 15,362 66.9 2,257 9.8 5,359 23.3 0 0.0Nov. 66,371 57,186 86.2 9,185 13.8 58,827 88.6 3,064 4.6 4,480 6.7 0 0.0Dec. 33,436 19,411 58.1 14,026 41.9 20,496 61.3 4,968 14.9 7,969 23.8 2 0.0
2006 Jan. 23,816 17,099 71.8 6,717 28.2 15,073 63.3 3,120 13.1 5,623 23.6 0 0.0Feb. 24,841 16,581 66.7 8,260 33.3 16,815 67.7 3,361 13.5 4,665 18.8 0 0.0Mar. 44,129 31,389 71.1 12,740 28.9 35,753 81.0 1,935 4.4 6,441 14.6 0 0.0Apr. 43,824 31,448 71.8 12,376 28.2 34,754 79.3 4,569 10.4 4,501 10.3 0 0.0May 39,685 31,512 79.4 8,173 20.6 33,705 84.9 2,851 7.2 3,128 7.9 0 0.0Jun. 29,648 22,463 75.8 7,185 24.2 23,952 80.8 2,328 7.9 3,368 11.4 0 0.0Jul. 38,159 26,285 68.9 11,874 31.1 31,498 82.5 3,292 8.6 3,370 8.8 0 0.0Aug. 32,724 23,301 71.2 9,423 28.8 27,674 84.6 3,076 9.4 1,973 6.0 0 0.0Sep. 38,696 31,462 81.3 7,234 18.7 29,861 77.2 3,165 8.2 5,333 13.8 336 0.9Oct. 46,384 36,679 79.1 9,705 20.9 39,910 86.0 3,120 6.7 3,354 7.2 0 0.0Nov. 32,675 23,372 71.5 9,304 28.5 24,899 76.2 4,425 13.5 3,345 10.2 6 0.0Dec. 40,711 28,860 70.9 11,851 29.1 33,574 82.5 3,406 8.4 3,730 9.2 0 0.0
2007 3,324 2,847 85.6 477 14.4 3,035 91.3 124 3.7 166 5.0 0 0.02008 1,271 - - - - 953 75.0 61 4.8 257 20.2 0 0.0
2007 Jan. 293 224 76.5 69 23.5 259 88.2 19 6.4 16 5.5 0 0.0Feb. 254 225 88.5 29 11.5 229 90.4 10 3.8 15 5.8 0 0.0Mar. 224 196 87.3 29 12.7 200 89.1 14 6.0 11 4.9 0 0.0Apr. 197 162 82.1 35 17.9 180 91.4 8 4.1 9 4.5 0 0.0May 266 229 86.2 37 13.8 243 91.2 10 3.8 13 5.1 0 0.0Jun. 302 233 77.1 69 22.9 269 89.2 9 2.8 24 8.0 0 0.0Jul. 499 454 91.0 45 9.0 479 96.0 11 2.2 9 1.8 0 0.0Aug. 315 283 89.8 32 10.2 298 94.6 11 3.6 6 1.9 0 0.0Sep. 286 250 87.2 37 12.8 266 92.8 7 2.3 14 4.9 0 0.0Oct. 264 225 85.3 39 14.7 241 91.3 9 3.4 14 5.3 0 0.0Nov. 194 171 88.5 22 11.5 176 90.8 7 3.5 11 5.7 0 0.0Dec. 230 195 84.9 35 15.1 195 85.0 11 4.6 24 10.4 0 0.0
2008 Jan. 193 174 90.5 18 9.5 180 93.7 7 3.5 5 2.8 0 0.0Feb. 117 97 83.3 19 16.7 100 86.0 4 3.8 12 10.3 0 0.0Mar. 136 110 81.2 26 18.8 109 79.9 8 5.7 20 14.4 0 0.0Apr. 195 169 86.4 26 13.6 125 64.0 10 5.4 60 30.7 0 0.0May 71 53 74.9 18 25.1 54 76.3 8 11.5 9 12.2 0 0.0Jun. 62 - - - - 45 71.5 4 6.5 14 22.0 0 0.0Jul. 60 - - - - 51 85.2 5 8.2 4 6.6 0 0.0Aug. 39 - - - - 32 80.6 3 8.1 4 11.4 0 0.0Sep. 95 - - - - 75 78.5 4 3.7 17 17.8 0 0.0Oct. 156 - - - - 88 56.3 4 2.6 64 41.1 0 0.0Nov. 71 - - - - 52 72.6 3 3.6 17 23.9 0 0.0Dec. 75 - - - - 42 56.5 1 1.8 31 41.7 0 0.0
2009 Jan. 36 - - - - 27 75.0 1 2.6 8 22.4 0 0.0Feb. 53 - - - - 26 48.2 1 2.6 26 49.2 0 0.0Mar. 72 - - - - 36 49.3 1 1.5 36 49.2 0 0.0Apr. 28 - - - - 21 73.0 1 3.2 7 23.8 0 0.0May 71 - - - - 58 81.8 3 4.0 10 14.2 0 0.0Jun. 58 - - - - 45 77.6 2 3.2 11 19.2 0 0.0Jul. 36 - - - - 23 65.7 1 2.9 11 31.4 0 0.0
Value until 31.12.2006
in mio SIT from
01.01.2007 in mio
EUR Value
Total Official Market Free Market Shares
Value Value % Value %761 4
PIF Bonds
2 5 8
% Value
Short-Term Securities
Turnover by Market Segment and by Type of Securities
10
%13
Value % Value11
Source: The Ljubljana Stock Exchange and computations in BS.
%9 123
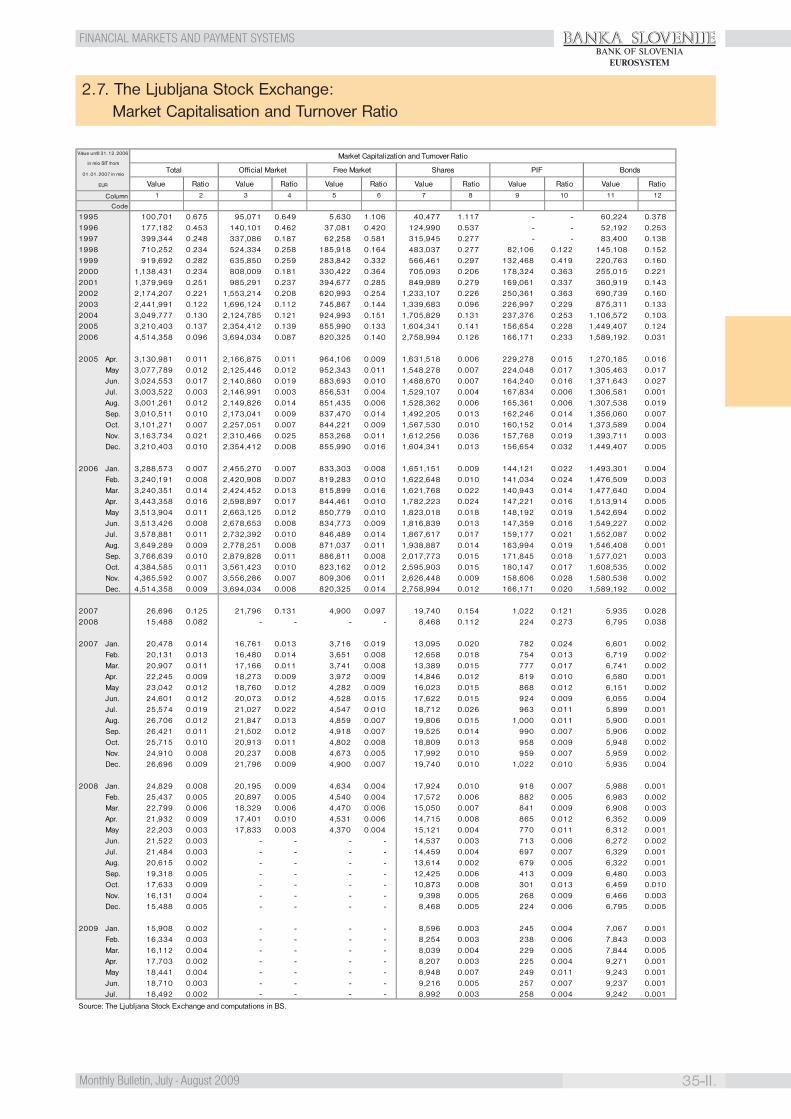
BANKA SLOVENIJE
35-II.Monthly Bulletin, July - August 2009
FINANCIAL MARKETS AND PAYMENT SYSTEMSBANK OF SLOVENIA
EUROSYSTEM
2.7. The Ljubljana Stock Exchange:Market Capitalisation and Turnover Ratio
Column
Code
1995 100,701 0.675 95,071 0.649 5,630 1.106 40,477 1.117 - - 60,224 0.3781996 177,182 0.453 140,101 0.462 37,081 0.420 124,990 0.537 - - 52,192 0.2531997 399,344 0.248 337,086 0.187 62,258 0.581 315,945 0.277 - - 83,400 0.1381998 710,252 0.234 524,334 0.258 185,918 0.164 483,037 0.277 82,106 0.122 145,108 0.1521999 919,692 0.282 635,850 0.259 283,842 0.332 566,461 0.297 132,468 0.419 220,763 0.1602000 1,138,431 0.234 808,009 0.181 330,422 0.364 705,093 0.206 178,324 0.363 255,015 0.2212001 1,379,969 0.251 985,291 0.237 394,677 0.285 849,989 0.279 169,061 0.337 360,919 0.1432002 2,174,207 0.221 1,553,214 0.208 620,993 0.254 1,233,107 0.226 250,361 0.363 690,739 0.1602003 2,441,991 0.122 1,696,124 0.112 745,867 0.144 1,339,683 0.096 226,997 0.229 875,311 0.1332004 3,049,777 0.130 2,124,785 0.121 924,993 0.151 1,705,829 0.131 237,376 0.253 1,106,572 0.1032005 3,210,403 0.137 2,354,412 0.139 855,990 0.133 1,604,341 0.141 156,654 0.228 1,449,407 0.1242006 4,514,358 0.096 3,694,034 0.087 820,325 0.140 2,758,994 0.126 166,171 0.233 1,589,192 0.031
2005 Apr. 3,130,981 0.011 2,166,875 0.011 964,106 0.009 1,631,518 0.006 229,278 0.015 1,270,185 0.016May 3,077,789 0.012 2,125,446 0.012 952,343 0.011 1,548,278 0.007 224,048 0.017 1,305,463 0.017Jun. 3,024,553 0.017 2,140,860 0.019 883,693 0.010 1,488,670 0.007 164,240 0.016 1,371,643 0.027Jul. 3,003,522 0.003 2,146,991 0.003 856,531 0.004 1,529,107 0.004 167,834 0.006 1,306,581 0.001Aug. 3,001,261 0.012 2,149,826 0.014 851,435 0.006 1,528,362 0.006 165,361 0.006 1,307,538 0.019Sep. 3,010,511 0.010 2,173,041 0.009 837,470 0.014 1,492,205 0.013 162,246 0.014 1,356,060 0.007Oct. 3,101,271 0.007 2,257,051 0.007 844,221 0.009 1,567,530 0.010 160,152 0.014 1,373,589 0.004Nov. 3,163,734 0.021 2,310,466 0.025 853,268 0.011 1,612,256 0.036 157,768 0.019 1,393,711 0.003Dec. 3,210,403 0.010 2,354,412 0.008 855,990 0.016 1,604,341 0.013 156,654 0.032 1,449,407 0.005
2006 Jan. 3,288,573 0.007 2,455,270 0.007 833,303 0.008 1,651,151 0.009 144,121 0.022 1,493,301 0.004Feb. 3,240,191 0.008 2,420,908 0.007 819,283 0.010 1,622,648 0.010 141,034 0.024 1,476,509 0.003Mar. 3,240,351 0.014 2,424,452 0.013 815,899 0.016 1,621,768 0.022 140,943 0.014 1,477,640 0.004Apr. 3,443,358 0.016 2,598,897 0.017 844,461 0.010 1,782,223 0.024 147,221 0.016 1,513,914 0.005May 3,513,904 0.011 2,663,125 0.012 850,779 0.010 1,823,018 0.018 148,192 0.019 1,542,694 0.002Jun. 3,513,426 0.008 2,678,653 0.008 834,773 0.009 1,816,839 0.013 147,359 0.016 1,549,227 0.002Jul. 3,578,881 0.011 2,732,392 0.010 846,489 0.014 1,867,617 0.017 159,177 0.021 1,552,087 0.002Aug. 3,649,289 0.009 2,778,251 0.008 871,037 0.011 1,938,887 0.014 163,994 0.019 1,546,408 0.001Sep. 3,766,639 0.010 2,879,828 0.011 886,811 0.008 2,017,773 0.015 171,845 0.018 1,577,021 0.003Oct. 4,384,585 0.011 3,561,423 0.010 823,162 0.012 2,595,903 0.015 180,147 0.017 1,608,535 0.002Nov. 4,365,592 0.007 3,556,286 0.007 809,306 0.011 2,626,448 0.009 158,606 0.028 1,580,538 0.002Dec. 4,514,358 0.009 3,694,034 0.008 820,325 0.014 2,758,994 0.012 166,171 0.020 1,589,192 0.002
2007 26,696 0.125 21,796 0.131 4,900 0.097 19,740 0.154 1,022 0.121 5,935 0.0282008 15,488 0.082 - - - - 8,468 0.112 224 0.273 6,795 0.038
2007 Jan. 20,478 0.014 16,761 0.013 3,716 0.019 13,095 0.020 782 0.024 6,601 0.002Feb. 20,131 0.013 16,480 0.014 3,651 0.008 12,658 0.018 754 0.013 6,719 0.002Mar. 20,907 0.011 17,166 0.011 3,741 0.008 13,389 0.015 777 0.017 6,741 0.002Apr. 22,245 0.009 18,273 0.009 3,972 0.009 14,846 0.012 819 0.010 6,580 0.001May 23,042 0.012 18,760 0.012 4,282 0.009 16,023 0.015 868 0.012 6,151 0.002Jun. 24,601 0.012 20,073 0.012 4,528 0.015 17,622 0.015 924 0.009 6,055 0.004Jul. 25,574 0.019 21,027 0.022 4,547 0.010 18,712 0.026 963 0.011 5,899 0.001Aug. 26,706 0.012 21,847 0.013 4,859 0.007 19,806 0.015 1,000 0.011 5,900 0.001Sep. 26,421 0.011 21,502 0.012 4,918 0.007 19,525 0.014 990 0.007 5,906 0.002Oct. 25,715 0.010 20,913 0.011 4,802 0.008 18,809 0.013 958 0.009 5,948 0.002Nov. 24,910 0.008 20,237 0.008 4,673 0.005 17,992 0.010 959 0.007 5,959 0.002Dec. 26,696 0.009 21,796 0.009 4,900 0.007 19,740 0.010 1,022 0.010 5,935 0.004
2008 Jan. 24,829 0.008 20,195 0.009 4,634 0.004 17,924 0.010 918 0.007 5,988 0.001Feb. 25,437 0.005 20,897 0.005 4,540 0.004 17,572 0.006 882 0.005 6,983 0.002Mar. 22,799 0.006 18,329 0.006 4,470 0.006 15,050 0.007 841 0.009 6,908 0.003Apr. 21,932 0.009 17,401 0.010 4,531 0.006 14,715 0.008 865 0.012 6,352 0.009May 22,203 0.003 17,833 0.003 4,370 0.004 15,121 0.004 770 0.011 6,312 0.001Jun. 21,522 0.003 - - - - 14,537 0.003 713 0.006 6,272 0.002Jul. 21,484 0.003 - - - - 14,459 0.004 697 0.007 6,329 0.001Aug. 20,615 0.002 - - - - 13,614 0.002 679 0.005 6,322 0.001Sep. 19,318 0.005 - - - - 12,425 0.006 413 0.009 6,480 0.003Oct. 17,633 0.009 - - - - 10,873 0.008 301 0.013 6,459 0.010Nov. 16,131 0.004 - - - - 9,398 0.005 268 0.009 6,466 0.003Dec. 15,488 0.005 - - - - 8,468 0.005 224 0.006 6,795 0.005
2009 Jan. 15,908 0.002 - - - - 8,596 0.003 245 0.004 7,067 0.001Feb. 16,334 0.003 - - - - 8,254 0.003 238 0.006 7,843 0.003Mar. 16,112 0.004 - - - - 8,039 0.004 229 0.005 7,844 0.005Apr. 17,703 0.002 - - - - 8,207 0.003 225 0.004 9,271 0.001May 18,441 0.004 - - - - 8,948 0.007 249 0.011 9,243 0.001Jun. 18,710 0.003 - - - - 9,216 0.005 257 0.007 9,237 0.001Jul. 18,492 0.002 - - - - 8,992 0.003 258 0.004 9,242 0.001
97 8 123
Value Ratio1161 2 4 5
Value
Value until 31.12.2006
in mio SIT from
01.01.2007 in mio
EUR Value
Market Capitalization and Turnover Ratio
Total Official Market Free Market Shares PIF Bonds
Value Ratio
Source: The Ljubljana Stock Exchange and computations in BS.
RatioRatio10
Value Ratio ValueRatio
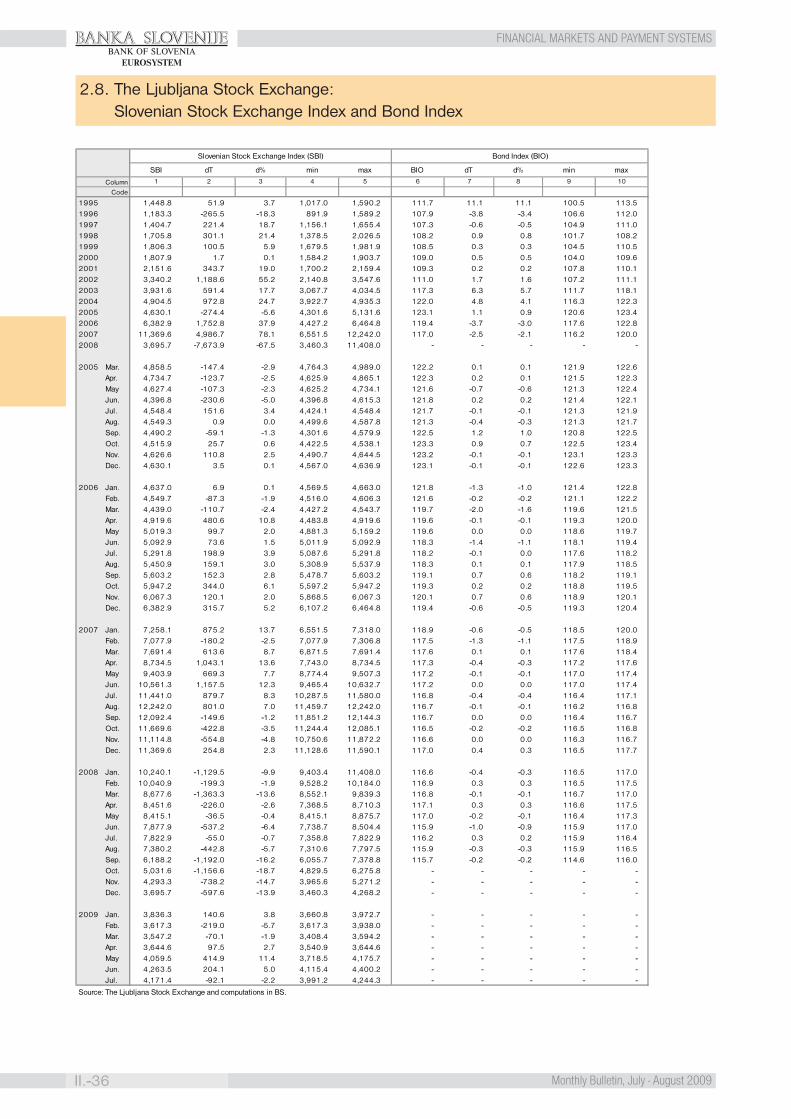
BANKA SLOVENIJE
II.-36 Monthly Bulletin, July - August 2009
FINANCIAL MARKETS AND PAYMENT SYSTEMSBANK OF SLOVENIA
EUROSYSTEM
2.8. The Ljubljana Stock Exchange:Slovenian Stock Exchange Index and Bond Index
Column
Code
1995 1,448.8 51.9 3.7 1,017.0 1,590.2 111.7 11.1 11.1 100.5 113.51996 1,183.3 -265.5 -18.3 891.9 1,589.2 107.9 -3.8 -3.4 106.6 112.01997 1,404.7 221.4 18.7 1,156.1 1,655.4 107.3 -0.6 -0.5 104.9 111.01998 1,705.8 301.1 21.4 1,378.5 2,026.5 108.2 0.9 0.8 101.7 108.21999 1,806.3 100.5 5.9 1,679.5 1,981.9 108.5 0.3 0.3 104.5 110.52000 1,807.9 1.7 0.1 1,584.2 1,903.7 109.0 0.5 0.5 104.0 109.62001 2,151.6 343.7 19.0 1,700.2 2,159.4 109.3 0.2 0.2 107.8 110.12002 3,340.2 1,188.6 55.2 2,140.8 3,547.6 111.0 1.7 1.6 107.2 111.12003 3,931.6 591.4 17.7 3,067.7 4,034.5 117.3 6.3 5.7 111.7 118.12004 4,904.5 972.8 24.7 3,922.7 4,935.3 122.0 4.8 4.1 116.3 122.32005 4,630.1 -274.4 -5.6 4,301.6 5,131.6 123.1 1.1 0.9 120.6 123.42006 6,382.9 1,752.8 37.9 4,427.2 6,464.8 119.4 -3.7 -3.0 117.6 122.82007 11,369.6 4,986.7 78.1 6,551.5 12,242.0 117.0 -2.5 -2.1 116.2 120.02008 3,695.7 -7,673.9 -67.5 3,460.3 11,408.0 - - - - -
2005 Mar. 4,858.5 -147.4 -2.9 4,764.3 4,989.0 122.2 0.1 0.1 121.9 122.6Apr. 4,734.7 -123.7 -2.5 4,625.9 4,865.1 122.3 0.2 0.1 121.5 122.3May 4,627.4 -107.3 -2.3 4,625.2 4,734.1 121.6 -0.7 -0.6 121.3 122.4Jun. 4,396.8 -230.6 -5.0 4,396.8 4,615.3 121.8 0.2 0.2 121.4 122.1Jul. 4,548.4 151.6 3.4 4,424.1 4,548.4 121.7 -0.1 -0.1 121.3 121.9Aug. 4,549.3 0.9 0.0 4,499.6 4,587.8 121.3 -0.4 -0.3 121.3 121.7Sep. 4,490.2 -59.1 -1.3 4,301.6 4,579.9 122.5 1.2 1.0 120.8 122.5Oct. 4,515.9 25.7 0.6 4,422.5 4,538.1 123.3 0.9 0.7 122.5 123.4Nov. 4,626.6 110.8 2.5 4,490.7 4,644.5 123.2 -0.1 -0.1 123.1 123.3Dec. 4,630.1 3.5 0.1 4,567.0 4,636.9 123.1 -0.1 -0.1 122.6 123.3
2006 Jan. 4,637.0 6.9 0.1 4,569.5 4,663.0 121.8 -1.3 -1.0 121.4 122.8Feb. 4,549.7 -87.3 -1.9 4,516.0 4,606.3 121.6 -0.2 -0.2 121.1 122.2Mar. 4,439.0 -110.7 -2.4 4,427.2 4,543.7 119.7 -2.0 -1.6 119.6 121.5Apr. 4,919.6 480.6 10.8 4,483.8 4,919.6 119.6 -0.1 -0.1 119.3 120.0May 5,019.3 99.7 2.0 4,881.3 5,159.2 119.6 0.0 0.0 118.6 119.7Jun. 5,092.9 73.6 1.5 5,011.9 5,092.9 118.3 -1.4 -1.1 118.1 119.4Jul. 5,291.8 198.9 3.9 5,087.6 5,291.8 118.2 -0.1 0.0 117.6 118.2Aug. 5,450.9 159.1 3.0 5,308.9 5,537.9 118.3 0.1 0.1 117.9 118.5Sep. 5,603.2 152.3 2.8 5,478.7 5,603.2 119.1 0.7 0.6 118.2 119.1Oct. 5,947.2 344.0 6.1 5,597.2 5,947.2 119.3 0.2 0.2 118.8 119.5Nov. 6,067.3 120.1 2.0 5,868.5 6,067.3 120.1 0.7 0.6 118.9 120.1Dec. 6,382.9 315.7 5.2 6,107.2 6,464.8 119.4 -0.6 -0.5 119.3 120.4
2007 Jan. 7,258.1 875.2 13.7 6,551.5 7,318.0 118.9 -0.6 -0.5 118.5 120.0Feb. 7,077.9 -180.2 -2.5 7,077.9 7,306.8 117.5 -1.3 -1.1 117.5 118.9Mar. 7,691.4 613.6 8.7 6,871.5 7,691.4 117.6 0.1 0.1 117.6 118.4Apr. 8,734.5 1,043.1 13.6 7,743.0 8,734.5 117.3 -0.4 -0.3 117.2 117.6May 9,403.9 669.3 7.7 8,774.4 9,507.3 117.2 -0.1 -0.1 117.0 117.4Jun. 10,561.3 1,157.5 12.3 9,465.4 10,632.7 117.2 0.0 0.0 117.0 117.4Jul. 11,441.0 879.7 8.3 10,287.5 11,580.0 116.8 -0.4 -0.4 116.4 117.1Aug. 12,242.0 801.0 7.0 11,459.7 12,242.0 116.7 -0.1 -0.1 116.2 116.8Sep. 12,092.4 -149.6 -1.2 11,851.2 12,144.3 116.7 0.0 0.0 116.4 116.7Oct. 11,669.6 -422.8 -3.5 11,244.4 12,085.1 116.5 -0.2 -0.2 116.5 116.8Nov. 11,114.8 -554.8 -4.8 10,750.6 11,872.2 116.6 0.0 0.0 116.3 116.7Dec. 11,369.6 254.8 2.3 11,128.6 11,590.1 117.0 0.4 0.3 116.5 117.7
2008 Jan. 10,240.1 -1,129.5 -9.9 9,403.4 11,408.0 116.6 -0.4 -0.3 116.5 117.0Feb. 10,040.9 -199.3 -1.9 9,528.2 10,184.0 116.9 0.3 0.3 116.5 117.5Mar. 8,677.6 -1,363.3 -13.6 8,552.1 9,839.3 116.8 -0.1 -0.1 116.7 117.0Apr. 8,451.6 -226.0 -2.6 7,368.5 8,710.3 117.1 0.3 0.3 116.6 117.5May 8,415.1 -36.5 -0.4 8,415.1 8,875.7 117.0 -0.2 -0.1 116.4 117.3Jun. 7,877.9 -537.2 -6.4 7,738.7 8,504.4 115.9 -1.0 -0.9 115.9 117.0Jul. 7,822.9 -55.0 -0.7 7,358.8 7,822.9 116.2 0.3 0.2 115.9 116.4Aug. 7,380.2 -442.8 -5.7 7,310.6 7,797.5 115.9 -0.3 -0.3 115.9 116.5Sep. 6,188.2 -1,192.0 -16.2 6,055.7 7,378.8 115.7 -0.2 -0.2 114.6 116.0Oct. 5,031.6 -1,156.6 -18.7 4,829.5 6,275.8 - - - - -Nov. 4,293.3 -738.2 -14.7 3,965.6 5,271.2 - - - - -Dec. 3,695.7 -597.6 -13.9 3,460.3 4,268.2 - - - - -
2009 Jan. 3,836.3 140.6 3.8 3,660.8 3,972.7 - - - - -Feb. 3,617.3 -219.0 -5.7 3,617.3 3,938.0 - - - - -Mar. 3,547.2 -70.1 -1.9 3,408.4 3,594.2 - - - - -Apr. 3,644.6 97.5 2.7 3,540.9 3,644.6 - - - - -May 4,059.5 414.9 11.4 3,718.5 4,175.7 - - - - -Jun. 4,263.5 204.1 5.0 4,115.4 4,400.2 - - - - -Jul. 4,171.4 -92.1 -2.2 3,991.2 4,244.3 - - - - -
Source: The Ljubljana Stock Exchange and computations in BS.
Slovenian Stock Exchange Index (SBI) Bond Index (BIO)
9 107 85 6
min max1 2 3 4
max BIO dT d%SBI dT d% min

BANKA SLOVENIJE
37-II.Monthly Bulletin, July - August 2009
FINANCIAL MARKETS AND PAYMENT SYSTEMSBANK OF SLOVENIA
EUROSYSTEM
2.9.1.a. Selected Bank of Slovenia Exchange Rates - Average Rates to 31.12.2006
2.9.1.b. Selected Bank of Slovenia Exchange Rates - End of Month Rates to 31.12.2006
Column
Code
1992 105.0788 142.7461 57.9490 81.2870 0.6422 2.8170 1.0106 0.0060 - 0.42711993 132.2802 170.0252 76.6669 113.2419 1.0248 3.8509 1.2306 0.0063 - 0.04911994 152.3622 197.0006 94.2149 128.8086 1.2598 4.4723 1.2408 0.0057 4.0159 21.21881995 153.1177 186.9737 100.2418 118.5185 1.2644 4.4366 0.9665 49.0672 3.9584 22.50091996 169.5098 211.4174 109.6247 135.3654 1.2453 4.9776 0.9097 50.3619 4.4139 24.88831997 180.3985 261.5308 110.0789 159.6893 1.3224 5.0803 0.8582 48.8393 4.7465 25.92231998 186.2659 275.2013 114.6526 166.1346 1.2743 5.1514 0.7841 47.8055 4.7157 26.06591999 193.6253 294.0493 120.9907 181.7704 1.6053 5.2556 0.7665 45.8644 4.3976 25.60992000 205.0316 336.5545 131.7159 222.6824 2.0673 5.7624 0.7888 51.2137 4.8181 26.90452001 217.1851 349.3743 143.8502 242.7488 1.9989 6.3822 0.8476 59.3171 5.0203 29.12982002 226.2237 360.0079 154.1931 240.2447 1.9171 7.3500 0.9332 58.8916 5.3062 30.59102003 233.7045 338.0625 153.7727 207.1137 1.7863 7.3480 0.9238 53.2745 5.6371 30.90312004 238.8615 352.1029 154.7207 192.3811 1.7783 7.4931 0.9499 52.8366 5.9692 31.88772005 239.6371 350.3115 154.7818 192.7055 1.7511 8.0509 0.9670 59.6242 6.2144 32.39522006 239.6009 351.4322 152.3405 191.0283 1.6425 8.4588 0.9087 61.5690 6.4436 32.7343
2005 Oct. 239.5807 351.3147 154.6052 199.2506 1.7376 8.0799 0.9515 61.1596 6.1615 32.4528Nov. 239.5792 352.7656 155.1060 203.2470 1.7166 8.1855 0.9550 60.2878 6.1914 32.4951Dec. 239.5806 352.7348 154.8072 202.1508 1.7042 8.2754 0.9485 62.1571 6.3288 32.4458
2006 Jan. 239.5819 349.1456 154.6279 197.9386 1.7139 8.3432 0.9564 62.7640 6.3919 32.4928Feb. 239.5747 350.7676 153.7948 200.4449 1.7002 8.4410 0.9529 63.1841 6.4103 32.7543Mar. 239.5850 347.9357 152.7422 199.5020 1.7015 8.3693 0.9219 61.8858 6.4003 32.7118Apr. 239.5864 345.0651 152.1430 195.9356 1.6695 8.4039 0.9025 61.1223 6.4088 32.7791May 239.6060 350.6148 153.9118 187.6411 1.6796 8.4773 0.9133 61.5581 6.3788 32.9716Jun. 239.6155 349.1390 153.6103 189.1902 1.6520 8.4511 0.8851 59.6528 6.3065 33.0389Jul. 239.6143 348.2300 152.7889 188.8930 1.6335 8.4266 0.8623 59.9182 6.2473 33.0698Aug. 239.6088 353.7894 151.8884 187.0762 1.6156 8.5006 0.8742 61.4034 6.3607 32.9058Sep. 239.6018 354.9524 151.2966 188.0560 1.6069 8.4480 0.8726 60.4599 6.3898 32.4361Oct. 239.6052 355.9334 150.6935 190.0380 1.6008 8.4737 0.8964 61.3990 6.5055 32.4196Nov. 239.6129 355.5299 150.4937 186.2352 1.5870 8.5461 0.9243 62.5999 6.6741 32.6365Dec. 239.6188 356.0833 150.0954 181.3881 1.5491 8.6251 0.9429 62.8802 6.8490 32.5958
CHFin SIT SKK HRKJPY CZK HUF PLNEUR GBP
8
USD
2 31 4 5 9 106 7
Column
Code
1992 31.Dec. 119.4741 149.2738 67.5004 98.7005 0.7925 3.3584 1.1692 0.0063 - 0.13001993 31.Dec. 147.8001 195.2084 89.8447 131.8420 1.1819 4.2931 1.2808 0.0061 3.8730 0.02001994 31.Dec. 155.1327 197.6472 96.5088 126.4576 1.2687 4.5533 1.1607 0.0053 4.0795 22.00001995 31.Dec. 161.4538 194.5444 109.4581 125.9902 1.2224 4.7260 0.9314 50.0004 4.2194 23.67701996 31.Dec. 175.4113 239.0169 104.6444 141.4792 1.2201 5.2536 0.8988 49.7196 4.4357 25.57861997 31.Dec. 186.7334 281.5091 116.3514 169.1792 1.3063 4.9700 0.8426 47.3093 4.8667 26.84961998 31.Dec. 188.9271 269.5999 117.7452 161.2011 1.3976 5.4048 0.7441 47.1241 4.3637 25.75021999 31.Dec. 197.3215 318.1579 122.9647 196.7705 1.9249 5.4681 0.7758 47.4582 4.6526 25.76172000 31.Dec. 211.5062 339.3329 138.9295 227.3771 1.9798 6.0387 0.7980 54.9224 4.8113 27.98182001 31.Dec. 221.4095 363.5027 149.5606 250.9458 1.9138 6.9234 0.9033 63.3051 5.1816 30.18162002 31.Dec. 230.2673 354.0940 158.5099 221.0708 1.8542 7.3194 0.9768 57.6331 5.5300 30.83802003 31.Dec. 236.6903 336.2556 151.7343 189.3674 1.7708 7.2774 0.9067 50.5759 5.7561 30.97232004 31.Dec. 239.7430 338.3333 155.1132 176.2427 1.6972 7.8816 0.9765 58.8471 6.1892 31.40552005 31.Dec. 239.5756 348.6765 154.0382 202.4297 1.7221 8.2584 0.9486 62.0823 6.3288 32.52012006 31.Dec. 239.6400 356.9258 149.0299 181.9314 1.5296 8.7208 0.9524 62.5937 6.9602 32.6374
2005 31.Oct. 239.6246 351.4588 154.9664 197.2381 1.7117 8.0722 0.9541 60.0367 6.1375 32.493730.Nov. 239.5742 349.7944 154.7937 202.7026 1.7014 8.2817 0.9539 61.4766 6.3358 32.405531.Dec. 239.5756 348.6765 154.0382 202.4297 1.7221 8.2584 0.9486 62.0823 6.3288 32.5201
2006 31.Jan. 239.5844 349.9626 154.0141 198.1510 1.6841 8.4316 0.9520 62.7809 6.4111 32.597428.Feb. 239.5663 351.5280 153.1950 202.0974 1.7394 8.4569 0.9489 63.5320 6.4303 32.776931.Mar. 239.5871 345.0772 152.0995 198.5145 1.6915 8.3778 0.9025 61.0149 6.3618 32.703730.Apr. 239.5803 345.1668 152.4630 190.9158 1.6728 8.4261 0.9068 61.8033 6.4059 32.900331.May 239.6203 349.7596 153.7703 186.1996 1.6637 8.5023 0.9159 60.8328 6.3577 33.005130.Jun. 239.6285 346.6848 153.0586 191.2896 1.6426 8.4110 0.8489 58.7642 6.2599 33.097431.Jul. 239.6096 351.2307 152.3459 189.1008 1.6347 8.4227 0.8849 60.9864 6.2964 33.026831.Aug. 239.6011 355.3331 151.9637 186.9401 1.5966 8.4845 0.8669 60.5436 6.3496 32.715430.Sep. 239.5987 353.7034 150.8618 189.1071 1.6033 8.4649 0.8785 60.3356 6.4184 32.444431.Oct. 239.6000 358.0395 150.7677 188.3204 1.6032 8.4625 0.9126 61.6382 6.5851 32.574330.Nov. 239.6220 355.1008 150.8100 182.1113 1.5670 8.5671 0.9308 62.6872 6.7455 32.584331.Dec. 239.6400 356.9258 149.0299 181.9314 1.5296 8.7208 0.9524 62.5937 6.9602 32.6374
USD SKK HRKJPY CZK HUF PLN
31
EUR GBP CHF
9 106 7
in SIT
8542
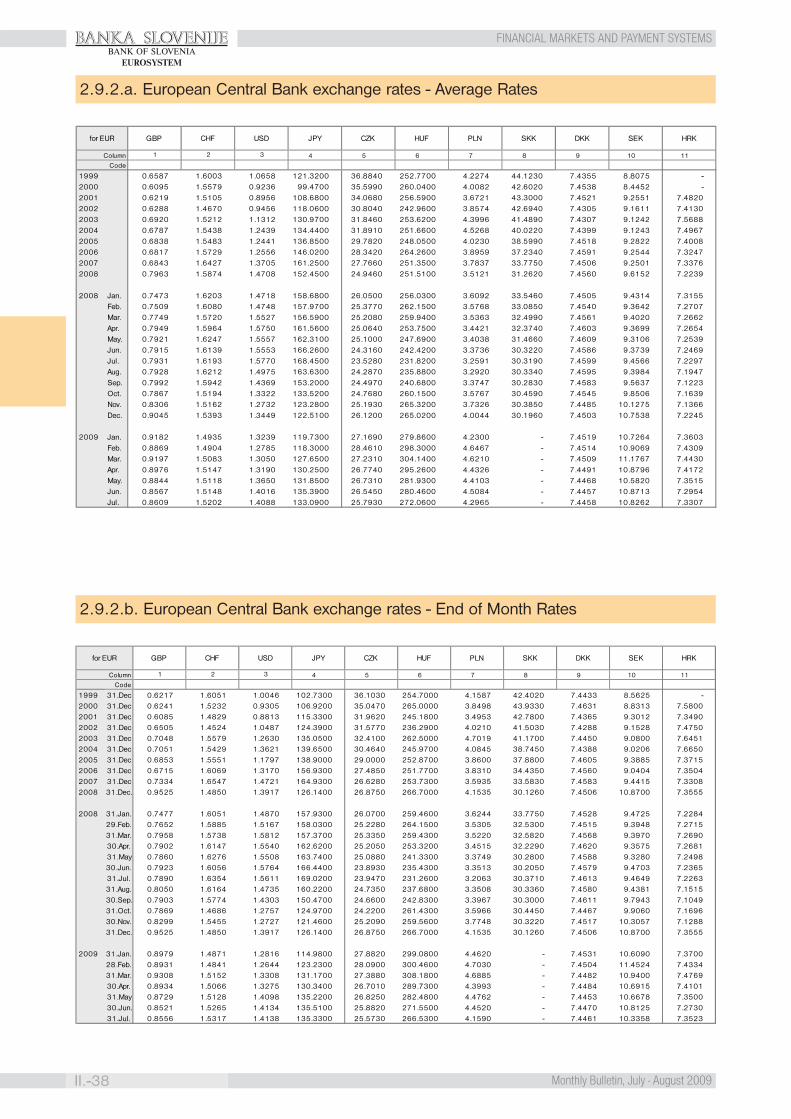
BANKA SLOVENIJE
II.-38 Monthly Bulletin, July - August 2009
FINANCIAL MARKETS AND PAYMENT SYSTEMSBANK OF SLOVENIA
EUROSYSTEM
2.9.2.a. European Central Bank exchange rates - Average Rates
2.9.2.b. European Central Bank exchange rates - End of Month Rates
Column 4 5 6 7 8 9 10 11
Code
1999 0.6587 1.6003 1.0658 121.3200 36.8840 252.7700 4.2274 44.1230 7.4355 8.8075 -2000 0.6095 1.5579 0.9236 99.4700 35.5990 260.0400 4.0082 42.6020 7.4538 8.4452 -2001 0.6219 1.5105 0.8956 108.6800 34.0680 256.5900 3.6721 43.3000 7.4521 9.2551 7.48202002 0.6288 1.4670 0.9456 118.0600 30.8040 242.9600 3.8574 42.6940 7.4305 9.1611 7.41302003 0.6920 1.5212 1.1312 130.9700 31.8460 253.6200 4.3996 41.4890 7.4307 9.1242 7.56882004 0.6787 1.5438 1.2439 134.4400 31.8910 251.6600 4.5268 40.0220 7.4399 9.1243 7.49672005 0.6838 1.5483 1.2441 136.8500 29.7820 248.0500 4.0230 38.5990 7.4518 9.2822 7.40082006 0.6817 1.5729 1.2556 146.0200 28.3420 264.2600 3.8959 37.2340 7.4591 9.2544 7.32472007 0.6843 1.6427 1.3705 161.2500 27.7660 251.3500 3.7837 33.7750 7.4506 9.2501 7.33762008 0.7963 1.5874 1.4708 152.4500 24.9460 251.5100 3.5121 31.2620 7.4560 9.6152 7.2239
2008 Jan. 0.7473 1.6203 1.4718 158.6800 26.0500 256.0300 3.6092 33.5460 7.4505 9.4314 7.3155Feb. 0.7509 1.6080 1.4748 157.9700 25.3770 262.1500 3.5768 33.0850 7.4540 9.3642 7.2707Mar. 0.7749 1.5720 1.5527 156.5900 25.2080 259.9400 3.5363 32.4990 7.4561 9.4020 7.2662Apr. 0.7949 1.5964 1.5750 161.5600 25.0640 253.7500 3.4421 32.3740 7.4603 9.3699 7.2654May. 0.7921 1.6247 1.5557 162.3100 25.1000 247.6900 3.4038 31.4660 7.4609 9.3106 7.2539Jun. 0.7915 1.6139 1.5553 166.2600 24.3160 242.4200 3.3736 30.3220 7.4586 9.3739 7.2469Jul. 0.7931 1.6193 1.5770 168.4500 23.5280 231.8200 3.2591 30.3190 7.4599 9.4566 7.2297Aug. 0.7928 1.6212 1.4975 163.6300 24.2870 235.8800 3.2920 30.3340 7.4595 9.3984 7.1947Sep. 0.7992 1.5942 1.4369 153.2000 24.4970 240.6800 3.3747 30.2830 7.4583 9.5637 7.1223Oct. 0.7867 1.5194 1.3322 133.5200 24.7680 260.1500 3.5767 30.4590 7.4545 9.8506 7.1639Nov. 0.8306 1.5162 1.2732 123.2800 25.1930 265.3200 3.7326 30.3850 7.4485 10.1275 7.1366Dec. 0.9045 1.5393 1.3449 122.5100 26.1200 265.0200 4.0044 30.1960 7.4503 10.7538 7.2245
2009 Jan. 0.9182 1.4935 1.3239 119.7300 27.1690 279.8600 4.2300 - 7.4519 10.7264 7.3603Feb. 0.8869 1.4904 1.2785 118.3000 28.4610 298.3000 4.6467 - 7.4514 10.9069 7.4309Mar. 0.9197 1.5083 1.3050 127.6500 27.2310 304.1400 4.6210 - 7.4509 11.1767 7.4430Apr. 0.8976 1.5147 1.3190 130.2500 26.7740 295.2600 4.4326 - 7.4491 10.8796 7.4172May. 0.8844 1.5118 1.3650 131.8500 26.7310 281.9300 4.4103 - 7.4468 10.5820 7.3515Jun. 0.8567 1.5148 1.4016 135.3900 26.5450 280.4600 4.5084 - 7.4457 10.8713 7.2954Jul. 0.8609 1.5202 1.4088 133.0900 25.7930 272.0600 4.2965 - 7.4458 10.8262 7.3307
HRKCHF USDfor EUR SEKSKK DKKCZK PLNHUF
1 2 3
JPYGBP
Column 4 5 6 7 8 9 10 11
Code
1999 31.Dec. 0.6217 1.6051 1.0046 102.7300 36.1030 254.7000 4.1587 42.4020 7.4433 8.5625 -2000 31.Dec. 0.6241 1.5232 0.9305 106.9200 35.0470 265.0000 3.8498 43.9330 7.4631 8.8313 7.58002001 31.Dec. 0.6085 1.4829 0.8813 115.3300 31.9620 245.1800 3.4953 42.7800 7.4365 9.3012 7.34902002 31.Dec. 0.6505 1.4524 1.0487 124.3900 31.5770 236.2900 4.0210 41.5030 7.4288 9.1528 7.47502003 31.Dec. 0.7048 1.5579 1.2630 135.0500 32.4100 262.5000 4.7019 41.1700 7.4450 9.0800 7.64512004 31.Dec. 0.7051 1.5429 1.3621 139.6500 30.4640 245.9700 4.0845 38.7450 7.4388 9.0206 7.66502005 31.Dec. 0.6853 1.5551 1.1797 138.9000 29.0000 252.8700 3.8600 37.8800 7.4605 9.3885 7.37152006 31.Dec. 0.6715 1.6069 1.3170 156.9300 27.4850 251.7700 3.8310 34.4350 7.4560 9.0404 7.35042007 31.Dec. 0.7334 1.6547 1.4721 164.9300 26.6280 253.7300 3.5935 33.5830 7.4583 9.4415 7.33082008 31.Dec. 0.9525 1.4850 1.3917 126.1400 26.8750 266.7000 4.1535 30.1260 7.4506 10.8700 7.3555
2008 31.Jan. 0.7477 1.6051 1.4870 157.9300 26.0700 259.4600 3.6244 33.7750 7.4528 9.4725 7.228429.Feb. 0.7652 1.5885 1.5167 158.0300 25.2280 264.1500 3.5305 32.5300 7.4515 9.3948 7.271531.Mar. 0.7958 1.5738 1.5812 157.3700 25.3350 259.4300 3.5220 32.5820 7.4568 9.3970 7.269030.Apr. 0.7902 1.6147 1.5540 162.6200 25.2050 253.3200 3.4515 32.2290 7.4620 9.3575 7.268131.May 0.7860 1.6276 1.5508 163.7400 25.0880 241.3300 3.3749 30.2800 7.4588 9.3280 7.249830.Jun. 0.7923 1.6056 1.5764 166.4400 23.8930 235.4300 3.3513 30.2050 7.4579 9.4703 7.236531.Jul. 0.7890 1.6354 1.5611 169.0200 23.9470 231.2600 3.2063 30.3710 7.4613 9.4649 7.226331.Aug. 0.8050 1.6164 1.4735 160.2200 24.7350 237.6800 3.3508 30.3360 7.4580 9.4381 7.151530.Sep. 0.7903 1.5774 1.4303 150.4700 24.6600 242.8300 3.3967 30.3000 7.4611 9.7943 7.104931.Oct. 0.7869 1.4686 1.2757 124.9700 24.2200 261.4300 3.5966 30.4450 7.4467 9.9060 7.169630.Nov. 0.8299 1.5455 1.2727 121.4600 25.2090 259.5600 3.7748 30.3220 7.4517 10.3057 7.128831.Dec. 0.9525 1.4850 1.3917 126.1400 26.8750 266.7000 4.1535 30.1260 7.4506 10.8700 7.3555
2009 31.Jan. 0.8979 1.4871 1.2816 114.9800 27.8820 299.0800 4.4620 - 7.4531 10.6090 7.370028.Feb. 0.8931 1.4841 1.2644 123.2300 28.0900 300.4600 4.7030 - 7.4504 11.4524 7.433431.Mar. 0.9308 1.5152 1.3308 131.1700 27.3880 308.1800 4.6885 - 7.4482 10.9400 7.476930.Apr. 0.8934 1.5066 1.3275 130.3400 26.7010 289.7300 4.3993 - 7.4484 10.6915 7.410131.May 0.8729 1.5128 1.4098 135.2200 26.8250 282.4800 4.4762 - 7.4453 10.6678 7.350030.Jun. 0.8521 1.5265 1.4134 135.5100 25.8820 271.5500 4.4520 - 7.4470 10.8125 7.273031.Jul. 0.8556 1.5317 1.4138 135.3300 25.5730 266.5300 4.1590 - 7.4461 10.3358 7.3523
1 2 3
JPYGBPfor EUR SEKSKK DKKCZK PLNHUF HRKCHF USD
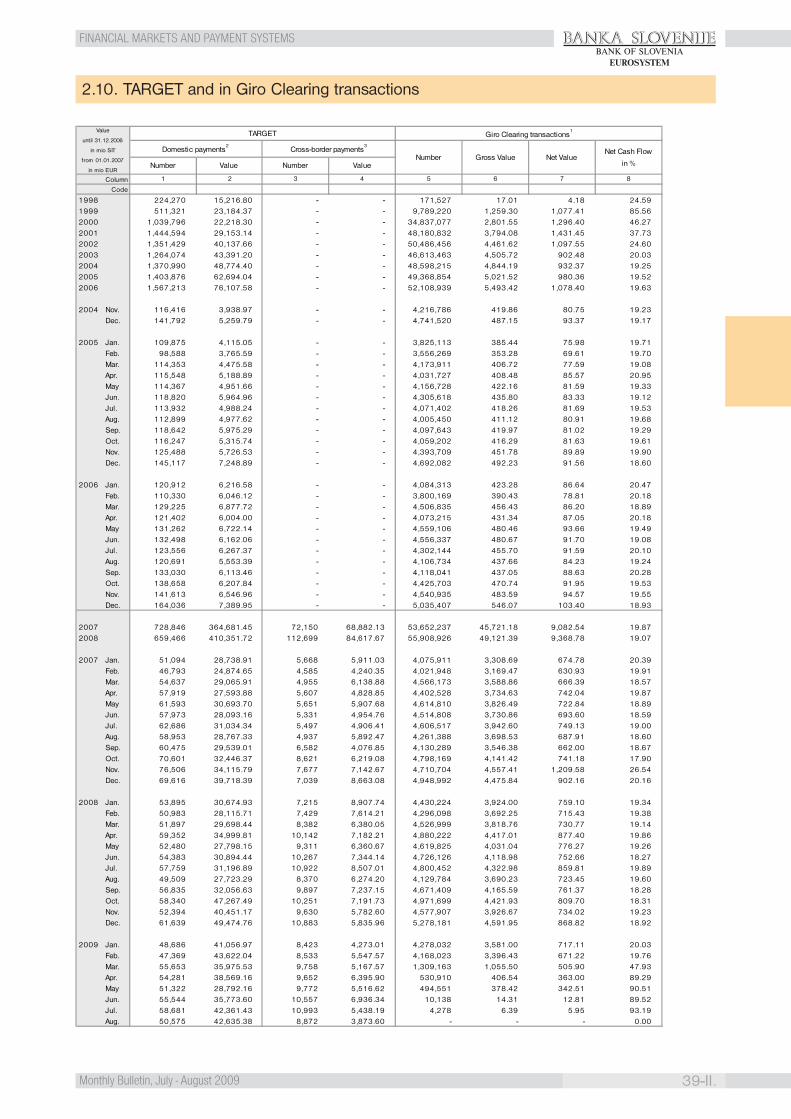
BANKA SLOVENIJE
39-II.Monthly Bulletin, July - August 2009
FINANCIAL MARKETS AND PAYMENT SYSTEMSBANK OF SLOVENIA
EUROSYSTEM
2.10. TARGET and in Giro Clearing transactions
Column
Code
1998 224,270 15,216.80 - - 171,527 17.01 4.18 24.591999 511,321 23,184.37 - - 9,789,220 1,259.30 1,077.41 85.562000 1,039,796 22,218.30 - - 34,837,077 2,801.55 1,296.40 46.272001 1,444,594 29,153.14 - - 48,180,832 3,794.08 1,431.45 37.732002 1,351,429 40,137.66 - - 50,486,456 4,461.62 1,097.55 24.602003 1,264,074 43,391.20 - - 46,613,463 4,505.72 902.48 20.032004 1,370,990 48,774.40 - - 48,598,215 4,844.19 932.37 19.252005 1,403,876 62,694.04 - - 49,368,854 5,021.52 980.36 19.522006 1,567,213 76,107.58 - - 52,108,939 5,493.42 1,078.40 19.63
2004 Nov. 116,416 3,938.97 - - 4,216,786 419.86 80.75 19.23Dec. 141,792 5,259.79 - - 4,741,520 487.15 93.37 19.17
2005 Jan. 109,875 4,115.05 - - 3,825,113 385.44 75.98 19.71Feb. 98,588 3,765.59 - - 3,556,269 353.28 69.61 19.70Mar. 114,353 4,475.58 - - 4,173,911 406.72 77.59 19.08Apr. 115,548 5,188.89 - - 4,031,727 408.48 85.57 20.95
May 114,367 4,951.66 - - 4,156,728 422.16 81.59 19.33Jun. 118,820 5,964.96 - - 4,305,618 435.80 83.33 19.12Jul. 113,932 4,988.24 - - 4,071,402 418.26 81.69 19.53
Aug. 112,899 4,977.62 - - 4,005,450 411.12 80.91 19.68 Sep. 118,642 5,975.29 - - 4,097,643 419.97 81.02 19.29 Oct. 116,247 5,315.74 - - 4,059,202 416.29 81.63 19.61 Nov. 125,488 5,726.53 - - 4,393,709 451.78 89.89 19.90 Dec. 145,117 7,248.89 - - 4,692,082 492.23 91.56 18.60
2006 Jan. 120,912 6,216.58 - - 4,084,313 423.28 86.64 20.47 Feb. 110,330 6,046.12 - - 3,800,169 390.43 78.81 20.18
Mar. 129,225 6,877.72 - - 4,506,835 456.43 86.20 18.89Apr. 121,402 6,004.00 - - 4,073,215 431.34 87.05 20.18May 131,262 6,722.14 - - 4,559,106 480.46 93.66 19.49Jun. 132,498 6,162.06 - - 4,556,337 480.67 91.70 19.08Jul. 123,556 6,267.37 - - 4,302,144 455.70 91.59 20.10Aug. 120,691 5,553.39 - - 4,106,734 437.66 84.23 19.24Sep. 133,030 6,113.46 - - 4,118,041 437.05 88.63 20.28Oct. 138,658 6,207.84 - - 4,425,703 470.74 91.95 19.53Nov. 141,613 6,546.96 - - 4,540,935 483.59 94.57 19.55Dec. 164,036 7,389.95 - - 5,035,407 546.07 103.40 18.93
2007 728,846 364,681.45 72,150 68,882.13 53,652,237 45,721.18 9,082.54 19.872008 659,466 410,351.72 112,699 84,617.67 55,908,926 49,121.39 9,368.78 19.07
2007 Jan. 51,094 28,738.91 5,668 5,911.03 4,075,911 3,308.69 674.78 20.39 Feb. 46,793 24,874.65 4,585 4,240.35 4,021,948 3,169.47 630.93 19.91
Mar. 54,637 29,065.91 4,955 6,138.88 4,566,173 3,588.86 666.39 18.57 Apr. 57,919 27,593.88 5,607 4,828.85 4,402,528 3,734.63 742.04 19.87 May 61,593 30,693.70 5,651 5,907.68 4,614,810 3,826.49 722.84 18.89 Jun. 57,973 28,093.16 5,331 4,954.76 4,514,808 3,730.86 693.60 18.59 Jul. 62,686 31,034.34 5,497 4,906.41 4,606,517 3,942.60 749.13 19.00 Aug. 58,953 28,767.33 4,937 5,892.47 4,261,388 3,698.53 687.91 18.60 Sep. 60,475 29,539.01 6,582 4,076.85 4,130,289 3,546.38 662.00 18.67 Oct. 70,601 32,446.37 8,621 6,219.08 4,798,169 4,141.42 741.18 17.90 Nov. 76,506 34,115.79 7,677 7,142.67 4,710,704 4,557.41 1,209.58 26.54 Dec. 69,616 39,718.39 7,039 8,663.08 4,948,992 4,475.84 902.16 20.16
2008 Jan. 53,895 30,674.93 7,215 8,907.74 4,430,224 3,924.00 759.10 19.34 Feb. 50,983 28,115.71 7,429 7,614.21 4,296,098 3,692.25 715.43 19.38 Mar. 51,897 29,698.44 8,382 6,380.05 4,526,999 3,818.76 730.77 19.14 Apr. 59,352 34,999.81 10,142 7,182.21 4,880,222 4,417.01 877.40 19.86 May 52,480 27,798.15 9,311 6,360.67 4,619,825 4,031.04 776.27 19.26 Jun. 54,383 30,894.44 10,267 7,344.14 4,726,126 4,118.98 752.66 18.27 Jul. 57,759 31,196.89 10,922 8,507.01 4,800,452 4,322.98 859.81 19.89 Aug. 49,509 27,723.29 8,370 6,274.20 4,129,784 3,690.23 723.45 19.60 Sep. 56,835 32,056.63 9,897 7,237.15 4,671,409 4,165.59 761.37 18.28 Oct. 58,340 47,267.49 10,251 7,191.73 4,971,699 4,421.93 809.70 18.31 Nov. 52,394 40,451.17 9,630 5,782.60 4,577,907 3,926.67 734.02 19.23 Dec. 61,639 49,474.76 10,883 5,835.96 5,278,181 4,591.95 868.82 18.92 2009 Jan. 48,686 41,056.97 8,423 4,273.01 4,278,032 3,581.00 717.11 20.03 Feb. 47,369 43,622.04 8,533 5,547.57 4,168,023 3,396.43 671.22 19.76 Mar. 55,653 35,975.53 9,758 5,167.57 1,309,163 1,055.50 505.90 47.93 Apr. 54,281 38,569.16 9,652 6,395.90 530,910 406.54 363.00 89.29 May 51,322 28,792.16 9,772 5,516.62 494,551 378.42 342.51 90.51 Jun. 55,544 35,773.60 10,557 6,936.34 10,138 14.31 12.81 89.52 Jul. 58,681 42,361.43 10,993 5,438.19 4,278 6.39 5.95 93.19 Aug. 50,575 42,635.38 8,872 3,873.60 - - - 0.00
Value
4 5 6
Value
1 2
Value
until 31.12.2006
in mio SIT
from 01.01.2007
in mio EUR
TARGET Giro Clearing transactions1
Domestic payments2
Cross-border payments3
Number Gross Value Net ValueNet Cash Flow
Number Number in %
7 83
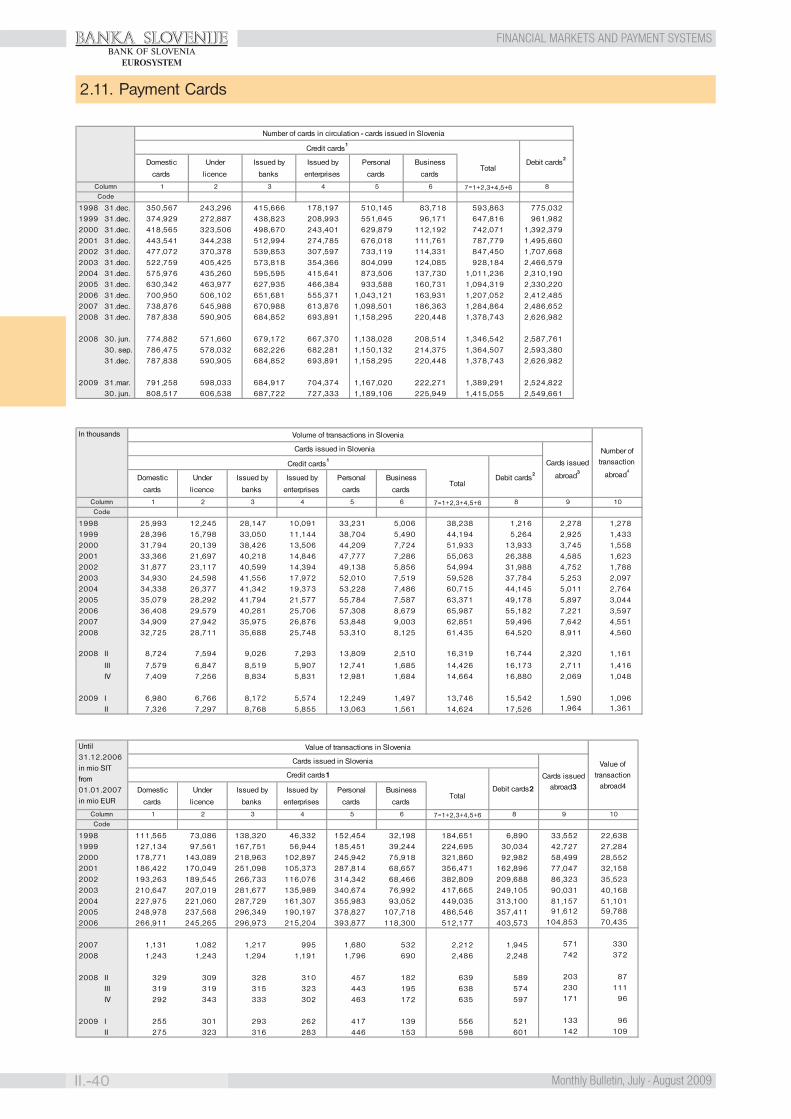
BANKA SLOVENIJE
II.-40 Monthly Bulletin, July - August 2009
FINANCIAL MARKETS AND PAYMENT SYSTEMSBANK OF SLOVENIA
EUROSYSTEM
2.11. Payment Cards
1998 31.dec. 350,567 243,296 415,666 178,197 510,145 83,718 593,863 775,032 1999 31.dec. 374,929 272,887 438,823 208,993 551,645 96,171 647,816 961,9822000 31.dec. 418,565 323,506 498,670 243,401 629,879 112,192 742,071 1,392,3792001 31.dec. 443,541 344,238 512,994 274,785 676,018 111,761 787,779 1,495,6602002 31.dec. 477,072 370,378 539,853 307,597 733,119 114,331 847,450 1,707,6682003 31.dec. 522,759 405,425 573,818 354,366 804,099 124,085 928,184 2,466,5792004 31.dec. 575,976 435,260 595,595 415,641 873,506 137,730 1,011,236 2,310,1902005 31.dec. 630,342 463,977 627,935 466,384 933,588 160,731 1,094,319 2,330,2202006 31.dec. 700,950 506,102 651,681 555,371 1,043,121 163,931 1,207,052 2,412,4852007 31.dec. 738,876 545,988 670,988 613,876 1,098,501 186,363 1,284,864 2,486,6522008 31.dec. 787,838 590,905 684,852 693,891 1,158,295 220,448 1,378,743 2,626,982
2008 30. jun. 774,882 571,660 679,172 667,370 1,138,028 208,514 1,346,542 2,587,76130. sep. 786,475 578,032 682,226 682,281 1,150,132 214,375 1,364,507 2,593,38031.dec. 787,838 590,905 684,852 693,891 1,158,295 220,448 1,378,743 2,626,982
2009 31.mar. 791,258 598,033 684,917 704,374 1,167,020 222,271 1,389,291 2,524,82230. jun. 808,517 606,538 687,722 727,333 1,189,106 225,949 1,415,055 2,549,661
87=1+2,3+4,5+6Code
4 5 6
cards cards
Column 1 2 3
cards licence banks enterprises
Number of cards in circulation - cards issued in Slovenia
Credit cards1
Debit cards2
Domestic Under Issued by Issued by Personal BusinessTotal
Volume of transactions in Slovenia
1998 25,993 12,245 28,147 10,091 33,231 5,006 38,238 1,216 2,278 1,2781999 28,396 15,798 33,050 11,144 38,704 5,490 44,194 5,264 2,925 1,4332000 31,794 20,139 38,426 13,506 44,209 7,724 51,933 13,933 3,745 1,5582001 33,366 21,697 40,218 14,846 47,777 7,286 55,063 26,388 4,585 1,6232002 31,877 23,117 40,599 14,394 49,138 5,856 54,994 31,988 4,752 1,7882003 34,930 24,598 41,556 17,972 52,010 7,519 59,528 37,784 5,253 2,0972004 34,338 26,377 41,342 19,373 53,228 7,486 60,715 44,145 5,011 2,7642005 35,079 28,292 41,794 21,577 55,784 7,587 63,371 49,178 5,897 3,0442006 36,408 29,579 40,281 25,706 57,308 8,679 65,987 55,182 7,221 3,5972007 34,909 27,942 35,975 26,876 53,848 9,003 62,851 59,496 7,642 4,5512008 32,725 28,711 35,688 25,748 53,310 8,125 61,435 64,520 8,911 4,560
2008 II 8,724 7,594 9,026 7,293 13,809 2,510 16,319 16,744 2,320 1,161
III 7,579 6,847 8,519 5,907 12,741 1,685 14,426 16,173 2,711 1,416IV 7,409 7,256 8,834 5,831 12,981 1,684 14,664 16,880 2,069 1,048
2009 I 6,980 6,766 8,172 5,574 12,249 1,497 13,746 15,542 1,590 1,096II 7,326 7,297 8,768 5,855 13,063 1,561 14,624 17,526 1,964 1,361
10
Number of transaction
abroad4
In thousands
Cards issued in Slovenia
Cards issued
abroad3
Credit cards1
Debit cards2
Under Issued by Issued by Personal Total
licence banks enterprises cards cards
Business
6 7=1+2,3+4,5+6 81 2 3 4Column
Code
Domestic
cards
95
1998 111,565 73,086 138,320 46,332 152,454 32,198 184,651 6,890 33,552 22,6381999 127,134 97,561 167,751 56,944 185,451 39,244 224,695 30,034 42,727 27,2842000 178,771 143,089 218,963 102,897 245,942 75,918 321,860 92,982 58,499 28,552 2001 186,422 170,049 251,098 105,373 287,814 68,657 356,471 162,896 77,047 32,158 2002 193,263 189,545 266,733 116,076 314,342 68,466 382,809 209,688 86,323 35,523 2003 210,647 207,019 281,677 135,989 340,674 76,992 417,665 249,105 90,031 40,168 2004 227,975 221,060 287,729 161,307 355,983 93,052 449,035 313,100 81,157 51,1012005 248,978 237,568 296,349 190,197 378,827 107,718 486,546 357,411 91,612 59,788
2006 266,911 245,265 296,973 215,204 393,877 118,300 512,177 403,573 104,853 70,435
2007 1,131 1,082 1,217 995 1,680 532 2,212 1,945 571 330
2008 1,243 1,243 1,294 1,191 1,796 690 2,486 2,248 742 372
2008 II 329 309 328 310 457 182 639 589 203 87
III 319 319 315 323 443 195 638 574 230 111
IV 292 343 333 302 463 172 635 597 171 96
2009 I 255 301 293 262 417 139 556 521 133 96
II 275 323 316 283 446 153 598 601 142 109
95Column
Code
Domestic
cards
6 7=1+2,3+4,5+6 81 2 3 4
Issued by Personal Total
licence banks enterprises cards cards
Business
10
Value of transactions in Slovenia
Value of transaction
abroad4
Until 31.12.2006 in mio SIT from 01.01.2007 in mio EUR
Cards issued in Slovenia
Cards issued abroad3
Credit cards1
Debit cards2Under Issued by
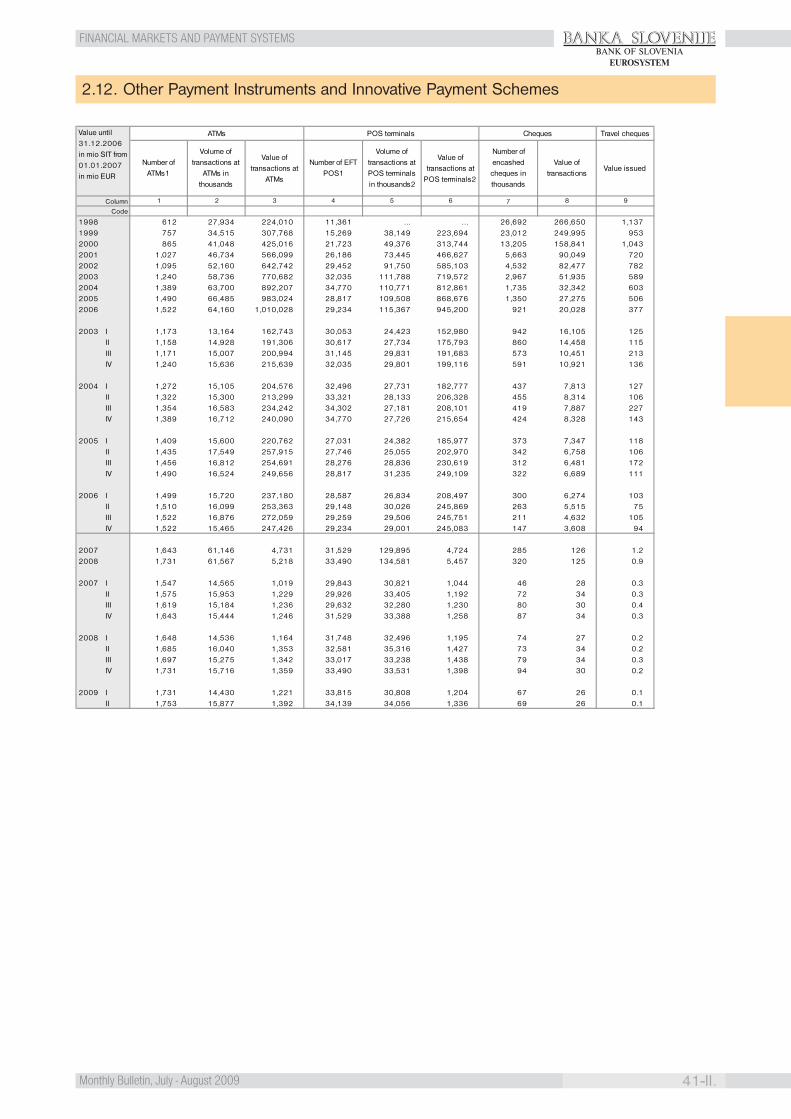
BANKA SLOVENIJE
41-II.Monthly Bulletin, July - August 2009
FINANCIAL MARKETS AND PAYMENT SYSTEMSBANK OF SLOVENIA
EUROSYSTEM
2.12. Other Payment Instruments and Innovative Payment Schemes
Column
Code
1998 612 27,934 224,010 11,361 … … 26,692 266,650 1,1371999 757 34,515 307,768 15,269 38,149 223,694 23,012 249,995 9532000 865 41,048 425,016 21,723 49,376 313,744 13,205 158,841 1,0432001 1,027 46,734 566,099 26,186 73,445 466,627 5,663 90,049 7202002 1,095 52,160 642,742 29,452 91,750 585,103 4,532 82,477 7822003 1,240 58,736 770,682 32,035 111,788 719,572 2,967 51,935 5892004 1,389 63,700 892,207 34,770 110,771 812,861 1,735 32,342 6032005 1,490 66,485 983,024 28,817 109,508 868,676 1,350 27,275 5062006 1,522 64,160 1,010,028 29,234 115,367 945,200 921 20,028 377
2003 I 1,173 13,164 162,743 30,053 24,423 152,980 942 16,105 125 II 1,158 14,928 191,306 30,617 27,734 175,793 860 14,458 115 III 1,171 15,007 200,994 31,145 29,831 191,683 573 10,451 213
IV 1,240 15,636 215,639 32,035 29,801 199,116 591 10,921 136
2004 I 1,272 15,105 204,576 32,496 27,731 182,777 437 7,813 127II 1,322 15,300 213,299 33,321 28,133 206,328 455 8,314 106III 1,354 16,583 234,242 34,302 27,181 208,101 419 7,887 227IV 1,389 16,712 240,090 34,770 27,726 215,654 424 8,328 143
2005 I 1,409 15,600 220,762 27,031 24,382 185,977 373 7,347 118
II 1,435 17,549 257,915 27,746 25,055 202,970 342 6,758 106III 1,456 16,812 254,691 28,276 28,836 230,619 312 6,481 172IV 1,490 16,524 249,656 28,817 31,235 249,109 322 6,689 111
2006 I 1,499 15,720 237,180 28,587 26,834 208,497 300 6,274 103II 1,510 16,099 253,363 29,148 30,026 245,869 263 5,515 75III 1,522 16,876 272,059 29,259 29,506 245,751 211 4,632 105IV 1,522 15,465 247,426 29,234 29,001 245,083 147 3,608 94
2007 1,643 61,146 4,731 31,529 129,895 4,724 285 126 1.22008 1,731 61,567 5,218 33,490 134,581 5,457 320 125 0.9
2007 I 1,547 14,565 1,019 29,843 30,821 1,044 46 28 0.3II 1,575 15,953 1,229 29,926 33,405 1,192 72 34 0.3III 1,619 15,184 1,236 29,632 32,280 1,230 80 30 0.4IV 1,643 15,444 1,246 31,529 33,388 1,258 87 34 0.3
2008 I 1,648 14,536 1,164 31,748 32,496 1,195 74 27 0.2II 1,685 16,040 1,353 32,581 35,316 1,427 73 34 0.2III 1,697 15,275 1,342 33,017 33,238 1,438 79 34 0.3IV 1,731 15,716 1,359 33,490 33,531 1,398 94 30 0.2
2009 I 1,731 14,430 1,221 33,815 30,808 1,204 67 26 0.1II 1,753 15,877 1,392 34,139 34,056 1,336 69 26 0.1
7 82 3 4
Value until 31.12.2006 in mio SIT from 01.01.2007 in mio EUR
1
ATMs
6
POS terminals
Value of transactions at
POS terminals2
95
Cheques Travel cheques
Number of ATMs1
Volume of transactions at
ATMs in thousands
Number of EFT POS1
Number of encashed cheques in thousands
Value of transactions
Value issuedValue of
transactions at ATMs
Volume of transactions at POS terminals in thousands2
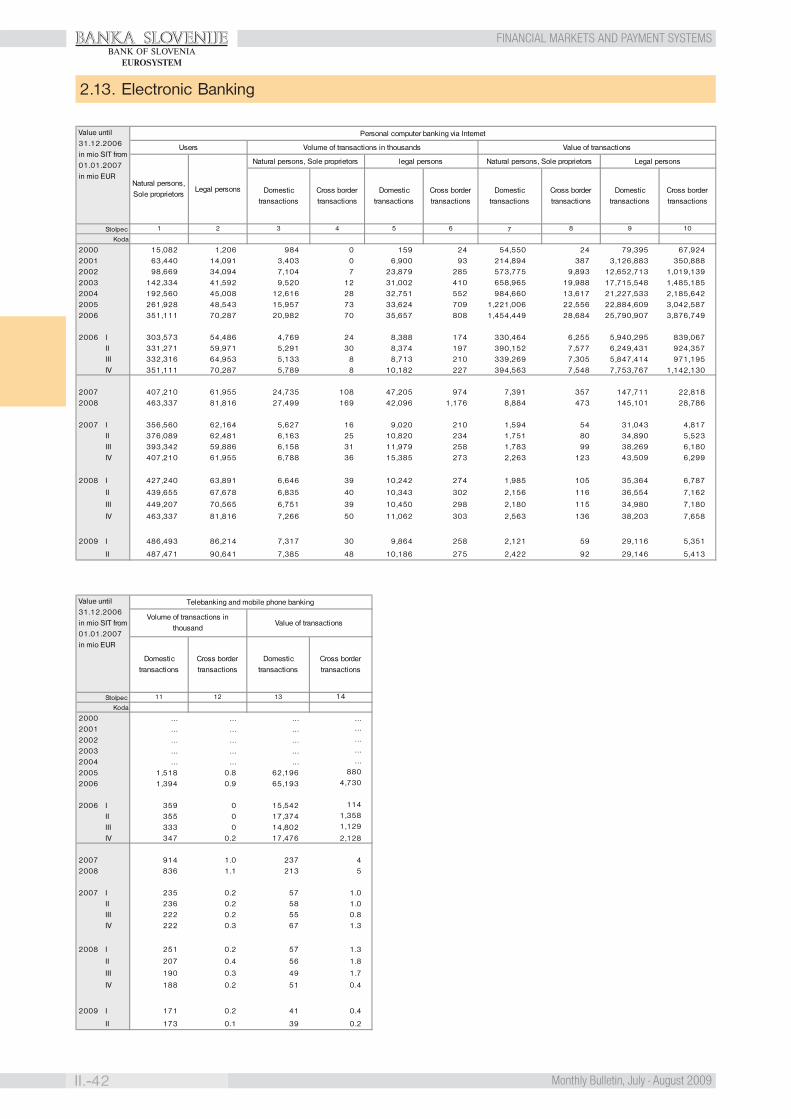
BANKA SLOVENIJE
II.-42 Monthly Bulletin, July - August 2009
FINANCIAL MARKETS AND PAYMENT SYSTEMSBANK OF SLOVENIA
EUROSYSTEM
2.13. Electronic Banking
Stolpec
Koda
2000 … … … …2001 … … … …
2002 … … … …
2003 … … … …
2004 … … … …
2005 1,518 0.8 62,196 880
2006 1,394 0.9 65,193 4,730
2006 I 359 0 15,542 114
II 355 0 17,374 1,358
III 333 0 14,802 1,129
IV 347 0.2 17,476 2,128
2007 914 1.0 237 42008 836 1.1 213 5
2007 I 235 0.2 57 1.0II 236 0.2 58 1.0III 222 0.2 55 0.8IV 222 0.3 67 1.3
2008 I 251 0.2 57 1.3
II 207 0.4 56 1.8
III 190 0.3 49 1.7
IV 188 0.2 51 0.4
2009 I 171 0.2 41 0.4
II 173 0.1 39 0.2
1211 13 14
Value until 31.12.2006 in mio SIT from 01.01.2007 in mio EUR
Telebanking and mobile phone banking
Volume of transactions in thousand
Value of transactions
Domestic transactions
Cross border transactions
Cross border transactions
Domestic transactions
Stolpec
Koda
2000 15,082 1,206 984 0 159 24 54,550 24 79,395 67,9242001 63,440 14,091 3,403 0 6,900 93 214,894 387 3,126,883 350,8882002 98,669 34,094 7,104 7 23,879 285 573,775 9,893 12,652,713 1,019,1392003 142,334 41,592 9,520 12 31,002 410 658,965 19,988 17,715,548 1,485,1852004 192,560 45,008 12,616 28 32,751 552 984,660 13,617 21,227,533 2,185,6422005 261,928 48,543 15,957 73 33,624 709 1,221,006 22,556 22,884,609 3,042,5872006 351,111 70,287 20,982 70 35,657 808 1,454,449 28,684 25,790,907 3,876,749
2006 I 303,573 54,486 4,769 24 8,388 174 330,464 6,255 5,940,295 839,067II 331,271 59,971 5,291 30 8,374 197 390,152 7,577 6,249,431 924,357III 332,316 64,953 5,133 8 8,713 210 339,269 7,305 5,847,414 971,195IV 351,111 70,287 5,789 8 10,182 227 394,563 7,548 7,753,767 1,142,130
2007 407,210 61,955 24,735 108 47,205 974 7,391 357 147,711 22,8182008 463,337 81,816 27,499 169 42,096 1,176 8,884 473 145,101 28,786
2007 I 356,560 62,164 5,627 16 9,020 210 1,594 54 31,043 4,817II 376,089 62,481 6,163 25 10,820 234 1,751 80 34,890 5,523III 393,342 59,886 6,158 31 11,979 258 1,783 99 38,269 6,180IV 407,210 61,955 6,788 36 15,385 273 2,263 123 43,509 6,299
2008 I 427,240 63,891 6,646 39 10,242 274 1,985 105 35,364 6,787
II 439,655 67,678 6,835 40 10,343 302 2,156 116 36,554 7,162
III 449,207 70,565 6,751 39 10,450 298 2,180 115 34,980 7,180
IV 463,337 81,816 7,266 50 11,062 303 2,563 136 38,203 7,658
2009 I 486,493 86,214 7,317 30 9,864 258 2,121 59 29,116 5,351
II 487,471 90,641 7,385 48 10,186 275 2,422 92 29,146 5,413
Value until 31.12.2006 in mio SIT from 01.01.2007 in mio EUR
Personal computer banking via Internet
Legal persons
Domestic transactions
Cross border transactions
Domestic transactions
Cross border transactions
Natural persons, Sole proprietors
Domestic transactions
Cross border transactions
Users Volume of transactions in thousands Value of transactions
Natural persons, Sole proprietors
Legal persons
Natural persons, Sole proprietors legal persons
Cross border transactions
1 2 3 4 5 6 7
Domestic transactions
9 108
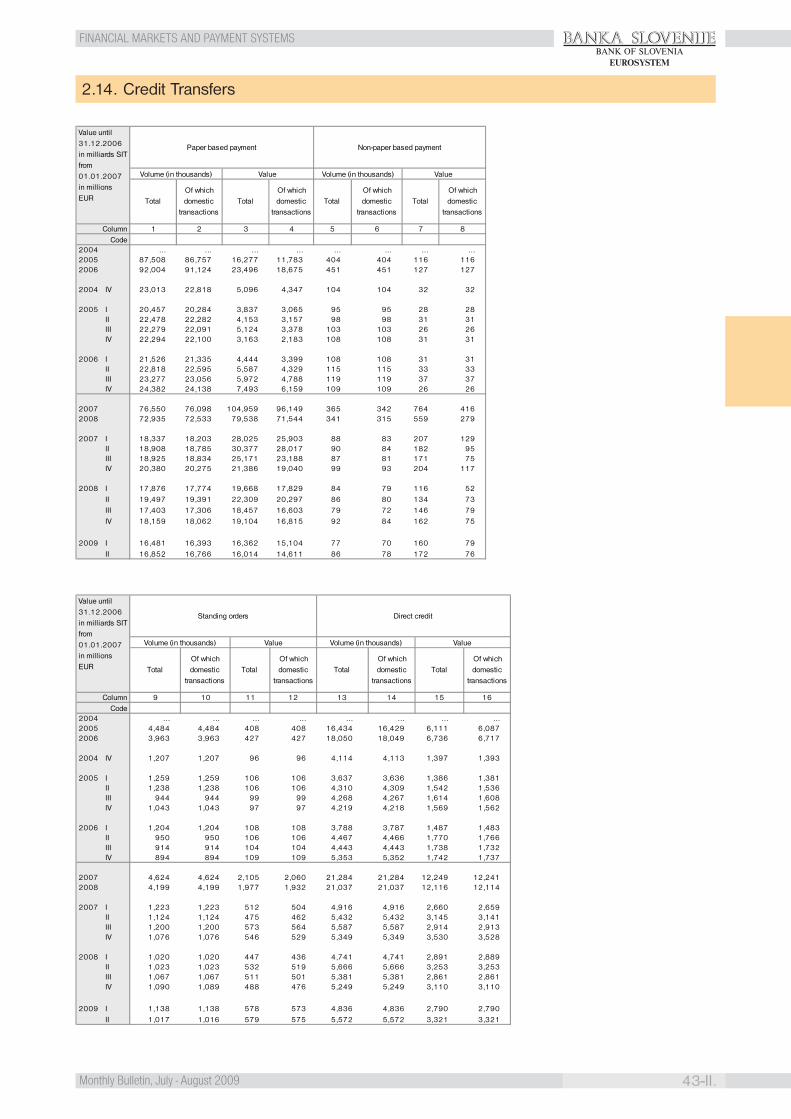
BANKA SLOVENIJE
43-II.Monthly Bulletin, July - August 2009
FINANCIAL MARKETS AND PAYMENT SYSTEMSBANK OF SLOVENIA
EUROSYSTEM
2.14. Credit Transfers
ColumnCode
2004 … … … … … … … …2005 87,508 86,757 16,277 11,783 404 404 116 1162006 92,004 91,124 23,496 18,675 451 451 127 127
2004 IV 23,013 22,818 5,096 4,347 104 104 32 32
2005 I 20,457 20,284 3,837 3,065 95 95 28 28II 22,478 22,282 4,153 3,157 98 98 31 31III 22,279 22,091 5,124 3,378 103 103 26 26IV 22,294 22,100 3,163 2,183 108 108 31 31
2006 I 21,526 21,335 4,444 3,399 108 108 31 31II 22,818 22,595 5,587 4,329 115 115 33 33III 23,277 23,056 5,972 4,788 119 119 37 37IV 24,382 24,138 7,493 6,159 109 109 26 26
2007 76,550 76,098 104,959 96,149 365 342 764 4162008 72,935 72,533 79,538 71,544 341 315 559 279
2007 I 18,337 18,203 28,025 25,903 88 83 207 129II 18,908 18,785 30,377 28,017 90 84 182 95III 18,925 18,834 25,171 23,188 87 81 171 75IV 20,380 20,275 21,386 19,040 99 93 204 117
2008 I 17,876 17,774 19,668 17,829 84 79 116 52II 19,497 19,391 22,309 20,297 86 80 134 73III 17,403 17,306 18,457 16,603 79 72 146 79IV 18,159 18,062 19,104 16,815 92 84 162 75
2009 I 16,481 16,393 16,362 15,104 77 70 160 79II 16,852 16,766 16,014 14,611 86 78 172 76
3 4 5 61 2
TotalOf which domestic
transactions
7
TotalOf which domestic
transactions
Volume (in thousands) Value
8
Value until 31.12.2006 in milliards SIT from 01.01.2007 in millions EUR
Paper based payment Non-paper based payment
Volume (in thousands) Value
TotalOf which domestic
transactionsTotal
Of which domestic
transactions
ColumnCode
2004 … … … … … … … …2005 4,484 4,484 408 408 16,434 16,429 6,111 6,0872006 3,963 3,963 427 427 18,050 18,049 6,736 6,717
2004 IV 1,207 1,207 96 96 4,114 4,113 1,397 1,393
2005 I 1,259 1,259 106 106 3,637 3,636 1,386 1,381II 1,238 1,238 106 106 4,310 4,309 1,542 1,536III 944 944 99 99 4,268 4,267 1,614 1,608IV 1,043 1,043 97 97 4,219 4,218 1,569 1,562
2006 I 1,204 1,204 108 108 3,788 3,787 1,487 1,483II 950 950 106 106 4,467 4,466 1,770 1,766III 914 914 104 104 4,443 4,443 1,738 1,732IV 894 894 109 109 5,353 5,352 1,742 1,737
2007 4,624 4,624 2,105 2,060 21,284 21,284 12,249 12,2412008 4,199 4,199 1,977 1,932 21,037 21,037 12,116 12,114
2007 I 1,223 1,223 512 504 4,916 4,916 2,660 2,659II 1,124 1,124 475 462 5,432 5,432 3,145 3,141III 1,200 1,200 573 564 5,587 5,587 2,914 2,913IV 1,076 1,076 546 529 5,349 5,349 3,530 3,528
2008 I 1,020 1,020 447 436 4,741 4,741 2,891 2,889II 1,023 1,023 532 519 5,666 5,666 3,253 3,253III 1,067 1,067 511 501 5,381 5,381 2,861 2,861IV 1,090 1,089 488 476 5,249 5,249 3,110 3,110
2009 I 1,138 1,138 578 573 4,836 4,836 2,790 2,790II 1,017 1,016 579 575 5,572 5,572 3,321 3,321
1611
Value until 31.12.2006 in milliards SIT from 01.01.2007 in millions EUR
Direct credit
15
Total
1310
Of which domestic
transactions
Value
14
Volume (in thousands) Value
Of which domestic
transactionsTotalTotal
Of which domestic
transactions
9
Volume (in thousands)
Standing orders
TotalOf which domestic
transactions
12
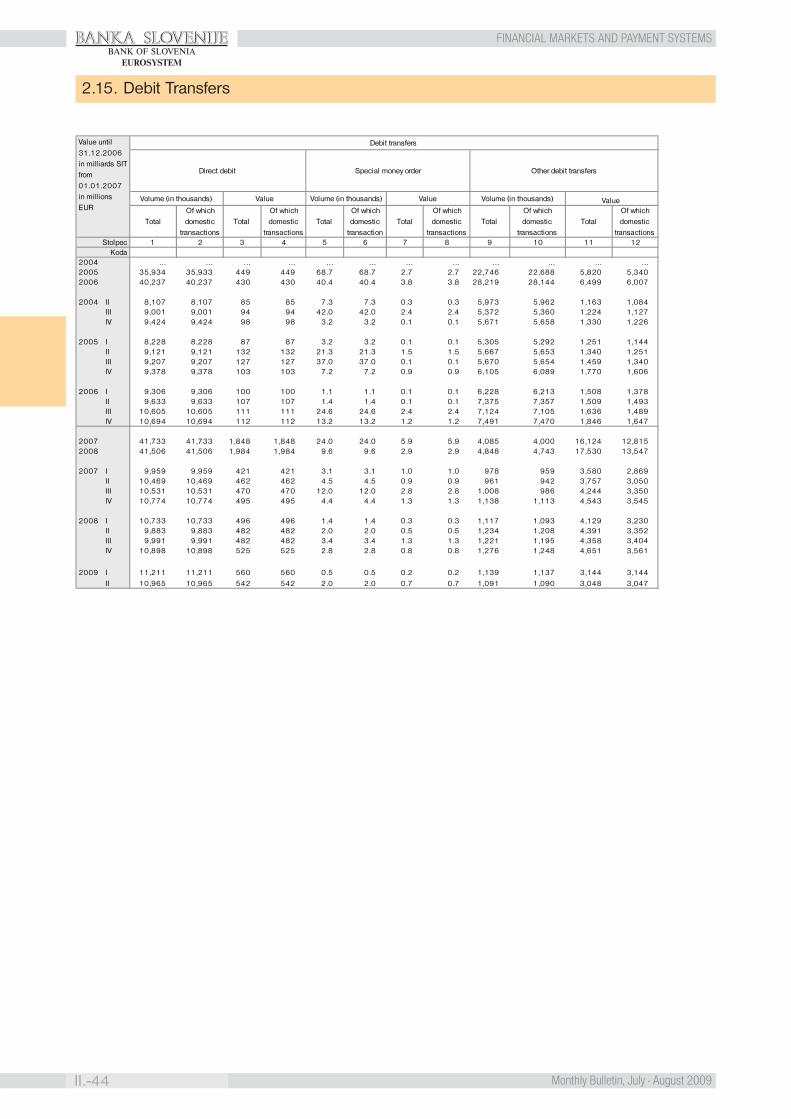
BANKA SLOVENIJE
II.-44 Monthly Bulletin, July - August 2009
FINANCIAL MARKETS AND PAYMENT SYSTEMSBANK OF SLOVENIA
EUROSYSTEM
2.15. Debit Transfers
StolpecKoda
2004 … … … … … … … … … … … …2005 35,934 35,933 449 449 68.7 68.7 2.7 2.7 22,746 22,688 5,820 5,3402006 40,237 40,237 430 430 40.4 40.4 3.8 3.8 28,219 28,144 6,499 6,007
2004 II 8,107 8,107 85 85 7.3 7.3 0.3 0.3 5,973 5,962 1,163 1,084 III 9,001 9,001 94 94 42.0 42.0 2.4 2.4 5,372 5,360 1,224 1,127
IV 9,424 9,424 98 98 3.2 3.2 0.1 0.1 5,671 5,658 1,330 1,226
2005 I 8,228 8,228 87 87 3.2 3.2 0.1 0.1 5,305 5,292 1,251 1,144II 9,121 9,121 132 132 21.3 21.3 1.5 1.5 5,667 5,653 1,340 1,251III 9,207 9,207 127 127 37.0 37.0 0.1 0.1 5,670 5,654 1,459 1,340IV 9,378 9,378 103 103 7.2 7.2 0.9 0.9 6,105 6,089 1,770 1,606
2006 I 9,306 9,306 100 100 1.1 1.1 0.1 0.1 6,228 6,213 1,508 1,378II 9,633 9,633 107 107 1.4 1.4 0.1 0.1 7,375 7,357 1,509 1,493III 10,605 10,605 111 111 24.6 24.6 2.4 2.4 7,124 7,105 1,636 1,489IV 10,694 10,694 112 112 13.2 13.2 1.2 1.2 7,491 7,470 1,846 1,647
2007 41,733 41,733 1,848 1,848 24.0 24.0 5.9 5.9 4,085 4,000 16,124 12,8152008 41,506 41,506 1,984 1,984 9.6 9.6 2.9 2.9 4,848 4,743 17,530 13,547
2007 I 9,959 9,959 421 421 3.1 3.1 1.0 1.0 978 959 3,580 2,869II 10,469 10,469 462 462 4.5 4.5 0.9 0.9 961 942 3,757 3,050III 10,531 10,531 470 470 12.0 12.0 2.8 2.8 1,008 986 4,244 3,350IV 10,774 10,774 495 495 4.4 4.4 1.3 1.3 1,138 1,113 4,543 3,545
2008 I 10,733 10,733 496 496 1.4 1.4 0.3 0.3 1,117 1,093 4,129 3,230II 9,883 9,883 482 482 2.0 2.0 0.5 0.5 1,234 1,208 4,391 3,352III 9,991 9,991 482 482 3.4 3.4 1.3 1.3 1,221 1,195 4,358 3,404IV 10,898 10,898 525 525 2.8 2.8 0.8 0.8 1,276 1,248 4,651 3,561
2009 I 11,211 11,211 560 560 0.5 0.5 0.2 0.2 1,139 1,137 3,144 3,144II 10,965 10,965 542 542 2.0 2.0 0.7 0.7 1,091 1,090 3,048 3,047
Debit transfers
Special money order
Volume (in thousands) Value Volume (in thousands) Value
Total
5
Of which domestic
transactionTotal
Of which domestic
transactions
Other debit transfers
Total
9 10
TotalOf which domestic
transactionsTotal
Of which domestic
transactions
Value until 31.12.2006 in milliards SIT from 01.01.2007 in millions EUR
11 12
Of which domestic
transactionsTotal
Volume (in thousands)
3
Value Of which domestic
transactions
Direct debit
41 2 6 7 8

BANKA SLOVENIJE
45-II.Monthly Bulletin, July - August 2009
FINANCIAL MARKETS AND PAYMENT SYSTEMSBANK OF SLOVENIA
EUROSYSTEM
2.16. Network of Commercial Banks
2004 2005 2006 2007 2008
1 Pomurska 0 0 0 0 0 0 13 27 402 Podravska 4 4 4 4 4 4 22 67 933 Koroška 1 1 1 1 0 0 5 21 264 Savinjska 1 1 1 1 1 1 38 63 1025 Zasavska 1 1 1 1 0 0 1 11 126 Spodnjeposavska 0 0 0 0 0 0 5 15 207 Jugovzhodna Slovenija 0 0 0 0 0 0 13 43 568 Osrednjeslovenska 11 13 13 15 14 14 33 100 1479 Gorenjska 1 1 1 1 1 1 21 49 71
10 Notranjsko-kraška 0 0 0 0 0 0 4 16 2011 Goriška 0 0 0 0 0 0 19 38 5712 Obalno-kraška 1 1 1 1 1 1 19 22 42
TOTAL 20 22 22 24 21 21 193 472 686
AgencyTotalNo. Region
1Commercial banks (Head offices)
H.officeNetwork
2 (31.12.2008)Branch
2002 2004 2007
Number of employees in commercial banks
10,929 11,258 11,54310,386 10,445
2008
12,09611,87811,714
1998 1999 2000 2001 2003 2005 2006
11,534 11,63211,397
Density of the banking network by local comunities
BANKA SLOVENIJE
II.-46 Monthly Bulletin, July - August 2009
FINANCIAL MARKETS AND PAYMENT SYSTEMSBANK OF SLOVENIA
EUROSYSTEM
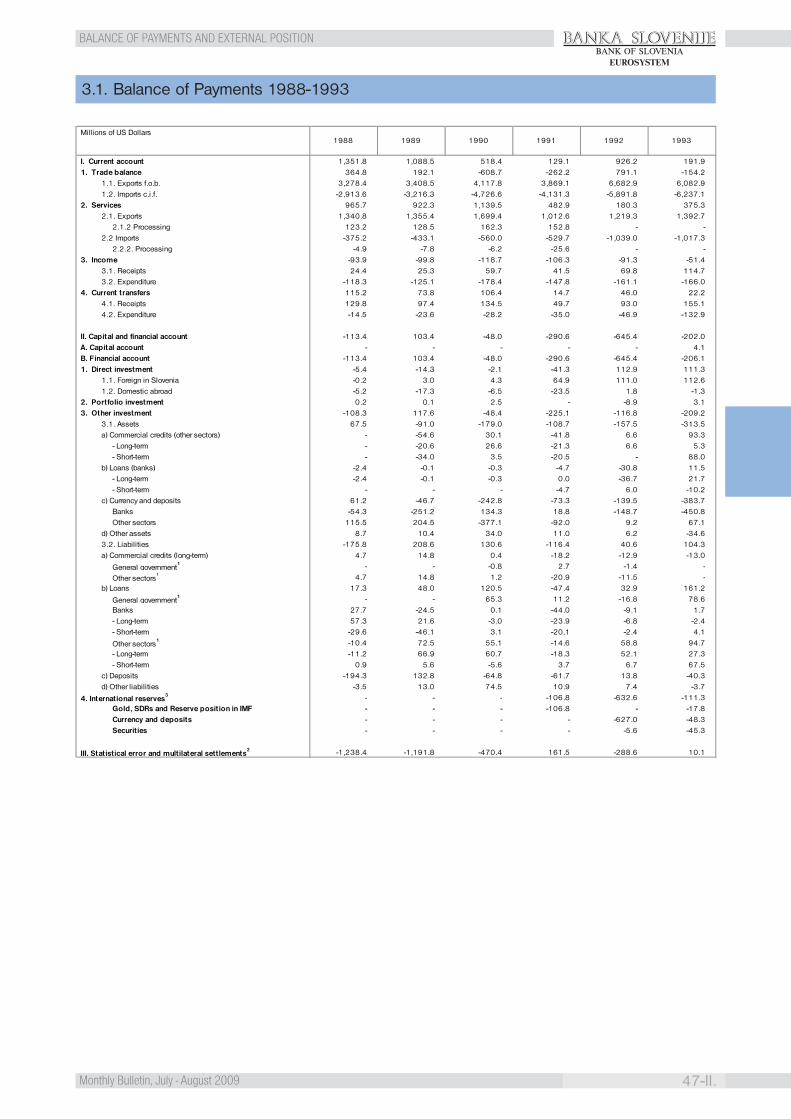
BANKA SLOVENIJE
47-II.Monthly Bulletin, July - August 2009
BALANCE OF PAYMENTS AND EXTERNAL POSITIONBANK OF SLOVENIA
EUROSYSTEM
3.1. Balance of Payments 1988-1993
I. Current account 1,351.8 1,088.5 518.4 129.1 926.2 191.9 1. Trade balance 364.8 192.1 -608.7 -262.2 791.1 -154.2
1.1. Exports f.o.b. 3,278.4 3,408.5 4,117.8 3,869.1 6,682.9 6,082.91.2. Imports c.i.f. -2,913.6 -3,216.3 -4,726.6 -4,131.3 -5,891.8 -6,237.1
2. Services 965.7 922.3 1,139.5 482.9 180.3 375.32.1. Exports 1,340.8 1,355.4 1,699.4 1,012.6 1,219.3 1,392.7
2.1.2 Processing 123.2 128.5 162.3 152.8 - -2.2 Imports -375.2 -433.1 -560.0 -529.7 -1,039.0 -1,017.3
2.2.2. Processing -4.9 -7.8 -6.2 -25.6 - - 3. Income -93.9 -99.8 -118.7 -106.3 -91.3 -51.4
3.1. Receipts 24.4 25.3 59.7 41.5 69.8 114.73.2. Expenditure -118.3 -125.1 -178.4 -147.8 -161.1 -166.0
4. Current transfers 115.2 73.8 106.4 14.7 46.0 22.24.1. Receipts 129.8 97.4 134.5 49.7 93.0 155.14.2. Expenditure -14.5 -23.6 -28.2 -35.0 -46.9 -132.9
II. Capital and financial account -113.4 103.4 -48.0 -290.6 -645.4 -202.0 A. Capital account - - - - - 4.1 B. Financial account -113.4 103.4 -48.0 -290.6 -645.4 -206.1 1. Direct investment -5.4 -14.3 -2.1 -41.3 112.9 111.3
1.1. Foreign in Slovenia -0.2 3.0 4.3 64.9 111.0 112.61.2. Domestic abroad -5.2 -17.3 -6.5 -23.5 1.8 -1.3
2. Portfolio investment 0.2 0.1 2.5 - -8.9 3.1 3. Other investment -108.3 117.6 -48.4 -225.1 -116.8 -209.2
3.1. Assets 67.5 -91.0 -179.0 -108.7 -157.5 -313.5a) Commercial credits (other sectors) - -54.6 30.1 -41.8 6.6 93.3
- Long-term - -20.6 26.6 -21.3 6.6 5.3- Short-term - -34.0 3.5 -20.5 - 88.0
b) Loans (banks) -2.4 -0.1 -0.3 -4.7 -30.8 11.5- Long-term -2.4 -0.1 -0.3 0.0 -36.7 21.7- Short-term - - - -4.7 6.0 -10.2
c) Currency and deposits 61.2 -46.7 -242.8 -73.3 -139.5 -383.7Banks -54.3 -251.2 134.3 18.8 -148.7 -450.8Other sectors 115.5 204.5 -377.1 -92.0 9.2 67.1
d) Other assets 8.7 10.4 34.0 11.0 6.2 -34.63.2. Liabilities -175.8 208.6 130.6 -116.4 40.6 104.3a) Commercial credits (long-term) 4.7 14.8 0.4 -18.2 -12.9 -13.0
General government1 - - -0.8 2.7 -1.4 -
Other sectors1 4.7 14.8 1.2 -20.9 -11.5 -
b) Loans 17.3 48.0 120.5 -47.4 32.9 161.2
General government1 - - 65.3 11.2 -16.8 78.6
Banks 27.7 -24.5 0.1 -44.0 -9.1 1.7- Long-term 57.3 21.6 -3.0 -23.9 -6.8 -2.4- Short-term -29.6 -46.1 3.1 -20.1 -2.4 4.1
Other sectors1 -10.4 72.5 55.1 -14.6 58.8 94.7
- Long-term -11.2 66.9 60.7 -18.3 52.1 27.3- Short-term 0.9 5.6 -5.6 3.7 6.7 67.5
c) Deposits -194.3 132.8 -64.8 -61.7 13.8 -40.3d) Other liabilities -3.5 13.0 74.5 10.9 7.4 -3.7
4. International reserves3 - - - -106.8 -632.6 -111.3
Gold, SDRs and Reserve position in IMF - - - -106.8 - -17.8Currency and deposits - - - - -627.0 -48.3Securities - - - - -5.6 -45.3
III. Statistical error and multilateral settlements2 -1,238.4 -1,191.8 -470.4 161.5 -288.6 10.1
1991 1993 Millions of US Dollars
1988 1989 1990 1992
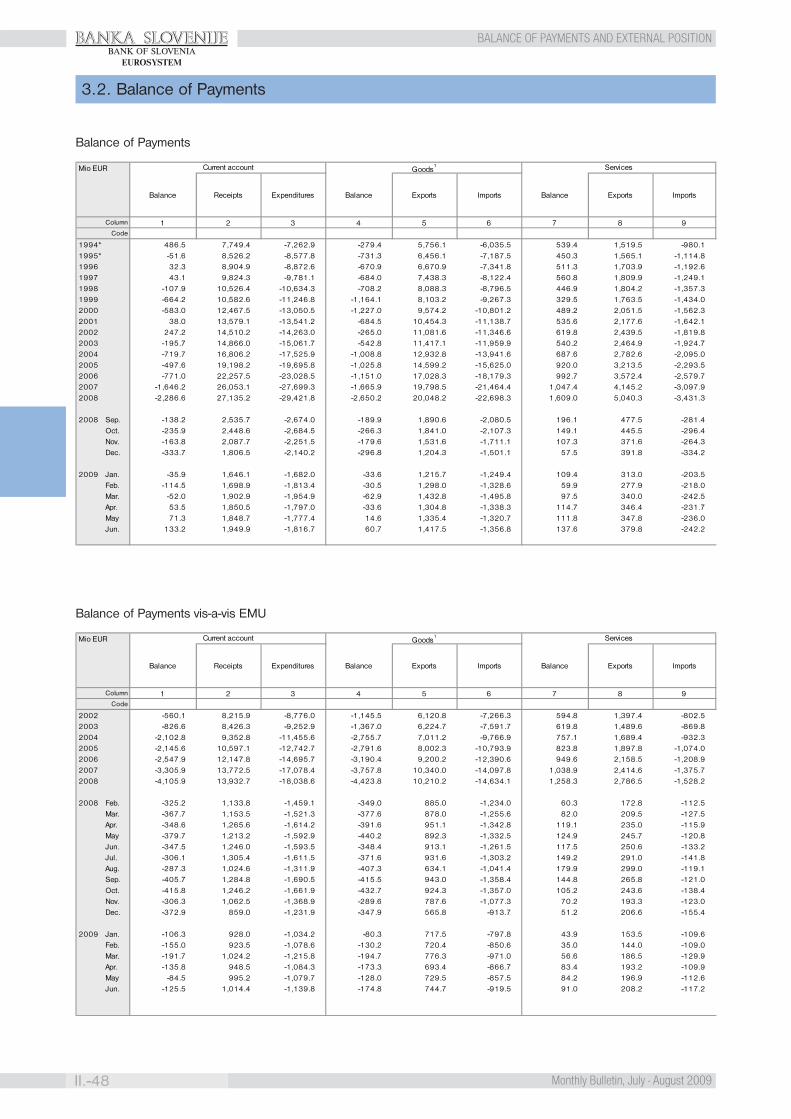
BANKA SLOVENIJE
II.-48 Monthly Bulletin, July - August 2009
BALANCE OF PAYMENTS AND EXTERNAL POSITIONBANK OF SLOVENIA
EUROSYSTEM
3.2. Balance of Payments
Balance of Payments
Balance of Payments vis-a-vis EMU
Column
Code
1994* 486.5 7,749.4 -7,262.9 -279.4 5,756.1 -6,035.5 539.4 1,519.5 -980.11995* -51.6 8,526.2 -8,577.8 -731.3 6,456.1 -7,187.5 450.3 1,565.1 -1,114.81996 32.3 8,904.9 -8,872.6 -670.9 6,670.9 -7,341.8 511.3 1,703.9 -1,192.61997 43.1 9,824.3 -9,781.1 -684.0 7,438.3 -8,122.4 560.8 1,809.9 -1,249.11998 -107.9 10,526.4 -10,634.3 -708.2 8,088.3 -8,796.5 446.9 1,804.2 -1,357.31999 -664.2 10,582.6 -11,246.8 -1,164.1 8,103.2 -9,267.3 329.5 1,763.5 -1,434.02000 -583.0 12,467.5 -13,050.5 -1,227.0 9,574.2 -10,801.2 489.2 2,051.5 -1,562.32001 38.0 13,579.1 -13,541.2 -684.5 10,454.3 -11,138.7 535.6 2,177.6 -1,642.12002 247.2 14,510.2 -14,263.0 -265.0 11,081.6 -11,346.6 619.8 2,439.5 -1,819.82003 -195.7 14,866.0 -15,061.7 -542.8 11,417.1 -11,959.9 540.2 2,464.9 -1,924.72004 -719.7 16,806.2 -17,525.9 -1,008.8 12,932.8 -13,941.6 687.6 2,782.6 -2,095.02005 -497.6 19,198.2 -19,695.8 -1,025.8 14,599.2 -15,625.0 920.0 3,213.5 -2,293.52006 -771.0 22,257.5 -23,028.5 -1,151.0 17,028.3 -18,179.3 992.7 3,572.4 -2,579.72007 -1,646.2 26,053.1 -27,699.3 -1,665.9 19,798.5 -21,464.4 1,047.4 4,145.2 -3,097.92008 -2,286.6 27,135.2 -29,421.8 -2,650.2 20,048.2 -22,698.3 1,609.0 5,040.3 -3,431.3
2008 Sep. -138.2 2,535.7 -2,674.0 -189.9 1,890.6 -2,080.5 196.1 477.5 -281.4Oct. -235.9 2,448.6 -2,684.5 -266.3 1,841.0 -2,107.3 149.1 445.5 -296.4Nov. -163.8 2,087.7 -2,251.5 -179.6 1,531.6 -1,711.1 107.3 371.6 -264.3Dec. -333.7 1,806.5 -2,140.2 -296.8 1,204.3 -1,501.1 57.5 391.8 -334.2
2009 Jan. -35.9 1,646.1 -1,682.0 -33.6 1,215.7 -1,249.4 109.4 313.0 -203.5Feb. -114.5 1,698.9 -1,813.4 -30.5 1,298.0 -1,328.6 59.9 277.9 -218.0Mar. -52.0 1,902.9 -1,954.9 -62.9 1,432.8 -1,495.8 97.5 340.0 -242.5Apr. 53.5 1,850.5 -1,797.0 -33.6 1,304.8 -1,338.3 114.7 346.4 -231.7May 71.3 1,848.7 -1,777.4 14.6 1,335.4 -1,320.7 111.8 347.8 -236.0Jun. 133.2 1,949.9 -1,816.7 60.7 1,417.5 -1,356.8 137.6 379.8 -242.2
8 91 2 765
Services
ExpendituresBalance Receipts Imports ImportsBalance Balance ExportsExports
3 4
Mio EUR Current account Goods1
Column
Code
2002 -560.1 8,215.9 -8,776.0 -1,145.5 6,120.8 -7,266.3 594.8 1,397.4 -802.52003 -826.6 8,426.3 -9,252.9 -1,367.0 6,224.7 -7,591.7 619.8 1,489.6 -869.82004 -2,102.8 9,352.8 -11,455.6 -2,755.7 7,011.2 -9,766.9 757.1 1,689.4 -932.32005 -2,145.6 10,597.1 -12,742.7 -2,791.6 8,002.3 -10,793.9 823.8 1,897.8 -1,074.02006 -2,547.9 12,147.8 -14,695.7 -3,190.4 9,200.2 -12,390.6 949.6 2,158.5 -1,208.92007 -3,305.9 13,772.5 -17,078.4 -3,757.8 10,340.0 -14,097.8 1,038.9 2,414.6 -1,375.72008 -4,105.9 13,932.7 -18,038.6 -4,423.8 10,210.2 -14,634.1 1,258.3 2,786.5 -1,528.2
2008 Feb. -325.2 1,133.8 -1,459.1 -349.0 885.0 -1,234.0 60.3 172.8 -112.5Mar. -367.7 1,153.5 -1,521.3 -377.6 878.0 -1,255.6 82.0 209.5 -127.5Apr. -348.6 1,265.6 -1,614.2 -391.6 951.1 -1,342.8 119.1 235.0 -115.9May -379.7 1,213.2 -1,592.9 -440.2 892.3 -1,332.5 124.9 245.7 -120.8Jun. -347.5 1,246.0 -1,593.5 -348.4 913.1 -1,261.5 117.5 250.6 -133.2Jul. -306.1 1,305.4 -1,611.5 -371.6 931.6 -1,303.2 149.2 291.0 -141.8Aug. -287.3 1,024.6 -1,311.9 -407.3 634.1 -1,041.4 179.9 299.0 -119.1Sep. -405.7 1,284.8 -1,690.5 -415.5 943.0 -1,358.4 144.8 265.8 -121.0Oct. -415.8 1,246.2 -1,661.9 -432.7 924.3 -1,357.0 105.2 243.6 -138.4Nov. -306.3 1,062.5 -1,368.9 -289.6 787.6 -1,077.3 70.2 193.3 -123.0Dec. -372.9 859.0 -1,231.9 -347.9 565.8 -913.7 51.2 206.6 -155.4
2009 Jan. -106.3 928.0 -1,034.2 -80.3 717.5 -797.8 43.9 153.5 -109.6Feb. -155.0 923.5 -1,078.6 -130.2 720.4 -850.6 35.0 144.0 -109.0Mar. -191.7 1,024.2 -1,215.8 -194.7 776.3 -971.0 56.6 186.5 -129.9Apr. -135.8 948.5 -1,084.3 -173.3 693.4 -866.7 83.4 193.2 -109.9May -84.5 995.2 -1,079.7 -128.0 729.5 -857.5 84.2 196.9 -112.6Jun. -125.5 1,014.4 -1,139.8 -174.8 744.7 -919.5 91.0 208.2 -117.2
8 91 2 765
Services
ExpendituresBalance Receipts Imports ImportsBalance Balance ExportsExports
3 4
Mio EUR Current account Goods1

BANKA SLOVENIJE
49-II.Monthly Bulletin, July - August 2009
BALANCE OF PAYMENTS AND EXTERNAL POSITIONBANK OF SLOVENIA
EUROSYSTEM
Balance of Payments
Balance of Payments vis-a-vis EMU
410.6 -354.8 766.8 -326.3 10.6 -4.6 103.6 -2.7 205.1 -220.3390.2 -338.1 836.8 -443.0 9.2 -8.9 104.1 -18.4 191.0 -221.2383.9 -326.6 989.1 -481.5 11.1 -13.1 73.8 -35.0 193.5 -236.1411.9 -327.2 1,047.9 -462.8 19.1 -24.0 70.3 -46.8 199.6 -247.6480.9 -365.9 970.8 -501.1 22.1 -27.6 65.2 -31.1 189.8 -272.7489.8 -357.5 900.1 -511.5 22.7 -35.0 54.0 -59.2 207.5 -296.2534.4 -385.0 1,044.8 -556.2 27.0 -55.3 71.8 -55.6 265.0 -301.5559.2 -356.3 1,104.8 -600.8 37.8 -67.1 78.8 -52.1 266.8 -335.4634.6 -385.2 1,142.6 -634.8 60.5 -89.0 94.9 -60.4 337.4 -380.7680.0 -419.5 1,186.3 -664.1 61.7 -94.9 71.0 -72.1 331.4 -399.1809.3 -485.4 1,311.7 -703.3 71.9 -95.9 72.2 -49.4 378.4 -455.1923.0 -524.9 1,450.5 -707.5 90.8 -109.4 107.9 -64.4 479.5 -572.3
1,057.7 -601.4 1,555.5 -772.3 89.9 -107.9 103.8 -67.5 577.1 -648.51,258.7 -733.6 1,665.4 -831.5 105.4 -129.8 151.4 -160.5 751.5 -801.71,437.3 -846.1 1,931.5 -894.2 206.3 -215.6 299.5 -154.9 876.0 -830.6
127.5 -69.3 180.4 -71.2 27.3 -21.4 29.2 -11.3 88.5 -67.9129.7 -74.1 155.5 -81.9 15.7 -19.8 32.4 -16.6 90.4 -69.8117.4 -59.9 113.2 -62.5 17.0 -13.7 26.6 -8.4 74.7 -72.4103.7 -63.8 125.6 -71.6 17.5 -18.3 24.5 -16.9 93.5 -112.2
82.9 -52.7 125.7 -57.2 16.3 -11.9 13.3 -3.0 60.8 -43.681.6 -51.8 96.0 -54.8 14.8 -16.8 13.4 -5.7 50.9 -54.489.6 -56.5 119.5 -56.7 17.6 -14.6 13.9 -4.9 77.9 -60.487.3 -60.1 141.9 -54.8 14.2 -16.8 16.0 -5.6 65.8 -60.980.0 -47.8 146.7 -60.6 18.4 -17.3 18.4 -5.8 67.4 -62.182.8 -48.5 186.0 -68.9 15.5 -15.3 15.1 -6.4 59.0 -63.8
18 19
Exports Imports
10 11 12 13 14 15 16 17
Exports Imports Exports ImportsExports Imports Exports Imports
Services - of which:Transportations Travel Communications services Construction services Other business services
386.3 -234.0 722.7 -242.8 30.8 -30.0 34.1 -14.6 162.0 -170.7420.7 -254.0 778.5 -246.4 36.2 -38.6 26.8 -30.1 171.4 -179.1488.4 -287.8 872.7 -247.8 41.8 -32.2 31.8 -24.7 194.3 -195.4563.9 -277.7 930.7 -326.9 54.2 -44.0 46.2 -31.7 232.1 -243.4695.7 -320.1 995.6 -347.6 57.9 -44.7 59.5 -29.9 265.0 -282.0801.9 -388.6 1033.8 -344.4 66.4 -42.0 82.0 -97.9 340.0 -285.7869.3 -455.3 1208.6 -402.6 104.9 -69.5 107.7 -33.5 357.7 -297.3
65.7 -33.4 62.4 -32.8 8.4 -4.8 6.4 -1.2 20.1 -18.574.0 -44.8 85.1 -29.5 7.7 -5.3 8.3 -2.6 24.0 -23.978.8 -42.9 104.0 -26.7 7.7 -5.3 8.9 -3.2 26.5 -20.478.9 -42.6 104.8 -27.0 10.5 -5.8 9.1 -5.7 33.7 -20.178.8 -42.9 100.6 -28.1 8.2 -5.3 9.0 -2.8 31.3 -23.483.0 -41.9 150.7 -41.1 8.0 -6.6 9.6 -3.1 27.2 -26.161.7 -31.5 184.2 -33.5 8.7 -7.0 11.7 -2.8 18.5 -19.376.1 -36.7 110.7 -32.6 14.6 -6.1 11.0 -1.7 42.4 -24.577.0 -38.2 94.9 -44.4 8.1 -6.1 9.9 -4.4 43.5 -27.570.4 -30.7 69.5 -35.4 8.0 -5.0 9.0 -2.2 26.8 -24.363.4 -33.0 78.8 -40.4 8.0 -6.5 7.3 -2.1 39.8 -49.4
48.9 -28.5 63.6 -36.6 8.0 -3.6 7.9 -1.7 19.3 -16.551.3 -32.0 53.4 -35.4 4.8 -4.1 7.1 -1.5 18.8 -20.657.0 -30.9 71.2 -35.0 6.8 -4.4 7.4 -2.1 34.2 -27.354.1 -37.1 93.9 -25.4 6.1 -5.0 6.9 -2.4 24.6 -22.350.8 -26.4 95.6 -27.4 7.6 -4.5 8.1 -2.5 25.9 -24.351.4 -28.2 109.2 -28.7 6.6 -3.9 9.0 -2.8 21.3 -31.0
Services - of which:Transportations Travel Communications services Construction services Other business services
Exports Imports Exports Imports Exports Imports Exports Imports Exports Imports
10 11 12 13 14 15 16 17 18 19
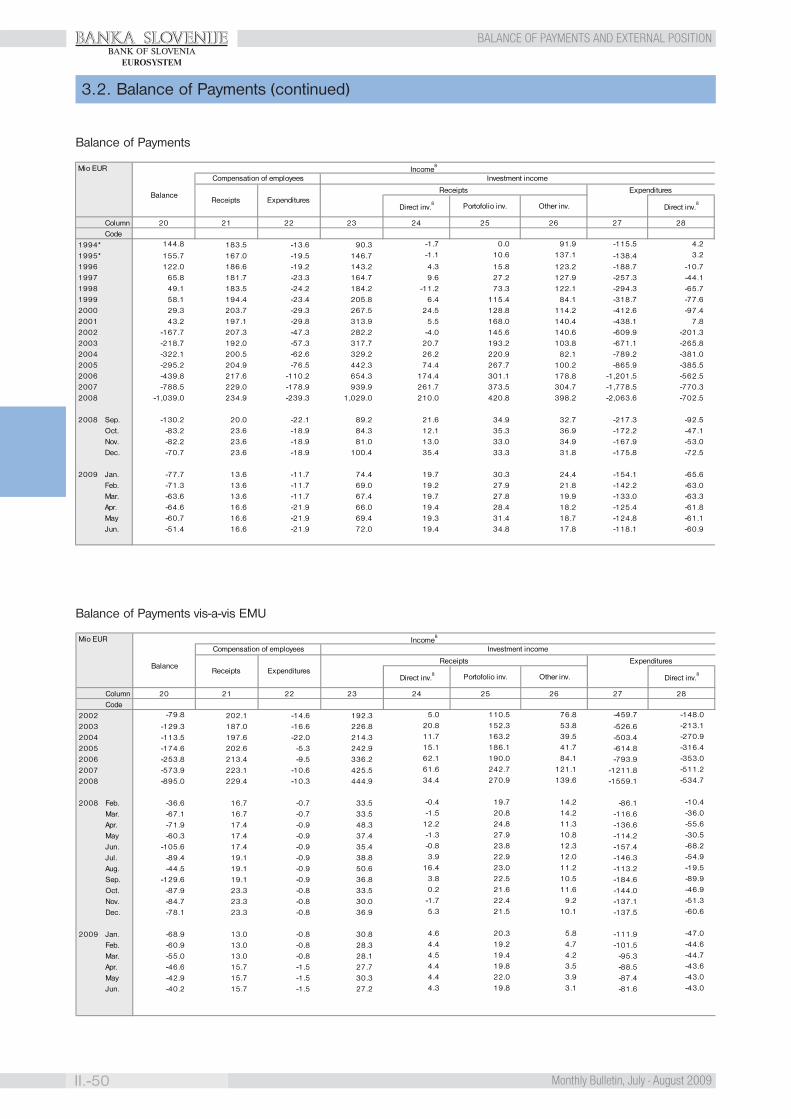
BANKA SLOVENIJE
II.-50 Monthly Bulletin, July - August 2009
BALANCE OF PAYMENTS AND EXTERNAL POSITIONBANK OF SLOVENIA
EUROSYSTEM
3.2. Balance of Payments (continued)
Balance of Payments
Balance of Payments vis-a-vis EMU
ColumnCode
1994* 144.8 183.5 -13.6 90.3 -1.7 0.0 91.9 -115.5 4.2
1995* 155.7 167.0 -19.5 146.7 -1.1 10.6 137.1 -138.4 3.2
1996 122.0 186.6 -19.2 143.2 4.3 15.8 123.2 -188.7 -10.71997 65.8 181.7 -23.3 164.7 9.6 27.2 127.9 -257.3 -44.11998 49.1 183.5 -24.2 184.2 -11.2 73.3 122.1 -294.3 -65.71999 58.1 194.4 -23.4 205.8 6.4 115.4 84.1 -318.7 -77.62000 29.3 203.7 -29.3 267.5 24.5 128.8 114.2 -412.6 -97.42001 43.2 197.1 -29.8 313.9 5.5 168.0 140.4 -438.1 7.82002 -167.7 207.3 -47.3 282.2 -4.0 145.6 140.6 -609.9 -201.32003 -218.7 192.0 -57.3 317.7 20.7 193.2 103.8 -671.1 -265.82004 -322.1 200.5 -62.6 329.2 26.2 220.9 82.1 -789.2 -381.02005 -295.2 204.9 -76.5 442.3 74.4 267.7 100.2 -865.9 -385.52006 -439.8 217.6 -110.2 654.3 174.4 301.1 178.8 -1,201.5 -562.52007 -788.5 229.0 -178.9 939.9 261.7 373.5 304.7 -1,778.5 -770.32008 -1,039.0 234.9 -239.3 1,029.0 210.0 420.8 398.2 -2,063.6 -702.5
2008 Sep. -130.2 20.0 -22.1 89.2 21.6 34.9 32.7 -217.3 -92.5Oct. -83.2 23.6 -18.9 84.3 12.1 35.3 36.9 -172.2 -47.1Nov. -82.2 23.6 -18.9 81.0 13.0 33.0 34.9 -167.9 -53.0Dec. -70.7 23.6 -18.9 100.4 35.4 33.3 31.8 -175.8 -72.5
2009 Jan. -77.7 13.6 -11.7 74.4 19.7 30.3 24.4 -154.1 -65.6Feb. -71.3 13.6 -11.7 69.0 19.2 27.9 21.8 -142.2 -63.0Mar. -63.6 13.6 -11.7 67.4 19.7 27.8 19.9 -133.0 -63.3Apr. -64.6 16.6 -21.9 66.0 19.4 28.4 18.2 -125.4 -61.8May -60.7 16.6 -21.9 69.4 19.3 31.4 18.7 -124.8 -61.1Jun. -51.4 16.6 -21.9 72.0 19.4 34.8 17.8 -118.1 -60.9
Expenditures
Mio EUR Income8
Balance
Compensation of employees Investment income
Receipts ExpendituresReceipts
Direct inv.8
Direct inv.8Portofolio inv. Other inv.
20 21 22 23 24 25 26 27 28
ColumnCode
2002 -79.8 202.1 -14.6 192.3 5.0 110.5 76.8 -459.7 -148.0
2003 -129.3 187.0 -16.6 226.8 20.8 152.3 53.8 -526.6 -213.1
2004 -113.5 197.6 -22.0 214.3 11.7 163.2 39.5 -503.4 -270.9
2005 -174.6 202.6 -5.3 242.9 15.1 186.1 41.7 -614.8 -316.4
2006 -253.8 213.4 -9.5 336.2 62.1 190.0 84.1 -793.9 -353.0
2007 -573.9 223.1 -10.6 425.5 61.6 242.7 121.1 -1211.8 -511.2
2008 -895.0 229.4 -10.3 444.9 34.4 270.9 139.6 -1559.1 -534.7
2008 Feb. -36.6 16.7 -0.7 33.5 -0.4 19.7 14.2 -86.1 -10.4
Mar. -67.1 16.7 -0.7 33.5 -1.5 20.8 14.2 -116.6 -36.0
Apr. -71.9 17.4 -0.9 48.3 12.2 24.8 11.3 -136.6 -55.6
May -60.3 17.4 -0.9 37.4 -1.3 27.9 10.8 -114.2 -30.5
Jun. -105.6 17.4 -0.9 35.4 -0.8 23.8 12.3 -157.4 -68.2
Jul. -89.4 19.1 -0.9 38.8 3.9 22.9 12.0 -146.3 -54.9
Aug. -44.5 19.1 -0.9 50.6 16.4 23.0 11.2 -113.2 -19.5
Sep. -129.6 19.1 -0.9 36.8 3.8 22.5 10.5 -184.6 -89.9
Oct. -87.9 23.3 -0.8 33.5 0.2 21.6 11.6 -144.0 -46.9
Nov. -84.7 23.3 -0.8 30.0 -1.7 22.4 9.2 -137.1 -51.3
Dec. -78.1 23.3 -0.8 36.9 5.3 21.5 10.1 -137.5 -60.6
2009 Jan. -68.9 13.0 -0.8 30.8 4.6 20.3 5.8 -111.9 -47.0
Feb. -60.9 13.0 -0.8 28.3 4.4 19.2 4.7 -101.5 -44.6
Mar. -55.0 13.0 -0.8 28.1 4.5 19.4 4.2 -95.3 -44.7
Apr. -46.6 15.7 -1.5 27.7 4.4 19.8 3.5 -88.5 -43.6
May -42.9 15.7 -1.5 30.3 4.4 22.0 3.9 -87.4 -43.0
Jun. -40.2 15.7 -1.5 27.2 4.3 19.8 3.1 -81.6 -43.0
Expenditures
Mio EUR Income8
Balance
Compensation of employees Investment income
Receipts ExpendituresReceipts
Direct inv.8
Direct inv.8Portofolio inv. Other inv.
20 21 22 23 24 25 26 27 28
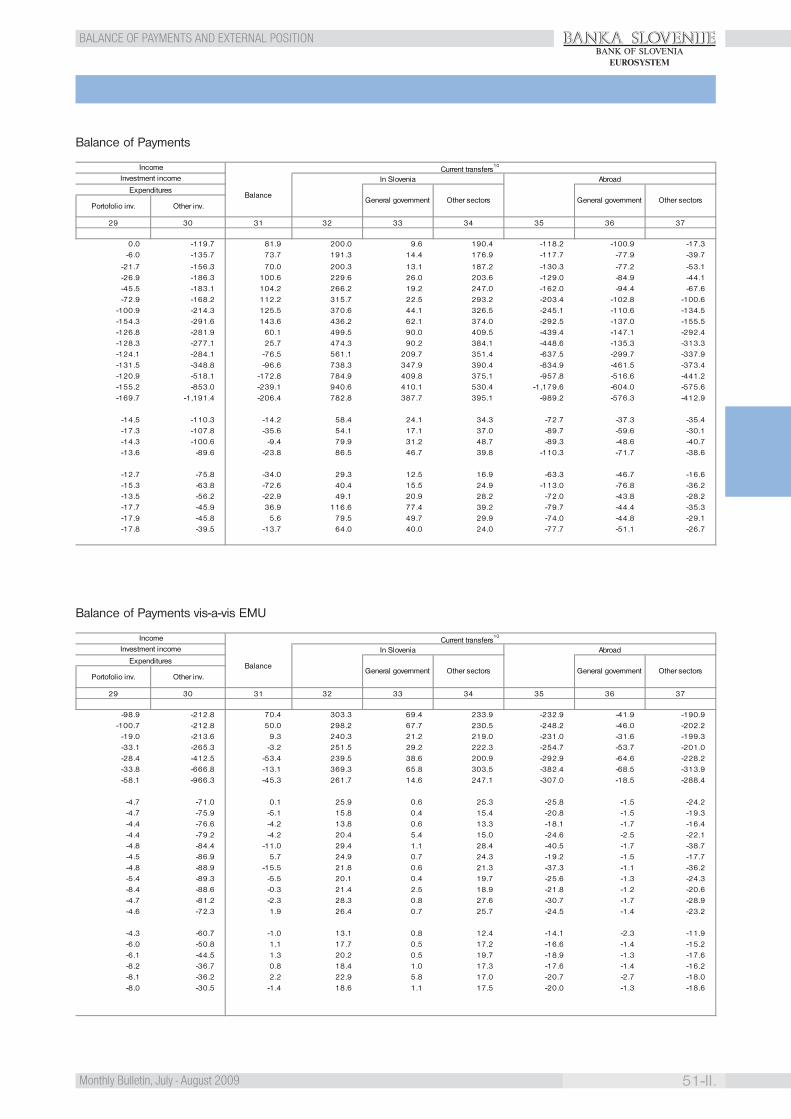
BANKA SLOVENIJE
51-II.Monthly Bulletin, July - August 2009
BALANCE OF PAYMENTS AND EXTERNAL POSITIONBANK OF SLOVENIA
EUROSYSTEM
Balance of Payments
Balance of Payments vis-a-vis EMU
0.0 -119.7 81.9 200.0 9.6 190.4 -118.2 -100.9 -17.3-6.0 -135.7 73.7 191.3 14.4 176.9 -117.7 -77.9 -39.7
-21.7 -156.3 70.0 200.3 13.1 187.2 -130.3 -77.2 -53.1-26.9 -186.3 100.6 229.6 26.0 203.6 -129.0 -84.9 -44.1-45.5 -183.1 104.2 266.2 19.2 247.0 -162.0 -94.4 -67.6-72.9 -168.2 112.2 315.7 22.5 293.2 -203.4 -102.8 -100.6
-100.9 -214.3 125.5 370.6 44.1 326.5 -245.1 -110.6 -134.5-154.3 -291.6 143.6 436.2 62.1 374.0 -292.5 -137.0 -155.5-126.8 -281.9 60.1 499.5 90.0 409.5 -439.4 -147.1 -292.4-128.3 -277.1 25.7 474.3 90.2 384.1 -448.6 -135.3 -313.3-124.1 -284.1 -76.5 561.1 209.7 351.4 -637.5 -299.7 -337.9-131.5 -348.8 -96.6 738.3 347.9 390.4 -834.9 -461.5 -373.4-120.9 -518.1 -172.8 784.9 409.8 375.1 -957.8 -516.6 -441.2-155.2 -853.0 -239.1 940.6 410.1 530.4 -1,179.6 -604.0 -575.6-169.7 -1,191.4 -206.4 782.8 387.7 395.1 -989.2 -576.3 -412.9
-14.5 -110.3 -14.2 58.4 24.1 34.3 -72.7 -37.3 -35.4-17.3 -107.8 -35.6 54.1 17.1 37.0 -89.7 -59.6 -30.1-14.3 -100.6 -9.4 79.9 31.2 48.7 -89.3 -48.6 -40.7-13.6 -89.6 -23.8 86.5 46.7 39.8 -110.3 -71.7 -38.6
-12.7 -75.8 -34.0 29.3 12.5 16.9 -63.3 -46.7 -16.6-15.3 -63.8 -72.6 40.4 15.5 24.9 -113.0 -76.8 -36.2-13.5 -56.2 -22.9 49.1 20.9 28.2 -72.0 -43.8 -28.2-17.7 -45.9 36.9 116.6 77.4 39.2 -79.7 -44.4 -35.3-17.9 -45.8 5.6 79.5 49.7 29.9 -74.0 -44.8 -29.1-17.8 -39.5 -13.7 64.0 40.0 24.0 -77.7 -51.1 -26.7
3733 34 35 3629 30 31 32
General government Other sectorsPortofolio inv. Other inv.
Income Current transfers10
Investment income
Balance
In Slovenia AbroadExpenditures
General government Other sectors
-98.9 -212.8 70.4 303.3 69.4 233.9 -232.9 -41.9 -190.9-100.7 -212.8 50.0 298.2 67.7 230.5 -248.2 -46.0 -202.2
-19.0 -213.6 9.3 240.3 21.2 219.0 -231.0 -31.6 -199.3-33.1 -265.3 -3.2 251.5 29.2 222.3 -254.7 -53.7 -201.0-28.4 -412.5 -53.4 239.5 38.6 200.9 -292.9 -64.6 -228.2-33.8 -666.8 -13.1 369.3 65.8 303.5 -382.4 -68.5 -313.9-58.1 -966.3 -45.3 261.7 14.6 247.1 -307.0 -18.5 -288.4
-4.7 -71.0 0.1 25.9 0.6 25.3 -25.8 -1.5 -24.2-4.7 -75.9 -5.1 15.8 0.4 15.4 -20.8 -1.5 -19.3-4.4 -76.6 -4.2 13.8 0.6 13.3 -18.1 -1.7 -16.4-4.4 -79.2 -4.2 20.4 5.4 15.0 -24.6 -2.5 -22.1-4.8 -84.4 -11.0 29.4 1.1 28.4 -40.5 -1.7 -38.7-4.5 -86.9 5.7 24.9 0.7 24.3 -19.2 -1.5 -17.7-4.8 -88.9 -15.5 21.8 0.6 21.3 -37.3 -1.1 -36.2-5.4 -89.3 -5.5 20.1 0.4 19.7 -25.6 -1.3 -24.3-8.4 -88.6 -0.3 21.4 2.5 18.9 -21.8 -1.2 -20.6-4.7 -81.2 -2.3 28.3 0.8 27.6 -30.7 -1.7 -28.9-4.6 -72.3 1.9 26.4 0.7 25.7 -24.5 -1.4 -23.2
-4.3 -60.7 -1.0 13.1 0.8 12.4 -14.1 -2.3 -11.9-6.0 -50.8 1.1 17.7 0.5 17.2 -16.6 -1.4 -15.2-6.1 -44.5 1.3 20.2 0.5 19.7 -18.9 -1.3 -17.6-8.2 -36.7 0.8 18.4 1.0 17.3 -17.6 -1.4 -16.2-8.1 -36.2 2.2 22.9 5.8 17.0 -20.7 -2.7 -18.0-8.0 -30.5 -1.4 18.6 1.1 17.5 -20.0 -1.3 -18.6
Income Current transfers10
Investment income
Balance
In Slovenia AbroadExpenditures
General government Other sectors General government Other sectorsPortofolio inv. Other inv.
29 30 31 32 33 34 35 36 37

BANKA SLOVENIJE
II.-52 Monthly Bulletin, July - August 2009
BALANCE OF PAYMENTS AND EXTERNAL POSITIONBANK OF SLOVENIA
EUROSYSTEM
Balance of Payments
Balance of Payments vis-a-vis EMU
3.2. Balance of Payments (continued)
ColumnCode
1994* -441.3 -2.8 -1.5 1.8 - 1.8 -3.2 - -3.2 -1.3
1995* 200.5 -5.3 -3.5 2.3 0.8 1.5 -5.8 -3.1 -2.8 -1.81996 -33.9 -1.5 0.6 4.1 0.9 3.2 -3.5 0.0 -3.4 -2.11997 -111.4 0.9 1.8 4.2 1.2 3.0 -2.4 -0.1 -2.3 -0.91998 53.0 -1.2 -0.2 3.0 0.1 2.8 -3.2 0.0 -3.2 -1.01999 624.6 -0.7 0.0 2.7 0.1 2.6 -2.8 - -2.8 -0.62000 541.6 4.0 0.8 3.4 0.0 3.4 -2.7 -0.2 -2.5 3.32001 -148.4 -4.0 0.7 2.4 - 2.4 -1.8 0.0 -1.7 -4.72002 3.1 -163.6 -162.7 74.1 0.0 74.1 -236.8 0.0 -236.8 -0.82003 45.7 -165.5 -163.7 81.1 0.1 81.0 -244.8 -0.1 -244.7 -1.82004 697.6 -96.1 -96.5 151.0 19.5 131.5 -247.5 0.0 -247.5 0.42005 970.4 -113.9 -109.2 169.8 28.6 141.2 -279.0 0.0 -279.0 -4.72006 1,091.5 -131.5 -126.4 205.2 46.7 158.5 -331.6 -0.1 -331.5 -5.12007 1,919.7 -51.9 -50.5 315.5 127.7 187.8 -366.0 -0.8 -365.3 -1.42008 2,394.9 -43.1 -44.0 263.1 78.0 185.1 -307.1 - -307.1 0.9
2008 Sep. 33.7 -0.9 -0.9 13.5 1.8 11.7 -14.4 - -14.4 0.1Oct. -129.9 3.9 0.3 16.2 1.1 15.0 -15.8 - -15.8 3.6Nov. 278.5 39.1 39.9 61.5 40.9 20.6 -21.6 - -21.6 -0.8Dec. 439.0 -73.1 -72.9 37.9 5.3 32.6 -110.8 - -110.8 -0.1
2009 Jan. 86.9 -7.6 -7.3 9.0 0.8 8.3 -16.3 0.0 -16.3 -0.3Feb. -115.0 -2.0 -1.1 12.5 2.1 10.4 -13.6 - -13.6 -0.8Mar. -80.3 4.8 5.2 21.4 6.3 15.1 -16.2 -0.1 -16.2 -0.4Apr. -26.8 -2.5 -2.2 12.3 2.8 9.4 -14.5 -0.1 -14.4 -0.3May 68.4 -1.6 -0.9 12.5 4.1 8.3 -13.4 0.0 -13.4 -0.7Jun. -104.6 42.0 42.1 57.0 46.8 10.2 -14.9 - -14.9 -0.2
46 4742 43 44 4538 39 40 41
Other sectorsGeneral
governmentOther sectors
CA, of which: Non-produced, nonfinancial
assets
Mio EURCapital and
financial account
Capital account (CA)
CA, of which: Capital
transfers10
Receipts Expenditures
General government
ColumnCode
2002 -314.7 -81.3 -82.4 45.3 0.0 45.3 -127.7 0.0 -127.7 1.1
2003 65.2 -83.9 -83.2 47.5 0.0 47.5 -130.7 0.0 -130.7 -0.7
2004 557.5 -42.8 -42.5 90.1 - 90.1 -132.6 0.0 -132.6 -0.3
2005 2,611.8 -57.0 -52.8 96.3 0.0 96.3 -149.1 0.0 -149.1 -4.2
2006 2,611.5 -68.9 -68.2 107.3 0.1 107.2 -175.5 0.0 -175.5 -0.6
2007 2,734.0 -65.3 -65.1 123.2 0.0 123.2 -188.3 -0.2 -188.1 -0.2
2008 3,142.9 -34.8 -34.0 118.7 0.0 118.7 -152.7 - -152.7 -0.8
2008 Feb. -619.2 0.9 0.9 9.6 - 9.6 -8.7 - -8.7 0.0
Mar. 665.7 3.3 3.5 13.4 - 13.4 -9.9 - -9.9 -0.2
Apr. 290.0 -1.7 -1.6 9.4 0.0 9.4 -11.0 - -11.0 0.0
May 440.1 -0.7 -0.6 8.3 - 8.3 -8.9 - -8.9 -0.1
Jun. 401.6 0.5 0.4 8.5 0.0 8.5 -8.1 - -8.1 0.1
Jul. 402.5 -3.5 -3.3 7.1 0.0 7.1 -10.4 - -10.4 -0.1
Aug. 395.7 -1.5 -1.4 4.7 - 4.7 -6.0 - -6.0 -0.1
Sep. -16.5 0.5 0.5 7.6 - 7.6 -7.1 - -7.1 0.0
Oct. 89.1 2.4 1.8 9.7 - 9.7 -7.9 - -7.9 0.6
Nov. 220.5 1.2 1.9 13.0 - 13.0 -11.1 - -11.1 -0.7
Dec. 542.8 -32.2 -32.1 19.8 - 19.8 -51.9 - -51.9 -0.1
2009 Jan. -65.7 -4.0 -3.6 5.3 0.1 5.3 -8.9 - -8.9 -0.5
Feb. -944.1 -0.8 -0.4 6.6 0.0 6.6 -7.1 - -7.1 -0.4
Mar. 449.4 0.6 1.0 9.8 0.0 9.8 -8.8 0.0 -8.8 -0.5
Apr. -957.0 -1.8 -1.4 6.2 0.0 6.1 -7.6 0.0 -7.6 -0.3
May 135.6 -2.1 -1.8 5.5 0.0 5.4 -7.3 - -7.3 -0.3
Jun. 197.0 -1.6 -1.4 7.4 0.1 7.2 -8.7 - -8.7 -0.2
CA, of which: Non-produced, nonfinancial
assets
Mio EURCapital and
financial account
Capital account (CA)
CA, of which: Capital
transfers10
Receipts Expenditures
General government
Other sectorsGeneral
governmentOther sectors
38 39 40 41 42 43 44 45 46 47
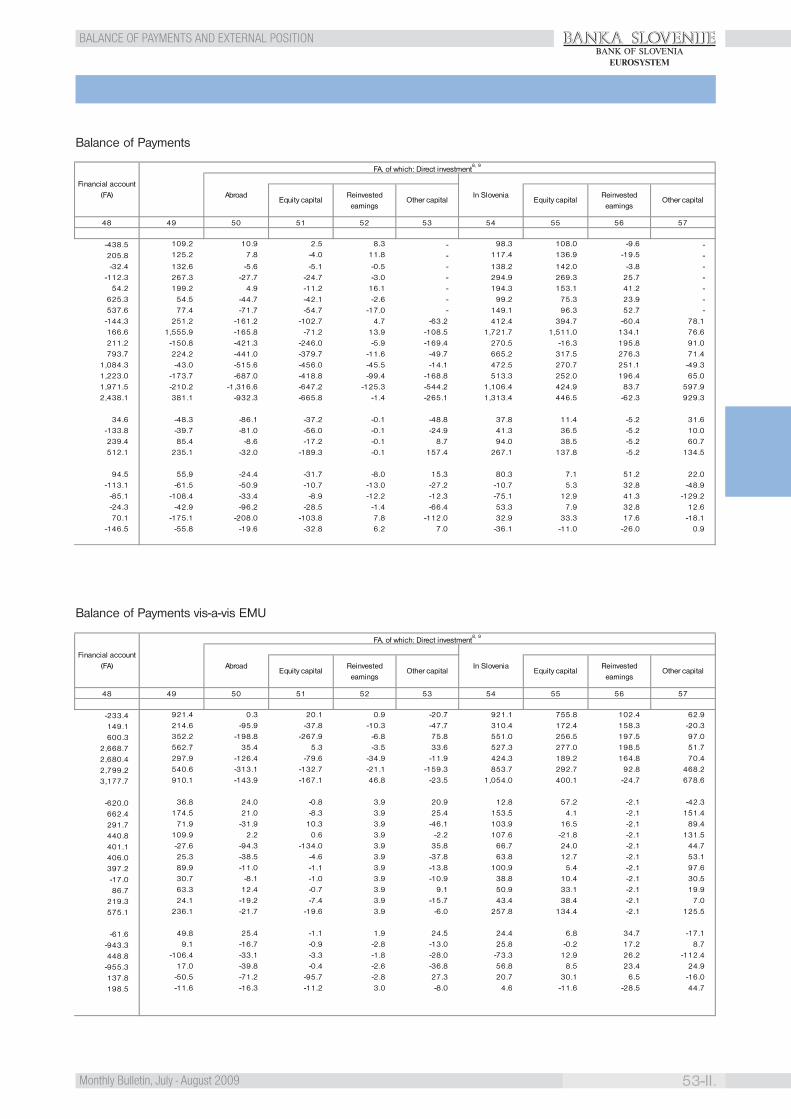
BANKA SLOVENIJE
53-II.Monthly Bulletin, July - August 2009
BALANCE OF PAYMENTS AND EXTERNAL POSITIONBANK OF SLOVENIA
EUROSYSTEM
Balance of Payments
Balance of Payments vis-a-vis EMU
-438.5 109.2 10.9 2.5 8.3 - 98.3 108.0 -9.6 -205.8 125.2 7.8 -4.0 11.8 - 117.4 136.9 -19.5 --32.4 132.6 -5.6 -5.1 -0.5 - 138.2 142.0 -3.8 -
-112.3 267.3 -27.7 -24.7 -3.0 - 294.9 269.3 25.7 -54.2 199.2 4.9 -11.2 16.1 - 194.3 153.1 41.2 -
625.3 54.5 -44.7 -42.1 -2.6 - 99.2 75.3 23.9 -537.6 77.4 -71.7 -54.7 -17.0 - 149.1 96.3 52.7 --144.3 251.2 -161.2 -102.7 4.7 -63.2 412.4 394.7 -60.4 78.1166.6 1,555.9 -165.8 -71.2 13.9 -108.5 1,721.7 1,511.0 134.1 76.6211.2 -150.8 -421.3 -246.0 -5.9 -169.4 270.5 -16.3 195.8 91.0793.7 224.2 -441.0 -379.7 -11.6 -49.7 665.2 317.5 276.3 71.4
1,084.3 -43.0 -515.6 -456.0 -45.5 -14.1 472.5 270.7 251.1 -49.31,223.0 -173.7 -687.0 -418.8 -99.4 -168.8 513.3 252.0 196.4 65.01,971.5 -210.2 -1,316.6 -647.2 -125.3 -544.2 1,106.4 424.9 83.7 597.92,438.1 381.1 -932.3 -665.8 -1.4 -265.1 1,313.4 446.5 -62.3 929.3
34.6 -48.3 -86.1 -37.2 -0.1 -48.8 37.8 11.4 -5.2 31.6-133.8 -39.7 -81.0 -56.0 -0.1 -24.9 41.3 36.5 -5.2 10.0239.4 85.4 -8.6 -17.2 -0.1 8.7 94.0 38.5 -5.2 60.7512.1 235.1 -32.0 -189.3 -0.1 157.4 267.1 137.8 -5.2 134.5
94.5 55.9 -24.4 -31.7 -8.0 15.3 80.3 7.1 51.2 22.0-113.1 -61.5 -50.9 -10.7 -13.0 -27.2 -10.7 5.3 32.8 -48.9
-85.1 -108.4 -33.4 -8.9 -12.2 -12.3 -75.1 12.9 41.3 -129.2-24.3 -42.9 -96.2 -28.5 -1.4 -66.4 53.3 7.9 32.8 12.670.1 -175.1 -208.0 -103.8 7.8 -112.0 32.9 33.3 17.6 -18.1
-146.5 -55.8 -19.6 -32.8 6.2 7.0 -36.1 -11.0 -26.0 0.9
Equity capitalReinvested earnings
Other capitalReinvested earnings
Other capital
Financial account (FA)
FA, of which: Direct investment8, 9
48 49 50 51
Abroad In SloveniaEquity capital
52 53 54 55 56 57
-233.4 921.4 0.3 20.1 0.9 -20.7 921.1 755.8 102.4 62.9
149.1 214.6 -95.9 -37.8 -10.3 -47.7 310.4 172.4 158.3 -20.3
600.3 352.2 -198.8 -267.9 -6.8 75.8 551.0 256.5 197.5 97.0
2,668.7 562.7 35.4 5.3 -3.5 33.6 527.3 277.0 198.5 51.7
2,680.4 297.9 -126.4 -79.6 -34.9 -11.9 424.3 189.2 164.8 70.4
2,799.2 540.6 -313.1 -132.7 -21.1 -159.3 853.7 292.7 92.8 468.2
3,177.7 910.1 -143.9 -167.1 46.8 -23.5 1,054.0 400.1 -24.7 678.6
-620.0 36.8 24.0 -0.8 3.9 20.9 12.8 57.2 -2.1 -42.3
662.4 174.5 21.0 -8.3 3.9 25.4 153.5 4.1 -2.1 151.4
291.7 71.9 -31.9 10.3 3.9 -46.1 103.9 16.5 -2.1 89.4
440.8 109.9 2.2 0.6 3.9 -2.2 107.6 -21.8 -2.1 131.5
401.1 -27.6 -94.3 -134.0 3.9 35.8 66.7 24.0 -2.1 44.7
406.0 25.3 -38.5 -4.6 3.9 -37.8 63.8 12.7 -2.1 53.1
397.2 89.9 -11.0 -1.1 3.9 -13.8 100.9 5.4 -2.1 97.6
-17.0 30.7 -8.1 -1.0 3.9 -10.9 38.8 10.4 -2.1 30.5
86.7 63.3 12.4 -0.7 3.9 9.1 50.9 33.1 -2.1 19.9
219.3 24.1 -19.2 -7.4 3.9 -15.7 43.4 38.4 -2.1 7.0
575.1 236.1 -21.7 -19.6 3.9 -6.0 257.8 134.4 -2.1 125.5
-61.6 49.8 25.4 -1.1 1.9 24.5 24.4 6.8 34.7 -17.1
-943.3 9.1 -16.7 -0.9 -2.8 -13.0 25.8 -0.2 17.2 8.7
448.8 -106.4 -33.1 -3.3 -1.8 -28.0 -73.3 12.9 26.2 -112.4
-955.3 17.0 -39.8 -0.4 -2.6 -36.8 56.8 8.5 23.4 24.9
137.8 -50.5 -71.2 -95.7 -2.8 27.3 20.7 30.1 6.5 -16.0
198.5 -11.6 -16.3 -11.2 3.0 -8.0 4.6 -11.6 -28.5 44.7
55 56 57
Equity capital
52 53 54
Financial account (FA)
FA, of which: Direct investment8, 9
48 49 50 51
Abroad In SloveniaEquity capital
Reinvested earnings
Other capitalReinvested
earningsOther capital
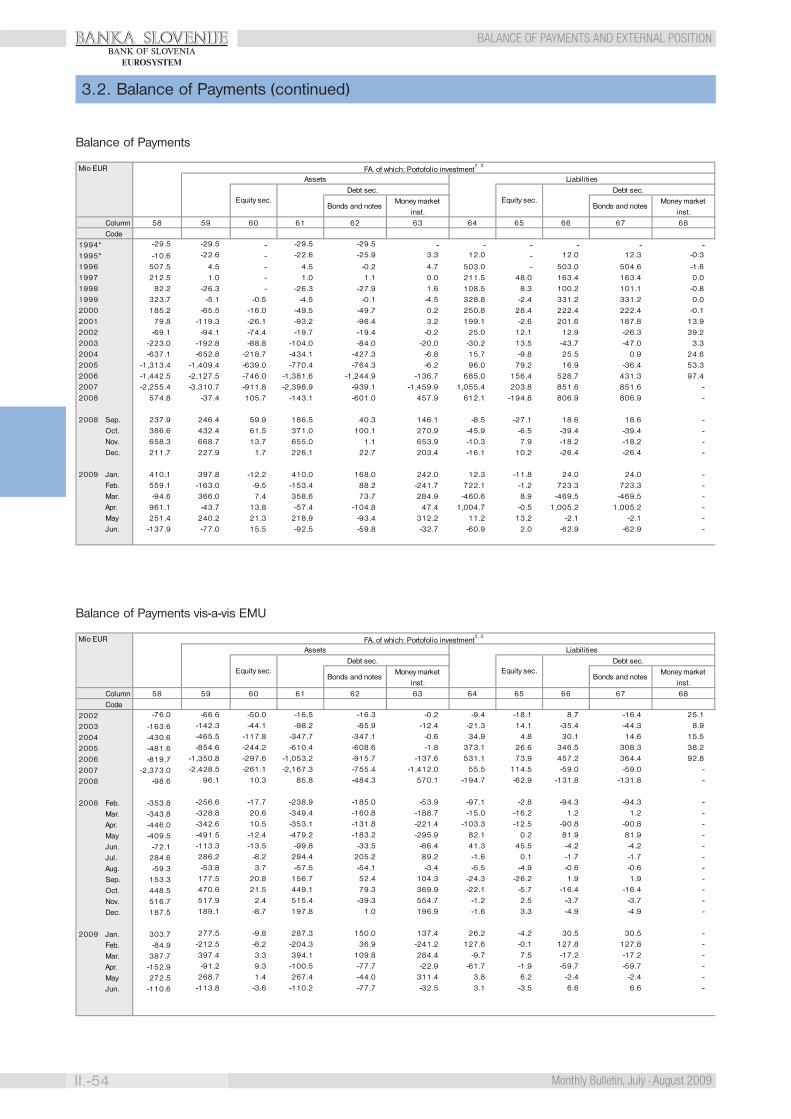
BANKA SLOVENIJE
II.-54 Monthly Bulletin, July - August 2009
BALANCE OF PAYMENTS AND EXTERNAL POSITIONBANK OF SLOVENIA
EUROSYSTEM
Balance of Payments
Balance of Payments vis-a-vis EMU
3.2. Balance of Payments (continued)
ColumnCode
1994* -29.5 -29.5 - -29.5 -29.5 - - - - - -1995* -10.6 -22.6 - -22.6 -25.9 3.3 12.0 - 12.0 12.3 -0.3
1996 507.5 4.5 - 4.5 -0.2 4.7 503.0 - 503.0 504.6 -1.61997 212.5 1.0 - 1.0 1.1 0.0 211.5 48.0 163.4 163.4 0.01998 82.2 -26.3 - -26.3 -27.9 1.6 108.5 8.3 100.2 101.1 -0.81999 323.7 -5.1 -0.5 -4.5 -0.1 -4.5 328.8 -2.4 331.2 331.2 0.02000 185.2 -65.5 -16.0 -49.5 -49.7 0.2 250.8 28.4 222.4 222.4 -0.12001 79.8 -119.3 -26.1 -93.2 -96.4 3.2 199.1 -2.6 201.6 187.8 13.92002 -69.1 -94.1 -74.4 -19.7 -19.4 -0.2 25.0 12.1 12.9 -26.3 39.22003 -223.0 -192.8 -88.8 -104.0 -84.0 -20.0 -30.2 13.5 -43.7 -47.0 3.32004 -637.1 -652.8 -218.7 -434.1 -427.3 -6.8 15.7 -9.8 25.5 0.9 24.62005 -1,313.4 -1,409.4 -639.0 -770.4 -764.3 -6.2 96.0 79.2 16.9 -36.4 53.32006 -1,442.5 -2,127.5 -746.0 -1,381.6 -1,244.9 -136.7 685.0 156.4 528.7 431.3 97.42007 -2,255.4 -3,310.7 -911.8 -2,398.9 -939.1 -1,459.9 1,055.4 203.8 851.6 851.6 -2008 574.8 -37.4 105.7 -143.1 -601.0 457.9 612.1 -194.8 806.9 806.9 -
2008 Sep. 237.9 246.4 59.9 186.5 40.3 146.1 -8.5 -27.1 18.6 18.6 -Oct. 386.6 432.4 61.5 371.0 100.1 270.9 -45.9 -6.5 -39.4 -39.4 -Nov. 658.3 668.7 13.7 655.0 1.1 653.9 -10.3 7.9 -18.2 -18.2 -Dec. 211.7 227.9 1.7 226.1 22.7 203.4 -16.1 10.2 -26.4 -26.4 -
2009 Jan. 410.1 397.8 -12.2 410.0 168.0 242.0 12.3 -11.8 24.0 24.0 -Feb. 559.1 -163.0 -9.5 -153.4 88.2 -241.7 722.1 -1.2 723.3 723.3 -Mar. -94.6 366.0 7.4 358.6 73.7 284.9 -460.6 8.9 -469.5 -469.5 -Apr. 961.1 -43.7 13.8 -57.4 -104.8 47.4 1,004.7 -0.5 1,005.2 1,005.2 -May 251.4 240.2 21.3 218.9 -93.4 312.2 11.2 13.2 -2.1 -2.1 -Jun. -137.9 -77.0 15.5 -92.5 -59.8 -32.7 -60.9 2.0 -62.9 -62.9 -
66 67 686458 59 60 61
Equity sec.Debt sec.
65
Bonds and notesMoney market
inst.62 63
Mio EUR FA, of which: Portofolio investment2, 3
LiabilitiesAssets
Equity sec.Debt sec.
Bonds and notesMoney market
inst.
ColumnCode
2002 -76.0 -66.6 -50.0 -16.5 -16.3 -0.2 -9.4 -18.1 8.7 -16.4 25.1
2003 -163.6 -142.3 -44.1 -98.2 -85.9 -12.4 -21.3 14.1 -35.4 -44.3 8.9
2004 -430.6 -465.5 -117.8 -347.7 -347.1 -0.6 34.9 4.8 30.1 14.6 15.5
2005 -481.6 -854.6 -244.2 -610.4 -608.6 -1.8 373.1 26.6 346.5 308.3 38.2
2006 -819.7 -1,350.8 -297.6 -1,053.2 -915.7 -137.6 531.1 73.9 457.2 364.4 92.8
2007 -2,373.0 -2,428.5 -261.1 -2,167.3 -755.4 -1,412.0 55.5 114.5 -59.0 -59.0 -
2008 -98.6 96.1 10.3 85.8 -484.3 570.1 -194.7 -62.9 -131.8 -131.8 -
2008 Feb. -353.8 -256.6 -17.7 -238.9 -185.0 -53.9 -97.1 -2.8 -94.3 -94.3 -
Mar. -343.8 -328.8 20.6 -349.4 -160.8 -188.7 -15.0 -16.2 1.2 1.2 -
Apr. -446.0 -342.6 10.5 -353.1 -131.8 -221.4 -103.3 -12.5 -90.8 -90.8 -
May -409.5 -491.5 -12.4 -479.2 -183.2 -295.9 82.1 0.2 81.9 81.9 -
Jun. -72.1 -113.3 -13.5 -99.8 -33.5 -66.4 41.3 45.5 -4.2 -4.2 -
Jul. 284.6 286.2 -8.2 294.4 205.2 89.2 -1.6 0.1 -1.7 -1.7 -
Aug. -59.3 -53.8 3.7 -57.5 -54.1 -3.4 -5.5 -4.9 -0.6 -0.6 -
Sep. 153.3 177.5 20.8 156.7 52.4 104.3 -24.3 -26.2 1.9 1.9 -
Oct. 448.5 470.6 21.5 449.1 79.3 369.9 -22.1 -5.7 -16.4 -16.4 -
Nov. 516.7 517.9 2.4 515.4 -39.3 554.7 -1.2 2.5 -3.7 -3.7 -
Dec. 187.5 189.1 -8.7 197.8 1.0 196.9 -1.6 3.3 -4.9 -4.9 -
2009 Jan. 303.7 277.5 -9.8 287.3 150.0 137.4 26.2 -4.2 30.5 30.5 -
Feb. -84.9 -212.5 -8.2 -204.3 36.9 -241.2 127.6 -0.1 127.8 127.8 -
Mar. 387.7 397.4 3.3 394.1 109.8 284.4 -9.7 7.5 -17.2 -17.2 -
Apr. -152.9 -91.2 9.3 -100.5 -77.7 -22.9 -61.7 -1.9 -59.7 -59.7 -
May 272.5 268.7 1.4 267.4 -44.0 311.4 3.8 6.2 -2.4 -2.4 -
Jun. -110.6 -113.8 -3.6 -110.2 -77.7 -32.5 3.1 -3.5 6.6 6.6 -
66 67 686458 59 60 61
Equity sec.Debt sec.
65
Bonds and notesMoney market
inst.62 63
Mio EUR FA, of which: Portofolio investment2, 3
LiabilitiesAssets
Equity sec.Debt sec.
Bonds and notesMoney market
inst.
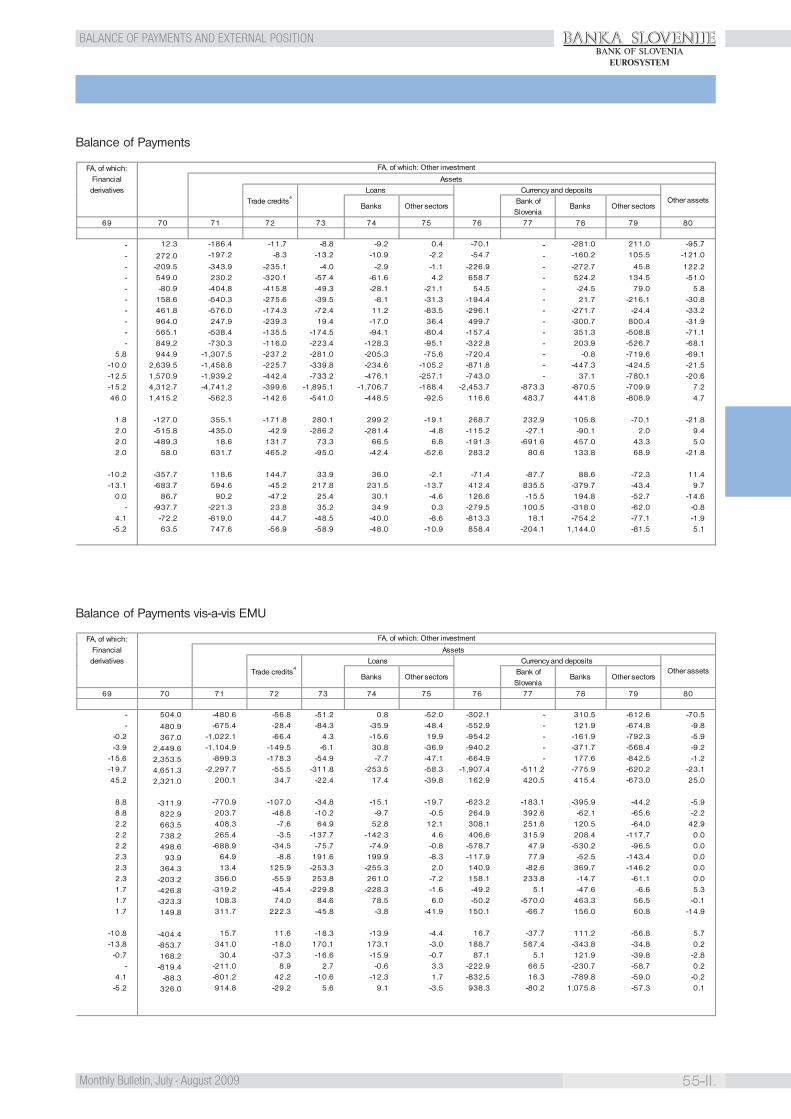
BANKA SLOVENIJE
55-II.Monthly Bulletin, July - August 2009
BALANCE OF PAYMENTS AND EXTERNAL POSITIONBANK OF SLOVENIA
EUROSYSTEM
Balance of Payments
Balance of Payments vis-a-vis EMU
- 12.3 -186.4 -11.7 -8.8 -9.2 0.4 -70.1 - -281.0 211.0 -95.7
- 272.0 -197.2 -8.3 -13.2 -10.9 -2.2 -54.7 - -160.2 105.5 -121.0
- -209.5 -343.9 -235.1 -4.0 -2.9 -1.1 -226.9 - -272.7 45.8 122.2- 549.0 230.2 -320.1 -57.4 -61.6 4.2 658.7 - 524.2 134.5 -51.0- -80.9 -404.8 -415.8 -49.3 -28.1 -21.1 54.5 - -24.5 79.0 5.8- 158.6 -540.3 -275.6 -39.5 -8.1 -31.3 -194.4 - 21.7 -216.1 -30.8- 461.8 -576.0 -174.3 -72.4 11.2 -83.5 -296.1 - -271.7 -24.4 -33.2- 964.0 247.9 -239.3 19.4 -17.0 36.4 499.7 - -300.7 800.4 -31.9- 565.1 -538.4 -135.5 -174.5 -94.1 -80.4 -157.4 - 351.3 -508.8 -71.1- 849.2 -730.3 -116.0 -223.4 -128.3 -95.1 -322.8 - 203.9 -526.7 -68.1
5.8 944.9 -1,307.5 -237.2 -281.0 -205.3 -75.6 -720.4 - -0.8 -719.6 -69.1-10.0 2,639.5 -1,458.8 -225.7 -339.8 -234.6 -105.2 -871.8 - -447.3 -424.5 -21.5-12.5 1,570.9 -1,939.2 -442.4 -733.2 -476.1 -257.1 -743.0 - 37.1 -780.1 -20.6-15.2 4,312.7 -4,741.2 -399.6 -1,895.1 -1,706.7 -188.4 -2,453.7 -873.3 -870.5 -709.9 7.246.0 1,415.2 -562.3 -142.6 -541.0 -448.5 -92.5 116.6 483.7 441.8 -808.9 4.7
1.8 -127.0 355.1 -171.8 280.1 299.2 -19.1 268.7 232.9 105.8 -70.1 -21.82.0 -515.8 -435.0 -42.9 -286.2 -281.4 -4.8 -115.2 -27.1 -90.1 2.0 9.42.0 -489.3 18.6 131.7 73.3 66.5 6.8 -191.3 -691.6 457.0 43.3 5.02.0 58.0 631.7 465.2 -95.0 -42.4 -52.6 283.2 80.6 133.8 68.9 -21.8
-10.2 -357.7 118.6 144.7 33.9 36.0 -2.1 -71.4 -87.7 88.6 -72.3 11.4-13.1 -683.7 594.6 -45.2 217.8 231.5 -13.7 412.4 835.5 -379.7 -43.4 9.7
0.0 86.7 90.2 -47.2 25.4 30.1 -4.6 126.6 -15.5 194.8 -52.7 -14.6- -937.7 -221.3 23.8 35.2 34.9 0.3 -279.5 100.5 -318.0 -62.0 -0.8
4.1 -72.2 -819.0 44.7 -48.5 -40.0 -8.6 -813.3 18.1 -754.2 -77.1 -1.9-5.2 63.5 747.6 -56.9 -58.9 -48.0 -10.9 858.4 -204.1 1,144.0 -81.5 5.1
77 78 79 80
Banks Other sectors
69 70 71 72 73 74 75 76
Banks Other sectorsBank of Slovenia
FA, of which: Financial derivatives
FA, of which: Other investment
Assets
Trade credits4
Loans Currency and depositsOther assets
- 504.0 -480.6 -56.8 -51.2 0.8 -52.0 -302.1 - 310.5 -612.6 -70.5- 480.9 -675.4 -28.4 -84.3 -35.9 -48.4 -552.9 - 121.9 -674.8 -9.8
-0.2 367.0 -1,022.1 -66.4 4.3 -15.6 19.9 -954.2 - -161.9 -792.3 -5.9-3.9 2,449.6 -1,104.9 -149.5 -6.1 30.8 -36.9 -940.2 - -371.7 -568.4 -9.2
-15.6 2,353.5 -899.3 -178.3 -54.9 -7.7 -47.1 -664.9 - 177.6 -842.5 -1.2-19.7 4,651.3 -2,297.7 -55.5 -311.8 -253.5 -58.3 -1,907.4 -511.2 -775.9 -620.2 -23.145.2 2,321.0 200.1 34.7 -22.4 17.4 -39.8 162.9 420.5 415.4 -673.0 25.0
8.8 -311.9 -770.9 -107.0 -34.8 -15.1 -19.7 -623.2 -183.1 -395.9 -44.2 -5.98.8 822.9 203.7 -48.8 -10.2 -9.7 -0.5 264.9 392.6 -62.1 -65.6 -2.22.2 663.5 408.3 -7.6 64.9 52.8 12.1 308.1 251.6 120.5 -64.0 42.92.2 738.2 265.4 -3.5 -137.7 -142.3 4.6 406.6 315.9 208.4 -117.7 0.02.2 498.6 -688.9 -34.5 -75.7 -74.9 -0.8 -578.7 47.9 -530.2 -96.5 0.02.3 93.9 64.9 -8.8 191.6 199.9 -8.3 -117.9 77.9 -52.5 -143.4 0.02.3 364.3 13.4 125.9 -253.3 -255.3 2.0 140.9 -82.6 369.7 -146.2 0.02.3 -203.2 356.0 -55.9 253.8 261.0 -7.2 158.1 233.8 -14.7 -61.1 0.01.7 -426.8 -319.2 -45.4 -229.8 -228.3 -1.6 -49.2 5.1 -47.6 -6.6 5.31.7 -323.3 108.3 74.0 84.6 78.5 6.0 -50.2 -570.0 463.3 56.5 -0.11.7 149.8 311.7 222.3 -45.8 -3.8 -41.9 150.1 -66.7 156.0 60.8 -14.9
-10.8 -404.4 15.7 11.6 -18.3 -13.9 -4.4 16.7 -37.7 111.2 -56.8 5.7-13.8 -853.7 341.0 -18.0 170.1 173.1 -3.0 188.7 567.4 -343.8 -34.8 0.2
-0.7 168.2 30.4 -37.3 -16.6 -15.9 -0.7 87.1 5.1 121.9 -39.8 -2.8- -819.4 -211.0 8.9 2.7 -0.6 3.3 -222.9 66.5 -230.7 -58.7 0.2
4.1 -88.3 -801.2 42.2 -10.6 -12.3 1.7 -832.5 16.3 -789.8 -59.0 -0.2-5.2 326.0 914.8 -29.2 5.6 9.1 -3.5 938.3 -80.2 1,075.8 -57.3 0.1
FA, of which: Financial derivatives
FA, of which: Other investment
Assets
Trade credits4
Loans Currency and depositsOther assets
Banks Other sectorsBank of Slovenia
Banks Other sectors
69 70 71 72 73 74 75 76 77 78 79 80
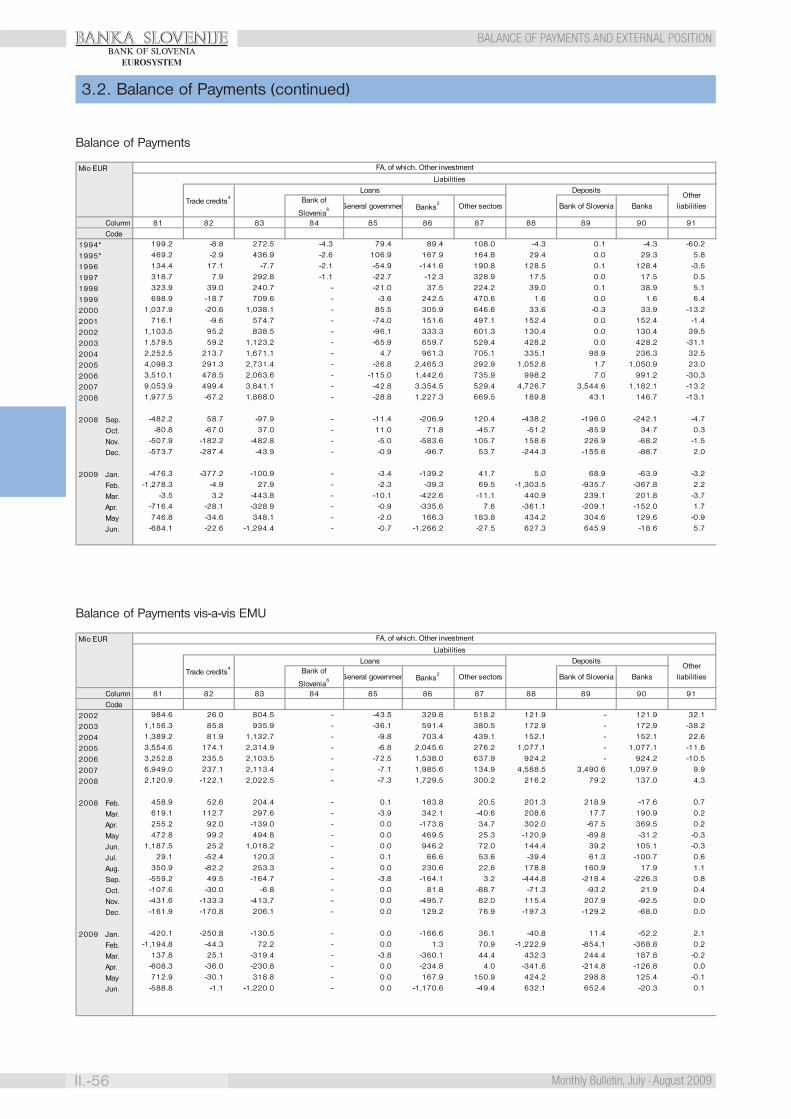
BANKA SLOVENIJE
II.-56 Monthly Bulletin, July - August 2009
BALANCE OF PAYMENTS AND EXTERNAL POSITIONBANK OF SLOVENIA
EUROSYSTEM
Balance of Payments
Balance of Payments vis-a-vis EMU
3.2. Balance of Payments (continued)
ColumnCode
1994* 199.2 -8.8 272.5 -4.3 79.4 89.4 108.0 -4.3 0.1 -4.3 -60.2
1995* 469.2 -2.9 436.9 -2.6 106.9 167.9 164.8 29.4 0.0 29.3 5.8
1996 134.4 17.1 -7.7 -2.1 -54.9 -141.6 190.8 128.5 0.1 128.4 -3.5
1997 318.7 7.9 292.8 -1.1 -22.7 -12.3 328.9 17.5 0.0 17.5 0.5
1998 323.9 39.0 240.7 - -21.0 37.5 224.2 39.0 0.1 38.9 5.1
1999 698.9 -18.7 709.6 - -3.6 242.5 470.6 1.6 0.0 1.6 6.4
2000 1,037.9 -20.6 1,038.1 - 85.5 305.9 646.6 33.6 -0.3 33.9 -13.2
2001 716.1 -9.6 574.7 - -74.0 151.6 497.1 152.4 0.0 152.4 -1.4
2002 1,103.5 95.2 838.5 - -96.1 333.3 601.3 130.4 0.0 130.4 39.5
2003 1,579.5 59.2 1,123.2 - -65.9 659.7 529.4 428.2 0.0 428.2 -31.1
2004 2,252.5 213.7 1,671.1 - 4.7 961.3 705.1 335.1 98.9 236.3 32.5
2005 4,098.3 291.3 2,731.4 - -26.8 2,465.3 292.9 1,052.6 1.7 1,050.9 23.0
2006 3,510.1 478.5 2,063.6 - -115.0 1,442.6 735.9 998.2 7.0 991.2 -30.3
2007 9,053.9 499.4 3,841.1 - -42.8 3,354.5 529.4 4,726.7 3,544.6 1,182.1 -13.2
2008 1,977.5 -67.2 1,868.0 - -28.8 1,227.3 669.5 189.8 43.1 146.7 -13.1
2008 Sep. -482.2 58.7 -97.9 - -11.4 -206.9 120.4 -438.2 -196.0 -242.1 -4.7
Oct. -80.8 -67.0 37.0 - 11.0 71.8 -45.7 -51.2 -85.9 34.7 0.3
Nov. -507.9 -182.2 -482.8 - -5.0 -583.6 105.7 158.6 226.9 -68.2 -1.5
Dec. -573.7 -287.4 -43.9 - -0.9 -96.7 53.7 -244.3 -155.6 -88.7 2.0
2009 Jan. -476.3 -377.2 -100.9 - -3.4 -139.2 41.7 5.0 68.9 -63.9 -3.2
Feb. -1,278.3 -4.9 27.9 - -2.3 -39.3 69.5 -1,303.5 -935.7 -367.8 2.2
Mar. -3.5 3.2 -443.8 - -10.1 -422.6 -11.1 440.9 239.1 201.8 -3.7
Apr. -716.4 -28.1 -328.9 - -0.9 -335.6 7.6 -361.1 -209.1 -152.0 1.7
May 746.8 -34.6 348.1 - -2.0 166.3 183.8 434.2 304.6 129.6 -0.9
Jun. -684.1 -22.6 -1,294.4 - -0.7 -1,266.2 -27.5 627.3 645.9 -18.6 5.7
89 90 9185 86 87 8881 82 83 84
General governmen Banks2Trade credits
4Loans
Other sectors
Mio EUR FA, of which. Other investment
LiabilitiesDeposits
Other liabilitiesBank of Slovenia Banks
Bank of
Slovenia6
ColumnCode
2002 984.6 26.0 804.5 - -43.5 329.8 518.2 121.9 - 121.9 32.1
2003 1,156.3 85.8 935.9 - -36.1 591.4 380.5 172.9 - 172.9 -38.2
2004 1,389.2 81.9 1,132.7 - -9.8 703.4 439.1 152.1 - 152.1 22.6
2005 3,554.6 174.1 2,314.9 - -6.8 2,045.6 276.2 1,077.1 - 1,077.1 -11.6
2006 3,252.8 235.5 2,103.5 - -72.5 1,538.0 637.9 924.2 - 924.2 -10.5
2007 6,949.0 237.1 2,113.4 - -7.1 1,985.6 134.9 4,588.5 3,490.6 1,097.9 9.9
2008 2,120.9 -122.1 2,022.5 - -7.3 1,729.5 300.2 216.2 79.2 137.0 4.3
2008 Feb. 458.9 52.6 204.4 - 0.1 183.8 20.5 201.3 218.9 -17.6 0.7
Mar. 619.1 112.7 297.6 - -3.9 342.1 -40.6 208.6 17.7 190.9 0.2
Apr. 255.2 92.0 -139.0 - 0.0 -173.8 34.7 302.0 -67.5 369.5 0.2
May 472.8 99.2 494.8 - 0.0 469.5 25.3 -120.9 -89.8 -31.2 -0.3
Jun. 1,187.5 25.2 1,018.2 - 0.0 946.2 72.0 144.4 39.2 105.1 -0.3
Jul. 29.1 -52.4 120.3 - 0.1 66.6 53.6 -39.4 61.3 -100.7 0.6
Aug. 350.9 -82.2 253.3 - 0.0 230.6 22.6 178.8 160.9 17.9 1.1
Sep. -559.2 49.5 -164.7 - -3.8 -164.1 3.2 -444.8 -218.4 -226.3 0.8
Oct. -107.6 -30.0 -6.8 - 0.0 81.8 -88.7 -71.3 -93.2 21.9 0.4
Nov. -431.6 -133.3 -413.7 - 0.0 -495.7 82.0 115.4 207.9 -92.5 0.0
Dec. -161.9 -170.8 206.1 - 0.0 129.2 76.9 -197.3 -129.2 -68.0 0.0
2009 Jan. -420.1 -250.8 -130.5 - 0.0 -166.6 36.1 -40.8 11.4 -52.2 2.1
Feb. -1,194.8 -44.3 72.2 - 0.0 1.3 70.9 -1,222.9 -854.1 -368.8 0.2
Mar. 137.8 25.1 -319.4 - -3.8 -360.1 44.4 432.3 244.4 187.8 -0.2
Apr. -608.3 -36.0 -230.8 - 0.0 -234.8 4.0 -341.6 -214.8 -126.8 0.0
May 712.9 -30.1 318.8 - 0.0 167.9 150.9 424.2 298.8 125.4 -0.1
Jun. -588.8 -1.1 -1,220.0 - 0.0 -1,170.6 -49.4 632.1 652.4 -20.3 0.1
Mio EUR FA, of which. Other investment
LiabilitiesDeposits
Other liabilitiesBank of Slovenia Banks
Bank of
Slovenia6 General governmen Banks
2Trade credits4
Loans
Other sectors
81 82 83 84 85 86 87 88 89 90 91
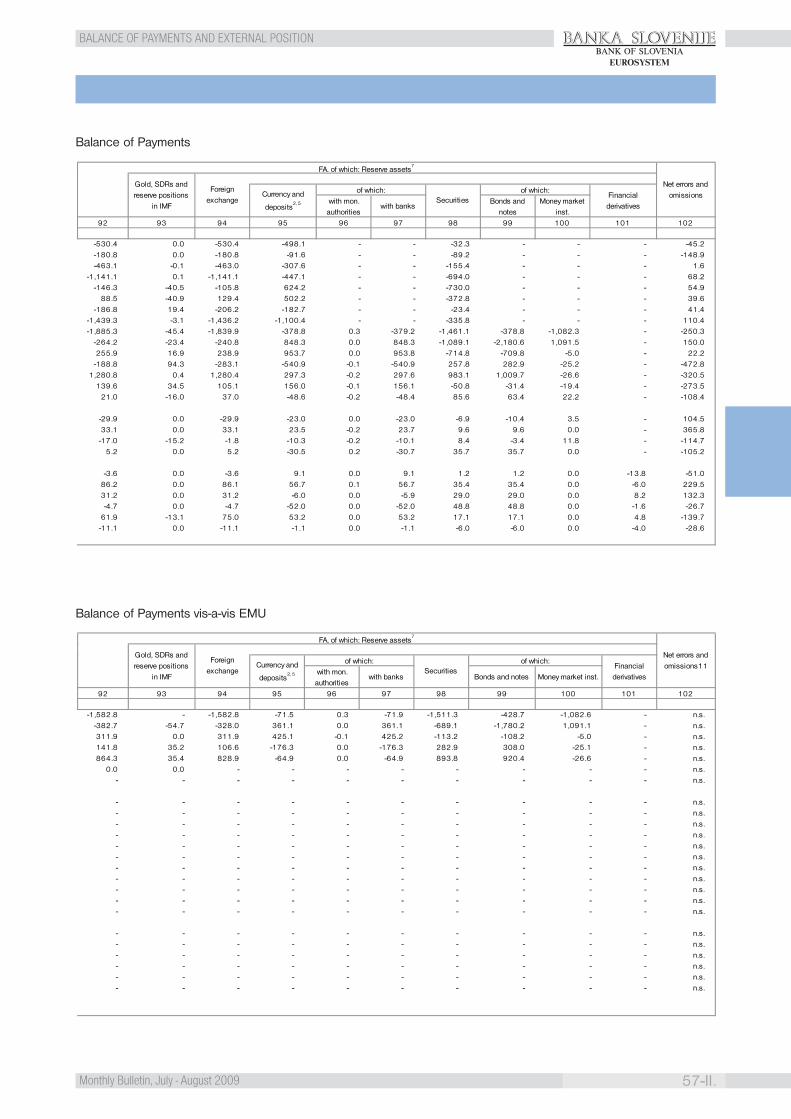
BANKA SLOVENIJE
57-II.Monthly Bulletin, July - August 2009
BALANCE OF PAYMENTS AND EXTERNAL POSITIONBANK OF SLOVENIA
EUROSYSTEM
Balance of Payments
Balance of Payments vis-a-vis EMU
-530.4 0.0 -530.4 -498.1 - - -32.3 - - - -45.2-180.8 0.0 -180.8 -91.6 - - -89.2 - - - -148.9-463.1 -0.1 -463.0 -307.6 - - -155.4 - - - 1.6
-1,141.1 0.1 -1,141.1 -447.1 - - -694.0 - - - 68.2-146.3 -40.5 -105.8 624.2 - - -730.0 - - - 54.9
88.5 -40.9 129.4 502.2 - - -372.8 - - - 39.6-186.8 19.4 -206.2 -182.7 - - -23.4 - - - 41.4
-1,439.3 -3.1 -1,436.2 -1,100.4 - - -335.8 - - - 110.4-1,885.3 -45.4 -1,839.9 -378.8 0.3 -379.2 -1,461.1 -378.8 -1,082.3 - -250.3
-264.2 -23.4 -240.8 848.3 0.0 848.3 -1,089.1 -2,180.6 1,091.5 - 150.0255.9 16.9 238.9 953.7 0.0 953.8 -714.8 -709.8 -5.0 - 22.2-188.8 94.3 -283.1 -540.9 -0.1 -540.9 257.8 282.9 -25.2 - -472.8
1,280.8 0.4 1,280.4 297.3 -0.2 297.6 983.1 1,009.7 -26.6 - -320.5139.6 34.5 105.1 156.0 -0.1 156.1 -50.8 -31.4 -19.4 - -273.5
21.0 -16.0 37.0 -48.6 -0.2 -48.4 85.6 63.4 22.2 - -108.4
-29.9 0.0 -29.9 -23.0 0.0 -23.0 -6.9 -10.4 3.5 - 104.533.1 0.0 33.1 23.5 -0.2 23.7 9.6 9.6 0.0 - 365.8-17.0 -15.2 -1.8 -10.3 -0.2 -10.1 8.4 -3.4 11.8 - -114.7
5.2 0.0 5.2 -30.5 0.2 -30.7 35.7 35.7 0.0 - -105.2
-3.6 0.0 -3.6 9.1 0.0 9.1 1.2 1.2 0.0 -13.8 -51.086.2 0.0 86.1 56.7 0.1 56.7 35.4 35.4 0.0 -6.0 229.531.2 0.0 31.2 -6.0 0.0 -5.9 29.0 29.0 0.0 8.2 132.3-4.7 0.0 -4.7 -52.0 0.0 -52.0 48.8 48.8 0.0 -1.6 -26.7
61.9 -13.1 75.0 53.2 0.0 53.2 17.1 17.1 0.0 4.8 -139.7-11.1 0.0 -11.1 -1.1 0.0 -1.1 -6.0 -6.0 0.0 -4.0 -28.6
100 1029995 96 97 98
Net errors and omissions
Gold, SDRs and reserve positions
in IMF
Foreign exchange
Currency and
deposits2,5
of which:Securities
of which:with mon. authorities
with banks
FA, of which: Reserve assets7
Financial derivatives
101
Bonds and notes
Money market inst.
92 93 94
-1,582.8 - -1,582.8 -71.5 0.3 -71.9 -1,511.3 -428.7 -1,082.6 - n.s.-382.7 -54.7 -328.0 361.1 0.0 361.1 -689.1 -1,780.2 1,091.1 - n.s.311.9 0.0 311.9 425.1 -0.1 425.2 -113.2 -108.2 -5.0 - n.s.141.8 35.2 106.6 -176.3 0.0 -176.3 282.9 308.0 -25.1 - n.s.864.3 35.4 828.9 -64.9 0.0 -64.9 893.8 920.4 -26.6 - n.s.
0.0 0.0 - - - - - - - - n.s.- - - - - - - - - - n.s.
- - - - - - - - - - n.s.- - - - - - - - - - n.s.- - - - - - - - - - n.s.- - - - - - - - - - n.s.- - - - - - - - - - n.s.- - - - - - - - - - n.s.- - - - - - - - - - n.s.- - - - - - - - - - n.s.- - - - - - - - - - n.s.- - - - - - - - - - n.s.- - - - - - - - - - n.s.
- - - - - - - - - - n.s.- - - - - - - - - - n.s.- - - - - - - - - - n.s.- - - - - - - - - - n.s.- - - - - - - - - - n.s.- - - - - - - - - - n.s.
Financial derivatives
101100 10296 97 98 9992 93 94 95
Net errors and omissions11
Gold, SDRs and reserve positions
in IMF
Foreign exchange
Currency and
deposits2,5
of which:Securities
of which:with mon. authorities
with banks
FA, of which: Reserve assets7
Bonds and notes Money market inst.
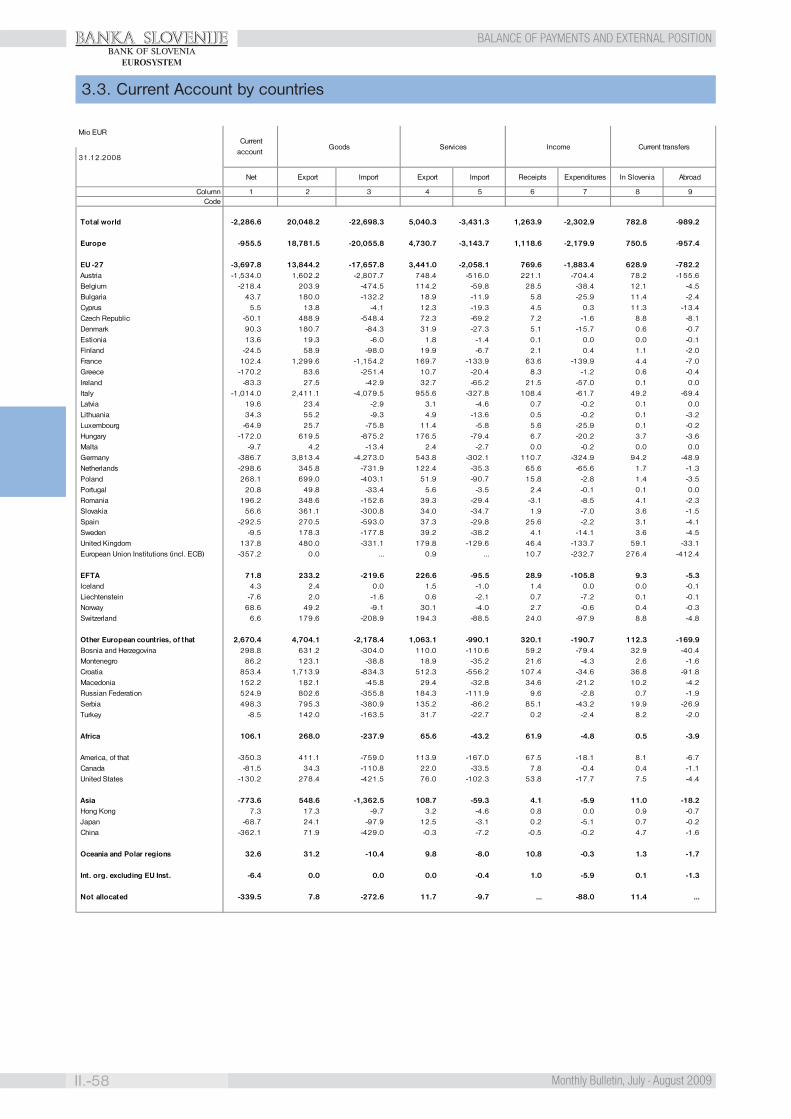
BANKA SLOVENIJE
II.-58 Monthly Bulletin, July - August 2009
BALANCE OF PAYMENTS AND EXTERNAL POSITIONBANK OF SLOVENIA
EUROSYSTEM
3.3. Current Account by countries
Mio EUR
31.12.2008
ColumnCode
Total world -2,286.6 20,048.2 -22,698.3 5,040.3 -3,431.3 1,263.9 -2,302.9 782.8 -989.2
Europe -955.5 18,781.5 -20,055.8 4,730.7 -3,143.7 1,118.6 -2,179.9 750.5 -957.4
EU -27 -3,697.8 13,844.2 -17,657.8 3,441.0 -2,058.1 769.6 -1,883.4 628.9 -782.2 Austria -1,534.0 1,602.2 -2,807.7 748.4 -516.0 221.1 -704.4 78.2 -155.6 Belgium -218.4 203.9 -474.5 114.2 -59.8 28.5 -38.4 12.1 -4.5 Bulgaria 43.7 180.0 -132.2 18.9 -11.9 5.8 -25.9 11.4 -2.4 Cyprus 5.5 13.8 -4.1 12.3 -19.3 4.5 0.3 11.3 -13.4 Czech Republic -50.1 488.9 -548.4 72.3 -69.2 7.2 -1.6 8.8 -8.1 Denmark 90.3 180.7 -84.3 31.9 -27.3 5.1 -15.7 0.6 -0.7 Estionia 13.6 19.3 -6.0 1.8 -1.4 0.1 0.0 0.0 -0.1 Finland -24.5 58.9 -98.0 19.9 -6.7 2.1 0.4 1.1 -2.0 France 102.4 1,299.6 -1,154.2 169.7 -133.9 63.6 -139.9 4.4 -7.0 Greece -170.2 83.6 -251.4 10.7 -20.4 8.3 -1.2 0.6 -0.4 Ireland -83.3 27.5 -42.9 32.7 -65.2 21.5 -57.0 0.1 0.0 Italy -1,014.0 2,411.1 -4,079.5 955.6 -327.8 108.4 -61.7 49.2 -69.4 Latvia 19.6 23.4 -2.9 3.1 -4.6 0.7 -0.2 0.1 0.0 Lithuania 34.3 55.2 -9.3 4.9 -13.6 0.5 -0.2 0.1 -3.2 Luxembourg -64.9 25.7 -75.8 11.4 -5.8 5.6 -25.9 0.1 -0.2 Hungary -172.0 619.5 -875.2 176.5 -79.4 6.7 -20.2 3.7 -3.6 Malta -9.7 4.2 -13.4 2.4 -2.7 0.0 -0.2 0.0 0.0 Germany -386.7 3,813.4 -4,273.0 543.8 -302.1 110.7 -324.9 94.2 -48.9 Netherlands -298.6 345.8 -731.9 122.4 -35.3 65.6 -65.6 1.7 -1.3 Poland 268.1 699.0 -403.1 51.9 -90.7 15.8 -2.8 1.4 -3.5 Portugal 20.8 49.8 -33.4 5.6 -3.5 2.4 -0.1 0.1 0.0 Romania 196.2 348.6 -152.6 39.3 -29.4 -3.1 -8.5 4.1 -2.3 Slovakia 56.6 361.1 -300.8 34.0 -34.7 1.9 -7.0 3.6 -1.5 Spain -292.5 270.5 -593.0 37.3 -29.8 25.6 -2.2 3.1 -4.1 Sweden -9.5 178.3 -177.8 39.2 -38.2 4.1 -14.1 3.6 -4.5 United Kingdom 137.8 480.0 -331.1 179.8 -129.6 46.4 -133.7 59.1 -33.1 European Union Institutions (incl. ECB) -357.2 0.0 ... 0.9 ... 10.7 -232.7 276.4 -412.4
EFTA 71.8 233.2 -219.6 226.6 -95.5 28.9 -105.8 9.3 -5.3 Iceland 4.3 2.4 0.0 1.5 -1.0 1.4 0.0 0.0 -0.1 Liechtenstein -7.6 2.0 -1.6 0.6 -2.1 0.7 -7.2 0.1 -0.1 Norway 68.6 49.2 -9.1 30.1 -4.0 2.7 -0.6 0.4 -0.3 Switzerland 6.6 179.6 -208.9 194.3 -88.5 24.0 -97.9 8.8 -4.8
Other European countries, of that 2,670.4 4,704.1 -2,178.4 1,063.1 -990.1 320.1 -190.7 112.3 -169.9 Bosnia and Herzegovina 298.8 631.2 -304.0 110.0 -110.6 59.2 -79.4 32.9 -40.4 Montenegro 86.2 123.1 -38.8 18.9 -35.2 21.6 -4.3 2.6 -1.6 Croatia 853.4 1,713.9 -834.3 512.3 -556.2 107.4 -34.6 36.8 -91.8 Macedonia 152.2 182.1 -45.8 29.4 -32.8 34.6 -21.2 10.2 -4.2 Russian Federation 524.9 802.6 -355.8 184.3 -111.9 9.6 -2.8 0.7 -1.9 Serbia 498.3 795.3 -380.9 135.2 -86.2 85.1 -43.2 19.9 -26.9 Turkey -8.5 142.0 -163.5 31.7 -22.7 0.2 -2.4 8.2 -2.0
Africa 106.1 268.0 -237.9 65.6 -43.2 61.9 -4.8 0.5 -3.9
America, of that -350.3 411.1 -759.0 113.9 -167.0 67.5 -18.1 8.1 -6.7 Canada -81.5 34.3 -110.8 22.0 -33.5 7.8 -0.4 0.4 -1.1 United States -130.2 278.4 -421.5 76.0 -102.3 53.8 -17.7 7.5 -4.4
Asia -773.6 548.6 -1,362.5 108.7 -59.3 4.1 -5.9 11.0 -18.2 Hong Kong 7.3 17.3 -9.7 3.2 -4.6 0.8 0.0 0.9 -0.7 Japan -68.7 24.1 -97.9 12.5 -3.1 0.2 -5.1 0.7 -0.2 China -362.1 71.9 -429.0 -0.3 -7.2 -0.5 -0.2 4.7 -1.6
Oceania and Polar regions 32.6 31.2 -10.4 9.8 -8.0 10.8 -0.3 1.3 -1.7
Int. org. excluding EU Inst. -6.4 0.0 0.0 0.0 -0.4 1.0 -5.9 0.1 -1.3
Not allocated -339.5 7.8 -272.6 11.7 -9.7 ... -88.0 11.4 ...
In Slovenia Abroad
8 9 5 7
Net Export Import Export Import Receipts Expenditures
6
Current transfers Current account
Goods Services Income
1 2 3 4
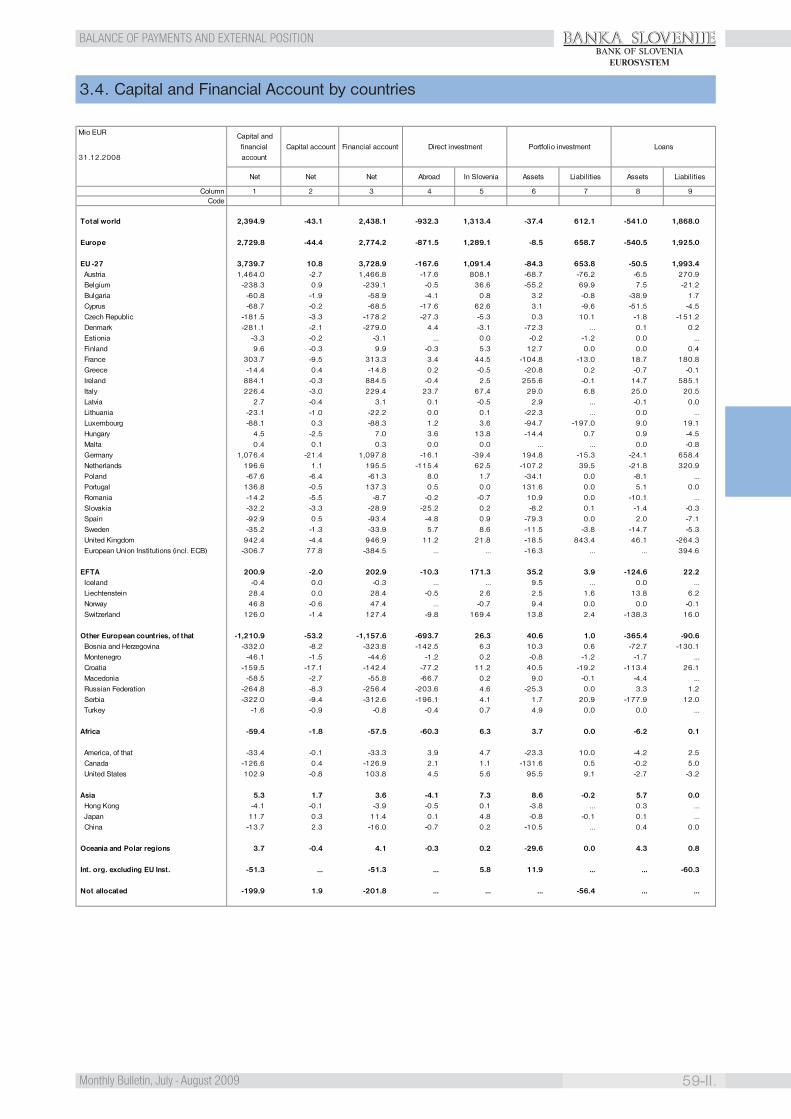
BANKA SLOVENIJE
59-II.Monthly Bulletin, July - August 2009
BALANCE OF PAYMENTS AND EXTERNAL POSITIONBANK OF SLOVENIA
EUROSYSTEM
3.4. Capital and Financial Account by countries
Mio EUR
31.12.2008
ColumnCode
Total world 2,394.9 -43.1 2,438.1 -932.3 1,313.4 -37.4 612.1 -541.0 1,868.0
Europe 2,729.8 -44.4 2,774.2 -871.5 1,289.1 -8.5 658.7 -540.5 1,925.0
EU -27 3,739.7 10.8 3,728.9 -167.6 1,091.4 -84.3 653.8 -50.5 1,993.4 Austria 1,464.0 -2.7 1,466.8 -17.6 808.1 -68.7 -76.2 -6.5 270.9 Belgium -238.3 0.9 -239.1 -0.5 36.6 -55.2 69.9 7.5 -21.2 Bulgaria -60.8 -1.9 -58.9 -4.1 0.8 3.2 -0.8 -38.9 1.7 Cyprus -68.7 -0.2 -68.5 -17.6 62.6 3.1 -9.6 -51.5 -4.5 Czech Republic -181.5 -3.3 -178.2 -27.3 -5.3 0.3 10.1 -1.8 -151.2 Denmark -281.1 -2.1 -279.0 4.4 -3.1 -72.3 ... 0.1 0.2 Estionia -3.3 -0.2 -3.1 ... 0.0 -0.2 -1.2 0.0 ... Finland 9.6 -0.3 9.9 -0.3 5.3 12.7 0.0 0.0 0.4 France 303.7 -9.5 313.3 3.4 44.5 -104.8 -13.0 18.7 180.8 Greece -14.4 0.4 -14.8 0.2 -0.5 -20.8 0.2 -0.7 -0.1 Ireland 884.1 -0.3 884.5 -0.4 2.5 255.6 -0.1 14.7 585.1 Italy 226.4 -3.0 229.4 23.7 67.4 29.0 6.8 25.0 20.5 Latvia 2.7 -0.4 3.1 0.1 -0.5 2.9 ... -0.1 0.0 Lithuania -23.1 -1.0 -22.2 0.0 0.1 -22.3 ... 0.0 ... Luxembourg -88.1 0.3 -88.3 1.2 3.6 -94.7 -197.0 9.0 19.1 Hungary 4.5 -2.5 7.0 3.6 13.8 -14.4 0.7 0.9 -4.5 Malta 0.4 0.1 0.3 0.0 0.0 ... ... 0.0 -0.8 Germany 1,076.4 -21.4 1,097.8 -16.1 -39.4 194.8 -15.3 -24.1 658.4 Netherlands 196.6 1.1 195.5 -115.4 62.5 -107.2 39.5 -21.8 320.9 Poland -67.6 -6.4 -61.3 8.0 1.7 -34.1 0.0 -8.1 ... Portugal 136.8 -0.5 137.3 0.5 0.0 131.6 0.0 5.1 0.0 Romania -14.2 -5.5 -8.7 -0.2 -0.7 10.9 0.0 -10.1 ... Slovakia -32.2 -3.3 -28.9 -25.2 0.2 -8.2 0.1 -1.4 -0.3 Spain -92.9 0.5 -93.4 -4.8 0.9 -79.3 0.0 2.0 -7.1 Sweden -35.2 -1.3 -33.9 5.7 8.6 -11.5 -3.8 -14.7 -5.3 United Kingdom 942.4 -4.4 946.9 11.2 21.8 -18.5 843.4 46.1 -264.3 European Union Institutions (incl. ECB) -306.7 77.8 -384.5 ... ... -16.3 ... ... 394.6
EFTA 200.9 -2.0 202.9 -10.3 171.3 35.2 3.9 -124.6 22.2 Iceland -0.4 0.0 -0.3 ... ... 9.5 ... 0.0 ... Liechtenstein 28.4 0.0 28.4 -0.5 2.6 2.5 1.6 13.8 6.2 Norway 46.8 -0.6 47.4 ... -0.7 9.4 0.0 0.0 -0.1 Switzerland 126.0 -1.4 127.4 -9.8 169.4 13.8 2.4 -138.3 16.0
Other European countries, of that -1,210.9 -53.2 -1,157.6 -693.7 26.3 40.6 1.0 -365.4 -90.6 Bosnia and Herzegovina -332.0 -8.2 -323.8 -142.5 6.3 10.3 0.6 -72.7 -130.1 Montenegro -46.1 -1.5 -44.6 -1.2 0.2 -0.8 -1.2 -1.7 ... Croatia -159.5 -17.1 -142.4 -77.2 11.2 40.5 -19.2 -113.4 26.1 Macedonia -58.5 -2.7 -55.8 -66.7 0.2 9.0 -0.1 -4.4 ... Russian Federation -264.8 -8.3 -256.4 -203.6 4.6 -25.3 0.0 3.3 1.2 Serbia -322.0 -9.4 -312.6 -196.1 4.1 1.7 20.9 -177.9 12.0 Turkey -1.6 -0.9 -0.8 -0.4 0.7 4.9 0.0 0.0 ...
Africa -59.4 -1.8 -57.5 -60.3 6.3 3.7 0.0 -6.2 0.1
America, of that -33.4 -0.1 -33.3 3.9 4.7 -23.3 10.0 -4.2 2.5 Canada -126.6 0.4 -126.9 2.1 1.1 -131.6 0.5 -0.2 5.0 United States 102.9 -0.8 103.8 4.5 5.6 95.5 9.1 -2.7 -3.2
Asia 5.3 1.7 3.6 -4.1 7.3 8.6 -0.2 5.7 0.0 Hong Kong -4.1 -0.1 -3.9 -0.5 0.1 -3.8 ... 0.3 ... Japan 11.7 0.3 11.4 0.1 4.8 -0.8 -0.1 0.1 ... China -13.7 2.3 -16.0 -0.7 0.2 -10.5 ... 0.4 0.0
Oceania and Polar regions 3.7 -0.4 4.1 -0.3 0.2 -29.6 0.0 4.3 0.8
Int. org. excluding EU Inst. -51.3 ... -51.3 ... 5.8 11.9 ... ... -60.3
Not allocated -199.9 1.9 -201.8 ... ... ... -56.4 ... ...
Liabilities
8 9
In Slovenia Assets Liabilities Assets Net Net Net Abroad
71 2 6 3 4 5
Loans Capital and
financial account
Direct investment Portfolio investment Capital account Financial account

BANKA SLOVENIJE
II.-60 Monthly Bulletin, July - August 2009
BALANCE OF PAYMENTS AND EXTERNAL POSITIONBANK OF SLOVENIA
EUROSYSTEM
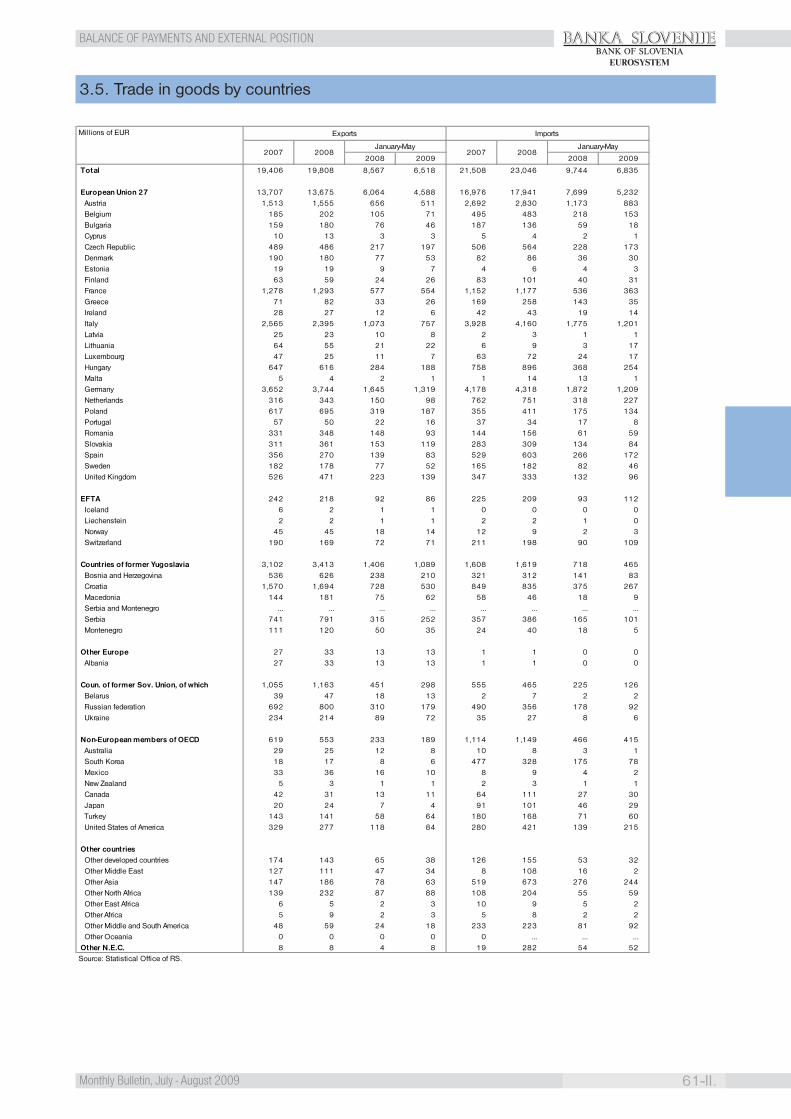
BANKA SLOVENIJE
61-II.Monthly Bulletin, July - August 2009
BALANCE OF PAYMENTS AND EXTERNAL POSITIONBANK OF SLOVENIA
EUROSYSTEM
3.5. Trade in goods by countries
2008 2009 2008 2009
Total 19,406 19,808 8,567 6,518 21,508 23,046 9,744 6,835
European Union 27 13,707 13,675 6,064 4,588 16,976 17,941 7,699 5,232 Austria 1,513 1,555 656 511 2,692 2,830 1,173 883 Belgium 185 202 105 71 495 483 218 153 Bulgaria 159 180 76 46 187 136 59 18 Cyprus 10 13 3 3 5 4 2 1 Czech Republic 489 486 217 197 506 564 228 173 Denmark 190 180 77 53 82 86 36 30 Estonia 19 19 9 7 4 6 4 3 Finland 63 59 24 26 83 101 40 31 France 1,278 1,293 577 554 1,152 1,177 536 363 Greece 71 82 33 26 169 258 143 35 Ireland 28 27 12 6 42 43 19 14 Italy 2,565 2,395 1,073 757 3,928 4,160 1,775 1,201 Latvia 25 23 10 8 2 3 1 1 Lithuania 64 55 21 22 6 9 3 17 Luxembourg 47 25 11 7 63 72 24 17 Hungary 647 616 284 188 758 896 368 254 Malta 5 4 2 1 1 14 13 1 Germany 3,652 3,744 1,645 1,319 4,178 4,318 1,872 1,209 Netherlands 316 343 150 98 762 751 318 227 Poland 617 695 319 187 355 411 175 134 Portugal 57 50 22 16 37 34 17 8 Romania 331 348 148 93 144 156 61 59 Slovakia 311 361 153 119 283 309 134 84 Spain 356 270 139 83 529 603 266 172 Sweden 182 178 77 52 165 182 82 46 United Kingdom 526 471 223 139 347 333 132 96
EFTA 242 218 92 86 225 209 93 112 Iceland 6 2 1 1 0 0 0 0 Liechenstein 2 2 1 1 2 2 1 0 Norway 45 45 18 14 12 9 2 3 Switzerland 190 169 72 71 211 198 90 109
Countries of former Yugoslavia 3,102 3,413 1,406 1,089 1,608 1,619 718 465 Bosnia and Herzegovina 536 626 238 210 321 312 141 83 Croatia 1,570 1,694 728 530 849 835 375 267 Macedonia 144 181 75 62 58 46 18 9 Serbia and Montenegro ... ... ... ... ... ... ... ... Serbia 741 791 315 252 357 386 165 101 Montenegro 111 120 50 35 24 40 18 5
Other Europe 27 33 13 13 1 1 0 0 Albania 27 33 13 13 1 1 0 0
Coun. of former Sov. Union, of which 1,055 1,163 451 298 555 465 225 126 Belarus 39 47 18 13 2 7 2 2 Russian federation 692 800 310 179 490 356 178 92 Ukraine 234 214 89 72 35 27 8 6
Non-European members of OECD 619 553 233 189 1,114 1,149 466 415 Australia 29 25 12 8 10 8 3 1 South Korea 18 17 8 6 477 328 175 78 Mexico 33 36 16 10 8 9 4 2 New Zealand 5 3 1 1 2 3 1 1 Canada 42 31 13 11 64 111 27 30 Japan 20 24 7 4 91 101 46 29 Turkey 143 141 58 64 180 168 71 60 United States of America 329 277 118 84 280 421 139 215
Other countries Other developed countries 174 143 65 38 126 155 53 32 Other Middle East 127 111 47 34 8 108 16 2 Other Asia 147 186 78 63 519 673 276 244 Other North Africa 139 232 87 88 108 204 55 59 Other East Africa 6 5 2 3 10 9 5 2 Other Africa 5 9 2 3 5 8 2 2 Other Middle and South America 48 59 24 18 233 223 81 92 Other Oceania 0 0 0 0 0 ... ... ... Other N.E.C. 8 8 4 8 19 282 54 52Source: Statistical Office of RS.
Millions of EUR Exports
January-May
Imports
January-May2007 2008 2007 2008
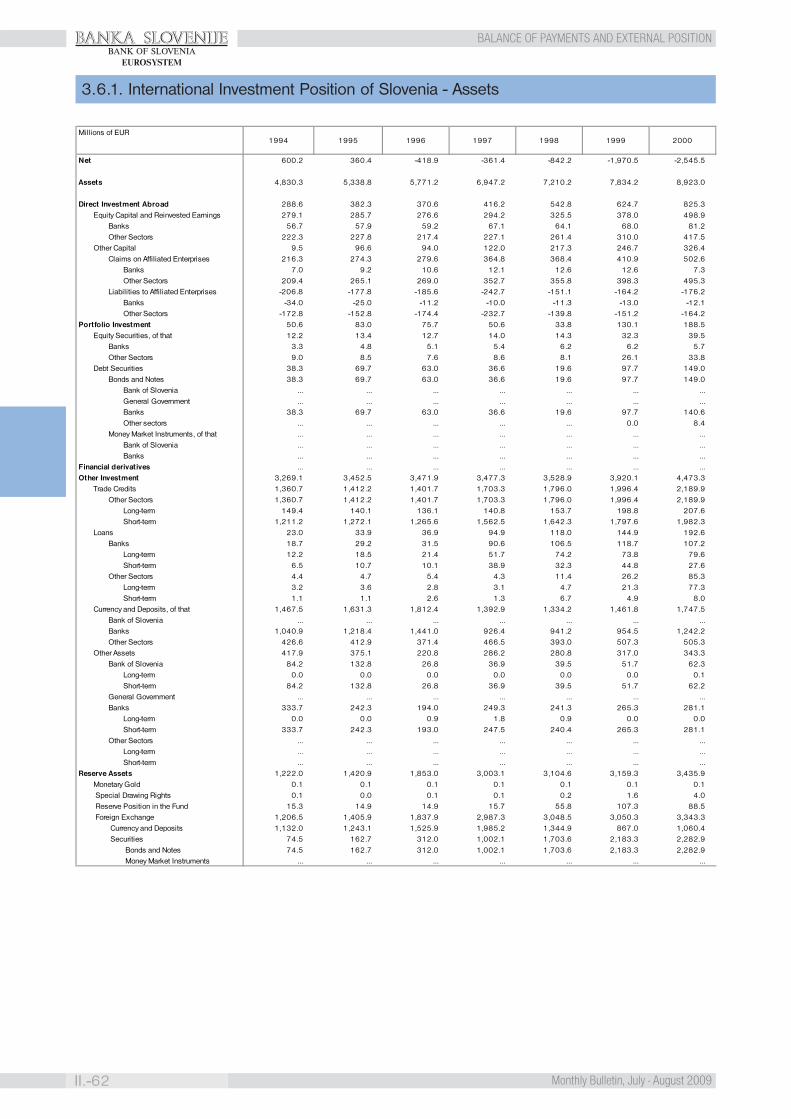
BANKA SLOVENIJE
II.-62 Monthly Bulletin, July - August 2009
BALANCE OF PAYMENTS AND EXTERNAL POSITIONBANK OF SLOVENIA
EUROSYSTEM
3.6.1. International Investment Position of Slovenia - Assets
Net 600.2 360.4 -418.9 -361.4 -842.2 -1,970.5 -2,545.5
Assets 4,830.3 5,338.8 5,771.2 6,947.2 7,210.2 7,834.2 8,923.0
Direct Investment Abroad 288.6 382.3 370.6 416.2 542.8 624.7 825.3Equity Capital and Reinvested Earnings 279.1 285.7 276.6 294.2 325.5 378.0 498.9
Banks 56.7 57.9 59.2 67.1 64.1 68.0 81.2Other Sectors 222.3 227.8 217.4 227.1 261.4 310.0 417.5
Other Capital 9.5 96.6 94.0 122.0 217.3 246.7 326.4Claims on Affiliated Enterprises 216.3 274.3 279.6 364.8 368.4 410.9 502.6
Banks 7.0 9.2 10.6 12.1 12.6 12.6 7.3Other Sectors 209.4 265.1 269.0 352.7 355.8 398.3 495.3
Liabilities to Affiliated Enterprises -206.8 -177.8 -185.6 -242.7 -151.1 -164.2 -176.2Banks -34.0 -25.0 -11.2 -10.0 -11.3 -13.0 -12.1Other Sectors -172.8 -152.8 -174.4 -232.7 -139.8 -151.2 -164.2
Portfolio Investment 50.6 83.0 75.7 50.6 33.8 130.1 188.5Equity Securities, of that 12.2 13.4 12.7 14.0 14.3 32.3 39.5
Banks 3.3 4.8 5.1 5.4 6.2 6.2 5.7Other Sectors 9.0 8.5 7.6 8.6 8.1 26.1 33.8
Debt Securities 38.3 69.7 63.0 36.6 19.6 97.7 149.0Bonds and Notes 38.3 69.7 63.0 36.6 19.6 97.7 149.0
Bank of Slovenia ... ... ... ... ... ... ...General Government ... ... ... ... ... ... ...Banks 38.3 69.7 63.0 36.6 19.6 97.7 140.6Other sectors ... ... ... ... ... 0.0 8.4
Money Market Instruments, of that ... ... ... ... ... ... ...Bank of Slovenia ... ... ... ... ... ... ...Banks ... ... ... ... ... ... ...
Financial derivatives ... ... ... ... ... ... ...Other Investment 3,269.1 3,452.5 3,471.9 3,477.3 3,528.9 3,920.1 4,473.3
Trade Credits 1,360.7 1,412.2 1,401.7 1,703.3 1,796.0 1,996.4 2,189.9Other Sectors 1,360.7 1,412.2 1,401.7 1,703.3 1,796.0 1,996.4 2,189.9
Long-term 149.4 140.1 136.1 140.8 153.7 198.8 207.6Short-term 1,211.2 1,272.1 1,265.6 1,562.5 1,642.3 1,797.6 1,982.3
Loans 23.0 33.9 36.9 94.9 118.0 144.9 192.6Banks 18.7 29.2 31.5 90.6 106.5 118.7 107.2
Long-term 12.2 18.5 21.4 51.7 74.2 73.8 79.6Short-term 6.5 10.7 10.1 38.9 32.3 44.8 27.6
Other Sectors 4.4 4.7 5.4 4.3 11.4 26.2 85.3Long-term 3.2 3.6 2.8 3.1 4.7 21.3 77.3Short-term 1.1 1.1 2.6 1.3 6.7 4.9 8.0
Currency and Deposits, of that 1,467.5 1,631.3 1,812.4 1,392.9 1,334.2 1,461.8 1,747.5Bank of Slovenia ... ... ... ... ... ... ...Banks 1,040.9 1,218.4 1,441.0 926.4 941.2 954.5 1,242.2Other Sectors 426.6 412.9 371.4 466.5 393.0 507.3 505.3
Other Assets 417.9 375.1 220.8 286.2 280.8 317.0 343.3Bank of Slovenia 84.2 132.8 26.8 36.9 39.5 51.7 62.3
Long-term 0.0 0.0 0.0 0.0 0.0 0.0 0.1Short-term 84.2 132.8 26.8 36.9 39.5 51.7 62.2
General Government ... ... ... ... ... ... ...Banks 333.7 242.3 194.0 249.3 241.3 265.3 281.1
Long-term 0.0 0.0 0.9 1.8 0.9 0.0 0.0Short-term 333.7 242.3 193.0 247.5 240.4 265.3 281.1
Other Sectors ... ... ... ... ... ... ...Long-term ... ... ... ... ... ... ...Short-term ... ... ... ... ... ... ...
Reserve Assets 1,222.0 1,420.9 1,853.0 3,003.1 3,104.6 3,159.3 3,435.9Monetary Gold 0.1 0.1 0.1 0.1 0.1 0.1 0.1 Special Drawing Rights 0.1 0.0 0.1 0.1 0.2 1.6 4.0 Reserve Position in the Fund 15.3 14.9 14.9 15.7 55.8 107.3 88.5 Foreign Exchange 1,206.5 1,405.9 1,837.9 2,987.3 3,048.5 3,050.3 3,343.3
Currency and Deposits 1,132.0 1,243.1 1,525.9 1,985.2 1,344.9 867.0 1,060.4 Securities 74.5 162.7 312.0 1,002.1 1,703.6 2,183.3 2,282.9
Bonds and Notes 74.5 162.7 312.0 1,002.1 1,703.6 2,183.3 2,282.9 Money Market Instruments ... ... ... ... ... ... ...
1997Millions of EUR
1994 1995 1996 1998 1999 2000
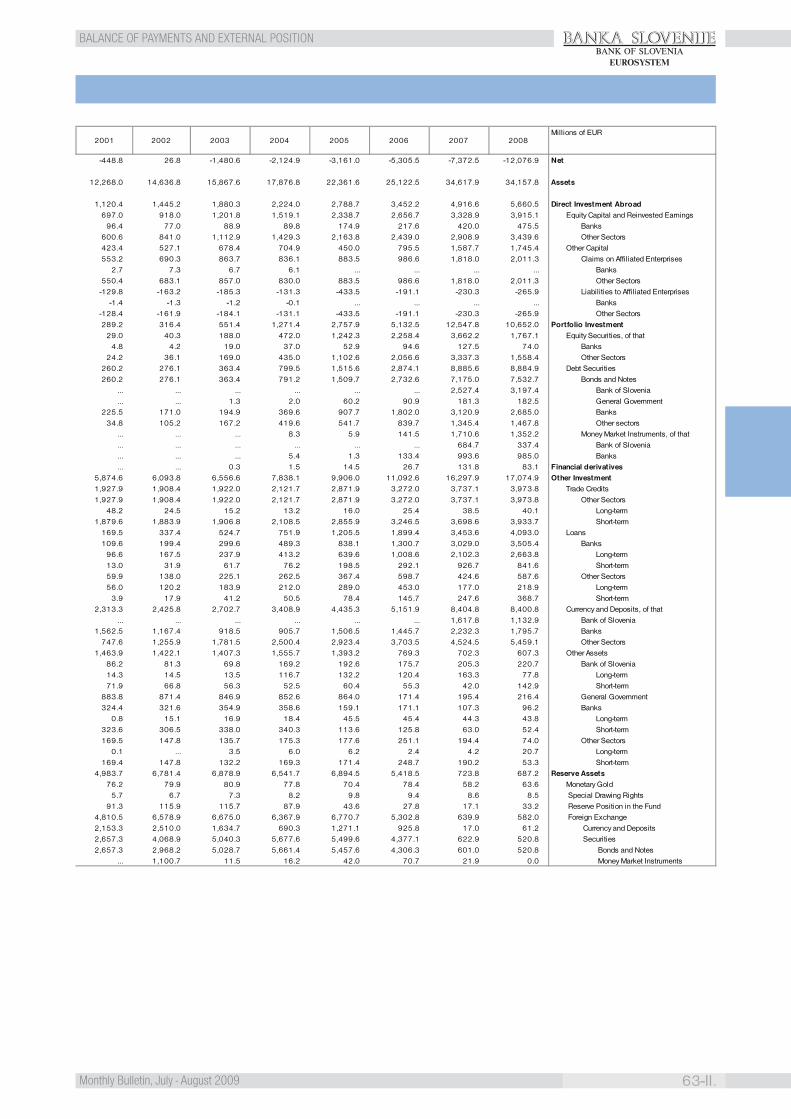
BANKA SLOVENIJE
63-II.Monthly Bulletin, July - August 2009
BALANCE OF PAYMENTS AND EXTERNAL POSITIONBANK OF SLOVENIA
EUROSYSTEM
-448.8 26.8 -1,480.6 -2,124.9 -3,161.0 -5,305.5 -7,372.5 -12,076.9 Net
12,268.0 14,636.8 15,867.6 17,876.8 22,361.6 25,122.5 34,617.9 34,157.8 Assets
1,120.4 1,445.2 1,880.3 2,224.0 2,788.7 3,452.2 4,916.6 5,660.5 Direct Investment Abroad697.0 918.0 1,201.8 1,519.1 2,338.7 2,656.7 3,328.9 3,915.1 Equity Capital and Reinvested Earnings
96.4 77.0 88.9 89.8 174.9 217.6 420.0 475.5 Banks600.6 841.0 1,112.9 1,429.3 2,163.8 2,439.0 2,908.9 3,439.6 Other Sectors423.4 527.1 678.4 704.9 450.0 795.5 1,587.7 1,745.4 Other Capital 553.2 690.3 863.7 836.1 883.5 986.6 1,818.0 2,011.3 Claims on Affiliated Enterprises
2.7 7.3 6.7 6.1 ... ... ... ... Banks550.4 683.1 857.0 830.0 883.5 986.6 1,818.0 2,011.3 Other Sectors-129.8 -163.2 -185.3 -131.3 -433.5 -191.1 -230.3 -265.9 Liabilities to Affiliated Enterprises
-1.4 -1.3 -1.2 -0.1 ... ... ... ... Banks-128.4 -161.9 -184.1 -131.1 -433.5 -191.1 -230.3 -265.9 Other Sectors289.2 316.4 551.4 1,271.4 2,757.9 5,132.5 12,547.8 10,652.0 Portfolio Investment
29.0 40.3 188.0 472.0 1,242.3 2,258.4 3,662.2 1,767.1 Equity Securities, of that4.8 4.2 19.0 37.0 52.9 94.6 127.5 74.0 Banks
24.2 36.1 169.0 435.0 1,102.6 2,056.6 3,337.3 1,558.4 Other Sectors260.2 276.1 363.4 799.5 1,515.6 2,874.1 8,885.6 8,884.9 Debt Securities260.2 276.1 363.4 791.2 1,509.7 2,732.6 7,175.0 7,532.7 Bonds and Notes
... ... ... ... ... ... 2,527.4 3,197.4 Bank of Slovenia
... ... 1.3 2.0 60.2 90.9 181.3 182.5 General Government225.5 171.0 194.9 369.6 907.7 1,802.0 3,120.9 2,685.0 Banks
34.8 105.2 167.2 419.6 541.7 839.7 1,345.4 1,467.8 Other sectors... ... ... 8.3 5.9 141.5 1,710.6 1,352.2 Money Market Instruments, of that... ... ... ... ... ... 684.7 337.4 Bank of Slovenia... ... ... 5.4 1.3 133.4 993.6 985.0 Banks... ... 0.3 1.5 14.5 26.7 131.8 83.1 Financial derivatives
5,874.6 6,093.8 6,556.6 7,838.1 9,906.0 11,092.6 16,297.9 17,074.9 Other Investment1,927.9 1,908.4 1,922.0 2,121.7 2,871.9 3,272.0 3,737.1 3,973.8 Trade Credits1,927.9 1,908.4 1,922.0 2,121.7 2,871.9 3,272.0 3,737.1 3,973.8 Other Sectors
48.2 24.5 15.2 13.2 16.0 25.4 38.5 40.1 Long-term1,879.6 1,883.9 1,906.8 2,108.5 2,855.9 3,246.5 3,698.6 3,933.7 Short-term
169.5 337.4 524.7 751.9 1,205.5 1,899.4 3,453.6 4,093.0 Loans109.6 199.4 299.6 489.3 838.1 1,300.7 3,029.0 3,505.4 Banks
96.6 167.5 237.9 413.2 639.6 1,008.6 2,102.3 2,663.8 Long-term13.0 31.9 61.7 76.2 198.5 292.1 926.7 841.6 Short-term59.9 138.0 225.1 262.5 367.4 598.7 424.6 587.6 Other Sectors56.0 120.2 183.9 212.0 289.0 453.0 177.0 218.9 Long-term
3.9 17.9 41.2 50.5 78.4 145.7 247.6 368.7 Short-term2,313.3 2,425.8 2,702.7 3,408.9 4,435.3 5,151.9 8,404.8 8,400.8 Currency and Deposits, of that
... ... ... ... ... ... 1,617.8 1,132.9 Bank of Slovenia1,562.5 1,167.4 918.5 905.7 1,506.5 1,445.7 2,232.3 1,795.7 Banks
747.6 1,255.9 1,781.5 2,500.4 2,923.4 3,703.5 4,524.5 5,459.1 Other Sectors1,463.9 1,422.1 1,407.3 1,555.7 1,393.2 769.3 702.3 607.3 Other Assets
86.2 81.3 69.8 169.2 192.6 175.7 205.3 220.7 Bank of Slovenia14.3 14.5 13.5 116.7 132.2 120.4 163.3 77.8 Long-term71.9 66.8 56.3 52.5 60.4 55.3 42.0 142.9 Short-term
883.8 871.4 846.9 852.6 864.0 171.4 195.4 216.4 General Government324.4 321.6 354.9 358.6 159.1 171.1 107.3 96.2 Banks
0.8 15.1 16.9 18.4 45.5 45.4 44.3 43.8 Long-term323.6 306.5 338.0 340.3 113.6 125.8 63.0 52.4 Short-term169.5 147.8 135.7 175.3 177.6 251.1 194.4 74.0 Other Sectors
0.1 ... 3.5 6.0 6.2 2.4 4.2 20.7 Long-term169.4 147.8 132.2 169.3 171.4 248.7 190.2 53.3 Short-term
4,983.7 6,781.4 6,878.9 6,541.7 6,894.5 5,418.5 723.8 687.2 Reserve Assets76.2 79.9 80.9 77.8 70.4 78.4 58.2 63.6 Monetary Gold
5.7 6.7 7.3 8.2 9.8 9.4 8.6 8.5 Special Drawing Rights91.3 115.9 115.7 87.9 43.6 27.8 17.1 33.2 Reserve Position in the Fund
4,810.5 6,578.9 6,675.0 6,367.9 6,770.7 5,302.8 639.9 582.0 Foreign Exchange2,153.3 2,510.0 1,634.7 690.3 1,271.1 925.8 17.0 61.2 Currency and Deposits2,657.3 4,068.9 5,040.3 5,677.6 5,499.6 4,377.1 622.9 520.8 Securities2,657.3 2,968.2 5,028.7 5,661.4 5,457.6 4,306.3 601.0 520.8 Bonds and Notes
... 1,100.7 11.5 16.2 42.0 70.7 21.9 0.0 Money Market Instruments
2001 2002 2003 2004 2005 2006 2007 2008Millions of EUR
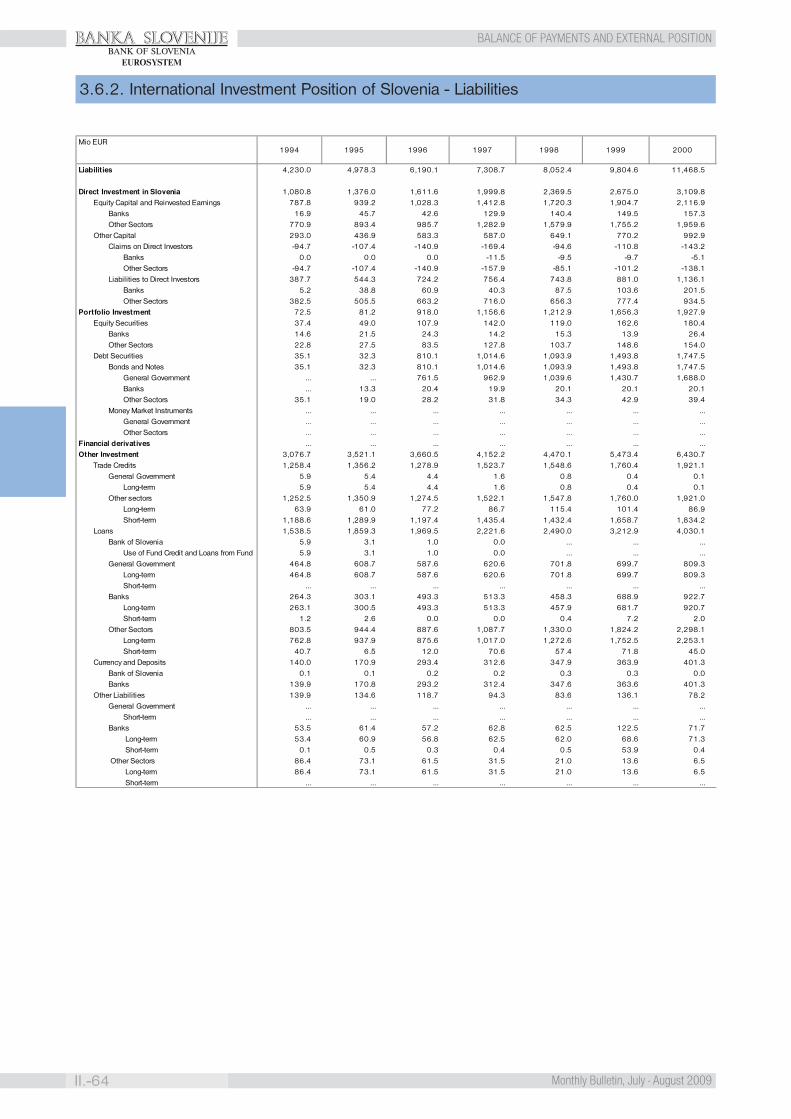
BANKA SLOVENIJE
II.-64 Monthly Bulletin, July - August 2009
BALANCE OF PAYMENTS AND EXTERNAL POSITIONBANK OF SLOVENIA
EUROSYSTEM
3.6.2. International Investment Position of Slovenia - Liabilities
Liabilities 4,230.0 4,978.3 6,190.1 7,308.7 8,052.4 9,804.6 11,468.5
Direct Investment in Slovenia 1,080.8 1,376.0 1,611.6 1,999.8 2,369.5 2,675.0 3,109.8Equity Capital and Reinvested Earnings 787.8 939.2 1,028.3 1,412.8 1,720.3 1,904.7 2,116.9
Banks 16.9 45.7 42.6 129.9 140.4 149.5 157.3Other Sectors 770.9 893.4 985.7 1,282.9 1,579.9 1,755.2 1,959.6
Other Capital 293.0 436.9 583.3 587.0 649.1 770.2 992.9Claims on Direct Investors -94.7 -107.4 -140.9 -169.4 -94.6 -110.8 -143.2
Banks 0.0 0.0 0.0 -11.5 -9.5 -9.7 -5.1Other Sectors -94.7 -107.4 -140.9 -157.9 -85.1 -101.2 -138.1
Liabilities to Direct Investors 387.7 544.3 724.2 756.4 743.8 881.0 1,136.1Banks 5.2 38.8 60.9 40.3 87.5 103.6 201.5Other Sectors 382.5 505.5 663.2 716.0 656.3 777.4 934.5
Portfolio Investment 72.5 81.2 918.0 1,156.6 1,212.9 1,656.3 1,927.9Equity Securities 37.4 49.0 107.9 142.0 119.0 162.6 180.4
Banks 14.6 21.5 24.3 14.2 15.3 13.9 26.4Other Sectors 22.8 27.5 83.5 127.8 103.7 148.6 154.0
Debt Securities 35.1 32.3 810.1 1,014.6 1,093.9 1,493.8 1,747.5Bonds and Notes 35.1 32.3 810.1 1,014.6 1,093.9 1,493.8 1,747.5
General Government ... ... 761.5 962.9 1,039.6 1,430.7 1,688.0Banks ... 13.3 20.4 19.9 20.1 20.1 20.1Other Sectors 35.1 19.0 28.2 31.8 34.3 42.9 39.4
Money Market Instruments ... ... ... ... ... ... ...General Government ... ... ... ... ... ... ...Other Sectors ... ... ... ... ... ... ...
Financial derivatives ... ... ... ... ... ... ...Other Investment 3,076.7 3,521.1 3,660.5 4,152.2 4,470.1 5,473.4 6,430.7
Trade Credits 1,258.4 1,356.2 1,278.9 1,523.7 1,548.6 1,760.4 1,921.1General Government 5.9 5.4 4.4 1.6 0.8 0.4 0.1
Long-term 5.9 5.4 4.4 1.6 0.8 0.4 0.1Other sectors 1,252.5 1,350.9 1,274.5 1,522.1 1,547.8 1,760.0 1,921.0
Long-term 63.9 61.0 77.2 86.7 115.4 101.4 86.9Short-term 1,188.6 1,289.9 1,197.4 1,435.4 1,432.4 1,658.7 1,834.2
Loans 1,538.5 1,859.3 1,969.5 2,221.6 2,490.0 3,212.9 4,030.1Bank of Slovenia 5.9 3.1 1.0 0.0 ... ... ...
Use of Fund Credit and Loans from Fund 5.9 3.1 1.0 0.0 ... ... ...General Government 464.8 608.7 587.6 620.6 701.8 699.7 809.3
Long-term 464.8 608.7 587.6 620.6 701.8 699.7 809.3Short-term ... ... ... ... ... ... ...
Banks 264.3 303.1 493.3 513.3 458.3 688.9 922.7Long-term 263.1 300.5 493.3 513.3 457.9 681.7 920.7Short-term 1.2 2.6 0.0 0.0 0.4 7.2 2.0
Other Sectors 803.5 944.4 887.6 1,087.7 1,330.0 1,824.2 2,298.1Long-term 762.8 937.9 875.6 1,017.0 1,272.6 1,752.5 2,253.1Short-term 40.7 6.5 12.0 70.6 57.4 71.8 45.0
Currency and Deposits 140.0 170.9 293.4 312.6 347.9 363.9 401.3Bank of Slovenia 0.1 0.1 0.2 0.2 0.3 0.3 0.0Banks 139.9 170.8 293.2 312.4 347.6 363.6 401.3
Other Liabilities 139.9 134.6 118.7 94.3 83.6 136.1 78.2General Government ... ... ... ... ... ... ...
Short-term ... ... ... ... ... ... ...Banks 53.5 61.4 57.2 62.8 62.5 122.5 71.7
Long-term 53.4 60.9 56.8 62.5 62.0 68.6 71.3 Short-term 0.1 0.5 0.3 0.4 0.5 53.9 0.4
Other Sectors 86.4 73.1 61.5 31.5 21.0 13.6 6.5 Long-term 86.4 73.1 61.5 31.5 21.0 13.6 6.5 Short-term ... ... ... ... ... ... ...
1997Mio EUR
1994 1995 1996 1998 1999 2000

BANKA SLOVENIJE
65-II.Monthly Bulletin, July - August 2009
BALANCE OF PAYMENTS AND EXTERNAL POSITIONBANK OF SLOVENIA
EUROSYSTEM
12,716.8 14,610.0 17,348.1 20,001.7 25,522.6 30,428.1 41,990.5 46,234.6 Liabilities
2,940.0 3,947.9 5,046.8 5,579.6 6,133.6 6,822.3 9,765.1 10,996.4 Direct Investment in Slovenia2,489.0 3,466.2 4,438.6 4,874.1 5,607.4 6,283.1 6,776.0 7,230.4 Equity Capital and Reinvested Earnings
223.3 492.1 520.9 572.5 705.7 1,026.4 1,218.0 1,449.1 Banks2,265.8 2,974.2 3,917.7 4,301.6 4,901.7 5,256.7 5,558.0 5,781.3 Other Sectors
451.0 481.6 608.2 705.4 526.2 539.1 2,989.1 3,766.0 Other Capital-223.1 -324.1 -366.2 -295.7 -454.8 -388.9 -772.5 -793.4 Claims on Direct Investors
... ... ... ... ... ... ... ... Banks-223.1 -324.1 -366.2 -295.7 -454.8 -388.9 -772.5 -793.4 Other Sectors674.0 805.7 974.4 1,001.2 981.0 928.0 3,761.6 4,559.3 Liabilities to Direct Investors
25.7 147.2 158.5 136.1 ... ... ... ... Banks648.3 658.5 816.0 865.1 981.0 928.0 3,761.6 4,559.3 Other Sectors
2,143.9 2,098.4 2,337.7 2,320.1 2,398.2 3,137.4 4,549.5 4,590.3 Portfolio Investment194.9 107.0 236.2 211.0 306.9 657.2 1,358.4 598.0 Equity Securities
11.7 32.2 30.7 34.8 45.6 53.1 148.9 58.1 Banks183.2 74.8 205.4 176.2 261.3 604.1 1,209.4 539.9 Other Sectors
1,949.1 1,991.4 2,101.6 2,109.1 2,091.3 2,480.1 3,191.2 3,992.4 Debt Securities1,934.2 1,935.2 2,070.0 2,096.1 2,069.9 2,456.4 3,191.2 3,992.4 Bonds and Notes1,908.2 1,894.0 2,008.3 1,865.0 1,720.3 2,107.9 2,832.2 3,551.7 General Government
0.3 19.6 33.4 221.4 336.3 331.8 352.7 436.9 Banks25.6 21.6 28.3 9.7 13.3 16.7 6.2 3.8 Other Sectors14.9 56.2 31.5 13.0 21.4 23.8 ... ... Money Market Instruments
3.4 56.2 31.5 13.0 21.4 23.8 ... ... General Government11.5 ... ... ... ... ... ... ... Other Sectors
... ... ... ... ... ... 76.4 227.5 Financial derivatives7,632.8 8,563.7 9,963.6 12,102.0 16,990.7 20,468.4 27,599.5 30,420.4 Other Investment1,749.5 1,730.3 1,693.5 1,879.0 2,855.2 3,337.0 3,855.5 4,022.8 Trade Credits
0.0 0.0 0.0 0.0 0.0 ... ... ... General Government0.0 0.0 0.0 0.0 0.0 ... ... ... Long-term
1,749.5 1,730.3 1,693.5 1,878.9 2,855.2 3,337.0 3,855.5 4,022.8 Other sectors 59.5 37.6 30.3 17.2 7.4 2.5 8.9 16.9 Long-term
1,690.0 1,692.7 1,663.2 1,861.7 2,847.8 3,334.5 3,846.6 4,006.0 Short-term5,162.3 5,932.4 7,013.4 8,699.9 11,612.1 13,576.8 15,636.2 17,987.1 Loans
0.0 ... ... ... ... ... ... ... Bank of Slovenia... ... ... ... ... ... ... ... Use of Fund Credit and Loans from Fund
582.7 467.7 382.4 380.7 363.1 241.3 203.4 180.0 General Government582.7 467.7 382.4 380.7 363.1 241.3 203.4 180.0 Long-term
0.0 ... ... ... ... ... 0.0 ... Short-term1,329.0 1,633.0 2,284.3 3,255.5 5,929.6 7,354.6 11,374.9 12,704.2 Banks1,327.7 1,622.0 2,278.1 3,206.1 5,392.7 7,150.1 9,865.6 10,884.2 Long-term
1.3 11.0 6.1 49.4 536.8 204.5 1,509.2 1,820.0 Short-term3,250.5 3,831.7 4,346.8 5,063.8 5,319.5 5,980.9 4,057.9 5,102.9 Other Sectors3,223.6 3,819.2 4,266.2 5,040.2 5,218.7 5,912.5 3,892.4 4,773.3 Long-term
26.9 12.5 80.6 23.5 100.8 68.5 165.5 329.6 Short-term557.9 695.5 1,093.9 1,322.7 2,351.9 3,331.2 8,037.6 8,332.6 Currency and Deposits
0.0 33.2 30.3 35.8 39.3 44.6 3,587.5 3,631.4 Bank of Slovenia557.9 662.3 1,063.6 1,286.8 2,312.6 3,286.5 4,450.0 4,701.3 Banks 163.1 205.5 162.8 200.4 171.5 223.4 70.2 77.8 Other Liabilities
11.3 9.8 8.4 7.9 9.4 8.9 0.0 0.0 General Government11.3 9.8 8.4 7.9 9.4 8.9 0.0 0.0 Short-term81.7 110.1 64.1 90.7 64.5 46.2 38.8 43.6 Banks73.4 63.9 55.1 57.6 ... ... ... ... Long-term
8.2 46.1 9.0 33.1 64.5 46.2 38.8 43.6 Short-term70.2 85.6 90.4 101.9 97.6 168.2 31.5 34.2 Other Sectors
5.8 3.6 2.1 10.0 6.6 1.8 9.9 11.1 Long-term64.4 82.0 88.3 91.9 91.0 166.4 21.5 23.1 Short-term
2001 2002 2003 2004 2005 2006 2007 2008Mio EUR
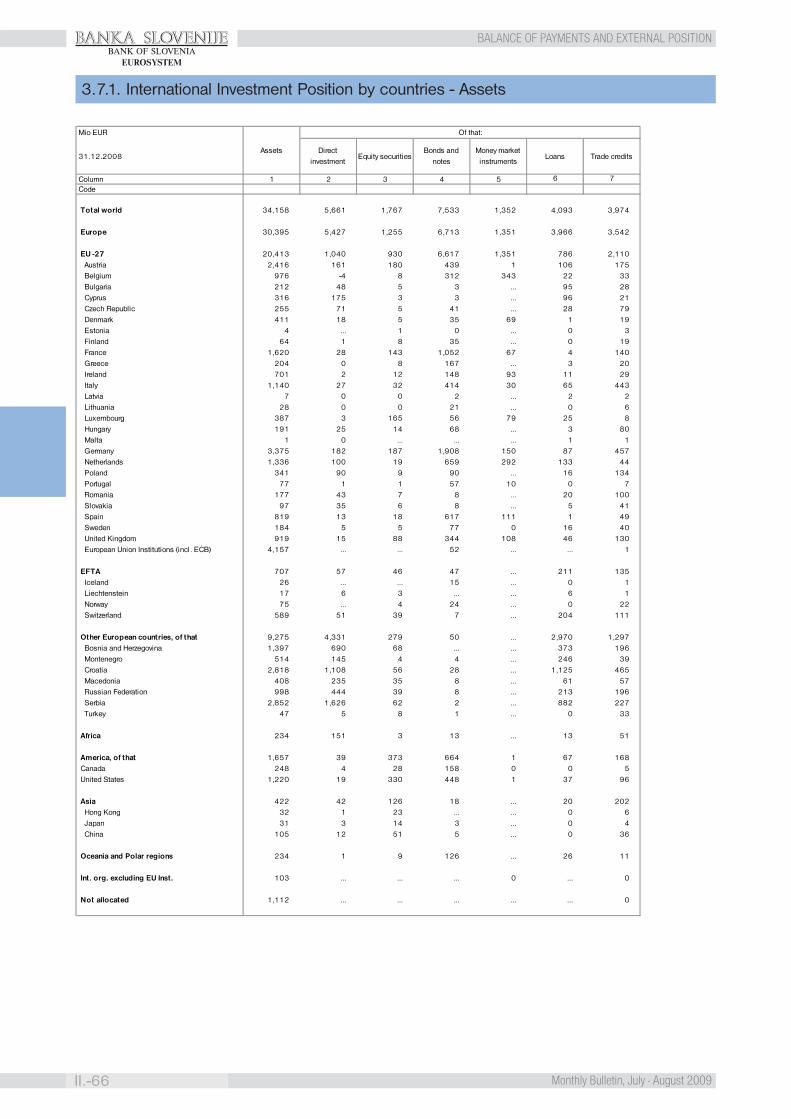
BANKA SLOVENIJE
II.-66 Monthly Bulletin, July - August 2009
BALANCE OF PAYMENTS AND EXTERNAL POSITIONBANK OF SLOVENIA
EUROSYSTEM
3.7.1. International Investment Position by countries - Assets
Mio EUR
31.12.2008
ColumnCode
Total world 34,158 5,661 1,767 7,533 1,352 4,093 3,974
Europe 30,395 5,427 1,255 6,713 1,351 3,966 3,542
EU -27 20,413 1,040 930 6,617 1,351 786 2,110 Austria 2,416 161 180 439 1 106 175 Belgium 976 -4 8 312 343 22 33 Bulgaria 212 48 5 3 ... 95 28 Cyprus 316 175 3 3 ... 96 21 Czech Republic 255 71 5 41 ... 28 79 Denmark 411 18 5 35 69 1 19 Estonia 4 ... 1 0 ... 0 3 Finland 64 1 8 35 ... 0 19 France 1,620 28 143 1,052 67 4 140 Greece 204 0 8 167 ... 3 20 Ireland 701 2 12 148 93 11 29 Italy 1,140 27 32 414 30 65 443 Latvia 7 0 0 2 ... 2 2 Lithuania 28 0 0 21 ... 0 6 Luxembourg 387 3 165 56 79 25 8 Hungary 191 25 14 68 ... 3 80 Malta 1 0 ... ... ... 1 1 Germany 3,375 182 187 1,908 150 87 457 Netherlands 1,336 100 19 659 292 133 44 Poland 341 90 9 90 ... 16 134 Portugal 77 1 1 57 10 0 7 Romania 177 43 7 8 ... 20 100 Slovakia 97 35 6 8 ... 5 41 Spain 819 13 18 617 111 1 49 Sweden 184 5 5 77 0 16 40 United Kingdom 919 15 88 344 108 46 130 European Union Institutions (incl. ECB) 4,157 ... ... 52 ... ... 1
EFTA 707 57 46 47 ... 211 135 Iceland 26 ... ... 15 ... 0 1 Liechtenstein 17 6 3 ... ... 6 1 Norway 75 ... 4 24 ... 0 22 Switzerland 589 51 39 7 ... 204 111
Other European countries, of that 9,275 4,331 279 50 ... 2,970 1,297 Bosnia and Herzegovina 1,397 690 68 ... ... 373 196 Montenegro 514 145 4 4 ... 246 39 Croatia 2,818 1,108 56 28 ... 1,125 465 Macedonia 408 235 35 8 ... 61 57 Russian Federation 998 444 39 8 ... 213 196 Serbia 2,852 1,626 62 2 ... 882 227 Turkey 47 5 8 1 ... 0 33
Africa 234 151 3 13 ... 13 51
America, of that 1,657 39 373 664 1 67 168 Canada 248 4 28 158 0 0 5 United States 1,220 19 330 448 1 37 96
Asia 422 42 126 18 ... 20 202 Hong Kong 32 1 23 ... ... 0 6 Japan 31 3 14 3 ... 0 4 China 105 12 51 5 ... 0 36
Oceania and Polar regions 234 1 9 126 ... 26 11
Int. org. excluding EU Inst. 103 ... ... ... 0 ... 0
Not allocated 1,112 ... ... ... ... ... 0
Bonds and notes
Money market instruments
Loans
6 7
Of that:
1 2 3 4 5
Assets Direct investment
Trade creditsEquity securities
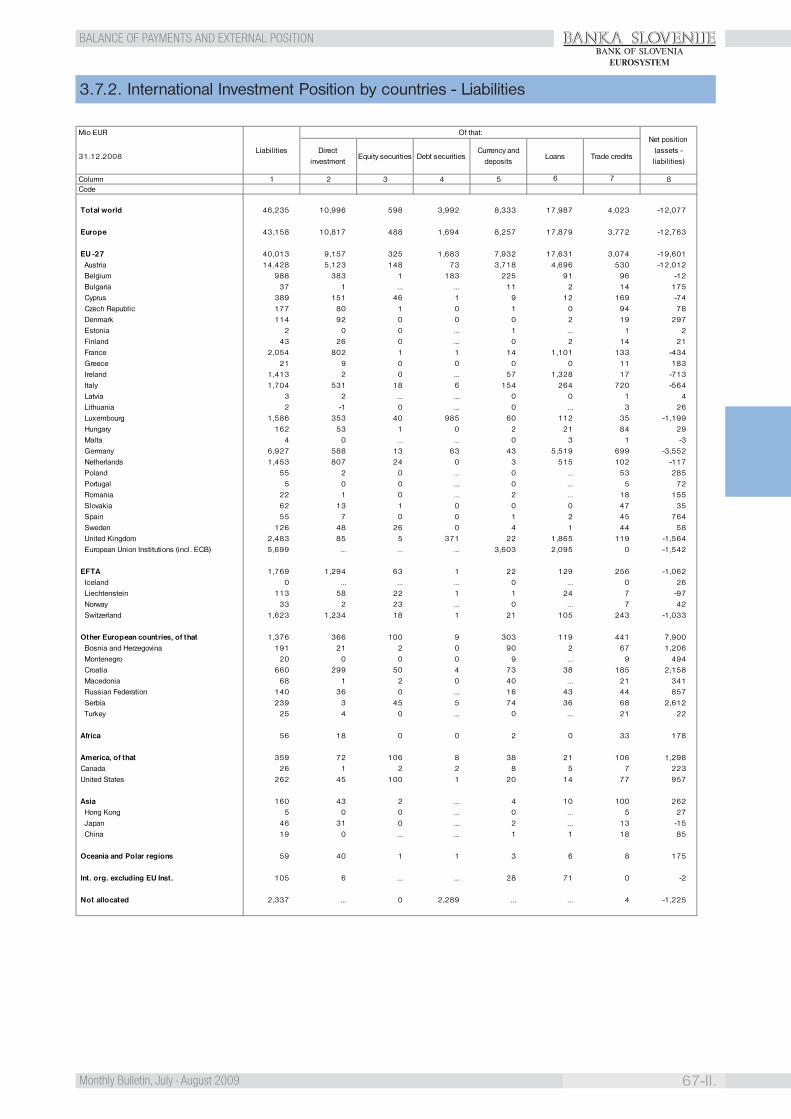
BANKA SLOVENIJE
67-II.Monthly Bulletin, July - August 2009
BALANCE OF PAYMENTS AND EXTERNAL POSITIONBANK OF SLOVENIA
EUROSYSTEM
3.7.2. International Investment Position by countries - Liabilities
Mio EUR
31.12.2008
ColumnCode
Total world 46,235 10,996 598 3,992 8,333 17,987 4,023 -12,077
Europe 43,158 10,817 488 1,694 8,257 17,879 3,772 -12,763
EU -27 40,013 9,157 325 1,683 7,932 17,631 3,074 -19,601 Austria 14,428 5,123 148 73 3,718 4,696 530 -12,012 Belgium 988 383 1 183 225 91 96 -12 Bulgaria 37 1 ... ... 11 2 14 175 Cyprus 389 151 46 1 9 12 169 -74 Czech Republic 177 80 1 0 1 0 94 78 Denmark 114 92 0 0 0 2 19 297 Estonia 2 0 0 ... 1 ... 1 2 Finland 43 26 0 ... 0 2 14 21 France 2,054 802 1 1 14 1,101 133 -434 Greece 21 9 0 0 0 0 11 183 Ireland 1,413 2 0 ... 57 1,328 17 -713 Italy 1,704 531 18 6 154 264 720 -564 Latvia 3 2 ... ... 0 0 1 4 Lithuania 2 -1 0 ... 0 ... 3 26 Luxembourg 1,586 353 40 985 60 112 35 -1,199 Hungary 162 53 1 0 2 21 84 29 Malta 4 0 ... ... 0 3 1 -3 Germany 6,927 588 13 63 43 5,519 699 -3,552 Netherlands 1,453 807 24 0 3 515 102 -117 Poland 55 2 0 ... 0 ... 53 285 Portugal 5 0 0 ... 0 ... 5 72 Romania 22 1 0 ... 2 ... 18 155 Slovakia 62 13 1 0 0 0 47 35 Spain 55 7 0 0 1 2 45 764 Sweden 126 48 26 0 4 1 44 58 United Kingdom 2,483 85 5 371 22 1,865 119 -1,564 European Union Institutions (incl. ECB) 5,699 ... ... ... 3,603 2,095 0 -1,542
EFTA 1,769 1,294 63 1 22 129 256 -1,062 Iceland 0 ... ... ... 0 ... 0 26 Liechtenstein 113 58 22 1 1 24 7 -97 Norway 33 2 23 ... 0 ... 7 42 Switzerland 1,623 1,234 18 1 21 105 243 -1,033
Other European countries, of that 1,376 366 100 9 303 119 441 7,900 Bosnia and Herzegovina 191 21 2 0 90 2 67 1,206 Montenegro 20 0 0 0 9 ... 9 494 Croatia 660 299 50 4 73 38 185 2,158 Macedonia 68 1 2 0 40 ... 21 341 Russian Federation 140 36 0 ... 16 43 44 857 Serbia 239 3 45 5 74 36 68 2,612 Turkey 25 4 0 ... 0 ... 21 22
Africa 56 18 0 0 2 0 33 178
America, of that 359 72 106 8 38 21 106 1,298 Canada 26 1 2 2 8 5 7 223 United States 262 45 100 1 20 14 77 957
Asia 160 43 2 ... 4 10 100 262 Hong Kong 5 0 0 ... 0 ... 5 27 Japan 46 31 0 ... 2 ... 13 -15 China 19 0 ... ... 1 1 18 85
Oceania and Polar regions 59 40 1 1 3 6 8 175
Int. org. excluding EU Inst. 105 6 ... ... 28 71 0 -2
Not allocated 2,337 ... 0 2,289 ... ... 4 -1,225
Liabilities Direct investment
Currency and deposits
LoansEquity securities Debt securities
6 71 2 3
Net position (assets - liabilities)
8
Trade credits
Of that:
4 5
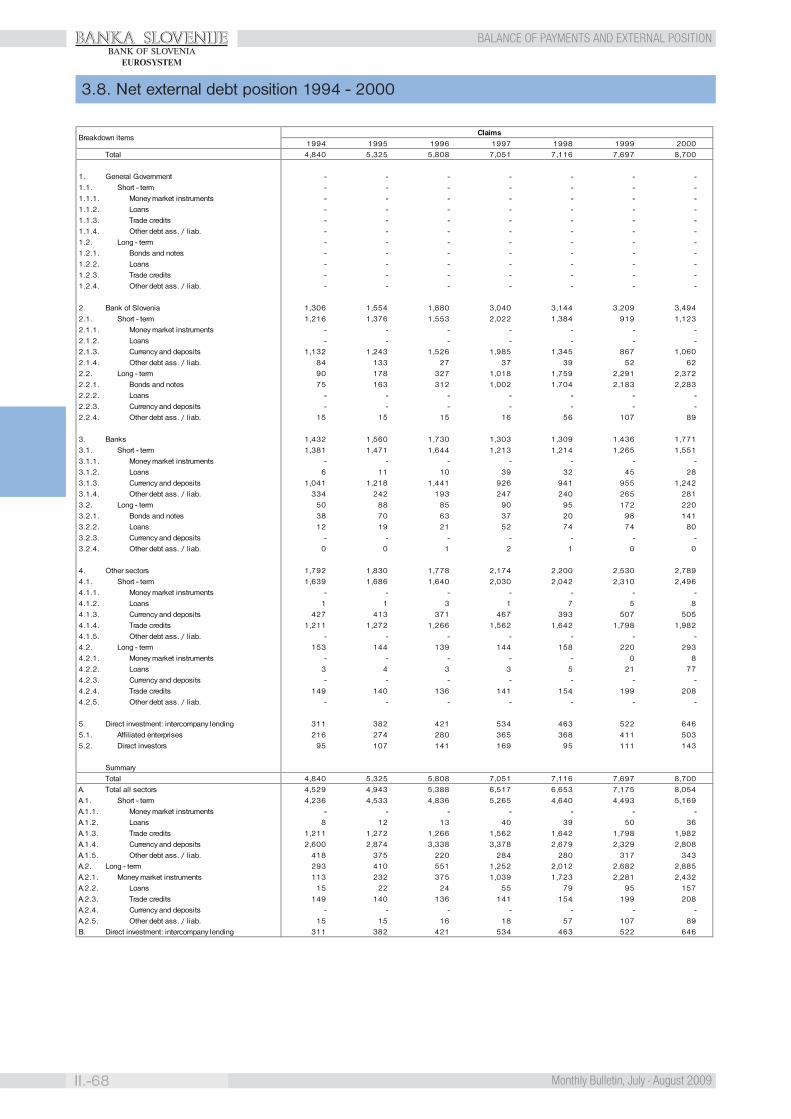
BANKA SLOVENIJE
II.-68 Monthly Bulletin, July - August 2009
BALANCE OF PAYMENTS AND EXTERNAL POSITIONBANK OF SLOVENIA
EUROSYSTEM
3.8. Net external debt position 1994 - 2000
1994 1995 1996 1997 1998 1999 2000Total 4,840 5,325 5,808 7,051 7,116 7,697 8,700
1. General Government - - - - - - -1.1. Short - term - - - - - - -1.1.1. Money market instruments - - - - - - -1.1.2. Loans - - - - - - -1.1.3. Trade credits - - - - - - -1.1.4. Other debt ass. / liab. - - - - - - -1.2. Long - term - - - - - - -1.2.1. Bonds and notes - - - - - - -1.2.2. Loans - - - - - - -1.2.3. Trade credits - - - - - - -1.2.4. Other debt ass. / liab. - - - - - - -
2. Bank of Slovenia 1,306 1,554 1,880 3,040 3,144 3,209 3,4942.1. Short - term 1,216 1,376 1,553 2,022 1,384 919 1,1232.1.1. Money market instruments - - - - - - -2.1.2. Loans - - - - - - -2.1.3. Currency and deposits 1,132 1,243 1,526 1,985 1,345 867 1,0602.1.4. Other debt ass. / liab. 84 133 27 37 39 52 622.2. Long - term 90 178 327 1,018 1,759 2,291 2,3722.2.1. Bonds and notes 75 163 312 1,002 1,704 2,183 2,2832.2.2. Loans - - - - - - -2.2.3. Currency and deposits - - - - - - -2.2.4. Other debt ass. / liab. 15 15 15 16 56 107 89
3. Banks 1,432 1,560 1,730 1,303 1,309 1,436 1,7713.1. Short - term 1,381 1,471 1,644 1,213 1,214 1,265 1,5513.1.1. Money market instruments - - - - - - -3.1.2. Loans 6 11 10 39 32 45 283.1.3. Currency and deposits 1,041 1,218 1,441 926 941 955 1,2423.1.4. Other debt ass. / liab. 334 242 193 247 240 265 2813.2. Long - term 50 88 85 90 95 172 2203.2.1. Bonds and notes 38 70 63 37 20 98 1413.2.2. Loans 12 19 21 52 74 74 803.2.3. Currency and deposits - - - - - - -3.2.4. Other debt ass. / liab. 0 0 1 2 1 0 0
4. Other sectors 1,792 1,830 1,778 2,174 2,200 2,530 2,7894.1. Short - term 1,639 1,686 1,640 2,030 2,042 2,310 2,4964.1.1. Money market instruments - - - - - - -4.1.2. Loans 1 1 3 1 7 5 84.1.3. Currency and deposits 427 413 371 467 393 507 5054.1.4. Trade credits 1,211 1,272 1,266 1,562 1,642 1,798 1,9824.1.5. Other debt ass. / liab. - - - - - - -4.2. Long - term 153 144 139 144 158 220 2934.2.1. Money market instruments - - - - - 0 84.2.2. Loans 3 4 3 3 5 21 774.2.3. Currency and deposits - - - - - - -4.2.4. Trade credits 149 140 136 141 154 199 2084.2.5. Other debt ass. / liab. - - - - - - -
5. Direct investment: intercompany lending 311 382 421 534 463 522 6465.1. Affiliated enterprises 216 274 280 365 368 411 5035.2. Direct investors 95 107 141 169 95 111 143
SummaryTotal 4,840 5,325 5,808 7,051 7,116 7,697 8,700
A. Total all sectors 4,529 4,943 5,388 6,517 6,653 7,175 8,054A.1. Short - term 4,236 4,533 4,836 5,265 4,640 4,493 5,169A.1.1. Money market instruments - - - - - - -A.1.2. Loans 8 12 13 40 39 50 36A.1.3. Trade credits 1,211 1,272 1,266 1,562 1,642 1,798 1,982A.1.4. Currency and deposits 2,600 2,874 3,338 3,378 2,679 2,329 2,808A.1.5. Other debt ass. / liab. 418 375 220 284 280 317 343A.2. Long - term 293 410 551 1,252 2,012 2,682 2,885A.2.1. Money market instruments 113 232 375 1,039 1,723 2,281 2,432A.2.2. Loans 15 22 24 55 79 95 157A.2.3. Trade credits 149 140 136 141 154 199 208A.2.4. Currency and deposits - - - - - - -A.2.5. Other debt ass. / liab. 15 15 16 18 57 107 89B. Direct investment: intercompany lending 311 382 421 534 463 522 646
Breakdown itemsClaims
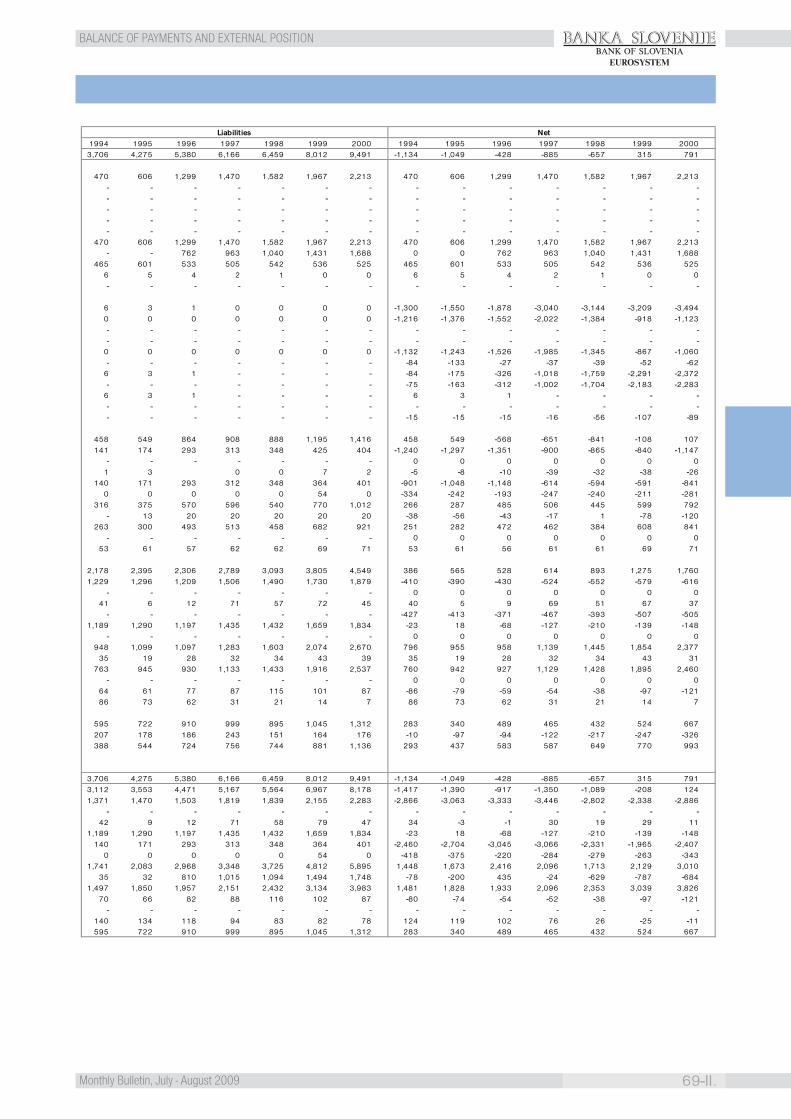
BANKA SLOVENIJE
69-II.Monthly Bulletin, July - August 2009
BALANCE OF PAYMENTS AND EXTERNAL POSITIONBANK OF SLOVENIA
EUROSYSTEM
1994 1995 1996 1997 1998 1999 2000 1994 1995 1996 1997 1998 1999 20003,706 4,275 5,380 6,166 6,459 8,012 9,491 -1,134 -1,049 -428 -885 -657 315 791
470 606 1,299 1,470 1,582 1,967 2,213 470 606 1,299 1,470 1,582 1,967 2,213- - - - - - - - - - - - - -- - - - - - - - - - - - - -- - - - - - - - - - - - - -- - - - - - - - - - - - - -- - - - - - - - - - - - - -
470 606 1,299 1,470 1,582 1,967 2,213 470 606 1,299 1,470 1,582 1,967 2,213- - 762 963 1,040 1,431 1,688 0 0 762 963 1,040 1,431 1,688
465 601 533 505 542 536 525 465 601 533 505 542 536 5256 5 4 2 1 0 0 6 5 4 2 1 0 0- - - - - - - - - - - - - -
6 3 1 0 0 0 0 -1,300 -1,550 -1,878 -3,040 -3,144 -3,209 -3,4940 0 0 0 0 0 0 -1,216 -1,376 -1,552 -2,022 -1,384 -918 -1,123- - - - - - - - - - - - - -- - - - - - - - - - - - - -
0 0 0 0 0 0 0 -1,132 -1,243 -1,526 -1,985 -1,345 -867 -1,060- - - - - - - -84 -133 -27 -37 -39 -52 -62
6 3 1 - - - - -84 -175 -326 -1,018 -1,759 -2,291 -2,372- - - - - - - -75 -163 -312 -1,002 -1,704 -2,183 -2,283
6 3 1 - - - - 6 3 1 - - - -- - - - - - - - - - - - - -- - - - - - - -15 -15 -15 -16 -56 -107 -89
458 549 864 908 888 1,195 1,416 458 549 -568 -651 -841 -108 107141 174 293 313 348 425 404 -1,240 -1,297 -1,351 -900 -865 -840 -1,147
- - - - - - - 0 0 0 0 0 0 01 3 0 0 7 2 -5 -8 -10 -39 -32 -38 -26
140 171 293 312 348 364 401 -901 -1,048 -1,148 -614 -594 -591 -8410 0 0 0 0 54 0 -334 -242 -193 -247 -240 -211 -281
316 375 570 596 540 770 1,012 266 287 485 506 445 599 792- 13 20 20 20 20 20 -38 -56 -43 -17 1 -78 -120
263 300 493 513 458 682 921 251 282 472 462 384 608 841- - - - - - - 0 0 0 0 0 0 0
53 61 57 62 62 69 71 53 61 56 61 61 69 71
2,178 2,395 2,306 2,789 3,093 3,805 4,549 386 565 528 614 893 1,275 1,7601,229 1,296 1,209 1,506 1,490 1,730 1,879 -410 -390 -430 -524 -552 -579 -616
- - - - - - - 0 0 0 0 0 0 041 6 12 71 57 72 45 40 5 9 69 51 67 37
- - - - - - - -427 -413 -371 -467 -393 -507 -5051,189 1,290 1,197 1,435 1,432 1,659 1,834 -23 18 -68 -127 -210 -139 -148
- - - - - - - 0 0 0 0 0 0 0948 1,099 1,097 1,283 1,603 2,074 2,670 796 955 958 1,139 1,445 1,854 2,377
35 19 28 32 34 43 39 35 19 28 32 34 43 31763 945 930 1,133 1,433 1,916 2,537 760 942 927 1,129 1,428 1,895 2,460
- - - - - - - 0 0 0 0 0 0 064 61 77 87 115 101 87 -86 -79 -59 -54 -38 -97 -12186 73 62 31 21 14 7 86 73 62 31 21 14 7
595 722 910 999 895 1,045 1,312 283 340 489 465 432 524 667207 178 186 243 151 164 176 -10 -97 -94 -122 -217 -247 -326388 544 724 756 744 881 1,136 293 437 583 587 649 770 993
3,706 4,275 5,380 6,166 6,459 8,012 9,491 -1,134 -1,049 -428 -885 -657 315 7913,112 3,553 4,471 5,167 5,564 6,967 8,178 -1,417 -1,390 -917 -1,350 -1,089 -208 1241,371 1,470 1,503 1,819 1,839 2,155 2,283 -2,866 -3,063 -3,333 -3,446 -2,802 -2,338 -2,886
- - - - - - - - - - - - - -42 9 12 71 58 79 47 34 -3 -1 30 19 29 11
1,189 1,290 1,197 1,435 1,432 1,659 1,834 -23 18 -68 -127 -210 -139 -148140 171 293 313 348 364 401 -2,460 -2,704 -3,045 -3,066 -2,331 -1,965 -2,407
0 0 0 0 0 54 0 -418 -375 -220 -284 -279 -263 -3431,741 2,083 2,968 3,348 3,725 4,812 5,895 1,448 1,673 2,416 2,096 1,713 2,129 3,010
35 32 810 1,015 1,094 1,494 1,748 -78 -200 435 -24 -629 -787 -6841,497 1,850 1,957 2,151 2,432 3,134 3,983 1,481 1,828 1,933 2,096 2,353 3,039 3,826
70 66 82 88 116 102 87 -80 -74 -54 -52 -38 -97 -121- - - - - - - - - - - - - -
140 134 118 94 83 82 78 124 119 102 76 26 -25 -11595 722 910 999 895 1,045 1,312 283 340 489 465 432 524 667
Liabilities Net
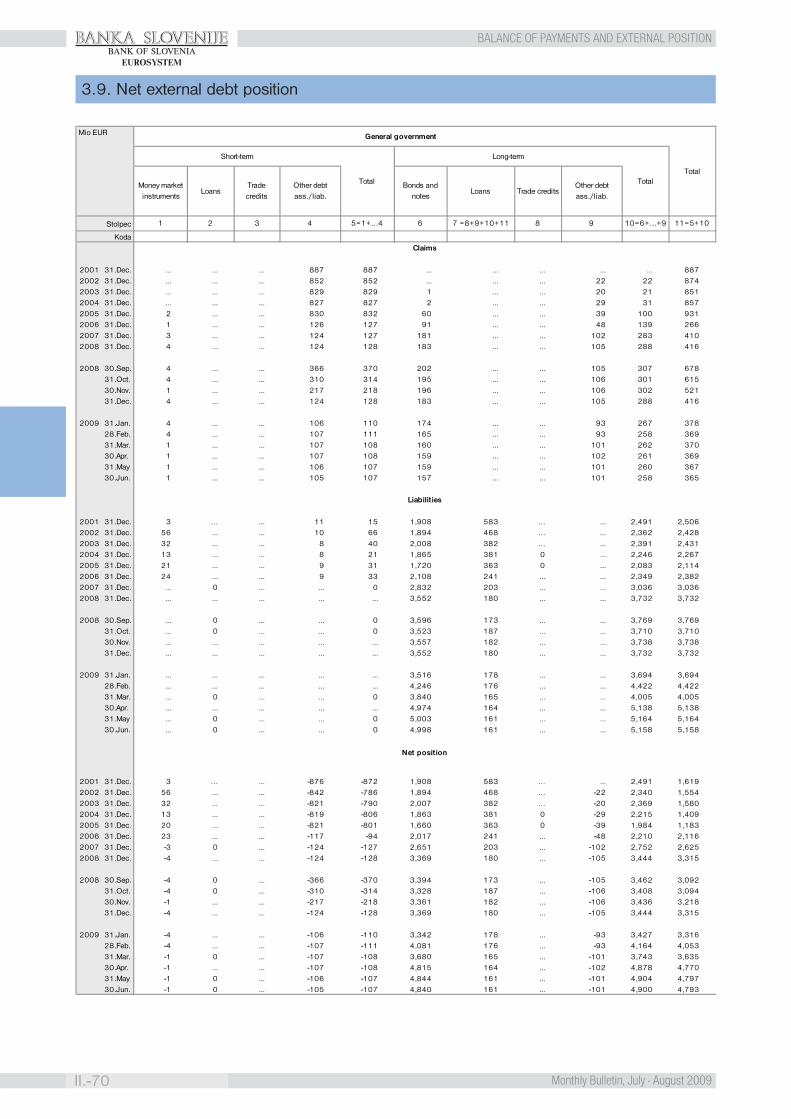
BANKA SLOVENIJE
II.-70 Monthly Bulletin, July - August 2009
BALANCE OF PAYMENTS AND EXTERNAL POSITIONBANK OF SLOVENIA
EUROSYSTEM
3.9. Net external debt position
Stolpec
Koda 2001 31.Dec. ... ... ... 887 887 ... ... ... ... ... 8872002 31.Dec. ... ... ... 852 852 ... ... ... 22 22 8742003 31.Dec. ... ... ... 829 829 1 ... ... 20 21 8512004 31.Dec. ... ... ... 827 827 2 ... ... 29 31 8572005 31.Dec. 2 ... ... 830 832 60 ... ... 39 100 9312006 31.Dec. 1 ... ... 126 127 91 ... ... 48 139 2662007 31.Dec. 3 ... ... 124 127 181 ... ... 102 283 4102008 31.Dec. 4 ... ... 124 128 183 ... ... 105 288 416
2008 30.Sep. 4 ... ... 366 370 202 ... ... 105 307 67831.Oct. 4 ... ... 310 314 195 ... ... 106 301 61530.Nov. 1 ... ... 217 218 196 ... ... 106 302 52131.Dec. 4 ... ... 124 128 183 ... ... 105 288 416
2009 31.Jan. 4 ... ... 106 110 174 ... ... 93 267 37828.Feb. 4 ... ... 107 111 165 ... ... 93 258 36931.Mar. 1 ... ... 107 108 160 ... ... 101 262 37030.Apr. 1 ... ... 107 108 159 ... ... 102 261 36931.May 1 ... ... 106 107 159 ... ... 101 260 36730.Jun. 1 ... ... 105 107 157 ... ... 101 258 365
2001 31.Dec. 3 … ... 11 15 1,908 583 … ... 2,491 2,5062002 31.Dec. 56 ... ... 10 66 1,894 468 … ... 2,362 2,4282003 31.Dec. 32 ... ... 8 40 2,008 382 … ... 2,391 2,4312004 31.Dec. 13 ... ... 8 21 1,865 381 0 ... 2,246 2,2672005 31.Dec. 21 ... ... 9 31 1,720 363 0 ... 2,083 2,1142006 31.Dec. 24 ... ... 9 33 2,108 241 ... ... 2,349 2,3822007 31.Dec. ... 0 ... ... 0 2,832 203 ... ... 3,036 3,0362008 31.Dec. ... ... ... ... ... 3,552 180 ... ... 3,732 3,732
2008 30.Sep. ... 0 ... ... 0 3,596 173 ... ... 3,769 3,76931.Oct. ... 0 ... ... 0 3,523 187 ... ... 3,710 3,71030.Nov. ... ... ... ... ... 3,557 182 ... ... 3,738 3,73831.Dec. ... ... ... ... ... 3,552 180 ... ... 3,732 3,732
2009 31.Jan. ... ... ... ... ... 3,516 178 ... ... 3,694 3,69428.Feb. ... ... ... ... ... 4,246 176 ... ... 4,422 4,42231.Mar. ... 0 ... ... 0 3,840 165 ... ... 4,005 4,00530.Apr. ... ... ... ... ... 4,974 164 ... ... 5,138 5,13831.May ... 0 ... ... 0 5,003 161 ... ... 5,164 5,16430.Jun. ... 0 ... ... 0 4,998 161 ... ... 5,158 5,158
2001 31.Dec. 3 … ... -876 -872 1,908 583 … ... 2,491 1,6192002 31.Dec. 56 ... ... -842 -786 1,894 468 … -22 2,340 1,5542003 31.Dec. 32 ... ... -821 -790 2,007 382 … -20 2,369 1,5802004 31.Dec. 13 ... ... -819 -806 1,863 381 0 -29 2,215 1,4092005 31.Dec. 20 ... ... -821 -801 1,660 363 0 -39 1,984 1,1832006 31.Dec. 23 ... ... -117 -94 2,017 241 ... -48 2,210 2,1162007 31.Dec. -3 0 ... -124 -127 2,651 203 ... -102 2,752 2,6252008 31.Dec. -4 ... ... -124 -128 3,369 180 ... -105 3,444 3,315
2008 30.Sep. -4 0 ... -366 -370 3,394 173 ... -105 3,462 3,09231.Oct. -4 0 ... -310 -314 3,328 187 ... -106 3,408 3,09430.Nov. -1 ... ... -217 -218 3,361 182 ... -106 3,436 3,21831.Dec. -4 ... ... -124 -128 3,369 180 ... -105 3,444 3,315
2009 31.Jan. -4 ... ... -106 -110 3,342 178 ... -93 3,427 3,31628.Feb. -4 ... ... -107 -111 4,081 176 ... -93 4,164 4,05331.Mar. -1 0 ... -107 -108 3,680 165 ... -101 3,743 3,63530.Apr. -1 ... ... -107 -108 4,815 164 ... -102 4,878 4,77031.May -1 0 ... -106 -107 4,844 161 ... -101 4,904 4,79730.Jun. -1 0 ... -105 -107 4,840 161 ... -101 4,900 4,793
Mio EUR General government
Total
LoansTrade credits
Other debt ass./liab.
Bonds and notes
Loans Trade credits
Short-term
Total
Long-term
TotalMoney market instruments
Other debt ass./liab.
1 2 3 4 5=1+…4 6 7 =8+9+10+11 8 9 10=6+…+9 11=5+10
Liabilities
Net position
Claims
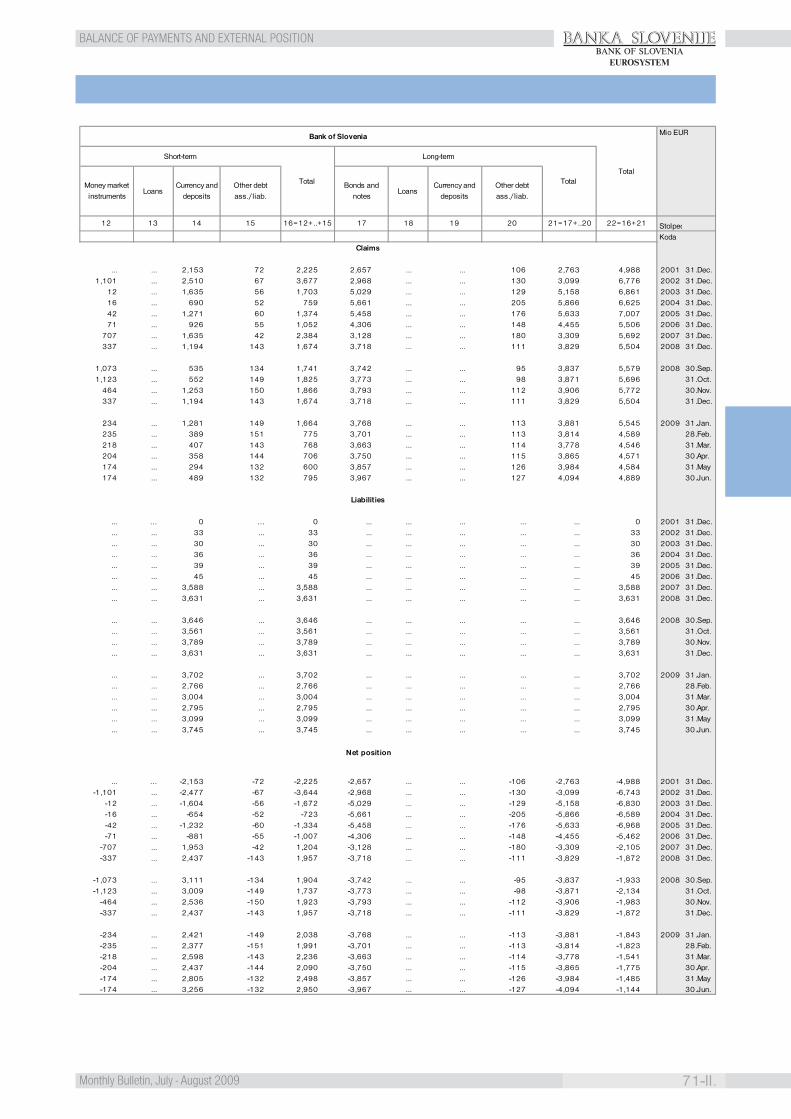
BANKA SLOVENIJE
71-II.Monthly Bulletin, July - August 2009
BALANCE OF PAYMENTS AND EXTERNAL POSITIONBANK OF SLOVENIA
EUROSYSTEM
Stolpec
Koda
... ... 2,153 72 2,225 2,657 ... ... 106 2,763 4,988 2001 31.Dec.1,101 ... 2,510 67 3,677 2,968 ... ... 130 3,099 6,776 2002 31.Dec.
12 ... 1,635 56 1,703 5,029 ... ... 129 5,158 6,861 2003 31.Dec.16 ... 690 52 759 5,661 ... ... 205 5,866 6,625 2004 31.Dec.42 ... 1,271 60 1,374 5,458 ... ... 176 5,633 7,007 2005 31.Dec.71 ... 926 55 1,052 4,306 ... ... 148 4,455 5,506 2006 31.Dec.
707 ... 1,635 42 2,384 3,128 ... ... 180 3,309 5,692 2007 31.Dec.337 ... 1,194 143 1,674 3,718 ... ... 111 3,829 5,504 2008 31.Dec.
1,073 ... 535 134 1,741 3,742 ... ... 95 3,837 5,579 2008 30.Sep.1,123 ... 552 149 1,825 3,773 ... ... 98 3,871 5,696 31.Oct.
464 ... 1,253 150 1,866 3,793 ... ... 112 3,906 5,772 30.Nov.337 ... 1,194 143 1,674 3,718 ... ... 111 3,829 5,504 31.Dec.
234 ... 1,281 149 1,664 3,768 ... ... 113 3,881 5,545 2009 31.Jan.235 ... 389 151 775 3,701 ... ... 113 3,814 4,589 28.Feb.218 ... 407 143 768 3,663 ... ... 114 3,778 4,546 31.Mar.204 ... 358 144 706 3,750 ... ... 115 3,865 4,571 30.Apr.174 ... 294 132 600 3,857 ... ... 126 3,984 4,584 31.May174 ... 489 132 795 3,967 ... ... 127 4,094 4,889 30.Jun.
... … 0 … 0 ... ... ... ... ... 0 2001 31.Dec.
... ... 33 ... 33 ... ... ... ... ... 33 2002 31.Dec.
... ... 30 ... 30 ... ... ... ... ... 30 2003 31.Dec.
... ... 36 ... 36 ... ... ... ... ... 36 2004 31.Dec.
... ... 39 ... 39 ... ... ... ... ... 39 2005 31.Dec.
... ... 45 ... 45 ... ... ... ... ... 45 2006 31.Dec.
... ... 3,588 ... 3,588 ... ... ... ... ... 3,588 2007 31.Dec.
... ... 3,631 ... 3,631 ... ... ... ... ... 3,631 2008 31.Dec.
... ... 3,646 ... 3,646 ... ... ... ... ... 3,646 2008 30.Sep.
... ... 3,561 ... 3,561 ... ... ... ... ... 3,561 31.Oct.
... ... 3,789 ... 3,789 ... ... ... ... ... 3,789 30.Nov.
... ... 3,631 ... 3,631 ... ... ... ... ... 3,631 31.Dec.
... ... 3,702 ... 3,702 ... ... ... ... ... 3,702 2009 31.Jan.
... ... 2,766 ... 2,766 ... ... ... ... ... 2,766 28.Feb.
... ... 3,004 ... 3,004 ... ... ... ... ... 3,004 31.Mar.
... ... 2,795 ... 2,795 ... ... ... ... ... 2,795 30.Apr.
... ... 3,099 ... 3,099 ... ... ... ... ... 3,099 31.May
... ... 3,745 ... 3,745 ... ... ... ... ... 3,745 30.Jun.
... … -2,153 -72 -2,225 -2,657 ... ... -106 -2,763 -4,988 2001 31.Dec.-1,101 ... -2,477 -67 -3,644 -2,968 ... ... -130 -3,099 -6,743 2002 31.Dec.
-12 ... -1,604 -56 -1,672 -5,029 ... ... -129 -5,158 -6,830 2003 31.Dec.-16 ... -654 -52 -723 -5,661 ... ... -205 -5,866 -6,589 2004 31.Dec.-42 ... -1,232 -60 -1,334 -5,458 ... ... -176 -5,633 -6,968 2005 31.Dec.-71 ... -881 -55 -1,007 -4,306 ... ... -148 -4,455 -5,462 2006 31.Dec.
-707 ... 1,953 -42 1,204 -3,128 ... ... -180 -3,309 -2,105 2007 31.Dec.-337 ... 2,437 -143 1,957 -3,718 ... ... -111 -3,829 -1,872 2008 31.Dec.
-1,073 ... 3,111 -134 1,904 -3,742 ... ... -95 -3,837 -1,933 2008 30.Sep.-1,123 ... 3,009 -149 1,737 -3,773 ... ... -98 -3,871 -2,134 31.Oct.
-464 ... 2,536 -150 1,923 -3,793 ... ... -112 -3,906 -1,983 30.Nov.-337 ... 2,437 -143 1,957 -3,718 ... ... -111 -3,829 -1,872 31.Dec.
-234 ... 2,421 -149 2,038 -3,768 ... ... -113 -3,881 -1,843 2009 31.Jan.-235 ... 2,377 -151 1,991 -3,701 ... ... -113 -3,814 -1,823 28.Feb.-218 ... 2,598 -143 2,236 -3,663 ... ... -114 -3,778 -1,541 31.Mar.-204 ... 2,437 -144 2,090 -3,750 ... ... -115 -3,865 -1,775 30.Apr.-174 ... 2,805 -132 2,498 -3,857 ... ... -126 -3,984 -1,485 31.May-174 ... 3,256 -132 2,950 -3,967 ... ... -127 -4,094 -1,144 30.Jun.
Bank of Slovenia
Total
Short-term
Total
Long-term
TotalMoney market instruments
LoansCurrency and
depositsOther debt ass./liab.
Bonds and notes
LoansCurrency and
depositsOther debt ass./liab.
18 1914 15 16=12+..+15 17 22=16+2121=17+..2012 13 20
Mio EUR
Liabilities
Net position
Claims
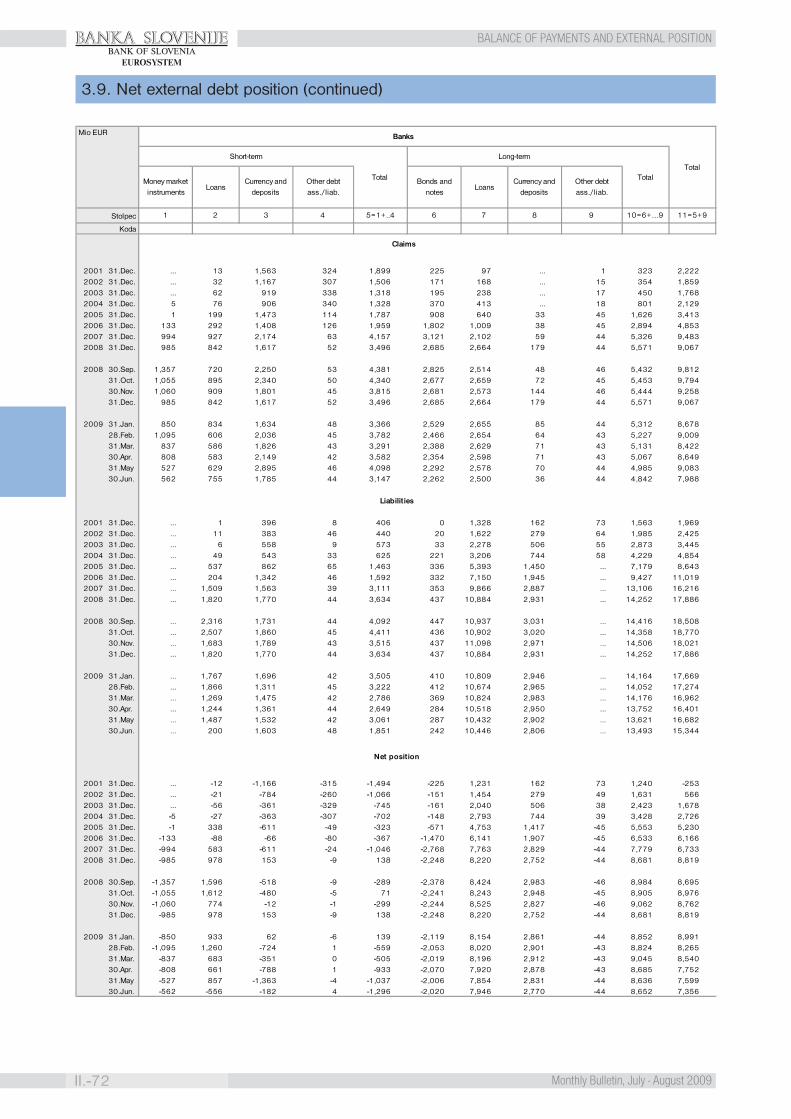
BANKA SLOVENIJE
II.-72 Monthly Bulletin, July - August 2009
BALANCE OF PAYMENTS AND EXTERNAL POSITIONBANK OF SLOVENIA
EUROSYSTEM
3.9. Net external debt position (continued)
Stolpec
Koda
2001 31.Dec. ... 13 1,563 324 1,899 225 97 ... 1 323 2,2222002 31.Dec. ... 32 1,167 307 1,506 171 168 ... 15 354 1,8592003 31.Dec. ... 62 919 338 1,318 195 238 ... 17 450 1,7682004 31.Dec. 5 76 906 340 1,328 370 413 ... 18 801 2,1292005 31.Dec. 1 199 1,473 114 1,787 908 640 33 45 1,626 3,4132006 31.Dec. 133 292 1,408 126 1,959 1,802 1,009 38 45 2,894 4,8532007 31.Dec. 994 927 2,174 63 4,157 3,121 2,102 59 44 5,326 9,4832008 31.Dec. 985 842 1,617 52 3,496 2,685 2,664 179 44 5,571 9,067
2008 30.Sep. 1,357 720 2,250 53 4,381 2,825 2,514 48 46 5,432 9,81231.Oct. 1,055 895 2,340 50 4,340 2,677 2,659 72 45 5,453 9,79430.Nov. 1,060 909 1,801 45 3,815 2,681 2,573 144 46 5,444 9,25831.Dec. 985 842 1,617 52 3,496 2,685 2,664 179 44 5,571 9,067
2009 31.Jan. 850 834 1,634 48 3,366 2,529 2,655 85 44 5,312 8,67828.Feb. 1,095 606 2,036 45 3,782 2,466 2,654 64 43 5,227 9,00931.Mar. 837 586 1,826 43 3,291 2,388 2,629 71 43 5,131 8,42230.Apr. 808 583 2,149 42 3,582 2,354 2,598 71 43 5,067 8,64931.May 527 629 2,895 46 4,098 2,292 2,578 70 44 4,985 9,08330.Jun. 562 755 1,785 44 3,147 2,262 2,500 36 44 4,842 7,988
2001 31.Dec. ... 1 396 8 406 0 1,328 162 73 1,563 1,9692002 31.Dec. ... 11 383 46 440 20 1,622 279 64 1,985 2,4252003 31.Dec. ... 6 558 9 573 33 2,278 506 55 2,873 3,4452004 31.Dec. ... 49 543 33 625 221 3,206 744 58 4,229 4,8542005 31.Dec. ... 537 862 65 1,463 336 5,393 1,450 ... 7,179 8,6432006 31.Dec. ... 204 1,342 46 1,592 332 7,150 1,945 ... 9,427 11,0192007 31.Dec. ... 1,509 1,563 39 3,111 353 9,866 2,887 ... 13,106 16,2162008 31.Dec. ... 1,820 1,770 44 3,634 437 10,884 2,931 ... 14,252 17,886
2008 30.Sep. ... 2,316 1,731 44 4,092 447 10,937 3,031 ... 14,416 18,50831.Oct. ... 2,507 1,860 45 4,411 436 10,902 3,020 ... 14,358 18,77030.Nov. ... 1,683 1,789 43 3,515 437 11,098 2,971 ... 14,506 18,02131.Dec. ... 1,820 1,770 44 3,634 437 10,884 2,931 ... 14,252 17,886
2009 31.Jan. ... 1,767 1,696 42 3,505 410 10,809 2,946 ... 14,164 17,66928.Feb. ... 1,866 1,311 45 3,222 412 10,674 2,965 ... 14,052 17,27431.Mar. ... 1,269 1,475 42 2,786 369 10,824 2,983 ... 14,176 16,96230.Apr. ... 1,244 1,361 44 2,649 284 10,518 2,950 ... 13,752 16,40131.May ... 1,487 1,532 42 3,061 287 10,432 2,902 ... 13,621 16,68230.Jun. ... 200 1,603 48 1,851 242 10,446 2,806 ... 13,493 15,344
2001 31.Dec. ... -12 -1,166 -315 -1,494 -225 1,231 162 73 1,240 -2532002 31.Dec. ... -21 -784 -260 -1,066 -151 1,454 279 49 1,631 5662003 31.Dec. ... -56 -361 -329 -745 -161 2,040 506 38 2,423 1,6782004 31.Dec. -5 -27 -363 -307 -702 -148 2,793 744 39 3,428 2,7262005 31.Dec. -1 338 -611 -49 -323 -571 4,753 1,417 -45 5,553 5,2302006 31.Dec. -133 -88 -66 -80 -367 -1,470 6,141 1,907 -45 6,533 6,1662007 31.Dec. -994 583 -611 -24 -1,046 -2,768 7,763 2,829 -44 7,779 6,7332008 31.Dec. -985 978 153 -9 138 -2,248 8,220 2,752 -44 8,681 8,819
2008 30.Sep. -1,357 1,596 -518 -9 -289 -2,378 8,424 2,983 -46 8,984 8,69531.Oct. -1,055 1,612 -480 -5 71 -2,241 8,243 2,948 -45 8,905 8,97630.Nov. -1,060 774 -12 -1 -299 -2,244 8,525 2,827 -46 9,062 8,76231.Dec. -985 978 153 -9 138 -2,248 8,220 2,752 -44 8,681 8,819
2009 31.Jan. -850 933 62 -6 139 -2,119 8,154 2,861 -44 8,852 8,99128.Feb. -1,095 1,260 -724 1 -559 -2,053 8,020 2,901 -43 8,824 8,26531.Mar. -837 683 -351 0 -505 -2,019 8,196 2,912 -43 9,045 8,54030.Apr. -808 661 -788 1 -933 -2,070 7,920 2,878 -43 8,685 7,75231.May -527 857 -1,363 -4 -1,037 -2,006 7,854 2,831 -44 8,636 7,59930.Jun. -562 -556 -182 4 -1,296 -2,020 7,946 2,770 -44 8,652 7,356
Claims
Liabilities
Net position
9 10=6+…9 11=5+95=1+..4 6 7 81 2 3 4
Other debt ass./liab.
Short-term
Total
Long-term
TotalMoney market instruments
Mio EUR Banks
Total
LoansCurrency and
depositsOther debt ass./liab.
Bonds and notes
LoansCurrency and
deposits
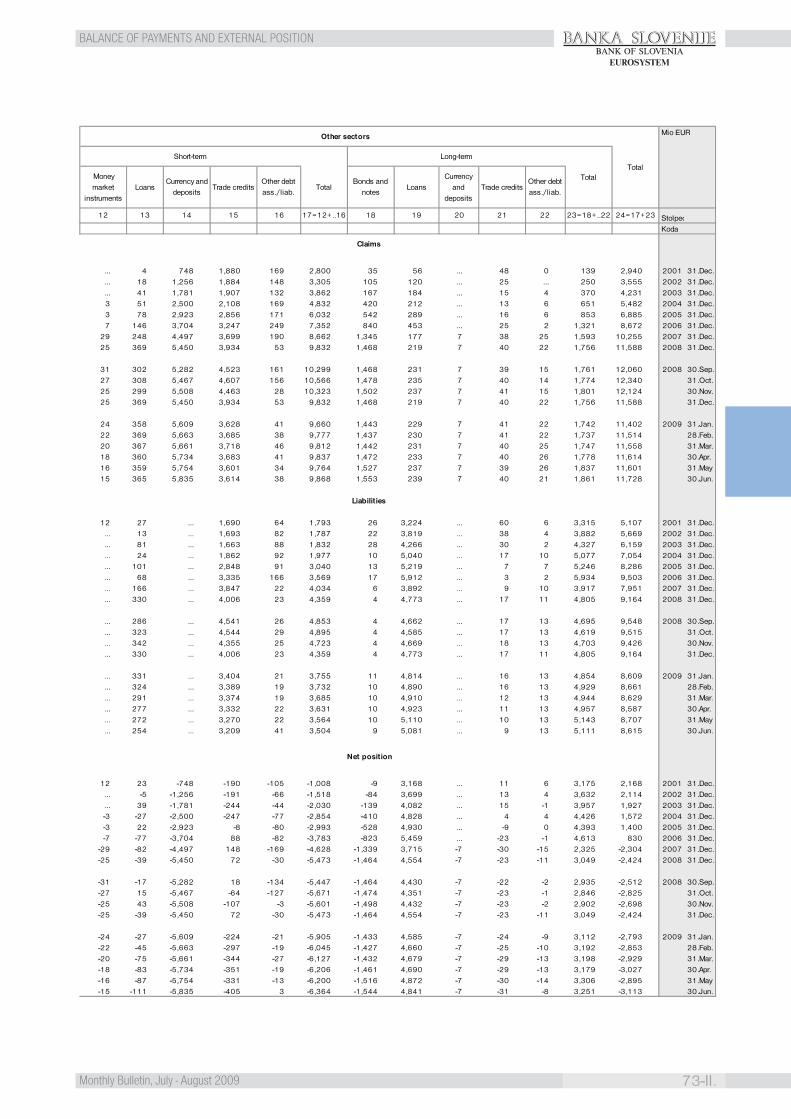
BANKA SLOVENIJE
73-II.Monthly Bulletin, July - August 2009
BALANCE OF PAYMENTS AND EXTERNAL POSITIONBANK OF SLOVENIA
EUROSYSTEM
Stolpec
Koda
... 4 748 1,880 169 2,800 35 56 ... 48 0 139 2,940 2001 31.Dec.
... 18 1,256 1,884 148 3,305 105 120 ... 25 ... 250 3,555 2002 31.Dec.
... 41 1,781 1,907 132 3,862 167 184 ... 15 4 370 4,231 2003 31.Dec.3 51 2,500 2,108 169 4,832 420 212 ... 13 6 651 5,482 2004 31.Dec.3 78 2,923 2,856 171 6,032 542 289 ... 16 6 853 6,885 2005 31.Dec.7 146 3,704 3,247 249 7,352 840 453 ... 25 2 1,321 8,672 2006 31.Dec.
29 248 4,497 3,699 190 8,662 1,345 177 7 38 25 1,593 10,255 2007 31.Dec.25 369 5,450 3,934 53 9,832 1,468 219 7 40 22 1,756 11,588 2008 31.Dec.
31 302 5,282 4,523 161 10,299 1,468 231 7 39 15 1,761 12,060 2008 30.Sep.27 308 5,467 4,607 156 10,566 1,478 235 7 40 14 1,774 12,340 31.Oct.25 299 5,508 4,463 28 10,323 1,502 237 7 41 15 1,801 12,124 30.Nov.25 369 5,450 3,934 53 9,832 1,468 219 7 40 22 1,756 11,588 31.Dec.
24 358 5,609 3,628 41 9,660 1,443 229 7 41 22 1,742 11,402 2009 31.Jan.22 369 5,663 3,685 38 9,777 1,437 230 7 41 22 1,737 11,514 28.Feb.20 367 5,661 3,718 46 9,812 1,442 231 7 40 25 1,747 11,558 31.Mar.18 360 5,734 3,683 41 9,837 1,472 233 7 40 26 1,778 11,614 30.Apr.16 359 5,754 3,601 34 9,764 1,527 237 7 39 26 1,837 11,601 31.May15 365 5,835 3,614 38 9,868 1,553 239 7 40 21 1,861 11,728 30.Jun.
12 27 ... 1,690 64 1,793 26 3,224 ... 60 6 3,315 5,107 2001 31.Dec.... 13 ... 1,693 82 1,787 22 3,819 ... 38 4 3,882 5,669 2002 31.Dec.... 81 ... 1,663 88 1,832 28 4,266 ... 30 2 4,327 6,159 2003 31.Dec.... 24 ... 1,862 92 1,977 10 5,040 ... 17 10 5,077 7,054 2004 31.Dec.... 101 ... 2,848 91 3,040 13 5,219 ... 7 7 5,246 8,286 2005 31.Dec.... 68 ... 3,335 166 3,569 17 5,912 ... 3 2 5,934 9,503 2006 31.Dec.... 166 ... 3,847 22 4,034 6 3,892 ... 9 10 3,917 7,951 2007 31.Dec.... 330 ... 4,006 23 4,359 4 4,773 ... 17 11 4,805 9,164 2008 31.Dec.
... 286 ... 4,541 26 4,853 4 4,662 ... 17 13 4,695 9,548 2008 30.Sep.
... 323 ... 4,544 29 4,895 4 4,585 ... 17 13 4,619 9,515 31.Oct.
... 342 ... 4,355 25 4,723 4 4,669 ... 18 13 4,703 9,426 30.Nov.
... 330 ... 4,006 23 4,359 4 4,773 ... 17 11 4,805 9,164 31.Dec.
... 331 ... 3,404 21 3,755 11 4,814 ... 16 13 4,854 8,609 2009 31.Jan.
... 324 ... 3,389 19 3,732 10 4,890 ... 16 13 4,929 8,661 28.Feb.
... 291 ... 3,374 19 3,685 10 4,910 ... 12 13 4,944 8,629 31.Mar.
... 277 ... 3,332 22 3,631 10 4,923 ... 11 13 4,957 8,587 30.Apr.
... 272 ... 3,270 22 3,564 10 5,110 ... 10 13 5,143 8,707 31.May
... 254 ... 3,209 41 3,504 9 5,081 ... 9 13 5,111 8,615 30.Jun.
12 23 -748 -190 -105 -1,008 -9 3,168 ... 11 6 3,175 2,168 2001 31.Dec.... -5 -1,256 -191 -66 -1,518 -84 3,699 ... 13 4 3,632 2,114 2002 31.Dec.... 39 -1,781 -244 -44 -2,030 -139 4,082 ... 15 -1 3,957 1,927 2003 31.Dec.-3 -27 -2,500 -247 -77 -2,854 -410 4,828 ... 4 4 4,426 1,572 2004 31.Dec.-3 22 -2,923 -8 -80 -2,993 -528 4,930 ... -9 0 4,393 1,400 2005 31.Dec.-7 -77 -3,704 88 -82 -3,783 -823 5,459 ... -23 -1 4,613 830 2006 31.Dec.
-29 -82 -4,497 148 -169 -4,628 -1,339 3,715 -7 -30 -15 2,325 -2,304 2007 31.Dec.-25 -39 -5,450 72 -30 -5,473 -1,464 4,554 -7 -23 -11 3,049 -2,424 2008 31.Dec.
-31 -17 -5,282 18 -134 -5,447 -1,464 4,430 -7 -22 -2 2,935 -2,512 2008 30.Sep.-27 15 -5,467 -64 -127 -5,671 -1,474 4,351 -7 -23 -1 2,846 -2,825 31.Oct.-25 43 -5,508 -107 -3 -5,601 -1,498 4,432 -7 -23 -2 2,902 -2,698 30.Nov.-25 -39 -5,450 72 -30 -5,473 -1,464 4,554 -7 -23 -11 3,049 -2,424 31.Dec.
-24 -27 -5,609 -224 -21 -5,905 -1,433 4,585 -7 -24 -9 3,112 -2,793 2009 31.Jan.-22 -45 -5,663 -297 -19 -6,045 -1,427 4,660 -7 -25 -10 3,192 -2,853 28.Feb.-20 -75 -5,661 -344 -27 -6,127 -1,432 4,679 -7 -29 -13 3,198 -2,929 31.Mar.-18 -83 -5,734 -351 -19 -6,206 -1,461 4,690 -7 -29 -13 3,179 -3,027 30.Apr.-16 -87 -5,754 -331 -13 -6,200 -1,516 4,872 -7 -30 -14 3,306 -2,895 31.May-15 -111 -5,835 -405 3 -6,364 -1,544 4,841 -7 -31 -8 3,251 -3,113 30.Jun.
Net position
Claims
Liabilities
21 22 23=18+..22 24=17+2317=12+..16 18 19 2013 14 15 1612
LoansCurrency
and deposits
Trade creditsOther debt ass./liab.
Trade creditsOther debt ass./liab.
TotalBonds and
notes
Money market
instrumentsLoans
Currency and deposits
Total
Mio EUR
Short-term Long-term
Total
Other sectors
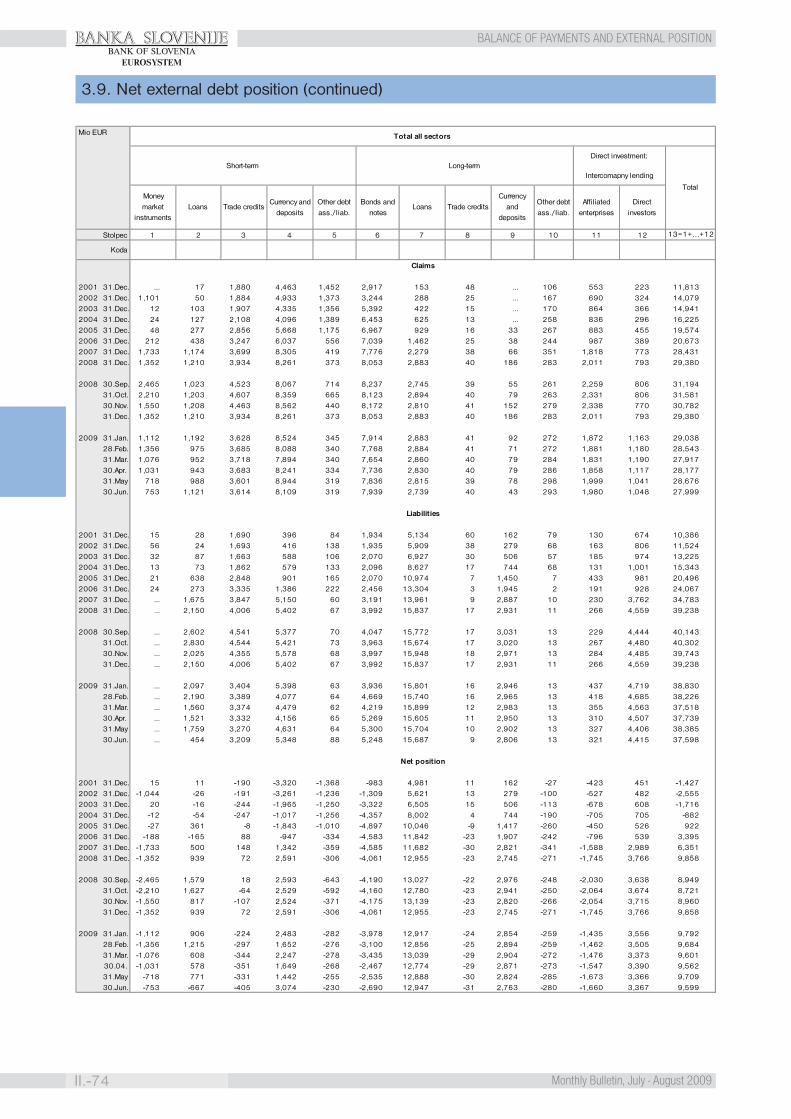
BANKA SLOVENIJE
II.-74 Monthly Bulletin, July - August 2009
BALANCE OF PAYMENTS AND EXTERNAL POSITIONBANK OF SLOVENIA
EUROSYSTEM
3.9. Net external debt position (continued)
Stolpec
Koda
2001 31.Dec. ... 17 1,880 4,463 1,452 2,917 153 48 ... 106 553 223 11,8132002 31.Dec. 1,101 50 1,884 4,933 1,373 3,244 288 25 ... 167 690 324 14,0792003 31.Dec. 12 103 1,907 4,335 1,356 5,392 422 15 ... 170 864 366 14,9412004 31.Dec. 24 127 2,108 4,096 1,389 6,453 625 13 ... 258 836 296 16,2252005 31.Dec. 48 277 2,856 5,668 1,175 6,967 929 16 33 267 883 455 19,5742006 31.Dec. 212 438 3,247 6,037 556 7,039 1,462 25 38 244 987 389 20,6732007 31.Dec. 1,733 1,174 3,699 8,305 419 7,776 2,279 38 66 351 1,818 773 28,4312008 31.Dec. 1,352 1,210 3,934 8,261 373 8,053 2,883 40 186 283 2,011 793 29,380
2008 30.Sep. 2,465 1,023 4,523 8,067 714 8,237 2,745 39 55 261 2,259 806 31,19431.Oct. 2,210 1,203 4,607 8,359 665 8,123 2,894 40 79 263 2,331 806 31,58130.Nov. 1,550 1,208 4,463 8,562 440 8,172 2,810 41 152 279 2,338 770 30,78231.Dec. 1,352 1,210 3,934 8,261 373 8,053 2,883 40 186 283 2,011 793 29,380
2009 31.Jan. 1,112 1,192 3,628 8,524 345 7,914 2,883 41 92 272 1,872 1,163 29,03828.Feb. 1,356 975 3,685 8,088 340 7,768 2,884 41 71 272 1,881 1,180 28,54331.Mar. 1,076 952 3,718 7,894 340 7,654 2,860 40 79 284 1,831 1,190 27,91730.Apr. 1,031 943 3,683 8,241 334 7,736 2,830 40 79 286 1,858 1,117 28,17731.May 718 988 3,601 8,944 319 7,836 2,815 39 78 298 1,999 1,041 28,67630.Jun. 753 1,121 3,614 8,109 319 7,939 2,739 40 43 293 1,980 1,048 27,999
2001 31.Dec. 15 28 1,690 396 84 1,934 5,134 60 162 79 130 674 10,3862002 31.Dec. 56 24 1,693 416 138 1,935 5,909 38 279 68 163 806 11,5242003 31.Dec. 32 87 1,663 588 106 2,070 6,927 30 506 57 185 974 13,2252004 31.Dec. 13 73 1,862 579 133 2,096 8,627 17 744 68 131 1,001 15,3432005 31.Dec. 21 638 2,848 901 165 2,070 10,974 7 1,450 7 433 981 20,4962006 31.Dec. 24 273 3,335 1,386 222 2,456 13,304 3 1,945 2 191 928 24,0672007 31.Dec. ... 1,675 3,847 5,150 60 3,191 13,961 9 2,887 10 230 3,762 34,7832008 31.Dec. ... 2,150 4,006 5,402 67 3,992 15,837 17 2,931 11 266 4,559 39,238
2008 30.Sep. ... 2,602 4,541 5,377 70 4,047 15,772 17 3,031 13 229 4,444 40,14331.Oct. ... 2,830 4,544 5,421 73 3,963 15,674 17 3,020 13 267 4,480 40,30230.Nov. ... 2,025 4,355 5,578 68 3,997 15,948 18 2,971 13 284 4,485 39,74331.Dec. ... 2,150 4,006 5,402 67 3,992 15,837 17 2,931 11 266 4,559 39,238
2009 31.Jan. ... 2,097 3,404 5,398 63 3,936 15,801 16 2,946 13 437 4,719 38,83028.Feb. ... 2,190 3,389 4,077 64 4,669 15,740 16 2,965 13 418 4,685 38,22631.Mar. ... 1,560 3,374 4,479 62 4,219 15,899 12 2,983 13 355 4,563 37,51830.Apr. ... 1,521 3,332 4,156 65 5,269 15,605 11 2,950 13 310 4,507 37,73931.May ... 1,759 3,270 4,631 64 5,300 15,704 10 2,902 13 327 4,406 38,38530.Jun. ... 454 3,209 5,348 88 5,248 15,687 9 2,806 13 321 4,415 37,598
2001 31.Dec. 15 11 -190 -3,320 -1,368 -983 4,981 11 162 -27 -423 451 -1,4272002 31.Dec. -1,044 -26 -191 -3,261 -1,236 -1,309 5,621 13 279 -100 -527 482 -2,5552003 31.Dec. 20 -16 -244 -1,965 -1,250 -3,322 6,505 15 506 -113 -678 608 -1,7162004 31.Dec. -12 -54 -247 -1,017 -1,256 -4,357 8,002 4 744 -190 -705 705 -8822005 31.Dec. -27 361 -8 -1,843 -1,010 -4,897 10,046 -9 1,417 -260 -450 526 9222006 31.Dec. -188 -165 88 -947 -334 -4,583 11,842 -23 1,907 -242 -796 539 3,3952007 31.Dec. -1,733 500 148 1,342 -359 -4,585 11,682 -30 2,821 -341 -1,588 2,989 6,3512008 31.Dec. -1,352 939 72 2,591 -306 -4,061 12,955 -23 2,745 -271 -1,745 3,766 9,858
2008 30.Sep. -2,465 1,579 18 2,593 -643 -4,190 13,027 -22 2,976 -248 -2,030 3,638 8,94931.Oct. -2,210 1,627 -64 2,529 -592 -4,160 12,780 -23 2,941 -250 -2,064 3,674 8,72130.Nov. -1,550 817 -107 2,524 -371 -4,175 13,139 -23 2,820 -266 -2,054 3,715 8,96031.Dec. -1,352 939 72 2,591 -306 -4,061 12,955 -23 2,745 -271 -1,745 3,766 9,858
2009 31.Jan. -1,112 906 -224 2,483 -282 -3,978 12,917 -24 2,854 -259 -1,435 3,556 9,79228.Feb. -1,356 1,215 -297 1,652 -276 -3,100 12,856 -25 2,894 -259 -1,462 3,505 9,68431.Mar. -1,076 608 -344 2,247 -278 -3,435 13,039 -29 2,904 -272 -1,476 3,373 9,60130.04. -1,031 578 -351 1,649 -268 -2,467 12,774 -29 2,871 -273 -1,547 3,390 9,56231.May -718 771 -331 1,442 -255 -2,535 12,888 -30 2,824 -285 -1,673 3,366 9,70930.Jun. -753 -667 -405 3,074 -230 -2,690 12,947 -31 2,763 -280 -1,660 3,367 9,599
Total all sectors
Short-term Long-termDirect investment:
Total
Intercomapny lending
Money market
instrumentsLoans Trade credits
Currency and deposits
Other debt ass./liab.
Bonds and notes
Loans Trade creditsCurrency
and deposits
Other debt ass./liab.
Affiliated enterprises
Direct investors
1 2 3 4 11 125 6 7 8 13=1+…+129 10
Mio EUR
Claims
Liabilities
Net position
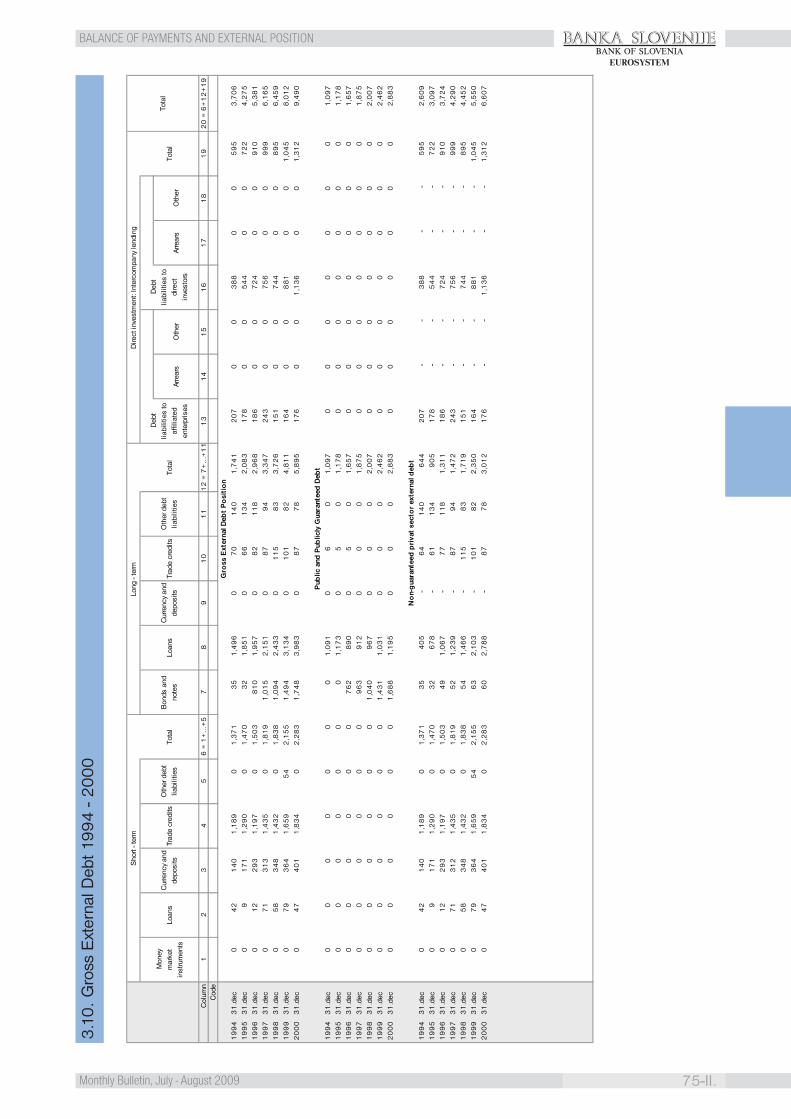
BANKA SLOVENIJE
75-II.Monthly Bulletin, July - August 2009
BALANCE OF PAYMENTS AND EXTERNAL POSITIONBANK OF SLOVENIA
EUROSYSTEM
3.10
. G
ross
Ext
erna
l Deb
t 199
4 -
20
00
Col
umn
Cod
e
1
99
43
1.d
ec0
42
14
01
,18
90
1,3
71
35
1,4
96
07
01
40
1,7
41
20
70
03
88
00
59
53
,70
61
99
53
1.d
ec0
91
71
1,2
90
01
,47
03
21
,85
10
66
13
42
,08
31
78
00
54
40
07
22
4,2
75
19
96
31
.dec
01
22
93
1,1
97
01
,50
38
10
1,9
57
08
21
18
2,9
68
18
60
07
24
00
91
05
,38
11
99
73
1.d
ec0
71
31
31
,43
50
1,8
19
1,0
15
2,1
51
08
79
43
,34
72
43
00
75
60
09
99
6,1
65
19
98
31
.dec
05
83
48
1,4
32
01
,83
81
,09
42
,43
30
11
58
33
,72
61
51
00
74
40
08
95
6,4
59
19
99
31
.dec
07
93
64
1,6
59
54
2,1
55
1,4
94
3,1
34
01
01
82
4,8
11
16
40
08
81
00
1,0
45
8,0
12
20
00
31
.dec
04
74
01
1,8
34
02
,28
31
,74
83
,98
30
87
78
5,8
95
17
60
01
,13
60
01
,31
29
,49
0
19
94
31
.dec
00
00
00
01
,09
10
60
1,0
97
00
00
00
01
,09
71
99
53
1.d
ec0
00
00
00
1,1
73
05
01
,17
80
00
00
00
1,1
78
19
96
31
.dec
00
00
00
76
28
90
05
01
,65
70
00
00
00
1,6
57
19
97
31
.dec
00
00
00
96
39
12
00
01
,87
50
00
00
00
1,8
75
19
98
31
.dec
00
00
00
1,0
40
96
70
00
2,0
07
00
00
00
02
,00
71
99
93
1.d
ec0
00
00
01
,43
11
,03
10
00
2,4
62
00
00
00
02
,46
22
00
03
1.d
ec0
00
00
01
,68
81
,19
50
00
2,8
83
00
00
00
02
,88
3
19
94
31
.dec
04
21
40
1,1
89
01
,37
13
54
05
-6
41
40
64
42
07
--
38
8-
-5
95
2,6
09
19
95
31
.dec
09
17
11
,29
00
1,4
70
32
67
8-
61
13
49
05
17
8-
-5
44
--
72
23
,09
71
99
63
1.d
ec0
12
29
31
,19
70
1,5
03
49
1,0
67
-7
71
18
1,3
11
18
6-
-7
24
--
91
03
,72
41
99
73
1.d
ec0
71
31
21
,43
50
1,8
19
52
1,2
39
-8
79
41
,47
22
43
--
75
6-
-9
99
4,2
90
19
98
31
.dec
05
83
48
1,4
32
01
,83
85
41
,46
6-
11
58
31
,71
91
51
--
74
4-
-8
95
4,4
52
19
99
31
.dec
07
93
64
1,6
59
54
2,1
55
63
2,1
03
-1
01
82
2,3
50
16
4-
-8
81
--
1,0
45
5,5
50
20
00
31
.dec
04
74
01
1,8
34
02
,28
36
02
,78
8-
87
78
3,0
12
17
6-
-1
,13
6-
-1
,31
26
,60
7
Pub
lic a
nd P
ublic
ly G
uara
ntee
d D
ebt
No
n-g
uara
ntee
d p
riva
t se
cto
r ex
tern
al d
ebt
Tota
lAr
rear
sO
ther
Arre
ars
Oth
er
Oth
er d
ebt
liabi
litie
sTo
tal
Deb
t lia
bilit
ies
to
affil
iate
d en
terp
rises
Deb
t lia
bilit
ies
to
dire
ct
inve
stor
s
Bon
ds a
nd
note
sLo
ans
Cur
renc
y an
d de
posi
tsTr
ade
cred
its
Sho
rt - t
erm
Long
- te
rmD
irect
inve
stm
ent:
Inte
rcom
pany
lend
ing
Tota
lM
oney
m
arke
t in
stru
men
tsLo
ans
Cur
renc
y an
d de
posi
tsTr
ade
cred
itsO
ther
deb
t lia
bilit
ies
Tota
l
20
= 6
+1
2+
19
19
14
15
16
17
18
Gro
ss E
xter
nal D
ebt
Po
siti
on
13
12
= 7
+…
+1
11
11
09
87
6 =
1+
…+
55
43
12
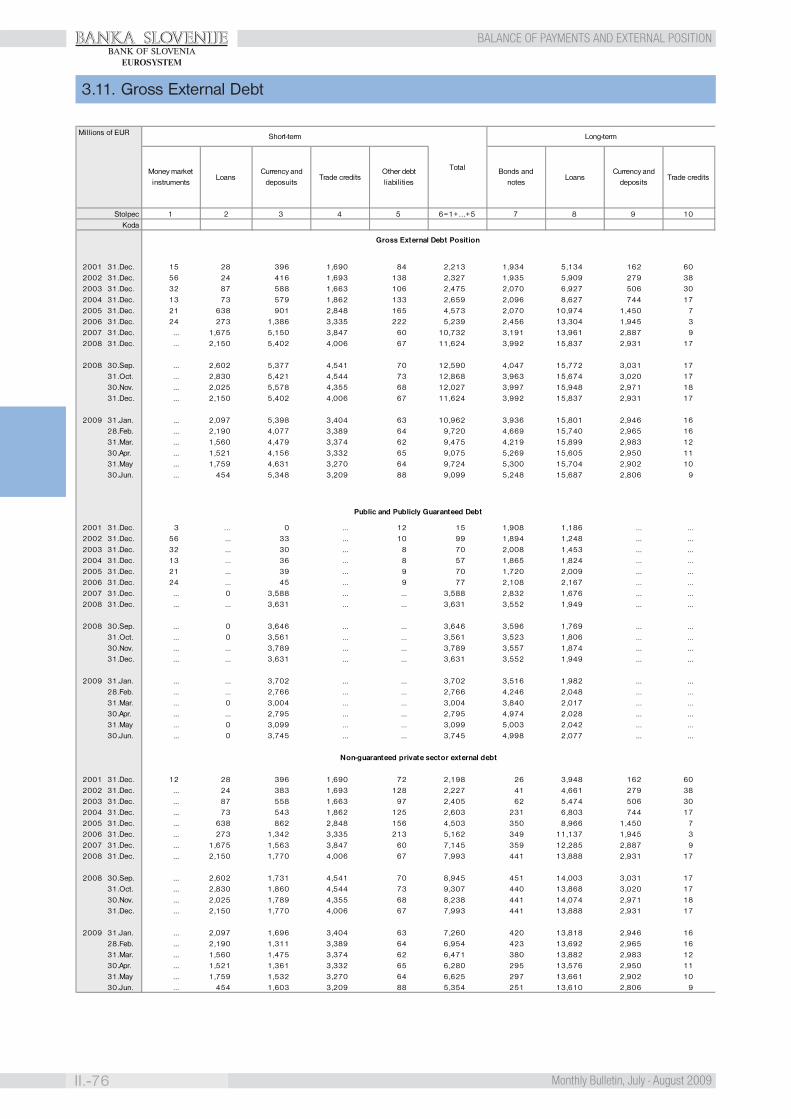
BANKA SLOVENIJE
II.-76 Monthly Bulletin, July - August 2009
BALANCE OF PAYMENTS AND EXTERNAL POSITIONBANK OF SLOVENIA
EUROSYSTEM
3.11. Gross External Debt
Millions of EUR
StolpecKoda
2001 31.Dec. 15 28 396 1,690 84 2,213 1,934 5,134 162 602002 31.Dec. 56 24 416 1,693 138 2,327 1,935 5,909 279 382003 31.Dec. 32 87 588 1,663 106 2,475 2,070 6,927 506 302004 31.Dec. 13 73 579 1,862 133 2,659 2,096 8,627 744 172005 31.Dec. 21 638 901 2,848 165 4,573 2,070 10,974 1,450 72006 31.Dec. 24 273 1,386 3,335 222 5,239 2,456 13,304 1,945 32007 31.Dec. ... 1,675 5,150 3,847 60 10,732 3,191 13,961 2,887 92008 31.Dec. ... 2,150 5,402 4,006 67 11,624 3,992 15,837 2,931 17
2008 30.Sep. ... 2,602 5,377 4,541 70 12,590 4,047 15,772 3,031 1731.Oct. ... 2,830 5,421 4,544 73 12,868 3,963 15,674 3,020 1730.Nov. ... 2,025 5,578 4,355 68 12,027 3,997 15,948 2,971 1831.Dec. ... 2,150 5,402 4,006 67 11,624 3,992 15,837 2,931 17
2009 31.Jan. ... 2,097 5,398 3,404 63 10,962 3,936 15,801 2,946 1628.Feb. ... 2,190 4,077 3,389 64 9,720 4,669 15,740 2,965 1631.Mar. ... 1,560 4,479 3,374 62 9,475 4,219 15,899 2,983 1230.Apr. ... 1,521 4,156 3,332 65 9,075 5,269 15,605 2,950 1131.May ... 1,759 4,631 3,270 64 9,724 5,300 15,704 2,902 1030.Jun. ... 454 5,348 3,209 88 9,099 5,248 15,687 2,806 9
2001 31.Dec. 3 … 0 ... 12 15 1,908 1,186 ... ...2002 31.Dec. 56 ... 33 ... 10 99 1,894 1,248 ... ...2003 31.Dec. 32 ... 30 ... 8 70 2,008 1,453 ... ...2004 31.Dec. 13 ... 36 ... 8 57 1,865 1,824 ... ...2005 31.Dec. 21 ... 39 ... 9 70 1,720 2,009 ... ...2006 31.Dec. 24 ... 45 ... 9 77 2,108 2,167 ... ...2007 31.Dec. ... 0 3,588 ... ... 3,588 2,832 1,676 ... ...2008 31.Dec. ... ... 3,631 ... ... 3,631 3,552 1,949 ... ...
2008 30.Sep. ... 0 3,646 ... ... 3,646 3,596 1,769 ... ...31.Oct. ... 0 3,561 ... ... 3,561 3,523 1,806 ... ...30.Nov. ... ... 3,789 ... ... 3,789 3,557 1,874 ... ...31.Dec. ... ... 3,631 ... ... 3,631 3,552 1,949 ... ...
2009 31.Jan. ... ... 3,702 ... ... 3,702 3,516 1,982 ... ...28.Feb. ... ... 2,766 ... ... 2,766 4,246 2,048 ... ...31.Mar. ... 0 3,004 ... ... 3,004 3,840 2,017 ... ...30.Apr. ... ... 2,795 ... ... 2,795 4,974 2,028 ... ...31.May ... 0 3,099 ... ... 3,099 5,003 2,042 ... ...30.Jun. ... 0 3,745 ... ... 3,745 4,998 2,077 ... ...
2001 31.Dec. 12 28 396 1,690 72 2,198 26 3,948 162 602002 31.Dec. ... 24 383 1,693 128 2,227 41 4,661 279 382003 31.Dec. ... 87 558 1,663 97 2,405 62 5,474 506 302004 31.Dec. ... 73 543 1,862 125 2,603 231 6,803 744 172005 31.Dec. ... 638 862 2,848 156 4,503 350 8,966 1,450 72006 31.Dec. ... 273 1,342 3,335 213 5,162 349 11,137 1,945 32007 31.Dec. ... 1,675 1,563 3,847 60 7,145 359 12,285 2,887 92008 31.Dec. ... 2,150 1,770 4,006 67 7,993 441 13,888 2,931 17
2008 30.Sep. ... 2,602 1,731 4,541 70 8,945 451 14,003 3,031 1731.Oct. ... 2,830 1,860 4,544 73 9,307 440 13,868 3,020 1730.Nov. ... 2,025 1,789 4,355 68 8,238 441 14,074 2,971 1831.Dec. ... 2,150 1,770 4,006 67 7,993 441 13,888 2,931 17
2009 31.Jan. ... 2,097 1,696 3,404 63 7,260 420 13,818 2,946 1628.Feb. ... 2,190 1,311 3,389 64 6,954 423 13,692 2,965 1631.Mar. ... 1,560 1,475 3,374 62 6,471 380 13,882 2,983 1230.Apr. ... 1,521 1,361 3,332 65 6,280 295 13,576 2,950 1131.May ... 1,759 1,532 3,270 64 6,625 297 13,661 2,902 1030.Jun. ... 454 1,603 3,209 88 5,354 251 13,610 2,806 9
Gross External Debt Position
Public and Publicly Guaranteed Debt
Non-guaranteed private sector external debt
9 105 6=1+…+5 7 81 2 3 4
LoansCurrency and
depositsTrade credits
Short-term
Total
Long-term
Money market instruments
LoansCurrency and
deposuitsTrade credits
Other debt liabilities
Bonds and notes
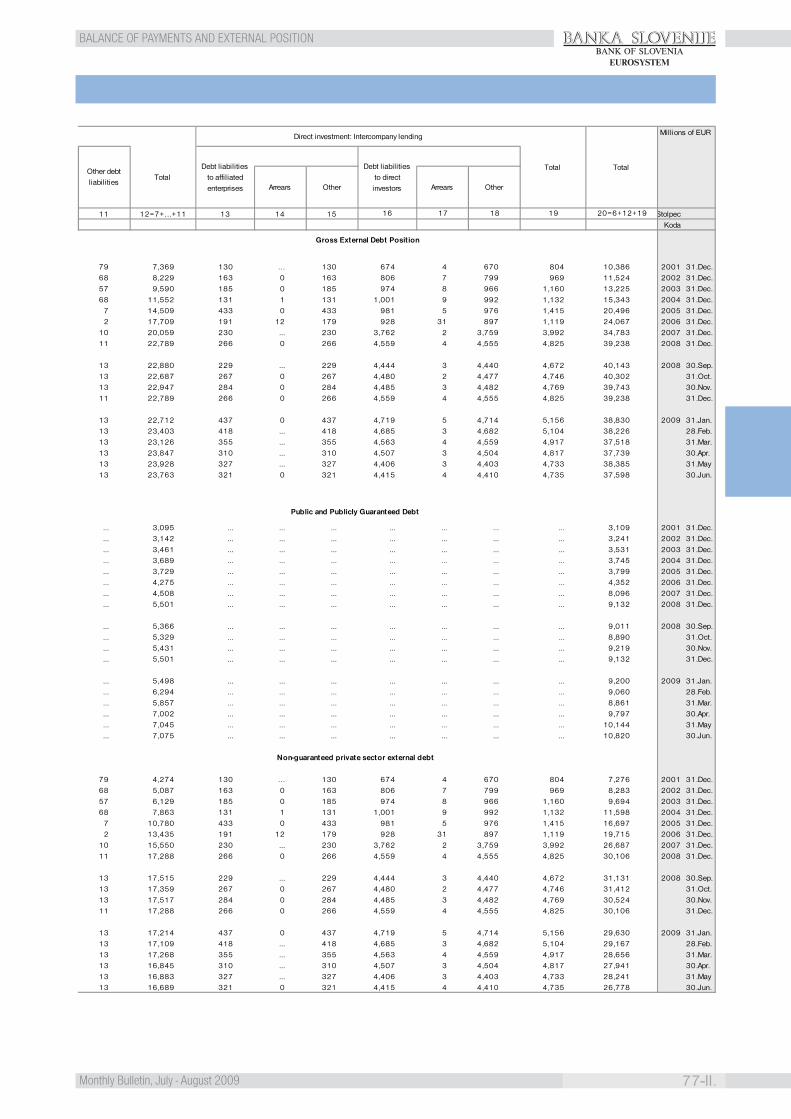
BANKA SLOVENIJE
77-II.Monthly Bulletin, July - August 2009
BALANCE OF PAYMENTS AND EXTERNAL POSITIONBANK OF SLOVENIA
EUROSYSTEM
Stolpec Koda
79 7,369 130 … 130 674 4 670 804 10,386 2001 31.Dec.68 8,229 163 0 163 806 7 799 969 11,524 2002 31.Dec.57 9,590 185 0 185 974 8 966 1,160 13,225 2003 31.Dec.68 11,552 131 1 131 1,001 9 992 1,132 15,343 2004 31.Dec.
7 14,509 433 0 433 981 5 976 1,415 20,496 2005 31.Dec.2 17,709 191 12 179 928 31 897 1,119 24,067 2006 31.Dec.
10 20,059 230 ... 230 3,762 2 3,759 3,992 34,783 2007 31.Dec.11 22,789 266 0 266 4,559 4 4,555 4,825 39,238 2008 31.Dec.
13 22,880 229 ... 229 4,444 3 4,440 4,672 40,143 2008 30.Sep.13 22,687 267 0 267 4,480 2 4,477 4,746 40,302 31.Oct.13 22,947 284 0 284 4,485 3 4,482 4,769 39,743 30.Nov.11 22,789 266 0 266 4,559 4 4,555 4,825 39,238 31.Dec.
13 22,712 437 0 437 4,719 5 4,714 5,156 38,830 2009 31.Jan.13 23,403 418 ... 418 4,685 3 4,682 5,104 38,226 28.Feb.13 23,126 355 ... 355 4,563 4 4,559 4,917 37,518 31.Mar.13 23,847 310 ... 310 4,507 3 4,504 4,817 37,739 30.Apr.13 23,928 327 ... 327 4,406 3 4,403 4,733 38,385 31.May13 23,763 321 0 321 4,415 4 4,410 4,735 37,598 30.Jun.
... 3,095 ... ... ... ... ... ... ... 3,109 2001 31.Dec.
... 3,142 ... ... ... ... ... ... ... 3,241 2002 31.Dec.
... 3,461 ... ... ... ... ... ... ... 3,531 2003 31.Dec.
... 3,689 ... ... ... ... ... ... ... 3,745 2004 31.Dec.
... 3,729 ... ... ... ... ... ... ... 3,799 2005 31.Dec.
... 4,275 ... ... ... ... ... ... ... 4,352 2006 31.Dec.
... 4,508 ... ... ... ... ... ... ... 8,096 2007 31.Dec.
... 5,501 ... ... ... ... ... ... ... 9,132 2008 31.Dec.
... 5,366 ... ... ... ... ... ... ... 9,011 2008 30.Sep.
... 5,329 ... ... ... ... ... ... ... 8,890 31.Oct.
... 5,431 ... ... ... ... ... ... ... 9,219 30.Nov.
... 5,501 ... ... ... ... ... ... ... 9,132 31.Dec.
... 5,498 ... ... ... ... ... ... ... 9,200 2009 31.Jan.
... 6,294 ... ... ... ... ... ... ... 9,060 28.Feb.
... 5,857 ... ... ... ... ... ... ... 8,861 31.Mar.
... 7,002 ... ... ... ... ... ... ... 9,797 30.Apr.
... 7,045 ... ... ... ... ... ... ... 10,144 31.May
... 7,075 ... ... ... ... ... ... ... 10,820 30.Jun.
79 4,274 130 … 130 674 4 670 804 7,276 2001 31.Dec.68 5,087 163 0 163 806 7 799 969 8,283 2002 31.Dec.57 6,129 185 0 185 974 8 966 1,160 9,694 2003 31.Dec.68 7,863 131 1 131 1,001 9 992 1,132 11,598 2004 31.Dec.
7 10,780 433 0 433 981 5 976 1,415 16,697 2005 31.Dec.2 13,435 191 12 179 928 31 897 1,119 19,715 2006 31.Dec.
10 15,550 230 ... 230 3,762 2 3,759 3,992 26,687 2007 31.Dec.11 17,288 266 0 266 4,559 4 4,555 4,825 30,106 2008 31.Dec.
13 17,515 229 ... 229 4,444 3 4,440 4,672 31,131 2008 30.Sep.13 17,359 267 0 267 4,480 2 4,477 4,746 31,412 31.Oct.13 17,517 284 0 284 4,485 3 4,482 4,769 30,524 30.Nov.11 17,288 266 0 266 4,559 4 4,555 4,825 30,106 31.Dec.
13 17,214 437 0 437 4,719 5 4,714 5,156 29,630 2009 31.Jan.13 17,109 418 ... 418 4,685 3 4,682 5,104 29,167 28.Feb.13 17,268 355 ... 355 4,563 4 4,559 4,917 28,656 31.Mar.13 16,845 310 ... 310 4,507 3 4,504 4,817 27,941 30.Apr.13 16,883 327 ... 327 4,406 3 4,403 4,733 28,241 31.May13 16,689 321 0 321 4,415 4 4,410 4,735 26,778 30.Jun.
Gross External Debt Position
Public and Publicly Guaranteed Debt
Non-guaranteed private sector external debt
17 18 19 20=6+12+1913 14 15 1611 12=7+…+11
TotalDebt liabilities
to affiliated enterprises
Debt liabilities to direct investorsArrears Other
Other debt liabilities
Direct investment: Intercompany lending
Total Total
Millions of EUR
Arrears Other
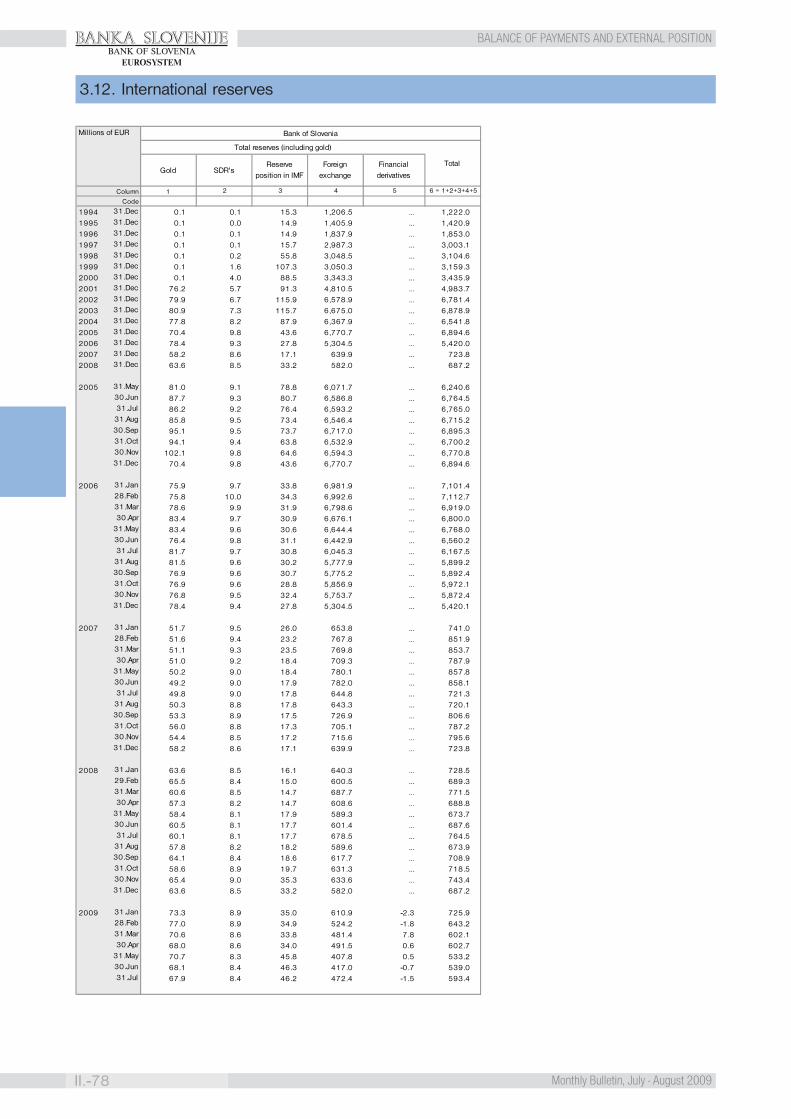
BANKA SLOVENIJE
II.-78 Monthly Bulletin, July - August 2009
BALANCE OF PAYMENTS AND EXTERNAL POSITIONBANK OF SLOVENIA
EUROSYSTEM
3.12. International reserves
Column
Code
1994 31.Dec 0.1 0.1 15.3 1,206.5 ... 1,222.01995 31.Dec 0.1 0.0 14.9 1,405.9 ... 1,420.91996 31.Dec 0.1 0.1 14.9 1,837.9 ... 1,853.01997 31.Dec 0.1 0.1 15.7 2,987.3 ... 3,003.11998 31.Dec 0.1 0.2 55.8 3,048.5 ... 3,104.61999 31.Dec 0.1 1.6 107.3 3,050.3 ... 3,159.32000 31.Dec 0.1 4.0 88.5 3,343.3 ... 3,435.92001 31.Dec 76.2 5.7 91.3 4,810.5 ... 4,983.72002 31.Dec 79.9 6.7 115.9 6,578.9 ... 6,781.42003 31.Dec 80.9 7.3 115.7 6,675.0 ... 6,878.92004 31.Dec 77.8 8.2 87.9 6,367.9 ... 6,541.82005 31.Dec 70.4 9.8 43.6 6,770.7 ... 6,894.62006 31.Dec 78.4 9.3 27.8 5,304.5 ... 5,420.02007 31.Dec 58.2 8.6 17.1 639.9 ... 723.82008 31.Dec 63.6 8.5 33.2 582.0 ... 687.2
2005 31.May 81.0 9.1 78.8 6,071.7 ... 6,240.630.Jun 87.7 9.3 80.7 6,586.8 ... 6,764.531.Jul 86.2 9.2 76.4 6,593.2 ... 6,765.0
31.Aug 85.8 9.5 73.4 6,546.4 ... 6,715.230.Sep 95.1 9.5 73.7 6,717.0 ... 6,895.331.Oct 94.1 9.4 63.8 6,532.9 ... 6,700.230.Nov 102.1 9.8 64.6 6,594.3 ... 6,770.831.Dec 70.4 9.8 43.6 6,770.7 ... 6,894.6
2006 31.Jan 75.9 9.7 33.8 6,981.9 ... 7,101.428.Feb 75.8 10.0 34.3 6,992.6 ... 7,112.731.Mar 78.6 9.9 31.9 6,798.6 ... 6,919.030.Apr 83.4 9.7 30.9 6,676.1 ... 6,800.0
31.May 83.4 9.6 30.6 6,644.4 ... 6,768.030.Jun 76.4 9.8 31.1 6,442.9 ... 6,560.231.Jul 81.7 9.7 30.8 6,045.3 ... 6,167.5
31.Aug 81.5 9.6 30.2 5,777.9 ... 5,899.230.Sep 76.9 9.6 30.7 5,775.2 ... 5,892.431.Oct 76.9 9.6 28.8 5,856.9 ... 5,972.130.Nov 76.8 9.5 32.4 5,753.7 ... 5,872.431.Dec 78.4 9.4 27.8 5,304.5 ... 5,420.1
2007 31.Jan 51.7 9.5 26.0 653.8 ... 741.028.Feb 51.6 9.4 23.2 767.8 ... 851.931.Mar 51.1 9.3 23.5 769.8 ... 853.730.Apr 51.0 9.2 18.4 709.3 ... 787.9
31.May 50.2 9.0 18.4 780.1 ... 857.830.Jun 49.2 9.0 17.9 782.0 ... 858.131.Jul 49.8 9.0 17.8 644.8 ... 721.3
31.Aug 50.3 8.8 17.8 643.3 ... 720.130.Sep 53.3 8.9 17.5 726.9 ... 806.631.Oct 56.0 8.8 17.3 705.1 ... 787.230.Nov 54.4 8.5 17.2 715.6 ... 795.631.Dec 58.2 8.6 17.1 639.9 ... 723.8
2008 31.Jan 63.6 8.5 16.1 640.3 ... 728.529.Feb 65.5 8.4 15.0 600.5 ... 689.331.Mar 60.6 8.5 14.7 687.7 ... 771.530.Apr 57.3 8.2 14.7 608.6 ... 688.8
31.May 58.4 8.1 17.9 589.3 ... 673.730.Jun 60.5 8.1 17.7 601.4 ... 687.631.Jul 60.1 8.1 17.7 678.5 ... 764.5
31.Aug 57.8 8.2 18.2 589.6 ... 673.930.Sep 64.1 8.4 18.6 617.7 ... 708.931.Oct 58.6 8.9 19.7 631.3 ... 718.530.Nov 65.4 9.0 35.3 633.6 ... 743.431.Dec 63.6 8.5 33.2 582.0 ... 687.2
2009 31.Jan 73.3 8.9 35.0 610.9 -2.3 725.928.Feb 77.0 8.9 34.9 524.2 -1.8 643.231.Mar 70.6 8.6 33.8 481.4 7.8 602.130.Apr 68.0 8.6 34.0 491.5 0.6 602.7
31.May 70.7 8.3 45.8 407.8 0.5 533.230.Jun 68.1 8.4 46.3 417.0 -0.7 539.031.Jul 67.9 8.4 46.2 472.4 -1.5 593.4
6 = 1+2+3+4+55
Bank of Slovenia
Gold
1
TotalSDR's
Reserve position in IMF
Financial derivatives
Total reserves (including gold)
Millions of EUR
43
Foreign exchange
2

BANKA SLOVENIJE
79-II.Monthly Bulletin, July - August 2009
PUBLIC FINANCEBANK OF SLOVENIA
EUROSYSTEM
4.1. Non-financial and Financial Accounts (ESA 95) of the General Government sector
NON-FINANCIAL ACCOUNTDeficit (-) or surplus (+) -98,700 -96,871 163 -351 -1.4 -1.3 0.5 -0.9Total revenue 3,015,117 3,215,028 14,790 15,838 43.8 43.3 42.9 42.7Total current revenue 3,004,525 3,200,451 14,645 15,742 43.7 43.1 42.5 42.4
Current taxes on income, wealth 597,899 677,493 3,272 3,441 8.7 9.1 9.5 9.3 Taxes on production and imports 1,066,071 1,110,695 5,025 5,205 15.5 14.9 14.6 14.0 Property income 53,882 46,320 247 278 0.8 0.6 0.7 0.7 Social contributions 998,003 1,061,238 4,814 5,324 14.5 14.3 14.0 14.3 Market output, output for own final use and payments 197,639 202,997 901 985 2.9 2.7 2.6 2.7 for other non-market output Other current transfers 91,030 101,708 387 509 1.3 1.4 1.1 1.4
Total capital revenue 10,593 14,577 145 96 0.2 0.2 0.4 0.3 Capital taxes 1,913 1,354 9 11 0.0 0.0 0.0 0.0 Other capital transfers and investment grants 8,680 13,223 136 85 0.1 0.2 0.4 0.2
Total expenditure 3,113,818 3,311,899 14,627 16,189 45.3 44.6 42.4 43.6Total current expenditure 2,835,108 2,988,471 13,037 14,272 41.2 40.2 37.8 38.4
Current transfers 1,471,550 1,554,779 6,779 7,492 21.4 20.9 19.7 20.2 Social benefits 1,220,311 1,287,996 5,627 6,174 17.7 17.3 16.3 16.6 Subsidies 108,340 120,565 550 577 1.6 1.6 1.6 1.6 Other current transfers 142,899 146,218 603 741 2.1 2.0 1.7 2.0 Property income (payable) 107,075 103,664 443 436 1.6 1.4 1.3 1.2
of which: interest rates 107,075 103,664 443 436 1.6 1.4 1.3 1.2 Compensation of employees 791,911 833,931 3,641 3,994 11.5 11.2 10.6 10.8 Intermediate consumption 426,129 463,463 2,046 2,270 6.2 6.2 5.9 6.1 Other expenditure 38,443 32,634 128 79 0.6 0.4 0.4 0.2
Total capital expenditure 67,202 60,773 295 353 1.0 0.8 0.9 0.9Gross capital formation and Acquisitions less disposals of non-financial non-produced assets 211,507 262,655 1,295 1,564 3.1 3.5 3.8 4.2Net receipts from EU Budget (net receiver +, net payer -) 11,052 22,981 91 -11 0.2 0.3 0.3 0.0
Payments by Member State to EU Budget 69,997 70,751 358 414 1.0 1.0 1.0 1.1 EU expenditure in Member State 81,049 93,732 449 404 1.2 1.3 1.3 1.1
FINANCIAL ACCOUNT, consolidated TRANSACTIONSDeficit (-) or surplus (+) -97,821 -97,062 156 -465 -1.4 -1.3 0.5 -1.3Financial assets -37,847 125,813 205 159 -0.6 1.7 0.6 0.4
Currency and deposits -37,679 84,001 412 268 -0.5 1.1 1.2 0.7 Securities other than shares 3,371 -2,332 103 -51 0.0 0.0 0.3 -0.1 Loans 1,840 2,979 9 -3 0.0 0.0 0.0 0.0 Shares and other equity -20,943 -23,452 -806 -3 -0.3 -0.3 -2.3 0.0 Insurance technical reserves -420 3,616 18 -13 0.0 0.0 0.1 0.0 Other assets 15,984 61,001 469 -39 0.2 0.8 1.4 -0.1
Financial liabilities 59,974 222,875 49 625 0.9 3.0 0.1 1.7 Currency and deposits 678 133 34 2 0.0 0.0 0.1 0.0 Securities other than shares 42,609 162,498 -226 333 0.6 2.2 -0.7 0.9 Loans 25,715 -29,538 -66 19 0.4 -0.4 -0.2 0.1 Shares and other equity -1 -31 0 0 0.0 0.0 0.0 0.0 Insurance technical reserves 0 0 0 0 0.0 0.0 0.0 0.0 Other liabilities -9,027 89,814 308 270 -0.1 1.2 0.9 0.7
STOCKS, consolidated Financial assets 2,925,438 3,254,872 16,555 13,288 42.5 43.8 48.0 35.8
Currency and deposits 301,518 381,534 1,978 2,263 4.4 5.1 5.7 6.1 Securities other than shares 59,992 59,516 361 309 0.9 0.8 1.0 0.8 Loans 90,077 86,179 366 448 1.3 1.2 1.1 1.2 Shares and other equity 1,872,670 2,219,701 11,305 7,783 27.2 29.9 32.8 21.0 Insurance technical reserves 192 3,809 26 13 0.0 0.1 0.1 0.0 Other assets 600,989 504,133 2,520 2,472 8.7 6.8 7.3 6.7
Liabilities 2,337,796 2,516,096 10,349 10,985 34.0 33.9 30.0 29.6 Currency and deposits 3,469 3,602 40 42 0.1 0.0 0.1 0.1 Securities other than shares 1,658,717 1,774,801 6,955 7,356 24.1 23.9 20.2 19.8 Loans 274,240 243,320 947 856 4.0 3.3 2.7 2.3 Shares and other equity 271 269 0 1 0.0 0.0 0.0 0.0 Insurance technical reserves 0 0 0 0 0.0 0.0 0.0 0.0 Other liabilities 401,099 494,104 2,406 2,729 5.8 6.6 7.0 7.4
EDP debt 1,858,339 1,986,305 8,071 8,473 27.0 26.7 23.4 22.8
2005 2006 2007
Source: Statistical Office of the Republic of Slovenia, Bank of Slovenia, Ministry of Finance and computations in Bank of Slovenia.
2007 2008
till 31.12.2006 Millions of SIT, after 1.1.2007 Millions of EUR share in GDP (%)
2008 2005 2006
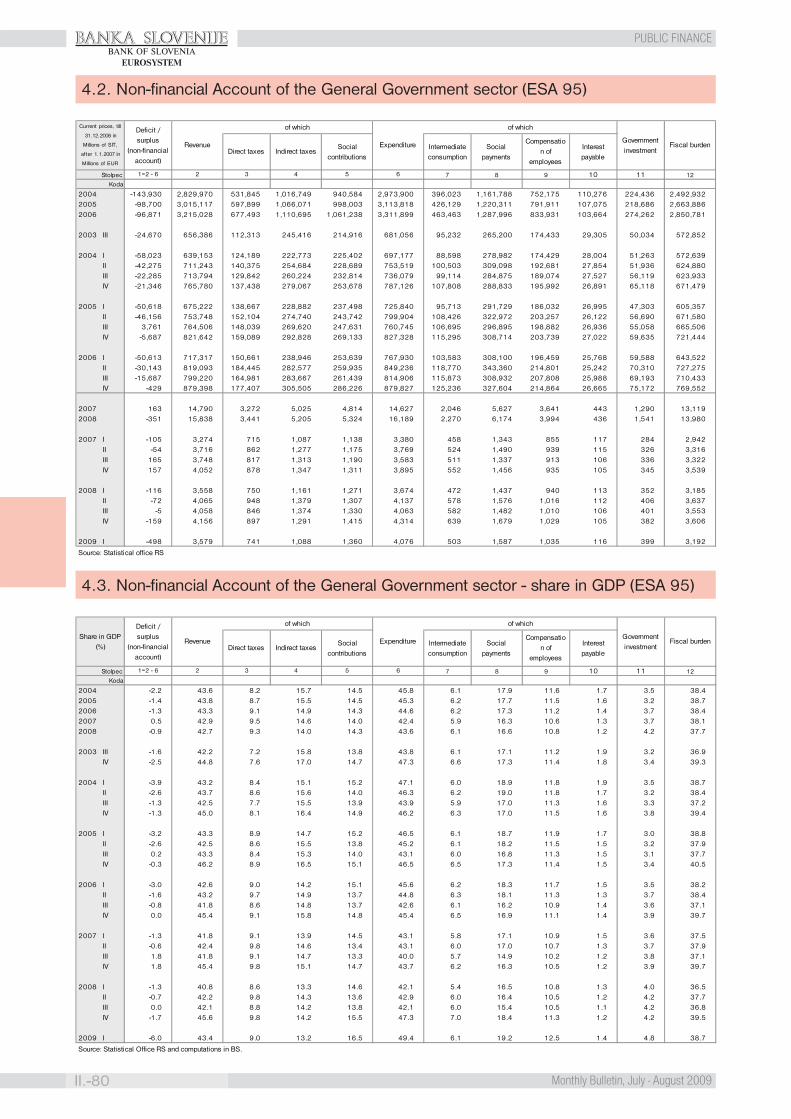
BANKA SLOVENIJE
II.-80 Monthly Bulletin, July - August 2009
PUBLIC FINANCEBANK OF SLOVENIA
EUROSYSTEM
4.2. Non-financial Account of the General Government sector (ESA 95)
4.3. Non-financial Account of the General Government sector - share in GDP (ESA 95)
Stolpec
Koda
2004 -143,930 2,829,970 531,845 1,016,749 940,584 2,973,900 396,023 1,161,788 752,175 110,276 224,436 2,492,9322005 -98,700 3,015,117 597,899 1,066,071 998,003 3,113,818 426,129 1,220,311 791,911 107,075 218,686 2,663,8862006 -96,871 3,215,028 677,493 1,110,695 1,061,238 3,311,899 463,463 1,287,996 833,931 103,664 274,262 2,850,781
2003 III -24,670 656,386 112,313 245,416 214,916 681,056 95,232 265,200 174,433 29,305 50,034 572,852
2004 I -58,023 639,153 124,189 222,773 225,402 697,177 88,598 278,982 174,429 28,004 51,263 572,639II -42,275 711,243 140,375 254,684 228,689 753,519 100,503 309,098 192,681 27,854 51,936 624,880III -22,285 713,794 129,842 260,224 232,814 736,079 99,114 284,875 189,074 27,527 56,119 623,933IV -21,346 765,780 137,438 279,067 253,678 787,126 107,808 288,833 195,992 26,891 65,118 671,479
2005 I -50,618 675,222 138,667 228,882 237,498 725,840 95,713 291,729 186,032 26,995 47,303 605,357II -46,156 753,748 152,104 274,740 243,742 799,904 108,426 322,972 203,257 26,122 56,690 671,580III 3,761 764,506 148,039 269,620 247,631 760,745 106,695 296,895 198,882 26,936 55,058 665,506IV -5,687 821,642 159,089 292,828 269,133 827,328 115,295 308,714 203,739 27,022 59,635 721,444
2006 I -50,613 717,317 150,661 238,946 253,639 767,930 103,583 308,100 196,459 25,768 59,588 643,522II -30,143 819,093 184,445 282,577 259,935 849,236 118,770 343,360 214,801 25,242 70,310 727,275III -15,687 799,220 164,981 283,667 261,439 814,906 115,873 308,932 207,808 25,988 69,193 710,433IV -429 879,398 177,407 305,505 286,226 879,827 125,236 327,604 214,864 26,665 75,172 769,552
2007 163 14,790 3,272 5,025 4,814 14,627 2,046 5,627 3,641 443 1,290 13,1192008 -351 15,838 3,441 5,205 5,324 16,189 2,270 6,174 3,994 436 1,541 13,980
2007 I -105 3,274 715 1,087 1,138 3,380 458 1,343 855 117 284 2,942II -54 3,716 862 1,277 1,175 3,769 524 1,490 939 115 326 3,316III 165 3,748 817 1,313 1,190 3,583 511 1,337 913 106 336 3,322IV 157 4,052 878 1,347 1,311 3,895 552 1,456 935 105 345 3,539
2008 I -116 3,558 750 1,161 1,271 3,674 472 1,437 940 113 352 3,185II -72 4,065 948 1,379 1,307 4,137 578 1,576 1,016 112 406 3,637III -5 4,058 846 1,374 1,330 4,063 582 1,482 1,010 106 401 3,553IV -159 4,156 897 1,291 1,415 4,314 639 1,679 1,029 105 382 3,606
2009 I -498 3,579 741 1,088 1,360 4,076 503 1,587 1,035 116 399 3,192
Expenditure
of which
Compensation of
employees
Interest payable
Fiscal burdenIntermediate consumption
Social payments
Government investment
Current prices, t ill
31.12.2006 in
Millions of SIT,
after 1.1.2007 in
Millions of EUR
Direct taxes Indirect taxes
Deficit / surplus
(non-financial account)
Revenue
of which
Social contributions
121=2 - 6 2 3 4 107 8 115 6 9
Source: Statistical office RS
Stolpec
Koda
2004 -2.2 43.6 8.2 15.7 14.5 45.8 6.1 17.9 11.6 1.7 3.5 38.42005 -1.4 43.8 8.7 15.5 14.5 45.3 6.2 17.7 11.5 1.6 3.2 38.72006 -1.3 43.3 9.1 14.9 14.3 44.6 6.2 17.3 11.2 1.4 3.7 38.42007 0.5 42.9 9.5 14.6 14.0 42.4 5.9 16.3 10.6 1.3 3.7 38.12008 -0.9 42.7 9.3 14.0 14.3 43.6 6.1 16.6 10.8 1.2 4.2 37.7
2003 III -1.6 42.2 7.2 15.8 13.8 43.8 6.1 17.1 11.2 1.9 3.2 36.9IV -2.5 44.8 7.6 17.0 14.7 47.3 6.6 17.3 11.4 1.8 3.4 39.3
2004 I -3.9 43.2 8.4 15.1 15.2 47.1 6.0 18.9 11.8 1.9 3.5 38.7II -2.6 43.7 8.6 15.6 14.0 46.3 6.2 19.0 11.8 1.7 3.2 38.4III -1.3 42.5 7.7 15.5 13.9 43.9 5.9 17.0 11.3 1.6 3.3 37.2IV -1.3 45.0 8.1 16.4 14.9 46.2 6.3 17.0 11.5 1.6 3.8 39.4
2005 I -3.2 43.3 8.9 14.7 15.2 46.5 6.1 18.7 11.9 1.7 3.0 38.8II -2.6 42.5 8.6 15.5 13.8 45.2 6.1 18.2 11.5 1.5 3.2 37.9III 0.2 43.3 8.4 15.3 14.0 43.1 6.0 16.8 11.3 1.5 3.1 37.7IV -0.3 46.2 8.9 16.5 15.1 46.5 6.5 17.3 11.4 1.5 3.4 40.5
2006 I -3.0 42.6 9.0 14.2 15.1 45.6 6.2 18.3 11.7 1.5 3.5 38.2II -1.6 43.2 9.7 14.9 13.7 44.8 6.3 18.1 11.3 1.3 3.7 38.4III -0.8 41.8 8.6 14.8 13.7 42.6 6.1 16.2 10.9 1.4 3.6 37.1IV 0.0 45.4 9.1 15.8 14.8 45.4 6.5 16.9 11.1 1.4 3.9 39.7
2007 I -1.3 41.8 9.1 13.9 14.5 43.1 5.8 17.1 10.9 1.5 3.6 37.5II -0.6 42.4 9.8 14.6 13.4 43.1 6.0 17.0 10.7 1.3 3.7 37.9III 1.8 41.8 9.1 14.7 13.3 40.0 5.7 14.9 10.2 1.2 3.8 37.1IV 1.8 45.4 9.8 15.1 14.7 43.7 6.2 16.3 10.5 1.2 3.9 39.7
2008 I -1.3 40.8 8.6 13.3 14.6 42.1 5.4 16.5 10.8 1.3 4.0 36.5II -0.7 42.2 9.8 14.3 13.6 42.9 6.0 16.4 10.5 1.2 4.2 37.7III 0.0 42.1 8.8 14.2 13.8 42.1 6.0 15.4 10.5 1.1 4.2 36.8IV -1.7 45.6 9.8 14.2 15.5 47.3 7.0 18.4 11.3 1.2 4.2 39.5
2009 I -6.0 43.4 9.0 13.2 16.5 49.4 6.1 19.2 12.5 1.4 4.8 38.7
Expenditure
of which
Compensation of
employees
Interest payable
Fiscal burdenIntermediate consumption
Social payments
Government investment
Share in GDP (%) Direct taxes Indirect taxes
Deficit / surplus
(non-financial account)
Revenue
of which
Social contributions
121=2 - 6 2 3 4 107 8 115 6 9
Source: Statistical Office RS and computations in BS.
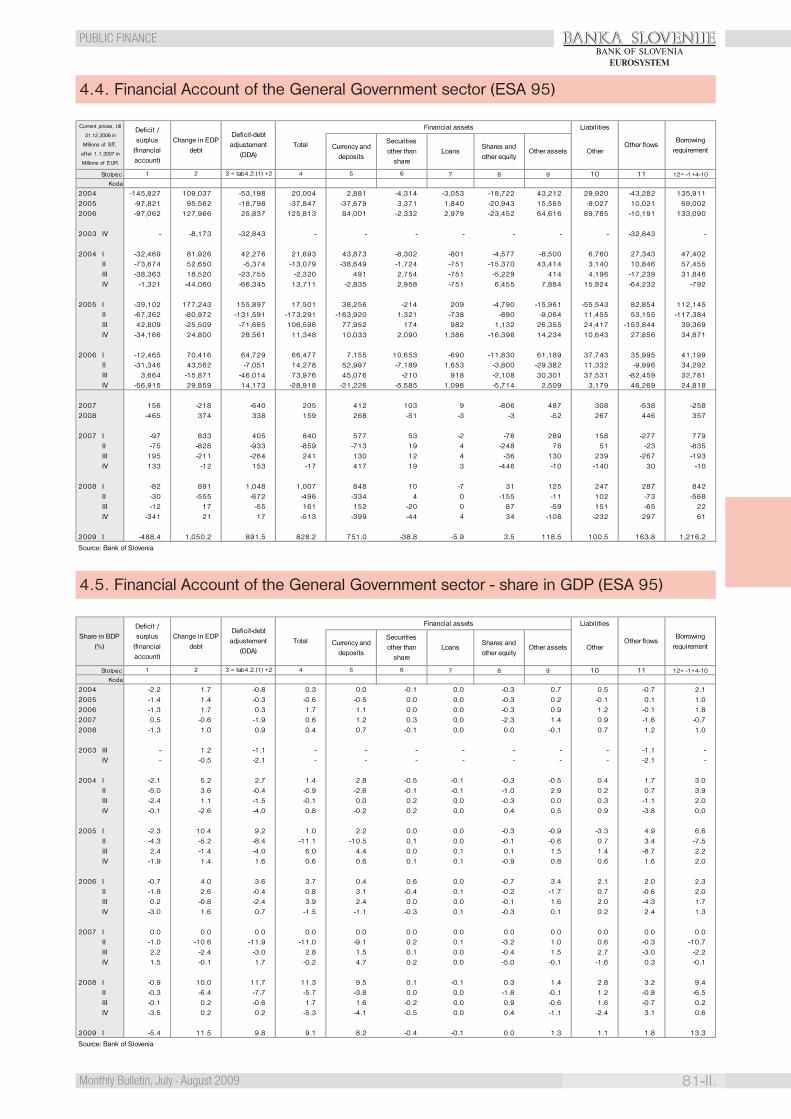
BANKA SLOVENIJE
81-II.Monthly Bulletin, July - August 2009
PUBLIC FINANCEBANK OF SLOVENIA
EUROSYSTEM
4.4. Financial Account of the General Government sector (ESA 95)
4.5. Financial Account of the General Government sector - share in GDP (ESA 95)
Stolpec
Koda
2004 -145,827 109,037 -53,198 20,004 2,881 -4,314 -3,053 -18,722 43,212 29,920 -43,282 135,9112005 -97,821 95,562 -18,798 -37,847 -37,679 3,371 1,840 -20,943 15,565 -9,027 10,021 69,0022006 -97,062 127,966 25,837 125,813 84,001 -2,332 2,979 -23,452 64,616 89,785 -10,191 133,090
2003 IV - -8,173 -32,843 - - - - - - - -32,843 -
2004 I -32,469 81,926 42,276 21,693 43,873 -8,302 -801 -4,577 -8,500 6,760 27,343 47,402II -73,674 52,650 -5,374 -13,079 -38,649 -1,724 -751 -15,370 43,414 3,140 10,846 57,455III -38,363 18,520 -23,755 -2,320 491 2,754 -751 -5,229 414 4,196 -17,239 31,846IV -1,321 -44,060 -66,345 13,711 -2,835 2,958 -751 6,455 7,884 15,824 -64,232 -792
2005 I -39,102 177,243 155,897 17,501 38,256 -214 209 -4,790 -15,961 -55,543 82,854 112,145II -67,362 -80,972 -131,591 -173,291 -163,920 1,321 -738 -890 -9,064 11,455 53,155 -117,384III 42,809 -25,509 -71,665 106,596 77,952 174 982 1,132 26,355 24,417 -153,844 39,369IV -34,166 24,800 28,561 11,348 10,033 2,090 1,386 -16,396 14,234 10,643 27,856 34,871
2006 I -12,465 70,416 64,729 66,477 7,155 10,653 -690 -11,830 61,189 37,743 35,995 41,199II -31,346 43,562 -7,051 14,278 52,997 -7,189 1,653 -3,800 -29,382 11,332 -9,996 34,292III 3,664 -15,871 -46,014 73,976 45,076 -210 918 -2,108 30,301 37,531 -82,459 32,781IV -56,915 29,859 14,173 -28,918 -21,226 -5,585 1,098 -5,714 2,509 3,179 46,269 24,818
2007 156 -218 -640 205 412 103 9 -806 487 308 -538 -2582008 -465 374 338 159 268 -51 -3 -3 -52 267 446 357
2007 I -97 833 405 840 577 53 -2 -76 289 158 -277 779II -75 -828 -933 -859 -713 19 4 -248 78 51 -23 -835III 195 -211 -264 241 130 12 4 -36 130 239 -267 -193IV 133 -12 153 -17 417 19 3 -446 -10 -140 30 -10
2008 I -82 891 1,048 1,007 848 10 -7 31 125 247 287 842II -30 -555 -672 -496 -334 4 0 -155 -11 102 -73 -568III -12 17 -55 161 152 -20 0 87 -59 151 -65 22IV -341 21 17 -513 -399 -44 4 34 -108 -232 297 61
2009 I -488.4 1,050.2 891.5 828.2 751.0 -38.8 -5.9 3.5 118.5 100.5 163.8 1,216.2
Source: Bank of Slovenia
6 9 12= -1+4-101 2 3 = tab4.2.(1) +2 4 107 8 115
Current prices, t ill
31.12.2006 in
Millions of SIT,
af ter 1.1.2007 in
Millions of EUR
Deficit / surplus
(financial account)
Change in EDP debt Currency and
deposits
Deficit-debt adjustement
(DDA)Total
Financial assets
Securities other than
share
Borrowing requirementLoans
Shares and other equity
Other flows
Liabilities
Other assets Other
Stolpec
Koda
2004 -2.2 1.7 -0.8 0.3 0.0 -0.1 0.0 -0.3 0.7 0.5 -0.7 2.12005 -1.4 1.4 -0.3 -0.6 -0.5 0.0 0.0 -0.3 0.2 -0.1 0.1 1.02006 -1.3 1.7 0.3 1.7 1.1 0.0 0.0 -0.3 0.9 1.2 -0.1 1.82007 0.5 -0.6 -1.9 0.6 1.2 0.3 0.0 -2.3 1.4 0.9 -1.6 -0.72008 -1.3 1.0 0.9 0.4 0.7 -0.1 0.0 0.0 -0.1 0.7 1.2 1.0
2003 III - 1.2 -1.1 - - - - - - - -1.1 -IV - -0.5 -2.1 - - - - - - - -2.1 -
2004 I -2.1 5.2 2.7 1.4 2.8 -0.5 -0.1 -0.3 -0.5 0.4 1.7 3.0II -5.0 3.6 -0.4 -0.9 -2.6 -0.1 -0.1 -1.0 2.9 0.2 0.7 3.9III -2.4 1.1 -1.5 -0.1 0.0 0.2 0.0 -0.3 0.0 0.3 -1.1 2.0IV -0.1 -2.6 -4.0 0.8 -0.2 0.2 0.0 0.4 0.5 0.9 -3.8 0.0
2005 I -2.3 10.4 9.2 1.0 2.2 0.0 0.0 -0.3 -0.9 -3.3 4.9 6.6II -4.3 -5.2 -8.4 -11.1 -10.5 0.1 0.0 -0.1 -0.6 0.7 3.4 -7.5III 2.4 -1.4 -4.0 6.0 4.4 0.0 0.1 0.1 1.5 1.4 -8.7 2.2IV -1.9 1.4 1.6 0.6 0.6 0.1 0.1 -0.9 0.8 0.6 1.6 2.0
2006 I -0.7 4.0 3.6 3.7 0.4 0.6 0.0 -0.7 3.4 2.1 2.0 2.3II -1.9 2.6 -0.4 0.8 3.1 -0.4 0.1 -0.2 -1.7 0.7 -0.6 2.0III 0.2 -0.8 -2.4 3.9 2.4 0.0 0.0 -0.1 1.6 2.0 -4.3 1.7IV -3.0 1.6 0.7 -1.5 -1.1 -0.3 0.1 -0.3 0.1 0.2 2.4 1.3
2007 I 0.0 0.0 0.0 0.0 0.0 0.0 0.0 0.0 0.0 0.0 0.0 0.0II -1.0 -10.6 -11.9 -11.0 -9.1 0.2 0.1 -3.2 1.0 0.6 -0.3 -10.7III 2.2 -2.4 -3.0 2.8 1.5 0.1 0.0 -0.4 1.5 2.7 -3.0 -2.2IV 1.5 -0.1 1.7 -0.2 4.7 0.2 0.0 -5.0 -0.1 -1.6 0.3 -0.1
2008 I -0.9 10.0 11.7 11.3 9.5 0.1 -0.1 0.3 1.4 2.8 3.2 9.4II -0.3 -6.4 -7.7 -5.7 -3.8 0.0 0.0 -1.8 -0.1 1.2 -0.8 -6.5III -0.1 0.2 -0.6 1.7 1.6 -0.2 0.0 0.9 -0.6 1.6 -0.7 0.2IV -3.5 0.2 0.2 -5.3 -4.1 -0.5 0.0 0.4 -1.1 -2.4 3.1 0.6
2009 I -5.4 11.5 9.8 9.1 8.2 -0.4 -0.1 0.0 1.3 1.1 1.8 13.3
Source: Bank of Slovenia
6 9 12= -1+4-101 2 3 = tab4.2.(1) +2 4 107 8 115
Share in BDP (%)
Deficit / surplus
(financial account)
Change in EDP debt Currency and
deposits
Deficit-debt adjustement
(DDA)Total
Financial assets
Securities other than
share
Borrowing requirementLoans
Shares and other equity
Other flows
Liabilities
Other assets Other
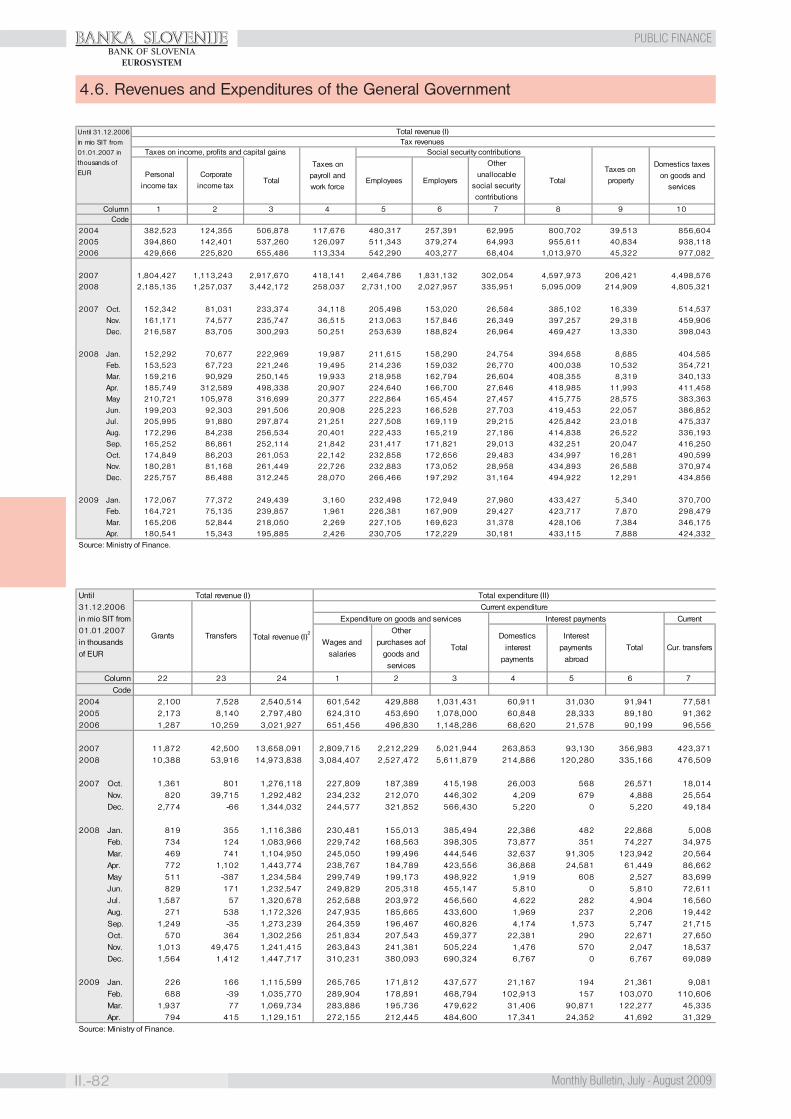
BANKA SLOVENIJE
II.-82 Monthly Bulletin, July - August 2009
PUBLIC FINANCEBANK OF SLOVENIA
EUROSYSTEM
4.6. Revenues and Expenditures of the General Government
ColumnCode
2004 382,523 124,355 506,878 117,676 480,317 257,391 62,995 800,702 39,513 856,6042005 394,860 142,401 537,260 126,097 511,343 379,274 64,993 955,611 40,834 938,1182006 429,666 225,820 655,486 113,334 542,290 403,277 68,404 1,013,970 45,322 977,082
2007 1,804,427 1,113,243 2,917,670 418,141 2,464,786 1,831,132 302,054 4,597,973 206,421 4,498,5762008 2,185,135 1,257,037 3,442,172 258,037 2,731,100 2,027,957 335,951 5,095,009 214,909 4,805,321
2007 Oct. 152,342 81,031 233,374 34,118 205,498 153,020 26,584 385,102 16,339 514,537Nov. 161,171 74,577 235,747 36,515 213,063 157,846 26,349 397,257 29,318 459,906Dec. 216,587 83,705 300,293 50,251 253,639 188,824 26,964 469,427 13,330 398,043
2008 Jan. 152,292 70,677 222,969 19,987 211,615 158,290 24,754 394,658 8,685 404,585Feb. 153,523 67,723 221,246 19,495 214,236 159,032 26,770 400,038 10,532 354,721Mar. 159,216 90,929 250,145 19,933 218,958 162,794 26,604 408,355 8,319 340,133Apr. 185,749 312,589 498,338 20,907 224,640 166,700 27,646 418,985 11,993 411,458May 210,721 105,978 316,699 20,377 222,864 165,454 27,457 415,775 28,575 383,363Jun. 199,203 92,303 291,506 20,908 225,223 166,528 27,703 419,453 22,057 386,852Jul. 205,995 91,880 297,874 21,251 227,508 169,119 29,215 425,842 23,018 475,337Aug. 172,296 84,238 256,534 20,401 222,433 165,219 27,186 414,838 26,522 336,193Sep. 165,252 86,861 252,114 21,842 231,417 171,821 29,013 432,251 20,047 416,250Oct. 174,849 86,203 261,053 22,142 232,858 172,656 29,483 434,997 16,281 490,599Nov. 180,281 81,168 261,449 22,726 232,883 173,052 28,958 434,893 26,588 370,974Dec. 225,757 86,488 312,245 28,070 266,466 197,292 31,164 494,922 12,291 434,856
2009 Jan. 172,067 77,372 249,439 3,160 232,498 172,949 27,980 433,427 5,340 370,700Feb. 164,721 75,135 239,857 1,961 226,381 167,909 29,427 423,717 7,870 298,479Mar. 165,206 52,844 218,050 2,269 227,105 169,623 31,378 428,106 7,384 346,175Apr. 180,541 15,343 195,885 2,426 230,705 172,229 30,181 433,115 7,888 424,332
Source: Ministry of Finance.
Until 31.12.2006
in mio SIT from
01.01.2007 in
thousands of
EUREmployees Employers
Other unallocable
social security contributions
Total revenue (I)Tax revenues
Personal income tax
Corporate income tax
Total
Taxes on payroll and work force
Domestics taxes on goods and
services
Taxes on income, profits and capital gains Social security contributions
Taxes on propertyTotal
103 4 95 6 7 81 2
Column 1 2 3 4 5 6 7Code
2004 2,100 7,528 2,540,514 601,542 429,888 1,031,431 60,911 31,030 91,941 77,5812005 2,173 8,140 2,797,480 624,310 453,690 1,078,000 60,848 28,333 89,180 91,3622006 1,287 10,259 3,021,927 651,456 496,830 1,148,286 68,620 21,578 90,199 96,556
2007 11,872 42,500 13,658,091 2,809,715 2,212,229 5,021,944 263,853 93,130 356,983 423,3712008 10,388 53,916 14,973,838 3,084,407 2,527,472 5,611,879 214,886 120,280 335,166 476,509
2007 Oct. 1,361 801 1,276,118 227,809 187,389 415,198 26,003 568 26,571 18,014Nov. 820 39,715 1,292,482 234,232 212,070 446,302 4,209 679 4,888 25,554Dec. 2,774 -66 1,344,032 244,577 321,852 566,430 5,220 0 5,220 49,184
2008 Jan. 819 355 1,116,386 230,481 155,013 385,494 22,386 482 22,868 5,008Feb. 734 124 1,083,966 229,742 168,563 398,305 73,877 351 74,227 34,975Mar. 469 741 1,104,950 245,050 199,496 444,546 32,637 91,305 123,942 20,564Apr. 772 1,102 1,443,774 238,767 184,789 423,556 36,868 24,581 61,449 86,662May 511 -387 1,234,584 299,749 199,173 498,922 1,919 608 2,527 83,699Jun. 829 171 1,232,547 249,829 205,318 455,147 5,810 0 5,810 72,611Jul. 1,587 57 1,320,678 252,588 203,972 456,560 4,622 282 4,904 16,560Aug. 271 538 1,172,326 247,935 185,665 433,600 1,969 237 2,206 19,442Sep. 1,249 -35 1,273,239 264,359 196,467 460,826 4,174 1,573 5,747 21,715Oct. 570 364 1,302,256 251,834 207,543 459,377 22,381 290 22,671 27,650Nov. 1,013 49,475 1,241,415 263,843 241,381 505,224 1,476 570 2,047 18,537Dec. 1,564 1,412 1,447,717 310,231 380,093 690,324 6,767 0 6,767 69,089
2009 Jan. 226 166 1,115,599 265,765 171,812 437,577 21,167 194 21,361 9,081Feb. 688 -39 1,035,770 289,904 178,891 468,794 102,913 157 103,070 110,606Mar. 1,937 77 1,069,734 283,886 195,736 479,622 31,406 90,871 122,277 45,335Apr. 794 415 1,129,151 272,155 212,445 484,600 17,341 24,352 41,692 31,329
Source: Ministry of Finance.
Total Cur. transfers
22 23 24
Total revenue (I)2
Until 31.12.2006 in mio SIT from 01.01.2007 in thousands of EUR
Interest paymentsCurrent expenditure
Expenditure on goods and services
Total revenue (I)
TotalInterest
payments abroad
Total expenditure (II)
Wages and salaries
Domestics interest
payments
Grants Transfers
Current Other
purchases aof goods and services
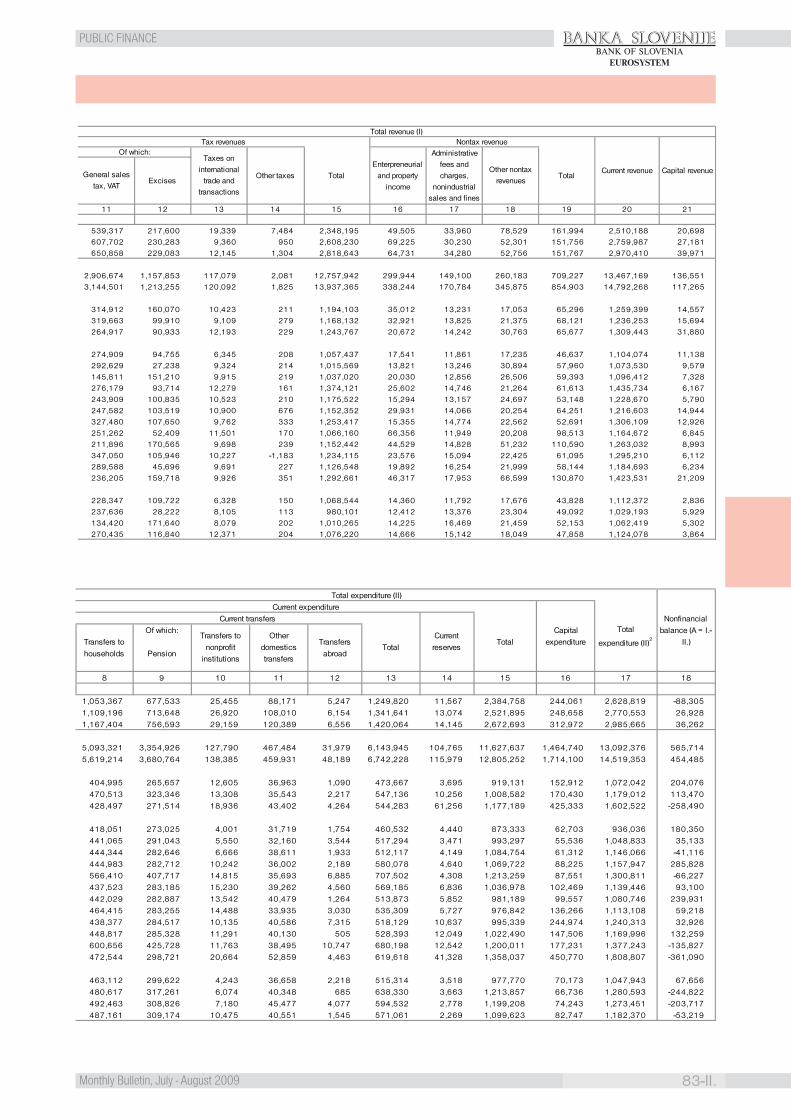
BANKA SLOVENIJE
83-II.Monthly Bulletin, July - August 2009
PUBLIC FINANCEBANK OF SLOVENIA
EUROSYSTEM
539,317 217,600 19,339 7,484 2,348,195 49,505 33,960 78,529 161,994 2,510,188 20,698607,702 230,283 9,360 950 2,608,230 69,225 30,230 52,301 151,756 2,759,987 27,181650,858 229,083 12,145 1,304 2,818,643 64,731 34,280 52,756 151,767 2,970,410 39,971
2,906,674 1,157,853 117,079 2,081 12,757,942 299,944 149,100 260,183 709,227 13,467,169 136,5513,144,501 1,213,255 120,092 1,825 13,937,365 338,244 170,784 345,875 854,903 14,792,268 117,265
314,912 160,070 10,423 211 1,194,103 35,012 13,231 17,053 65,296 1,259,399 14,557319,663 99,910 9,109 279 1,168,132 32,921 13,825 21,375 68,121 1,236,253 15,694264,917 90,933 12,193 229 1,243,767 20,672 14,242 30,763 65,677 1,309,443 31,880
274,909 94,755 6,345 208 1,057,437 17,541 11,861 17,235 46,637 1,104,074 11,138292,629 27,238 9,324 214 1,015,569 13,821 13,246 30,894 57,960 1,073,530 9,579145,811 151,210 9,915 219 1,037,020 20,030 12,856 26,506 59,393 1,096,412 7,328276,179 93,714 12,279 161 1,374,121 25,602 14,746 21,264 61,613 1,435,734 6,167243,909 100,835 10,523 210 1,175,522 15,294 13,157 24,697 53,148 1,228,670 5,790247,582 103,519 10,900 676 1,152,352 29,931 14,066 20,254 64,251 1,216,603 14,944327,480 107,650 9,762 333 1,253,417 15,355 14,774 22,562 52,691 1,306,109 12,926251,262 52,409 11,501 170 1,066,160 66,356 11,949 20,208 98,513 1,164,672 6,845211,896 170,565 9,698 239 1,152,442 44,529 14,828 51,232 110,590 1,263,032 8,993347,050 105,946 10,227 -1,183 1,234,115 23,576 15,094 22,425 61,095 1,295,210 6,112289,588 45,696 9,691 227 1,126,548 19,892 16,254 21,999 58,144 1,184,693 6,234236,205 159,718 9,926 351 1,292,661 46,317 17,953 66,599 130,870 1,423,531 21,209
228,347 109,722 6,328 150 1,068,544 14,360 11,792 17,676 43,828 1,112,372 2,836237,636 28,222 8,105 113 980,101 12,412 13,376 23,304 49,092 1,029,193 5,929134,420 171,640 8,079 202 1,010,265 14,225 16,469 21,459 52,153 1,062,419 5,302270,435 116,840 12,371 204 1,076,220 14,666 15,142 18,049 47,858 1,124,078 3,864
Administrative fees and charges,
nonindustrial sales and fines
Of which:
General sales tax, VAT
Excises
1211 13
Enterpreneurial and property
income
Total revenue (I)Tax revenues Nontax revenue
Current revenue Capital revenue
Taxes on international
trade and transactions
Other taxes TotalOther nontax
revenuesTotal
2114 15 16 17 18 19 20
1,053,367 677,533 25,455 88,171 5,247 1,249,820 11,567 2,384,758 244,061 2,628,819 -88,3051,109,196 713,648 26,920 108,010 6,154 1,341,641 13,074 2,521,895 248,658 2,770,553 26,9281,167,404 756,593 29,159 120,389 6,556 1,420,064 14,145 2,672,693 312,972 2,985,665 36,262
5,093,321 3,354,926 127,790 467,484 31,979 6,143,945 104,765 11,627,637 1,464,740 13,092,376 565,7145,619,214 3,680,764 138,385 459,931 48,189 6,742,228 115,979 12,805,252 1,714,100 14,519,353 454,485
404,995 265,657 12,605 36,963 1,090 473,667 3,695 919,131 152,912 1,072,042 204,076470,513 323,346 13,308 35,543 2,217 547,136 10,256 1,008,582 170,430 1,179,012 113,470428,497 271,514 18,936 43,402 4,264 544,283 61,256 1,177,189 425,333 1,602,522 -258,490
418,051 273,025 4,001 31,719 1,754 460,532 4,440 873,333 62,703 936,036 180,350441,065 291,043 5,550 32,160 3,544 517,294 3,471 993,297 55,536 1,048,833 35,133444,344 282,646 6,666 38,611 1,933 512,117 4,149 1,084,754 61,312 1,146,066 -41,116444,983 282,712 10,242 36,002 2,189 580,078 4,640 1,069,722 88,225 1,157,947 285,828566,410 407,717 14,815 35,693 6,885 707,502 4,308 1,213,259 87,551 1,300,811 -66,227437,523 283,185 15,230 39,262 4,560 569,185 6,836 1,036,978 102,469 1,139,446 93,100442,029 282,887 13,542 40,479 1,264 513,873 5,852 981,189 99,557 1,080,746 239,931464,415 283,255 14,488 33,935 3,030 535,309 5,727 976,842 136,266 1,113,108 59,218438,377 284,517 10,135 40,586 7,315 518,129 10,637 995,339 244,974 1,240,313 32,926448,817 285,328 11,291 40,130 505 528,393 12,049 1,022,490 147,506 1,169,996 132,259600,656 425,728 11,763 38,495 10,747 680,198 12,542 1,200,011 177,231 1,377,243 -135,827472,544 298,721 20,664 52,859 4,463 619,618 41,328 1,358,037 450,770 1,808,807 -361,090
463,112 299,622 4,243 36,658 2,218 515,314 3,518 977,770 70,173 1,047,943 67,656480,617 317,261 6,074 40,348 685 638,330 3,663 1,213,857 66,736 1,280,593 -244,822492,463 308,826 7,180 45,477 4,077 594,532 2,778 1,199,208 74,243 1,273,451 -203,717487,161 309,174 10,475 40,551 1,545 571,061 2,269 1,099,623 82,747 1,182,370 -53,219
Nonfinancial balance (A = I.-
II.)
Total expenditure (II)Current expenditure
Capital expenditure
Total
expenditure (II)2Total
Of which:
Pension
10 11
Current transfers
Current reserves
Transfers to households
Transfers to nonprofit
institutions
Other domestics transfers
Transfers abroad
Total
16 17 1812 13 14 158 9
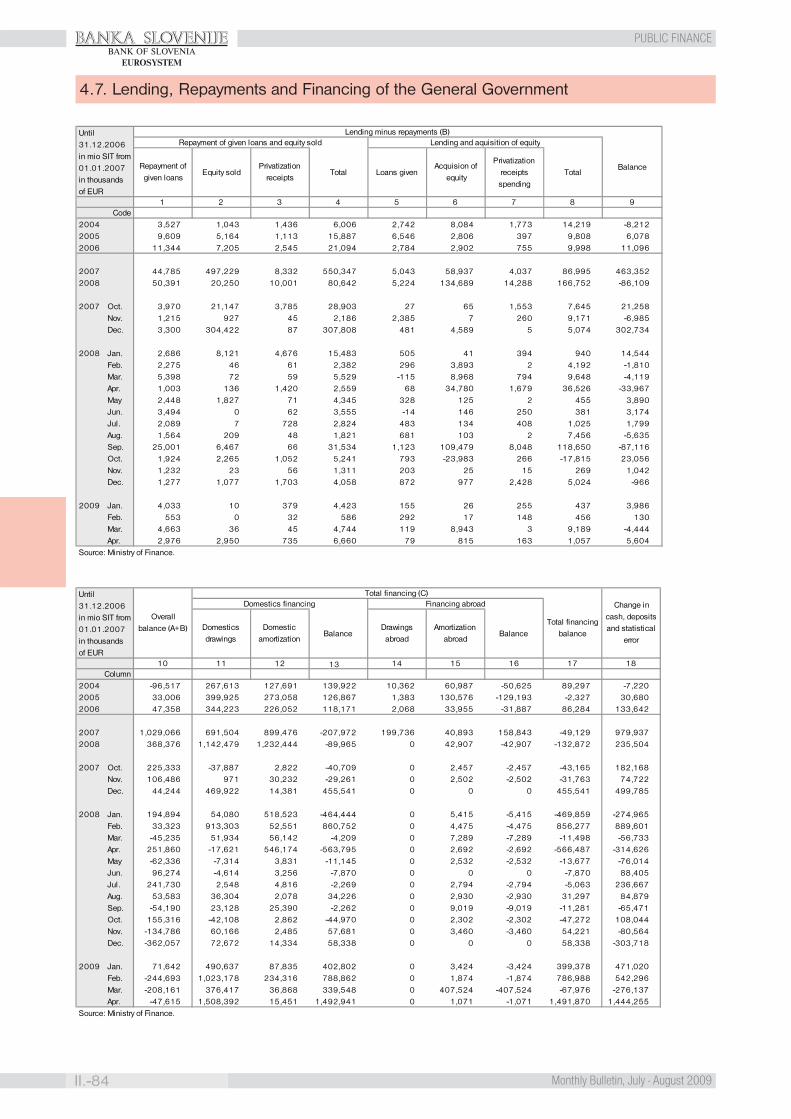
BANKA SLOVENIJE
II.-84 Monthly Bulletin, July - August 2009
PUBLIC FINANCEBANK OF SLOVENIA
EUROSYSTEM
4.7. Lending, Repayments and Financing of the General Government
Code2004 3,527 1,043 1,436 6,006 2,742 8,084 1,773 14,219 -8,2122005 9,609 5,164 1,113 15,887 6,546 2,806 397 9,808 6,0782006 11,344 7,205 2,545 21,094 2,784 2,902 755 9,998 11,096
2007 44,785 497,229 8,332 550,347 5,043 58,937 4,037 86,995 463,3522008 50,391 20,250 10,001 80,642 5,224 134,689 14,288 166,752 -86,109
2007 Oct. 3,970 21,147 3,785 28,903 27 65 1,553 7,645 21,258Nov. 1,215 927 45 2,186 2,385 7 260 9,171 -6,985Dec. 3,300 304,422 87 307,808 481 4,589 5 5,074 302,734
2008 Jan. 2,686 8,121 4,676 15,483 505 41 394 940 14,544Feb. 2,275 46 61 2,382 296 3,893 2 4,192 -1,810Mar. 5,398 72 59 5,529 -115 8,968 794 9,648 -4,119Apr. 1,003 136 1,420 2,559 68 34,780 1,679 36,526 -33,967May 2,448 1,827 71 4,345 328 125 2 455 3,890Jun. 3,494 0 62 3,555 -14 146 250 381 3,174Jul. 2,089 7 728 2,824 483 134 408 1,025 1,799Aug. 1,564 209 48 1,821 681 103 2 7,456 -5,635Sep. 25,001 6,467 66 31,534 1,123 109,479 8,048 118,650 -87,116Oct. 1,924 2,265 1,052 5,241 793 -23,983 266 -17,815 23,056Nov. 1,232 23 56 1,311 203 25 15 269 1,042Dec. 1,277 1,077 1,703 4,058 872 977 2,428 5,024 -966
2009 Jan. 4,033 10 379 4,423 155 26 255 437 3,986Feb. 553 0 32 586 292 17 148 456 130Mar. 4,663 36 45 4,744 119 8,943 3 9,189 -4,444Apr. 2,976 2,950 735 6,660 79 815 163 1,057 5,604
Until 31.12.2006 in mio SIT from 01.01.2007 in thousands of EUR
Total
1 2 3 4
Loans givenAcquision of
equityTotal
Privatization receipts spending
95 6 7 8
Source: Ministry of Finance.
Lending minus repayments (B)Repayment of given loans and equity sold Lending and aquisition of equity
BalanceRepayment of given loans
Equity soldPrivatization
receipts
13Column
2004 -96,517 267,613 127,691 139,922 10,362 60,987 -50,625 89,297 -7,2202005 33,006 399,925 273,058 126,867 1,383 130,576 -129,193 -2,327 30,6802006 47,358 344,223 226,052 118,171 2,068 33,955 -31,887 86,284 133,642
2007 1,029,066 691,504 899,476 -207,972 199,736 40,893 158,843 -49,129 979,9372008 368,376 1,142,479 1,232,444 -89,965 0 42,907 -42,907 -132,872 235,504
2007 Oct. 225,333 -37,887 2,822 -40,709 0 2,457 -2,457 -43,165 182,168Nov. 106,486 971 30,232 -29,261 0 2,502 -2,502 -31,763 74,722Dec. 44,244 469,922 14,381 455,541 0 0 0 455,541 499,785
2008 Jan. 194,894 54,080 518,523 -464,444 0 5,415 -5,415 -469,859 -274,965Feb. 33,323 913,303 52,551 860,752 0 4,475 -4,475 856,277 889,601Mar. -45,235 51,934 56,142 -4,209 0 7,289 -7,289 -11,498 -56,733Apr. 251,860 -17,621 546,174 -563,795 0 2,692 -2,692 -566,487 -314,626May -62,336 -7,314 3,831 -11,145 0 2,532 -2,532 -13,677 -76,014Jun. 96,274 -4,614 3,256 -7,870 0 0 0 -7,870 88,405Jul. 241,730 2,548 4,816 -2,269 0 2,794 -2,794 -5,063 236,667Aug. 53,583 36,304 2,078 34,226 0 2,930 -2,930 31,297 84,879Sep. -54,190 23,128 25,390 -2,262 0 9,019 -9,019 -11,281 -65,471Oct. 155,316 -42,108 2,862 -44,970 0 2,302 -2,302 -47,272 108,044Nov. -134,786 60,166 2,485 57,681 0 3,460 -3,460 54,221 -80,564Dec. -362,057 72,672 14,334 58,338 0 0 0 58,338 -303,718
2009 Jan. 71,642 490,637 87,835 402,802 0 3,424 -3,424 399,378 471,020Feb. -244,693 1,023,178 234,316 788,862 0 1,874 -1,874 786,988 542,296Mar. -208,161 376,417 36,868 339,548 0 407,524 -407,524 -67,976 -276,137Apr. -47,615 1,508,392 15,451 1,492,941 0 1,071 -1,071 1,491,870 1,444,255
Until 31.12.2006 in mio SIT from 01.01.2007 in thousands of EUR
Change in cash, deposits and statistical
error
Domestics financing Financing abroad
Total financing balance
Domestics drawings
Domestic amortization
BalanceDrawings
abroadAmortization
abroadBalance
Overall balance (A+B)
Total financing (C)
1710 11 12 14
Source: Ministry of Finance.
1815 16
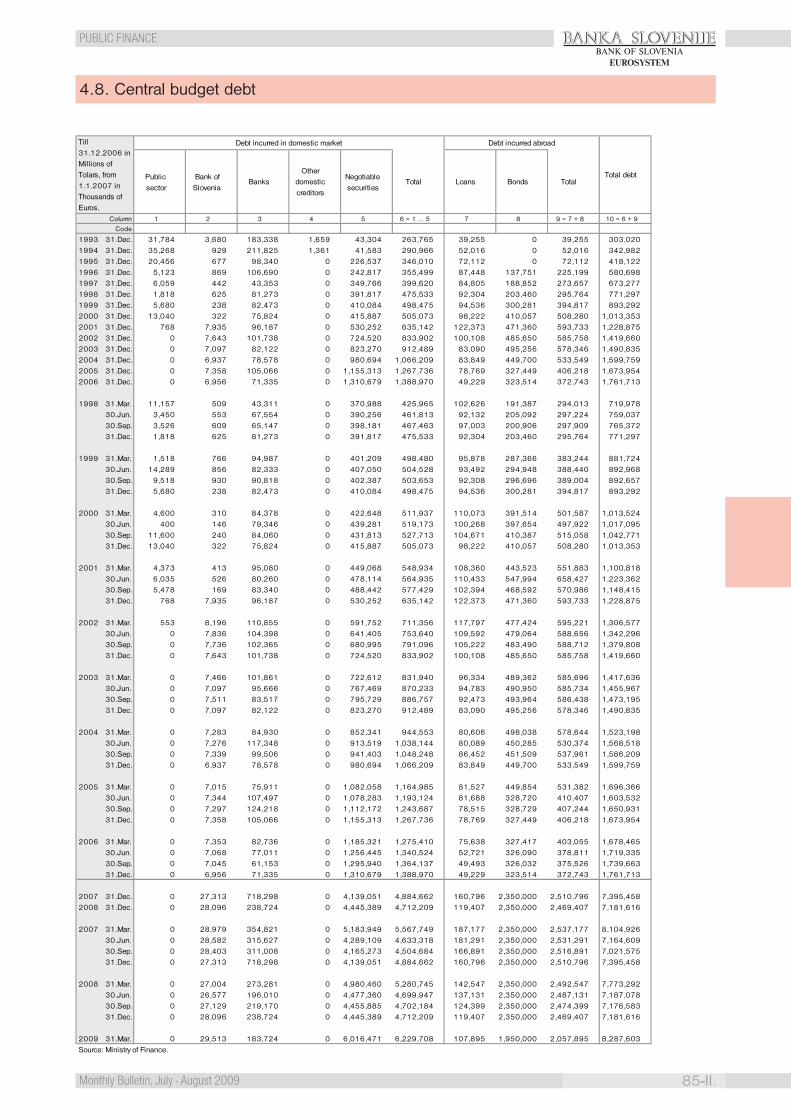
BANKA SLOVENIJE
85-II.Monthly Bulletin, July - August 2009
PUBLIC FINANCEBANK OF SLOVENIA
EUROSYSTEM
4.8. Central budget debt
Public sector
Bank of Slovenia
BanksOther
domestic creditors
Negotiable securities
Total Loans Bonds Total
Column 1 2 3 4 5 6 = 1 … 5 7 8 9 = 7 + 8 10 = 6 + 9
Code
1993 31.Dec. 31,784 3,680 183,338 1,659 43,304 263,765 39,255 0 39,255 303,0201994 31.Dec. 35,268 929 211,825 1,361 41,583 290,966 52,016 0 52,016 342,9821995 31.Dec. 20,456 677 98,340 0 226,537 346,010 72,112 0 72,112 418,1221996 31.Dec. 5,123 869 106,690 0 242,817 355,499 87,448 137,751 225,199 580,6981997 31.Dec. 6,059 442 43,353 0 349,766 399,620 84,805 188,852 273,657 673,2771998 31.Dec. 1,818 625 81,273 0 391,817 475,533 92,304 203,460 295,764 771,2971999 31.Dec. 5,680 238 82,473 0 410,084 498,475 94,536 300,281 394,817 893,2922000 31.Dec. 13,040 322 75,824 0 415,887 505,073 98,222 410,057 508,280 1,013,3532001 31.Dec. 768 7,935 96,187 0 530,252 635,142 122,373 471,360 593,733 1,228,8752002 31.Dec. 0 7,643 101,738 0 724,520 833,902 100,108 485,650 585,758 1,419,660 2003 31.Dec. 0 7,097 82,122 0 823,270 912,489 83,090 495,256 578,346 1,490,8352004 31.Dec. 0 6,937 78,578 0 980,694 1,066,209 83,849 449,700 533,549 1,599,7592005 31.Dec. 0 7,358 105,066 0 1,155,313 1,267,736 78,769 327,449 406,218 1,673,9542006 31.Dec. 0 6,956 71,335 0 1,310,679 1,388,970 49,229 323,514 372,743 1,761,713
1998 31.Mar. 11,157 509 43,311 0 370,988 425,965 102,626 191,387 294,013 719,978
30.Jun. 3,450 553 67,554 0 390,256 461,813 92,132 205,092 297,224 759,03730.Sep. 3,526 609 65,147 0 398,181 467,463 97,003 200,906 297,909 765,37231.Dec. 1,818 625 81,273 0 391,817 475,533 92,304 203,460 295,764 771,297
1999 31.Mar. 1,518 766 94,987 0 401,209 498,480 95,878 287,366 383,244 881,724
30.Jun. 14,289 856 82,333 0 407,050 504,528 93,492 294,948 388,440 892,96830.Sep. 9,518 930 90,818 0 402,387 503,653 92,308 296,696 389,004 892,65731.Dec. 5,680 238 82,473 0 410,084 498,475 94,536 300,281 394,817 893,292
2000 31.Mar. 4,600 310 84,378 0 422,648 511,937 110,073 391,514 501,587 1,013,524
30.Jun. 400 146 79,346 0 439,281 519,173 100,268 397,654 497,922 1,017,09530.Sep. 11,600 240 84,060 0 431,813 527,713 104,671 410,387 515,058 1,042,77131.Dec. 13,040 322 75,824 0 415,887 505,073 98,222 410,057 508,280 1,013,353
2001 31.Mar. 4,373 413 95,080 0 449,068 548,934 108,360 443,523 551,883 1,100,81830.Jun. 6,035 526 80,260 0 478,114 564,935 110,433 547,994 658,427 1,223,36230.Sep. 5,478 169 83,340 0 488,442 577,429 102,394 468,592 570,986 1,148,41531.Dec. 768 7,935 96,187 0 530,252 635,142 122,373 471,360 593,733 1,228,875
2002 31.Mar. 553 8,196 110,855 0 591,752 711,356 117,797 477,424 595,221 1,306,577 30.Jun. 0 7,836 104,398 0 641,405 753,640 109,592 479,064 588,656 1,342,296 30.Sep. 0 7,736 102,365 0 680,995 791,096 105,222 483,490 588,712 1,379,808 31.Dec. 0 7,643 101,738 0 724,520 833,902 100,108 485,650 585,758 1,419,660
2003 31.Mar. 0 7,466 101,861 0 722,612 831,940 96,334 489,362 585,696 1,417,636 30.Jun. 0 7,097 95,666 0 767,469 870,233 94,783 490,950 585,734 1,455,967 30.Sep. 0 7,511 83,517 0 795,729 886,757 92,473 493,964 586,438 1,473,195
31.Dec. 0 7,097 82,122 0 823,270 912,489 83,090 495,256 578,346 1,490,835
2004 31.Mar. 0 7,283 84,930 0 852,341 944,553 80,606 498,038 578,644 1,523,19830.Jun. 0 7,276 117,348 0 913,519 1,038,144 80,089 450,285 530,374 1,568,51830.Sep. 0 7,339 99,506 0 941,403 1,048,248 86,452 451,509 537,961 1,586,20931.Dec. 0 6,937 78,578 0 980,694 1,066,209 83,849 449,700 533,549 1,599,759
2005 31.Mar. 0 7,015 75,911 0 1,082,058 1,164,985 81,527 449,854 531,382 1,696,36630.Jun. 0 7,344 107,497 0 1,078,283 1,193,124 81,688 328,720 410,407 1,603,53230.Sep. 0 7,297 124,218 0 1,112,172 1,243,687 78,515 328,729 407,244 1,650,93131.Dec. 0 7,358 105,066 0 1,155,313 1,267,736 78,769 327,449 406,218 1,673,954
2006 31.Mar. 0 7,353 82,736 0 1,185,321 1,275,410 75,638 327,417 403,055 1,678,46530.Jun. 0 7,068 77,011 0 1,256,445 1,340,524 52,721 326,090 378,811 1,719,33530.Sep. 0 7,045 61,153 0 1,295,940 1,364,137 49,493 326,032 375,526 1,739,66331.Dec. 0 6,956 71,335 0 1,310,679 1,388,970 49,229 323,514 372,743 1,761,713
2007 31.Dec. 0 27,313 718,298 0 4,139,051 4,884,662 160,796 2,350,000 2,510,796 7,395,4582008 31.Dec. 0 28,096 238,724 0 4,445,389 4,712,209 119,407 2,350,000 2,469,407 7,181,616
2007 31.Mar. 0 28,979 354,821 0 5,183,949 5,567,749 187,177 2,350,000 2,537,177 8,104,92630.Jun. 0 28,582 315,627 0 4,289,109 4,633,318 181,291 2,350,000 2,531,291 7,164,60930.Sep. 0 28,403 311,008 0 4,165,273 4,504,684 166,891 2,350,000 2,516,891 7,021,57531.Dec. 0 27,313 718,298 0 4,139,051 4,884,662 160,796 2,350,000 2,510,796 7,395,458
2008 31.Mar. 0 27,004 273,281 0 4,980,460 5,280,745 142,547 2,350,000 2,492,547 7,773,29230.Jun. 0 26,577 196,010 0 4,477,360 4,699,947 137,131 2,350,000 2,487,131 7,187,07830.Sep. 0 27,129 219,170 0 4,455,885 4,702,184 124,399 2,350,000 2,474,399 7,176,58331.Dec. 0 28,096 238,724 0 4,445,389 4,712,209 119,407 2,350,000 2,469,407 7,181,616
2009 31.Mar. 0 29,513 183,724 0 6,016,471 6,229,708 107,895 1,950,000 2,057,895 8,287,603Source: Ministry of Finance.
Debt incurred in domestic market Debt incurred abroad
Total debt
Till 31.12.2006 in Millions of Tolars, from 1.1.2007 in Thousands of Euros.
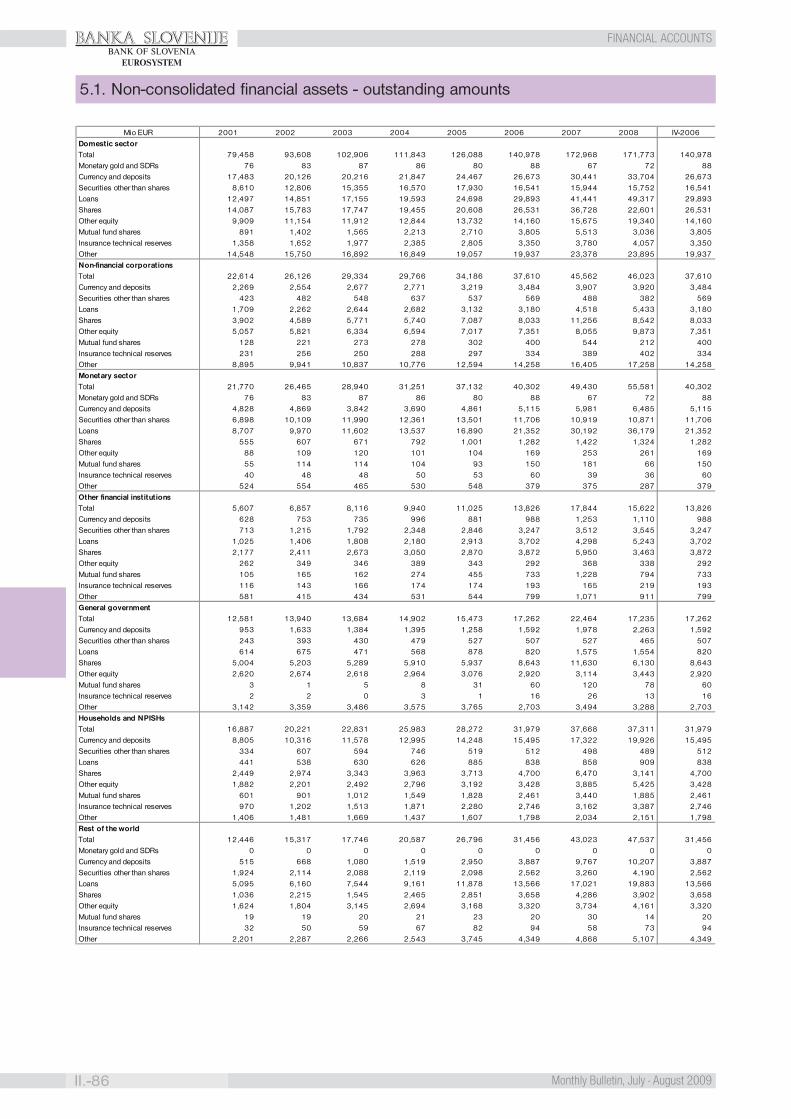
BANKA SLOVENIJE
II.-86 Monthly Bulletin, July - August 2009
FINANCIAL ACCOUNTSBANK OF SLOVENIA
EUROSYSTEM
5.1. Non-consolidated financial assets - outstanding amounts
Mio EUR 2001 2002 2003 2004 2005 2006 2007 2008 IV-2006Domestic sectorTotal 79,458 93,608 102,906 111,843 126,088 140,978 172,968 171,773 140,978Monetary gold and SDRs 76 83 87 86 80 88 67 72 88Currency and deposits 17,483 20,126 20,216 21,847 24,467 26,673 30,441 33,704 26,673Securities other than shares 8,610 12,806 15,355 16,570 17,930 16,541 15,944 15,752 16,541Loans 12,497 14,851 17,155 19,593 24,698 29,893 41,441 49,317 29,893Shares 14,087 15,783 17,747 19,455 20,608 26,531 36,728 22,601 26,531Other equity 9,909 11,154 11,912 12,844 13,732 14,160 15,675 19,340 14,160Mutual fund shares 891 1,402 1,565 2,213 2,710 3,805 5,513 3,036 3,805Insurance technical reserves 1,358 1,652 1,977 2,385 2,805 3,350 3,780 4,057 3,350Other 14,548 15,750 16,892 16,849 19,057 19,937 23,378 23,895 19,937Non-financial corporationsTotal 22,614 26,126 29,334 29,766 34,186 37,610 45,562 46,023 37,610Currency and deposits 2,269 2,554 2,677 2,771 3,219 3,484 3,907 3,920 3,484Securities other than shares 423 482 548 637 537 569 488 382 569Loans 1,709 2,262 2,644 2,682 3,132 3,180 4,518 5,433 3,180Shares 3,902 4,589 5,771 5,740 7,087 8,033 11,256 8,542 8,033Other equity 5,057 5,821 6,334 6,594 7,017 7,351 8,055 9,873 7,351Mutual fund shares 128 221 273 278 302 400 544 212 400Insurance technical reserves 231 256 250 288 297 334 389 402 334Other 8,895 9,941 10,837 10,776 12,594 14,258 16,405 17,258 14,258Monetary sectorTotal 21,770 26,465 28,940 31,251 37,132 40,302 49,430 55,581 40,302Monetary gold and SDRs 76 83 87 86 80 88 67 72 88Currency and deposits 4,828 4,869 3,842 3,690 4,861 5,115 5,981 6,485 5,115Securities other than shares 6,898 10,109 11,990 12,361 13,501 11,706 10,919 10,871 11,706Loans 8,707 9,970 11,602 13,537 16,890 21,352 30,192 36,179 21,352Shares 555 607 671 792 1,001 1,282 1,422 1,324 1,282Other equity 88 109 120 101 104 169 253 261 169Mutual fund shares 55 114 114 104 93 150 181 66 150Insurance technical reserves 40 48 48 50 53 60 39 36 60Other 524 554 465 530 548 379 375 287 379Other financial institutionsTotal 5,607 6,857 8,116 9,940 11,025 13,826 17,844 15,622 13,826Currency and deposits 628 753 735 996 881 988 1,253 1,110 988Securities other than shares 713 1,215 1,792 2,348 2,846 3,247 3,512 3,545 3,247Loans 1,025 1,406 1,808 2,180 2,913 3,702 4,298 5,243 3,702Shares 2,177 2,411 2,673 3,050 2,870 3,872 5,950 3,463 3,872Other equity 262 349 346 389 343 292 368 338 292Mutual fund shares 105 165 162 274 455 733 1,228 794 733Insurance technical reserves 116 143 166 174 174 193 165 219 193Other 581 415 434 531 544 799 1,071 911 799General governmentTotal 12,581 13,940 13,684 14,902 15,473 17,262 22,464 17,235 17,262Currency and deposits 953 1,633 1,384 1,395 1,258 1,592 1,978 2,263 1,592Securities other than shares 243 393 430 479 527 507 527 465 507Loans 614 675 471 568 878 820 1,575 1,554 820Shares 5,004 5,203 5,289 5,910 5,937 8,643 11,630 6,130 8,643Other equity 2,620 2,674 2,618 2,964 3,076 2,920 3,114 3,443 2,920Mutual fund shares 3 1 5 8 31 60 120 78 60Insurance technical reserves 2 2 0 3 1 16 26 13 16Other 3,142 3,359 3,486 3,575 3,765 2,703 3,494 3,288 2,703Households and NPISHsTotal 16,887 20,221 22,831 25,983 28,272 31,979 37,668 37,311 31,979Currency and deposits 8,805 10,316 11,578 12,995 14,248 15,495 17,322 19,926 15,495Securities other than shares 334 607 594 746 519 512 498 489 512Loans 441 538 630 626 885 838 858 909 838Shares 2,449 2,974 3,343 3,963 3,713 4,700 6,470 3,141 4,700Other equity 1,882 2,201 2,492 2,796 3,192 3,428 3,885 5,425 3,428Mutual fund shares 601 901 1,012 1,549 1,828 2,461 3,440 1,885 2,461Insurance technical reserves 970 1,202 1,513 1,871 2,280 2,746 3,162 3,387 2,746Other 1,406 1,481 1,669 1,437 1,607 1,798 2,034 2,151 1,798Rest of the worldTotal 12,446 15,317 17,746 20,587 26,796 31,456 43,023 47,537 31,456Monetary gold and SDRs 0 0 0 0 0 0 0 0 0Currency and deposits 515 668 1,080 1,519 2,950 3,887 9,767 10,207 3,887Securities other than shares 1,924 2,114 2,088 2,119 2,098 2,562 3,260 4,190 2,562Loans 5,095 6,160 7,544 9,161 11,878 13,566 17,021 19,883 13,566Shares 1,036 2,215 1,545 2,465 2,851 3,658 4,286 3,902 3,658Other equity 1,624 1,804 3,145 2,694 3,168 3,320 3,734 4,161 3,320Mutual fund shares 19 19 20 21 23 20 30 14 20Insurance technical reserves 32 50 59 67 82 94 58 73 94Other 2,201 2,287 2,266 2,543 3,745 4,349 4,868 5,107 4,349
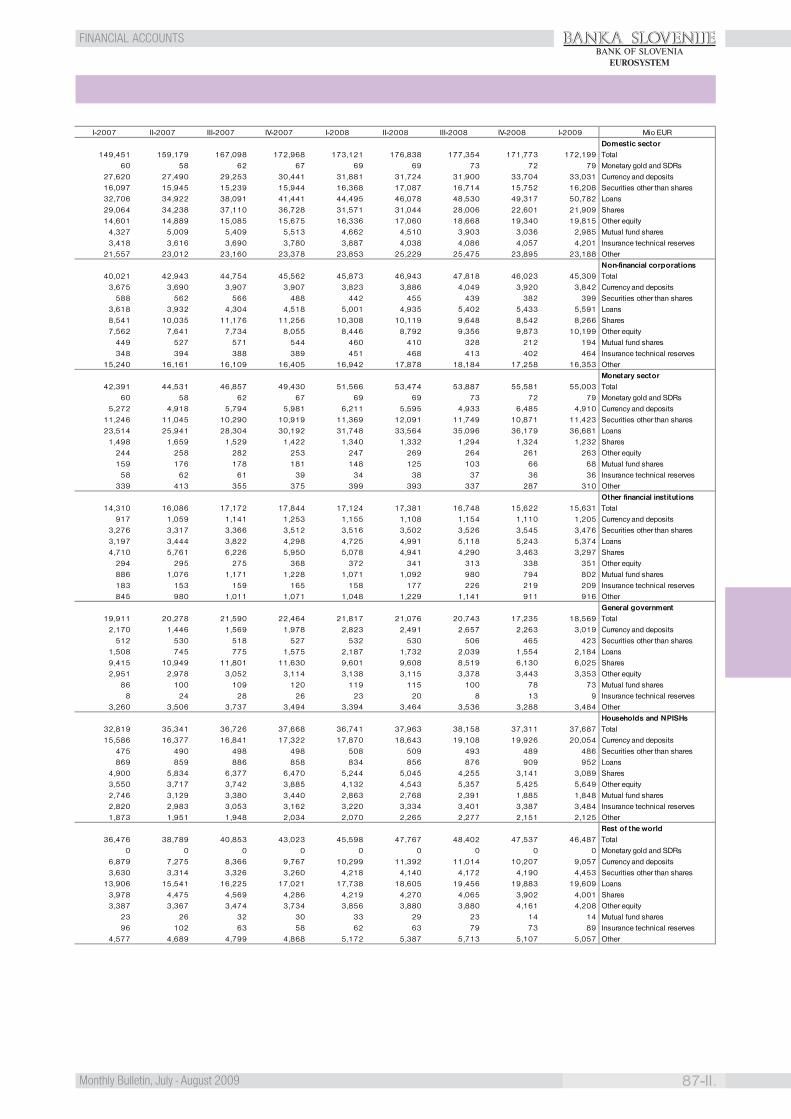
BANKA SLOVENIJE
87-II.Monthly Bulletin, July - August 2009
FINANCIAL ACCOUNTSBANK OF SLOVENIA
EUROSYSTEM
I-2007 II-2007 III-2007 IV-2007 I-2008 II-2008 III-2008 IV-2008 I-2009 Mio EURDomestic sector
149,451 159,179 167,098 172,968 173,121 176,838 177,354 171,773 172,199 Total60 58 62 67 69 69 73 72 79 Monetary gold and SDRs
27,620 27,490 29,253 30,441 31,881 31,724 31,900 33,704 33,031 Currency and deposits16,097 15,945 15,239 15,944 16,368 17,087 16,714 15,752 16,208 Securities other than shares32,706 34,922 38,091 41,441 44,495 46,078 48,530 49,317 50,782 Loans29,064 34,238 37,110 36,728 31,571 31,044 28,006 22,601 21,909 Shares14,601 14,889 15,085 15,675 16,336 17,060 18,668 19,340 19,815 Other equity
4,327 5,009 5,409 5,513 4,662 4,510 3,903 3,036 2,985 Mutual fund shares3,418 3,616 3,690 3,780 3,887 4,038 4,086 4,057 4,201 Insurance technical reserves
21,557 23,012 23,160 23,378 23,853 25,229 25,475 23,895 23,188 OtherNon-financial corporations
40,021 42,943 44,754 45,562 45,873 46,943 47,818 46,023 45,309 Total3,675 3,690 3,907 3,907 3,823 3,886 4,049 3,920 3,842 Currency and deposits
588 562 566 488 442 455 439 382 399 Securities other than shares3,618 3,932 4,304 4,518 5,001 4,935 5,402 5,433 5,591 Loans8,541 10,035 11,176 11,256 10,308 10,119 9,648 8,542 8,266 Shares7,562 7,641 7,734 8,055 8,446 8,792 9,356 9,873 10,199 Other equity
449 527 571 544 460 410 328 212 194 Mutual fund shares348 394 388 389 451 468 413 402 464 Insurance technical reserves
15,240 16,161 16,109 16,405 16,942 17,878 18,184 17,258 16,353 OtherMonetary sector
42,391 44,531 46,857 49,430 51,566 53,474 53,887 55,581 55,003 Total60 58 62 67 69 69 73 72 79 Monetary gold and SDRs
5,272 4,918 5,794 5,981 6,211 5,595 4,933 6,485 4,910 Currency and deposits11,246 11,045 10,290 10,919 11,369 12,091 11,749 10,871 11,423 Securities other than shares23,514 25,941 28,304 30,192 31,748 33,564 35,096 36,179 36,681 Loans
1,498 1,659 1,529 1,422 1,340 1,332 1,294 1,324 1,232 Shares244 258 282 253 247 269 264 261 263 Other equity159 176 178 181 148 125 103 66 68 Mutual fund shares
58 62 61 39 34 38 37 36 36 Insurance technical reserves339 413 355 375 399 393 337 287 310 Other
Other financial institutions14,310 16,086 17,172 17,844 17,124 17,381 16,748 15,622 15,631 Total
917 1,059 1,141 1,253 1,155 1,108 1,154 1,110 1,205 Currency and deposits3,276 3,317 3,366 3,512 3,516 3,502 3,526 3,545 3,476 Securities other than shares3,197 3,444 3,822 4,298 4,725 4,991 5,118 5,243 5,374 Loans4,710 5,761 6,226 5,950 5,078 4,941 4,290 3,463 3,297 Shares
294 295 275 368 372 341 313 338 351 Other equity886 1,076 1,171 1,228 1,071 1,092 980 794 802 Mutual fund shares183 153 159 165 158 177 226 219 209 Insurance technical reserves845 980 1,011 1,071 1,048 1,229 1,141 911 916 Other
General government19,911 20,278 21,590 22,464 21,817 21,076 20,743 17,235 18,569 Total
2,170 1,446 1,569 1,978 2,823 2,491 2,657 2,263 3,019 Currency and deposits512 530 518 527 532 530 506 465 423 Securities other than shares
1,508 745 775 1,575 2,187 1,732 2,039 1,554 2,184 Loans9,415 10,949 11,801 11,630 9,601 9,608 8,519 6,130 6,025 Shares2,951 2,978 3,052 3,114 3,138 3,115 3,378 3,443 3,353 Other equity
86 100 109 120 119 115 100 78 73 Mutual fund shares8 24 28 26 23 20 8 13 9 Insurance technical reserves
3,260 3,506 3,737 3,494 3,394 3,464 3,536 3,288 3,484 OtherHouseholds and NPISHs
32,819 35,341 36,726 37,668 36,741 37,963 38,158 37,311 37,687 Total15,586 16,377 16,841 17,322 17,870 18,643 19,108 19,926 20,054 Currency and deposits
475 490 498 498 508 509 493 489 486 Securities other than shares869 859 886 858 834 856 876 909 952 Loans
4,900 5,834 6,377 6,470 5,244 5,045 4,255 3,141 3,089 Shares3,550 3,717 3,742 3,885 4,132 4,543 5,357 5,425 5,649 Other equity2,746 3,129 3,380 3,440 2,863 2,768 2,391 1,885 1,848 Mutual fund shares2,820 2,983 3,053 3,162 3,220 3,334 3,401 3,387 3,484 Insurance technical reserves1,873 1,951 1,948 2,034 2,070 2,265 2,277 2,151 2,125 Other
Rest of the world36,476 38,789 40,853 43,023 45,598 47,767 48,402 47,537 46,487 Total
0 0 0 0 0 0 0 0 0 Monetary gold and SDRs6,879 7,275 8,366 9,767 10,299 11,392 11,014 10,207 9,057 Currency and deposits3,630 3,314 3,326 3,260 4,218 4,140 4,172 4,190 4,453 Securities other than shares
13,906 15,541 16,225 17,021 17,738 18,605 19,456 19,883 19,609 Loans3,978 4,475 4,569 4,286 4,219 4,270 4,065 3,902 4,001 Shares3,387 3,367 3,474 3,734 3,856 3,880 3,880 4,161 4,208 Other equity
23 26 32 30 33 29 23 14 14 Mutual fund shares96 102 63 58 62 63 79 73 89 Insurance technical reserves
4,577 4,689 4,799 4,868 5,172 5,387 5,713 5,107 5,057 Other
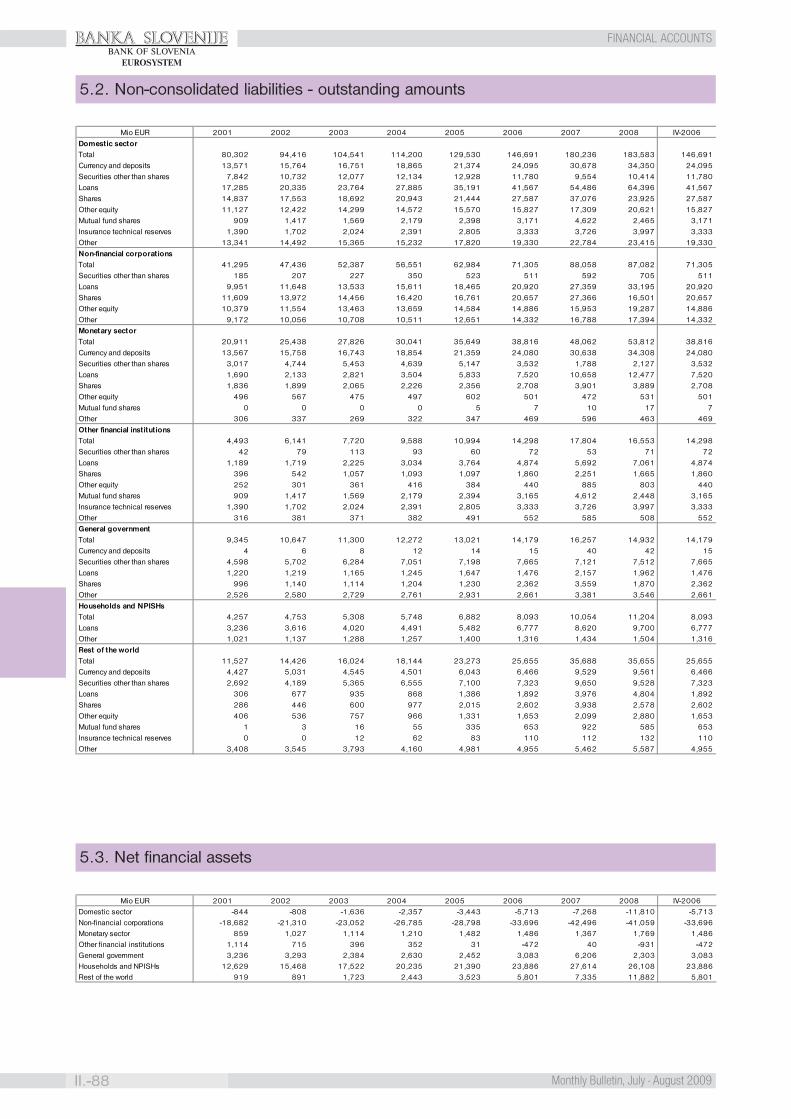
BANKA SLOVENIJE
II.-88 Monthly Bulletin, July - August 2009
FINANCIAL ACCOUNTSBANK OF SLOVENIA
EUROSYSTEM
5.2. Non-consolidated liabilities - outstanding amounts
Mio EUR 2001 2002 2003 2004 2005 2006 2007 2008 IV-2006Domestic sectorTotal 80,302 94,416 104,541 114,200 129,530 146,691 180,236 183,583 146,691Currency and deposits 13,571 15,764 16,751 18,865 21,374 24,095 30,678 34,350 24,095Securities other than shares 7,842 10,732 12,077 12,134 12,928 11,780 9,554 10,414 11,780Loans 17,285 20,335 23,764 27,885 35,191 41,567 54,486 64,396 41,567Shares 14,837 17,553 18,692 20,943 21,444 27,587 37,076 23,925 27,587Other equity 11,127 12,422 14,299 14,572 15,570 15,827 17,309 20,621 15,827Mutual fund shares 909 1,417 1,569 2,179 2,398 3,171 4,622 2,465 3,171Insurance technical reserves 1,390 1,702 2,024 2,391 2,805 3,333 3,726 3,997 3,333Other 13,341 14,492 15,365 15,232 17,820 19,330 22,784 23,415 19,330Non-financial corporationsTotal 41,295 47,436 52,387 56,551 62,984 71,305 88,058 87,082 71,305Securities other than shares 185 207 227 350 523 511 592 705 511Loans 9,951 11,648 13,533 15,611 18,465 20,920 27,359 33,195 20,920Shares 11,609 13,972 14,456 16,420 16,761 20,657 27,366 16,501 20,657Other equity 10,379 11,554 13,463 13,659 14,584 14,886 15,953 19,287 14,886Other 9,172 10,056 10,708 10,511 12,651 14,332 16,788 17,394 14,332Monetary sectorTotal 20,911 25,438 27,826 30,041 35,649 38,816 48,062 53,812 38,816Currency and deposits 13,567 15,758 16,743 18,854 21,359 24,080 30,638 34,308 24,080Securities other than shares 3,017 4,744 5,453 4,639 5,147 3,532 1,788 2,127 3,532Loans 1,690 2,133 2,821 3,504 5,833 7,520 10,658 12,477 7,520Shares 1,836 1,899 2,065 2,226 2,356 2,708 3,901 3,889 2,708Other equity 496 567 475 497 602 501 472 531 501Mutual fund shares 0 0 0 0 5 7 10 17 7Other 306 337 269 322 347 469 596 463 469Other financial institutionsTotal 4,493 6,141 7,720 9,588 10,994 14,298 17,804 16,553 14,298Securities other than shares 42 79 113 93 60 72 53 71 72Loans 1,189 1,719 2,225 3,034 3,764 4,874 5,692 7,061 4,874Shares 396 542 1,057 1,093 1,097 1,860 2,251 1,665 1,860Other equity 252 301 361 416 384 440 885 803 440Mutual fund shares 909 1,417 1,569 2,179 2,394 3,165 4,612 2,448 3,165Insurance technical reserves 1,390 1,702 2,024 2,391 2,805 3,333 3,726 3,997 3,333Other 316 381 371 382 491 552 585 508 552General governmentTotal 9,345 10,647 11,300 12,272 13,021 14,179 16,257 14,932 14,179Currency and deposits 4 6 8 12 14 15 40 42 15Securities other than shares 4,598 5,702 6,284 7,051 7,198 7,665 7,121 7,512 7,665Loans 1,220 1,219 1,165 1,245 1,647 1,476 2,157 1,962 1,476Shares 996 1,140 1,114 1,204 1,230 2,362 3,559 1,870 2,362Other 2,526 2,580 2,729 2,761 2,931 2,661 3,381 3,546 2,661Households and NPISHsTotal 4,257 4,753 5,308 5,748 6,882 8,093 10,054 11,204 8,093Loans 3,236 3,616 4,020 4,491 5,482 6,777 8,620 9,700 6,777Other 1,021 1,137 1,288 1,257 1,400 1,316 1,434 1,504 1,316Rest of the worldTotal 11,527 14,426 16,024 18,144 23,273 25,655 35,688 35,655 25,655Currency and deposits 4,427 5,031 4,545 4,501 6,043 6,466 9,529 9,561 6,466Securities other than shares 2,692 4,189 5,365 6,555 7,100 7,323 9,650 9,528 7,323Loans 306 677 935 868 1,386 1,892 3,976 4,804 1,892Shares 286 446 600 977 2,015 2,602 3,938 2,578 2,602Other equity 406 536 757 966 1,331 1,653 2,099 2,880 1,653Mutual fund shares 1 3 16 55 335 653 922 585 653Insurance technical reserves 0 0 12 62 83 110 112 132 110Other 3,408 3,545 3,793 4,160 4,981 4,955 5,462 5,587 4,955
5.3. Net financial assets
Mio EUR 2001 2002 2003 2004 2005 2006 2007 2008 IV-2006Domestic sector -844 -808 -1,636 -2,357 -3,443 -5,713 -7,268 -11,810 -5,713Non-financial corporations -18,682 -21,310 -23,052 -26,785 -28,798 -33,696 -42,496 -41,059 -33,696Monetary sector 859 1,027 1,114 1,210 1,482 1,486 1,367 1,769 1,486Other financial institutions 1,114 715 396 352 31 -472 40 -931 -472General government 3,236 3,293 2,384 2,630 2,452 3,083 6,206 2,303 3,083Households and NPISHs 12,629 15,468 17,522 20,235 21,390 23,886 27,614 26,108 23,886Rest of the world 919 891 1,723 2,443 3,523 5,801 7,335 11,882 5,801
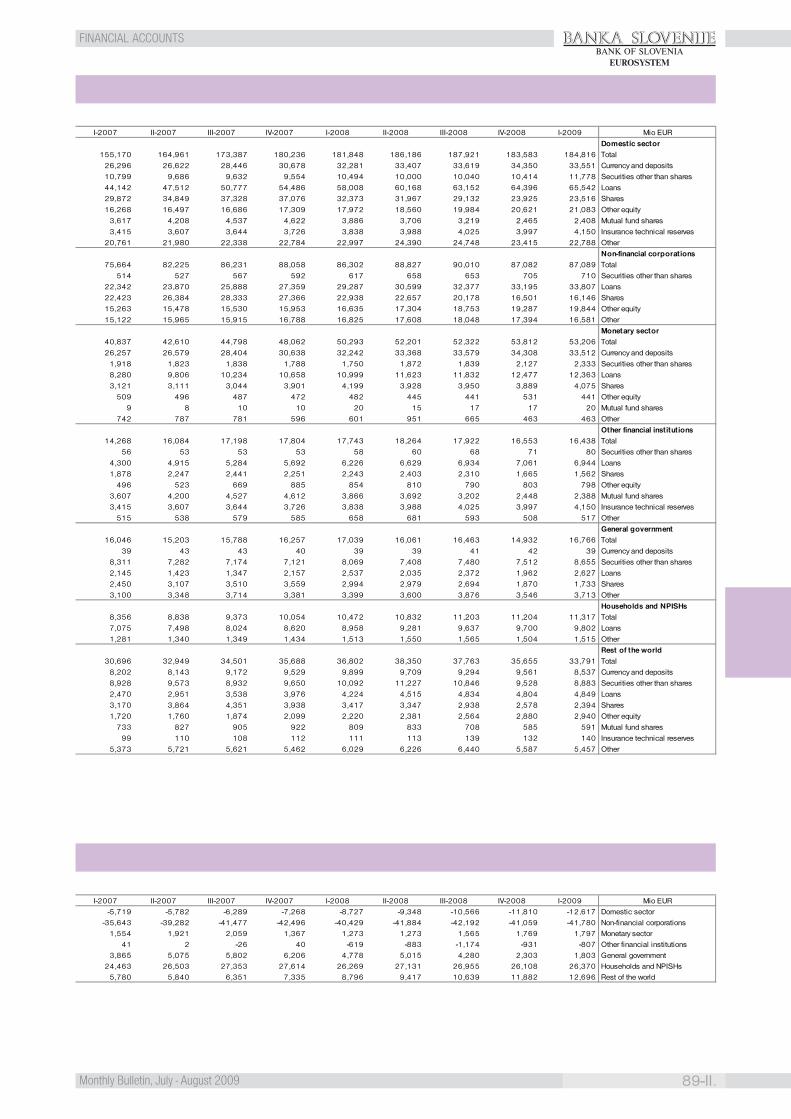
BANKA SLOVENIJE
89-II.Monthly Bulletin, July - August 2009
FINANCIAL ACCOUNTSBANK OF SLOVENIA
EUROSYSTEM
I-2007 II-2007 III-2007 IV-2007 I-2008 II-2008 III-2008 IV-2008 I-2009 Mio EURDomestic sector
155,170 164,961 173,387 180,236 181,848 186,186 187,921 183,583 184,816 Total26,296 26,622 28,446 30,678 32,281 33,407 33,619 34,350 33,551 Currency and deposits10,799 9,686 9,632 9,554 10,494 10,000 10,040 10,414 11,778 Securities other than shares44,142 47,512 50,777 54,486 58,008 60,168 63,152 64,396 65,542 Loans29,872 34,849 37,328 37,076 32,373 31,967 29,132 23,925 23,516 Shares16,268 16,497 16,686 17,309 17,972 18,560 19,984 20,621 21,083 Other equity
3,617 4,208 4,537 4,622 3,886 3,706 3,219 2,465 2,408 Mutual fund shares3,415 3,607 3,644 3,726 3,838 3,988 4,025 3,997 4,150 Insurance technical reserves
20,761 21,980 22,338 22,784 22,997 24,390 24,748 23,415 22,788 OtherNon-financial corporations
75,664 82,225 86,231 88,058 86,302 88,827 90,010 87,082 87,089 Total514 527 567 592 617 658 653 705 710 Securities other than shares
22,342 23,870 25,888 27,359 29,287 30,599 32,377 33,195 33,807 Loans22,423 26,384 28,333 27,366 22,938 22,657 20,178 16,501 16,146 Shares15,263 15,478 15,530 15,953 16,635 17,304 18,753 19,287 19,844 Other equity15,122 15,965 15,915 16,788 16,825 17,608 18,048 17,394 16,581 Other
Monetary sector40,837 42,610 44,798 48,062 50,293 52,201 52,322 53,812 53,206 Total26,257 26,579 28,404 30,638 32,242 33,368 33,579 34,308 33,512 Currency and deposits
1,918 1,823 1,838 1,788 1,750 1,872 1,839 2,127 2,333 Securities other than shares8,280 9,806 10,234 10,658 10,999 11,623 11,832 12,477 12,363 Loans3,121 3,111 3,044 3,901 4,199 3,928 3,950 3,889 4,075 Shares
509 496 487 472 482 445 441 531 441 Other equity9 8 10 10 20 15 17 17 20 Mutual fund shares
742 787 781 596 601 951 665 463 463 OtherOther financial institutions
14,268 16,084 17,198 17,804 17,743 18,264 17,922 16,553 16,438 Total56 53 53 53 58 60 68 71 80 Securities other than shares
4,300 4,915 5,284 5,692 6,226 6,629 6,934 7,061 6,944 Loans1,878 2,247 2,441 2,251 2,243 2,403 2,310 1,665 1,562 Shares
496 523 669 885 854 810 790 803 798 Other equity3,607 4,200 4,527 4,612 3,866 3,692 3,202 2,448 2,388 Mutual fund shares3,415 3,607 3,644 3,726 3,838 3,988 4,025 3,997 4,150 Insurance technical reserves
515 538 579 585 658 681 593 508 517 OtherGeneral government
16,046 15,203 15,788 16,257 17,039 16,061 16,463 14,932 16,766 Total39 43 43 40 39 39 41 42 39 Currency and deposits
8,311 7,282 7,174 7,121 8,069 7,408 7,480 7,512 8,655 Securities other than shares2,145 1,423 1,347 2,157 2,537 2,035 2,372 1,962 2,627 Loans2,450 3,107 3,510 3,559 2,994 2,979 2,694 1,870 1,733 Shares3,100 3,348 3,714 3,381 3,399 3,600 3,876 3,546 3,713 Other
Households and NPISHs8,356 8,838 9,373 10,054 10,472 10,832 11,203 11,204 11,317 Total7,075 7,498 8,024 8,620 8,958 9,281 9,637 9,700 9,802 Loans1,281 1,340 1,349 1,434 1,513 1,550 1,565 1,504 1,515 Other
Rest of the world30,696 32,949 34,501 35,688 36,802 38,350 37,763 35,655 33,791 Total
8,202 8,143 9,172 9,529 9,899 9,709 9,294 9,561 8,537 Currency and deposits8,928 9,573 8,932 9,650 10,092 11,227 10,846 9,528 8,883 Securities other than shares2,470 2,951 3,538 3,976 4,224 4,515 4,834 4,804 4,849 Loans3,170 3,864 4,351 3,938 3,417 3,347 2,938 2,578 2,394 Shares1,720 1,760 1,874 2,099 2,220 2,381 2,564 2,880 2,940 Other equity
733 827 905 922 809 833 708 585 591 Mutual fund shares99 110 108 112 111 113 139 132 140 Insurance technical reserves
5,373 5,721 5,621 5,462 6,029 6,226 6,440 5,587 5,457 Other
I-2007 II-2007 III-2007 IV-2007 I-2008 II-2008 III-2008 IV-2008 I-2009 Mio EUR-5,719 -5,782 -6,289 -7,268 -8,727 -9,348 -10,566 -11,810 -12,617 Domestic sector
-35,643 -39,282 -41,477 -42,496 -40,429 -41,884 -42,192 -41,059 -41,780 Non-financial corporations1,554 1,921 2,059 1,367 1,273 1,273 1,565 1,769 1,797 Monetary sector
41 2 -26 40 -619 -883 -1,174 -931 -807 Other financial institutions3,865 5,075 5,802 6,206 4,778 5,015 4,280 2,303 1,803 General government
24,463 26,503 27,353 27,614 26,269 27,131 26,955 26,108 26,370 Households and NPISHs5,780 5,840 6,351 7,335 8,796 9,417 10,639 11,882 12,696 Rest of the world
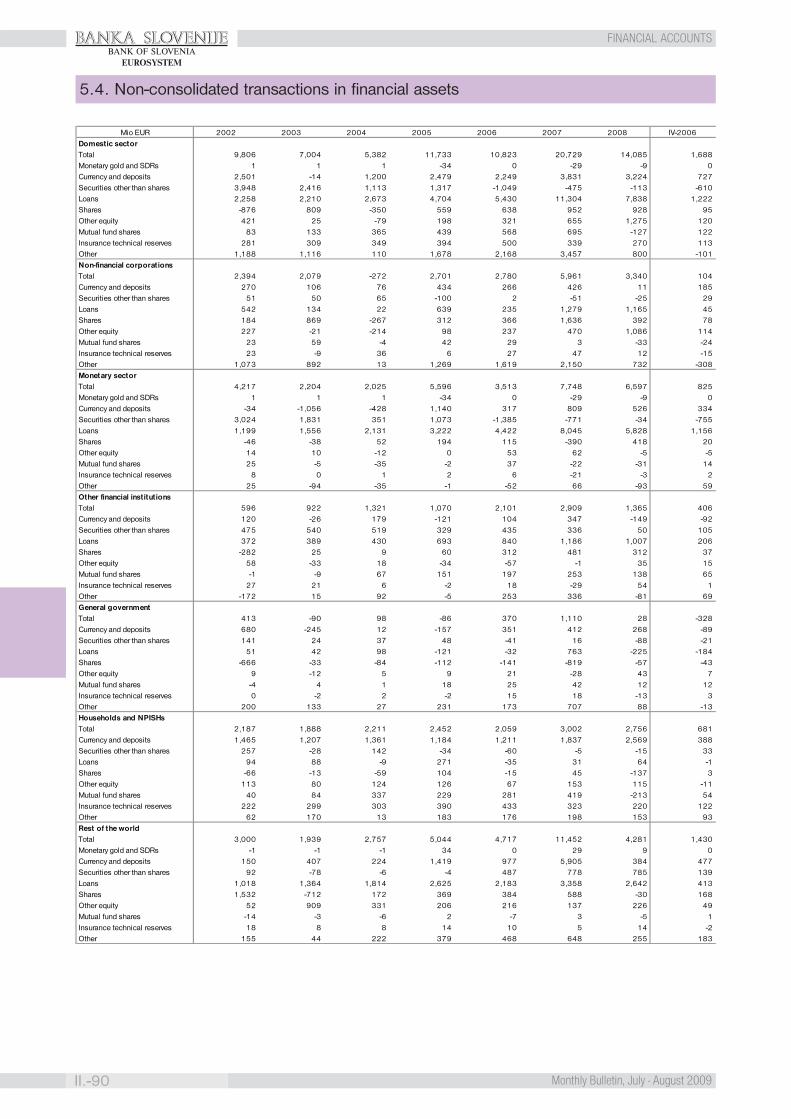
BANKA SLOVENIJE
II.-90 Monthly Bulletin, July - August 2009
FINANCIAL ACCOUNTSBANK OF SLOVENIA
EUROSYSTEM
5.4. Non-consolidated transactions in financial assets
Mio EUR 2002 2003 2004 2005 2006 2007 2008 IV-2006Domestic sectorTotal 9,806 7,004 5,382 11,733 10,823 20,729 14,085 1,688Monetary gold and SDRs 1 1 1 -34 0 -29 -9 0Currency and deposits 2,501 -14 1,200 2,479 2,249 3,831 3,224 727Securities other than shares 3,948 2,416 1,113 1,317 -1,049 -475 -113 -610Loans 2,258 2,210 2,673 4,704 5,430 11,304 7,838 1,222Shares -876 809 -350 559 638 952 928 95Other equity 421 25 -79 198 321 655 1,275 120Mutual fund shares 83 133 365 439 568 695 -127 122Insurance technical reserves 281 309 349 394 500 339 270 113Other 1,188 1,116 110 1,678 2,168 3,457 800 -101Non-financial corporationsTotal 2,394 2,079 -272 2,701 2,780 5,961 3,340 104Currency and deposits 270 106 76 434 266 426 11 185Securities other than shares 51 50 65 -100 2 -51 -25 29Loans 542 134 22 639 235 1,279 1,165 45Shares 184 869 -267 312 366 1,636 392 78Other equity 227 -21 -214 98 237 470 1,086 114Mutual fund shares 23 59 -4 42 29 3 -33 -24Insurance technical reserves 23 -9 36 6 27 47 12 -15Other 1,073 892 13 1,269 1,619 2,150 732 -308Monetary sectorTotal 4,217 2,204 2,025 5,596 3,513 7,748 6,597 825Monetary gold and SDRs 1 1 1 -34 0 -29 -9 0Currency and deposits -34 -1,056 -428 1,140 317 809 526 334Securities other than shares 3,024 1,831 351 1,073 -1,385 -771 -34 -755Loans 1,199 1,556 2,131 3,222 4,422 8,045 5,828 1,156Shares -46 -38 52 194 115 -390 418 20Other equity 14 10 -12 0 53 62 -5 -5Mutual fund shares 25 -5 -35 -2 37 -22 -31 14Insurance technical reserves 8 0 1 2 6 -21 -3 2Other 25 -94 -35 -1 -52 66 -93 59Other financial institutionsTotal 596 922 1,321 1,070 2,101 2,909 1,365 406Currency and deposits 120 -26 179 -121 104 347 -149 -92Securities other than shares 475 540 519 329 435 336 50 105Loans 372 389 430 693 840 1,186 1,007 206Shares -282 25 9 60 312 481 312 37Other equity 58 -33 18 -34 -57 -1 35 15Mutual fund shares -1 -9 67 151 197 253 138 65Insurance technical reserves 27 21 6 -2 18 -29 54 1Other -172 15 92 -5 253 336 -81 69General governmentTotal 413 -90 98 -86 370 1,110 28 -328Currency and deposits 680 -245 12 -157 351 412 268 -89Securities other than shares 141 24 37 48 -41 16 -88 -21Loans 51 42 98 -121 -32 763 -225 -184Shares -666 -33 -84 -112 -141 -819 -57 -43Other equity 9 -12 5 9 21 -28 43 7Mutual fund shares -4 4 1 18 25 42 12 12Insurance technical reserves 0 -2 2 -2 15 18 -13 3Other 200 133 27 231 173 707 88 -13Households and NPISHsTotal 2,187 1,888 2,211 2,452 2,059 3,002 2,756 681Currency and deposits 1,465 1,207 1,361 1,184 1,211 1,837 2,569 388Securities other than shares 257 -28 142 -34 -60 -5 -15 33Loans 94 88 -9 271 -35 31 64 -1Shares -66 -13 -59 104 -15 45 -137 3Other equity 113 80 124 126 67 153 115 -11Mutual fund shares 40 84 337 229 281 419 -213 54Insurance technical reserves 222 299 303 390 433 323 220 122Other 62 170 13 183 176 198 153 93Rest of the worldTotal 3,000 1,939 2,757 5,044 4,717 11,452 4,281 1,430Monetary gold and SDRs -1 -1 -1 34 0 29 9 0Currency and deposits 150 407 224 1,419 977 5,905 384 477Securities other than shares 92 -78 -6 -4 487 778 785 139Loans 1,018 1,364 1,814 2,625 2,183 3,358 2,642 413Shares 1,532 -712 172 369 384 588 -30 168Other equity 52 909 331 206 216 137 226 49Mutual fund shares -14 -3 -6 2 -7 3 -5 1Insurance technical reserves 18 8 8 14 10 5 14 -2Other 155 44 222 379 468 648 255 183
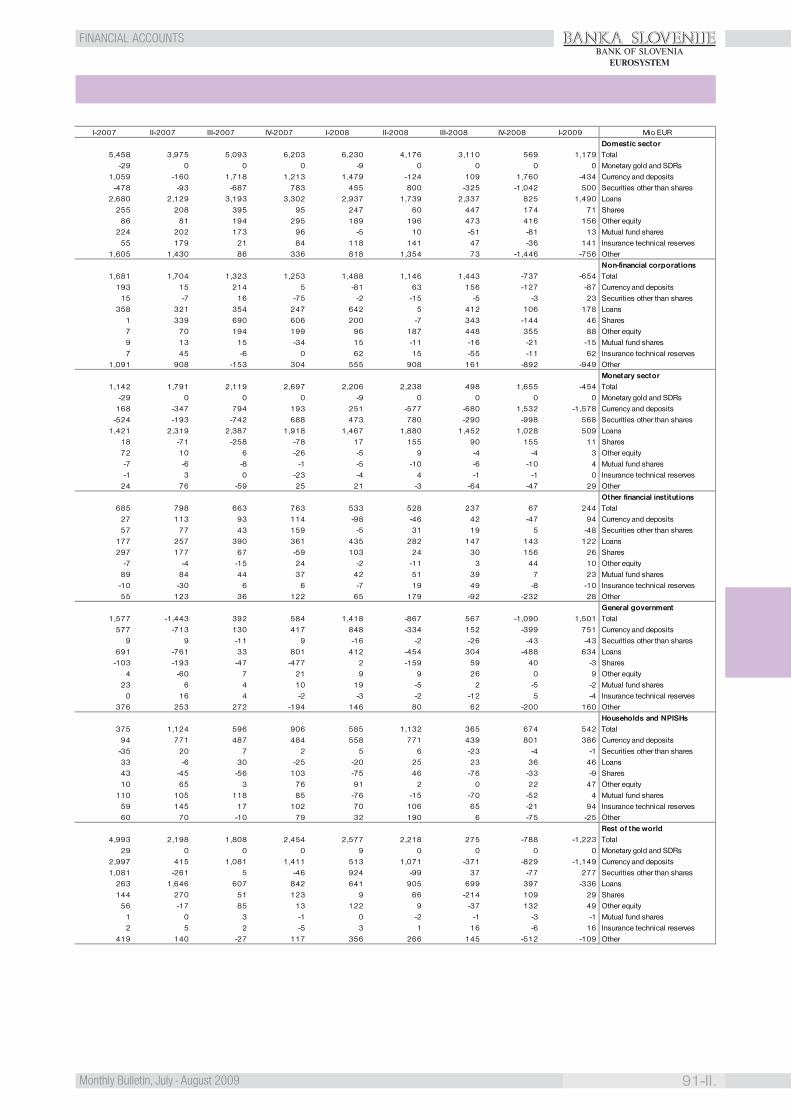
BANKA SLOVENIJE
91-II.Monthly Bulletin, July - August 2009
FINANCIAL ACCOUNTSBANK OF SLOVENIA
EUROSYSTEM
I-2007 II-2007 III-2007 IV-2007 I-2008 II-2008 III-2008 IV-2008 I-2009 Mio EURDomestic sector
5,458 3,975 5,093 6,203 6,230 4,176 3,110 569 1,179 Total-29 0 0 0 -9 0 0 0 0 Monetary gold and SDRs
1,059 -160 1,718 1,213 1,479 -124 109 1,760 -434 Currency and deposits-478 -93 -687 783 455 800 -325 -1,042 500 Securities other than shares
2,680 2,129 3,193 3,302 2,937 1,739 2,337 825 1,490 Loans255 208 395 95 247 60 447 174 71 Shares
86 81 194 295 189 196 473 416 156 Other equity224 202 173 96 -5 10 -51 -81 13 Mutual fund shares
55 179 21 84 118 141 47 -36 141 Insurance technical reserves1,605 1,430 86 336 818 1,354 73 -1,446 -756 Other
Non-financial corporations1,681 1,704 1,323 1,253 1,488 1,146 1,443 -737 -654 Total
193 15 214 5 -81 63 156 -127 -87 Currency and deposits15 -7 16 -75 -2 -15 -5 -3 23 Securities other than shares
358 321 354 247 642 5 412 106 178 Loans1 339 690 606 200 -7 343 -144 46 Shares7 70 194 199 96 187 448 355 88 Other equity9 13 15 -34 15 -11 -16 -21 -15 Mutual fund shares7 45 -6 0 62 15 -55 -11 62 Insurance technical reserves
1,091 908 -153 304 555 908 161 -892 -949 OtherMonetary sector
1,142 1,791 2,119 2,697 2,206 2,238 498 1,655 -454 Total-29 0 0 0 -9 0 0 0 0 Monetary gold and SDRs
168 -347 794 193 251 -577 -680 1,532 -1,578 Currency and deposits-524 -193 -742 688 473 780 -290 -998 568 Securities other than shares
1,421 2,319 2,387 1,918 1,467 1,880 1,452 1,028 509 Loans18 -71 -258 -78 17 155 90 155 11 Shares72 10 6 -26 -5 9 -4 -4 3 Other equity-7 -6 -8 -1 -5 -10 -6 -10 4 Mutual fund shares-1 3 0 -23 -4 4 -1 -1 0 Insurance technical reserves
24 76 -59 25 21 -3 -64 -47 29 OtherOther financial institutions
685 798 663 763 533 528 237 67 244 Total27 113 93 114 -98 -46 42 -47 94 Currency and deposits57 77 43 159 -5 31 19 5 -48 Securities other than shares
177 257 390 361 435 282 147 143 122 Loans297 177 67 -59 103 24 30 156 26 Shares
-7 -4 -15 24 -2 -11 3 44 10 Other equity89 84 44 37 42 51 39 7 23 Mutual fund shares-10 -30 6 6 -7 19 49 -8 -10 Insurance technical reserves55 123 36 122 65 179 -92 -232 28 Other
General government1,577 -1,443 392 584 1,418 -867 567 -1,090 1,501 Total
577 -713 130 417 848 -334 152 -399 751 Currency and deposits9 9 -11 9 -16 -2 -26 -43 -43 Securities other than shares
691 -761 33 801 412 -454 304 -488 634 Loans-103 -193 -47 -477 2 -159 59 40 -3 Shares
4 -60 7 21 9 9 26 0 9 Other equity23 6 4 10 19 -5 2 -5 -2 Mutual fund shares
0 16 4 -2 -3 -2 -12 5 -4 Insurance technical reserves376 253 272 -194 146 80 62 -200 160 Other
Households and NPISHs375 1,124 596 906 585 1,132 365 674 542 Total
94 771 487 484 558 771 439 801 386 Currency and deposits-35 20 7 2 5 6 -23 -4 -1 Securities other than shares33 -6 30 -25 -20 25 23 36 46 Loans43 -45 -56 103 -75 46 -76 -33 -9 Shares10 65 3 76 91 2 0 22 47 Other equity
110 105 118 85 -76 -15 -70 -52 4 Mutual fund shares59 145 17 102 70 106 65 -21 94 Insurance technical reserves60 70 -10 79 32 190 6 -75 -25 Other
Rest of the world4,993 2,198 1,808 2,454 2,577 2,218 275 -788 -1,223 Total
29 0 0 0 9 0 0 0 0 Monetary gold and SDRs2,997 415 1,081 1,411 513 1,071 -371 -829 -1,149 Currency and deposits1,081 -261 5 -46 924 -99 37 -77 277 Securities other than shares
263 1,646 607 842 641 905 699 397 -336 Loans144 270 51 123 9 66 -214 109 29 Shares
56 -17 85 13 122 9 -37 132 49 Other equity1 0 3 -1 0 -2 -1 -3 -1 Mutual fund shares2 5 2 -5 3 1 16 -6 16 Insurance technical reserves
419 140 -27 117 356 266 145 -512 -109 Other
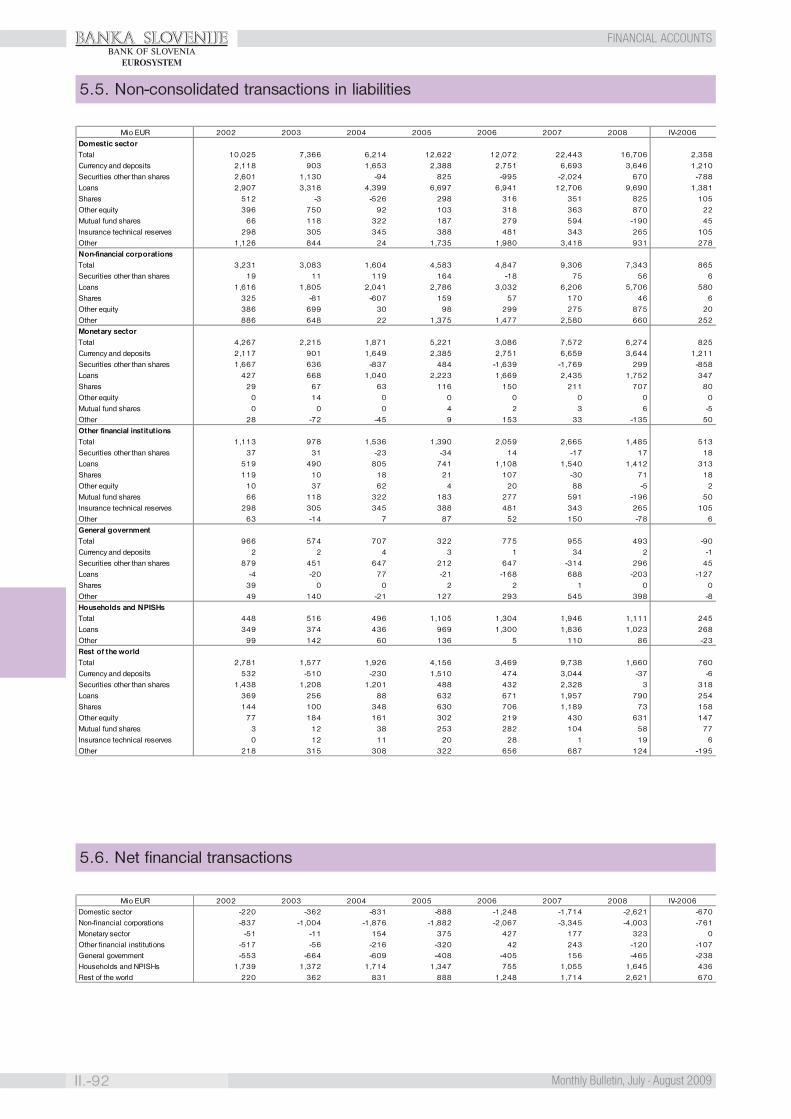
BANKA SLOVENIJE
II.-92 Monthly Bulletin, July - August 2009
FINANCIAL ACCOUNTSBANK OF SLOVENIA
EUROSYSTEM
5.5. Non-consolidated transactions in liabilities
Mio EUR 2002 2003 2004 2005 2006 2007 2008 IV-2006Domestic sectorTotal 10,025 7,366 6,214 12,622 12,072 22,443 16,706 2,358Currency and deposits 2,118 903 1,653 2,388 2,751 6,693 3,646 1,210Securities other than shares 2,601 1,130 -94 825 -995 -2,024 670 -788Loans 2,907 3,318 4,399 6,697 6,941 12,706 9,690 1,381Shares 512 -3 -526 298 316 351 825 105Other equity 396 750 92 103 318 363 870 22Mutual fund shares 66 118 322 187 279 594 -190 45Insurance technical reserves 298 305 345 388 481 343 265 105Other 1,126 844 24 1,735 1,980 3,418 931 278Non-financial corporationsTotal 3,231 3,083 1,604 4,583 4,847 9,306 7,343 865Securities other than shares 19 11 119 164 -18 75 56 6Loans 1,616 1,805 2,041 2,786 3,032 6,206 5,706 580Shares 325 -81 -607 159 57 170 46 6Other equity 386 699 30 98 299 275 875 20Other 886 648 22 1,375 1,477 2,580 660 252Monetary sectorTotal 4,267 2,215 1,871 5,221 3,086 7,572 6,274 825Currency and deposits 2,117 901 1,649 2,385 2,751 6,659 3,644 1,211Securities other than shares 1,667 636 -837 484 -1,639 -1,769 299 -858Loans 427 668 1,040 2,223 1,669 2,435 1,752 347Shares 29 67 63 116 150 211 707 80Other equity 0 14 0 0 0 0 0 0Mutual fund shares 0 0 0 4 2 3 6 -5Other 28 -72 -45 9 153 33 -135 50Other financial institutionsTotal 1,113 978 1,536 1,390 2,059 2,665 1,485 513Securities other than shares 37 31 -23 -34 14 -17 17 18Loans 519 490 805 741 1,108 1,540 1,412 313Shares 119 10 18 21 107 -30 71 18Other equity 10 37 62 4 20 88 -5 2Mutual fund shares 66 118 322 183 277 591 -196 50Insurance technical reserves 298 305 345 388 481 343 265 105Other 63 -14 7 87 52 150 -78 6General governmentTotal 966 574 707 322 775 955 493 -90Currency and deposits 2 2 4 3 1 34 2 -1Securities other than shares 879 451 647 212 647 -314 296 45Loans -4 -20 77 -21 -168 688 -203 -127Shares 39 0 0 2 2 1 0 0Other 49 140 -21 127 293 545 398 -8Households and NPISHsTotal 448 516 496 1,105 1,304 1,946 1,111 245Loans 349 374 436 969 1,300 1,836 1,023 268Other 99 142 60 136 5 110 86 -23Rest of the worldTotal 2,781 1,577 1,926 4,156 3,469 9,738 1,660 760Currency and deposits 532 -510 -230 1,510 474 3,044 -37 -6Securities other than shares 1,438 1,208 1,201 488 432 2,328 3 318Loans 369 256 88 632 671 1,957 790 254Shares 144 100 348 630 706 1,189 73 158Other equity 77 184 161 302 219 430 631 147Mutual fund shares 3 12 38 253 282 104 58 77Insurance technical reserves 0 12 11 20 28 1 19 6Other 218 315 308 322 656 687 124 -195
5.6. Net financial transactions
Mio EUR 2002 2003 2004 2005 2006 2007 2008 IV-2006Domestic sector -220 -362 -831 -888 -1,248 -1,714 -2,621 -670Non-financial corporations -837 -1,004 -1,876 -1,882 -2,067 -3,345 -4,003 -761Monetary sector -51 -11 154 375 427 177 323 0Other financial institutions -517 -56 -216 -320 42 243 -120 -107General government -553 -664 -609 -408 -405 156 -465 -238Households and NPISHs 1,739 1,372 1,714 1,347 755 1,055 1,645 436Rest of the world 220 362 831 888 1,248 1,714 2,621 670

BANKA SLOVENIJE
93-II.Monthly Bulletin, July - August 2009
FINANCIAL ACCOUNTSBANK OF SLOVENIA
EUROSYSTEM
I-2007 II-2007 III-2007 IV-2007 I-2008 II-2008 III-2008 IV-2008 I-2009 Mio EURDomestic sector
5,630 4,271 5,614 6,929 6,903 4,854 3,675 1,275 1,313 Total2,260 311 1,856 2,265 1,606 1,178 171 691 -840 Currency and deposits
-929 -996 -55 -45 874 -427 -2 225 1,411 Securities other than shares2,503 3,297 3,222 3,683 3,323 2,347 2,807 1,212 1,118 Loans
26 85 68 171 227 140 290 167 64 Shares80 16 142 124 224 63 290 292 155 Other equity
196 165 134 100 -52 -5 -47 -86 8 Mutual fund shares69 174 25 75 123 141 36 -35 149 Insurance technical reserves
1,425 1,218 221 554 577 1,417 128 -1,191 -752 OtherNon-financial corporations
2,371 2,356 1,881 2,698 2,198 2,426 2,152 568 -173 Total5 7 34 30 12 6 1 36 29 Securities other than shares
1,320 1,438 1,960 1,488 1,767 1,443 1,661 835 508 Loans10 54 20 86 39 73 -40 -26 61 Shares64 7 83 121 214 85 289 285 142 Other equity
972 850 -216 974 166 818 240 -563 -913 OtherMonetary sector
789 1,802 2,365 2,615 2,123 2,283 378 1,489 -760 Total2,227 307 1,857 2,268 1,607 1,177 170 690 -837 Currency and deposits
-1,646 -104 22 -41 9 77 5 208 188 Securities other than shares47 1,526 443 419 305 667 167 614 -113 Loans
0 28 34 148 187 16 330 174 2 Shares0 0 0 0 0 0 0 0 0 Other equity3 -1 1 1 10 -5 2 -1 3 Mutual fund shares
158 46 8 -180 6 351 -295 -197 -3 OtherOther financial institutions
491 996 638 540 694 618 222 -49 117 Total-14 -2 0 0 2 3 7 5 0 Securities other than shares
127 625 368 420 547 419 317 128 -59 Loans16 2 14 -62 2 51 0 18 2 Shares16 10 59 3 10 -22 0 7 12 Other equity
193 166 133 99 -62 1 -49 -86 5 Mutual fund shares69 174 25 75 123 141 36 -35 149 Insurance technical reserves83 23 39 5 72 26 -89 -87 7 Other
General government1,674 -1,368 197 452 1,500 -837 579 -748 1,990 Total
33 4 0 -3 -1 0 1 1 -3 Currency and deposits727 -896 -111 -33 850 -515 -15 -25 1,193 Securities other than shares669 -718 -76 814 387 -514 331 -407 662 Loans
0 1 0 0 0 0 0 0 0 Shares246 241 384 -326 264 191 261 -318 138 Other
Households and NPISHs305 485 533 624 388 364 343 16 139 Total339 427 528 542 317 332 332 42 120 Loans-35 57 5 82 70 31 11 -26 19 Other
Rest of the world4,821 1,902 1,287 1,728 1,903 1,540 -289 -1,494 -1,357 Total1,797 -56 944 359 386 -230 -433 240 -744 Currency and deposits1,531 642 -627 781 505 1,128 -286 -1,344 -634 Securities other than shares
440 478 577 461 255 296 229 10 36 Loans373 392 377 46 29 -15 -57 116 36 Shares
62 47 138 183 87 142 146 257 50 Other equity30 37 42 -5 47 13 -5 2 4 Mutual fund shares
-11 10 -2 3 -2 2 26 -7 8 Insurance technical reserves599 351 -162 -102 597 203 90 -767 -113 Other
I-2007 II-2007 III-2007 IV-2007 I-2008 II-2008 III-2008 IV-2008 I-2009 Mio EUR-172 -295 -521 -726 -673 -678 -564 -706 -134 Domestic sector-690 -652 -558 -1,445 -710 -1,280 -708 -1,305 -481 Non-financial corporations352 -11 -246 82 82 -45 119 167 305 Monetary sector193 -198 25 223 -161 -91 15 116 127 Other financial institutions-97 -75 195 133 -82 -30 -12 -341 -488 General government70 640 63 282 197 768 21 659 403 Households and NPISHs
172 295 521 726 673 678 564 706 134 Rest of the world
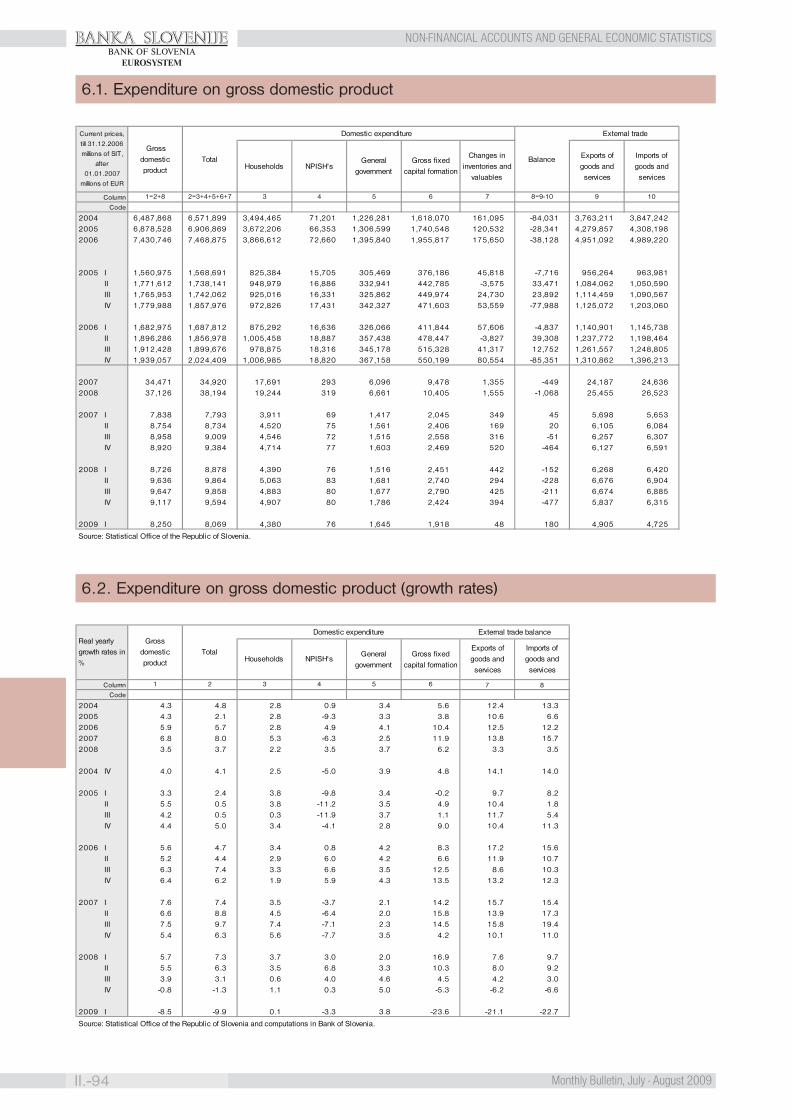
BANKA SLOVENIJE
II.-94 Monthly Bulletin, July - August 2009
NON-FINANCIAL ACCOUNTS AND GENERAL ECONOMIC STATISTICSBANK OF SLOVENIA
EUROSYSTEM
6.1. Expenditure on gross domestic product
6.2. Expenditure on gross domestic product (growth rates)
Column
Code
2004 6,487,868 6,571,899 3,494,465 71,201 1,226,281 1,618,070 161,095 -84,031 3,763,211 3,847,2422005 6,878,528 6,906,869 3,672,206 66,353 1,306,599 1,740,548 120,532 -28,341 4,279,857 4,308,1982006 7,430,746 7,468,875 3,866,612 72,660 1,395,840 1,955,817 175,650 -38,128 4,951,092 4,989,220
2005 I 1,560,975 1,568,691 825,384 15,705 305,469 376,186 45,818 -7,716 956,264 963,981II 1,771,612 1,738,141 948,979 16,886 332,941 442,785 -3,575 33,471 1,084,062 1,050,590III 1,765,953 1,742,062 925,016 16,331 325,862 449,974 24,730 23,892 1,114,459 1,090,567IV 1,779,988 1,857,976 972,826 17,431 342,327 471,603 53,559 -77,988 1,125,072 1,203,060
2006 I 1,682,975 1,687,812 875,292 16,636 326,066 411,844 57,606 -4,837 1,140,901 1,145,738II 1,896,286 1,856,978 1,005,458 18,887 357,438 478,447 -3,827 39,308 1,237,772 1,198,464III 1,912,428 1,899,676 978,875 18,316 345,178 515,328 41,317 12,752 1,261,557 1,248,805IV 1,939,057 2,024,409 1,006,985 18,820 367,158 550,199 80,554 -85,351 1,310,862 1,396,213
2007 34,471 34,920 17,691 293 6,096 9,478 1,355 -449 24,187 24,6362008 37,126 38,194 19,244 319 6,661 10,405 1,555 -1,068 25,455 26,523
2007 I 7,838 7,793 3,911 69 1,417 2,045 349 45 5,698 5,653II 8,754 8,734 4,520 75 1,561 2,406 169 20 6,105 6,084III 8,958 9,009 4,546 72 1,515 2,558 316 -51 6,257 6,307IV 8,920 9,384 4,714 77 1,603 2,469 520 -464 6,127 6,591
2008 I 8,726 8,878 4,390 76 1,516 2,451 442 -152 6,268 6,420II 9,636 9,864 5,063 83 1,681 2,740 294 -228 6,676 6,904III 9,647 9,858 4,883 80 1,677 2,790 425 -211 6,674 6,885IV 9,117 9,594 4,907 80 1,786 2,424 394 -477 5,837 6,315
2009 I 8,250 8,069 4,380 76 1,645 1,918 48 180 4,905 4,725
5
Balance
External trade
Exports of goods and services
Imports of goods and services
6 8=9-10 9 101=2+8 2=3+4+5+6+7 3 4 7
Current prices,
till 31.12.2006
millions of SIT,
after 01.01.2007
millions of EUR
Gross domestic product
Total
Domestic expenditure
Households NPISH'sGeneral
governmentGross fixed
capital formation
Changes in inventories and
valuables
Source: Statistical Office of the Republic of Slovenia.
ColumnCode
2004 4.3 4.8 2.8 0.9 3.4 5.6 12.4 13.32005 4.3 2.1 2.8 -9.3 3.3 3.8 10.6 6.62006 5.9 5.7 2.8 4.9 4.1 10.4 12.5 12.22007 6.8 8.0 5.3 -6.3 2.5 11.9 13.8 15.72008 3.5 3.7 2.2 3.5 3.7 6.2 3.3 3.5
2004 IV 4.0 4.1 2.5 -5.0 3.9 4.8 14.1 14.0
2005 I 3.3 2.4 3.8 -9.8 3.4 -0.2 9.7 8.2II 5.5 0.5 3.8 -11.2 3.5 4.9 10.4 1.8III 4.2 0.5 0.3 -11.9 3.7 1.1 11.7 5.4IV 4.4 5.0 3.4 -4.1 2.8 9.0 10.4 11.3
2006 I 5.6 4.7 3.4 0.8 4.2 8.3 17.2 15.6II 5.2 4.4 2.9 6.0 4.2 6.6 11.9 10.7III 6.3 7.4 3.3 6.6 3.5 12.5 8.6 10.3IV 6.4 6.2 1.9 5.9 4.3 13.5 13.2 12.3
2007 I 7.6 7.4 3.5 -3.7 2.1 14.2 15.7 15.4II 6.6 8.8 4.5 -6.4 2.0 15.8 13.9 17.3III 7.5 9.7 7.4 -7.1 2.3 14.5 15.8 19.4IV 5.4 6.3 5.6 -7.7 3.5 4.2 10.1 11.0
2008 I 5.7 7.3 3.7 3.0 2.0 16.9 7.6 9.7II 5.5 6.3 3.5 6.8 3.3 10.3 8.0 9.2III 3.9 3.1 0.6 4.0 4.6 4.5 4.2 3.0IV -0.8 -1.3 1.1 0.3 5.0 -5.3 -6.2 -6.6
2009 I -8.5 -9.9 0.1 -3.3 3.8 -23.6 -21.1 -22.7
General government
Gross fixed capital formation
Exports of goods and
services
3 4
Real yearly growth rates in %
Gross domestic product
TotalHouseholds NPISH's
Source: Statistical Office of the Republic of Slovenia and computations in Bank of Slovenia.
Domestic expenditure External trade balance
Imports of goods and
services
7 85 61 2

BANKA SLOVENIJE
95-II.Monthly Bulletin, July - August 2009
BANK OF SLOVENIAEUROSYSTEM
NON-FINANCIAL ACCOUNTS AND GENERAL ECONOMIC STATISTICS
6.3. Gross domestic product by activity
6.4. Gross domestic product by activity (growth rates)
Column
Code
2004 10.9 5.0 1.7 4.0 -3.0 6.1 10.9 2.2 5.0 2.7 4.3 4.32005 -1.1 3.8 6.1 4.6 4.2 5.7 13.2 2.2 3.8 5.7 5.0 4.32006 -4.0 7.3 15.4 5.4 1.9 9.7 9.1 6.3 7.3 0.7 4.1 5.92007 -11.0 6.3 16.0 5.8 8.7 9.2 13.8 11.2 6.3 -2.0 6.3 6.82008 -1.8 -1.3 14.1 5.5 0.1 5.3 11.9 2.0 -1.3 3.4 5.7 3.5
2004 III 12.3 6.6 4.2 4.4 -3.8 4.6 11.6 2.2 6.6 2.9 4.6 4.9IV 11.3 2.2 1.8 3.4 -1.0 5.7 16.0 1.7 2.2 6.6 4.6 4.0
2005 I -0.2 1.5 1.3 3.9 0.7 4.3 19.1 2.7 1.5 2.0 4.0 3.3II -1.3 4.8 13.0 5.0 4.1 6.5 14.4 2.2 4.8 7.7 8.8 5.5III -1.5 2.8 3.8 5.2 7.0 7.2 12.3 2.0 2.8 9.0 4.5 4.2IV -1.3 5.7 6.4 4.4 3.6 4.8 7.4 2.0 5.7 4.0 2.9 4.4
2006 I -4.5 8.2 6.7 5.4 2.9 12.0 4.1 5.9 8.2 0.7 4.8 5.6II -4.7 5.0 8.0 4.6 1.6 9.9 9.0 5.6 5.0 3.8 7.4 5.2III -3.9 8.3 19.0 6.1 0.4 8.5 9.7 6.5 8.3 0.0 3.3 6.3IV -3.0 7.9 26.4 5.7 3.5 8.4 13.7 7.0 7.9 -1.8 1.3 6.4
2007 I -9.5 7.6 26.0 6.8 6.3 8.9 11.8 10.0 7.6 -2.0 7.8 7.6II -9.9 7.2 20.8 5.8 10.1 8.9 13.1 10.6 7.2 -3.5 2.6 6.6III -11.2 5.6 14.4 6.1 11.8 10.5 17.3 13.5 5.6 -0.9 8.4 7.5IV -13.5 4.7 6.5 4.8 5.2 8.4 13.1 10.5 4.7 -1.8 6.6 5.4
2008 I -2.2 1.4 27.1 7.3 1.2 5.9 16.2 4.8 1.4 3.2 5.9 5.7II -2.8 3.1 13.9 6.9 -1.0 5.3 11.3 3.2 3.1 2.3 11.8 5.5III -0.2 -0.6 14.2 6.2 -1.1 5.3 12.3 2.4 -0.6 5.1 5.4 3.9IV -2.1 -9.1 3.1 1.7 1.8 4.9 8.2 -1.7 -9.1 3.1 0.0 -0.8
2009 I -10.4 -19.2 -13.2 -11.3 -4.3 -5.5 8.7 -8.9 -19.2 0.9 -6.6 -8.5
Transport, storage,
communications
Financial intermediation
Real growth rates in % Construction
Trade, motor vechicle repair
Hotels and restaurants
121 2 3 4 5 6 97 8 10 11
Value added
Net taxes on products
Gross domestic product
Agriculture, fishing
Mining, manufacturing and electricity
supply
Public administration,
education, health and social work
Other services
Real estate, renting and business activities
ColumnCode
2004 152,930 1,605,616 1,403,923 354,869 1,197,328 1,211,809 1,153,169 5,675,721 812,147 6,487,8682005 162,942 1,646,851 1,433,933 406,177 1,299,404 1,279,956 1,233,709 6,029,039 849,489 6,878,5282006 154,892 1,764,917 1,536,636 474,517 1,401,079 1,419,664 1,300,248 6,515,317 915,429 7,430,746
2005 I 35,379 388,104 333,838 85,415 289,940 298,457 286,550 1,383,846 177,129 1,560,975II 46,665 437,076 380,613 103,977 336,201 312,776 310,173 1,546,868 224,744 1,771,612III 39,051 408,492 361,850 111,954 344,982 333,722 313,025 1,551,226 214,728 1,765,953IV 41,847 413,179 357,632 104,830 328,282 335,001 323,961 1,547,100 232,888 1,779,988
2006 I 32,118 419,017 358,520 92,476 314,727 327,417 303,997 1,489,751 193,224 1,682,975II 41,299 456,464 395,384 112,660 361,581 356,908 329,141 1,658,053 238,233 1,896,286III 38,017 442,840 393,322 134,816 371,498 367,287 327,570 1,682,028 230,400 1,912,428IV 43,459 446,596 389,410 134,564 353,273 368,052 339,541 1,685,484 253,573 1,939,057
2007 715 7,987 7,070 2,407 6,766 6,671 5,684 30,231 4,240 34,4712008 745 8,171 7,195 2,908 7,278 7,302 6,163 32,567 4,559 37,126
2007 I 150 1,910 1,681 508 1,532 1,500 1,335 6,935 903 7,838II 194 2,095 1,841 596 1,722 1,613 1,443 7,663 1,091 8,754III 177 2,003 1,807 676 1,805 1,774 1,435 7,869 1,089 8,958IV 194 1,979 1,740 627 1,708 1,784 1,471 7,764 1,156 8,920
2008 I 161 1,987 1,743 680 1,694 1,706 1,452 7,682 1,044 8,726II 216 2,204 1,939 721 1,853 1,869 1,536 8,400 1,236 9,636III 174 2,090 1,890 822 1,986 1,872 1,571 8,514 1,133 9,647IV 194 1,889 1,623 684 1,744 1,855 1,604 7,970 1,147 9,117
2009 I 138 1,687 1,432 614 1,586 1,634 1,583 7,242 1,008 8,250
Vir: Statistični urad RS.
9 10
Net taxes on products
Gross domestic product
8
TotalOther services
5 6
Current prices
till 31.12.2006
in Millions of SIT, after
01.01.2007
Millions of EUR
Value added
Trade, motor vechicle repair,
hotels and restaurants, transport,
communications
Financial intermediation, real estate, renting and business activities
Manufacturing
Agriculture, fishing, hunting, forestry
Mining, manufacturing and electricity
supply
Construction
of which:
71 2 3 4
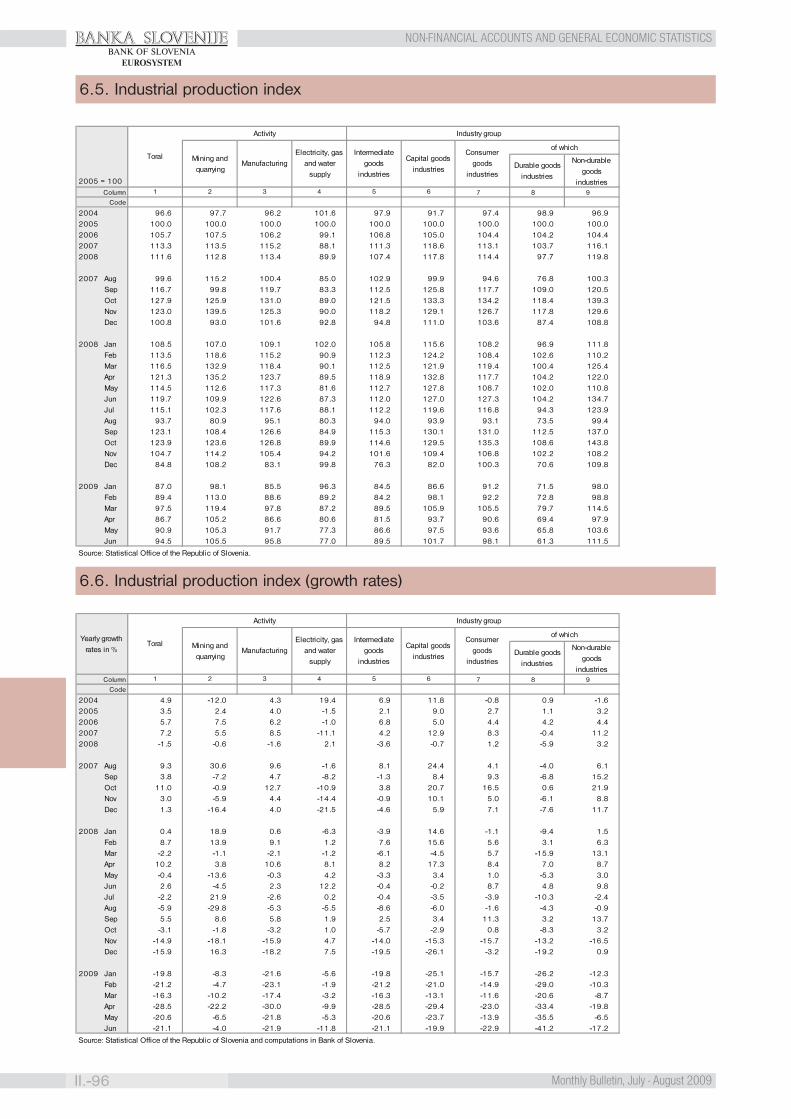
BANKA SLOVENIJE
II.-96 Monthly Bulletin, July - August 2009
NON-FINANCIAL ACCOUNTS AND GENERAL ECONOMIC STATISTICSBANK OF SLOVENIA
EUROSYSTEM
6.5. Industrial production index
6.6. Industrial production index (growth rates)
Column 7 8 9
Code
2004 96.6 97.7 96.2 101.6 97.9 91.7 97.4 98.9 96.92005 100.0 100.0 100.0 100.0 100.0 100.0 100.0 100.0 100.02006 105.7 107.5 106.2 99.1 106.8 105.0 104.4 104.2 104.42007 113.3 113.5 115.2 88.1 111.3 118.6 113.1 103.7 116.12008 111.6 112.8 113.4 89.9 107.4 117.8 114.4 97.7 119.8
2007 Aug 99.6 115.2 100.4 85.0 102.9 99.9 94.6 76.8 100.3Sep 116.7 99.8 119.7 83.3 112.5 125.8 117.7 109.0 120.5Oct 127.9 125.9 131.0 89.0 121.5 133.3 134.2 118.4 139.3Nov 123.0 139.5 125.3 90.0 118.2 129.1 126.7 117.8 129.6Dec 100.8 93.0 101.6 92.8 94.8 111.0 103.6 87.4 108.8
2008 Jan 108.5 107.0 109.1 102.0 105.8 115.6 108.2 96.9 111.8Feb 113.5 118.6 115.2 90.9 112.3 124.2 108.4 102.6 110.2Mar 116.5 132.9 118.4 90.1 112.5 121.9 119.4 100.4 125.4Apr 121.3 135.2 123.7 89.5 118.9 132.8 117.7 104.2 122.0May 114.5 112.6 117.3 81.6 112.7 127.8 108.7 102.0 110.8Jun 119.7 109.9 122.6 87.3 112.0 127.0 127.3 104.2 134.7Jul 115.1 102.3 117.6 88.1 112.2 119.6 116.8 94.3 123.9Aug 93.7 80.9 95.1 80.3 94.0 93.9 93.1 73.5 99.4Sep 123.1 108.4 126.6 84.9 115.3 130.1 131.0 112.5 137.0Oct 123.9 123.6 126.8 89.9 114.6 129.5 135.3 108.6 143.8Nov 104.7 114.2 105.4 94.2 101.6 109.4 106.8 102.2 108.2Dec 84.8 108.2 83.1 99.8 76.3 82.0 100.3 70.6 109.8
2009 Jan 87.0 98.1 85.5 96.3 84.5 86.6 91.2 71.5 98.0Feb 89.4 113.0 88.6 89.2 84.2 98.1 92.2 72.8 98.8Mar 97.5 119.4 97.8 87.2 89.5 105.9 105.5 79.7 114.5Apr 86.7 105.2 86.6 80.6 81.5 93.7 90.6 69.4 97.9May 90.9 105.3 91.7 77.3 86.6 97.5 93.6 65.8 103.6Jun 94.5 105.5 95.8 77.0 89.5 101.7 98.1 61.3 111.5
of which
Durable goods industries
Non-durable goods
industries
Source: Statistical Office of the Republic of Slovenia.
5 61 2 3 4
Industry group
Intermediate goods
industries2005 = 100
Toral
Activity
Mining and quarrying
ManufacturingElectricity, gas
and water supply
Capital goods industries
Consumer goods
industries
Column 7 8 9
Code
2004 4.9 -12.0 4.3 19.4 6.9 11.8 -0.8 0.9 -1.62005 3.5 2.4 4.0 -1.5 2.1 9.0 2.7 1.1 3.22006 5.7 7.5 6.2 -1.0 6.8 5.0 4.4 4.2 4.42007 7.2 5.5 8.5 -11.1 4.2 12.9 8.3 -0.4 11.22008 -1.5 -0.6 -1.6 2.1 -3.6 -0.7 1.2 -5.9 3.2
2007 Aug 9.3 30.6 9.6 -1.6 8.1 24.4 4.1 -4.0 6.1Sep 3.8 -7.2 4.7 -8.2 -1.3 8.4 9.3 -6.8 15.2Oct 11.0 -0.9 12.7 -10.9 3.8 20.7 16.5 0.6 21.9Nov 3.0 -5.9 4.4 -14.4 -0.9 10.1 5.0 -6.1 8.8Dec 1.3 -16.4 4.0 -21.5 -4.6 5.9 7.1 -7.6 11.7
2008 Jan 0.4 18.9 0.6 -6.3 -3.9 14.6 -1.1 -9.4 1.5Feb 8.7 13.9 9.1 1.2 7.6 15.6 5.6 3.1 6.3Mar -2.2 -1.1 -2.1 -1.2 -6.1 -4.5 5.7 -15.9 13.1Apr 10.2 3.8 10.6 8.1 8.2 17.3 8.4 7.0 8.7May -0.4 -13.6 -0.3 4.2 -3.3 3.4 1.0 -5.3 3.0Jun 2.6 -4.5 2.3 12.2 -0.4 -0.2 8.7 4.8 9.8Jul -2.2 21.9 -2.6 0.2 -0.4 -3.5 -3.9 -10.3 -2.4Aug -5.9 -29.8 -5.3 -5.5 -8.6 -6.0 -1.6 -4.3 -0.9Sep 5.5 8.6 5.8 1.9 2.5 3.4 11.3 3.2 13.7Oct -3.1 -1.8 -3.2 1.0 -5.7 -2.9 0.8 -8.3 3.2Nov -14.9 -18.1 -15.9 4.7 -14.0 -15.3 -15.7 -13.2 -16.5Dec -15.9 16.3 -18.2 7.5 -19.5 -26.1 -3.2 -19.2 0.9
2009 Jan -19.8 -8.3 -21.6 -5.6 -19.8 -25.1 -15.7 -26.2 -12.3Feb -21.2 -4.7 -23.1 -1.9 -21.2 -21.0 -14.9 -29.0 -10.3Mar -16.3 -10.2 -17.4 -3.2 -16.3 -13.1 -11.6 -20.6 -8.7Apr -28.5 -22.2 -30.0 -9.9 -28.5 -29.4 -23.0 -33.4 -19.8May -20.6 -6.5 -21.8 -5.3 -20.6 -23.7 -13.9 -35.5 -6.5Jun -21.1 -4.0 -21.9 -11.8 -21.1 -19.9 -22.9 -41.2 -17.2
of which
Durable goods industries
Non-durable goods
industries
Source: Statistical Office of the Republic of Slovenia and computations in Bank of Slovenia.
5 61 2 3 4
Industry group
Intermediate goods
industries
Yearly growth rates in %
Toral
Activity
Mining and quarrying
ManufacturingElectricity, gas
and water supply
Capital goods industries
Consumer goods
industries
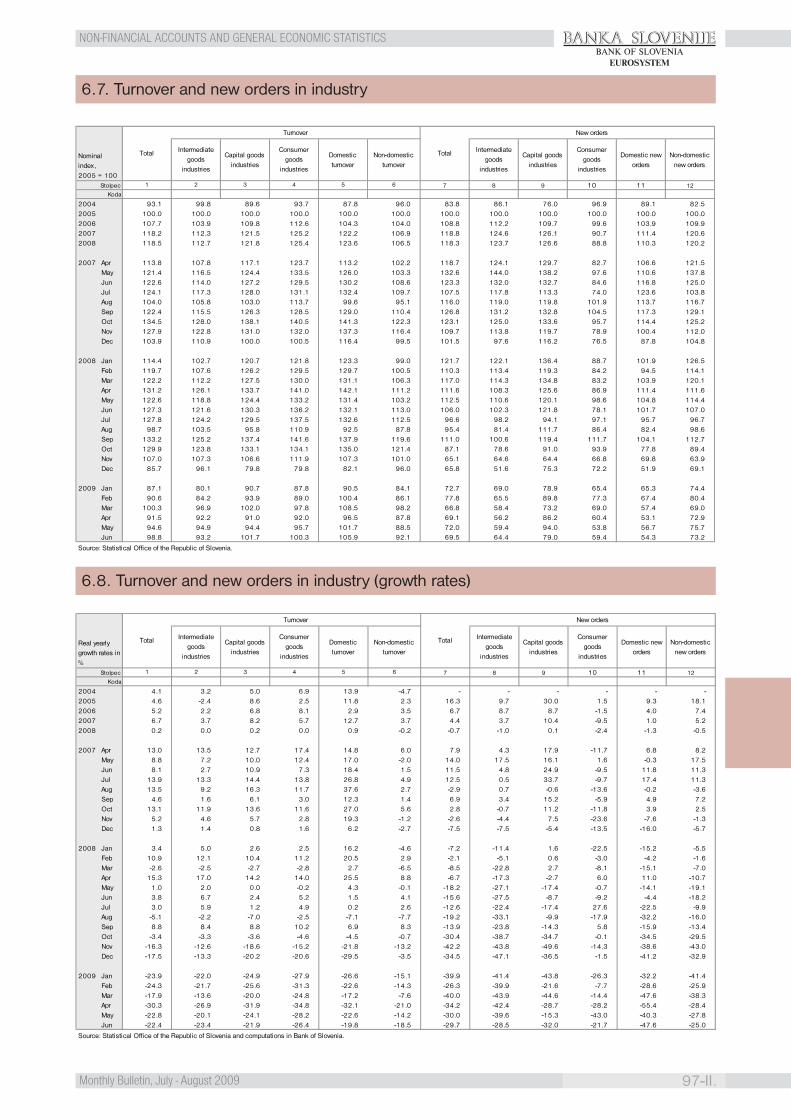
BANKA SLOVENIJE
97-II.Monthly Bulletin, July - August 2009
BANK OF SLOVENIAEUROSYSTEM
NON-FINANCIAL ACCOUNTS AND GENERAL ECONOMIC STATISTICS
6.7. Turnover and new orders in industry
6.8. Turnover and new orders in industry (growth rates)
Stolpec
Koda
2004 4.1 3.2 5.0 6.9 13.9 -4.7 - - - - - -2005 4.6 -2.4 8.6 2.5 11.8 2.3 16.3 9.7 30.0 1.5 9.3 18.12006 5.2 2.2 6.8 8.1 2.9 3.5 6.7 8.7 8.7 -1.5 4.0 7.42007 6.7 3.7 8.2 5.7 12.7 3.7 4.4 3.7 10.4 -9.5 1.0 5.22008 0.2 0.0 0.2 0.0 0.9 -0.2 -0.7 -1.0 0.1 -2.4 -1.3 -0.5
2007 Apr 13.0 13.5 12.7 17.4 14.8 6.0 7.9 4.3 17.9 -11.7 6.8 8.2May 8.8 7.2 10.0 12.4 17.0 -2.0 14.0 17.5 16.1 1.6 -0.3 17.5Jun 8.1 2.7 10.9 7.3 18.4 1.5 11.5 4.8 24.9 -9.5 11.8 11.3Jul 13.9 13.3 14.4 13.8 26.8 4.9 12.5 0.5 33.7 -9.7 17.4 11.3Aug 13.5 9.2 16.3 11.7 37.6 2.7 -2.9 0.7 -0.6 -13.6 -0.2 -3.6Sep 4.6 1.6 6.1 3.0 12.3 1.4 6.9 3.4 15.2 -5.9 4.9 7.2Oct 13.1 11.9 13.6 11.6 27.0 5.6 2.8 -0.7 11.2 -11.8 3.9 2.5Nov 5.2 4.6 5.7 2.8 19.3 -1.2 -2.6 -4.4 7.5 -23.6 -7.6 -1.3Dec 1.3 1.4 0.8 1.6 6.2 -2.7 -7.5 -7.5 -5.4 -13.5 -16.0 -5.7
2008 Jan 3.4 5.0 2.6 2.5 16.2 -4.6 -7.2 -11.4 1.6 -22.5 -15.2 -5.5Feb 10.9 12.1 10.4 11.2 20.5 2.9 -2.1 -5.1 0.6 -3.0 -4.2 -1.6Mar -2.6 -2.5 -2.7 -2.8 2.7 -6.5 -8.5 -22.8 2.7 -8.1 -15.1 -7.0Apr 15.3 17.0 14.2 14.0 25.5 8.8 -6.7 -17.3 -2.7 6.0 11.0 -10.7May 1.0 2.0 0.0 -0.2 4.3 -0.1 -18.2 -27.1 -17.4 -0.7 -14.1 -19.1Jun 3.8 6.7 2.4 5.2 1.5 4.1 -15.6 -27.5 -8.7 -9.2 -4.4 -18.2Jul 3.0 5.9 1.2 4.9 0.2 2.6 -12.6 -22.4 -17.4 27.6 -22.5 -9.9Aug -5.1 -2.2 -7.0 -2.5 -7.1 -7.7 -19.2 -33.1 -9.9 -17.9 -32.2 -16.0Sep 8.8 8.4 8.8 10.2 6.9 8.3 -13.9 -23.8 -14.3 5.8 -15.9 -13.4Oct -3.4 -3.3 -3.6 -4.6 -4.5 -0.7 -30.4 -38.7 -34.7 -0.1 -34.5 -29.5Nov -16.3 -12.6 -18.6 -15.2 -21.8 -13.2 -42.2 -43.8 -49.6 -14.3 -38.6 -43.0Dec -17.5 -13.3 -20.2 -20.6 -29.5 -3.5 -34.5 -47.1 -36.5 -1.5 -41.2 -32.9
2009 Jan -23.9 -22.0 -24.9 -27.9 -26.6 -15.1 -39.9 -41.4 -43.8 -26.3 -32.2 -41.4Feb -24.3 -21.7 -25.6 -31.3 -22.6 -14.3 -26.3 -39.9 -21.6 -7.7 -28.6 -25.9Mar -17.9 -13.6 -20.0 -24.8 -17.2 -7.6 -40.0 -43.9 -44.6 -14.4 -47.6 -38.3Apr -30.3 -26.9 -31.9 -34.8 -32.1 -21.0 -34.2 -42.4 -28.7 -28.2 -55.4 -28.4May -22.8 -20.1 -24.1 -28.2 -22.6 -14.2 -30.0 -39.6 -15.3 -43.0 -40.3 -27.8Jun -22.4 -23.4 -21.9 -26.4 -19.8 -18.5 -29.7 -28.5 -32.0 -21.7 -47.6 -25.0
Real yearly growth rates in %
Non-domestic turnover
Capital goods industries
Consumer goods
industries
Domestic turnover
Total
Turnover
10 11 121 2 3 4
Intermediate goods
industries
7 8
Total
New orders
Domestic new orders
Non-domestic new orders
5 6
Source: Statistical Office of the Republic of Slovenia and computations in Bank of Slovenia.
Intermediate goods
industries
Capital goods industries
Consumer goods
industries
9
StolpecKoda
2004 93.1 99.8 89.6 93.7 87.8 96.0 83.8 86.1 76.0 96.9 89.1 82.52005 100.0 100.0 100.0 100.0 100.0 100.0 100.0 100.0 100.0 100.0 100.0 100.02006 107.7 103.9 109.8 112.6 104.3 104.0 108.8 112.2 109.7 99.6 103.9 109.92007 118.2 112.3 121.5 125.2 122.2 106.9 118.8 124.6 126.1 90.7 111.4 120.62008 118.5 112.7 121.8 125.4 123.6 106.5 118.3 123.7 126.6 88.8 110.3 120.2
2007 Apr 113.8 107.8 117.1 123.7 113.2 102.2 118.7 124.1 129.7 82.7 106.6 121.5May 121.4 116.5 124.4 133.5 126.0 103.3 132.6 144.0 138.2 97.6 110.6 137.8Jun 122.6 114.0 127.2 129.5 130.2 108.6 123.3 132.0 132.7 84.6 116.8 125.0Jul 124.1 117.3 128.0 131.1 132.4 109.7 107.5 117.8 113.3 74.0 123.6 103.8Aug 104.0 105.8 103.0 113.7 99.6 95.1 116.0 119.0 119.8 101.9 113.7 116.7Sep 122.4 115.5 126.3 128.5 129.0 110.4 126.8 131.2 132.8 104.5 117.3 129.1Oct 134.5 128.0 138.1 140.5 141.3 122.3 123.1 125.0 133.6 95.7 114.4 125.2Nov 127.9 122.8 131.0 132.0 137.3 116.4 109.7 113.8 119.7 78.9 100.4 112.0Dec 103.9 110.9 100.0 100.5 116.4 99.5 101.5 97.6 116.2 76.5 87.8 104.8
2008 Jan 114.4 102.7 120.7 121.8 123.3 99.0 121.7 122.1 136.4 88.7 101.9 126.5Feb 119.7 107.6 126.2 129.5 129.7 100.5 110.3 113.4 119.3 84.2 94.5 114.1Mar 122.2 112.2 127.5 130.0 131.1 106.3 117.0 114.3 134.8 83.2 103.9 120.1Apr 131.2 126.1 133.7 141.0 142.1 111.2 111.6 108.3 125.6 86.9 111.4 111.6May 122.6 118.8 124.4 133.2 131.4 103.2 112.5 110.6 120.1 98.6 104.8 114.4Jun 127.3 121.6 130.3 136.2 132.1 113.0 106.0 102.3 121.8 78.1 101.7 107.0Jul 127.8 124.2 129.5 137.5 132.6 112.5 96.6 98.2 94.1 97.1 95.7 96.7Aug 98.7 103.5 95.8 110.9 92.5 87.8 95.4 81.4 111.7 86.4 82.4 98.6Sep 133.2 125.2 137.4 141.6 137.9 119.6 111.0 100.6 119.4 111.7 104.1 112.7Oct 129.9 123.8 133.1 134.1 135.0 121.4 87.1 78.6 91.0 93.9 77.8 89.4Nov 107.0 107.3 106.6 111.9 107.3 101.0 65.1 64.6 64.4 66.8 69.8 63.9Dec 85.7 96.1 79.8 79.8 82.1 96.0 65.8 51.6 75.3 72.2 51.9 69.1
2009 Jan 87.1 80.1 90.7 87.8 90.5 84.1 72.7 69.0 78.9 65.4 65.3 74.4Feb 90.6 84.2 93.9 89.0 100.4 86.1 77.8 65.5 89.8 77.3 67.4 80.4Mar 100.3 96.9 102.0 97.8 108.5 98.2 66.8 58.4 73.2 69.0 57.4 69.0Apr 91.5 92.2 91.0 92.0 96.5 87.8 69.1 56.2 86.2 60.4 53.1 72.9May 94.6 94.9 94.4 95.7 101.7 88.5 72.0 59.4 94.0 53.8 56.7 75.7Jun 98.8 93.2 101.7 100.3 105.9 92.1 69.5 64.4 79.0 59.4 54.3 73.2
Nominal index, 2005 = 100
Non-domestic turnover
Capital goods industries
Consumer goods
industries
Domestic turnover
Total
Turnover
10 11 121 2 3 4
Intermediate goods
industries
7 8
Total
New orders
Domestic new orders
Non-domestic new orders
5 6
Source: Statistical Office of the Republic of Slovenia.
Intermediate goods
industries
Capital goods industries
Consumer goods
industries
9
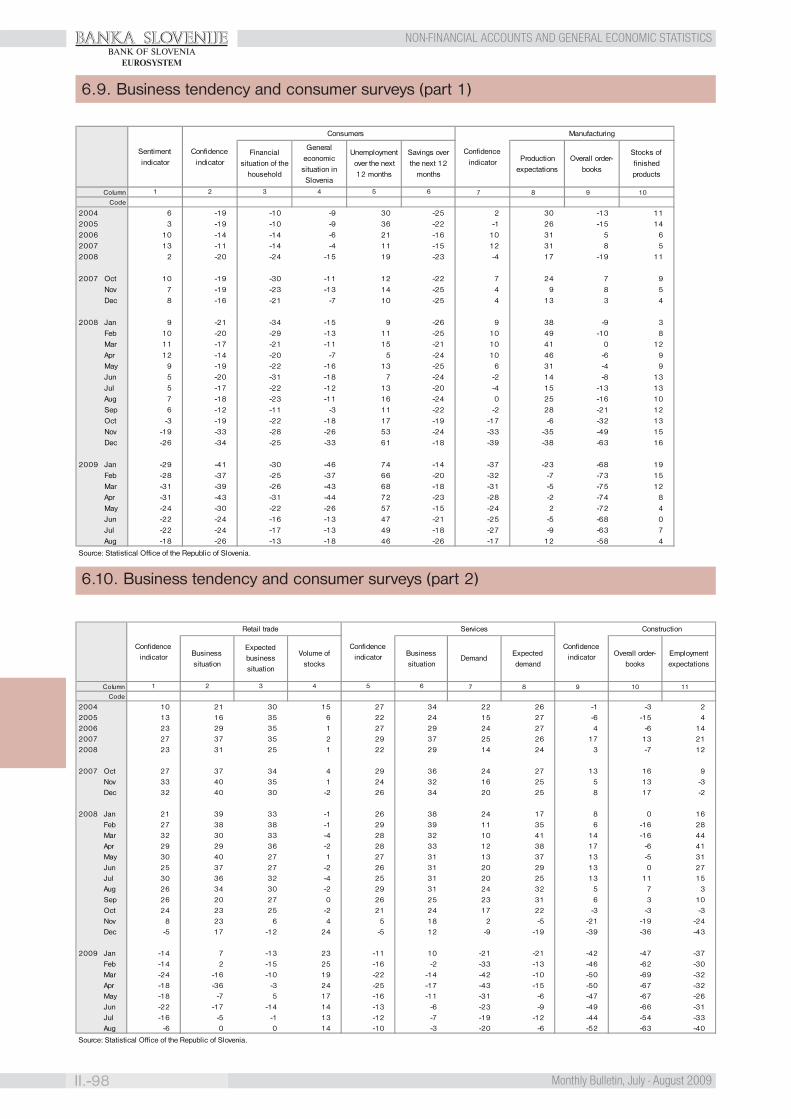
BANKA SLOVENIJE
II.-98 Monthly Bulletin, July - August 2009
NON-FINANCIAL ACCOUNTS AND GENERAL ECONOMIC STATISTICSBANK OF SLOVENIA
EUROSYSTEM
6.9. Business tendency and consumer surveys (part 1)
6.10. Business tendency and consumer surveys (part 2)
Column 7 8 9 10
Code
2004 6 -19 -10 -9 30 -25 2 30 -13 112005 3 -19 -10 -9 36 -22 -1 26 -15 142006 10 -14 -14 -6 21 -16 10 31 5 62007 13 -11 -14 -4 11 -15 12 31 8 52008 2 -20 -24 -15 19 -23 -4 17 -19 11
2007 Oct 10 -19 -30 -11 12 -22 7 24 7 9Nov 7 -19 -23 -13 14 -25 4 9 8 5Dec 8 -16 -21 -7 10 -25 4 13 3 4
2008 Jan 9 -21 -34 -15 9 -26 9 38 -9 3Feb 10 -20 -29 -13 11 -25 10 49 -10 8Mar 11 -17 -21 -11 15 -21 10 41 0 12Apr 12 -14 -20 -7 5 -24 10 46 -6 9May 9 -19 -22 -16 13 -25 6 31 -4 9Jun 5 -20 -31 -18 7 -24 -2 14 -8 13Jul 5 -17 -22 -12 13 -20 -4 15 -13 13Aug 7 -18 -23 -11 16 -24 0 25 -16 10Sep 6 -12 -11 -3 11 -22 -2 28 -21 12Oct -3 -19 -22 -18 17 -19 -17 -6 -32 13Nov -19 -33 -28 -26 53 -24 -33 -35 -49 15Dec -26 -34 -25 -33 61 -18 -39 -38 -63 16
2009 Jan -29 -41 -30 -46 74 -14 -37 -23 -68 19Feb -28 -37 -25 -37 66 -20 -32 -7 -73 15Mar -31 -39 -26 -43 68 -18 -31 -5 -75 12Apr -31 -43 -31 -44 72 -23 -28 -2 -74 8May -24 -30 -22 -26 57 -15 -24 2 -72 4Jun -22 -24 -16 -13 47 -21 -25 -5 -68 0Jul -22 -24 -17 -13 49 -18 -27 -9 -63 7Aug -18 -26 -13 -18 46 -26 -17 12 -58 4
Source: Statistical Office of the Republic of Slovenia.
Savings over the next 12
months
5 6
Unemployment over the next 12 months
1 2 3 4
Sentiment indicator
Financial situation of the
household
General economic situation in Slovenia
Confidence indicator
Consumers
Confidence indicator
Manufacturing
Production expectations
Overall order-books
Stocks of finished products
Column 7 8 9 11
Code
2004 10 21 30 15 27 34 22 26 -1 -3 22005 13 16 35 6 22 24 15 27 -6 -15 42006 23 29 35 1 27 29 24 27 4 -6 142007 27 37 35 2 29 37 25 26 17 13 212008 23 31 25 1 22 29 14 24 3 -7 12
2007 Oct 27 37 34 4 29 36 24 27 13 16 9Nov 33 40 35 1 24 32 16 25 5 13 -3Dec 32 40 30 -2 26 34 20 25 8 17 -2
2008 Jan 21 39 33 -1 26 38 24 17 8 0 16Feb 27 38 38 -1 29 39 11 35 6 -16 28Mar 32 30 33 -4 28 32 10 41 14 -16 44Apr 29 29 36 -2 28 33 12 38 17 -6 41May 30 40 27 1 27 31 13 37 13 -5 31Jun 25 37 27 -2 26 31 20 29 13 0 27Jul 30 36 32 -4 25 31 20 25 13 11 15Aug 26 34 30 -2 29 31 24 32 5 7 3Sep 26 20 27 0 26 25 23 31 6 3 10Oct 24 23 25 -2 21 24 17 22 -3 -3 -3Nov 8 23 6 4 5 18 2 -5 -21 -19 -24Dec -5 17 -12 24 -5 12 -9 -19 -39 -36 -43
2009 Jan -14 7 -13 23 -11 10 -21 -21 -42 -47 -37Feb -14 2 -15 25 -16 -2 -33 -13 -46 -62 -30Mar -24 -16 -10 19 -22 -14 -42 -10 -50 -69 -32Apr -18 -36 -3 24 -25 -17 -43 -15 -50 -67 -32May -18 -7 5 17 -16 -11 -31 -6 -47 -67 -26Jun -22 -17 -14 14 -13 -6 -23 -9 -49 -66 -31Jul -16 -5 -1 13 -12 -7 -19 -12 -44 -54 -33Aug -6 0 0 14 -10 -3 -20 -6 -52 -63 -40
Overall order-books
Confidence indicator
Construction
Employment expectations
Confidence indicator
Expected business situation
Volume of stocks
Retail trade
Business situation
1 2 3 4
Business situation
5 6
Confidence indicator
Services
DemandExpected demand
10
Source: Statistical Office of the Republic of Slovenia.
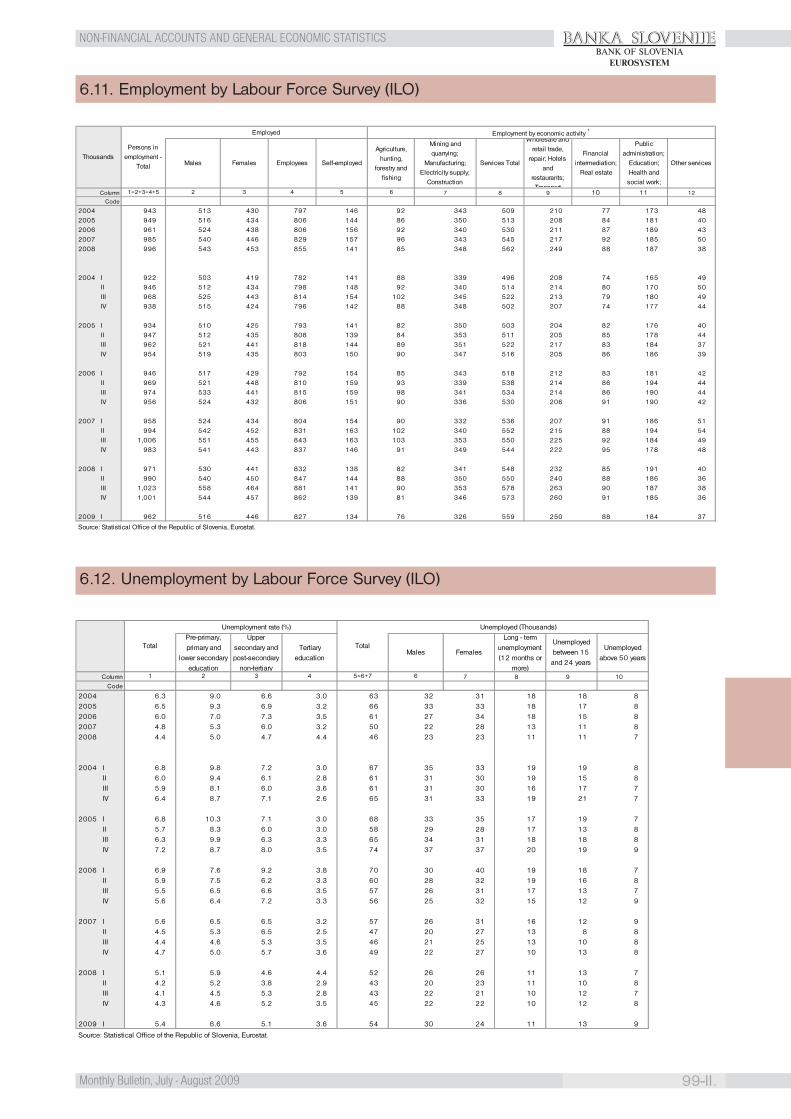
BANKA SLOVENIJE
99-II.Monthly Bulletin, July - August 2009
BANK OF SLOVENIAEUROSYSTEM
NON-FINANCIAL ACCOUNTS AND GENERAL ECONOMIC STATISTICS
6.11. Employment by Labour Force Survey (ILO)
6.12. Unemployment by Labour Force Survey (ILO)
Column
Code
2004 943 513 430 797 146 92 343 509 210 77 173 482005 949 516 434 806 144 86 350 513 208 84 181 402006 961 524 438 806 156 92 340 530 211 87 189 432007 985 540 446 829 157 96 343 545 217 92 185 502008 996 543 453 855 141 85 348 562 249 88 187 38
2004 I 922 503 419 782 141 88 339 496 208 74 165 49II 946 512 434 798 148 92 340 514 214 80 170 50III 968 525 443 814 154 102 345 522 213 79 180 49IV 938 515 424 796 142 88 348 502 207 74 177 44
2005 I 934 510 425 793 141 82 350 503 204 82 176 40II 947 512 435 808 139 84 353 511 205 85 178 44III 962 521 441 818 144 89 351 522 217 83 184 37IV 954 519 435 803 150 90 347 516 205 86 186 39
2006 I 946 517 429 792 154 85 343 518 212 83 181 42II 969 521 448 810 159 93 339 538 214 86 194 44III 974 533 441 815 159 98 341 534 214 86 190 44IV 956 524 432 806 151 90 336 530 206 91 190 42
2007 I 958 524 434 804 154 90 332 536 207 91 186 51II 994 542 452 831 163 102 340 552 215 88 194 54III 1,006 551 455 843 163 103 353 550 225 92 184 49IV 983 541 443 837 146 91 349 544 222 95 178 48
2008 I 971 530 441 832 138 82 341 548 232 85 191 40II 990 540 450 847 144 88 350 550 240 88 186 36III 1,023 558 464 881 141 90 353 578 263 90 187 38IV 1,001 544 457 862 139 81 346 573 260 91 185 36
2009 I 962 516 446 827 134 76 326 559 250 88 184 37
Source: Statistical Office of the Republic of Slovenia, Eurostat.
Males
Wholesale and retail trade,
repair; Hotels and
restaurants; Transport
Financial intermediation;
Real estate
5 6 9 107 8 11 121=2+3=4+5 2 3 4
ThousandsFemales Employees Self-employed
Employed
Persons in employment -
Total
Employment by economic activity 1
Public administration;
Education; Health and
social work;
Other services
Agriculture, hunting,
forestry and fishing
Mining and quarrying;
Manufacturing; Electricity supply;
Construction
Services Total
Column 7 8 9 10
Code
2004 6.3 9.0 6.6 3.0 63 32 31 18 18 82005 6.5 9.3 6.9 3.2 66 33 33 18 17 82006 6.0 7.0 7.3 3.5 61 27 34 18 15 82007 4.8 5.3 6.0 3.2 50 22 28 13 11 82008 4.4 5.0 4.7 4.4 46 23 23 11 11 7
2004 I 6.8 9.8 7.2 3.0 67 35 33 19 19 8II 6.0 9.4 6.1 2.8 61 31 30 19 15 8III 5.9 8.1 6.0 3.6 61 31 30 16 17 7IV 6.4 8.7 7.1 2.6 65 31 33 19 21 7
2005 I 6.8 10.3 7.1 3.0 68 33 35 17 19 7II 5.7 8.3 6.0 3.0 58 29 28 17 13 8III 6.3 9.9 6.3 3.3 65 34 31 18 18 8IV 7.2 8.7 8.0 3.5 74 37 37 20 19 9
2006 I 6.9 7.6 9.2 3.8 70 30 40 19 18 7II 5.9 7.5 6.2 3.3 60 28 32 19 16 8III 5.5 6.5 6.6 3.5 57 26 31 17 13 7IV 5.6 6.4 7.2 3.3 56 25 32 15 12 9
2007 I 5.6 6.5 6.5 3.2 57 26 31 16 12 9II 4.5 5.3 6.5 2.5 47 20 27 13 8 8III 4.4 4.6 5.3 3.5 46 21 25 13 10 8IV 4.7 5.0 5.7 3.6 49 22 27 10 13 8
2008 I 5.1 5.9 4.6 4.4 52 26 26 11 13 7II 4.2 5.2 3.8 2.9 43 20 23 11 10 8III 4.1 4.5 5.3 2.8 43 22 21 10 12 7IV 4.3 4.6 5.2 3.5 45 22 22 10 12 8
2009 I 5.4 6.6 5.1 3.6 54 30 24 11 13 9
Unemployed between 15
and 24 years
Unemployed above 50 years
6
Total
Unemployed (Thousands)
Males Females
2 3 4 5=6+7
TotalUpper
secondary and post-secondary
non-tertiary
Tertiary education
Unemployment rate (%)
1
Pre-primary, primary and
lower secondary education
Long - term unemployment (12 months or
more)
Source: Statistical Office of the Republic of Slovenia, Eurostat.
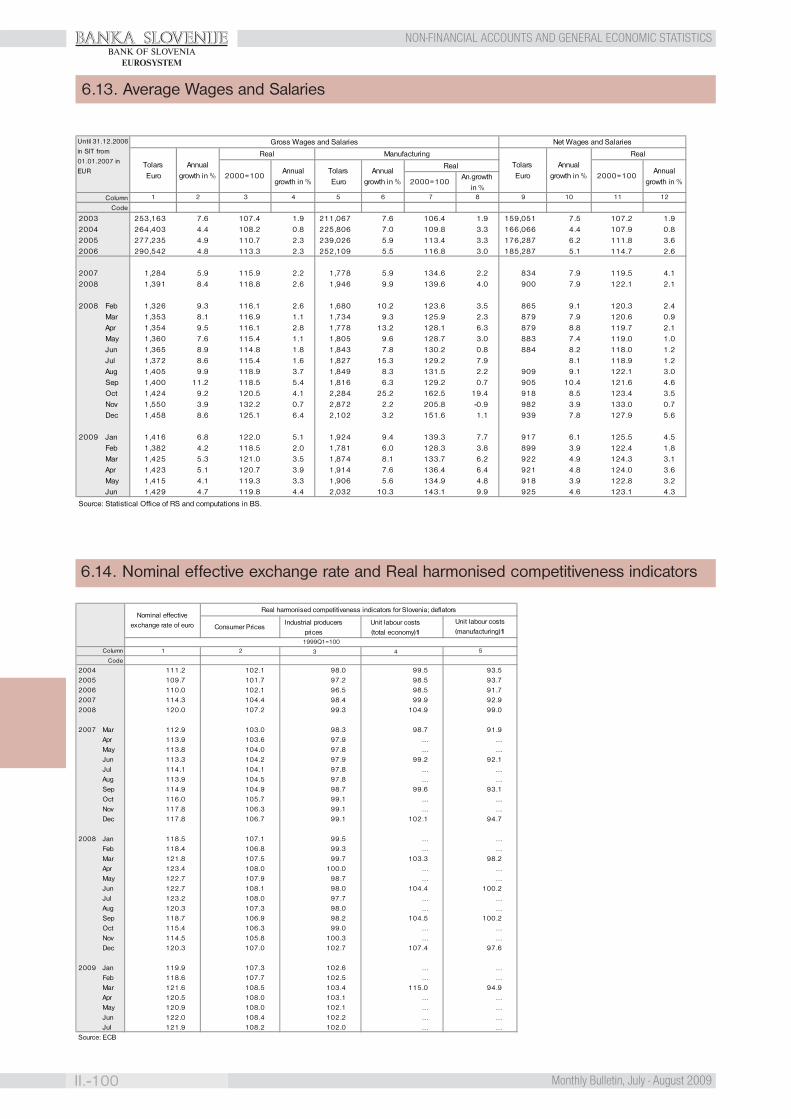
BANKA SLOVENIJE
II.-100 Monthly Bulletin, July - August 2009
NON-FINANCIAL ACCOUNTS AND GENERAL ECONOMIC STATISTICSBANK OF SLOVENIA
EUROSYSTEM
6.13. Average Wages and Salaries
6.14. Nominal effective exchange rate and Real harmonised competitiveness indicators
ColumnCode
2003 253,163 7.6 107.4 1.9 211,067 7.6 106.4 1.9 159,051 7.5 107.2 1.92004 264,403 4.4 108.2 0.8 225,806 7.0 109.8 3.3 166,066 4.4 107.9 0.82005 277,235 4.9 110.7 2.3 239,026 5.9 113.4 3.3 176,287 6.2 111.8 3.62006 290,542 4.8 113.3 2.3 252,109 5.5 116.8 3.0 185,287 5.1 114.7 2.6
2007 1,284 5.9 115.9 2.2 1,778 5.9 134.6 2.2 834 7.9 119.5 4.12008 1,391 8.4 118.8 2.6 1,946 9.9 139.6 4.0 900 7.9 122.1 2.1
2008 Feb 1,326 9.3 116.1 2.6 1,680 10.2 123.6 3.5 865 9.1 120.3 2.4Mar 1,353 8.1 116.9 1.1 1,734 9.3 125.9 2.3 879 7.9 120.6 0.9Apr 1,354 9.5 116.1 2.8 1,778 13.2 128.1 6.3 879 8.8 119.7 2.1May 1,360 7.6 115.4 1.1 1,805 9.6 128.7 3.0 883 7.4 119.0 1.0Jun 1,365 8.9 114.8 1.8 1,843 7.8 130.2 0.8 884 8.2 118.0 1.2Jul 1,372 8.6 115.4 1.6 1,827 15.3 129.2 7.9 8.1 118.9 1.2Aug 1,405 9.9 118.9 3.7 1,849 8.3 131.5 2.2 909 9.1 122.1 3.0Sep 1,400 11.2 118.5 5.4 1,816 6.3 129.2 0.7 905 10.4 121.6 4.6Oct 1,424 9.2 120.5 4.1 2,284 25.2 162.5 19.4 918 8.5 123.4 3.5Nov 1,550 3.9 132.2 0.7 2,872 2.2 205.8 -0.9 982 3.9 133.0 0.7Dec 1,458 8.6 125.1 6.4 2,102 3.2 151.6 1.1 939 7.8 127.9 5.6
2009 Jan 1,416 6.8 122.0 5.1 1,924 9.4 139.3 7.7 917 6.1 125.5 4.5Feb 1,382 4.2 118.5 2.0 1,781 6.0 128.3 3.8 899 3.9 122.4 1.8Mar 1,425 5.3 121.0 3.5 1,874 8.1 133.7 6.2 922 4.9 124.3 3.1Apr 1,423 5.1 120.7 3.9 1,914 7.6 136.4 6.4 921 4.8 124.0 3.6May 1,415 4.1 119.3 3.3 1,906 5.6 134.9 4.8 918 3.9 122.8 3.2Jun 1,429 4.7 119.8 4.4 2,032 10.3 143.1 9.9 925 4.6 123.1 4.3
Until 31.12.2006
in SIT from
01.01.2007 in EUR
Tolars Euro
Annual growth in %
Real
2000=100Annual
growth in %Annual
growth in %
Real
2000=100An.growth
in %
2000=100Annual
growth in %
Real
Tolars Euro
Net Wages and Salaries
Manufacturing
4 76 12
Gross Wages and Salaries
1
Tolars Euro
Annual growth in %
2 853
Source: Statistical Office of RS and computations in BS.
9 10 11
Industrial producers prices
Unit labour costs (total economy)1
3 4
Code
2004 111.2 102.1 98.0 99.5 93.52005 109.7 101.7 97.2 98.5 93.72006 110.0 102.1 96.5 98.5 91.72007 114.3 104.4 98.4 99.9 92.92008 120.0 107.2 99.3 104.9 99.0
2007 Mar 112.9 103.0 98.3 98.7 91.9Apr 113.9 103.6 97.9 … …May 113.8 104.0 97.8 … …Jun 113.3 104.2 97.9 99.2 92.1Jul 114.1 104.1 97.8 … …Aug 113.9 104.5 97.8 … …Sep 114.9 104.9 98.7 99.6 93.1Oct 116.0 105.7 99.1 … …Nov 117.8 106.3 99.1 … …Dec 117.8 106.7 99.1 102.1 94.7
2008 Jan 118.5 107.1 99.5 … …Feb 118.4 106.8 99.3 … …Mar 121.8 107.5 99.7 103.3 98.2Apr 123.4 108.0 100.0 … …May 122.7 107.9 98.7 … …Jun 122.7 108.1 98.0 104.4 100.2Jul 123.2 108.0 97.7 … …Aug 120.3 107.3 98.0 … …Sep 118.7 106.9 98.2 104.5 100.2Oct 115.4 106.3 99.0 … …Nov 114.5 105.8 100.3 … …Dec 120.3 107.0 102.7 107.4 97.6
2009 Jan 119.9 107.3 102.6 … …Feb 118.6 107.7 102.5 … …Mar 121.6 108.5 103.4 115.0 94.9Apr 120.5 108.0 103.1 … …May 120.9 108.0 102.1 … …Jun 122.0 108.4 102.2 … …Jul 121.9 108.2 102.0 … …
Real harmonised competitiveness indicators for Slovenia; deflators
2
Nominal effective exchange rate of euro Consumer Prices
Unit labour costs (manufacturing)1
1999Q1=100
Source: ECB
1Column 5

BANKA SLOVENIJE
101-II.Monthly Bulletin, July - August 2009
BANK OF SLOVENIAEUROSYSTEM
NON-FINANCIAL ACCOUNTS AND GENERAL ECONOMIC STATISTICS
6.15. Consumer price index
6.16. Consumer price index (growth rates)
Column 11Code
2004 97.6 98.8 89.4 97.6 98.3 97.9 102.2 99.4 96.5 96.9 97.7 97.9 96.92005 100.0 100.0 100.0 100.0 100.0 100.0 100.0 100.0 100.0 100.0 100.1 100.1 100.12006 102.5 101.6 108.2 102.4 104.5 102.0 96.8 99.6 103.9 103.5 102.6 102.3 103.72007 106.2 105.4 111.6 105.7 118.9 105.3 95.8 101.8 108.7 108.1 106.5 105.7 108.72008 112.2 110.6 123.4 111.7 124.9 111.5 95.4 106.3 117.4 113.5 107.0 106.2 109.1
2007 May 106.1 105.1 113.4 105.4 126.9 105.7 95.9 105.1 108.4 107.1 106.5 105.9 107.6Jun 106.5 105.5 113.8 106.0 120.6 105.8 95.8 105.3 108.6 108.1 106.8 106.0 108.5Jul 106.6 105.4 114.5 106.1 119.2 104.9 95.3 97.3 109.5 110.2 106.7 105.1 110.1Aug 106.9 106.0 113.1 106.5 117.1 104.9 95.5 96.8 109.6 111.1 106.9 104.9 111.0Sep 107.3 106.6 112.0 106.9 117.9 106.2 95.2 102.3 110.1 109.7 107.4 106.1 110.0Oct 108.0 107.3 112.4 107.6 117.8 107.5 95.4 105.5 111.3 109.0 108.2 107.5 109.6Nov 108.9 107.8 116.9 108.6 119.6 108.8 95.5 108.0 112.6 109.3 109.2 108.8 110.0Dec 109.4 108.3 116.9 108.9 123.5 109.1 95.5 107.0 113.3 110.2 109.6 109.0 110.8
2008 Jan 109.5 108.0 120.1 108.8 130.0 108.9 95.2 98.3 115.3 110.8 109.7 108.8 111.6Feb 109.4 108.5 116.2 109.0 121.3 108.6 95.5 99.7 114.5 111.3 109.6 108.3 112.0Mar 110.9 109.5 120.7 110.5 120.9 110.5 95.5 106.2 115.8 111.7 111.0 110.3 112.5Apr 111.7 110.3 121.7 111.3 124.6 111.5 95.9 109.6 116.4 112.2 111.8 111.2 113.0May 112.9 111.0 126.9 112.3 132.0 113.1 95.8 110.4 118.7 112.5 113.1 113.0 113.4Jun 113.9 111.3 133.6 113.4 128.5 114.1 95.8 110.1 120.3 113.7 114.2 114.1 114.3Jul 113.9 110.9 135.8 113.3 131.1 112.9 95.6 99.2 121.4 116.1 114.1 113.1 116.1Aug 113.3 111.0 130.1 112.9 122.1 111.5 95.5 99.5 119.2 117.0 113.3 111.5 116.9Sep 113.2 111.2 127.6 112.9 122.1 112.4 95.4 106.5 118.8 114.9 113.3 112.2 115.6Oct 113.2 111.7 124.3 112.9 121.6 112.9 95.4 111.4 118.2 114.0 113.3 112.5 115.1Nov 112.4 111.9 115.2 112.0 122.5 111.6 94.3 113.5 116.1 114.0 112.3 110.9 115.3Dec 111.7 112.0 108.5 111.3 121.8 110.5 95.2 112.0 114.3 114.3 111.5 109.4 115.6
2009 Jan 111.2 111.1 111.4 110.5 132.8 109.7 94.9 100.8 116.2 114.5 111.2 108.7 116.1Feb 111.8 111.3 114.9 111.1 131.5 110.3 95.1 101.3 117.0 115.0 111.9 109.5 116.6Mar 112.8 112.5 115.2 112.3 129.4 111.7 94.7 109.2 117.2 115.3 112.8 110.6 116.9Apr 113.0 112.5 116.1 112.4 129.6 112.1 94.7 110.8 117.4 115.0 113.0 111.1 116.8May 113.7 113.2 117.1 113.1 131.8 112.8 93.8 112.6 118.4 115.7 113.7 111.9 117.3Jun 114.3 113.5 120.4 114.0 122.9 112.9 93.7 111.6 118.9 117.4 114.3 112.2 118.6Jul 113.2 112.2 121.0 112.9 121.1 110.5 92.7 98.4 118.9 119.4 113.4 110.1 120.0
1312
Durable goodsSemi-durable
goods
108
Non-durable goods
Harmonised index
6 7
Harmonised consumer price index
TotalTotal without
fuels and energyFuels and
energy
Total without seasonal products
Seasonal products
Total Services
2005 = 100
Consumer price index
1 2 3 4 5 9
Source: Statistical Office of the Republic of Slovenia.
Goods
Goods Services
Column 11Code
2004 3.6 3.1 6.9 3.8 -1.0 2.6 2.0 2.2 2.8 6.0 3.6 2.6 5.82005 2.5 1.2 11.9 2.5 1.8 2.2 -2.2 0.6 3.6 3.2 2.4 2.2 3.22006 2.5 1.6 8.2 2.4 4.5 2.0 -3.2 -0.4 3.9 3.5 2.5 2.2 3.62007 3.6 3.7 3.1 3.2 13.8 3.2 -1.1 2.2 4.6 4.5 3.8 3.3 4.82008 5.7 5.0 10.6 5.7 5.0 6.0 -0.4 4.5 8.0 5.0 0.5 0.5 0.4
2007 May 2.8 3.1 1.9 2.3 18.7 2.3 -0.5 1.1 3.5 4.1 3.1 2.5 4.4Jun 3.5 3.6 3.6 3.1 17.6 3.1 0.0 2.2 4.2 4.6 3.7 3.2 4.8Jul 3.9 4.0 3.7 3.3 17.5 3.4 -0.5 2.5 4.7 4.8 3.9 3.4 5.1Aug 3.5 4.1 0.4 3.2 11.2 2.8 -1.0 3.6 3.7 5.1 3.4 2.5 5.3Sep 3.5 4.2 -0.4 3.2 12.6 3.0 -1.0 2.9 4.1 4.7 3.5 2.8 5.0Oct 5.0 5.0 5.4 4.7 17.4 5.1 -1.7 2.4 7.8 4.9 5.1 5.1 5.2Nov 5.7 5.0 10.2 5.4 12.8 5.9 -1.2 3.5 8.6 5.0 5.8 5.9 5.4Dec 5.6 5.1 9.8 5.4 11.8 6.0 -1.6 2.9 9.0 4.8 5.7 5.9 5.3
2008 Jan 6.4 5.2 15.0 6.1 13.2 7.2 -1.7 3.0 10.6 4.7 6.4 7.0 5.1Feb 6.5 5.8 12.0 6.5 6.6 7.2 -1.3 4.3 10.2 5.2 6.4 6.9 5.4Mar 6.9 6.0 12.8 6.8 7.6 7.4 -0.5 5.8 9.9 5.7 6.6 7.0 5.9Apr 6.5 6.0 9.9 6.7 1.2 6.8 -0.3 6.7 8.8 5.9 6.2 6.4 5.9May 6.4 5.6 11.9 6.5 4.0 7.0 -0.1 5.1 9.5 5.1 6.2 6.7 5.4Jun 7.0 5.5 17.4 7.0 6.5 7.8 0.0 4.6 10.8 5.2 6.8 7.6 5.3Jul 6.9 5.2 18.6 6.8 10.0 7.6 0.3 2.0 10.8 5.3 6.9 7.7 5.5Aug 6.0 4.7 15.1 6.0 4.3 6.3 0.0 2.8 8.7 5.3 6.0 6.4 5.3Sep 5.5 4.4 13.9 5.6 3.6 5.9 0.2 4.1 7.9 4.8 5.6 5.8 5.1Oct 4.9 4.0 10.6 4.9 3.2 5.0 0.0 5.6 6.2 4.6 4.8 4.7 5.0Nov 3.1 3.8 -1.4 3.2 2.4 2.6 -1.3 5.0 3.1 4.3 2.9 1.9 4.8Dec 2.1 3.4 -7.2 2.2 -1.4 1.3 -0.3 4.6 0.9 3.8 1.8 0.4 4.3
2009 Jan 1.6 2.9 -7.2 1.5 2.1 0.8 -0.3 2.5 0.8 3.3 1.4 -0.1 4.1Feb 2.1 2.6 -1.1 1.9 8.4 1.6 -0.4 1.6 2.2 3.4 2.1 1.0 4.1Mar 1.8 2.7 -4.6 1.6 7.0 1.1 -0.8 2.8 1.2 3.3 1.6 0.3 4.0Apr 1.1 2.0 -4.6 1.0 4.0 0.5 -1.3 1.0 0.9 2.5 1.1 -0.1 3.4May 0.7 2.0 -7.8 0.7 -0.2 -0.3 -2.2 2.0 -0.3 2.8 0.5 -1.0 3.5Jun 0.3 2.0 -9.9 0.5 -4.3 -1.0 -2.2 1.3 -1.2 3.2 0.2 -1.7 3.8Jul -0.6 1.1 -10.9 -0.3 -7.6 -2.2 -3.0 -0.8 -2.1 2.9 -0.6 -2.7 3.3
1312
Durable goodsSemi-durable
goods
108
Non-durable goods
Harmonised index
6 7
Harmonised consumer price index
TotalTotal without
fuels and energyFuels and
energy
Total without seasonal products
Seasonal products
Total Services
Yearly growth rate in %
Consumer price index
1 2 3 4 5 9
Source: Statistical Office of the Republic of Slovenia and computations in Bank of Slovenia.
Goods
Goods Services
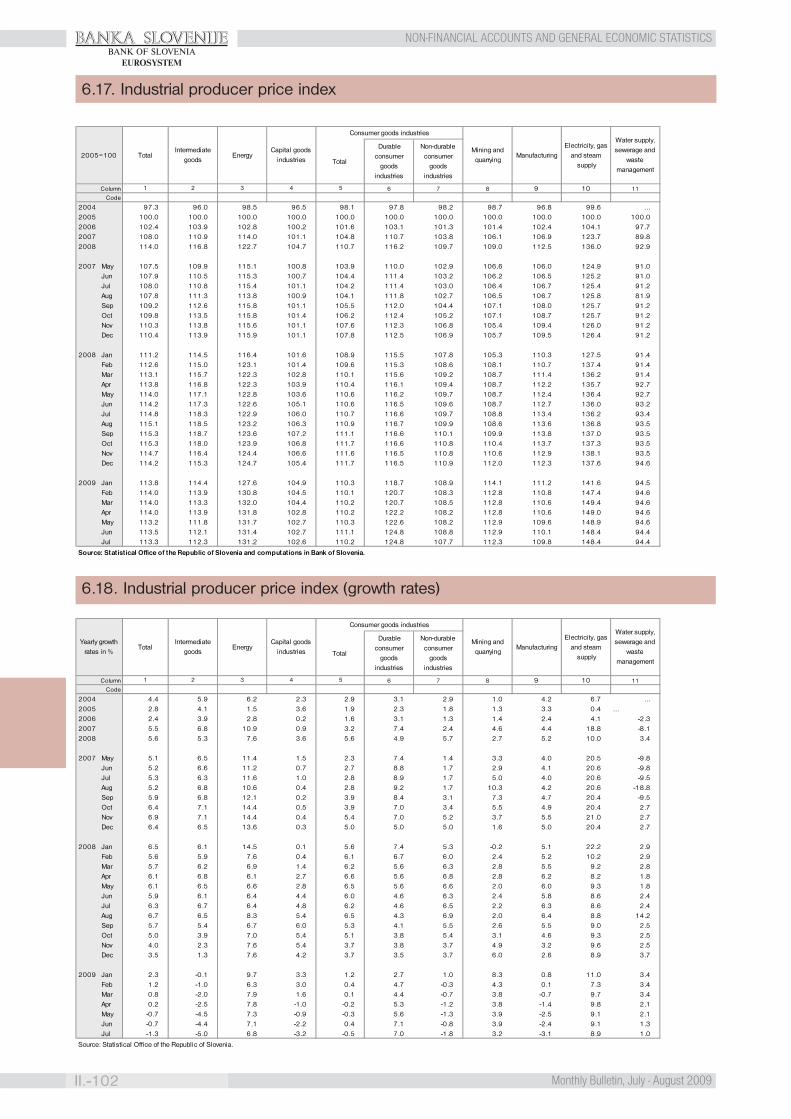
BANKA SLOVENIJE
II.-102 Monthly Bulletin, July - August 2009
NON-FINANCIAL ACCOUNTS AND GENERAL ECONOMIC STATISTICSBANK OF SLOVENIA
EUROSYSTEM
6.17. Industrial producer price index
6.18. Industrial producer price index (growth rates)
Column
Code
2004 97.3 96.0 98.5 96.5 98.1 97.8 98.2 98.7 96.8 99.6 …2005 100.0 100.0 100.0 100.0 100.0 100.0 100.0 100.0 100.0 100.0 100.02006 102.4 103.9 102.8 100.2 101.6 103.1 101.3 101.4 102.4 104.1 97.72007 108.0 110.9 114.0 101.1 104.8 110.7 103.8 106.1 106.9 123.7 89.82008 114.0 116.8 122.7 104.7 110.7 116.2 109.7 109.0 112.5 136.0 92.9
2007 May 107.5 109.9 115.1 100.8 103.9 110.0 102.9 106.6 106.0 124.9 91.0Jun 107.9 110.5 115.3 100.7 104.4 111.4 103.2 106.2 106.5 125.2 91.0Jul 108.0 110.8 115.4 101.1 104.2 111.4 103.0 106.4 106.7 125.4 91.2Aug 107.8 111.3 113.8 100.9 104.1 111.8 102.7 106.5 106.7 125.8 81.9Sep 109.2 112.6 115.8 101.1 105.5 112.0 104.4 107.1 108.0 125.7 91.2Oct 109.8 113.5 115.8 101.4 106.2 112.4 105.2 107.1 108.7 125.7 91.2Nov 110.3 113.8 115.6 101.1 107.6 112.3 106.8 105.4 109.4 126.0 91.2Dec 110.4 113.9 115.9 101.1 107.8 112.5 106.9 105.7 109.5 126.4 91.2
2008 Jan 111.2 114.5 116.4 101.6 108.9 115.5 107.8 105.3 110.3 127.5 91.4Feb 112.6 115.0 123.1 101.4 109.6 115.3 108.6 108.1 110.7 137.4 91.4Mar 113.1 115.7 122.3 102.8 110.1 115.6 109.2 108.7 111.4 136.2 91.4Apr 113.8 116.8 122.3 103.9 110.4 116.1 109.4 108.7 112.2 135.7 92.7May 114.0 117.1 122.8 103.6 110.6 116.2 109.7 108.7 112.4 136.4 92.7Jun 114.2 117.3 122.6 105.1 110.6 116.5 109.6 108.7 112.7 136.0 93.2Jul 114.8 118.3 122.9 106.0 110.7 116.6 109.7 108.8 113.4 136.2 93.4Aug 115.1 118.5 123.2 106.3 110.9 116.7 109.9 108.6 113.6 136.8 93.5Sep 115.3 118.7 123.6 107.2 111.1 116.6 110.1 109.9 113.8 137.0 93.5Oct 115.3 118.0 123.9 106.8 111.7 116.6 110.8 110.4 113.7 137.3 93.5Nov 114.7 116.4 124.4 106.6 111.6 116.5 110.8 110.6 112.9 138.1 93.5Dec 114.2 115.3 124.7 105.4 111.7 116.5 110.9 112.0 112.3 137.6 94.6
2009 Jan 113.8 114.4 127.6 104.9 110.3 118.7 108.9 114.1 111.2 141.6 94.5Feb 114.0 113.9 130.8 104.5 110.1 120.7 108.3 112.8 110.8 147.4 94.6Mar 114.0 113.3 132.0 104.4 110.2 120.7 108.5 112.8 110.6 149.4 94.6Apr 114.0 113.9 131.8 102.8 110.2 122.2 108.2 112.8 110.6 149.0 94.6May 113.2 111.8 131.7 102.7 110.3 122.6 108.2 112.9 109.6 148.9 94.6Jun 113.5 112.1 131.4 102.7 111.1 124.8 108.8 112.9 110.1 148.4 94.4Jul 113.3 112.3 131.2 102.6 110.2 124.8 107.7 112.3 109.8 148.4 94.4
Source: Statistical Office of the Republic of Slovenia and computations in Bank of Slovenia.
Water supply, sewerage and
waste management
Total
Durable consumer
goods industries
Non-durable consumer
goods industries
Electricity, gas and steam
supply2005=100 Total
Intermediate goods
Energy
1 2 3 4 8 1196 7 10
Capital goods industries
Consumer goods industries
Mining and quarrying
Manufacturing
5
Column
Code
2004 4.4 5.9 6.2 2.3 2.9 3.1 2.9 1.0 4.2 6.7 …2005 2.8 4.1 1.5 3.6 1.9 2.3 1.8 1.3 3.3 0.4 …2006 2.4 3.9 2.8 0.2 1.6 3.1 1.3 1.4 2.4 4.1 -2.32007 5.5 6.8 10.9 0.9 3.2 7.4 2.4 4.6 4.4 18.8 -8.12008 5.6 5.3 7.6 3.6 5.6 4.9 5.7 2.7 5.2 10.0 3.4
2007 May 5.1 6.5 11.4 1.5 2.3 7.4 1.4 3.3 4.0 20.5 -9.8Jun 5.2 6.6 11.2 0.7 2.7 8.8 1.7 2.9 4.1 20.6 -9.8Jul 5.3 6.3 11.6 1.0 2.8 8.9 1.7 5.0 4.0 20.6 -9.5Aug 5.2 6.8 10.6 0.4 2.8 9.2 1.7 10.3 4.2 20.6 -18.8Sep 5.9 6.8 12.1 0.2 3.9 8.4 3.1 7.3 4.7 20.4 -9.5Oct 6.4 7.1 14.4 0.5 3.9 7.0 3.4 5.5 4.9 20.4 2.7Nov 6.9 7.1 14.4 0.4 5.4 7.0 5.2 3.7 5.5 21.0 2.7Dec 6.4 6.5 13.6 0.3 5.0 5.0 5.0 1.6 5.0 20.4 2.7
2008 Jan 6.5 6.1 14.5 0.1 5.6 7.4 5.3 -0.2 5.1 22.2 2.9Feb 5.6 5.9 7.6 0.4 6.1 6.7 6.0 2.4 5.2 10.2 2.9Mar 5.7 6.2 6.9 1.4 6.2 5.6 6.3 2.8 5.5 9.2 2.8Apr 6.1 6.8 6.1 2.7 6.6 5.6 6.8 2.8 6.2 8.2 1.8May 6.1 6.5 6.6 2.8 6.5 5.6 6.6 2.0 6.0 9.3 1.8Jun 5.9 6.1 6.4 4.4 6.0 4.6 6.3 2.4 5.8 8.6 2.4Jul 6.3 6.7 6.4 4.8 6.2 4.6 6.5 2.2 6.3 8.6 2.4Aug 6.7 6.5 8.3 5.4 6.5 4.3 6.9 2.0 6.4 8.8 14.2Sep 5.7 5.4 6.7 6.0 5.3 4.1 5.5 2.6 5.5 9.0 2.5Oct 5.0 3.9 7.0 5.4 5.1 3.8 5.4 3.1 4.6 9.3 2.5Nov 4.0 2.3 7.6 5.4 3.7 3.8 3.7 4.9 3.2 9.6 2.5Dec 3.5 1.3 7.6 4.2 3.7 3.5 3.7 6.0 2.6 8.9 3.7
2009 Jan 2.3 -0.1 9.7 3.3 1.2 2.7 1.0 8.3 0.8 11.0 3.4Feb 1.2 -1.0 6.3 3.0 0.4 4.7 -0.3 4.3 0.1 7.3 3.4Mar 0.8 -2.0 7.9 1.6 0.1 4.4 -0.7 3.8 -0.7 9.7 3.4Apr 0.2 -2.5 7.8 -1.0 -0.2 5.3 -1.2 3.8 -1.4 9.8 2.1May -0.7 -4.5 7.3 -0.9 -0.3 5.6 -1.3 3.9 -2.5 9.1 2.1Jun -0.7 -4.4 7.1 -2.2 0.4 7.1 -0.8 3.9 -2.4 9.1 1.3Jul -1.3 -5.0 6.8 -3.2 -0.5 7.0 -1.8 3.2 -3.1 8.9 1.0
Capital goods industries
Source: Statistical Office of the Republic of Slovenia.
Consumer goods industries
Mining and quarrying
Manufacturing
5 8 111 2 3 4 96 7 10
Yearly growth rates in %
TotalIntermediate
goodsEnergy
Water supply, sewerage and
waste management
Total
Durable consumer
goods industries
Non-durable consumer
goods industries
Electricity, gas and steam
supply

BANKA SLOVENIJE
1-III.Monthly Bulletin, July - August 2009
BANK OF SLOVENIAEUROSYSTEM
BANKS, SAVINGS BANKS AND REPRESENTATIVE OFFICES OF BANKS IN RS
III. BANKS, SAVINGS BANKS
AND REPRESENTATIVE OFFICES
OF BANKS IN RS
as at 31 August 2009
I. Banks
Abanka Vipa d.d.Slovenska cesta 581517 LjubljanaPhone: +386 (1) 471 81 00
The bank may perform the following mutually recognized financial services, pursuant to Article 10 of the ZBan-1:1. Receiving deposits,2. Granting credits that also includes:- consumer credits,- mortgage credits,- factoring, with or without recourse,- financing of commercial transactions, including forfeiting,4. Payment transaction services according to ZPlaP, except services of managing payment systems,5. Issuing and managing of payment instruments (such as credit cards and travellers cheques),6. Issuing of guarantees and other commitments,7. Trading for own account or for account of customers in:- money market instruments,- foreign exchange, including currency exchange transactions,- financial futures and options,- exchange and interest-rate instruments,- transferable securities,8. Participations in securities issues and the provision of services related to such issues,9. Advice and services related to mergers and the of undetakings,11. Portfolio management and advice,12. Safekeeping of securities and other services relating to the safekeeping of securities,13. Credit reference services: collection, analysis and provision of information on creditworthiness of legal persons,14. Rental of safe deposit boxes and15. Investment and ancillary investment services and operations.
The bank may perform the following supplementary financial services, pursuant to Article 11 of the ZBan-1:1. Insurance brokerage in accordance with the act governing the insurance business,3. Pension fund management in accordance with the act governing pension and disability insurance and4. Custodian services in accordance with the law governing investment funds and management companies6. Administrative services for investment funds.
BANKA SLOVENIJE
III.-2 Monthly Bulletin, July - August 2009
BANKS, SAVINGS BANKS AND REPRESENTATIVE OFFICES OF BANKS IN RSBANK OF SLOVENIA
EUROSYSTEM
Banka Celje d.d.Vodnikova cesta 23000 CeljePhone: +386 (3) 422 10 00
The bank may perform the following mutually recognized financial services, pursuant to Article 10 of the ZBan-1:1. Receiving deposits,2. Granting credits that also includes:- consumer credits,- mortgage credits,- factoring, with or without recourse,- financing of commercial transactions, including forfeiting,4. Payment transaction services according to ZPlaP, except services of managing payment systems,5. Issuing and managing of payment instruments (such as credit cards and travellers cheques),6. Issuing of guarantees and other commitments,7. Trading for own account or for account of customers in:- foreign exchange, including currency exchange transactions,- financial futures and options,- exchange and interest-rate instruments,
trading for own account:- money market instruments,- transferable securities,14. Rental of safe deposit boxes and15. Investment and ancillary investment services and operations.
The bank may perform the following supplementary financial services, pursuant to Article 11 of the ZBan-1:1. Insurance brokerage in accordance with the act governing the insurance business and6. Marketing of investment funds and the sale of investment coupons or shares in investment funds.
Banka Koper d.d.Pristaniška ulica 146502 KoperPhone: +386 (5) 666 11 00
The bank may perform the following mutually recognized financial services, pursuant to Article 10 of the ZBan-1:1. Receiving deposits,2. Granting credits that also includes:- consumer credits,- mortgage credits,- factoring, with or without recourse,- financing of commercial transactions, including forfeiting,4. Payment transaction services according to ZPlaP, except services of managing payment systems,5. Issuing and managing of payment instruments (such as credit cards and travellers cheques), including issuing of electronic money,6. Issuing of guarantees and other commitments- administrative services for investment funds.7. Trading for own account or for account of customers in:- money market instruments,- foreign exchange, including currency exchange transactions,- financial futures and options,- exchange and interest-rate instruments,- transferable securities,8. Participations in securities issues and the provision of services related to such issues,9. Advice and services related to mergers and the of undetakings,11. Portfolio management and advice,12. Safekeeping of securities and other services relating to the safekeeping of securities,14. Rental of safe deposit boxes and15. Investment and ancillary investment services and operations.
The bank may perform the following supplementary financial services, pursuant to Article 11 of the ZBan-1:1. Insurance brokerage in accordance with the act governing the insurance business,2. Administration of payment systems according to ZPlaP,3. Pension fund management in accordance with the act governing pension and disability insurance,4. Custodian services in accordance with the law governing investment funds and management companies and- custodian services in accordance with the law governing the protection of apartment and house buyers;6. Representation in financial leasing.
BANKA SLOVENIJE
3-III.Monthly Bulletin, July - August 2009
BANK OF SLOVENIAEUROSYSTEM
BANKS, SAVINGS BANKS AND REPRESENTATIVE OFFICES OF BANKS IN RS
Banka Sparkasse d.d.Cesta v Kleče 151000 LjubljanaPhone: +386 (1) 583 66 66
The bank may perform the following mutually recognized financial services, pursuant to Article 10 of the ZBan-1:1. Receiving deposits,2. Granting credits that also includes:- consumer credits,- mortgage credits,- financing of commercial transactions, including forfeiting,4. Payment transaction services according to ZPlaP, except services of managing payment systems,5. Issuing and managing of payment instruments (such as credit cards and travellers cheques),6. Issuing of guarantees and other commitments,7. Trading for own account or for account of customers in:- foreign exchange, including currency exchange transactions,
trading for own account:- money market instruments and13. Credit reference services: collection, analysis and provision of information on creditworthiness of legal persons.
The bank may perform the following supplementary financial services, pursuant to Article 11 of the ZBan-1:1. Insurance brokerage in accordance with the act governing the insurance business and5. Credit brokerage for consumer and other types of loans;6. Marketing of investment funds and the sale of investment coupons or shares in investment funds.
Banka Volksbank d.d.Dunajska cesta 128 a1101 LjubljanaPhone: +386 (1) 530 74 00
The bank may perform the following mutually recognized financial services, pursuant to Article 10 of the ZBan-1:1. Receiving deposits,2. Granting credits that also includes:- consumer credits,- mortgage credits,- factoring, with or without recourse,- financing of commercial transactions, including forfeiting,4. Payment transaction services according to ZPlaP, except services of managing payment systems,5. Issuing and managing of payment instruments (such as credit cards and travellers cheques),6. Issuing of guarantees and other commitments,7. Trading for own account or for account of customers in:- foreign exchange, including currency exchange transactions,- exchange and interest-rate instruments,
trading for own account:- money market instruments,- transferable securities and8. Participations in securities issues and the provision of services related to such issues,15. Investment and ancillary investment services and operations.
The bank may perform the following supplementary financial services, pursuant to Article 11 of the ZBan-1:1. Insurance brokerage in accordance with the act governing the insurance business and6. Marketing of investment funds and the sale of investment coupons or shares in investment funds.
BAWAG banka d.d.Tivolska cesta 301000 LjubljanaPhone: +386 (1) 230 07 06
The bank may perform the following mutually recognized financial services, pursuant to Article 10 of the ZBan-1:1. Receiving deposits,2. Granting credits that also includes:- mortgage credits,- factoring, with or without recourse,6. Issuing of guarantees and other commitments,
The bank may perform the following supplementary financial services, pursuant to Article 11 of the ZBan-1:5. Credit brokerage.
BANKA SLOVENIJE
III.-4 Monthly Bulletin, July - August 2009
BANKS, SAVINGS BANKS AND REPRESENTATIVE OFFICES OF BANKS IN RSBANK OF SLOVENIA
EUROSYSTEM
Deželna banka Slovenije d.d.Kolodvorska ulica 91000 LjubljanaPhone: +386 (1) 472 71 00
The bank may perform the following mutually recognized financial services, pursuant to Article 10 of the ZBan-1:1. Receiving deposits,2. Granting credits that also includes:- consumer credits,- mortgage credits,- factoring, with or without recourse,- financing of commercial transactions, including forfeiting,4. Payment transaction services according to ZPlaP, except services of managing payment systems,5. Issuing and managing of payment instruments (such as credit cards and travellers cheques),6. Issuing of guarantees and other commitments,7. Trading for own account or for account of customers in:- money market instruments,- foreign exchange, including currency exchange transactions,- financial futures and options,- exchange and interest-rate instruments,- transferable securities,8. Participations in securities issues and the provision of services related to such issues,9. Advice and services related to mergers and the of undetakings,11. Portfolio management and advice,12. Safekeeping of securities and other services relating to the safekeeping of securities,13. Credit reference services: collection, analysis and provision of information on creditworthiness of legal personsand15. Investment and ancillary investment services and operations.
Factor banka d.d.Tivolska cesta 481000 LjubljanaPhone: +386 (1) 230 66 00
The bank may perform the following mutually recognized financial services, pursuant to Article 10 of the ZBan-1:1. Receiving deposits,2. Granting credits that also includes:- consumer credits,- mortgage credits,- factoring, with or without recourse,- financing of commercial transactions, including forfeiting,4. Payment transaction services according to ZPlaP, except services of managing payment systems,5. Issuing and managing of payment instruments (such as credit cards and travellers cheques),6. Issuing of guarantees and other commitments,7. Trading for own account or for account of customers in:- money market instruments,- foreign exchange, including currency exchange transactions,- financial futures and options,- exchange and interest-rate instruments,- transferable securities,8. Participations in securities issues and the provision of services related to such issues,9. Advice and services related to mergers and the of undetakings,11. Portfolio management and advice,13. Credit reference services: collection, analysis and provision of information on creditworthiness of legal persons and15. Investment and ancillary investment services and operations.
The bank may perform the following supplementary financial services, pursuant to Article 11 of the ZBan-1:3. Pension fund management in accordance with the act governing pension and disability insurance.
Gorenjska banka d.d., KranjBleiweisova cesta 14000 KranjPhone: +386 (4) 208 40 00
The bank may perform the following mutually recognized financial services, pursuant to Article 10 of the ZBan-1:1. Receiving deposits,2. Granting credits that also includes:- consumer credits,- mortgage credits,- factoring, with or without recourse,- financing of commercial transactions, including forfeiting,
BANKA SLOVENIJE
5-III.Monthly Bulletin, July - August 2009
BANK OF SLOVENIAEUROSYSTEM
BANKS, SAVINGS BANKS AND REPRESENTATIVE OFFICES OF BANKS IN RS
4. Payment transaction services according to ZPlaP, except services of managing payment systems,5. Issuing and managing of payment instruments (such as credit cards and travellers cheques),6. Issuing of guarantees and other commitments,7. Trading for own account or for account of customers in:- money market instruments,- foreign exchange, including currency exchange transactions,- financial futures and options,- exchange and interest-rate instruments,- transferable securities,8. Participations in securities issues and the provision of services related to such issues,9. Advice and services related to mergers and the of undetakings,11. Portfolio management and advice,12. Safekeeping of securities and other services relating to the safekeeping of securities,14. Rental of safe deposit boxes and15. Investment and ancillary investment services and operations.
The bank may perform the following supplementary financial services, pursuant to Article 11 of the ZBan-1:1. Insurance brokerage in accordance with the act governing the insurance business,
Hypo Alpe-Adria-Bank d.d.Dunajska cesta 1171000 LjubljanaPhone: +386 (1) 580 44 00
The bank may perform the following mutually recognized financial services, pursuant to Article 10 of the ZBan-1:1. Receiving deposits,2. Granting credits that also includes:- consumer credits,- mortgage credits,- factoring, with or without recourse,- financing of commercial transactions, including forfeiting,4. Payment transaction services according to ZPlaP, except services of managing payment systems,5. Issuing and managing of payment instruments (such as credit cards and travellers cheques),6. Issuing of guarantees and other commitments,7. Trading for own account or for account of customers in:- money market instruments,- foreign exchange, including currency exchange transactions,- financial futures and options,- exchange and interest-rate instruments,- transferable securities,8. Participations in securities issues and the provision of services related to such issues,9. Advice and services related to mergers and the of undetakings,11. Portfolio management and advice,14. Rental of safe deposit boxes and15. Investment and ancillary investment services and operations.
KD Banka, d.d.Neubergerjeva 301000 Ljubljana
The bank may perform the following mutually recognized financial services, pursuant to Article 10 of the ZBan-1:1. Receiving deposits,2. Granting credits that also includes:- consumer credits,- mortgage credits,- factoring, with or without recourse,- financing of commercial transactions, including forfeiting,4. Payment transaction services according to ZPlaP, except services of managing payment systems,5. Issuing and managing of payment instruments (such as credit cards and travellers cheques),7. Trading for own account or for account of customers in:- money market instruments,- foreign exchange, including currency exchange transactions,- financial futures and options,- exchange and interest-rate instruments,- transferable securities,8. Participations in securities issues and the provision of services related to such issues,9. Advice to undertakings on capital structure, industrial strategy and related questions and advice as well as services relating to mergers and the purchase of undertakings,11. Portfolio management and advice,12. Safekeeping of securities and other services relating to the safekeeping of securities,15. Investment and ancillary investment services and operations.

BANKA SLOVENIJE
III.-6 Monthly Bulletin, July - August 2009
BANKS, SAVINGS BANKS AND REPRESENTATIVE OFFICES OF BANKS IN RSBANK OF SLOVENIA
EUROSYSTEM
The bank may perform the following supplementary financial services, pursuant to Article 11 of the ZBan-1:1. Insurance brokerage in accordance with the act governing the insurance business,
Nova Kreditna banka Maribor d.d.Ulica Vita Kraigherja 42505 MariborPhone: +386 (2) 229 22 90
The bank may perform the following mutually recognized financial services, pursuant to Article 10 of the ZBan-1:1. Receiving deposits,2. Granting credits that also includes:- consumer credits,- mortgage credits,- factoring, with or without recourse,- financing of commercial transactions, including forfeiting,4. Payment transaction services according to ZPlaP, except services of managing payment systems,5. Issuing and managing of payment instruments (such as credit cards and travellers cheques),6. Issuing of guarantees and other commitments,7. Trading for own account or for account of customers in:- money market instruments,- foreign exchange, including currency exchange transactions,- financial futures and options,- exchange and interest-rate instruments,- transferable securities,8. Participations in securities issues and the provision of services related to such issues,9. Advice and services related to mergers and the of undetakings,11. Portfolio management and advice,12. Safekeeping of securities and other services relating to the safekeeping of securities,14. Rental of safe deposit boxes and15. Investment and ancillary investment services and operations.The bank may perform the following supplementary financial services, pursuant to Article 11 of the ZBan-1:1. Insurance brokerage in accordance with the act governing the insurance business and6. Marketing of investment funds and the sale of investment coupons or shares in investment funds.
Nova Ljubljanska banka d.d., LjubljanaTrg republike 21520 LjubljanaPhone: +386 (1) 425 01 55
The bank may perform the following mutually recognized financial services, pursuant to Article 10 of the ZBan-1:1. Receiving deposits,2. Granting credits that also includes:- consumer credits,- mortgage credits,- factoring, with or without recourse,- financing of commercial transactions, including forfeiting,4. Payment transaction services according to ZPlaP, except services of managing payment systems,5. Issuing and managing of payment instruments (such as credit cards and travellers cheques),6. Issuing of guarantees and other commitments,7. Trading for own account or for account of customers in:- money market instruments,- foreign exchange, including currency exchange transactions,- financial futures and options,- exchange and interest-rate instruments,- transferable securities,8. Participations in securities issues and the provision of services related to such issues,9. Advice to undertakings on capital structure, industrial strategy and related questions and advice as well as services relating to mergers and the purchase of undertakings,10. Money broking on inter bank markets,11. Portfolio management and advice,12. Safekeeping of securities and other services relating to the safekeeping of securities,13. Credit reference services: collection, analysis and provision of information on creditworthiness of legal persons,14. Rental of safe deposit boxes and15. Investment and ancillary investment services and operations.
The bank may perform the following supplementary financial services, pursuant to Article 11 of the ZBan-1:1. Insurance brokerage in accordance with the act governing the insurance business,4. Custodian services in accordance with the law governing investment funds and management companies and5. Credit brokerage for consumer and other types of loans;6. Administrative services for investment funds.

BANKA SLOVENIJE
7-III.Monthly Bulletin, July - August 2009
BANK OF SLOVENIAEUROSYSTEM
BANKS, SAVINGS BANKS AND REPRESENTATIVE OFFICES OF BANKS IN RS
Poštna banka Slovenije, d.d. - b. sk. NKBM d.d.Ulica Vita Kraigherja 52000 MariborPhone: +386 (2) 228 82 00
The bank may perform the following mutually recognized financial services, pursuant to Article 10 of the ZBan-1:1. Receiving deposits,2. Granting credits that also includes:- consumer credits,- mortgage credits,- factoring, with or without recourse,- financing of commercial transactions, including forfeiting,4. Payment transaction services according to ZPlaP, except services of managing payment systems,5. Issuing and managing of payment instruments (such as credit cards and travellers cheques),6. Issuing of guarantees and other commitments,7. Trading for own account or for account of customers in:- foreign exchange, including currency exchange transactions,
trading for own account:- money market instruments and- transferable securities.
Probanka d.d.Trg Leona Štuklja 122000 MariborPhone: +386 (2) 252 05 00
The bank may perform the following mutually recognized financial services, pursuant to Article 10 of the ZBan-1:1. Receiving deposits,2. Granting credits that also includes:- consumer credits,- mortgage credits,- factoring, with or without recourse,- financing of commercial transactions, including forfeiting,3. Financial leasing: financial leasing of assets of which the duration approximately equals the expected useful life of the asset which is the object of the lease and for which the lessee acquires most of the benefit from the use of the asset and accepts the full risk of the transaction,4. Payment transaction services according to ZPlaP, except services of managing payment systems,5. Issuing and managing of payment instruments (such as credit cards and travellers cheques),6. Issuing of guarantees and other commitments,7. Trading for own account or for account of customers in:- money market instruments,- foreign exchange, including currency exchange transactions,- financial futures and options,- exchange and interest-rate instruments,- transferable securities,8. Participations in securities issues and the provision of services related to such issues,9. Advice and services related to mergers and the of undetakings, 11. Portfolio management and advice,12. Safekeeping of securities and other services relating to the safekeeping of securities,14. Rental of safe deposit boxes and15. Investment and ancillary investment services and operations.
The bank may perform the following supplementary financial services, pursuant to Article 11 of the ZBan-1:1. Insurance brokerage in accordance with the act governing the insurance business and3. Pension fund management in accordance with the act governing pension and disability insurance.6. Administrative services for investment funds.
Raiffeisen banka d.d.Slovenska ulica 172000 MariborPhone: +386 (2) 229 31 00
The bank may perform the following mutually recognized financial services, pursuant to Article 10 of the ZBan-1:1. Receiving deposits,2. Granting credits that also includes:- consumer credits,- mortgage credits,- factoring, with or without recourse,- financing of commercial transactions, including forfeiting,4. Payment transaction services according to ZPlaP, except services of managing payment systems,5. Issuing and managing of payment instruments (such as credit cards and travellers cheques),6. Issuing of guarantees and other commitments,
BANKA SLOVENIJE
III.-8 Monthly Bulletin, July - August 2009
BANKS, SAVINGS BANKS AND REPRESENTATIVE OFFICES OF BANKS IN RSBANK OF SLOVENIA
EUROSYSTEM
7. Trading for own account or for account of customers in:- money market instruments,- foreign exchange, including currency exchange transactions,- financial futures and options,- exchange and interest-rate instruments,- transferable securities,8. Participations in securities issues and the provision of services related to such issues,9. Advice and services related to mergers and the of undetakings,11. Portfolio management and advice,12. Safekeeping of securities and other services relating to the safekeeping of securities,14. Rental of safe deposit boxes and15. Investment and ancillary investment services and operations.
The bank may perform the following supplementary financial services, pursuant to Article 11 of the ZBan-1:1. Insurance brokerage in accordance with the act governing the insurance business.
SKB Banka d.d. LjubljanaAjdovščina 41513 LjubljanaPhone: +386 (1) 471 51 00
The bank may perform the following mutually recognized financial services, pursuant to Article 10 of the ZBan-1:1. Receiving deposits,2. Granting credits that also includes:- consumer credits,- mortgage credits,- factoring, with or without recourse,- financing of commercial transactions, including forfeiting,3. Financial leasing: financial leasing of assets of which the duration approximately equals the expected useful life of the asset which is the object of the lease and for which the lessee acquires most of the benefit from the use of the asset and accepts the full risk of the transaction,4. Payment transaction services according to ZPlaP, except services of managing payment systems,5. Issuing and managing of payment instruments (such as credit cards and travellers cheques),6. Issuing of guarantees and other commitments,7. Trading for own account or for account of customers in:- money market instruments,- foreign exchange, including currency exchange transactions,- financial futures and options,- exchange and interest-rate instruments,- transferable securities,8. Participations in securities issues and the provision of services related to such issues,9. Advice and services related to mergers and the of undetakings,10. Money broking on interbank markets,12. Safekeeping of securities and other services relating to the safekeeping of securities,13. Credit reference services: collection, analysis and provision of information on creditworthiness of legal persons,14. Rental of safe deposit boxes and15. Investment and ancillary investment services and operations.
The bank may perform the following supplementary financial services, pursuant to Article 11 of the ZBan-1:1. Insurance brokerage in accordance with the act governing the insurance business and5. Credit brokerage for consumer and other types of loans.
Slovenska investicijska banka, d.d. – liquidation procedureČopova ulica 381101 LjubljanaPhone: +386 (1) 242 03 00
At General Meeting held on 29.12.2003 was adopted a Decision about liquidation procedure.
SID - Slovenska izvozna in razvojna banka, d.d., LjubljanaUlica Josipine Turnograjske 61000 LjubljanaPhone: +386 (1) 200 75 00
The bank may perform the following mutually recognized financial services, pursuant to Article 10 of the ZBan-1:1. Receiving deposits,2. Granting credits that also includes:- mortgage credits,- factoring, with or without recourse,- financing of commercial transactions, including forfeiting,
BANKA SLOVENIJE
9-III.Monthly Bulletin, July - August 2009
BANK OF SLOVENIAEUROSYSTEM
BANKS, SAVINGS BANKS AND REPRESENTATIVE OFFICES OF BANKS IN RS
6. Issuing of guarantees and other commitments,7. Trading for own account or for account of customers in:- foreign exchange, including currency exchange transactions,- financial futures and options,- exchange and interest-rate instruments,
trading for own account:- money market instruments and13. Credit reference services: collection, analysis and provision of information on creditworthiness of legal persons.
UniCredit Banka Slovenija d.d.Šmartinska cesta 1401000 LjubljanaPhone: +386 (1) 587 66 00
The bank may perform the following mutually recognized financial services, pursuant to Article 10 of the ZBan-1:1. Receiving deposits,2. Granting credits that also includes:- consumer credits,- mortgage credits,- factoring, with or without recourse,- financing of commercial transactions, including forfeiting,4. Payment transaction services according to ZPlaP, except services of managing payment systems,5. Issuing and managing of payment instruments (such as credit cards and travellers cheques),6. Issuing of guarantees and other commitments,7. Trading for own account or for account of customers in:- money market instruments,- foreign exchange, including currency exchange transactions,- financial futures and options,- exchange and interest-rate instruments,- transferable securities,8. Participations in securities issues and the provision of services related to such issues,9. Advice and services related to mergers and the of undetakings,11. Portfolio management and advice,15. Investment and ancillary investment services and operations.
The bank may perform the following supplementary financial services, pursuant to Article 11 of the ZBan-1:1. Insurance brokerage in accordance with the act governing the insurance business and4. Custodian services in accordance with the law governing investment funds and management companies;6. Brokerage of financial leasing.
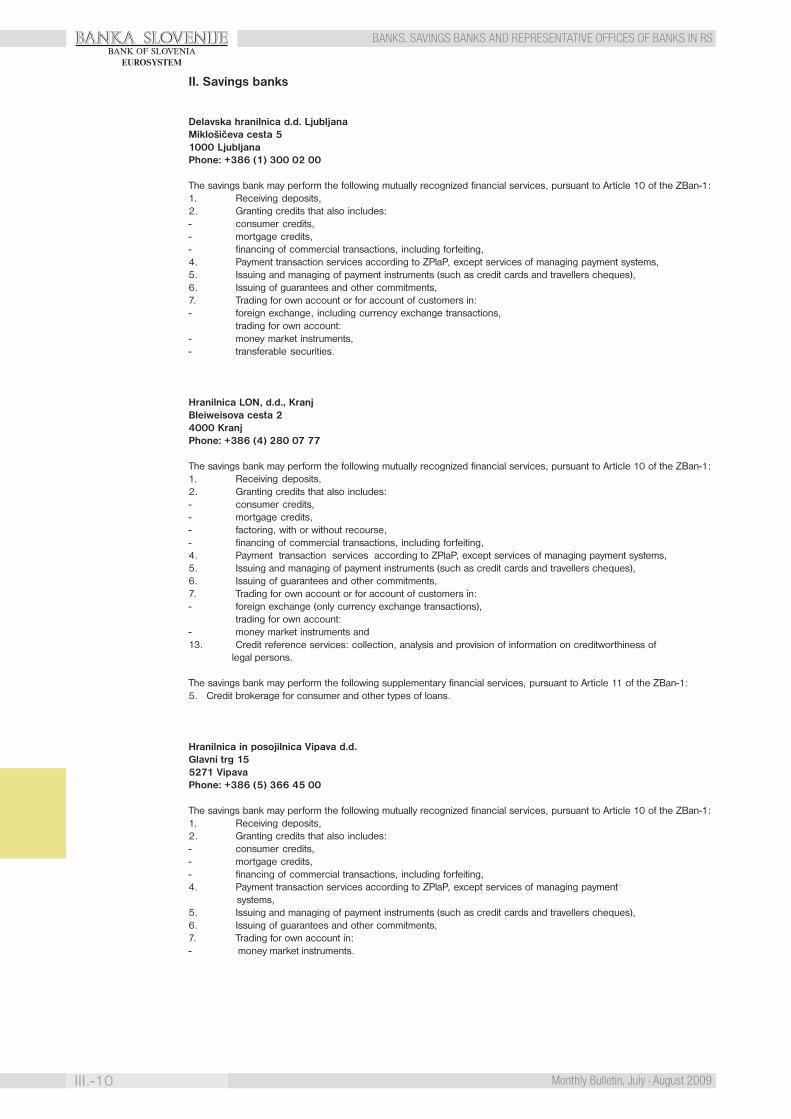
BANKA SLOVENIJE
III.-10 Monthly Bulletin, July - August 2009
BANKS, SAVINGS BANKS AND REPRESENTATIVE OFFICES OF BANKS IN RSBANK OF SLOVENIA
EUROSYSTEM
II. Savings banks
Delavska hranilnica d.d. LjubljanaMiklošičeva cesta 51000 LjubljanaPhone: +386 (1) 300 02 00
The savings bank may perform the following mutually recognized financial services, pursuant to Article 10 of the ZBan-1:1. Receiving deposits,2. Granting credits that also includes:- consumer credits,- mortgage credits,- financing of commercial transactions, including forfeiting,4. Payment transaction services according to ZPlaP, except services of managing payment systems,5. Issuing and managing of payment instruments (such as credit cards and travellers cheques),6. Issuing of guarantees and other commitments,7. Trading for own account or for account of customers in:- foreign exchange, including currency exchange transactions,
trading for own account:- money market instruments,- transferable securities.
Hranilnica LON, d.d., KranjBleiweisova cesta 24000 KranjPhone: +386 (4) 280 07 77
The savings bank may perform the following mutually recognized financial services, pursuant to Article 10 of the ZBan-1:1. Receiving deposits,2. Granting credits that also includes:- consumer credits,- mortgage credits,- factoring, with or without recourse,- financing of commercial transactions, including forfeiting,4. Payment transaction services according to ZPlaP, except services of managing payment systems,5. Issuing and managing of payment instruments (such as credit cards and travellers cheques),6. Issuing of guarantees and other commitments,7. Trading for own account or for account of customers in:- foreign exchange (only currency exchange transactions),
trading for own account:- money market instruments and13. Credit reference services: collection, analysis and provision of information on creditworthiness of legal persons.
The savings bank may perform the following supplementary financial services, pursuant to Article 11 of the ZBan-1:5. Credit brokerage for consumer and other types of loans.
Hranilnica in posojilnica Vipava d.d.Glavni trg 155271 VipavaPhone: +386 (5) 366 45 00
The savings bank may perform the following mutually recognized financial services, pursuant to Article 10 of the ZBan-1:1. Receiving deposits,2. Granting credits that also includes:- consumer credits,- mortgage credits,- financing of commercial transactions, including forfeiting,4. Payment transaction services according to ZPlaP, except services of managing payment systems,5. Issuing and managing of payment instruments (such as credit cards and travellers cheques),6. Issuing of guarantees and other commitments,7. Trading for own account in:- money market instruments.
BANKA SLOVENIJE
11-III.Monthly Bulletin, July - August 2009
BANK OF SLOVENIAEUROSYSTEM
BANKS, SAVINGS BANKS AND REPRESENTATIVE OFFICES OF BANKS IN RS
III. Representative offices of the member state’s banks:
Bank Bank representative office address
European Bank for Reconstruction European Bank for Reconstructionand Development and DevelopmentOne Exchange Square Trg republike 3London EC2A 2JN 1000 LjubljanaGreat Britain Phone: +386 (1) 426 36 00
BKS Bank AG BKS – Predstavništvo v Republiki SlovenijiSt. Veiter Ring 43 Dunajska cesta 161A-9020 Klagenfurt/ Celovec 1102 LjubljanaAustria Phone: +386 (1) 589 09 10
IV. Branches of the member state’s banks:
Banks, authorized in a Member State to carry out all or particular banking and other financial services, itemized in the AnnexI of Directive 2006/48/ES (List of activities, for which mutual recognition is enforced) and may perform these activitieswithin the Republic of Slovenia, through a branch or directly.
Branches in Slovenia:
BKS Bank AGBančna podružnicaDunajska cesta 1611102 Ljubljana
Zveza BankPodružnica LjubljanaBravničarjeva 131000 Ljubljana
RCI Banque Societe AnonymeBančna podružnica LjubljanaDunajska cesta 221511 Ljubljana
BANKA SLOVENIJE
III.-12 Monthly Bulletin, July - August 2009
BANKS, SAVINGS BANKS AND REPRESENTATIVE OFFICES OF BANKS IN RSBANK OF SLOVENIA
EUROSYSTEM
BANKA SLOVENIJE
1-IV.Monthly Bulletin, July - August 2009
NOTES ON METHODOLOGYBANK OF SLOVENIA
EUROSYSTEM
IV. NOTES ON METHODOLOGY
General notes
Sectors
For data from 30 April 1999 onwards, a sectorization has been implemented according to the Regulation on Introductionand Implementation of Standard Classification of Institutional Sectors (hereinafter SKIS), published in the Official GazetteNo. 56/98. SKIS, which implemented a national standard for economic sectorization, based on the European System ofAccounts 95 and is in accordance with the System of National Accounts 93. According to SKIS, the economy is divided intothe following sectors: non-financial corporations, financial corporations (central bank, commercial banks, and other finan-cial institutions), general government, households, non-profit institutions serving households, and the external sector (non-residents).
The external sector comprises non-residents; the domestic sector, residents.
Residents of the Republic of Slovenia are defined as:- companies and other legal entities with a registered office in the Republic of Slovenia, not including their branches abroad;- branches of foreign companies entered in the Register of Companies of the Republic of Slovenia;- sole proprietors or natural persons independently performing business activities as their primary occupation, with a registered office in the Republic of Slovenia or having permanent residence in the Republic of Slovenia;- natural persons with permanent residence in the Republic of Slovenia;- natural persons temporarily residing in the Republic of Slovenia, holding a residential or working visa valid for no less than six months; and- diplomatic, consular and other representative offices of the Republic of Slovenia abroad which are financed from the Budget, as well as Slovene citizens employed at these representative offices and their family members.
All other persons and entities shall be deemed non-residents.
The domestic sector is broken down to the monetary sector and non-monetary sectors. The monetary sector consists of theBank of Slovenia and other monetary financial institutions (banks, savings banks and money market funds). Domestic mon-etary financial institutions, owned by both residents and non-residents, are included.
Non-monetary sectors are: non-financial corporations, non-monetary financial institutions, general government, house-holds, and non-profit institutions serving households. Non-financial corporations (enterprises) are legal persons – marketproducers of goods and non-financial services.
The non-monetary financial institutions sector comprises other financial institutions. Other financial institutions are: otherfinancial intermediaries, except insurance corporations and pension funds (mutual funds, investment funds and financialleasing companies), financial auxiliaries (securities brokers/dealers, stock exchanges) and insurance corporations andpension funds.
The general government consists of the central government (administrative departments of state and central governmentagencies), local government (local administration, local agencies) and social security funds.
“Households” refers to resident individuals as consumers, resident individuals as sole proprietorships, and partnershipsbeing market producers and having no independent legal status. The data of the latter, prior to 30 April 1999, were includedin the enterprises sector.
Non-profit institutions serving households are clubs, political parties, trade unions, churches or religious societies, humani-tarian and charity organizations, and professional societies.
Characteristics of the data
- The data present stocks of assets and liabilities at the end of the period.- Data on stocks denominated in foreign currencies are converted into domestic currency using the official end-of-
period middle exchange rate.- Data in tables are not seasonally adjusted.
BANKA SLOVENIJE
IV.-2 Monthly Bulletin, July - August 2009
NOTES ON METHODOLOGYBANK OF SLOVENIA
EUROSYSTEM
Table: Republic of Slovenia: General Information
The table shows basic general data on Slovenia and its economy. In the “Latest actual” column, the latest available data forthe current year are published. Sources of the data are the Bank of Slovenia, the Ministry of Finance and the StatisticalOffice of the Republic of Slovenia.
1. MONEY AND MONETARY FINANCIAL INSTITUTIONS
Data in all tables present stocks items at the end of the period. Last published data are preliminary.The change in the reporting could cause some inconsistencies in conceptual definitions of some items in the year 2005data.
Until the end of December 2006 the data is published in the currency SIT, from 1 January 2007 the data is published in thecurrency EUR. The currency EUR in the data until the end of December 2006 is considered as foreign currency, from 1January 2007 as domestic currency.
Change of Methodology
In May 2006 the tables of the Money and Monetary Financial Institutions chapter, have been changed. Structurally similartables are based on the methodology of the European Central Bank (ECB) or of the euro area and no more on the method-ology of the International Monetary Fund. The data source for the data of the MFI’s in the changed tables is the report of themonetary financial institutions and not the bookkeeping report of the banks and savings banks. The main methodologicalchanges are explained below.
The data from the new tables is available since December 2004, while the time series of the old tables up to March 2006are still available on the Bank of Slovenia internet page (http://www.bsi.si/en/).
The main differences between the methodology of the ECB and the tables in the monthly bulletin up to April 2006 are asfollows:
- The sector of the monetary financial institutions, MFI, contains banks, savings banks, savings and loans undertakingsand money market funds, but it does not include old LB in KBM banks, while the banking sector without savings banks,savings and loans undertakings and money market funds but with the old LB and KBM is presented in the old bulletintables.
- Balance sheet total according to the ECB’s methodology differs from the balance sheet total according to the IMF’smethodology mainly because of the different treatment of the loans. The loans are recorded on gross basis in the newtables and net of provisions in the old set. Consequently the stock of the loans is different.
- There is a difference among the stock of the items loans and deposits and debt securities – among the claims andliabilities, because of the inclusion of the negotiable/non-negotiable securities into the items loans/deposits and debtsecurities. According to the ECB’s methodology, the non-negotiable debt securities are included into the loans/depos-its and the negotiable debt securities into the debt securities.
- According to the ECB’s methodology, the deals by procuration and internal affairs are included on a net basis, whilebefore they were shown on a gross basis.
- There are differences in the composition of monetary aggregates according to national definition and harmonizedmonetary aggregates according to the ECB’s definition that are described below.
Since April 2006 the data of the specific balance sheet items (loans, deposits, securities other than shares and issued debtsecurities) are in line with the ECB’s request recorded according to their nominal values. The nominal value of a specificinstrument is an amount of the principal, which is owed by the debtor to the creditor:• loans: unpaid principal, not included the accrued interest, the commissions and other expenses,• deposits: amount of the time deposits, the accrued interest not included,• debt securities: nominal value.
Interest, which is subscribed to the principal and thus increases it, is the component of the nominal value.
Description of the balance sheet instruments
Below is a short description of the balance sheet aggregate items or instruments, as defined by the European Central bank:
CashHoldings of domestic and foreign banknotes and coins in circulation that are commonly used to make payments.
LoansFor the purposes of the statistical reporting scheme, this item consists of funds lent by reporting agents to borrowers, whichare not evidenced by documents or are represented by a single document (even if it has become negotiable). It includesassets in the form of deposits, bad debt loans, in respect of which repayment is overdue or otherwise identified as beingimpaired, traded loans, subordinated debt in the form of deposits or loans and claims under reverse repos. The stock ofloans is included into the item according to the “gross” principle.
BANKA SLOVENIJE
3-IV.Monthly Bulletin, July - August 2009
NOTES ON METHODOLOGYBANK OF SLOVENIA
EUROSYSTEM
Securities other than sharesHoldings of securities other than shares or other equity, which are negotiable and usually traded on secondary markets orcan be offset on the market, and which do not grant the holder any ownership rights over the issuing institution. Besidesnegotiable debt securities this item includes: negotiable loans that have been restructured into a large number of identicaldocuments and that can be traded on secondary markets and subordinated debt in the form of debt securities. The itemdoes not include the accrued interest – which are classified into the item remaining assets, except when the separation isnot possible (when the interest is the inseparable part of the market price).
Shares and other equityHoldings of securities which represent property rights in corporations or quasi-corporations. These securities generallyentitle the holders to a share in the profits of corporations or quasi-corporations and to a share in their own funds in the eventof liquidation. Mutual fund shares and money market fund shares/units are included here.
Remaining assetsThis item may also include: financial derivative positions with gross positive market values, non-financial assets (tangible orintangible), accrued interest receivable on loans and securities, the surplus from the deals by procuration, internal affairs.
DepositsAmounts owed to creditors by reporting agents, other than those arising from the issue of negotiable debt securities.Deposits also cover loans as liabilities of MFIs, which represent amounts received by MFIs that are not structured in the formof deposits, non-negotiable debt securities issued, liabilities for the loans received and where they are not separately statedalso deposits redeemable at notice, repos and traded loans.
Debt securities issuedSecurities other than equity issued by reporting agents, which are negotiable and usually traded on secondary markets orwhich can be offset on the market, and which do not grant the holder any ownership rights over the issuing institution, andthe subordinated debt issued by MFI’s in the form of the debt securities. The accrued interest are not included in the stockdata, but classified to the remaining liabilities. The amount of debt securities is shown net of own purchase.
Capital and reservesThis category comprises the amounts arising from the issue of equity capital, including also non-distributed benefits orfunds, specific and general provisions against loans, securities and other types of assets. The item is adequately netted forthe own shares owned. This item also includes the difference between the revenues and expenditures during the year andthe money market fund shares/units issued.
Remaining liabilitiesThe remaining liabilities consist of accrued interest payable on deposits and debt securities, provisions representing theliabilities vis-ŕ-vis third persons, gross amounts payable in respect of transit items, financial derivative positions. The surplusof the liabilities over claims from the deals by procuration, internal affairs is also included here.
Tables
In May 2006 the tables from 1.1. to 1.8 have been changed and substituted with the new ones, which enables partialcontinuity of the old time series.
Table 1.1.: Monetary Aggregates
The table shows stock data at the end of month for monetary aggregates M1, M2 and M3, calculated according to thedefinition of the European Central Bank.
The main characteristics of monetary aggregates under the ECB’s definition:• Inclusion of liabilities of MFI sectors to EMU non-monetary sectors,• Exclusion of the monetary neutral sector (the central government has the status of a monetary neutral sector),• Limited maturity of items included (liabilities of up to 2 years and deposits redeemable at notice of up to 3 months only),• Equal treatment of the liabilities in domestic and foreign currency,• Inclusion of the money market fund shares/units into M3.
The entry to the euro area (on 1,1.2007) caused a break in the time series of the statistical tables in the Monthly bulletinin cases where the “currency” is an attribute. An expected reclassification of the data between the individual columns inthe tables, which keep the same name takes place, for example of the stock of outstanding loans in euros from the timeseries of “foreign currency” before the introduction to the time series of “domestic currency” after the introduction ofeuro. To enable easier reconstruction of this change, the shares of the Euro amounts in stocks of the foreign currencyon 31.12.2004, 31.12.2005 and 31.12.2006 are published in the Methodological notes for the tables 1.3, 1.4, 1.5 in1.6, where the reclassification occurred.
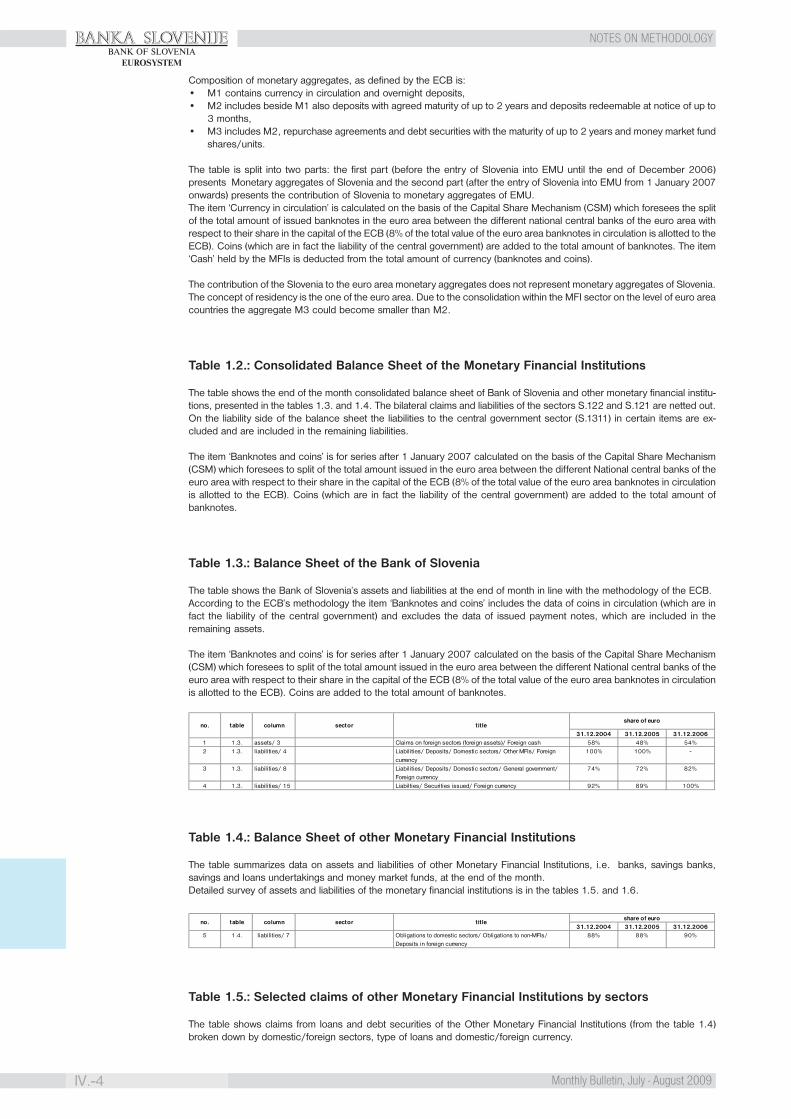
BANKA SLOVENIJE
IV.-4 Monthly Bulletin, July - August 2009
NOTES ON METHODOLOGYBANK OF SLOVENIA
EUROSYSTEM
Composition of monetary aggregates, as defined by the ECB is:• M1 contains currency in circulation and overnight deposits,• M2 includes beside M1 also deposits with agreed maturity of up to 2 years and deposits redeemable at notice of up to
3 months,• M3 includes M2, repurchase agreements and debt securities with the maturity of up to 2 years and money market fund
shares/units.
The table is split into two parts: the first part (before the entry of Slovenia into EMU until the end of December 2006)presents Monetary aggregates of Slovenia and the second part (after the entry of Slovenia into EMU from 1 January 2007onwards) presents the contribution of Slovenia to monetary aggregates of EMU.The item ‘Currency in circulation’ is calculated on the basis of the Capital Share Mechanism (CSM) which foresees the splitof the total amount of issued banknotes in the euro area between the different national central banks of the euro area withrespect to their share in the capital of the ECB (8% of the total value of the euro area banknotes in circulation is allotted to theECB). Coins (which are in fact the liability of the central government) are added to the total amount of banknotes. The item‘Cash’ held by the MFIs is deducted from the total amount of currency (banknotes and coins).
The contribution of the Slovenia to the euro area monetary aggregates does not represent monetary aggregates of Slovenia.The concept of residency is the one of the euro area. Due to the consolidation within the MFI sector on the level of euro areacountries the aggregate M3 could become smaller than M2.
Table 1.2.: Consolidated Balance Sheet of the Monetary Financial Institutions
The table shows the end of the month consolidated balance sheet of Bank of Slovenia and other monetary financial institu-tions, presented in the tables 1.3. and 1.4. The bilateral claims and liabilities of the sectors S.122 and S.121 are netted out.On the liability side of the balance sheet the liabilities to the central government sector (S.1311) in certain items are ex-cluded and are included in the remaining liabilities.
The item ‘Banknotes and coins’ is for series after 1 January 2007 calculated on the basis of the Capital Share Mechanism(CSM) which foresees to split of the total amount issued in the euro area between the different National central banks of theeuro area with respect to their share in the capital of the ECB (8% of the total value of the euro area banknotes in circulationis allotted to the ECB). Coins (which are in fact the liability of the central government) are added to the total amount ofbanknotes.
Table 1.3.: Balance Sheet of the Bank of Slovenia
The table shows the Bank of Slovenia’s assets and liabilities at the end of month in line with the methodology of the ECB.According to the ECB’s methodology the item ‘Banknotes and coins’ includes the data of coins in circulation (which are infact the liability of the central government) and excludes the data of issued payment notes, which are included in theremaining assets.
The item ‘Banknotes and coins’ is for series after 1 January 2007 calculated on the basis of the Capital Share Mechanism(CSM) which foresees to split of the total amount issued in the euro area between the different National central banks of theeuro area with respect to their share in the capital of the ECB (8% of the total value of the euro area banknotes in circulationis allotted to the ECB). Coins are added to the total amount of banknotes.
Table 1.4.: Balance Sheet of other Monetary Financial Institutions
The table summarizes data on assets and liabilities of other Monetary Financial Institutions, i.e. banks, savings banks,savings and loans undertakings and money market funds, at the end of the month.Detailed survey of assets and liabilities of the monetary financial institutions is in the tables 1.5. and 1.6.
Table 1.5.: Selected claims of other Monetary Financial Institutions by sectors
The table shows claims from loans and debt securities of the Other Monetary Financial Institutions (from the table 1.4)broken down by domestic/foreign sectors, type of loans and domestic/foreign currency.
31.12.2004 31.12.2005 31.12.20061 1.3. assets/ 3 Claims on foreign sectors (foreign assets)/ Foreign cash 58% 48% 54%2 1.3. liabilities/ 4 Liabilities/ Deposits/ Domestic sectors/ Other MFIs/ Foreign
currency100% 100% -
3 1.3. liabilities/ 8 Liabilities/ Deposits/ Domestic sectors/ General government/ Foreign currency
74% 72% 82%
4 1.3. liabilities/ 15 Liabilties/ Securities issued/ Foreign currency 92% 89% 100%
share of eurono. table column sector title
31.12.2004 31.12.2005 31.12.20065 1.4. liabilities/ 7 Obligations to domestic sectors/ Obligations to non-MFIs/
Deposits in foreign currency88% 88% 90%
titleshare of euro
no. table column sector
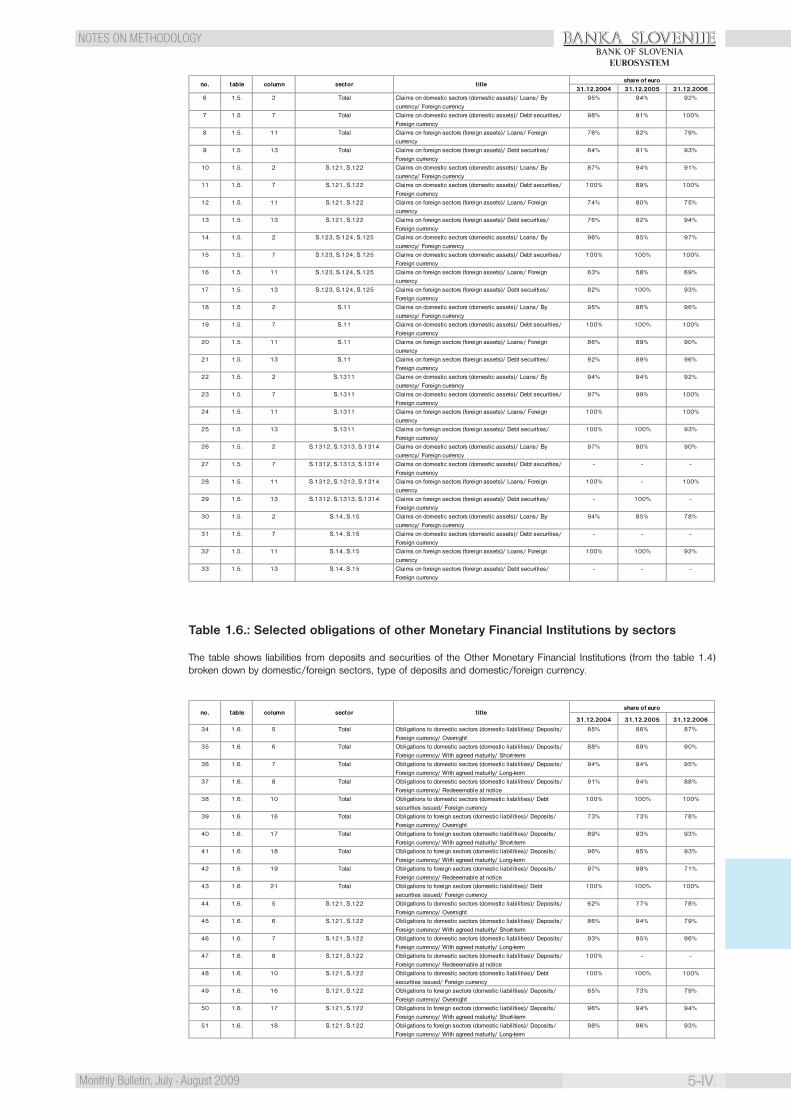
BANKA SLOVENIJE
5-IV.Monthly Bulletin, July - August 2009
NOTES ON METHODOLOGYBANK OF SLOVENIA
EUROSYSTEM
Table 1.6.: Selected obligations of other Monetary Financial Institutions by sectors
The table shows liabilities from deposits and securities of the Other Monetary Financial Institutions (from the table 1.4)broken down by domestic/foreign sectors, type of deposits and domestic/foreign currency.
31.12.2004 31.12.2005 31.12.20066 1.5. 2 Total Claims on domestic sectors (domestic assets)/ Loans/ By
currency/ Foreign currency95% 94% 92%
7 1.5. 7 Total Claims on domestic sectors (domestic assets)/ Debt securities/ Foreign currency
98% 91% 100%
8 1.5. 11 Total Claims on foreign sectors (foreign assets)/ Loans/ Foreign currency
76% 82% 79%
9 1.5. 13 Total Claims on foreign sectors (foreign assets)/ Debt securities/ Foreign currency
84% 91% 93%
10 1.5. 2 S.121, S.122 Claims on domestic sectors (domestic assets)/ Loans/ By currency/ Foreign currency
87% 94% 91%
11 1.5. 7 S.121, S.122 Claims on domestic sectors (domestic assets)/ Debt securities/ Foreign currency
100% 89% 100%
12 1.5. 11 S.121, S.122 Claims on foreign sectors (foreign assets)/ Loans/ Foreign currency
74% 80% 75%
13 1.5. 13 S.121, S.122 Claims on foreign sectors (foreign assets)/ Debt securities/ Foreign currency
76% 82% 94%
14 1.5. 2 S.123, S.124, S.125 Claims on domestic sectors (domestic assets)/ Loans/ By currency/ Foreign currency
96% 95% 97%
15 1.5. 7 S.123, S.124, S.125 Claims on domestic sectors (domestic assets)/ Debt securities/ Foreign currency
100% 100% 100%
16 1.5. 11 S.123, S.124, S.125 Claims on foreign sectors (foreign assets)/ Loans/ Foreign currency
63% 58% 69%
17 1.5. 13 S.123, S.124, S.125 Claims on foreign sectors (foreign assets)/ Debt securities/ Foreign currency
82% 100% 93%
18 1.5. 2 S.11 Claims on domestic sectors (domestic assets)/ Loans/ By currency/ Foreign currency
95% 96% 96%
19 1.5. 7 S.11 Claims on domestic sectors (domestic assets)/ Debt securities/ Foreign currency
100% 100% 100%
20 1.5. 11 S.11 Claims on foreign sectors (foreign assets)/ Loans/ Foreign currency
86% 89% 90%
21 1.5. 13 S.11 Claims on foreign sectors (foreign assets)/ Debt securities/ Foreign currency
92% 89% 96%
22 1.5. 2 S.1311 Claims on domestic sectors (domestic assets)/ Loans/ By currency/ Foreign currency
94% 94% 92%
23 1.5. 7 S.1311 Claims on domestic sectors (domestic assets)/ Debt securities/ Foreign currency
97% 99% 100%
24 1.5. 11 S.1311 Claims on foreign sectors (foreign assets)/ Loans/ Foreign currency
100% 100%
25 1.5. 13 S.1311 Claims on foreign sectors (foreign assets)/ Debt securities/ Foreign currency
100% 100% 93%
26 1.5. 2 S.1312, S.1313, S.1314 Claims on domestic sectors (domestic assets)/ Loans/ By currency/ Foreign currency
97% 90% 90%
27 1.5. 7 S.1312, S.1313, S.1314 Claims on domestic sectors (domestic assets)/ Debt securities/ Foreign currency
- - -
28 1.5. 11 S.1312, S.1313, S.1314 Claims on foreign sectors (foreign assets)/ Loans/ Foreign currency
100% - 100%
29 1.5. 13 S.1312, S.1313, S.1314 Claims on foreign sectors (foreign assets)/ Debt securities/ Foreign currency
- 100% -
30 1.5. 2 S.14, S.15 Claims on domestic sectors (domestic assets)/ Loans/ By currency/ Foreign currency
94% 85% 78%
31 1.5. 7 S.14, S.15 Claims on domestic sectors (domestic assets)/ Debt securities/ Foreign currency
- - -
32 1.5. 11 S.14, S.15 Claims on foreign sectors (foreign assets)/ Loans/ Foreign currency
100% 100% 92%
33 1.5. 13 S.14, S.15 Claims on foreign sectors (foreign assets)/ Debt securities/ Foreign currency
- - -
titleshare of euro
no. table column sector
31.12.2004 31.12.2005 31.12.2006
34 1.6. 5 Total Obligations to domestic sectors (domestic liabilities)/ Deposits/ Foreign currency/ Overnight
85% 86% 87%
35 1.6. 6 Total Obligations to domestic sectors (domestic liabilities)/ Deposits/ Foreign currency/ With agreed maturity/ Short-term
88% 89% 90%
36 1.6. 7 Total Obligations to domestic sectors (domestic liabilities)/ Deposits/ Foreign currency/ With agreed maturity/ Long-term
94% 94% 95%
37 1.6. 8 Total Obligations to domestic sectors (domestic liabilities)/ Deposits/ Foreign currency/ Redeeemable at notice
91% 94% 88%
38 1.6. 10 Total Obligations to domestic sectors (domestic liabilities)/ Debt securities issued/ Foreign currency
100% 100% 100%
39 1.6. 16 Total Obligations to foreign sectors (domestic liabilities)/ Deposits/ Foreign currency/ Overnight
73% 73% 78%
40 1.6. 17 Total Obligations to foreign sectors (domestic liabilities)/ Deposits/ Foreign currency/ With agreed maturity/ Short-term
89% 93% 93%
41 1.6. 18 Total Obligations to foreign sectors (domestic liabilities)/ Deposits/ Foreign currency/ With agreed maturity/ Long-term
96% 95% 93%
42 1.6. 19 Total Obligations to foreign sectors (domestic liabilities)/ Deposits/ Foreign currency/ Redeeemable at notice
97% 99% 71%
43 1.6. 21 Total Obligations to foreign sectors (domestic liabilities)/ Debt securities issued/ Foreign currency
100% 100% 100%
44 1.6. 5 S.121, S.122 Obligations to domestic sectors (domestic liabilities)/ Deposits/ Foreign currency/ Overnight
62% 77% 78%
45 1.6. 6 S.121, S.122 Obligations to domestic sectors (domestic liabilities)/ Deposits/ Foreign currency/ With agreed maturity/ Short-term
86% 94% 79%
46 1.6. 7 S.121, S.122 Obligations to domestic sectors (domestic liabilities)/ Deposits/ Foreign currency/ With agreed maturity/ Long-term
93% 95% 96%
47 1.6. 8 S.121, S.122 Obligations to domestic sectors (domestic liabilities)/ Deposits/ Foreign currency/ Redeeemable at notice
100% - -
48 1.6. 10 S.121, S.122 Obligations to domestic sectors (domestic liabilities)/ Debt securities issued/ Foreign currency
100% 100% 100%
49 1.6. 16 S.121, S.122 Obligations to foreign sectors (domestic liabilities)/ Deposits/ Foreign currency/ Overnight
65% 73% 79%
50 1.6. 17 S.121, S.122 Obligations to foreign sectors (domestic liabilities)/ Deposits/ Foreign currency/ With agreed maturity/ Short-term
96% 94% 94%
51 1.6. 18 S.121, S.122 Obligations to foreign sectors (domestic liabilities)/ Deposits/ Foreign currency/ With agreed maturity/ Long-term
98% 96% 93%
titleshare of euro
no. table column sector
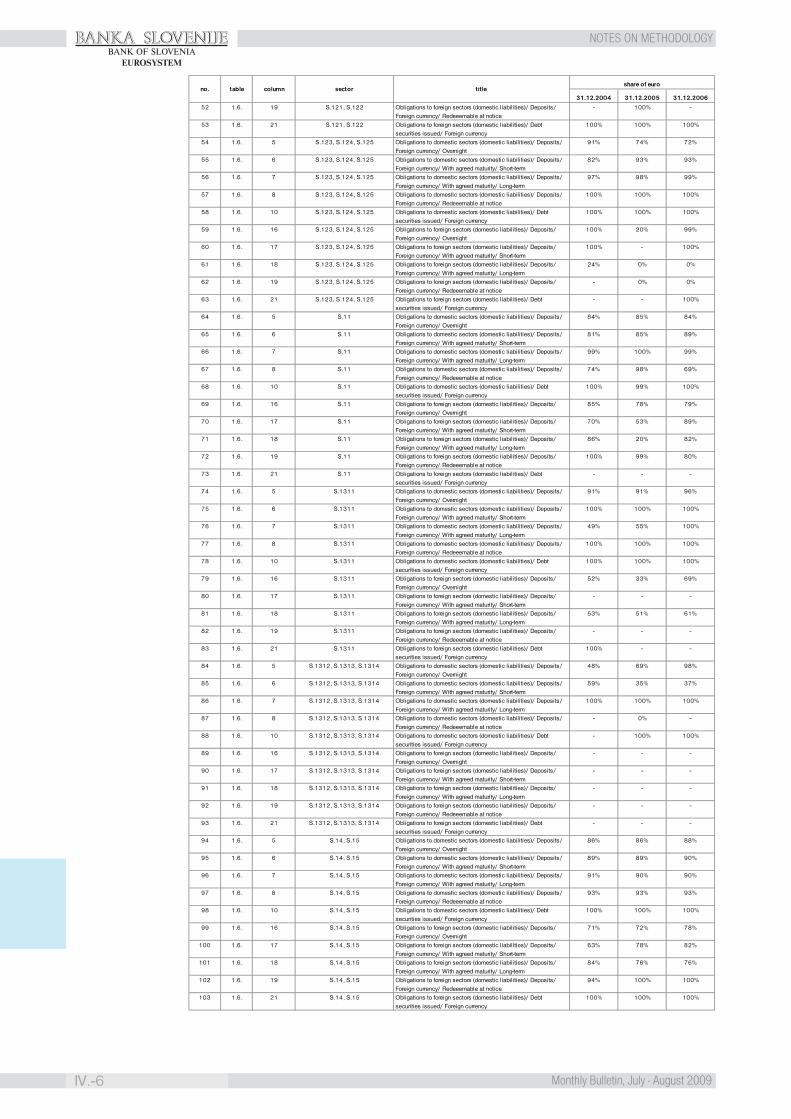
BANKA SLOVENIJE
IV.-6 Monthly Bulletin, July - August 2009
NOTES ON METHODOLOGYBANK OF SLOVENIA
EUROSYSTEM
31.12.2004 31.12.2005 31.12.2006
52 1.6. 19 S.121, S.122 Obligations to foreign sectors (domestic liabilities)/ Deposits/ Foreign currency/ Redeeemable at notice
- 100% -
53 1.6. 21 S.121, S.122 Obligations to foreign sectors (domestic liabilities)/ Debt securities issued/ Foreign currency
100% 100% 100%
54 1.6. 5 S.123, S.124, S.125 Obligations to domestic sectors (domestic liabilities)/ Deposits/ Foreign currency/ Overnight
91% 74% 72%
55 1.6. 6 S.123, S.124, S.125 Obligations to domestic sectors (domestic liabilities)/ Deposits/ Foreign currency/ With agreed maturity/ Short-term
82% 93% 93%
56 1.6. 7 S.123, S.124, S.125 Obligations to domestic sectors (domestic liabilities)/ Deposits/ Foreign currency/ With agreed maturity/ Long-term
97% 98% 99%
57 1.6. 8 S.123, S.124, S.125 Obligations to domestic sectors (domestic liabilities)/ Deposits/ Foreign currency/ Redeeemable at notice
100% 100% 100%
58 1.6. 10 S.123, S.124, S.125 Obligations to domestic sectors (domestic liabilities)/ Debt securities issued/ Foreign currency
100% 100% 100%
59 1.6. 16 S.123, S.124, S.125 Obligations to foreign sectors (domestic liabilities)/ Deposits/ Foreign currency/ Overnight
100% 20% 99%
60 1.6. 17 S.123, S.124, S.125 Obligations to foreign sectors (domestic liabilities)/ Deposits/ Foreign currency/ With agreed maturity/ Short-term
100% - 100%
61 1.6. 18 S.123, S.124, S.125 Obligations to foreign sectors (domestic liabilities)/ Deposits/ Foreign currency/ With agreed maturity/ Long-term
24% 0% 0%
62 1.6. 19 S.123, S.124, S.125 Obligations to foreign sectors (domestic liabilities)/ Deposits/ Foreign currency/ Redeeemable at notice
- 0% 0%
63 1.6. 21 S.123, S.124, S.125 Obligations to foreign sectors (domestic liabilities)/ Debt securities issued/ Foreign currency
- - 100%
64 1.6. 5 S.11 Obligations to domestic sectors (domestic liabilities)/ Deposits/ Foreign currency/ Overnight
84% 85% 84%
65 1.6. 6 S.11 Obligations to domestic sectors (domestic liabilities)/ Deposits/ Foreign currency/ With agreed maturity/ Short-term
81% 85% 89%
66 1.6. 7 S.11 Obligations to domestic sectors (domestic liabilities)/ Deposits/ Foreign currency/ With agreed maturity/ Long-term
99% 100% 99%
67 1.6. 8 S.11 Obligations to domestic sectors (domestic liabilities)/ Deposits/ Foreign currency/ Redeeemable at notice
74% 98% 69%
68 1.6. 10 S.11 Obligations to domestic sectors (domestic liabilities)/ Debt securities issued/ Foreign currency
100% 99% 100%
69 1.6. 16 S.11 Obligations to foreign sectors (domestic liabilities)/ Deposits/ Foreign currency/ Overnight
85% 78% 79%
70 1.6. 17 S.11 Obligations to foreign sectors (domestic liabilities)/ Deposits/ Foreign currency/ With agreed maturity/ Short-term
70% 53% 89%
71 1.6. 18 S.11 Obligations to foreign sectors (domestic liabilities)/ Deposits/ Foreign currency/ With agreed maturity/ Long-term
86% 20% 82%
72 1.6. 19 S.11 Obligations to foreign sectors (domestic liabilities)/ Deposits/ Foreign currency/ Redeeemable at notice
100% 99% 80%
73 1.6. 21 S.11 Obligations to foreign sectors (domestic liabilities)/ Debt securities issued/ Foreign currency
- - -
74 1.6. 5 S.1311 Obligations to domestic sectors (domestic liabilities)/ Deposits/ Foreign currency/ Overnight
91% 91% 96%
75 1.6. 6 S.1311 Obligations to domestic sectors (domestic liabilities)/ Deposits/ Foreign currency/ With agreed maturity/ Short-term
100% 100% 100%
76 1.6. 7 S.1311 Obligations to domestic sectors (domestic liabilities)/ Deposits/ Foreign currency/ With agreed maturity/ Long-term
49% 55% 100%
77 1.6. 8 S.1311 Obligations to domestic sectors (domestic liabilities)/ Deposits/ Foreign currency/ Redeeemable at notice
100% 100% 100%
78 1.6. 10 S.1311 Obligations to domestic sectors (domestic liabilities)/ Debt securities issued/ Foreign currency
100% 100% 100%
79 1.6. 16 S.1311 Obligations to foreign sectors (domestic liabilities)/ Deposits/ Foreign currency/ Overnight
52% 33% 69%
80 1.6. 17 S.1311 Obligations to foreign sectors (domestic liabilities)/ Deposits/ Foreign currency/ With agreed maturity/ Short-term
- - -
81 1.6. 18 S.1311 Obligations to foreign sectors (domestic liabilities)/ Deposits/ Foreign currency/ With agreed maturity/ Long-term
53% 51% 61%
82 1.6. 19 S.1311 Obligations to foreign sectors (domestic liabilities)/ Deposits/ Foreign currency/ Redeeemable at notice
- - -
83 1.6. 21 S.1311 Obligations to foreign sectors (domestic liabilities)/ Debt securities issued/ Foreign currency
100% - -
84 1.6. 5 S.1312, S.1313, S.1314 Obligations to domestic sectors (domestic liabilities)/ Deposits/ Foreign currency/ Overnight
48% 69% 98%
85 1.6. 6 S.1312, S.1313, S.1314 Obligations to domestic sectors (domestic liabilities)/ Deposits/ Foreign currency/ With agreed maturity/ Short-term
59% 35% 37%
86 1.6. 7 S.1312, S.1313, S.1314 Obligations to domestic sectors (domestic liabilities)/ Deposits/ Foreign currency/ With agreed maturity/ Long-term
100% 100% 100%
87 1.6. 8 S.1312, S.1313, S.1314 Obligations to domestic sectors (domestic liabilities)/ Deposits/ Foreign currency/ Redeeemable at notice
- 0% -
88 1.6. 10 S.1312, S.1313, S.1314 Obligations to domestic sectors (domestic liabilities)/ Debt securities issued/ Foreign currency
- 100% 100%
89 1.6. 16 S.1312, S.1313, S.1314 Obligations to foreign sectors (domestic liabilities)/ Deposits/ Foreign currency/ Overnight
- - -
90 1.6. 17 S.1312, S.1313, S.1314 Obligations to foreign sectors (domestic liabilities)/ Deposits/ Foreign currency/ With agreed maturity/ Short-term
- - -
91 1.6. 18 S.1312, S.1313, S.1314 Obligations to foreign sectors (domestic liabilities)/ Deposits/ Foreign currency/ With agreed maturity/ Long-term
- - -
92 1.6. 19 S.1312, S.1313, S.1314 Obligations to foreign sectors (domestic liabilities)/ Deposits/ Foreign currency/ Redeeemable at notice
- - -
93 1.6. 21 S.1312, S.1313, S.1314 Obligations to foreign sectors (domestic liabilities)/ Debt securities issued/ Foreign currency
- - -
94 1.6. 5 S.14, S.15 Obligations to domestic sectors (domestic liabilities)/ Deposits/ Foreign currency/ Overnight
86% 86% 88%
95 1.6. 6 S.14, S.15 Obligations to domestic sectors (domestic liabilities)/ Deposits/ Foreign currency/ With agreed maturity/ Short-term
89% 89% 90%
96 1.6. 7 S.14, S.15 Obligations to domestic sectors (domestic liabilities)/ Deposits/ Foreign currency/ With agreed maturity/ Long-term
91% 90% 90%
97 1.6. 8 S.14, S.15 Obligations to domestic sectors (domestic liabilities)/ Deposits/ Foreign currency/ Redeeemable at notice
93% 93% 93%
98 1.6. 10 S.14, S.15 Obligations to domestic sectors (domestic liabilities)/ Debt securities issued/ Foreign currency
100% 100% 100%
99 1.6. 16 S.14, S.15 Obligations to foreign sectors (domestic liabilities)/ Deposits/ Foreign currency/ Overnight
71% 72% 78%
100 1.6. 17 S.14, S.15 Obligations to foreign sectors (domestic liabilities)/ Deposits/ Foreign currency/ With agreed maturity/ Short-term
63% 78% 82%
101 1.6. 18 S.14, S.15 Obligations to foreign sectors (domestic liabilities)/ Deposits/ Foreign currency/ With agreed maturity/ Long-term
84% 76% 76%
102 1.6. 19 S.14, S.15 Obligations to foreign sectors (domestic liabilities)/ Deposits/ Foreign currency/ Redeeemable at notice
94% 100% 100%
103 1.6. 21 S.14, S.15 Obligations to foreign sectors (domestic liabilities)/ Debt securities issued/ Foreign currency
100% 100% 100%
titleshare of euro
no. table column sector
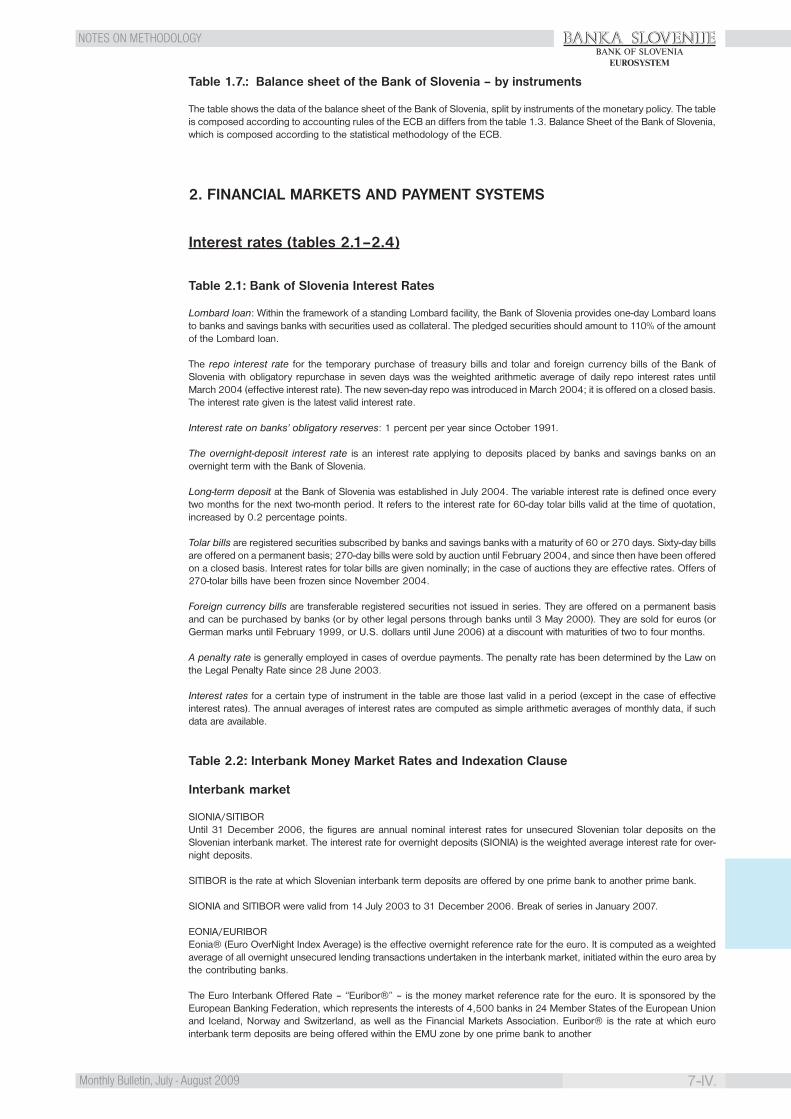
BANKA SLOVENIJE
7-IV.Monthly Bulletin, July - August 2009
NOTES ON METHODOLOGYBANK OF SLOVENIA
EUROSYSTEM
Table 1.7.: Balance sheet of the Bank of Slovenia – by instruments
The table shows the data of the balance sheet of the Bank of Slovenia, split by instruments of the monetary policy. The tableis composed according to accounting rules of the ECB an differs from the table 1.3. Balance Sheet of the Bank of Slovenia,which is composed according to the statistical methodology of the ECB.
2. FINANCIAL MARKETS AND PAYMENT SYSTEMS
Interest rates (tables 2.1–2.4)
Table 2.1: Bank of Slovenia Interest Rates
Lombard loan: Within the framework of a standing Lombard facility, the Bank of Slovenia provides one-day Lombard loansto banks and savings banks with securities used as collateral. The pledged securities should amount to 110% of the amountof the Lombard loan.
The repo interest rate for the temporary purchase of treasury bills and tolar and foreign currency bills of the Bank ofSlovenia with obligatory repurchase in seven days was the weighted arithmetic average of daily repo interest rates untilMarch 2004 (effective interest rate). The new seven-day repo was introduced in March 2004; it is offered on a closed basis.The interest rate given is the latest valid interest rate.
Interest rate on banks’ obligatory reserves: 1 percent per year since October 1991.
The overnight-deposit interest rate is an interest rate applying to deposits placed by banks and savings banks on anovernight term with the Bank of Slovenia.
Long-term deposit at the Bank of Slovenia was established in July 2004. The variable interest rate is defined once everytwo months for the next two-month period. It refers to the interest rate for 60-day tolar bills valid at the time of quotation,increased by 0.2 percentage points.
Tolar bills are registered securities subscribed by banks and savings banks with a maturity of 60 or 270 days. Sixty-day billsare offered on a permanent basis; 270-day bills were sold by auction until February 2004, and since then have been offeredon a closed basis. Interest rates for tolar bills are given nominally; in the case of auctions they are effective rates. Offers of270-tolar bills have been frozen since November 2004.
Foreign currency bills are transferable registered securities not issued in series. They are offered on a permanent basisand can be purchased by banks (or by other legal persons through banks until 3 May 2000). They are sold for euros (orGerman marks until February 1999, or U.S. dollars until June 2006) at a discount with maturities of two to four months.
A penalty rate is generally employed in cases of overdue payments. The penalty rate has been determined by the Law onthe Legal Penalty Rate since 28 June 2003.
Interest rates for a certain type of instrument in the table are those last valid in a period (except in the case of effectiveinterest rates). The annual averages of interest rates are computed as simple arithmetic averages of monthly data, if suchdata are available.
Table 2.2: Interbank Money Market Rates and Indexation Clause
Interbank market
SIONIA/SITIBORUntil 31 December 2006, the figures are annual nominal interest rates for unsecured Slovenian tolar deposits on theSlovenian interbank market. The interest rate for overnight deposits (SIONIA) is the weighted average interest rate for over-night deposits.
SITIBOR is the rate at which Slovenian interbank term deposits are offered by one prime bank to another prime bank.
SIONIA and SITIBOR were valid from 14 July 2003 to 31 December 2006. Break of series in January 2007.
EONIA/EURIBOREonia® (Euro OverNight Index Average) is the effective overnight reference rate for the euro. It is computed as a weightedaverage of all overnight unsecured lending transactions undertaken in the interbank market, initiated within the euro area bythe contributing banks.
The Euro Interbank Offered Rate – “Euribor®” – is the money market reference rate for the euro. It is sponsored by theEuropean Banking Federation, which represents the interests of 4,500 banks in 24 Member States of the European Unionand Iceland, Norway and Switzerland, as well as the Financial Markets Association. Euribor® is the rate at which eurointerbank term deposits are being offered within the EMU zone by one prime bank to another
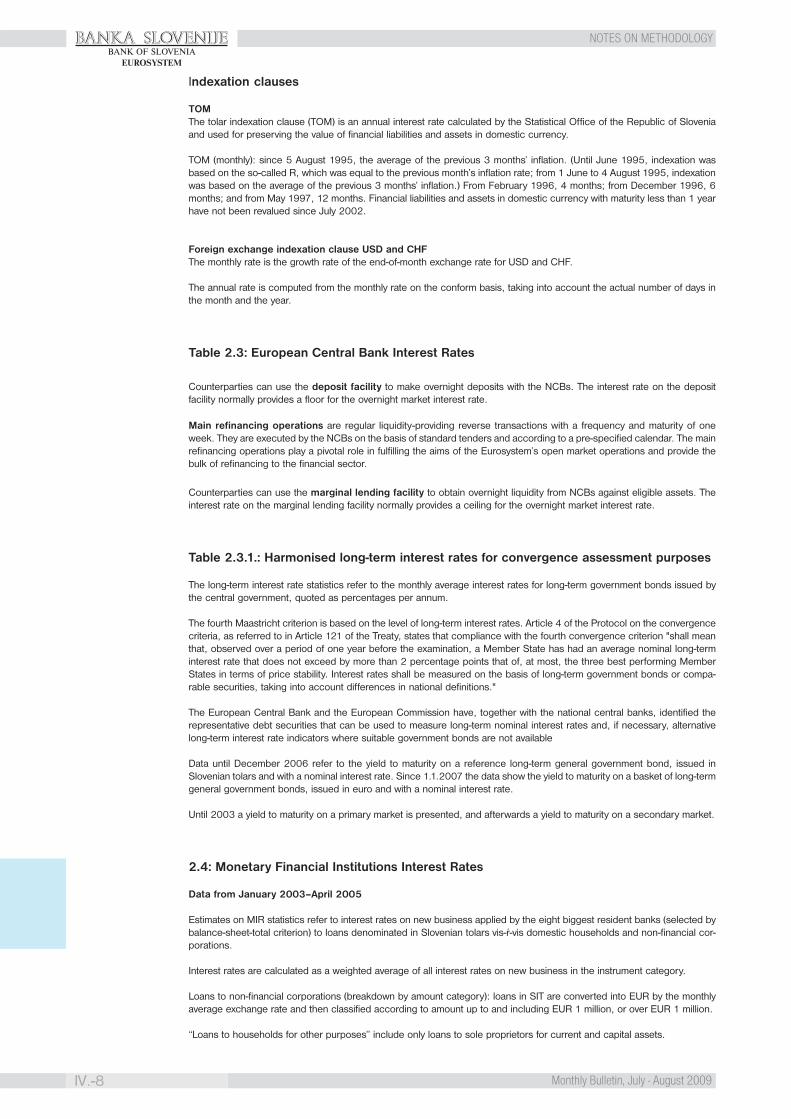
BANKA SLOVENIJE
IV.-8 Monthly Bulletin, July - August 2009
NOTES ON METHODOLOGYBANK OF SLOVENIA
EUROSYSTEM
Indexation clauses
TOMThe tolar indexation clause (TOM) is an annual interest rate calculated by the Statistical Office of the Republic of Sloveniaand used for preserving the value of financial liabilities and assets in domestic currency.
TOM (monthly): since 5 August 1995, the average of the previous 3 months’ inflation. (Until June 1995, indexation wasbased on the so-called R, which was equal to the previous month’s inflation rate; from 1 June to 4 August 1995, indexationwas based on the average of the previous 3 months’ inflation.) From February 1996, 4 months; from December 1996, 6months; and from May 1997, 12 months. Financial liabilities and assets in domestic currency with maturity less than 1 yearhave not been revalued since July 2002.
Foreign exchange indexation clause USD and CHFThe monthly rate is the growth rate of the end-of-month exchange rate for USD and CHF.
The annual rate is computed from the monthly rate on the conform basis, taking into account the actual number of days inthe month and the year.
Table 2.3: European Central Bank Interest Rates
Counterparties can use the deposit facility to make overnight deposits with the NCBs. The interest rate on the depositfacility normally provides a floor for the overnight market interest rate.
Main refinancing operations are regular liquidity-providing reverse transactions with a frequency and maturity of oneweek. They are executed by the NCBs on the basis of standard tenders and according to a pre-specified calendar. The mainrefinancing operations play a pivotal role in fulfilling the aims of the Eurosystem’s open market operations and provide thebulk of refinancing to the financial sector.
Counterparties can use the marginal lending facility to obtain overnight liquidity from NCBs against eligible assets. Theinterest rate on the marginal lending facility normally provides a ceiling for the overnight market interest rate.
Table 2.3.1.: Harmonised long-term interest rates for convergence assessment purposes
The long-term interest rate statistics refer to the monthly average interest rates for long-term government bonds issued bythe central government, quoted as percentages per annum.
The fourth Maastricht criterion is based on the level of long-term interest rates. Article 4 of the Protocol on the convergencecriteria, as referred to in Article 121 of the Treaty, states that compliance with the fourth convergence criterion "shall meanthat, observed over a period of one year before the examination, a Member State has had an average nominal long-terminterest rate that does not exceed by more than 2 percentage points that of, at most, the three best performing MemberStates in terms of price stability. Interest rates shall be measured on the basis of long-term government bonds or compa-rable securities, taking into account differences in national definitions."
The European Central Bank and the European Commission have, together with the national central banks, identified therepresentative debt securities that can be used to measure long-term nominal interest rates and, if necessary, alternativelong-term interest rate indicators where suitable government bonds are not available
Data until December 2006 refer to the yield to maturity on a reference long-term general government bond, issued inSlovenian tolars and with a nominal interest rate. Since 1.1.2007 the data show the yield to maturity on a basket of long-termgeneral government bonds, issued in euro and with a nominal interest rate.
Until 2003 a yield to maturity on a primary market is presented, and afterwards a yield to maturity on a secondary market.
2.4: Monetary Financial Institutions Interest Rates
Data from January 2003–April 2005
Estimates on MIR statistics refer to interest rates on new business applied by the eight biggest resident banks (selected bybalance-sheet-total criterion) to loans denominated in Slovenian tolars vis-ŕ-vis domestic households and non-financial cor-porations.
Interest rates are calculated as a weighted average of all interest rates on new business in the instrument category.
Loans to non-financial corporations (breakdown by amount category): loans in SIT are converted into EUR by the monthlyaverage exchange rate and then classified according to amount up to and including EUR 1 million, or over EUR 1 million.
“Loans to households for other purposes” include only loans to sole proprietors for current and capital assets.

BANKA SLOVENIJE
9-IV.Monthly Bulletin, July - August 2009
NOTES ON METHODOLOGYBANK OF SLOVENIA
EUROSYSTEM
Data on APRC in the period from January to August 2003 refer to six respondents, and from August 2003 to December2003, to seven out of eight total respondents.Data from May 2005–December 2006 covers business conducted in SIT by the total MFI population in Slovenia.
MFI interest rate statistics cover those interest rates that resident monetary financial institutions (MFIs, i.e. “credit institu-tions”) apply to euro-denominated deposits and loans by households and non-financial corporations which are residents ofthe euro area.
The legal requirements for MFI interest rate statistics are laid down in Regulation ECB/2001/18, which defines the statis-tical standards according to which monetary financial institutions must report their interest rate statistics. This regulation iscomplemented by the Manual on MFI Interest Rate Statistics, which further clarifies and illustrates the statistical require-ments. The MFI interest rate statistics refer to the interest rates individually agreed between a credit institution or otherinstitution and its customer. They are converted to an annual basis, taking into account the frequency of interest payments,and are quoted in percentages per annum. At the euro area level 45 interest rate indicators with the corresponding volumesare collected, of which 31 refer to new business and 14 to outstanding amounts.
Outstanding amounts are defined as the stock of all deposits placed by customers, i.e. households and non-financialcorporations, with credit institutions or other MFIs, and the stock of all loans granted by credit institutions to customers. Aninterest rate on outstanding amounts reflects the weighted average interest rate applied to the stock of deposits or loans inthe relevant instrument category in the time reference period. Interest rates on outstanding deposits cover all depositsplaced and not yet withdrawn by customers in all periods up to and including the reporting date. Interest rates on outstand-ing loans cover all loans used and not yet repaid by customers in all periods up to and including the reporting date, althoughexcluding bad loans and loans for debt restructuring at rates below market conditions. MFI interest rates on outstandingamounts are hence statistics on the interest rates actually applied to all “open” deposits and loans.New business is defined as any new agreement between the household or non-financial corporation and the credit orother institution. New agreements comprise all financial contracts, the terms and conditions of which specify for the firsttime the interest rate on the deposit or loan, and all new negotiations of existing deposits and loans. The prolongation ofexisting deposit and loan contracts which are carried out automatically, i.e. without any active involvement of the householdor non-financial corporation, and which do not involve any renegotiating of the terms and conditions of the contracts,including the interest rate, are not considered new business.
The annual percentage rate of charge (APRC) is an effective lending rate that covers the total cost of credit to theconsumer, i.e. the interest payments as well as all other related charges. It covers the total cost of credit to the consumer,as defined in Article 18(2) of the Consumer Credit Act. Charges defined in Article 18 of the Consumer Credit Act areexcluded. APRC is compiled only for consumer credit and loans to households for house purchases (sole proprietorsexcluded).
Weighting method: The interest rates on new business are weighted by the size of the individual agreement.
The new interest rate statistics replace the average bank interest rates published by the Bank of Slovenia. The coverage anddefinition of the new statistics differ substantially from those previously published. Therefore, a direct comparison of thenew and old rates is not possible.
* Households = sole proprietorships + individuals + non-profit institutions serving households**APRC data includes households without sole proprietorships and without non-profit institutions serving households
Note 1: For this instrument category, new business and outstanding amounts coincide.Note 2: For this instrument category, households and non-financial corporations are merged and shown under the house-hold sector.
Ljubljana Stock Exchange (Tables 2.6 to 2.8)
General
Data prior to 2007 are published in tolars; from 2007, data are published in euros.
Table 2.6: The Ljubljana Stock Exchange: Turnover by Market Segment and Type of Secu-rities
Shares – investment fund shares are not included.IF – investment fund shares.
Turnover is measured with a single counting.
Table 2.7: The Ljubljana Stock Exchange: Market Capitalisation and Turnover Ratio
Market capitalisation by market segment and by type of securities is calculated as the sum of the market capitalisation of
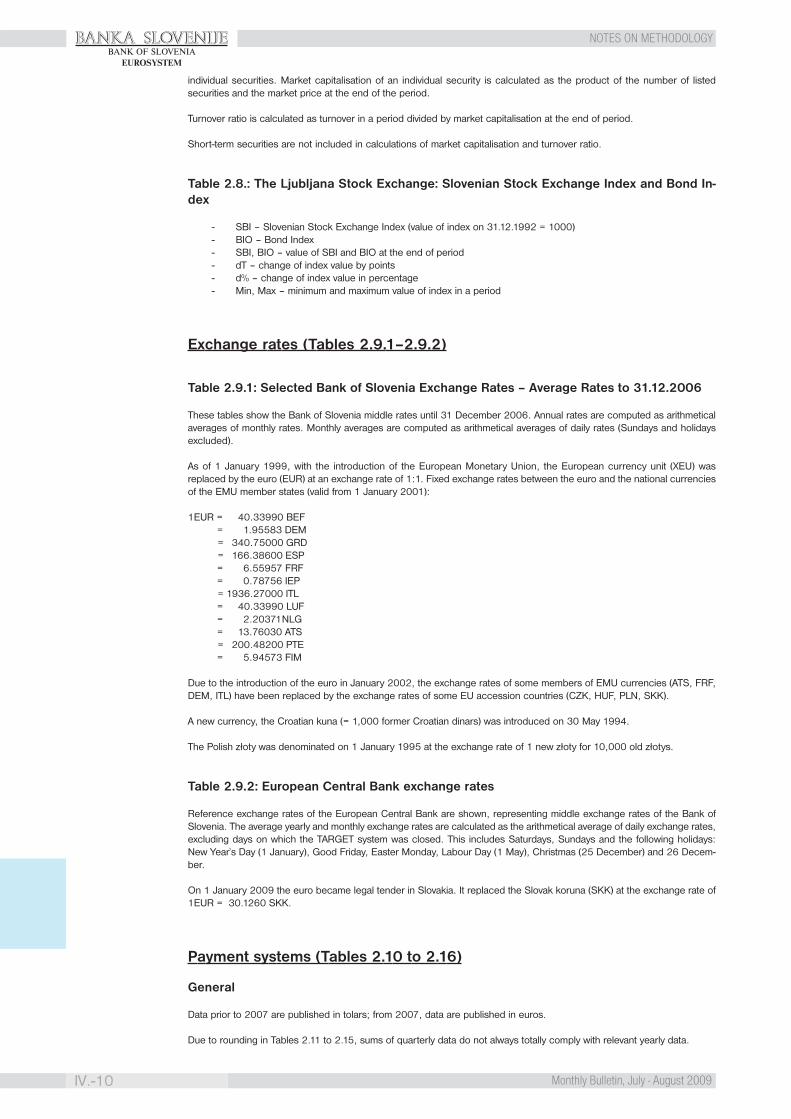
BANKA SLOVENIJE
IV.-10 Monthly Bulletin, July - August 2009
NOTES ON METHODOLOGYBANK OF SLOVENIA
EUROSYSTEM
individual securities. Market capitalisation of an individual security is calculated as the product of the number of listedsecurities and the market price at the end of the period.
Turnover ratio is calculated as turnover in a period divided by market capitalisation at the end of period.
Short-term securities are not included in calculations of market capitalisation and turnover ratio.
Table 2.8.: The Ljubljana Stock Exchange: Slovenian Stock Exchange Index and Bond In-dex
- SBI – Slovenian Stock Exchange Index (value of index on 31.12.1992 = 1000)- BIO – Bond Index- SBI, BIO – value of SBI and BIO at the end of period- dT – change of index value by points- d% – change of index value in percentage- Min, Max – minimum and maximum value of index in a period
Exchange rates (Tables 2.9.1–2.9.2)
Table 2.9.1: Selected Bank of Slovenia Exchange Rates – Average Rates to 31.12.2006
These tables show the Bank of Slovenia middle rates until 31 December 2006. Annual rates are computed as arithmeticalaverages of monthly rates. Monthly averages are computed as arithmetical averages of daily rates (Sundays and holidaysexcluded).
As of 1 January 1999, with the introduction of the European Monetary Union, the European currency unit (XEU) wasreplaced by the euro (EUR) at an exchange rate of 1:1. Fixed exchange rates between the euro and the national currenciesof the EMU member states (valid from 1 January 2001):
1EUR = 40.33990 BEF = 1.95583 DEM = 340.75000 GRD = 166.38600 ESP = 6.55957 FRF = 0.78756 IEP = 1936.27000 ITL = 40.33990 LUF = 2.20371NLG = 13.76030 ATS = 200.48200 PTE = 5.94573 FIM
Due to the introduction of the euro in January 2002, the exchange rates of some members of EMU currencies (ATS, FRF,DEM, ITL) have been replaced by the exchange rates of some EU accession countries (CZK, HUF, PLN, SKK).
A new currency, the Croatian kuna (= 1,000 former Croatian dinars) was introduced on 30 May 1994.
The Polish złoty was denominated on 1 January 1995 at the exchange rate of 1 new złoty for 10,000 old złotys.
Table 2.9.2: European Central Bank exchange rates
Reference exchange rates of the European Central Bank are shown, representing middle exchange rates of the Bank ofSlovenia. The average yearly and monthly exchange rates are calculated as the arithmetical average of daily exchange rates,excluding days on which the TARGET system was closed. This includes Saturdays, Sundays and the following holidays:New Year’s Day (1 January), Good Friday, Easter Monday, Labour Day (1 May), Christmas (25 December) and 26 Decem-ber.
On 1 January 2009 the euro became legal tender in Slovakia. It replaced the Slovak koruna (SKK) at the exchange rate of1EUR = 30.1260 SKK.
Payment systems (Tables 2.10 to 2.16)
General
Data prior to 2007 are published in tolars; from 2007, data are published in euros.
Due to rounding in Tables 2.11 to 2.15, sums of quarterly data do not always totally comply with relevant yearly data.
BANKA SLOVENIJE
11-IV.Monthly Bulletin, July - August 2009
NOTES ON METHODOLOGYBANK OF SLOVENIA
EUROSYSTEM
Table 2.10: TARGET and Giro Clearing transactions
Note 1: On 1st January 2007 the transaction limit for payments submitted to the Giro Clearing system (multilateral netsystem for small value payments), raised from EUR 8.354,21 to EUR 50.000.
Note 2: Until 29th December 2006 payments data on domestic payments between Slovenian participants are published fordomestic Slovenian RTGS system (values in billion Slovenian tolars). As of 1st January 2007 domestic payments of SlovenianTARGET participants represents payments sent from Slovenian credit institutions to another Slovenian payment institution,direct participated in the TARGET system.As of 19th November 2007 payments in TARGET 2 system are considered.
Note 3: As of 1st January 2007 cross-border payments of Slovenian TARGET participants represents payments sent fromSlovenian credit institutions to non-Slovenian credit institutions, direct participated in the TARGET system.As of 19th November 2007 payments in TARGET 2 system are considered.
Table 2.11 Payment Cards
Note 1: Credit card: A card indicating that the holder has been granted a line of credit. The credit granted may be settled infull by a specific date each month (delayed debit card, i.e. charge card), or may be settled in part, with the balance taken asextended credit (credit card).
Note 2: Debit card: A card which enables the holder to have purchases directly charged to funds on the cardholder’s bankaccount.
Note 3: Cards issued abroad: Payment cards issued abroad and used for payments in Slovenia, mostly by non-residents.
Note 4: Volume and value of transactions abroad: Use of cards issued in Slovenia for payments abroad.
Number of payment cards in circulation: Number of valid payment cards held by residents and non-residents issued inSlovenia. Data refer to the end of each quarter/year.Number and value of payments refer to the use of payment cards in each quarter/year.
Domestic card: Payment card issued by banks and enterprises resident in Slovenia without licence agreements withforeign issuers.
Licence card: Payment card issued by banks and enterprises resident in Slovenia under licence agreements with foreignissuers.
Bank card: Payment card issued by banks.
Retailer card: Payment card issued by non-banking institutions, mostly for use at specific retail outlets.
Personal card: Payment card issued to a natural person (family cards included).
Business card: Payment card issued to a legal entity.
Table 2.12 Other Payment Instruments and Innovative Payment Schemes
Note 1: Data refer to the end of each quarter.
Note 2: Prior to 2007 the data refer to payment transactions and money withdrawals at manual POS and EFT POS terminalsin Slovenia. From 2007 on, the data on money withdrawals are not included.
Table 2.13 Electronic Banking
Note 1: Only debt transactions are included.
Table 2.14 Credit Transfers
A paper-based order is a payment instrument related to a credit or debit transfer, in which the payer submits an order ona paper-based form. In case of credit transfer it means any instruction by an account holder to his payment service providerrequesting the transfer of funds from his account to another account (also between accounts of the same account holder).Includes submissions by telefax if they require manual intervention in order to be transformed into electronic payments.
BANKA SLOVENIJE
IV.-12 Monthly Bulletin, July - August 2009
NOTES ON METHODOLOGYBANK OF SLOVENIA
EUROSYSTEM
Special payment order is a special form of paper-based payment order, which is issued by a payee (beneficiary) to be paidby the debtor. The special payment order is presented by the payer at the bank, which then debits his transaction accountand transfers the amount to the account of the payee, potentially via several other credit institutions as intermediaries and/or one or more payment and settlement systems. A contemporary form can assure automated processing with ICR technol-ogy (Intelligent Character Recognition) or classic manual processing.
A non-paper-based credit transfer is any credit transfer which the payer submits without the use of paper forms i.e.electronically. Includes submissions by telefax or other means if they are transformed into electronic payments withoutmanual intervention.
A standing order is a non-paper-based credit transfer and means an instruction from a payer to his bank to make a regularpayment of a fixed amount to a named creditor. The payer authorises his bank (the bank at which he maintains a transactionaccount) to pay a specified amount regularly to another account. The payment must be repeated at least five times. Theexecution of payments occurs under exact conditions on a particular day of the month.
Direct credit is special form of payment instrument related to a credit transfer, initiated by the payer, which enables acashless fund transfer from payer to payee. Direct credit is used for the execution of small value payments, e.g., salaries,pensions, dividends and similar payments, to a large number of creditors.
Table 2.15 Debit Transfers and Simply book-entry
Direct debit is an authorised debit on the payer's bank account initiated by the payee. It is a payment instrument consistingof automatic debiting of the debtor's account for goods and services delivered by the creditor. The debtor (payer) authoriseshis bank to transfer funds from his bank account to the creditor's account and the creditor to submit a payment order to thecreditor's bank to be paid. A typical example is an electricity bill payment.
A special money order is a standardised paper-based debit instrument used to remit money to the named payee. A specialmoney order is issued by a bank, allowing the individual named on the order form to receive a specified amount of cash ondemand.
Table 2.16: Network of Commercial Banks
Note 1: Statistical regions, source: Statistical Office of the Republic of Slovenia, 31March 2000.
Map of Slovenia by Geodetic Institute of Slovenia
Note 2: Data referring to the Post Bank of Slovenia do not include units of the Post of Slovenia that operate for the Post Bankof Slovenia on a contractual basis.
3. BALANCE OF PAYMENTS AND EXTERNAL POSITION
Balance of Payments
General notes
In most respects the Slovenian Balance of Payments (BOP) conforms to the methodology of the IMF’s Balance of PaymentsManual, fifth edition (1993).
Characteristics of the Data
Minus sign (-) indicates imports or surplus of imports over exports in the current account, increase in assets or decrease inliabilities in the capital and financial accounts, and growth of reserve assets.Data on transactions are converted from the original currencies to EUR using the daily Bank of Slovenia or ECB's exchangerates, or average exchange rates for the period if the exact date of transaction is not known.
Revision policy
Revision of balance of payments, the international investment position and gross external debt data occur as follows:
Revisions in monthly data are published with the release of:- the following month’s data;- the corresponding quarterly data;- the corresponding revised quarterly data;
BANKA SLOVENIJE
13-IV.Monthly Bulletin, July - August 2009
NOTES ON METHODOLOGYBANK OF SLOVENIA
EUROSYSTEM
- the international investment position and external debt data for the corresponding year; and- the revised international investment position and external debt data for the corresponding year.
Revisions in quarterly data are published with the release of:- the following month's data;- the data on the following quarter;- the international investment position and external debt data for the corresponding year; and- the revised international investment position and external debt data for the corresponding year.
Revisions for the annual balance of payments, international investment position and external debt data are published withthe release of the data for the following years.
Annual data are revised for the year t-1 and t-2. In the case of major methodological changes or discrepancies among thedata sources, data for the year t-3 will be revised as well.
Data sources
· The external trade statistics (Statistical Office of the Republic of Slovenia) is the main source of data on trade ingoods. Since 1 May 2004, the source of data on trade in goods among Slovenia and EU Member States is the Intrastatreporting. The source of data on trade in goods with other countries is the single administrative document (Exstrastatreporting).
· Reports on account balances and transactions between residents and non-residents (C, PPT, PPV):- report on account balances at domestic banks – PPV (until 31 December 2004),- report on account balances abroad – C (until 31 December 2006),- report on transactions through accounts at domestic banks – PPT (until 31 December 2008),- report on transactions through accounts abroad – C (until 31 December 2008).
All banks which conducted international payment transactions and all residents with open accounts abroad were obligedto report. The resident issuer/beneficiary of the payment was obliged to forward data on the type of transaction. Since2009 only banks which conduct international payment transactions report transactions with nonresidents that exceedthreshold EUR 50.000. Data are used for quality control purposes only.
· Reports on trade in services, part of trade in goods and on current/capital transfers with nonresidents (BST)are the sources of data on services (excl. travel), data on coverage adjustments of goods item and data on current andcapital transfers (excl. transfers with EU budget) from 2008 onwards.
· Reports on transactions with securities (VRP) and data from the Securities Clearing Corporation (KDD) are thesources of portfolio investments (debt and equity securities) and financial derivates since 2004.
· Reports on purchased/sold foreign debt securities without domestic brokers (DVP) are the sources of portfolioinvestments in foreign debt securities, carried out without domestic brokers, from 2007 onwards.
· Data regarding drawn/un-drawn credit transactions from foreign credit registration forms (KR) are the sourceof data on loans of all sectors until 2004; in 2005 and 2006 they are only the source for the non-banking sector. Aregistration was obligatory for all financial credits and long-term commercial credits; since 1997 from the same sourceare also obtained the data on the purpose of direct payments of foreign lenders, used to settle the obligations ofdomestic borrowers to other non-residents.
· Reports on monetary financial institutions (PORFI) are the source for data on loans, cash and deposits of thebanking sector since 2005.
· Reports on credits received and granted and deposits with non-residents (KRD) are the source for data regard-ing loans and deposit of all sectors, except banks, since 2007.
· Reports on short-term receivables and liabilities from operations with non-residents (SKV) are the source forshort-term trade credits since 2002.
· Reports on investments (SN) are until 2007 the source for reinvested earnings of direct investments. From 2008onwards these reports are source also for all other direct investment transactions in equity and related income as wellas for portfolio equity transactions without involvement of domestic dealers.
· Accounting data of the Bank of Slovenia
· Accounting data of banks (KNB)
· Budget data on the transactions of government sector between the Republic of Slovenia and EU (from 2004onwards)
Qarterly data on financial account's statistics are source for financial derivatives for all sectors except the central bank(since 2007).
· Estimates and other sources- estimate of purchases of foreign currency and cheques from foreigners in exchange offices (part of the travel cat-egory) - until 2004,- estimate of expenditures on travel abroad including purchases of goods abroad - until 2004- estimate of Italian pensions (UMAR) until the end of 1998,
BANKA SLOVENIJE
IV.-14 Monthly Bulletin, July - August 2009
NOTES ON METHODOLOGYBANK OF SLOVENIA
EUROSYSTEM
- estimate of transactions with foreign currencies and the deposits of Slovene households (until 2006),- estimate of labour income (SURS),- data on pensions paid to non-residents (ZPIZ),- survey on the write-downs of debt from trade in goods and services abroad,- estimates for exports and imports of travel - from 2005 onwards (detailed explanation under item Travel),- estimate of cash transactions on tourism and labour income (from 2007 onwards).
Current account
Goods
Data regarding general goods can be obtained from the Statistical Office of the Republic of Slovenia. Prior to Slovenia’saccession to the EU data were available from standard customs documents. Since 1 May 2004, data are available fromsingle administrative documents for trade in goods with non-EU countries and from Intrastat reports for trade with EUMember States.
Adjustments of CIF/FOB – data on import by CIF value were adjusted to FOB value with the help of a coefficient which isequal to the weighted average of coefficients between CIF and FOB values of the goods imported (in an available sample),separated with regard to type of goods, type of transport and partner’s country. For 2004, a new CIF/FOB coefficient wascalculated (1.0306); prior to that the coefficient was 1.0393. Since 2004 on, the coefficient is calculated every year basedon a five year average.
Coverage adjustments - made for goods exported and imported without customs declarations (the ITRS source until2007,the reports of duty free shops and consignment warehouses until 2005, BST reports as source from 2008 onwards).Since 1 May 2004, coverage adjustments also include estimated data on imports of motor vehicles from EU by naturalpersons not covered by Intrastat System.
Services
TransportTransportation services are classified according to mode of transport and furthermore according to what is carried. Thesource of records on transportation services is the ITRS until 2007 and BST reports from 2008 onwards.
Travel - methodology until 2004The ITRS sources used in the compilation of the “Incoming travel” category include: a.) health- and education-relatedservices; b.) payments made by non-residents to Slovenian tourist agencies; c.) net withdrawals in tolars from non-residentaccounts; d.) money spent in casinos by non-residents; e.) data on sales of goods to non-residents in duty-free shops andconsignment warehouses; f.) payments with credit cards; and g.) sales of tolars to non-residents abroad.
The data on sales of tolars to non-residents in Slovenia are estimated based on the number of border crossings by foreigntravellers and on the number of nights spent in the country by foreign tourists.
Data for the category “Expenditure on travel” come from the ITRS and estimations.
Travel - methodology since 2005 onwardsMain data sources to estimate the export of travel are the following surveys and researches conducted by StatisticalOffice of the Republic of Slovenia (SURS):
- Survey on foreign tourists in summer season is used to define the structure of foreign tourists according to their primary aim of travel (business travel, health care, education, other) and expenditures of each type of foreign tourists ; three-year's survey -last conducted in 2006)- Survey on foreign travelers (to define the structure of travelers broken down by same-day travelers and transit travelers and their respective expenditures).- Arrivals and over-night stays of foreign tourists broken down by countries of their residency (monthly survey).- Number of border crossings (to define the population of foreigners entering Slovenia).
Based on data sources the following six categories of data are calculated and finally broken down by countries using data onmobile phone operators;
- Business travel,- Health - related travel,- Education,- Other,- Same- day travelers,- Transit travelers.
Main data source to estimate the import of travel is SURS's survey TU_ČAP (Quarterly survey on travel of domesticcitizens). The Survey provides the value of expenditures of domestic population traveling abroad (same - day trips andlonger trips) and the amount spent for transportation to and from the foreign destination, which is then subtracted from totalexpenditures in order to avoid double counting (since it is already included in transport services).
Based on TU_ČAP data source the following five categories of data are calculated and finally broken down by countriesusing data on mobile phone operators;
- Business travel,- Health - related travel,
BANKA SLOVENIJE
15-IV.Monthly Bulletin, July - August 2009
NOTES ON METHODOLOGYBANK OF SLOVENIA
EUROSYSTEM
- Education,- Other,- Same - day travelers.
Construction servicesThe source of data is the ITRS until 2007, all construction undertakings are recorded under construction services on netbasis (the revenues earned on works performed abroad are recorded net of the corresponding expenditures). From 2008onwards the sources of data on construction services are BST reports.
Insurance servicesPremiums on life and non-life insurance are split into two components: (i) the service charge included in insurance services;and (ii) the premium in a narrow sense, recorded as a current transfer. The calculation of the service charge is based on afixed percentage of premium payments. The source of data on insurance services is ITRS until 2007, this source wasreplaced by BST reports for 2008 data onwards. Insurance services include commissions of insurance companies and 45% of premium payments. Insurance claims and other part of nonlife insurance premiums are included in current transfers,claims and part of life insurance premiums represent assets/liabilities of financial account.
Government servicesAll transactions settled through the accounts of Slovenian embassies abroad, as well as transactions coded as governmentservices settled through the accounts of Slovenian banks with foreign correspondents, are included in this item item until2007 with the ITRS as the source of data. From 2008 onwards the source of data is BST report, government servicesinclude all services of slovenian representative bodies abroad.
Also for all other types of services the ITRS source has been discontinued as of 2008, when the new source (BST report)for data on trade in services (excl. travel) has been introduced.
Income
Labour income – receipts. Since 2002, data from the Labour Force Survey (SURS) and Eurostat data have replacedITRS and estimates as sources of labour income for the work of Slovene residents abroad.
Labour income - expenditures. ITRS is the source for labour income - expenditures until 2004. Data relating to 2005onwards are provided by SURS on the basis of Labour Office register for the number of nonresidents, who at the end ofeach quarter possess valid work permits and who actually worked in Slovenia less than one year.
Since 2002, labour income (receipts and expenditures) is included according to the gross principle (including taxes andsocial contributions).
Capital income – Since 2004, VRP reports have replaced ITRS as a source for income from equity securities. Annualreports on capital investments are the source for data regarding reinvested earnings. Data on reinvested earnings in thecurrent year are estimated - (a three year monthly average of actual data on total earnings, less extraordinary incomes [thesource being annual reports on investments], is decreased by dividends and other incomes, paid in the current month (thesource being monthly reports on investments from 1.1.2008 onwards, previously the source was ITRS). The estimate isreplaced by actual data only when these data are available. Until 2003, the source of income from debt securities was ITRS;since 2004 the sources are reports on securities transactions (VRP reports) and KDD data. Until 2004, the source onincome from other investments was ITRS for the banking sector; the source was later changed to reports on monetaryfinancial institutions (PORFI). Until 2006, the source on income from other investments for the non-banking sector wasITRS; since 2007, the source is KDD reports. Income from loans (including long-tern commercial credits) and cash re-serves have been managed according to the accrual principle since 2002; since 2007, total income from other invest-ments is managed according to the same principle. Since 2004, the accrual principle is used for income from bonds andnotes.
Current transfers
Current transfers of other sectors are subdivided into workers’ remittances, insurance and other transfers. Current transfersof the government sector and other transfers of other sectors are from 2002 onwards subdivided into taxes, subsidies,social contributions, social benefits and other transfers. The main data sources are the ITRS and estimates until 2007, from2008 onwards the sources are BST reports and from 2004 onwards, data on EU transfers of the government sector areobtained directly from the Ministry of Finance (budget data).
Capital and financial account
Capital account
Capital transfersThe ITRS is the source of data until 2007. Migrants’ transfers cover not only payments recorded by domestic banks, but alsothe changes in residency of accounts held with these banks. From 2008 onwards data are obtained from BST reports, butdata on capital transfers between the Republic of Slovenia and the EU are from 2004 onwards obtained directly from theMinistry of Finance (budget data). Since 2002, the Bank of Slovenia also estimates the value of write-downs of debt fromtrade in goods and services abroad.
BANKA SLOVENIJE
IV.-16 Monthly Bulletin, July - August 2009
NOTES ON METHODOLOGYBANK OF SLOVENIA
EUROSYSTEM
Financial account
Direct investmentDirect investment is until 2007 recorded on the basis of reported payments through domestic banks and data from customsdeclarations, from 2008 the source is direct monthly report SN. Data on reinvested earnings are based on yearly surveys onbalance and transactions with affiliated enterprises (SN) and are included monthly as one-twelfth of the yearly figure. Dataregarding reinvested earnings for the current year are estimated. Until 1997, the purchase and sale of all shares and equitywere included in this item.
From the beginning of 1997, purchase and sale of shares that assure more than 50 percent of a company’s equity (acontrolling interest of shares) and shares issued by domestic companies on the primary markets with the purpose of in-creasing the nominal capital of the company are included in this item, due to capital control measures. With the new ForeignExchange Act in 1999, the 10% rule is applied to direct investment.
Since 2001, there is a break in the data series in the category "Direct Investments - Other Capital". Since that time, loansand long-term commercial credits between affiliated companies (10% or more of capital share) are included in this category.Until 2000, these types of transactions were included in the category "Other Investments". Since 2002, the category"Direct Investments - Other Capital" also includes short-term commercial credits between affiliated companies.Since 2005 other capital claims / liabilities does not include banking sector's claims/liabilities with direct investment rela-tionship (these data are included in item other investment/loans.
Portfolio investmentTransactions are divided into assets and liabilities, with further breakdown into equity and debt portfolio investment. Until1997 only data on sales and purchases of debt securities through banks were included in this item. Since February 1997the equity securities with the exception of direct investment are included in this item too. With the new Foreign ExchangeAct in 1999, portfolio investment transactions include all transactions below the 10% rule. Equity portfolio investment toindividual sectors is subdivided into mutual funds and other investment. VRP and KDD data are the main sources from 2004onwards. Since 2007 on this item includes also assets of debt portfolio instruments held by Bank of Slovenia, which are nolonger considered as international reserves, but as claims to EMU member states and claims in EUR currency to all othernonresidents. From 2007 onwards data on transactions in assets of foreign debt instruments that occur without involvementof domestic dealers are collected on a report DVP, and from 2008 onwards assets and liabilities in portfolio equity invest-ments deriving from transactions without involvement of domestic dealers are collected on report SN.
Financial derivativesFrom 2004 until 2006 these types of transactions are included in VRP and KDD sources. Since 2007 qarterly data onfinancial account's statistics are source for financial derivatives for all sectors except the central bank. From 2009 onwardsfinancial derivatives of Bank of Slovenia are included in other investment/financial derivatives item or international monetaryreserves item (depending on the residency of the counterpart).
Other investments
Short-term trade creditsUntil 2002, short-term trade credits were estimated based on the following calculation:- {[export of goods FOB + coverage adjustments - (export payments + free export of goods + direct investments in goods +drawings of granted long-term trade credits)]- {[import of goods FOB + coverage adjustments - (import payments + free import of goods + direct investments in goods +drawings of received long-term trade credits)]
Since 2002, short-term commercial credits are included based on SKV reports. Short-term trade credits between affiliatedcompanies are included in direct investments.
Loans and long-term trade creditsFrom 2001 onwards, inter-company debt transactions between affiliated enterprises (10% or more capital share) are notrecorded as loans, but are recorded as direct investment – other capital transactions. Loans (including long-term tradecredits) and related income have been calculated according to the accrual principle from 2002 onwards, and according tothe cash principle prior to 2002.From 2005 onwards claims/liabilities of banking sector regardless of capital affiliation tononresidents are included in this item (the direct investment relationships are not distinguished in the data source).
Currency and depositsUntil the adoption of Euro currency (1.1.2007) the foreign currency of residents is estimated based on the following formula:deposited currency and cheques on foreign currency accounts of individuals - withdrawals of cash and cheques fromforeign currency accounts of individuals + the estimated net purchase of foreign currency by residents + estimated expen-ditures for tourist travel abroad + estimated expenditures of tourist travel to the former Yugoslavia + the estimated purchaseof goods abroad - estimated labour expenditures abroad - estimated Italian pensions (until the end of 1998) + net withdraw-als from non-resident accounts in local currency + the change of deposit balances of residents on accounts at BIS MemberState banks (before 2002).From the adoption of Euro currency (1.1.2007) onwards item foreign currency of households is estimated by using data onnet inflows of foreign currency from tourism, data on net income on compensation of employees (decreased by consump-tion abroad/in the economy) and BIS (Bank for International Settlements) data on deposits held by residents with the banksabroad.
Since 2002, the category “Accounts Abroad of Other Sectors” also includes BIS data regarding deposits of residents onaccounts at BIS Member State banks.
BANKA SLOVENIJE
17-IV.Monthly Bulletin, July - August 2009
NOTES ON METHODOLOGYBANK OF SLOVENIA
EUROSYSTEM
With adoption of EUR in 2007 as a national currency Slovenia became a member of EMU which affects the followingchanges in currency and deposits item;- the item currency and deposits/ claims includes also estimated counterpart of the transactions in cash in current accountof the balance of payments (tourism and labour income),- claims of the Bank of Slovenia to EMU member states and all claims in EUR currency to all other states are included in theitem currency and deposits/ claims. - net position of the Bank of Slovenia to the Eurosystem (net result of incoming and outgoing payments conducted in EURcurrency through TARGET and STEP2 system) is included in the item currency and deposits/ other liabilities.
International monetary reservesReserve assets and related income have been calculated according to the accrual principle from 2002 onwards, andaccording to the cash principle prior to 2002.
Following Slovenia’s entry to the EMU in 2007, claims to other residents of the euro area (denominated in euros and in othercurrencies) and claims in euros to EMU non-residents are not included in reserve holdings. From 2007 onwards, thesetransactions are shown in the appropriate categories of the capital and financial account sector of the Bank of Slovenia(investments in securities and other investments).International monetary reserves item includes also financial derivatives (from 2009 onwards).
Table 3.1: Balance of Payments 1988–1993
The balance of payments is based on the methodology of the International Monetary Fund (Balance of Payments Manual,IMF, 1993). The balance of payments for the period 1998 - 1991 does not include transactions with republics of the formerYugoslavia. The import and export of goods is shown without processing transactions, processing is included in services.
Note 1: For 1988 and 1989, official sector data is included in “Other sectors”.
Note 2: For 1988 through 1990, “Statistical errors” include sales of claims from bilateral agreements to the former NationalBank of Yugoslavia and its purchases of foreign currency through Slovenian foreign currency exchange offices.
Note 3: Reserve assets of the Bank of Slovenia.
Table 3.2: Balance of Payments
The data for the current year are revised monthly. Data become final according to the revision practice (see revision prac-tice).
In June 2001, Slovenia acquired a 16.39% share in the holdings of the former Yugoslavia with the Bank for InternationalSettlements (BIS), consisting of gold SIT 16.9 mio (EUR 77.8 million), foreign currencies SIT 1.1 mio SIT (EUR 5.3 million)and shares SIT 3.0 mio (EUR 13.8 million). This transaction is not considered to be a flow of the balance of payments, butrather a part of the “Other changes” category, which reconciles the international investment position in consecutive peri-ods.
* Years 1994 in 1995: Data for balance of payments in ECU for years 1994 and 1995 are not obtained in the same manneras data for other years. The data for merchandise trade are converted from US dollar to ECU using average monthly ex-change rates. The data for merchandise trade in Euros or ECU since 1996 are computed from values in original currenciesusing daily exchange rates for Euro or ECU.
Note 1: Exports and imports of goods - f.o.b. parity
Note 2: June 1996: Includes the issue of government bonds in exchange for a part of allocated foreign debt in the amountof SIT 63.7 mio (EUR 374.9 million). Banks’ liabilities under foreign loans are decreased for the same amount and trans-ferred to “Liabilities to government”.
Note 3: Issues of government bonds:- August 1996 (EUR 253.7 million)- June 1997 (EUR 205.1 million)- May 1998 (EUR 500.0 million)- March 1999 (EUR 400.0 million)- March 2000 (EUR 400.0 million)- February 2001 (EUR 100.0 million)- April 2001 (EUR 450.0 million)- March 2007 (EUR 1000.0 million)- February 2008 (EUR 1000.0 million)- February 2009 (EUR 1000.0 million)- March 2009 (EUR 1500.0 million)
Note 4: For 1993–2001, short-term claims include net changes in commercial credits (received and granted). From 2002onwards, short-term commercial credits are included on the basis of SKV reports on the assets and liabilities side of thebalance of payments. Short-term commercial credits between affiliated enterprises are included under the heading “Directinvestments”, while other commercial credits are included in “Other investments/trade credits”.
BANKA SLOVENIJE
IV.-18 Monthly Bulletin, July - August 2009
NOTES ON METHODOLOGYBANK OF SLOVENIA
EUROSYSTEM
Note 5: Includes mostly Bank of Slovenia fiduciary accounts. In June 1996 the amount of 21.2 mio SIT (EUR 124.9 million)was transferred to regular Bank of Slovenia reserve accounts.
Note 6: Use of IMF credit (assumed upon membership in January 1993).
Note 7: Reserve assets of the Bank of Slovenia. Following Slovenia’s entry to the EMU in 2007, claims to other residents ofthe euro area (denominated in euros and other currencies) and claims in euros to EMU non-residents are not included inreserve holdings. From 2007 onwards, these transactions are shown in the appropriate categories of the capital and finan-cial account sector of the Bank of Slovenia (investments in securities and other investments). More explanation is availablein: “The statistical treatment of the international monetary reserves at the entry of Slovenia to the euro area” (slovenian), inthe chapter Methodological information on the internet page: http://www.bsi.si/en/financial-data.asp?MapaId=64 .
Note 8: The data on reinvested earnings for 2009 are not yet available. Therefore, the balance of payments includes anestimate (from the three year monthly average for the period 2006 to 2008 of actual data on total earnings less extraordinaryincomes [the source being annual reports on investments], less dividends and other incomes paid in the current month). In2010, the estimate will be replaced with actual data on reinvestment of earnings; the estimate for 2009 shall take intoconsideration the new three year average (2007 to 2009).
Note 9: From 2001 onwards, there is a time series break in the categories “Direct investment” and “Loans”. From 2001,inter-company debt transactions between affiliated enterprises (10% or more capital share) are included in the “Directinvestment” category; before that they were included under the heading “Loans”. Since 2002, the category “Direct invest-ments” also includes short-term trade credits between affiliated enterprises.
Note 10: Transfers from the EU budget since 2004 have been recorded as either current or capital transfers, according tothe nature of their use. Data are provided by the Ministry of Finance.
Note 11: In the balance of payment of Slovenia to the EMU the presentation of the category net of errors and omissionsdoes not make sense.
Tables 3.3 and 3.4: Current account and capital and financial account by countries
The tables show the main categories of current and capital and financial account of the balance of payments, by countries,for the last available year. The most important countries and/or groups of countries are shown.
Table 3.5.: Trade in goods by countries
The data source is the Statistical Office of the Republic of Slovenia (external trade statistics). Import is valued at FOB parity;export is valued at CIF parity. The data for 2009 are provisional.
International Investment Position of Slovenia
General notes
The international investment position is the balance sheet of the stock of external financial assets and liabilities. The financialitems that constitute the position consist of claims on non-residents, liabilities to non-residents, monetary gold and SDRs.
The methodology of the international investment position (IIP) of Slovenia is based on the fifth edition of the Balance ofPayments Manual, IMF, 1993. The manual distinguishes four sectors – monetary authorities, general government, banksand other sectors.
The structure of the statement is similar to the balance of payments (financial account): here as well are holdings andliabilities, first classified by instruments, followed by sectors and finally by maturity. The change to the balance of holdingsand liabilities in a specific period is the result of transactions or flows shown in the balance of payments and also exchangerate changes, price changes and other changes.
Revision policySee note “Revision policy” in the section “Balance of Payments”.
Data sourcesData sources for the international investment position of Slovenia are mainly the same as those for the financial account ofthe balance of payments.
Direct investmentData on direct investment are collected from:- concessional surveys on equity investment (SN),- reports on loans granted to or received from non-residents (KR) - until 2006,- reports on accounts abroad (C) - until 2006,- short-term commercial credits with non-residents (SKV), and- assets and liabilities in loans and deposits to nonresidents (KRD) for non-bank sectors since 2007.
BANKA SLOVENIJE
19-IV.Monthly Bulletin, July - August 2009
NOTES ON METHODOLOGYBANK OF SLOVENIA
EUROSYSTEM
In accordance with the recommendations of the IMF, this item comprises investment where the direct investor owns 10% ormore of ordinary shares or voting power. Equity shares are until 2006 valued at book value according to accounting stan-dards. From 2007 the equity of listed companies is recorded according to market value and equity of unlisted companies isrecorded according to book value in line with accounting standards. Reinvested earnings are included.
Claims on and liabilities to affiliated enterprises are included in the category “Direct investment–other capital”. Intercom-pany claims or liabilities between affiliated banks and affiliated financial intermediaries recorded under direct investmentcapital are limited to those associated with permanent debt (loan capital respresenting a permanent interest). Until 2000, alllong-term intercompany claims were considered liabilities between affiliated banks, and affiliated financial intermediarieswere included in this item as well as permanent debt. From 2005 onwards other capital item of direct investment does notinclude claims/liabilities of banking sector to affiliated enterprises (those data are included in item other investment/ loans).
Data on claims and liabilities of Slovene enterprises in indirectly-affiliated enterprises from 1996 onwards are included in thecategory “Direct investment abroad” (in cases where an enterprise abroad having Slovene direct investment holds 10% ormore equity in another foreign enterprise). In the category “Direct investment in Slovenia”, data on the investment of foreignenterprises in indirectly-affiliated enterprises in Slovenia are included (in the case that a Slovene enterprise with foreigndirect investment holds 10% or more equity in another Slovene enterprise). From 2007 all claims and liabilities to foreigndirect investors/ direct investment enterprise and fellow companies that belong to the same foreign direct investor / directinvestment enterprise are included.
Portfolio investmentUntil 2002, data on equity securities and other equity shares were available from enterprises’ surveys (form SN), but onlydata from surveys where the direct investor owns less than 10% of ordinary shares or voting power are included. (In thebalance of payments, transactions with equity securities and other shares are collected from the ITRS [see note to tables3.1–3.4] /Capital and financial account/Portofolio investment.) From 2007 data on equity shares bellow 10% that aretraded without involvement of domestic dealers are collected (report SN).From 2003 onwards, data from the reports VRP (operations in securities reported by brokerage houses, banks and invest-ment companies) and KDD (Central Securities Clearing Corporation) are included. Also data on investments in mutual fundsand investments of households in other equity securities are available since 2003. From 2007 data on assets of foreigndebt secuirities that are traded without involvement of domestic dealers are collected (report DVP).
Data on residents’ holdings of debt securities are available from VRP direct reports.
Liabilities of debt securities of the government, banking and other sectors are available from credit registration and CentralSecurities Clearing Corporation data (KDD). For domestic securities issued abroad, the source is VRP reports.
Financial derivatesFrom 2004 until 2006 these data are included in VRP and KDD sources. Since 2007 qarterly data on financial account'sstatistics are source for financial derivatives for all sectors except the central bank.
Trade credits and loansThe source for short-term trade credits is a report of enterprises on the stock of external assets and liabilities (form SKV).
Sources for long-term trade credits and loans are credit registration forms (until 2006 forms KR, from 2007 onwards formsKRD) and are the same for the international investment position and the balance of payments. Until 2000, the balance ofpayments did not distinguish loans between affiliated companies from loans between unaffiliated companies and includedall loans in other investment items.From 2005 onwards monetary statistics (PORFI) is the source for banking sector data (claims and liabilities are includedregardless of direct investment affiliation).
Currency and deposits, other assets, other liabilities and reserve assetsFor these categories, the sources largely coincide with the sources for the balance of payments:
- the accounting data of commercial banks (KNB) - until 2004,- the account balances of banks in original currencies (PPV) - until 2004,- the account balances abroad of companies (C) - until 2006,- assets and liabilities in loans and deposits to nonresidents (KRD) for non-bank sectors since 2007- the source for banking sector data (PORFI) - since 2005,- the accounts of the Bank of Slovenia.
In the International Investment Position, mature, unpaid loans and long-term commercial credits are included in other hold-ings and liabilities as short-term items. These transactions are not included in the balance of payments.
Until 2002, there is a difference between the International Investment Position and the balance of payments for otherliabilities and holdings of other sectors, where contractual joint ventures are shown in the investment position. The sourcefor this item is a JV report.
The International Investment Position includes data of the Bank for International Settlements (BIS) on deposits of localresidents at BIS Member State banks. Since 2001, an estimate of the balance of foreign currency held by households isalso included. However, any further investments of foreign currencies (primarily investments in real estate abroad andforeign securities, without domestic brokers) are not excluded from this estimate, since data of this type are not available.
Net position of the Bank of Slovenia to the Eurosystem (net result of incoming and outgoing payments conducted in EURcurrency through TARGET and STEP2 system) is also included in the item liabilities/currency and deposits.
BANKA SLOVENIJE
IV.-20 Monthly Bulletin, July - August 2009
NOTES ON METHODOLOGYBANK OF SLOVENIA
EUROSYSTEM
Table 3.6: International Investment Position of Slovenia
IIP data do not include:- data on real estate owned by Slovenian households abroad (mainly real estate in Croatia); from 2001 onwards, these
data are partially included under the heading “Assets/other investment/currency and deposits/households”; and- claims on other countries in the territory of the former Socialist Federal Republic of Yugoslavia, subject to negotiations
on succession (except the part reported by the Fund of the Republic of Slovenia for Succession from 2001 on-wards), expropriated assets in these territories and other assets transferred to the Slovenian government during theprocess of privatization. In December 2006 claims subject to succession to former Yugoslavia were revalued and'Sklad RS za sukcesijo' was transformed into 'Javna Agencija Republike Slovenije za nasledstvo',
- data on foreign ownership of real estate in Slovenia.
Additional data on direct investment are available in a special publication of the Bank of Slovenia: “Neposredne naložbe –Direct Investment”, and on the Bank of Slovenia Web site: http://www.bsi.si/iskalniki/ecb_en.asp?MapaId=714.
Table 3.7: International Investment Position by countries
The table includes data for the last available year by countries in which Slovenes invest (in holdings) and includes data fromwhich countries foreigners invest in Slovenia (in liabilities). The most important countries and/or groups of countries areshown.
Gross External Debt
General notesThe methodology is based on External Debt Statistics: Guide for Compilers and Users, IMF, 2003. The guide is available atthe following Web address: http://www.imf.org/external/pubs/ft/eds/Eng/Guide/index.htm.
Revision policySee note “Revision policy” in the section “Balance of Payments”.
Data sourcesIn order to maintain consistency, the data sources are the same as those for the International Investment Position. Thesources for equities and financial instruments are not used because these types of instruments are not included in thebalance of external debt according to the IMF definition.
Tables 3.8 and 3.9: Net External Debt
The tables present gross external debt, gross external assets in debt instruments, and net debt position. The data are thesame as presented in the international investment position (IIP). In the table "Net External Debt", data are sorted by sectors,maturities and instruments; in the table "International Investment Position", data are sorted by instrument, sectors andmaturities.
Tables 3.10 and 3.11: Gross External Debt
Gross external debt, at any given data, is the outstanding amount of those current, and not contingent, liabilities that requirepayment(s) of principal and/or interest by the debtor at some point(s) in the future and are owed to non-residents by resi-dents of an economy. The types of financial instruments included in the presentation of the gross external debt position areas follows: debt securities (money market instruments, bonds and notes), trade credits (short- and long-term), loans (short-and long-term), cash, deposits and other debt liabilities. Maturity of debt liabilities is based on the formal criterion of originalmaturity. Long-term debt is defined as debt with an original maturity of more than one year or with no maturity stated. Short-term debt, which includes cash, is debt repayable at notice or with an original maturity of one year or less.
International reserves
Table 3.12.: International reserves
Until December 2006, the Bank of Slovenia’s foreign exchange reserves included convertible foreign currencies, depositsabroad and first-class securities of foreign issuers.
From 1 January 2007, the Bank of Slovenia’s foreign exchange reserves include convertible foreign currencies, deposits inforeign currencies outside the euro area and first-class securities in foreign currencies of issuers outside the euro area. Thedecline of value presented in the data is due to Slovenia’s inclusion in the EMU.
Since 2009 foreign exchange reserves of the Bank of Slovenia include also positions on financial derivatives based on dailypricing of these instruments. The value of financial derivatives may also be negative.
BANKA SLOVENIJE
21-IV.Monthly Bulletin, July - August 2009
NOTES ON METHODOLOGYBANK OF SLOVENIA
EUROSYSTEM
4. PUBLIC FINANCE
General
Data prior to 2007 are published in tolars; from 2007, data are published in euros.Quarterly and yearly data on Gross domestic product are not yet reconciled.
General - methodology ESA 95
Non-financial and financial data are prepared in compliance with the European System of Accounts from the year 1995 (ESA95). This methodology was adopted by Council Regulation (EC) No. 2223/96 of 25 June on the European System ofAccounts in the Community.ESA 95 methodology is the central economic methodology of each EU member state and therefore ensures comparabilityof data.Data on non-financial accounts of general government are prepared by the Statistical Office of the Republic of Slovenia. Inaccordance with a memorandum of understanding between the Ministry of Finance, the Bank of Slovenia and the StatisticalOffice of the Republic of Slovenia, the data on financial accounts are compiled by the Bank of Slovenia.The data on financial accounts are consolidated.
Table 4.1: Non-financial and Financial Accounts (ESA 95) of the General Government sector
EDP debt is gross debt as defined in the Maastricht treaty. It comprises general government liabilities in the form of currency(coins), deposits, debt securities (securities other than shares and other equity) and loans only.
Tables 4.2 and 4.3: Non-financial Account of the General Government sector
Fiscal burden is a sum of the direct taxes, indirect taxes, social contributions and capital taxes.
Intermediate consumption consists of the value of the goods and services consumed as inputs by a process of produc-tion. The goods and services may be either transformed or used up by the production process.
Tables 4.4 and 4.5: Financial Account of the General Government sector
Change in EDP debt is a difference between the current and preceding EDP debt figure.
Deficit-debt adjustment (DDA) is a sum of the deficit/surplus of non-financial account and change in EDP debt. DDA canbe also calculated as a sum of the difference between financial assets and liabilities (which are not included in EDP debt)and other flows.
Other liabilities consist of data, which are not included in the EDP debt: financial derivatives, shares and other equity,insurance technical reserves and other liabilities.
Other flows are sum of the statistical discrepancy (difference between deficit/surplus of non-financial and financial ac-count) and changes of the debt which are not transactions (foreign exchange holding gains and losses, other valuationeffects, other changes in volume of debt).
Borrowing requirement consists of a negative deficit/surplus of financial account plus financial assets minus financialliabilities.
Table 4.6: Revenues and Expenditures of the General Government
Note 1: The data of the current and previous year are revised monthly until the data on the previous year become final.
Note 2: Total revenue excludes receipts from the EU, and likewise, total expenditure excludes payments to the EU budget.
Note 3: Current expenditure also includes social security contributions (besides of the expenditures on goods and services,interest payments, current reserves and current transfers).
Tables 4.7: Lending, Repayments and Financing of the General Government
General government operations (consolidated state budget, local governments, pension fund and health insurance fund).
Note 1: The data of the current and previous year are revised monthly until the data on the previous year become final.
BANKA SLOVENIJE
IV.-22 Monthly Bulletin, July - August 2009
NOTES ON METHODOLOGYBANK OF SLOVENIA
EUROSYSTEM
Table 4.8: Central budget debt
The Republic of Slovenia is defined as a legal person. The data from tables 4.6., 4.7. and 4.8. originate in the Bulletin ofGovernment Finance published by the Ministry of Finance.
The obligation of the Central budget of Republic of Slovenia to Bank of Slovenia is due to settlement of the Special drawingrights of the International monetary fund by Bank of Slovenia as a fiscal agent, in line with the agreement between theMinistry of finance of Republic of Slovenia and Bank of Slovenia.
5. FINANCIAL ACCOUNTS
Financial accounts (Tables 5.1 to 5.6)
Tables 5.1, 5.2, 5.4 and 5.5 show stocks and transactions in financial assets and liabilities held by individual institutionalsectors, by individual financial instruments. The basis for the financial accounts methodology is ESA95.
Tables 5.3 and 5.6 present net items by individual sectors.Net financial assets present difference between financial assets and liabilities (stocks).Net financial transactions present difference between transactions in financial assets and transactions in liabilities.
The general principle for stocks and transactions is valuation at the current market price. As a rule accrued interest isincluded in the instrument to which it relates (deposits, loans, securities).
The transactions represent the difference between increases (acquisitions) and decreases (disposals) or the net turnover inan individual financial instrument. Changes in market prices and exchange rates, and other changes (reallocations of finan-cial instruments/sectors, changes in methodology, write-downs of claims/debts, etc.) are excluded from the transactions.
Sectors, according to SKIS, are used.
Financial instruments in financial accounts
Individual financial instruments are the same among assets and liabilities, except Monetary gold and SDRs which onlyappear in financial asset tables.
Monetary gold and SDRs represent financial assets of the central bank. No other institutional unit or sector shall show aliability from the above mentioned instruments.
Currency and deposits consists of three sub-categories of financial instruments: currency represents bank notes and coins normally used for payments and includes bank notes and coins in circula-
tion and represents the liability of the unit which issued them (as a rule, the central bank). The category “HouseholdCurrency and NIPSH (non-profit institutions serving households)” includes the foreign currency of residents which isestimated based on net purchases.
transferable deposits consist of sight deposits in domestic or foreign currency. Transferable deposits can be con-verted into currency or transferred by cheque, payment order, debit entry or the like, without significant restrictions oradditional costs.
other deposits consist of deposits that cannot be used to make payments at any time and are not convertible intocurrency or transferable deposits without significant restrictions or additional costs.
Securities, excluding shares, are comprised of the following: short-term debt securities (with an original maturity of up to one year bills and other short-term debt securities); long-term debt securities (with an original maturity of more than one year: bonds); financial derivatives (options, swaps, standardised futures, interest rate futures and warrants).
Loans consist of all types of loans created when creditors lend funds to debtors, either directly or through brokers, that areeither evidenced by non-negotiable documents or not evidenced by documents. The initiative concerning a loan normallylies with the borrower. Loans also include loans for financing trade credits, financial leasing, repurchase agreements, andrepayable margin payments related to financial instruments when these agreements and payments are liabilities of corpora-tions that are not monetary financial institutions. Loans do not include trade credits or advances.
Loans are broken down into short-term loans (with an original maturity of up to one year) and long-term loans (with an originalmaturity of more than one year).
Shares and other equities represent: Shares which are quoted (on a domestic of foreign market); Unquoted shares; Other equities; Shares/units of investment funds.Shares/units of investment funds include shares of investment companies, investment coupons (referring to one or moreunits of mutual funds) and units of pension funds.
Insurance technical reserves comprise the insurance technical reserves of insurance corporations and pension funds
BANKA SLOVENIJE
23-IV.Monthly Bulletin, July - August 2009
NOTES ON METHODOLOGYBANK OF SLOVENIA
EUROSYSTEM
against policyholders and beneficiaries, and are divided into three sub-categories of financial instruments.
Net equity of households in life insurance reserves including:- net life insurance provisions;- net provisions for life insurance policies where the investment risk is borne by the policyholders;- net health insurance provisions.Net equity of households in pension fund reserves consists of provisions deriving from pensions.Prepayments of insurance premiums and reserves for outstanding claims represent net prepayments of insurance policies,net reserves for outstanding claims and other net insurance technical reserves.
Other assets and liabilities are broken down as follows: Commercial credits and advances; Other (other assets and liabilities, excluding commercial credits and advances).Commercial credits and advances consist of financial claims or liabilities arising from the direct extension of credit bysuppliers or buyers for goods and services transactions, and advance payments for work that is in progress or to be under-taken and associated with such transactions.Other (other assets and liabilities excluding commercial credits and advances) consists of all other claims and liabilitiesarising from timing differences between transactions and payments made in respect of taxes, social contributions, wages,rents, dividends, interest and transactions in financial assets on the secondary market. As a rule, accrued interest is in-cluded in the instrument to which it relates. However, should it be impossible to include the interest in the relevant instru-ment, it is disclosed in the category “Other”.
Financial accounts data may differ from other statistical data because of: valuation method (current market value), data sources, time of data recording, time of data revision, methodological differences in financial instrument classification and other methodological differences.
Data for the period before the 1st of January 2007 are converted into EUR based on exchange rate 1 EUR = 239,64 SIT.
6. NON-FINANCIAL ACCOUNTS AND GENERAL ECONOMIC STATISTICS
General notes
The Standard Classification of Activities is defined by the Decree on the Introduction and Use of the Standard Classificationof Activities (Official Gazette of the Republic of Slovenia, No. 69/2007, 17/2008) and is in line with the classification ofactivities NACE Rev.2(Nomenclature statistique des activités économiques dans la Communanté européenne) as a com-pulsory statistical standard of the European Union, which is directly connected to the international classification of theactivities of United Nations ISIC Rev. 4(International Standard Industrial Classification).
The basic activities of an economy are:
A Agriculture, forestry and fishingB Mining and quarryingC ManufacturingD Electricity, gas steam and air conditioning supplyE Water supply, sewerage, waste management and remediation activitiesF ConstructionG Wholesale and retail trade; repair of motor vehicles and motorcyclesH Transportation and storageI Accommodation and food serviceJ Information and communicationK Financial and insurance activitiesL Real estate activitiesM Professional, scientific and technical activitiesN Administrative and support service activitiesO Public administration and defence, compulsory social securityP EducationQ Human health and social work activitiesR Arts, entertainment and recreationS Other service activitiesT Activities of private households as employers, undifferentiated goods- and services- production activities of householdsfor own useU Activities of extraterritorial organizations and bodies
Methodological notes and a detailed classification for the real sector are published on the Statistical Office’s Web site:http://www.stat.si/skd_nace_2008.asp (in Slovene).
BANKA SLOVENIJE
IV.-24 Monthly Bulletin, July - August 2009
NOTES ON METHODOLOGYBANK OF SLOVENIA
EUROSYSTEM
General
Data prior to 2007 are published in tolars; from 2007, data are published in euros.
Non-financial accounts and general economic statistics (Tables 6.1 to6.8)
Tables 6.1 and 6.2: Expenditure of Gross Domestic Product
Real yearly growth rates are calculated from the GDP data in constant prices, reference year 2005.
Tables 6.3 and 6.4: Gross Domestic Product by Activity
Real yearly growth rates are calculated from the GDP data in constant prices, reference year 2005.
Tables 6.5 and 6.6: Industrial Production Index
For the period from January 1992 to January 2004, industrial production indices are calculated from quantitativedata on the production of industrial products.From February 2004 onwards, the basis for calculating the production indices are data on the value of production.
Tables 6.7 and 6.8: Turnover and New Orders in Industry
Data for the year 2008 are provisional.
For the period from January 1998 to January 2003, indices on turnover are estimated on the basis of the monthlydata on the quantity of sold industrial products and the average annual prices of industrial products. Data fromFebruary 2003 onwards are gathered with the regular monthly survey on turnover, new orders and value of stocksin industry.
Real yearly growth rates are calculated from the real index on turnover and new orders in industry. The deflator isthe industrial producer prices index.
Tables 6.9 and 6.10: Business Tendency and Consumer Surveys
The sentiment indicator is the weighted average of the confidence indicator in manufacturing and retail trade, plusthe consumer confidence indicator. Sentiment indicators of certain activities or consumers are calculated fromanswers shown in the table.
The results are shown as a balance by individual questions. The balance is the difference between positive andnegative answers, expressed as percentages. The balance shows the movement of the observed economic indi-cator (present situation or future expectations), and not the real size of economic indicators.
Table 6.11: Employment by Labour Force Survey (ILO)
The Slovene Labour Force Survey was carried out in compliance with International Labour Organisation (ILO)guidelines for labour force statistics and with Eurostat requirements. This enables the comparability of our data tothe data of other countries.
Data in column 5 – self-employed persons include family-member assistants as well.
Note 1: From 2008 onwards the revised classification of activities SKD 2008 is used, which is internationallycomparable with the NACE Rev. 2 classification of activities.
Table 6.12: Unemployment by Labour Force Survey (ILO)
The Slovene Labour Force Survey was carried out in compliance with International Labour Organisation (ILO)guidelines for labour force statistics and with Eurostat requirements. This enables the comparability of our data tothe data of other countries.
Table 6.13: Average Wages and Salaries
Real wages and salaries are deflated by the consumer price index (CPI).
From January 2005 onwards a new methodology for the calculations of average monthly wages and salaries has

BANKA SLOVENIJE
25-IV.Monthly Bulletin, July - August 2009
NOTES ON METHODOLOGYBANK OF SLOVENIA
EUROSYSTEM
been used. The statistical survey also includes legal entities with one or two persons in paid employment in the privatesector. Individual private entrepreneurs and persons employed by them, own account workers and farmers are not covered.
Published data are the results of new research: the Monthly Report on Earnings at Legal Entities. Data are collected by theAgency of the Republic of Slovenia for Public Legal Records and Related Services (with the common questionnaire (Form1–ZAP/M). Statistical work was done by SORS. SORS also calculated the average monthly wages and salaries data for2004 according to the new methodology.
Table 6.14 Nominal effective exchange rate and Real harmonised competitiveness indica-tors
Nominal effective exchange rate, ECB EER-41 group of currencies (AU, CA, CN, DK, HK, JP, NO, SG, KR, SE, CH, GB,US, CZ, EE, HU, LV, LT, PL, BG, RO, NZ, DZ, AR, BR, HR, IN, ID, IL, MY, MX, MA, PH, RU, ZA, TW, TH, TR, IS, CL, VE) -Euro area 16 against Euro.
Real harmonised competitiveness indicators consumer prices, industrial producer prices and unit labour costs deflated,ECB EER-21 group of currencies and Euro area 16 country currencies (FR, BE, LU, NL, DE, IT, IE, PT, ES, FI, AT, GR, SI,AU, CA, CN, DK, HK, JP, NO, SG, KR, SE, CH, GB, US, CY, CZ, EE, HU, LV, LT, MT, PL, SK, BG, RO) against Sloveniantolar (until 31.12.2006) from 01.01.2007 against Euro.
The growth of the index value represents decrease of competitiveness.
Note 1: Data shown every three months of the year are quarterly.
Explanations to harmonised competitiveness indicators calculations are available in special methodological paper "Calcula-tions of harmonised competitiveness indicators", on the Web site of Bank of Slovenia:http://www.bsi.si/publikacije-in-raziskave.asp?MapaId=1039.
Tables 6.15 and 6.16: Consumer Price Index
The Harmonized Index of Consumer Prices (HICP) is a comparable index of consumer prices produced by each MemberState and used for international comparison of consumer price inflation. In Slovenia it is available from the year 2001onwards.
Tables 6.17 and 6.18: Industrial Producer Price Index
The index of industrial producer prices measures changes in the level of producer prices of industrial products that are soldby producers on the Slovenian market. The tables show the price indices and growth rates by end-use of products , as wellas by main divisions of activities, v2 (2008).

BANKA SLOVENIJE
IV.-26 Monthly Bulletin, July - August 2009
NOTES ON METHODOLOGYBANK OF SLOVENIA
EUROSYSTEM
Review of the links between the data on Slovenia in the Bulletin of the Bank of Slovenia andthe Euro area data in the ECB's Bulletin
The table below shows the correspondence between the statistical tables on Slovenia in the Bulletin of the Bank of Slovenia and on the Euro area inthe ECB's Bulletin, i.e. where are the data on Slovenia included into the Euro area aggregates. The ECB's Bulletin is available on the internet address:http://www.ecb.int/pub/mb/html/index.en.html.
1.2 Consolidated Balance Sheet of Monetary Financial Institutions 2.2 Consolidated balance sheet of euro area MFI s2.3 Monetary statistics
1.4. Balance Sheet of Other Monetary Financial Institutions or 2.4 MFI loans, breakdown1.5. Selected Assets of Other Monetary Financial Institutions by Sector 2.6 MFI holdings of securities, breakdown1.6. Selected Obligations of Other Monetary Financial Institutions by Sector or 2.5 Deposits held with MFIs, breakdown1.4. Balance Sheet of Other Monetary Financial Institutions2.2. Interbank Money Market Rates and Indexation Clause 4.6 Money market interest rates2.3. European Central Bank Interest Rates 1.2 Key ECB interest rates2.8. The Ljubljana Stock Exchange: Slovenian Stock Exchange Index and Bond Ind 4.8 Stock market indices2.9.2a. European Central Bank exchange rates - Average Rates 8.2 Bilateral exchange rates3.2. Balance of payments, capital and financial account 7.1 Balance of payments - summary
7.2 Current and capital account7.3 Financial account
3.3. Current Account by countries 7.2.3 Current and capital account - geographical breakdown3.4. Capital and Financial Account by countries 7.3.8 Financial account - geographical breakdown3.5. Trade in goods by countries 7.5 Trade in goods3.6. International Investment Position of Slovenia; assets, liabilities 7.3 Financial account3.7. International Investment Position by countries; assets, liabilities 7.3.8 Financial account - geographical breakdown3.12. International reserves 7.3.7. Reserve assets4.1. General Government Non-financial and Financial Accounts (ESA 95) 6.1 Revenue, expenditure and deficit/surplus
6.2 Debt6.3 Change in debt
4.2. Non-financial account general government sector (ESA 95) 6.4. Quarterly revenue, expenditure and deficit/surplus4.4. Financial account general government sector (ESA 95) 6.5. Quarterly debt and change in debt6.1. Expenditure on gross domestic product 5.2.1. GDP and expenditure components6.2. Expenditure on gross domestic product (growth rates)6.3. Gross domestic product by activity 5.2.2. Value added by economic activity6.4. Gross domestic product by activity (growth rates)6.5. Industrial production index and productivity index in industry 5.2.3. Industrial production6.6. Industrial production index and productivity index in industry (growth rates)6.7. Turnover and new orders in industry 5.2.4. Industrial new orders and turnover, retail sales and new passenger car registrations6.8. Turnover and new orders in industry (growth rates)6.9. Business tendency and consumer surveys (part 1) 5.2.5. Business and Consumer Surveys6.10. Business tendency and consumer surveys (part 2)6.11. Employment by Labour Force Survey (ILO) 5.3.1. Employment6.12. Unemployment by Labour Force Survey (ILO) 5.3.2. Unemployment6.14. The Effective Exchange Rate - Nominal, Real 8.1 Effective exchange rates6.15. Consumer price index 5.1.1. Harmonised Index of Consumer Prices6.16. Consumer price index (growth rates)6.17. Industrial producer price index 5.1.2. Industry, construction, residential property and commodity prices6.18. Industrial producer price index (growth rates)
Tabels in Monthly Bulletin of the Bank of Slovenia Tabels in Monthly Bulletin of the ECB
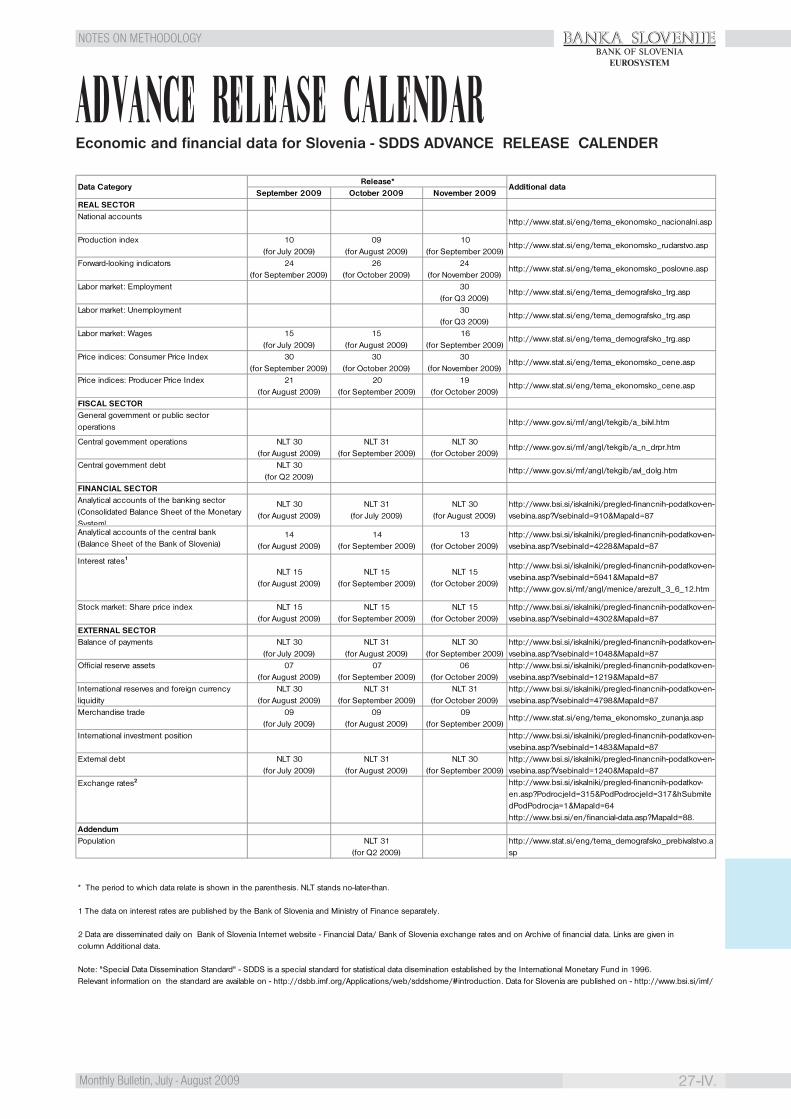
BANKA SLOVENIJE
27-IV.Monthly Bulletin, July - August 2009
NOTES ON METHODOLOGYBANK OF SLOVENIA
EUROSYSTEM
ADVANCE RELEASE CALENDAREconomic and financial data for Slovenia - SDDS ADVANCE RELEASE CALENDER
September 2009 October 2009 November 2009REAL SECTOR National accounts
http://www.stat.si/eng/tema_ekonomsko_nacionalni.asp
Production index 10(for July 2009)
09(for August 2009)
10(for September 2009)
http://www.stat.si/eng/tema_ekonomsko_rudarstvo.asp
Forward-looking indicators 24(for September 2009)
26(for October 2009)
24(for November 2009)
http://www.stat.si/eng/tema_ekonomsko_poslovne.asp
Labor market: Employment
30(for Q3 2009)
http://www.stat.si/eng/tema_demografsko_trg.asp
Labor market: Unemployment
30(for Q3 2009)
http://www.stat.si/eng/tema_demografsko_trg.asp
Labor market: Wages 15(for July 2009)
15(for August 2009)
16(for September 2009)
http://www.stat.si/eng/tema_demografsko_trg.asp
Price indices: Consumer Price Index 30(for September 2009)
30(for October 2009)
30(for November 2009)
http://www.stat.si/eng/tema_ekonomsko_cene.asp
Price indices: Producer Price Index 21(for August 2009)
20(for September 2009)
19(for October 2009)
http://www.stat.si/eng/tema_ekonomsko_cene.asp
FISCAL SECTOR General government or public sector operations http://www.gov.si/mf/angl/tekgib/a_bilvl.htm
Central government operations NLT 30(for August 2009)
NLT 31(for September 2009)
NLT 30(for October 2009)
http://www.gov.si/mf/angl/tekgib/a_n_drpr.htm
Central government debt NLT 30(for Q2 2009)
http://www.gov.si/mf/angl/tekgib/avl_dolg.htm
FINANCIAL SECTOR Analytical accounts of the banking sector (Consolidated Balance Sheet of the Monetary System)
NLT 30(for August 2009)
NLT 31(for July 2009)
NLT 30(for August 2009)
http://www.bsi.si/iskalniki/pregled-financnih-podatkov-en-vsebina.asp?VsebinaId=910&MapaId=87
Analytical accounts of the central bank (Balance Sheet of the Bank of Slovenia)
14(for August 2009)
14(for September 2009)
13(for October 2009)
http://www.bsi.si/iskalniki/pregled-financnih-podatkov-en-vsebina.asp?VsebinaId=4228&MapaId=87
Interest rates1
NLT 15(for August 2009)
NLT 15(for September 2009)
NLT 15(for October 2009)
http://www.bsi.si/iskalniki/pregled-financnih-podatkov-en-vsebina.asp?VsebinaId=5941&MapaId=87http://www.gov.si/mf/angl/menice/arezult_3_6_12.htm
Stock market: Share price index NLT 15(for August 2009)
NLT 15(for September 2009)
NLT 15(for October 2009)
http://www.bsi.si/iskalniki/pregled-financnih-podatkov-en-vsebina.asp?VsebinaId=4302&MapaId=87
EXTERNAL SECTOR Balance of payments NLT 30
(for July 2009)NLT 31
(for August 2009)NLT 30
(for September 2009)http://www.bsi.si/iskalniki/pregled-financnih-podatkov-en-vsebina.asp?VsebinaId=1048&MapaId=87
Official reserve assets 07(for August 2009)
07(for September 2009)
06(for October 2009)
http://www.bsi.si/iskalniki/pregled-financnih-podatkov-en-vsebina.asp?VsebinaId=1219&MapaId=87
International reserves and foreign currency liquidity
NLT 30(for August 2009)
NLT 31(for September 2009)
NLT 31(for October 2009)
http://www.bsi.si/iskalniki/pregled-financnih-podatkov-en-vsebina.asp?VsebinaId=4798&MapaId=87
Merchandise trade 09(for July 2009)
09(for August 2009)
09(for September 2009)
http://www.stat.si/eng/tema_ekonomsko_zunanja.asp
International investment position
http://www.bsi.si/iskalniki/pregled-financnih-podatkov-en-vsebina.asp?VsebinaId=1483&MapaId=87
External debt NLT 30(for July 2009)
NLT 31(for August 2009)
NLT 30(for September 2009)
http://www.bsi.si/iskalniki/pregled-financnih-podatkov-en-vsebina.asp?VsebinaId=1240&MapaId=87
Exchange rates2
http://www.bsi.si/iskalniki/pregled-financnih-podatkov-en.asp?PodrocjeId=315&PodPodrocjeId=317&hSubmitedPodPodrocja=1&MapaId=64http://www.bsi.si/en/financial-data.asp?MapaId=88.
Addendum Population
NLT 31
(for Q2 2009)
http://www.stat.si/eng/tema_demografsko_prebivalstvo.asp
* The period to which data relate is shown in the parenthesis. NLT stands no-later-than.
1 The data on interest rates are published by the Bank of Slovenia and Ministry of Finance separately. 2 Data are disseminated daily on Bank of Slovenia Internet website - Financial Data/ Bank of Slovenia exchange rates and on Archive of financial data. Links are given in column Additional data.
Note: "Special Data Dissemination Standard" - SDDS is a special standard for statistical data disemination established by the International Monetary Fund in 1996. Relevant information on the standard are available on - http://dsbb.imf.org/Applications/web/sddshome/#introduction. Data for Slovenia are published on - http://www.bsi.si/imf/
Data CategoryRelease*
Additional data

Related Documents