Preliminary Group 1 Financial Results for the year ended 31 December 2016 Bank of Cyprus Group 1 March 2017 The Preliminary Group Financial Results have not been audited by the Group‟s external auditors (1) The Preliminary Group Financial Results referred to in this Presentation relate to the Bank of Cyprus Public Company Limited, the “Bank”, and together with its subsidiaries, the “Group”, which was listed on the Cyprus Stock Exchange (CSE) and the Athens Exchange as at 31 December 2016. On 18 January 2017, Bank of Cyprus Holdings Public Limited Company (BOC Holdings) became the new parent company of the Bank. On 19 January 2017 BOC Holdings was admitted to listing and trading on the London Stock Exchange and the CSE.

Welcome message from author
This document is posted to help you gain knowledge. Please leave a comment to let me know what you think about it! Share it to your friends and learn new things together.
Transcript

49
133
156
255
192
0
127
127
127
0
153
204
191
191
191
203
224
230
234
234
234
0
97
114
Preliminary Group1 Financial Results
for the year ended 31 December 2016
Bank of Cyprus Group
1 March 2017
The Preliminary Group Financial Results have not been audited by the Group‟s external auditors
(1) The Preliminary Group Financial Results referred to in this Presentation relate to the Bank of Cyprus Public Company Limited, the “Bank”, and together with its subsidiaries, the “Group”,
which was listed on the Cyprus Stock Exchange (CSE) and the Athens Exchange as at 31 December 2016. On 18 January 2017, Bank of Cyprus Holdings Public Limited Company (BOC
Holdings) became the new parent company of the Bank. On 19 January 2017 BOC Holdings was admitted to listing and trading on the London Stock Exchange and the CSE.

49
133
156
255
192
0
127
127
127
0
153
204
191
191
191
203
224
230
234
234
234
0
97
114
(1) Problem loans (90+ DPD) are loans in arrears for more than 90 days (90+ DPD) and are defined as loans past-due for more than 90 days and those that are impaired (impaired loans are those which
are not considered fully collectable and for which a provision for impairment has been recognised on an individual basis or for which incurred losses exist at their initial recognition or customers in Debt
Recovery).
(2) Including Debt for asset swaps, write offs & non contractual write offs
(3) Adjusted for the issuance of €250 mn Tier 2 Notes in January 2017 based on the preliminary Group financial results as at and for the year ended 31 December 2016.
(4) Leverage ratio = Tangible Total Equity over Total Assets (5) As at 31 December 2016
FY2016 Financial Results - Highlights
2
• Loan market share5 at 39,4%; Deposit market share5 at 31,1%; Economy growing for a second consecutive
year at 2,8% yoy (compared to 1,7% in 2015)
• New lending of c.€1,5 bn, in 2016
• Trading of shares on the LSE and the CSE commenced on 19 January 2016
• Another significant milestone in journey back to strength
Maintaining Strong
Capital Position
• Total Capital ratio c.16% (pro forma3)
• CET1 ratio at 14,7%; 70 basis points added during FY2016;
• RWA intensity at 85%; Conservative leverage ratio4 of 13,2%
Normalising
liability stack
• Deposits up by €867 mn or 6% qoq; up by €2,3 bn or 16% in FY2016
• Ratio of Loans to Deposits (L/D) improved to 95%
Seven consecutive
quarters of NPL
improvement
• 90+ DPD1 down by €459 mn or 5% qoq; down by €3,0 bn or 27% in FY2016
• NPEs down by €867 mn or 7% qoq; down by €2,9 bn or 21% in FY2016
• Loan restructurings of €6,2 bn2 in FY2016
Operating
profitability
directed to de-risk
balance sheet
• Modest profitability of €64 mn for FY2016; €2 mn for 4Q2016
• Strong pre provision operating profitability of €148 mn for 4Q2016 and €566 mn for FY2016
• Sustained NIM at 3,47%
• Healthy C/I ratio of 41% for FY2016
Leading market
Position
in a Recovering
Economy
Key Milestones
Achieved in
January 2017
• Listing on LSE
• ELA fully repaid
• Successful issuance of €250 mn Tier 2 Notes

49
133
156
255
192
0
127
127
127
0
153
204
191
191
191
203
224
230
234
234
234
0
97
114
15,6
%
14,0
%
14,9
%
14,0
%
14,4
%
14,7
%
14,7
%
11,3
% 14,2
%
15,0
%
14,1
%
14,5
%
14,8
%
c. 1
6%
Jun2014
Dec2014
Jun2015
Dec2015
Jun2016
Dec2016
Dec2016pro
forma
CET 1 transitional Total Capital Ratio
Strong Capital Position Loan to Deposit Ratio at 95%
At a glance- Significant Improvement in all Financial Indicators
(1) Mainly attributable to loan restructuring activity and slower formation of new problem loans
(2) Based on EBA Risk Dashboard Report, data as at 30 September 2016
(3) Leverage ratio defined as tangible equity over total assets
(4) Adjusted for the issuance of €250 mn Tier 2 Notes in January 2017 based on the preliminary Group financial results as at and for the year ended 31 December 2016
145% 148% 141% 136%
121% 110%
95%
Dec2013
Jun2014
Dec2014
Jun2015
Dec2015
Jun2016
Dec2016
Loan to deposit ratio (L/D)
€2,9 bn reduction in NPEs in FY2016;
Down by 27% since peak Rising coverage ratios
0,2
(0,4)
(0,6)
(0,2)
(0,6)
(0,8)
(0,6)
(0,9)
Ma
r 15
Jun
15
Se
pt 15
Dec 1
5
Ma
r 16
Jun
16
Se
pt 16
Dec 1
6
49% 50% 53% 53% 50% 44% 41%
38% 39% 41% 43% 48%
53% 54%
35% 33% 34% 36% 39% 39%
41%
Dec2013
Jun2014
Dec2014
Jun2015
Dec2015
Jun2016
Dec2016
90+DPD ratio
90+DPD provision coverage
NPEs provision coverage
Change in NPEs (€ bn)
EBA average
L/D2: 120%
2015:
(€1,0 bn)
62,9% 61,9% 61,8% 59,3% 54,8%
NPE ratio
12,5% 12,5% 12,6% 13,0% 13,2%
Leverage ratio3
9,4%
2016:
(€2,9bn)
3
€3,0 bn reduction in 90+DPD in FY2016;
Down by 36% since peak
0,9 1,3 1,4
2,7
5,3
(0,4)
0,0
(0,0)
(1,3) (2,0)
(1,0)
2009
2010
2011
2012
2013
1H
2014
2H
2014
1H
2015
2H
2015
1H
2016
2H
2016
2014:
(€0,4 bn)
2015:
(€1,3 bn)
2016:
(€3,0 bn)
Full repayment of ELA
11,4 11,1 9,6
8,8 7,4
5,9 3,8
2,4 1,3 0,2 0,0
34% 31% 31%
28%
23%
16%
11%
6%
1% 0%
Apr2013
Jun2013
Dec2013
Jun2014
Dec2014
Jun2015
Dec2015
Jun2016
Sep2016
Dec2016
Jan2017
ELA (€ bn) ELA as % of total assets
Change in 90+ DPD1 (€ bn)
4
49
133
156
255
192
0
127
127
127
0
153
204
191
191
191
203
224
230
234
234
234
0
97
114
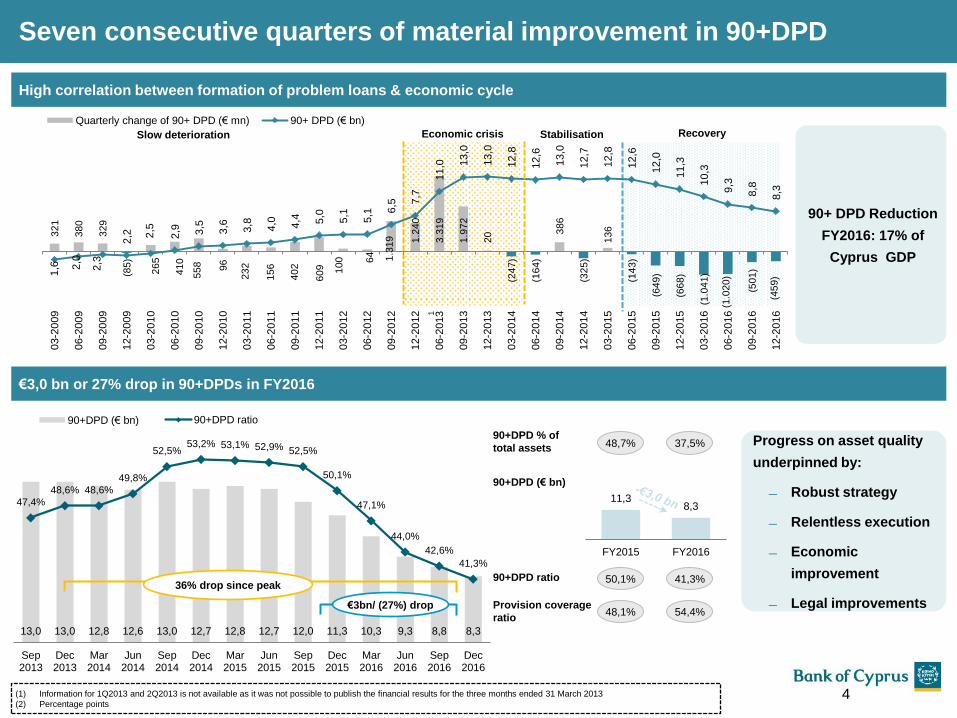
13,0 13,0 12,8 12,6 13,0 12,7 12,8 12,7 12,0 11,3 10,3 9,3 8,8 8,3
47,4%
48,6% 48,6%
49,8%
52,5% 53,2% 53,1% 52,9% 52,5%
50,1%
47,1%
44,0%
42,6%
41,3%
Sep2013
Dec2013
Mar2014
Jun2014
Sep2014
Dec2014
Mar2015
Jun2015
Sep2015
Dec2015
Mar2016
Jun2016
Sep2016
Dec2016
90+DPD (€ bn) 90+DPD ratio
Seven consecutive quarters of material improvement in 90+DPD
High correlation between formation of problem loans & economic cycle
90+ DPD Reduction
FY2016: 17% of
Cyprus GDP
4
Progress on asset quality
underpinned by:
Robust strategy
Relentless execution
Economic
improvement
Legal improvements
11,3 8,3
FY2015 FY2016
50,1% 41,3% 90+DPD ratio
48,1% 54,4% Provision coverage
ratio
90+DPD (€ bn)
48,7% 37,5% 90+DPD % of
total assets
€3,0 bn or 27% drop in 90+DPDs in FY2016
€3bn/ (27%) drop
36% drop since peak
32
1
380
329
(85
)
26
5
410
558
96
232
156
402
609
100
64
1.3
19
1.2
40
3.3
19
1.9
72
20
(24
7)
(16
4)
386
(32
5)
136
(14
3)
(64
9)
(66
8)
(1.0
41
)
(1.0
20
)
(50
1)
(45
9) 1
,6
2,0
2,3
2,2
2,5
2,9
3,5
3,6
3,8
4,0
4,4
5,0
5,1
5,1
6,5
7,7
11,0
13,0
13,0
12
,8
12,6
13,0
12,7
12,8
12,6
12,0
11,3
10,3
9,3
8,8
8,3
03
-20
09
06
-20
09
09
-20
09
12
-20
09
03
-20
10
06
-20
10
09
-20
10
12
-20
10
03
-20
11
06
-20
11
09
-20
11
12
-20
11
03
-20
12
06
-20
12
09
-20
12
12
-20
12
06-2
013
09
-20
13
12
-20
13
03
-20
14
06
-20
14
09
-20
14
12
-20
14
03
-20
15
06
-20
15
09
-20
15
12
-20
15
03
-20
16
06
-20
16
09
-20
16
12
-20
16
Quarterly change of 90+ DPD (€ mn) 90+ DPD (€ bn)
Economic crisis
1
Slow deterioration Stabilisation Recovery
(1) Information for 1Q2013 and 2Q2013 is not available as it was not possible to publish the financial results for the three months ended 31 March 2013
(2) Percentage points

49
133
156
255
192
0
127
127
127
0
153
204
191
191
191
203
224
230
234
234
234
0
97
114
0,7
0,1 0,2
0,3
0,1 0,0
0,5
0,1
1,5
0,3 0,2
2017 2018 2019+
Corporate SME Retail
15,0 15,2 14,8 14,2 14,0 13,3 12,5 11,9 11,0
62,9% 63,0% 61,9% 62,2% 61,8%
61,0%
59,3%
57,8%
54,8%
Dec 2014 Mar 2015 Jun 2015 Sep 2015 Dec 2015 Mar 2016 Jun 2016 Sep 2016 Dec 2016
NPEs (€ bn) NPE ratio
€4,0 bn drop since Dec-2014; €867 mn drop in 4Q2016
Forborne NPEs with no impairments or
arrears1 (€ bn) – in pipeline to exit NPEs
subject to meeting all exit criteria2
(1) Analysis provided on account basis. Accounts will not exit NPE status if not all exit criteria are met
(2) Curing period of the NPEs with forbearance measures, but no impairments and no arrears, assuming no re-default
(3) Percentage points
Seven consecutive quarters of material improvement in NPEs
2,2 2,4
2,0 2,3
€4,0 bn or ( 26%) drop since Dec 14
13,97 11,03
FY2015 FY2016
61,8% 54,8% NPE ratio
39,0% 41,0% Provision coverage
ratio
NPEs (€ bn)
NPEs % of
total assets
• NPEs reduction FY2016: 17% of Cyprus GDP
• NPEs reduced for 7 consecutive quarters
• For a second consecutive quarter reduction of NPEs exceeds
reduction of 90+ DPD
NPEs reduced by €2,9 bn or 21% in FY2016
60,0% 49,8%
5
€867 mn or (7%)
drop qoq
NPEs with forbearance measures no
impairments, no arrears
1,9
49
133
156
255
192
0
127
127
127
0
153
204
191
191
191
203
224
230
234
234
234
0
97
114
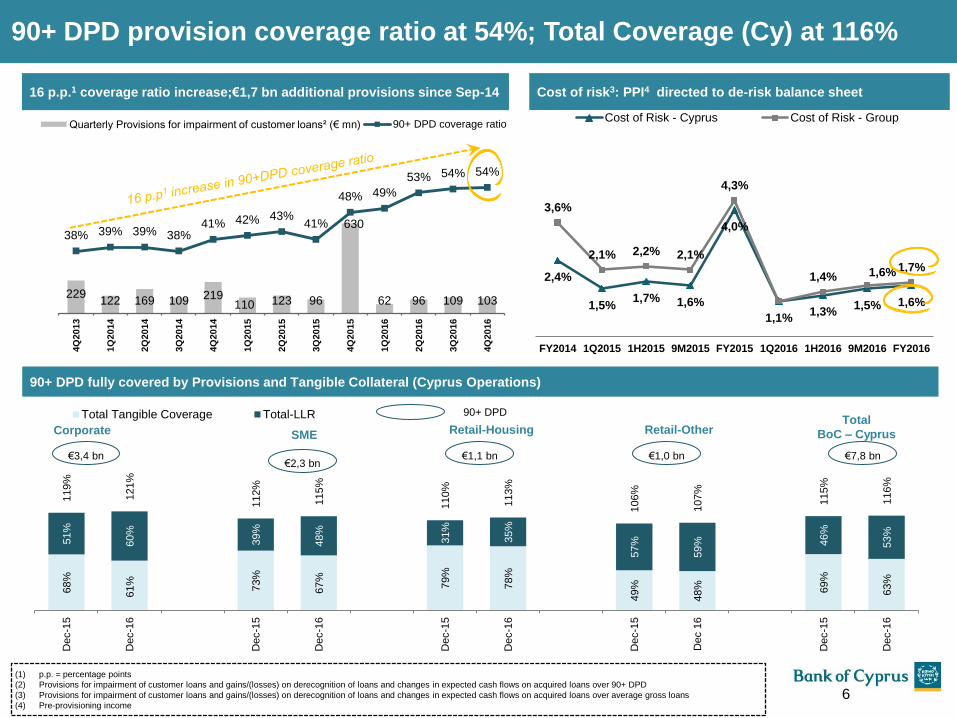
(1) p.p. = percentage points
(2) Provisions for impairment of customer loans and gains/(losses) on derecognition of loans and changes in expected cash flows on acquired loans over 90+ DPD
(3) Provisions for impairment of customer loans and gains/(losses) on derecognition of loans and changes in expected cash flows on acquired loans over average gross loans
(4) Pre-provisioning income
90+ DPD provision coverage ratio at 54%; Total Coverage (Cy) at 116%
Cost of risk3: PPI4 directed to de-risk balance sheet
2,4%
1,5% 1,7% 1,6%
4,0%
1,1% 1,3%
1,5% 1,6%
3,6%
2,1% 2,2% 2,1%
4,3%
1,4% 1,6% 1,7%
FY2014 1Q2015 1H2015 9M2015 FY2015 1Q2016 1H2016 9M2016 FY2016
Cost of Risk - Cyprus Cost of Risk - Group
6
16 p.p.1 coverage ratio increase;€1,7 bn additional provisions since Sep-14
90+ DPD fully covered by Provisions and Tangible Collateral (Cyprus Operations)
229 122 169 109 219
110 123 96
630
62 96 109 103
38% 39% 39% 38% 41% 42% 43%
41%
48% 49%
53% 54% 54%
4Q
20
13
1Q
20
14
2Q
20
14
3Q
20
14
4Q
20
14
1Q
20
15
2Q
20
15
3Q
20
15
4Q
20
15
1Q
20
16
2Q
20
16
3Q
20
16
4Q
20
16
Quarterly Provisions for impairment of customer loans² (€ mn) 90+ DPD coverage ratio
68%
61%
73%
67%
79%
78%
49%
48%
69%
63%
51%
60%
39%
48%
31%
35%
57%
59%
46%
53%
119%
121%
112%
115%
110%
113%
106%
107%
115%
116%
Dec-1
5
Dec-1
6
Dec-1
5
Dec-1
6
Dec-1
5
Dec-1
6
Dec-1
5
Dec 1
6
Dec-1
5
Dec-1
6
Total Tangible Coverage Total-LLR Total
BoC – Cyprus Corporate SME Retail-Housing Retail-Other
€3,4 bn €2,3 bn
€1,1 bn €7,8 bn
90+ DPD
€1,0 bn

49
133
156
255
192
0
127
127
127
0
153
204
191
191
191
203
224
230
234
234
234
0
97
114
(1) p.p. = percentage points
(2) Analysis provided on account basis. Accounts will not exit NPE status if not all exit criteria are met
NPE provision coverage ratio at 41%; Total Coverage (Cy) at 108%
7
Adequate NPE total coverage when collateral is included(Cyprus operations)
71%
67%
76%
72%
85%
84%
53%
52%
73%
69%
44%
45%
33%
37%
17%
21%
45%
47%
37%
39%
115%
112%
109%
109%
102%
105%
98%
99%
110%
108%
Dec 1
5
Dec 1
6
Dec 1
5
Dec 1
6
Dec 1
5
Dec 1
6
Dec 1
5
Dec 1
6
Dec 1
5
Dec 1
6
Total Tangible Coverage Total-LLR
Total BoC –Cyprus Corporate SME Retail-Housing Retail-Other
€4,5 bn €3,0 bn €1,8 bn €1,2 bn €10,5 bn
NPEs
7 p.p.1 coverage ratio increase; €1,7 bn additional provisions since Sep-14
109
219
110 123 96
630
62 96 109 103
34% 34% 35% 36% 35%
39% 38% 39% 40% 41%
0%
5%
10%
15%
20%
25%
30%
35%
40%
45%
3Q2014 4Q2014 1Q2015 2Q2015 3Q2015 4Q2015 1Q2016 2Q2016 3Q2016 4Q2016
Quarterly Provisions for impairment of customer loans² …
• NPEs provision coverage increases
significantly when adjusted for NPEs with
forbearance measures no impairments or
arrears2

49
133
156
255
192
0
127
127
127
0
153
204
191
191
191
203
224
230
234
234
234
0
97
114
90+ DPD and NPE outflows significantly exceed inflows
90+DPD inflows in Cyprus operations (€ bn) arrested
Significant increase in NPE outflows in 4Q2016 (€ bn)
0,27 0,17 0,19 0,22
(0,58) (0,68) (0,53) (0,45)
(0,30) (0,26) (0,23)
(0,58)
(0,88) (0,94)
(0,76)
(1,03)
1Q2016 2Q2016 3Q2016 4Q2016
Total outflows
• Close monitoring to arrest
deterioration of portfolio
• Ramp up in restructuring efforts
0,68
0,60
0,34 0,36
0,22
0,11 0,13 0,14 0,14 0,14
3Q2014 4Q2014 1Q2015 2Q2015 3Q2015 4Q2015 1Q2016 2Q2016 3Q2016 4Q2016
Average: 0,29
8
• Strict monitoring of
restructurings to arrest re-
defaults
Inflows Cured restructured NPEs & collections
Outflows-other
2

49
133
156
255
192
0
127
127
127
0
153
204
191
191
191
203
224
230
234
234
234
0
97
114
0,84 0,69 0,81
1,33 1,50
1,26
0,68 0,53
0,4
0,3
0,2 0,2
0,3
0,4
0,2 0,2
0,8 0,7
0,8
1,3
2,2
2,0
1,1 0,9
1Q
201
5
2Q
201
5
3Q
201
5
4Q
201
5
1Q
201
6
2Q
201
6
3Q
201
6
4Q
201
6
Restructured loans Write offs & non contractual write offs DFAS
Average2: c.1,0
4
71
%
65
%
70
%
76
%
82
%
75
%
70
%
88
%
84
%
85
%
81
%
1Q
201
4
2Q
201
4
3Q
201
4
4Q
201
4
1Q
201
5
2Q
201
5
3Q
201
5
4Q
201
5
1Q
201
6
2Q
201
6
3Q
201
6
% of restructured loans with no arrears
FY20161: €6,2 bn
Quarterly evolution of restructuring activity (€ bn)
81% of restructured loans5 have no arrears6 (Cyprus operations)
(1) Total restructured loans is equal to restructured loans plus write offs & non contractual write offs and debt for asset swaps for FY2016
(2) Average restructured loans excluding write offs & non contractual write offs and DFAS
(3) Loans together with the associated provisions are written off when there is no realistic prospect of future recovery. Partial write-offs, including non-contractual write-offs, may occur when it is
considered that there is no realistic prospect for the recovery of the contractual cash flows. In addition, write-offs may reflect restructuring activity with customers and are part of the terms of the
agreement and subject to satisfactory performance.
(4) Debt for asset swaps
(5) Restructured loans post 31 December 2013 excluding write offs , set offs and DFAs
(6) The performance of loans restructured during 4Q2016 is not presented in this graph as it is too early to assess
Total €6,2 bn of restructurings1 in 2016
9
Average: 81% • 81% of restructured loans5,6, have
no arrears
3
49
133
156
255
192
0
127
127
127
0
153
204
191
191
191
203
224
230
234
234
234
0
97
114
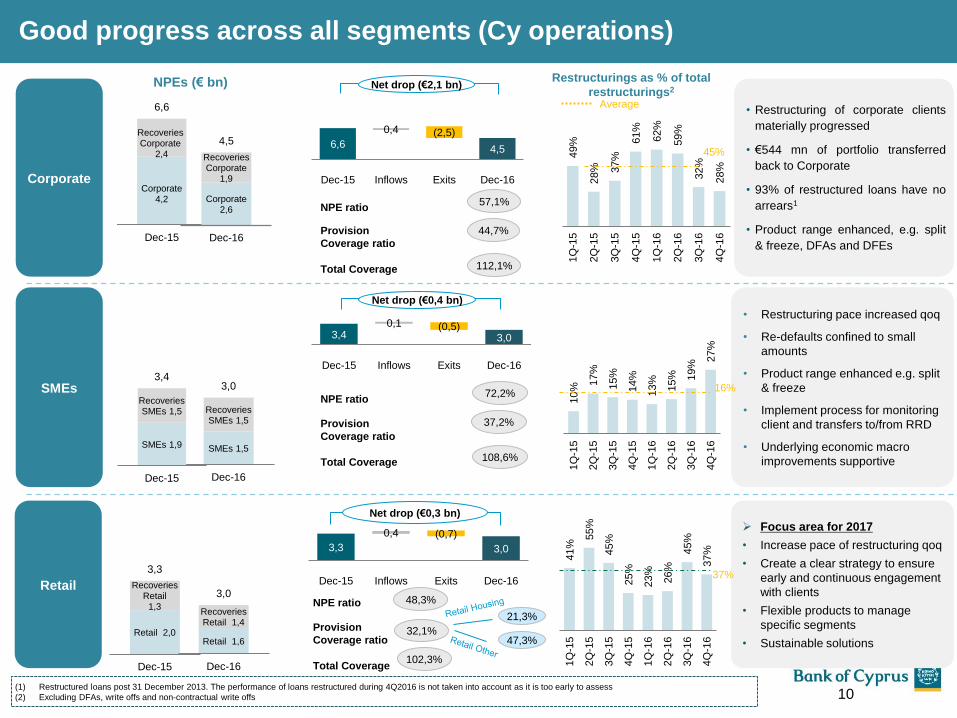
Retail 2,0
Recoveries Retail
1,3
3,3
Dec-15
SMEs 1,5
Recoveries SMEs 1,5
3,0
Dec-16
SMEs 1,9
Recoveries SMEs 1,5
3,4
Dec-15
Corporate 4,2
Recoveries Corporate
2,4
6,6
Dec-15
Focus area for 2017
• Increase pace of restructuring qoq
• Create a clear strategy to ensure
early and continuous engagement
with clients
• Flexible products to manage
specific segments
• Sustainable solutions Retail 1,6
Recoveries Retail 1,4
3,0
Dec-16
3,3 3,0
0,4 (0,7)
Dec-15 Inflows Exits Dec-16
Net drop (€0,3 bn)
Corporate 2,6
Recoveries Corporate
1,9
4,5
Dec-16
41%
55%
45%
25%
23%
26%
45%
37%
1Q
-15
2Q
-15
3Q
-15
4Q
-15
1Q
-16
2Q
-16
3Q
-16
4Q
-16
37% 49%
28%
37%
61%
62%
59%
32%
28%
1Q
-15
2Q
-15
3Q
-15
4Q
-15
1Q
-16
2Q
-16
3Q
-16
4Q
-16
45%
Average
Good progress across all segments (Cy operations)
Corporate
SMEs
Retail
Restructurings as % of total
restructurings2 NPEs (€ bn)
10
• Restructuring pace increased qoq
• Re-defaults confined to small
amounts
• Product range enhanced e.g. split
& freeze
• Implement process for monitoring
client and transfers to/from RRD
• Underlying economic macro
improvements supportive
3,4 3,0
0,1 (0,5)
Dec-15 Inflows Exits Dec-16
• Restructuring of corporate clients
materially progressed
• €544 mn of portfolio transferred
back to Corporate
• 93% of restructured loans have no
arrears1
• Product range enhanced, e.g. split
& freeze, DFAs and DFEs
NPE ratio
Provision
Coverage ratio
Total Coverage
6,6 4,5
0,4 (2,5)
Dec-15 Inflows Exits Dec-16
44,7%
57,1%
112,1%
NPE ratio
Provision
Coverage ratio
Total Coverage
32,1%
48,3%
102,3%
Net drop (€2,1 bn)
Net drop (€0,4 bn)
10%
17%
15%
14%
13%
15%
19%
27%
1Q
-15
2Q
-15
3Q
-15
4Q
-15
1Q
-16
2Q
-16
3Q
-16
4Q
-16
16%
(1) Restructured loans post 31 December 2013. The performance of loans restructured during 4Q2016 is not taken into account as it is too early to assess
(2) Excluding DFAs, write offs and non-contractual write offs
NPE ratio
Provision
Coverage ratio
Total Coverage
37,2%
72,2%
108,6%
47,3%
21,3%
49
133
156
255
192
0
127
127
127
0
153
204
191
191
191
203
224
230
234
234
234
0
97
114
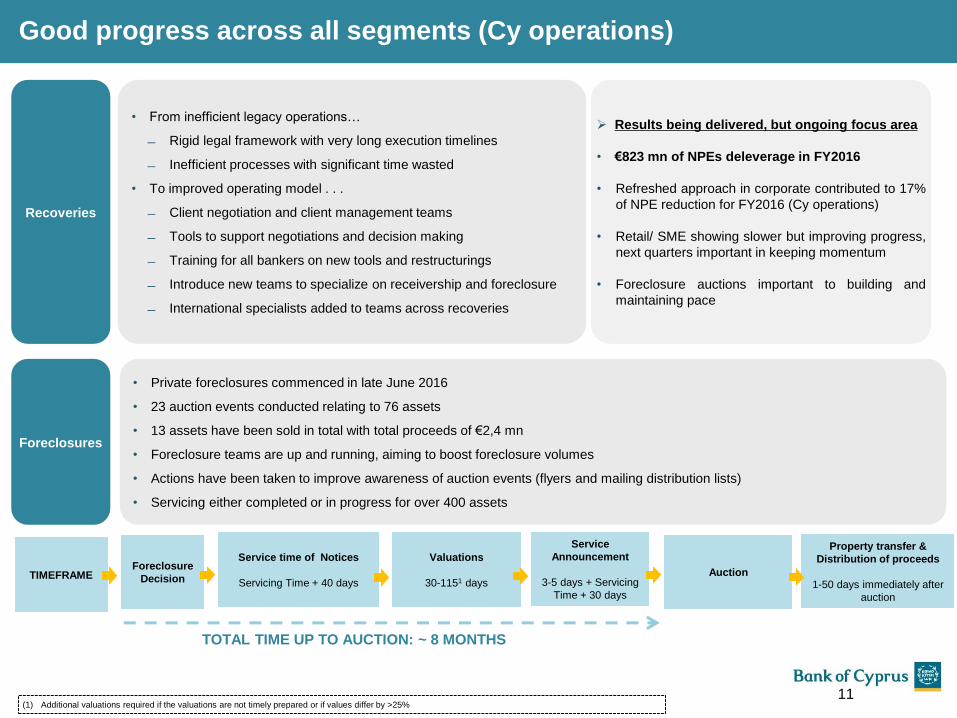
Recoveries
• Private foreclosures commenced in late June 2016
• 23 auction events conducted relating to 76 assets
• 13 assets have been sold in total with total proceeds of €2,4 mn
• Foreclosure teams are up and running, aiming to boost foreclosure volumes
• Actions have been taken to improve awareness of auction events (flyers and mailing distribution lists)
• Servicing either completed or in progress for over 400 assets
Foreclosures
11
Results being delivered, but ongoing focus area
• €823 mn of NPEs deleverage in FY2016
• Refreshed approach in corporate contributed to 17%
of NPE reduction for FY2016 (Cy operations)
• Retail/ SME showing slower but improving progress,
next quarters important in keeping momentum
• Foreclosure auctions important to building and
maintaining pace
Good progress across all segments (Cy operations)
Service time of Notices
Servicing Time + 40 days Auction
Property transfer &
Distribution of proceeds
1-50 days immediately after
auction
TIMEFRAME
Valuations
30-1151 days
TOTAL TIME UP TO AUCTION: ~ 8 MONTHS
Foreclosure
Decision
Service
Announcement
3-5 days + Servicing
Time + 30 days
• From inefficient legacy operations…
Rigid legal framework with very long execution timelines
Inefficient processes with significant time wasted
• To improved operating model . . .
Client negotiation and client management teams
Tools to support negotiations and decision making
Training for all bankers on new tools and restructurings
Introduce new teams to specialize on receivership and foreclosure
International specialists added to teams across recoveries
(1) Additional valuations required if the valuations are not timely prepared or if values differ by >25%
49
133
156
255
192
0
127
127
127
0
153
204
191
191
191
203
224
230
234
234
234
0
97
114
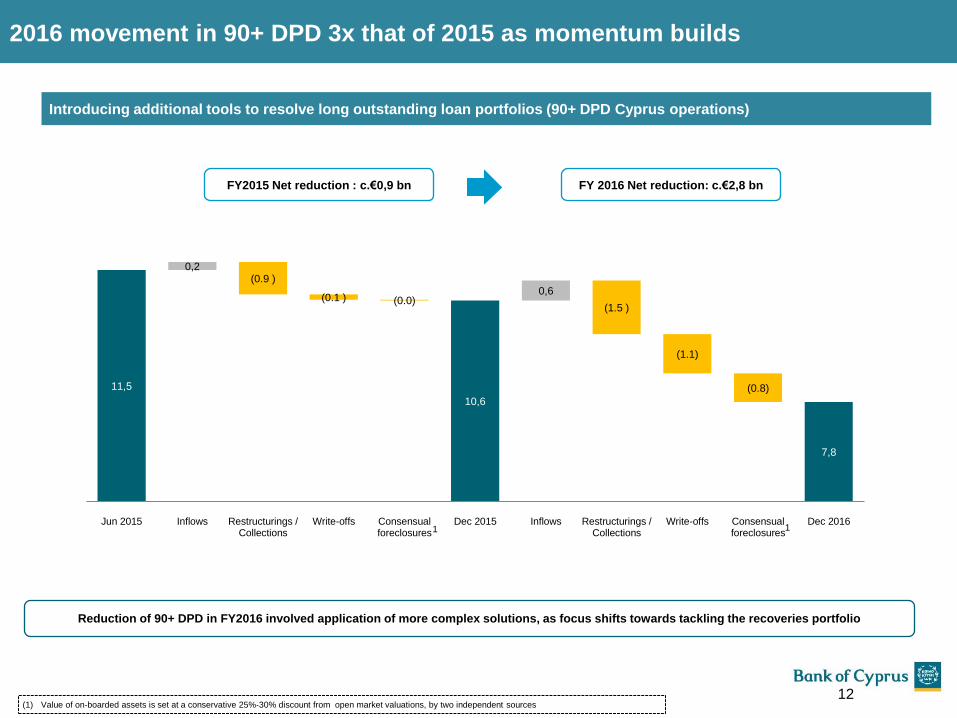
2016 movement in 90+ DPD 3x that of 2015 as momentum builds
Introducing additional tools to resolve long outstanding loan portfolios (90+ DPD Cyprus operations)
Reduction of 90+ DPD in FY2016 involved application of more complex solutions, as focus shifts towards tackling the recoveries portfolio
11,5 11,5
10,6
7,8
0,2 (0.9 )
(0.1 ) (0.0) 0,6
(1.5 )
(1.1)
(0.8)
Jun 2015 Inflows Restructurings /Collections
Write-offs Consensualforeclosures
Dec 2015 Inflows Restructurings /Collections
Write-offs Consensualforeclosures
Dec 2016
FY2015 Net reduction : c.€0,9 bn FY 2016 Net reduction: c.€2,8 bn
12
1
(1) Value of on-boarded assets is set at a conservative 25%-30% discount from open market valuations, by two independent sources
1

49
133
156
255
192
0
127
127
127
0
153
204
191
191
191
203
224
230
234
234
234
0
97
114
Source: Company reports
(1) The charts are not adjusted for market share (2) Based on the preliminary Group financial results as at and for the year ended 31 December 2016 for BOC and on latest available for peer.
(3) For Greek banks, NPE total coverage for Greece only
(4) Calculated using NPE provisions coverage (latest available) and collateral coverage amount (as reported by EBA Transparency Exercise with reference date 30 June 2016). For BOC tangible
collateral is calculated based on FY2016 preliminary results
(5) Share price as at 24 February 2017
BoC compares favourably vs. peer1
13
Highest reduction of NPE as % of nominal GDP vs peer
Change in NPE as % of nominal GDP since 20142
(1,6%)
(0,9%) (0,7%)
(0,4%) (0,3%) (0,1%) (0,0%)
0,2% 0,4%
1,5% 2,0%
Bo
C
Pe
er
1
Pe
er
2
Pe
er
3
Pe
er
4
Pe
er
5
Pe
er
6
Pe
er
7
Pe
er
8
Pe
er
9
Pe
er
10
Pe
er
11
(22,2%)
Good collateral coverage
Strong progress on NPE coverage
11%1
9% 9%
7% 7% 6%
4% 4% 4%
2% 2% 1%
Pe
er
1
Pe
er
2
Pe
er
3
BO
C
Pe
er
4
Pe
er
5
Pe
er
6
Pe
er
7
Pe
er
8
Pe
er
9
Pe
er
10
Pe
er
11
NPE coverage progress since 20142,3
97% 73% 54%
74% 39% 50% 47% 49% 36% 47% 52%
60%
48% 59% 38%
69% 50% 47% 43% 53% 37% 31%
157%
121% 113% 112% 108% 100% 94% 92% 89% 84% 83%
Pe
er
1
Pe
er
2
Pe
er
3
Pe
er
4
Bo
C
Pe
er
5
Pe
er
6
Pe
er
7
Pe
er
8
Pe
er
9
Pe
er
10
Provision coverage Tangible coverage
NPE Total coverage2,4 (Q2’16)
BoC valuation against peers5
0,84x 0,82x 0,81x 0,69x 0,67x
0,54x 0,40x
0,31x 0,31x 0,29x 0,24x 0,20x P
eer
1
Pe
er
2
Pe
er
3
Pe
er
4
Pe
er
5
Pe
er
6
Bo
C
Pe
er
7
Pe
er
8
Pe
er
9
Pe
er
10
Pe
er
11
Average: 0,51x
Valuation benchmarks: On a P/B basis5
Average: 5,50%
1
1
1
49
133
156
255
192
0
127
127
127
0
153
204
191
191
191
203
224
230
234
234
234
0
97
114
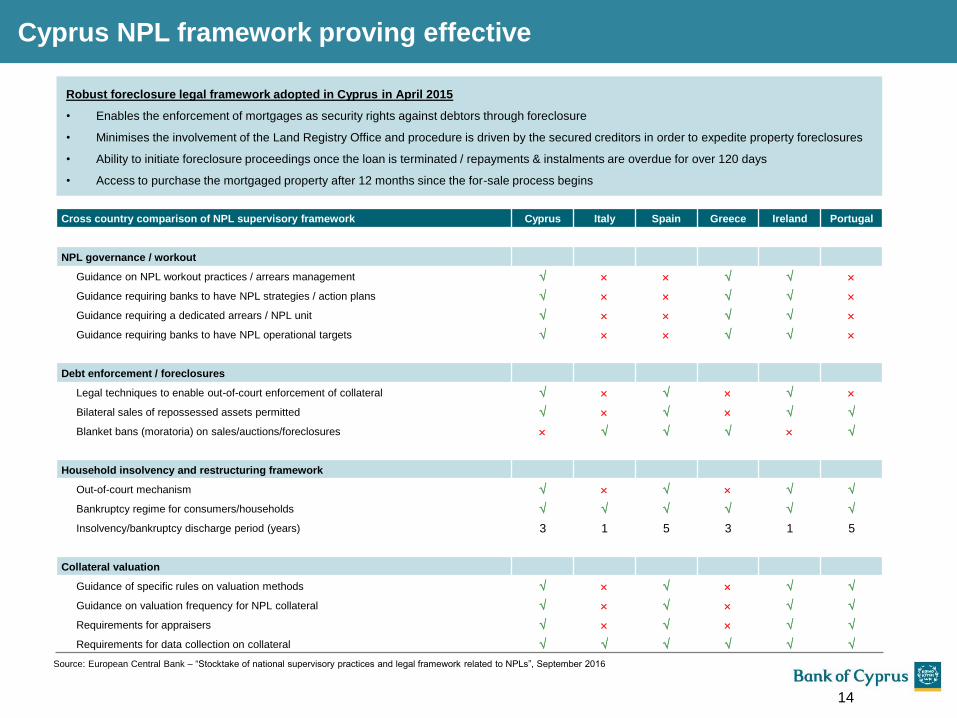
Cyprus NPL framework proving effective
Robust foreclosure legal framework adopted in Cyprus in April 2015
• Enables the enforcement of mortgages as security rights against debtors through foreclosure
• Minimises the involvement of the Land Registry Office and procedure is driven by the secured creditors in order to expedite property foreclosures
• Ability to initiate foreclosure proceedings once the loan is terminated / repayments & instalments are overdue for over 120 days
• Access to purchase the mortgaged property after 12 months since the for-sale process begins
Cross country comparison of NPL supervisory framework Cyprus Italy Spain Greece Ireland Portugal
NPL governance / workout
Guidance on NPL workout practices / arrears management
Guidance requiring banks to have NPL strategies / action plans
Guidance requiring a dedicated arrears / NPL unit
Guidance requiring banks to have NPL operational targets
Debt enforcement / foreclosures
Legal techniques to enable out-of-court enforcement of collateral
Bilateral sales of repossessed assets permitted
Blanket bans (moratoria) on sales/auctions/foreclosures
Household insolvency and restructuring framework
Out-of-court mechanism
Bankruptcy regime for consumers/households
Insolvency/bankruptcy discharge period (years) 3 1 5 3 1 5
Collateral valuation
Guidance of specific rules on valuation methods
Guidance on valuation frequency for NPL collateral
Requirements for appraisers
Requirements for data collection on collateral
Source: European Central Bank – “Stocktake of national supervisory practices and legal framework related to NPLs”, September 2016
14
49
133
156
255
192
0
127
127
127
0
153
204
191
191
191
203
224
230
234
234
234
0
97
114
87,0%
10,7%
2,3%
Cyprus Greece Others
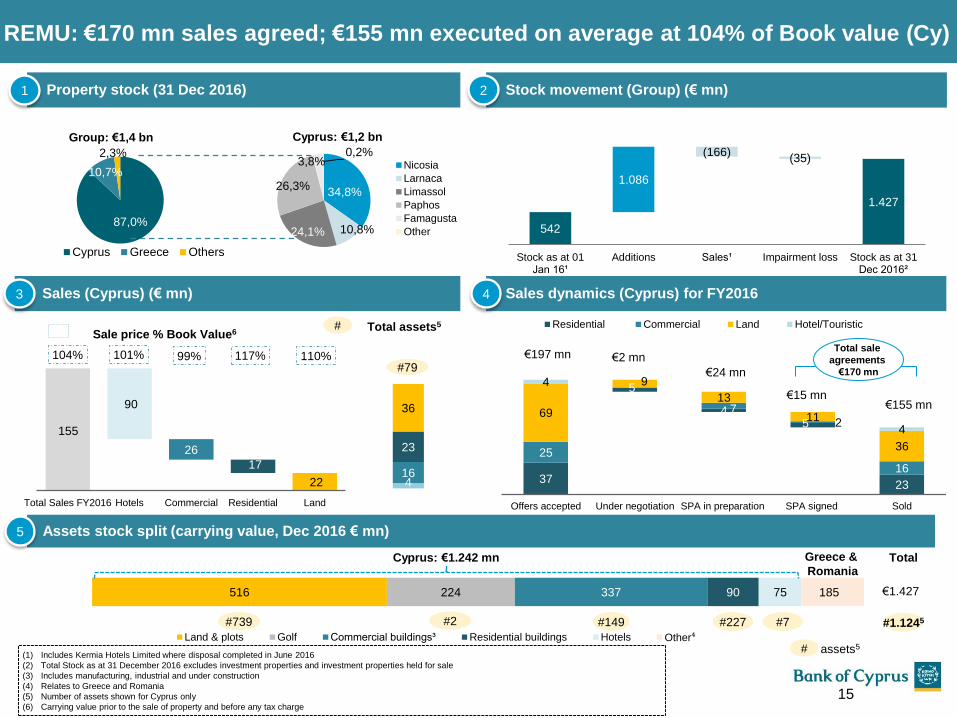
REMU: €170 mn sales agreed; €155 mn executed on average at 104% of Book value (Cy)
(1) Includes Kermia Hotels Limited where disposal completed in June 2016
(2) Total Stock as at 31 December 2016 excludes investment properties and investment properties held for sale
(3) Includes manufacturing, industrial and under construction
(4) Relates to Greece and Romania
(5) Number of assets shown for Cyprus only
(6) Carrying value prior to the sale of property and before any tax charge
Cyprus: €1,2 bn
Property stock (31 Dec 2016)
Group: €1,4 bn
34,8%
10,8% 24,1%
26,3%
3,8% 0,2%
Nicosia
Larnaca
Limassol
Paphos
Famagusta
Other
Stock movement (Group) (€ mn)
542
1.427
1.086
(166) (35)
Stock as at 01Jan 16¹
Additions Sales¹ Impairment loss Stock as at 31Dec 2016²
1 2
Assets stock split (carrying value, Dec 2016 € mn)
516 224 337 90 75 185
Land & plots Golf Commercial buildings³ Residential buildings Hotels Other⁴
Cyprus: €1.242 mn
#739 #149 #227 #7
assets5
#1.1245
Greece &
Romania
155
65,5 39,5
22,5
90
26
17
22
104% 101% 99% 117% 110%
0%
20%
40%
60%
80%
100%
120%
140%
160%
Total Sales FY2016 Hotels Commercial Residential Land
4 16
23
36
#79
Sales (Cyprus) (€ mn)
Sale price % Book Value6 Total assets5
Sales dynamics (Cyprus) for FY2016
37
5
4 5
23
25
7 2
16
69
9
13
11
36
4
4
Offers accepted Under negotiation SPA in preparation SPA signed Sold
Residential Commercial Land Hotel/Touristic
€155 mn €15 mn
€2 mn €197 mn
€24 mn
3 4
5
15
€1.427
#2
#
#
Total sale
agreements
€170 mn
Total

49
133
156
255
192
0
127
127
127
0
153
204
191
191
191
203
224
230
234
234
234
0
97
114
148% 141% 138% 136% 132%
121% 119% 110%
102% 95%
124% 125% 125% 123% 121% 122% 121% 120%
Sep 14 Dec 14 Mar 15 Jun 15 Sep 15 Dec 15 Mar 16 Jun 16 Sep 16 Dec 16
Loans to deposits EU average Loans to deposits ratio
Deposit growth of 16% in FY2016
16
Increasing market share in resident and non-resident deposits
(1) Based on EBA Risk Dashboard Report, Data as at 30 September 2016
(2) Percentage Points
Deposits up by €867 mn in 4Q2016 and by €2,3 bn in FY2016; L/D ratio improved to 95%
11,2 11,3 11,6 11,6 12,2
12,7 12,7 13,3
14,2 15,0
1,3 1,3 1,4 1,4
1,4
1,5 1,4
1,4
1,4
1,5
0,80 0,56 0,61 0,61
0,01
0,01
13,3 13,2 13,6 13,6 13,6
14,2 14,1
14,8
15,6
16,5
Sep 14 Dec-14 Mar-15 Jun-15 Sep-15 Dec-15 Mar-16 Jun-16 Sep-16 Dec-16
Cyprus UK Other
25,6% 25,5% 24,6% 24,3%
23,7% 24,1% 24,6%
25,3% 26,1%
27,0% 26,5%
27,2%
28,8% 29,5%
35,2%
32,2%
30,8%
28,4% 27,5%
26,7% 26,9% 26,7% 27,5%
31,1%
32,9%
34,1% 34,6% 35,8%
Sep 2013 Dec 2013 Mar 2014 Jun 2014 Sep 2014 Dec 2014 Mar 2015 Jun 2015 Sep 2015 Dec 2015 Mar 2016 Jun 2016 Sep 2016 Dec 2016
Residents Non-residents
1

49
133
156
255
192
0
127
127
127
0
153
204
191
191
191
203
224
230
234
234
234
0
97
114
14,6% 14,7%
13,9%
0,8% (0,5%)
(0,1%) (0,1%)
(0,8%)
CET1 ratio30.09.16
(transitional)
Profit beforeprovisions
Provisions Other RWAsChange
CET1 ratio31.12.16
(transitional)
DTA CET1 ratio31.12.16 (fully
loaded)2
7
13,6% 13,5% 13,1% 15,1% 14,4% 13,4% 13,4%
Adequately capitalised relative to risk profile
17
(1) Based on EBA Risk Dashboard Report, Data as at 30 September 2016 (2) Transitional basis; includes unaudited profits for the year ended 31 December 2016 (3) In accordance with
the legislation in Cyprus which has been set for all credit institutions through the requirements of Capital Requirement Directive (CRR)/CRD IV. The applicable rate of the CCB is 1,875% for 2018 and
2,5% for 2019 (fully phased-in). (4) Pillar 2 requirement in the form of CET1 (5) Since 2015, the Bank has been designated as an Other Systemically Important Institution (O-SII). The Central
Bank of Cyprus set the O-SII buffer for the Group at 2%. This buffer will be phased-in gradually, starting from 1 January 2019 at 0.5% and increasing by 0.5% every year thereafter, until being fully
implemented (2.0%) on 1 January 2022 (6) Minimum CET1 Requirement reduced from 10,75% to 9,50% following amendments in the Cypriot Banking Law on 3 February 2017 allowing the gradual
phase-in of the Capital Conservation Buffer (CCB) (7) The DTA adjustments relate to Deferred Tax Assets totalling €450 mn and recognised on tax losses totalling €3,6 bn and can be set off
against future profits of the Bank until 2028 at a tax rate of 12,5%. Furthermore, there are tax losses of c. €8,5 bn for which no deferred tax asset has been recognised. The recognition of deferred tax
assets is supported by the Bank‟s business forecasts and takes into account the recoverability of the deferred tax assets within their expiry period.
CET1 ratio (transitional) of 14,7% compares favorably with EU average of 13,6%
14,0% 13,9%
14,9% 15,6%
14,0% 14,3% 14,4%
14,6% 14,7%
12,5% 12,4% 12,8%
13,0%
13,5% 13,4% 13,6%
14,1%
Dec 2014 Mar 2015 Jun 2015 Sep 2015 Dec 2015 Mar 2016 Jun 2016 Sep 2016 Dec 2016
CET1 ratio (transitional) Average EU CET1 ratio (transitional)1 1
13,9%
CET1 ratio (fully loaded)
Evolution for CET1 ratio2 during 4Q2016
P&L impact of
0,3%
13,8%
14,70%
4,50%
3,75%
1,25%
CET1 transitional31.12.2016
SREP CET1requirement
CET1 ratio vs SREP5 minimum requirement
CCB3 (phased-in)
9,50% Minimum CET1
Requirement6
Pillar 2R4
Pillar 1
49
133
156
255
192
0
127
127
127
0
153
204
191
191
191
203
224
230
234
234
234
0
97
114
0%
5%
10%
15%
20%
Tangible Total Equity % Total Assets Average
BOC
Leverage ratio
13,2%
18
6,6%
Total Capital position c. 16% (pro forma)
Total Capital Adequacy Ratios
10,8%
11,3%
15,5%
14,2% 14,1%
15,0%
15,7%
14,1% 14,4% 14,5%
14,7% 14,8%
Mar 14 Jun 14 Sep 14 Dec 14 Mar 15 Jun 15 Sep 15 Dec 15 Mar 16 Jun 16 Sep 16 Dec 16 Dec-16pro forma1
c. 16%
4,50%
1,50%
2,00%
3,75%
1,25%
Pro forma Total CapitalRatio 31.12.2016
SREP total capitalrequirement
13,00% Overall
Total Capital7
Requirement
CCB2(CET1)
Total Capital Requirement vs SREP6 minimum
requirement
Pillar 2R3
Pillar 1 (CET1)
AT1 capital5
T2 capital4
Total
Pillar 1
of 8%
‘Clean’ Fully Loaded CET1 ratio8,9
Leverage ratio10,11
13,6%
42%
0%
10%
20%
30%
40%
50%
60%
70%
80%
90%
0%
5%
10%
15%
20%
25%
'Clean' Fully Loaded CET1 ratio (LHS) Average 'Clean' Fully Loaded CET1 ratio
RWA % Total Assets (RHS) Average (RWA % Total Assets)
BOC
CET1 FL 13,9%
RWA intensity 85%
(1) The pro forma is based on the preliminary Group financial results as at and for the year ended 31 December 2016. (2) Pillar 2 requirement in the form of CET1 (3) In accordance with the legislation in Cyprus
which has been set for all credit institutions through the requirements of Capital Requirement Directive (CRR)/CRD IV. The applicable rate of the CCB is 1,875% for 2018 and 2,5% for 2019 (fully phased-in). (4)
Tier 2 capital (5) Additional Tier 1 capital (6) Since 2015, the Bank has been designated as an Other Systemically Important Institution (O-SII). The Central Bank of Cyprus set the O-SII buffer for the Group
at 2%. This buffer will be phased-in gradually, starting from 1 January 2019 at 0.5% and increasing by 0.5% every year thereafter, until being fully implemented (2.0%) on 1 January 2022 (7) The Group‟s overall Total
Capital Requirement for 2017 has been reduced to 13,00% from 14,25% following amendments in the Cypriot Banking Law on 3 February 2017 allowing the gradual phase-in of the Capital Conservation Buffer
(8) As per SNL Financial Database, „Clean‟ Fully Loaded CET1 ratio as 31 December 2016, excludes Deferred Tax Credits, AFS and Danish Compromise Estimated Impact (9) The data used is based on FY2016
financial results for 24 out of 37 EU Banks, including Bank of Cyprus, the data for the rest of the banks is based on 9M2016 financial results (10) Leverage ratio is defined as Tangible Total Equity over Total
Assets (11) The data used is based on FY2016 financial results for 28 out of 44 EU Banks, including Bank of Cyprus, the data for the rest of the banks are based on 9M2016 financial results
Issuance of
Tier 2 Notes
c.16%

49
133
156
255
192
0
127
127
127
0
153
204
191
191
191
203
224
230
234
234
234
0
97
114
€ mn FY2016 FY2015 yoy % 4Q2016 3Q2016 qoq %
Total income 963 1.040 -7% 246 235 5%
Total expenses (397) (408) -3% (98) (97) 1%
Profit before provisions and impairments1 566 632 -10% 148 138 8%
Provisions for impairment of customer loans net of
gains/(losses) on loan derecognition and changes
in expected cash flows
(370) (959) -61% (103) (109) -5%
Impairments of other financial and non financial
assets (47) (62) -23% (13) (12) 12%
Provision for litigation and regulatory matters (18) (8) 135% (18) - -
Share of profit from associates and joint ventures 8 6 38% 5 1 216%
Profit/(loss) before tax, restructuring costs,
discontinued operations and net profit on
disposal of non-core asset
139 (391) - 19 18 3%
Tax (16) (9) 84% (1) (4) -87%
(Loss)/profit attributable to non-controlling interests (4) 6 - - 2 -
Profit/(loss) after tax and before restructuring
costs, discontinued operations and net profit on
disposal of non-core asset 119 (394) - 18 16 11%
Advisory, VEP and other restructuring costs2 (114) (43) 165% (16) (11) 47%
Loss from disposal groups held for
sale/discontinued operations - (38) - - - -
Net gain on disposal of non-core assets 59 37 62% - - -
Profit/(loss) after tax 64 (438) - 2 5 -61%
Net interest margin 3,47% 3,79% -32 bps 3,37% 3,35% +2 p.p.
Return on tangible equity (annualised) 2,2% -15,0% 17,2 p.p. 0,3% 0,7% -0,4 p.p.
Return on Average Assets (annualised) 0,3% -1,7% +2 p.p. 0,0% 0,1% -0,1 p.p.
Cost-to-Income ratio 41% 39% +2 p.p. 40% 41% -1 p.p.
Modest profitability of €64 mn for FY2016
(1) Profit before provisions and impairments, gains/(losses) on derecognition and changes on expected cash flows , restructuring costs and discontinued operations.
(2) Advisory, VEP and other restructuring costs comprise mainly: 1) fees of external advisors in relation to: (i) disposal of operations (ii) customer loan restructuring activities which are not part of the
effective interest rate and (iii) the contemplated listing on the London stock exchange and 2) voluntary exit plan cost. (3) Debt for Asset swaps
Key Highlights QoQ change
• NIM at 3,47% for FY2016 compared to
3,51% for 9M2016 reflecting reduction
in customer loan balance due to
elevated loan restructuring activity,
including DFAs3
• Total Income up by 5% qoq due to
increase by 43% of fee and
commission income, favourably
affected by both new and increased
charges, as well as with non-recurring
fees of c.€7 mn.
• Strong operating profitability of €148
mn for 4Q2016, up by 8% qoq, a net
increase in non interest income
• Provision for litigation and
regulatory matters for 4Q2016 were
€18 mn primarily affected by legal and
regulatory one off redress charges for
UK operations
• Modest Profit after tax of €2 mn for
4Q2016 and €64 for FY2016
19
49
133
156
255
192
0
127
127
127
0
153
204
191
191
191
203
224
230
234
234
234
0
97
114
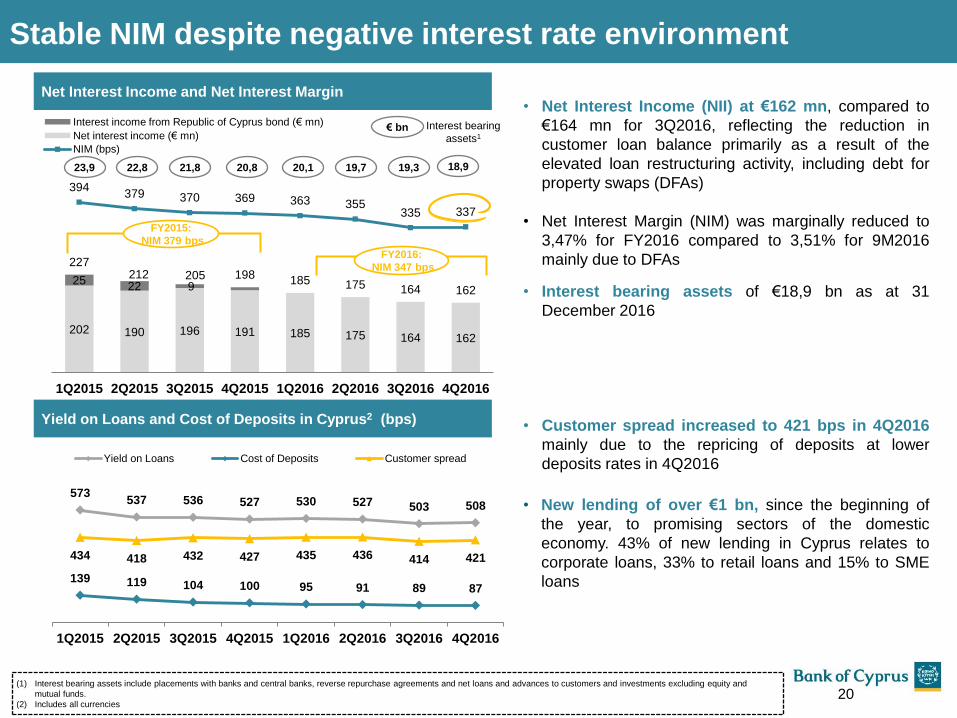
202 190 196 191 185 175 164 162
25 22 9
227 212 205 198
185 175 164 162
394 379 370 369 363 355
335 337
1Q2015 2Q2015 3Q2015 4Q2015 1Q2016 2Q2016 3Q2016 4Q2016
Interest income from Republic of Cyprus bond (€ mn)
Net interest income (€ mn)
NIM (bps)
Stable NIM despite negative interest rate environment
Net Interest Income and Net Interest Margin
Yield on Loans and Cost of Deposits in Cyprus2 (bps)
573 537 536 527 530 527 503 508
139 119 104 100 95 91 89 87
434 418 432 427 435 436 414 421
1Q2015 2Q2015 3Q2015 4Q2015 1Q2016 2Q2016 3Q2016 4Q2016
Yield on Loans Cost of Deposits Customer spread
• Net Interest Income (NII) at €162 mn, compared to
€164 mn for 3Q2016, reflecting the reduction in
customer loan balance primarily as a result of the
elevated loan restructuring activity, including debt for
property swaps (DFAs)
• Net Interest Margin (NIM) was marginally reduced to
3,47% for FY2016 compared to 3,51% for 9M2016
mainly due to DFAs
• Interest bearing assets of €18,9 bn as at 31
December 2016
• Customer spread increased to 421 bps in 4Q2016
mainly due to the repricing of deposits at lower
deposits rates in 4Q2016
• New lending of over €1 bn, since the beginning of
the year, to promising sectors of the domestic
economy. 43% of new lending in Cyprus relates to
corporate loans, 33% to retail loans and 15% to SME
loans
(1) Interest bearing assets include placements with banks and central banks, reverse repurchase agreements and net loans and advances to customers and investments excluding equity and
mutual funds.
(2) Includes all currencies 20
FY2016:
NIM 347 bps
FY2015:
NIM 379 bps
22,8 21,8 20,8 20,1 19,7 19,3 23,9 18,9
€ bn Interest bearing
assets1
49
133
156
255
192
0
127
127
127
0
153
204
191
191
191
203
224
230
234
234
234
0
97
114
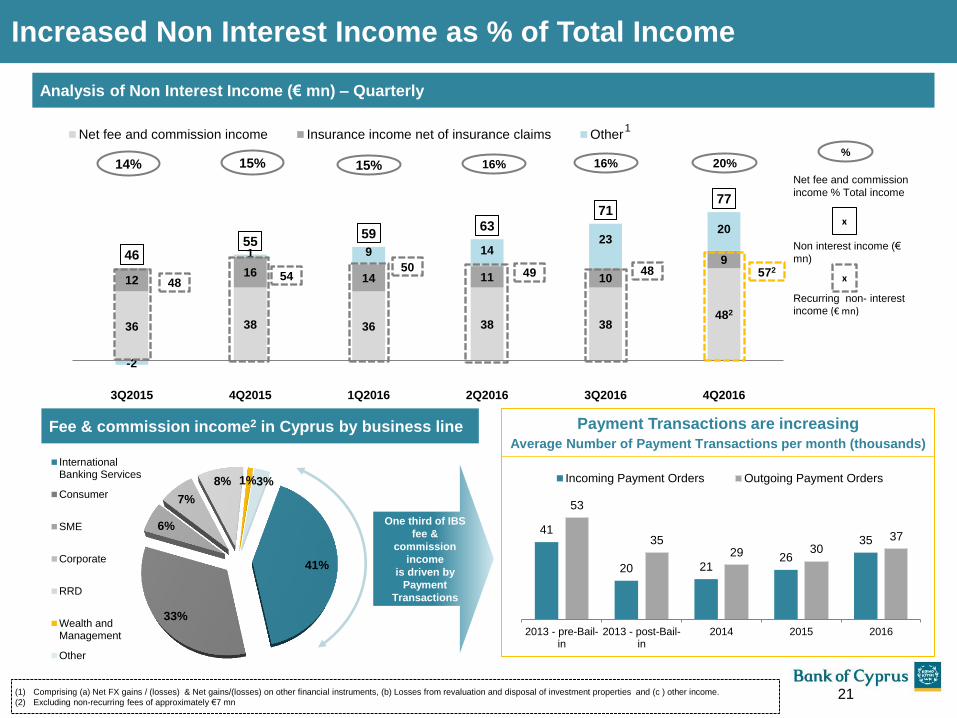
Recurring non- interest income (€ mn)
Analysis of Non Interest Income (€ mn) – Quarterly
36 38 36 38 38 482
12 16
14 11 10
9
-2
1 9 14 23
20
46 55
59 63
71 77
3Q2015 4Q2015 1Q2016 2Q2016 3Q2016 4Q2016
Net fee and commission income Insurance income net of insurance claims Other
15% 16% 20% 16% %
Net fee and commission
income % Total income
x
Non interest income (€
mn)
14% 15%
21
Increased Non Interest Income as % of Total Income
x 48 54
50 49
(1) Comprising (a) Net FX gains / (losses) & Net gains/(losses) on other financial instruments, (b) Losses from revaluation and disposal of investment properties and (c ) other income.
(2) Excluding non-recurring fees of approximately €7 mn
1
48
Fee & commission income2 in Cyprus by business line
41
20 21 26
35
53
35 29 30
37
2013 - pre-Bail-in
2013 - post-Bail-in
2014 2015 2016
Incoming Payment Orders Outgoing Payment Orders
Payment Transactions are increasing
Average Number of Payment Transactions per month (thousands)
41%
33%
6%
7%
8% 1% 3%
InternationalBanking Services
Consumer
SME
Corporate
RRD
Wealth andManagement
Other
One third of IBS
fee &
commission
income
is driven by
Payment
Transactions
572
49
133
156
255
192
0
127
127
127
0
153
204
191
191
191
203
224
230
234
234
234
0
97
114
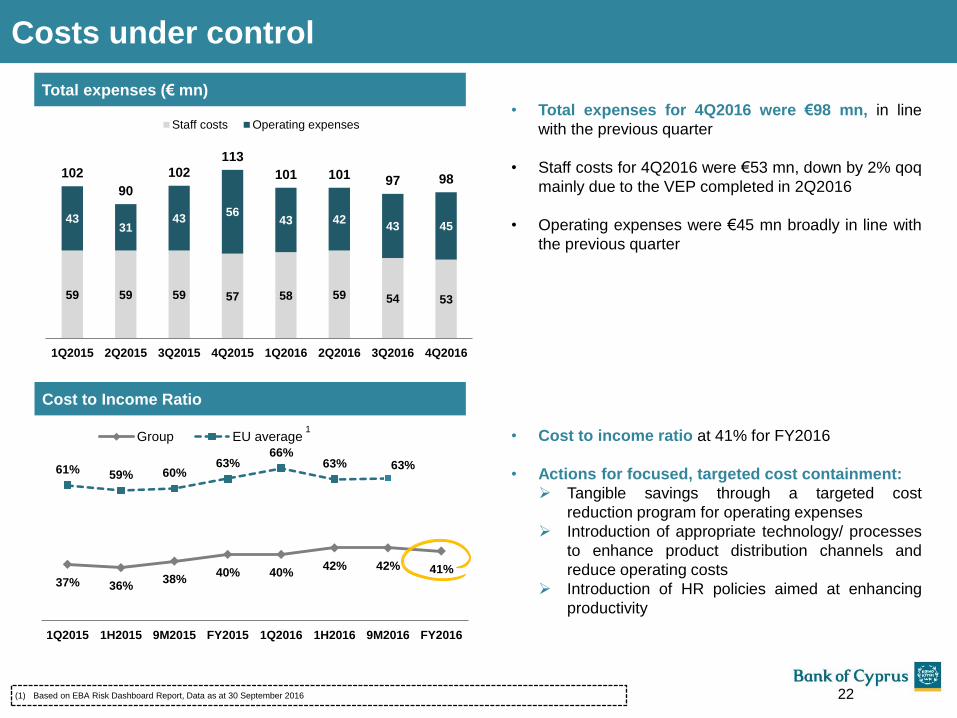
Cost to Income Ratio
Total expenses (€ mn)
• Total expenses for 4Q2016 were €98 mn, in line
with the previous quarter
• Staff costs for 4Q2016 were €53 mn, down by 2% qoq
mainly due to the VEP completed in 2Q2016
• Operating expenses were €45 mn broadly in line with
the previous quarter
• Cost to income ratio at 41% for FY2016
• Actions for focused, targeted cost containment:
Tangible savings through a targeted cost
reduction program for operating expenses
Introduction of appropriate technology/ processes
to enhance product distribution channels and
reduce operating costs
Introduction of HR policies aimed at enhancing
productivity
37% 36% 38%
40% 40% 42% 42% 41%
61% 59% 60% 63%
66% 63% 63%
1Q2015 1H2015 9M2015 FY2015 1Q2016 1H2016 9M2016 FY2016
Group EU average
59 59 59 57 58 59 54 53
43 31
43 56
43 42 43 45
102
90
102
113
101 101 97 98
1Q2015 2Q2015 3Q2015 4Q2015 1Q2016 2Q2016 3Q2016 4Q2016
Staff costs Operating expenses
Costs under control
(1) Based on EBA Risk Dashboard Report, Data as at 30 September 2016 22
1
49
133
156
255
192
0
127
127
127
0
153
204
191
191
191
203
224
230
234
234
234
0
97
114
Profitable Core Cypriot business
23 (1) Profit before provisions and impairments, gains/(losses) on loan derecognition and changes on expected cash flows, restructuring costs and discontinued operations.
(2) Excluding non-recurring fees of approximately €7 mn.
Stable NIM in Cyprus operations Healthy Cost to Income ratio for Cyprus
operations
386 369 367 366
359 349 332 335
1Q15 2Q15 3Q15 4Q15 1Q16 2Q16 3Q16 4Q16
FY15:
373 FY16:
344
35% 35% 35% 38%
40% 41% 40% 39%
1Q15 1H15 9M15 FY15 1Q16 1H16 9M16 FY16
153
232
-86
146
44 9 14
-12
2
-26
162
246
-98
148
18
Net interest income Total income Total expenses Profit before provisions andimpairments, restructuring
costs and discontinuedoperations
Profit after tax and beforeone off items
Cyprus operations
Rest of operations
Group
94% %
% contribution of
Cyprus operations
94% 88% 98% 245%
4Q2016 Cyprus Vs Group performance (€ mn)
(bps)
1
80% 77% 73% 74% 77% 75% 70% 68%
16% 13% 14% 15% 15% 17%
16% 20%
4% 10% 13% 11% 8% 8% 14% 12%
1Q15 2Q15 3Q15 4Q15 1Q16 2Q16 3Q16 4Q16
Net interest income
Fee and commission income
Other income
% of total income
Improving fee income as a % of revenues
2

49
133
156
255
192
0
127
127
127
0
153
204
191
191
191
203
224
230
234
234
234
0
97
114
Gross loans and customer deposits Loans by sector as at 31 December 2016
0,67 0,74
0,78 0,83
0,88 0,93
1,01 1,09
Mar 2015 Jun 2015 Sep 2015 Dec 2015 Mar 2016 Jun 2016 Sep 2016 Dec 2016
Expansion of BOC UK operations
81%
17%
1% 1%
Corporate
SMEs
Consumer credit
Housing
24
0,92 0,93 1,00 1,04
1,08 1,13
1,19 1,26
Mar 2015 Jun 2015 Sep 2015 Dec 2015 Mar 2016 Jun 2016 Sep 2016 Dec 2016
Gross loans (£ bn)
Customer deposits (£ bn)
3,9 6,0
FY2015 FY2016
Core operating profitability is rising
Operating profit (£ mn)
• Gross loans and customer deposits in the UK increased by 32% and 21% yoy to £1,09 bn and to £1,26 bn, respectively
• New lending of £370 mn during 2016
• Core operating profitability is rising, 54% increase yoy
• Loss after tax of £9,0 mn for the FY2016 primarily driven by legal and regulatory one off redress provision charges
Profit/(loss) after tax (£ mn)
3,6
(9,0)
FY2015 FY2016
Profit after tax
negatively affected by
legal and regulatory
one off redress
provision charges

49
133
156
255
192
0
127
127
127
0
153
204
191
191
191
203
224
230
234
234
234
0
97
114 Category
Key performance
indicators
Dec-
2015
Dec-
2016
Medium
Term
Targets
set in
2016
New
Medium
Term
Targets
Asset
quality
90+ DPD ratio 50% 41% <30% <20%
NPEs ratio 62% 55% <30%
NPEs coverage 39% 41% >50%
Provisioning charge 1 4,3% 1,7% <1,0% <1,0%
Funding Net Loans % Deposits 121% 95% 100%-120% 90%-110%
Capital Total Capital ratio 14,1% 14,8% >15%
Margins and
efficiency
Net interest margin 3,8% 3,5% ~3,00% ~3,00%
Fee and commission
income/total income 15% 17%3 >20% >20%
Cost to income ratio 39% 41% 40%-45% 40%-45%
Balance
Sheet Total assets €23,3 bn €22,2 bn >€25 bn >€25 bn
Significant Progress made on Group KPIs
Key Pillars & Plan of action
• Sustain momentum in restructuring
• Focus on recoveries portfolio – “accelerated consensual
foreclosures”
• Real estate management via REMU
1. Significantly
reduce
problem
loans
• Continue expansion of deposit franchise
• Increase loan pool for the Additional Credit Claim framework of
ECB
• Further diversify funding sources
2. Further
improveme
nt funding
structure;
• Targeted lending in Cyprus into promising sectors to fund
recovery
• New loan origination, while maintaining lending yields
• Revenue diversification via fee income from international
business, wealth, and insurance
• Carefully expand UK franchise by leveraging the UK subsidiary
3. Focus on
core
markets
• Tangible savings through a targeted reduction program
• Introduce technology/processes to improve distribution
channels and reduce costs
• HR policies aimed at enhancing productivity
4. Achieve a
lean
operating
model
• Deliver appropriate medium-term risk-adjusted returns
5. Deliver
returns
Well on track to meet targets set in 2016 – A clear plan of action to achieve new Medium Term Targets
(1) Post IFRS 9 impact
(2) That is Provisions for impairment of customer loans and gains /(losses) on derecognition of loans and changes in expected cash flows on acquired loans over average gross loans
(3) Excluding non-recurring fees of approximately €7 mn 25
49
133
156
255
192
0
127
127
127
0
153
204
191
191
191
203
224
230
234
234
234
0
97
114
• Key Milestones Achieved in January 2017; Listing on LSE and CSE, ELA fully repaid, successful issuance of €250 mn
Tier 2 Notes
• Satisfactory results this quarter reflecting our strategy of continued de-risking
• Leading position in a recovering economy
• 90+ DPD down by €459 mn or 5% qoq; down by €3,0 bn or 27% in FY2016
• Further NPE reduction of €867 mn or 7% qoq; €2,9 bn or 21% reduction during FY2016; Reduction in NPEs in 4Q2016
quarter of €867 mn was nearly double the in-quarter reduction of €459 mn in 90+ DPD
• Strong restructuring momentum continues with €6,2 bn1 of restructurings in FY2016
• Loans to Deposits ratio (L/D) at 95%; Customer deposits increased by €867 mn or 6% qoq and 16% yoy
• Pro forma Total Capital Ratio at c.16%2
• Strong operating profitability of €148 mn for 4Q2016 directed at increased provisions and impairment charges to faster
de-risk balance sheet
• Modest profitability of €64 mn for FY2016; €2 mn for 4Q2016
Key Takeaways
26 (1) Including Debt for asset swaps, write offs & non-contractual write offs
(2) Adjusted for the issuance of €250 mn Tier 2 Notes in January 2017 based on the preliminary Group financial results as at and for the year ended 31 December 2016.
49
133
156
255
192
0
127
127
127
0
153
204
191
191
191
203
224
230
234
234
234
0
97
114
Visit our website at: www.bankofcyprus.com
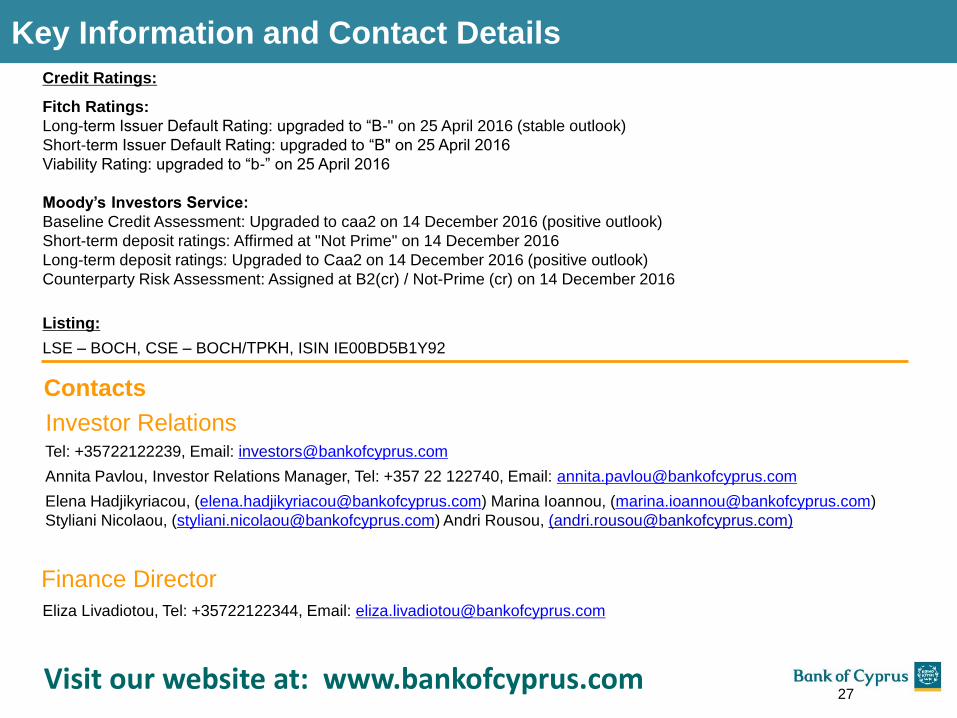
Credit Ratings:
Fitch Ratings:
Long-term Issuer Default Rating: upgraded to “B-" on 25 April 2016 (stable outlook)
Short-term Issuer Default Rating: upgraded to “B" on 25 April 2016
Viability Rating: upgraded to “b-” on 25 April 2016
Moody’s Investors Service:
Baseline Credit Assessment: Upgraded to caa2 on 14 December 2016 (positive outlook)
Short-term deposit ratings: Affirmed at "Not Prime" on 14 December 2016
Long-term deposit ratings: Upgraded to Caa2 on 14 December 2016 (positive outlook)
Counterparty Risk Assessment: Assigned at B2(cr) / Not-Prime (cr) on 14 December 2016
Listing:
LSE – BOCH, CSE – BOCH/ΤΡΚΗ, ISIN IE00BD5B1Y92
Tel: +35722122239, Email: [email protected]
Annita Pavlou, Investor Relations Manager, Tel: +357 22 122740, Email: [email protected]
Elena Hadjikyriacou, ([email protected]) Marina Ioannou, ([email protected])
Styliani Nicolaou, ([email protected]) Andri Rousou, ([email protected])
Investor Relations
Contacts
Finance Director
Eliza Livadiotou, Tel: +35722122344, Email: [email protected]
Key Information and Contact Details
27

49
133
156
255
192
0
127
127
127
0
153
204
191
191
191
203
224
230
234
234
234
0
97
114
Appendix – Macroeconomic overview
28
49
133
156
255
192
0
127
127
127
0
153
204
191
191
191
203
224
230
234
234
234
0
97
114
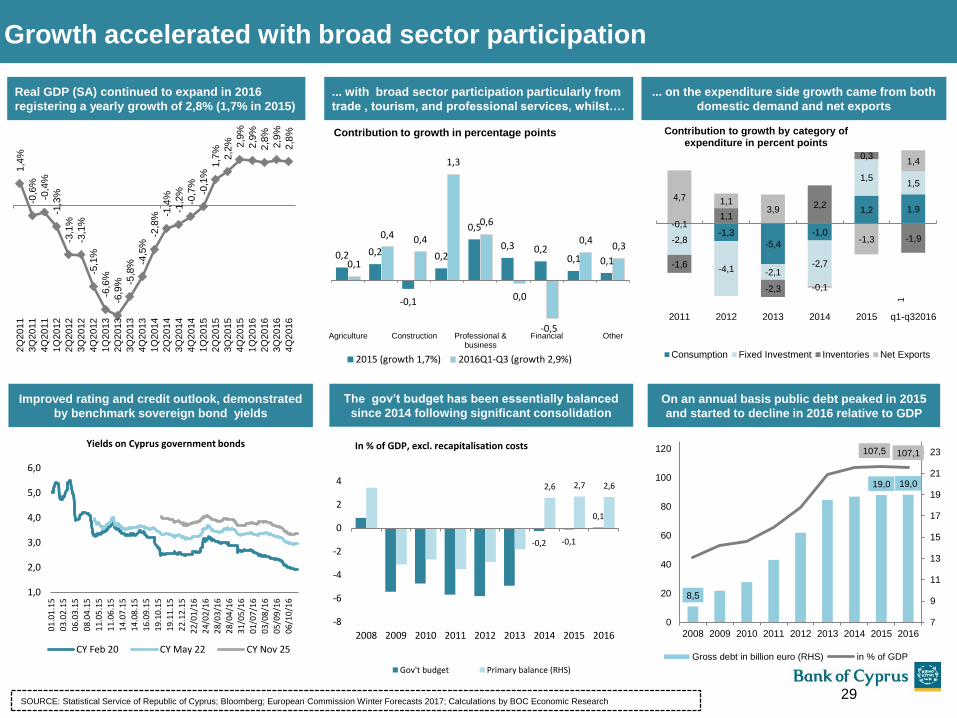
Improved rating and credit outlook, demonstrated
by benchmark sovereign bond yields
SOURCE: Statistical Service of Republic of Cyprus; Bloomberg; European Commission Winter Forecasts 2017; Calculations by BOC Economic Research 29
Real GDP (SA) continued to expand in 2016
registering a yearly growth of 2,8% (1,7% in 2015)
1,4
%
-0,6
%
-0,4
%
-1,3
%
-3,1
%
-3,1
%
-5,1
%
-6,6
%
-6,9
%
-5,8
%
-4,5
% -2
,8%
-1,4
%
-1,2
%
-0,7
%
-0,1
% 1
,7%
2,2
%
2,9
%
2,9
%
2,8
%
2,9
%
2,8
%
2Q
20
11
3Q
20
11
4Q
20
11
1Q
20
12
2Q
20
12
3Q
20
12
4Q
20
12
1Q
20
13
2Q
20
13
3Q
20
13
4Q
20
13
1Q
20
14
2Q
20
14
3Q
20
14
4Q
20
14
1Q
20
15
2Q
20
15
3Q
20
15
4Q
20
15
1Q
20
16
2Q
20
16
3Q
20
16
4Q
20
16
Growth accelerated with broad sector participation
1
... with broad sector participation particularly from
trade , tourism, and professional services, whilst….
... on the expenditure side growth came from both
domestic demand and net exports
0,2 0,2
-0,1
0,2
0,5
0,3 0,2 0,1 0,1 0,1
0,4 0,4
1,3
0,6
0,0
-0,5
0,4 0,3
Agriculture Construction Professional &business
Financial Other
Contribution to growth in percentage points
2015 (growth 1,7%) 2016Q1-Q3 (growth 2,9%)
-0,1 -1,3
-5,4
-1,0
1,2 1,9
-2,8
-4,1 -2,1 -2,7
1,5 1,5
-1,6
1,1
-2,3
2,2
0,3
-1,9
4,7 1,1 3,9
-0,1
-1,3
1,4
2011 2012 2013 2014 2015 q1-q32016
Contribution to growth by category of expenditure in percent points
Consumption Fixed Investment Inventories Net Exports
The gov’t budget has been essentially balanced
since 2014 following significant consolidation
On an annual basis public debt peaked in 2015
and started to decline in 2016 relative to GDP
8,5
19,0 19,0
107,5 107,1
7
9
11
13
15
17
19
21
23
0
20
40
60
80
100
120
2008 2009 2010 2011 2012 2013 2014 2015 2016
Gross debt in billion euro (RHS) in % of GDP
1,0
2,0
3,0
4,0
5,0
6,0
01.
01.1
5
03.
02.1
5
06.
03.1
5
08.
04.1
5
11.
05.1
5
11.
06.1
5
14.
07.1
5
14.
08.1
5
16.
09.1
5
19.
10.1
5
19.
11.1
5
22.
12.1
5
22/
01/1
6
24/
02/1
6
28/
03/1
6
28/
04/1
6
31/
05/1
6
01/
07/1
6
03/
08/1
6
05/
09/1
6
06/
10/1
6
Yields on Cyprus government bonds
CY Feb 20 CY May 22 CY Nov 25
-0,2 -0,1
0,1
2,6 2,7 2,6
-8
-6
-4
-2
0
2
4
2008 2009 2010 2011 2012 2013 2014 2015 2016
In % of GDP, excl. recapitalisation costs
Gov't budget Primary balance (RHS)

49
133
156
255
192
0
127
127
127
0
153
204
191
191
191
203
224
230
234
234
234
0
97
114
30 SOURCES: Statistical Service of Republic of Cyprus, Eurostat; Calculations by BOC Economic Research
Key economic sectors are performing well
The unemployment rate peaked in 2013Q4 at 16,6% SA and dropped to 12,8%
in 2016Q2 rising to 14,1% in 2016Q4
96,2
100,0
90,3
91,7 6,6
10,3
16,6 16,5
12,8
13,1
14,1
84,0
86,0
88,0
90,0
92,0
94,0
96,0
98,0
100,0
102,0
0,0
2,0
4,0
6,0
8,0
10,0
12,0
14,0
16,0
18,0
20
10
Q1
20
10
Q2
20
10
Q3
20
10
Q4
20
11
Q1
20
11
Q2
20
11
Q3
20
11
Q4
20
12
Q1
20
12
Q2
20
12
Q3
20
12
Q4
20
13
Q1
20
13
Q2
20
13
Q3
20
13
Q4
20
14
Q1
20
14
Q2
20
14
Q3
20
14
Q4
20
15
Q1
20
15
Q2
20
15
Q3
20
15
Q4
20
16
Q1
20
16
Q2
20
16
Q3
20
16
Q4
Employment Index 4Q averages SA 2011Q2=100 (RHS)
Unemployment rate SA %
... were the rebound has been relatively uniform across sectors with the total
production index up by 8,4% year-on-year in January-November
Industrial production bottomed in February 2014 on a 12 month basis, from a
peak in 2008, and has been rising since ...
95,6
64,9
72,7
7,1
30
40
50
60
70
80
90
100
110
120
130
-25
-20
-15
-10
-5
0
5
10
15
02
.09
05
.09
08
.09
11
.09
02
.10
05
.10
08
.10
11
.10
02
.11
05
.11
08
.11
11
.11
02
.12
05
.12
08
.12
11
.12
02
.13
05
.13
08
.13
11
.13
02
.14
05
.14
08
.14
11
.14
02
.15
05
.15
08
.15
11
.15
02
.16
05
.16
08
.16
11
.16
Total Industrial production
100=Oct 2008 of 12 m. Av. (RHS) % change y-o-y 12 month averages
-10,1
-13,4
-0,1
3,4
8,4
-10,3
-14,1
-1,2
3,6
7,2
-4,2
-9,2
1,0 4,0
6,6
-15,2 -12,9
12,3
-2,0
24,3
2012 2013 2014 2015 2016Jan-Nov
Industrial production by sector: % change year-on-year
Total Industry Manufacturing Electricity Water
In construction the main frequency indices have turned up in 2016
36,1 40,8
29,9
100,0
21,3 23,4 27,7
0,0
20,0
40,0
60,0
80,0
100,0
120,0
20
04
Q1
20
04
Q3
20
05
Q1
20
05
Q3
20
06
Q1
20
06
Q3
20
07
Q1
20
07
Q3
20
08
Q1
20
08
Q3
20
09
Q1
20
09
Q3
20
10
Q1
20
10
Q3
20
11
Q1
20
11
Q3
20
12
Q1
20
12
Q3
20
13
Q1
20
13
Q3
20
14
Q1
20
14
Q3
20
15
Q1
20
15
Q3
20
16
Q1
20
16
Q3
Index 100=2008Q3 of 4Q moving averages/sums
Production Index Local sales of cement Volume of building permits

49
133
156
255
192
0
127
127
127
0
153
204
191
191
191
203
224
230
234
234
234
0
97
114
Tourism is expanding & Residential Property Index is stabilising
31 SOURCES: Statistical Service of Republic of Cyprus; Central Bank of Cyprus; Eurostat; RICS-Cyprus; Calculations by BOC Economic Research
Tourist activity accelerated in 2016 with total arrivals up 19,8% in the year
driven by a 48,9% increase from Russia and 11,2% from the UK
The distribution of tourist arrivals has been shifting over time with the UK
now at 36,3% and Russia at 24,5% of total arrivals
3,0
-2,4
1,5
8,9
19,8
3,2
-3,0
0,2
7,2
19,4
-6,0 -7,1 -2,2
19,5
11,2
42,0
28,3
4,6
-17,6
48,9
8,7 8,0
-2,8
4,4
12,3
2012 2013 2014 2015 2016
Arrivals: % change year-on-year
Total Arrivals Europe UK Russia Receipts
58,5
37,1 35,7 39,2 36,3
5,6
4,1 3,5 4,2
3,9
4,6
25,3 26,1 19,7 24,5
4,8 4,4 4,1 5,2 5,0
21,2 22,6 22,8 22,4 20,7
5,3 6,6 7,8 9,2 9,6
2003 2013 2014 2015 2016
UK Germany Russia Greece Other Europe Non-Europe
Residential property prices have started to rise year-on-year in some index
series
Residential property prices declined by a cumulative 32% from their peak in
2008Q3 and started to stabilise from the second half of 2015
100,0
68,0 68,0
-1,8
-1,7
-1,3
60,0
65,0
70,0
75,0
80,0
85,0
90,0
95,0
100,0
105,0
110,0
-15
-10
-5
0
5
10
15
20
Q3.0
8
Q4.0
8
Q1.0
9
Q2.0
9
Q3.0
9
Q4.0
9
Q1.1
0
Q2.1
0
Q3.1
0
Q4.1
0
Q1.1
1
Q2.1
1
Q3.1
1
Q4.1
1
Q1.1
2
Q2.1
2
Q3.1
2
Q4.1
2
Q1.1
3
Q2.1
3
Q3.1
3
Q4.1
3
Q1.1
4
Q2.1
4
Q3.1
4
Q4.1
4
Q1.1
5
Q2.1
5
Q3.1
5
Q4.1
5
Q1.1
6
Q2.1
6
Q3.1
6CBC Residential Property Price Index (Rebased to 2008Q3)
100=2008Q4 of 4Q moving averages (RHS) RPPI % change y-o-y
-1,3
-3,3
0,5
1,1
-20,0
-15,0
-10,0
-5,0
0,0
5,0
10,0
15,0
20,0
25,0
20
08
Q2
20
08
Q3
20
08
Q4
20
09
Q1
20
09
Q2
20
09
Q3
20
09
Q4
20
10
Q1
20
10
Q2
20
10
Q3
20
10
Q4
20
11
Q1
20
11
Q2
20
11
Q3
20
11
Q4
20
12
Q1
20
12
Q2
20
12
Q3
20
12
Q4
20
13
Q1
20
13
Q2
20
13
Q3
20
13
Q4
20
14
Q1
20
14
Q2
20
14
Q3
20
14
Q4
20
15
Q1
20
15
Q2
20
15
Q3
20
15
Q4
20
16
Q1
20
16
Q2
20
16
Q3
Residential property prices: RPPI (CBC); HPI (Eurostat); RICS
RPPI HPI RICS-Apartments RICS-Houses
49
133
156
255
192
0
127
127
127
0
153
204
191
191
191
203
224
230
234
234
234
0
97
114
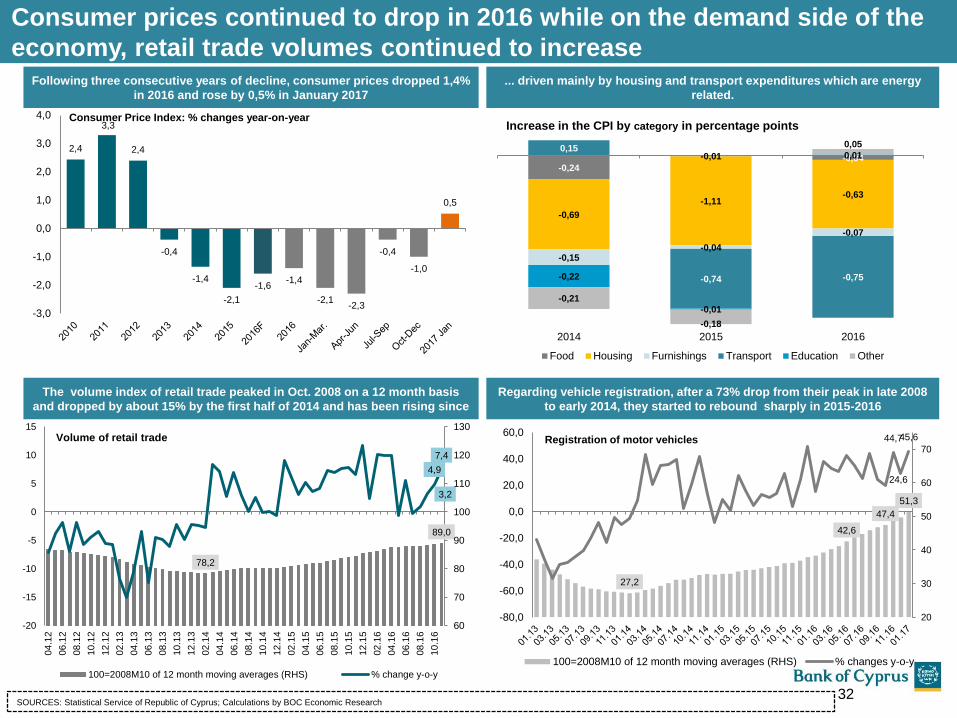
Consumer prices continued to drop in 2016 while on the demand side of the
economy, retail trade volumes continued to increase
32 SOURCES: Statistical Service of Republic of Cyprus; Calculations by BOC Economic Research
The volume index of retail trade peaked in Oct. 2008 on a 12 month basis
and dropped by about 15% by the first half of 2014 and has been rising since
Regarding vehicle registration, after a 73% drop from their peak in late 2008
to early 2014, they started to rebound sharply in 2015-2016
78,2
89,0
3,2
4,9
7,4
60
70
80
90
100
110
120
130
-20
-15
-10
-5
0
5
10
15
04
.12
06
.12
08
.12
10
.12
12
.12
02
.13
04
.13
06
.13
08
.13
10
.13
12
.13
02
.14
04
.14
06
.14
08
.14
10
.14
12
.14
02
.15
04
.15
06
.15
08
.15
10
.15
12
.15
02
.16
04
.16
06
.16
08
.16
10
.16
Volume of retail trade
100=2008M10 of 12 month moving averages (RHS) % change y-o-y
27,2
42,6
47,4
51,3
24,6
44,7 45,6
20
30
40
50
60
70
-80,0
-60,0
-40,0
-20,0
0,0
20,0
40,0
60,0Registration of motor vehicles
100=2008M10 of 12 month moving averages (RHS) % changes y-o-y
... driven mainly by housing and transport expenditures which are energy
related.
Following three consecutive years of decline, consumer prices dropped 1,4%
in 2016 and rose by 0,5% in January 2017
2,4
3,3
2,4
-0,4
-1,4
-2,1
-1,6 -1,4
-2,1 -2,3
-0,4
-1,0
0,5
-3,0
-2,0
-1,0
0,0
1,0
2,0
3,0
4,0 Consumer Price Index: % changes year-on-year
-0,24
-0,01 -0,04
-0,69
-1,11 -0,63
-0,15 -0,04
-0,07
0,15
-0,74 -0,75 -0,22
-0,01
0,01
-0,21
-0,18
0,05
2014 2015 2016
Increase in the CPI by category in percentage points
Food Housing Furnishings Transport Education Other

49
133
156
255
192
0
127
127
127
0
153
204
191
191
191
203
224
230
234
234
234
0
97
114
Appendix – Additional financial information
33
49
133
156
255
192
0
127
127
127
0
153
204
191
191
191
203
224
230
234
234
234
0
97
114
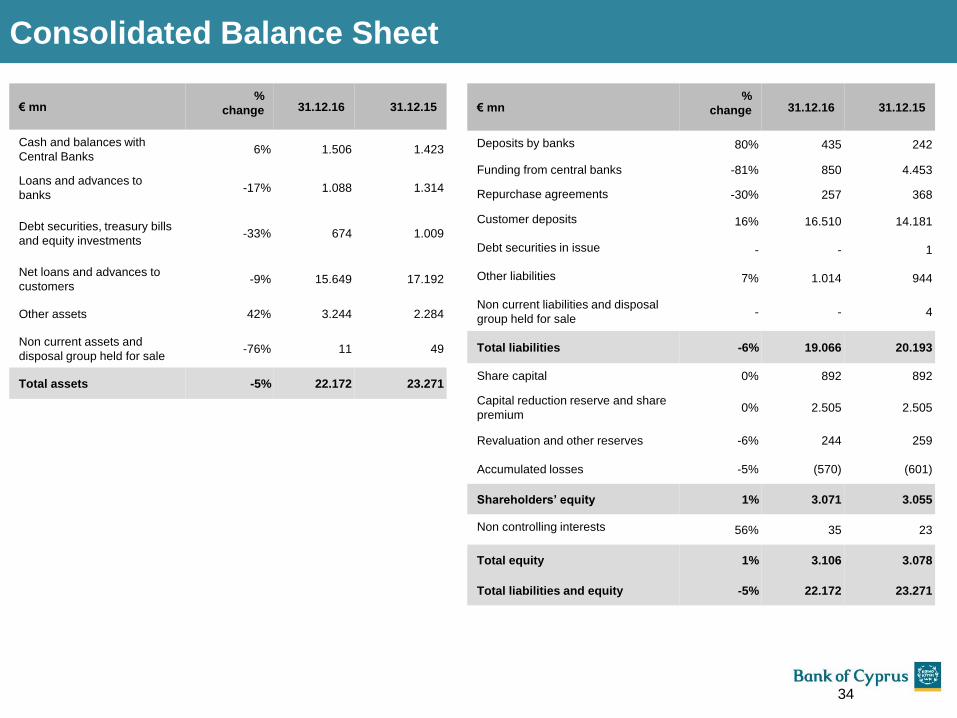
€ mn %
change 31.12.16 31.12.15
Cash and balances with
Central Banks 6% 1.506 1.423
Loans and advances to
banks -17% 1.088 1.314
Debt securities, treasury bills
and equity investments -33% 674 1.009
Net loans and advances to
customers -9% 15.649 17.192
Other assets 42% 3.244 2.284
Non current assets and
disposal group held for sale -76% 11 49
Total assets -5% 22.172 23.271
€ mn %
change 31.12.16 31.12.15
Deposits by banks 80% 435 242
Funding from central banks -81% 850 4.453
Repurchase agreements -30% 257 368
Customer deposits 16% 16.510 14.181
Debt securities in issue - - 1
Other liabilities 7% 1.014 944
Non current liabilities and disposal
group held for sale - - 4
Total liabilities -6% 19.066 20.193
Share capital 0% 892 892
Capital reduction reserve and share
premium 0% 2.505 2.505
Revaluation and other reserves -6% 244 259
Accumulated losses -5% (570) (601)
Shareholders’ equity 1% 3.071 3.055
Non controlling interests 56% 35 23
Total equity 1% 3.106 3.078
Total liabilities and equity -5% 22.172 23.271
Consolidated Balance Sheet
34

49
133
156
255
192
0
127
127
127
0
153
204
191
191
191
203
224
230
234
234
234
0
97
114
€ mn FY2016 FY2015 yoy
+% 4Q2016 3Q2016
qoq
+% 2Q2016 1Q2016
Net interest income 686 842 -19% 162 164 -1% 175 185
Net fee and commission income 167 154 9% 55 38 43% 38 36
Insurance income net of insurance claims 44 48 -7% 9 10 -3% 11 14
Core income 897 1.044 -14% 226 212 7% 224 235
Other income 66 (4) - 20 23 -10% 14 9
Total income 963 1.040 -7% 246 235 5% 238 244
Total expenses (397) (408) -3% (98) (97) 1% (101) (101)
Profit before provisions and impairments1 566 632 -10% 148 138 8% 137 143
Provisions for impairment of customer loans net of gains/(losses)
on derecognition of loans and changes in expected cash flows (370) (959) -61% (103) (109) -5% (96) (62)
Impairments of other financial and non financial assets (47) (62) -23% (13) (12) 12% (14) (8)
Provision for litigation and regulatory matters (18) (8) 135% (18) - - (2) 2
Share of profit from associates and joint ventures 8 6 38% 5 1 216% 1 1
Profit/(loss) before tax, restructuring costs and discontinued
operations 139 (391) - 19 18 3% 26 76
Tax (16) (9) 84% (1) (4) -87% (4) (8)
(Loss)/profit attributable to non-controlling interests (4) 6 - - 2 - (5) (1)
Profit/(loss) after tax from continuing operations2 119 (394) - 18 16 11% 17 67
Advisory, VEP and other restructuring costs3 (114) (43) 165% (16) (11) 47% (70) (17)
Loss from disposal group held for sale/discontinued operations - (38) - - - - - -
Net gain on disposal of non-core assets 59 37 62% - 0 - 59 -
Profit/(loss) after tax 64 (438) - 2 5 -61% 6 50
Net interest margin 3,47% 3,79% -32bps 3,37% 3,35% +2bps 3,55% 3,63%
Cost-to-Income ratio 41% 39% +2p.p. 40% 41% -1p.p. 43% 41%
(1) Profit before provisions and impairments, gains/(losses) on derecognition and changes on expected cash flows, restructuring costs and discontinued operations.
(2) Profit after tax and before restructuring costs, discontinued operations and net profit on disposal of non-core assets. (3) Advisory, VEP and other restructuring costs comprise mainly: 1) fees of external advisors in relation to: (i) disposal of operations (ii) customer loan restructuring activities which are not part of the
effective interest rate and (iii) the contemplated listing on the London stock exchange and 2) voluntary exit plan cost.
Income Statement Review
4
35

49
133
156
255
192
0
127
127
127
0
153
204
191
191
191
203
224
230
234
234
234
0
97
114
Group Income Statement Highlights (€ mn)
253
-113
140
244
-101
143
-62
50
238
-101
137
-96
6
235
-97
138
-109
5
246
-98
148
-103
2
Total Income Total Expenses Profit before impairmentsrestructuring costs anddiscontinued operations
Provisions for impairment ofcustomer loans and
gains/(losses) on loanderecognition and changes in
expected cash flows
Profit/(loss) after tax
4Q2015 1Q2016 2Q2016 3Q2016 4Q2016
1 -630 -512
Good underlying profitability continues in 4Q2016
(1) Profit before provisions and impairments, gains/(losses) on loan derecognition and changes on expected cash flows, restructuring costs and discontinued operations.
(2) RoTE and RoAA are on an annualised basis.
-1,7%
6,7%
0,9%
3,8%
0,5%
2,8%
0,4%
2,2%
0,3%
-9,0%-8,0%-7,0%-6,0%-5,0%-4,0%-3,0%-2,0%-1,0%0,0%1,0%2,0%3,0%4,0%5,0%6,0%7,0%8,0%
Return on Tangible Equity Return on Average Assets
FY2015 1Q2016 1H2016 9M2016 FY2016
-14,9%
2 2
Return on Tangible Equity (RoTE) (%) & Return on Average Assets (RoAA)
36

49
133
156
255
192
0
127
127
127
0
153
204
191
191
191
203
224
230
234
234
234
0
97
114
€ mn Per presentation Reclassification Per financial
statements
Net interest income 686 - 686
Net fee and commission income 167 - 167
Net foreign exchange gains and net gains on other financial instruments 48 59 107
Insurance income net of insurance claims 44 - 44
Gains/(losses) from revaluations/disposals of investment properties 6 (1) 5
Losses on disposal of stock properties - 1 1
Other income 12 3 15
Total income 963 62 1.025
Total expenses (397) (133) (530)
Profit before provisions and impairments, gains/(losses) on derecognition of loans and
changes in expected cash flows, restructuring costs and discontinued operations 566 (71) 495
Provisions for impairment of customer loans (433) - (433)
Gains on derecognition of loans and changes in expected cash flows 63 - 63
Impairments of other financial and non-financial assets (47) - (47)
Provision for litigation and regulatory matters (18) 18 -
Share of profit from associates 8 - 8
Profit before tax, restructuring costs and discontinued operations 139 (53) 86
Tax (16) (2) (18)
Loss attributable to non-controlling interests (4) - (4)
Profit after tax and before restructuring costs, discontinued operations and net profit from
disposal of non-core assets 119 (55) 64
Advisory, VEP and other restructuring costs1 (114) 114 -
Net gain on disposal of non-core assets 59 (59) -
Profit after tax 64 - 64
Income Statement bridge for FY2016
(1) Advisory, VEP and other restructuring costs comprise mainly: 1) fees of external advisors in relation to: (i) disposal of operations (ii) customer loan restructuring activities which are not part of the effective
interest rate and (iii) the contemplated listing on the London stock exchange and 2) voluntary exit plan cost.
37
49
133
156
255
192
0
127
127
127
0
153
204
191
191
191
203
224
230
234
234
234
0
97
114
€ mn Consumer
Banking
SME
Banking
Corporate
Banking
International
Banking
Wealth &
Brokerage &
Asset
Management
RRD REMU Insurance Other Total
Cyprus
Net interest income 247 62 81 62 11 202 (13) - (9) 643
Net fee & commission income 46 9 10 65 2 12 - (4) 19 159
Other income 5 1 1 7 4 1 4 44 26 93
Total income 298 72 92 134 17 215 (9) 40 36 895
Total expenses (117) (11) (11) (23) (4) (33) (9) (14) (131) (353)
Profit/(loss) before provisions
and impairments 181 61 81 111 13 182 (18) 26 (95) 542
Provisions for impairment of
customer loans net of
gains/(losses) on derecognition
of loans and changes in
expected cash flows
19 (11) (33) (6) (1) (286) - - 1 (317)
Impairment of other financial
and non financial assets - - - - - - (20) - (15) (35)
Provision for litigation and
regulatory matters - - - - - - - - (3) (3)
Share of profits from associates - - - - - - - - 8 8
Profit/(loss) before tax 200 50 48 105 12 (104) (38) 26 (104) 195
Tax (22) (6) (6) (13) (1) 16 5 (3) 13 (17)
Profit attributable to non
controlling interest - - - - - - - - (4) (4)
Profit/(loss) after tax and
before one off items 178 44 42 92 11 (88) (33) 23 (95) 174
Cyprus: Income Statement by business line for FY2016
38
49
133
156
255
192
0
127
127
127
0
153
204
191
191
191
203
224
230
234
234
234
0
97
114
Risk Weighted Assets – Regulatory Capital
Equity and Regulatory Capital (€ mn)
31.12.15 31.03.16 30.06.16 30.09.16 31.12.16
Shareholders‟ equity 3.055 3.101 3.054 3.063 3.071
CET1 capital 2.748 2.769 2.735 2.736 2.7653
Tier I capital 2.748 2.769 2.735 2.736 2.765
Tier II capital 30 20 21 21 21
Total regulatory capital
(Tier I + Tier II) 2.778 2.789 2.756 2.757 2.786
`
39
(1) The increase in Russia RWA is due to one off regulatory adjustments on operational risk in relation to disposed operations where permission to exclude it received from regulators early January
2017
(2) Other countries primarily relates to exposures in Channel Islands
(3) Transitional basis; Includes profits for the year ended 31 December 2016 that have been neither audited nor reviewed, by the Group‟s external auditors.
Risk weighted assets by type of risk (€ mn)
31.12.15 31.03.16 30.06.16 30.09.16 31.12.16
Credit risk 17.618 17.326 16.921 16.747 16.859
Market risk 8 8 7 6 6
Operational risk 2.040 2.040 2.040 2.050 1.997
Total 19.666 19.374 18.968 18.803 18.863
Risk weighted assets by Geography (€ mn)
31.12.15 31.03.16 30.06.16 30.09.16 31.12.16
Cyprus 18.438 18.276 17.845 17.675 17.552
Russia 21 25 16 15 1451
United Kingdom 685 650 695 725 784
Romania 269 198 195 205 182
Greece 208 182 176 140 190
Other2 45 43 41 43 10
Total RWA 19.666 19.374 18.968 18.803 18.863
RWA intensity(%) 85% 85% 84% 84% 85%
€ mn 31.12.16
Group Equity per financial statements 3.106
Less: Intangibles and other deductions (20)
Less: Deconsolidation of insurance and other entities (198)
Less: Regulatory adjustments (DTA and other items) (69)
Less: Revaluation reserves and other unrealised items transferred to
Tier II (54)
CET 1 (transitional) 2.765
Less: Adjustments to fully loaded (mainly DTA) (151)
CET 1 (fully loaded) 2.614
Risk Weighted Assets 18.863
CET 1 ratio (fully loaded) 13,9%
CET 1 ratio (transitional)3 14,7%
Reconciliation of Group Equity to CET 1

49
133
156
255
192
0
127
127
127
0
153
204
191
191
191
203
224
230
234
234
234
0
97
114
BOC - Main performance indicators
Ratios Group FY2016
Performance
ROAA (annualised) 0,3%
ROTE (annualised) 2,2%
Net Interest Margin 3,47%
Cost to income ratio 41%
Loans to deposits 95%
Asset Quality
90+ DPD / 90+ DPD ratio €8.309 mn (41%)
90+ DPD coverage 54%
Cost of risk (annualised) 1,7%1
Provisions / Gross Loans 22,4%
Capital
Transitional Common Equity Tier 1 capital 2.765
CET1 ratio (transitional basis) 14,7%
Total Shareholders‟ Equity / Total Assets 13,9%
(1) Provisions for impairment of customer loans and gains/(losses) on derecognition of loans and changes in expected cash flows
0,388 0,392 0,393 0,394 0,342 0,348 0,342 0,343 0,344
0,374 0,378 0,379 0,380
0,327 0,332 0,327 0,327 0,328
Dec-2014 Mar-2015 Jun-2015 Sep-2015 Dec-2015 Mar-2016 Jun-2016 Sep-2016 Dec-2016
Book Value per share (€) Tangible Book Value per share (€)
Book value evolution
40
49
133
156
255
192
0
127
127
127
0
153
204
191
191
191
203
224
230
234
234
234
0
97
114
Reduction in Overseas Non-Core Exposures
Overseas non-core exposures (€ mn)
The non-core overseas exposures at 31 December 2016 were as
follows:
Greece: Net exposure comprised:
a. Net on-balance sheet exposures (excluding foreclosed
properties) totalling €17 mn;
b. 634 foreclosed properties with a book value of €153 mn;
c. off-balance sheet exposures of €113 mn; and
d. lending exposures to Greek entities in the normal course
of business in Cyprus of €82 mn, and lending exposures
in Cyprus with collaterals in Greece of €107 mn.
Romania: Overall net exposure of €206 mn
Serbia: Overall net exposure of €42 mn, in line with the previous
quarter
Russia: Remaining net exposure (on and off balance sheet) in
Russia is further reduced to €44 mn during 4Q2016
(1) Lending exposures to Greek entities in the normal course of business in Cyprus and lending exposures in Cyprus with collaterals in Greece
120 114 119 45 45 44
354 312 274
262 221 206
54
54 54
42
42 42
192
173 168
164
161 153
49
22
16
13
12 17
132
131
122
119
115 113
139
151
158
225
225
189
1040
957
911
870
821
764
Sep 2015 Dec 2015 Mar 2016 Jun 2016 Sep 2016 Dec 2016
Russia: Net exposure Romania: Net exposure
Serbia Greece Foreclosed Properties
Greece net on balance sheet exposure Greece net off balance sheet exposure
Greece other¹
472
512
477
464
521
41
513
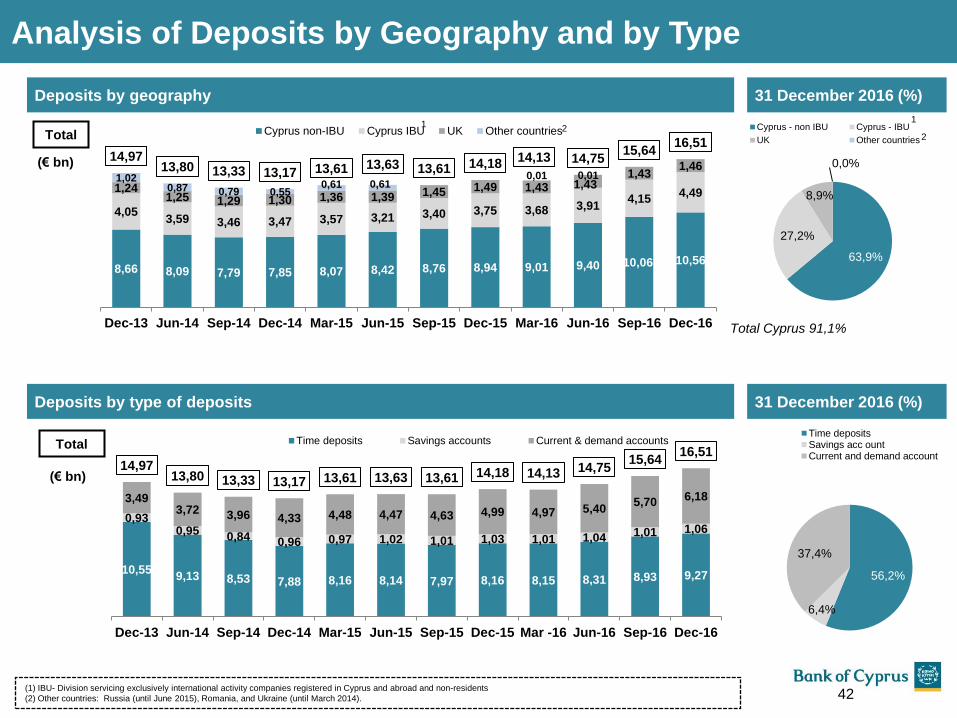
49
133
156
255
192
0
127
127
127
0
153
204
191
191
191
203
224
230
234
234
234
0
97
114
8,66 8,09 7,79 7,85 8,07 8,42 8,76 8,94 9,01 9,40 10,06 10,56
4,05 3,59 3,46 3,47 3,57 3,21 3,40 3,75 3,68 3,91
4,15 4,49 1,24
1,25 1,29 1,30 1,36 1,39 1,45 1,49 1,43 1,43 1,43
1,46 1,02
0,87 0,79 0,55 0,61 0,61
0,01 0,01
14,97 13,80 13,33 13,17 13,61 13,63 13,61 14,18
14,13 14,75 15,64
16,51
Dec-13 Jun-14 Sep-14 Dec-14 Mar-15 Jun-15 Sep-15 Dec-15 Mar-16 Jun-16 Sep-16 Dec-16
Cyprus non-IBU Cyprus IBU UK Other countriesTotal
(€ bn)
(1) IBU- Division servicing exclusively international activity companies registered in Cyprus and abroad and non-residents
(2) Other countries: Russia (until June 2015), Romania, and Ukraine (until March 2014).
Deposits by geography
Analysis of Deposits by Geography and by Type
31 December 2016 (%)
63,9%
27,2%
8,9%
0,0%
Cyprus - non IBU Cyprus - IBU
UK Other countries
Total Cyprus 91,1%
1
2
10,55 9,13 8,53 7,88 8,16 8,14 7,97 8,16 8,15 8,31 8,93 9,27
0,93 0,95
0,84 0,96 0,97 1,02 1,01 1,03 1,01 1,04 1,01 1,06
3,49 3,72 3,96 4,33 4,48 4,47 4,63 4,99 4,97 5,40
5,70 6,18
14,97 13,80 13,33 13,17 13,61 13,63 13,61 14,18 14,13 14,75
15,64 16,51
Dec-13 Jun-14 Sep-14 Dec-14 Mar-15 Jun-15 Sep-15 Dec-15 Mar -16 Jun-16 Sep-16 Dec-16
Time deposits Savings accounts Current & demand accountsTotal
(€ bn)
Deposits by type of deposits 31 December 2016 (%)
56,2%
6,4%
37,4%
Time depositsSavings acc ountCurrent and demand account
1 2
42

49
133
156
255
192
0
127
127
127
0
153
204
191
191
191
203
224
230
234
234
234
0
97
114
21,20 21,32 21,19 20,98 20,66 19,98 19,27 18,77 18,27
0,91 1,03 1,13 1,14 1,21 1,17 1,18 1,23 1,30
1,66 1,74 1,61 0,75 0,72 0,70 0,63 0,60
0,56
23,77 24,09 23,93 22,86 22,59 21,85 21,08 20,60 20,13
Dec-14 Mar-15 Jun-15 Sep-15 Dec-15 Mar-16 Jun-16 Sep-16 Dec-16
Othercountries
UK
Cyprus
1
Total
(€ bn)
Gross loans by geography
Gross loans by Geography and by Customer Type
90,8%
6,4% 2,8%
Cyprus UK Other countries1
11,83 12,10 12,03 11,56 11,42 10,77 10,13 9,78 9,47
5,09 5,02 4,99 4,75 4,68 4,65 4,55 4,47 4,35
4,41 4,43 4,39 4,35 4,31 4,28 4,27 4,24 4,22
2,44 2,54 2,52 2,20 2,18 2,16 2,13 2,11 2,09
23,77 24,09 23,93 22,86 22,59 21,85 21,08 20,60 20,13
Dec-14 Mar-15 Jun-15 Sep-15 Dec-15 Mar-16 Jun-16 Sep-16 Dec-16
Retail other
RetailHousing
SMEs
Corporate
(€ bn)
Total
47,1%
21,6%
20,9%
10,4%
Corporate SME
Retail Housing Retail Other
31 December 2016 (%)
31 December 2016 (%) Gross loans by customer type
43 (1) Other countries: Russia (until June 2015) and Romania
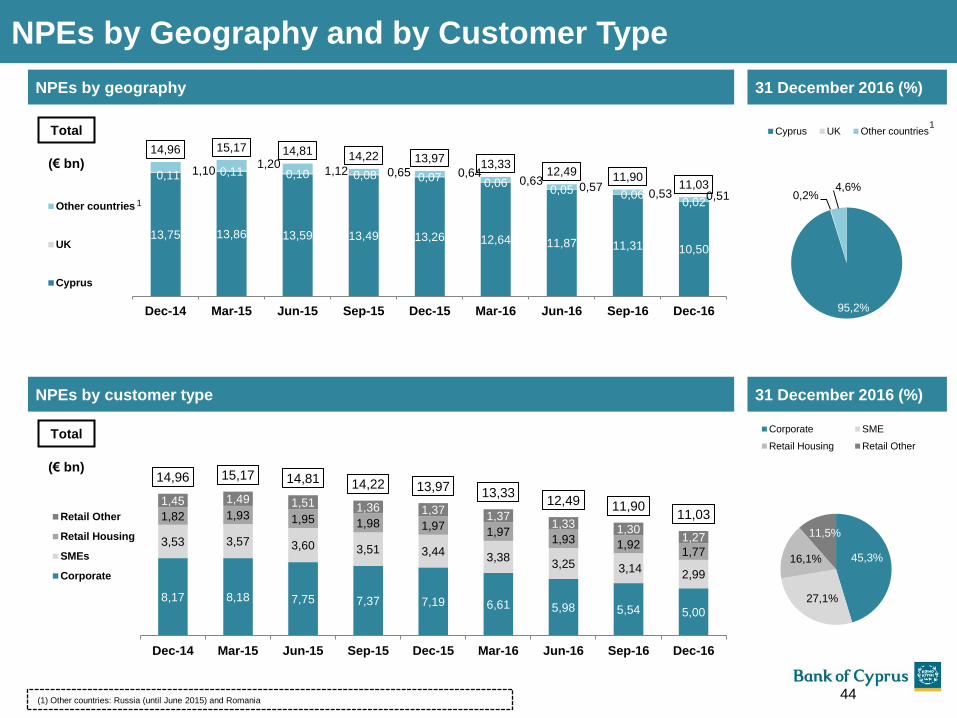
49
133
156
255
192
0
127
127
127
0
153
204
191
191
191
203
224
230
234
234
234
0
97
114
13,75 13,86 13,59 13,49 13,26 12,64 11,87 11,31 10,50
0,11 0,11 0,10 0,08 0,07 0,06 0,05 0,06
0,02
1,10 1,20
1,12 0,65 0,64 0,63
0,57 0,53 0,51
14,96 15,17 14,81 14,22 13,97 13,33
12,49 11,90 11,03
Dec-14 Mar-15 Jun-15 Sep-15 Dec-15 Mar-16 Jun-16 Sep-16 Dec-16
Other countries
UK
Cyprus
1
Total
(€ bn)
(1) Other countries: Russia (until June 2015) and Romania
NPEs by geography
NPEs by Geography and by Customer Type
95,2%
0,2% 4,6%
Cyprus UK Other countries1
45,3%
27,1%
16,1%
11,5%
Corporate SME
Retail Housing Retail Other
31 December 2016 (%)
31 December 2016 (%) NPEs by customer type
8,17 8,18 7,75 7,37 7,19 6,61 5,98 5,54 5,00
3,53 3,57 3,60 3,51 3,44 3,38
3,25 3,14 2,99
1,82 1,93 1,95 1,98 1,97 1,97
1,93 1,92 1,77
1,45 1,49 1,51 1,36 1,37 1,37
1,33 1,30 1,27
14,96 15,17 14,81 14,22 13,97 13,33 12,49 11,90
11,03
Dec-14 Mar-15 Jun-15 Sep-15 Dec-15 Mar-16 Jun-16 Sep-16 Dec-16
Retail Other
Retail Housing
SMEs
Corporate
Total
(€ bn)
44
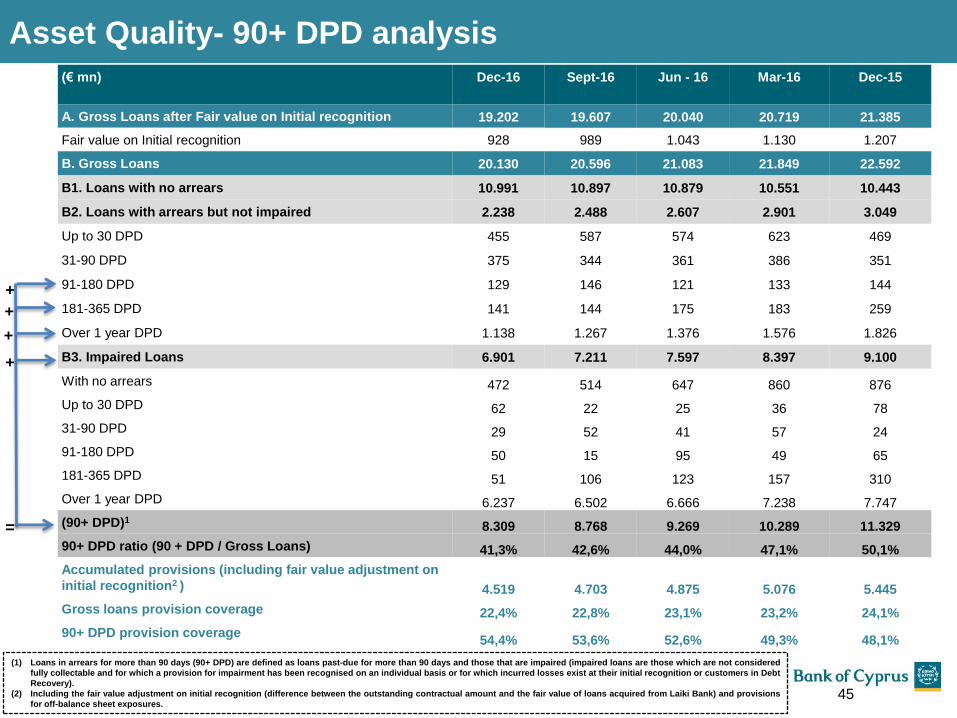
49
133
156
255
192
0
127
127
127
0
153
204
191
191
191
203
224
230
234
234
234
0
97
114
Asset Quality- 90+ DPD analysis
(€ mn) Dec-16
Sept-16 Jun - 16 Mar-16 Dec-15
A. Gross Loans after Fair value on Initial recognition 19.202 19.607 20.040 20.719 21.385
Fair value on Initial recognition 928 989 1.043 1.130 1.207
B. Gross Loans 20.130 20.596 21.083 21.849 22.592
B1. Loans with no arrears 10.991 10.897 10.879 10.551 10.443
B2. Loans with arrears but not impaired 2.238 2.488 2.607 2.901 3.049
Up to 30 DPD 455 587 574 623 469
31-90 DPD 375 344 361 386 351
91-180 DPD 129 146 121 133 144
181-365 DPD 141 144 175 183 259
Over 1 year DPD 1.138 1.267 1.376 1.576 1.826
B3. Impaired Loans 6.901 7.211 7.597 8.397 9.100
With no arrears 472 514 647 860 876
Up to 30 DPD 62 22 25 36 78
31-90 DPD 29 52 41 57 24
91-180 DPD 50 15 95 49 65
181-365 DPD 51 106 123 157 310
Over 1 year DPD 6.237 6.502 6.666 7.238 7.747
(90+ DPD)1 8.309 8.768 9.269 10.289 11.329
90+ DPD ratio (90 + DPD / Gross Loans) 41,3% 42,6% 44,0% 47,1% 50,1%
Accumulated provisions (including fair value adjustment on
initial recognition2 ) 4.519 4.703 4.875 5.076 5.445
Gross loans provision coverage 22,4% 22,8% 23,1% 23,2% 24,1%
90+ DPD provision coverage 54,4% 53,6% 52,6% 49,3% 48,1%
(1) Loans in arrears for more than 90 days (90+ DPD) are defined as loans past-due for more than 90 days and those that are impaired (impaired loans are those which are not considered
fully collectable and for which a provision for impairment has been recognised on an individual basis or for which incurred losses exist at their initial recognition or customers in Debt
Recovery).
(2) Including the fair value adjustment on initial recognition (difference between the outstanding contractual amount and the fair value of loans acquired from Laiki Bank) and provisions
for off-balance sheet exposures.
+
+
+
+
=
45

49
133
156
255
192
0
127
127
127
0
153
204
191
191
191
203
224
230
234
234
234
0
97
114
Progress on top 20 group exposures
46
Top 20 exposures down by €1,7 bn since 30 Sep 2014
2,8 2,7 2,7 2,7 2,6 2,3 1,9 1,4 1,3 1,2
1,6 1,5 1,3 1,3 1,1 1,5
1,6 2,0
1,7 1,5
4,4 4,2
4,0 4,0 3,7 3,8
3,5
3,4
3,0 2,7
64% 64% 66% 67% 69%
61%
53%
42% 45% 45%
Sep 2014 Dec 2014 Mar 2015 Jun 2015 Sep 2015 Dec 2015 Mar 2016 Jun 2016 Sep 2016 Dec 2016
90+DPD Loans other than 90+DPD 90+DPD ratio over total exposure
1,2
0,6
0,9
Dec 16
Top 20 - total exposure split (€ bn)
2,73
90+DPD
NPEs with
forbearance
measures, no
impairments, no
arrears1,2
Performing
NPE
€1,8 bn
• Top 20 group exposures were reduced by €0,3 bn qoq and totalled €2,7 bn at 31 Dec 2016, mainly
due to increased restructuring activity, including debt for asset swaps
• 90+ DPD ratio over total exposure remained stable at 45% at 31 December 2016
• Taking into account the provisions and tangible collateral, top 20 exposures are fully covered
- Total coverage (Provisions and MV of collateral over total exposure) of 106% at 31 December
2016
• As at 31 December 2016, c.65% of the top 20 group exposures were restructured
90+DPD reduced by 56%
€ bn3
(1) In pipeline to exit NPEs subject to meeting all exit criteria
(2) Analysis based on account basis
(3) Total exposures include on balance sheet and off balance sheet items

49
133
156
255
192
0
127
127
127
0
153
204
191
191
191
203
224
230
234
234
234
0
97
114
90+DPD 7,8
Forborne NPEs 2,5
Contagion² 0,2
Performing restructured 2,1
Performing 5,7
18,3
Cyprus gross loans(Dec 2016)
Aggressive target setting
Cyprus 18,3
Other 1,8
20,1
BOC Group gross loans(Dec 2016)
Total NPEs in Cyprus: €10,5 bn
• c.€6,8 bn of 90+DPDs managed by RRD
- o/s c.€4,8bn is managed via RRD
recoveries
Forborne NPEs:
• NPEs with forbearance measure no
impairments and no arrears1: €2,0 bn
• NPEs with forbearance measure, no
impairments and with arrears less than
90 days: €0,5 bn
• Focus on NPEs meeting exiting criteria
Following high volume of restructurings performed in 2016, now is the time to capitalise on the performance of restructured loans
• Continue to drive the resolution of cases for reduction of 90+ DPD
Close monitoring of progress towards targets
• Capitalise on improvements made to the Recoveries operating model and experience gained in the past year
Plans are in place to maintain positive progress
(1) In pipeline to exit NPEs subject to meeting all exit criteria; analysis based on account basis
(2) Contagion effect but not restructured 47

49
133
156
255
192
0
127
127
127
0
153
204
191
191
191
203
224
230
234
234
234
0
97
114 90+ DPD by Geography (€ bn) 90+ DPD ratios by Geography
11,47 11,53 11,48 11,27 10,63
9,60
8,65 8,18
7,78
0,09 0,11 0,09 0,08
0,07
0,06
0,05
0,06
0,02
1,09 1,15 1,08
0,65
0,63
0,63
0,57
0,53
0,51
12,65 12,79 12,65
12,00
11,33
10,29
9,27
8,77
8,31
Dec-14 Mar-15 Jun-15 Sep-15 Dec-15 Mar-16 Jun-16 Sep-16 Dec-16
Cyprus UK Other countries
90+ DPD by Geography
54
%
54%
54%
54%
51%
48%
45%
44%
43%
10%
11%
8%
7%
6%
5%
4%
5%
2%
66%
66%
67%
87%
87%
91%
90%
90%
90%
Dec-14 Mar-15 Jun-15 Sep-15 Dec-15 Mar-16 Jun-16 Sep-16 Dec-16
Cyprus UK Other countries1 1
48 (1) Other countries: Russia (until June 2015) and Romania

49
133
156
255
192
0
127
127
127
0
153
204
191
191
191
203
224
230
234
234
234
0
97
114
90+ DPD by business line (€ bn)
1,31 1,23 0,95 0,88 0,84 0,67 0,59 0,53
0,58 0,56 0,41 0,35 0,32 0,31 0,26 0,21
0,63 0,59 0,54 0,48 0,45
0,43 0,43 0,41
0,56 0,53
0,37 0,33 0,31
0,28 0,28 0,27
2,41 2,43
2,38 2,00
1,65 1,26
1,12 1,03
1,26 1,20
1,10
0,97
0,60
0,44 0,41
0,35
1,12 1,10
1,12
1,02
0,94
0,84 0,74
0,64
2,20 2,24
2,31
2,40
2,23
2,13 2,04
1,94
2,72 2,77
2,82
2,90
2,95
2,91
2,90
2,93
12,79 12,65
12,00
11,33
10,29
9,27 8,77
8,31
Mar 15 Jun 15 Sep 15 Dec 15 Mar 16 Jun 16 Sep-16 Dec-16
Corporate SMEs Housing
Consumer Credit RRD-Major Corporations RRD- Corporates
RRD-SMEs RRD-Recoveries corporates RRD-Recoveries SMEs & Retail
(1) As part of the restructuring of the Group, management is currently monitoring the loan portfolio of the Group using new business line definitions. An important component of the
Group‟s new operational structure is the establishment of the RRD for the purposes of centralising and streamlining the management of its delinquent loans.
Analysis 90+ DPD ratios by Business Line1
49

49
133
156
255
192
0
127
127
127
0
153
204
191
191
191
203
224
230
234
234
234
0
97
114
50
Total Bank – Cyprus
97%
1%
0%
2%
74%
1%
14%
11%
69
%
0%
21
%
10
%
89%
4%
0%
7%
90
%
0%
7%
3%
87
%
0%
1%
12
%
76
%
1%
5%
18
%
99%
0%
1%
0%
94
%
2%
1%
3%
96%
0%
3%
1%
93%
0%
0%
7%
0%
20%
40%
60%
80%
100%
No arrears 1-30 dpd 31-90 dpd Over 90 dpd
Corporate
SMEs
32%
4%
2%
62%
53
%
4%
2%
41
%
71%
0%
5%
24%
68%
12%
4%
16%
75%
9%
4%
12%
65%
10%
8%
17%
67%
13%
6%
14%
70%
12%
11%
7%
77%
9%
10%
4%
67%
14%
17%
2%
84%
6%
6%
4%
No arrears 1-30 dpd 31-90 dpd Over 90 dpd
Retail
93%
4%
69%
12%
57%
8%
3%
32%
65%
5%
2%
28%
70%
6%
3%
21%
69%
9%
3%
19%
70%
8%
1%
21%
69
%
10
%
5%
16
%
67%
10%
8%
15%
70%
13%
8%
9%
71%
15%
7%
7%
68%
18%
9%
5%
72
%
18
%
7%
3%
No arrears 1-30 dpd 31-90 dpd Over 90 dpd.
69%
12%
Quarterly average
• An analysis performed as at 31 December 2016 indicates that on average 81% of the loans restructured post 31 December
2013 for Cyprus operations, have no arrears (restructurings performed in 4Q2016 were excluded); The average percentage
of restructured loans with arrears more than 90 days stands at 8%
• Corporate restructured loans exhibit the best performance with an average percentage of restructured
loans with no arrears of 93%
Performance of Restructured Loans1
(1) The performance of loans restructured during 3Q2016 is not presented in this graph as it is too early to assess it.
71%
4%
1%
24%
65%
3%
7%
25%
70%
2%
12%
16%
76%
8%
2%
14%
83%
3%
5%
9%
75%
6%
4%
15%
70%
8%
6%
16%
88%
5%
4%
3%
84%
7%
5%
4%
85%
7%
6%
2%
81%
10%
4%
5%
No arrears 1-30 dpd 31-90 dpd Over 90 dpd
1Q2014 2Q2014 3Q2014 4Q2014
1Q2015 2Q2015 3Q2015 4Q2015
1Q2016 2Q2016 3Q2016
81%
8%

49
133
156
255
192
0
127
127
127
0
153
204
191
191
191
203
224
230
234
234
234
0
97
114
90+ DPD ratios by business line
Gross loans by business line (€ bn)
27
%
26
%
15
%
30
%
61
%
75
%
80
% 10
0%
10
0%
22
%
22
%
14
%
25
%
58
% 8
0%
79
% 10
0%
10
0%
21
%
20
%
13
%
23
%
53
%
69
%
74
% 1
00
%
10
0%
20
%
18
%
12
%
22
%
37
% 6
0%
70
%
10
0%
10
0%
16
%
18
%
12
%
21
%
32
% 50
%
64
%
10
0%
10
0%
14
%
15
%
12
%
20
% 37
%
48
%
58
%
10
0%
10
0%
12%
13%
11%
20%
34%
49%
52%
100%
100%
Corporate SMEs Housing Consumer Credit RRD-Mid Corporates RRD-MajorCorporations
RRD-SMEs RRD-Recoveriescorporates
RRD-RecoveriesSMEs and Retail
30.06.15 30.09.15 31.12.15 31.03.16 30.06.16 30.09.16 31.12.16
4,5
9
2,1
4
3,8
0
1,8
0
1,9
7 3
,22
1,3
8
2,2
4
2,7
7
4,3
8
1,8
3
3,7
5
1,4
8
1,9
0 2,9
8
1,4
1
2,3
1
2,8
3 4
,29
1,7
8
3,6
8
1,4
3
1,8
1 2,9
1
1,3
8 2,4
0
2,9
1 4
,15
1,7
7
3,6
2
1,4
0
1,6
2 2,7
6
1,3
5
2,2
3
2,9
4 4,1
0
1,7
4
3,6
1
1,3
8
1,3
7 2,5
3
1,3
0
2,1
3
2,9
2 4
,31
1,7
1
3,5
8
1,3
6
1,0
9 2
,34
1,2
6
2,0
4
2,9
1
4,4
0
1,6
2
3,5
4
1,3
4
1,0
1 2,1
2
1,2
2
1,9
5 2,9
3
Corporate SMEs Housing Consumer Credit RRD-MidCorporates
RRD-MajorCorporations
RRD-SMEs RRD-Recoveriescorporates
RRD-RecoveriesSMEs and Retail
30.06.15 30.09.15 31.12.15 31.03.16 30.06.16 30.09.16 31.12.16
% of total
(1) As part of the restructuring of the Group, management is currently monitoring the loan portfolio of the Group using new business line definitions. An important component of the
Group‟s new operational structure is the establishment of the RRD for the purposes of centralising and streamlining the management of its delinquent loans.
22% 8% 18% 5% 9% 6%
Analysis of Loans and 90+ DPD ratios by Business Line1
7% 11% 14%
51
49
133
156
255
192
0
127
127
127
0
153
204
191
191
191
203
224
230
234
234
234
0
97
114
90+ DPD ratios by economic activity
48
%
54
%
57
%
80
%
48
%
38
%
57
%
64
%
49
%
54
%
59
%
79
%
48
%
36
%
62
%
57
%
48
%
54
%
46
%
76
%
47
%
36
%
57
%
56
%
44
%
49
%
38
%
68
%
46
%
35
%
54
%
58
%
42
%
50
%
34
%
65
%
39
%
35
% 4
9%
56
%
39
%
46
%
34
%
63
%
37
%
35
% 46
% 57
%
38%
46%
32%
62%
35%
35%
45%
55%
30.06.15 30.09.15 31.12.15 31.03.16 30.06.16 30.09.16 31.12.16
Gross loans by economic activity (€ bn)
Trade Manufacturing Hotels &
Restaurants
Construction Real estate Private
Individuals
Professional
& other
services
Other
sectors
Analysis of Loans and 90+ DPD ratios by Economic Activity
52
2,5
0
0,9
2
1,6
4 4,1
9
3,2
0
7,8
6
2,0
7
1,5
5
2,3
8
0,8
5
1,6
2 4,1
4
3,3
8
7,4
1
1,8
4
1,2
4
2,3
6
0,8
3
1,5
7 4,0
7
3,4
2
7,3
3
1,7
9
1,2
1
2,2
6
0,8
2
1,4
7 3,9
2
3,3
2
7,2
5
1,6
4
1,1
7
2,2
3
0,8
0
1,4
5
3,4
3
3,3
3
7,1
7
1,5
5
1,1
2
2,1
9
0,7
1
1,4
2
3,2
2
3,3
0
7,1
1
1,4
8
1,1
7
2,1
2
0,7
0
1,4
2
2,9
7
3,3
0
7,0
3
1,5
0
1,0
9
30.06.15 30.09.15 31.12.15 31.03.16 31.06.16 30.09.16 31.12.16
Trade Manufacturing
Hotels &
Restaurants Construction Real estate
Private
Individuals
Professional
& other
services
Other
sectors
16% 11% 35% 7% 6% % of
total 15% 7% 3%
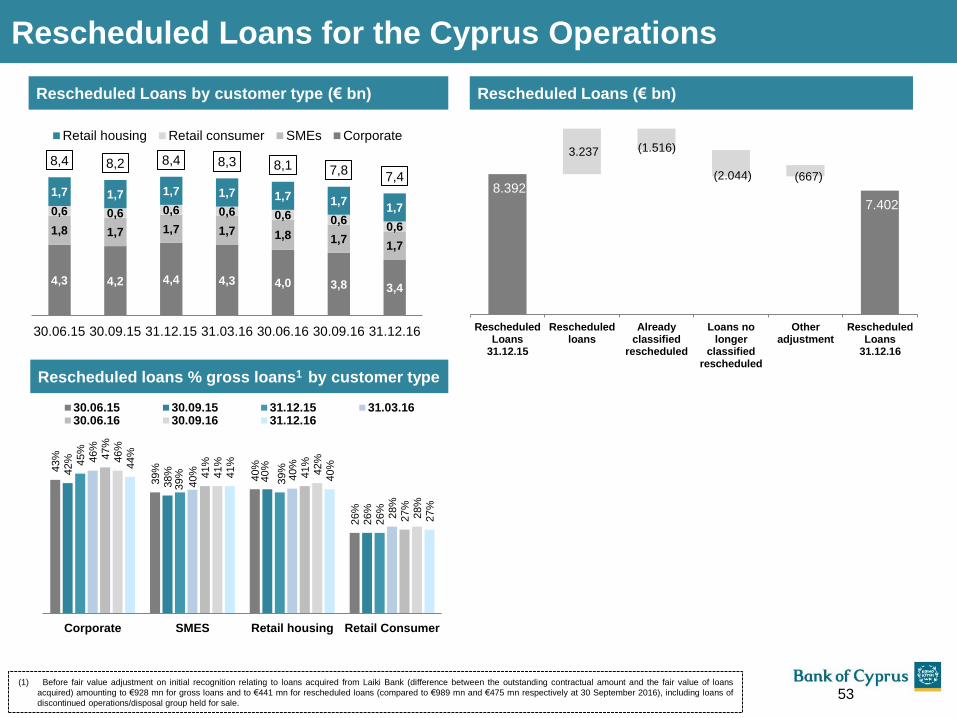
49
133
156
255
192
0
127
127
127
0
153
204
191
191
191
203
224
230
234
234
234
0
97
114
Rescheduled loans % gross loans1 by customer type
Rescheduled Loans by customer type (€ bn)
Rescheduled Loans for the Cyprus Operations
4,3 4,2 4,4 4,3 4,0 3,8 3,4
1,8 1,7 1,7 1,7 1,8 1,7 1,7
0,6 0,6 0,6 0,6 0,6 0,6 0,6
1,7 1,7 1,7 1,7 1,7 1,7 1,7
8,4 8,2 8,4 8,3 8,1 7,8 7,4
30.06.15 30.09.15 31.12.15 31.03.16 30.06.16 30.09.16 31.12.16
Retail housing Retail consumer SMEs Corporate
(1) Before fair value adjustment on initial recognition relating to loans acquired from Laiki Bank (difference between the outstanding contractual amount and the fair value of loans
acquired) amounting to €928 mn for gross loans and to €441 mn for rescheduled loans (compared to €989 mn and €475 mn respectively at 30 September 2016), including loans of
discontinued operations/disposal group held for sale.
43%
39%
40%
26%
42%
38%
40%
26%
45%
39%
39%
26%
46%
40%
40%
28%
47%
41%
41%
27%
46%
41%
42%
28%
44%
41%
40%
27%
Corporate SMES Retail housing Retail Consumer
30.06.15 30.09.15 31.12.15 31.03.1630.06.16 30.09.16 31.12.16
Rescheduled Loans (€ bn)
8.392
7.402
3.237 (1.516)
(2.044) (667)
RescheduledLoans
31.12.15
Rescheduledloans
Alreadyclassified
rescheduled
Loans nolonger
classifiedrescheduled
Otheradjustment
RescheduledLoans
31.12.16
53
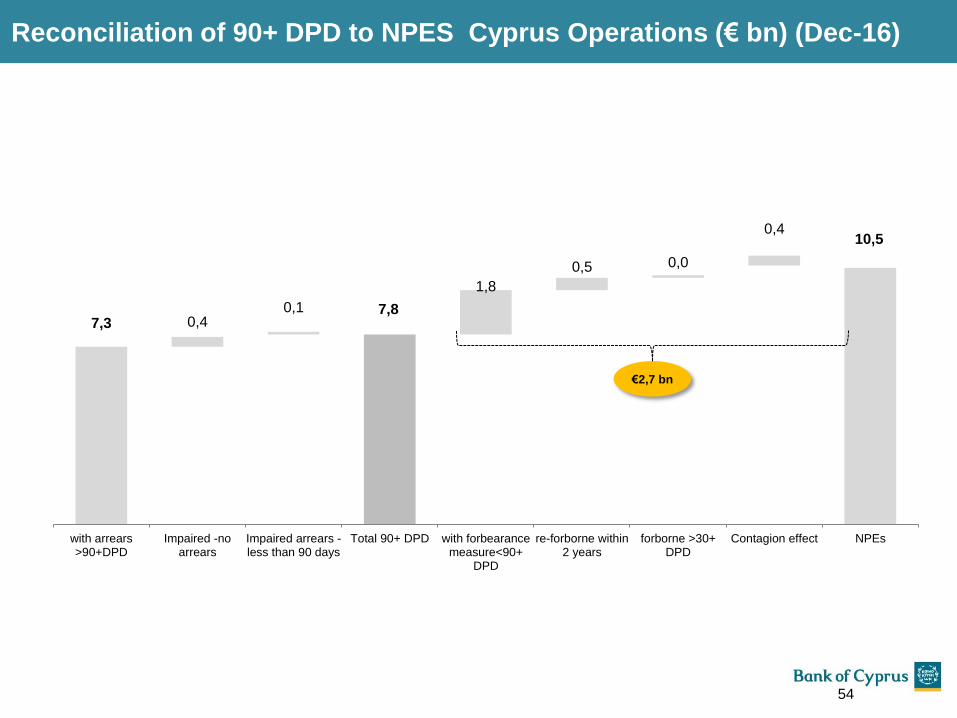
49
133
156
255
192
0
127
127
127
0
153
204
191
191
191
203
224
230
234
234
234
0
97
114
Reconciliation of 90+ DPD to NPES Cyprus Operations (€ bn) (Dec-16)
7,3 7,8
10,5
0,4 0,1
1,8
0,5 0,0
0,4
with arrears>90+DPD
Impaired -noarrears
Impaired arrears -less than 90 days
Total 90+ DPD with forbearancemeasure<90+
DPD
re-forborne within2 years
forborne >30+DPD
Contagion effect NPEs
€2,7 bn
54

49
133
156
255
192
0
127
127
127
0
153
204
191
191
191
203
224
230
234
234
234
0
97
114
Non-Performing Loans definition
Non-Performing Exposures (NPEs) –as per the EBA definition: In 2014 the European Banking Authority (EBA) published its reporting standards on
forbearance and non-performing exposures (NPEs). According to the EBA standards, a loan is considered a non-performing exposure if:
i. the debtor is assessed as unlikely to pay its credit obligations in full without the realisation of the collateral, regardless of the existence of any past
due amount or of the number of days past due, for example in case of a write off, a legal action against the borrower, or bankruptcy
ii. the exposures are impaired i.e. in cases where there is a specific provision, or
iii. there are material exposures which are more than 90 days past due, or
iv. there are performing forborne exposures under probation for which additional forbearance measures are extended, or
v. there are performing forborne exposures under probation that present more than 30 days past due within the probation period.
The exit criteria of NPE forborne are the following:
1. The extension of forbearance measures does not lead to the recognition of impairment or default
2. One year has passed since the forbearance measures were extended
3. There is not, following the forbearance measures, any past due amount or concerns regarding the full repayment of the exposure according to the
post forbearance conditions.
90+DPD: Loans in arrears for more than 90 days (90+ DPD) are defined as loans past-due for more than 90 days and those that are impaired
(impaired loans are those which are not considered fully collectable and for which a provision for impairment has been recognised on an individual
basis or for which incurred losses exist at their initial recognition or customers in Debt Recovery).
55

49
133
156
255
192
0
127
127
127
0
153
204
191
191
191
203
224
230
234
234
234
0
97
114
Certain statements, beliefs and opinions in this presentation are forward-looking. Such statements can be generally identified
by the use of terms such as “believes”, “expects”, “may”, “will”, “should”, “would”, “could”, “plans”, “anticipates” and
comparable terms and the negatives of such terms. By their nature, forward-looking statements involve risks and
uncertainties and assumptions about the Group that could cause actual results and developments to differ materially from
those expressed in or implied by such forward-looking statements. These risks, uncertainties and assumptions could
adversely affect the outcome and financial effects of the plans and events described herein. We have based these forward-
looking statements on our current expectations and projections about future events. Any statements regarding past trends or
activities should not be taken as a representation that such trends or activities will continue in the future. Readers are
cautioned not to place undue reliance on forward-looking statements, which are based on facts known to and/ or assumptions
made by the Group only as of the date of this presentation. We assume no obligation to update such forward-looking
statements or to update the reasons that actual results could differ materially from those anticipated in such forward-looking
statements. This presentation does not constitute an offer to sell, or a solicitation of an offer to buy, any security in any
jurisdiction in the United States, to United States Domiciles or otherwise. Some of the information in the presentation is
derived from publicly available information from sources such as the Central Bank of Cyprus, the Statistical Services of the
Cyprus Ministry of Finance, the IMF, Bloomberg and Company Reports and the Bank makes no representation or warranty as
to the accuracy of that information. The delivery of this presentation shall under no circumstances imply that there has been
no change in the affairs of the Group or that the information set forth herein is complete or correct as of any date. This
presentation shall not be used in connection with any investment decision regarding any of our securities, which should only
be made based on expressly authorised materials from us identified as such, nor in connection with any decision whether or
how to vote on any matter submitted to our stockholders. The securities issued by Bank of Cyprus Public Company Ltd have
not been, and will not be, registered under the US Securities Act of 1933 (“the Securities Act”), or under the applicable
securities laws of Canada, Australia or Japan.
Disclaimer
56
Related Documents