1 Bank Market Power and Liquidity Creation Hana Bawazir a,b,1 Marta Degl’innocenti a Simon Wolfe a a Southampton Business School, University of Southampton, UK. b Collage of Business Administration, University of Bahrain, Bahrain. Abstract We empirically investigate how bank market power affects liquidity creation for a large sample of banks in the euro area countries from 2006-2015. Using the instrumental variables approach to deal with possible endogeneity concerns, we find market power as measured by Lerner indices increases liquidity creation significantly. We shed further light on the market power and liquidity creation nexus by examining the interaction effect of market power and regulatory intervention during the global financial crisis. We find that government intervention only affects banks with low market power. Additional results include the effects of market power on various components of liquidity creation as well as bank profitability. Our main results remain robust to several robustness checks. JEL classification: G21, G28, L16 Keywords: Liquidity creation, Basel III, Bank market power 1 Corresponding Author. Email address: [email protected], [email protected] (Hana Bawazir), [email protected] (Marta Degl’innocenti), [email protected] (Simon Wolfe)

Welcome message from author
This document is posted to help you gain knowledge. Please leave a comment to let me know what you think about it! Share it to your friends and learn new things together.
Transcript
1
Bank Market Power and Liquidity Creation
Hana Bawazira,b,1 Marta Degl’innocenti a Simon Wolfe a
a Southampton Business School, University of Southampton, UK. b Collage of Business Administration, University of Bahrain, Bahrain.
Abstract
We empirically investigate how bank market power affects liquidity creation for a large sample of
banks in the euro area countries from 2006-2015. Using the instrumental variables approach to
deal with possible endogeneity concerns, we find market power as measured by Lerner indices
increases liquidity creation significantly. We shed further light on the market power and liquidity
creation nexus by examining the interaction effect of market power and regulatory intervention
during the global financial crisis. We find that government intervention only affects banks with
low market power. Additional results include the effects of market power on various components
of liquidity creation as well as bank profitability. Our main results remain robust to several
robustness checks.
JEL classification: G21, G28, L16
Keywords: Liquidity creation, Basel III, Bank market power
1 Corresponding Author. Email address: [email protected], [email protected] (Hana Bawazir), [email protected] (Marta Degl’innocenti), [email protected] (Simon Wolfe)
2
1. Introduction
Liquidity shocks that lead to the recent global financial crisis (GFC) highlighted deeper
structural changes and pressures in the financial system. The significant transformations that take
place in financial markets have changed how banks create liquidity. Nowadays, a significant part
of bank liquidity creation lies outside the banking system. Besides the traditional bank liquidity
creation, a second and growing component, which depends on the amount of credit that banks
are willing to extend to each other. Still market liquidity affects the asset side of banks’ balance
sheets to the extent they want to actively manage their portfolios. Consequently, liquidity shocks
have a bigger impact on market and funding liquidity, which is expected to have potential
implications on the level of bank competition among market participants. Also, banking
competition affects the availability of credit, access to finance, and ultimately, economic growth
(Claessens and Laeven (2004), (2005)). Therefore, understanding how market power affects credit
supply is essential for the formulation of appropriate regulatory policies.
The goal of this paper is to empirically examine the effect of bank market power on
liquidity creation. Liquidity creation is an essential service that banks provide to the economy.
Given the importance of liquidity creation, it is surprising that there is relatively little empirical
work on understanding the mechanisms of liquidity creation. It is only recently that Berger and
Bouwman (2009) created measures of liquidity creation and thereafter a growing empirical
literature has been directed towards understanding the mechanisms of liquidity creation based on
the measures offered by Berger and Bouwman (2009). However, little is known about how bank
market power after the GFC affect banks’ ability to create liquidity for their customers.
As liquidity creation becoming a relatively new research topic, most recent papers
investigate the relationship between bank regulatory capital (Horváth et al. (2014), Fu et al. (2016),
Casu et al. (2016) and Fungáčová et al. (2017)).The macroeconomy following financial crisis (Berger
and Bouwman (2015), (2017), and Berger and Sedunov (2017)). Or the effects of regulatory
interventions and capital support on liquidity creation (Berger et al., 2010; Berger et al., 2016).
Whereas studies that investigate market power have mainly investigate its impact on bank net
interest margin (Corvoisier and Gropp, 2002; Amidu and Wolfe, 2013b), financial stability (Berger
et al., 2009; Amidu and Wolfe, 2013a), efficiency (Ariss, 2010), and more recently how government
interventions affect bank completion (Calderon and Schaeck, 2016).
Our paper adds to the competition and liquidity creation literature and offers several
contributions. First, to the best of our knowledge, we are the first study that provide an in-depth
analysis on how and to what extent liquidity creation is affected by market power in 22 EU
3
countries. So far, no studies have explored the relationship between market power and liquidity
creation in EU countries, our paper covers this gap in the literature. While previous research in
this area relies heavily on Berger and Bouwman (2009) liquidity creation measures, this paper also
considers an indicator related to the new liquidity requirements established under Basel III (the
inverse of NSFR). Hence, our study provides comprehensive measures of liquidity creation
compared to the previous studies. Furthermore, using the efficiency adjusted Lerner and
traditional Lerner indices as measures of bank market power, this paper presents the first empirical
analysis of the relationship between bank market power and liquidity creation using non-structural
measures of market power in banking systems on across-country level. In addition, this paper
presents a methodological advancement in the literature on liquidity creation in that we apply an
instrumental variable technique not the widely accepted General Methods of Moments (GMM),
to investigate the effect of bank market power on liquidity creation. Our identification strategy
exploits plausibly exogenous variation in bank market power, which is instrumented using three
instruments: financial freedom, banking activity restrictions and entry restrictions instead of using
the lagged variables in the GMM approach. Finally, we are the first to examine the interaction
effect of bank market power and government intervention on liquidity creation during the GFC.
In this paper, we combine bank-specific data for 2,492 banks from 22 EU countries
(15,761 country-year observations) with regulatory and macroeconomic variables over the period
2006 to 2015. We attempt to extend the previous empirical literature and analyse the impact of
bank market power on liquidity creation. Due to the conflicting opinions on measuring the degree
of market power expressed in the economic literature, it has become an important scope for
investigating the competitive features of a banking industry. As a result, we apply a more recent
measure of market power that allows for the possibility that firms do not choose the prices and
input levels in a profit-maximizing way (Koetter et al., 2012).
Our results indicate that banks with greater market power significantly increase their
liquidity creation. Specifically, a greater market power increases liquidity creation by 59 and 7.8
percentage points for INSFR and TLC, respectively. This is large relative to the means of 127%
and 21%. We find that market power only increases liquidity creation on the asset side by 12-
percentage points for the adjusted Lerner and it reduces liability-side liquidity creation by 3.06
percentage points. Thus these effects when combined, explains why we find the overall effect of
bank market power on total liquidity creation (TLC).
We further extend our analysis to demonstrate whether bank market power enhances
overall bank profitability. In fact, we are interested to investigate the functionality of banks and to
4
what extent they will be able to optimise their performance when faced by high-risk exposure in
terms of liquidity creation. Our results show that higher market power increases bank profitability
by 26-percentage points measured by return on assets, 4% as measured by return on equity and
73-percentage points by net interest margin. All these results are statistically significant at the 1%
confidence level. This analysis highlights the importance of adjusting market power for profit
inefficiency. Calculating market power using the traditional Lerner index overestimate bank
profitability by more than 50%.
Our findings about the combined effect of high market power and government
intervention on bank liquidity creation during the GFC reveal a negative relationship between
banks with low market power and guarantees suggesting that during the GFC, government
intervention through guarantees reduces liquidity creation. In contrast, we find the combined
effect of recapitalisation with low market power is positive but only significant at the 10%
confidence level for the TLC. This suggests that government intervention through recapitalisation
should be targeted at banks with less market power.
We perform a number of robustness checks. First, we investigate how bank specialization
affects liquidity creation. Second, we split our sample into under-capitalized and well-capitalized
banks to examine whether liquidity creation responds differently at banks with relatively high
capital ratios. Third, we re-run our model focusing only on small banks in order to find a link
between bank size and liquidity creation. Fourth, we include macroeconomic control variables to
investigate their potential influence on our findings. Fifth, we correct standard errors for clustering
at the bank and year level to account for the structure of serial correlation within each bank in our
tests. Finally, we construct an alternative liquidity creation measure (I.NSFR) by applying the
October 2014 Basel III factors (BCBS, 2014). Our main findings remain robust to all these tests.
The remainder of this chapter is structured as follows: section 2 reviews the related
literature and provides the theoretical arguments linking liquidity creation with bank market power
and the explicit channels that can influence this relation. Section 3 describes the econometric
framework. Section 4 describes the data and the calculation of the market power measures as well
as the liquidity creation measures. Section 5 provides the results obtained from examining the
impact of bank market power on liquidity creation. Section 6 presents various robustness checks.
Finally, section 7 concludes.
2. Literature Review
Following the global financial crisis, Basel III and other strengthening policy responses are
expected to affect financial institutions with implications for industry structure and competitive
5
conduct over longer periods of time (Acharya and Mora, 2012). In turn, such actions might reduce
banks’ ability to provide lending or create liquidity in the economy. The theoretical literature
regarding the impact of bank market power on liquidity creation suggests two opposing
hypotheses. The “fragility channel” view by Petersen and Rajan (1995), who argue that increased
competition reduces credit supply, as banks are less likely to grant credit to clients. The idea is that
decreased market power reduces incentives for banks to establish long-term relationships with new
borrowers, or relationships that could create future surpluses to be shared. Banks’ propensity to
lend and invest in information production may be more limited in competitive environments
because competition reduces the possibility that banks can recoup the costs involved in building
and nurturing long-term relationships with borrowers.
The second hypothesis, the “price channel” view by Boot and Thakor (2000), suggests that
increased competition influences bank pricing policies, leading to diminished loan rates and
increased deposit rates. As a consequence, demand for both loans and deposits rise. The more
dominant view suggests that competition tends to be associated with lower loan rates, which makes
credit more affordable and increases lending and access to finance. More broadly, this view argues
that competition promotes credit availability. Several studies provide empirical support for a link
between competition and low lending rates (Calderon and Schaeck, 2012; Love and Pería, 2015).
Liquidity creation follows what financial intermediation assumes: that banks traditional and core
business is to “borrow short and lend long”, so they gather deposits and then lend these out.
Which of these two views best describes the nature of the relationship between bank
market power and liquidity creation is ultimately an empirical issue. As we noted in the
introduction, the empirical literature on this relationship is scarce. There is, however, empirical
work on the relationship between banks market power and lending (one element of liquidity
creation). The empirical results provided are mixed for example, Besanko and Thakor (1992) and
Guzman (2000) find that market power is detrimental in banking as more competition leads to
lower costs and better access to finance. Similarly, studies reveal that in a market where banks are
concentrated, lending reduces as a result of high lending rates but deposit rates decline where
banks have excessive market power in a deposit market (Berlin and Mester, 1999; Black and
Strahan, 2002; Kahn et al., 2005). Moreover, Cestone and White (2003) suggest that banks exhibit
a reduced willingness to lend to new borrowers in uncompetitive markets because their existing
lending relationships are highly valuable. Canales and Nanda (2012) and Cetorelli and Strahan
(2006) find that reduced competition decreases bank lending.
6
Our paper is also related to several other strands in the literature. It builds on previous
studies and control for the complex relationship between liquidity creation and capital. Berger and
Bouwman (2009) report two opposing hypotheses on the link between capital and liquidity
creation. “The financial fragility-crowding out” theory states that higher capital reduces liquidity
creation. Contrary, the “risk absorption” theories state that higher capital increases liquidity
creation. For instance, Casu et al. (2016) find that higher capital requirements may result in reduced
liquidity creation in the Eurozone. Similarly, Horváth et al. (2014) find Czech banks have a negative
and significant relationship between liquidity creation and capital. Furthermore, Fu et al. (2016)
and Distinguin et al. (2013) find similar results when analysing commercial banks in 14 Asia-Pacific
economies and a sample containing European and US banks, respectively.
As we investigate the impact of market power on liquidity creation, we only find two papers
that explore this relationship. Generally, prior empirical research on bank market power focuses
on the relationship between different aspects of bank regulations, supervisory practices, bank
performance or financial stability (Beck et al., 2006; Delis, 2012; Tabak et al., 2012; Amidu and
Wolfe, 2013a; Beck et al., 2013; Cubillas and Suárez, 2013; Soedarmono et al., 2013; Fiordelisi et al.,
2015). However, after the recent global financial crisis, the impact of the rescue operations such
as capital injections, state-aid, and bank bailouts on banking competition have been the object of
an increasing number of investigation (Beck et al., 2010; Andresen, 2011; Calderon and Schaeck,
2012; Fiordelisi et al., 2015). The financial crisis led to large losses, failure, and closure of many
banks, and forced the intervention of both central banks and governments. Our study considers
the interaction between market power and government intervention and examines how this might
affect liquidity creation during the GFC. Molyneux (2014) states that the on-going reform in the
European banking sector since the 2008-10 crisis will lead to a more conservative and less
competitive system. In this regards, Ivashina and Scharfstein (2010) find that banks in the U.S.
reduced their lending to customers significantly during the crisis period although banks have raised
deposit rates to substitute wholesale funding constraints (Acharya and Mora, 2015). Similarly,
Cornett et al. (2011) find that U.S. banks with more illiquid asset portfolios cut back on lending
during crisis periods.
In sum, studies on liquidity creation have mainly focused on the complex relationship
between liquidity creation and capital or government intervention. However, there has been no
studies devoted to the issue of how liquidity creation measured as the new liquidity requirement in
Basel III affects market power in the European banking industry. Our paper covers this gap and
contributes to this relatively unexplored avenue of research by providing new insights on the
relationship between liquidity creation and bank market power.
7
3. Econometric Framework
3.1 Identification Strategy
In this paper, we investigate the contribution of Liquidity creation in explaining bank
market power beyond the determinants considered in the existing literature. We define market
power as the extent to which banks fix prices above marginal costs. To capture market power, we
apply the traditional Lerner index as well as an adjusted Lerner index that allows for the possibility
that banks do not choose the prices and input levels in a profit-maximizing way, i.e., avoiding the
implicit assumptions of full efficiency in the estimation of traditional Lerner index (Koetter et al.,
2012). Ignoring profit inefficiency would lead to a large bias in price-cost margin, as well as in
consumer and producer welfare losses. Previous studies show that bank market power is an
important determinant of bank liquidity creation (Berger and Bouwman, 2009; Distinguin et al.,
2013; Fu et al., 2016). Thus, to mitigate simultaneity concerns, we employ a two-stage least squares
technique (2SLS/IV) and estimate Equations (1) and (2) as follows:
𝐿𝑒𝑟𝑛𝑒𝑟𝑖𝑡 = 𝑎0 + 𝑏1𝐼𝑉𝑖𝑡 + 𝑏2𝑋𝑖,𝑡−1 + 𝛾𝑡 + 𝛾𝑐 + 휀𝑖𝑡, (1)
Δ𝑌𝑖𝑡 = 𝑐0 + 𝑑1𝐿𝑒𝑟𝑛𝑒𝑟𝑖𝑡̂ + 𝑑2𝑋𝑖,𝑡−1 + 𝛾𝑡 + 𝛾𝑐 + 휀𝑖𝑡 , (2)
Where Δ𝑌𝑖𝑡 is the change in liquidity creation (or one of its components: asset-side, liability-
side, and off-balance sheet liquidity creation or one of the profitability measures: ROA, ROE and
NIM) scaled by total assets at bank 𝑖 from year 𝑡 − 1 to year 𝑡, 𝐿𝑒𝑟𝑛𝑒𝑟𝑖,𝑡 is either the adjusted or
unadjusted Lerner index. It denotes bank market power indicators for bank 𝑖 at time 𝑡. 𝑋𝑖,𝑡−1 is a
vector of control variables, defined in detail below. 𝐼𝑉𝑖,𝑡 are instrumental variables used to predict
Lerner indices, 𝛾𝑡 and 𝛾𝑐 are year and country dummies, respectively. The term 휀𝑖,𝑡 is the error
term. We estimate the first-stage regression between instrumental variables and market power in
the EU banking using OLS method. All regressions are based on annual data. In the second stage,
we regress liquidity creation on the predicted values of the potentially endogenous explanatory
variables, control variables, year and country dummies. Standard errors are clustered at the bank
level to control for serial correlation within each bank. We use Wooldridge (1995)
overidentification and exogeneity tests as well as the explanatory power of the first-stage regression
to select suited instruments.
3.1.1 Instruments
Establishing causality requires variables that explain market power but are neither
correlated with bank liquidity creation nor a second-stage error term (Elyasiani and Jia, 2008;

8
Danisewicz et al., 2016). Consistent with the banking literature (Schaeck and Cihak, 2012; Amidu
and Wolfe, 2013a), we instrument market power using three instruments: banking activity
restrictions, entry restrictions and banking freedom. We argue that these instruments are suitable
to instrument Lerner indices because they provide information concerning how independent a
banking system is from government control as well as legal requirements and state interference in
various banking activities. Hence, less government state ownership and interference directly affect
bank market power. Firstly, we use bank activity regulatory variable to measure the degree to which
national regulatory authorities allow banks to engage in the following three fee-based rather than
the more traditional interest-spread-based activities: Securities activities, insurance activities and
real estate activities. Following Barth et al. (2001), this instrument is proxied by an index taking on
values between (1) and (4) for categories that capture information on whether banks can engage
in securities, insurance, and real estate activities, and if they can hold stakes in non-banks. The
activities are classified as unrestricted (1), permitted (2), restricted (3), or prohibited (4). Higher
values indicated greater restrictions. Secondly, bank entry requirements (competition regulatory
variable) are used to measure the specific legal requirements for obtaining a license to operate as a
bank. This variable takes on values between (1) and (8), where higher values indicate lower entry
restrictions. Finally, we use banking freedom as an indicator for the openness of a banking system.
The index offers data on whether foreign banks are allowed to operate freely, on difficulties faced
when establishing banks, and on government influence over credit allocation. The index ranges
from 0 to 100 percent, where higher values indicate fewer restrictions.
3.2 The influence of government interventions
Furthermore, we extend our analysis and focus only on the crisis period (2008-2011) by
considering whether banks with the highest market power have benefited more from government
intervention in terms of creating more liquidity. We sort our sample into four quartiles; quartile
four represents banks with the highest adjusted Lerner index and quartile one the lowest. Our
pooled-OLS model specification is as follows:
Δ𝑌𝑖𝑡 = 𝛼 + 𝛽1𝐴𝑑𝑗𝑢𝑠𝑡𝑒𝑑 𝐿𝑒𝑟𝑛𝑒𝑟𝑞1𝑖,𝑡−1 + 𝛽2𝐴𝑑𝑗𝑢𝑠𝑡𝑒𝑑 𝐿𝑒𝑟𝑛𝑒𝑟𝑞2𝑖,𝑡−1 +
𝛽3𝐴𝑑𝑗𝑢𝑠𝑡𝑒𝑑 𝐿𝑒𝑟𝑛𝑒𝑟𝑞4𝑖,𝑡−1 + [∑ (𝜆𝑗 + 𝜉𝑗𝐴𝑑𝑗𝑢𝑠𝑡𝑒𝑑 𝐿𝑒𝑟𝑛𝑒𝑟𝑞𝑖,𝑡−12𝑗=1 ) ∗
𝐺𝑜𝑣𝐼𝑛𝑡𝑐,𝑡−1𝑗
] + 𝛿𝑋𝑖,𝑡−1 + 𝛾𝑐 + 𝛾𝑡 + 휀𝑖𝑡 , (3)
Where 𝐴𝑑𝑗𝑢𝑠𝑡𝑒𝑑 𝐿𝑒𝑟𝑛𝑒𝑟𝑞4𝑖,𝑡−1 is a variable that represents banks with the highest market power,
𝐺𝑜𝑣𝐼𝑛𝑡𝑐,𝑡−1𝑗
are two forms of government intervention; guarantees and liquidity measure as well
as recapitalisation and asset relief. The coefficient 𝜉𝑗 represents the interaction between adjusted
Lerner index at various quartiles with the government intervention.
9
4. Data and Summary Statistics
4.1 Data Sources
The data used in this study are taken from several sources. We collect annual income
statements and balance sheet data from the Fitch-IBCA BankScope (BSC) database. For our
analysis, we distinguish between commercial, savings and cooperative banks from 28 EU countries.
Income statements and balance sheets are taken in US dollar terms, using the market rate at the
closing dates of the bank-specific accounting exercises. While in many cases BankScope reports
both consolidated and unconsolidated financial statements, we use consolidated figures to the
extent possible, to reflect the overall liquidity positions of the individual banking group.
For the main regressions we focus on the period from 2006-2015. Country-level data is
obtained from the World Development Indicators of the World Bank. In addition, we retrieve the
regulatory and institutional setting from Barth et al. (2001), Barth et al. (2004) and the Heritage
Foundation. Variable definitions are provided in Appendix A, in the top panel, variables employed
to estimate cost and profit functions using both OLS and SFA (see section 4.3). We apply the
following selection criteria: we drop banks with missing or negative total assets, have no loans
outstanding loans, zero deposits, or with missing or negative data for three factor prices, tow
outputs, cost, profit and equity. We deflate all monetary volumes to 2015 prices using the
consumer price index (Koetter et al., 2012; Delis et al., 2016). All balance sheet items and factor
prices are then truncated at the 1st and 99th percentile, respectively, to control for outliers. This
reduces our final sample to 2,492 banks with 15,761 observations from 22 EU countries.2 Table 1
provides the composition of the sample by country and bank type.
Insert Table 1
4.2 Dependent Variables: Liquidity Creation Measures
Our first liquidity creation proxy is based on the regulatory standards proposed by the
Basel Committee on Banking Supervision (BCBS, 2010). Following the global financial crisis and
in recognition of the need for banks to improve their liquidity management, the Basel Committee
on Banking Supervision developed an international framework for liquidity assessment in banking.
Among the several guidelines, the Basel III accords include the implementation of a net stable
funding ratio (NSFR). This ratio aims to promote resiliency over long-term time horizons by
creating additional incentives for banks to fund their activities with more stable sources of funding.
2 Six countries are removed from our sample as banks in these countries fail to meet our selection criteria. These countries include Estonia, Finland, Lithuania, Poland, Romania and Slovenia.
10
This liquidity measure is the ratio of the available amount of stable funding to the required amount
of stable funding.
We are among the first studies that use the inverse net stable funding ratio (I.NSFR) as a
proxy of liquidity creation (Distinguin et al., 2013; Casu et al., 2016). Hence, we calculate our
liquidity creation indicator as the amount of required stable funding (RSF) relative to the amount
of available stable funding (ASF) (BCBS, 2010).
𝐼. 𝑁𝑆𝐹𝑅𝑖𝑡 =𝑅𝑒𝑞𝑢𝑖𝑟𝑒𝑑 𝑆𝑡𝑎𝑏𝑙𝑒 𝐹𝑢𝑛𝑑𝑖𝑛𝑔𝑖𝑡
𝐴𝑣𝑎𝑖𝑙𝑎𝑏𝑙𝑒 𝑆𝑡𝑎𝑏𝑙𝑒 𝐹𝑢𝑛𝑑𝑖𝑛𝑔𝑖𝑡 (4)
Required Stable Funding (RSF) is a weighted sum of the uses of funding sources (assets
and off-balance sheet) according to their liquidity. While Available Stable Funding (ASF) is a
weighted sum of funding sources according to their stability features. Appendix A shows the
breakdown of a bank balance sheet as provided by BankScope and its weighting with respect to
the Basel III framework to calculate the inverse of the net stable funding ratio. We follow the same
assumptions made by Distinguin et al. (2013) and Gobat et al. (2014) to compute NSFR.
In addition, we calculate four measures of liquidity creations following Berger and
Bouwman (2009) and Berger et al. (2016) using a three-step procedure. In step 1, we classify all
bank balance sheet and off-balance sheet activities using information on the category and maturity
of banks’ assets and liabilities as liquid, semi-liquid, or illiquid. This is done based on the ease, cost,
and time it takes customers to obtain liquid funds from the bank (liability-side of a balance sheet),
and based on the ease, cost and time with which banks can dispose their obligations in the case of
asset items (asset-side of a balance sheet). In step 2, we assign weights of either +1/2, 0, or -1/2
to the activities classified in step 1. The weights correspond to liquidity creation theory. According
to this theory, banks create liquidity by converting illiquid assets into liquid liabilities. In contrast,
banks destroy liquidity by transforming liquid assets into illiquid liabilities or equity (see Berger
and Bouwman, 2009). In step 3, we combine the activities as classified in step 1 and as weighted
in step 2 in different ways to construct our liquidity creation measures. Total liquidity creation
(TLC) for each bank considers both on- and off- balance sheet activities. Instead of using TLC,
we also use an (off-balance sheet) measure where we only include off-balance sheet activities. Similarly,
we decompose the TLC measure and construct two proxies (asset-side and liability-side) that focuses
on on-balance sheet activities. Appendix B provides a classification of bank activities and
construction of four liquidity creation measures.
Higher values of all measures will indicate higher illiquidity. Higher levels of liquidity
creation mean that banks invest more liquid liabilities in illiquid assets. In this context, a bank faces
11
risk if some liquid liabilities invested in illiquid assets are claimed on demand. We run the
regressions in changes rather than levels because this allows us to observe how changes in our
explanatory variables lead to changes in liquidity creation at one particular bank in the following
year and avoids our results being driven by cross-sectional variation in the data (see Berger et al.
(2010) and Berger et al. (2016)).
4.3 Explanatory Variables: Market Power Measures
We examine the impact of market structure in banking on liquidity creation using two
Lerner indices as indicators of the degree of market power and clarify which one is our preferred
measure. First, the traditional Lerner index that assumes fully efficient banks represents the mark-
up of price over marginal costs. Following the banking literature (Amidu and Wolfe (2013a),
Fungáčová et al. (2014) and Berger and Roman (2015)), the traditional Lerner index is calculated
at the bank level as:
𝐿𝑒𝑟𝑛𝑒𝑟𝑗𝑡 =𝑃𝑗𝑡−𝑀𝐶𝑗𝑡
𝑃𝑗𝑡 (5)
Where 𝑃𝑗𝑡 is the price of bank output which is calculated as the ratio of total income over
total assets for bank 𝑗 at time 𝑡, and 𝑀𝐶𝑗𝑡 is the marginal cost of the production of that output for
bank 𝑗 at time 𝑡. When the marginal cost is not available as in most empirical data sets, it can be
estimated using econometric methods. We use a popular approach through estimating a translog
cost function and take its derivative to obtain the marginal cost. We follow Koetter et al. (2012)
and employ the following translog cost function as:
𝑙𝑜𝑔 𝐶𝑜𝑠𝑡𝑗𝑡 = 𝛼 + ∑ 𝐵𝑖 log 𝑤𝑖𝑗𝑡 + ∑ 𝛾𝑝2𝑝=1 log 𝑦𝑝𝑗𝑡 + ∑ ( 𝜍𝑖/2) (log 𝑤𝑖𝑗𝑡)2 +3
𝑖=13𝑖=1
∑ ∑ 𝜂𝑖𝑘 log 𝑤𝑖𝑗𝑡 log 𝑤𝑘𝑗𝑡 + ∑ (𝜃𝑝/2 ) (2𝑝=1 log 𝑦𝑝𝑗𝑡)2 + (𝜅12/𝑖<𝑘
2) log 𝑦1𝑗𝑡 log 𝑦2𝑗𝑡 + ∑ ∑ 𝜆𝑝𝑖2𝑝=1 log 𝑤𝑖𝑗𝑡 log 𝑦𝑝𝑗𝑡 + ∑ 𝜈𝑘𝑡𝑟𝑒𝑛𝑑𝑘 +2
𝑘=13𝑖=1
∑ 𝜉𝑖 log 𝑤𝑖𝑗𝑡𝑡𝑟𝑒𝑛𝑑 + ∑ 𝜔𝑝 log 𝑦𝑝𝑗𝑡𝑡𝑟𝑒𝑛𝑑 + 𝛿𝑙𝑜𝑔(𝑧𝑗𝑡) + 휀𝑗𝑡 ,2𝑝=1
3𝑖=1 (6)
Where Cost represents total costs including financial and operating costs, 𝑤𝑖𝑗𝑡 input factors 𝑖 =
1,2,3 of bank 𝑗 at time 𝑡, 𝑦1𝑗𝑡 is total securities of bank 𝑗 at time 𝑡. Following Koetter et al. (2012)
Securities include securities held to maturity, securities available for sale and all other stocks, bonds
and securities. 𝑦2𝑗𝑡 is total loans for bank 𝑗 at time 𝑡, 𝑧𝑗𝑡 is total equity of bank 𝑗 at time 𝑡, and
𝑡𝑟𝑒𝑛𝑑 is a time trend to capture technical change.
12
Once the cost function is estimated, marginal cost is evaluated by taking the first derivative
with respect to total securities (𝑦1𝑗𝑡) and total loans (𝑦2𝑗𝑡), which yields
𝑀𝐶𝑗𝑡 =𝐶𝑜𝑠𝑡𝑗𝑡
𝑦1𝑗𝑡 [𝛾1 + 𝜃1 𝑙𝑜𝑔 𝑦1𝑗𝑡 + (𝜅12/ 2) 𝑙𝑜𝑔 𝑦2𝑗𝑡 + ∑ 𝜆1𝑖 𝑙𝑜𝑔 𝑤𝑖𝑗𝑡 + 𝜔1𝑡𝑟𝑒𝑛𝑑] +3
𝑖=1
𝐶𝑜𝑠𝑡𝑗𝑡
𝑦2𝑗𝑡 [𝛾2 + 𝜃2 𝑙𝑜𝑔 𝑦2𝑗𝑡 + (𝜅12/2) 𝑙𝑜𝑔 𝑦1𝑗𝑡 + ∑ 𝜆2𝑖 𝑙𝑜𝑔 𝑤𝑖𝑗𝑡 + 𝜔2𝑡𝑟𝑒𝑛𝑑]3
𝑖=1 . (7)
We estimate equation (5) using an OLS approach imposing the restrictions of homogeneity in
inputs prices and symmetry in cross-price effects as in Lang and Welzel (1996). We impose
homogeneity of degree 1 on input prices and Cost by the price of borrowed funds (𝑤3). Country
and time fixed effects are also introduced to control for all unobservable time-variant country-
specific factors. We cluster heteroscedasticity-adjusted standard errors at the bank level to account
for serial correlation within each bank. The Lerner index ranges between zero and one, and
interpreted as follows: zero corresponds to perfect competition and larger values reflect more
market power and less competition.
Our second indicator of market power is the adjusted Lerner index estimated using the
exact same procedure as Koetter et al. (2012). This index allows for the possibility that firms do
not choose the prices and input levels in a profit-maximizing way, i.e., avoiding the implicit
assumptions of full efficiency in the estimation of the traditional Lerner index. To approximate
average revenues, Humphrey and Pulley (1997) propose an alternative profit efficiency model as a
more adequate framework when the standard assumptions of a perfectly competitive market do
not hold. This model measures to what extent a bank generates maximum profits given its output
levels. To measure efficiency, we use profit before taxes (PBT) as the dependent variable in the
translog equation (6). We deal with the problem of losses in translog profit models by applying the
solution proposed by Bos and Koetter (2011), we specify an additional independent variable, the
Negative Profit Indicator (NPI). We define NPI to be equal to one for observations where PBT
is positive and equal to the absolute value of PBT for a loss-incurring bank.
We follow the new literature and use stochastic frontier analysis (SFA) to estimate marginal
cost and average revenues based on standard assumptions in (Kumbhakar and Lovell, 2000). SFA
posits a composed error model (휀𝑗 = 𝜈𝑗 + 𝜇𝑗), where inefficiencies (𝜇𝑗) are assumed to follow
an asymmetric distribution, usually the half-normal with a variance 𝜎𝜇2 independent of the 𝜈𝑗′𝑠 ,
while random errors (𝜈𝑗) follow a symmetric distribution, normal distribution with mean zero and
variance 𝜎𝜈2 . The logic is that the inefficiencies must have a truncated distribution because
inefficiencies cannot be negative.
13
An efficiency-adjusted Lerner index is then calculated using predicted total costs (Cost),
corresponding marginal costs (MC), and predicted profits (PBT) relative to total output (TO = total
loans + total securities) as:
𝐴𝑑𝑗𝑢𝑠𝑡𝑒𝑑 𝐿𝑒𝑟𝑛𝑒𝑟𝑗𝑡 = 𝑃𝐵𝑇
𝑇𝑂+
𝐶𝑜𝑠𝑡
𝑇𝑂−𝑀𝐶
𝑃𝐵𝑇
𝑇𝑂+
𝐶𝑜𝑠𝑡
𝑇𝑂
= 𝑃𝐵𝑇+𝐶𝑜𝑠𝑡−𝑀𝐶∗𝑇𝑂
𝑃𝐵𝑇+𝐶𝑜𝑠𝑡 (8)
Assessing market power using the adjusted Lerner index is our preferred measure. This is
because Koetter et al. (2012) state that firms with market power prefer to operate inefficiently
rather than reap all potential rents. Profit inefficiency arises when firms do not fully exploit their
pricing opportunity set. Therefore, ignoring both cost and profit inefficiencies would lead to an
even larger bias in price-cost margin, as well as in consumer and producer welfare losses.
4.4 Control Variables
Our regressions contain several control variables, which are lagged by one year. We include
the following: the natural logarithmic of total assets is included to account for bank size. We
control for bank capitalization, using the equity ratio (equity capital to total assets) because Berger
and Bouwman (2009) have shown that bank capital is a key determinant for liquidity creation.
Furthermore, we follow Berger et al. (2010) and Casu et al. (2016) and include the return on equity
(ROE) to control for bank profitability. It is calculated as the ratio of net income to average
equity. Finally, we add Loan Loss Provisions (LLP) to control for credit risk (Altunbas et al., 2007).
According to Berger and Bouwman (2009), it is important to control for risk because adding risk
to the regression helps to isolate the role of capial in suppporting bank liquidity creation from the
role of capital in supporting banks’ function as risk transformers. In addition, we include a dummy
variable for commercial banks (Commercial), a dummy variable for savings banks (Savings) and a
dummy variable for Cooperative banks (Cooperative) that we drop in the regression to avoid
perfect collinerity.
4.5 Summary Statistics and Statistical analysis of Lerner indices
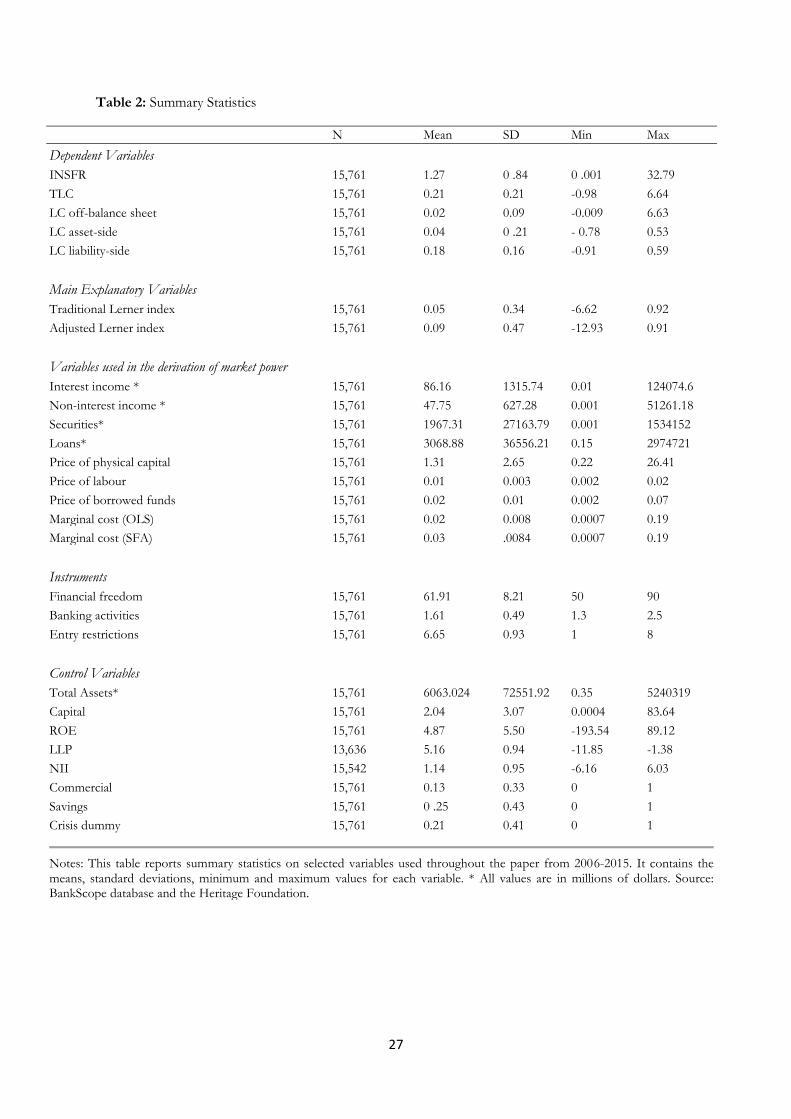
Table 2 presents the descriptive statistics for the variables included in our model. As to our
dependent variables, the average inverse net stable funding ratio (I.NSFR) is 127%. This result is
similar to those reported in US and European banks (90.2% by Distinguin et al. (2013)). Total
liquidity creation (TLC) equals 21% of industry total assets. This result is similar to those reported
in Germany (22% by Berger et al. (2016)). Banks in our sample create almost all their liquidity on
the balance sheet and only 2% liquidity is created off-balance sheet. Distinguin et al. (2013) state
that the main difference between the liquidity creation indicators based on Berger and Bouwman
14
(2009) and the liquidity indicator as defined in the Basel III accords stems from the liability side
of the balance sheet. The liquidity creation indicator (TLC) considers some liabilities as liquid
because they can be quickly withdrawn without penalty. However, a large share of these liquid
liabilities is considered as stable in the Basel III liquidity indicator because they are expected to
“stay” within the institution. Furthermore, higher levels of liquidity creation (TLC) mean that
banks invest more liquid liabilities in illiquid assets. Whereas, higher (INSFR) implies that the
amount of assets that cannot be monetized is deviating from the available amount of stable
funding. The mean value of the traditional Lerner index is 5%. While the adjusted Lerner index
shows a higher value of 9% consistent with Koetter et al. (2012), who find that adjusted Lerner
indices are larger than conventional Lerner indices.
Insert Table 2
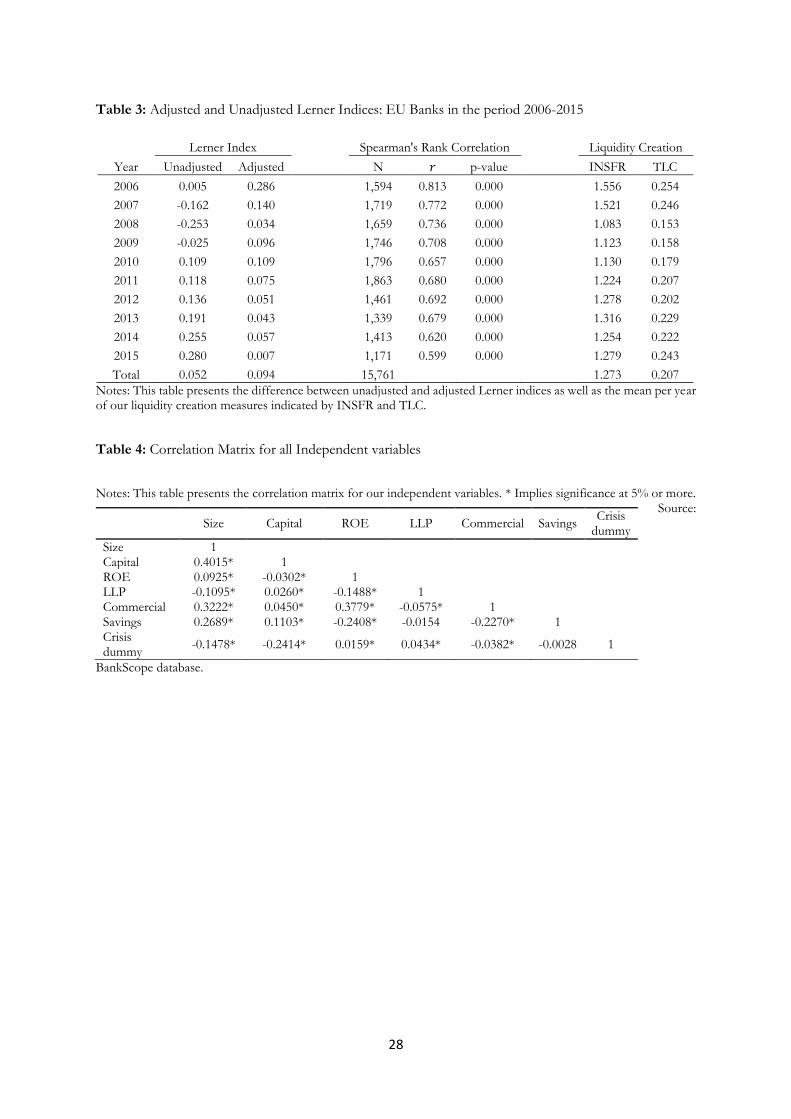
Consistent with Koetter et al. (2012), mean Lerner indices per year in Table3 demonstrate
that failure to adjust for inefficiency leads to underestimation of market power. For the period
from 2006 to 2010, adjusted Lerner indices are on average about one-third larger compared to
unadjusted indices. However, beyond 2010, adjusted Lerner reflect an increase in the level of
competition among banks as the adjusted Lerner declined. This could be due to the regulatory
reforms after the global financial crisis.
Furthermore, Table 4 shows the correlation matrix for the sample. It can be seen that no
high correlation between the independent variables is present and hence there are no
multicollinearity problems.
Insert Table 3 and Table 4
5. Empirical Results
5.1 Main Results
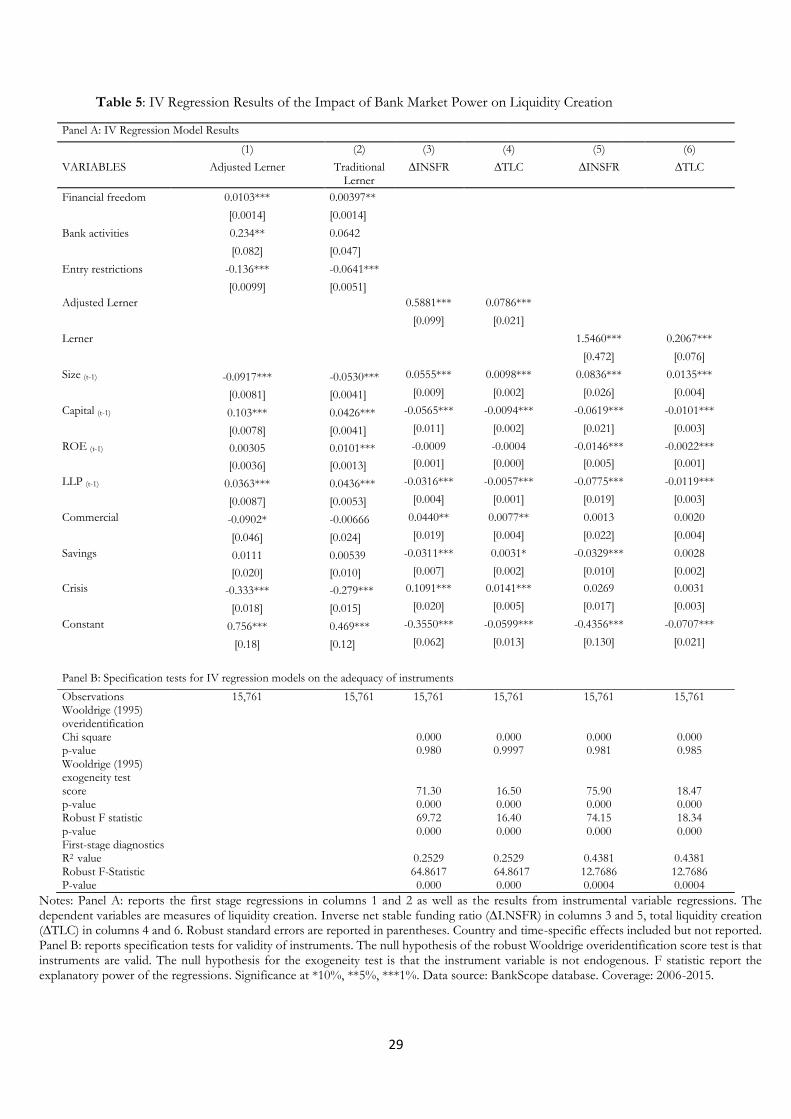
5.1.1 First-stage results: Instruments
Our two first-stage regressions in Table 5 (column 1 and column 2) analyse the
determinants of market power proxied by the adjusted Lerner index and traditional Lerner index.
The three instruments are financial freedom, bank activities and entry restrictions. In addition, we
use set of control variables as identified in the literature (Claessens and Laeven, 2004; Demirgüç-
Kunt and Martínez Pería, 2010).
First, we use financial freedom as an indicator for the openness of a banking system. The
index offers data on whether foreign banks are allowed to operate freely, on difficulties faced when
15
establishing banks, and on government influence over credit allocation. The findings suggest that
with the higher financial freedom, banking markets appear to be less competitive. Second, we find
that higher financial freedom is associated with weaker bank entry restrictions. This lead to new
investment opportunities which lead to higher sophistication in banking products that may in turn
affect the degree of bank competition.
Finally, we find a significant and positive impact of bank activities for the adjusted Lerner
index only. This indicates that banks with higher market power benefit more when national
authorities allow them to engage in fee-based non-traditional activities. Regarding the control
variables, most of the control variables have the expected sign and are significant.
5.1.2 Second-stage results: Market power
Our second-stage results are reported in Table 5 Panel A (columns 3-6). Our key variables
of interest are the adjusted Lerner index and the traditional Lerner index. We present our
estimations based on two definitions of liquidity creation: the inverse of net stable funding ratio
(I.NSFR) under Basel III regulatory requirements and total liquidity creation (TLC) based on
Berger and Bouwman (2009).
We find that banks with greater market power significantly increase their liquidity creation.
Our results show that market power has a positive and significant coefficient whether measured
by adjusted Lerner or traditional Lerner index. We obtain this result with both measures of liquidity
creation. Specifically, a greater market power increases liquidity creation by 59 and 7.8 percentage
points for INSFR and TLC, respectively. This is large relative to the means of 127% and 21%.
This result supports the hypothesis that market power can affect the availability of funds Petersen
and Rajan (1995) and the distributions of the loan portfolio (Berger et al., 2005). In contrast to
Cestone and White (2003), Cetorelli and Strahan (2006), and Canales and Nanda (2012), who find
that banks reduce their willingness to lend in uncompetitive markets because their existing lending
relationships are highly valuable.
Regarding the control variables, our coefficients are in line with those obtained in previous
studies (Distinguin et al., 2013; Berger et al., 2016; Casu et al., 2016) we find that size has a positive
and significant impact on liquidity creation. This can be justified by the ability of larger banks to
access external funding as they might benefit from a reputational advantage, possibly providing
them a broader access to financial markets. Furthermore, for bank capital, profitability and credit
risk, we find a negative relationship between these coefficients and liquidity creation. Consistent
with the “financial fragility structure” (Diamond and Rajan, 2000; Diamond and Rajan, 2001) and
the “crowding-out of deposits” (Gorton and Winton, 2017) theories, higher regulatory capital
16
ratios are associated with lower liquidity creation and illiquidity. Finally, we find the coefficient for
Commercial is positive while negative for Savings, indicating that commercial banks create more
liquidity than savings banks.
It is critical that our instruments are econometrically strong because weak instruments can
lead to worse biases than OLS (Berger et al., 2016). Table 5 Panel B shows several diagnostic tests
that we perform on a 2SLS model. Wooldridge (1995) is reported to examine overidentification
restrictions as well as exogeneity tests. The results suggest overidentification can be rejected, the
null hypothesis that Lerner indices are exogenous can be rejected and explanatory power as
indicated by R2 and F-tests support the choice of instruments. In sum, the results suggest that the
three instruments are correctly excluded from the second-stage equation.
Insert Table 5
5.2 Liquidity Creation Components
In this section, we examine whether the impact of market power on liquidity creation
comes only from on-balance sheet items: if it is on the asset side or the liability side, or it is also
goes through off-balance-sheet items. To examine this issue, we perform estimations by measuring
the components of liquidity creation focusing on the measures calculated based on Berger and
Bouwman (2009). Table 6 shows the results for both Lerner indices. We find that market power
only increase liquidity creation on the asset side by 12-percentage point for the adjusted Lerner
and 32-percentage point for the traditional Lerner.
This analysis also shows that higher market power reduces liability-side liquidity creation
by 3.06 percentage points measured by adjusted Lerner and 8.02 percentage points measured by
traditional Lerner index. Both results are statistically significant at 1% and 5%, respectively. These
effects thus when combined, explain why we find the overall effect of bank market power on total
liquidity creation (TLC). We find no significant measured effect of market power on off-balance
sheet liquidity creation. Regarding the control variables, we observe that they maintain their signs
but are only significant in the asset-side estimation.
Insert Table 6
5.3 Extensions: Bank Market Power, Profitability and government intervention
We further examine whether bank market power enhances overall bank profitability, one
of the main objectives of bank when increasing its illiquidity. We measure profitability by ∆ROA,
∆ROE and ∆NIM. Table 7 presents our results. Our results show that higher market power
increases bank profitability by 27-percentage points measured by return on assets, 4% as measured
17
by return on equity and 73-percentage points by net interest margin. The results are statistically
significant at the 1% confidence level and consistent with (Schaeck and Čihák (2008) Mirzaei et al.
(2013) and Amidu and Wolfe (2013b)).
This analysis highlights the importance of adjusting market power for profit inefficiency.
Calculating market power using the traditional Lerner index overestimate bank profitability by
more than 50%.
Insert Table 7
We next examine the combined effect of high market power and government intervention
on bank liquidity creation during the Global Financial Crisis (GFC). We sort banks based on their
adjusted Lerner index into four quartiles. The combined effects are explored through the
interaction between the government intervention and the adjuster Lerner index. Using equation
(3), the results are reported in Table 8. We find banks in the fourth quartile (Adjusted Lerner q4)
increase their liquidity creation as measured by (∆TLC). Across both estimations, we find the
coefficient of recapitalisation (Recapitalization) is positive and statistical significance at the 1%
confidence level to bank liquidity creation. Nevertheless, for our key variables of interest, when
we consider the combined effect of government intervention with market power. We find the
effect is negative for the combined effect of Guarantees with low market power (Adjusted Lerner
q1*Guarantees) and (Adjusted Lerner q2*Guarantees) suggesting that during the GFC, government
intervention through guarantees reduces liquidity creation for banks with less market power. The
average bank liquidity creation is lowered by 1.28 percentage points and 1.11 percentage points as
measured by (I.NSFR), respectively. In contrast, we find the combined effect of recapitalisation
with low market power (Adjusted Lerner q1*Recapitalization) and (Adjusted Lerner q2*Recapitalization)
is positive and significant at the 10% confidence level for the TLC. This suggests that government
intervention through recapitalisation should be targeted at banks with less market power.
Insert Table 8
6. Interaction Effects & Robustness Checks
6.1 Market Power and Bank Specialization
In this analysis, we turn to bank specialization and investigate how different business
models affects liquidity creation (Table 9 column 1 and column 2). We consider liquidity creation
as measured by (TLC) based on Berger and Bouwman (2009). We first run our estimation
considering only cooperative banks as they represent 61% of our sample. The results provide
interesting evidence. First, we find the interaction effect between market power and cooperative
18
banks negative and strongly significant, suggesting that cooperative banks create less liquidity
compared to commercial and savings banks. Second, we rerun our estimations with only
commercial and savings banks and find supporting evidence. The coefficients of the interaction
term between market power and bank specialization in column 2 are positive and statistically
significant at 1% confidence level. In both cases, the adjusted Lerner index remains positive and
strongly significant, indicating that higher market enhances liquidity creation.
6.2 Market Power and Bank Capital
In this test, we rerun our main analysis but now splitting the sample at the median equity
ratio into under-capitalized and well-capitalized banks to examine whether liquidity creation
responds differently at banks with relatively high capital ratios. We construct an interaction variable
between bank market power and well-capitalized banks (Adjusted Lerner*Capital). Consistent with
our main results, we find an inverse relationship between capital ratio and our liquidity creation
proxies. Therefore, banks may reduce liquidity creation as capital increases, as suggested by the
“financial-fragility-crowding out” hypothesis. This result is consistent with the findings of
(Distinguin et al., 2013; Horváth et al., 2014; Fu et al., 2016). Berger and Bouwman (2009) conclude
that the effect of capital on liquidity creation is negative only for small banks. Therefore, we run
our next test to investigate whether the interaction between bank size and bank market power
impacts liquidity creation.
6.3 Market Power and Bank Size
Both the “fragility channel” and the “price channel” effects on liquidity creation might
differ considerably among banks of different size. We address this by testing whether the net effect
of liquidity creation on bank market power is negative or positive for different bank sizes as a
further robustness check. We re-run our model focusing only on small banks in order to find a
link between bank size and liquidity creation.3 We split our sample at the median of total assets
into large and small banks. We expect that the financial fragility channel effect is likely to be
relatively strong for small banks. One reason is that small banks deal more with entrepreneurial-
type small business, where the close monitoring highlighted in Diamond and Rajan (2000) is
important. In contrast, the price channel effect is likely to be stronger for large banks because
substantial portions of their liquidity off the balance sheet is higher compared with small banks
(Berger and Bouwman, 2009).
3 We re-run the same test for large banks, our results show that large banks create more liquidity, results are available form authors upon request.
19
We construct an interaction variable between bank market power and small banks
(Adjusted Lerner*Small). Consistent with Berger and Bouwman (2009), small banks create less
liquidity compared to large banks.
6.4 Including Macroeconomic Variables
Next, we include macroeconomic contorl variables GDP and Inflation to investigate their
potential influence on the findings. We find that banks operating in countries with an expected
economic boom as measured by (GDP) have significant impact on liquidity creation. Similarly, we
find the inflation rate has a positive and significant impact on liquidity creation. Our main variable
of interest (Adjusted Lerner) remains positive and statistically significant at the 1% confidence level.
Insert Table 9
6.5 Standard Errors Corrected for Clustering at the Bank and Year
In this test, we deal with serial correlation in the error term. In the main results we clustered
hetroskedasticity-adjusted standard errors on the bank level to account for the structure of the
serial correlation within each bank in our tests. As an alternative way, we correct standard errors
for clustering at the bank and year (Table 10). We find that our results remain robust and do not
affect our inferences.
Insert Table 10
6.6 Alternative Liquidity Creation Proxy
As a final robustness check, we construct the (I.NSFR) based on Basel III applying the
more recent October 2014 factors (BCBS, 2014). The results are shown in Table 11 column 5 and
column 6. We find that both market power measures (Adjusted Lerner) and (Lerner) remain positive
and statistically significant at the 1% confidence level and do not differ substantially from those
obtained in Table 5.
The main differences between calculating INSFR based on previous factors used in the
literature and the new factors are as follows: With respect to the assets side; first, NSFR as revised
in October 2014 requires a higher weight for loans to financial entities. Hence, we apply a 10%
weight instead of 0%. Second, government securities receive a 5% weight. Third, corporate loans
receive a weight of 85% instead of 100%. Finally, other securities in available-for-sale or trading
portfolios (e.g., equities, commodities, and corporate bonds) receive 50% RSF weight consistent
with the revised Basel III NSFR. Similarly, on the liability side, the differences are in the factor
given to stable deposits, we increase the weight from 70% to 95% and decrease less stable from
100% to 90%. Whereas unsecured wholesale funding increased form 0% to 50%.
20
Insert Table 11
7. Conclusion
This paper examines the impact of bank market power on liquidity creation for a large
sample of banks in the euro area countries from 2006 to 2015. Using an instrumental variable
approach, we find market power as measured by Lerner indices increases liquidity creation
significantly. Further investigation suggests that market power affects liquidity creation on the
asset-side and the liability side of the balance sheet, but it does not affect liquidity creation off the
balance sheet. We compute adjusted Lerner index where we explicitly compare it with the
traditional Lerner index. We find that it is important to adjust for profit inefficiency as calculating
market power using traditional Lerner overestimate bank profitability by more than 50%. Overall,
our results show that Lerner indices have a positive impact on bank profitability.
As a further step, we investigate how regulatory interventions during the global financial
crisis affect liquidity creation. We find a negative relationship between the combined effect of
market power and guarantees and liquidity creation, while it is positive for the combined effect of
market power and recapitalisation for the (TLC) only. Our main results remain robust to several
robustness tests.
The results also suggest several policy implications. First, bank market power matters for
macroprudential policies. We find evidence that banks take on more liquidity risk as they achieve
greater market power. As market power can have detrimental economic effects through its impact
on liquidity creation. The ECB should monitor the structure of the banking sector not only for
financial stability reasons, but also to encourage liquidity creation as it may lead to higher levels of
economic growth. However, in light of the recent liquidity rules, as banks are required to hold
more liquid assets. Thus, policymakers facing conflicting objectives between sustainable economic
growth through liquidity creation and effectiveness of Basel III policy.
Second, we find higher required capital ratios may discourage liquidity creation within
banks. Hence, the implementation of Basel III may result in reduced liquidity creation by
introducing tightened capital requirements, therefore, slowing economic growth through a
reduction in the amount available for financing. Therefore, it is necessary to look for a trade-off
between benefits for a financial system from stronger capital and liquidity regulations and benefits
of greater liquidity creation.
Furthermore, given the differences between liquidity creation measures based on Berger
and Bouwman (2009) and Basel III BCBS (2010), using the (I.NSFR) measure for liquidity creation

21
may be useful to add to the debate on liquidity assessment in banking. This level of liquidity
creation could be considered to appreciate the ability of banks to face transformation risk when
they create liquidity. However, given the ambiguity in the definition and measurement of liquidity
under a global regulatory framework, it is recommended that regulators further clarify what type
of liquid liabilities should be considered stable. By better understanding what factors significantly
impact bank exposure to transformation risk, it can help banks to improve their risk management
framework.
22
8. References
Acharya, V.V. and Mora, N. (2012) Are banks passive liquidity backstops? Deposit rates and flows during the 2007-2009 crisis. Unpublished working paper. New York University and Federal Reserve Bank of Kansas, New York, NY, and Kansas City, MO, [Online] Available: http://archive.nyu.edu/bitstream/2451/31364/2/WP_AM_111311.pdf [Accessed: 23 Oct 2016].
Acharya, V.V. and Mora, N. (2015) A crisis of banks as liquidity providers. The Journal of Finance, 70 (1), 1-43.
Altunbas, Y., Carbo, S., Gardener, E.P. and Molyneux, P. (2007) Examining the relationships between capital, risk and efficiency in European banking. European Financial Management, 13 (1), 49-70.
Amidu, M. and Wolfe, S. (2013a) Does bank competition and diversification lead to greater stability? Evidence from emerging markets. Review of Development Finance, 3 (3), 152-166.
Amidu, M. and Wolfe, S. (2013b) The impact of market power and funding strategy on bank-interest margins. The European Journal of Finance, 19 (9), 888-908.
Andresen, S. (2011) Stock-take of financial system developments and their systemic implications. Speech given at the G20/OECE workshop "New financial landscape", Paris, 7th July 2011.
Ariss, R.T. (2010) On the implications of market power in banking: Evidence from developing countries. Journal of Banking & Finance, 34 (4), 765-775.
Barth, J.R., Caprio, G. and Levine, R. (2001) The regulation and supervision of banks around the world: A new database. World Bank Publications.
Barth, J.R., Caprio, G. and Levine, R. (2004) Bank regulation and supervision: what works best? Journal of Financial Intermediation, 13 (2), 205-248.
BCBS (2010) Basel III: International Framework for Liquidity Risk Managment, Standards and Monitoring. Bank for International Settlements (BIS), Basel.
BCBS (2014) Basel III: the net stable funding ratio. Bank for International Settlements (BIS), Basel. Beck, T., Coyle, D., Dewatripont, M., Freixas, X. and Seabright, P. (2010) Bailing out the banks:
reconciling stability and competition. Centre for Economic Policy Research, London. Beck, T., De Jonghe, O. and Schepens, G. (2013) Bank competition and stability: cross-country
heterogeneity. Journal of Financial Intermediation, 22 (2), 218-244. Beck, T., Demirgüç-Kunt, A. and Levine, R. (2006) Bank concentration, competition, and crises:
First results. Journal of Banking & Finance, 30 (5), 1581-1603. Berger, A. and Bouwman, C. (2015) Bank liquidity creation and financial crises. Academic Press.
Elsevier- North Holland. Berger, A.N. and Bouwman, C.H. (2009) Bank Liquidity Creation. Review of Financial Studies, 22 (9),
3779-3837. Berger, A.N. and Bouwman, C.H. (2017) Bank liquidity creation, monetary policy, and financial
crises. Journal of Financial Stability, 30, 139-155. Berger, A.N., Bouwman, C.H., Kick, T. and Schaeck, K. (2010) Bank liquidity creation and risk
taking during distress. Deutsche Bundesbank Discussion Paper Series 2, No. 05/2010. Deutsche Bundesbank, Frankfurt am Main. , [Online] Available: http://citeseerx.ist.psu.edu/viewdoc/download?doi=10.1.1.176.3248&rep=rep1&type=pdf [Accessed: 12th September 2016].
Berger, A.N., Bouwman, C.H., Kick, T. and Schaeck, K. (2016) Bank liquidity creation following regulatory interventions and capital support. Journal of Financial Intermediation, 26, 115-141.
Berger, A.N., Klapper, L.F. and Turk-Ariss, R. (2009) Bank competition and financial stability. Journal of Financial Services Research, 35 (2), 99-118.
23
Berger, A.N., Miller, N.H., Petersen, M.A., Rajan, R.G. and Stein, J.C. (2005) Does function follow organizational form? Evidence from the lending practices of large and small banks. Journal of Financial Economics, 76 (2), 237-269.
Berger, A.N. and Roman, R.A. (2015) Did TARP banks get competitive advantages? Journal of Financial and Quantitative Analysis, 50 (06), 1199-1236.
Berger, A.N. and Sedunov, J. (2017) Bank liquidity creation and real economic output. Journal of Banking & Finance, 81, 1-19.
Berlin, M. and Mester, L.J. (1999) Deposits and relationship lending. Review of Financial Studies, 12 (3), 579-607.
Besanko, D. and Thakor, A.V. (1992) Banking deregulation: Allocational consequences of relaxing entry barriers. Journal of Banking & Finance, 16 (5), 909-932.
Black, S.E. and Strahan, P.E. (2002) Entrepreneurship and bank credit availability. The Journal of Finance, 57 (6), 2807-2833.
Boot, A.W. and Thakor, A.V. (2000) Can relationship banking survive competition? The journal of Finance, 55 (2), 679-713.
Bos, J.W. and Koetter, M. (2011) Handling losses in translog profit models. Applied Economics, 43 (3), 307-312.
Calderon, C. and Schaeck, K. (2012) Bank bailouts, competitive distortions, and consumer welfare. [Online] Availabe at: http://www.bcb.gov.br/Pec/Depep/Seminarios/2012_VIISemRiscosBCB/Arquivos/2012_VIISemRiscosBCB_Ceasar_Calderon.pdf [Accessed: 3rd Oct 2016].
Calderon, C. and Schaeck, K. (2016) The effects of government interventions in the financial sector on banking competition and the evolution of zombie banks. Journal of Financial and Quantitative Analysis 51 (4), 1391-1436.
Canales, R. and Nanda, R. (2012) A darker side to decentralized banks: Market power and credit rationing in SME lending. Journal of Financial Economics, 105 (2), 353-366.
Casu, B., Di Pietro, F. and Trujillo‐Ponce, A. (2016) Liquidity Creation and Bank Capital in the Eurozone. Available at SSRN: https://ssrn.com/abstract=2828619 or http://dx.doi.org/10.2139/ssrn.2828619
Cestone, G. and White, L. (2003) Anticompetitive financial contracting: The design of financial claims. The Journal of Finance, 58 (5), 2109-2142.
Cetorelli, N. and Strahan, P.E. (2006) Finance as a barrier to entry: Bank competition and industry structure in local US markets. The Journal of Finance, 61 (1), 437-461.
Claessens, S. and Laeven, L. (2004) What drives bank competition? Some international evidence. Journal of Money, Credit, and Banking, 36 (3), 563-583.
Claessens, S. and Laeven, L. (2005) Financial dependence, banking sector competition, and economic growth. Journal of the European Economic Association, 3 (1), 179-207.
Cornett, M.M., Mcnutt, J.J., Strahan, P.E. and Tehranian, H. (2011) Liquidity risk management and credit supply in the financial crisis. Journal of Financial Economics, 101 (2), 297-312.
Corvoisier, S. and Gropp, R. (2002) Bank concentration and retail interest rates. Journal of Banking & Finance, 26 (11), 2155-2189.
Cubillas, E. and Suárez, N. (2013) Bank market power after a banking crisis: Some international evidence. The Spanish Review of Financial Economics, 11 (1), 13-28.
Danisewicz, P., Mcgowan, D., Onali, E. and Schaeck, K. (2016) The real effects of banking supervision: Evidence from enforcement actions. Journal of Financial Intermediation, In Press, Corrected Proof, Available online 27th October 2016.
Delis, M.D. (2012) Bank competition, financial reform, and institutions: The importance of being developed. Journal of Development Economics, 97 (2), 450-465.
Delis, M.D., Kokas, S. and Ongena, S. (2016) Foreign ownership and market power in banking: Evidence from a world sample. Journal of Money, Credit and Banking, 48 (2-3), 449-483.
24
Demirgüç-Kunt, A. and Martínez Pería, M.S. (2010) A framework for analyzing competition in the banking sector: an application to the case of Jordan. World Bank Policy Research Working Paper Series, 5499.
Diamond, D.W. and Rajan, R.G. (2000) A theory of bank capital. The Journal of Finance, 55 (6), 2431-2465.
Diamond, D.W. and Rajan, R.G. (2001) Liquidity risk, liquidity creation, and financial fragility: A Theory of Banking. Journal of Political Economy, 109 (2), 287-327.
Distinguin, I., Roulet, C. and Tarazi, A. (2013) Bank regulatory capital and liquidity: Evidence from US and European publicly traded banks. Journal of Banking & Finance, 37 (9), 3295-3317.
Elyasiani, E. and Jia, J.J. (2008) Institutional ownership stability and BHC performance. Journal of Banking & Finance, 32 (9), 1767-1781.
Fiordelisi, F., Mare, D.S. and Molyneux, P. (2015) State-aid, stability and competition in European banking. MPRA Paper No. 67473, posted 13, [Online] Available at: https://mpra.ub.uni-muenchen.de/67473/
Fu, X.M., Lin, Y.R. and Molyneux, P. (2016) Bank capital and liquidity creation in Asia Pacific. Economic Inquiry, 54 (2), 966-993.
Fungáčová, Z., Solanko, L. and Weill, L. (2014) Does competition influence the bank lending channel in the euro area? Journal of Banking & Finance, 49, 356-366.
Fungáčová, Z., Weill, L. and Zhou, M. (2017) Bank capital, liquidity creation and deposit insurance. Journal of Financial Services Research, 51 (1), 97-123.
Gobat, J., Yanase, M. and Maloney, J.F. (2014) The Net Stable Funding Ratio: Impact and Issues for Consideration. International Monetary Fund (IMF) Working Paper No. 14/106.
Gorton, G. and Winton, A. (2017) Liquidity provision, bank capital, and the macroeconomy. Journal of Money, Credit and Banking, 49 (1), 5-37.
Guzman, M.G. (2000) Bank structure, capital accumulation and growth: a simple macroeconomic model. Economic Theory, 16 (2), 421-455.
Horváth, R., Seidler, J. and Weill, L. (2014) Bank capital and liquidity creation: Granger-causality evidence. Journal of Financial Services Research, 45 (3), 341-361.
Humphrey, D.B. and Pulley, L.B. (1997) Banks' responses to deregulation: Profits, technology, and efficiency. Journal of Money, Credit, and Banking, 29 (1), 73-93.
Ivashina, V. and Scharfstein, D. (2010) Bank lending during the financial crisis of 2008. Journal of Financial Economics, 97 (3), 319-338.
Kahn, C., Pennacchi, G. and Sopranzetti, B. (2005) Bank consolidation and the dynamics of consumer loan interest rates. The Journal of Business, 78 (1), 99-134.
Koetter, M., Kolari, J.W. and Spierdijk, L. (2012) Enjoying the quiet life under deregulation? Evidence from adjusted Lerner indices for US banks. Review of Economics and Statistics, 94 (2), 462-480.
Kumbhakar, S.C. and Lovell, C. (2000) Stochastic Frontier Analysis. Cambridge University Press, Cambridge
Lang, G. and Welzel, P. (1996) Efficiency and technical progress in banking Empirical results for a panel of German cooperative banks. Journal of Banking and Finance, 20 (6), 1003-1023.
Love, I. and Pería, M.S.M. (2015) How bank competition affects firms' access to finance. The World Bank Economic Review, 29 (3), 413-448.
Mirzaei, A., Moore, T. and Liu, G. (2013) Does market structure matter on banks’ profitability and stability? Emerging vs. advanced economies. Journal of Banking & Finance, 37 (8), 2920-2937.
Molyneux, P. (2014) Performance in European Banking: Productivity, Profitability and Employment Trends. SUERF- The European Money and Finance Forum- Vienna 2014, [Online] Avilable at : https://www.suerf.org/doc/doc_02e74f10e0327ad868d138f2b4fdd6f0_2067_suerf.pdf [Accessed: 2nd Oct 2016].
25
Petersen, M.A. and Rajan, R.G. (1995) The Effect of Credit Market Competition on Lending Relationships. The Quarterly Journal of Economics, 110 (2), 407-443.
Schaeck, K. and Cihak, M. (2012) Banking competition and capital ratios. European Financial Management, 18 (5), 836-866.
Schaeck, K. and Čihák, M. (2008) How does competition affect efficiency and soundness in banking? New empirical evidence. ECB Working Paper No. 932 Available at SSRN: https://ssrn.com/abstract=1240856
Soedarmono, W., Machrouh, F. and Tarazi, A. (2013) Bank competition, crisis and risk taking: Evidence from emerging markets in Asia. Journal of International Financial Markets, Institutions and Money, 23, 196-221.
Tabak, B.M., Fazio, D.M. and Cajueiro, D.O. (2012) The relationship between banking market competition and risk-taking: Do size and capitalization matter? Journal of Banking & Finance, 36 (12), 3366-3381.
Wooldridge, J.M. (1995) Score Diagnostics for Linear Models Estimated by Two Stage Least Squares. Advances in Econometrics and Quantitative Economics: Essays in Honor of Professor C. R. Rao Cambridge, MA: Blackwell, 66-87.
26
Table 1: Composition of sample observations by country and bank type
Notes: This table presents a description of all observations included in the sample by country and bank type. Source: BankScope & authors’ calculations.
Country Total Commercial Banks Savings Banks Cooperative Banks
Total number of banks
15,761 2,078 3,994 9,689
percent of sample 100% 14% 25% 61%
of which Observations by category
1 Austria (AT) 709 113 379 217
2 Belgium (BE) 72 66 3 3
3 Bulgaria (BG) 10 10 0 0
4 Cyprus (CY) 6 6 0 0
5 Czech Republic (CZ) 89 70 0 19
6 Germany (DE) 9,449 317 3,109 6,023
7 Denmark (DK) 242 143 80 90
8 Spain (ES) 38 22 11 5
9 France (FR) 1,065 406 137 522 10 United Kingdom (UK) 222 221 0 1
11 Greece (GR) 1 1 0 0
12 Croatia (HR) 7 7 0 0
13 Hungary (HU) 2 2 0 0
14 Ireland (IE) 1 1 0 0
15 Italy (IT) 3,444 384 207 2,853
16 Luxembourg (LU) 124 111 3 10
17 Latvia (LV) 47 47 0 0
18 Malta (MT) 17 17 0 0
19 Netherlands (NL) 88 78 0 0
20 Portugal (PT) 88 35 46 7
21 Sweden (SE) 33 15 18 0
22 Slovakia (SK) 7 6 1 0
27
Table 2: Summary Statistics
N Mean SD Min Max
Dependent Variables
INSFR 15,761 1.27 0 .84 0 .001 32.79
TLC 15,761 0.21 0.21 -0.98 6.64
LC off-balance sheet 15,761 0.02 0.09 -0.009 6.63
LC asset-side 15,761 0.04 0 .21 - 0.78 0.53
LC liability-side 15,761 0.18 0.16 -0.91 0.59
Main Explanatory Variables
Traditional Lerner index 15,761 0.05 0.34 -6.62 0.92
Adjusted Lerner index 15,761 0.09 0.47 -12.93 0.91
Variables used in the derivation of market power
Interest income * 15,761 86.16 1315.74 0.01 124074.6
Non-interest income * 15,761 47.75 627.28 0.001 51261.18
Securities* 15,761 1967.31 27163.79 0.001 1534152
Loans* 15,761 3068.88 36556.21 0.15 2974721
Price of physical capital 15,761 1.31 2.65 0.22 26.41
Price of labour 15,761 0.01 0.003 0.002 0.02
Price of borrowed funds 15,761 0.02 0.01 0.002 0.07
Marginal cost (OLS) 15,761 0.02 0.008 0.0007 0.19
Marginal cost (SFA) 15,761 0.03 .0084 0.0007 0.19
Instruments
Financial freedom 15,761 61.91 8.21 50 90
Banking activities 15,761 1.61 0.49 1.3 2.5
Entry restrictions 15,761 6.65 0.93 1 8
Control Variables
Total Assets* 15,761 6063.024 72551.92 0.35 5240319
Capital 15,761 2.04 3.07 0.0004 83.64
ROE 15,761 4.87 5.50 -193.54 89.12
LLP 13,636 5.16 0.94 -11.85 -1.38
NII 15,542 1.14 0.95 -6.16 6.03
Commercial 15,761 0.13 0.33 0 1
Savings 15,761 0 .25 0.43 0 1
Crisis dummy 15,761 0.21 0.41 0 1
Notes: This table reports summary statistics on selected variables used throughout the paper from 2006-2015. It contains the means, standard deviations, minimum and maximum values for each variable. * All values are in millions of dollars. Source: BankScope database and the Heritage Foundation.
28
Table 3: Adjusted and Unadjusted Lerner Indices: EU Banks in the period 2006-2015
Notes: This table presents the difference between unadjusted and adjusted Lerner indices as well as the mean per year of our liquidity creation measures indicated by INSFR and TLC.
Table 4: Correlation Matrix for all Independent variables
Notes: This table presents the correlation matrix for our independent variables. * Implies significance at 5% or more.
Source:
BankScope database.
Lerner Index Spearman's Rank Correlation Liquidity Creation
Year Unadjusted Adjusted N 𝑟 p-value INSFR TLC
2006 0.005 0.286 1,594 0.813 0.000 1.556 0.254
2007 -0.162 0.140 1,719 0.772 0.000 1.521 0.246
2008 -0.253 0.034 1,659 0.736 0.000 1.083 0.153
2009 -0.025 0.096 1,746 0.708 0.000 1.123 0.158
2010 0.109 0.109 1,796 0.657 0.000 1.130 0.179
2011 0.118 0.075 1,863 0.680 0.000 1.224 0.207
2012 0.136 0.051 1,461 0.692 0.000 1.278 0.202
2013 0.191 0.043 1,339 0.679 0.000 1.316 0.229
2014 0.255 0.057 1,413 0.620 0.000 1.254 0.222
2015 0.280 0.007 1,171 0.599 0.000 1.279 0.243
Total 0.052 0.094 15,761 1.273 0.207
Size Capital ROE LLP Commercial Savings Crisis
dummy
Size 1 Capital 0.4015* 1 ROE 0.0925* -0.0302* 1 LLP -0.1095* 0.0260* -0.1488* 1 Commercial 0.3222* 0.0450* 0.3779* -0.0575* 1 Savings 0.2689* 0.1103* -0.2408* -0.0154 -0.2270* 1 Crisis dummy
-0.1478* -0.2414* 0.0159* 0.0434* -0.0382* -0.0028 1
29
Table 5: IV Regression Results of the Impact of Bank Market Power on Liquidity Creation
Panel A: IV Regression Model Results
(1) (2) (3) (4) (5) (6)
VARIABLES Adjusted Lerner Traditional Lerner
∆INSFR ∆TLC ∆INSFR ∆TLC
Financial freedom 0.0103*** 0.00397**
[0.0014] [0.0014]
Bank activities 0.234** 0.0642
[0.082] [0.047]
Entry restrictions -0.136*** -0.0641***
[0.0099] [0.0051]
Adjusted Lerner 0.5881*** 0.0786***
[0.099] [0.021]
Lerner 1.5460*** 0.2067***
[0.472] [0.076]
Size (t-1) -0.0917*** -0.0530*** 0.0555*** 0.0098*** 0.0836*** 0.0135***
[0.0081] [0.0041] [0.009] [0.002] [0.026] [0.004]
Capital (t-1) 0.103*** 0.0426*** -0.0565*** -0.0094*** -0.0619*** -0.0101***
[0.0078] [0.0041] [0.011] [0.002] [0.021] [0.003]
ROE (t-1) 0.00305 0.0101*** -0.0009 -0.0004 -0.0146*** -0.0022***
[0.0036] [0.0013] [0.001] [0.000] [0.005] [0.001]
LLP (t-1) 0.0363*** 0.0436*** -0.0316*** -0.0057*** -0.0775*** -0.0119***
[0.0087] [0.0053] [0.004] [0.001] [0.019] [0.003]
Commercial -0.0902* -0.00666 0.0440** 0.0077** 0.0013 0.0020
[0.046] [0.024] [0.019] [0.004] [0.022] [0.004]
Savings 0.0111 0.00539 -0.0311*** 0.0031* -0.0329*** 0.0028
[0.020] [0.010] [0.007] [0.002] [0.010] [0.002]
Crisis -0.333*** -0.279*** 0.1091*** 0.0141*** 0.0269 0.0031
[0.018] [0.015] [0.020] [0.005] [0.017] [0.003]
Constant 0.756*** 0.469*** -0.3550*** -0.0599*** -0.4356*** -0.0707***
[0.18] [0.12] [0.062] [0.013] [0.130] [0.021]
Panel B: Specification tests for IV regression models on the adequacy of instruments
Observations 15,761 15,761 15,761 15,761 15,761 15,761 Wooldrige (1995) overidentification
Chi square 0.000 0.000 0.000 0.000 p-value 0.980 0.9997 0.981 0.985 Wooldrige (1995) exogeneity test
score 71.30 16.50 75.90 18.47 p-value 0.000 0.000 0.000 0.000 Robust F statistic 69.72 16.40 74.15 18.34 p-value 0.000 0.000 0.000 0.000 First-stage diagnostics R2 value 0.2529 0.2529 0.4381 0.4381 Robust F-Statistic 64.8617 64.8617 12.7686 12.7686 P-value 0.000 0.000 0.0004 0.0004
Notes: Panel A: reports the first stage regressions in columns 1 and 2 as well as the results from instrumental variable regressions. The dependent variables are measures of liquidity creation. Inverse net stable funding ratio (∆I.NSFR) in columns 3 and 5, total liquidity creation (∆TLC) in columns 4 and 6. Robust standard errors are reported in parentheses. Country and time-specific effects included but not reported. Panel B: reports specification tests for validity of instruments. The null hypothesis of the robust Wooldrige overidentification score test is that instruments are valid. The null hypothesis for the exogeneity test is that the instrument variable is not endogenous. F statistic report the explanatory power of the regressions. Significance at *10%, **5%, ***1%. Data source: BankScope database. Coverage: 2006-2015.
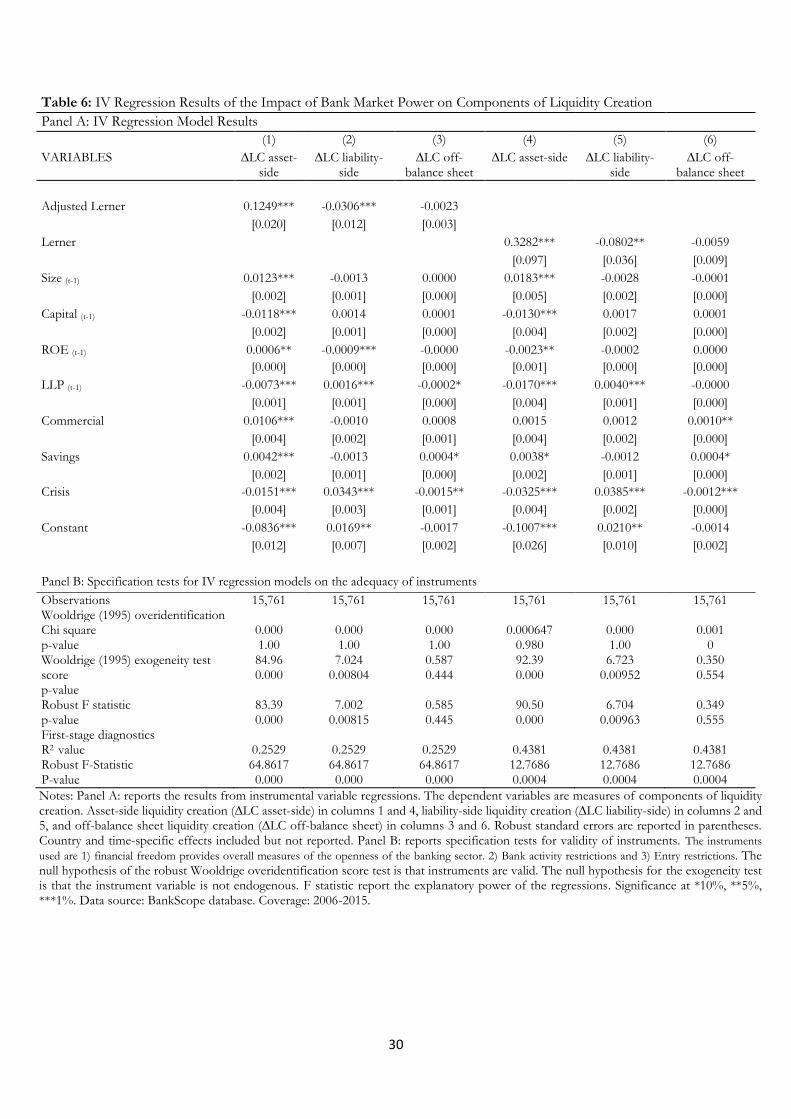
30
Table 6: IV Regression Results of the Impact of Bank Market Power on Components of Liquidity Creation
Panel A: IV Regression Model Results
(1) (2) (3) (4) (5) (6)
VARIABLES ∆LC asset-side
∆LC liability-side
∆LC off-balance sheet
∆LC asset-side ∆LC liability-side
∆LC off-balance sheet
Adjusted Lerner 0.1249*** -0.0306*** -0.0023
[0.020] [0.012] [0.003]
Lerner 0.3282*** -0.0802** -0.0059
[0.097] [0.036] [0.009]
Size (t-1) 0.0123*** -0.0013 0.0000 0.0183*** -0.0028 -0.0001
[0.002] [0.001] [0.000] [0.005] [0.002] [0.000]
Capital (t-1) -0.0118*** 0.0014 0.0001 -0.0130*** 0.0017 0.0001
[0.002] [0.001] [0.000] [0.004] [0.002] [0.000]
ROE (t-1) 0.0006** -0.0009*** -0.0000 -0.0023** -0.0002 0.0000
[0.000] [0.000] [0.000] [0.001] [0.000] [0.000]
LLP (t-1) -0.0073*** 0.0016*** -0.0002* -0.0170*** 0.0040*** -0.0000
[0.001] [0.001] [0.000] [0.004] [0.001] [0.000]
Commercial 0.0106*** -0.0010 0.0008 0.0015 0.0012 0.0010**
[0.004] [0.002] [0.001] [0.004] [0.002] [0.000]
Savings 0.0042*** -0.0013 0.0004* 0.0038* -0.0012 0.0004*
[0.002] [0.001] [0.000] [0.002] [0.001] [0.000]
Crisis -0.0151*** 0.0343*** -0.0015** -0.0325*** 0.0385*** -0.0012***
[0.004] [0.003] [0.001] [0.004] [0.002] [0.000]
Constant -0.0836*** 0.0169** -0.0017 -0.1007*** 0.0210** -0.0014
[0.012] [0.007] [0.002] [0.026] [0.010] [0.002]
Panel B: Specification tests for IV regression models on the adequacy of instruments
Observations 15,761 15,761 15,761 15,761 15,761 15,761 Wooldrige (1995) overidentification Chi square 0.000 0.000 0.000 0.000647 0.000 0.001 p-value 1.00 1.00 1.00 0.980 1.00 0 Wooldrige (1995) exogeneity test 84.96 7.024 0.587 92.39 6.723 0.350 score 0.000 0.00804 0.444 0.000 0.00952 0.554 p-value Robust F statistic 83.39 7.002 0.585 90.50 6.704 0.349 p-value 0.000 0.00815 0.445 0.000 0.00963 0.555 First-stage diagnostics R2 value 0.2529 0.2529 0.2529 0.4381 0.4381 0.4381 Robust F-Statistic 64.8617 64.8617 64.8617 12.7686 12.7686 12.7686 P-value 0.000 0.000 0.000 0.0004 0.0004 0.0004
Notes: Panel A: reports the results from instrumental variable regressions. The dependent variables are measures of components of liquidity creation. Asset-side liquidity creation (∆LC asset-side) in columns 1 and 4, liability-side liquidity creation (∆LC liability-side) in columns 2 and 5, and off-balance sheet liquidity creation (∆LC off-balance sheet) in columns 3 and 6. Robust standard errors are reported in parentheses. Country and time-specific effects included but not reported. Panel B: reports specification tests for validity of instruments. The instruments
used are 1) financial freedom provides overall measures of the openness of the banking sector. 2) Bank activity restrictions and 3) Entry restrictions. The null hypothesis of the robust Wooldrige overidentification score test is that instruments are valid. The null hypothesis for the exogeneity test is that the instrument variable is not endogenous. F statistic report the explanatory power of the regressions. Significance at *10%, **5%, ***1%. Data source: BankScope database. Coverage: 2006-2015.
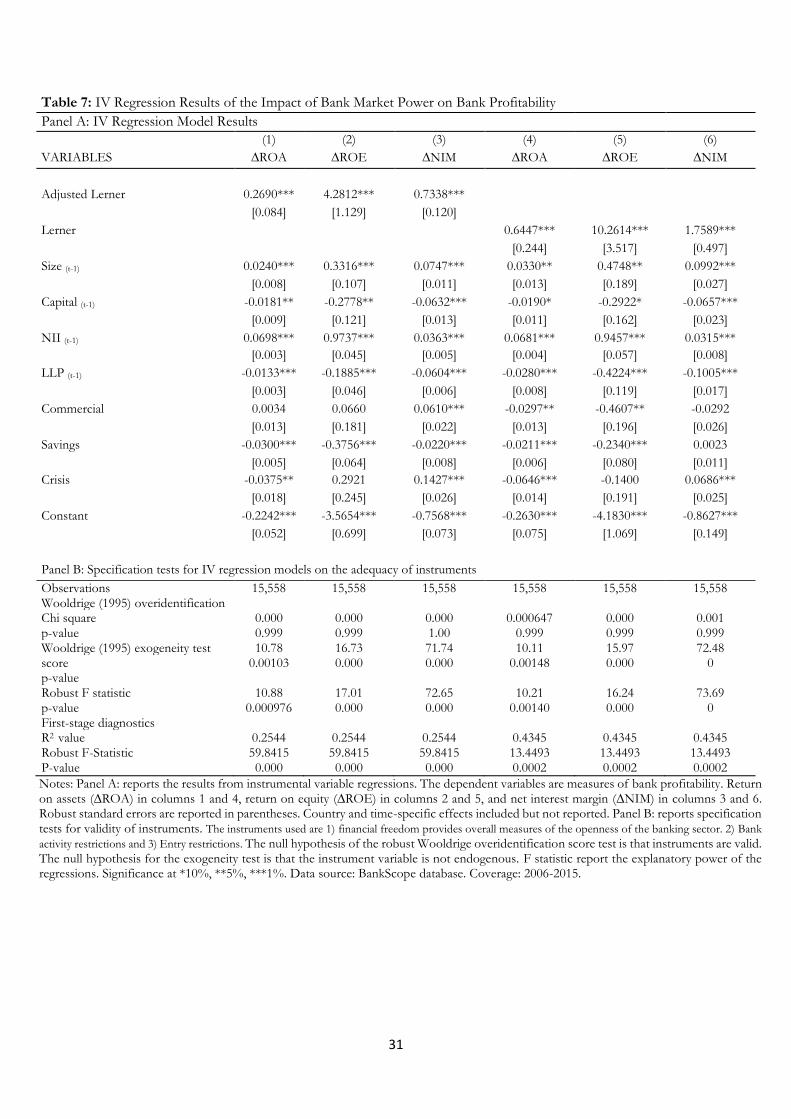
31
Table 7: IV Regression Results of the Impact of Bank Market Power on Bank Profitability
Panel A: IV Regression Model Results
(1) (2) (3) (4) (5) (6)
VARIABLES ∆ROA ∆ROE ∆NIM ∆ROA ∆ROE ∆NIM
Adjusted Lerner 0.2690*** 4.2812*** 0.7338***
[0.084] [1.129] [0.120]
Lerner 0.6447*** 10.2614*** 1.7589***
[0.244] [3.517] [0.497]
Size (t-1) 0.0240*** 0.3316*** 0.0747*** 0.0330** 0.4748** 0.0992***
[0.008] [0.107] [0.011] [0.013] [0.189] [0.027]
Capital (t-1) -0.0181** -0.2778** -0.0632*** -0.0190* -0.2922* -0.0657***
[0.009] [0.121] [0.013] [0.011] [0.162] [0.023]
NII (t-1) 0.0698*** 0.9737*** 0.0363*** 0.0681*** 0.9457*** 0.0315***
[0.003] [0.045] [0.005] [0.004] [0.057] [0.008]
LLP (t-1) -0.0133*** -0.1885*** -0.0604*** -0.0280*** -0.4224*** -0.1005***
[0.003] [0.046] [0.006] [0.008] [0.119] [0.017]
Commercial 0.0034 0.0660 0.0610*** -0.0297** -0.4607** -0.0292
[0.013] [0.181] [0.022] [0.013] [0.196] [0.026]
Savings -0.0300*** -0.3756*** -0.0220*** -0.0211*** -0.2340*** 0.0023
[0.005] [0.064] [0.008] [0.006] [0.080] [0.011]
Crisis -0.0375** 0.2921 0.1427*** -0.0646*** -0.1400 0.0686***
[0.018] [0.245] [0.026] [0.014] [0.191] [0.025]
Constant -0.2242*** -3.5654*** -0.7568*** -0.2630*** -4.1830*** -0.8627***
[0.052] [0.699] [0.073] [0.075] [1.069] [0.149]
Panel B: Specification tests for IV regression models on the adequacy of instruments
Observations 15,558 15,558 15,558 15,558 15,558 15,558 Wooldrige (1995) overidentification Chi square 0.000 0.000 0.000 0.000647 0.000 0.001 p-value 0.999 0.999 1.00 0.999 0.999 0.999 Wooldrige (1995) exogeneity test 10.78 16.73 71.74 10.11 15.97 72.48 score 0.00103 0.000 0.000 0.00148 0.000 0 p-value Robust F statistic 10.88 17.01 72.65 10.21 16.24 73.69 p-value 0.000976 0.000 0.000 0.00140 0.000 0 First-stage diagnostics R2 value 0.2544 0.2544 0.2544 0.4345 0.4345 0.4345 Robust F-Statistic 59.8415 59.8415 59.8415 13.4493 13.4493 13.4493 P-value 0.000 0.000 0.000 0.0002 0.0002 0.0002
Notes: Panel A: reports the results from instrumental variable regressions. The dependent variables are measures of bank profitability. Return on assets (∆ROA) in columns 1 and 4, return on equity (∆ROE) in columns 2 and 5, and net interest margin (∆NIM) in columns 3 and 6. Robust standard errors are reported in parentheses. Country and time-specific effects included but not reported. Panel B: reports specification tests for validity of instruments. The instruments used are 1) financial freedom provides overall measures of the openness of the banking sector. 2) Bank
activity restrictions and 3) Entry restrictions. The null hypothesis of the robust Wooldrige overidentification score test is that instruments are valid. The null hypothesis for the exogeneity test is that the instrument variable is not endogenous. F statistic report the explanatory power of the regressions. Significance at *10%, **5%, ***1%. Data source: BankScope database. Coverage: 2006-2015.
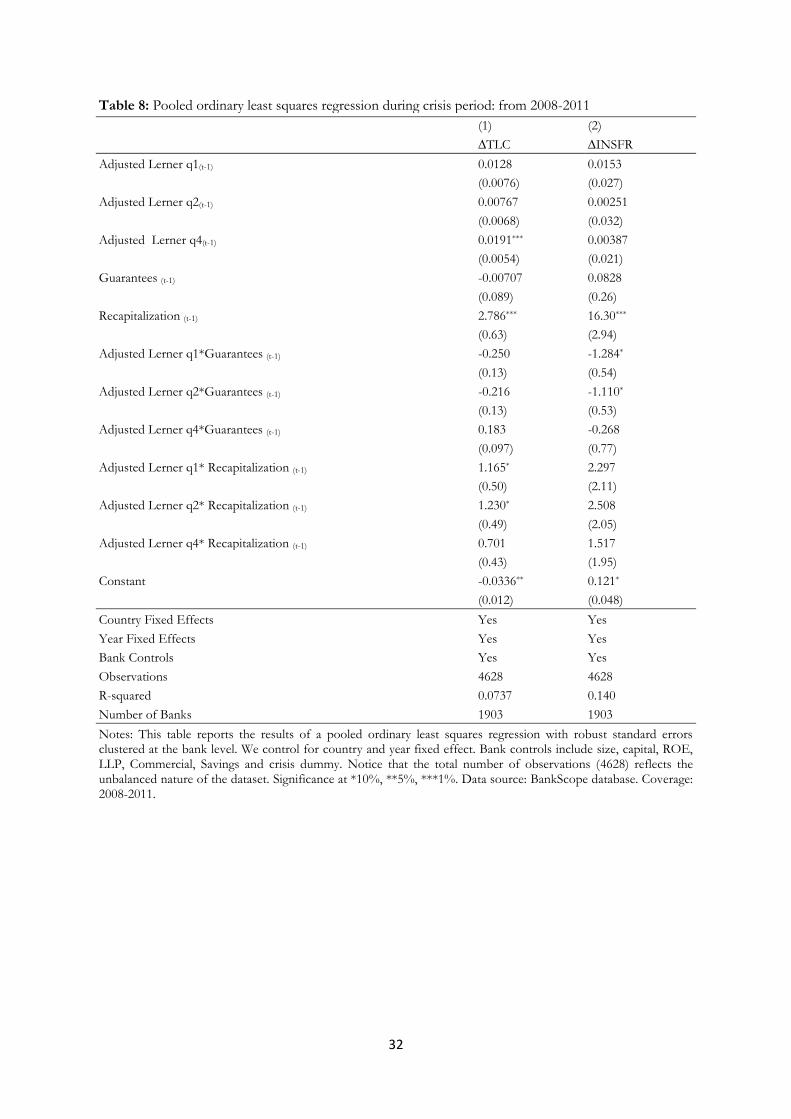
32
Table 8: Pooled ordinary least squares regression during crisis period: from 2008-2011
(1) (2) ∆TLC ∆INSFR
Adjusted Lerner q1(t-1) 0.0128 0.0153 (0.0076) (0.027)
Adjusted Lerner q2(t-1) 0.00767 0.00251 (0.0068) (0.032)
Adjusted Lerner q4(t-1) 0.0191*** 0.00387 (0.0054) (0.021)
Guarantees (t-1) -0.00707 0.0828 (0.089) (0.26)
Recapitalization (t-1) 2.786*** 16.30*** (0.63) (2.94)
Adjusted Lerner q1*Guarantees (t-1) -0.250 -1.284* (0.13) (0.54)
Adjusted Lerner q2*Guarantees (t-1) -0.216 -1.110* (0.13) (0.53)
Adjusted Lerner q4*Guarantees (t-1) 0.183 -0.268 (0.097) (0.77)
Adjusted Lerner q1* Recapitalization (t-1) 1.165* 2.297 (0.50) (2.11)
Adjusted Lerner q2* Recapitalization (t-1) 1.230* 2.508 (0.49) (2.05)
Adjusted Lerner q4* Recapitalization (t-1) 0.701 1.517 (0.43) (1.95)
Constant -0.0336** 0.121* (0.012) (0.048)
Country Fixed Effects Yes Yes
Year Fixed Effects Yes Yes
Bank Controls Yes Yes
Observations 4628 4628
R-squared 0.0737 0.140
Number of Banks 1903 1903
Notes: This table reports the results of a pooled ordinary least squares regression with robust standard errors clustered at the bank level. We control for country and year fixed effect. Bank controls include size, capital, ROE, LLP, Commercial, Savings and crisis dummy. Notice that the total number of observations (4628) reflects the unbalanced nature of the dataset. Significance at *10%, **5%, ***1%. Data source: BankScope database. Coverage: 2008-2011.
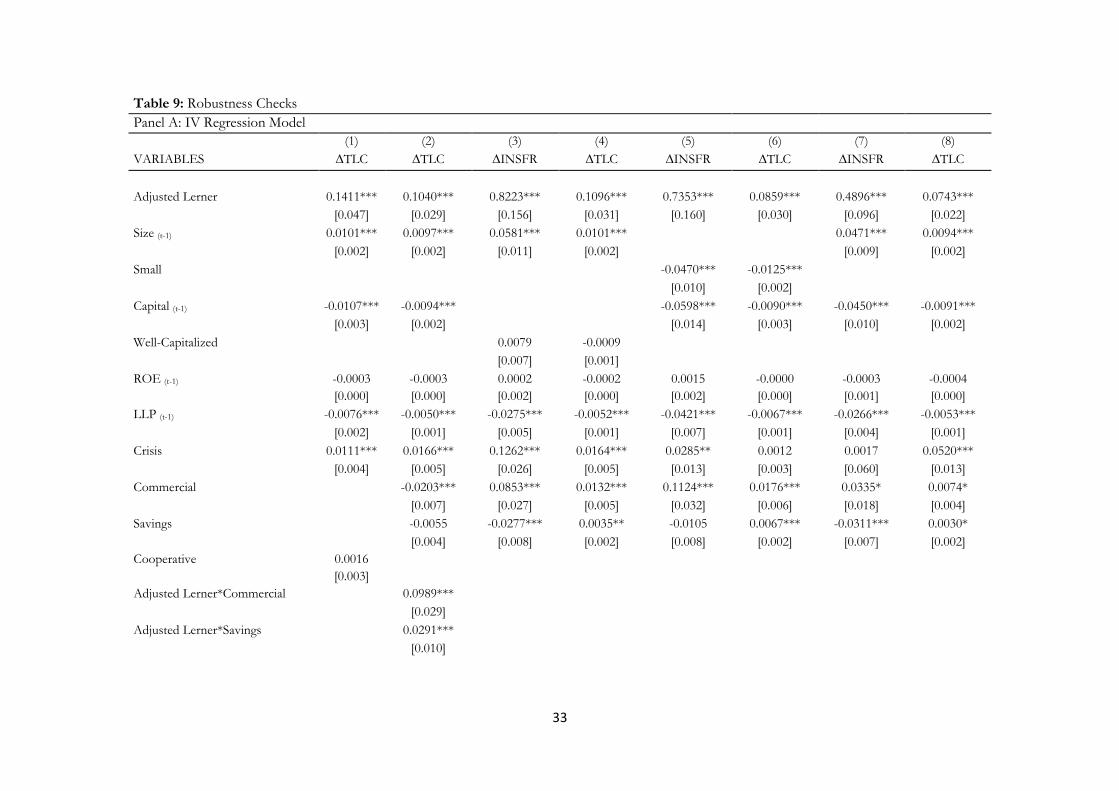
33
Table 9: Robustness Checks
Panel A: IV Regression Model
(1) (2) (3) (4) (5) (6) (7) (8)
VARIABLES ∆TLC ∆TLC ∆INSFR ∆TLC ∆INSFR ∆TLC ∆INSFR ∆TLC
Adjusted Lerner 0.1411*** 0.1040*** 0.8223*** 0.1096*** 0.7353*** 0.0859*** 0.4896*** 0.0743***
[0.047] [0.029] [0.156] [0.031] [0.160] [0.030] [0.096] [0.022]
Size (t-1) 0.0101*** 0.0097*** 0.0581*** 0.0101*** 0.0471*** 0.0094***
[0.002] [0.002] [0.011] [0.002] [0.009] [0.002]
Small -0.0470*** -0.0125***
[0.010] [0.002]
Capital (t-1) -0.0107*** -0.0094*** -0.0598*** -0.0090*** -0.0450*** -0.0091***
[0.003] [0.002] [0.014] [0.003] [0.010] [0.002]
Well-Capitalized 0.0079 -0.0009
[0.007] [0.001]
ROE (t-1) -0.0003 -0.0003 0.0002 -0.0002 0.0015 -0.0000 -0.0003 -0.0004
[0.000] [0.000] [0.002] [0.000] [0.002] [0.000] [0.001] [0.000]
LLP (t-1) -0.0076*** -0.0050*** -0.0275*** -0.0052*** -0.0421*** -0.0067*** -0.0266*** -0.0053***
[0.002] [0.001] [0.005] [0.001] [0.007] [0.001] [0.004] [0.001]
Crisis 0.0111*** 0.0166*** 0.1262*** 0.0164*** 0.0285** 0.0012 0.0017 0.0520***
[0.004] [0.005] [0.026] [0.005] [0.013] [0.003] [0.060] [0.013]
Commercial -0.0203*** 0.0853*** 0.0132*** 0.1124*** 0.0176*** 0.0335* 0.0074*
[0.007] [0.027] [0.005] [0.032] [0.006] [0.018] [0.004]
Savings -0.0055 -0.0277*** 0.0035** -0.0105 0.0067*** -0.0311*** 0.0030*
[0.004] [0.008] [0.002] [0.008] [0.002] [0.007] [0.002]
Cooperative 0.0016
[0.003]
Adjusted Lerner*Commercial 0.0989***
[0.029]
Adjusted Lerner*Savings 0.0291***
[0.010]
34
Table 9 (continued)
Adjusted Lerner*Cooperative -0.1123***
[0.042]
Adjusted Lerner* Well-Capitalized -0.2348*** -0.0310***
[0.047] [0.009]
Adjusted Lerner*Small -0.5305*** -0.0533**
[0.139] [0.026]
GDP -0.0166** 0.0036**
[0.007] [0.001]
Inflation 0.0413*** 0.0065***
[0.009] [0.002]
Constant -0.0503*** -0.0571*** -0.5203*** -0.0818*** -0.0387 -0.0034 -0.3267*** -0.0812***
[0.011] [0.013] [0.097] [0.019] [0.039] [0.007] [0.054] [0.013]
Panel B: Specification tests for IV regression models on the adequacy of instruments
Observations 15,761 15,761 15,761 15,761 15,761 15,761 15,761 15,761 Wooldrige (1995) overidentification
Chi square 0.000 0.000 0.00240 0.000733 0.000 0.000 0.0062 0.0062 p-value 1.00 1.00 0.961 0.978 0.710 1.00 0.937 1.00 Wooldrige (1995) exogeneity test 15.65 16.34 72.223 16.695 61.001 11.55 43.85 13.59 Score 0.000 0.000 0.000 0.000 0.000 0.0002 0.000 0.0002 p-value Robust F statistic 15.56 16.24 70.661 16.597 59.809 11.50 43.23 13.59 p-value 0.000 0.000 0.000 0.000 0.000 0.0002 0.000 0.0002 First-stage diagnostics R2 value 0.4883 0.3871 0.3941 0.3941 0.2792 0.2792 0.2542 0.2542 Robust F-Statistic 22.1443 50.1485 45.2846 45.2846 27.9362 27.9362 58.721 58.721 P-value 0.000 0.000 0.000 0.000 0.000 0.000 0.000 0.000
Notes: this table presents the results of vaious robustness tests. Columns 1 and 2 present the results for bank market power and bank specialization. Columns 3 and 4 present the results for bank market power and capital. Columns 5 and 6 presnt the result for bank market power and small size banks. Finally, columns 7 and 8 presents the results including macroeconomic control variables. Significance at *10%, **5%, ***1%. Data source: BankScope database. Coverage: 2006-2015.
35
Table 10: Robustness Checks- Clustering Standard Errors by Bank and Year
(1) (2)
VARIABLES ∆INSFR ∆TLC
Adjusted Lerner 0.5881*** 0.0786***
[0.098] [0.020]
Size (t-1) 0.0555*** 0.0097 ***
[0.009] [0.001]
Capital (t-1) -0.0565*** -0.0093***
[0.010] [0.002]
ROE (t-1) -0.0009 -0.0004
[0.001] [0.000]
LLP (t-1) -0.0316*** -0.0057***
[0.004] [0.001]
Crisis 0.1091*** 0.0141***
[0.020] [0.004]
Commercial 0.0440** 0.0077**
[0.019] [0.003]
Savings -0.0311*** 0.0031*
[0.007] [0.001]
Constant -0.3549*** -0.0599***
[0.062] [0.012]
Observations 15,761 15,761 R2 value 0.2529 0.2529 Robust F-Statistic 64.8617 64.8617 P-value 0.000 0.000
Notes: This table presents the results as we correct standard errors for clustering at the bank and year.
We estimate Δ𝑌𝑖𝑡 = 𝑐0 + 𝑑1𝐴𝑑𝑗𝑢𝑠𝑡𝑒𝑑 𝐿𝑒𝑟𝑛𝑒𝑟𝑖𝑡̂ + 𝑑2𝑋𝑖,𝑡−1 + 𝛾𝑡 + 𝛾𝑐 + 휀𝑖𝑡 , where Δ𝑌𝑖𝑡 denotes the dependent
variable of bank 𝑖 at time 𝑡. The dependent variables are measures of liquidity creation. Inverse net
stable funding ratio (∆I.NSFR) in column1 , total liquidity creation (∆TLC) in column 2. The main
explanatory variable is the (Adjusted Lerner). Country and time-specific effects included but not reported.
Significance at *10%, **5%, ***1%. Data source: BankScope database. Coverage: 2006-2015.
36
Table 11: Robustness Checks- Alternative Liquidity Creation Proxy
(3) (4) (5) (6)
VARIABLES Adjusted Lerner
Traditional Lerner ∆INSFR ∆INSFR
Financial freedom 0.0113*** 0.00356**
[0.0020] [0.0013]
Bank activities 0.750***
0.0655
[0.089] [0.095]
Entry restrictions -0.0969*** -0.0652***
[0.0057] [0.0093]
Adjusted Lerner 0.3405***
[0.070]
Lerner 1.0841***
[0.355]
Size (t-1) -0.0949*** -0.0549*** 0.0313*** 0.0585***
[0.0078] [0.0042] [0.006] [0.019]
Capital (t-1) 0.0654***
0.0238*** -0.0182*** -0.0217***
[0.0053] [0.0032] [0.004] [0.008]
ROE (t-1) 0.00429
0.0110*** -0.0008 -0.0112***
[0.0035] [0.0013] [0.001] [0.004]
LLP (t-1) 0.0442*** 0.0432*** -0.0197*** -0.0515***
(0.0097) [0.0049] [0.003] [0.014]
Commercial -0.128** -0.0151 0.0351*** 0.0080
[0.048]
[0.024] [0.012] [0.019]
Savings 0.0163 0.0126 -0.0151*** -0.0232***
[(0.019] [0.0099] [0.004] [0.007]
Crisis -0.300***
-0.0552*** 0.0635*** 0.0213
(0.026) [0.016] [0.014] [0.013]
Constant -0.191 0.555** -0.2833*** -0.4086***
[0.20] [0.21] [0.051] [0.116]
Observations 17,883 17,883 17,883 17,883 Wooldrige (1995) overidentification Chi square 0.00 0.00 p-value 1.00 0.9996 Wooldrige (1995) exogeneity test score 63.86 65.97 p-value 0.000 0.000 Robust F statistic 65.96 68.07 p-value 0.000 0.000 First-stage diagnostics R2 value 0.1910 0.3879 Robust F-Statistic 40.6667 11.1933 P-value 0.000 0.000
Notes: this table presents the results of a further robustness check of using alternative measure of liquidity creation applying Basel III more recent October 2014 factors to calculate the INSFR in columns 5 and 6. Robust standard errors are reported in parentheses. Country and time-specific effects included but not reported. Panel B: reports specification tests for validity of instruments. The instruments used are 1) financial freedom provides overall measures of the openness of the banking sector. 2) Bank activity restrictions and 3) Entry restrictions. The null hypothesis of the robust Wooldrige overidentification score test is that instruments are valid. The null hypothesis for the exogeneity test is that the instrument variable is not endogenous. F statistic report the explanatory power of the regressions. Significance at *10%, **5%, ***1%. Data source: BankScope database. Coverage: 2006-2015.
37
Appendix A: Variable Definitions and Sources Name Description Data Source
A. Measures of Market Power Cost of fixed assets sum of general administrative expenses, depreciation, amortisation, occupancy costs, software costs, operating
lease rentals and other operating expenses, divided by fixed assets BankScope database
Cost of labour personnel expenses divided by total assets BankScope database Cost of borrowed funds total interest expenses divided by total deposits, money markets and short-term funding BankScope database Total securities Sum of reverse repos and cash collateral, trading securities and FV through income, derivatives, AFS securities,
HTM securities, at-equity investments in associates and other securities. BankScope database
Total loans Sum of residential mortgage loans, other mortgage loans, other consumer/retail loans, corporate and commercial loans and other loans.
BankScope database
Equity total common equity BankScope database Operating costs sum of total interest expenses, loan impairment charge, other operating expenses and personnel expenses BankScope database Profit before tax Pre-tax profit BankScope database B. Measures of Liquidity Creation I.NSFR Required Stable Funding divided by Available Stable Funding (Basel III) BankScope database TLC/ Total assets measure of liquidity creation based on Berger et al., 2016 BankScope database LC off-balance sheet / Total assets measure of liquidity creation based on Berger et al., 2016 BankScope database LC asset side/ Total assets measure of liquidity creation based on Berger et al., 2016 BankScope database LC liability side/ Total assets measure of liquidity creation based on Berger et al., 2016 BankScope database C. Bank characteristics
Size Total assets in logarithmic form. BankScope database Capital Total equity to total assets BankScope database LLP Loan loss provisions divided by total loans BankScope database ROE Return on equity (%) BankScope database Crisis dummy Dummy variable. It takes value 1 for the years 2008 and 2009 and 0 otherwise. BankScope database Commercial Dummy variable. It takes value 1 for commercial banks and 0 otherwise. BankScope database Savings Dummy variable. It takes value 1 for savings banks and 0 otherwise. BankScope database Cooperatives Dummy variable. It takes value 1 for Cooperative banks and 0 otherwise. BankScope database D. Country- level variables
GDP Growth Rate of growth of the Gross Domestic Product (real) World Bank Inflation rate of consumer price index World Bank E. Instrumental variables
Banking activity restrictions the degree to which national regulatory authorities allow banks to engage in the following three fee-based rather than more traditional interest-spread-based activities: Securities activities, insurance activities and real estate activities
Barth et al. (2001) and Barth et al. (2004)
Entry restrictions The specific legal requirements for obtaining a license to operate as a bank. This variable takes on values between (1) and (8), where higher values indicate lower entry restrictions.
Barth et al. (2001) and Barth et al. (2004)
Banking freedom An indicator for the openness of a banking system. The index offers data on whether foreign banks are allowed to operate freely, on difficulties faced when establishing banks, and on government influence over credit allocation. The index ranges from 0 to 100 percent, where higher values indicate fewer restrictions.
Heritage foundation.
38
Appendix B: Classification of bank activities as documented in the Basel III report and construction of I.NSFR as a liquidity creation measure from
BankScope and associated ASF and RSF.
Basel Proposal BankScope Item Structure (Used in NSFR Calculations)
Factors following Distinguin et al. (2013)
Available Stable Funding (ASF)
Equity & Liabilities
Total regulatory Capital Shareholders' Equity 1.00
Secured and unsecured borrowings and liabilities > 1 year Total long-term funding 1.00
Senior debt maturing after 1 year 1.00
Subordinated borrowing 1.00
Other funding 1.00
Stable deposits < 1 year Customer deposits- Savings 0.7
Customer deposits- Term 1.00
Less stable deposits < 1 year Customer deposits-Current 0.7
Required Stable Funding (RSF) Assets cash immediately available to meet obligations Cash and due from banks 0
loans to financial entities < 1 year Loans and advances to banks 0
Marketable securities ≥ 1 year representing claims on sovereigns, Central Banks, BIS, IMF, Marketable securities and other short-term investments 0
EC, non-central government PSEs
loans to non-financial corporate clients < 1 year Corporate and commercial loans 1
loans to retail < 1 year Other consumer/ Retail loans 1
loans to non-financial corporate clients > 1 year Corporate and commercial loans 0.65
loans to retail > 1 year Other consumer/ Retail loans 0.85
Residential mortgages of any maturity Residential mortgage loans 0.65
other mortgage loans 0.65
39
Appendix B (Continued )
Basel Proposal BankScope Item Structure (Used in NSFR Calculations) Factor October 2014
Other performing loans with risk weights greater than 35% under the Standardised Approach and residual maturities of one year or more Other loans 0.85
equity securities not issued by financial institutions
All other assets not included in the above categories Other earning assets 1.00
Total assets - total earning assets 1.00
Investment in property 1.00
Fixed assets 1.00
Insurance assets 1.00
Other assets 1.00
Off-Balance Sheet Items
Irrevocable and conditionally revocable credit and liquidity facilities to any client Managed Securitized assets reported off-balance sheet 0.05
Other off-balance sheet exposure to securitizations 0.05
Guarantees 0.05
Acceptances & documentary credits reported off-balance sheet
0.05
Committed credit lines 0.05
Other contingent liabilities 0.05
Notess: Source: Basel III, BankScope and authors’ calculation.
40
Appendix C: Classification of bank activities and construction of five liquidity creation measures
Step 1: Classify all bank activities as liquid, semi-liquid, or illiquid based on product category "Cat" and maturity "Mat" Step 2: Assign weights to the items classified in Step 1.
ASSETS Illiquid assets (weight= 1/2) Semi-liquid assets (weight=0) Liquid assets (weight= -1/2)
Corporate and commercial loans Residential mortgage loans Cash and due from banks other loans Other mortgage loans Trading securities and at future
value through income Investments in property Other consumer/retail loans Derivatives Insurance assets Loans and advances to banks Available for sale securities Fixed assets Held to maturity securities At-equity investments in
associates Other securities
LIABILITIES PLUS EQUITY
Liquid liabilities(weight= 1/2) Semi-liquid liabilities (weight=0) Illiquid liabilities plus equity (weight= -1/2) Customer deposits-Current Customer deposits-Term Senior debt maturing after 1 year
Customer deposits-Savings Deposits from banks Subordinated borrowing Repos and cash collateral Other funding Other deposits and short-term borrowing Other liabilities Fair value portion of debt Total Equity
OFF-BALANCE-SEET ACTIVITIES
Illiquid OBS(weight= 1/2) Semi-liquid OBS (weight=0) Liquid OBS (weight= -1/2)
Acceptances and documentary credits reported OBS
Managed securitized assets reported OBS
Committed credit lines Other OBS exposure to securitizations
Other contingent liabilities Guarantees
41
Appendix C (Continued )
Step 3: Combine bank activities as classified in Step 1 and as weighted in Step 2 to construct our liquidity creation measures
TLC
+1/2 *illiquid assets + 1/2 * liquid liabilities + 1/2 * illiquid OBS
+ 0 * semi-liquid assets + 0* semi-liquid liabilities+ 0 *semi-liquid OBS
-1/2*liquid assets - 1/2 * illiquid liabilities - 1/2 * equity -1/2 * liquid OBS
LC OBS +1/2 * illiquid OBS + 0 *semi-liquid OBS -1/2 * liquid OBS
LC asset-side +1/2 *illiquid assets + 0 * semi-liquid assets -1/2*liquid assets
LC liability side + 1/2 * liquid liabilities
+ 0* semi-liquid liabilities -1/2 illiquid liabilities -1/2 * equity
Notes: We follow Berger and Bouwman (2009), Molyneux et al. (2016) and Berger et al. (2016) to classify the on- and off- balance sheet items. Source: BankScope database.
Related Documents