Journal of Financial Economics 00 (0000) 000-000 Bank governance, regulation and risk taking Luc Laeven a,b,c,* , Ross Levine d,e a International Monetary Fund, Washington, DC, 20431, USA b Centre for Economic Policy Research, London, EC 1V 0DG, UK c European Corporate Governance Institute, Brussels, 1180, Belgium d Department of Economics, Brown University, Providence, RI, 02912, USA e National Bureau of Economic Research, Cambridge, MA, 02138, USA Received 9 June 2008; received in revised format 4 August 2008; accepted 11 September 2008 ______________________________________________________________________ Abstract This paper conducts the first empirical assessment of theories concerning risk taking by banks, their ownership structures, and national bank regulations. We focus on conflicts between bank managers and owners over risk, and we show that bank risk taking varies positively with the comparative power of shareholders within the corporate governance structure of each bank. Moreover, we show that the relation between bank risk and capital regulations, deposit insurance policies, and restrictions on bank activities depends critically on each bank’s ownership structure, such that the actual sign of the marginal effect of regulation on risk varies with ownership concentration. These findings show that the same regulation has different effects on bank risk taking depending on the bank’s corporate governance structure. JEL Classifications: G21; G38; G18 Keywords: Corporate governance; Bank Regulation; Financial institutions; Financial risk ________________________________________________________________________ We received very helpful comments from an anonymous referee, Stijn Claessens, Francesca Cornelli, Giovanni dell’Ariccia, Phil Dybvig, Radhakrishnan Gopalan, Stuart Greenbaum, Christopher James, Kose John, Eugene Kandel, Hamid Mehran, Don Morgan, Gianni De Nicolo, Jose Luis Peydro, Anjan Thakor, and seminar participants at the Bank of Israel, Harvard Business School, Indiana University, Wharton School, the University of Minnesota, Washington University in St. Louis, and the World Bank. We thank Ying Lin for excellent assistance. This paper’s findings, interpretations, and conclusions are entirely ours and do not represent the views of the International Monetary Fund, its executive directors, or the countries they represent. *Corresponding author contact information: [email protected] 000-000X/00/ $ see front matter © 0000Published by Elsevier Science B.V. All rights reserved

Welcome message from author
This document is posted to help you gain knowledge. Please leave a comment to let me know what you think about it! Share it to your friends and learn new things together.
Transcript

Journal of Financial Economics 00 (0000) 000-000
Bank governance, regulation and risk taking
Luc Laevena,b,c,*, Ross Levined,e
aInternational Monetary Fund, Washington, DC, 20431, USA bCentre for Economic Policy Research, London, EC 1V 0DG, UK
cEuropean Corporate Governance Institute, Brussels, 1180, Belgium dDepartment of Economics, Brown University, Providence, RI, 02912, USA
eNational Bureau of Economic Research, Cambridge, MA, 02138, USA
Received 9 June 2008; received in revised format 4 August 2008; accepted 11 September 2008
______________________________________________________________________
Abstract This paper conducts the first empirical assessment of theories concerning risk taking by banks, their ownership structures, and national bank regulations. We focus on conflicts between bank managers and owners over risk, and we show that bank risk taking varies positively with the comparative power of shareholders within the corporate governance structure of each bank. Moreover, we show that the relation between bank risk and capital regulations, deposit insurance policies, and restrictions on bank activities depends critically on each bank’s ownership structure, such that the actual sign of the marginal effect of regulation on risk varies with ownership concentration. These findings show that the same regulation has different effects on bank risk taking depending on the bank’s corporate governance structure.
JEL Classifications: G21; G38; G18
Keywords: Corporate governance; Bank Regulation; Financial institutions; Financial risk
________________________________________________________________________
We received very helpful comments from an anonymous referee, Stijn Claessens, Francesca Cornelli, Giovanni dell’Ariccia, Phil Dybvig, Radhakrishnan Gopalan, Stuart Greenbaum, Christopher James, Kose John, Eugene Kandel, Hamid Mehran, Don Morgan, Gianni De Nicolo, Jose Luis Peydro, Anjan Thakor, and seminar participants at the Bank of Israel, Harvard Business School, Indiana University, Wharton School, the University of Minnesota, Washington University in St. Louis, and the World Bank. We thank Ying Lin for excellent assistance. This paper’s findings, interpretations, and conclusions are entirely ours and do not represent the views of the International Monetary Fund, its executive directors, or the countries they represent.
*Corresponding author contact information: [email protected] 000-000X/00/ $ see front matter © 0000Published by Elsevier Science B.V. All rights reserved
2
1. Introduction
In this paper, we analyze risk taking by banks, their ownership structures, and national bank
regulations. We focus on the potential conflicts between bank managers and owners over risk, and
assess whether bank risk taking varies with the comparative power of shareholders within the
corporate governance structure of each bank. Moreover, we examine whether the relation between
national regulations and bank risk depends on each bank’s ownership structure.
Policy considerations motivate this research. As emphasized by Bernanke (1983), Calomiris
and Mason (1997, 2003a, 2003b), Keeley (1990), and recent financial turmoil, the risk taking
behavior of banks affects financial and economic fragility. In turn, international and national agencies
propose an array of regulations to shape bank risk. Yet, researchers have not assessed how standard
corporate governance mechanisms, such as ownership structure, interact with national regulations in
shaping the risk taking behavior of individual banks. This gap is surprising because standard agency
theories suggest that ownership structure influences corporate risk taking (Jensen and Meckling,
1976; John, Litov, and Yeung, 2008). This gap is also potentially serious from a policy perspective.
The same regulations could have different effects on bank risk taking depending on the comparative
power of shareholders within the ownership structure of each bank. Changes in policies toward bank
ownership, such as allowing private equity groups to invest in banks or changing limits on ownership
concentration, could have very different effects on bank stability depending on other bank
regulations.
Existing research further advertises the value of simultaneously examining bank risk,
ownership structure, and bank regulations. Studying nonfinancial firms, Agrawal and Mandelker
(1987) find an inverse relation between risk taking and the degree of managerial control, while John,
Litov, and Yeung (2008) find that managers enjoying large private benefits of control select
3
suboptimally conservative investment strategies. Yet, research on bank risk taking typically does not
incorporate information on each bank’s ownership structure (Keeley, 1990; Kroszner and Rajan,
1994; Hellmann, Murdoch, and Stiglitz, 2000; and Demirguc-Kunt and Detragiache, 2002). In an
influential exception, Saunders, Strock, and Travlos (1990) find that owner controlled banks exhibit
higher risk taking behavior than banks controlled by managers with small shareholdings. They do
not, however, test whether ownership structure and regulations jointly shape bank risk taking, or
whether their results generalize beyond the United States to countries with distinct laws and
regulations. No previous research evaluates theoretical predictions concerning the interactive effects
of national regulations and bank-specific ownership structure on the risk taking behavior of
individual banks.
We frame our empirical analysis around three theoretical keystones. First, diversified owners
(owners who do not have a large fraction of their personal wealth invested in the bank) tend to
advocate for more bank risk taking than debt holders and nonshareholder managers (managers who
do not have a substantial equity stake in the bank). As in any limited liability firm, diversified owners
have incentives to increase bank risk after collecting funds from bondholders and depositors (Galai
and Masulis, 1976; and Esty, 1998). Similarly, managers with bank-specific human capital skills and
private benefits of control tend to advocate for less risk taking than stockholders without those skills
and benefits (Jensen and Meckling, 1976; Demsetz and Lehn, 1985; and Kane, 1985). From this
perspective, banks with an ownership structure that empowers diversified owners take more risk than
banks with owners who play a more subdued governance role.
Second, theory predicts that regulations influence the risk-taking incentives of diversified
owners differently from those of debt holders and nonshareholder managers. For example, deposit
insurance intensifies the ability and incentives of stockholders to increase risk (Merton, 1977; and

4
Keeley, 1990). The impetus for greater risk taking generated by deposit insurance operates on
owners, not necessarily on nonshareholder managers. As a second example, consider capital
regulations. One goal of capital regulations is to reduce the risk-taking incentives of owners by
forcing owners to place more of their personal wealth at risk in the bank (Kim and Santomero, 1994).
Capital regulations need not reduce the risk-taking incentives of influential owners, however.
Specifically, although capital regulations might induce the bank to raise capital, they might not force
influential owners to invest more of their wealth in the bank. Furthermore, capital regulations might
increase risk taking. Owners might compensate for the loss of utility from more stringent capital
requirements by selecting a riskier investment portfolio (Koehn and Santomero, 1980, and Buser,
Chen, and Kane, 1981), intensifying conflicts between owners and managers over bank risk taking.
As a final example, many countries attempt to reduce bank risk by restricting banks from engaging in
nonlending activities, such as securities and insurance underwriting (Boyd et al., 1998). As with
capital requirements, however, these activity restrictions could reduce the utility of owning a bank,
intensifying the risk-taking incentives of owners relative to managers. Thus, the impact of regulations
on risk depends on the comparative influence of owners within the governance structure of each
bank.
Third, while banking theory suggests that bank regulations affect the risk-taking incentives of
owners differently from those of managers, corporate governance theory suggests that ownership
structure affects the ability of owners to influence risk (Jensen and Meckling, 1976). As argued by
Shleifer and Vishny (1986), shareholders with larger voting and cash flow (CF) rights have
correspondingly greater power and incentives to shape corporate behavior than smaller owners. From
this perspective, ownership structure influences the ability of owners to alter bank risk in response
both to standard risk shifting incentives and to incentives created by official regulations (Boyd and

5
Hakenes, 2008). Thus, we examine how ownership structure interacts with bank regulation in shaping
the risk-taking behavior of individual banks.
These theoretical keystones combine to make two testable predictions. First, diversified
owners have stronger incentives to increase risk than nonshareholding managers, so banks with
powerful, diversified owners tend to be riskier than widely held banks, holding other factors constant.
Second, bank regulations (such as capital requirements, activity restrictions, and deposit insurance)
affect the risk-taking incentives of owners differently from managers, so the actual impact of
regulations on risk taking depends on the comparative power of shareholders relative to managers
within each bank’s corporate governance structure. This framework, however, does not consider
optimal risk taking. Instead, our more modest goal is to provide the first empirical assessment of
theoretical predictions concerning how a bank’s ownership structure interacts with national
regulations in shaping bank risk taking.
To assess these predictions, we compile new data on individual banks from economies with
different regulations, yielding a database of more than 250 privately owned banks across 48
countries. On ownership, we first measure whether the bank is widely held, i.e., the bank does not
have a large owner with at least 10% of the bank’s voting rights. We next distinguish among banks
with a large owner by computing the voting and cash flow rights of the largest owner. We then
collect bank level data on both owners and managers because theory stresses potential tensions
between stockholders and managers. If managers have accumulated bank-specific human capital or
enjoy private benefits of control, they seek less risk taking than stockholders without those skills and
benefits (Demsetz and Lehn, 1985; and Kane, 1985). Because tensions between owners and managers
might be mitigated when senior managers hold large equity stakes (Houston and James, 1995), we
calculate and control for the voting and cash flow rights of senior managers and for whether large
6
owners are on the board of directors. Theory also suggests that the risk-taking incentives of owners
are mitigated if the owners have a large portion of their personal wealth invested in the bank. We
would optimally like to have information on each owner’s personal portfolio, but these data are
unavailable. Instead, we condition on the degree to which the bank is primarily family-owned and
also test whether a nonlinear relation exists between the cash flow and voting rights of the controlling
shareholder and risk. We use several measures of bank risk taking and focus primarily on each bank’s
z-score, which is inversely related to the probability of bank insolvency. We also examine each
bank’s volatility of return on assets, volatility of equity returns, volatility of bank earnings, and
capital asset ratio.
The key findings are as follows. First, bank risk is generally higher in banks that have large
owners with substantial cash flow rights. Consistent with theory, greater cash flow rights by a large
owner are associated with more risk. This finding holds when conditioning on international
differences in bank regulations or when including country fixed effects. Ignoring ownership structure
provides an incomplete analysis of bank risk taking.
Second, the relation between risk and regulation depends critically on each bank’s ownership
structure, such that the relation between regulation and bank risk can change sign depending on
ownership structure. For example, the results suggest that deposit insurance is associated with an
increase in risk only when the bank has a large equity holder with sufficient power to act on the
additional risk-taking incentives created by deposit insurance. The data also suggest that owners seek
to compensate for the utility loss from capital regulations and activity restrictions by increasing bank
risk. Stricter capital regulations and more stringent activity restrictions are associated with greater
risk when the bank has a sufficiently powerful owner, but stricter capital regulations have the

7
opposite effect in widely held banks. Ignoring bank governance leads to erroneous conclusions about
the risk taking effects of banking regulations.
To explore more fully the channels linking ownership, risk, and regulation, we allow for the
joint determination of bank risk and valuation. Regulations and ownership structure might influence
bank risk primarily by altering bank valuations. We therefore allow for the simultaneous
determination of risk and valuation by extending the work of Keeley (1990) and John, Litov, and
Yeung (2008). We confirm the paper’s results when endogenizing bank valuations. Thus, this paper’s
conclusions on ownership, capital stringency regulations, and risk hold beyond any indirect
connection operating through bank valuations.
The paper is organized as follows. Section 2 summarizes the data. Section 3 presents initial
results. Section 4 assesses how the relation between risk and regulation varies with ownership
structure. Section 5 simultaneously estimates risk and valuation. Section 6 concludes.
2. Data and summary statistics
We build a new database to examine whether ownership structure affects bank risk and
whether the impact of national regulations on bank risk depends on the ownership structure of
individual banks. Data permitting, we collect information on the ten largest publicly listed banks (as
defined by total assets at the end of 2001) in those countries for which La Porta, Lopez-de-Silanes,
Shleifer, and Vishny (1998) assembled data on shareholder rights. We exclude New Zealand because
all its major banks are subsidiaries of Australian banks, which are already included in the sample.
Because some countries have data on fewer than ten publicly listed banks, this yields information on
a maximum of 279 banks across 48 countries. Focusing on the largest banks enhances comparability
because they tend to comply with international accounting standards and have more liquid shares,

8
reducing concerns that accounting or liquidity differences drive the results. Furthermore, we
eliminate all state-owned banks (defined as banks with majority stakes by the government over the
sample period) because theory focuses on the incentives of private owners relative to managers, not
the government relative to government employees. On average, our sample accounts for over 80% of
total banking system assets in each country held by privately run banks. When eliminating countries
for which the sample covers less than 50% of total banking assets, the results hold.
2.1. Ownership structure: control rights and cash flow rights
We start with the Caprio, Laeven, and Levine (2007) data on bank ownership in 2001, which
classifies a bank as having a large owner if the shareholder has direct and indirect voting rights that
sum to 10% or more. If no shareholder holds 10% of the voting rights, the bank is classified as widely
held. This paper’s results hold when using a 20% cutoff to define a large owner.
While direct ownership involves shares registered in the shareholder’s name, indirect
ownership involves bank shares held by entities that the ultimate shareholder controls. Because the
principal shareholders of banks are frequently themselves corporations, the major shareholders in
these entities must be found. Often, this indirect ownership chain must be traced backwards through
numerous corporations to identify the ultimate controllers of the votes. For example, a shareholder
has x% indirect control over bank A if she controls directly firm C that, in turn, controls directly firm
B, which directly controls x% of the votes of bank A. The control chain from bank A to firm C can be
a long sequence of firms, each of which has control (greater than 10% voting rights) over the next
one. If several chains of ownership are between a single shareholder and the bank, we sum the control
rights across all of these chains to compute the control rights of that shareholder. When multiple
shareholders have over 10% of the votes, we define the large owner as the owner with the greatest
voting rights.
9
The large shareholder could hold cash flow rights directly and indirectly. For example, if the
large shareholder of bank A holds the fraction y of CF rights in firm B and firm B in turn holds the
fraction x of the CF rights in bank A, then the large shareholder’s indirect CF rights in bank A equals
the product of x and y. If there is an ownership chain, we use the products of the CF rights along the
chain. To compute total CF rights we sum direct and indirect CF rights.
By focusing on the large shareholder’s CF rights, we capture both the incentives of owners
toward risk and the ability of owners to influence risk. On ability, we first measure whether the bank
has a large owner or whether the bank is widely held. Then, conditional on the bank having a large
owner, we measure the cash flow rights of the shareholder with the largest number of voting rights.
CF rights are highly correlated with voting rights, so they provide additional information about the
power of the largest owner. On incentives, CF rights provide a more direct measure of the risk-taking
incentives of owners than voting rights. Profitable outcomes are distributed to owners based on cash
flow rights, not through control rights. In robustness tests, we examine the wedge between voting and
CF rights, which has been the focus of research on the private benefits of control.
2.2. Management structure
We collect new data on each bank’s board structure and managerial ownership. First, we set
the dummy variable large owner on mgt board equal to one if the large shareholder has a seat on the
management board and zero otherwise. Next, to assess theories about managerial shareholding and
risk, we compute the CF rights of executive managers and directors and refer to this variable as
management ownership. We collect data on the year the bank was founded and whether the founder
or the descendents of the founder are on the management or supervisory board. Data on these
variables are hand-collected using a variety of sources, including Bankers Almanac, Bankscope, 20F
filings, annual reports, and company websites.
10
2.3. Bank risk taking
We primarily measure bank risk using the z-score of each bank, which equals the return on
assets plus the capital asset ratio divided by the standard deviation of asset returns. The z-score
measures the distance from insolvency (Roy, 1952). Insolvency is defined as a state in which losses
surmount equity (E<-π) (where E is equity and π is profits). The probability of insolvency, therefore,
can be expressed as prob (-ROA<CAR), where ROA (=π/A) is the return on assets and CAR (= E/A) is
the capital assets ratio. If profits are normally distributed, then the inverse of the probability of
insolvency equals (ROA+CAR)/σ(ROA), where σ(ROA) is the standard deviation of ROA. Following
the literature, we define the inverse of the probability of insolvency as the z-score.
A higher z-score indicates that the bank is more stable. Because the z-score is highly skewed,
we use the natural logarithm of the z-score, which is normally distributed. For brevity, we use the
label “z-score” in referring to the natural logarithm of the z-score in the remainder of the paper.
Furthermore, in assessing how bank risk varies with ownership structure and regulation, we want to
understand the degree to which cross-bank differences in bank stability (z-score) are accounted for by
differences in asset composition or by cross-bank differences in leverage. Thus, besides studying z-
score, which is a composite measure of bank stability, we separately examine the volatility of asset
returns, σ(ROA), and leverage, CAR.
We have data to calculate the z-score for 270 privately held banks across 48 countries. As
listed in the Appendix, the number of banks per country varies from ten to one. The paper’s results
hold when excluding countries with data on only one or two banks. We calculate the average return
on assets, its standard deviation, and the capital asset ratio over 1996 - 2001. The accounting data on
banks are from Bankscope, a commercial database on major international banks.
11
We confirm our results when using the volatility of equity returns and the volatility of
earnings as alternative measures of bank risk. Volatility of equity returns equals the annualized
volatility of weekly equity returns in 2001, which is also used by Saunders, Strock, and Travlos
(1990) and Esty (1998). We use the total return index (including reinvested dividends) from
Datastream. One advantage of the volatility of equity returns is that it is based on market, not
accounting, data. One disadvantage is that using equity volatility as a measure of risk reduces our
sample because we have weekly data on stock market returns only for 211 out of 270 banks. The
Volatility of earnings equals the standard deviation of the ratio of total earnings before taxes and loan
loss provisions to average total assets, computed over the period 1996 - 2001.
Finally, we also confirm the results using risk measures computed after 2001, which is the
year in which we observe bank ownership. The advantage of this approach is that risk is measured
after ownership. The disadvantage is that we lose a large portion of our sample because of mergers,
acquisitions, and bank failures. The full sample, which is the focus of the paper, includes almost 50%
more banks than the smaller sample based on post-2001 risk measures.
2.4. Bank regulations
This paper evaluates theoretical predictions that key bank regulations interact with ownership
structure to shape each bank’s risk taking behavior. In selecting data on regulation from the Barth,
Caprio, and Levine (2006) database, we use two criteria. First, we choose regulations stressed by the
Basel Committee. Second, we analyze regulations that theory highlights as affecting bank behavior.
Thus, we examine deposit insurance, capital regulations, and regulatory restrictions on bank
activities.
DI is a dummy variable that takes a value of one if the country has deposit insurance, and zero
otherwise. It is calculated from Demirguc-Kunt, Kane, and Laeven (2008). DI equals one both when
12
the country has explicit deposit insurance and when depositors were fully compensated the last time a
bank failed if the country did not have formal deposit insurance.
We use two indicators of national capital regulations from Barth, Caprio, and Levine (2006).
Capital Requirements equals the minimum capital requirement in the country. In most cases this is
8%, but in about one-third of the countries, the minimum capital requirement is between 8% and
12%. Capital stringency is an index of regulatory oversight of bank capital. This index is based on
the following questions: Is the minimum capital asset ratio requirement risk weighted in line with the
Basel guidelines? Does the minimum ratio vary as a function of market risk? Are market values of
loan losses not realized in accounting books deducted from capital? Are unrealized losses in
securities portfolios deducted? Are unrealized foreign exchange losses deducted? What fraction of
revaluation gains is allowed as part of capital? Are the sources of funds to be used as capital verified
by the regulatory or supervisory authorities? Can the initial disbursement or subsequent injections of
capital be done with assets other than cash or government securities? Can initial disbursement of
capital be done with borrowed funds? Thus, capital stringency does not measure statutory capital
requirements. Instead, it measures the regulatory approach to assessing and verifying the degree of
capital at risk in a bank.
Restrict is an index of regulatory restrictions on the activities of banks from Barth, Caprio,
and Levine (2006). This index measures regulatory impediments to banks engaging in securities
market activities (e.g., underwriting, brokering, dealing, and all aspects of the mutual fund industry),
insurance activities (e.g., insurance underwriting and selling), real estate activities (e.g., real estate
investment, development, and management), and the ownership of nonfinancial firms.
2.5. Other country-level and bank-level control variables

13
We control for numerous country level and bank level characteristics. At the country level, we
control for the level of economic development, aggregate economic volatility, institutional
development, degree of competition in national banking markets, and whether the authorities have
taken over a failing bank since 1995. At the bank level, product market conditions influence the
resolution of conflicting interests among stockholders, managers, and depositors. For instance,
Gorton and Rosen (1995) argue that intense competition that lowers the franchise value of incumbent
banks intensifies incentives for both stockholders and managers to increase risk. Consequently, we
control for bank growth, size, liquidity, loan loss provisions, and whether the bank accounts for more
than 10% of the nation’s deposits. Finally, we control for shareholder protection laws in each
country. Rights is the La Porta, Lopez-de-Silanes, Shleifer, and Vishny (1998) index of the statutory
rights of shareholders. It ranges from zero to six, where larger values indicate greater shareholder
rights. The six components in this index are (1) the country allows shareholders to mail proxy votes;
(2) shareholders are not required to deposit shares prior to the general shareholders’ meeting; (3)
cumulative voting or proportional representation of minorities on the board of directors is allowed;
(4) an oppressed minorities mechanism exists; (5) the minimum percentage of share capital that
entitles a shareholder to call for an extraordinary shareholders’ meeting is less than or equal to 10%;
and (6) shareholders have preemptive rights that can be waived only by a shareholders meeting.
We pay special attention to bank valuation. We measure bank valuation using the Tobin’s q of
each bank, which equals the market value of equity plus the book value of liabilities divided by the
book value of assets. We simultaneously estimate risk and valuation to better assess the potential
channels linking regulations, ownership, valuations, and bank risk.
2.6. Summary statistics
14
Large variation exists in bank fragility across countries. Table 1 provides summary statistics
and Table A-1 lists the averages of key variables for each country’s banks. Column 1 of Table A-1
presents the average z-score across all banks for each country in the sample. The z-score indicates
that profits have to fall by 57 times their standard deviation in Austria to deplete bank equity, but
profits need to fall by less than two standard deviations in Thailand to eliminate bank equity. Our
estimates of equity volatility of banks display a similar variation (Table A-1, Column 2). Volatility of
equity returns vary from a low of about 19% per annum in Denmark to a high of 95% in Turkey. The
average equity volatility is 45%.
Ownership and management structure vary enormously. As shown in Table 1 and Table A-1
1, the large owner averages more than 50% of the CF rights in six out of 48 countries, but in seven
other countries there is either no bank with a large owner or the average degree of CF rights is 5% or
less. Although all banks in Canada, Ireland, the United States, and Uruguay (in our sample) are
widely held, 20 out of 48 countries do not have a single widely held bank (among their largest
banks). Furthermore, considerable variability is found in managerial ownership. For 31% of banks,
the large owner (the largest owner with more than 10% of the voting rights) is also a senior manager.
However, on average, managerial ownership is only 6% of total bank shares. Indeed, in half of the
countries in our sample, no bank has managerial shareholdings of greater than 1%. The standard
deviation of managerial shareholdings is 15%. Finally, we find that the original founder of the bank
continues to manage the bank in 3% of the banks in our sample, and a descendant of the founder is a
manager in 14% of the banks. Thus, we consider a broad cross-section of countries to assess the
relation between risk and ownership.
The correlation matrix in Table 2 shows that more stable banks (as measured by higher z-
score or lower equity and earnings volatilities) have lower CF rights, and are located in countries with
15
fewer activity restrictions. Furthermore, risk is higher in banks where the large shareholder is a senior
manager. However, the relation between these private governance mechanisms and risk depends on
national policies. Furthermore, the z-score and equity volatility are (negatively) correlated with a
statistically significant correlation coefficient of 32%, while the negative correlation between z-score
and earnings volatility is 68% and also statistically significant.
3. Ownership structure and bank risk
We begin by examining the relationship between risk taking by banks and their ownership
structures. The primary measure of ownership structure is the CF rights of the largest owner, where
CF rights equals zero if the bank is widely held. We examine whether greater CF rights by the
largest owner is associated with greater risk as suggested by Jensen and Meckling (1976) and John,
Litov, and Yeung (2008). In Section 4, we extend the analysis by testing whether the relation between
risk and ownership structure varies with national regulations. Finally, in Section 5, we also allow for
the endogenous determination of the Tobin’s q of each bank. This is crucial because regulations and
ownership could influence bank risk by influencing bank valuations.
More formally, we estimate the following equation:
Zb,c = α*Xb,c + β*CFb,c + γ*Rc + δ*CFb,c*Rc + u b,c,
where Zb,c is the z-score of bank b in country c, Xb,c is a matrix of bank level control variables, CFb,c is
cash flow rights of bank b in country c, Rc are country level measures of bank regulations, u b,c is the
error term, and α, β, γ, and δ are vectors of coefficient estimates. In this section we do not consider
interactions between bank level ownership structure and national regulations (CFb,c*Rc). We examine
these interactions in Section 4. We begin by using ordinary least squares (OLS) with clustering at the
16
country level. Then, in Section 5, we use a simultaneous equations system to allow for the joint
determination of risk and valuation.
3.1. First Results
The overarching message from the regressions presented in Table 3 is that greater CF rights
by a large owner is associated with greater risk. In each of the ten bank level regressions, the standard
errors are adjusted to control for clustering at the country level. Regression 1 simply controls for
recent bank performance (revenue growth) and the CF rights (CF) of the large owner, where CF
equals zero if the bank is widely held. CF enters negatively and significantly at the 1% level,
indicating that the existence of a large owner with substantial cash flow rights is associated with
greater risk. The economic size of the coefficient on CF is consequential. A one standard deviation
change in CF (0.25) is associated with a change in z-score of 0.35 (=0.25*1.4), where the mean of z-
score is 2.9 and the standard deviation is 0.96.
These results are consistent with the view that owners tend to advocate for more bank risk
taking than managers and debt holders (Galai and Masulis, 1976; and Demsetz and Lehn, 1985) and
that large owners with substantial cash flow rights have greater incentives and power to increase bank
risk taking than small shareholders (Jensen and Meckling, 1976; and John, Litov, and Yeung, 2008).
Thus, CF is positively associated with bank risk.
The positive association between CF and risk holds when controlling for country traits and
even when including country fixed effects. To control for the possibility that the relation between
ownership structure and bank risk primarily reflects cross-country differences, instead of cross-bank
differences, in ownership structure, we control for many country-specific traits, including the level of
economic development in each bank’s country (per capita income), and include country fixed effects.
As shown in Table 3, the results are robust to conditioning on per capita income (Regression 3).
17
Furthermore, CF continues to enter negatively and significantly at the 6% level when controlling for
country fixed effects (Regression 2). While the economic size of the coefficient on CF drops by over
50% when controlling for country fixed effects, the analysis still indicates that more CF rights by a
large owner is associated with more risk taking. We also controlled for outliers. Specifically, we
exclude each country one at a time to test whether the banks from any single country determine the
results. All of the results hold.
These results suggest that the connection between risk and ownership structure does not
simply reflect the possibility that successful countries adopt good laws, regulations, and institutions,
which in turn induces banks to behave prudently and allows owners to diversify their holdings.
Instead, when only focusing on cross-bank variation, we find a strong association between ownership
structure and risk.
3.2. Alternative measures of bank stability
While we focus on examining the z-score of individual banks computed over the period 1996
- 2001, the results are robust to using alternative bank risk measures. We also examine equity
volatility, which equals the volatility of the bank’s equity returns over the period 1999-2001,
earnings volatility, which equals the volatility of the bank’s earnings over the period 1996 - 2001,
and z-score (02 - 04), which equals the z-score computed over the period 2002 - 2004, measuring the
z-score a few years after we observe ownership structure. However, this reduces the sample
substantially. Because the volatility of equity returns and the volatility of earnings are positively
related to risk, we expect the opposite signs on the estimated coefficients when these volatility
measures replace z-score as the dependent variable.
As shown in Table 3, Regressions 5 to 7, the key results on ownership are robust to using
alternative measures of bank risk taking. Higher CF is associated with greater risk taking. Though the

18
result are somewhat weaker with earnings volatility, CF enters negatively and significantly with a p-
value of 0.06 even with this measure that can be subject to substantial manipulation by banks. In sum,
the Table 3 results emphasize a robust connection between risk and ownership structure.
3.3. Identification and many controls
We were concerned that the joint determination of risk and ownership structure could bias the
results. For instance, high risk banks might form concentrated ownership structures if diffuse
shareholders have difficulty monitoring risky investments. In the estimation equation z = b*Z + u, z is
the vector of bank z-scores, Z the matrix of all explanatory variables, u the error term, and b the
vector of estimated coefficients. OLS is consistent only if Cov{u, Zi} = 0 for each regressor i, i.e.,
OLS is consistent only if no unobservable factors affect both ownership and risk.
We address this concern using a variety of strategies. While none is perfect, they all yield the
same conclusion. Larger CF is associated with greater risk. Nonetheless, we interpret the results very
cautiously. These results on the partial correlation between risk and ownership structure represent
some initial, descriptive findings that begin to integrate traditional corporate governance forces into
the study of bank risk taking. Furthermore, the paper’s major emphasis is on assessing whether the
relation between bank regulations and bank risk varies in a theoretically predictable manner with
bank ownership structure. As we show in Section 4, the empirical results are consistent with these
predictions.
3.3.1. Many controls
A commonly used strategy for reducing concerns that Cov{u, Zi} ≠ 0 is to saturate the
regression with a large number of bank and country characteristics to capture as much of the error
term u as possible (see also Demsetz and Lehn, 1985; and Bitler, Moskowitz, and Vissing-Jorgensen,
2005). We control for numerous country- and bank level traits in Regressions 8 to 10 of Table 3.
19
Besides per capita GDP (gross domestic product), we include indicators of capital regulations
(capital), activity restrictions (restrict), deposit insurance (DI), shareholder protection rights (rights),
and the degree to which the law is fairly and effectively enforced in a country (enforce). At the
banking system level, we include a measure of banking system concentration that equals the
percentage of banking system assets held by the five largest banks (concentration) because many
debate the link between bank concentration and risk (Allen and Gale, 2000, and Boyd and De Nicolo,
2005). We also condition on the mergers and acquisitions activities of all firms in a country (M&A)
because M&A activity might affect bank governance (Schranz, 1993; and Berger, Saunders, Scalise,
and Udell, 1998). Furthermore, in unreported regressions, we condition on measures of official
corruption, the degree to which the rule of law operates in the country, GDP volatility, and the return
on assets averaged across all banks in each country. These did not affect the conclusions.
At the bank level, we control for the extent to which senior managers hold shares in the bank
(managerial ownership) and whether the large owner (if there is a large owner) is on the management
board (large owner on mgt board). We also condition on revenue growth, size, loan loss provisions,
and the liquidity ratio. Moreover, in unreported regressions, we find that the results hold when
including dummy variables of whether the bank holds more than 10% of the country’s deposits (to
gauge if the bank is too big to fail) and whether the bank was recently intervened by the government.
Even when conditioning on all of these country- and bank level characteristics, CF rights are
positively associated with risk. In Table 3, restrict and DI both enter negatively and significantly,
suggesting that activity restrictions and deposit insurance increase bank risk, confirming findings by
Demirguc-Kunt and Detragiache (2002) and Barth, Caprio, and Levine (2004, 2006). Critically, CF
continues to enter the z-score regression negatively and significantly, with a similar coefficient size.
3.3.2. Instrumental variables
20
We use instrumental variables for each bank’s ownership structure. We primarily use the
average CF rights of other banks in the country, which captures industry and country factors
explaining CF. A positive feature of this instrument is that innovations in the risk of one bank does
not influence the cash flow rights of other banks. If innovations in national bank risk affect bank
ownership across all banks, however, then this instrument does not reduce endogeneity bias. Yet, this
seems unlikely because we find that bank ownership changes extremely little over time and the
results hold when controlling for national economic volatility. For regressions using the average CF
rights of other banks in the country as an instrumental variable, we exclude countries with only one
bank because we can compute the CF instrument only for countries with more than one bank, which
accounts for the drop in country coverage from 46 to 43 countries in Regression 4.
The instrumental variable results confirm that CF is negatively and significantly associated
with bank z-score, supporting the view that a large owner with sufficient incentives tends to increase
bank risk taking (Table 3, Regression 4). The instrument enters the first stage regression significantly
at the 1% level as demonstrated by the F-test of excluded instruments, accounts for 15% of the
variance of CF rights in the first stage as indicated by the partial R2 of excluded instruments, and
yields a different vector of coefficient estimates from those obtained using OLS as shown by the
Hausman test of endogeneity. The fact that the IV estimate of the coefficient on CF is larger in
absolute value terms than the OLS estimate suggests that OLS underestimates the true causal effect of
CF on bank stability.
In unreported regressions, we confirm these findings using alternative instruments. As a
different instrument for CF, we identified the year in which the bank was founded (founded) using
the Bankscope and Bankers Almanac databases. Older banks have had more time to diversify
ownership. Also, founded is unlikely to affect bank risk directly. Instead, by reducing CF of the

21
largest owner, founded affects the incentives of the owner to influence risk. Founded enters the first
stage regression with a p-value of 0.06, accounting for 3% of the variation of CF. If the age of the
bank is correlated with an unobserved bank-specific trait that drives bank risk, however, then founded
is an invalid instrument. But, a test of the overidentifying restrictions does not reject the validity of
founded as an instrument. Next, we include a dummy variable denoting whether the founder of the
bank is on the management or supervisory board (founder) as an instrument. If the founder of the
bank is still on the management or supervisory board, this implies a continuing large, controlling role
with correspondingly high CF. The partial correlation coefficient between CF and founder is 0.17.
One concern with founder is that shocks to risk might affect the probability of the founder being on
the board. Again, the overidentifying restrictions test does not reject the validity of the instruments,
and we confirm the results in Table 3.
3.4. Additional robustness tests
We conduct a series of additional robustness tests. We had concerns about the ownership
structure indicators. For instance, we are mixing firms with a large owner (CF>0) with widely held
firms (CF=0). We restrict the sample to only firms with a large owner and confirmed the results. We
also had concerns about defining large owners using the 10% voting rights cutoff. All of the results
hold using a 20% cutoff.
Critically, some theories suggest that owners with a very large proportion of their wealth tied
to the bank take less risk (for example, Jensen and Meckling, 1976; Saunders, Strock, and Travlos,
1990; and Kane, 1985). We include a dummy variable that takes on the value one if CF is above the
sample median and zero otherwise. Including this dummy variable does not change the results, and it
does not enter significantly. We also enter CF2 to test for nonlinearities, but the quadratic term did
not enter significantly. Moreover, we control for whether the bank is family owned and operated,

22
which would suggest that the owners have a large amount of wealth and human capital committed to
the bank (Bennedsen, Nielsen, Perez-Gonzalez, and Wolfenzon, 2007; and Perez-Gonzalez, 2006).
Specifically, we control for whether the founder of the bank, or a descendent of the founder, is on the
bank’s management or supervisory board. Controlling for family ownership did not alter any of the
results.
Furthermore, considerable research focuses on pyramidal ownership structures in which
voting rights are much greater than CF rights. The wedge between voting and CF rights is used to
gauge the degree to which owners have the power and incentives to expropriate bank resources
(Caprio, Laeven, and Levine, 2007; and Laeven and Levine, 2007, 2008). In focusing on risk, theory
suggests that CF rights are crucial, not the wedge. Wedge does not enter our regressions significantly,
and it does not affect our main results.
In addition, this paper’s results hold when eliminating banks associated with major mergers
and acquisitions. We were concerned that banks about to experience a major event might behave
differently and these banks might drive this paper’s results. Consequently, we trace the ownership
history of each bank using the Bankscope and Bankers Almanac databases and identify whether the
bank has undergone a major acquisition or merger between 2001 and 2005. All of the findings hold
when eliminating these banks.
Finally, we compute ownership structure in 2005 for a subsample of two hundred banks from
the 2001 sample following the approach in Caprio, Laeven, and Levine (2007). Ownership structure
is stable over time. Except when banks experience a major event, such as a merger or acquisition,
ownership structure does not vary. This indicates that ownership structure does not respond to short-
run fluctuations in bank risk. It also implies that changes in ownership structure do not account for
high frequency changes in risk. While economic and financial stability at low frequencies could
23
influence ownership structure in the long run, this paper’s results hold when conditioning on the
volatility of each country’s gross domestic product. In addition, because ownership structure does
not change much unless a bank experiences a merger or acquisition and because mergers and
acquisitions generally make accounting data incomparable over time, this reduces the value of panel
studies in this context.
4. Bank ownership and regulation
Beyond yielding predictions about the bivariate relation between risk and ownership structure,
some theories suggest that the relation between bank risk and ownership structure will vary with
national regulations (e.g., Shleifer and Vishny, 1986; Buser, Chen, and Kane, 1981; John, Saunders,
Senbet, 2000; and John, Litov, and Yeung, 2008). Thus, we now examine whether the relation
between risk and ownership structure depends on bank regulations. If the empirical results on these
conditional relations are consistent with theory, then any alternative explanation also has to account
for these interactive results, not simply the positive partial correlation between risk and CF.
Table 4 presents a series of regressions in which we examine the direct and interactive
associations among ownership structure, regulations, and bank risk. Specifically, after conditioning
on numerous country- and bank-level traits, we include the interaction term of each of the national
regulations with bank level ownership structure. Because we are examining individual banks, we
were not very concerned that an individual bank’s risk affects national regulations. Nonetheless, these
results hold when using instrumental variables for regulations. Based on Beck, Demirguc-Kunt, and
Levine (2003, 2006) and Barth, Caprio, and Levine (2006), we use legal origin and the religious
composition of each country as instruments for bank regulation. Given that we condition on the level
of income per capita, the most direct impact of religion and legal origin on bank risk runs through

24
bank regulations, not by altering bank risk through an alternative channel. Moreover, we do not reject
the hypothesis that the instruments explain risk only through their impact on regulation. Besides the
z-score, we examine the volatility of the return on assets (σ(ROA)), which is a component of the z-
score. We examine σ(ROA) to assess whether changes in z-score are due to changes in the riskiness
of bank assets or whether other components of the z-score, such as the capital asset ratio (CAR),
account for changes in bank fragility.
First, consider capital regulations, which have been the focus of international and national
regulatory approaches to promoting the safety and soundness of banking systems. To induce prudent
risk taking, capital regulations require bank owners to have more of their wealth at risk and to
increase the amount of capital at risk as a bank’s assets become more risky. Nonetheless, because
binding capital regulations reduce the utility of owning a bank, banks’ owners might seek to increase
risk in response to those capital regulations. Moreover, any adjustment to risk might depend on the
incentives and powers of the owner, as measured by CF. We consider two measures of capital
regulations. Capital requirements simply equals the statutory minimum capital requirement in the
country. We also include a measure of the degree to which the regulatory system screens capital.
Capital stringency is an index of regulatory oversight of bank capital that includes data on the source
of funds that count as regulatory capital and whether the authorities verify the true source of bank
capital.
Table 4 shows that the sign of the relationship between risk and capital stringency depends
materially on each bank’s ownership structure. In the regressions that include the interaction between
CF and capital stringency, the index of capital stringency enters positively and significantly.
Consistent with standard approaches to bank regulation, this finding indicates that the direct effect of
more stringent oversight of capital regulations is to enhance bank stability. The results, however, also
25
indicate that the impact of capital stringency depends on ownership structure. The interaction term
CF* capital stringency enters negatively and significantly in Regressions 2 and 5. This shows that the
stabilizing effects of an intensification of capital stringency regulations diminish when the bank has a
large owner with the incentives and power to increase bank risk. With a sufficiently large owner,
more stringent oversight of capital regulations increases bank risk. Ignoring the interactions between
national policies and the ownership structure of individual banks leads to erroneous inferences about
the impact of more stringent supervision of capital regulations on bank risk. Further, the results in
Column 6 are qualitatively similar when focusing only on the volatility of the return on bank assets,
not the z-score measure of bank stability, which also considers the bank’s capital asset ratio. The
results indicate that capital stringency has a direct, risk reducing effect, but this direct effect is
counterbalanced as large owners seek to increase risk taking with stronger capital stringency
regulations. Boyd and Hakenes (2008) develop a theoretical model of bank risk taking and looting
under different ownership structures. They stress that the risk effects of capital regulations can be
quite different, depending on the ownership structure of each bank. In their model, they also stress
that owners’ incentives toward risk taking are shaped along with their incentives to convert bank
assets to the personal benefit of bank owners.
In terms of the economic effects, capital stringency regulations have very different
implications for the risk taking behavior of widely held banks relative to banks with a majority
owner. For instance, the estimates in Table 4, Regression 2 suggest that bank risk will fall by about
0.3 standard deviations if there is a one standard deviation increase in capital stringency (1.25) when
the bank is widely held (i.e., CF equals zero). But, bank risk will rise by 0.1 standard deviations if
there is a one standard deviation increase in capital stringency when the bank has an owner where CF
equals 50%. Both the reduction and increase in risk are statistically significant.
26
In contrast, capital requirements do not have significant nonlinear effects that depend on
ownership structure. The minimum capital requirement regulation enters positively and significantly
in all of the z-score specifications, suggesting that higher minimum capital requirements enhance
bank stability. However, capital requirements do not boost z-scores by reducing the volatility of
assets (Regression 6). Instead, we find that capital requirements increase z-scores by increasing
capital asset ratios.
The association between risk and activity restrictions depends crucially on the ownership
structure of individual banks. While many countries attempt to reduce risk by restricting banks from
engaging in nonlending activities, theory suggests that these regulations might have unintended
effects. Bank owners might seek to compensate for the utility loss from stricter restrictions by
increasing risk. Theory further suggests that owners have greater incentives and power to increase
risk if they have larger CF rights. In the regressions that include the interaction between CF and
restrict, restrict enters negatively, though insignificantly at the 5% level. Thus, an increase in restrict
is not associated with a significant change in a bank’s risk if the bank is widely held. However, the
interaction term CF*restrict enters negatively and significantly in Regressions 3 and 5. When a bank
has a large owner, activity restrictions boost risk. For instance, the estimates in Table 4, Regression 3
suggest that bank risk rises by almost 0.3 standard deviations if there is a one standard deviation
increase in restrict (2.40) and if the bank has an owner where CF equals 50%. As further support,
consider the Column (6) regression in which the dependent variable is the volatility of bank assets.
When simply focusing on asset risk, the results confirm that restricting banking activities only tends
to boost the riskiness of bank assets when there is a sufficiently strong owner as measured by CF.
The evidence on deposit insurance further emphasizes that ignoring the interactions between
national regulations and the ownership structure of individual banks leads to flawed conclusions
27
about the impact of regulations on bank risk. In particular, explicit deposit insurance has very
different implications for the risk taking behavior of a widely held bank relative to a bank with a
majority owner. The estimates in Regression 4 of Table 4 suggest that bank risk rises by a statistically
significant 0.4 standard deviations in response to a one standard deviation increase in DI (0.41) if the
bank has a large owner with CF equal to 50%. But DI is not associated with a significant increase in
bank risk when the bank is widely held. From this perspective, explicit deposit insurance does not
have much of an effect on bank risk in a country such as the United States, where all ten of the largest
banks are widely held. In countries such as Indonesia, where large banks tend to have concentrated
ownership, however, deposit insurance is associated with significantly greater risk.
5. Simultaneous determination of bank valuation and risk
To further assess the mechanisms relating bank ownership, regulation, and risk, we allow for
the joint determination of bank risk and bank valuations. Regulations and ownership structure might
influence bank risk by affecting bank valuations. If regulations reduce a bank’s value, this could
increase the risk-taking incentives of owners as argued by Koehn and Santomero (1980) and Buser,
Chen, and Kane (1981). However, regulation might affect risk through an assortment of other
channels, including the response by bank borrowers to changes in interest rates induced by regulation
(Boyd and De Nicolo, 2005), the screening incentives and capabilities of investors (Calomiris and
Kahn, 1991), and the degree of bank competition (Hellmann, Murdoch, and Stiglitz, 2000).
Following Keeley (1990), we control for the endogenous determination of risk and bank
valuation and test whether an association exists between risk and bank regulations independent of
bank valuation. In the second stage of a two-stage least squared system, z-score and σ(ROA) are
modeled exactly as in Table 4, except that we also include Tobin’s q. In the first stage, Tobin’s q (q)

28
is modeled both as a function of the numerous bank level and country level control variables used in
the risk equation and variables excluded from the second stage. These excluded variables include a
dummy variable for whether the bank is listed on the New York Stock Exchange (NYSE), a dummy
variable for whether the country has entry restrictions that protect banks from competition, and the
bank’s market share as measured in terms of assets. As in Keeley (1990), the identifying assumption
is that these excluded variables explain cross-bank differences in valuation but the excluded variables
explain only bank risk through their impact on q.
Keeley (1990) uses the liberalization of laws governing branch restrictions in the US as an
instrument for q to assess the impact of exogenous changes in q on bank risk taking. At the same
time, these regulatory entry barriers reduce competition between banks, enhancing the market power
and franchise value of banks, as captured by q, and are thus a potentially valid instrument for q.
Following Keeley (1990), we use a regulatory index of entry barriers at the country level as
instrument for q. We also include the bank’s market share of assets in the set of instrumental
variables to proxy for market power. The results are qualitatively similar when we use the market
share of deposits. The NYSE listing dummy variable is included to capture other valuation trends not
related to changes in market power, such as the liquidity enhancing effect of a NYSE listing. Also,
valuation could be enhanced by the strict disclosure requirements of NYSE listings.
Table 5 presents the complete first stage and second-stage results. Table 5 gives the partial R2
and the F-test of the excluded instruments in the first stage to assess whether these instruments
explain cross-bank differences in q. The three instrumental variables explain about 10% of the cross-
bank variation in q. The F-tests rejects the hypothesis that these instruments can be excluded from the
first stage at the 1% significance level. Furthermore, in all of the specifications, the overidentification
test supports the hypothesis that the instruments are valid, i.e., we do not reject the assumption that

29
the instruments explain bank risk only through their effect on q. Also, the first stage results indicate
that q is higher in countries with stronger shareholder protection laws, which is consistent with the
findings in Caprio, Laeven, and Levine (2007).
With one exception, Table 5 confirms this paper’s results while controlling for the
endogenous determination of q. The one exception is that capital requirements no longer has a robust
direct link with banking stability, as measured by z-scores. Capital requirements affect bank stability,
but only through their effect on bank valuations. Capital requirements are likely to affect q because
they are a form of entry barrier that boosts the franchise value of banks. This in turn affects bank
stability, but capital requirements do not have an independent effect on bank stability. The results
also hold when simply including Tobin’s q in the OLS regressions in Table 4.
The results on capital stringency are similar to those reported above. The impact of the index
of capital stringency on bank risk depends critically on ownership structure. In widely held banks, a
marginal increase in capital stringency has little impact on actual bank risk, while stronger capital
stringency boosts bank risk when the bank has a powerful owner. The evidence is consistent with the
view that capital regulations increase the risk-taking incentives of owners (Koehn and Santomero,
1980; and Buser, Chen, and Kane, 1981). In the absence of a powerful owner, the stringency of
capital regulations has little marginal influence on risk. A large owner, however, is able to induce the
bank to increase its risk taking behavior in response to stricter capital regulations. Ignoring the
interactions between regulations and the ownership of individual banks yields invalid conclusions
about the impact of the capital stringency index on risk.
When controlling for the endogenous determination of bank valuation, we also confirm the
earlier findings on deposit insurance and activity restrictions. To promote stability, many countries
restrict banks from engaging in nonlending activities (Boyd, Chang, and Smith, 1998). But, bank

30
owners might seek to compensate for the utility loss by increasing risk. Furthermore, activity
restrictions might reduce the ability of banks to diversify income flows (Barth, Caprio, and Levine,
2004). This is what we find. Activity restrictions are associated with a lower z-score. Moreover, when
a bank has a large owner, activity restrictions are associated with a particularly large increase in bank
risk. Similarly, countries adopt deposit insurance to eliminate bank runs, but deposit insurance
intensifies standard moral hazard problems. The ability of owners to act on these incentives depends
on bank ownership structure. Even when controlling for q, we find that bank risk does not rise in
response to deposit insurance when the bank is widely held. When a large bank owner has sufficient
CF rights, however, deposit insurance is associated with an increase in risk.
6. Conclusions
In this paper, we conduct the first empirical assessment of theories concerning risk taking by
banks, their ownership structures, and national bank regulations. Theory highlights the potential
conflicts between bank managers and owners over bank risk taking and stresses that the same bank
regulation has different effects on bank risk taking depending on the comparative power of
shareholders in the governance structure of each bank. Besides assessing theories from corporate
finance and banking, this analysis is crucial from a public policy perspective because bank risk taking
affects economic fragility, business-cycle fluctuations, and economic growth.
We find that banks with more powerful owners tend to take greater risks. This is consistent
with theories predicting that equity holders have stronger incentives to increase risk than
nonshareholding managers and debt holders and that large owners with substantial cash flows have
the power and incentives to induce the bank’s managers to increase risk taking.

31
Furthermore, the impact of bank regulations on bank risk depends critically on each bank’s
ownership structure. The effect of the same regulation on a bank’s risk taking can be positive or
negative depending on the bank’s ownership structure. Consistent with theory, we find that ignoring
ownership structure leads to incomplete and sometimes erroneous conclusions about the impact of
capital regulations, deposit insurance, and activity restrictions on bank risk taking.
32
References
Agrawal, A., Mandelker, G., 1987. Managerial incentives and corporate investment and financing decisions. Journal of Finance 42, 823–838. Allen, F., Gale, D., 2000. Comparing Financial Systems. MIT Press, Cambridge, MA. Barth, J.R., Caprio, G., Levine, R., 2004. Bank Supervision and regulation: what works best? Journal of Financial Intermediation 13, 205-248. Barth, J.R., Caprio, G., Levine, R., 2006. Rethinking Bank Regulation: Till Angels Govern. Cambridge University Press, New York. Beck, T., Demirgüç-Kunt, A., Levine, R., 2003. Law, endowments, and finance. Journal of Financial Economics 70, 137-181. Beck, T., Demirgüç-Kunt, A., Levine, R., 2006. Bank supervision and corruption in lending. Journal of Monetary Economics 53, 2131-2163. Bennedsen, M., Nielsen, K., Perez-Gonzalez, F., Wolfenzon, D., 2007. Inside the family firm: the role of families in succession decisions and performance. Quarterly Journal of Economics 122, 647-691. Berger, A., Saunders, A., Scalise, J., Udell, G., 1998. The effects of bank mergers and acquisitions on small business lending. Journal of Financial Economics 50, 187-229. Bernanke, B., 1983. Nonmonetary effects of the financial crisis in the propagation of the great depression. American Economic Review 73, 257-276. Bitler, M., Moskowitz, T., Vissing-Jorgensen, A., 2005. Testing agency theory with entrepreneur effort and wealth. Journal of Finance 60, 539-576. Boyd, J., Chang, C., Smith, B.D., 1998. Moral hazard under commercial and universal banking. Journal of Money, Credit, and Banking 30, 426-468. Boyd, J., Hakenes, H., 2008. Looting and gambling in banking crises. Mimeo. University of Minnesota, Minneapolis MN. Boyd, J., De Nicolo, G., 2005. The theory of bank risk taking and competition revisited. Journal of Finance 60, 1329-1343. Buser, S., Chen, A., Kane, E., 1981. Federal deposit insurance, regulatory policy, and optimal bank capital. Journal of Finance 36, 51-60. Calomiris, C., Kahn, C., 1991. The role of demandable debt in structuring optimal banking arrangements. American Economic Review 81 497-513. Calomiris, C., Mason, J., 1997. Contagion and bank failures during the Great Depression: the Chicago banking panic of June 1932. American Economic Review 87, 863-884.
33
Calomiris, C., Mason, J., 2003a. Consequences of US bank distress during the Depression. American Economic Review 93, 937-947. Calomiris, C., Mason, J., 2003b. Fundamentals, panics and bank distress during the Depression. American Economic Review 93, 1615-1647. Caprio, G., Laeven, L., Levine, R., 2007. Ownership and bank valuation. Journal of Financial Intermediation 16, 584-617. Demirguc-Kunt, A., Detragiache, E., 2002. Does deposit insurance increase banking system stability? an empirical investigation. Journal of Monetary Economics 49, 1373-1406. Demirguc-Kunt, A., Kane, E., Laeven, L., 2008. Deposit insurance around the world: issues of design and implementation. MIT Press, Cambridge, MA. Demsetz, H., Lehn, K., 1985. The structure of corporate ownership: causes and consequences. Journal of Political Economy 93, 1155-1177. Esty, B., 1998. The impact of contingent liability on commercial bank risk taking,” Journal of Financial Economics 47, 189-218. Galai, D., Masulis, R., 1976, “The option pricing model and the risk factor of stock. Journal of Financial Economics 3, 53-81. Gorton, G., Rosen, R., 1995. Corporate control, portfolio choices, and the decline of banking. Journal of Finance 50, 1377-1420. Hellmann, T., Murdock, K., Stiglitz, J., 2000. Liberalization, moral hazard in banking, and prudential regulation: are capital requirements enough? American Economic Review 90, 147-165. Houston, J.F., James, C., 1995. CEO compensation and bank risk: is compensation in banking structured to promote risk taking? Journal of Monetary Economics 36, 405-431. Jensen, M., Meckling, W., 1976. Theory of the firm: managerial behavior, agency costs, and ownership structure. Journal of Financial Economics 3, 305-360. John, K., Litov, L., Yeung, B., 2008. Corporate governance and managerial risk taking: theory and evidence. Journal of Finance 63, 1679-1728. John, K., Saunders, A., L.W. Senbet, L.W., 2000. A theory of bank regulation and management compensation. Review of Financial Studies 13, 95-125. Kane, E., 1985. The Gathering Crisis in Federal Deposit Insurance. MIT Press, Cambridge, MA. Keeley, M., 1990. Deposit insurance, risk, and market power in banking. American Economic Review 80, 1183-1200.
34
Kim, D., Santomero, A., 1994. Risk in banking and capital regulation. Journal of Finance 43, 1219-1233. Koehn, M., Santomero, A., 1980. Regulation of bank capital and portfolio risk. Journal of Finance 35, 1235-1244. Kroszner, R., Rajan, R., 1994. Is the Glass-Steagall Act justified? A study of the US experience with universal banking before 1933. American Economic Review 84, 810-832. La Porta, R., Lopez-de-Silanes, F., Shleifer, A., Vishny, R., 1998. Law and finance. Journal of Political Economy 106, 1113-1155. Laeven, L., Levine, R., 2007. Is there a diversification discount in financial conglomerates? Journal of Financial Economics 85, 331-367. Laeven, L., Levine, R., 2008. Complex ownership structures and corporate valuations. Review of Financial Studies 21, 579-604. Merton, R., 1977. An analytical derivation of the cost of deposit insurance and loan guarantees: an application of modern option pricing theory. Journal of Banking and Finance 1, 3-11. Perez-Gonzalez, F., 2006. Inherited control and firm performance. American Economic Review 96, 1559-1588. Roy, A.D., 1952. Safety first and the holding of assets. Econometrica 20, 431-449. Saunders, A., Strock, E., Travlos, N.G., 1990. Ownership structure, deregulation, and bank risk taking. Journal of Finance 45, 643-654. Schranz, M., 1993. Takeovers improve firm performance: evidence from the banking industry. Journal of Political Economy 101, 299-326. Shleifer, A., Vishny, R., 1986. Large shareholders and corporate control. Journal of Political Economy 94, 461-488.

Table 1 Summary statistics of main regression variables. This table reports summary statistics of the main regression variables. Sample consists of 270 banks from 48 countries, and includes the ten largest listed banks in the country in terms of total assets, if available. Statistics based on annual data for the year 2001, unless otherwise indicated. z-score is the bank’s return on assets plus the capital asset ratio divided by the standard deviation of asset returns over the period 1996–2001. σ(ROA) is the volatility of the bank’s return on assets over the period 1996–2001. Equity volatility is the volatility of the equity returns of the bank, computed using weekly data over the period 1999–2001. Earnings volatility is the average standard deviation of the ratio of total earnings before taxes and loan loss provisions to average total assets over the period 1996–2001. CF is the cash flow rights of the largest shareholder of the bank. Large owner on mgt board takes a value of one if a large shareholder has a seat on the management board of the company, and zero otherwise. Managerial ownership equals the total cash flow rights of senior management. Revenue growth is the growth in total revenues of the bank over the year 2001. Market share is the bank’s share in total deposits in the country. NYSE takes a value of one if the bank is listed or has an American Depository Receipt on the NYSE, and zero otherwise. Size is the bank’s log of total assets. Loan loss provision ratio is the ratio of the bank’s loan loss provisions to net interest income. Liquidity ratio is the bank’s liquid assets to liquid liabilities. Per capita income is the log of gross domestic product (GDP) per capita of the country. Rights is an index of anti-director rights. Capital requirements is the minimum capital asset ratio requirement. Capital stringency is an index of capital regulation. Restrict is an index of activity restrictions. DI takes a value of one if the country has explicit deposit insurance, and zero otherwise. Enforce is an index of enforcement of contracts. M&A is the percentage of traded companies listed on the country’s stock exchange that have been targeted in completed mergers or acquisitions deals during the period 1990–2000. GDP volatility is the standard deviation of the logarithm of real annual GDP growth over the period 1996–2001.
Variable Number of banks Mean Standard deviation Minimum Maximum Bank level z-score 270 2.88 0.96 -1.56 5.14 σ(ROA) 270 0.01 0.03 0.00 0.46 Equity volatility 203 0.45 0.36 0.03 4.50 Earnings volatility 246 0.83 1.38 0.03 12.17 CF 270 0.24 0.25 0.00 1.00 Large owner on mgt board 270 0.31 0.46 0.00 1.00 Managerial ownership 266 0.06 0.14 0.00 0.68 Revenue growth 251 0.02 0.24 -0.86 1.87 Market share 234 0.14 0.22 0.00 1.84 NYSE 270 0.13 0.33 0.00 1.00 Size 251 16.20 2.13 10.94 20.77 Loan loss provision ratio 243 0.23 0.33 -2.56 2.64 Liquidity ratio 240 0.04 0.05 0.00 0.50 Country level Per capita income 48 8.79 1.49 5.54 10.70 Rights 48 2.98 1.31 0.00 5.00 Capital requirements 48 8.69 1.23 8.00 12.00 Capital stringency 41 3.12 1.25 0.00 5.00 Restrict 41 9.02 2.40 5.00 14.00 DI 47 0.79 0.41 0.00 1.00 Enforce 47 7.13 2.15 3.55 9.99 M&A 44 23.90 18.65 0.00 65.63 GDP volatility 47 0.03 0.02 0.00 0.12

Table 2 Correlation matrix of main regression variables. This table reports the correlations between the main regression variables. Sample consists of 270 listed banks from 48 countries, and includes the ten largest listed banks in the country in terms of total assets, if available. Statistics based on annual data for the year 2001, unless otherwise indicated. z-score is the bank’s return on assets plus the capital asset ratio divided by the standard deviation of asset returns over the period 1996–2001. σ(ROA) is the volatility of the bank’s return on assets over the period 1996–2001. Equity volatility is the volatility of the equity returns of the bank, computed using weekly data over the period 1999–2001. Earnings volatility is the average standard deviation of the ratio of total earnings before taxes and loan loss provisions to average total assets over the period 1996–2001. CF is cash flow rights of the largest shareholder of the bank. Revenue growth is the growth in total revenues of the bank over the year 2001. Large owner on mgt board takes a value of one if a large shareholder has a seat on the management board of the company, and zero otherwise. Managerial ownership equals the total cash flow rights of senior management. Per capita income is the log of gross domestic product (GDP) per capita. Rights is an index of anti-director rights. Capital requirements is the minimum capital asset ratio requirement. Capital stringency is an index of capital regulation. Restrict is an index of activity restrictions. DI takes a value of one if the country has explicit deposit insurance, and zero otherwise. p-values denoting the significance level of each correlation coefficient are in parentheses. *, **, and *** indicate significance at the 10%, 5%, and 1% levels, respectively.
Variable z-score Equity
volatility Earnings volatility CF
Revenue growth
Large owner on mgt board
Managerial ownership
Per capita income Rights
Capital requirements
Capital stringency Restrict
Equity volatility -0.319*** (0.000) Earnings volatility -0.682*** 0.239*** (0.000) (0.001) CF -0.348*** 0.209*** 0.373*** (0.000) (0.003) (0.000) Revenue growth -0.029 -0.013 0.309*** 0.127** (0.652) (0.864) (0.000) (0.045) Large owner on mgt board -0.214*** 0.177** 0.175*** 0.377*** 0.075 (0.000) (0.012) (0.006) (0.000) (0.234) Managerial ownership -0.056 0.237*** 0.056 0.296*** 0.060 0.305*** (0.364) (0.001) (0.383) (0.000) (0.351) (0.000) Per capita income 0.327*** -0.252*** -0.368*** -0.252*** -0.191*** -0.335*** -0.215*** (0.000) (0.000) (0.000) (0.000) (0.002) (0.000) (0.000) Rights 0.172*** -0.145** -0.167*** -0.258*** -0.052 -0.125** -0.033 0.125** (0.005) (0.039) (0.009) (0.000) (0.414) (0.040) (0.594) (0.040) Capital requirements 0.070 0.161** -0.026 0.101* 0.069 0.295*** 0.264*** -0.276*** -0.210*** (0.253) (0.022) (0.688) (0.097) (0.277) (0.000) (0.000) (0.000) (0.001) Capital stringency -0.102 -0.059 0.101 -0.038 0.122* 0.090 -0.106 -0.075 0.071 0.088 (0.119) (0.425) (0.143) (0.557) (0.071) (0.169) (0.107) (0.249) (0.274) (0.178) Restrict -0.312*** 0.333*** 0.295*** 0.161** 0.075 0.315*** 0.108 -0.274*** -0.126** 0.168*** 0.221*** (0.000) (0.000) (0.000) (0.013) (0.268) (0.000) (0.100) (0.000) (0.054) (0.010) (0.001) DI -0.130** -0.072 0.130** 0.012 -0.038 -0.067 -0.076 0.263*** -0.119* -0.156** 0.398*** -0.165** (0.034) (0.307) (0.043) (0.847) (0.551) (0.271) (0.220) (0.000) (0.052) (0.010) (0.000) (0.011)
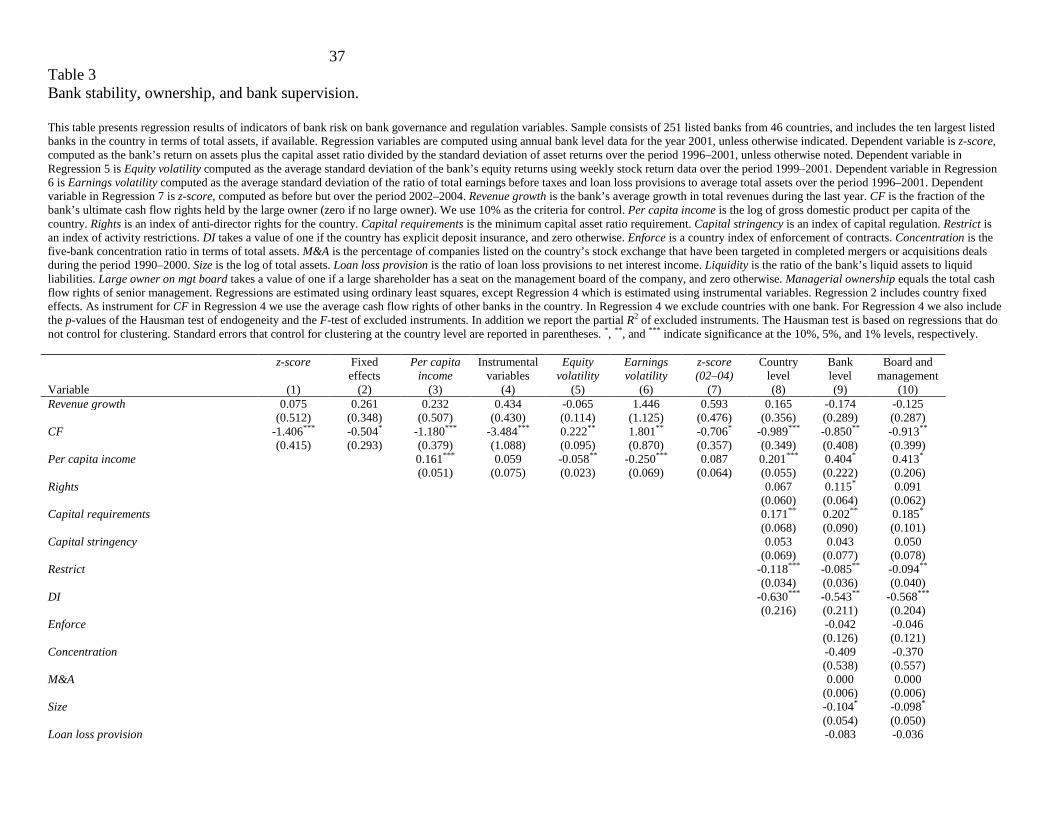
37
Table 3 Bank stability, ownership, and bank supervision. This table presents regression results of indicators of bank risk on bank governance and regulation variables. Sample consists of 251 listed banks from 46 countries, and includes the ten largest listed banks in the country in terms of total assets, if available. Regression variables are computed using annual bank level data for the year 2001, unless otherwise indicated. Dependent variable is z-score, computed as the bank’s return on assets plus the capital asset ratio divided by the standard deviation of asset returns over the period 1996–2001, unless otherwise noted. Dependent variable in Regression 5 is Equity volatility computed as the average standard deviation of the bank’s equity returns using weekly stock return data over the period 1999–2001. Dependent variable in Regression 6 is Earnings volatility computed as the average standard deviation of the ratio of total earnings before taxes and loan loss provisions to average total assets over the period 1996–2001. Dependent variable in Regression 7 is z-score, computed as before but over the period 2002–2004. Revenue growth is the bank’s average growth in total revenues during the last year. CF is the fraction of the bank’s ultimate cash flow rights held by the large owner (zero if no large owner). We use 10% as the criteria for control. Per capita income is the log of gross domestic product per capita of the country. Rights is an index of anti-director rights for the country. Capital requirements is the minimum capital asset ratio requirement. Capital stringency is an index of capital regulation. Restrict is an index of activity restrictions. DI takes a value of one if the country has explicit deposit insurance, and zero otherwise. Enforce is a country index of enforcement of contracts. Concentration is the five-bank concentration ratio in terms of total assets. M&A is the percentage of companies listed on the country’s stock exchange that have been targeted in completed mergers or acquisitions deals during the period 1990–2000. Size is the log of total assets. Loan loss provision is the ratio of loan loss provisions to net interest income. Liquidity is the ratio of the bank’s liquid assets to liquid liabilities. Large owner on mgt board takes a value of one if a large shareholder has a seat on the management board of the company, and zero otherwise. Managerial ownership equals the total cash flow rights of senior management. Regressions are estimated using ordinary least squares, except Regression 4 which is estimated using instrumental variables. Regression 2 includes country fixed effects. As instrument for CF in Regression 4 we use the average cash flow rights of other banks in the country. In Regression 4 we exclude countries with one bank. For Regression 4 we also include the p-values of the Hausman test of endogeneity and the F-test of excluded instruments. In addition we report the partial R2 of excluded instruments. The Hausman test is based on regressions that do not control for clustering. Standard errors that control for clustering at the country level are reported in parentheses. *, **, and *** indicate significance at the 10%, 5%, and 1% levels, respectively. z-score Fixed
effects Per capita
income Instrumental
variables Equity
volatility Earnings volatility
z-score (02–04)
Country level
Bank level
Board and management
Variable (1) (2) (3) (4) (5) (6) (7) (8) (9) (10) Revenue growth 0.075 0.261 0.232 0.434 -0.065 1.446 0.593 0.165 -0.174 -0.125 (0.512) (0.348) (0.507) (0.430) (0.114) (1.125) (0.476) (0.356) (0.289) (0.287) CF -1.406*** -0.504* -1.180*** -3.484*** 0.222** 1.801** -0.706* -0.989*** -0.850** -0.913** (0.415) (0.293) (0.379) (1.088) (0.095) (0.870) (0.357) (0.349) (0.408) (0.399) Per capita income 0.161*** 0.059 -0.058** -0.250*** 0.087 0.201*** 0.404* 0.413* (0.051) (0.075) (0.023) (0.069) (0.064) (0.055) (0.222) (0.206) Rights 0.067 0.115* 0.091 (0.060) (0.064) (0.062) Capital requirements 0.171** 0.202** 0.185* (0.068) (0.090) (0.101) Capital stringency 0.053 0.043 0.050 (0.069) (0.077) (0.078) Restrict -0.118*** -0.085** -0.094** (0.034) (0.036) (0.040) DI -0.630*** -0.543** -0.568*** (0.216) (0.211) (0.204) Enforce -0.042 -0.046 (0.126) (0.121) Concentration -0.409 -0.370 (0.538) (0.557) M&A 0.000 0.000 (0.006) (0.006) Size -0.104* -0.098* (0.054) (0.050) Loan loss provision -0.083 -0.036

38
(0.158) (0.210) Liquidity -0.097 0.724 (1.071) (1.217) Large owner on mgt board 0.003 (0.237) Managerial ownership 0.363 (0.703) Hausman test of endogeneity (p-value) — — — 0.000*** — — — — — — Partial R2 of excluded instruments — — — 0.151 — — — — — — F-test of excluded instruments — — — 0.000*** — — — — — — Number of countries 46 46 46 43 41 46 39 40 37 37 Number of observations 251 251 251 248 190 234 171 219 193 189 R2 0.14 0.03 0.19 — 0.08 0.29 0.10 0.34 0.36 0.37
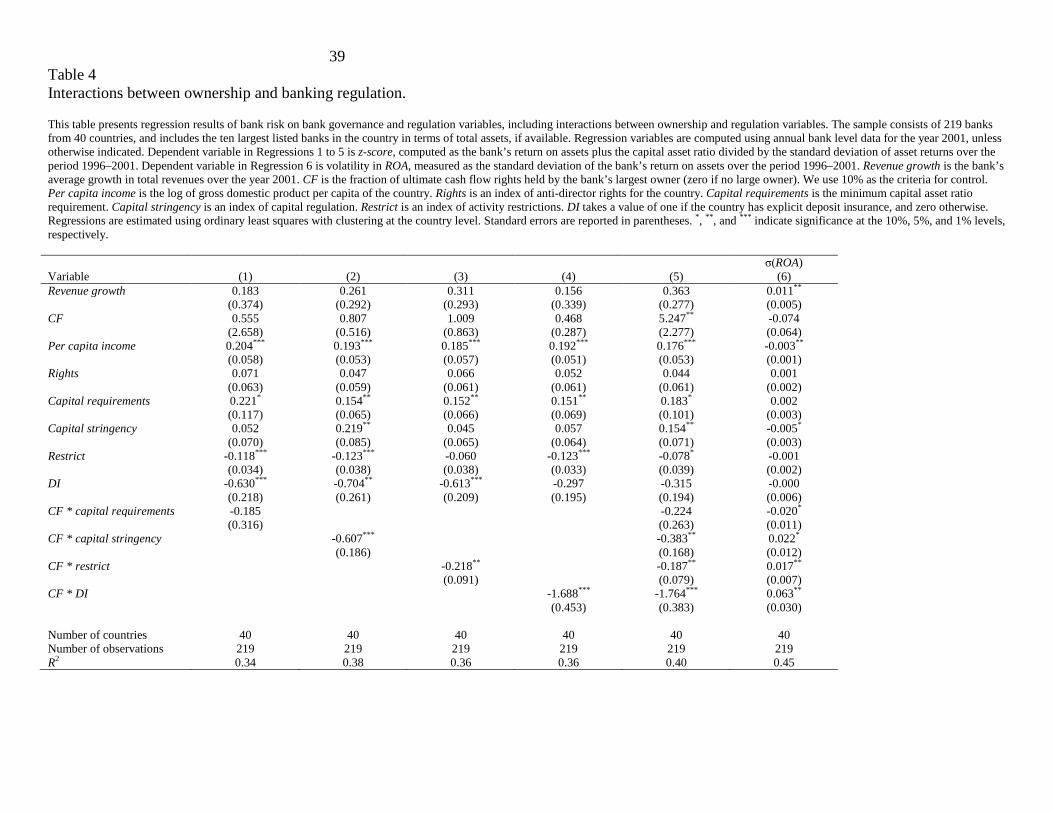
39
Table 4 Interactions between ownership and banking regulation. This table presents regression results of bank risk on bank governance and regulation variables, including interactions between ownership and regulation variables. The sample consists of 219 banks from 40 countries, and includes the ten largest listed banks in the country in terms of total assets, if available. Regression variables are computed using annual bank level data for the year 2001, unless otherwise indicated. Dependent variable in Regressions 1 to 5 is z-score, computed as the bank’s return on assets plus the capital asset ratio divided by the standard deviation of asset returns over the period 1996–2001. Dependent variable in Regression 6 is volatility in ROA, measured as the standard deviation of the bank’s return on assets over the period 1996–2001. Revenue growth is the bank’s average growth in total revenues over the year 2001. CF is the fraction of ultimate cash flow rights held by the bank’s largest owner (zero if no large owner). We use 10% as the criteria for control. Per capita income is the log of gross domestic product per capita of the country. Rights is an index of anti-director rights for the country. Capital requirements is the minimum capital asset ratio requirement. Capital stringency is an index of capital regulation. Restrict is an index of activity restrictions. DI takes a value of one if the country has explicit deposit insurance, and zero otherwise. Regressions are estimated using ordinary least squares with clustering at the country level. Standard errors are reported in parentheses. *, **, and *** indicate significance at the 10%, 5%, and 1% levels, respectively. σ(ROA) Variable (1) (2) (3) (4) (5) (6) Revenue growth 0.183 0.261 0.311 0.156 0.363 0.011** (0.374) (0.292) (0.293) (0.339) (0.277) (0.005) CF 0.555 0.807 1.009 0.468 5.247** -0.074 (2.658) (0.516) (0.863) (0.287) (2.277) (0.064) Per capita income 0.204*** 0.193*** 0.185*** 0.192*** 0.176*** -0.003** (0.058) (0.053) (0.057) (0.051) (0.053) (0.001) Rights 0.071 0.047 0.066 0.052 0.044 0.001 (0.063) (0.059) (0.061) (0.061) (0.061) (0.002) Capital requirements 0.221* 0.154** 0.152** 0.151** 0.183* 0.002 (0.117) (0.065) (0.066) (0.069) (0.101) (0.003) Capital stringency 0.052 0.219** 0.045 0.057 0.154** -0.005* (0.070) (0.085) (0.065) (0.064) (0.071) (0.003) Restrict -0.118*** -0.123*** -0.060 -0.123*** -0.078* -0.001 (0.034) (0.038) (0.038) (0.033) (0.039) (0.002) DI -0.630*** -0.704** -0.613*** -0.297 -0.315 -0.000 (0.218) (0.261) (0.209) (0.195) (0.194) (0.006) CF * capital requirements -0.185 -0.224 -0.020* (0.316) (0.263) (0.011) CF * capital stringency -0.607*** -0.383** 0.022* (0.186) (0.168) (0.012) CF * restrict -0.218** -0.187** 0.017** (0.091) (0.079) (0.007) CF * DI -1.688*** -1.764*** 0.063** (0.453) (0.383) (0.030) Number of countries 40 40 40 40 40 40 Number of observations 219 219 219 219 219 219 R2 0.34 0.38 0.36 0.36 0.40 0.45
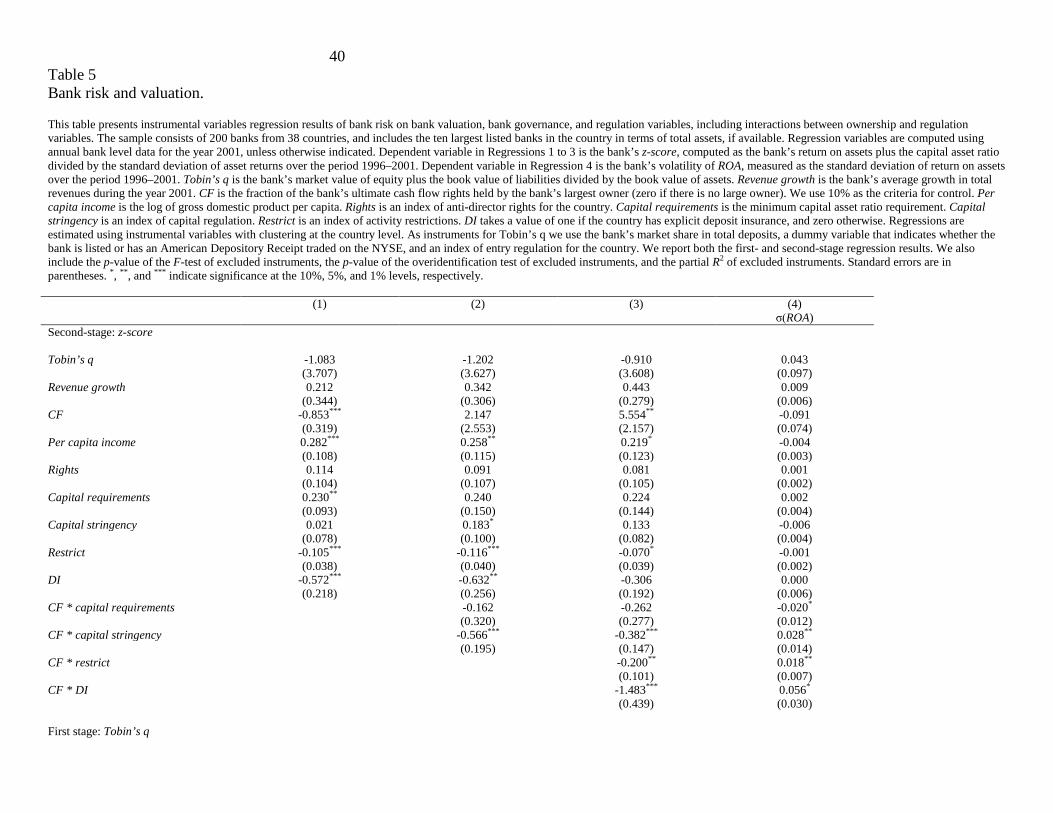
40
Table 5 Bank risk and valuation. This table presents instrumental variables regression results of bank risk on bank valuation, bank governance, and regulation variables, including interactions between ownership and regulation variables. The sample consists of 200 banks from 38 countries, and includes the ten largest listed banks in the country in terms of total assets, if available. Regression variables are computed using annual bank level data for the year 2001, unless otherwise indicated. Dependent variable in Regressions 1 to 3 is the bank’s z-score, computed as the bank’s return on assets plus the capital asset ratio divided by the standard deviation of asset returns over the period 1996–2001. Dependent variable in Regression 4 is the bank’s volatility of ROA, measured as the standard deviation of return on assets over the period 1996–2001. Tobin’s q is the bank’s market value of equity plus the book value of liabilities divided by the book value of assets. Revenue growth is the bank’s average growth in total revenues during the year 2001. CF is the fraction of the bank’s ultimate cash flow rights held by the bank’s largest owner (zero if there is no large owner). We use 10% as the criteria for control. Per capita income is the log of gross domestic product per capita. Rights is an index of anti-director rights for the country. Capital requirements is the minimum capital asset ratio requirement. Capital stringency is an index of capital regulation. Restrict is an index of activity restrictions. DI takes a value of one if the country has explicit deposit insurance, and zero otherwise. Regressions are estimated using instrumental variables with clustering at the country level. As instruments for Tobin’s q we use the bank’s market share in total deposits, a dummy variable that indicates whether the bank is listed or has an American Depository Receipt traded on the NYSE, and an index of entry regulation for the country. We report both the first- and second-stage regression results. We also include the p-value of the F-test of excluded instruments, the p-value of the overidentification test of excluded instruments, and the partial R2 of excluded instruments. Standard errors are in parentheses. *, **, and *** indicate significance at the 10%, 5%, and 1% levels, respectively. (1) (2) (3) (4) σ(ROA) Second-stage: z-score Tobin’s q -1.083 -1.202 -0.910 0.043 (3.707) (3.627) (3.608) (0.097) Revenue growth 0.212 0.342 0.443 0.009 (0.344) (0.306) (0.279) (0.006) CF -0.853*** 2.147 5.554** -0.091 (0.319) (2.553) (2.157) (0.074) Per capita income 0.282*** 0.258** 0.219* -0.004 (0.108) (0.115) (0.123) (0.003) Rights 0.114 0.091 0.081 0.001 (0.104) (0.107) (0.105) (0.002) Capital requirements 0.230** 0.240 0.224 0.002 (0.093) (0.150) (0.144) (0.004) Capital stringency 0.021 0.183* 0.133 -0.006 (0.078) (0.100) (0.082) (0.004) Restrict -0.105*** -0.116*** -0.070* -0.001 (0.038) (0.040) (0.039) (0.002) DI -0.572*** -0.632** -0.306 0.000 (0.218) (0.256) (0.192) (0.006) CF * capital requirements -0.162 -0.262 -0.020* (0.320) (0.277) (0.012) CF * capital stringency -0.566*** -0.382*** 0.028** (0.195) (0.147) (0.014) CF * restrict -0.200** 0.018** (0.101) (0.007) CF * DI -1.483*** 0.056* (0.439) (0.030) First stage: Tobin’s q
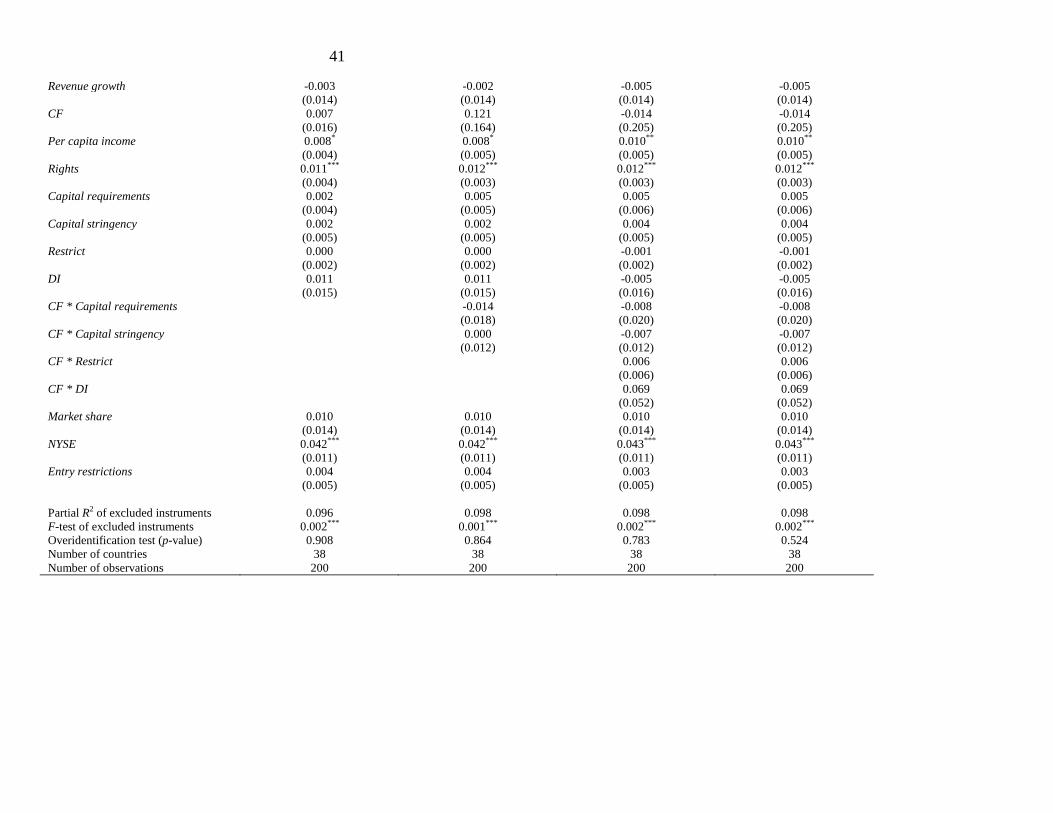
41
Revenue growth -0.003 -0.002 -0.005 -0.005 (0.014) (0.014) (0.014) (0.014) CF 0.007 0.121 -0.014 -0.014 (0.016) (0.164) (0.205) (0.205) Per capita income 0.008* 0.008* 0.010** 0.010** (0.004) (0.005) (0.005) (0.005) Rights 0.011*** 0.012*** 0.012*** 0.012*** (0.004) (0.003) (0.003) (0.003) Capital requirements 0.002 0.005 0.005 0.005 (0.004) (0.005) (0.006) (0.006) Capital stringency 0.002 0.002 0.004 0.004 (0.005) (0.005) (0.005) (0.005) Restrict 0.000 0.000 -0.001 -0.001 (0.002) (0.002) (0.002) (0.002) DI 0.011 0.011 -0.005 -0.005 (0.015) (0.015) (0.016) (0.016) CF * Capital requirements -0.014 -0.008 -0.008 (0.018) (0.020) (0.020) CF * Capital stringency 0.000 -0.007 -0.007 (0.012) (0.012) (0.012) CF * Restrict 0.006 0.006 (0.006) (0.006) CF * DI 0.069 0.069 (0.052) (0.052) Market share 0.010 0.010 0.010 0.010 (0.014) (0.014) (0.014) (0.014) NYSE 0.042*** 0.042*** 0.043*** 0.043*** (0.011) (0.011) (0.011) (0.011) Entry restrictions 0.004 0.004 0.003 0.003 (0.005) (0.005) (0.005) (0.005) Partial R2 of excluded instruments 0.096 0.098 0.098 0.098 F-test of excluded instruments 0.002*** 0.001*** 0.002*** 0.002*** Overidentification test (p-value) 0.908 0.864 0.783 0.524 Number of countries 38 38 38 38 Number of observations 200 200 200 200
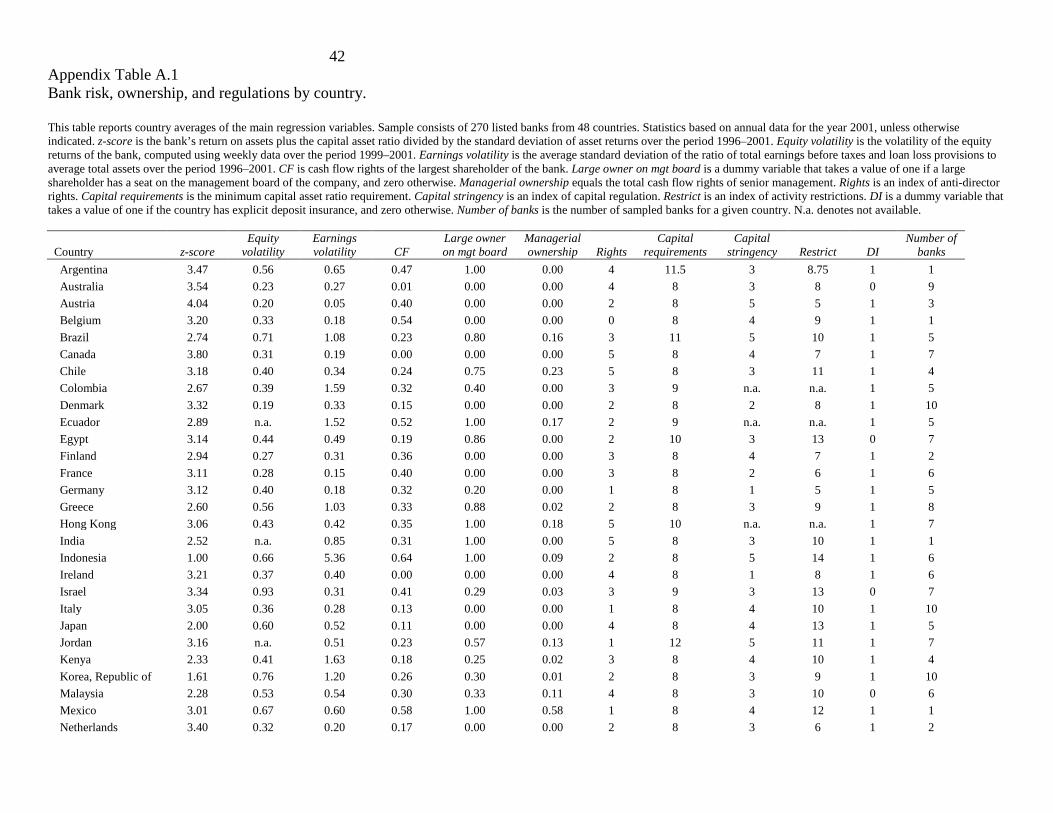
42
Appendix Table A.1 Bank risk, ownership, and regulations by country. This table reports country averages of the main regression variables. Sample consists of 270 listed banks from 48 countries. Statistics based on annual data for the year 2001, unless otherwise indicated. z-score is the bank’s return on assets plus the capital asset ratio divided by the standard deviation of asset returns over the period 1996–2001. Equity volatility is the volatility of the equity returns of the bank, computed using weekly data over the period 1999–2001. Earnings volatility is the average standard deviation of the ratio of total earnings before taxes and loan loss provisions to average total assets over the period 1996–2001. CF is cash flow rights of the largest shareholder of the bank. Large owner on mgt board is a dummy variable that takes a value of one if a large shareholder has a seat on the management board of the company, and zero otherwise. Managerial ownership equals the total cash flow rights of senior management. Rights is an index of anti-director rights. Capital requirements is the minimum capital asset ratio requirement. Capital stringency is an index of capital regulation. Restrict is an index of activity restrictions. DI is a dummy variable that takes a value of one if the country has explicit deposit insurance, and zero otherwise. Number of banks is the number of sampled banks for a given country. N.a. denotes not available.
Country z-score Equity
volatility Earnings volatility CF
Large owner on mgt board
Managerial ownership Rights
Capital requirements
Capital stringency Restrict DI
Number of banks
Argentina 3.47 0.56 0.65 0.47 1.00 0.00 4 11.5 3 8.75 1 1 Australia 3.54 0.23 0.27 0.01 0.00 0.00 4 8 3 8 0 9 Austria 4.04 0.20 0.05 0.40 0.00 0.00 2 8 5 5 1 3 Belgium 3.20 0.33 0.18 0.54 0.00 0.00 0 8 4 9 1 1 Brazil 2.74 0.71 1.08 0.23 0.80 0.16 3 11 5 10 1 5 Canada 3.80 0.31 0.19 0.00 0.00 0.00 5 8 4 7 1 7 Chile 3.18 0.40 0.34 0.24 0.75 0.23 5 8 3 11 1 4 Colombia 2.67 0.39 1.59 0.32 0.40 0.00 3 9 n.a. n.a. 1 5 Denmark 3.32 0.19 0.33 0.15 0.00 0.00 2 8 2 8 1 10 Ecuador 2.89 n.a. 1.52 0.52 1.00 0.17 2 9 n.a. n.a. 1 5 Egypt 3.14 0.44 0.49 0.19 0.86 0.00 2 10 3 13 0 7 Finland 2.94 0.27 0.31 0.36 0.00 0.00 3 8 4 7 1 2 France 3.11 0.28 0.15 0.40 0.00 0.00 3 8 2 6 1 6 Germany 3.12 0.40 0.18 0.32 0.20 0.00 1 8 1 5 1 5 Greece 2.60 0.56 1.03 0.33 0.88 0.02 2 8 3 9 1 8 Hong Kong 3.06 0.43 0.42 0.35 1.00 0.18 5 10 n.a. n.a. 1 7 India 2.52 n.a. 0.85 0.31 1.00 0.00 5 8 3 10 1 1 Indonesia 1.00 0.66 5.36 0.64 1.00 0.09 2 8 5 14 1 6 Ireland 3.21 0.37 0.40 0.00 0.00 0.00 4 8 1 8 1 6 Israel 3.34 0.93 0.31 0.41 0.29 0.03 3 9 3 13 0 7 Italy 3.05 0.36 0.28 0.13 0.00 0.00 1 8 4 10 1 10 Japan 2.00 0.60 0.52 0.11 0.00 0.00 4 8 4 13 1 5 Jordan 3.16 n.a. 0.51 0.23 0.57 0.13 1 12 5 11 1 7 Kenya 2.33 0.41 1.63 0.18 0.25 0.02 3 8 4 10 1 4 Korea, Republic of 1.61 0.76 1.20 0.26 0.30 0.01 2 8 3 9 1 10 Malaysia 2.28 0.53 0.54 0.30 0.33 0.11 4 8 3 10 0 6 Mexico 3.01 0.67 0.60 0.58 1.00 0.58 1 8 4 12 1 1 Netherlands 3.40 0.32 0.20 0.17 0.00 0.00 2 8 3 6 1 2
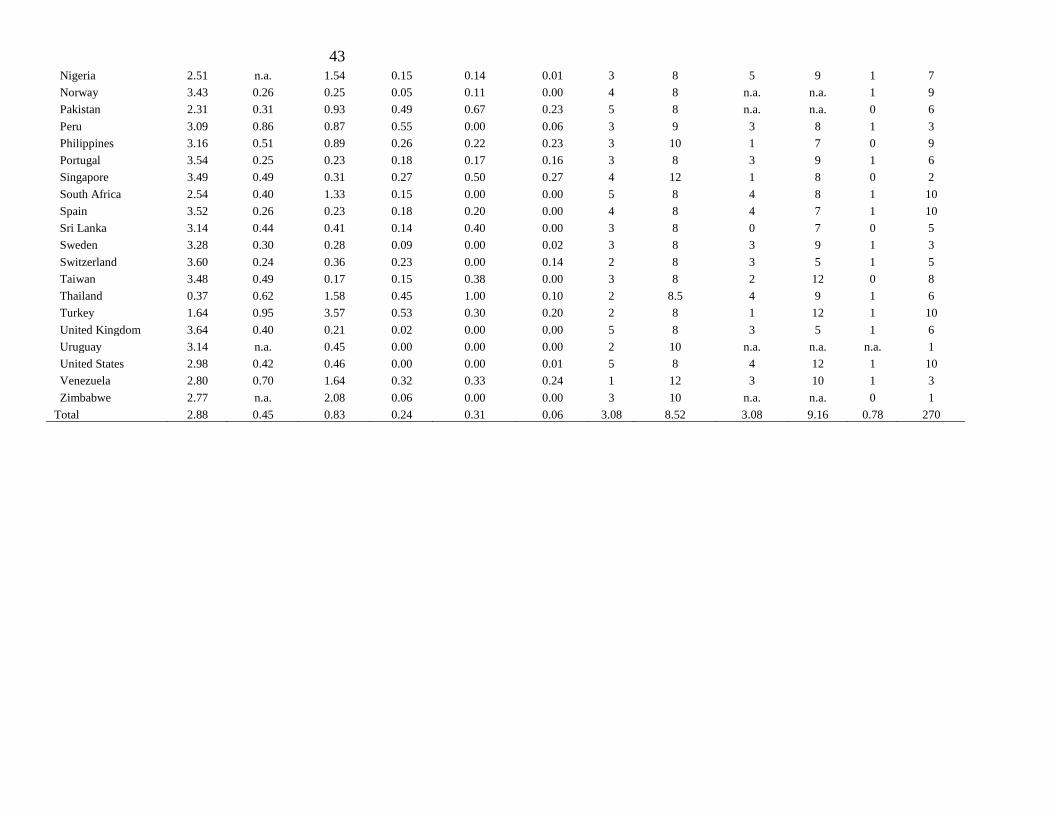
43
Nigeria 2.51 n.a. 1.54 0.15 0.14 0.01 3 8 5 9 1 7 Norway 3.43 0.26 0.25 0.05 0.11 0.00 4 8 n.a. n.a. 1 9 Pakistan 2.31 0.31 0.93 0.49 0.67 0.23 5 8 n.a. n.a. 0 6 Peru 3.09 0.86 0.87 0.55 0.00 0.06 3 9 3 8 1 3 Philippines 3.16 0.51 0.89 0.26 0.22 0.23 3 10 1 7 0 9 Portugal 3.54 0.25 0.23 0.18 0.17 0.16 3 8 3 9 1 6 Singapore 3.49 0.49 0.31 0.27 0.50 0.27 4 12 1 8 0 2 South Africa 2.54 0.40 1.33 0.15 0.00 0.00 5 8 4 8 1 10 Spain 3.52 0.26 0.23 0.18 0.20 0.00 4 8 4 7 1 10 Sri Lanka 3.14 0.44 0.41 0.14 0.40 0.00 3 8 0 7 0 5 Sweden 3.28 0.30 0.28 0.09 0.00 0.02 3 8 3 9 1 3 Switzerland 3.60 0.24 0.36 0.23 0.00 0.14 2 8 3 5 1 5 Taiwan 3.48 0.49 0.17 0.15 0.38 0.00 3 8 2 12 0 8 Thailand 0.37 0.62 1.58 0.45 1.00 0.10 2 8.5 4 9 1 6 Turkey 1.64 0.95 3.57 0.53 0.30 0.20 2 8 1 12 1 10 United Kingdom 3.64 0.40 0.21 0.02 0.00 0.00 5 8 3 5 1 6 Uruguay 3.14 n.a. 0.45 0.00 0.00 0.00 2 10 n.a. n.a. n.a. 1 United States 2.98 0.42 0.46 0.00 0.00 0.01 5 8 4 12 1 10 Venezuela 2.80 0.70 1.64 0.32 0.33 0.24 1 12 3 10 1 3 Zimbabwe 2.77 n.a. 2.08 0.06 0.00 0.00 3 10 n.a. n.a. 0 1
Total 2.88 0.45 0.83 0.24 0.31 0.06 3.08 8.52 3.08 9.16 0.78 270
Related Documents