BANGLADESH PUBLIC EXPENDITURE REVIEW ON NUTRITION Final Report | March 2019

Welcome message from author
This document is posted to help you gain knowledge. Please leave a comment to let me know what you think about it! Share it to your friends and learn new things together.
Transcript
BANGLADESH PUBLIC EXPENDITUREREVIEW ON NUTRITION
Final Report | March 2019


ii BAGLADESH PUBLIC EXPENDITURE REVIEW ON NUTRITION
©Finance Division, Government of the Republic of Bangladesh and United Nations Children’s Fund (UNICEF)
All materials are protected by copyright, including text, photographs, images and videotapes. Permission is required to reproduce any part of this publication. Permission will be freely granted to educational or non-profit organizations. Please contact:
Strengthening Capacity of Child-Focused Budgeting Project, Ministry of Finance, Government of the People’s Republic of Bangladesh, Bangladesh Secretariat, Dhaka, Bangladesh www.mof.gov.bd
Social Policy, Evaluation, Analytics and Research Section (SPEAR)United Nations Children’s Fund (UNICEF)BSL Office Complex1, Minto Road, Dhaka-1000, Bangladesh
Telephone: (880-2)55668088Email: [email protected]
ISBN: 978-984-8969-33-5
Cover Photo: ©UNICEF/UNI146716/Kiron
Concept & Design: Md. Mosarof Hossain (Azad)/DrikLayout: Qumrunnahar Hossain (Kali)/Drik
iiiBAGLADESH PUBLIC EXPENDITURE REVIEW ON NUTRITION
This is the final report of the Public Expenditure Review on Nutrition in Bangladesh undertaken by Oxford Policy Management (OPM) as part of an Intervention under Strengthening the capacity of Child-Focused Budgeting Project being implemented by the Finance Division of the Government of Bangladesh with UNICEF support. The first draft was submitted on the 15th of May and presented to UNICEF, BNNC, FPMU and MoF. The second draft was submitted on the 7th of June and presented to the Technical Advisory Committee. The findings and emerging recommendations were presented at the validation workshop on the 5th and 6th of September 2018 in Dhaka. This final report incorporates all comments received through the validation period.
UNICEF, the Government of Bangladesh, and development partners provided their time and inputs throughout the study. Special thank goes to the members of the Technical Advisory Committee, in particular to Dr. Md. Jafar Uddin (Chair), Mr. Md. Habibur Rahman, Mr. Ruhul Amin Talukder, Mr Shakil Ahmed, Mr. Carlos Acosta, Ms. Anuradha Narayan, Ms Piyali Mustaphi, Mr Golam Mohiuddin Khan Sadi and Mr Sheikh Farid, for the guidance and valuable comments throughout the process. The full list of members of the Technical Advisory Committee and stakeholders met is provided in Annex A and Annex B.
The draft report was peer reviewed by Mr Adrian Gheorghe and also benefits from the peer review of the Inception Report by Ms Stephanie Allan of OPM, as well as inputs by Mr Paul Harnett. Errors and interpretations remain the sole responsibility of the authors.
This assignment is being carried out by Oxford Policy Management (for details, please see Annex H). The project manager is Mr Matt Robinson. The other team members are Ms Tahmina Begum, Mr Rezauddin Chowdhury, Ms Adiba Khaled, Ms Clara Picanyol and Ms Mehroosh Tak. This study has been conducted under overall guidance of the Secretary, Finance Division, Government of the People’s Republic of Bangladesh.
Acknowledgements
iv BAGLADESH PUBLIC EXPENDITURE REVIEW ON NUTRITION
Background
During the last two decades, since the adoption of the first National Plan of Action for Nutrition in 1997, although much progress has been made in reducing the burden of undernutrition in Bangladesh, it is still a significant issue. According to the Bangladesh Demographic and Health Survey (BDHS) data, between 2000 to 2014 childhood stunting has reduced from 45% to 36% amongst children under 5. However, stunting prevalence of 36% still classifies as high according to WHO standards1.
The Government of Bangladesh (GoB) has made nutrition a priority and taken steps to ensure that a strong policy framework is in place through developing the National Nutrition Policy 2015 and the Second National Plan of Action for Nutrition 2016-2025 (NPAN2). The GoB also recognises that ensuring existing funding is being spent efficiently in line with NPAN2 can provide a further boost in reaching nutrition goals. Having reliable financial data, including data on budget allocations and expenditure is essential for policy makers to be able to prioritise, plan, and make decisions on resource allocation, as well as to monitor and evaluate proper and efficient use of these resources in line with the NPAN2.
Objectives and approach
The Public Expenditure Review of Nutrition (PER-N) aims to:
• Analyse the level and composition of public expenditure in nutrition over the past three fiscal years (2014/15 – 2016/17) and the budget for 2017-18;
• Provide a baseline against which developments in nutrition budget allocations and execution to effectively monitor progress towards the achievement of the nationally set goals for nutrition; and
• Assess the institutional mechanisms for the management of public finances for nutrition.
Executive Summary
1 WHO stunting classification: Low <20%, medium 20-29%, high: 30-39%, very high =>40%

vBAGLADESH PUBLIC EXPENDITURE REVIEW ON NUTRITION
In order to do so, four interrelated areas were analysed using several data sources to provide specific recommendations to improve nutrition expenditures and budget management performance going forward. The methodology used is derived from international best practice guidelines issues by the SUN Movement.
Key findings
In 2016/17, the Government of Bangladesh spent BDT 23,210 crore2 (USD 2.7 billion) in nutrition relevant interventions, representing around 1% of GDP and around 9% of the national budget. Nutrition budget allocations and actual expenditure has remained relatively stable in relative terms during the period under review.
Expenditure is spread across 15 ministries/divisions and almost 300 projects or operational lines. Four ministries account for about 80% of nutrition expenditure: the Ministry of Food (MoFood), the Ministry of Health and Family Welfare (MoHFW), the Ministry of Primary and Mass Education (MoPME) and the Ministry of Women and Children Affairs (MoWCA). The largest 20 projects account for 81% of total expenditure.
The vast majority is spent on nutrition-sensitive interventions (98%) and a significant amount is on Non-Development Operational lines.
With improvements in budget processes and performance, execution rates could be improved so actual expenditure is closer to the original budget. There is no particular pattern affecting nutrition expenditures as nutrition-related rates are similar to ministry-level ones.
NPAN2 costs “additional” investments and was approved in August 2017 while the PER covers the three years prior to the approval of NPAN2. The PER provides an initial classification of all project/operational lines identifying the largest projects per thematic area and putting special attention on the largest spending areas: food security, health, education and social protection. There is scope for making these investments more nutrition sensitive. With NPAN2 and the PER, allocative efficiency can be improved over time as targeting maximises the impact on nutrition outcomes.
In Bangladesh significant funding for nutrition is provided by donors, which is channelled through organization outside of the government system. Therefore, other available data sources were also analysed to provide an understanding of off-budget expenditure. A large number of projects/programmes (60) were found, with significant funding going from funders direct to NGOs and other organisations, and
2 Without attributing Secretariat expenditures, the figure amounts to BDT 20,855.
vi BAGLADESH PUBLIC EXPENDITURE REVIEW ON NUTRITION
with the proxy value for the three PER-N years of USD 736 million (6,182 crore taka). All projects/programmes were broadly aligned with the thematic areas of the NPAN2 with 14 have a direct objective to improve nutritional status, and nine explicitly focusing on pregnant and lactating mothers, children under five and adolescent girls. There is likely to be more investment for nutrition outside of the government system than what has been found in this PER-N. This is because NGOs are likely to receive funds from foundations and private sources which are not captured in existing datasets.
Opportunities for action
This PER-N provides a number of opportunities for action to improve nutrition expenditure, in terms of both allocation and execution. It is the first time ever to identify and classify expenditure for all ministries under NPAN2. The report provides an understanding of how state expenditures are used to meet nutrition goals and serves as a baseline to operationalize NPAN2.
A number of recommendations emerged from the PER-N and these were validated through a multi-sectorial workshop.
First, to improve the level and composition of expenditure, NPAN2 activities should be considered during budget preparation, Annual Performance Agreements to set Key Performance Indicators and project preparation. In addition, the largest spending items can be scrutinized to identify any potentially missed opportunities for better targeting for nutrition impact, particularly for the MoFood, MoHFW, MoPME and MoWCA given they account for a significant proportion of overall investments.
Second, to strengthen coordination and reporting, the nutrition investment dataset that accompanies this PER-N should be consolidated and refined going forward as additional data becomes available.
Third, efforts to advocate for nutrition should be increased. Specifically, BNNC could develop a Nutrition training module to be used by line ministries in awareness raising and capacity building of nutrition focal points in line ministries.
Fourth, the regular collection and use of relevant data should improve in order to address the data challenges identified in this PER-N, including district-disaggregated data, information on donor investments, as well as public and city corporations.
Finally, this PER-N has created the opportunities and enabling environment to track public financial investment for Nutrition.
viiBAGLADESH PUBLIC EXPENDITURE REVIEW ON NUTRITION
Acknowledgements iii
Executive Summary iv
Background iv
Objectives and approach iv
Key findings v
Opportunities for action vi
Table of contents vii
List of tables, figures, and boxes ix
List of abbreviations xi
1 Introduction
1.1 Rationale 1
1.2 Objectives 2
1.3 Structure of this report 2
2 Methodology
2.1 List of Ministries’ budgets analysed 8
2.2 Level and composition on public expenditures on nutrition (on-budget) 9
2.3 Level and composition of other donor investments on nutrition 11
2.4 Limitations 14
3 Nutrition goals and governance in Bangladesh
3.1 Government Commitment to Nutrition 17
3.2 Key Policies and Plans 18
3.3 Coordination mechanisms 22
3.4 Key findings 27
4 Public expenditure on nutrition (on-budget)
4.1 Level and composition of expenditure 29
4.2 Analysis of selected ministries 41
Table of contents
viii BAGLADESH PUBLIC EXPENDITURE REVIEW ON NUTRITION
4.3 Efficiency and equity of spending 52
4.4 Key findings 69
5 Other donor investments for nutrition
5.1 Level and composition of investments 73
5.2 Key findings 76
6 Conclusions and recommendations
6.1 Summary of findings 79
6.2 Recommendations 80
References 82
Annex A Members of the Technical Advisory Committee 84
Annex B List of people met 85
Annex C Technical notes 90
C.1 Key words 90
C.2 Description of data sources 93
C.3 Detailed methodology to screen other donor investments for nutrition 94
Annex D On-budget nutrition projects/operational lines 96
Annex E Other donor investments for nutrition 136
Annex F Validation Workshop 140
F.1 Agenda 140
F.2 List of participants 141
Annex G Plan of Action 145
Annex H About Oxford Policy Management 150
ixBAGLADESH PUBLIC EXPENDITURE REVIEW ON NUTRITION
List of tables,figures, and boxes
Table 1: Quantitative data sources and coverage 5
Table 2: The Development and Non-Development Budgets 11
Table 3: List of ministries in NPAN2 and in CIP2 20
Table 4: Nutrition expenditure 2016/17 by ministry/division 32
Table 5: Nutrition expenditure by ministry/division; 2014/15 to 2017/18; Original, revised and actual expenditure (crore, nominal)
33
Table 6: Top 20 Projects/Operational Lines by Size 37
Table 7: Top 20 Projects/Operational Lines by Size; 2014/15 to 2017/18; original, revised and actual expenditure (crore)
38
Table 8: Nutrition-Specific Projects/Operational Lines 39
Table 9: Nutrition-Specific Projects/Operational Lines; 2014/15 to 2017/18; Original, Revised and Actual (crore)
40
Table 10: Ministry of Food: Nutrition Projects/Operational Lines 42
Table 11: MoFood nutrition expenditure: Breakdown by economic classification (nominal) 43
Table 12: Breakdown of Domestic Procurement (nominal) 43
Table 13: Breakdown of Subsidy for Open Market Sale (OMS) (nominal) 43
Table 14: Ministry of Health and Family Welfare 45
Table 15: Breakdown of the Upazilla Family Planning Offices (nominal) 46
Table 16: Ministry of Primary and Mass Education: List of Projects/Operational Lines 47
Table 17: Ministry of Women and Children Affairs: List of Projects/Operational Lines 50
Table 18: Breakdown of Vulnerable Group Development (VGD) Programme (nominal) 51
Table 19: Top 20 Projects/Operational Lines by NPAN2 themes 55
Table 20: Execution rates nutrition expenditure 2014/15 to 2016/17 by Ministry 58
Table 21: Execution rates 2014/15 to 2016/17 largest projects 59
x BAGLADESH PUBLIC EXPENDITURE REVIEW ON NUTRITION
Table 22: List of 60 other donor investments for nutrition 136
Table 23: Projects found in both AIMS and CIP-DP 139
Figure 1: Overlap between the CIP and the PER list of projects/operational lines 13
Figure 2: Proposed Coordination Structure for Nutrition under the NPAN2 23
Figure 3: Nutrition Actual Expenditure as a % of Government Budget and as a share of the 15 key ministries
30
Figure 4: Nutrition Budget, Revised Allocation and Actual Expenditure, FY2014/15 to FY2016/17 (nominal terms)
30
Figure 5: Nutrition expenditure distribution across ministries, FY2014/15-2016/17 34
Figure 6: Nutrition-specific vs nutrition-sensitive, FY2014/15-FY2016/17 34
Figure 7: Development vs Non-development, FY2014/15-FY2016/17 35
Figure 8: Summary of costs of NPAN2 52
Figure 9: Distribution of nutrition-related expenditure across NPAN2 themes 54
Figure 10: Percentage of stunted children under five years of age in Bangladesh, 2012 63
Figure 11: Maternal, Neonatal, Child and Adolescent Health (MNCAH) and National Nutrition Services, Per Capita Expenditure in BDT, 2014/15
64
Figure 12: Upazilla Family Planning Offices, Per Capita Expenditure in BDT, 2014/15 65
Figure 13: Upazilla Health Complex and Sub Center, Per Capita Expenditure in BDT, 2014/15 66
Figure 14: Upazilla Health Offices, Per Capita Expenditure in BDT, 2014/15 67
Figure 15: Largest 10 other donor investments for nutrition – Total value 74
Figure 16: Other donor funding for nutrition by NPAN2 thematic areas 75
Figure 17: Screening of potential other donor investments for nutrition 94
Box 1: Conceptual Framework: Global Guidelines from the SUN Movement 6
Box 2: Alignment with FPMU database 13
Box 3: Nutrition focused policies, programme and entities in Bangladesh since 1972 17
Box 4: Ministries/Divisions mentioning nutrition in their MTBFs. 31
Box 5: Geographical distribution of stunted children 62
Box 6: Spending at sub-national level: Insights from Dhaka South City Corporation 68
Box 7: Challenges in reporting other donor investments for nutrition 73
xiBAGLADESH PUBLIC EXPENDITURE REVIEW ON NUTRITION
List of abbreviationsADP Annual Development Programme
AIMS Aid Information Management System
AUSAID Australian Aid
BADC Bangladesh Agriculture Development Corporation
BDHS Bangladesh Demographic and Health Survey
BDT Bangladesh Taka
BFDC Bangladesh Fisheries Development Corporation
BIRTAN Bangladesh Institute of Research and Training on Applied Nutrition
BNNC Bangladesh National Nutrition Council
BSCIC Bangladesh Small and Cottage Industries Corporation
CIP Country Investment Plan
CRS Creditor Reporting System
DFATD Department of Foreign Affairs, Trade and Development (now Global Affairs Canada)
DFID Department for International Development
DGHS Directorate General of Health Services
DMFAS Debt Management and Financial Analysis System
DPA Direct Project Aid
DSCC Dhaka South City Corporation
EPI Expanded Programme of Immunization
ERD Economic Relations Division, Ministry of Finance
EU European Union
FAO Food and Agriculture Organization
FPMC Food Planning and Monitoring Committee
FPMU Food Planning and Monitoring Unit, Ministry of Food
FY Financial Year
xii BAGLADESH PUBLIC EXPENDITURE REVIEW ON NUTRITION
GDP Gross Domestic Product
GAIN Global Alliance for Improved Nutrition
GBP British Pound
GoB Government of Bangladesh
HNPSP Health, Nutrition and Population Sector Programme
HPNSDP Health, Population and Nutrition Sector Development Programme
HSD Health Services Division
iBAS Integrated Budget and Accounting System
ICN2 Second International Conference on Nutrition
IMED Implementation Monitoring and Evaluation Division
IPH Institute of Public Health
IPHN Institute of Public Health and Nutrition
IYCF Infant and Young Child Feeding
KII Key Informant Interview
KOICA Korea International Cooperation Agency
LCG Local Consultative Group
LD Line Director
LGD Local Government Division
MCRAH Maternal, Child, and Reproductive & Adolescent Health
MDA Ministries, Departments and Agencies
MEFWD Medical Education and Family Welfare Division
MIS Management Information System
MNCAH Maternal, Neonatal, Child and Adolescent Health
MoF Ministry of Finance
MoFood Ministry of Food
MoHFW Ministry of Health and Family Welfare
MoPME Ministry of Primary and Mass Education
MoWCA Ministry of Women and Children Affairs
xiiiBAGLADESH PUBLIC EXPENDITURE REVIEW ON NUTRITION
MTBF Medium Term Budgetary Framework
NGO Non-Governmental Organization
NNP National Nutrition Programme
NNS National Nutrition Services
NPAN2 Second National Plan of Action for Nutrition
OECD-DAC The Organisation for Economic Co-operation and Development – Development Assistance Committee
OMS Open Market Sales
OP Operational Plan
PD Project Director
PEFA Public Expenditure and Financial Accountability
PER Public Expenditure Review
PER-N Public Expenditure Review on Nutrition
PFM Public Financial Management
PPC Planning, Policy Planning and Coordination
RDCD Rural Development and Cooperative Division
REACH Renewed Efforts Against Child Hunger and Under nutrition
RPA Reimbursable Project Aid
SBCC Social and Behaviour Change Communication
SUN Scaling Up Nutrition
TAC Technical Advisory Committee
UPHCSDP Urban Primary Health Care Services Delivery Project
USAID United States Agency for International Development
USD US Dollar
VGD Vulnerable Group Development programme
WASH Water, Sanitation and Hygiene
WFP World Food Programme
WHA World Health Assembly
WHO World Health Organization
14 BAGLADESH PUBLIC EXPENDITURE REVIEW ON NUTRITION
Introduction 1©
UN
ICE
F/U
NI1
8334
4/N
oo
ran
i

BAGLADESH PUBLIC EXPENDITURE REVIEW ON NUTRITION 1
Intent on making greater progress towards nutrition goals, the Government of Bangladesh (GoB) has made nutrition a priority. In 2012, Bangladesh signed up to the WHA six global nutrition targets and in 2014, at the Second International Conference on Nutrition (ICN2) in Rome, Bangladesh reaffirming its commitment to tackle malnutrition by endorsing both the Rome Declaration and the Plan of Action for the next decade (until 2025). Nutrition is included in key national development plans including Vision 2021. The GoB has also taken steps to ensure that a strong policy framework is in place through developing the National Nutrition Policy (2015) and the Second National Plan of Action for Nutrition 2016-2025 (NPAN2).
GoB also recognises that ensuring existing funding is being spent efficiently and in line with the NPAN2 can potentially provide a further boost in reaching nutrition goals. Two key aims of the NPAN2 are to monitor the levels of expenditure on nutrition as a percentage of total public health expenditure and to increase the level of expenditure on nutrition sensitive social protection as a percentage of total public expenditure on social protection. For this to happen, reliable financial data, including on budget allocations and expenditure is essential for policy makers to be able to prioritise, plan, and make decisions on resource allocation. Budget tracking also helps to systematically monitor and evaluate efficient use of these resources in line with the NPAN2.
Bangladesh previously carried out two rounds of nutrition budget and expenditure tracking for the financial years 2013/14 and 2014/15 as part of the global Scaling Up Nutrition (SUN) Movement initiative to track budget
3 Bangladesh Demographic and Health Survey 2014, National Institute of Population Research and Training, Ministry of Health and Family Welfare, Mitra and Associates, Dhaka, Bangladesh
1.1 RATIONALE
Bangladesh has seen rapid economic development over the last decade with growth averaging 6% per year. However, the prevalence of malnutrition, whilst improving is still high. Childhood stunting improved from 45% to 36% between the years 2000 and 20143. The World Health Assembly (WHA) global stunting target means that by 2025, Bangladesh needs a 40% reduction, 1 million in the number of children under-5 who are stunted. This requires concerted efforts from the government and its partners in order to achieve this target.
Childhood stunting improved from 45% to 36% between the years 2000 and 2014.
2 BAGLADESH PUBLIC EXPENDITURE REVIEW ON NUTRITION
4 The difference between the development and the non-development budget is explained in the following section, in Table 2.
and expenditure data on nutrition. These exercises, whilst a good starting point, focused on identifying development projects financed through the GoB financial system. This Public Expenditure Review (PER) goes further by reviewing expenditure activities financed through the non-development budget.4 It also analyses budget processes and explores how nutrition finance can be tracked sustainably and linked to the planning process moving forwards.
As a result, this PER has been commissioned to provide a more thorough and in-depth assessment of public expenditures on nutrition financed through the government budget. The findings will be assessed against the priority interventions set out in the NPAN2. This PER of nutrition (PER-N) also seeks to identify shortcomings in budgetary processes for nutrition and to assess how budgetary support can be better directed to achieve better nutrition outcomes.
1.2 Objectives
The primary objective of the PER-N is to analyse the level and composition of public expenditure in nutrition over the past three fiscal years (2014/15 – 2016/17) and the projections for 2017-18. The PER-N will provide a baseline for future trend analysis and for effectively monitoring progress towards the achievement of the nationally set goals for nutrition – specifically the goals of the NPAN2.
Secondary objectives include to assess the institutional mechanisms for the management of public finances for nutrition, including how nutrition budgets are formulated and allocated, disbursed and executed, the functioning of oversight and accountability mechanisms, and to comment on the 2017/18 budget allocations. A further objective is to assess the efficiency and equity of nutrition spending to the extent possible within the bounds of a PER.
1.3 Structure of this Report
This PER-N report is structured as follows:
• Section 2 presents the updated methodology based on the learning’s during the data collection and analysis phase;
• Section 3 discusses the nutrition goals and governance in Bangladesh which provides the framework for our analysis;
• Section 4 presents the results of the analysis of expenditure (on-budget);
• Section 5 presents the results of analysis of other nutrition investments going directly from funders to NGOs or other organisations.
• Section 6 concludes, summarising the findings and recommendations for follow up actions.

3BAGLADESH PUBLIC EXPENDITURE REVIEW ON NUTRITION©
UN
ICE
F/U
N07
2799
/Lat
if
4 BAGLADESH PUBLIC EXPENDITURE REVIEW ON NUTRITION
Methodology 2©
UN
ICE
F/U
N08
90/P
aul
5BAGLADESH PUBLIC EXPENDITURE REVIEW ON NUTRITION
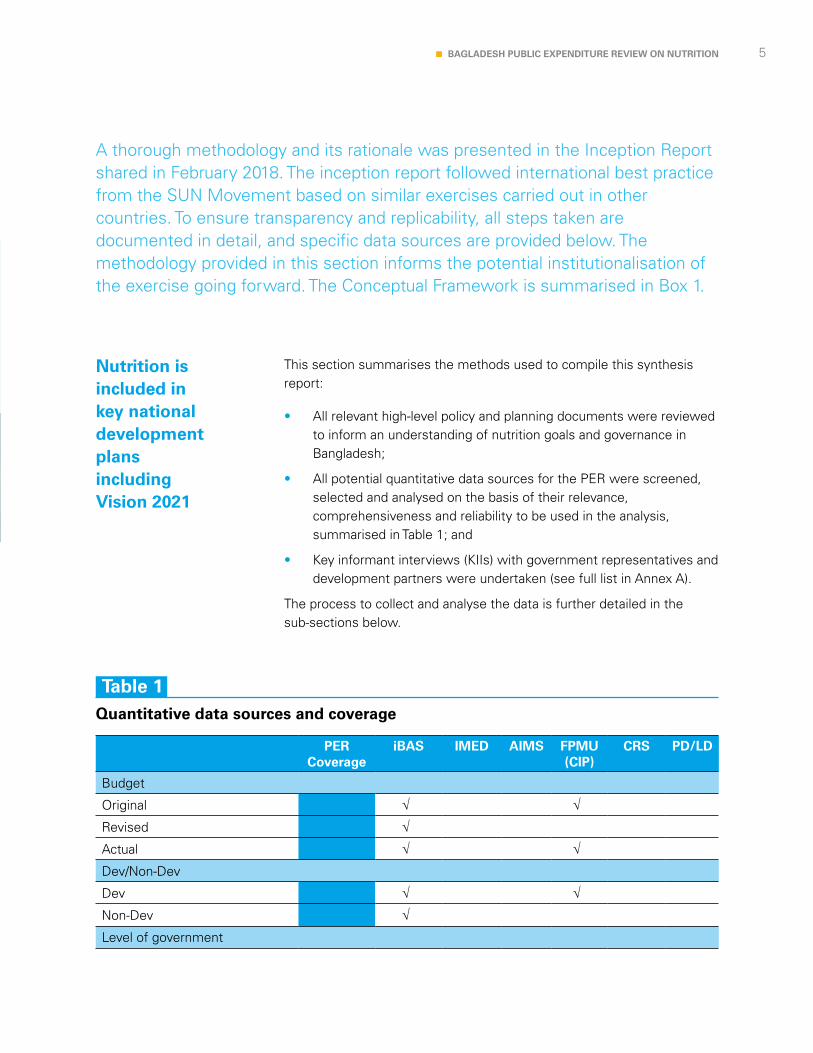
This section summarises the methods used to compile this synthesis report:
• All relevant high-level policy and planning documents were reviewed to inform an understanding of nutrition goals and governance in Bangladesh;
• All potential quantitative data sources for the PER were screened, selected and analysed on the basis of their relevance, comprehensiveness and reliability to be used in the analysis, summarised in Table 1; and
• Key informant interviews (KIIs) with government representatives and development partners were undertaken (see full list in Annex A).
The process to collect and analyse the data is further detailed in the sub-sections below.
A thorough methodology and its rationale was presented in the Inception Report shared in February 2018. The inception report followed international best practice from the SUN Movement based on similar exercises carried out in other countries. To ensure transparency and replicability, all steps taken are documented in detail, and specific data sources are provided below. The methodology provided in this section informs the potential institutionalisation of the exercise going forward. The Conceptual Framework is summarised in Box 1.
Nutrition is included in key national development plans including Vision 2021
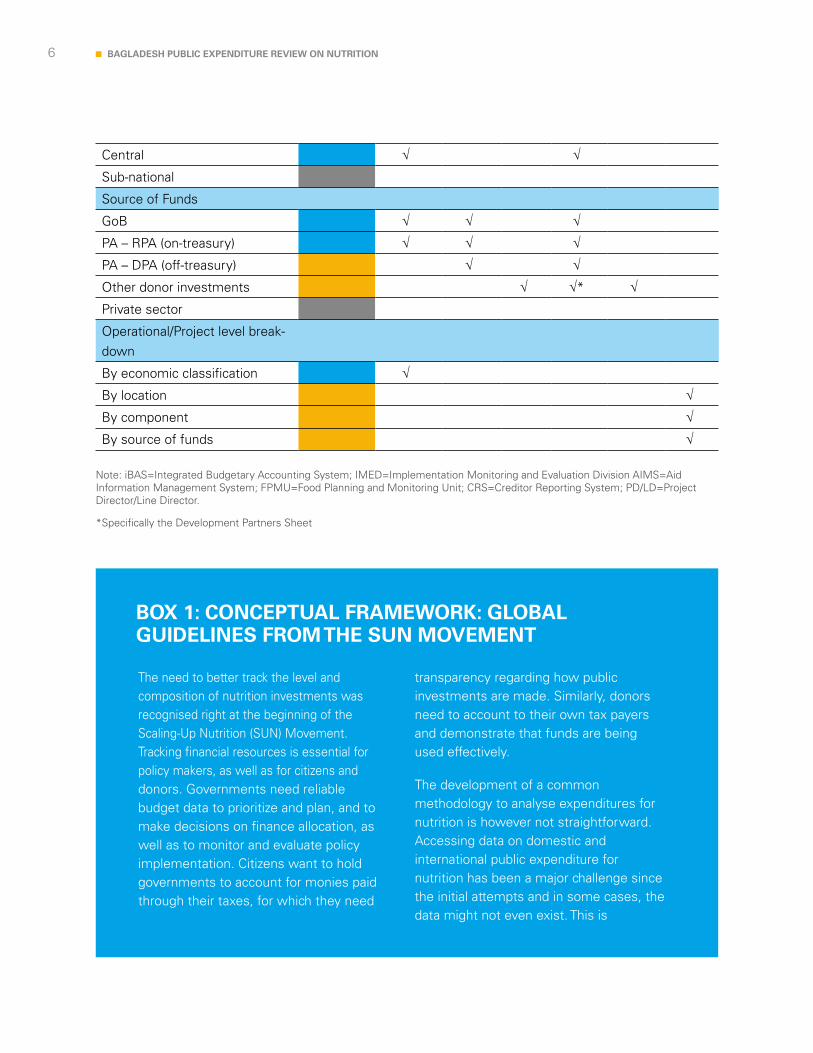
Quantitative data sources and coverage
PER Coverage
iBAS IMED AIMS FPMU (CIP)
CRS PD/LD
Budget
Original √ √
Revised √
Actual √ √
Dev/Non-Dev
Dev √ √
Non-Dev √
Level of government
Table 1
6 BAGLADESH PUBLIC EXPENDITURE REVIEW ON NUTRITION
Note: iBAS=Integrated Budgetary Accounting System; IMED=Implementation Monitoring and Evaluation Division AIMS=Aid Information Management System; FPMU=Food Planning and Monitoring Unit; CRS=Creditor Reporting System; PD/LD=Project Director/Line Director.
*Specifically the Development Partners Sheet
Central √ √
Sub-national
Source of Funds
GoB √ √ √
PA – RPA (on-treasury) √ √ √
PA – DPA (off-treasury) √ √
Other donor investments √ √* √
Private sector
Operational/Project level break-down
By economic classification √
By location √
By component √
By source of funds √
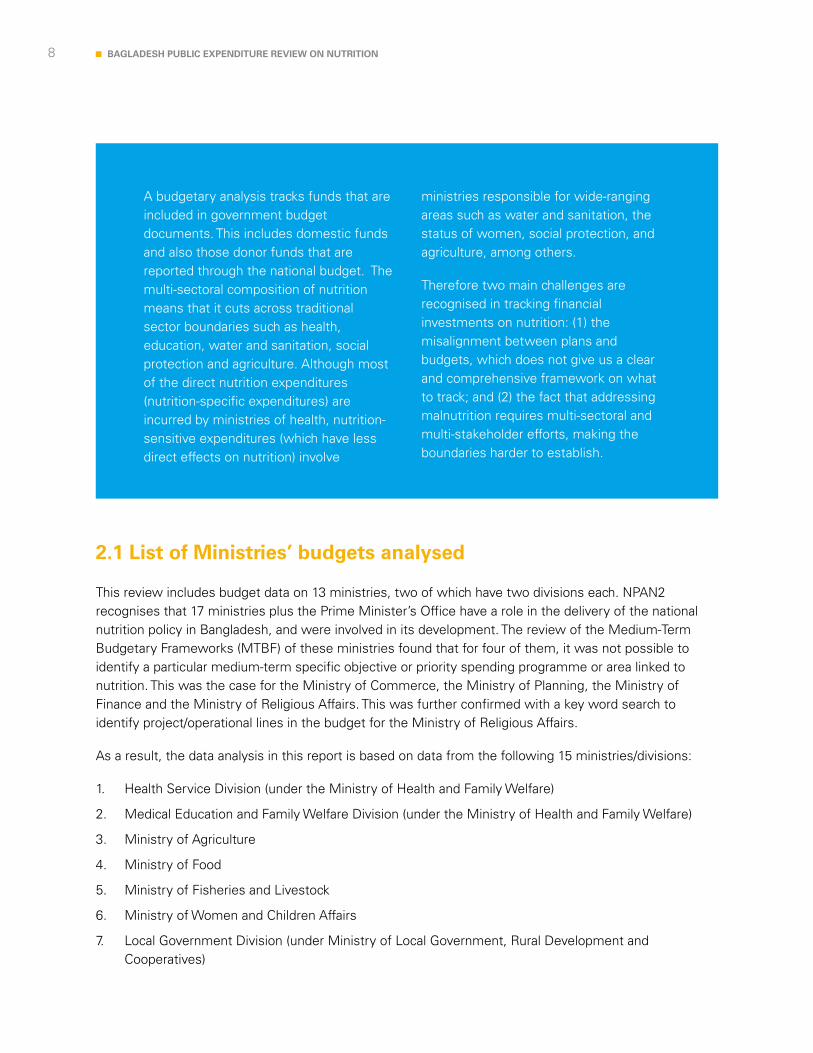
The need to better track the level and composition of nutrition investments was recognised right at the beginning of the Scaling-Up Nutrition (SUN) Movement. Tracking financial resources is essential for policy makers, as well as for citizens and donors. Governments need reliable budget data to prioritize and plan, and to make decisions on finance allocation, as well as to monitor and evaluate policy implementation. Citizens want to hold governments to account for monies paid through their taxes, for which they need
transparency regarding how public investments are made. Similarly, donors need to account to their own tax payers and demonstrate that funds are being used effectively.
The development of a common methodology to analyse expenditures for nutrition is however not straightforward. Accessing data on domestic and international public expenditure for nutrition has been a major challenge since the initial attempts and in some cases, the data might not even exist. This is
BOX 1: CONCEPTUAL FRAMEWORK: GLOBAL GUIDELINES FROM THE SUN MOVEMENT

7BAGLADESH PUBLIC EXPENDITURE REVIEW ON NUTRITION
exacerbated by the multi-sectoral dimension of nutrition programs as financing will be split across different budgets and formats.
These challenges are discussed in more detail in the sub-sections below, before the proposed approach is presented.
Key challenges in expenditure tracking methodologies
There are a number of reasons why mechanisms for resource tracking have faced many challenges in developing and transitional economies, including shortcomings in the legal and regulatory frameworks, organisational structures, and control processes (Doe, 2008). As a starting point, weak underlying Public Financial Management (PFM) systems can make resource tracking through the government system nearly impossible. Data are often not generated and where a data system exists, it is often not up to date and cannot be used for tracking or planning purposes.
At the implementation level, there are also constraints due to both systems’ capacity and the lack of capacity to carry out budget reviews. Also, as different audiences are interested in different reporting format and content, there are often numerous reporting methods being carried out in parallel with overlapping coverage, posing a significant challenge in terms of time and costs to the staff needing to complete the necessary reporting templates. A typical challenge is
how to reconcile reporting formats with Government and development partners’ requirements.
Key challenges in developing a standardised methodology for nutrition expenditure tracking
The first step in any attempt at financial tracking will of course be the delineation of the area of relevance – what should be tracked? In an ideal world, there would be detailed national plans for nutrition with associated costs, which would then be reflected in the national budget of the country, and then the implementation of these plans could be tracked through national budget documents. However, in practice this is rarely the case. Only two countries, Guatemala and Peru, have linked their national nutrition target (stunting reduction) to a publicly recognized set of line items within their government budget. This allows the tracking both of allocations and of actual expenditures over the years and linked to targets. However, the budget structure often does not go beyond the programme level to reflect the activities in the national plan. There might even be programmes in the national budget that are not covered in the national nutrition plan. In other words, plans and budgets are not fully aligned. In order to identify which interventions are in the budget and which are not, national budgets need to be screened, i.e., some budgetary analysis undertaken.
8 BAGLADESH PUBLIC EXPENDITURE REVIEW ON NUTRITION
2.1 List of Ministries’ budgets analysed
This review includes budget data on 13 ministries, two of which have two divisions each. NPAN2 recognises that 17 ministries plus the Prime Minister’s Office have a role in the delivery of the national nutrition policy in Bangladesh, and were involved in its development. The review of the Medium-Term Budgetary Frameworks (MTBF) of these ministries found that for four of them, it was not possible to identify a particular medium-term specific objective or priority spending programme or area linked to nutrition. This was the case for the Ministry of Commerce, the Ministry of Planning, the Ministry of Finance and the Ministry of Religious Affairs. This was further confirmed with a key word search to identify project/operational lines in the budget for the Ministry of Religious Affairs.
As a result, the data analysis in this report is based on data from the following 15 ministries/divisions:
1. Health Service Division (under the Ministry of Health and Family Welfare)
2. Medical Education and Family Welfare Division (under the Ministry of Health and Family Welfare)
3. Ministry of Agriculture
4. Ministry of Food
5. Ministry of Fisheries and Livestock
6. Ministry of Women and Children Affairs
7. Local Government Division (under Ministry of Local Government, Rural Development and Cooperatives)
A budgetary analysis tracks funds that are included in government budget documents. This includes domestic funds and also those donor funds that are reported through the national budget. The multi-sectoral composition of nutrition means that it cuts across traditional sector boundaries such as health, education, water and sanitation, social protection and agriculture. Although most of the direct nutrition expenditures (nutrition-specific expenditures) are incurred by ministries of health, nutrition-sensitive expenditures (which have less direct effects on nutrition) involve
ministries responsible for wide-ranging areas such as water and sanitation, the status of women, social protection, and agriculture, among others.
Therefore two main challenges are recognised in tracking financial investments on nutrition: (1) the misalignment between plans and budgets, which does not give us a clear and comprehensive framework on what to track; and (2) the fact that addressing malnutrition requires multi-sectoral and multi-stakeholder efforts, making the boundaries harder to establish.
9BAGLADESH PUBLIC EXPENDITURE REVIEW ON NUTRITION
8. Rural Development and Cooperative Division (under Ministry of Local Government, Rural Development and Cooperatives)
9. Ministry of Primary and Mass Education
10. Ministry of Social Welfare
11. Ministry of Disaster Management & Relief
12. Secondary and Higher Education Division (under the Ministry of Education)
13. Ministry of Environment and Forest
14. Ministry of Industries
15. Ministry of Information
2.2 Level and composition on public expenditures on nutrition (on-budget)
The iBAS++ data is used to identify nutrition-relevant projects. To do so, guided by NPAN2, first we identify all the nutrition-relevant ministries. Their functions were reviewed based on the MTBF, which detail each ministry’s medium term strategic objectives and priority spending areas and programmes.
To identify all potentially relevant budget/operational lines, an exhaustive list of key words was used to search through the IBAS++ data. The key words were identified per categories/sectors of the NPAN2. Based on international best practice, these have been derived from: (i) key terms used in the NPAN2, (ii) the Compendium of Actions for Nutrition (CAN) – SUN UN Network / REACH, (iii) the SUN 3-Step Approach guidelines - Tracking Government Investments for Nutrition at Country Level, and (iv) the Budget Analysis for Nutrition: guidance note for countries (update 2017). The key words can be found in Annex B.1.
In addition to the lines identified by the key word search, Secretariat costs were also included for each ministry which had development expenditure as they are essential to the implementation of nutrition-relevant programmes and policies. Secretariat costs are part of non-development budget expenditures. As not all secretariat costs support the implementation of nutrition-relevant programmes only a proportion of total secretariat cost per ministry was taken. The methodology for to calculate the proportional secretariat cost is similar to that proposed in the analysis of climate change expenditure in Bangladesh5. The proportional cost is estimated by multiplying the total secretariat cost per ministry by the ratio between nutrition-relevant development actual expenditure and total development expenditure for each ministry6.
5 Climate Protection and Development: Budget Report 2017-18”. Finance Division, Ministry of Finance; Government of the People’s Republic of Bangladesh.
6 Of the 16 ministries/divisions only 15 ministries were found with budget allocation, revised allocation or actual expenditure that was nutrition-relevant. One ministry, namely Ministry of Religious Affairs did not have any projects or operational lines that were nutrition-relevant. Thus, no secretariat costs are included for the ministry in the analysis as no expenditures overall were found.
10 BAGLADESH PUBLIC EXPENDITURE REVIEW ON NUTRITION
In order not to overestimate the investments on nutrition where these are part of larger programmes, as it is particularly the case for nutrition-sensitive interventions, the PER-N team had anticipated that perhaps a project level breakdown by component would allow the team to delineate those activities that should be included in the analysis. However, the data on breakdown by component for the projects that have been collected revealed that it is not possible to separate particular components relevant to nutrition while leaving others out. It was concluded that the whole amount for all nutrition-sensitive projects should be tracked in the PER-N rather than attempting to break it down. As nutrition is multi-sectorial and nutrition-sensitive interventions include large sector programmes (e.g. maternal and child health, procurement of food, etc.), the total nutrition investment estimated in the PER should not be compared with investment in traditional sectors, such as health or education, where expenditures directly target specific sector outcomes. The amount reported includes investments whose primary focus is not nutrition and it does not answer to what extent these are targeting nutrition. This means that investments are consciously overestimated. A project by project analysis would be necessary to give a more accurate estimate but the costs of doing so at the moment outweighed the benefits. What is important is to put the focus on the largest spending programmes to be tracked over time and have a more in-depth conversation on its design features. This report enables us to do so.
International experience shows that having lengthy discussions on whether a higher or a lower weight should be applied to a particular budget line does not add much value. Hence, the latest guidelines from the SUN Movement proposes an approach “based on two steps (identification and categorisation) and one optional step (weighting)”, as undertaken for this PER-N. It is not recommended to go through the process of weighting unless it can be informed by within project level analysis (Fracassi et al, 2017)7.
From a governance/management point of view, this is more logical to track expenditures going forward given that “projects” or “operational lines” are the unit of management within ministries, i.e., the level at which decisions are made, and the level of aggregation at which reporting happens. It therefore makes sense that sector-wide expenditure analysis is also carried out at this level and not a further level of breakdown.
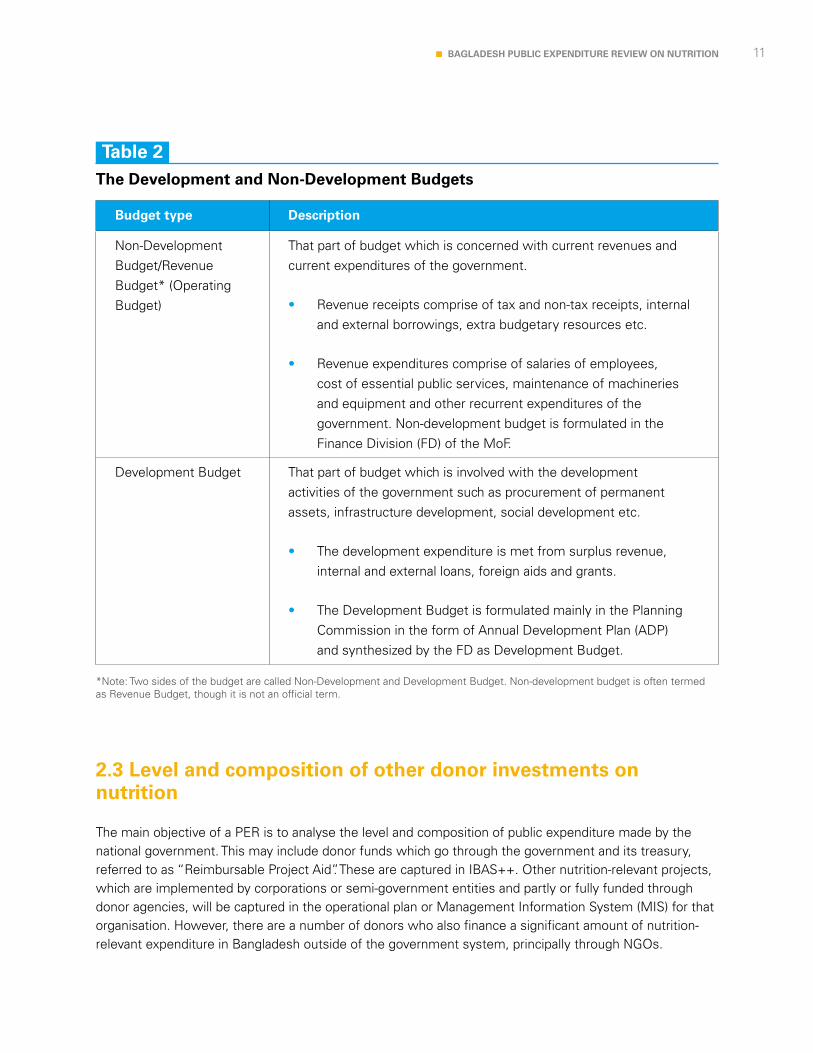
The PER-N covers both, the development as well as the non-development budget. The difference between the two is explained in Table 2.
7See http://docs.scalingupnutrition.org/wp-content/uploads/2017/10/2017-Guidance-for-Budget-Analysis_EN.pdf
11BAGLADESH PUBLIC EXPENDITURE REVIEW ON NUTRITION
The Development and Non-Development Budgets
Budget type Description
Non-Development Budget/Revenue Budget* (Operating Budget)
That part of budget which is concerned with current revenues and current expenditures of the government.
• Revenue receipts comprise of tax and non-tax receipts, internal and external borrowings, extra budgetary resources etc.
• Revenue expenditures comprise of salaries of employees, cost of essential public services, maintenance of machineries and equipment and other recurrent expenditures of the government. Non-development budget is formulated in the Finance Division (FD) of the MoF.
Development Budget That part of budget which is involved with the development activities of the government such as procurement of permanent assets, infrastructure development, social development etc.
• The development expenditure is met from surplus revenue, internal and external loans, foreign aids and grants.
• The Development Budget is formulated mainly in the Planning Commission in the form of Annual Development Plan (ADP) and synthesized by the FD as Development Budget.
*Note: Two sides of the budget are called Non-Development and Development Budget. Non-development budget is often termed as Revenue Budget, though it is not an official term.
2.3 Level and composition of other donor investments on nutrition
The main objective of a PER is to analyse the level and composition of public expenditure made by the national government. This may include donor funds which go through the government and its treasury, referred to as “Reimbursable Project Aid”. These are captured in IBAS++. Other nutrition-relevant projects, which are implemented by corporations or semi-government entities and partly or fully funded through donor agencies, will be captured in the operational plan or Management Information System (MIS) for that organisation. However, there are a number of donors who also finance a significant amount of nutrition-relevant expenditure in Bangladesh outside of the government system, principally through NGOs.
Table 2
12 BAGLADESH PUBLIC EXPENDITURE REVIEW ON NUTRITION
With the aim of developing a broad estimate of the amount of funding from donors for nutrition which goes through organisations outside of the government system, other available data sources were also analysed. These included the Country Investment Plan (CIP) database under FPMU, the Aid Information Management System (AIMS) under the Economic Relations Division (ERD) of the Ministry of Finance (MoF) and the OECD-DAC Creditor Reporting System (CRS). An overview of each of the available datasets can be found in Annex B.2.
Out of the 3 datasets mentioned above, the AIMS and CIP databases were screened first by relevant thematic areas (nutrition, health, WASH, social protection, livelihoods, education, agriculture) and then using the same key word search to identify relevant lines on donor funding for nutrition-relevant projects and programmes that are implemented through non-governmental organisations. The CRS dataset was used for triangulation of the information found in AIMS and CIP.
For those projects/programmes which were unclear in terms of their nutrition relevance, a search of project/programme websites, donor/implementing organisation websites and available project documents was undertaken to determine inclusion or exclusion. Only projects/programmes which were active for at least 1 of the 3 PER-N financial years (2014-15, 2015-16, 2016-17) were included.
The project/programme lists from the AIMS and CIP databases were then merged and screened to check whether there were any duplicate projects using the project name, the start and end dates of the project, the total funding value and the donor. A total of 13 duplicate projects/programmes were identified and excluded.
The identified projects/programmes were then classified into the NPAN2 thematic areas as closely as possible. This was done based on the information available in the respective datasets and crosschecked with project and programme websites and reports.
Finally, the datasets were compared to understand what common financial data was available across all chosen projects. As full data on disbursements were not available, the only common data which could be reliably used for comparison across projects/programmes was the total value of the project in USD. However, in order to align with the time period of the PER-N (2014-15, 2015-16, 2016-17), the financial data presented is an estimation using a proxy value based on the proportion of the project/programme period in the 3 PER-N years.
Also, this analysis does not give a complete picture as there is likely to be further funding from donors as well as private sources and foundations, for example, not captured in the available datasets analysed which go to non-governmental and other organisations.
Due to the reasons outlined above, this data is not comparable with the on-budget data analysis. This had been anticipated as a limitation from the beginning and the study has confirmed this. Further methodological details can be found in Annex B.3.
13BAGLADESH PUBLIC EXPENDITURE REVIEW ON NUTRITION
At the moment, the database held by FPMU covering the CIP is probably the most comprehensive dataset on nutrition-relevant programmes, in so long as they are related to food security. In fact, in the past, this dataset has been used to share data on nutrition to the SUN Movement Secretariat by removing those projects not relevant to nutrition and adding projects on nutrition-specific interventions which are not part of the CIP.
FPMU collects, reviews and publishes a dataset at least annually, linking expenditures to objectives. However, during the inception phase, its main limitation was identified as it only covers the Development budget, while a significant proportion of nutrition expenditures are in the Non-development budget.
On the other hand, however, the FPMU database covers projects by Public and City Corporations, which are not captured in this
PER-N as IBAS++ does not provide a sufficient level of detail. For example, Bangladesh Fisheries Development Corporation (BFDC) and Bangladesh Small and Cottage Industries Corporation (BSCIC) are not captured in the PER. This was identified as one of the main limitations of the PER during inception phase. In addition, the CIP included projects that were related to agriculture only without a link to nutrition based on the SUN Movement guidelines. The CIP has a very wide focus on food availability, access and utilisation. These are also not included in the PER.
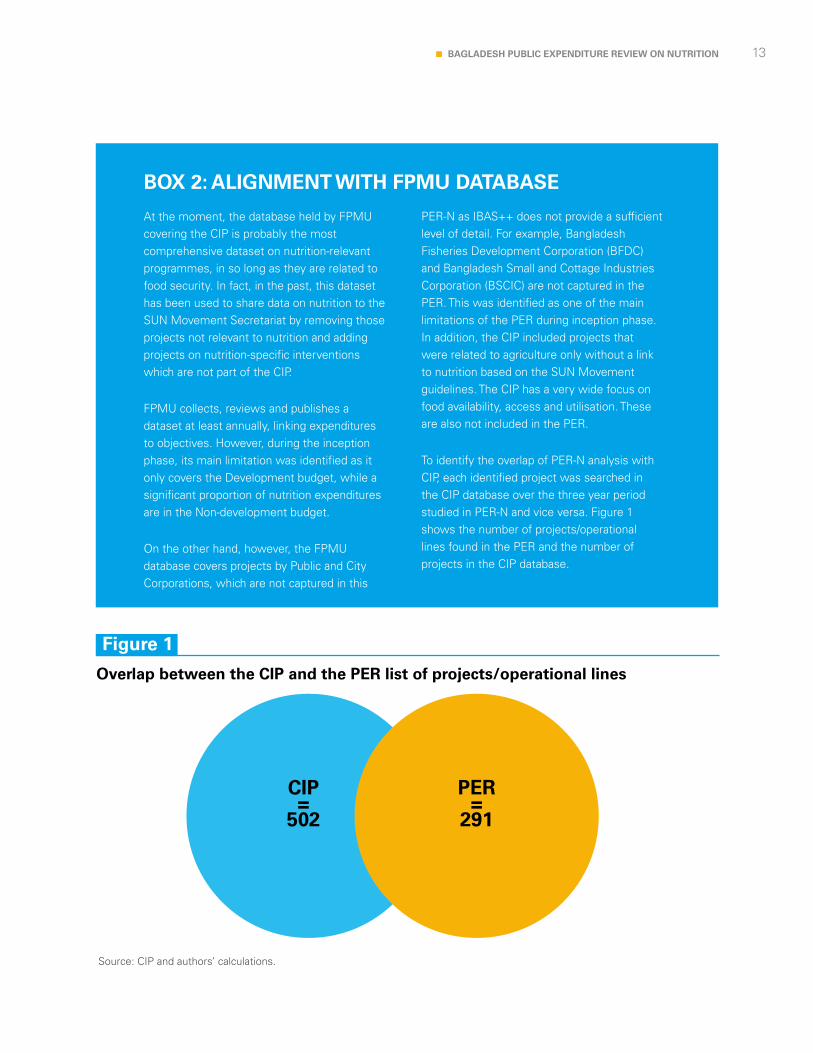
To identify the overlap of PER-N analysis with CIP, each identified project was searched in the CIP database over the three year period studied in PER-N and vice versa. Figure 1 shows the number of projects/operational lines found in the PER and the number of projects in the CIP database.
BOX 2: ALIGNMENT WITH FPMU DATABASE
CIP=
502
PER =
291
Source: CIP and authors’ calculations.
Overlap between the CIP and the PER list of projects/operational lines
Figure 1
14 BAGLADESH PUBLIC EXPENDITURE REVIEW ON NUTRITION
2.4 Limitations
The limitations of this PER are the following:
• On budget expenditure by location: With the upgrade of iBAS++, it is not possible to use the segment on location as it was not transferred into the new system. As a result, this PER-N is not able to present findings by location. The geographical spread of four selected projects is presented in Section 4.3. It is anticipated that the segment on location will be available with the upgrade of IBAS++.
• Donor investments: The existing datasets used for donor investment analysis in this PER-N do not capture funds from foundations and private sources channelled to NGOs. Hence, it does not give a complete picture of available funding for nutrition outside of the government system in Bangladesh. This is an area where the GoB and donors can work together to ensure all the necessary data with the adequate details is kept in one place.
• Public corporations: Part of nutrition investments might be carried out by semi-autonomous state owned entities, for which iBAS++ does not provide enough level of detail.8 These are not included in this PER-N. This includes, for example BSCIC’s project ‘Nutrition awareness of iodine and promoting consumption of iodized salt (2011-2012 to 2015-2016)’, which was in the CIP database but was not captured in the iBAS++ database.
• City Corporations: There are 11 City Corporations in Bangladesh and these local government bodies might make investments on nutrition from their own resources, which are not captured in iBAS++. This PER-N presents a description of finances and nutrition relevant programmes from one City Corporation (Dhaka South) to provide an indication of the relevance of these entities to nutrition (see Section 4). Clearly this is an area where further analysis should focus on.
8Ministries transfer Grants-in–Aid from Non-development budget to autonomous bodies for which iBAS++ captures economic codes. If a public corporation has a project included in ADP, ADP document shows GOB and Project Aid but does not show investment made by that public corporation from its own source. This is not captured by iBAS++ or IMED.
15BAGLADESH PUBLIC EXPENDITURE REVIEW ON NUTRITION©
UN
ICE
F/U
NI1
8334
8/N
oo
ran
16 BAGLADESH PUBLIC EXPENDITURE REVIEW ON NUTRITION
Nutrition goals and governance in Bangladesh
3©
UN
ICE
F/U
NI1
8330
0/N
oo
ran
i

17BAGLADESH PUBLIC EXPENDITURE REVIEW ON NUTRITION
3.1 Government Commitment to Nutrition
Ever since the founding of Bangladesh, the GoB has put emphasis on nutrition security. The 1972 Constitution of Bangladesh enshrined access to adequate nutrition as a basic human right in Article 18. This has been reflected in a number of nutrition focused policies, programmes and entities developed over the years (summarised in Box 3 below), from the establishment of the Institute of Public Health and Nutrition (IPHN) in 1974 to the recent development of the NPAN2. During this period emphasis has been put on nutrition as a health concern, a food security issue and, more recently, a matter that requires a multi-sectoral response.
This section gives an overview of the GoB’s commitment to improving the nutrition situation in Bangladesh, including the policies, plans and coordination structures in place to do that. Where relevant, it captures the views gathered through key informant interview on each of these interrelated matters, which included representatives from governments (including 8 line ministries from NPAN2) as well as non-government stakeholders (see Annex A for the full list of people met).
Nutrition is included in key national development plans including Vision 2021
1974 - Establishment of the Institute of Public Health and Nutrition (IPHN)
1975 - Establishment of the Bangladesh National Nutrition Council (BNNC)
1997 - National Food and Nutrition Policy and the National Plan of Action for Nutrition
1995 - Bangladesh Integrated Nutrition Programme (BINP)
2002 - National Nutrition Project 2006 - National Nutrition Project integrated
under the Health, Nutrition and Population Sector Programme
(HNPSP 2003-2011) as the National Nutrition Programme (NNP)
2006 - The National Food Policy 2008 - National Food Policy Plan of Action
(2008-2015)2011 - Operational plan (OP) of the National
Nutrition Services (NNS) approved by GoB under the Health, Population and Nutrition Sector Development Program (HPNSDP, 2011–2016)
2015 - National Nutrition Policy 2017 - The Second National Plan of Action
for Nutrition (NPAN2)
BOX 3: NUTRITION FOCUSED POLICIES, PROGRAMME AND ENTITIES IN BANGLADESH SINCE 1972
Source: Compiled by authors.
18 BAGLADESH PUBLIC EXPENDITURE REVIEW ON NUTRITION
3.2 Key Policies and Plans
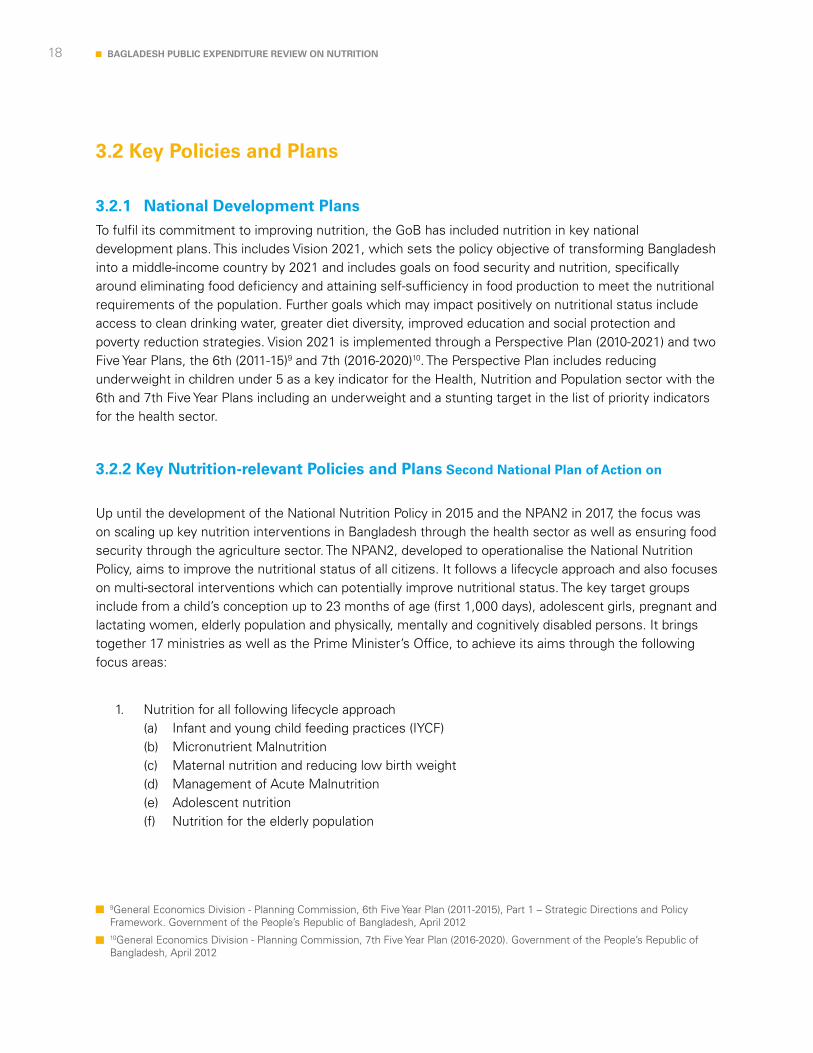
3.2.1 National Development Plans To fulfil its commitment to improving nutrition, the GoB has included nutrition in key national development plans. This includes Vision 2021, which sets the policy objective of transforming Bangladesh into a middle-income country by 2021 and includes goals on food security and nutrition, specifically around eliminating food deficiency and attaining self-sufficiency in food production to meet the nutritional requirements of the population. Further goals which may impact positively on nutritional status include access to clean drinking water, greater diet diversity, improved education and social protection and poverty reduction strategies. Vision 2021 is implemented through a Perspective Plan (2010-2021) and two Five Year Plans, the 6th (2011-15)9 and 7th (2016-2020)10. The Perspective Plan includes reducing underweight in children under 5 as a key indicator for the Health, Nutrition and Population sector with the 6th and 7th Five Year Plans including an underweight and a stunting target in the list of priority indicators for the health sector.
3.2.2 Key Nutrition-relevant Policies and Plans Second National Plan of Action on
Nutrition
Up until the development of the National Nutrition Policy in 2015 and the NPAN2 in 2017, the focus was on scaling up key nutrition interventions in Bangladesh through the health sector as well as ensuring food security through the agriculture sector. The NPAN2, developed to operationalise the National Nutrition Policy, aims to improve the nutritional status of all citizens. It follows a lifecycle approach and also focuses on multi-sectoral interventions which can potentially improve nutritional status. The key target groups include from a child’s conception up to 23 months of age (first 1,000 days), adolescent girls, pregnant and lactating women, elderly population and physically, mentally and cognitively disabled persons. It brings together 17 ministries as well as the Prime Minister’s Office, to achieve its aims through the following focus areas:
1. Nutrition for all following lifecycle approach(a) Infant and young child feeding practices (IYCF)(b) Micronutrient Malnutrition (c) Maternal nutrition and reducing low birth weight(d) Management of Acute Malnutrition(e) Adolescent nutrition(f) Nutrition for the elderly population
9General Economics Division - Planning Commission, 6th Five Year Plan (2011-2015), Part 1 – Strategic Directions and Policy Framework. Government of the People’s Republic of Bangladesh, April 201210General Economics Division - Planning Commission, 7th Five Year Plan (2016-2020). Government of the People’s Republic of Bangladesh, April 2012

19BAGLADESH PUBLIC EXPENDITURE REVIEW ON NUTRITION
(g) Prevention and control of obesity and non-communicable diseases(h) Water, sanitation and hygiene (WASH)(i) Urban nutrition
2. Agriculture and diet diversification and locally adapted recipes(j) Food Fortification(k) Food Processing and Storage(l) Food security, safety and quality
3. Social Protection
4. Implementation of Integrated and Comprehensive Social and Behaviours Change Communication (SBCC) Strategy
5. Monitoring, Evaluation and Research to inform policy and program formulation as well as implementation
6. Capacity Building
The NPAN2 is the culmination of efforts by a large number of GoB ministries and development partners over a period of 2 years to develop a plan to implement the National Nutrition Policy and is seen by many as a landmark achievement. It takes a multi-sectoral approach to tackle malnutrition in line with the Lancet 2013 Series on Maternal and Child Nutrition11, as many other countries have developed in recent years. The inclusive approach taken when developing the NPAN2 as well as its multi-sectoral nature resulted in a wide-ranging debate in terms of what could and should be included in the plan. However, a common view received from stakeholders was that the final document provides a solid framework from which to plan and to guide implementation. However, the implementation phase, which has already started, will determine the success of the NPAN2.
The Country Investment Plan for the National Food Policy Plan of Action
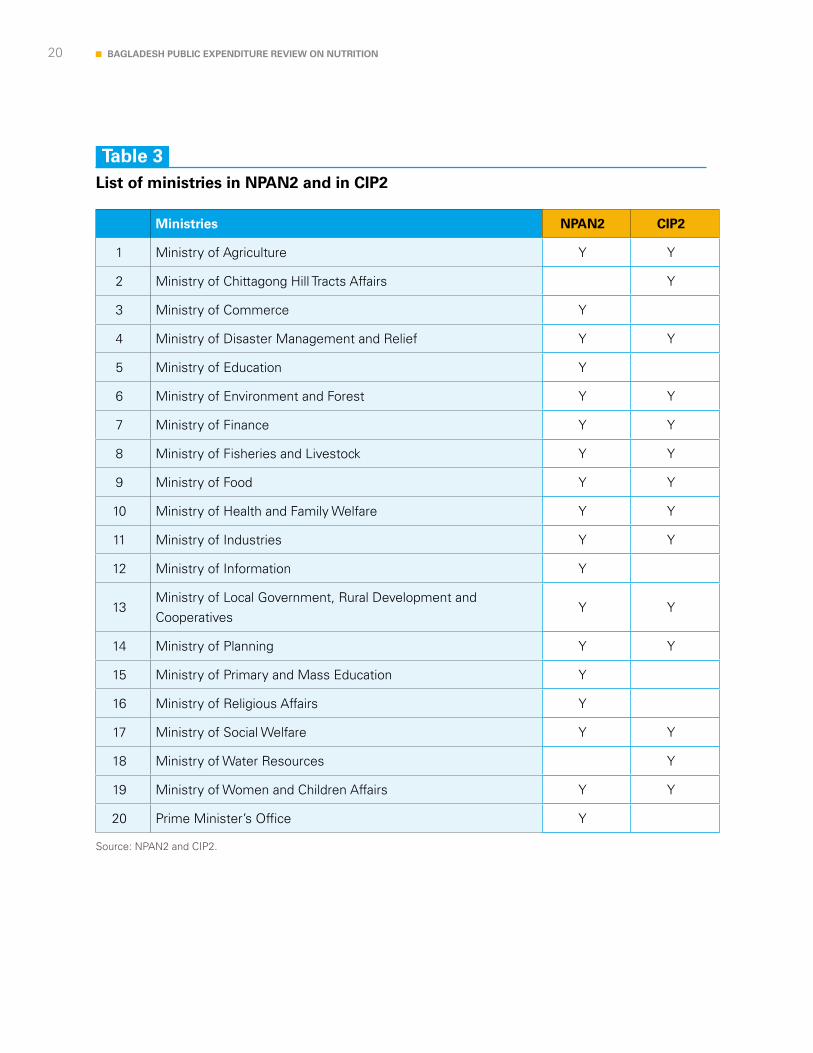
The National Food Policy Plan of Action was first implemented through the Country Investment Plan (CIP), but is now transitioning to the upcoming CIP2. The CIP set out a roadmap towards investment in agriculture, food security and nutrition with CIP2 (currently in draft), focuses on interventions related to food availability, access and utilisation, particularly nutrition sensitive food systems. There are a number of ministries and development partners whose main focus is on implementing the CIP, who also have a role to play in the implementation of the NPAN2. These include the Ministry of Food (including the Food Planning and Monitoring Unit - FPMU), the Ministry of Agriculture and the Ministry of Fisheries and Livestock along with the EU, FAO and USAID. Table 3 lists the ministries which participated in the development of the NPAN2 and /or CIP2 and have specific roles and responsibilities outlined in the Plans.
11Lancet Series on Maternal and Child Nutrition, The Lancet, Volume 382, No. 9890, 3 August 2013
20 BAGLADESH PUBLIC EXPENDITURE REVIEW ON NUTRITION
Table 3List of ministries in NPAN2 and in CIP2
Ministries NPAN2 CIP2
1 Ministry of Agriculture Y Y
2 Ministry of Chittagong Hill Tracts Affairs Y
3 Ministry of Commerce Y
4 Ministry of Disaster Management and Relief Y Y
5 Ministry of Education Y
6 Ministry of Environment and Forest Y Y
7 Ministry of Finance Y Y
8 Ministry of Fisheries and Livestock Y Y
9 Ministry of Food Y Y
10 Ministry of Health and Family Welfare Y Y
11 Ministry of Industries Y Y
12 Ministry of Information Y
13Ministry of Local Government, Rural Development and Cooperatives
Y Y
14 Ministry of Planning Y Y
15 Ministry of Primary and Mass Education Y
16 Ministry of Religious Affairs Y
17 Ministry of Social Welfare Y Y
18 Ministry of Water Resources Y
19 Ministry of Women and Children Affairs Y Y
20 Prime Minister’s Office Y
Source: NPAN2 and CIP2.
21BAGLADESH PUBLIC EXPENDITURE REVIEW ON NUTRITION
There are obvious synergies between the NPAN2 and the CIP2, particularly around food security and nutrition. FPMU, in particular, were keen to stress that although their focus is on implementing the CIP, they are keen to ensure that they are playing their role to the full to improve nutrition and food security. Similarly, donors such as the EU who also support implementation of the CIP are also supporting projects which focus on nutrition specific interventions, such as “Improving Health and Nutrition Status of Urban Extreme Poor in Bangladesh through Sustainable Health Service Provision (2016-2020).”
At the same time there are thematic areas and interventions which potentially crossover. The NPAN2 includes a component on Agriculture and diet diversification and locally adapted recipes, which covers food fortification; food processing and storage; and food security, safety and quality. These are all areas also covered in the draft CIP2. A number of respondents stressed the need to ensure that implementation of the two plans is coordinated where potential overlaps exist to achieve the maximum impact and to take advantage of synergies. FPMU indicated that there has been strong coordination since the start of development of both the CIP2 and the NPAN2.
Implementation of the NPAN2
Since the NPAN2 was finalised and approved by the Honourable Prime Minister on 13th August 2017, there have been efforts to raise awareness about it with key ministries and development partners and it has also been distributed quite widely. Although in the early stages greater awareness seems to have been generated among key development partners relative to government ministries, efforts are ongoing to disseminate information on the NPAN2 to ministries and also at the district level.
Key informant interviews were conducted with stakeholders from 8 out of the 17 ministries involved in NPAN2, in particular with the planning wing of the relevant line ministries. When asked about their level of understanding and awareness of NPAN2, responses varied widely among ministries. A majority of respondents reported that they had either heard of the NPAN2 and seen the document or that they had heard about it, often from junior colleagues, but had not seen it. Only a small minority of respondents responded that they were not aware of the NPAN2.
The most common factor regarding lack of awareness was that government officials working in the planning wing, which may have been engaged in the development of the NPAN2 to some degree, had often moved to different positions and taken the knowledge with them. A number of interviewees cited examples of colleagues that they knew had been involved but had now moved to new positions.
Another reason that came to light was that disseminated policies and plans were more likely to go first to the policy wing within each ministry, which would then disseminate amongst relevant colleagues. However, it seems as though this has not always happened to date. Therefore, awareness of the NPAN2 in each ministry may not yet have reached those that are directly responsible for the planning and budgeting of nutrition relevant interventions, i.e., the planning wing within each ministry. This situation may improve over time and with the expected appointment of nutrition focal persons within each of the 17 Ministries which are a part of NPAN2.
It may be expected that ministries would start to take the NPAN2 into consideration in the planning and budgeting cycle for the next financial year 2018-19, which is now in progress. Some ministries, such as
22 BAGLADESH PUBLIC EXPENDITURE REVIEW ON NUTRITION
the Ministry of Health – Health Services Division, indicated that this was the case. Others stated that although they were largely aware of the types of projects that they implemented that were nutrition relevant, these were being implemented as part of their regular mandate or due to the influence of other policies and plans such as the National Food Policy Plan of Action rather than because of the influence of the NPAN2 at this stage.
3.3 Coordination mechanisms
The coordination between NPAN2 and CIP2 is particularly important to ensure that synergies are maximised. Each one has its own coordinating mechanism: For the NPAN2 it is the recently revived Bangladesh National Nutrition Council (BNNC) and its associated committees and Secretariat. The Food Planning and Monitoring Committee (FPMC) coordinates the CIP, and the FPMU acts as the secretariat.
There was a suggestion that prior to the revitalisation of BNNC and the development of NPAN2, the Food Planning and Monitoring Committee had been de facto acting as the coordinating body for a significant part of nutrition-relevant interventions in Bangladesh, specifically those that overlap with food security and are part of the country’s Annual Development Programme (ADP), i.e., the development side of the budget. At the same time, there is recognition that there are also a significant number of nutrition interventions that fall outside the CIP, as explained in Section 1.1.
The first meeting of the revived BNNC on 13th August 2017, chaired by the Honourable Prime Minister, launched the NPAN2. The BNNC, comprised of Ministers representing 12 ministries, other senior government officials representing a further 4 ministries, and representatives of the Prime Minister’s Office and other government entities and academia is the apex of the envisioned coordination mechanisms for implementation of the NPAN2 (Figure 2). The proposed structure, which has started to be implemented, focuses on developing coordination mechanisms at each level of government down to the sub-district level in order to ensure that nutrition is understood and interventions are implemented as a cross cutting issue. However, it is understood that at the lower levels, these mechanisms are yet to be put in place and information on the NPAN2 is not yet disseminated fully (although a dissemination plan is being implemented). The structure also focuses on ensuring that the key stakeholders in nutrition, whether GoB, development partners or NGOs have a voice through various committees and task groups and that decisions taken by the BNNC and other key committees are transmitted effectively. This role of coordinating the various stakeholders and committees is one of the roles of the BNNC Secretariat.
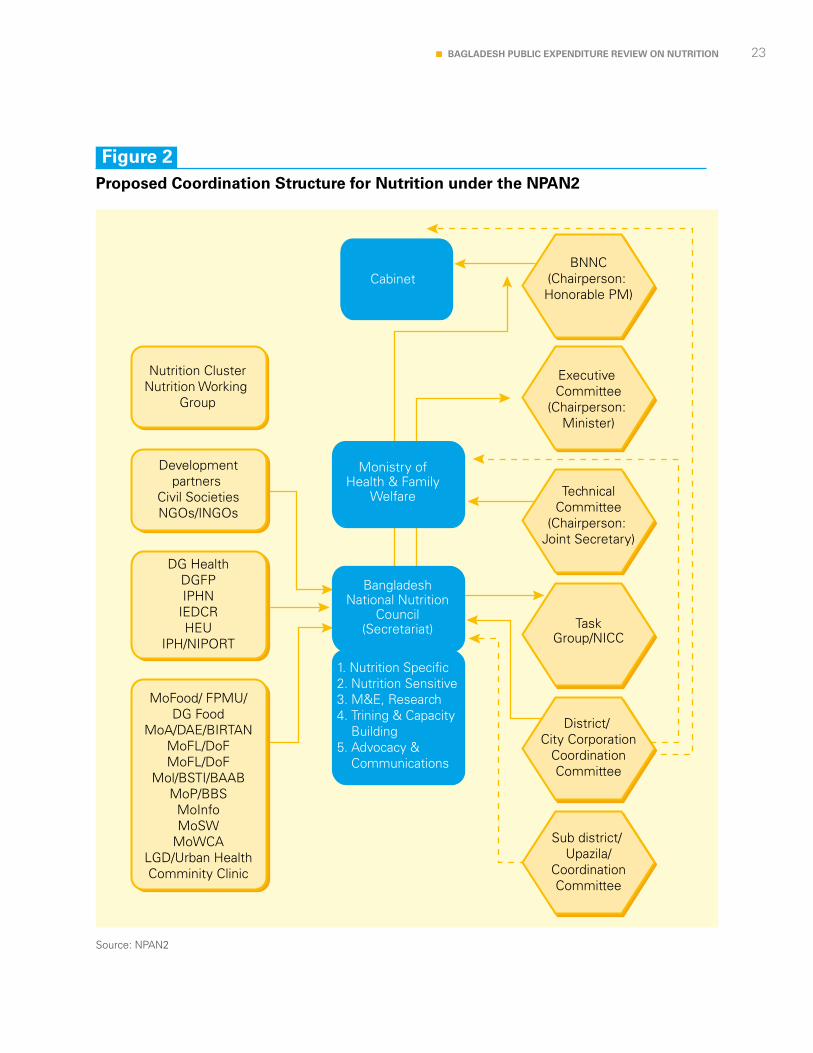
23BAGLADESH PUBLIC EXPENDITURE REVIEW ON NUTRITION
Figure 2Proposed Coordination Structure for Nutrition under the NPAN2
Source: NPAN2
24 BAGLADESH PUBLIC EXPENDITURE REVIEW ON NUTRITION
The importance of involving multiple sectors to address malnutrition is well recognised, and has been embraced by the GoB in the NPAN2. A number of other countries, which have developed multi-sectoral plans, have situated the coordinating body and associated structures under the Presidents or Prime Minister’s office in order to ensure that the body is in a position to be able to provide strong oversight and coordinate the implementation of nutrition policies and plans with Ministries, Divisions and Agencies (MDAs). In Bangladesh, a hybrid approach has been taken. The BNNC itself, chaired by the Honourable Prime Minister, is in a position to guide the 17 Ministries under the NPAN2. However, the Executive Committee (headed by the Minister of Health and Family Welfare) and the Standing Technical Committee (headed by a Joint Secretary of MOHFW) are led by the MOFHW. The BNNC Secretariat is housed in the Institute of Public Health (IPH) outside the Bangladesh Secretariat where all relevant ministries are located. It will be important to ensure that this is not a barrier to the BNNC Secretariat in particular overseeing the implementation of decisions taken by the BNNC due to being housed under one ministry (MOHFW).
3.3.1 BNNC Secretariat The BNNC Secretariat has an explicit but broad mandate to provide technical, analytical and secretarial support for NPAN2 implementation, and ensure that the decisions taken by the BNNC are implemented. Its mandate is outlined in Annex 3b of the NPAN2 and is summarised below:
• Provide technical, analytical and secretarial support to the BNNC and other Committees and execute their decisions as appropriate
• Conduct/coordinate research and studies to generate knowledge including provision of research grants
• Monitor and evaluate NPAN2 implementation; and enhance multi-sectoral coordination on policies, strategies and programs
• Provide support to formulate/update nutrition policies/plan of action and disseminate technical and general information on nutrition
• Provide support and guidance to develop institutional capacity for nutrition;
• Organize media campaign on Sustainable SBCC using radio, television and print media and maintain a public resource library on nutrition.
Although the BNNC is mandated to provide oversight and coordinate policy through the Secretariat with Ministries, Department and Agencies (MDAs) to implement nutrition-relevant interventions according to the NPAN2, the budgeting and expenditure authority remains in the MDAs. A key part of this role is to ensure information flow among ministries on nutrition policies, plans and projects as well as ensuring each relevant project is implemented in line with the National Nutrition Policy. The BNNC Secretariat has already held meetings with 8 of the 17 NPAN2 ministries (with more planned) to understand the nutrition relevant projects that they are already implementing and the budget allocated to them. It has also enquired about each ministry’s plan to implement and scale up those projects they have been mandated to implement in the NPAN2. It is critical that the BNNC Secretariat continues this early momentum.
25BAGLADESH PUBLIC EXPENDITURE REVIEW ON NUTRITION
Separately, the Cabinet Division has sent a letter to relevant ministries requesting them to provide information on the budget allocated for nutrition related activities. In both cases, as they can only advise ministries on budget allocations for nutrition and advocate for greater funding, it is too early to know what the response will be from each ministry.
Given its role, it is very important that the BNNC Secretariat builds up its capacity to that outlined in the NPAN2 (Annex 3a), as it is currently understaffed. The Director General has been in position for only 6 months, and out of a total expected staff of 62, there are only 6 staff who have been seconded from the Directorate General of Health Services (DGHS) at Assistant Director level. However, over half of the expected positions are currently being recruited. It is also yet to finalise its operational plan, outlining how it will carry out each of its functions. Both of these are critical elements that need to be addressed so that BNNC Secretariat is able to carry out its mandate and has the funding to do so.
The BNNC Secretariat is currently a grant in aid body with the budget allocation mainly coming from MOHFW for operational costs and the NNS OP to implement activities. However, there is an expectation that development partners would also provide funding to implement a number of the functional areas outlined above such as research studies and media campaigns. In fact, a number of development partners and NGOs have already provided or expressed a willingness to provide funds. This includes DFID through Nutrition International which is supporting the recruitment of a number of consultants, UNICEF which plans to develop a work plan with the BNNC Secretariat and provide support for human resources, as well as capacity support from WFP, GAIN and Alive and Thrive. The BNNC Secretariat is also actively soliciting further support from development partners.
Although it is encouraging that a number of development partners have expressed willingness to support the BNNC Secretariat or are already doing so, it would be preferable that over time such an autonomous body can receive sufficient direct budgetary support to carry out its role. A number of development partners and the BNNC Secretariat itself highlighted that it would be advantageous to receive sufficient operational budget from the GoB, rather than relying on a specific Operational Plan and development partners, to be able to carry out its mandate sustainably.
3.3.2 Coordination with development partners at national and sub-national levels
There are a large number of development partners and national and international NGOs involved in nutrition. Many work within government frameworks and programmes or at least coordinate with relevant line ministries. However, any form of coordination tends to be with the relevant line ministry. Finding the best mechanisms for coordination with development partners and NGOs to ensure that a coordinated approach is taken at each level to implement the NPAN2 will be important.
Currently there are a number of such mechanisms that could be taken advantage of:
• The Local Consultative Group (LCG) is a coordination mechanism between development partners and the GoB, consisting of national and sector level forums. The LCG Plenary is chaired by the Secretary of the ERD and the chair of the LCG Executive Committee (a development partner representative), and includes representatives of bilateral and multilateral donors. It promotes the
26 BAGLADESH PUBLIC EXPENDITURE REVIEW ON NUTRITION
effective and efficient use of aid in harmony with the GoB’s development priorities. The LCG Executive Committee steers the work of the LCG. Under the LCG Plenary are a number of sector Working Groups including one for health, but not specifically nutrition.12
• Separately, a Nutrition Working Group (NWG) aims to coordinate the work of development partners and NGOs in Bangladesh. The co-chairs of the NWG are members of the Nutrition Task Group (NTG), led by the MOHFW and operating within the health, nutrition and population sector programme. NGOs also coordinate nutrition activities through the SUN Civil Society Alliance.
The BNNC Secretariat has already started to plan and undertake regular meetings with development partners and NGOs, with one such meeting held in the second half of March 2018 with the aim of soliciting further support and sensitizing on the role of the BNNC Secretariat in the NPAN2. This is an encouraging sign; however, it will be important that they take advantage of and work within these existing coordination mechanisms to coordinate with development partners and NGOs to build towards what is proposed in the NPAN2, rather than duplicating existing coordination mechanisms. In order to start this process, a review of the existing groups with development partners and NGOs to agree on the best mechanisms to coordinate effectively, would be helpful. It will also be important for development partners and NGOs to ensure that relevant groups are fully functional and are linked to the BNNC Secretariat.
Sub-national level coordination
As Figure 2 showed, the coordination mechanisms for the NPAN2 are not only focused at the national level but go down to the lower levels of government at the district and sub-district levels. A number of stakeholders within and outside of the GoB suggested that ensuring an understanding of what the NPAN2 is trying to achieve at the sub-national level, where the majority of implementation actually takes place, would be critical to its success. Nutrition is not a new issue at this level and 39 districts supported by UNICEF have set up multi-sectoral District Nutrition Coordination mechanisms over the last 4 years13. There are also a significant number of GoB and non-government actors at the local level working on nutrition-relevant interventions, often together. However, nutrition is not necessarily seen as a key issue at the local level with most spending on issues that give immediately visible results.
A strong coordination mechanism from the national to local level is important to ensure that the multitude of actors within and outside of the GoB are all working in a coordinated manner towards the same nutrition goals within the NPAN2. Taking the case of IYCF as an example: At the national level, the MoHFW, for example, takes the lead in developing national guidelines for IYCF, with technical support
12www.lcgbangladesh.org13District Nutrition Coordination comprised of: CS, DDFP, DD-Agri, DFO, DLO, DPEO, DEO, DWAO, BSCIC, DFO, DIO, DSWO
27BAGLADESH PUBLIC EXPENDITURE REVIEW ON NUTRITION
coming from development partners as well as funding to implement relevant programmes at the local level. At the other end of the chain, NGOs may play a critical role working with the district or sub-district councils in order to advocate for implementing the IYCF guidelines and also to support implementation in Community Clinics (14,000 established since 200914), and through outreach services. Strong coordination at each level will help to ensure that key nutritional interventions achieve maximum impact. Therefore, it is critical that focus continues to be placed on sensitization around the NPAN2 throughout the country and implementing multi-sectoral coordination mechanisms at all levels.
There are two recent developments in this direction showing progress made on the coordination mechanism: The District and Upazilla Nutrition Coordination Committee was approved on the 31st of July 2018; and The Nutrition Platform Committee was approved on the 12th of August 2018.
3.4 Key findings
In summary, the key findings on nutrition goals and governance are as follows:
• The GoB is increasingly committed to improving nutrition outcomes of the population, attested by the growing number of policies and action plans and the reformation of the BNNC.
• There are obvious synergies and areas of potential crossover between the NPAN2 and the CIP2, particularly around nutrition sensitive ap ill be very important.
• A coordination mechanism is in place but a number of steps are required before it is fully functional including continuing to build the capacity of the BNNC Secretariat, and further developing the envisaged coordination mechanisms with and between donors and other development partners and at the district and sub-district levels. There has been progress throughout 2018 in this respect.
• The BNNC Secretariat should continue to enhance its advocacy role and the relationship building it has started with ministries and development partners. This will enable it to execute its functions more effectively including those related to funding such as ensuring sufficient budget allocations for nutrition-relevant projects in each ministry, and tracking nutrition budgets and expenditure over the lifetime of the NPAN2.
14http://www.searo.who.int/mediacentre/events/community-clinics-bangladesh-story/en/

28 BAGLADESH PUBLIC EXPENDITURE REVIEW ON NUTRITION
Public expenditure on nutrition(on-budget)
4©
UN
ICE
F/U
NI6
6229
/No
ora
ni
29BAGLADESH PUBLIC EXPENDITURE REVIEW ON NUTRITION
Based on the methodology outlined in Section 2 above, this PER has identified a total of 291 projects/operational lines relevant to nutrition in the 15 ministries/divisions. The full list is presented in Annex D and the analysis is presented below.
Figure 3 presents the yearly trend in nutrition actual expenditure from FY2014/15 to FY2016/17 as a percentage of total government budget and as a percentage of the nutrition-relevant ministries. It shows that the proportion of nutrition expenditure with respect to the total budget for these 15 ministries/divisions remained relatively stable around 20% over the 3 years under review (FY2014/15 to FY2016/17). Figure 4 presents nutrition budget allocation, revised allocation and actual expenditure in nominal terms for the 15 ministries/divisions. The figure shows how actual expenditure has been lower than the revised budget every year, which itself was also lower than the original budget.
4.1 Level and composition of expenditure
In total, BDT 23,120 crore (USD 2.7 billion)15 was spent in nutrition relevant interventions in Bangladesh in 2016/17, representing about 9% of the total GoB budget and about 1% of GDP. This includes Secretariat costs attributed to nutrition interventions and all nutrition-specific and nutrition-sensitive interventions (the value without Secretariat costs is BDT 20,855). The latter are accounted for in full, without weighting or apportionment. In other words, this amount includes not only those investments in the interventions that are the most effective and most important to accelerate progress in improving nutritional status (nutrition-specific) but also those that address the underlying determinants of nutrition (nutrition-sensitive programmes). With a population of over 150 million (of which 15 million are children under 5),16 this translates into an average of about USD 18 per capita. However, as stated above, as nutrition is multi-sectorial and nutrition-sensitive interventions include large sector programmes (e.g. maternal and child health, procurement of food, etc.), the total expenditure found with the PER should not be compared with investment in traditional sectors, such as health or education.
Nutrition is included in key national development plans including Vision 2021
15Estimated using exchange rate at USD 1=BDT 84. This figure includes Secretariat costs attributed to nutrition interventions. 16See UNICEF statistics for Bangladesh at: https://www.unicef.org/infobycountry/bangladesh_bangladesh_statistics.html
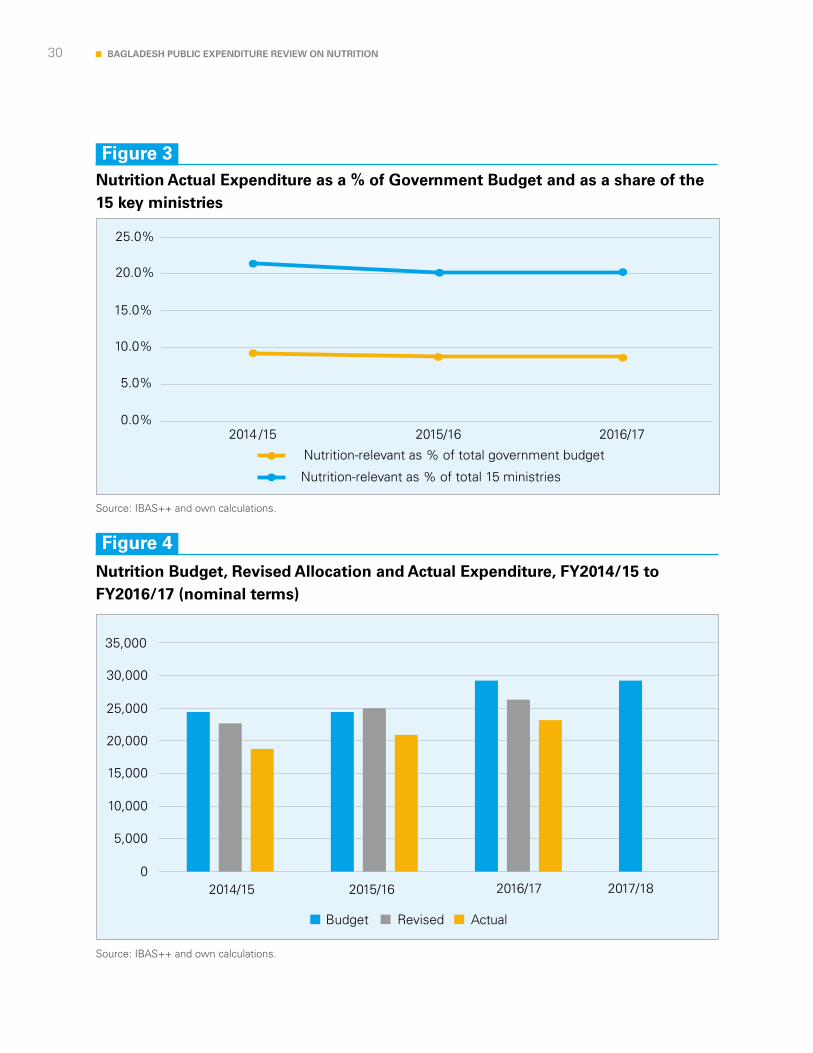
30 BAGLADESH PUBLIC EXPENDITURE REVIEW ON NUTRITION
Nutrition Budget, Revised Allocation and Actual Expenditure, FY2014/15 to FY2016/17 (nominal terms)
Figure 4
Source: IBAS++ and own calculations.
Source: IBAS++ and own calculations.
Figure 3Nutrition Actual Expenditure as a % of Government Budget and as a share of the 15 key ministries
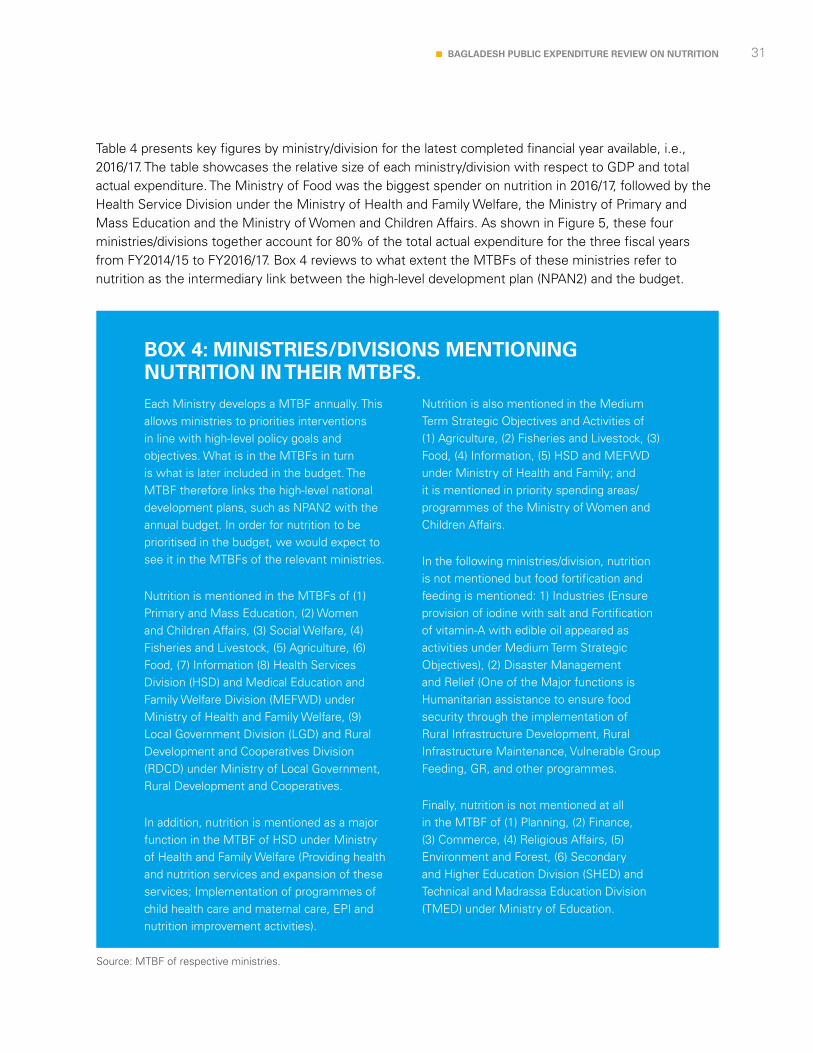
31BAGLADESH PUBLIC EXPENDITURE REVIEW ON NUTRITION
Source: MTBF of respective ministries.
Table 4 presents key figures by ministry/division for the latest completed financial year available, i.e., 2016/17. The table showcases the relative size of each ministry/division with respect to GDP and total actual expenditure. The Ministry of Food was the biggest spender on nutrition in 2016/17, followed by the Health Service Division under the Ministry of Health and Family Welfare, the Ministry of Primary and Mass Education and the Ministry of Women and Children Affairs. As shown in Figure 5, these four ministries/divisions together account for 80% of the total actual expenditure for the three fiscal years from FY2014/15 to FY2016/17. Box 4 reviews to what extent the MTBFs of these ministries refer to nutrition as the intermediary link between the high-level development plan (NPAN2) and the budget.
Each Ministry develops a MTBF annually. This allows ministries to priorities interventions in line with high-level policy goals and objectives. What is in the MTBFs in turn is what is later included in the budget. The MTBF therefore links the high-level national development plans, such as NPAN2 with the annual budget. In order for nutrition to be prioritised in the budget, we would expect to see it in the MTBFs of the relevant ministries.
Nutrition is mentioned in the MTBFs of (1) Primary and Mass Education, (2) Women and Children Affairs, (3) Social Welfare, (4) Fisheries and Livestock, (5) Agriculture, (6) Food, (7) Information (8) Health Services Division (HSD) and Medical Education and Family Welfare Division (MEFWD) under Ministry of Health and Family Welfare, (9) Local Government Division (LGD) and Rural Development and Cooperatives Division (RDCD) under Ministry of Local Government, Rural Development and Cooperatives.
In addition, nutrition is mentioned as a major function in the MTBF of HSD under Ministry of Health and Family Welfare (Providing health and nutrition services and expansion of these services; Implementation of programmes of child health care and maternal care, EPI and nutrition improvement activities).
Nutrition is also mentioned in the Medium Term Strategic Objectives and Activities of (1) Agriculture, (2) Fisheries and Livestock, (3) Food, (4) Information, (5) HSD and MEFWD under Ministry of Health and Family; and it is mentioned in priority spending areas/programmes of the Ministry of Women and Children Affairs.
In the following ministries/division, nutrition is not mentioned but food fortification and feeding is mentioned: 1) Industries (Ensure provision of iodine with salt and Fortification of vitamin-A with edible oil appeared as activities under Medium Term Strategic Objectives), (2) Disaster Management and Relief (One of the Major functions is Humanitarian assistance to ensure food security through the implementation of Rural Infrastructure Development, Rural Infrastructure Maintenance, Vulnerable Group Feeding, GR, and other programmes.
Finally, nutrition is not mentioned at all in the MTBF of (1) Planning, (2) Finance, (3) Commerce, (4) Religious Affairs, (5) Environment and Forest, (6) Secondary and Higher Education Division (SHED) and Technical and Madrassa Education Division (TMED) under Ministry of Education.
BOX 4: MINISTRIES/DIVISIONS MENTIONING NUTRITION IN THEIR MTBFS.
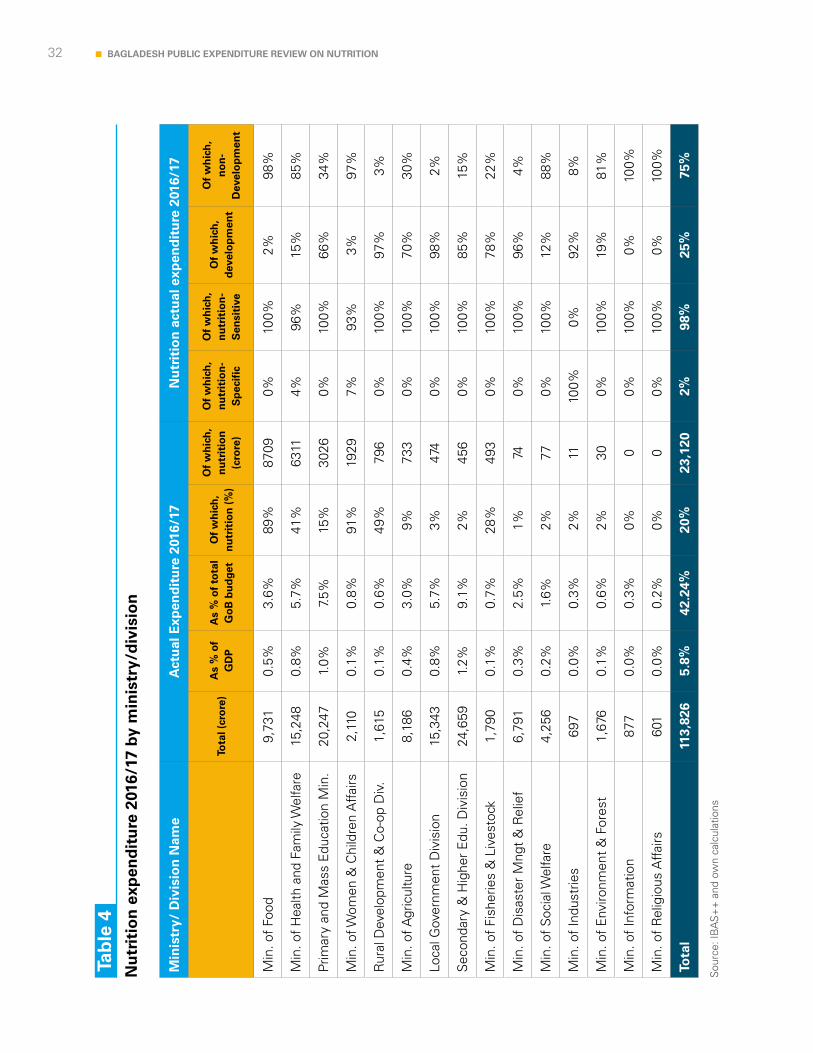
32 BAGLADESH PUBLIC EXPENDITURE REVIEW ON NUTRITION
Min
istr
y/ D
ivis
ion
Nam
eA
ctu
al E
xpen
dit
ure
201
6/17
Nu
trit
ion
act
ual
exp
end
itu
re 2
016/
17
To
tal (
cro
re)
As
% o
f G
DP
As
% o
f to
tal
Go
B b
ud
get
Of
wh
ich
, n
utr
itio
n (
%)
Of
wh
ich
, n
utr
itio
n
(cro
re)
Of
wh
ich
, n
utr
itio
n-
Sp
ecif
ic
Of
wh
ich
, n
utr
itio
n-
Sen
siti
ve
Of
wh
ich
, d
evel
op
men
t
Of
wh
ich
, n
on
-D
evel
op
men
t
Min
. of
Food
9,
731
0.5%
3.6%
89%
8709
0%10
0%2%
98%
Min
. of
Hea
lth a
nd F
amily
Wel
fare
15,2
480.
8%5.
7%41
%63
114%
96%
15%
85%
Prim
ary
and
Mas
s E
duca
tion
Min
. 20
,247
1.0%
7.5%
15%
3026
0%10
0%66
%34
%
Min
. of W
omen
& C
hild
ren
Affa
irs
2,11
00.
1%0.
8%91
%19
297%
93%
3%97
%
Rur
al D
evel
opm
ent
& C
o-op
Div
.1,
615
0.1%
0.6%
49%
796
0%10
0%97
%3%
Min
. of A
gric
ultu
re
8,18
60.
4%3.
0%9%
733
0%10
0%70
%30
%
Loca
l Gov
ernm
ent
Div
isio
n 15
,343
0.8%
5.7%
3%47
40%
100%
98%
2%
Sec
onda
ry &
Hig
her
Edu
. Div
isio
n 24
,659
1.2%
9.1%
2%45
60%
100%
85%
15%
Min
. of
Fish
erie
s &
Liv
esto
ck
1,79
00.
1%0.
7%28
%49
30%
100%
78%
22%
Min
. of
Dis
aste
r M
ngt
& R
elie
f6,
791
0.3%
2.5%
1%74
0%10
0%96
%4%
Min
. of
Soc
ial W
elfa
re
4,25
60.
2%1.
6%2%
770%
100%
12%
88%
Min
. of
Indu
strie
s 69
70.
0%0.
3%2%
1110
0%0%
92%
8%
Min
. of
Env
ironm
ent
& F
ores
t 1,
676
0.1%
0.6%
2%30
0%10
0%19
%81
%
Min
. of
Info
rmat
ion
877
0.0%
0.3%
0%0
0%10
0%0%
100%
Min
. of
Rel
igio
us A
ffairs
60
10.
0%0.
2%0%
00%
100%
0%10
0%
Tota
l11
3,82
65.
8%42
.24%
20%
23,1
202%
98%
25%
75%
Sou
rce:
IBA
S+
+ a
nd o
wn
calc
ulat
ions
Tab
le 4
Nu
trit
ion
exp
end
itu
re 2
016/
17 b
y m
inis
try/
div
isio
n
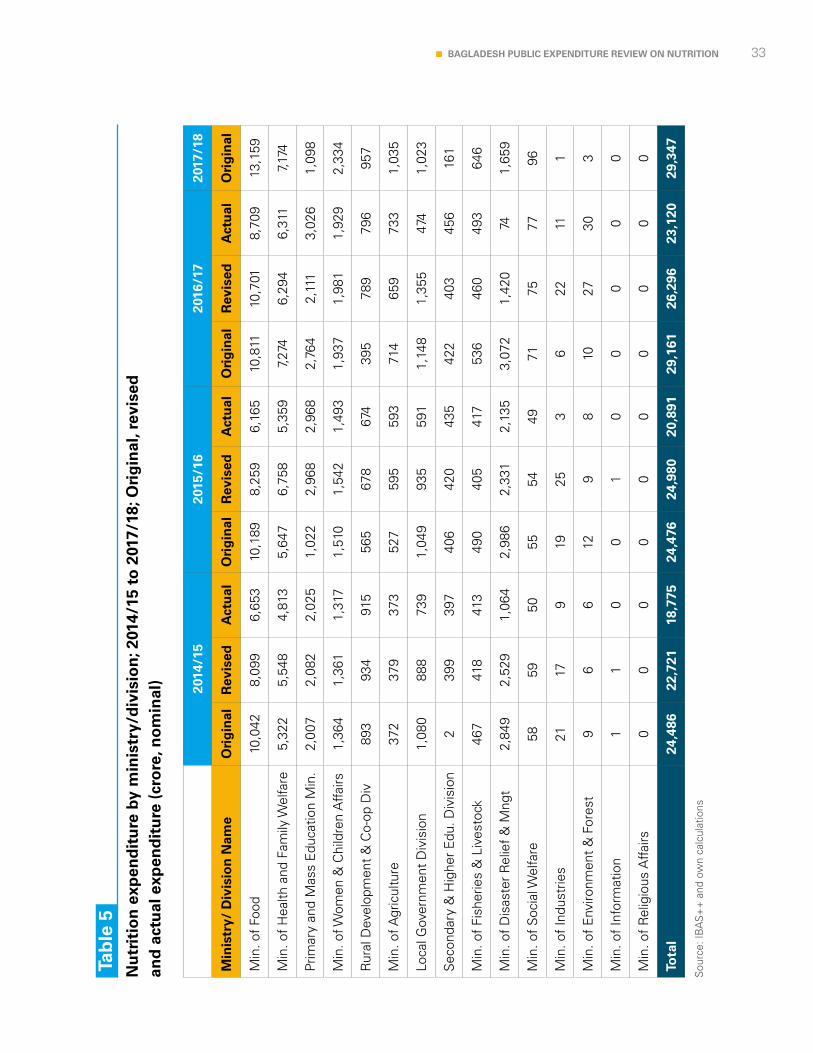
33BAGLADESH PUBLIC EXPENDITURE REVIEW ON NUTRITION
Sou
rce:
IBA
S+
+ a
nd o
wn
calc
ulat
ions
20
14/1
520
15/1
620
16/1
720
17/1
8
Min
istr
y/ D
ivis
ion
Nam
eO
rig
inal
Rev
ised
Act
ual
Ori
gin
alR
evis
edA
ctu
alO
rig
inal
Rev
ised
Act
ual
Ori
gin
al
Min
. of
Food
10,0
428,
099
6,65
310
,189
8,25
96,
165
10,8
1110
,701
8,70
913
,159
Min
. of
Hea
lth a
nd F
amily
Wel
fare
5,32
25,
548
4,81
35,
647
6,75
85,
359
7,27
46,
294
6,31
17,
174
Prim
ary
and
Mas
s E
duca
tion
Min
. 2,
007
2,08
22,
025
1,02
22,
968
2,96
82,
764
2,11
13,
026
1,09
8
Min
. of W
omen
& C
hild
ren
Affa
irs
1,36
41,
361
1,31
71,
510
1,54
21,
493
1,93
71,
981
1,92
92,
334
Rur
al D
evel
opm
ent
& C
o-op
Div
893
934
915
565
678
674
395
789
796
957
Min
. of A
gric
ultu
re37
237
937
352
759
559
371
465
973
31,
035
Loca
l Gov
ernm
ent
Div
isio
n1,
080
888
739
1,04
993
559
11,
148
1,35
547
41,
023
Sec
onda
ry &
Hig
her
Edu
. Div
isio
n
239
939
740
642
043
542
240
345
616
1
Min
. of
Fish
erie
s &
Liv
esto
ck46
741
841
349
040
541
753
646
049
364
6
Min
. of
Dis
aste
r R
elie
f &
Mng
t2,
849
2,52
91,
064
2,98
62,
331
2,13
53,
072
1,42
074
1,65
9
Min
. of
Soc
ial W
elfa
re58
5950
5554
4971
7577
96
Min
. of
Indu
strie
s21
179
1925
36
2211
1
Min
. of
Env
ironm
ent
& F
ores
t9
66
129
810
2730
3
Min
. of
Info
rmat
ion
11
00
10
00
00
Min
. of
Rel
igio
us A
ffairs
00
00
00
00
00
Tota
l24
,486
22,7
2118
,775
24,4
7624
,980
20,8
9129
,161
26,2
9623
,120
29,3
47
Tab
le 5
Nu
trit
ion
exp
end
itu
re b
y m
inis
try/
div
isio
n; 2
014/
15 t
o 2
017/
18; O
rig
inal
, rev
ised
an
d a
ctu
al e
xpen
dit
ure
(cr
ore
, no
min
al)
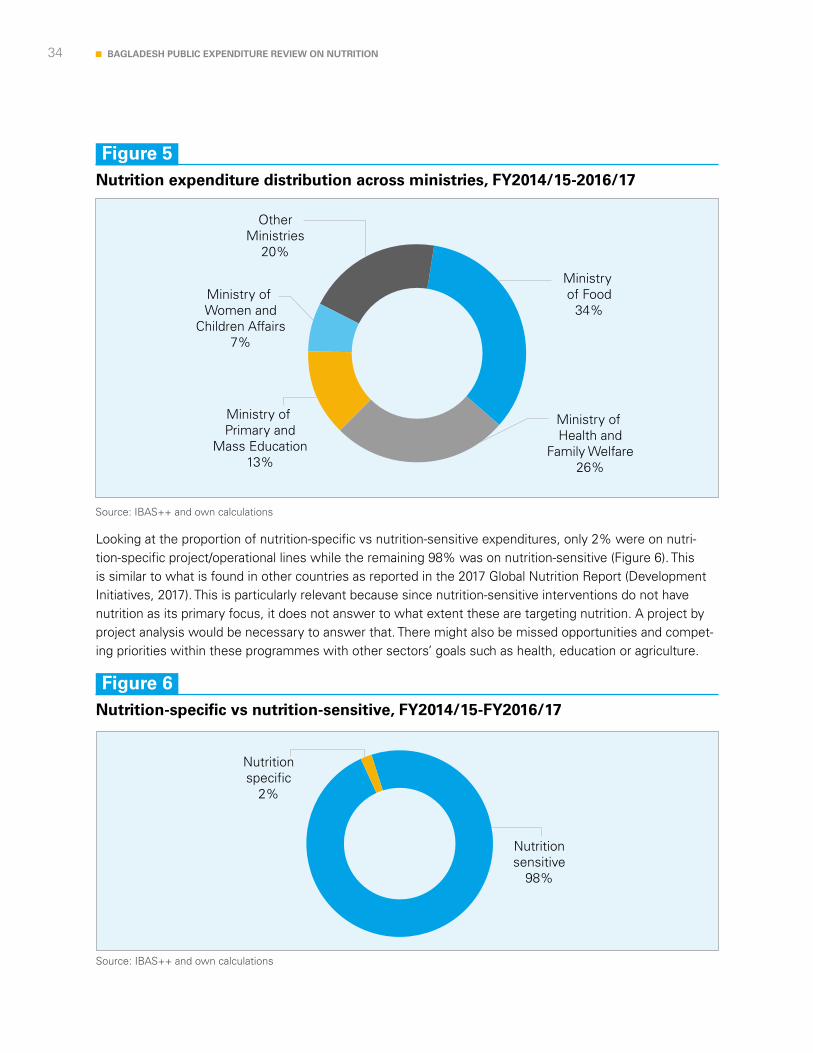
34 BAGLADESH PUBLIC EXPENDITURE REVIEW ON NUTRITION
Source: IBAS++ and own calculations
Source: IBAS++ and own calculations
Looking at the proportion of nutrition-specific vs nutrition-sensitive expenditures, only 2% were on nutri-tion-specific project/operational lines while the remaining 98% was on nutrition-sensitive (Figure 6). This is similar to what is found in other countries as reported in the 2017 Global Nutrition Report (Development Initiatives, 2017). This is particularly relevant because since nutrition-sensitive interventions do not have nutrition as its primary focus, it does not answer to what extent these are targeting nutrition. A project by project analysis would be necessary to answer that. There might also be missed opportunities and compet-ing priorities within these programmes with other sectors’ goals such as health, education or agriculture.
Figure 5Nutrition expenditure distribution across ministries, FY2014/15-2016/17
Figure 6Nutrition-specific vs nutrition-sensitive, FY2014/15-FY2016/17
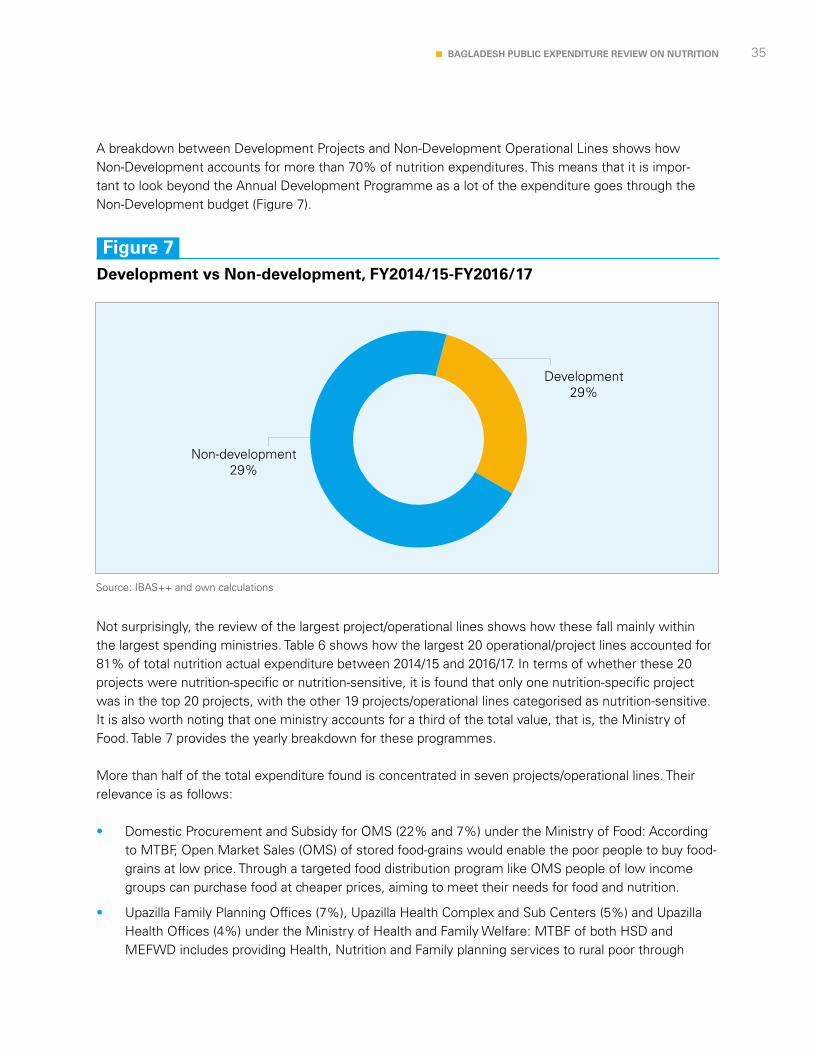
35BAGLADESH PUBLIC EXPENDITURE REVIEW ON NUTRITION
Source: IBAS++ and own calculations
A breakdown between Development Projects and Non-Development Operational Lines shows how Non-Development accounts for more than 70% of nutrition expenditures. This means that it is impor-tant to look beyond the Annual Development Programme as a lot of the expenditure goes through the Non-Development budget (Figure 7).
Not surprisingly, the review of the largest project/operational lines shows how these fall mainly within the largest spending ministries. Table 6 shows how the largest 20 operational/project lines accounted for 81% of total nutrition actual expenditure between 2014/15 and 2016/17. In terms of whether these 20 projects were nutrition-specific or nutrition-sensitive, it is found that only one nutrition-specific project was in the top 20 projects, with the other 19 projects/operational lines categorised as nutrition-sensitive. It is also worth noting that one ministry accounts for a third of the total value, that is, the Ministry of Food. Table 7 provides the yearly breakdown for these programmes. More than half of the total expenditure found is concentrated in seven projects/operational lines. Their relevance is as follows:
• Domestic Procurement and Subsidy for OMS (22% and 7%) under the Ministry of Food: According to MTBF, Open Market Sales (OMS) of stored food-grains would enable the poor people to buy food-grains at low price. Through a targeted food distribution program like OMS people of low income groups can purchase food at cheaper prices, aiming to meet their needs for food and nutrition.
• Upazilla Family Planning Offices (7%), Upazilla Health Complex and Sub Centers (5%) and Upazilla Health Offices (4%) under the Ministry of Health and Family Welfare: MTBF of both HSD and MEFWD includes providing Health, Nutrition and Family planning services to rural poor through
Figure 7Development vs Non-development, FY2014/15-FY2016/17
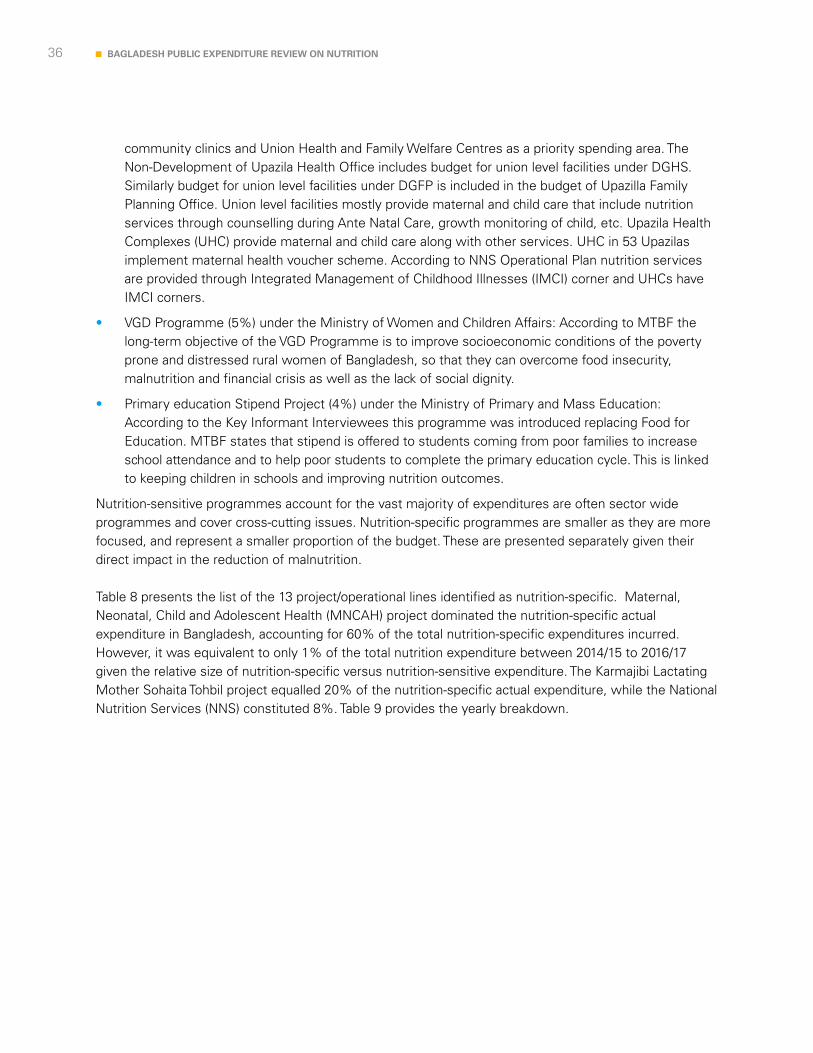
36 BAGLADESH PUBLIC EXPENDITURE REVIEW ON NUTRITION
community clinics and Union Health and Family Welfare Centres as a priority spending area. The Non-Development of Upazila Health Office includes budget for union level facilities under DGHS. Similarly budget for union level facilities under DGFP is included in the budget of Upazilla Family Planning Office. Union level facilities mostly provide maternal and child care that include nutrition services through counselling during Ante Natal Care, growth monitoring of child, etc. Upazila Health Complexes (UHC) provide maternal and child care along with other services. UHC in 53 Upazilas implement maternal health voucher scheme. According to NNS Operational Plan nutrition services are provided through Integrated Management of Childhood Illnesses (IMCI) corner and UHCs have IMCI corners.
• VGD Programme (5%) under the Ministry of Women and Children Affairs: According to MTBF the long-term objective of the VGD Programme is to improve socioeconomic conditions of the poverty prone and distressed rural women of Bangladesh, so that they can overcome food insecurity, malnutrition and financial crisis as well as the lack of social dignity.
• Primary education Stipend Project (4%) under the Ministry of Primary and Mass Education: According to the Key Informant Interviewees this programme was introduced replacing Food for Education. MTBF states that stipend is offered to students coming from poor families to increase school attendance and to help poor students to complete the primary education cycle. This is linked to keeping children in schools and improving nutrition outcomes.
Nutrition-sensitive programmes account for the vast majority of expenditures are often sector wide programmes and cover cross-cutting issues. Nutrition-specific programmes are smaller as they are more focused, and represent a smaller proportion of the budget. These are presented separately given their direct impact in the reduction of malnutrition. Table 8 presents the list of the 13 project/operational lines identified as nutrition-specific. Maternal, Neonatal, Child and Adolescent Health (MNCAH) project dominated the nutrition-specific actual expenditure in Bangladesh, accounting for 60% of the total nutrition-specific expenditures incurred. However, it was equivalent to only 1% of the total nutrition expenditure between 2014/15 to 2016/17 given the relative size of nutrition-specific versus nutrition-sensitive expenditure. The Karmajibi Lactating Mother Sohaita Tohbil project equalled 20% of the nutrition-specific actual expenditure, while the National Nutrition Services (NNS) constituted 8%. Table 9 provides the yearly breakdown.
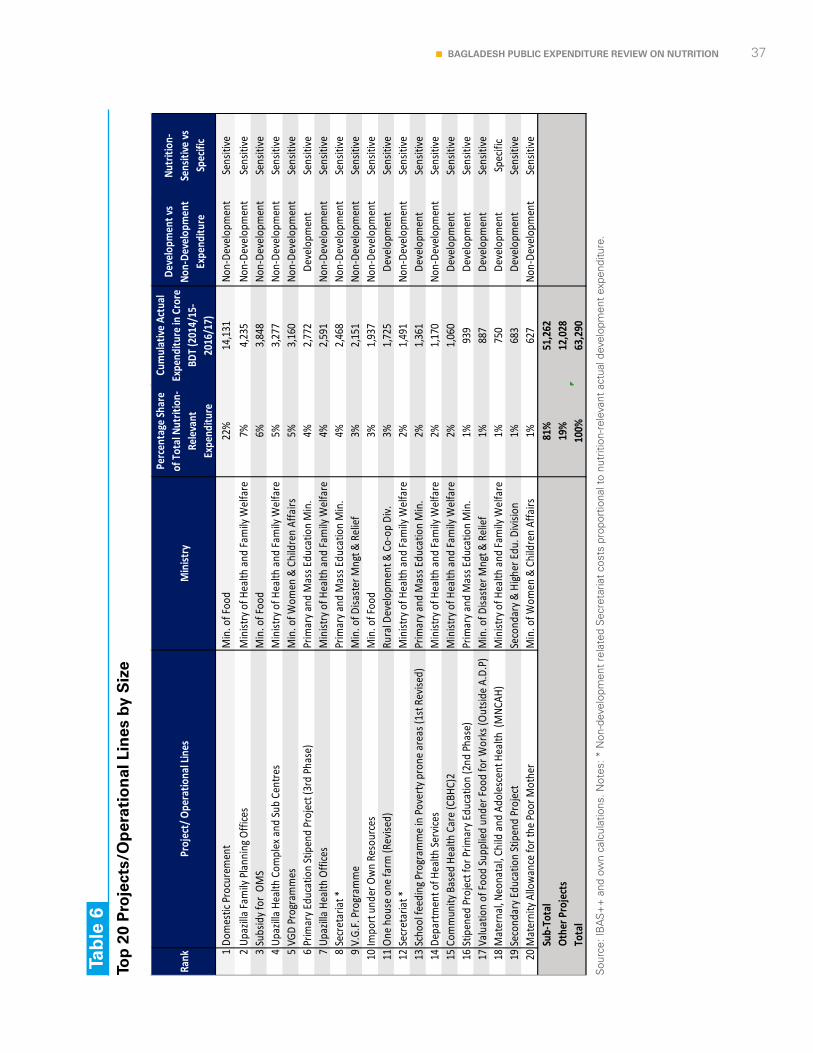
37BAGLADESH PUBLIC EXPENDITURE REVIEW ON NUTRITION
Rank
Proj
ect/
Ope
ratio
nal L
ines
Min
istry
Perc
enta
ge Sh
are
of T
otal
Nut
ritio
n-Re
leva
nt
Expe
nditu
re
Cum
ulat
ive A
ctua
l Ex
pend
iture
in C
rore
BD
T (2
014/
15-
2016
/17)
Deve
lopm
ent v
s No
n-De
velo
pmen
t Ex
pend
iture
Nutr
ition
-Se
nsiti
ve vs
Sp
ecifi
c
1Do
mes
tic P
rocu
rem
ent
Min
. of F
ood
22%
14,1
31No
n-De
velo
pmen
tSe
nsiti
ve2
Upaz
illa Fa
mily
Pla
nnin
g Offi
ces
Min
istry
of H
ealth
and
Fam
ily W
elfa
re7%
4,23
5No
n-De
velo
pmen
tSe
nsiti
ve3
Subs
idy f
or O
MS
Min
. of F
ood
6%3,
848
Non-
Deve
lopm
ent
Sens
itive
4Up
azilla
Hea
lth C
ompl
ex a
nd Su
b Ce
ntre
sM
inist
ry o
f Hea
lth a
nd Fa
mily
Wel
fare
5%3,
277
Non-
Deve
lopm
ent
Sens
itive
5VG
D Pr
ogra
mm
esM
in. o
f Wom
en &
Chi
ldre
n Af
fairs
5%
3,16
0No
n-De
velo
pmen
tSe
nsiti
ve6
Prim
ary E
duca
tion
Stip
end
Proj
ect (
3rd
Phas
e)Pr
imar
y and
Mas
s Edu
catio
n M
in.
4%2,
772
Deve
lopm
ent
Sens
itive
7Up
azilla
Hea
lth O
ffice
sM
inist
ry o
f Hea
lth a
nd Fa
mily
Wel
fare
4%2,
591
Non-
Deve
lopm
ent
Sens
itive
8Se
cret
aria
t *Pr
imar
y and
Mas
s Edu
catio
n M
in.
4%2,
468
Non-
Deve
lopm
ent
Sens
itive
9V.
G.F.
Pro
gram
me
Min
. of D
isast
er M
ngt &
Rel
ief
3%2,
151
Non-
Deve
lopm
ent
Sens
itive
10Im
port
unde
r Ow
n Re
sour
ces
Min
. of F
ood
3%1,
937
Non-
Deve
lopm
ent
Sens
itive
11On
e ho
use
one
farm
(Rev
ised)
Ru
ral D
evel
opm
ent &
Co-
op D
iv.3%
1,72
5De
velo
pmen
tSe
nsiti
ve12
Secr
etar
iat *
Min
istry
of H
ealth
and
Fam
ily W
elfa
re2%
1,49
1No
n-De
velo
pmen
tSe
nsiti
ve13
Scho
ol fe
edin
g Pro
gram
me
in P
over
ty p
rone
are
as (1
st R
evise
d)Pr
imar
y and
Mas
s Edu
catio
n M
in.
2%1,
361
Deve
lopm
ent
Sens
itive
14De
partm
ent o
f Hea
lth Se
rvice
sM
inist
ry o
f Hea
lth a
nd Fa
mily
Wel
fare
2%1,
170
Non-
Deve
lopm
ent
Sens
itive
15Co
mm
unity
Bas
ed H
ealth
Car
e (C
BHC)
2M
inist
ry o
f Hea
lth a
nd Fa
mily
Wel
fare
2%1,
060
Deve
lopm
ent
Sens
itive
16St
ipen
ed P
roje
ct fo
r Prim
ary E
duca
tion
(2nd
Pha
se)
Prim
ary a
nd M
ass E
duca
tion
Min
. 1%
939
Deve
lopm
ent
Sens
itive
17Va
luat
ion
of Fo
od Su
pplie
d un
der F
ood
for W
orks
(Out
side
A.D.
P)M
in. o
f Disa
ster
Mng
t & R
elie
f1%
887
Deve
lopm
ent
Sens
itive
18M
ater
nal, N
eona
tal, C
hild
and
Ado
lesc
ent H
ealth
(M
NCAH
) M
inist
ry o
f Hea
lth a
nd Fa
mily
Wel
fare
1%75
0De
velo
pmen
tSp
ecifi
c19
Seco
ndar
y Edu
catio
n St
ipen
d Pr
ojec
tSe
cond
ary &
High
er E
du. D
ivisio
n 1%
683
Deve
lopm
ent
Sens
itive
20M
ater
nity
Allo
wan
ce fo
r the
Poo
r Mot
her
Min
. of W
omen
& C
hild
ren
Affa
irs
1%62
7No
n-De
velo
pmen
tSe
nsiti
veSu
b-To
tal
81%
51,2
62Ot
her P
roje
cts
19%
12,0
28To
tal
100%
63,2
90
Sou
rce:
IBA
S+
+ a
nd o
wn
calc
ulat
ions
. Not
es: *
Non
-dev
elop
men
t re
late
d S
ecre
taria
t co
sts
prop
ortio
nal t
o nu
triti
on-r
elev
ant
actu
al d
evel
opm
ent
expe
nditu
re.
Tab
le 6
Top
20
Pro
ject
s/O
per
atio
nal
Lin
es b
y S
ize
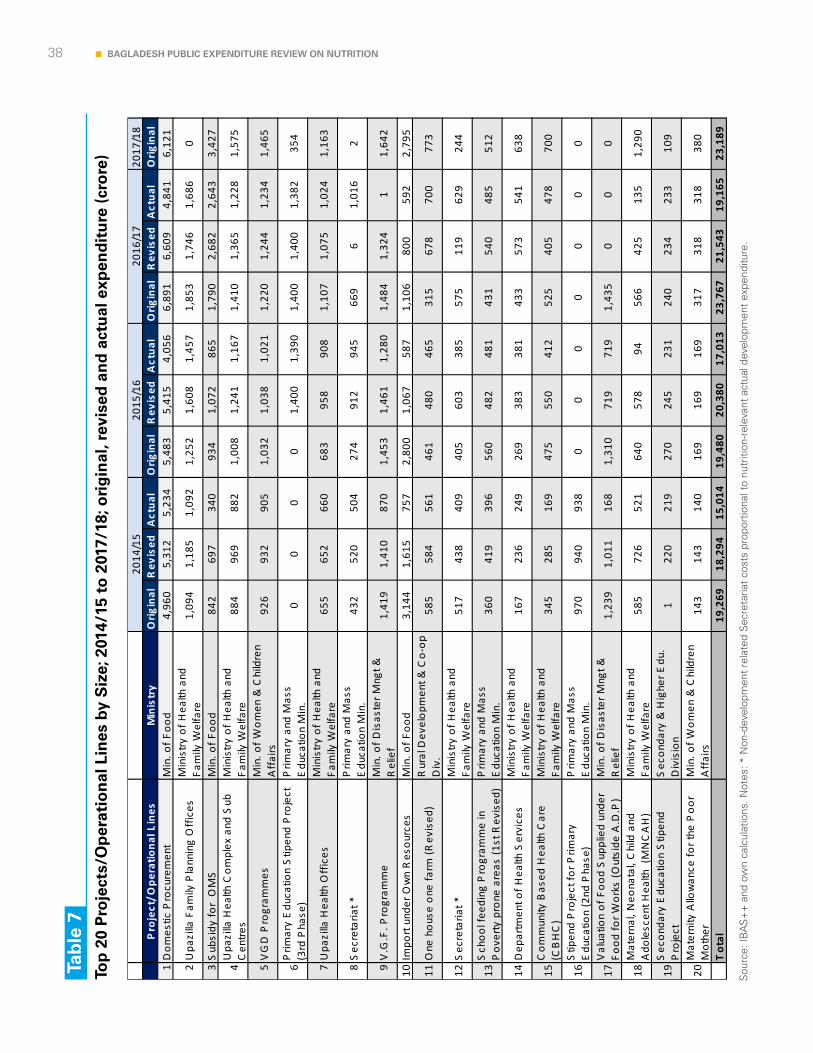
38 BAGLADESH PUBLIC EXPENDITURE REVIEW ON NUTRITION
Sou
rce:
IBA
S+
+ a
nd o
wn
calc
ulat
ions
. Not
es: *
Non
-dev
elop
men
t re
late
d S
ecre
taria
t co
sts
prop
ortio
nal t
o nu
triti
on-r
elev
ant
actu
al d
evel
opm
ent
expe
nditu
re.
2017
/18
Pro
ject
/ Ope
ratio
nal L
ines
Min
istr
yO
rigin
alR
evis
edA
ctua
lO
rigin
alR
evis
edA
ctua
lO
rigin
alR
evis
edA
ctua
lO
rigin
al1
Dom
estic
Pro
cure
men
tM
in. o
f Foo
d 4,
960
5,31
25,
234
5,48
35,
415
4,05
66,
891
6,60
94,
841
6,12
1
2U
pazi
lla F
amily
Pla
nnin
g O
ffic
esM
inis
try o
f Hea
lth a
nd
Fam
ily W
elfa
re1,
094
1,18
51,
092
1,25
21,
608
1,45
71,
853
1,74
61,
686
0
3S
ubsi
dy fo
r O
MS
Min
. of F
ood
842
697
340
934
1,07
286
51,
790
2,68
22,
643
3,42
7
4U
pazi
lla H
ealth
Com
plex
and
Sub
C
entre
sM
inis
try o
f Hea
lth a
nd
Fam
ily W
elfa
re88
496
988
21,
008
1,24
11,
167
1,41
01,
365
1,22
81,
575
5V
GD
Pro
gram
mes
Min
. of W
omen
& C
hild
ren
Aff
airs
92
693
290
51,
032
1,03
81,
021
1,22
01,
244
1,23
41,
465
6P
rimar
y E
duca
tion
Stip
end
Pro
ject
(3
rd P
hase
)P
rimar
y an
d M
ass
Edu
catio
n M
in.
00
00
1,40
01,
390
1,40
01,
400
1,38
235
4
7U
pazi
lla H
ealth
Off
ices
Min
istry
of H
ealth
and
Fa
mily
Wel
fare
655
652
660
683
958
908
1,10
71,
075
1,02
41,
163
8S
ecre
taria
t *P
rimar
y an
d M
ass
Edu
catio
n M
in.
432
520
504
274
912
945
669
61,
016
2
9V
.G.F
. Pro
gram
me
Min
. of D
isas
ter M
ngt &
R
elie
f1,
419
1,41
087
01,
453
1,46
11,
280
1,48
41,
324
11,
642
10Im
port
unde
r Ow
n R
esou
rces
Min
. of F
ood
3,14
41,
615
757
2,80
01,
067
587
1,10
680
059
22,
795
11O
ne h
ouse
one
farm
(Rev
ised
) R
ural
Dev
elop
men
t & C
o-op
D
iv.
585
584
561
461
480
465
315
678
700
773
12S
ecre
taria
t *M
inis
try o
f Hea
lth a
nd
Fam
ily W
elfa
re51
743
840
940
560
338
557
511
962
924
4
13S
choo
l fee
ding
Pro
gram
me
in
Pov
erty
pro
ne a
reas
(1st
Rev
ised
)P
rimar
y an
d M
ass
Edu
catio
n M
in.
360
419
396
560
482
481
431
540
485
512
14D
epar
tmen
t of H
ealth
Ser
vice
sM
inis
try o
f Hea
lth a
nd
Fam
ily W
elfa
re16
723
624
926
938
338
143
357
354
163
8
15C
omm
unity
Bas
ed H
ealth
Car
e (C
BH
C)
Min
istry
of H
ealth
and
Fa
mily
Wel
fare
345
285
169
475
550
412
525
405
478
700
16S
tipen
d P
roje
ct fo
r Prim
ary
Edu
catio
n (2
nd P
hase
)P
rimar
y an
d M
ass
Edu
catio
n M
in.
970
940
938
00
00
00
0
17V
alua
tion
of F
ood
Sup
plie
d un
der
Food
for W
orks
(Out
side
A.D
.P)
Min
. of D
isas
ter M
ngt &
R
elie
f1,
239
1,01
116
81,
310
719
719
1,43
50
00
18M
ater
nal,
Neo
nata
l, C
hild
and
A
dole
scen
t Hea
lth (
MN
CA
H)
Min
istry
of H
ealth
and
Fa
mily
Wel
fare
585
726
521
640
578
9456
642
513
51,
290
19S
econ
dary
Edu
catio
n S
tipen
d P
roje
ctS
econ
dary
& H
ighe
r Edu
. D
ivis
ion
122
021
927
024
523
124
023
423
310
9
20M
ater
nity
Allo
wan
ce fo
r the
Poo
r M
othe
rM
in. o
f Wom
en &
Chi
ldre
n A
ffai
rs
143
143
140
169
169
169
317
318
318
380
Tot
al19
,269
18,2
9415
,014
19,4
8020
,380
17,0
1323
,767
21,5
4319
,165
23,1
89
2014
/15
2015
/16
2016
/17
Tab
le 7
Top
20
Pro
ject
s/O
per
atio
nal
Lin
es b
y S
ize;
201
4/15
to
201
7/18
; ori
gin
al, r
evis
ed a
nd
act
ual
exp
end
itu
re (
cro
re)
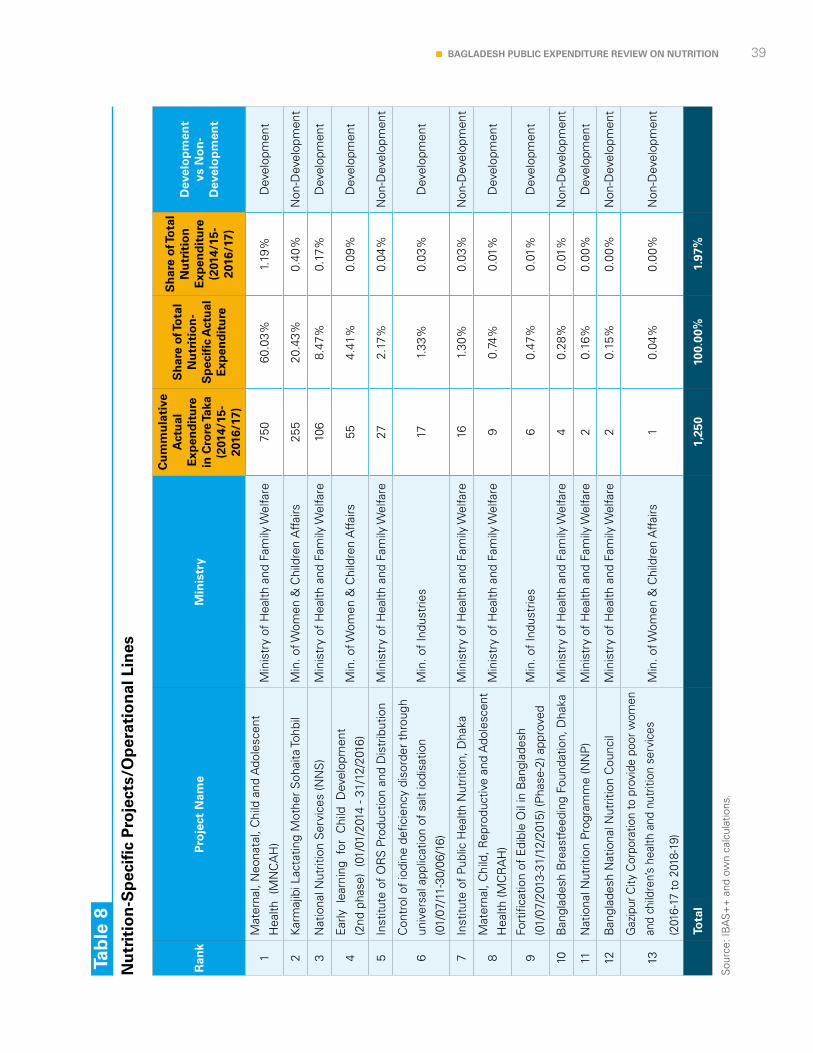
39BAGLADESH PUBLIC EXPENDITURE REVIEW ON NUTRITION
Sou
rce:
IBA
S+
+ a
nd o
wn
calc
ulat
ions
.
Ran
kP
roje
ct N
ame
Min
istr
y
Cu
mm
ula
tive
A
ctu
al
Exp
end
itu
re
in C
rore
Taka
(2
014/
15-
2016
/17)
Sh
are
of T
ota
l N
utr
itio
n-
Sp
ecif
ic A
ctu
al
Exp
end
itu
re
Sh
are
of T
ota
l N
utr
itio
n
Exp
end
itu
re
(201
4/15
-20
16/1
7)
Dev
elo
pm
ent
vs N
on
-D
evel
op
men
t
1M
ater
nal,
Neo
nata
l, C
hild
and
Ado
lesc
ent
Hea
lth (
MN
CA
H)
Min
istr
y of
Hea
lth a
nd F
amily
Wel
fare
750
60.0
3%1.
19%
Dev
elop
men
t
2K
arm
ajib
i Lac
tatin
g M
othe
r S
ohai
ta To
hbil
Min
. of W
omen
& C
hild
ren
Affa
irs
255
20.4
3%0.
40%
Non
-Dev
elop
men
t
3N
atio
nal N
utrit
ion
Ser
vice
s (N
NS
)M
inis
try
of H
ealth
and
Fam
ily W
elfa
re10
68.
47%
0.17
%D
evel
opm
ent
4E
arly
lea
rnin
g fo
r C
hild
Dev
elop
men
t
(2nd
pha
se)
(01/
01/2
014
- 31/
12/2
016)
Min
. of W
omen
& C
hild
ren
Affa
irs
554.
41%
0.09
%D
evel
opm
ent
5In
stitu
te o
f O
RS
Pro
duct
ion
and
Dis
trib
utio
nM
inis
try
of H
ealth
and
Fam
ily W
elfa
re27
2.17
%0.
04%
Non
-Dev
elop
men
t
6
Con
trol
of
iodi
ne d
efic
ienc
y di
sord
er t
hrou
gh
univ
ersa
l app
licat
ion
of s
alt
iodi
satio
n
(01/
07/1
1-30
/06/
16)
Min
. of
Indu
strie
s 17
1.33
%0.
03%
Dev
elop
men
t
7In
stitu
te o
f Pu
blic
Hea
lth N
utrit
ion,
Dha
kaM
inis
try
of H
ealth
and
Fam
ily W
elfa
re16
1.30
%0.
03%
Non
-Dev
elop
men
t
8M
ater
nal,
Chi
ld, R
epro
duct
ive
and
Ado
lesc
ent
Hea
lth (M
CR
AH
)M
inis
try
of H
ealth
and
Fam
ily W
elfa
re9
0.74
%0.
01%
Dev
elop
men
t
9Fo
rtifi
catio
n of
Edi
ble
Oil
in B
angl
ades
h
(01/
07/2
013-
31/1
2/20
15) (
Pha
se-2
) app
rove
dM
in. o
f In
dust
ries
60.
47%
0.01
%D
evel
opm
ent
10B
angl
ades
h B
reas
tfee
ding
Fou
ndat
ion,
Dha
kaM
inis
try
of H
ealth
and
Fam
ily W
elfa
re4
0.28
%0.
01%
Non
-Dev
elop
men
t
11N
atio
nal N
utrit
ion
Prog
ram
me
(NN
P)
Min
istr
y of
Hea
lth a
nd F
amily
Wel
fare
20.
16%
0.00
%D
evel
opm
ent
12B
angl
ades
h N
atio
nal N
utrit
ion
Cou
ncil
Min
istr
y of
Hea
lth a
nd F
amily
Wel
fare
20.
15%
0.00
%N
on-D
evel
opm
ent
13
Gaz
ipur
City
Cor
pora
tion
to p
rovi
de p
oor w
omen
and
child
ren’
s he
alth
and
nut
ritio
n se
rvic
es
(201
6-17
to 2
018-
19)
Min
. of W
omen
& C
hild
ren
Affa
irs
10.
04%
0.00
%N
on-D
evel
opm
ent
To
tal
1,
250
100.
00%
1.97
%
Tab
le 8
Nu
trit
ion
-Sp
ecifi
c P
roje
cts/
Op
erat
ion
al L
ines
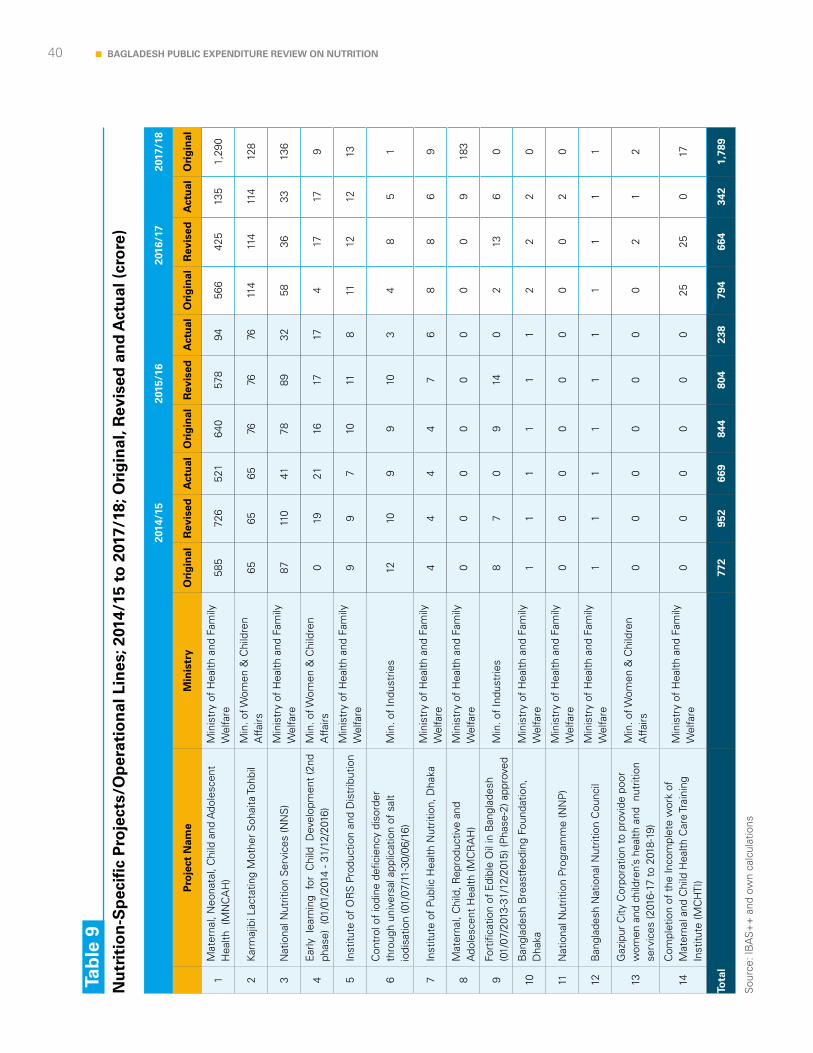
40 BAGLADESH PUBLIC EXPENDITURE REVIEW ON NUTRITION
Sou
rce:
IBA
S+
+ a
nd o
wn
calc
ulat
ions
20
14/1
520
15/1
620
16/1
720
17/1
8
P
roje
ct N
ame
Min
istr
yO
rig
inal
Rev
ised
Act
ual
Ori
gin
alR
evis
edA
ctu
alO
rig
inal
Rev
ised
Act
ual
Ori
gin
al
1M
ater
nal,
Neo
nata
l, C
hild
and
Ado
lesc
ent
Hea
lth (
MN
CA
H)
Min
istr
y of
Hea
lth a
nd F
amily
W
elfa
re58
572
652
164
057
894
566
425
135
1,29
0
2K
arm
ajib
i Lac
tatin
g M
othe
r S
ohai
ta To
hbil
Min
. of W
omen
& C
hild
ren
Affa
irs
6565
6576
7676
114
114
114
128
3N
atio
nal N
utrit
ion
Ser
vice
s (N
NS
)M
inis
try
of H
ealth
and
Fam
ily
Wel
fare
8711
041
7889
3258
3633
136
4E
arly
lea
rnin
g fo
r C
hild
Dev
elop
men
t (2
nd
phas
e) (
01/0
1/20
14 -
31/1
2/20
16)
Min
. of W
omen
& C
hild
ren
Affa
irs
019
2116
1717
417
179
5In
stitu
te o
f O
RS
Pro
duct
ion
and
Dis
trib
utio
nM
inis
try
of H
ealth
and
Fam
ily
Wel
fare
99
710
118
1112
1213
6C
ontr
ol o
f io
dine
def
icie
ncy
diso
rder
th
roug
h un
iver
sal a
pplic
atio
n of
sal
t io
disa
tion
(01/
07/1
1-30
/06/
16)
Min
. of
Indu
strie
s 12
109
910
34
85
1
7In
stitu
te o
f Pu
blic
Hea
lth N
utrit
ion,
Dha
kaM
inis
try
of H
ealth
and
Fam
ily
Wel
fare
44
44
76
88
69
8M
ater
nal,
Chi
ld, R
epro
duct
ive
and
Ado
lesc
ent
Hea
lth (M
CR
AH
)M
inis
try
of H
ealth
and
Fam
ily
Wel
fare
00
00
00
00
918
3
9Fo
rtifi
catio
n of
Edi
ble
Oil
in B
angl
ades
h (0
1/07
/201
3-31
/12/
2015
) (P
hase
-2) a
ppro
ved
Min
. of
Indu
strie
s 8
70
914
02
136
0
10B
angl
ades
h B
reas
tfee
ding
Fou
ndat
ion,
D
haka
Min
istr
y of
Hea
lth a
nd F
amily
W
elfa
re1
11
11
12
22
0
11N
atio
nal N
utrit
ion
Prog
ram
me
(NN
P)
Min
istr
y of
Hea
lth a
nd F
amily
W
elfa
re0
00
00
00
02
0
12B
angl
ades
h N
atio
nal N
utrit
ion
Cou
ncil
Min
istr
y of
Hea
lth a
nd F
amily
W
elfa
re1
11
11
11
11
1
13G
azip
ur C
ity C
orpo
ratio
n to
pro
vide
poo
r w
omen
and
chi
ldre
n’s
heal
th a
nd n
utrit
ion
serv
ices
(201
6-17
to
2018
-19)
Min
. of W
omen
& C
hild
ren
Affa
irs
00
00
00
02
12
14C
ompl
etio
n of
the
Inco
mpl
ete
wor
k of
M
ater
nal a
nd C
hild
Hea
lth C
are
Trai
ning
In
stitu
te (M
CH
TI)
Min
istr
y of
Hea
lth a
nd F
amily
W
elfa
re0
00
00
025
250
17
Tota
l
772
952
669
844
804
238
794
664
342
1,78
9
Tab
le 9
Nu
trit
ion
-Sp
ecifi
c P
roje
cts/
Op
erat
ion
al L
ines
; 201
4/15
to
201
7/18
; Ori
gin
al, R
evis
ed a
nd
Act
ual
(cr
ore
)
41BAGLADESH PUBLIC EXPENDITURE REVIEW ON NUTRITION
4.2 Analysis of selected ministries
This section presents the analysis of the largest spenders on nutrition project/operational lines as shows in Table 4 above based on their priorities as presented in the MTBF and the projects/operational lines found in their budgets. These are: Ministry of Food, Health Service Division, Ministry of Primary and Mass Education and the Ministry of Women and Children Affairs.
4.2.1 Ministry of FoodFood access and availability are one of the most important long-term factors that could prevent undernutrition (Ahmed et al, 2015). One of the specific objectives of the National Nutrition Policy 2015 guiding NPAN2 is “ensuring availability of adequate, diversified and quality safe food and promote healthy feeding practices”, which to a large extent falls under the responsibility of the Ministry of Food.
As per its MTBF, the Ministry of Food aims at ensuring sufficient and safe food for all citizens of the country through integrated policy, strategy and management of food. Its main functions include Bangladesh’s overall food management, planning, operation, and co-ordination; export, import and internal procurement of food grains (rice and wheat), its distribution and movement around the country, as well as maintaining sufficient food stock and grains and testing its quality. Its medium term strategic objectives include ensuring availability of food to the poor (especially to the women and children) and ensuring availability of safe food and improved nutrition. In line with this, its priority spending areas are the domestic procurement of rice and wheat, the import of food-grain through own resources and aid supported imports and the distribution of food grains at fair prices for the poor people.
Based on this, this PER-N argues that the alignment between the ministry’s objectives and those in NPAN2 should be strengthened. The MTBF talks about ensuring sufficient and safe food and testing quality. It however does not mention diversification. Food grains include rice and wheat only but this is not sufficient to ensure the diversified diet as prioritised in NPAN2.
The Ministry of Food represents about 3.7% of total GoB budget and around 0.5% of GDP. Table 10 shows how the identified projects/operational lines contributing to nutrition represent around 34% of total expenditure on nutrition found in the three years under review. Most of it is in the non-development side of the budget and is dedicated to the procurement of rice and wheat as well as import and distribution of food. It can all be classified as nutrition-sensitive.
These interventions would fall under the second thematic area of NPAN2, namely “agriculture and diet diversification and locally adapted recipes”. This thematic area includes food fortification, food processing and storage and food security, safety and quality. This does not mean, however, that they reflect the actions as anticipated in NPAN2.
Table 11 presents the breakdown by economic classification, namely pay, recurrent non-pay and capital. In the Ministry of Food, nutrition expenditures on pay represent less than 1% of the total and most of it is on recurrent non-pay and on capital expenditure.
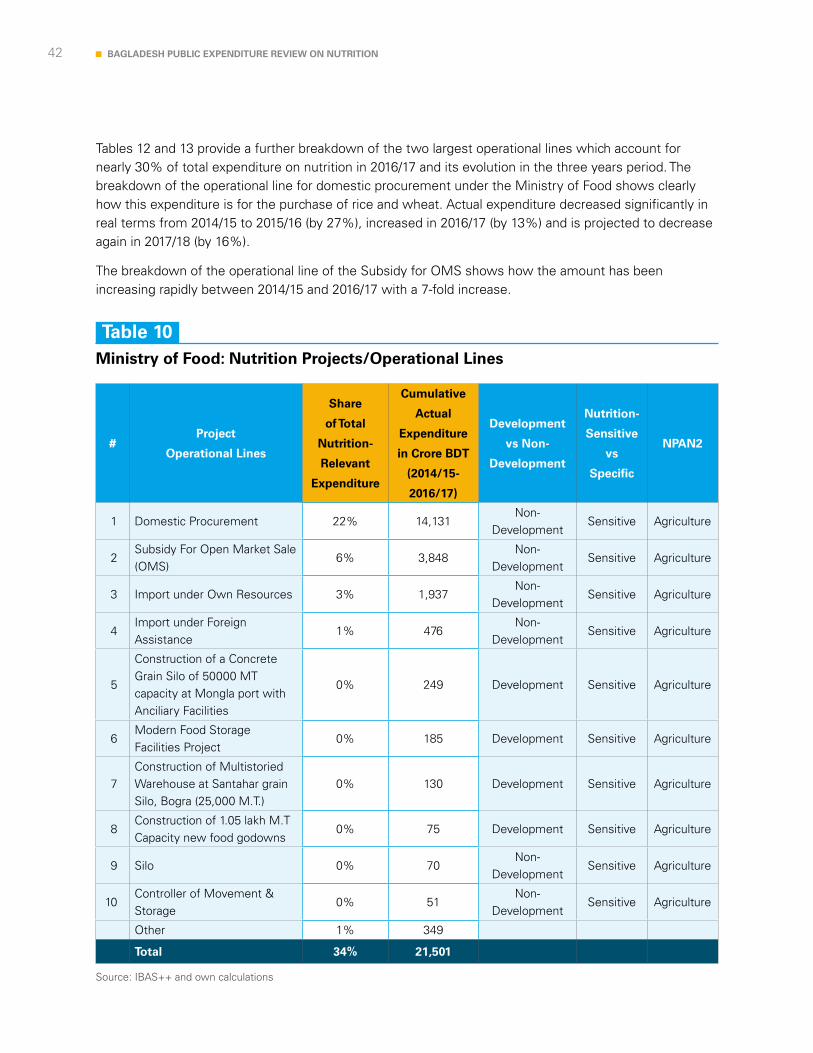
42 BAGLADESH PUBLIC EXPENDITURE REVIEW ON NUTRITION
Tables 12 and 13 provide a further breakdown of the two largest operational lines which account for nearly 30% of total expenditure on nutrition in 2016/17 and its evolution in the three years period. The breakdown of the operational line for domestic procurement under the Ministry of Food shows clearly how this expenditure is for the purchase of rice and wheat. Actual expenditure decreased significantly in real terms from 2014/15 to 2015/16 (by 27%), increased in 2016/17 (by 13%) and is projected to decrease again in 2017/18 (by 16%). The breakdown of the operational line of the Subsidy for OMS shows how the amount has been increasing rapidly between 2014/15 and 2016/17 with a 7-fold increase.
Source: IBAS++ and own calculations
#Project
Operational Lines
Share
of Total
Nutrition-
Relevant
Expenditure
Cumulative
Actual
Expenditure
in Crore BDT
(2014/15-
2016/17)
Development
vs Non-
Development
Nutrition-
Sensitive
vs
Specific
NPAN2
1 Domestic Procurement 22% 14,131Non-
DevelopmentSensitive Agriculture
2Subsidy For Open Market Sale (OMS)
6% 3,848Non-
DevelopmentSensitive Agriculture
3 Import under Own Resources 3% 1,937Non-
DevelopmentSensitive Agriculture
4Import under Foreign Assistance
1% 476Non-
DevelopmentSensitive Agriculture
5
Construction of a Concrete Grain Silo of 50000 MT capacity at Mongla port with Anciliary Facilities
0% 249 Development Sensitive Agriculture
6Modern Food Storage Facilities Project
0% 185 Development Sensitive Agriculture
7Construction of Multistoried Warehouse at Santahar grain Silo, Bogra (25,000 M.T.)
0% 130 Development Sensitive Agriculture
8Construction of 1.05 lakh M.T Capacity new food godowns
0% 75 Development Sensitive Agriculture
9 Silo 0% 70Non-
DevelopmentSensitive Agriculture
10Controller of Movement & Storage
0% 51Non-
DevelopmentSensitive Agriculture
Other 1% 349
Total 34% 21,501
Table 10Ministry of Food: Nutrition Projects/Operational Lines
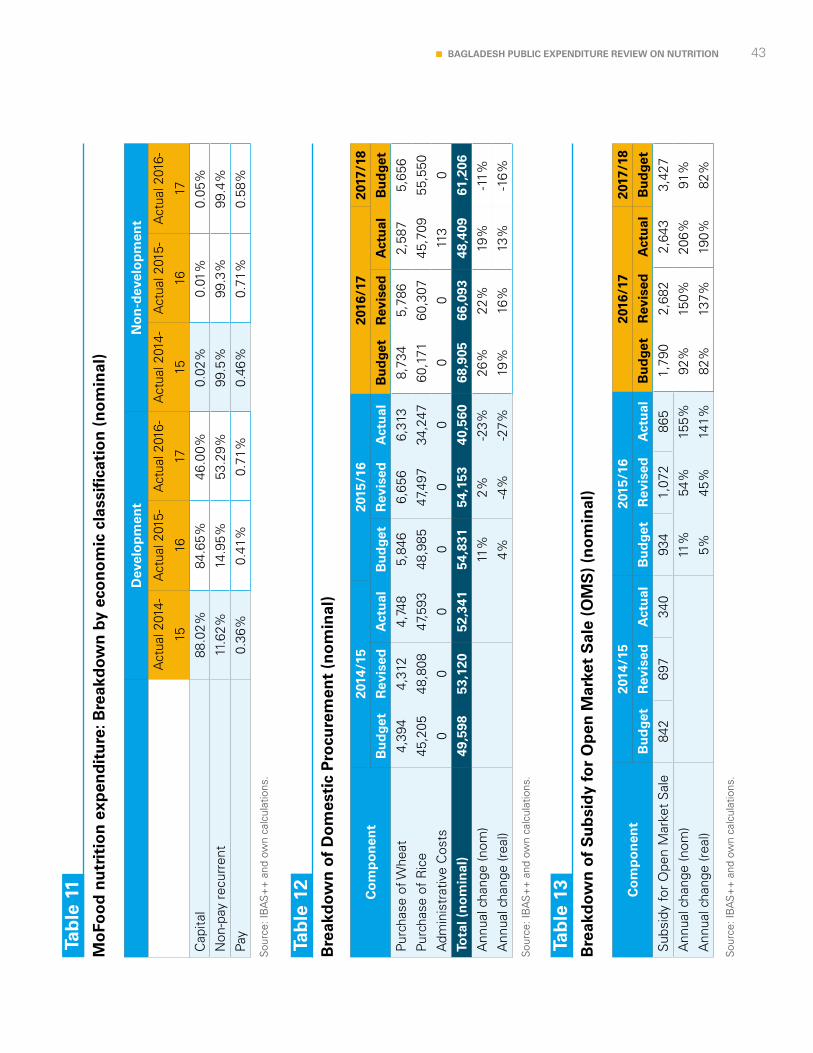
43BAGLADESH PUBLIC EXPENDITURE REVIEW ON NUTRITION
Sou
rce:
IBA
S+
+ a
nd o
wn
calc
ulat
ions
.
Dev
elo
pm
ent
No
n-d
evel
op
men
t
Act
ual 2
014-
15
Act
ual 2
015-
16
Act
ual 2
016-
17
Act
ual 2
014-
15
Act
ual 2
015-
16
Act
ual 2
016-
17
Cap
ital
88.0
2%84
.65%
46.0
0%0.
02%
0.01
%0.
05%
Non
-pay
rec
urre
nt11
.62%
14.9
5%53
.29%
99.5
%99
.3%
99.4
%
Pay
0.36
%0.
41%
0.71
%0.
46%
0.71
%0.
58%
Tab
le 1
1M
oFo
od
nu
trit
ion
exp
end
itu
re: B
reak
dow
n b
y ec
on
om
ic c
lass
ifica
tio
n (
no
min
al)
Sou
rce:
IBA
S+
+ a
nd o
wn
calc
ulat
ions
.
Co
mp
on
ent
2014
/15
2015
/16
2016
/17
2017
/18
Bu
dge
tR
evis
edA
ctu
alB
ud
get
Rev
ised
Act
ual
Bu
dge
tR
evis
edA
ctu
alB
ud
get
Purc
hase
of W
heat
4,39
44,
312
4,74
85,
846
6,65
66,
313
8,73
45,
786
2,58
75,
656
Purc
hase
of
Ric
e 45
,205
48,8
0847
,593
48,9
8547
,497
34,2
4760
,171
60,3
0745
,709
55,5
50
Adm
inis
trat
ive
Cos
ts0
00
00
00
011
30
Tota
l (n
om
inal
)49
,598
53,1
2052
,341
54,8
3154
,153
40,5
6068
,905
66,0
9348
,409
61,2
06
Ann
ual c
hang
e (n
om)
11%
2%-2
3%26
%22
%19
%-1
1%
Ann
ual c
hang
e (r
eal)
4%
-4%
-27%
19%
16%
13%
-16%
Tab
le 1
2B
reak
dow
n o
f D
om
esti
c P
rocu
rem
ent
(no
min
al)
Sou
rce:
IBA
S+
+ a
nd o
wn
calc
ulat
ions
.
Co
mp
on
ent
2014
/15
2015
/16
2016
/17
2017
/18
Bu
dge
tR
evis
edA
ctu
alB
ud
get
Rev
ised
Act
ual
Bu
dge
tR
evis
edA
ctu
alB
ud
get
Sub
sidy
for
Ope
n M
arke
t S
ale
842
697
340
934
1,07
286
51,
790
2,68
22,
643
3,42
7
Ann
ual c
hang
e (n
om)
11%
54%
155%
92%
150%
206%
91%
Ann
ual c
hang
e (r
eal)
5%
45%
141%
82%
137%
190%
82%
Tab
le 1
3B
reak
dow
n o
f S
ub
sid
y fo
r O
pen
Mar
ket
Sal
e (O
MS
) (n
om
inal
)
44 BAGLADESH PUBLIC EXPENDITURE REVIEW ON NUTRITION
4.2.2 Ministry of Health and Family Welfare
As reflected in NPAN2, one of the objectives of the National Nutrition Policy 2015 specifically aims to improve the nutritional status of all citizens, including children, adolescent girls, pregnant women and lactating mothers. This, to a large extent, falls under the Ministry of Health and Family Welfare, split in two divisions since 2017/18: The Health Services Division and the Medical Education and Family Welfare Division. The Ministry aims to ensure affordable and quality health care services for all by improving the health, population and nutrition sectors and building a healthy, strong and effective workforce. Within its major functions, it includes providing health and nutrition services and expansion of these services; ensuring medical facilities, public health and prevention and cure of different communicable and non-communicable diseases; implementation of programmes of child health care and maternal care, Expanded Programme of Immunisation (EPI) and nutrition improvement activities; and control of communicable and non-communicable and newly emerging diseases. Aligned with this, its medium-term objectives include ensuring improved health care for mother and child (including distribution of Vitamin-A and encouraging breast feeding); upgrading quality health services for all (including conducting community clinic based primary health, nutrition and population programme for rural population; inclusion of health education in school curriculum; and mass awareness and information campaigns); and increasing food safety with nutritional standards. The latter includes the implementation of the community nutrition programme; expansion of activity providing supplementary foods to pregnant women, nursing mothers and children; formulation and implementation of a strategy to ensure food safety and to determine food standards; and conducting nutrition awareness programmes with help of the mass media and NGOs. Furthermore, it aims to develop efficient human resources in the health, population and nutrition sector. Within its priority spending areas/programmes, it has the provision of health, nutrition and family planning services to rural poor through community clinics and Union Health and Family Welfare Centres. The Ministry of Health and Family Welfare represents about 5.8% of total GoB budget and around 0.8% of GDP. Table 14 shows how the identified projects/operational lines contributing to nutrition represent around 26% of total expenditure on nutrition found in the 2016/17. These are mainly related to health services in general and maternal and child health specifically. Most of it is in the non-development side of the budget. The largest lines, i.e., Upazilla Family Offices, Upazilla Health Complex and Sub-Centers and Upazilla Health Offices have been explained above.
These interventions would fall under the first thematic area of NPAN2, namely “nutrition for all lifecycle approach”. This thematic area includes Infant and Young Child Feeding (IYCF) Practices, micronutrients malnutrition, maternal nutrition and reducing low birth weight, management of acute malnutrition, adolescent nutrition, nutrition for the elderly population, prevention and control of obesity and non-communicable diseases, and urban nutrition. Table 15 provides a further breakdown of the largest operational line, the Upazilla Health Family Planning Office, which alone accounts for 7% of total expenditure on nutrition in 2016/17 and its evolution in the three years period. It shows how around 92% of it is for pay and allowances, and 3% is for contraceptives. Actual expenditure has increased by 26% and 10% in real terms in 2015/16 and 2016/17 respectively.

45BAGLADESH PUBLIC EXPENDITURE REVIEW ON NUTRITION
# Project/ Operational Lines
Share
of Total
Nutrition-
Relevant
Expenditure
Cumulative
Actual in
Crore BDT
(2014/15-
2016/17)
Development
vs Non-
Development
Nutrition-
Sensitive
vs
Specific
NPAN2
1Upazilla Family Planning
Offices6.69% 4,235
Non-
DevelopmentSensitive Nutrition
2Upazilla Health Complex
and Sub Centres5.18% 3,277
Non-
DevelopmentSensitive Nutrition
3 Upazilla Health Offices 4.09% 2,591Non-
DevelopmentSensitive Nutrition
4 Secretariat 2.36% 1,491Non-
DevelopmentSensitive Nutrition
5Department of Health
Services1.85% 1,170
Non-
DevelopmentSensitive Nutrition
6Community Based Health
Care (CBHC) (2)1.67% 1,060 Development Sensitive Nutrition
7
Maternal, Neonatal, Child
and Adolescent Health
(MNCAH)
1.19% 750 Development Specific Nutrition
8*Family Planning Field
Services Delivery (FPFSD)0.49% 310 Development Sensitive Nutrition
9
Clinical Contraception
Services Delivery
Programme (CCSDP)
0.47% 299 Development Sensitive Nutrition
10
Revitalization of Community
Health Care Initiative in
Bangladesh (01/07/2009 -
30/06/2015) approved
0.41% 258 Development Sensitive Nutrition
Other 1.74% 1,098
Total 26.13% 16,540
Source: IBAS++ and own calculations. Notes: Those mark with MEFWD fall under the Medical Education and Family Welfare Division since 2017/2018.
Table 14Ministry of Health and Family Welfare
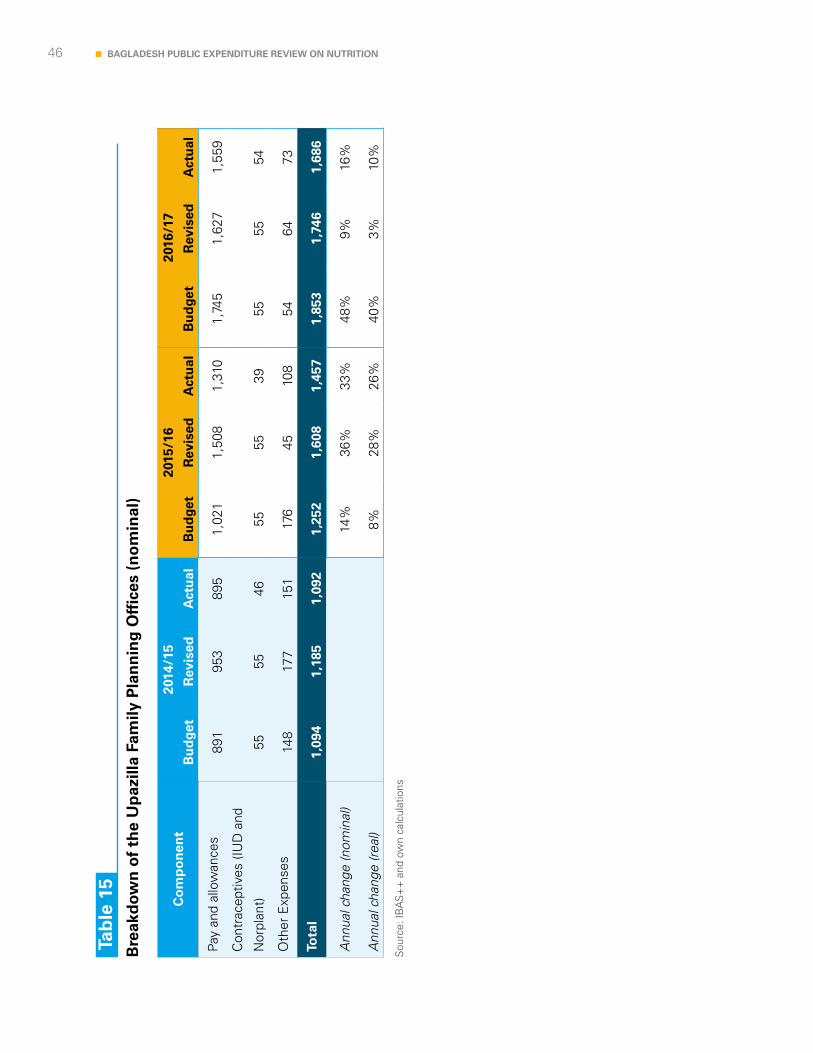
46 BAGLADESH PUBLIC EXPENDITURE REVIEW ON NUTRITION
Co
mp
on
ent
2014
/15
2015
/16
2016
/17
Bu
dge
tR
evis
edA
ctu
alB
ud
get
Rev
ised
Act
ual
Bu
dge
tR
evis
edA
ctu
al
Pay
and
allo
wan
ces
891
953
895
1,02
11,
508
1,31
01,
745
1,62
71,
559
Con
trac
eptiv
es (I
UD
and
Nor
plan
t)55
5546
5555
3955
5554
Oth
er E
xpen
ses
148
177
151
176
4510
854
6473
Tota
l1,
094
1,18
51,
092
1,25
21,
608
1,45
71,
853
1,74
61,
686
Ann
ual c
hang
e (n
omin
al)
14%
36%
33%
48%
9%16
%
Ann
ual c
hang
e (r
eal)
8%
28%
26%
40%
3%10
%
Sou
rce:
IBA
S+
+ a
nd o
wn
calc
ulat
ions
Tab
le 1
5B
reak
dow
n o
f th
e U
paz
illa
Fam
ily P
lan
nin
g O
ffice
s (n
om
inal
)
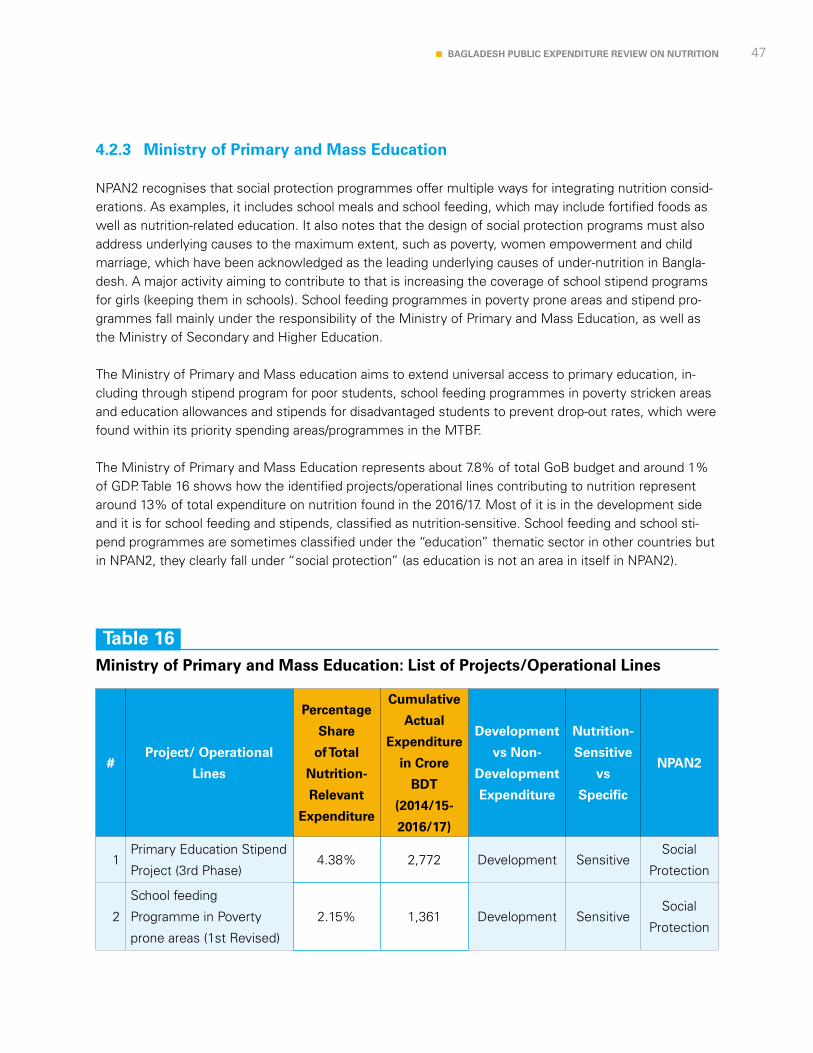
47BAGLADESH PUBLIC EXPENDITURE REVIEW ON NUTRITION
4.2.3 Ministry of Primary and Mass Education
NPAN2 recognises that social protection programmes offer multiple ways for integrating nutrition consid-erations. As examples, it includes school meals and school feeding, which may include fortified foods as well as nutrition-related education. It also notes that the design of social protection programs must also address underlying causes to the maximum extent, such as poverty, women empowerment and child marriage, which have been acknowledged as the leading underlying causes of under-nutrition in Bangla-desh. A major activity aiming to contribute to that is increasing the coverage of school stipend programs for girls (keeping them in schools). School feeding programmes in poverty prone areas and stipend pro-grammes fall mainly under the responsibility of the Ministry of Primary and Mass Education, as well as the Ministry of Secondary and Higher Education.
The Ministry of Primary and Mass education aims to extend universal access to primary education, in-cluding through stipend program for poor students, school feeding programmes in poverty stricken areas and education allowances and stipends for disadvantaged students to prevent drop-out rates, which were found within its priority spending areas/programmes in the MTBF.
The Ministry of Primary and Mass Education represents about 7.8% of total GoB budget and around 1% of GDP. Table 16 shows how the identified projects/operational lines contributing to nutrition represent around 13% of total expenditure on nutrition found in the 2016/17. Most of it is in the development side and it is for school feeding and stipends, classified as nutrition-sensitive. School feeding and school sti-pend programmes are sometimes classified under the “education” thematic sector in other countries but in NPAN2, they clearly fall under “social protection” (as education is not an area in itself in NPAN2).
#Project/ Operational
Lines
Percentage
Share
of Total
Nutrition-
Relevant
Expenditure
Cumulative
Actual
Expenditure
in Crore
BDT
(2014/15-
2016/17)
Development
vs Non-
Development
Expenditure
Nutrition-
Sensitive
vs
Specific
NPAN2
1Primary Education Stipend
Project (3rd Phase)4.38% 2,772 Development Sensitive
Social
Protection
2
School feeding
Programme in Poverty
prone areas (1st Revised)
2.15% 1,361 Development SensitiveSocial
Protection
Table 16Ministry of Primary and Mass Education: List of Projects/Operational Lines
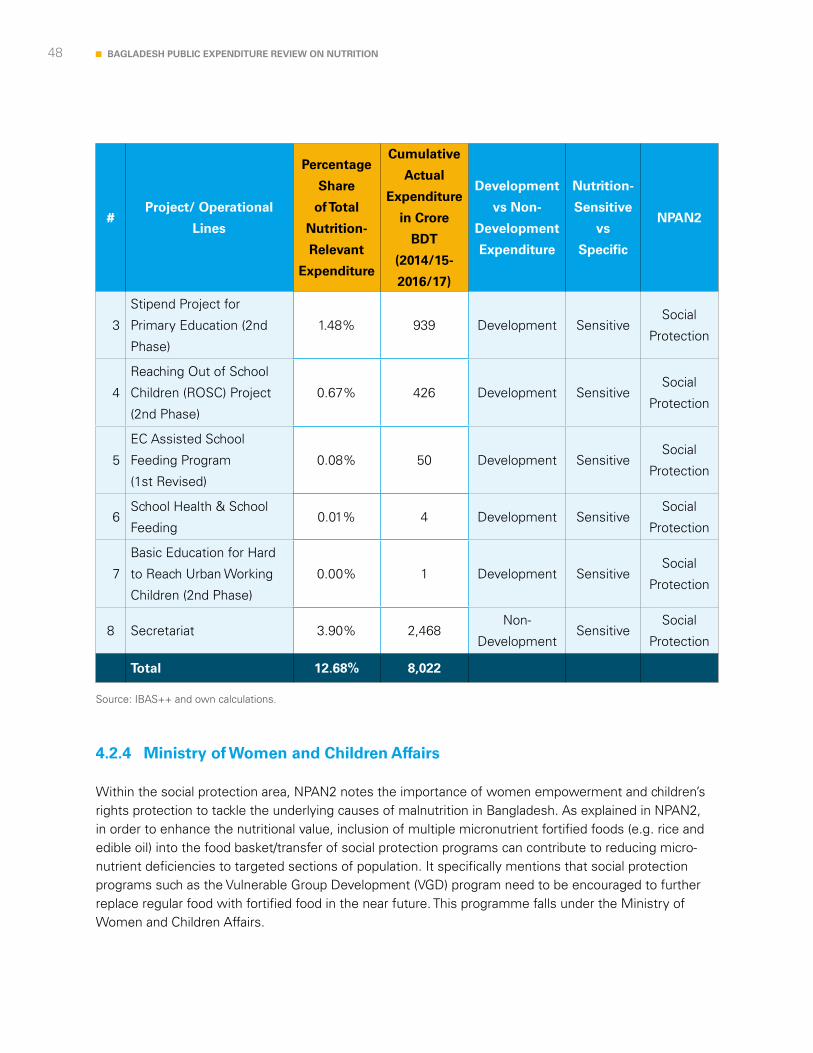
48 BAGLADESH PUBLIC EXPENDITURE REVIEW ON NUTRITION
Source: IBAS++ and own calculations.
4.2.4 Ministry of Women and Children Affairs
Within the social protection area, NPAN2 notes the importance of women empowerment and children’s rights protection to tackle the underlying causes of malnutrition in Bangladesh. As explained in NPAN2, in order to enhance the nutritional value, inclusion of multiple micronutrient fortified foods (e.g. rice and edible oil) into the food basket/transfer of social protection programs can contribute to reducing micro-nutrient deficiencies to targeted sections of population. It specifically mentions that social protection programs such as the Vulnerable Group Development (VGD) program need to be encouraged to further replace regular food with fortified food in the near future. This programme falls under the Ministry of Women and Children Affairs.
#Project/ Operational
Lines
Percentage
Share
of Total
Nutrition-
Relevant
Expenditure
Cumulative
Actual
Expenditure
in Crore
BDT
(2014/15-
2016/17)
Development
vs Non-
Development
Expenditure
Nutrition-
Sensitive
vs
Specific
NPAN2
3
Stipend Project for
Primary Education (2nd
Phase)
1.48% 939 Development SensitiveSocial
Protection
4
Reaching Out of School
Children (ROSC) Project
(2nd Phase)
0.67% 426 Development SensitiveSocial
Protection
5
EC Assisted School
Feeding Program
(1st Revised)
0.08% 50 Development SensitiveSocial
Protection
6School Health & School
Feeding0.01% 4 Development Sensitive
Social
Protection
7
Basic Education for Hard
to Reach Urban Working
Children (2nd Phase)
0.00% 1 Development SensitiveSocial
Protection
8 Secretariat 3.90% 2,468Non-
DevelopmentSensitive
Social
Protection
Total 12.68% 8,022
49BAGLADESH PUBLIC EXPENDITURE REVIEW ON NUTRITION
The MTBF has as part of its major functions women and children welfare and development as well as empowerment of women with creation of employment opportunities. Within its priority spending areas, in addition to the VGD programme, it also includes the working lactating mother assistance fund and maternity allowance programme for poor mothers, i.e. pregnant women.
The Ministry of Women and Children Affairs is a relatively small one, representing only 0.8% of GOB budget and 0.1% of GDP. However, almost all of its operational/project lines have been identified as nu-trition-sensitive, accounting for as much as 83% of the total expenditure of the ministry. All of its project/operational lines account for 7.5% of nutrition expenditure in Bangladesh, most of it dedicated to the VGD Programme (see Table 17).
Table 18 shows the breakdown of the Programme and the trends over the years. It shows that training expenses and travel related costs are only a small proportion of the total programme costs and most of it is for VGD. The Programme has been allocated a budget for 2017/18 which represents around a 14% increase in real terms.
© U
NIC
EF/
UN
I146
716/
Kir
on
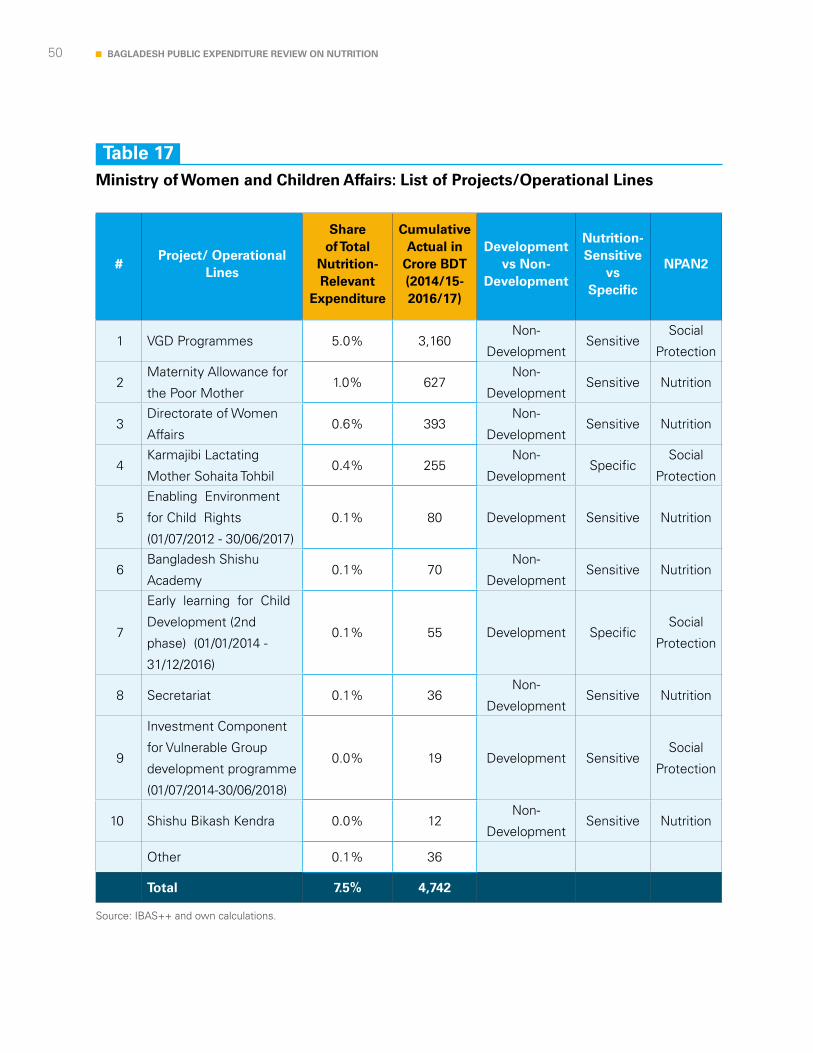
50 BAGLADESH PUBLIC EXPENDITURE REVIEW ON NUTRITION
Source: IBAS++ and own calculations.
#Project/ Operational
Lines
Share of Total
Nutrition-Relevant
Expenditure
Cumulative Actual in
Crore BDT (2014/15-2016/17)
Development vs Non-
Development
Nutrition-Sensitive
vs Specific
NPAN2
1 VGD Programmes 5.0% 3,160Non-
DevelopmentSensitive
Social
Protection
2Maternity Allowance for
the Poor Mother1.0% 627
Non-
DevelopmentSensitive Nutrition
3Directorate of Women
Affairs0.6% 393
Non-
DevelopmentSensitive Nutrition
4Karmajibi Lactating
Mother Sohaita Tohbil0.4% 255
Non-
DevelopmentSpecific
Social
Protection
5
Enabling Environment
for Child Rights
(01/07/2012 - 30/06/2017)
0.1% 80 Development Sensitive Nutrition
6Bangladesh Shishu
Academy0.1% 70
Non-
DevelopmentSensitive Nutrition
7
Early learning for Child
Development (2nd
phase) (01/01/2014 -
31/12/2016)
0.1% 55 Development SpecificSocial
Protection
8 Secretariat 0.1% 36Non-
DevelopmentSensitive Nutrition
9
Investment Component
for Vulnerable Group
development programme
(01/07/2014-30/06/2018)
0.0% 19 Development SensitiveSocial
Protection
10 Shishu Bikash Kendra 0.0% 12Non-
DevelopmentSensitive Nutrition
Other 0.1% 36
Total 7.5% 4,742
Table 17Ministry of Women and Children Affairs: List of Projects/Operational Lines

51BAGLADESH PUBLIC EXPENDITURE REVIEW ON NUTRITION
Sou
rce:
IBA
S+
+ a
nd o
wn
calc
ulat
ions
.
Co
mp
on
ent
2014
/15
2015
/16
2016
/17
2017
/18
Bu
dge
tR
evis
edA
ctu
alB
ud
get
Rev
ised
Act
ual
Bu
dge
tR
evis
edA
ctu
alB
ud
get
Vuln
erab
le G
roup
Dev
elop
men
t88
788
786
998
199
098
41,
169
1,19
21,
190
1,40
8
Trai
ning
Exp
ense
s32
3229
3230
2832
3329
36
Tran
spor
t R
elat
ed C
osts
713
719
189
1919
1521
Oth
er E
xpen
ses
18
213
102
99
610
Tota
l92
793
990
71,
045
1,04
71,
023
1,22
91,
253
1,24
01,
475
Ann
ual c
hang
e (n
omin
al)
13%
11%
13%
18%
20%
21%
20%
Ann
ual c
hang
e (r
eal)
6%
5%6%
12%
13%
15%
14%
Tab
le 1
8B
reak
dow
n o
f Vu
lner
able
Gro
up
Dev
elo
pm
ent
(VG
D)
Pro
gra
mm
e (n
om
inal
)
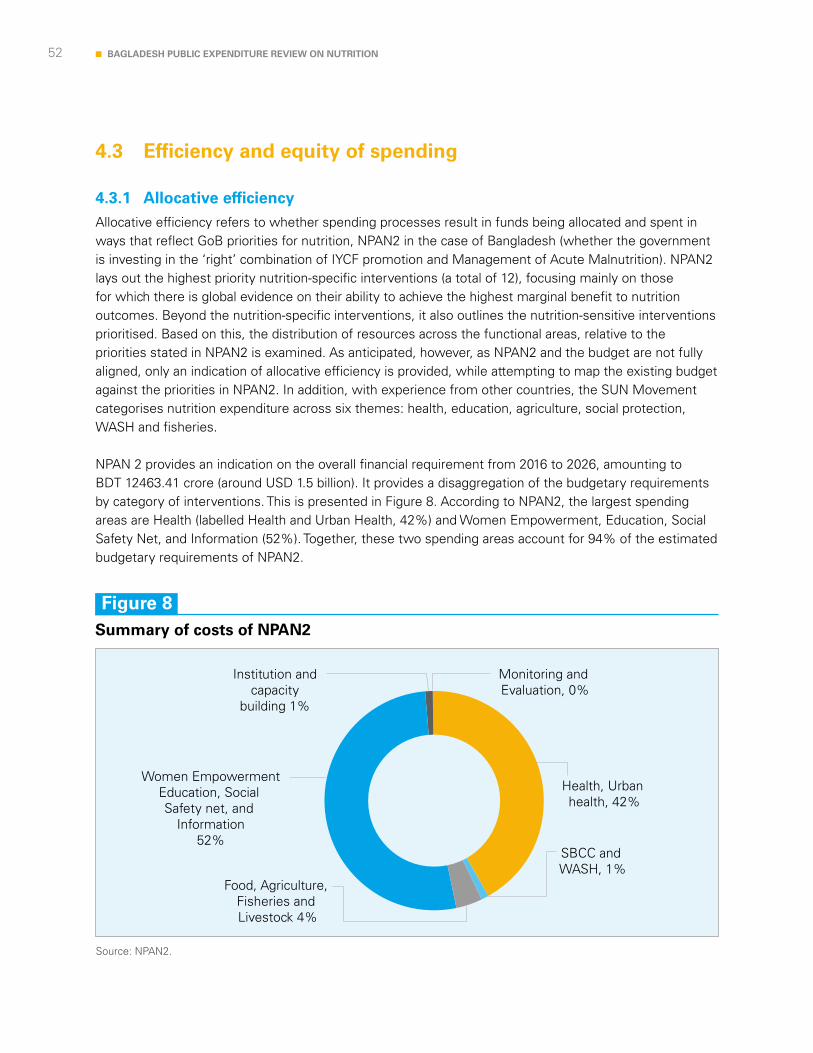
52 BAGLADESH PUBLIC EXPENDITURE REVIEW ON NUTRITION
4.3 Efficiency and equity of spending
4.3.1 Allocative efficiencyAllocative efficiency refers to whether spending processes result in funds being allocated and spent in ways that reflect GoB priorities for nutrition, NPAN2 in the case of Bangladesh (whether the government is investing in the ‘right’ combination of IYCF promotion and Management of Acute Malnutrition). NPAN2 lays out the highest priority nutrition-specific interventions (a total of 12), focusing mainly on those for which there is global evidence on their ability to achieve the highest marginal benefit to nutrition outcomes. Beyond the nutrition-specific interventions, it also outlines the nutrition-sensitive interventions prioritised. Based on this, the distribution of resources across the functional areas, relative to the priorities stated in NPAN2 is examined. As anticipated, however, as NPAN2 and the budget are not fully aligned, only an indication of allocative efficiency is provided, while attempting to map the existing budget against the priorities in NPAN2. In addition, with experience from other countries, the SUN Movement categorises nutrition expenditure across six themes: health, education, agriculture, social protection, WASH and fisheries.
NPAN 2 provides an indication on the overall financial requirement from 2016 to 2026, amounting to BDT 12463.41 crore (around USD 1.5 billion). It provides a disaggregation of the budgetary requirements by category of interventions. This is presented in Figure 8. According to NPAN2, the largest spending areas are Health (labelled Health and Urban Health, 42%) and Women Empowerment, Education, Social Safety Net, and Information (52%). Together, these two spending areas account for 94% of the estimated budgetary requirements of NPAN2.
Source: NPAN2.
Figure 8Summary of costs of NPAN2

53BAGLADESH PUBLIC EXPENDITURE REVIEW ON NUTRITION
Within Women Empowerment, Education, Social Safety Net and Information, by far the highest spending requirement is for the Scale up of existing Maternity Allowance project to 90% coverage, which accounts for 51% of the total NPAN2 financial requirements. Within Health and Urban Health, NPAN 2 identifies as the highest spending requirements for nutrition specific interventions the public provision of complementary foods (15% of total requirements) and breastfeeding promotion (5%). In an ideal world, the current financial commitments would be aligned with the spending areas identified in NPAN2. However, in practice, plans and budgets are not fully aligned and it is not possible to compare like for like based on existing information. In addition, NPAN2 is forward looking and its costs refer to additional investments over and above existing spending. It was approved in the second half of 2017. This PER is backward looking, covering FY2014/16 to FY2017/18. A review of how the projects and operational lines identified align with nutrition NPAN2 revealed challenges in classifying these and aligning them to NPAN2. Some project/operational lines appear to be cutting across more than one theme. This preliminary classification gives an indication of the areas which are currently accounting for the largest shares and can be refined further with more nuanced clarifications. Figure 9 present the share of nutrition-related projects and their value by theme based on NPAN2.
The largest 20 projects/operational lines were found to be under either “agriculture and diet diversification and locally adapted recipes”, “nutrition for all following lifecycle approach” or the “social protection” themes of NPAN2. These thematic areas are also the ones capturing almost all nutrition-relevant expenditures in 2016/17 with 62%, 31% and 6.7% respectively. There were very small expenditures found under the other three thematic areas, i.e., “implementation of Integrated and Comprehensive Social and Behaviours Change Communication (SBCC) Strategy”, “Monitoring, Evaluation and Research to inform policy and program formulation as well as implementation” and “capacity building”. The relatively lower financial requirements of these areas is aligned with NPAN2 estimates given that M&E and capacity building are expected to require relatively small additional financing and the SBCC is currently under development and particular operational or project lines were not expected to be found. In the area of “monitoring, evaluation and research” a number of lines related to research institutes have been identified. The line between research organisations and capacity building is not clear cut. For the purposes of the PER, the Institute of Public Health and Nutrition has been classified under this thematic area as it is mentioned in NPAN2. Other research organisations might be classified here with further consultation, or under capacity building. Their value is quite small relative to the large spending areas and accounts for just 0.24% of actual expenditure. This classification is preliminary and it is to show the array of research initiatives NPAN2 can build on. This can support the establishment of a common nutrition agenda as well as knowledge sharing mechanisms in the utilization of research findings and outcomes, as envisaged under NPAN2. The overlaps are with agriculture, food and health nutrition and population are also recognised.
Finally, under the thematic area of Capacity Building, the review has preliminary identified items mainly related to the Bangladesh Institute of Research and Training On Applied Nutrition (BIRTAN). This is because NPAN2 anticipates that BIRTAN’s capacity, as the training and research arm of the Ministry of Agriculture, will be enhanced through different capacity-building initiatives. NPAN2 further envisages that
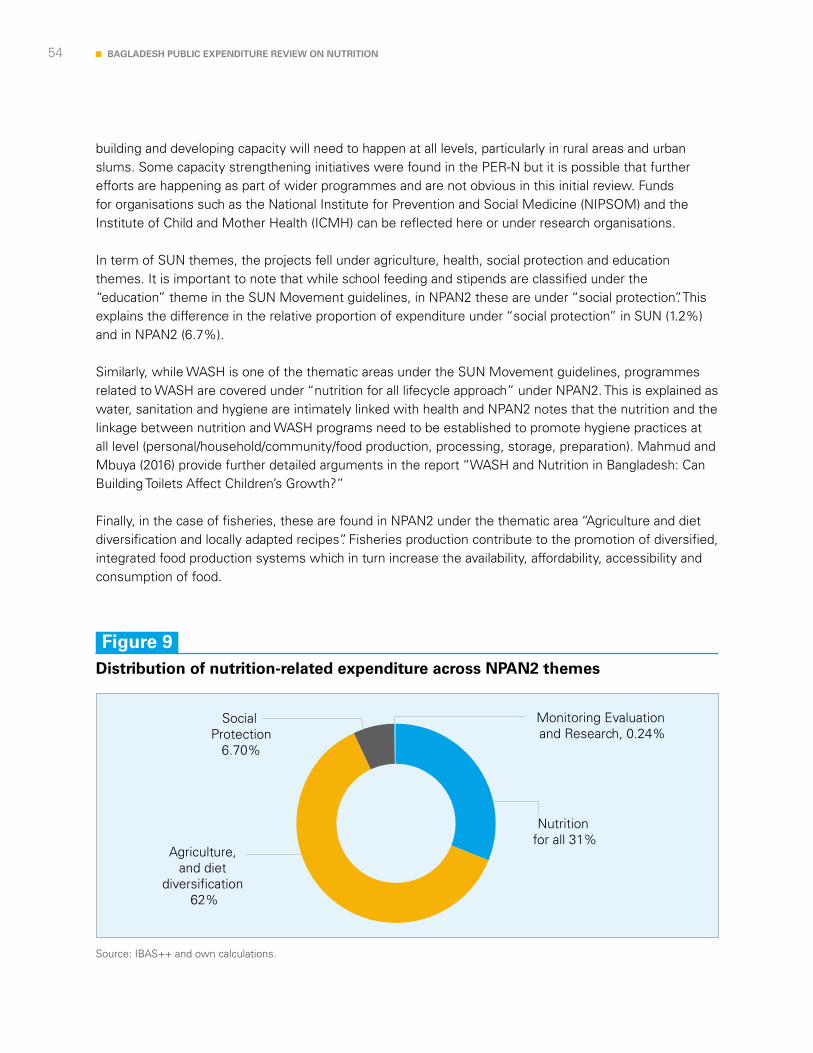
54 BAGLADESH PUBLIC EXPENDITURE REVIEW ON NUTRITION
building and developing capacity will need to happen at all levels, particularly in rural areas and urban slums. Some capacity strengthening initiatives were found in the PER-N but it is possible that further efforts are happening as part of wider programmes and are not obvious in this initial review. Funds for organisations such as the National Institute for Prevention and Social Medicine (NIPSOM) and the Institute of Child and Mother Health (ICMH) can be reflected here or under research organisations. In term of SUN themes, the projects fell under agriculture, health, social protection and education themes. It is important to note that while school feeding and stipends are classified under the “education” theme in the SUN Movement guidelines, in NPAN2 these are under “social protection”. This explains the difference in the relative proportion of expenditure under “social protection” in SUN (1.2%) and in NPAN2 (6.7%). Similarly, while WASH is one of the thematic areas under the SUN Movement guidelines, programmes related to WASH are covered under “nutrition for all lifecycle approach” under NPAN2. This is explained as water, sanitation and hygiene are intimately linked with health and NPAN2 notes that the nutrition and the linkage between nutrition and WASH programs need to be established to promote hygiene practices at all level (personal/household/community/food production, processing, storage, preparation). Mahmud and Mbuya (2016) provide further detailed arguments in the report “WASH and Nutrition in Bangladesh: Can Building Toilets Affect Children’s Growth?” Finally, in the case of fisheries, these are found in NPAN2 under the thematic area “Agriculture and diet diversification and locally adapted recipes”. Fisheries production contribute to the promotion of diversified, integrated food production systems which in turn increase the availability, affordability, accessibility and consumption of food.
Source: IBAS++ and own calculations.
Figure 9Distribution of nutrition-related expenditure across NPAN2 themes
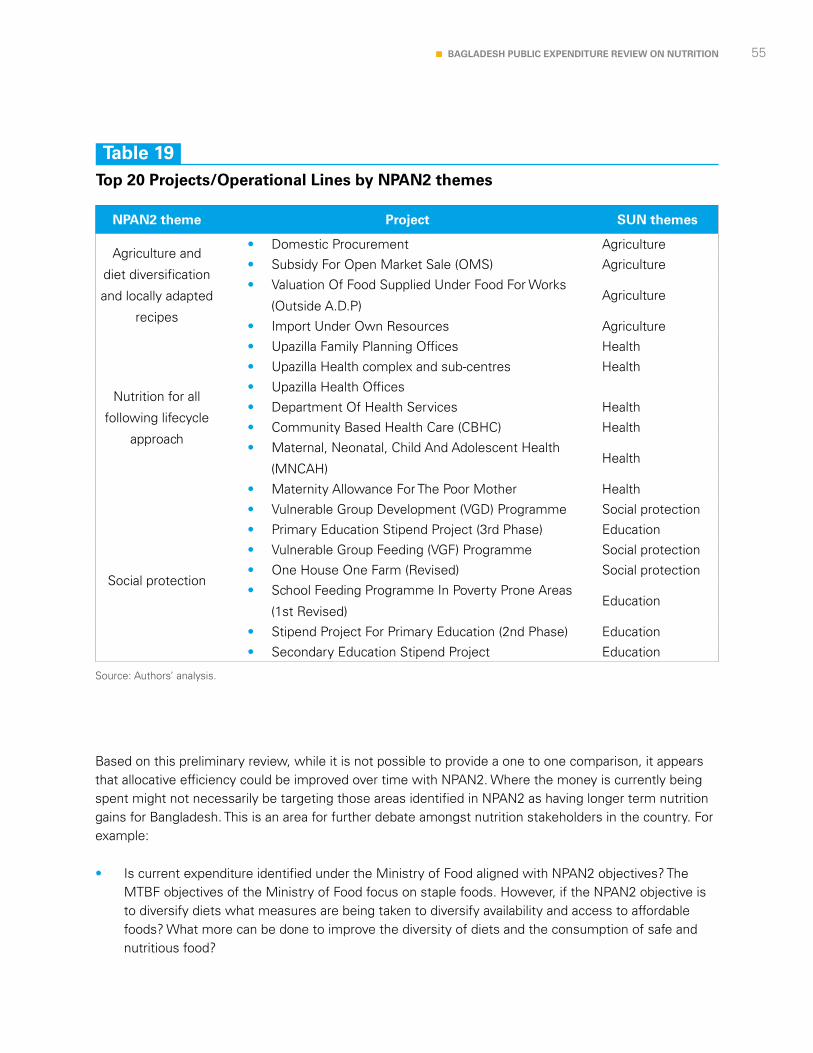
55BAGLADESH PUBLIC EXPENDITURE REVIEW ON NUTRITION
Source: Authors’ analysis.
Table 19Top 20 Projects/Operational Lines by NPAN2 themes
NPAN2 theme Project SUN themes
Agriculture and
diet diversification
and locally adapted
recipes
• Domestic Procurement Agriculture
• Subsidy For Open Market Sale (OMS) Agriculture
• Valuation Of Food Supplied Under Food For Works
(Outside A.D.P)Agriculture
• Import Under Own Resources Agriculture
Nutrition for all
following lifecycle
approach
• Upazilla Family Planning Offices Health
• Upazilla Health complex and sub-centres Health
• Upazilla Health Offices
• Department Of Health Services Health
• Community Based Health Care (CBHC) Health
• Maternal, Neonatal, Child And Adolescent Health
(MNCAH)Health
• Maternity Allowance For The Poor Mother Health
Social protection
• Vulnerable Group Development (VGD) Programme Social protection
• Primary Education Stipend Project (3rd Phase) Education
• Vulnerable Group Feeding (VGF) Programme Social protection
• One House One Farm (Revised) Social protection
• School Feeding Programme In Poverty Prone Areas
(1st Revised)Education
• Stipend Project For Primary Education (2nd Phase) Education
• Secondary Education Stipend Project Education
Based on this preliminary review, while it is not possible to provide a one to one comparison, it appears that allocative efficiency could be improved over time with NPAN2. Where the money is currently being spent might not necessarily be targeting those areas identified in NPAN2 as having longer term nutrition gains for Bangladesh. This is an area for further debate amongst nutrition stakeholders in the country. For example:
• Is current expenditure identified under the Ministry of Food aligned with NPAN2 objectives? The MTBF objectives of the Ministry of Food focus on staple foods. However, if the NPAN2 objective is to diversify diets what measures are being taken to diversify availability and access to affordable foods? What more can be done to improve the diversity of diets and the consumption of safe and nutritious food?
56 BAGLADESH PUBLIC EXPENDITURE REVIEW ON NUTRITION
• With regards to education, the MTBF importantly aims for universal access. Is there a differentiated approach to ensure that girls are not left behind? Better educated mothers has a positive impact on nutrition. There is a direct link between keeping girls in school and delaying early marriage and pregnancy. Female secondary education plays a key role so the stipends projects are very relevant.
• Under MoWCA, one of the main spending areas is the “Working Lactating Mother Assistance Fund and Maternity Allowance Program for Poor Lactating Mothers”. Is the budget estimated for this aligned with the costing provided in NPAN2?
• Under MoHFW, there are a number of large operational/budget lines that play an important role in nutrition. Could targeting be improved to reach the more malnourished women and children?
It would be premature to conclude on these questions on the basis of the PER-N or provide specific reallocations that might improve allocative efficiency. However, further work can shed more light on these and the PER-N has provided a baseline to build upon.
4.3.2 Process efficiency
Process efficiency refers to whether institutional arrangements for public spending are efficient. One of the issues covered during the KII with ministries was the budget processes and performance to understand any issues faced in this regard and how these might be impacting spending in general and nutrition related expenditures in particular. The starting point used was the issues emerging from the 2015 PEFA report, which were then adapted and updated based on changes since the report was published. Some of the potential issues includes in-year budget revisions, underspending of budgets or a weak procurement system. Discussions were also held based on available data on ministry-level original budget, the revised and the actual expenditure as this can also give some indication of the efficiency of budget processes.
A common theme emerging from the KII was that coordination between Planning, Policy Planning and Coordination (PPC) and the budget wings in the respective ministries was good, with the planning wing aware of the development budget ceiling and each wing working together. This usually resulted in no change from planning onwards in terms of the amounts budgeted. A common finding was that expenditure would be close or equal to the budgeted amount over each fiscal year, although there may be some adjustments made in the revised budget to facilitate this.
Some challenges may present themselves during the fiscal year, with delays in fund releases cited on a number of occasions due to procedural issues but the funds would always be made available if in line with the budget. However, there were also some examples where capacity in a specific ministry was cited as a reason why there may be difficulties in fully expending the budgeted amount. This was the case with the Ministry of Health and Family Welfare, where Table 20 below shows that actual execution rates based on the revised budget ranged between 79% and 91% over the 3 fiscal years. There is also evidence that the National Nutrition Services has also not been able to spent all its allocated budget and this was also acknowledged during the interviews.
57BAGLADESH PUBLIC EXPENDITURE REVIEW ON NUTRITION
Table 21 below shows how the largest project/operational lines identified as nutrition-sensitive (school feeding and stipends) had execution rates of 90% of above.
There is one particularly odd percentage which is driven by the Secondary Education Stipend Project. While there was a very small budget in 2014/15, a large amount was then included in the revised budget and spent. This explains the more than 18,000% in the Secondary and Higher Education Division and the more than 21,000% execution rate for this project in Table 21.
Performance is usually monitored by the planning wing of the respective ministry with reporting through monthly, quarterly and annual reports in IMED-5 from the line ministry for review meetings and to the IMED for the purpose of monitoring. No specific issues were noted with regards to monitoring and reporting, with review meetings, involving all the relevant wings and departments of the respective ministry used to discuss and solve any issues found.
There are incentives (non-monetary) systems in place for good performance in budget utilisation. Each Ministry/Division signs a Performance Contract under Annual Performance Agreement (APA) with the Cabinet Division and performance, especially in respect of resource utilization and other MTBF objectives is reviewed on the basis of performance of the entity submitted to the Cabinet Division. If the indicator used to monitor budget utilization performance is high, then the concerned ministry/division earns reward points and is given preferential treatment during next year’s budget allocation. When utilisation is low, then the concerned entity is held responsible, and in the absence of satisfactory reason for low performance the next year’s budget allocation of that line item is reduced.17 However, this does not apply to priority or essential projects/line items.
17 See Annual Performance Agreement Guidelines (APA) 2014-15 - Cabinet Division, GoB.
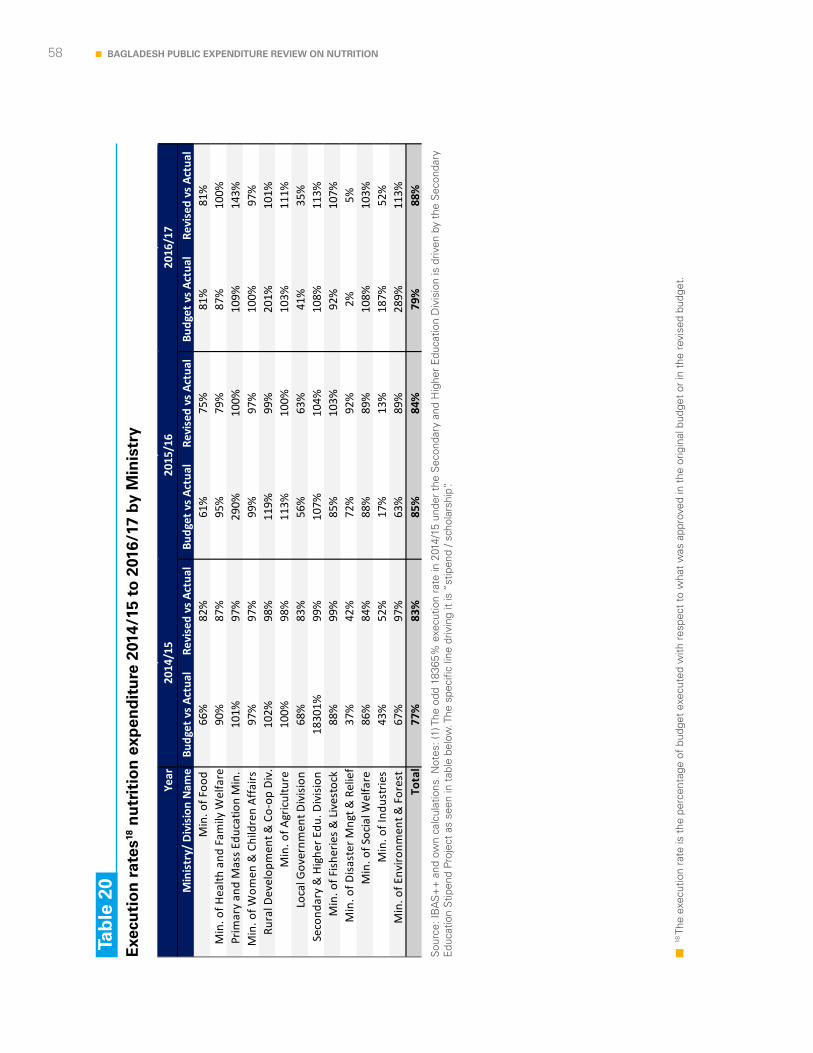
58 BAGLADESH PUBLIC EXPENDITURE REVIEW ON NUTRITION
Tab
le 2
0E
xecu
tio
n r
ates
18 n
utr
itio
n e
xpen
dit
ure
201
4/15
to
201
6/17
by
Min
istr
y
Sou
rce:
IBA
S+
+ a
nd o
wn
calc
ulat
ions
. Not
es: (
1) T
he o
dd 1
8365
% e
xecu
tion
rate
in 2
014/
15 u
nder
the
Sec
onda
ry a
nd H
ighe
r E
duca
tion
Div
isio
n is
driv
en b
y th
e S
econ
dary
E
duca
tion
Stip
end
Proj
ect
as s
een
in t
able
bel
ow. T
he s
peci
fic li
ne d
rivin
g it
is “
stip
end
/ sch
olar
ship
”.
18 T
he e
xecu
tion
rate
is t
he p
erce
ntag
e of
bud
get
exec
uted
with
res
pect
to
wha
t w
as a
ppro
ved
in t
he o
rigin
al b
udge
t or
in t
he r
evis
ed b
udge
t.
Year
Min
istr
y/ D
ivis
ion
Nam
eBu
dget
vs
Actu
alRe
vise
d vs
Act
ual
Budg
et v
s Ac
tual
Revi
sed
vs A
ctua
lBu
dget
vs
Actu
alRe
vise
d vs
Act
ual
Min
. of F
ood
66%
82%
61%
75%
81%
81%
Min
. of H
ealth
and
Fam
ily W
elfa
re90
%87
%95
%79
%87
%10
0%Pr
imar
y an
d M
ass
Educ
atio
n M
in.
101%
97%
290%
100%
109%
143%
Min
. of W
omen
& C
hild
ren
Affa
irs
97%
97%
99%
97%
100%
97%
Rura
l Dev
elop
men
t & C
o-op
Div
.10
2%98
%11
9%99
%20
1%10
1%M
in. o
f Agr
icul
ture
10
0%98
%11
3%10
0%10
3%11
1%Lo
cal G
over
nmen
t Div
isio
n 68
%83
%56
%63
%41
%35
%Se
cond
ary
& H
ighe
r Edu
. Div
isio
n 18
301%
99%
107%
104%
108%
113%
Min
. of F
ishe
ries
& L
ives
tock
88
%99
%85
%10
3%92
%10
7%M
in. o
f Dis
aste
r Mng
t & R
elie
f37
%42
%72
%92
%2%
5%M
in. o
f Soc
ial W
elfa
re
86%
84%
88%
89%
108%
103%
Min
. of I
ndus
trie
s 43
%52
%17
%13
%18
7%52
%M
in. o
f Env
ironm
ent &
For
est
67%
97%
63%
89%
289%
113%
Tota
l77
%83
%85
%84
%79
%88
%
2014
/15
2015
/16
2016
/17
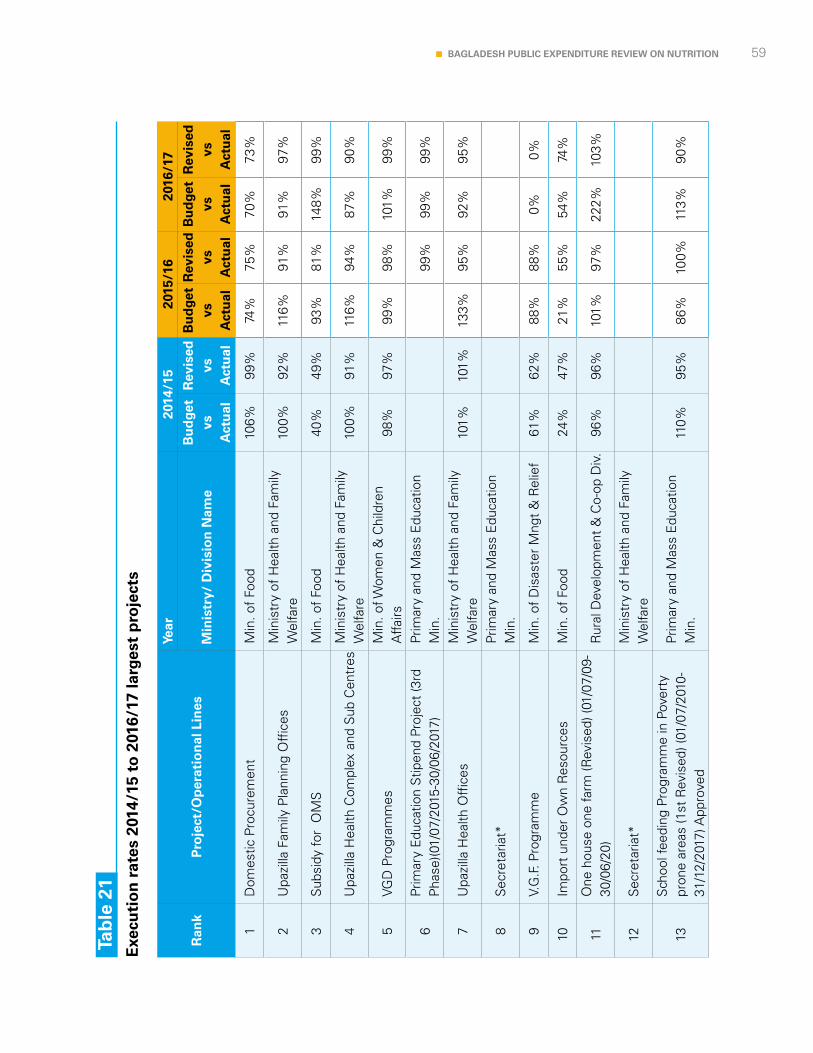
59BAGLADESH PUBLIC EXPENDITURE REVIEW ON NUTRITION
Tab
le 2
1E
xecu
tio
n r
ates
201
4/15
to
201
6/17
larg
est
pro
ject
s
Ran
kP
roje
ct/O
per
atio
nal
Lin
es
Year
2014
/15
2015
/16
2016
/17
Min
istr
y/ D
ivis
ion
Nam
eB
ud
get
vs
Act
ual
Rev
ised
vs
A
ctu
al
Bu
dge
t vs
A
ctu
al
Rev
ised
vs
A
ctu
al
Bu
dge
t vs
A
ctu
al
Rev
ised
vs
A
ctu
al
1D
omes
tic P
rocu
rem
ent
Min
. of
Food
10
6%99
%74
%75
%70
%73
%
2U
pazi
lla F
amily
Pla
nnin
g O
ffic
esM
inis
try
of H
ealth
and
Fam
ily
Wel
fare
100%
92%
116%
91%
91%
97%
3S
ubsi
dy fo
r O
MS
Min
. of
Food
40
%49
%93
%81
%14
8%99
%
4U
pazi
lla H
ealth
Com
plex
and
Sub
Cen
tres
Min
istr
y of
Hea
lth a
nd F
amily
W
elfa
re10
0%91
%11
6%94
%87
%90
%
5VG
D P
rogr
amm
esM
in. o
f Wom
en &
Chi
ldre
n A
ffairs
98
%97
%99
%98
%10
1%99
%
6Pr
imar
y E
duca
tion
Stip
end
Proj
ect
(3rd
P
hase
)(01/
07/2
015-
30/0
6/20
17)
Prim
ary
and
Mas
s E
duca
tion
Min
.
99%
99%
99%
7U
pazi
lla H
ealth
Off
ices
Min
istr
y of
Hea
lth a
nd F
amily
W
elfa
re10
1%10
1%13
3%95
%92
%95
%
8S
ecre
taria
t*Pr
imar
y an
d M
ass
Edu
catio
n M
in.
9V.
G.F
. Pro
gram
me
Min
. of
Dis
aste
r M
ngt
& R
elie
f61
%62
%88
%88
%0%
0%
10Im
port
und
er O
wn
Res
ourc
esM
in. o
f Fo
od
24%
47%
21%
55%
54%
74%
11O
ne h
ouse
one
farm
(Rev
ised
) (01
/07/
09-
30/0
6/20
)R
ural
Dev
elop
men
t &
Co-
op D
iv.
96%
96%
101%
97%
222%
103%
12S
ecre
taria
t*M
inis
try
of H
ealth
and
Fam
ily
Wel
fare
13S
choo
l fee
ding
Pro
gram
me
in P
over
ty
pron
e ar
eas
(1st
Rev
ised
) (01
/07/
2010
-31
/12/
2017
) App
rove
d
Prim
ary
and
Mas
s E
duca
tion
Min
. 11
0%95
%86
%10
0%11
3%90
%
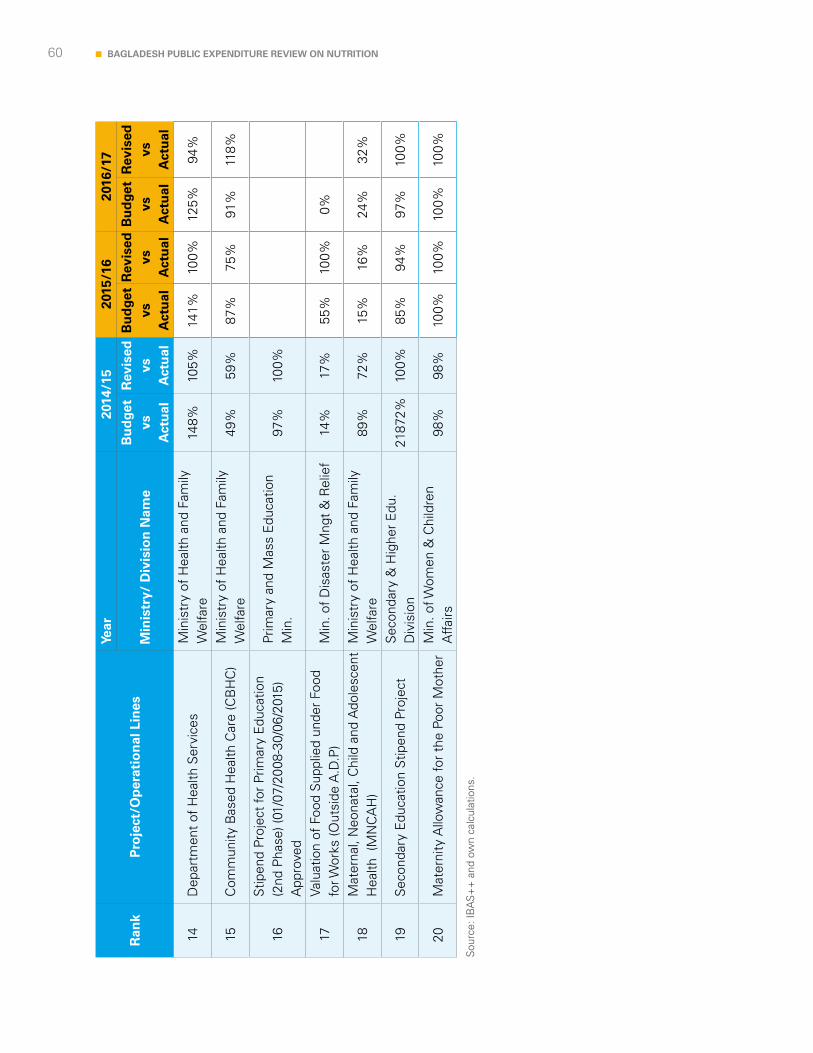
60 BAGLADESH PUBLIC EXPENDITURE REVIEW ON NUTRITION
Ran
kP
roje
ct/O
per
atio
nal
Lin
es
Year
2014
/15
2015
/16
2016
/17
Min
istr
y/ D
ivis
ion
Nam
eB
ud
get
vs
Act
ual
Rev
ised
vs
A
ctu
al
Bu
dge
t vs
A
ctu
al
Rev
ised
vs
A
ctu
al
Bu
dge
t vs
A
ctu
al
Rev
ised
vs
A
ctu
al
14D
epar
tmen
t of
Hea
lth S
ervi
ces
Min
istr
y of
Hea
lth a
nd F
amily
W
elfa
re14
8%10
5%14
1%10
0%12
5%94
%
15C
omm
unity
Bas
ed H
ealth
Car
e (C
BH
C)
Min
istr
y of
Hea
lth a
nd F
amily
W
elfa
re49
%59
%87
%75
%91
%11
8%
16S
tipen
d Pr
ojec
t fo
r Pr
imar
y E
duca
tion
(2nd
Pha
se) (
01/0
7/20
08-3
0/06
/201
5)
App
rove
d
Prim
ary
and
Mas
s E
duca
tion
Min
. 97
%10
0%
17Va
luat
ion
of F
ood
Sup
plie
d un
der
Food
fo
r Wor
ks (O
utsi
de A
.D.P
)M
in. o
f D
isas
ter
Mng
t &
Rel
ief
14%
17%
55%
100%
0%
18M
ater
nal,
Neo
nata
l, C
hild
and
Ado
lesc
ent
Hea
lth (
MN
CA
H)
Min
istr
y of
Hea
lth a
nd F
amily
W
elfa
re89
%72
%15
%16
%24
%32
%
19S
econ
dary
Edu
catio
n S
tipen
d Pr
ojec
tS
econ
dary
& H
ighe
r E
du.
Div
isio
n 21
872%
100%
85%
94%
97%
100%
20M
ater
nity
Allo
wan
ce fo
r th
e Po
or M
othe
rM
in. o
f Wom
en &
Chi
ldre
n A
ffairs
98
%98
%10
0%10
0%10
0%10
0%
Sou
rce:
IBA
S+
+ a
nd o
wn
calc
ulat
ions
.
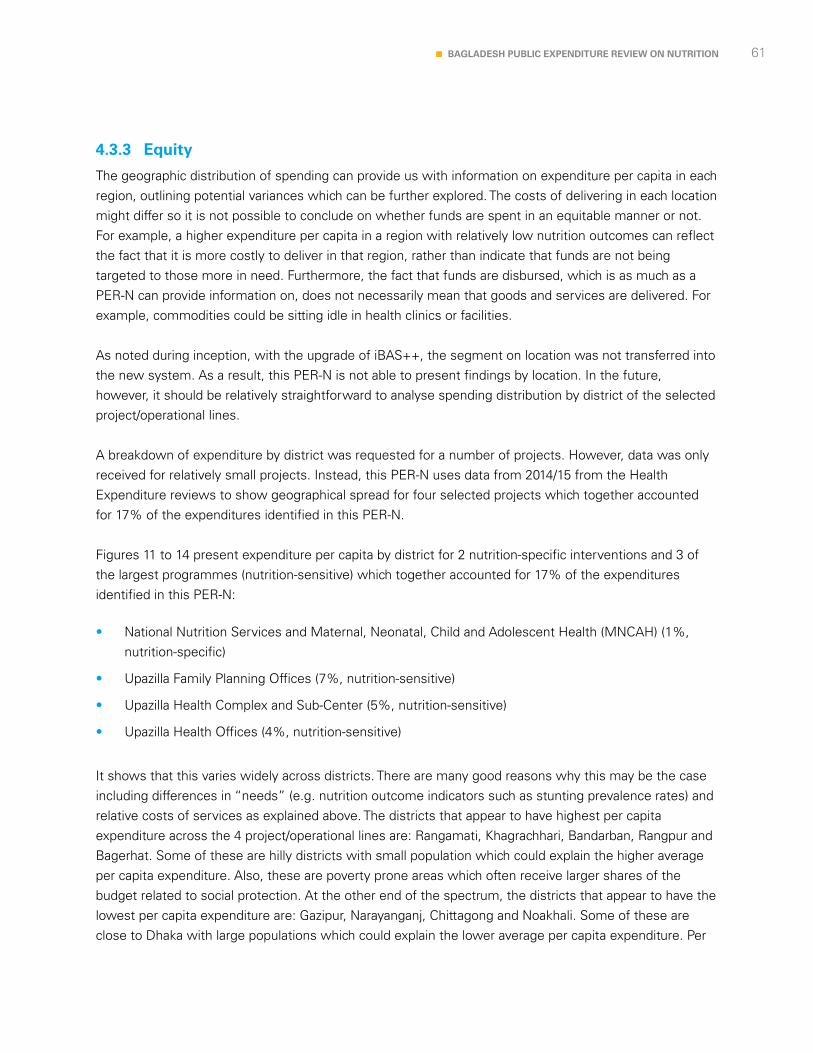
61BAGLADESH PUBLIC EXPENDITURE REVIEW ON NUTRITION
4.3.3 Equity
The geographic distribution of spending can provide us with information on expenditure per capita in each region, outlining potential variances which can be further explored. The costs of delivering in each location might differ so it is not possible to conclude on whether funds are spent in an equitable manner or not. For example, a higher expenditure per capita in a region with relatively low nutrition outcomes can reflect the fact that it is more costly to deliver in that region, rather than indicate that funds are not being targeted to those more in need. Furthermore, the fact that funds are disbursed, which is as much as a PER-N can provide information on, does not necessarily mean that goods and services are delivered. For example, commodities could be sitting idle in health clinics or facilities. As noted during inception, with the upgrade of iBAS++, the segment on location was not transferred into the new system. As a result, this PER-N is not able to present findings by location. In the future, however, it should be relatively straightforward to analyse spending distribution by district of the selected project/operational lines.
A breakdown of expenditure by district was requested for a number of projects. However, data was only received for relatively small projects. Instead, this PER-N uses data from 2014/15 from the Health Expenditure reviews to show geographical spread for four selected projects which together accounted for 17% of the expenditures identified in this PER-N.
Figures 11 to 14 present expenditure per capita by district for 2 nutrition-specific interventions and 3 of the largest programmes (nutrition-sensitive) which together accounted for 17% of the expenditures identified in this PER-N:
• National Nutrition Services and Maternal, Neonatal, Child and Adolescent Health (MNCAH) (1%, nutrition-specific)
• Upazilla Family Planning Offices (7%, nutrition-sensitive)
• Upazilla Health Complex and Sub-Center (5%, nutrition-sensitive)
• Upazilla Health Offices (4%, nutrition-sensitive)
It shows that this varies widely across districts. There are many good reasons why this may be the case including differences in “needs” (e.g. nutrition outcome indicators such as stunting prevalence rates) and relative costs of services as explained above. The districts that appear to have highest per capita expenditure across the 4 project/operational lines are: Rangamati, Khagrachhari, Bandarban, Rangpur and Bagerhat. Some of these are hilly districts with small population which could explain the higher average per capita expenditure. Also, these are poverty prone areas which often receive larger shares of the budget related to social protection. At the other end of the spectrum, the districts that appear to have the lowest per capita expenditure are: Gazipur, Narayanganj, Chittagong and Noakhali. Some of these are close to Dhaka with large populations which could explain the lower average per capita expenditure. Per
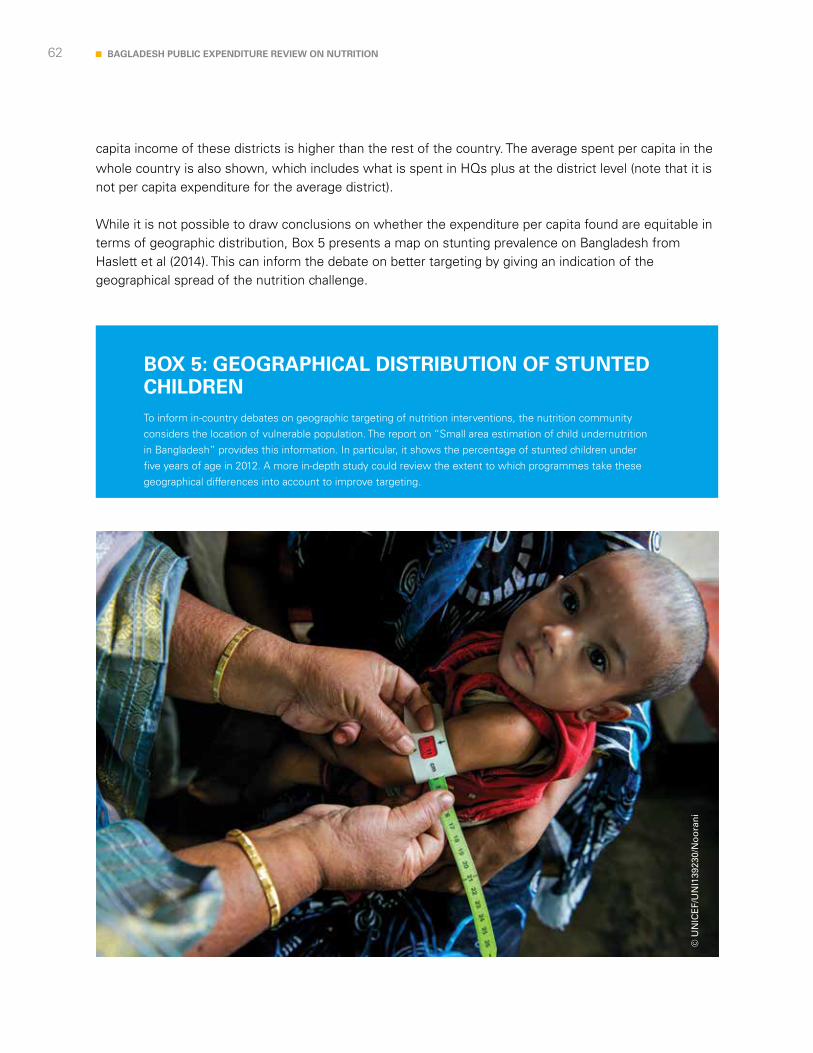
62 BAGLADESH PUBLIC EXPENDITURE REVIEW ON NUTRITION
To inform in-country debates on geographic targeting of nutrition interventions, the nutrition community considers the location of vulnerable population. The report on “Small area estimation of child undernutrition in Bangladesh” provides this information. In particular, it shows the percentage of stunted children under five years of age in 2012. A more in-depth study could review the extent to which programmes take these geographical differences into account to improve targeting.
BOX 5: GEOGRAPHICAL DISTRIBUTION OF STUNTED CHILDREN
capita income of these districts is higher than the rest of the country. The average spent per capita in the whole country is also shown, which includes what is spent in HQs plus at the district level (note that it is not per capita expenditure for the average district).
While it is not possible to draw conclusions on whether the expenditure per capita found are equitable in terms of geographic distribution, Box 5 presents a map on stunting prevalence on Bangladesh from Haslett et al (2014). This can inform the debate on better targeting by giving an indication of the geographical spread of the nutrition challenge.
© U
NIC
EF/
UN
I139
230/
No
ora
ni
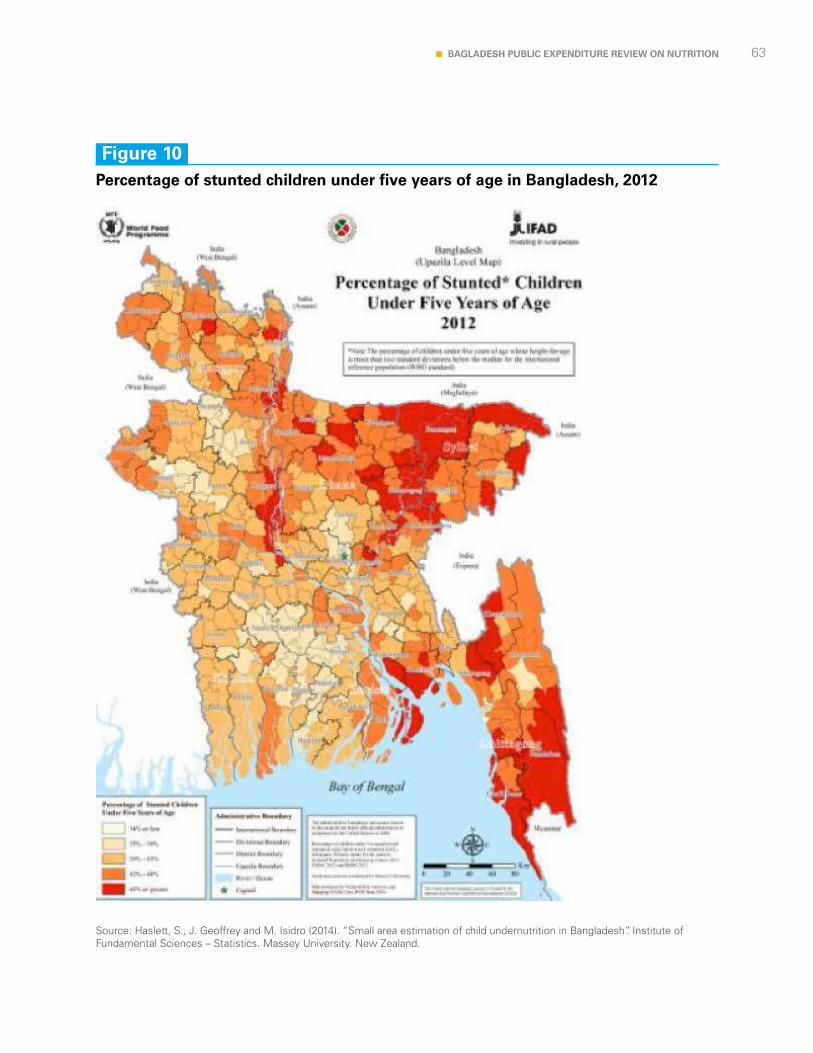
63BAGLADESH PUBLIC EXPENDITURE REVIEW ON NUTRITION
Figure 10Percentage of stunted children under five years of age in Bangladesh, 2012
Source: Haslett, S., J. Geoffrey and M. Isidro (2014). “Small area estimation of child undernutrition in Bangladesh”. Institute of Fundamental Sciences – Statistics. Massey University. New Zealand.
64 BAGLADESH PUBLIC EXPENDITURE REVIEW ON NUTRITION
Figure 11Maternal, Neonatal, Child and Adolescent Health (MNCAH) and National Nutrition Services, Per Capita Expenditure in BDT, 2014/15
Source: Expenditure data from PER Health and population data from http://www.citypopulation.de/Bangladesh-Mun.html.
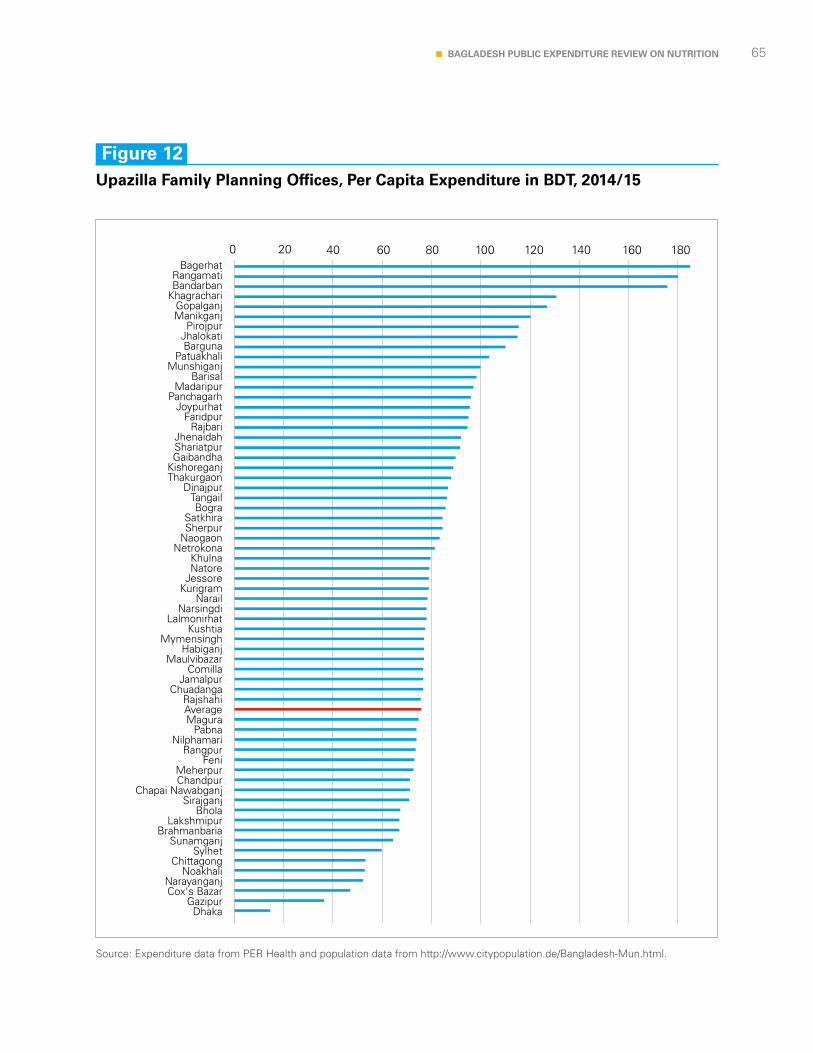
65BAGLADESH PUBLIC EXPENDITURE REVIEW ON NUTRITION
Figure 12Upazilla Family Planning Offices, Per Capita Expenditure in BDT, 2014/15
Source: Expenditure data from PER Health and population data from http://www.citypopulation.de/Bangladesh-Mun.html.
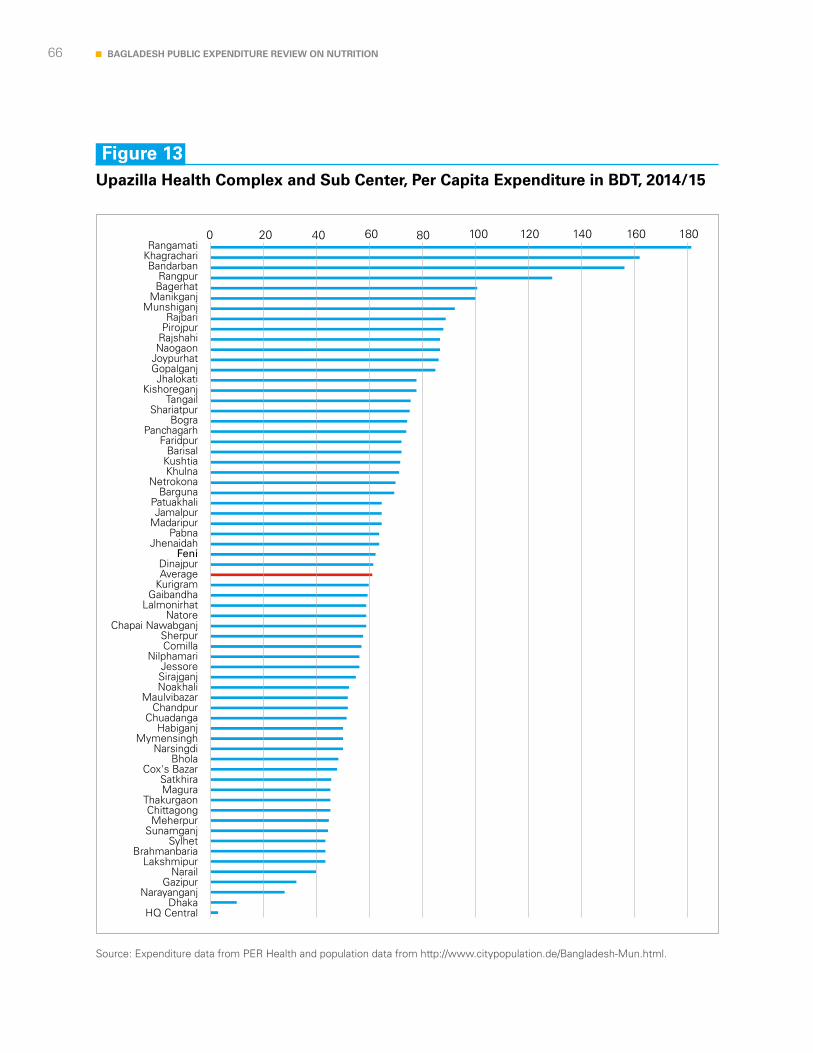
66 BAGLADESH PUBLIC EXPENDITURE REVIEW ON NUTRITION
Figure 13Upazilla Health Complex and Sub Center, Per Capita Expenditure in BDT, 2014/15
Source: Expenditure data from PER Health and population data from http://www.citypopulation.de/Bangladesh-Mun.html.
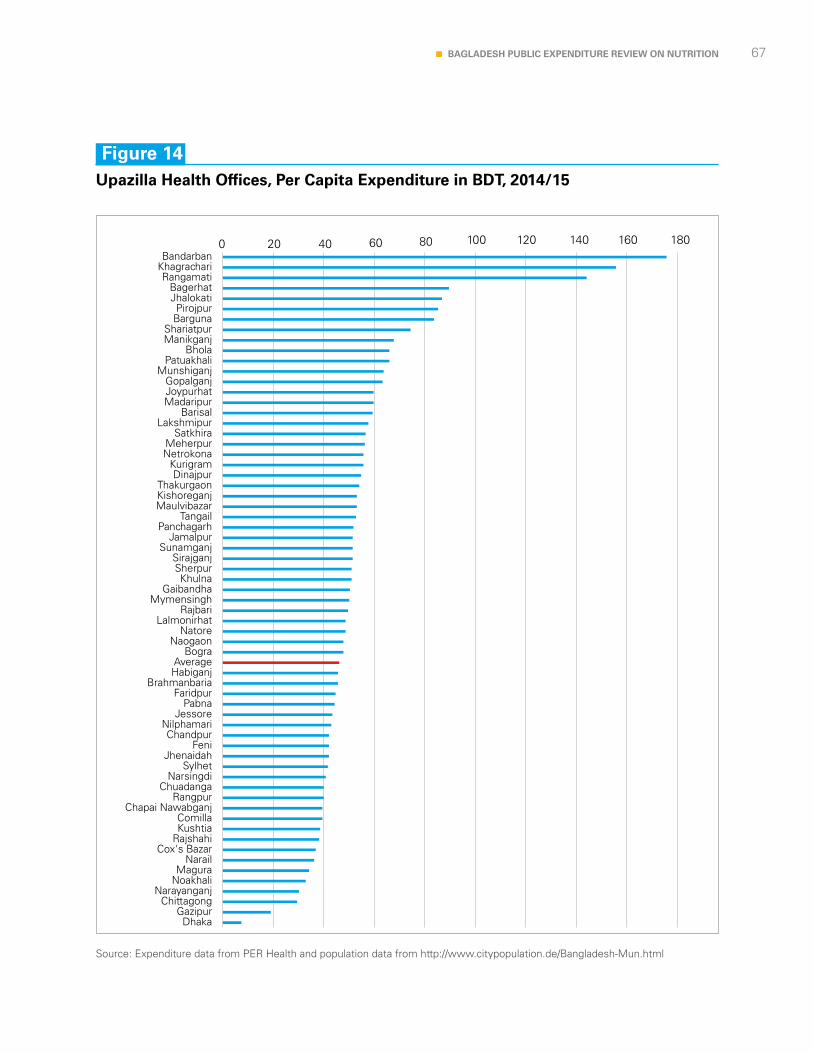
67BAGLADESH PUBLIC EXPENDITURE REVIEW ON NUTRITION
Figure 14Upazilla Health Offices, Per Capita Expenditure in BDT, 2014/15
Source: Expenditure data from PER Health and population data from http://www.citypopulation.de/Bangladesh-Mun.html

68 BAGLADESH PUBLIC EXPENDITURE REVIEW ON NUTRITION
Furthermore, while reviewing sub-national level finances is outside the scope of this PER-N, it is clear that a thorough analysis of resources and activities at the sub-national could provide further insights into the extent to which national level policy, planning and budgeting translates into service delivery outcomes. The in-depth study by Save the Children on nutrition governance at the Upazilla level19 covers this aspect. For the purposes of the PER-N, a brief case study is included in Box 6 on the Dhaka South City Corporation to provide insights on finance and activities at the sub-national level.
Nutrition relevant spending by local government entities was not included in the scope of this PER. However, to gain an understanding of the finances related to nutrition at sub-national level, spending by Dhaka South City Corporation (DSCC) was reviewed.
Dhaka City Corporation, the local government entity of the capital city, was known as Dhaka Municipality before 1990, and was established in 1864. In December 2011 it was split into two parts, creating Dhaka North City Corporation and DSCC. The present population of Dhaka city is around 15 million, however, the population who live in the Southern part of the city is not known. DSCC with 5 zones and 57 wards is densely populated demanding more attention for cleanliness, sanitation and hygiene, all nutrition sensitive activities.
Budget and Finance: DSCC budget is financed through government grants from the Local Government Division (LGD), external assisted ADP projects (e.g. UPHCSDP) and DSCC’s own income. Major sources of DSCC’s own income include: holding tax collected from households, amusement tax collected from cinema halls, circus etc., lease and rents collected
from markets, children parks, community centres, and shopping malls, fees collected from land transfer, issue of birth, death, and marriage certificates, trade licences, rickshaw licences, rent from bus and truck terminals and advertisement fees. However, this amount is not always adequate; it also needs government grants for deficit financing and foreign aid and government contributions in the form of Project Aid to carry out development programmes. In 2016-17, DSCC spent BDT 1788.8 crore. A little less than one fourth of this was financed by DSCC’s own income.
Health Department: The health department of the DSCC consists of one Chief Health Officer who leads the department, there is an Assistant Health Officer for each of its 5 zones to oversee the health related activities of the City Corporation within the respective zone. Health Department also operates 3 hospitals and charitable dispensaries with DSCC’s own income.
Nutrition related activities: Some of the activities of the DSCC health department cover nutrition-relevant issues, like EPI, distribution of vitamin A for children, sanitation, hygiene, and food safety. The Extended Programme on Immunization (EPI)
BOX 6: SPENDING AT SUB-NATIONAL LEVEL: INSIGHTS FROM DHAKA SOUTH CITY CORPORATION.
19 Nutrition Governance in Bangladesh - A National and Upazilla-level Assessment, Save the Children, 2014
69BAGLADESH PUBLIC EXPENDITURE REVIEW ON NUTRITION
Source: Interview with the Senior Medical Officer and Chief Accounting Officer of DSCC, DSCC website, and the data from iBAS++ and the Urban Primary Health Care Services Delivery Project (UPHCSDP) of LGD.
is led by the Ministry of Health and Family Welfare (MOHFW) and the DSCC health department provides manpower and facilities in 57 wards to facilitate the EPI service. MOHFW and UNICEF provide vaccines for EPI programme, folic acid and vitamin A. For food safety DSCC uses the food testing laboratory of IPH, MOHFW for food testing.
The health department of the DSCC keeps close liaison with the IPHN to keep themselves abreast of the National Nutrition Policy, although they do not have any plan to launch any nutrition programmes of their own. Policy meetings at the MOHFW are attended by representatives from the health department of the DSCC.
Nutrition Finance: DSCC’s health and nutrition finance is mainly looked after by UPHCSDP. In 2016-17 UPHCSDP allocated BDT 2.3 million for the component on supplementary nutrition, which is 0.1% of total UPHCSDP budget for that year. Out of BDT 2.3 million, 22% was allocated for DSCC. However, DSCC does not provide funding to UPHCSDP.
The expenditure of nutrition-relevant programmes of DSCC such as sanitation, hygiene and food safety is from DSCC’s own income. In 2016-17, a paltry amount of BDT 200,000 was spent on procuring chemicals used for food testing. It is unlikely that DSCC will increase nutrition related expenditure in near future given its dependence on government grants and project aid for development programmes.
The DSCC website, while describing health related activities, does not even mention ‘nutrition’. It mentions nutrition only in relation to UPHCSDP. On the other hand, NPAN2 does not show local government entities as implementing agencies for various nutrition related activities it outlined in the document. Focus is on the need to strengthen capacity and coordination mechanisms at this level. BNNC needs to start dialogue with local government bodies, particularly city corporations on coordination of nutrition activities in urban areas.
4.4 Key findings
The key findings from the analysis are the following:
• Total public actual expenditure in nutrition in Bangladesh in 2016/17 was BDT 23,120 crore (USD 2.7 billion) across 15 ministries/division, representing 9% of the total budget and 1% of GDP.
• Nutrition project/operational lines are found across at least 15 ministries/divisions. Of these, the vast majority is concentrated in 4 ministries over the 3 years under review (FY2014/15 to FY2016/17), namely Ministry of Food (34%), Ministry of Health and Family Welfare (26%), Primary and Mass Education Ministry (13%) and Ministry of Women and Children Affairs (7%).
• The proportion of nutrition expenditure with respect to the total budget for these 15 ministries/divisions remained relatively stable around 20% over the 3 years under review (FY2014/15 to FY2016/17).
70 BAGLADESH PUBLIC EXPENDITURE REVIEW ON NUTRITION
• The ministries/divisions for whom the proportion of nutrition expenditure with respect to their own spending is largest are: Ministry of Food, Ministry of Women and Children Affairs, Rural Development and Cooperation Division and Ministry of Health and Family Welfare.
• Out of total nutrition expenditure during the 3 years under review, only 2% is on nutrition-specific project/operational lines. The remaining 98% is on nutrition-sensitive.
• Out of the total expenditure in 3 years, 29% was found in the development side of the budget while 71% was found in the non-development side. This means that any analysis of nutrition investments needs to include both the development as well as the non-development side of the budget.
• The largest 20 project/operational lines found account for 81% of expenditures in the 3 years under review. A third of it is on the procurement of rice and wheat and the subsidy for OMS. This PER argues that alignment of the objectives of these expenditures could be strengthened to better reflect the objective of diet diversification prioritised in NPAN2.
• The largest nutrition-sensitive project/operational lines during these 3 years are: Procurement of wheat/rice (22%); the Upazilla Family Planning Offices (7%); the subsidy for Open Market Sales (6%), Upazilla Health Complex and sub-centres (6%), the VGD Programme (5%) and the Primary Education Stipend Project (4%).
• The largest nutrition-specific project/operational lines are: MNCAH, Karmajibi Lactating Mother Sohaita Tohbil and NNS.
• The 20 largest projects were found to be under either “agriculture and diet diversification and locally adapted recipes”, “nutrition for all following lifecycle approach” or the “social protection” themes of NPAN2. As it is the case in many countries, health and agriculture dominate although social protection plays a very important role too.
• Based on this analysis, it appears that allocative efficiency can be improved over time. Where the money is currently being spent is not necessarily targeting those areas identified in NPAN2 as having longer term nutrition gains for Bangladesh. This is an area for further debate among nutrition stakeholders in the country.
• The analysis of execution rates highlighted some challenges in budget processes and performance. These challenges are similar to those found in PFM diagnostic studies, such as the 2015 PEFA. An analysis of execution rates showed odd figures for some ministries which might be further investigated, as well as some of the largest project/operational lines.
• The review of geographical distribution of expenditure for four programmes shows that per capita expenditure by district can vary significantly. There are many good reasons why this may be the case. More in-depths analysis would be required to conclude on equity.
• The districts that appear to have highest per capita expenditure across the health project/operational lines analysed are: Rangamati, Khagrachhari, Bandarban, Rangpur and Bagerhat. At the other end of the spectrum, the districts that appear to have the lowest per capita expenditure are: Gazipur, Narayanganj, Chittagong and Noakhali.
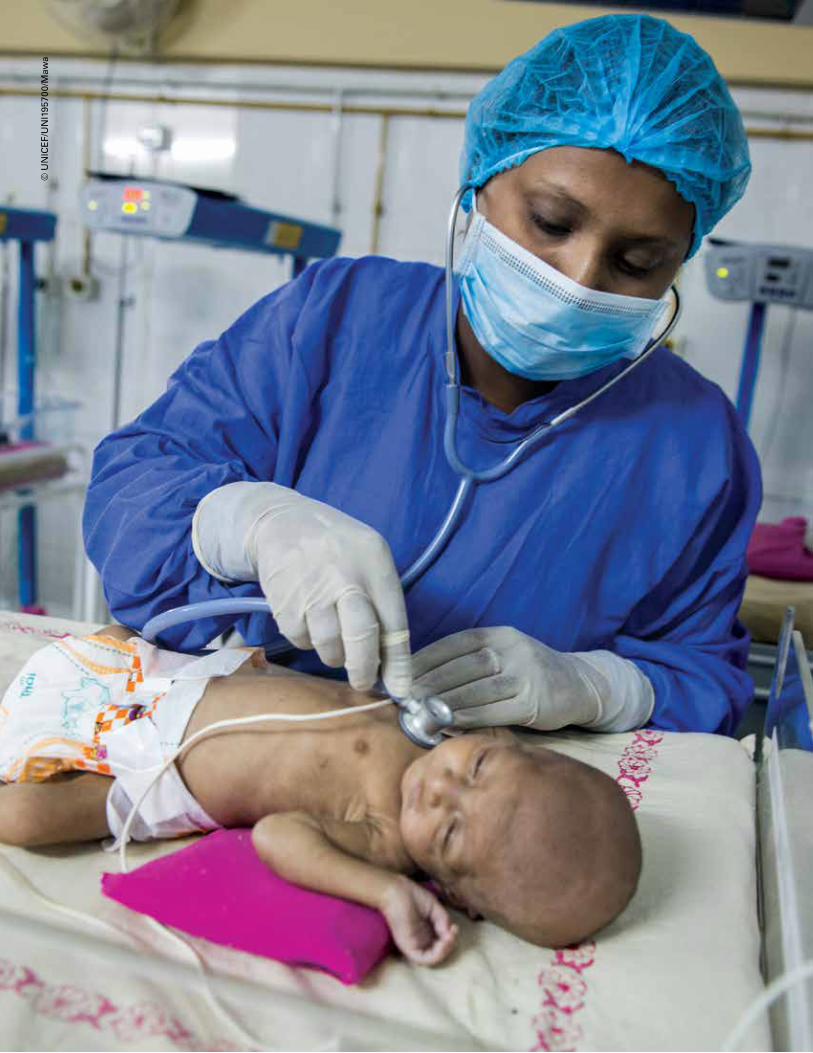
71BAGLADESH PUBLIC EXPENDITURE REVIEW ON NUTRITION©
UN
ICE
F/U
NI1
9570
0/M
awa
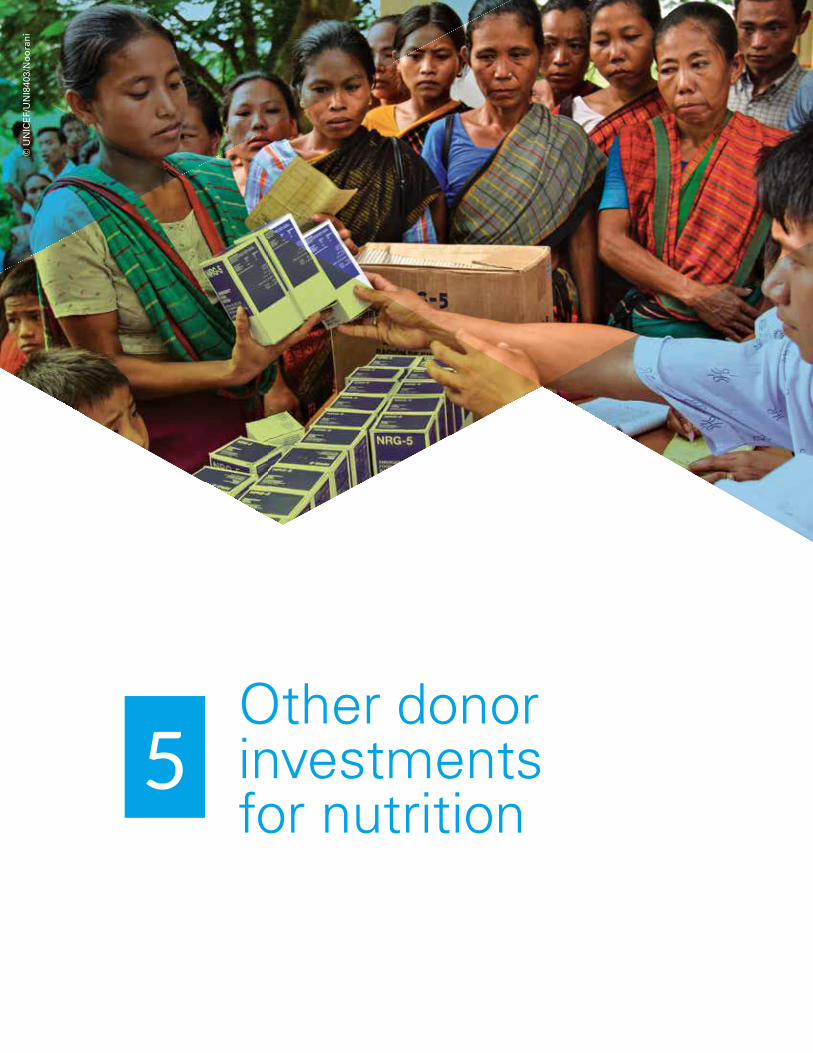
72 BAGLADESH PUBLIC EXPENDITURE REVIEW ON NUTRITION
Other donor investments for nutrition
5
© U
NIC
EF/
UN
I840
3/N
oo
ran
i
73BAGLADESH PUBLIC EXPENDITURE REVIEW ON NUTRITION
20https://devtracker.dfid.gov.uk/projects/GB-1-204131/21Exchange rate used 1 USD = BDP 84.
5.1 Level and composition of investments
Following the process outlined in the methodology section, a total of 73 projects investing in nutrition were found with funding from donors to NGOs and other organisations. The majority of these projects were found in the AIMS database (46) with a further 27 found in the CIP database (Development Partners Sheet). Out of these, only 13 projects were found in both, giving a total of 60 unique projects. Annex D provides further details on these projects. Some of the challenges found in reporting such investments are given in Box 7.
The analysis has indicated challenges in reporting on aid funding evidenced by some data inconsistencies with regards to other donor investments for nutrition, which were found when reviewing the various datasets. These challenges are common in many countries and in the case of the reporting systems in Bangladesh two common issues were found.
In some cases, projects showed commitments and disbursed amounts but expenditure was showing zero. An example project is the Improving Maternal and Child Nutrition (NoboKoli) project funded by KOICA found in the AIMS database. Such projects were included in the analysis but the only financial data used was total value in USD.
In other cases, projects showed disbursements higher than the project total amount or project total values differed in each dataset or in other project information. In this case the total value of the project was checked in all available databases and project documents and websites to ascertain the value. In a small number of cases this could not be resolved. An example of this is SUCHANA where the project value is entered in AIMS as GBP 2 million when according DFID’s website it should be 20 million20 . This might explain why the disbursed amount is higher than the funding value entered in AIMS at GBP 7.9 million. Information could not be found on the EU contribution to this project in the available databases.
BOX 7: CHALLENGES IN REPORTING OTHER DONOR INVESTMENTS FOR NUTRITION
Source: Authors.
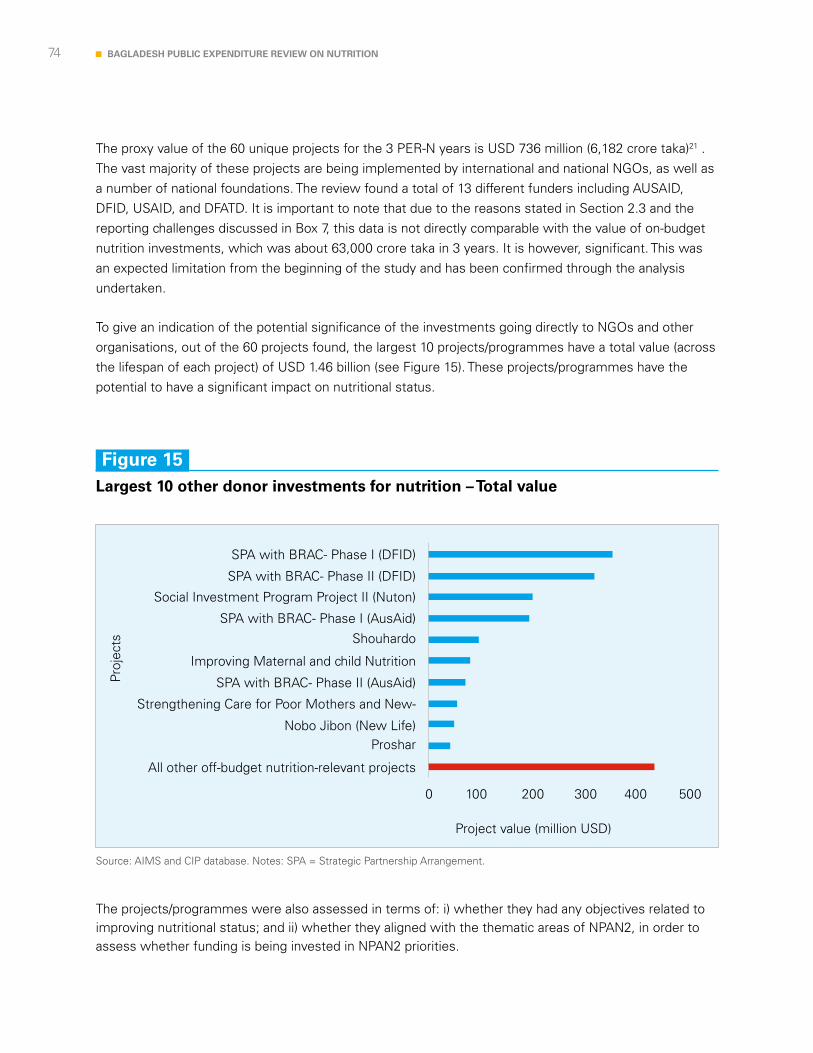
74 BAGLADESH PUBLIC EXPENDITURE REVIEW ON NUTRITION
The proxy value of the 60 unique projects for the 3 PER-N years is USD 736 million (6,182 crore taka)21 . The vast majority of these projects are being implemented by international and national NGOs, as well as a number of national foundations. The review found a total of 13 different funders including AUSAID, DFID, USAID, and DFATD. It is important to note that due to the reasons stated in Section 2.3 and the reporting challenges discussed in Box 7, this data is not directly comparable with the value of on-budget nutrition investments, which was about 63,000 crore taka in 3 years. It is however, significant. This was an expected limitation from the beginning of the study and has been confirmed through the analysis undertaken.
To give an indication of the potential significance of the investments going directly to NGOs and other organisations, out of the 60 projects found, the largest 10 projects/programmes have a total value (across the lifespan of each project) of USD 1.46 billion (see Figure 15). These projects/programmes have the potential to have a significant impact on nutritional status.
The projects/programmes were also assessed in terms of: i) whether they had any objectives related to improving nutritional status; and ii) whether they aligned with the thematic areas of NPAN2, in order to assess whether funding is being invested in NPAN2 priorities.
Figure 15Largest 10 other donor investments for nutrition – Total value
Source: AIMS and CIP database. Notes: SPA = Strategic Partnership Arrangement.
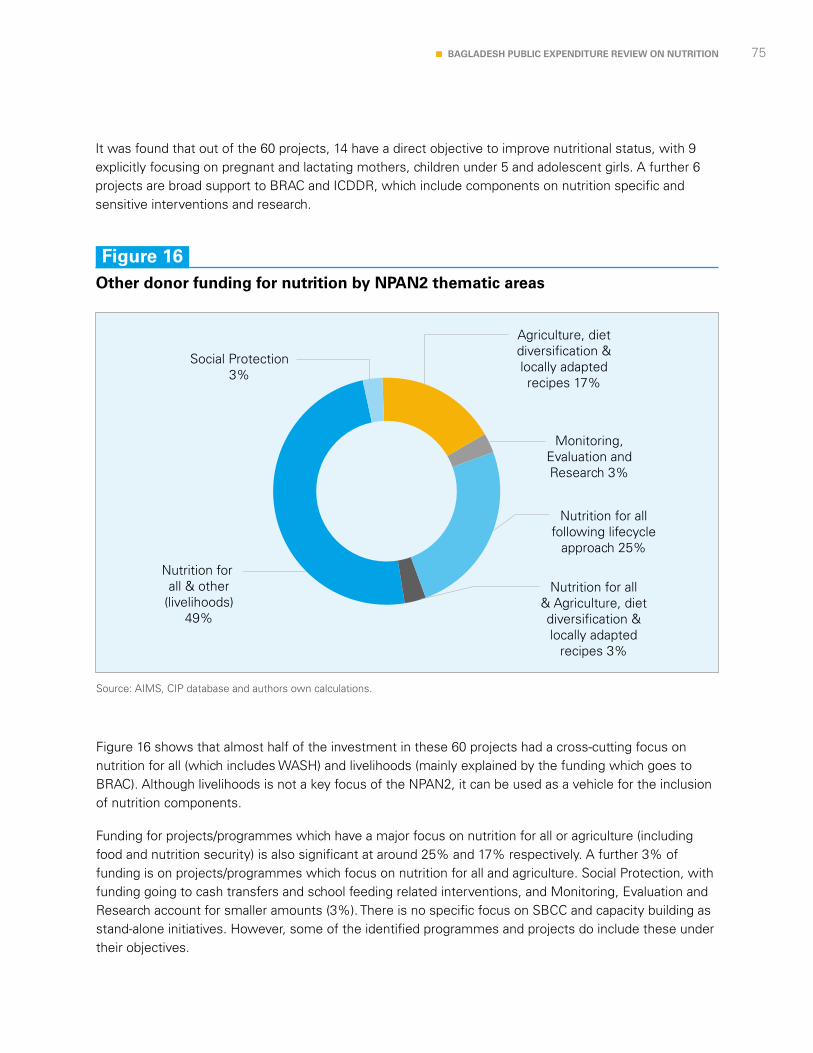
75BAGLADESH PUBLIC EXPENDITURE REVIEW ON NUTRITION
Figure 16 shows that almost half of the investment in these 60 projects had a cross-cutting focus on nutrition for all (which includes WASH) and livelihoods (mainly explained by the funding which goes to BRAC). Although livelihoods is not a key focus of the NPAN2, it can be used as a vehicle for the inclusion of nutrition components.
Funding for projects/programmes which have a major focus on nutrition for all or agriculture (including food and nutrition security) is also significant at around 25% and 17% respectively. A further 3% of funding is on projects/programmes which focus on nutrition for all and agriculture. Social Protection, with funding going to cash transfers and school feeding related interventions, and Monitoring, Evaluation and Research account for smaller amounts (3%). There is no specific focus on SBCC and capacity building as stand-alone initiatives. However, some of the identified programmes and projects do include these under their objectives.
Source: AIMS, CIP database and authors own calculations.
Figure 16Other donor funding for nutrition by NPAN2 thematic areas
It was found that out of the 60 projects, 14 have a direct objective to improve nutritional status, with 9 explicitly focusing on pregnant and lactating mothers, children under 5 and adolescent girls. A further 6 projects are broad support to BRAC and ICDDR, which include components on nutrition specific and sensitive interventions and research.
76 BAGLADESH PUBLIC EXPENDITURE REVIEW ON NUTRITION
5.2 Key findings
The key findings from the review of other donor investments for nutrition are:
• There is a large number of projects with significant funding going from funders direct to NGOs and other organisations.
• The proxy value for the three PER-N years of the 60 projects identified is USD 736 million (6,182 crore taka).
• Although this analysis gives a relatively comprehensive picture of available funding outside of the government system for nutrition in Bangladesh, it does not give a complete picture. This is due to the fact that NGOs for example are likely to receive funds from foundations and private sources which are not captured in the datasets that exist as they focus on donor funding only.
• Almost half of the investment in these 60 projects had a cross-cutting focus on nutrition for all (which includes WASH) and livelihoods (mainly explained by the funding which goes to BRAC).
• None of the existing databases is comprehensive and there are likely to be more projects not found in this review:
• The analysis revealed that the AIMS database does not comprehensively cover all donor funding in Bangladesh. AIMS relies on information being provided by development partners in a standardised format to the ERD for each project. It seems likely that project information is not always received.
• The triangulation with the CIP dataset also indicates that it is likely that there are other projects which started from 2016 onwards that are not in AIMS and have been missed in the list of 60 projects found in this analysis. This is because the CIP dataset (specifically the Development Partners sheet) available for the analysis had been collected in 2016 and covered projects which were in progress in 2014/15 but not afterwards.
• Some of the projects found may have close links with government ministries, such as SUCHANA with the MoHFW. However, this does not necessarily translate into systematic and timely reporting in a comprehensive manner.
77BAGLADESH PUBLIC EXPENDITURE REVIEW ON NUTRITION©
UN
ICE
F/U
NI1
8332
1/N
oo
ran
78 BAGLADESH PUBLIC EXPENDITURE REVIEW ON NUTRITION
Conclusions and recommendations 6
© U
NIC
EF/
UN
0878
/Pau
l
79BAGLADESH PUBLIC EXPENDITURE REVIEW ON NUTRITION
The findings from this PER are summarised below.
• BNNC Secretariat has the mandate to oversee and monitor all expenditure relevant for the operationalisation of NPAN2. It is important that early momentum in this regard is built upon, that capacity envisioned in NPAN2 is realised and sufficient operational budget comes from the GoB to enable the BNNC Secretariat to carry out its mandate sustainably.
• Nutrition investments can be found in at least 15 ministries/divisions in Bangladesh.
• The PER estimates that a total of BDT 23,210 crore (USD 2.7 billion) was spent in nutrition in 2016/17, representing 9% of total government budget and 1% of GDP. It is however not possible to compare this with traditional sectors such as health or education because nutrition cuts across them and could be misleading. In a sense the amount overestimates investments on nutrition since it includes programmes that do not have nutrition outcomes as its primary target.
• The level of investment has remained relatively stable.
• The vast majority of expenditure is on nutrition-sensitive interventions, around 98%, while the remaining 2% is on nutrition-specific.
• The ministries concentrating the largest amounts are Ministry of Food (34%), Ministry of Health and Family Welfare (23%), Primary and Mass Education Ministry (13%) and Ministry of Women and Children Affairs (7%). The 4 of them together account for 80% of the total.
• The distribution of allocation across NPAN2 themes shows how almost all expenditure can be classified under the three main NPAN2 themes: “agriculture and diet diversification and locally adapted recipes” (62%), “nutrition for all following lifecycle approach” (31%) or the “social protection” (7%) themes of NPAN2.
• Based on this analysis, it appears that allocative efficiency can be improved. Where the money is currently being spent is not necessarily targeting those areas identified in NPAN2 as having longer term nutrition gains for Bangladesh. This is an area of further debate among nutrition stakeholders in the country (see next sub-section).
Agriculture and diet diversification and locally adapted recipes
6.1 Summary of findings
80 BAGLADESH PUBLIC EXPENDITURE REVIEW ON NUTRITION
• Execution rates of nutrition expenditures signal weaknesses in budget processes and performance, broadly in line with those found across sectors, so they are not particular to nutrition.
• The review of geographical distribution of expenditure for 2 nutrition-specific and 3 nutrition-sensitive programmes shows that per capita expenditure by district can vary significantly. However, more in-depths analysis would be required to conclude on equity.
• The districts that appear to have highest per capita expenditure across health project/operational lines analysed are: Rangamati, Khagrachhari, Bandarban, Rangpur and Bagerhat. At the other end of the spectrum, the districts that appear to have the lowest per capita expenditure are: Gazipur, Narayanganj, Chittagong and Noakhali.
• In addition to public expenditure on nutrition found in iBAS++, there are significant other donor investments for nutrition which go directly to NGOs that are currently not being captured in a systematic and comprehensive manner by any other existing database (AIMS, the CIP database or the OECD-DAC CRS).
• The proxy value for the 3 PER-N years of the 60 projects identified is USD 736 million (6,182 crore taka).
• There is likely to be more investment for nutrition outside of the government system than what has been found in this PER as NGOs for example are likely to receive funds from foundations and private sources which are not captured in the datasets that exist.
• More than half of the investment in the 60 projects found had a cross-cutting focus on nutrition for all (which includes WASH) and livelihoods (mainly explained by the funding which goes to BRAC).
6.2 Recommendations
A Validation Workshop was held on the 5th of September 2018 with 50 participants representing all the line ministries identified in NPAN2 as well as key development partners. The workshop agenda and full list of participants can be found in Annex F.
On the basis of the findings, some preliminary questions were identified to be discussed at the workshop to put forward the necessary recommendations. In order to strengthen ownership and accountability of the Plan of Action put forward, this was developed as a team during the validation workshop with all the relevant stakeholders who will ultimately be responsible for making them happen. The full Plan of Action as developed during the workshop by participants is attached in Annex G.
Based on the discussions during the workshop and contributions from participants, the following specific recommendations have been selected.
81BAGLADESH PUBLIC EXPENDITURE REVIEW ON NUTRITION
First, in order to improve the level and composition of expenditure:
• NPAN2 activities should be considered during budget preparation, Annual Performance Agreements to set Key Performance Indicators and project preparation. Specifically, including a nutrition component in the Development Project Proforma.
• The largest spending items can be scrutinized to identify any potentially missed opportunities for better targeting for nutrition impact, particularly for the MoFood, MoHFW, MoPME and MoWCA given they account for a significant proportion of overall investments. (See examples provided by participants in the Plan of Action in Annex G)
Second, in order to strengthen coordination and reporting:
• Consolidate the nutrition investment dataset that accompanies this PER-N and populate and refine going forward as data becomes available.
• Increase resources to BNNC to deliver on their mandate (budget and HR).
Third, advocate for nutrition. Specifically, BNNC could develop a Nutrition training module to be used by line ministries in awareness raising and capacity building of nutrition focal points in line ministries.
Fourth, improve the regular collection and use of relevant data to address the data challenges identified in this PER-N, including:
• On-budget expenditure by location: Ensure the segment on location is duly completed in the upgrade of iBAS++ going forward, to allow tracking the geographical distribution of expenditures.
• Donor investments: The GoB and the identified donors should work together to ensure all the necessary data with the adequate details is kept in one place to track also donor funds that are going directly to NGOs for the implementation of programmes aiming to improve nutrition.
• Public corporations: iBAS++ does not provide enough level of detail to understand expenditures made by Public Corporations. BNNC should work with the relevant Public corporations to gather the relevant data on nutrition investments, such as for example BSCIC’s project ‘Nutrition awareness of iodine and promoting consumption of iodized salt (2011-2012 to 2015-2016)’, which was in the CIP database but was not captured in the iBAS++ database.
• City Corporations: There are 11 City Corporations in Bangladesh and these local government bodies might make investments on nutrition from their own resources, which are not captured in iBAS++. BNNC should explore the expenditures of the 11 City Corporations to have a better understanding of investments at the sub-national level.
Finally, this PER-N should be used as a baseline to institutionalise tracking of financing investments on nutrition going forward, as part of the mandate of BNNC.
82 BAGLADESH PUBLIC EXPENDITURE REVIEW ON NUTRITION
ReferencesBangladesh Bureau of Statistics, 2007. Household Income and Expenditure Survey 2005. Ministry of Planning,
Government of the People’s Republic of Bangladesh
Bangladesh Bureau of Statistics, 2011. Household Income and Expenditure Survey 2010. Ministry of Planning,
Government of the People’s Republic of Bangladesh
Bangladesh Bureau of Statistics, Statistics and Informatics Division, 2017. Preliminary Report on Household Income
and Expenditure Survey 2016. Ministry of Planning, Government of the People’s Republic of Bangladesh
Bangladesh Bureau of Statistics, Statistics and Informatics Division, January 2018. Labour Force Survey Bangladesh
2016-17. Improving of Labour Statistics and Labour Market Information System through Panel Survey (LMIS) Project,
Ministry of Planning, Government of the People’s Republic of Bangladesh
Bangladesh Economic Review 2017: http://mof.portal.gov.bd/site/page/44e399b3-d378-41aa-86ff-8c4277eb0990/
Bangladesh-Economic-Review
Bhutta ZA et al., 2013. Evidence-based Interventions for improvement of maternal and child nutrition: what can be
done and at what cost? Lancet Series on Maternal and Child Nutrition, The Lancet, 2013.
Compact 2025 Team, 2016. Bangladesh: Ending Hunger & Undernutrition Challenges & Opportunities - Scoping
Report For Roundtable Discussion. International Food Policy Research Institute
Development Initiatives, 2017. Global Nutrition Report 2017: Nourishing the SDGs. Bristol, UK: Development
Initiatives.
Donor and Development Partner Group, 2014. Undernutrition in Bangladesh: A Common Narrative
Fracassi P, Picanyol C, Knechtel W, D’Alimonte M, Gary A, Pomeroy-Stevens A, Watts R
“Budget Analysis for Nutrition: guidance note for countries (update 2017)”, available at http://docs.scalingupnutrition.
org/wp-content/uploads/2017/10/2017-Guidance-for-Budget-Analysis_EN.pdf
Haslett, S., J. Geoffrey and M. Isidro (2014). “Small area estimation of child undernutrition in Bangladesh”. Institute of
Fundamental Sciences – Statistics. Massey University. New Zealand.
Hoddinott, J., H. Alderman, J. R. Behrman, L. Haddad and S. Horton, 2013. The economic rationale for investing in
stunting. Maternal and Child Nutrition 9(S2): 69-82, 2013.
Institute of Public Health and Nutrition et al., 2013. Bangladesh National Micronutrient Status Survey 2011-12 - Final
Report. Ministry of Health and Family Welfare, icddr,b, UNICEF, GAIN, Dhaka, Bangladesh
Local Consultative Groups in Bangladesh: http://lcgbangladesh.org/LCG_Mechanism.php
Ministry of Food and Disaster Management, 2011. Bangladesh Country Investment Plan: A Road Map Towards
Investment in Agriculture, Food Security and Nutrition - Updated Version June, 2011, Government of the People’s
Republic of Bangladesh
Ministry of Finance, Budget at a Glance 2017-18, Government of the People’s Republic of Bangladesh. http://mof.
portal.gov.bd/site/page/65335556-555b-4e79-8160-2c8975d76b52
83BAGLADESH PUBLIC EXPENDITURE REVIEW ON NUTRITION
Mitra and Associates, 2016. Bangladesh Demographic and Health Survey 2014, National Institute of Population
Research and Training (NIPORT), Ministry of Health and Family Welfare, Dhaka, Bangladesh
Mokoro, Valid international and FEG Consulting, 2015. Independent Comprehensive Evaluation of the Scaling Up
Nutrition Movement report.
Planning Wing, Ministry of Health and Family Welfare, 2011. Strategic Plan for Health, Population, and Nutrition Sector
Development Program (HPNSDP) 2011-2016. Government of the People’s Republic of Bangladesh. Dhaka,
Bangladesh.
Ruel et al., 2013. Nutrition-sensitive interventions and programmes: how can they help to accelerate progress in
improving maternal and child nutrition? The Lancet Series on Maternal and Child Nutrition, 2013.
Ruel et al., 2013. Nutrition-sensitive interventions and programmes: how can they help to accelerate progress in
improving maternal and child nutrition? Series on Maternal and Child Nutrition, The Lancet, 2013.
Saha, Kuntal K., Masum Billah, Purnima Menon, Shams El Arifeen, and Nkosinathi V. N. Mbuya. 2015. Bangladesh
National Nutrition Services: Assessment of Implementation Status. World Bank Studies. Washington, DC: World Bank
Save the Children, 2014. Nutrition Governance in Bangladesh - A National and Upazila-level Assessment.
Second International Conference on Nutrition, 2014. Country Nutrition Paper, Bangladesh
WHO – Community Clinics in Bangladesh: http://www.searo.who.int/mediacentre/events/community-clinics-
bangladesh-story/en/
World Bank Bangladesh Data: http://databank.worldbank.org/data/Views/Reports/ReportWidgetCustom.aspx?Report_
Name=CountryProfile&Id=b450fd57&tbar=y&dd=y&inf=n&zm=n&country=BGD
The World Bank, April 2016. Bangladesh Development Update – Moving Forward with Fading Tailwinds. The World
Bank, Washington DC
The World Bank, April 2018. Bangladesh Development Update – Building on Resilience. The World Bank, Washington
DC
The World Bank, October 2017. Bangladesh Country Snapshot. The World Bank, Washington DC
The World Bank Bangladesh Overview: http://www.worldbank.org/en/country/bangladesh/overview
The World Bank and Nutrition: http://www.worldbank.org/en/topic/nutrition/overview
The World Bank, 2006. Repositioning Nutrition as Central to Development: A Strategy for Large-Scale Action. The
International Bank for Reconstruction and Development/The World Bank, Washington, 2013.
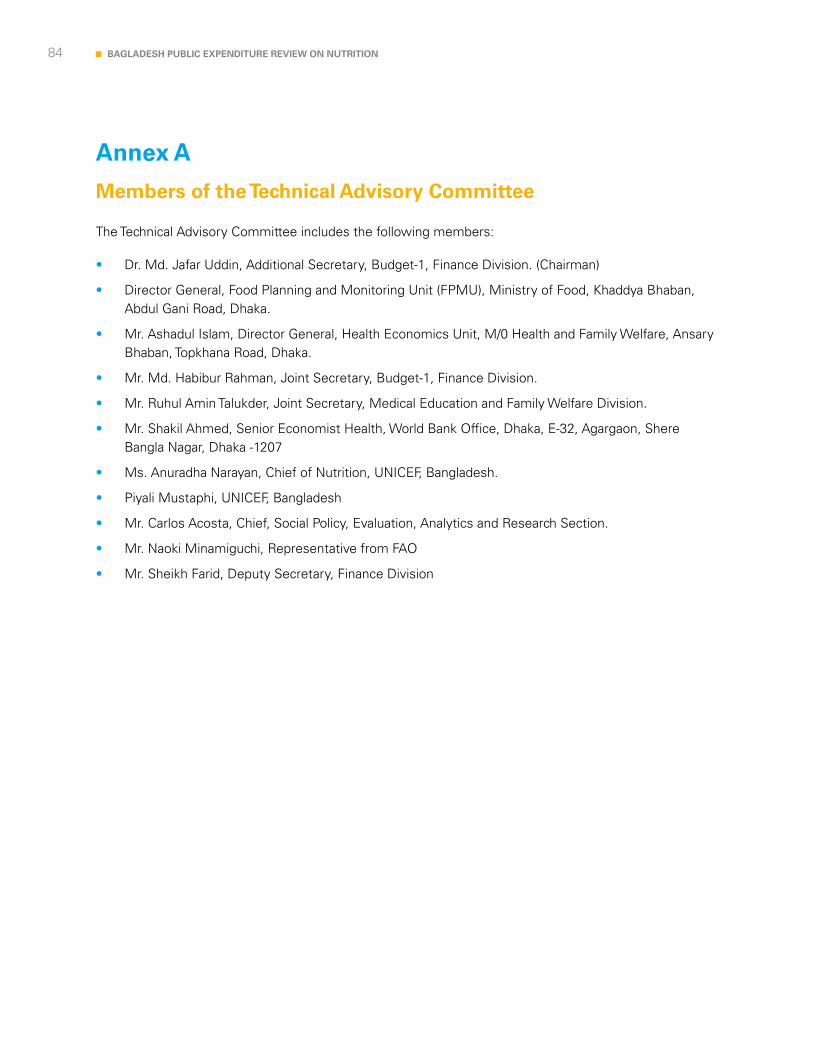
84 BAGLADESH PUBLIC EXPENDITURE REVIEW ON NUTRITION
The Technical Advisory Committee includes the following members:
• Dr. Md. Jafar Uddin, Additional Secretary, Budget-1, Finance Division. (Chairman)
• Director General, Food Planning and Monitoring Unit (FPMU), Ministry of Food, Khaddya Bhaban, Abdul Gani Road, Dhaka.
• Mr. Ashadul Islam, Director General, Health Economics Unit, M/0 Health and Family Welfare, Ansary Bhaban, Topkhana Road, Dhaka.
• Mr. Md. Habibur Rahman, Joint Secretary, Budget-1, Finance Division.
• Mr. Ruhul Amin Talukder, Joint Secretary, Medical Education and Family Welfare Division.
• Mr. Shakil Ahmed, Senior Economist Health, World Bank Office, Dhaka, E-32, Agargaon, Shere Bangla Nagar, Dhaka -1207
• Ms. Anuradha Narayan, Chief of Nutrition, UNICEF, Bangladesh.
• Piyali Mustaphi, UNICEF, Bangladesh
• Mr. Carlos Acosta, Chief, Social Policy, Evaluation, Analytics and Research Section.
• Mr. Naoki Minamiguchi, Representative from FAO
• Mr. Sheikh Farid, Deputy Secretary, Finance Division
Annex A
Members of the Technical Advisory Committee

85BAGLADESH PUBLIC EXPENDITURE REVIEW ON NUTRITION
Annex B
List of people met
Name Designation Organisation
1 A K M Nurul Islam
Project Director, Strengthening of Sustainable Nutrition through Pulse and Oil Seed Production Project
Bangladesh Agricultural Development Corporation (BADC)
2 Jamaluddin Deputy ChiefBangladesh Agricultural Development Corporation (BADC)
3Mr Mustafa Shawkat Ali Faisal
Deputy ChiefBangladesh Agricultural Development Corporation (BADC)
4 Ms Tapasi Rani Basak Joint Chief, PlanningBangladesh Agricultural Development Corporation (BADC)
5Dr. Mohammad Abduhu
Senior Scientific Officer BIRTAN
6 Kazi Abul Kalam Joint Secretary BIRTAN
7 Dr Akhter Imam Focal Point BNNC Secretariat
8 Dr Md Shah Nawaz Director General BNNC Secretariat
9 Mahfuza RifatProgramme Head - Health Nutrition & Population
BRAC
10 Mehedi MasudProject Director, Year Round Fruit Production for Nutrition Improvement Project
Department of Agricultural Extension, Ministry of Agriculture
11Engineer Tushar Mohon Shadhu Khan
Superintendent Engineer, Planning Circle
Department of Health Engineering (DPHE)
12Engineer Md Shafiqur Rahman
Programmer, Planning CircleDepartment of Health Engineering (DPHE)
13Engineer Ehteshamul Russel Khan
Project Director, Water Supply Sanitation & Hygiene (WASH) Project
Department of Health Engineering (DPHE)
14 Kazi Rowshan Akhter Director GeneralDepartment of Women Affairs (DWA), Ministry of Women and Children Affairs (MOWCA)
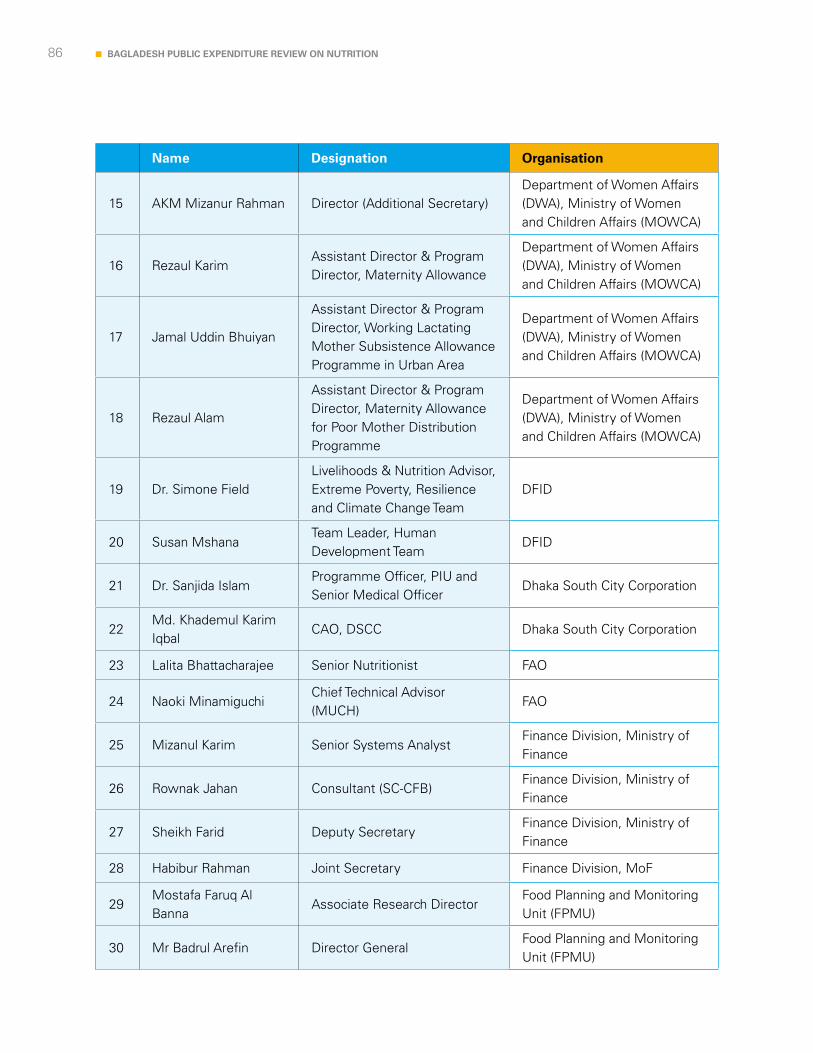
86 BAGLADESH PUBLIC EXPENDITURE REVIEW ON NUTRITION
Name Designation Organisation
15 AKM Mizanur Rahman Director (Additional Secretary)Department of Women Affairs (DWA), Ministry of Women and Children Affairs (MOWCA)
16 Rezaul KarimAssistant Director & Program Director, Maternity Allowance
Department of Women Affairs (DWA), Ministry of Women and Children Affairs (MOWCA)
17 Jamal Uddin Bhuiyan
Assistant Director & Program Director, Working Lactating Mother Subsistence Allowance Programme in Urban Area
Department of Women Affairs (DWA), Ministry of Women and Children Affairs (MOWCA)
18 Rezaul Alam
Assistant Director & Program Director, Maternity Allowance for Poor Mother Distribution Programme
Department of Women Affairs (DWA), Ministry of Women and Children Affairs (MOWCA)
19 Dr. Simone Field Livelihoods & Nutrition Advisor, Extreme Poverty, Resilience and Climate Change Team
DFID
20 Susan MshanaTeam Leader, Human Development Team
DFID
21 Dr. Sanjida IslamProgramme Officer, PIU and Senior Medical Officer
Dhaka South City Corporation
22Md. Khademul Karim Iqbal
CAO, DSCC Dhaka South City Corporation
23 Lalita Bhattacharajee Senior Nutritionist FAO
24 Naoki MinamiguchiChief Technical Advisor (MUCH)
FAO
25 Mizanul Karim Senior Systems AnalystFinance Division, Ministry of Finance
26 Rownak Jahan Consultant (SC-CFB)Finance Division, Ministry of Finance
27 Sheikh Farid Deputy SecretaryFinance Division, Ministry of Finance
28 Habibur Rahman Joint Secretary Finance Division, MoF
29Mostafa Faruq Al Banna
Associate Research DirectorFood Planning and Monitoring Unit (FPMU)
30 Mr Badrul Arefin Director General Food Planning and Monitoring Unit (FPMU)
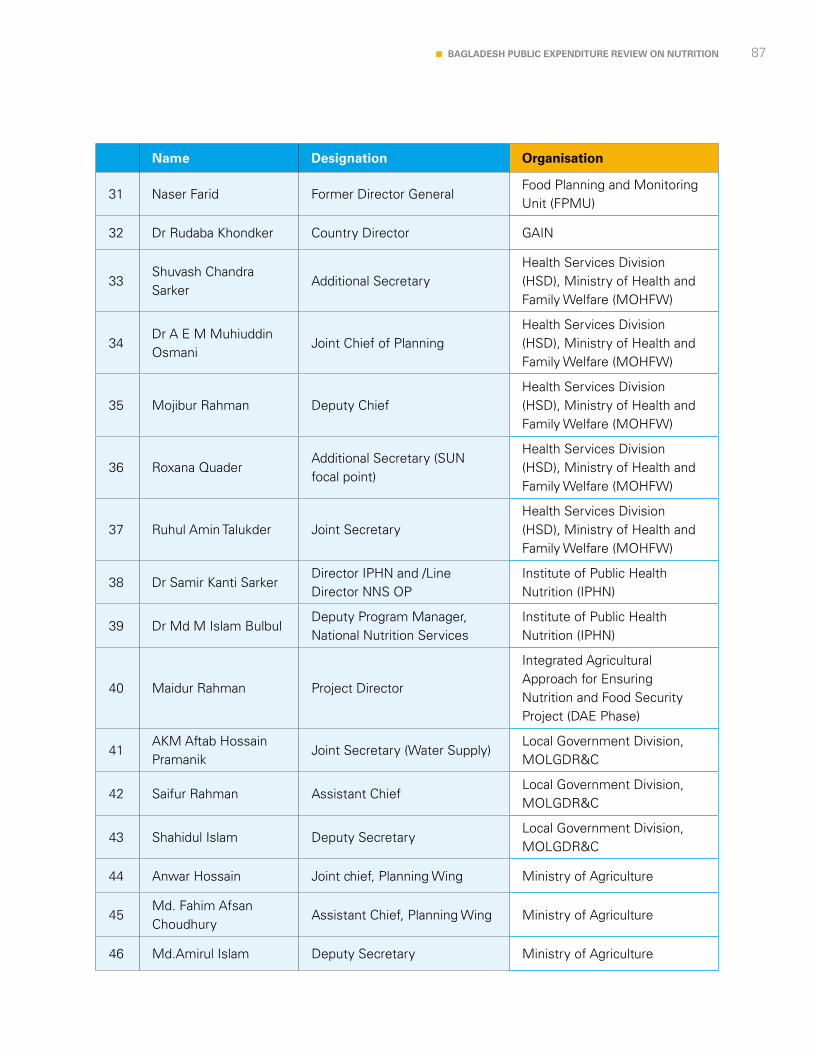
87BAGLADESH PUBLIC EXPENDITURE REVIEW ON NUTRITION
Name Designation Organisation
31 Naser Farid Former Director GeneralFood Planning and Monitoring Unit (FPMU)
32 Dr Rudaba Khondker Country Director GAIN
33Shuvash Chandra Sarker
Additional SecretaryHealth Services Division (HSD), Ministry of Health and Family Welfare (MOHFW)
34Dr A E M Muhiuddin Osmani
Joint Chief of PlanningHealth Services Division (HSD), Ministry of Health and Family Welfare (MOHFW)
35 Mojibur Rahman Deputy ChiefHealth Services Division (HSD), Ministry of Health and Family Welfare (MOHFW)
36 Roxana QuaderAdditional Secretary (SUN focal point)
Health Services Division (HSD), Ministry of Health and Family Welfare (MOHFW)
37 Ruhul Amin Talukder Joint Secretary Health Services Division (HSD), Ministry of Health and Family Welfare (MOHFW)
38 Dr Samir Kanti SarkerDirector IPHN and /Line Director NNS OP
Institute of Public Health Nutrition (IPHN)
39 Dr Md M Islam BulbulDeputy Program Manager, National Nutrition Services
Institute of Public Health Nutrition (IPHN)
40 Maidur Rahman Project Director
Integrated Agricultural Approach for Ensuring Nutrition and Food Security Project (DAE Phase)
41AKM Aftab Hossain Pramanik
Joint Secretary (Water Supply)Local Government Division, MOLGDR&C
42 Saifur Rahman Assistant ChiefLocal Government Division, MOLGDR&C
43 Shahidul Islam Deputy SecretaryLocal Government Division, MOLGDR&C
44 Anwar Hossain Joint chief, Planning Wing Ministry of Agriculture
45Md. Fahim Afsan Choudhury
Assistant Chief, Planning Wing Ministry of Agriculture
46 Md.Amirul Islam Deputy Secretary Ministry of Agriculture
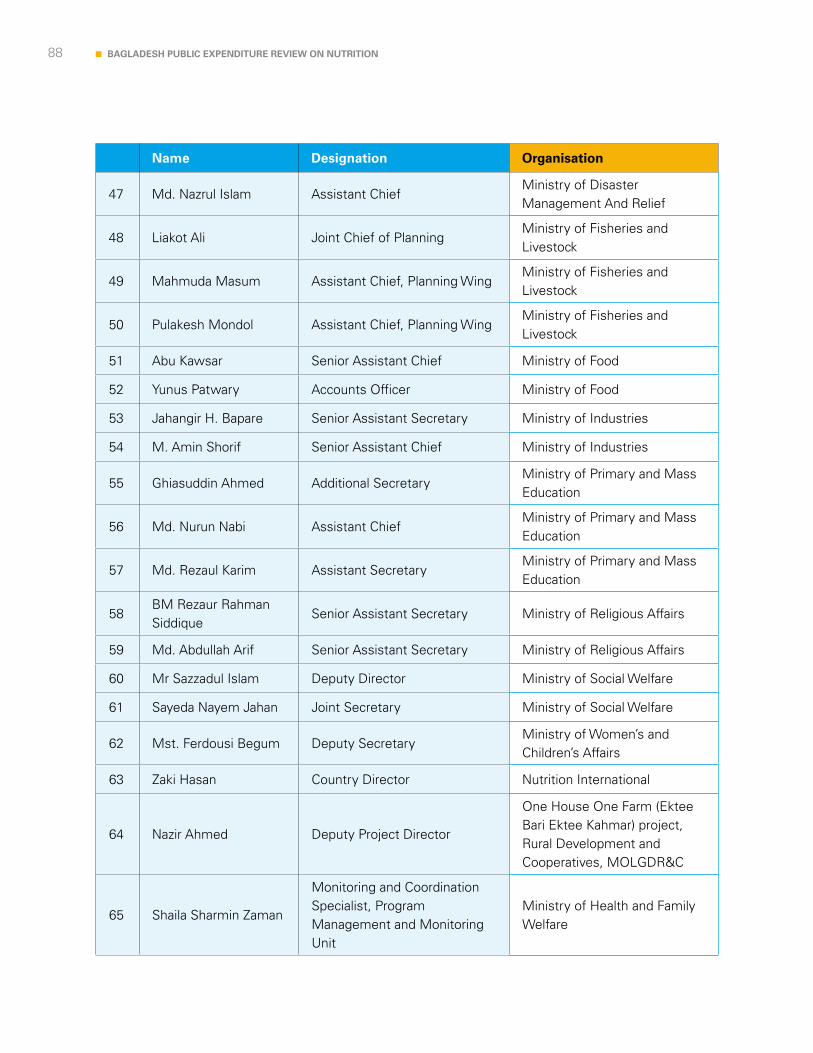
88 BAGLADESH PUBLIC EXPENDITURE REVIEW ON NUTRITION
Name Designation Organisation
47 Md. Nazrul Islam Assistant ChiefMinistry of Disaster Management And Relief
48 Liakot Ali Joint Chief of Planning Ministry of Fisheries and Livestock
49 Mahmuda Masum Assistant Chief, Planning WingMinistry of Fisheries and Livestock
50 Pulakesh Mondol Assistant Chief, Planning WingMinistry of Fisheries and Livestock
51 Abu Kawsar Senior Assistant Chief Ministry of Food
52 Yunus Patwary Accounts Officer Ministry of Food
53 Jahangir H. Bapare Senior Assistant Secretary Ministry of Industries
54 M. Amin Shorif Senior Assistant Chief Ministry of Industries
55 Ghiasuddin Ahmed Additional SecretaryMinistry of Primary and Mass Education
56 Md. Nurun Nabi Assistant ChiefMinistry of Primary and Mass Education
57 Md. Rezaul Karim Assistant SecretaryMinistry of Primary and Mass Education
58BM Rezaur Rahman Siddique
Senior Assistant Secretary Ministry of Religious Affairs
59 Md. Abdullah Arif Senior Assistant Secretary Ministry of Religious Affairs
60 Mr Sazzadul Islam Deputy Director Ministry of Social Welfare
61 Sayeda Nayem Jahan Joint Secretary Ministry of Social Welfare
62 Mst. Ferdousi Begum Deputy SecretaryMinistry of Women’s and Children’s Affairs
63 Zaki Hasan Country Director Nutrition International
64 Nazir Ahmed Deputy Project Director
One House One Farm (Ektee Bari Ektee Kahmar) project, Rural Development and Cooperatives, MOLGDR&C
65 Shaila Sharmin Zaman
Monitoring and Coordination Specialist, Program Management and Monitoring Unit
Ministry of Health and Family Welfare
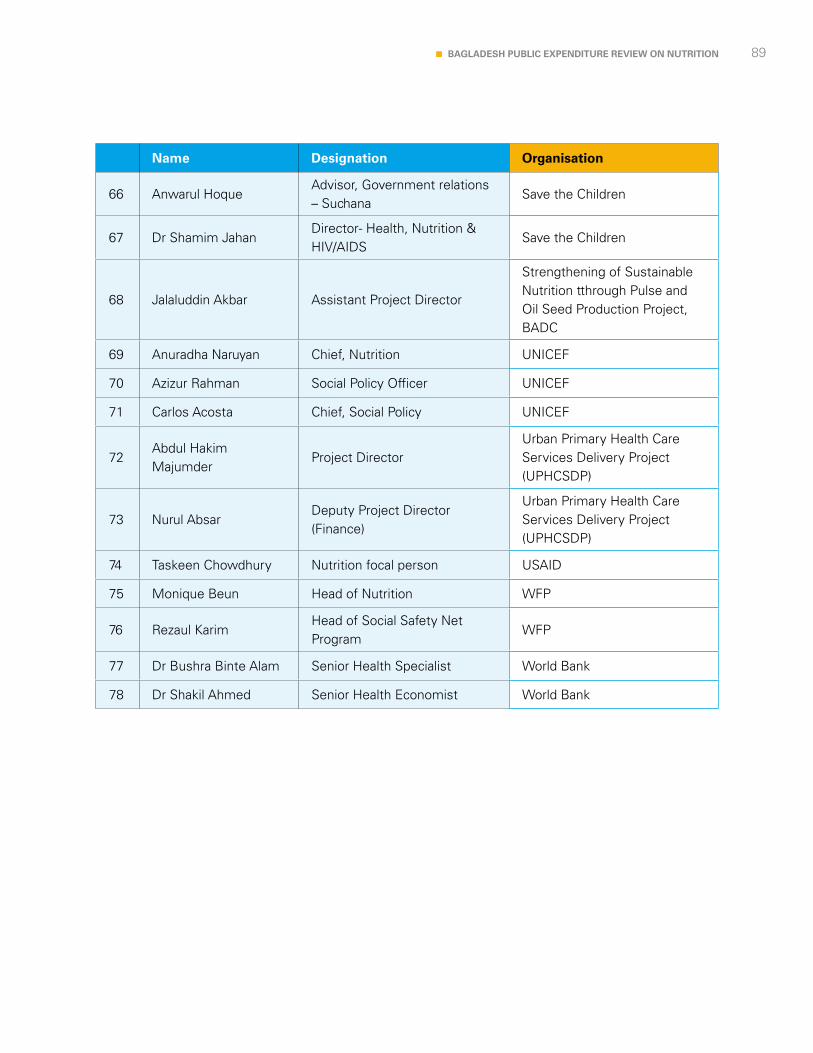
89BAGLADESH PUBLIC EXPENDITURE REVIEW ON NUTRITION
Name Designation Organisation
66 Anwarul Hoque Advisor, Government relations – Suchana
Save the Children
67 Dr Shamim Jahan Director- Health, Nutrition & HIV/AIDS
Save the Children
68 Jalaluddin Akbar Assistant Project Director
Strengthening of Sustainable Nutrition tthrough Pulse and Oil Seed Production Project, BADC
69 Anuradha Naruyan Chief, Nutrition UNICEF
70 Azizur Rahman Social Policy Officer UNICEF
71 Carlos Acosta Chief, Social Policy UNICEF
72Abdul Hakim Majumder
Project DirectorUrban Primary Health Care Services Delivery Project (UPHCSDP)
73 Nurul AbsarDeputy Project Director (Finance)
Urban Primary Health Care Services Delivery Project (UPHCSDP)
74 Taskeen Chowdhury Nutrition focal person USAID
75 Monique Beun Head of Nutrition WFP
76 Rezaul KarimHead of Social Safety Net Program
WFP
77 Dr Bushra Binte Alam Senior Health Specialist World Bank
78 Dr Shakil Ahmed Senior Health Economist World Bank
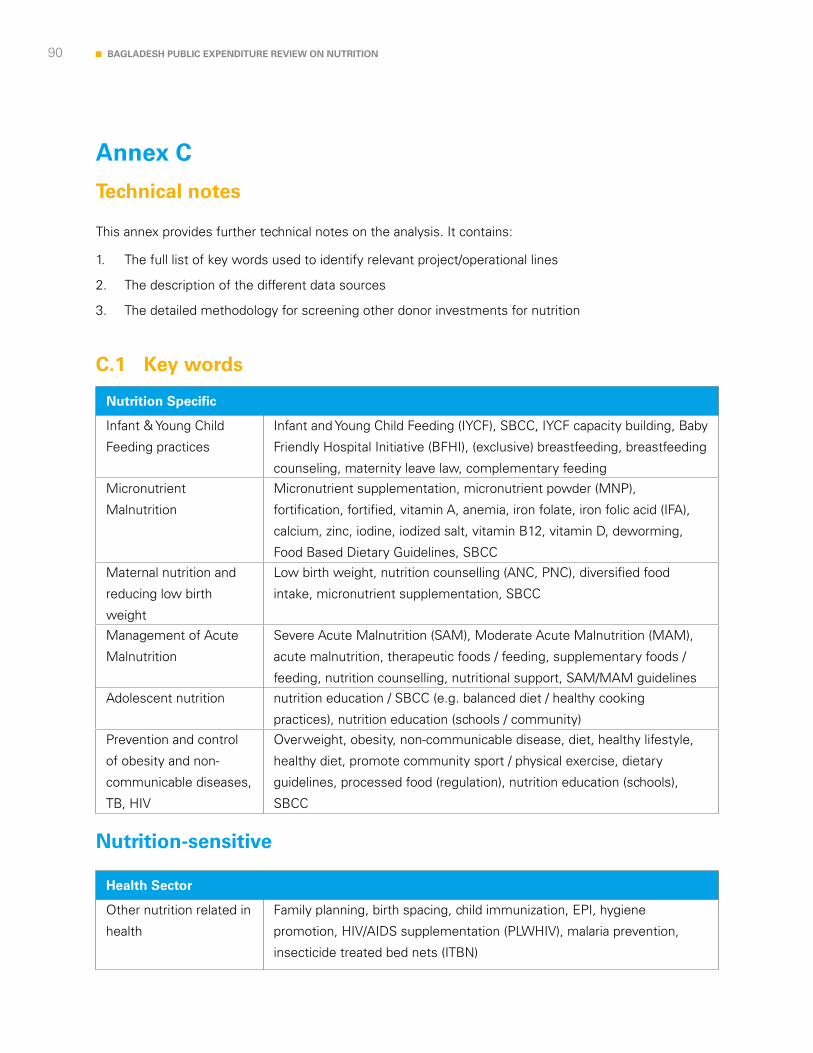
90 BAGLADESH PUBLIC EXPENDITURE REVIEW ON NUTRITION
Annex C
Technical notes
C.1 Key words
This annex provides further technical notes on the analysis. It contains:
1. The full list of key words used to identify relevant project/operational lines
2. The description of the different data sources
3. The detailed methodology for screening other donor investments for nutrition
Nutrition Specific
Infant & Young Child
Feeding practices
Infant and Young Child Feeding (IYCF), SBCC, IYCF capacity building, Baby
Friendly Hospital Initiative (BFHI), (exclusive) breastfeeding, breastfeeding
counseling, maternity leave law, complementary feeding
Micronutrient
Malnutrition
Micronutrient supplementation, micronutrient powder (MNP),
fortification, fortified, vitamin A, anemia, iron folate, iron folic acid (IFA),
calcium, zinc, iodine, iodized salt, vitamin B12, vitamin D, deworming,
Food Based Dietary Guidelines, SBCC
Maternal nutrition and
reducing low birth
weight
Low birth weight, nutrition counselling (ANC, PNC), diversified food
intake, micronutrient supplementation, SBCC
Management of Acute
Malnutrition
Severe Acute Malnutrition (SAM), Moderate Acute Malnutrition (MAM),
acute malnutrition, therapeutic foods / feeding, supplementary foods /
feeding, nutrition counselling, nutritional support, SAM/MAM guidelines
Adolescent nutrition nutrition education / SBCC (e.g. balanced diet / healthy cooking
practices), nutrition education (schools / community)
Prevention and control
of obesity and non-
communicable diseases,
TB, HIV
Overweight, obesity, non-communicable disease, diet, healthy lifestyle,
healthy diet, promote community sport / physical exercise, dietary
guidelines, processed food (regulation), nutrition education (schools),
SBCC
Nutrition-sensitive
Health Sector
Other nutrition related in
health
Family planning, birth spacing, child immunization, EPI, hygiene
promotion, HIV/AIDS supplementation (PLWHIV), malaria prevention,
insecticide treated bed nets (ITBN)
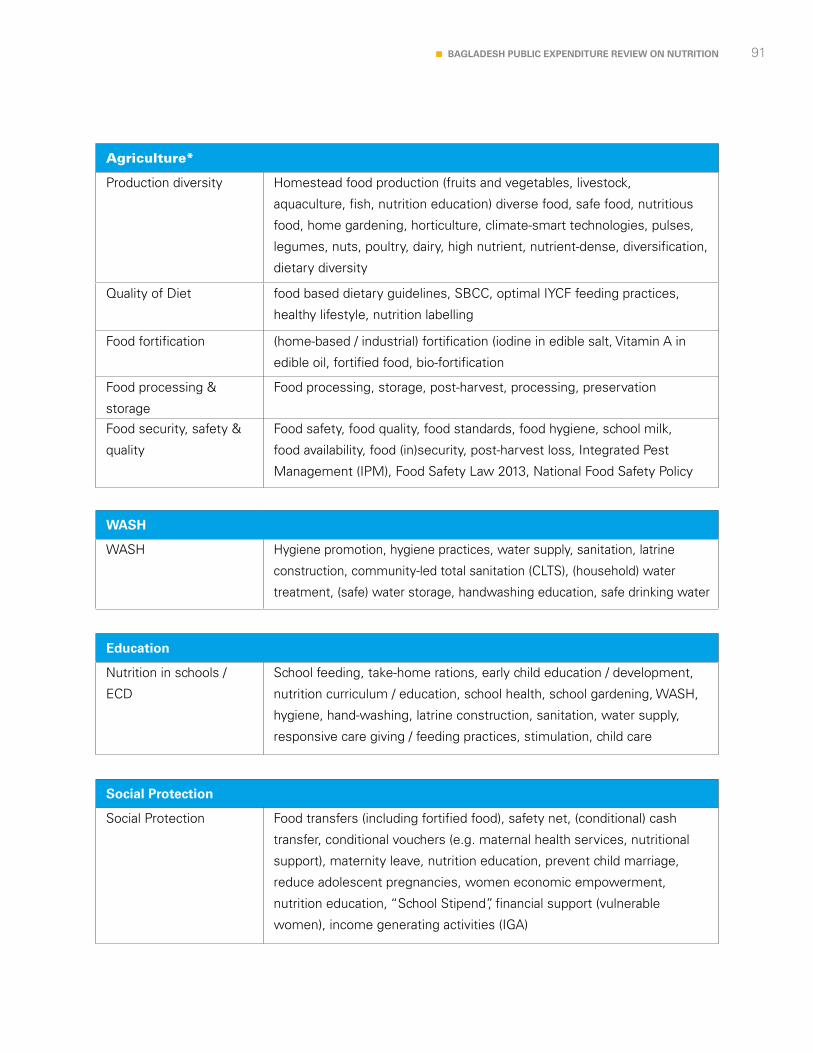
91BAGLADESH PUBLIC EXPENDITURE REVIEW ON NUTRITION
Agriculture*
Production diversity Homestead food production (fruits and vegetables, livestock,
aquaculture, fish, nutrition education) diverse food, safe food, nutritious
food, home gardening, horticulture, climate-smart technologies, pulses,
legumes, nuts, poultry, dairy, high nutrient, nutrient-dense, diversification,
dietary diversity
Quality of Diet food based dietary guidelines, SBCC, optimal IYCF feeding practices,
healthy lifestyle, nutrition labelling
Food fortification (home-based / industrial) fortification (iodine in edible salt, Vitamin A in
edible oil, fortified food, bio-fortification
Food processing &
storage
Food processing, storage, post-harvest, processing, preservation
Food security, safety &
quality
Food safety, food quality, food standards, food hygiene, school milk,
food availability, food (in)security, post-harvest loss, Integrated Pest
Management (IPM), Food Safety Law 2013, National Food Safety Policy
WASH
WASH Hygiene promotion, hygiene practices, water supply, sanitation, latrine
construction, community-led total sanitation (CLTS), (household) water
treatment, (safe) water storage, handwashing education, safe drinking water
Education
Nutrition in schools /
ECD
School feeding, take-home rations, early child education / development,
nutrition curriculum / education, school health, school gardening, WASH,
hygiene, hand-washing, latrine construction, sanitation, water supply,
responsive care giving / feeding practices, stimulation, child care
Social Protection
Social Protection Food transfers (including fortified food), safety net, (conditional) cash
transfer, conditional vouchers (e.g. maternal health services, nutritional
support), maternity leave, nutrition education, prevent child marriage,
reduce adolescent pregnancies, women economic empowerment,
nutrition education, “School Stipend”, financial support (vulnerable
women), income generating activities (IGA)
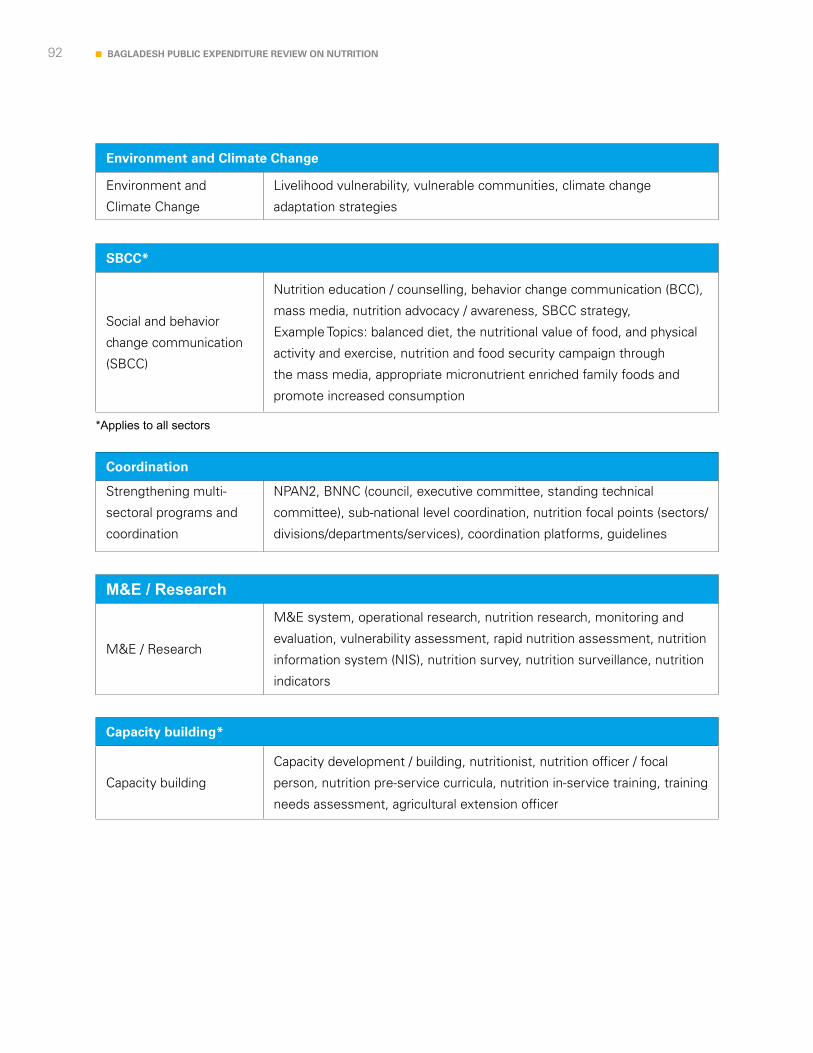
92 BAGLADESH PUBLIC EXPENDITURE REVIEW ON NUTRITION
Environment and Climate Change
Environment and
Climate Change
Livelihood vulnerability, vulnerable communities, climate change
adaptation strategies
SBCC*
Social and behavior
change communication
(SBCC)
Nutrition education / counselling, behavior change communication (BCC),
mass media, nutrition advocacy / awareness, SBCC strategy,
Example Topics: balanced diet, the nutritional value of food, and physical
activity and exercise, nutrition and food security campaign through
the mass media, appropriate micronutrient enriched family foods and
promote increased consumption
*Applies to all sectors
Coordination
Strengthening multi-
sectoral programs and
coordination
NPAN2, BNNC (council, executive committee, standing technical
committee), sub-national level coordination, nutrition focal points (sectors/
divisions/departments/services), coordination platforms, guidelines
M&E / Research
M&E / Research
M&E system, operational research, nutrition research, monitoring and
evaluation, vulnerability assessment, rapid nutrition assessment, nutrition
information system (NIS), nutrition survey, nutrition surveillance, nutrition
indicators
Capacity building*
Capacity building
Capacity development / building, nutritionist, nutrition officer / focal
person, nutrition pre-service curricula, nutrition in-service training, training
needs assessment, agricultural extension officer
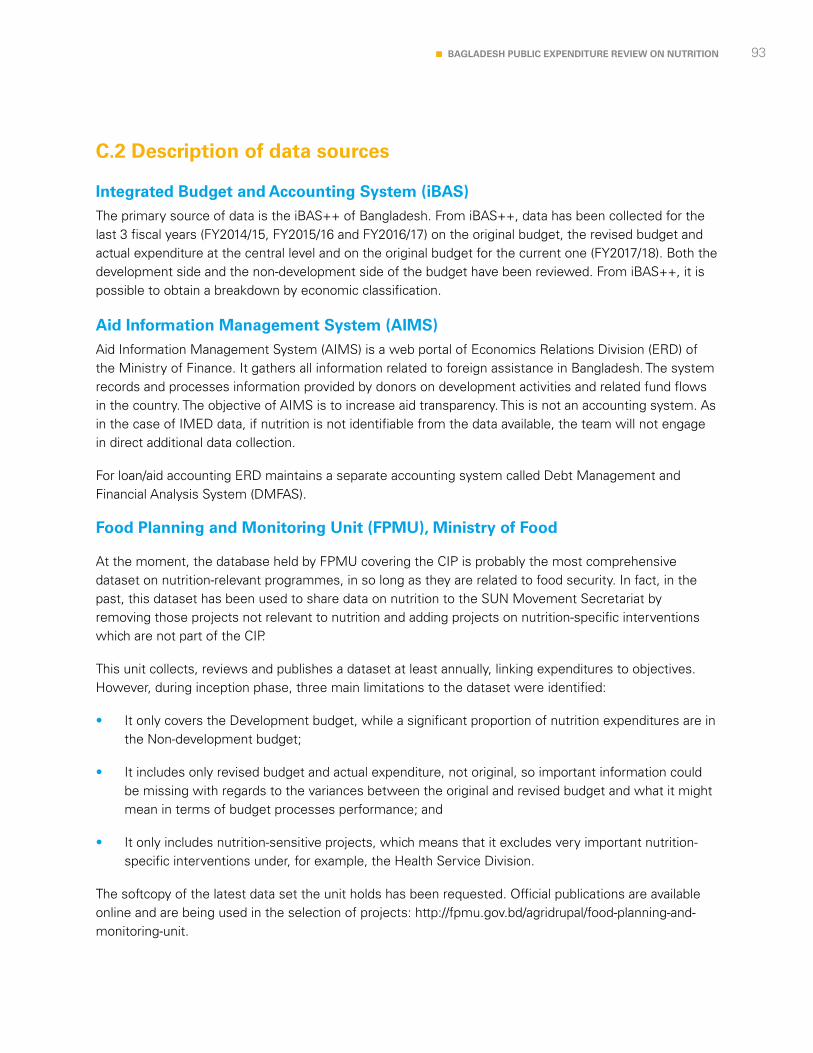
93BAGLADESH PUBLIC EXPENDITURE REVIEW ON NUTRITION
C.2 Description of data sources
Integrated Budget and Accounting System (iBAS)The primary source of data is the iBAS++ of Bangladesh. From iBAS++, data has been collected for the last 3 fiscal years (FY2014/15, FY2015/16 and FY2016/17) on the original budget, the revised budget and actual expenditure at the central level and on the original budget for the current one (FY2017/18). Both the development side and the non-development side of the budget have been reviewed. From iBAS++, it is possible to obtain a breakdown by economic classification.
Aid Information Management System (AIMS) Aid Information Management System (AIMS) is a web portal of Economics Relations Division (ERD) of the Ministry of Finance. It gathers all information related to foreign assistance in Bangladesh. The system records and processes information provided by donors on development activities and related fund flows in the country. The objective of AIMS is to increase aid transparency. This is not an accounting system. As in the case of IMED data, if nutrition is not identifiable from the data available, the team will not engage in direct additional data collection.
For loan/aid accounting ERD maintains a separate accounting system called Debt Management and Financial Analysis System (DMFAS).
Food Planning and Monitoring Unit (FPMU), Ministry of Food
At the moment, the database held by FPMU covering the CIP is probably the most comprehensive dataset on nutrition-relevant programmes, in so long as they are related to food security. In fact, in the past, this dataset has been used to share data on nutrition to the SUN Movement Secretariat by removing those projects not relevant to nutrition and adding projects on nutrition-specific interventions which are not part of the CIP.
This unit collects, reviews and publishes a dataset at least annually, linking expenditures to objectives. However, during inception phase, three main limitations to the dataset were identified:
• It only covers the Development budget, while a significant proportion of nutrition expenditures are in the Non-development budget;
• It includes only revised budget and actual expenditure, not original, so important information could be missing with regards to the variances between the original and revised budget and what it might mean in terms of budget processes performance; and
• It only includes nutrition-sensitive projects, which means that it excludes very important nutrition-specific interventions under, for example, the Health Service Division.
The softcopy of the latest data set the unit holds has been requested. Official publications are available online and are being used in the selection of projects: http://fpmu.gov.bd/agridrupal/food-planning-and-monitoring-unit.

94 BAGLADESH PUBLIC EXPENDITURE REVIEW ON NUTRITION
The existence of this database facilitates significantly the task of selecting development projects (Step 1: Identification) and will be used to triangulate the data captured in iBAS++ and collected from IMED.
OECD-DAC Creditor Reporting System (CRS)In an ideal world, the team would want to match the data available in the international OECD-DAC CRS which collects data on donor flows worldwide with the data available at the country level on donor funded projects. An initial review of the data from the Creditor Reporting System has found that this is unlikely to provide additional information. However, this option will be explored further to triangulate it with other data sources on donor funded projects.
C.3 Detailed methodology to screen other donor investments for nutrition
The process to select other donor investments for nutrition involved a number of steps.
Figure 17Screening of potential other donor investments for nutrition
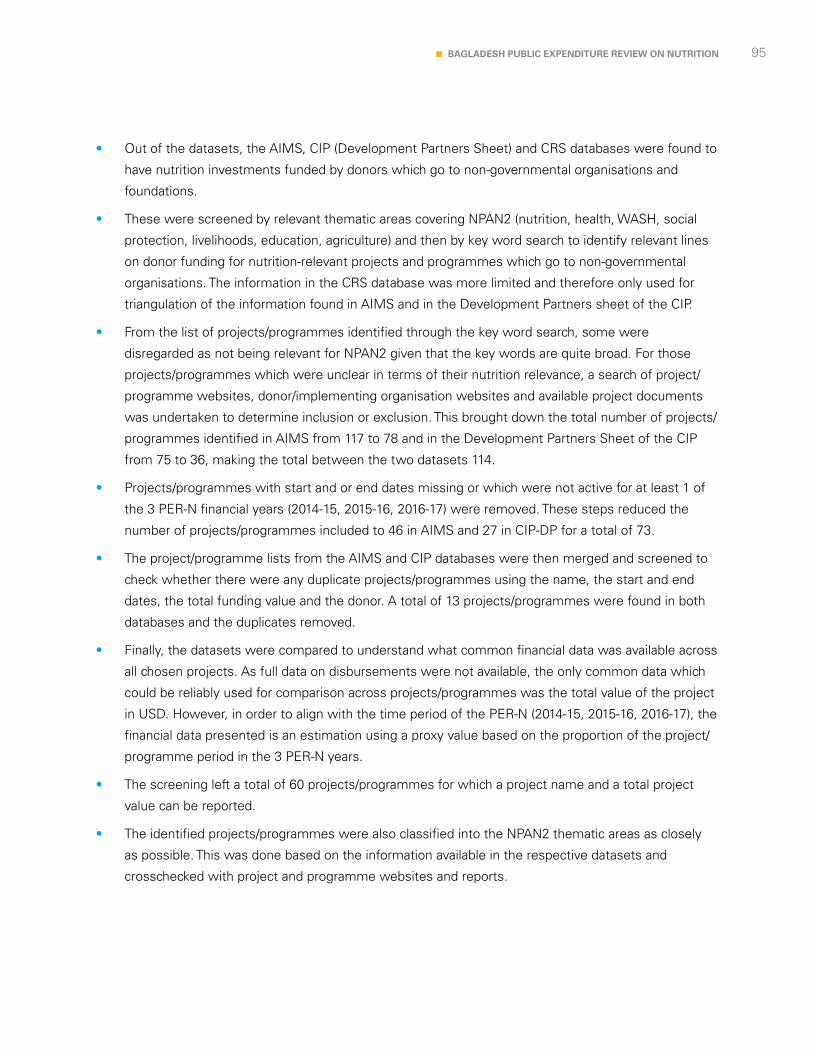
95BAGLADESH PUBLIC EXPENDITURE REVIEW ON NUTRITION
• Out of the datasets, the AIMS, CIP (Development Partners Sheet) and CRS databases were found to
have nutrition investments funded by donors which go to non-governmental organisations and
foundations.
• These were screened by relevant thematic areas covering NPAN2 (nutrition, health, WASH, social
protection, livelihoods, education, agriculture) and then by key word search to identify relevant lines
on donor funding for nutrition-relevant projects and programmes which go to non-governmental
organisations. The information in the CRS database was more limited and therefore only used for
triangulation of the information found in AIMS and in the Development Partners sheet of the CIP.
• From the list of projects/programmes identified through the key word search, some were
disregarded as not being relevant for NPAN2 given that the key words are quite broad. For those
projects/programmes which were unclear in terms of their nutrition relevance, a search of project/
programme websites, donor/implementing organisation websites and available project documents
was undertaken to determine inclusion or exclusion. This brought down the total number of projects/
programmes identified in AIMS from 117 to 78 and in the Development Partners Sheet of the CIP
from 75 to 36, making the total between the two datasets 114.
• Projects/programmes with start and or end dates missing or which were not active for at least 1 of
the 3 PER-N financial years (2014-15, 2015-16, 2016-17) were removed. These steps reduced the
number of projects/programmes included to 46 in AIMS and 27 in CIP-DP for a total of 73.
• The project/programme lists from the AIMS and CIP databases were then merged and screened to
check whether there were any duplicate projects/programmes using the name, the start and end
dates, the total funding value and the donor. A total of 13 projects/programmes were found in both
databases and the duplicates removed.
• Finally, the datasets were compared to understand what common financial data was available across
all chosen projects. As full data on disbursements were not available, the only common data which
could be reliably used for comparison across projects/programmes was the total value of the project
in USD. However, in order to align with the time period of the PER-N (2014-15, 2015-16, 2016-17), the
financial data presented is an estimation using a proxy value based on the proportion of the project/
programme period in the 3 PER-N years.
• The screening left a total of 60 projects/programmes for which a project name and a total project
value can be reported.
• The identified projects/programmes were also classified into the NPAN2 thematic areas as closely
as possible. This was done based on the information available in the respective datasets and
crosschecked with project and programme websites and reports.
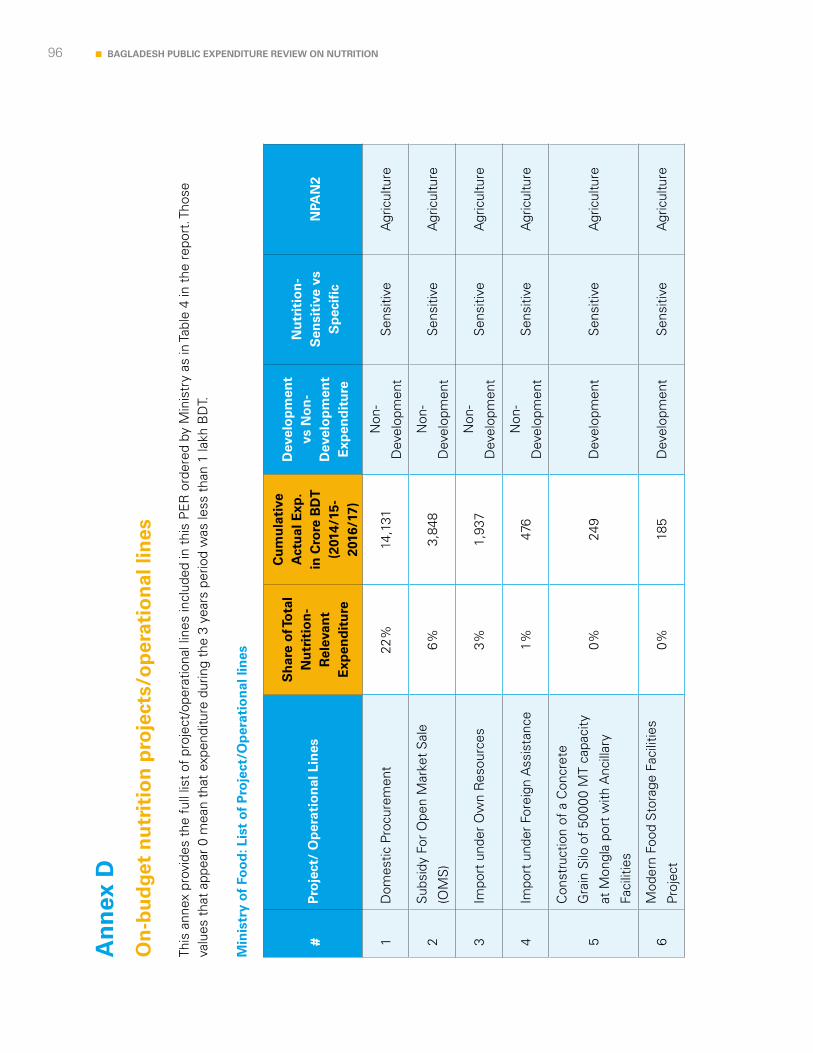
96 BAGLADESH PUBLIC EXPENDITURE REVIEW ON NUTRITION
An
nex
D
On
-bu
dge
t n
utr
itio
n p
roje
cts/
op
erat
ion
al li
nes
This
ann
ex p
rovi
des
the
full
list
of p
roje
ct/o
pera
tiona
l lin
es in
clud
ed in
thi
s P
ER
ord
ered
by
Min
istr
y as
in T
able
4 in
the
rep
ort.
Tho
se
valu
es t
hat
appe
ar 0
mea
n th
at e
xpen
ditu
re d
urin
g th
e 3
year
s pe
riod
was
less
tha
n 1
lakh
BD
T.
Min
istr
y o
f Fo
od
: Lis
t o
f P
roje
ct/O
per
atio
nal
lin
es
#P
roje
ct/
Op
erat
ion
al L
ines
Sh
are
of T
ota
l N
utr
itio
n-
Rel
evan
t E
xpen
dit
ure
Cu
mu
lati
ve
Act
ual
Exp
. in
Cro
re B
DT
(2
014/
15-
2016
/17)
Dev
elo
pm
ent
vs N
on
-D
evel
op
men
t E
xpen
dit
ure
Nu
trit
ion
-S
ensi
tive
vs
Sp
ecif
icN
PAN
2
1D
omes
tic P
rocu
rem
ent
22%
14,1
31N
on-
Dev
elop
men
tS
ensi
tive
Agr
icul
ture
2S
ubsi
dy F
or O
pen
Mar
ket
Sal
e
(OM
S)
6%3,
848
Non
-
Dev
elop
men
tS
ensi
tive
Agr
icul
ture
3Im
port
und
er O
wn
Res
ourc
es3%
1,93
7N
on-
Dev
elop
men
tS
ensi
tive
Agr
icul
ture
4Im
port
und
er F
orei
gn A
ssis
tanc
e1%
476
Non
-
Dev
elop
men
tS
ensi
tive
Agr
icul
ture
5
Con
stru
ctio
n of
a C
oncr
ete
Gra
in S
ilo o
f 50
000
MT
capa
city
at M
ongl
a po
rt w
ith A
ncill
ary
Faci
litie
s
0%24
9D
evel
opm
ent
Sen
sitiv
eA
gric
ultu
re
6M
oder
n Fo
od S
tora
ge F
acili
ties
Proj
ect
0%18
5D
evel
opm
ent
Sen
sitiv
eA
gric
ultu
re

97BAGLADESH PUBLIC EXPENDITURE REVIEW ON NUTRITION
#P
roje
ct/
Op
erat
ion
al L
ines
Sh
are
of T
ota
l N
utr
itio
n-
Rel
evan
t E
xpen
dit
ure
Cu
mu
lati
ve
Act
ual
Exp
. in
Cro
re B
DT
(2
014/
15-
2016
/17)
Dev
elo
pm
ent
vs N
on
-D
evel
op
men
t E
xpen
dit
ure
Nu
trit
ion
-S
ensi
tive
vs
Sp
ecif
icN
PAN
2
7
Con
stru
ctio
n of
Mul
tisto
ried
War
ehou
se a
t S
anta
har
grai
n S
ilo,
Bog
ra (2
5,00
0 M
.T.)
0%13
0D
evel
opm
ent
Sen
sitiv
eA
gric
ultu
re
8C
onst
ruct
ion
of 1
.05
lakh
M.T
Cap
acity
new
food
god
owns
0%75
Dev
elop
men
tS
ensi
tive
Agr
icul
ture
9S
ilo0%
70N
on-
Dev
elop
men
tS
ensi
tive
Agr
icul
ture
10C
ontr
olle
r of
Mov
emen
t &
Sto
rage
0%51
Non
-
Dev
elop
men
tS
ensi
tive
Agr
icul
ture
11B
angl
ades
h S
afe
Food
Aut
horit
y0%
20N
on-
Dev
elop
men
tS
ensi
tive
Agr
icul
ture
12In
stitu
tiona
lizat
ion
of F
ood
Saf
ety
in B
angl
ades
h fo
r S
afer
Foo
d0%
10D
evel
opm
ent
Sen
sitiv
eA
gric
ultu
re
13
Nat
iona
l Foo
d Po
licy
capa
city
stre
ngth
enin
g Pr
ojec
t (N
.F.P
.C.S
.P.)
Pha
se-2
0%7
Dev
elop
men
tS
ensi
tive
Agr
icul
ture
14G
over
nmen
t Fl
our
Mill
s0%
6N
on-
Dev
elop
men
tS
ensi
tive
Agr
icul
ture
15S
ecre
taria
t0%
307
Non
-
Dev
elop
men
tS
ensi
tive
Agr
icul
ture
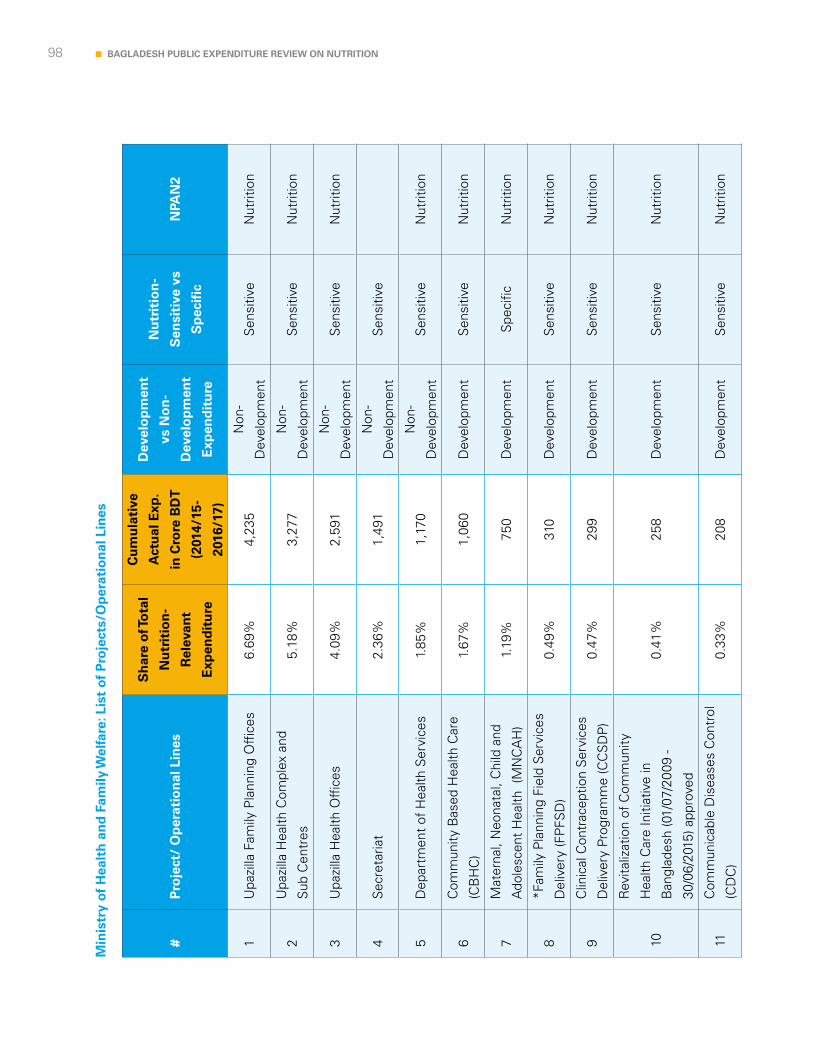
98 BAGLADESH PUBLIC EXPENDITURE REVIEW ON NUTRITION
Min
istr
y o
f H
ealt
h a
nd
Fam
ily W
elfa
re: L
ist
of
Pro
ject
s/O
per
atio
nal
Lin
es
#P
roje
ct/
Op
erat
ion
al L
ines
Sh
are
of T
ota
l
Nu
trit
ion
-
Rel
evan
t
Exp
end
itu
re
Cu
mu
lati
ve
Act
ual
Exp
.
in C
rore
BD
T
(201
4/15
-
2016
/17)
Dev
elo
pm
ent
vs N
on
-
Dev
elo
pm
ent
Exp
end
itu
re
Nu
trit
ion
-
Sen
siti
ve v
s
Sp
ecif
ic
NPA
N2
1U
pazi
lla F
amily
Pla
nnin
g O
ffic
es6.
69%
4,23
5N
on-
Dev
elop
men
tS
ensi
tive
Nut
ritio
n
2U
pazi
lla H
ealth
Com
plex
and
Sub
Cen
tres
5.18
%3,
277
Non
-
Dev
elop
men
tS
ensi
tive
Nut
ritio
n
3U
pazi
lla H
ealth
Off
ices
4.09
%2,
591
Non
-
Dev
elop
men
tS
ensi
tive
Nut
ritio
n
4S
ecre
taria
t2.
36%
1,49
1N
on-
Dev
elop
men
tS
ensi
tive
5D
epar
tmen
t of
Hea
lth S
ervi
ces
1.85
%1,
170
Non
-
Dev
elop
men
tS
ensi
tive
Nut
ritio
n
6C
omm
unity
Bas
ed H
ealth
Car
e
(CB
HC
)1.
67%
1,06
0D
evel
opm
ent
Sen
sitiv
eN
utrit
ion
7M
ater
nal,
Neo
nata
l, C
hild
and
Ado
lesc
ent
Hea
lth (
MN
CA
H)
1.19
%75
0D
evel
opm
ent
Spe
cific
Nut
ritio
n
8*F
amily
Pla
nnin
g Fi
eld
Ser
vice
s
Del
iver
y (F
PFS
D)
0.49
%31
0D
evel
opm
ent
Sen
sitiv
eN
utrit
ion
9C
linic
al C
ontr
acep
tion
Ser
vice
s
Del
iver
y Pr
ogra
mm
e (C
CS
DP
)0.
47%
299
Dev
elop
men
tS
ensi
tive
Nut
ritio
n
10
Rev
italiz
atio
n of
Com
mun
ity
Hea
lth C
are
Initi
ativ
e in
Ban
glad
esh
(01/
07/2
009
-
30/0
6/20
15) a
ppro
ved
0.41
%25
8D
evel
opm
ent
Sen
sitiv
eN
utrit
ion
11C
omm
unic
able
Dis
ease
s C
ontr
ol
(CD
C)
0.33
%20
8D
evel
opm
ent
Sen
sitiv
eN
utrit
ion
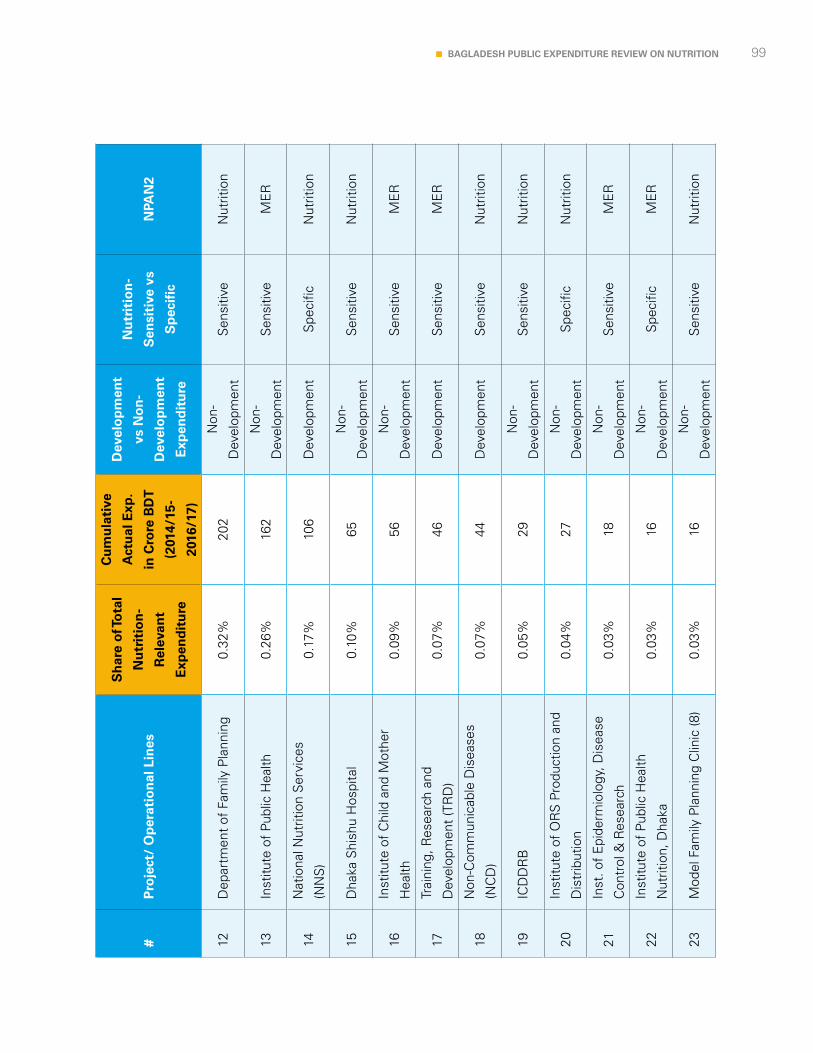
99BAGLADESH PUBLIC EXPENDITURE REVIEW ON NUTRITION
#P
roje
ct/
Op
erat
ion
al L
ines
Sh
are
of T
ota
l
Nu
trit
ion
-
Rel
evan
t
Exp
end
itu
re
Cu
mu
lati
ve
Act
ual
Exp
.
in C
rore
BD
T
(201
4/15
-
2016
/17)
Dev
elo
pm
ent
vs N
on
-
Dev
elo
pm
ent
Exp
end
itu
re
Nu
trit
ion
-
Sen
siti
ve v
s
Sp
ecif
ic
NPA
N2
12D
epar
tmen
t of
Fam
ily P
lann
ing
0.32
%20
2N
on-
Dev
elop
men
tS
ensi
tive
Nut
ritio
n
13In
stitu
te o
f Pu
blic
Hea
lth0.
26%
162
Non
-
Dev
elop
men
tS
ensi
tive
ME
R
14N
atio
nal N
utrit
ion
Ser
vice
s
(NN
S)
0.17
%10
6D
evel
opm
ent
Spe
cific
Nut
ritio
n
15D
haka
Shi
shu
Hos
pita
l0.
10%
65N
on-
Dev
elop
men
tS
ensi
tive
Nut
ritio
n
16In
stitu
te o
f C
hild
and
Mot
her
Hea
lth0.
09%
56N
on-
Dev
elop
men
tS
ensi
tive
ME
R
17Tr
aini
ng, R
esea
rch
and
Dev
elop
men
t (T
RD
)0.
07%
46D
evel
opm
ent
Sen
sitiv
eM
ER
18N
on-C
omm
unic
able
Dis
ease
s
(NC
D)
0.07
%44
Dev
elop
men
tS
ensi
tive
Nut
ritio
n
19IC
DD
RB
0.05
%29
Non
-
Dev
elop
men
tS
ensi
tive
Nut
ritio
n
20In
stitu
te o
f O
RS
Pro
duct
ion
and
Dis
trib
utio
n0.
04%
27N
on-
Dev
elop
men
tS
peci
ficN
utrit
ion
21In
st. o
f E
pide
rmio
logy
, Dis
ease
Con
trol
& R
esea
rch
0.03
%18
Non
-
Dev
elop
men
tS
ensi
tive
ME
R
22In
stitu
te o
f Pu
blic
Hea
lth
Nut
ritio
n, D
haka
0.03
%16
Non
-
Dev
elop
men
tS
peci
ficM
ER
23M
odel
Fam
ily P
lann
ing
Clin
ic (8
)0.
03%
16N
on-
Dev
elop
men
tS
ensi
tive
Nut
ritio
n
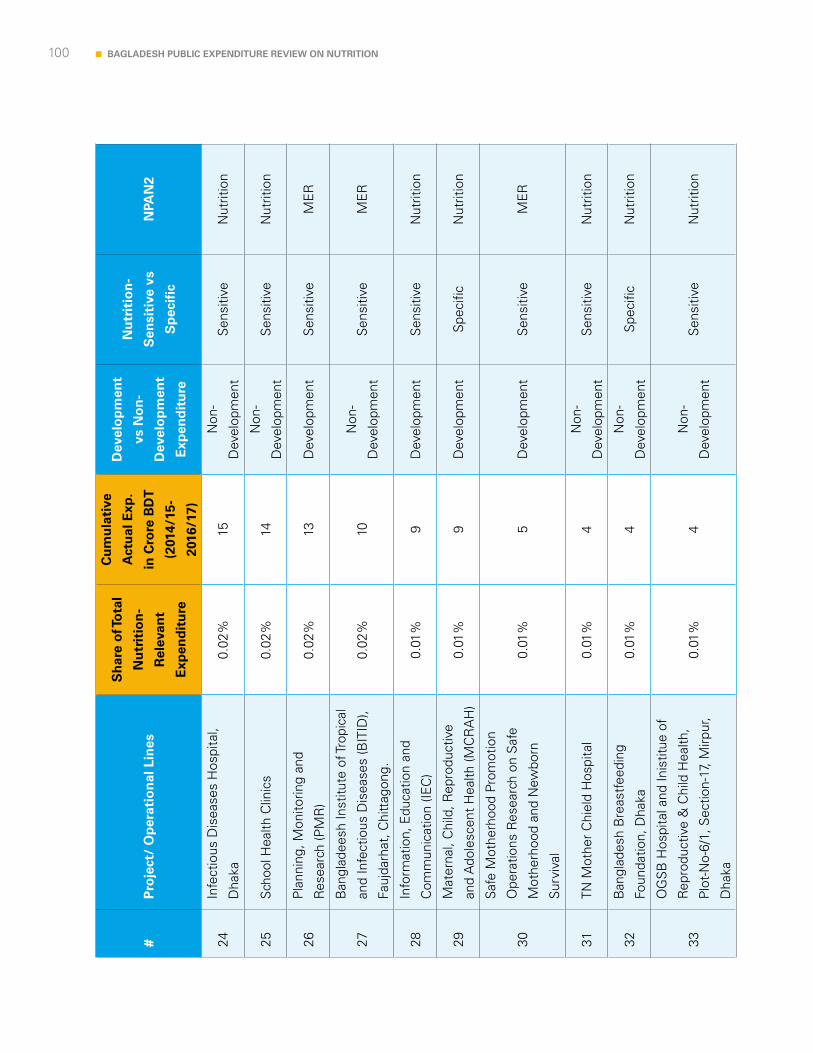
100 BAGLADESH PUBLIC EXPENDITURE REVIEW ON NUTRITION
#P
roje
ct/
Op
erat
ion
al L
ines
Sh
are
of T
ota
l
Nu
trit
ion
-
Rel
evan
t
Exp
end
itu
re
Cu
mu
lati
ve
Act
ual
Exp
.
in C
rore
BD
T
(201
4/15
-
2016
/17)
Dev
elo
pm
ent
vs N
on
-
Dev
elo
pm
ent
Exp
end
itu
re
Nu
trit
ion
-
Sen
siti
ve v
s
Sp
ecif
ic
NPA
N2
24In
fect
ious
Dis
ease
s H
ospi
tal,
Dha
ka0.
02%
15N
on-
Dev
elop
men
tS
ensi
tive
Nut
ritio
n
25S
choo
l Hea
lth C
linic
s0.
02%
14N
on-
Dev
elop
men
tS
ensi
tive
Nut
ritio
n
26P
lann
ing,
Mon
itorin
g an
d
Res
earc
h (P
MR
)0.
02%
13D
evel
opm
ent
Sen
sitiv
eM
ER
27
Ban
glad
eesh
Inst
itute
of T
ropi
cal
and
Infe
ctio
us D
isea
ses
(BIT
ID),
Fauj
darh
at, C
hitt
agon
g.
0.02
%10
Non
-
Dev
elop
men
tS
ensi
tive
ME
R
28In
form
atio
n, E
duca
tion
and
Com
mun
icat
ion
(IEC
)0.
01%
9D
evel
opm
ent
Sen
sitiv
eN
utrit
ion
29M
ater
nal,
Chi
ld, R
epro
duct
ive
and
Ado
lesc
ent
Hea
lth (M
CR
AH
)0.
01%
9D
evel
opm
ent
Spe
cific
Nut
ritio
n
30
Saf
e M
othe
rhoo
d Pr
omot
ion
Ope
ratio
ns R
esea
rch
on S
afe
Mot
herh
ood
and
New
born
Sur
viva
l
0.01
%5
Dev
elop
men
tS
ensi
tive
ME
R
31TN
Mot
her
Chi
eld
Hos
pita
l0.
01%
4N
on-
Dev
elop
men
tS
ensi
tive
Nut
ritio
n
32B
angl
ades
h B
reas
tfee
ding
Foun
datio
n, D
haka
0.01
%4
Non
-
Dev
elop
men
tS
peci
ficN
utrit
ion
33
OG
SB
Hos
pita
l and
Inis
titue
of
Rep
rodu
ctiv
e &
Chi
ld H
ealth
,
Plo
t-N
o-6/
1, S
ectio
n-17
, Mirp
ur,
Dha
ka
0.01
%4
Non
-
Dev
elop
men
tS
ensi
tive
Nut
ritio
n

101BAGLADESH PUBLIC EXPENDITURE REVIEW ON NUTRITION
#P
roje
ct/
Op
erat
ion
al L
ines
Sh
are
of T
ota
l
Nu
trit
ion
-
Rel
evan
t
Exp
end
itu
re
Cu
mu
lati
ve
Act
ual
Exp
.
in C
rore
BD
T
(201
4/15
-
2016
/17)
Dev
elo
pm
ent
vs N
on
-
Dev
elo
pm
ent
Exp
end
itu
re
Nu
trit
ion
-
Sen
siti
ve v
s
Sp
ecif
ic
NPA
N2
34K
huln
a S
hish
u ho
spita
l0.
00%
3N
on-
Dev
elop
men
tS
ensi
tive
Nut
ritio
n
35S
kin
and
Soc
ial H
ygie
ne C
entr
e ,
Chi
ttag
ong
0.00
%3
Non
-
Dev
elop
men
tS
ensi
tive
Nut
ritio
n
36B
angl
ades
h Fa
mily
Pla
nnin
g
Ass
ocia
tion
0.00
%3
Non
-
Dev
elop
men
tS
ensi
tive
Nut
ritio
n
37S
hish
u S
asth
ya F
ound
atio
n,
Ban
glad
esh
0.00
%2
Non
-
Dev
elop
men
tS
ensi
tive
Nut
ritio
n
38N
atio
nal N
utrit
ion
Prog
ram
me
(NN
P)
0.00
%2
Dev
elop
men
tS
peci
ficN
utrit
ion
39B
angl
ades
h N
atio
nal N
utrit
ion
Cou
ncil
0.00
%2
Non
-
Dev
elop
men
tS
peci
ficN
utrit
ion
40Li
fe S
tyle
and
Hea
lth E
duca
tion
& P
rom
otio
n (L
HE
P)
0.00
%1
Dev
elop
men
tS
ensi
tive
Nut
ritio
n
41D
r. Za
hed
Shi
shu
Hos
pita
l,
Farid
pur
0.00
%1
Non
-
Dev
elop
men
tS
ensi
tive
Nut
ritio
n
42B
angl
ades
h C
hild
Hea
lth
Inst
itute
0.00
%1
Non
-
Dev
elop
men
tS
ensi
tive
ME
R
43
* E
xten
sion
of
Dha
ka S
hish
u
(Chi
ldre
n) H
ospi
tal (
01/0
7/20
10-
30/0
6/20
14)
0.00
%0
Dev
elop
men
tS
ensi
tive
Nut
ritio
n
44M
eter
nity
Cen
ter,
Mot
ijhee
l0.
00%
0N
on-
Dev
elop
men
tS
ensi
tive
Nut
ritio
n
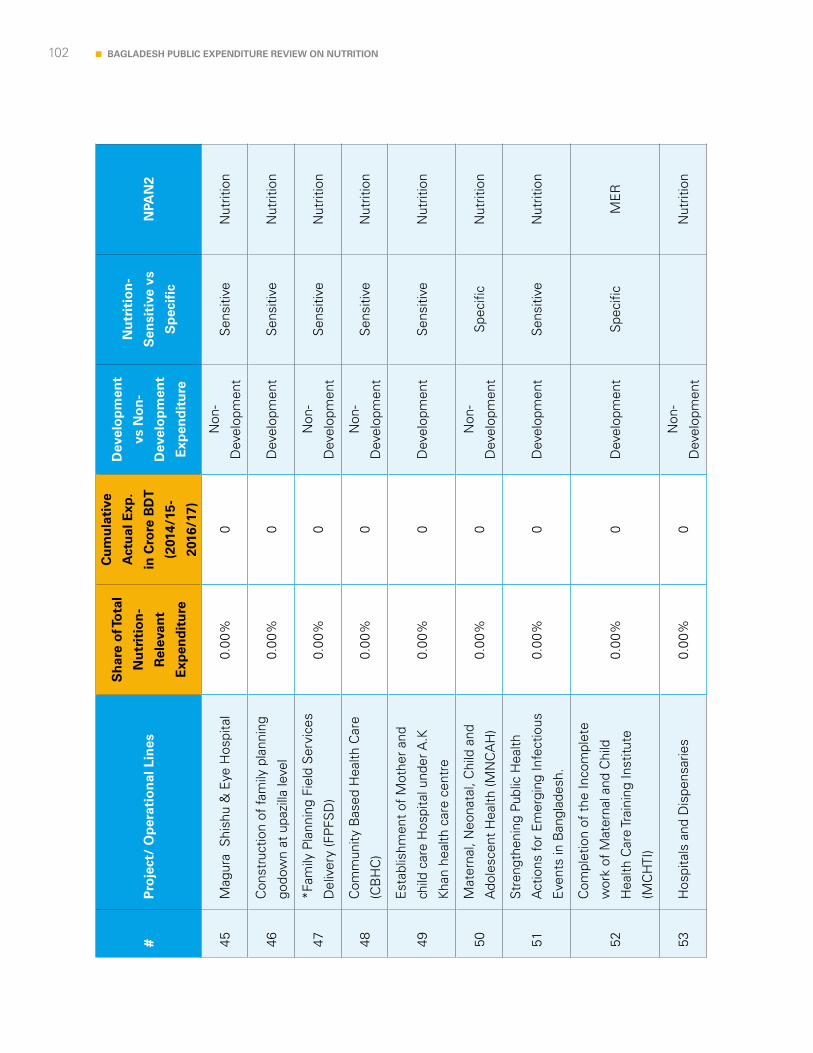
102 BAGLADESH PUBLIC EXPENDITURE REVIEW ON NUTRITION
#P
roje
ct/
Op
erat
ion
al L
ines
Sh
are
of T
ota
l
Nu
trit
ion
-
Rel
evan
t
Exp
end
itu
re
Cu
mu
lati
ve
Act
ual
Exp
.
in C
rore
BD
T
(201
4/15
-
2016
/17)
Dev
elo
pm
ent
vs N
on
-
Dev
elo
pm
ent
Exp
end
itu
re
Nu
trit
ion
-
Sen
siti
ve v
s
Sp
ecif
ic
NPA
N2
45M
agur
a S
hish
u &
Eye
Hos
pita
l0.
00%
0N
on-
Dev
elop
men
tS
ensi
tive
Nut
ritio
n
46C
onst
ruct
ion
of fa
mily
pla
nnin
g
godo
wn
at u
pazi
lla le
vel
0.00
%0
Dev
elop
men
tS
ensi
tive
Nut
ritio
n
47*F
amily
Pla
nnin
g Fi
eld
Ser
vice
s
Del
iver
y (F
PFS
D)
0.00
%0
Non
-
Dev
elop
men
tS
ensi
tive
Nut
ritio
n
48C
omm
unity
Bas
ed H
ealth
Car
e
(CB
HC
)0.
00%
0N
on-
Dev
elop
men
tS
ensi
tive
Nut
ritio
n
49
Est
ablis
hmen
t of
Mot
her
and
child
car
e H
ospi
tal u
nder
A.K
Kha
n he
alth
car
e ce
ntre
0.00
%0
Dev
elop
men
tS
ensi
tive
Nut
ritio
n
50M
ater
nal,
Neo
nata
l, C
hild
and
Ado
lesc
ent
Hea
lth (M
NC
AH
)0.
00%
0N
on-
Dev
elop
men
tS
peci
ficN
utrit
ion
51
Str
engt
heni
ng P
ublic
Hea
lth
Act
ions
for
Em
ergi
ng In
fect
ious
Eve
nts
in B
angl
ades
h.
0.00
%0
Dev
elop
men
tS
ensi
tive
Nut
ritio
n
52
Com
plet
ion
of t
he In
com
plet
e
wor
k of
Mat
erna
l and
Chi
ld
Hea
lth C
are
Trai
ning
Inst
itute
(MC
HTI
)
0.00
%0
Dev
elop
men
tS
peci
ficM
ER
53H
ospi
tals
and
Dis
pens
arie
s0.
00%
0N
on-
Dev
elop
men
tN
utrit
ion
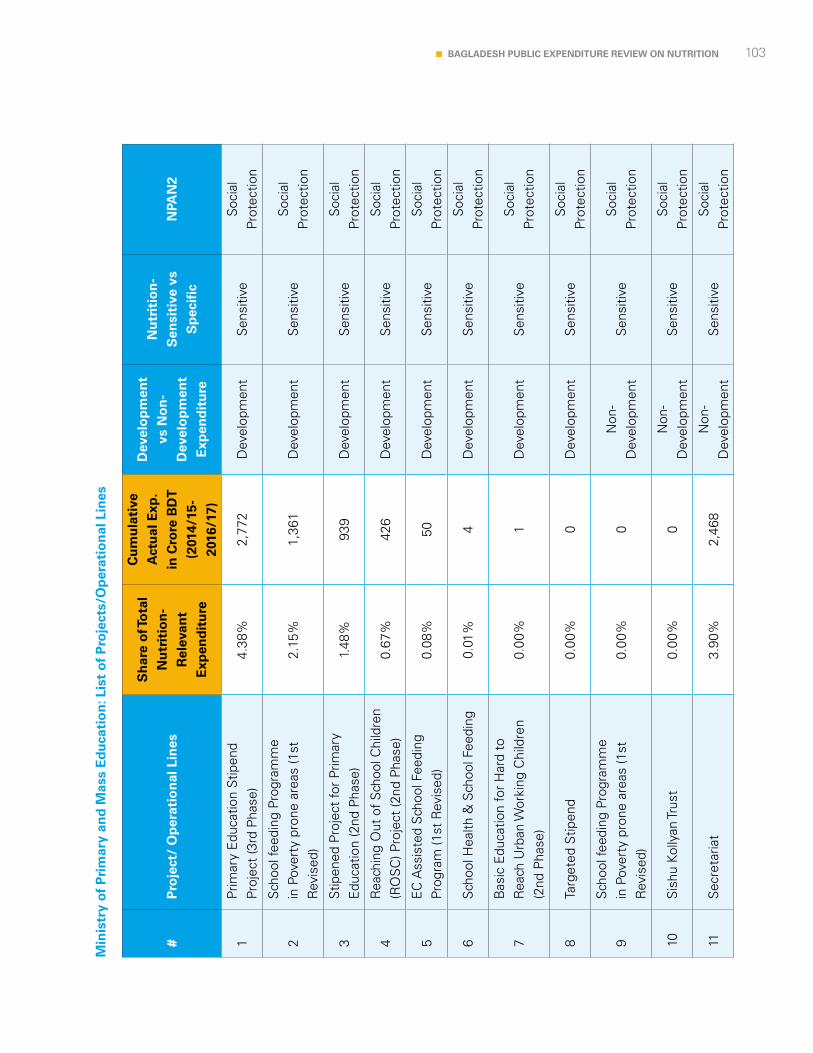
103BAGLADESH PUBLIC EXPENDITURE REVIEW ON NUTRITION
Min
istr
y o
f P
rim
ary
and
Mas
s E
du
cati
on
: Lis
t o
f P
roje
cts/
Op
erat
ion
al L
ines
#P
roje
ct/
Op
erat
ion
al L
ines
Sh
are
of T
ota
l N
utr
itio
n-
Rel
evan
t E
xpen
dit
ure
Cu
mu
lati
ve
Act
ual
Exp
. in
Cro
re B
DT
(2
014/
15-
2016
/17)
Dev
elo
pm
ent
vs N
on
-D
evel
op
men
t E
xpen
dit
ure
Nu
trit
ion
-S
ensi
tive
vs
Sp
ecif
icN
PAN
2
1Pr
imar
y E
duca
tion
Stip
end
Proj
ect
(3rd
Pha
se)
4.38
%2,
772
Dev
elop
men
tS
ensi
tive
Soc
ial
Prot
ectio
n
2S
choo
l fee
ding
Pro
gram
me
in P
over
ty p
rone
are
as (1
st
Rev
ised
)2.
15%
1,36
1D
evel
opm
ent
Sen
sitiv
eS
ocia
l Pr
otec
tion
3S
tipen
ed P
roje
ct fo
r Pr
imar
y E
duca
tion
(2nd
Pha
se)
1.48
%93
9D
evel
opm
ent
Sen
sitiv
eS
ocia
l Pr
otec
tion
4R
each
ing
Out
of
Sch
ool C
hild
ren
(RO
SC
) Pro
ject
(2nd
Pha
se)
0.67
%42
6D
evel
opm
ent
Sen
sitiv
eS
ocia
l Pr
otec
tion
5E
C A
ssis
ted
Sch
ool F
eedi
ng
Prog
ram
(1st
Rev
ised
)0.
08%
50D
evel
opm
ent
Sen
sitiv
eS
ocia
l Pr
otec
tion
6S
choo
l Hea
lth &
Sch
ool F
eedi
ng0.
01%
4D
evel
opm
ent
Sen
sitiv
eS
ocia
l Pr
otec
tion
7B
asic
Edu
catio
n fo
r H
ard
to
Rea
ch U
rban
Wor
king
Chi
ldre
n (2
nd P
hase
)0.
00%
1D
evel
opm
ent
Sen
sitiv
eS
ocia
l Pr
otec
tion
8Ta
rget
ed S
tipen
d0.
00%
0D
evel
opm
ent
Sen
sitiv
eS
ocia
l Pr
otec
tion
9S
choo
l fee
ding
Pro
gram
me
in P
over
ty p
rone
are
as (1
st
Rev
ised
)0.
00%
0N
on-
Dev
elop
men
tS
ensi
tive
Soc
ial
Prot
ectio
n
10S
ishu
Kol
lyan
Trus
t0.
00%
0N
on-
Dev
elop
men
tS
ensi
tive
Soc
ial
Prot
ectio
n
11S
ecre
taria
t3.
90%
2,46
8N
on-
Dev
elop
men
tS
ensi
tive
Soc
ial
Prot
ectio
n
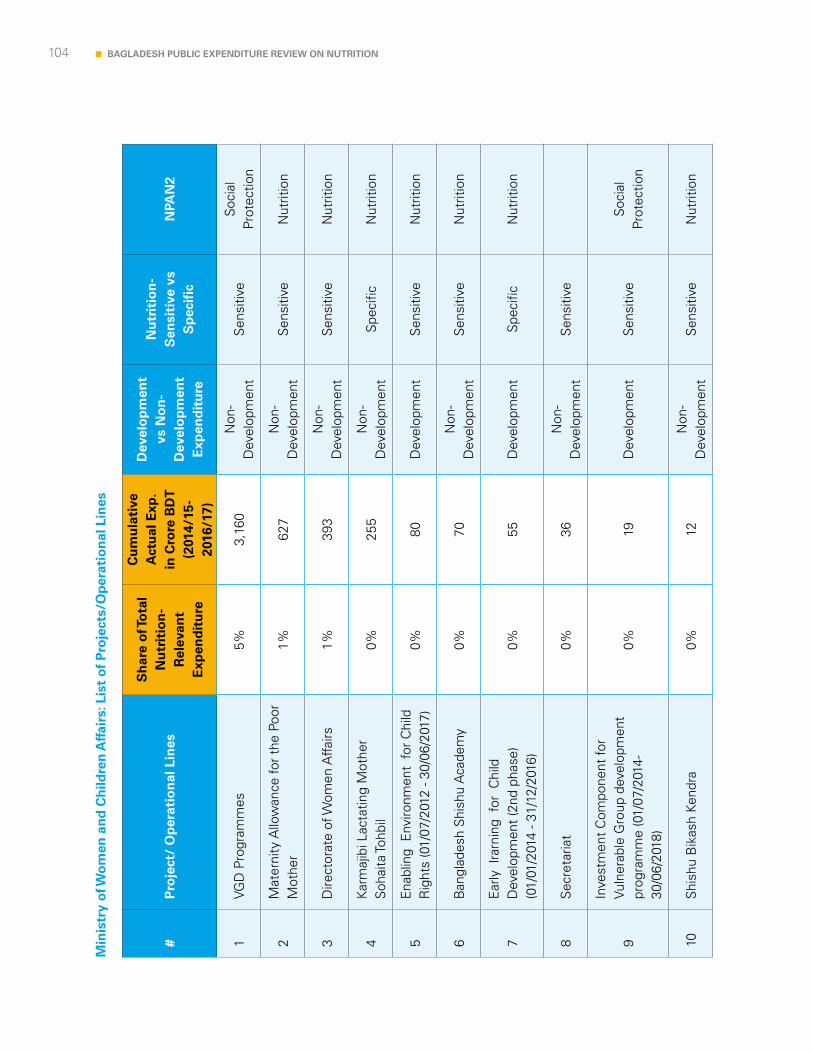
104 BAGLADESH PUBLIC EXPENDITURE REVIEW ON NUTRITION
Min
istr
y o
f Wo
men
an
d C
hild
ren
Aff
airs
: Lis
t o
f P
roje
cts/
Op
erat
ion
al L
ines
#P
roje
ct/
Op
erat
ion
al L
ines
Sh
are
of T
ota
l N
utr
itio
n-
Rel
evan
t E
xpen
dit
ure
Cu
mu
lati
ve
Act
ual
Exp
. in
Cro
re B
DT
(2
014/
15-
2016
/17)
Dev
elo
pm
ent
vs N
on
-D
evel
op
men
t E
xpen
dit
ure
Nu
trit
ion
-S
ensi
tive
vs
Sp
ecif
icN
PAN
2
1VG
D P
rogr
amm
es5%
3,16
0N
on-
Dev
elop
men
tS
ensi
tive
Soc
ial
Prot
ectio
n
2M
ater
nity
Allo
wan
ce fo
r th
e Po
or
Mot
her
1%62
7N
on-
Dev
elop
men
tS
ensi
tive
Nut
ritio
n
3D
irect
orat
e of
Wom
en A
ffairs
1%39
3N
on-
Dev
elop
men
tS
ensi
tive
Nut
ritio
n
4K
arm
ajib
i Lac
tatin
g M
othe
r S
ohai
ta To
hbil
0%25
5N
on-
Dev
elop
men
tS
peci
ficN
utrit
ion
5E
nabl
ing
Env
ironm
ent
for
Chi
ld
Rig
hts
(01/
07/2
012
- 30/
06/2
017)
0%80
Dev
elop
men
tS
ensi
tive
Nut
ritio
n
6B
angl
ades
h S
hish
u A
cade
my
0%70
Non
-D
evel
opm
ent
Sen
sitiv
eN
utrit
ion
7E
arly
lra
rnin
g fo
r C
hild
D
evel
opm
ent
(2nd
pha
se)
(01/
01/2
014
- 31/
12/2
016)
0%55
Dev
elop
men
tS
peci
ficN
utrit
ion
8S
ecre
taria
t0%
36N
on-
Dev
elop
men
tS
ensi
tive
9
Inve
stm
ent
Com
pone
nt fo
r Vu
lner
able
Gro
up d
evel
opm
ent
prog
ram
me
(01/
07/2
014-
30/0
6/20
18)
0%19
Dev
elop
men
tS
ensi
tive
Soc
ial
Prot
ectio
n
10S
hish
u B
ikas
h Ke
ndra
0%12
Non
-D
evel
opm
ent
Sen
sitiv
eN
utrit
ion
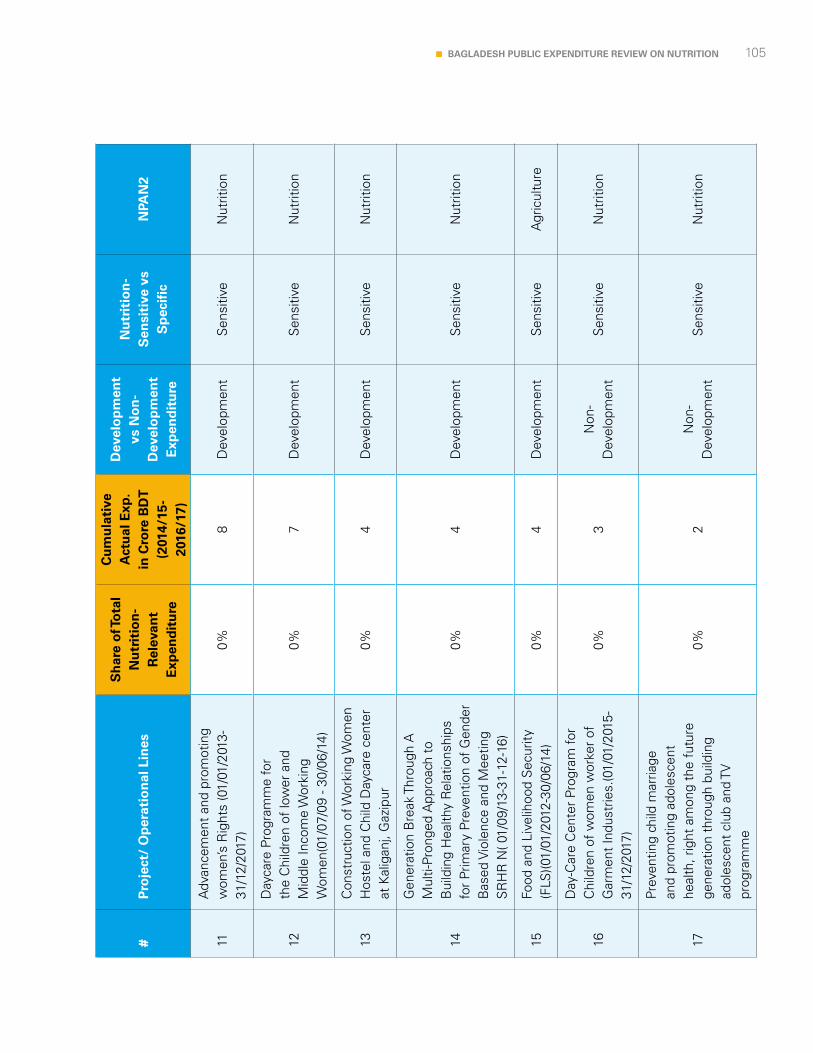
105BAGLADESH PUBLIC EXPENDITURE REVIEW ON NUTRITION
#P
roje
ct/
Op
erat
ion
al L
ines
Sh
are
of T
ota
l N
utr
itio
n-
Rel
evan
t E
xpen
dit
ure
Cu
mu
lati
ve
Act
ual
Exp
. in
Cro
re B
DT
(2
014/
15-
2016
/17)
Dev
elo
pm
ent
vs N
on
-D
evel
op
men
t E
xpen
dit
ure
Nu
trit
ion
-S
ensi
tive
vs
Sp
ecif
icN
PAN
2
11A
dvan
cem
ent
and
prom
otin
g w
omen
’s R
ight
s (0
1/01
/201
3-31
/12/
2017
)0%
8D
evel
opm
ent
Sen
sitiv
eN
utrit
ion
12
Day
care
Pro
gram
me
for
the
Chi
ldre
n of
low
er a
nd
Mid
dle
Inco
me
Wor
king
W
omen
(01/
07/0
9 - 3
0/06
/14)
0%7
Dev
elop
men
tS
ensi
tive
Nut
ritio
n
13C
onst
ruct
ion
of W
orki
ng W
omen
H
oste
l and
Chi
ld D
ayca
re c
ente
r at
Kal
igan
j, G
azip
ur0%
4D
evel
opm
ent
Sen
sitiv
eN
utrit
ion
14
Gen
erat
ion
Bre
ak T
hrou
gh A
M
ulti-
Pron
ged
App
roac
h to
B
uild
ing
Hea
lthy
Rel
atio
nshi
ps
for
Prim
ary
Prev
entio
n of
Gen
der
Bas
ed V
iole
nce
and
Mee
ting
SR
HR
N( 0
1/09
/13-
31-1
2-16
)
0%4
Dev
elop
men
tS
ensi
tive
Nut
ritio
n
15Fo
od a
nd L
ivel
ihoo
d S
ecur
ity
(FLS
)(01/
01/2
012-
30/0
6/14
)0%
4D
evel
opm
ent
Sen
sitiv
eA
gric
ultu
re
16
Day
-Car
e C
ente
r Pr
ogra
m fo
r C
hild
ren
of w
omen
wor
ker
of
Gar
men
t In
dust
ries.
(01/
01/2
015-
31/1
2/20
17)
0%3
Non
-D
evel
opm
ent
Sen
sitiv
eN
utrit
ion
17
Prev
entin
g ch
ild m
arria
ge
and
prom
otin
g ad
oles
cent
he
alth
, rig
ht a
mon
g th
e fu
ture
ge
nera
tion
thro
ugh
build
ing
adol
esce
nt c
lub
and
TV
prog
ram
me
0%2
Non
-D
evel
opm
ent
Sen
sitiv
eN
utrit
ion
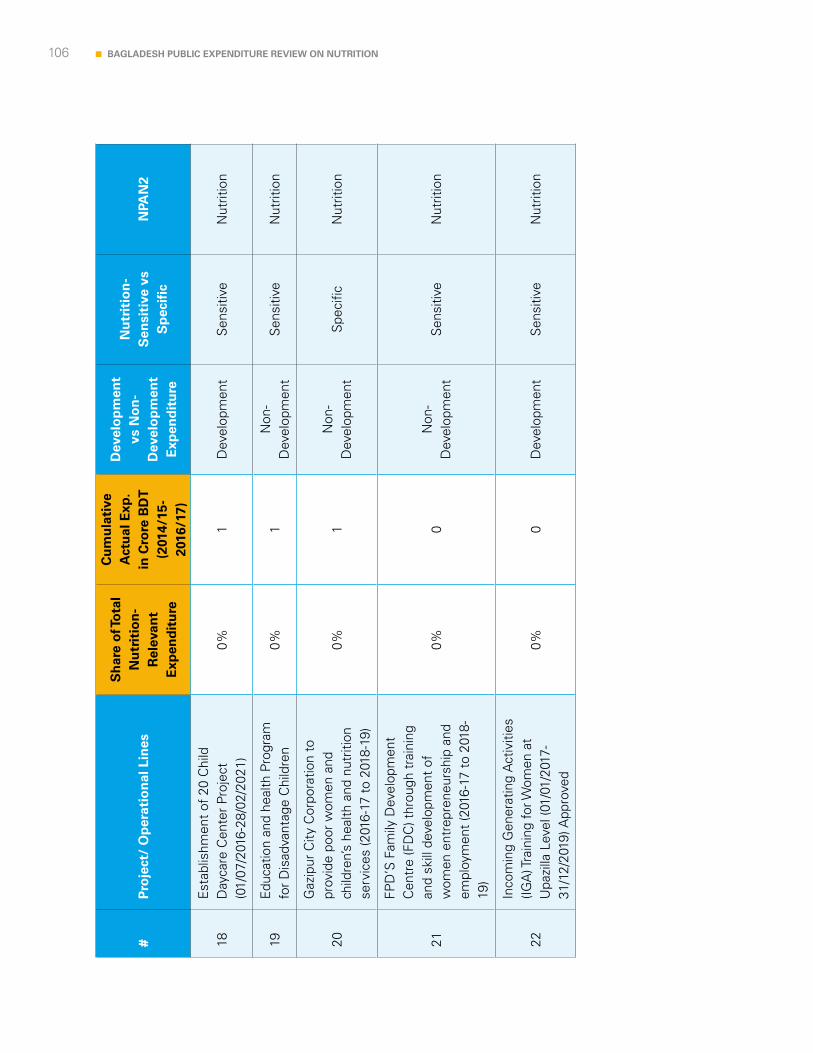
106 BAGLADESH PUBLIC EXPENDITURE REVIEW ON NUTRITION
#P
roje
ct/
Op
erat
ion
al L
ines
Sh
are
of T
ota
l N
utr
itio
n-
Rel
evan
t E
xpen
dit
ure
Cu
mu
lati
ve
Act
ual
Exp
. in
Cro
re B
DT
(2
014/
15-
2016
/17)
Dev
elo
pm
ent
vs N
on
-D
evel
op
men
t E
xpen
dit
ure
Nu
trit
ion
-S
ensi
tive
vs
Sp
ecif
icN
PAN
2
18E
stab
lishm
ent
of 2
0 C
hild
D
ayca
re C
ente
r Pr
ojec
t (0
1/07
/201
6-28
/02/
2021
)0%
1D
evel
opm
ent
Sen
sitiv
eN
utrit
ion
19E
duca
tion
and
heal
th P
rogr
am
for
Dis
adva
ntag
e C
hild
ren
0%1
Non
-D
evel
opm
ent
Sen
sitiv
eN
utrit
ion
20
Gaz
ipur
City
Cor
pora
tion
to
prov
ide
poor
wom
en a
nd
child
ren’
s he
alth
and
nut
ritio
n se
rvic
es (2
016-
17 t
o 20
18-1
9)
0%1
Non
-D
evel
opm
ent
Spe
cific
Nut
ritio
n
21
FPD
’S F
amily
Dev
elop
men
t C
entr
e (F
DC
) thr
ough
tra
inin
g an
d sk
ill d
evel
opm
ent
of
wom
en e
ntre
pren
eurs
hip
and
empl
oym
ent
(201
6-17
to
2018
-19
)
0%0
Non
-D
evel
opm
ent
Sen
sitiv
eN
utrit
ion
22
Inco
min
g G
ener
atin
g A
ctiv
ities
(IG
A) T
rain
ing
for W
omen
at
Upa
zilla
Lev
el (0
1/01
/201
7-31
/12/
2019
) App
rove
d
0%0
Dev
elop
men
tS
ensi
tive
Nut
ritio
n
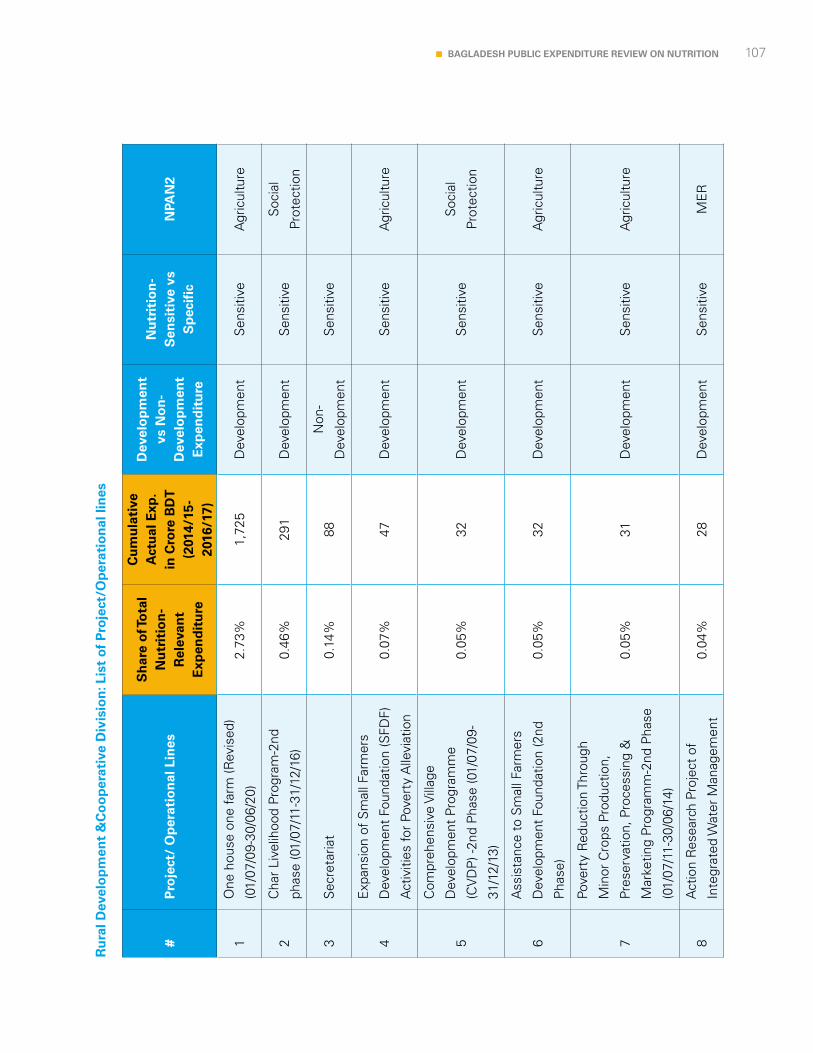
107BAGLADESH PUBLIC EXPENDITURE REVIEW ON NUTRITION
Ru
ral D
evel
op
men
t &
Co
op
erat
ive
Div
isio
n: L
ist
of
Pro
ject
/Op
erat
ion
al li
nes
#P
roje
ct/
Op
erat
ion
al L
ines
Sh
are
of T
ota
l N
utr
itio
n-
Rel
evan
t E
xpen
dit
ure
Cu
mu
lati
ve
Act
ual
Exp
. in
Cro
re B
DT
(2
014/
15-
2016
/17)
Dev
elo
pm
ent
vs N
on
-D
evel
op
men
t E
xpen
dit
ure
Nu
trit
ion
-S
ensi
tive
vs
Sp
ecif
icN
PAN
2
1O
ne h
ouse
one
farm
(Rev
ised
)
(01/
07/0
9-30
/06/
20)
2.73
%1,
725
Dev
elop
men
tS
ensi
tive
Agr
icul
ture
2C
har
Live
lihoo
d Pr
ogra
m-2
nd
phas
e (0
1/07
/11-
31/1
2/16
)0.
46%
291
Dev
elop
men
tS
ensi
tive
Soc
ial
Prot
ectio
n
3S
ecre
taria
t0.
14%
88N
on-
Dev
elop
men
tS
ensi
tive
4
Exp
ansi
on o
f S
mal
l Far
mer
s
Dev
elop
men
t Fo
unda
tion
(SFD
F)
Act
iviti
es fo
r Po
vert
y A
llevi
atio
n
0.07
%47
Dev
elop
men
tS
ensi
tive
Agr
icul
ture
5
Com
preh
ensi
ve V
illag
e
Dev
elop
men
t Pr
ogra
mm
e
(CV
DP
) -2n
d P
hase
(01/
07/0
9-
31/1
2/13
)
0.05
%32
Dev
elop
men
tS
ensi
tive
Soc
ial
Prot
ectio
n
6
Ass
ista
nce
to S
mal
l Far
mer
s
Dev
elop
men
t Fo
unda
tion
(2nd
Pha
se)
0.05
%32
Dev
elop
men
tS
ensi
tive
Agr
icul
ture
7
Pove
rty
Red
uctio
n Th
roug
h
Min
or C
rops
Pro
duct
ion,
Pres
erva
tion,
Pro
cess
ing
&
Mar
ketin
g Pr
ogra
mm
-2nd
Pha
se
(01/
07/1
1-30
/06/
14)
0.05
%31
Dev
elop
men
tS
ensi
tive
Agr
icul
ture
8A
ctio
n R
esea
rch
Proj
ect
of
Inte
grat
ed W
ater
Man
agem
ent
0.04
%28
Dev
elop
men
tS
ensi
tive
ME
R
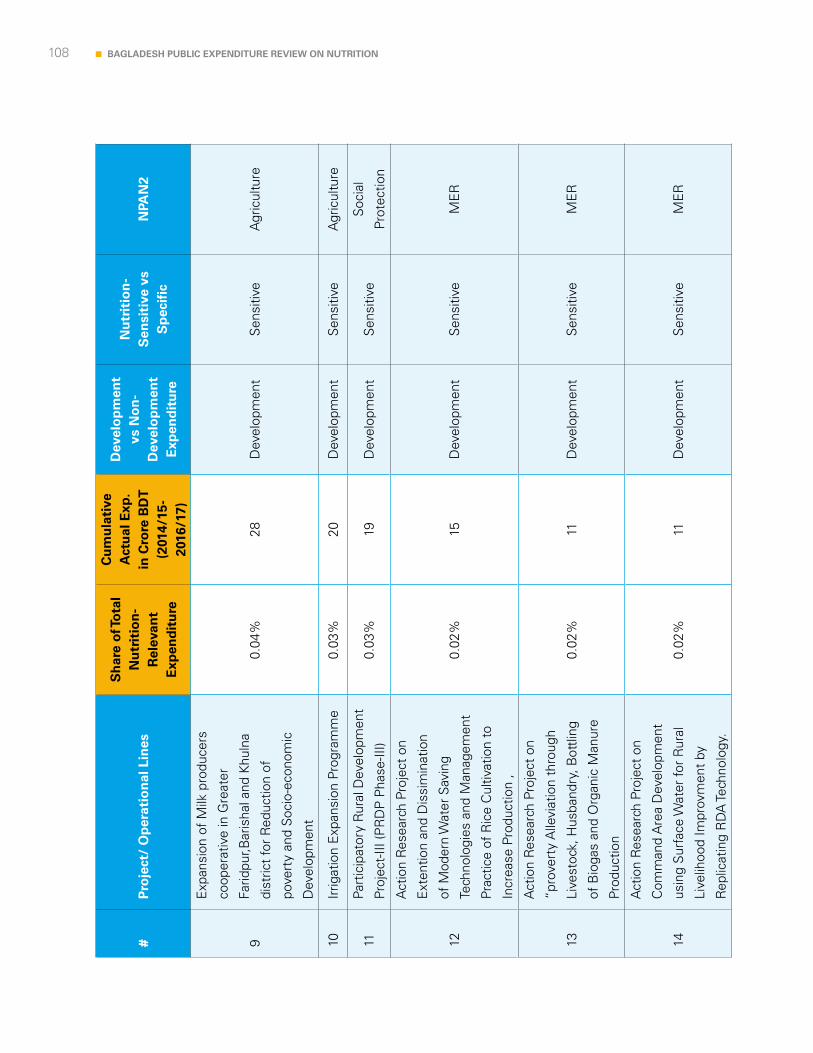
108 BAGLADESH PUBLIC EXPENDITURE REVIEW ON NUTRITION
#P
roje
ct/
Op
erat
ion
al L
ines
Sh
are
of T
ota
l N
utr
itio
n-
Rel
evan
t E
xpen
dit
ure
Cu
mu
lati
ve
Act
ual
Exp
. in
Cro
re B
DT
(2
014/
15-
2016
/17)
Dev
elo
pm
ent
vs N
on
-D
evel
op
men
t E
xpen
dit
ure
Nu
trit
ion
-S
ensi
tive
vs
Sp
ecif
icN
PAN
2
9
Exp
ansi
on o
f M
ilk p
rodu
cers
coop
erat
ive
in G
reat
er
Farid
pur,B
aris
hal a
nd K
huln
a
dist
rict
for
Red
uctio
n of
pove
rty
and
Soc
io-e
cono
mic
Dev
elop
men
t
0.04
%28
Dev
elop
men
tS
ensi
tive
Agr
icul
ture
10Irr
igat
ion
Exp
ansi
on P
rogr
amm
e0.
03%
20D
evel
opm
ent
Sen
sitiv
eA
gric
ultu
re
11Pa
rtic
ipat
ory
Rur
al D
evel
opm
ent
Proj
ect-
III (P
RD
P P
hase
-III)
0.03
%19
Dev
elop
men
tS
ensi
tive
Soc
ial
Prot
ectio
n
12
Act
ion
Res
earc
h Pr
ojec
t on
Ext
entio
n an
d D
issi
min
atio
n
of M
oder
n W
ater
Sav
ing
Tech
nolo
gies
and
Man
agem
ent
Prac
tice
of R
ice
Cul
tivat
ion
to
Incr
ease
Pro
duct
ion
,
0.02
%15
Dev
elop
men
tS
ensi
tive
ME
R
13
Act
ion
Res
earc
h Pr
ojec
t on
“pro
vert
y A
llevi
atio
n th
roug
h
Live
stoc
k, H
usba
ndry
, Bot
tling
of B
ioga
s an
d O
rgan
ic M
anur
e
Prod
uctio
n
0.02
%11
Dev
elop
men
tS
ensi
tive
ME
R
14
Act
ion
Res
earc
h Pr
ojec
t on
Com
man
d A
rea
Dev
elop
men
t
usin
g S
urfa
ce W
ater
for
Rur
al
Live
lihoo
d Im
prov
men
t by
Rep
licat
ing
RD
A Te
chno
logy
.
0.02
%11
Dev
elop
men
tS
ensi
tive
ME
R
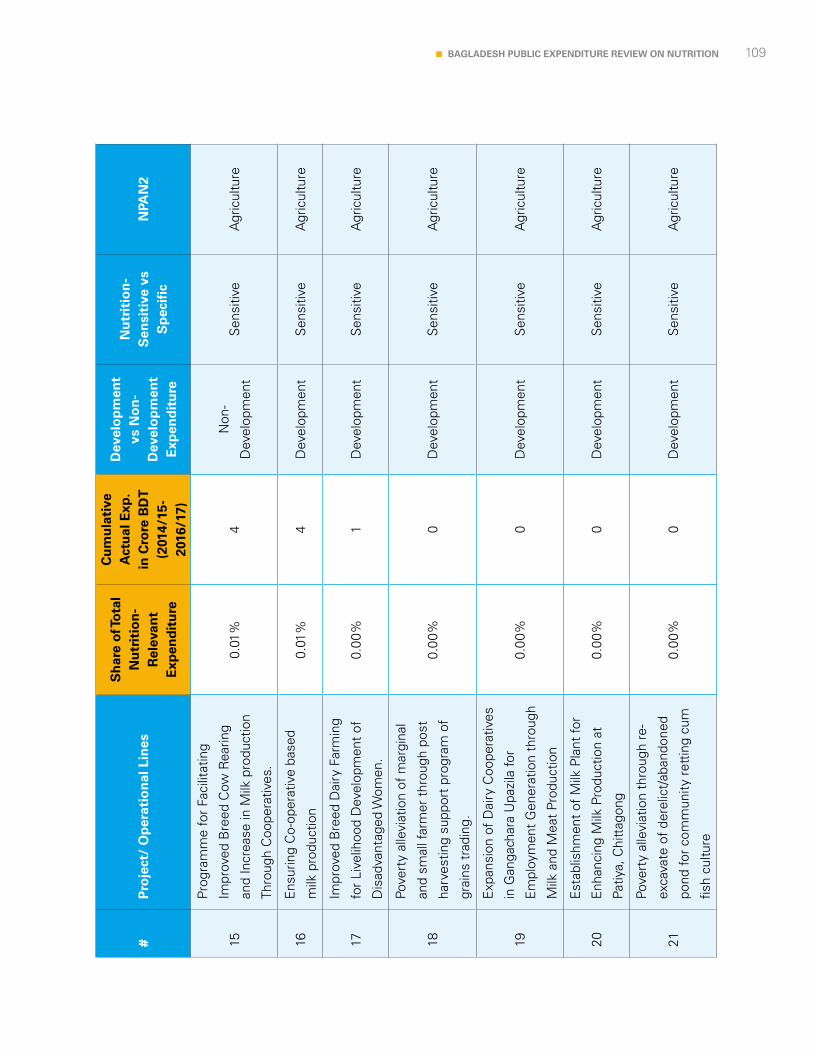
109BAGLADESH PUBLIC EXPENDITURE REVIEW ON NUTRITION
#P
roje
ct/
Op
erat
ion
al L
ines
Sh
are
of T
ota
l N
utr
itio
n-
Rel
evan
t E
xpen
dit
ure
Cu
mu
lati
ve
Act
ual
Exp
. in
Cro
re B
DT
(2
014/
15-
2016
/17)
Dev
elo
pm
ent
vs N
on
-D
evel
op
men
t E
xpen
dit
ure
Nu
trit
ion
-S
ensi
tive
vs
Sp
ecif
icN
PAN
2
15
Prog
ram
me
for
Faci
litat
ing
Impr
oved
Bre
ed C
ow R
earin
g
and
Incr
ease
in M
ilk p
rodu
ctio
n
Thro
ugh
Coo
pera
tives
.
0.01
%4
Non
-
Dev
elop
men
tS
ensi
tive
Agr
icul
ture
16E
nsur
ing
Co-
oper
ativ
e ba
sed
milk
pro
duct
ion
0.01
%4
Dev
elop
men
tS
ensi
tive
Agr
icul
ture
17
Impr
oved
Bre
ed D
airy
Far
min
g
for
Live
lihoo
d D
evel
opm
ent
of
Dis
adva
ntag
ed W
omen
.
0.00
%1
Dev
elop
men
tS
ensi
tive
Agr
icul
ture
18
Pove
rty
alle
viat
ion
of m
argi
nal
and
smal
l far
mer
thr
ough
pos
t
harv
estin
g su
ppor
t pr
ogra
m o
f
grai
ns t
radi
ng.
0.00
%0
Dev
elop
men
tS
ensi
tive
Agr
icul
ture
19
Exp
ansi
on o
f D
airy
Coo
pera
tives
in G
anga
char
a U
pazi
la fo
r
Em
ploy
men
t G
ener
atio
n th
roug
h
Milk
and
Mea
t Pr
oduc
tion
0.00
%0
Dev
elop
men
tS
ensi
tive
Agr
icul
ture
20
Est
ablis
hmen
t of
Milk
Pla
nt fo
r
Enh
anci
ng M
ilk P
rodu
ctio
n at
Patiy
a, C
hitt
agon
g
0.00
%0
Dev
elop
men
tS
ensi
tive
Agr
icul
ture
21
Pove
rty
alle
viat
ion
thro
ugh
re-
exca
vate
of
dere
lict/
aban
done
d
pond
for
com
mun
ity r
ettin
g cu
m
fish
cultu
re
0.00
%0
Dev
elop
men
tS
ensi
tive
Agr
icul
ture
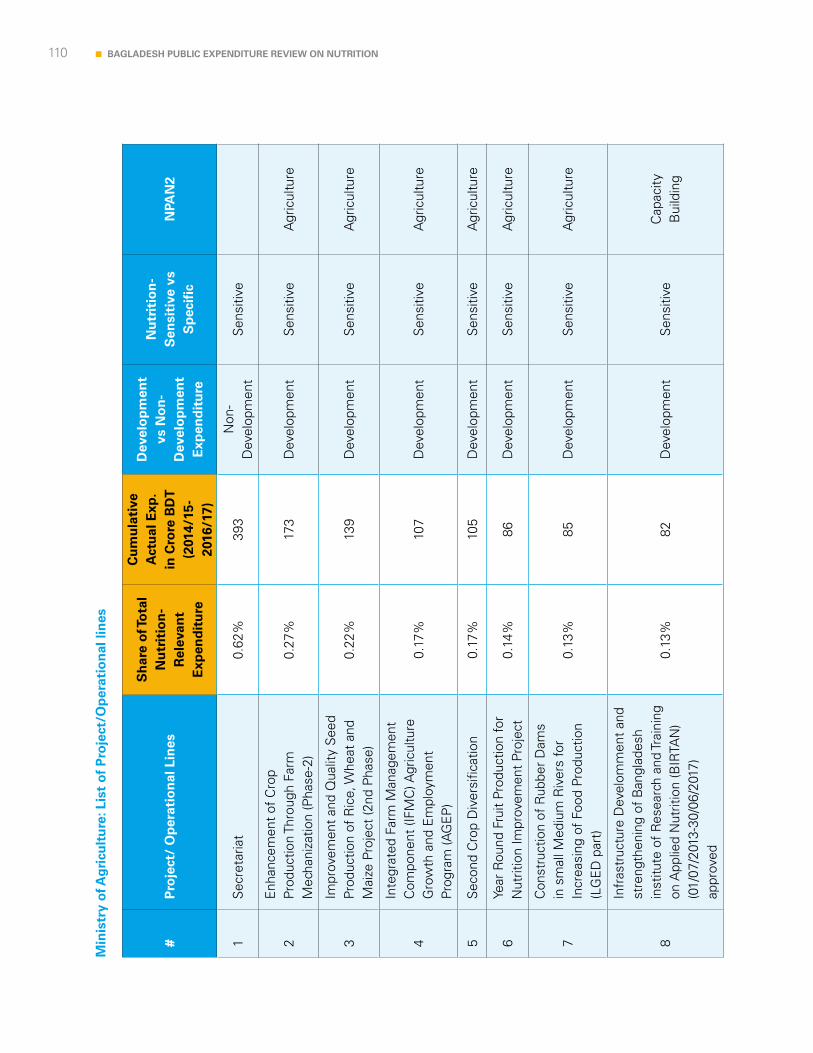
110 BAGLADESH PUBLIC EXPENDITURE REVIEW ON NUTRITION
Min
istr
y o
f Ag
ricu
ltu
re: L
ist
of
Pro
ject
/Op
erat
ion
al li
nes
#P
roje
ct/
Op
erat
ion
al L
ines
Sh
are
of T
ota
l N
utr
itio
n-
Rel
evan
t E
xpen
dit
ure
Cu
mu
lati
ve
Act
ual
Exp
. in
Cro
re B
DT
(2
014/
15-
2016
/17)
Dev
elo
pm
ent
vs N
on
-D
evel
op
men
t E
xpen
dit
ure
Nu
trit
ion
-S
ensi
tive
vs
Sp
ecif
icN
PAN
2
1S
ecre
taria
t0.
62%
393
Non
-D
evel
opm
ent
Sen
sitiv
e
2E
nhan
cem
ent
of C
rop
Prod
uctio
n Th
roug
h Fa
rm
Mec
hani
zatio
n (P
hase
-2)
0.27
%17
3D
evel
opm
ent
Sen
sitiv
eA
gric
ultu
re
3Im
prov
emen
t an
d Q
ualit
y S
eed
Prod
uctio
n of
Ric
e, W
heat
and
M
aize
Pro
ject
(2nd
Pha
se)
0.22
%13
9D
evel
opm
ent
Sen
sitiv
eA
gric
ultu
re
4
Inte
grat
ed F
arm
Man
agem
ent
Com
pone
nt (I
FMC
) Agr
icul
ture
G
row
th a
nd E
mpl
oym
ent
Prog
ram
(AG
EP
)
0.17
%10
7D
evel
opm
ent
Sen
sitiv
eA
gric
ultu
re
5S
econ
d C
rop
Div
ersi
ficat
ion
0.17
%10
5D
evel
opm
ent
Sen
sitiv
eA
gric
ultu
re
6Ye
ar R
ound
Fru
it Pr
oduc
tion
for
Nut
ritio
n Im
prov
emen
t Pr
ojec
t0.
14%
86D
evel
opm
ent
Sen
sitiv
eA
gric
ultu
re
7
Con
stru
ctio
n of
Rub
ber
Dam
s in
sm
all M
ediu
m R
iver
s fo
r In
crea
sing
of
Food
Pro
duct
ion
(LG
ED
par
t)
0.13
%85
Dev
elop
men
tS
ensi
tive
Agr
icul
ture
8
Infr
astr
uctu
re D
evel
omm
ent
and
stre
ngth
enin
g of
Ban
glad
esh
inst
itute
of
Res
earc
h an
d Tr
aini
ng
on A
pplie
d N
utrit
ion
(BIR
TAN
) (0
1/07
/201
3-30
/06/
2017
) ap
prov
ed
0.13
%82
Dev
elop
men
tS
ensi
tive
Cap
acity
B
uild
ing
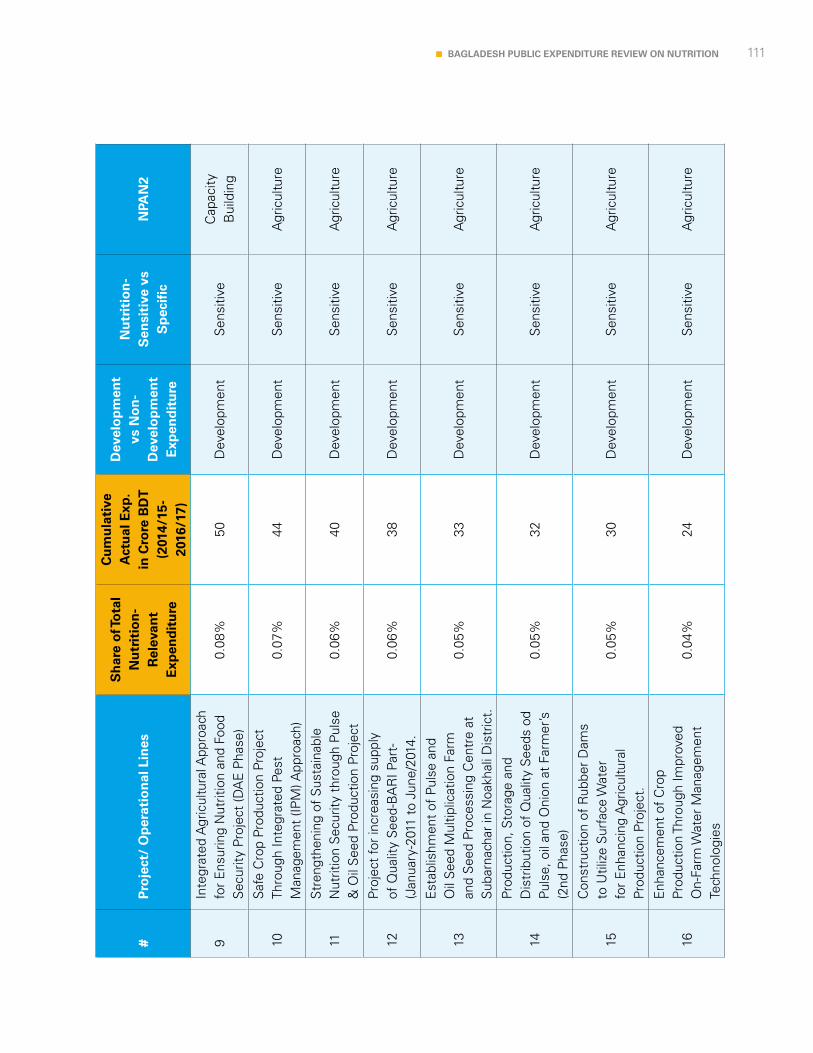
111BAGLADESH PUBLIC EXPENDITURE REVIEW ON NUTRITION
#P
roje
ct/
Op
erat
ion
al L
ines
Sh
are
of T
ota
l N
utr
itio
n-
Rel
evan
t E
xpen
dit
ure
Cu
mu
lati
ve
Act
ual
Exp
. in
Cro
re B
DT
(2
014/
15-
2016
/17)
Dev
elo
pm
ent
vs N
on
-D
evel
op
men
t E
xpen
dit
ure
Nu
trit
ion
-S
ensi
tive
vs
Sp
ecif
icN
PAN
2
9In
tegr
ated
Agr
icul
tura
l App
roac
h fo
r E
nsur
ing
Nut
ritio
n an
d Fo
od
Sec
urity
Pro
ject
(DA
E P
hase
)0.
08%
50D
evel
opm
ent
Sen
sitiv
eC
apac
ity
Bui
ldin
g
10S
afe
Cro
p Pr
oduc
tion
Proj
ect
Thro
ugh
Inte
grat
ed P
est
Man
agem
ent
(IPM
) App
roac
h)0.
07%
44D
evel
opm
ent
Sen
sitiv
eA
gric
ultu
re
11S
tren
gthe
ning
of
Sus
tain
able
N
utrit
ion
Sec
urity
thr
ough
Pul
se
& O
il S
eed
Prod
uctio
n Pr
ojec
t0.
06%
40D
evel
opm
ent
Sen
sitiv
eA
gric
ultu
re
12Pr
ojec
t fo
r in
crea
sing
sup
ply
of Q
ualit
y S
eed-
BA
RI P
art-
(Jan
uary
-201
1 to
Jun
e/20
14.
0.06
%38
Dev
elop
men
tS
ensi
tive
Agr
icul
ture
13
Est
ablis
hmen
t of
Pul
se a
nd
Oil
See
d M
ultip
licat
ion
Farm
an
d S
eed
Proc
essi
ng C
entr
e at
S
ubar
nach
ar in
Noa
khal
i Dis
tric
t.
0.05
%33
Dev
elop
men
tS
ensi
tive
Agr
icul
ture
14
Prod
uctio
n, S
tora
ge a
nd
Dis
trib
utio
n of
Qua
lity
See
ds o
d Pu
lse,
oil
and
Oni
on a
t Fa
rmer
’s
(2nd
Pha
se)
0.05
%32
Dev
elop
men
tS
ensi
tive
Agr
icul
ture
15
Con
stru
ctio
n of
Rub
ber
Dam
s to
Util
ize
Sur
face
Wat
er
for
Enh
anci
ng A
gric
ultu
ral
Prod
uctio
n Pr
ojec
t.
0.05
%30
Dev
elop
men
tS
ensi
tive
Agr
icul
ture
16
Enh
ance
men
t of
Cro
p Pr
oduc
tion
Thro
ugh
Impr
oved
O
n-Fa
rm W
ater
Man
agem
ent
Tech
nolo
gies
0.04
%24
Dev
elop
men
tS
ensi
tive
Agr
icul
ture
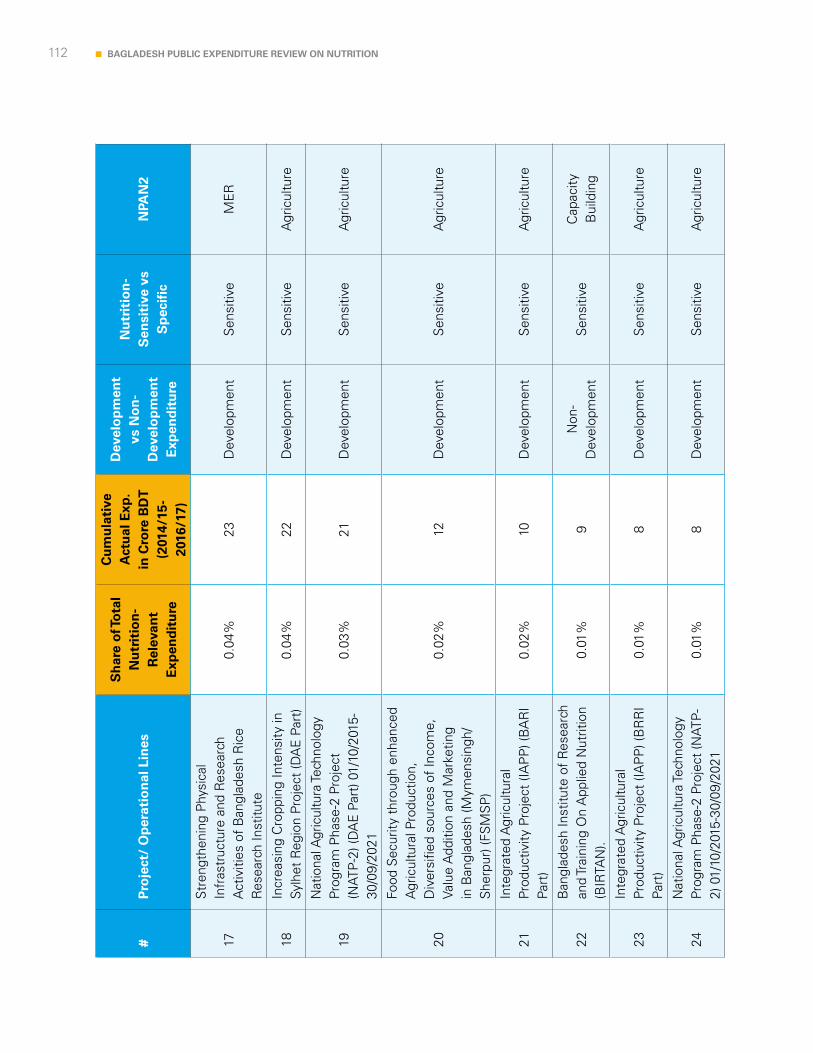
112 BAGLADESH PUBLIC EXPENDITURE REVIEW ON NUTRITION
#P
roje
ct/
Op
erat
ion
al L
ines
Sh
are
of T
ota
l N
utr
itio
n-
Rel
evan
t E
xpen
dit
ure
Cu
mu
lati
ve
Act
ual
Exp
. in
Cro
re B
DT
(2
014/
15-
2016
/17)
Dev
elo
pm
ent
vs N
on
-D
evel
op
men
t E
xpen
dit
ure
Nu
trit
ion
-S
ensi
tive
vs
Sp
ecif
icN
PAN
2
17
Str
engt
heni
ng P
hysi
cal
Infr
astr
uctu
re a
nd R
esea
rch
Act
iviti
es o
f B
angl
ades
h R
ice
Res
earc
h In
stitu
te
0.04
%23
Dev
elop
men
tS
ensi
tive
ME
R
18In
crea
sing
Cro
ppin
g In
tens
ity in
Sy
lhet
Reg
ion
Proj
ect
(DA
E P
art)
0.04
%22
Dev
elop
men
tS
ensi
tive
Agr
icul
ture
19
Nat
iona
l Agr
icul
tura
Tech
nolo
gy
Prog
ram
Pha
se-2
Pro
ject
(N
ATP
-2) (
DA
E P
art)
01/
10/2
015-
30/0
9/20
21
0.03
%21
Dev
elop
men
tS
ensi
tive
Agr
icul
ture
20
Food
Sec
urity
thr
ough
enh
ance
d A
gric
ultu
ral P
rodu
ctio
n,
Div
ersi
fied
sour
ces
of In
com
e,
Valu
e A
dditi
on a
nd M
arke
ting
in B
angl
ades
h (M
ymen
sing
h/S
herp
ur) (
FSM
SP
)
0.02
%12
Dev
elop
men
tS
ensi
tive
Agr
icul
ture
21In
tegr
ated
Agr
icul
tura
l Pr
oduc
tivity
Pro
ject
(IA
PP
) (B
AR
I Pa
rt)
0.02
%10
Dev
elop
men
tS
ensi
tive
Agr
icul
ture
22B
angl
ades
h In
stitu
te o
f R
esea
rch
and
Trai
ning
On
App
lied
Nut
ritio
n (B
IRTA
N).
0.01
%9
Non
-D
evel
opm
ent
Sen
sitiv
eC
apac
ity
Bui
ldin
g
23In
tegr
ated
Agr
icul
tura
l Pr
oduc
tivity
Pro
ject
(IA
PP
) (B
RR
I Pa
rt)
0.01
%8
Dev
elop
men
tS
ensi
tive
Agr
icul
ture
24N
atio
nal A
gric
ultu
ra Te
chno
logy
Pr
ogra
m P
hase
-2 P
roje
ct (N
ATP
-2)
01/
10/2
015-
30/0
9/20
210.
01%
8D
evel
opm
ent
Sen
sitiv
eA
gric
ultu
re
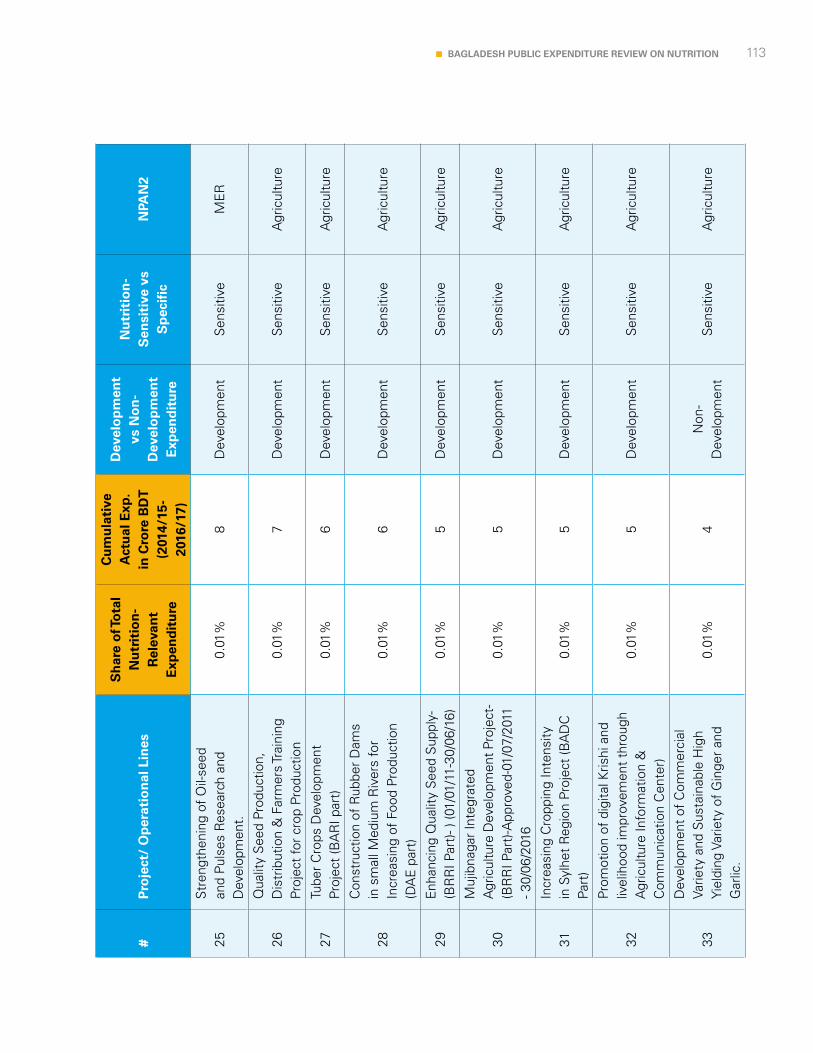
113BAGLADESH PUBLIC EXPENDITURE REVIEW ON NUTRITION
#P
roje
ct/
Op
erat
ion
al L
ines
Sh
are
of T
ota
l N
utr
itio
n-
Rel
evan
t E
xpen
dit
ure
Cu
mu
lati
ve
Act
ual
Exp
. in
Cro
re B
DT
(2
014/
15-
2016
/17)
Dev
elo
pm
ent
vs N
on
-D
evel
op
men
t E
xpen
dit
ure
Nu
trit
ion
-S
ensi
tive
vs
Sp
ecif
icN
PAN
2
25S
tren
gthe
ning
of
Oil-
seed
an
d Pu
lses
Res
earc
h an
d D
evel
opm
ent.
0.01
%8
Dev
elop
men
tS
ensi
tive
ME
R
26Q
ualit
y S
eed
Prod
uctio
n,
Dis
trib
utio
n &
Far
mer
s Tr
aini
ng
Proj
ect
for
crop
Pro
duct
ion
0.01
%7
Dev
elop
men
tS
ensi
tive
Agr
icul
ture
27Tu
ber
Cro
ps D
evel
opm
ent
Proj
ect
(BA
RI p
art)
0.01
%6
Dev
elop
men
tS
ensi
tive
Agr
icul
ture
28
Con
stru
ctio
n of
Rub
ber
Dam
s in
sm
all M
ediu
m R
iver
s fo
r In
crea
sing
of
Food
Pro
duct
ion
(DA
E p
art)
0.01
%6
Dev
elop
men
tS
ensi
tive
Agr
icul
ture
29E
nhan
cing
Qua
lity
See
d S
uppl
y-(B
RR
I Par
t)- )
(01/
01/1
1-30
/06/
16)
0.01
%5
Dev
elop
men
tS
ensi
tive
Agr
icul
ture
30
Muj
ibna
gar
Inte
grat
ed
Agr
icul
ture
Dev
elop
men
t Pro
ject
-(B
RR
I Par
t)-A
ppro
ved-
01/0
7/20
11
- 30/
06/2
016
0.01
%5
Dev
elop
men
tS
ensi
tive
Agr
icul
ture
31In
crea
sing
Cro
ppin
g In
tens
ity
in S
ylhe
t R
egio
n Pr
ojec
t (B
AD
C
Part
)0.
01%
5D
evel
opm
ent
Sen
sitiv
eA
gric
ultu
re
32
Prom
otio
n of
dig
ital K
rishi
and
liv
elih
ood
impr
ovem
ent
thro
ugh
Agr
icul
ture
Info
rmat
ion
&
Com
mun
icat
ion
Cen
ter)
0.01
%5
Dev
elop
men
tS
ensi
tive
Agr
icul
ture
33
Dev
elop
men
t of
Com
mer
cial
Va
riety
and
Sus
tain
able
Hig
h Yi
eldi
ng V
arie
ty o
f G
inge
r an
d G
arlic
.
0.01
%4
Non
-D
evel
opm
ent
Sen
sitiv
eA
gric
ultu
re
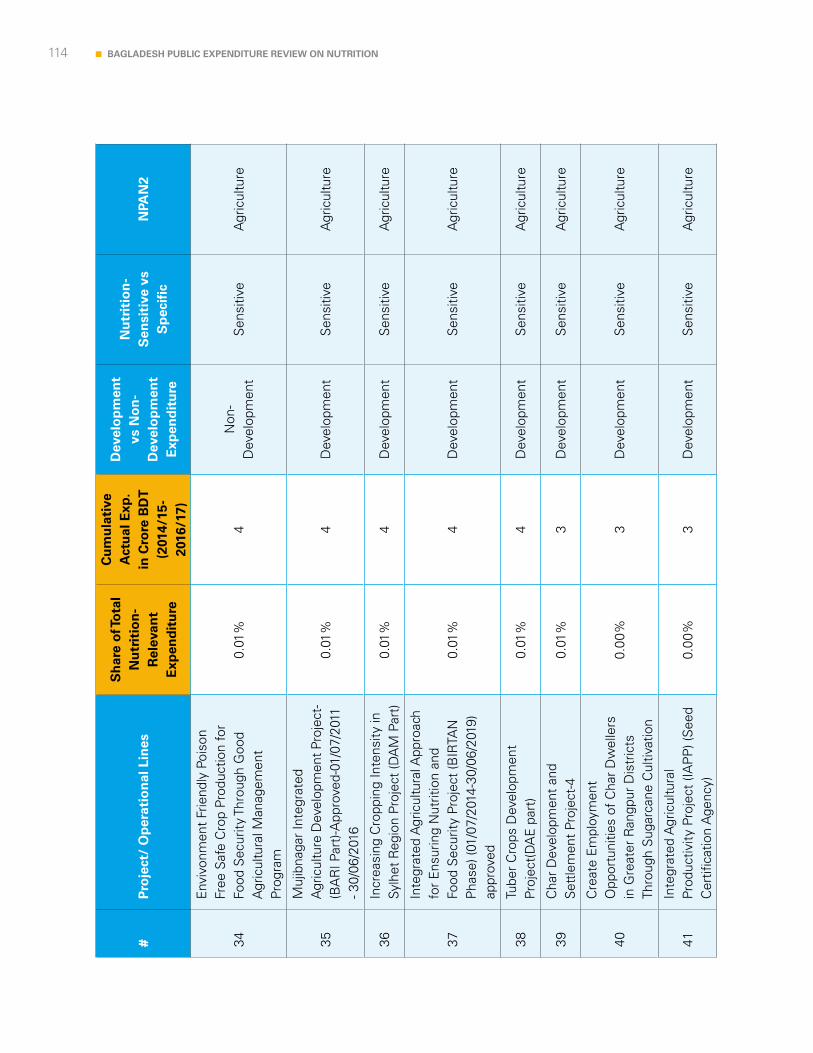
114 BAGLADESH PUBLIC EXPENDITURE REVIEW ON NUTRITION
#P
roje
ct/
Op
erat
ion
al L
ines
Sh
are
of T
ota
l N
utr
itio
n-
Rel
evan
t E
xpen
dit
ure
Cu
mu
lati
ve
Act
ual
Exp
. in
Cro
re B
DT
(2
014/
15-
2016
/17)
Dev
elo
pm
ent
vs N
on
-D
evel
op
men
t E
xpen
dit
ure
Nu
trit
ion
-S
ensi
tive
vs
Sp
ecif
icN
PAN
2
34
Env
ivon
men
t Fr
iend
ly P
oiso
n Fr
ee S
afe
Cro
p Pr
oduc
tion
for
Food
Sec
urity
Thr
ough
Goo
d A
gric
ultu
ral M
anag
emen
t Pr
ogra
m
0.01
%4
Non
-D
evel
opm
ent
Sen
sitiv
eA
gric
ultu
re
35
Muj
ibna
gar
Inte
grat
ed
Agr
icul
ture
Dev
elop
men
t Pro
ject
-(B
AR
I Par
t)-A
ppro
ved-
01/0
7/20
11
- 30/
06/2
016
0.01
%4
Dev
elop
men
tS
ensi
tive
Agr
icul
ture
36In
crea
sing
Cro
ppin
g In
tens
ity in
Sy
lhet
Reg
ion
Proj
ect
(DA
M P
art)
0.01
%4
Dev
elop
men
tS
ensi
tive
Agr
icul
ture
37
Inte
grat
ed A
gric
ultu
ral A
ppro
ach
for
Ens
urin
g N
utrit
ion
and
Food
Sec
urity
Pro
ject
(BIR
TAN
P
hase
) (01
/07/
2014
-30/
06/2
019)
ap
prov
ed
0.01
%4
Dev
elop
men
tS
ensi
tive
Agr
icul
ture
38Tu
ber
Cro
ps D
evel
opm
ent
Proj
ect(
DA
E p
art)
0.01
%4
Dev
elop
men
tS
ensi
tive
Agr
icul
ture
39C
har
Dev
elop
men
t an
d S
ettle
men
t Pr
ojec
t-4
0.01
%3
Dev
elop
men
tS
ensi
tive
Agr
icul
ture
40
Cre
ate
Em
ploy
men
t O
ppor
tuni
ties
of C
har
Dw
elle
rs
in G
reat
er R
angp
ur D
istr
icts
Th
roug
h S
ugar
cane
Cul
tivat
ion
0.00
%3
Dev
elop
men
tS
ensi
tive
Agr
icul
ture
41In
tegr
ated
Agr
icul
tura
l Pr
oduc
tivity
Pro
ject
(IA
PP
) (S
eed
Cer
tific
atio
n A
genc
y)0.
00%
3D
evel
opm
ent
Sen
sitiv
eA
gric
ultu
re
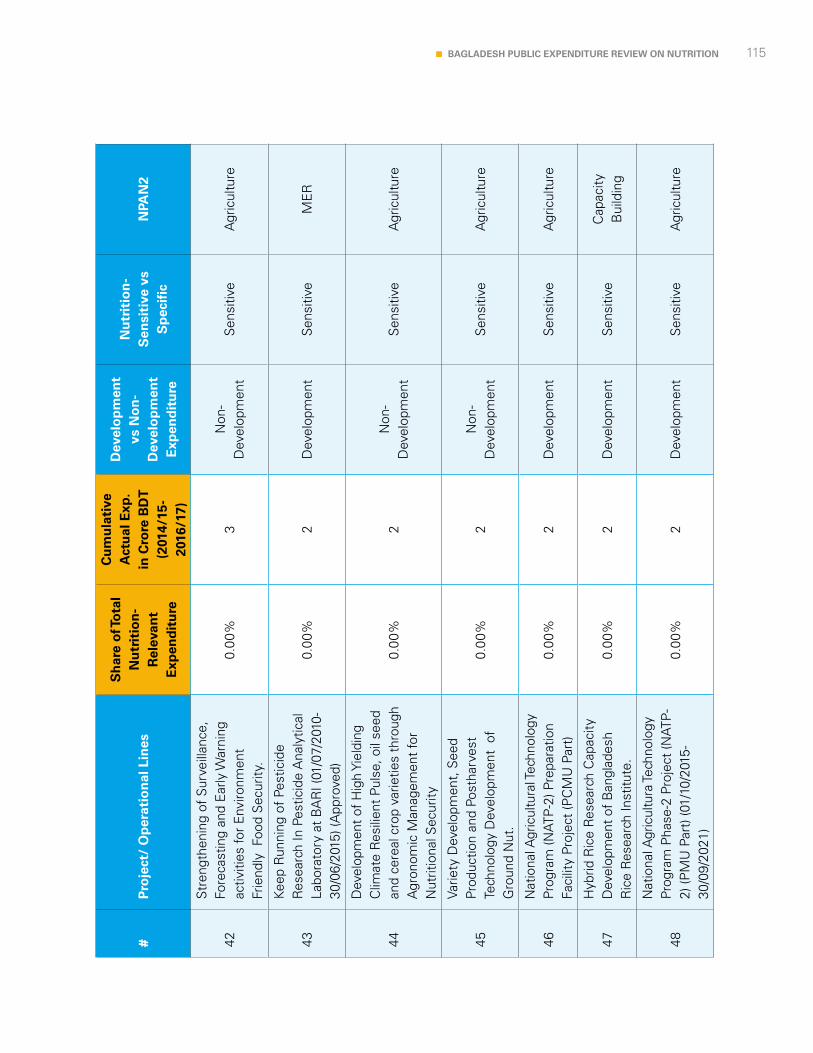
115BAGLADESH PUBLIC EXPENDITURE REVIEW ON NUTRITION
#P
roje
ct/
Op
erat
ion
al L
ines
Sh
are
of T
ota
l N
utr
itio
n-
Rel
evan
t E
xpen
dit
ure
Cu
mu
lati
ve
Act
ual
Exp
. in
Cro
re B
DT
(2
014/
15-
2016
/17)
Dev
elo
pm
ent
vs N
on
-D
evel
op
men
t E
xpen
dit
ure
Nu
trit
ion
-S
ensi
tive
vs
Sp
ecif
icN
PAN
2
42
Str
engt
heni
ng o
f S
urve
illan
ce,
Fore
cast
ing
and
Ear
ly W
arni
ng
activ
ities
for
Env
ironm
ent
Frie
ndly
Foo
d S
ecur
ity.
0.00
%3
Non
-D
evel
opm
ent
Sen
sitiv
eA
gric
ultu
re
43
Keep
Run
ning
of
Pest
icid
e R
esea
rch
In P
estic
ide
Ana
lytic
al
Labo
rato
ry a
t B
AR
I (01
/07/
2010
-30
/06/
2015
) (A
ppro
ved)
0.00
%2
Dev
elop
men
tS
ensi
tive
ME
R
44
Dev
elop
men
t of
Hig
h Yi
eldi
ng
Clim
ate
Res
ilien
t Pu
lse,
oil
seed
an
d ce
real
cro
p va
rietie
s th
roug
h A
gron
omic
Man
agem
ent
for
Nut
ritio
nal S
ecur
ity
0.00
%2
Non
-D
evel
opm
ent
Sen
sitiv
eA
gric
ultu
re
45
Varie
ty D
evel
opm
ent,
See
d Pr
oduc
tion
and
Post
harv
est
Tech
nolo
gy D
evel
opm
ent
of
Gro
und
Nut
.
0.00
%2
Non
-D
evel
opm
ent
Sen
sitiv
eA
gric
ultu
re
46N
atio
nal A
gric
ultu
ral T
echn
olog
y Pr
ogra
m (N
ATP
-2) P
repa
ratio
n Fa
cilit
y Pr
ojec
t (P
CM
U P
art)
0.00
%2
Dev
elop
men
tS
ensi
tive
Agr
icul
ture
47H
ybrid
Ric
e R
esea
rch
Cap
acity
D
evel
opm
ent
of B
angl
ades
h R
ice
Res
earc
h In
stitu
te.
0.00
%2
Dev
elop
men
tS
ensi
tive
Cap
acity
B
uild
ing
48
Nat
iona
l Agr
icul
tura
Tech
nolo
gy
Prog
ram
Pha
se-2
Pro
ject
(NAT
P-
2) (P
MU
Par
t) (0
1/10
/201
5-30
/09/
2021
)
0.00
%2
Dev
elop
men
tS
ensi
tive
Agr
icul
ture
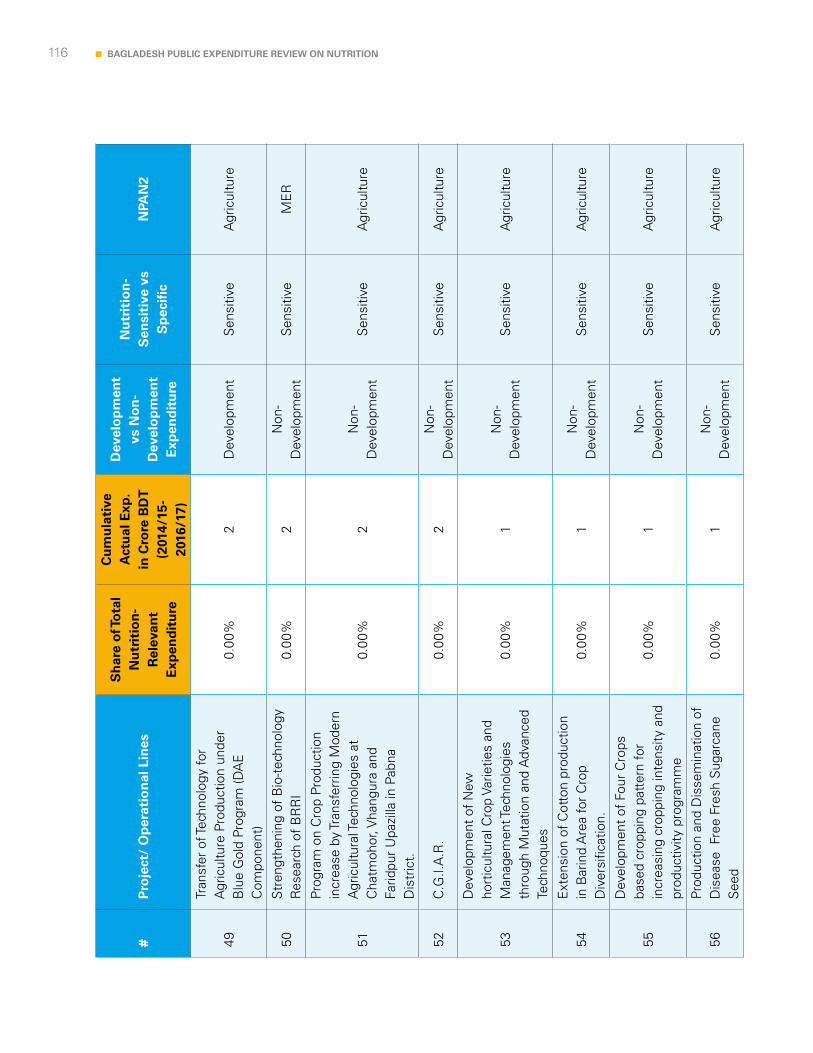
116 BAGLADESH PUBLIC EXPENDITURE REVIEW ON NUTRITION
#P
roje
ct/
Op
erat
ion
al L
ines
Sh
are
of T
ota
l N
utr
itio
n-
Rel
evan
t E
xpen
dit
ure
Cu
mu
lati
ve
Act
ual
Exp
. in
Cro
re B
DT
(2
014/
15-
2016
/17)
Dev
elo
pm
ent
vs N
on
-D
evel
op
men
t E
xpen
dit
ure
Nu
trit
ion
-S
ensi
tive
vs
Sp
ecif
icN
PAN
2
49
Tran
sfer
of T
echn
olog
y fo
r A
gric
ultu
re P
rodu
ctio
n un
der
Blu
e G
old
Prog
ram
(DA
E
Com
pone
nt)
0.00
%2
Dev
elop
men
tS
ensi
tive
Agr
icul
ture
50S
tren
gthe
ning
of
Bio
-tec
hnol
ogy
Res
earc
h of
BR
RI
0.00
%2
Non
-D
evel
opm
ent
Sen
sitiv
eM
ER
51
Prog
ram
on
Cro
p Pr
oduc
tion
incr
ease
by
Tran
sfer
ring
Mod
ern
Agr
icul
tura
l Tec
hnol
ogie
s at
C
hatm
ohor
, Vha
ngur
a an
d Fa
ridpu
r U
pazi
lla in
Pab
na
Dis
tric
t.
0.00
%2
Non
-D
evel
opm
ent
Sen
sitiv
eA
gric
ultu
re
52C
.G.I.
A.R
.0.
00%
2N
on-
Dev
elop
men
tS
ensi
tive
Agr
icul
ture
53
Dev
elop
men
t of
New
ho
rtic
ultu
ral C
rop
Varie
ties
and
Man
agem
ent T
echn
olog
ies
thro
ugh
Mut
atio
n an
d A
dvan
ced
Tech
noqu
es
0.00
%1
Non
-D
evel
opm
ent
Sen
sitiv
eA
gric
ultu
re
54E
xten
sion
of
Cot
ton
prod
uctio
n in
Bar
ind
Are
a fo
r C
rop
Div
ersi
ficat
ion.
0.00
%1
Non
-D
evel
opm
ent
Sen
sitiv
eA
gric
ultu
re
55
Dev
elop
men
t of
Fou
r C
rops
ba
sed
crop
ping
pat
tern
for
incr
easi
ng c
ropp
ing
inte
nsity
and
pr
oduc
tivity
pro
gram
me
0.00
%1
Non
-D
evel
opm
ent
Sen
sitiv
eA
gric
ultu
re
56Pr
oduc
tion
and
Dis
sem
inat
ion
of
Dis
ease
Fre
e Fr
esh
Sug
arca
ne
See
d0.
00%
1N
on-
Dev
elop
men
tS
ensi
tive
Agr
icul
ture
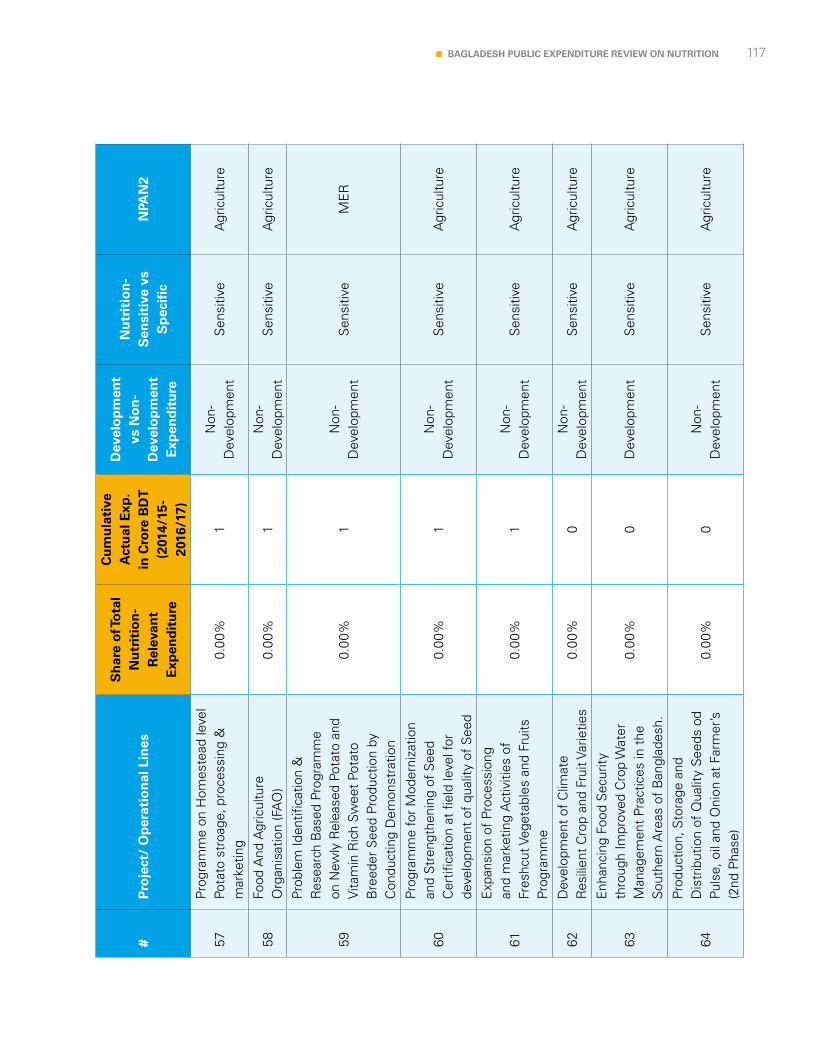
117BAGLADESH PUBLIC EXPENDITURE REVIEW ON NUTRITION
#P
roje
ct/
Op
erat
ion
al L
ines
Sh
are
of T
ota
l N
utr
itio
n-
Rel
evan
t E
xpen
dit
ure
Cu
mu
lati
ve
Act
ual
Exp
. in
Cro
re B
DT
(2
014/
15-
2016
/17)
Dev
elo
pm
ent
vs N
on
-D
evel
op
men
t E
xpen
dit
ure
Nu
trit
ion
-S
ensi
tive
vs
Sp
ecif
icN
PAN
2
57Pr
ogra
mm
e on
Hom
este
ad le
vel
Pota
to s
troa
ge, p
roce
ssin
g &
m
arke
ting
0.00
%1
Non
-D
evel
opm
ent
Sen
sitiv
eA
gric
ultu
re
58Fo
od A
nd A
gric
ultu
re
Org
anis
atio
n (F
AO
)0.
00%
1N
on-
Dev
elop
men
tS
ensi
tive
Agr
icul
ture
59
Prob
lem
Iden
tific
atio
n &
R
esea
rch
Bas
ed P
rogr
amm
e on
New
ly R
elea
sed
Pota
to a
nd
Vita
min
Ric
h Sw
eet
Pota
to
Bre
eder
See
d Pr
oduc
tion
by
Con
duct
ing
Dem
onst
ratio
n
0.00
%1
Non
-D
evel
opm
ent
Sen
sitiv
eM
ER
60
Prog
ram
me
for
Mod
erni
zatio
n an
d S
tren
gthe
ning
of
See
d C
ertif
icat
ion
at f
ield
leve
l for
de
velo
pmen
t of
qua
lity
of S
eed
0.00
%1
Non
-D
evel
opm
ent
Sen
sitiv
eA
gric
ultu
re
61
Exp
ansi
on o
f Pr
oces
sion
g an
d m
arke
ting
Act
iviti
es o
f Fr
eshc
ut V
eget
able
s an
d Fr
uits
Pr
ogra
mm
e
0.00
%1
Non
-D
evel
opm
ent
Sen
sitiv
eA
gric
ultu
re
62D
evel
opm
ent
of C
limat
e R
esili
ent
Cro
p an
d Fr
uit V
arie
ties
0.00
%0
Non
-D
evel
opm
ent
Sen
sitiv
eA
gric
ultu
re
63
Enh
anci
ng F
ood
Sec
urity
th
roug
h Im
prov
ed C
rop
Wat
er
Man
agem
ent
Prac
tices
in t
he
Sou
ther
n A
reas
of
Ban
glad
esh.
0.00
%0
Dev
elop
men
tS
ensi
tive
Agr
icul
ture
64
Prod
uctio
n, S
tora
ge a
nd
Dis
trib
utio
n of
Qua
lity
See
ds o
d Pu
lse,
oil
and
Oni
on a
t Fa
rmer
’s
(2nd
Pha
se)
0.00
%0
Non
-D
evel
opm
ent
Sen
sitiv
eA
gric
ultu
re
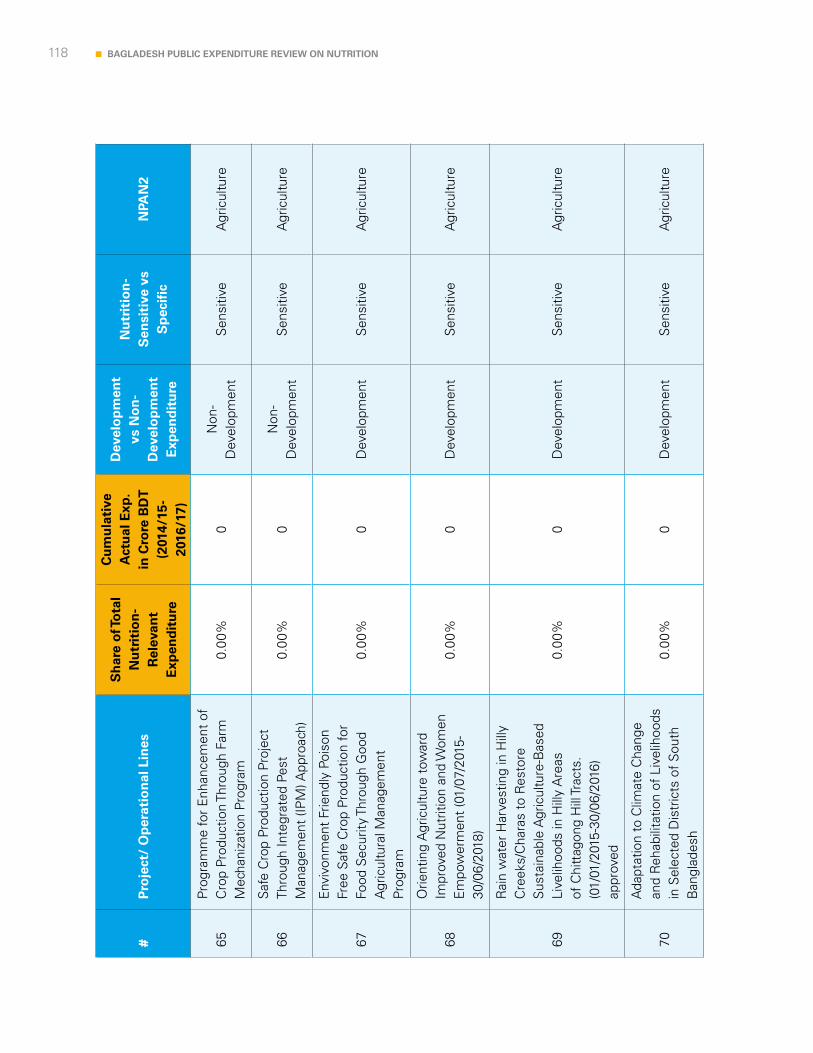
118 BAGLADESH PUBLIC EXPENDITURE REVIEW ON NUTRITION
#P
roje
ct/
Op
erat
ion
al L
ines
Sh
are
of T
ota
l N
utr
itio
n-
Rel
evan
t E
xpen
dit
ure
Cu
mu
lati
ve
Act
ual
Exp
. in
Cro
re B
DT
(2
014/
15-
2016
/17)
Dev
elo
pm
ent
vs N
on
-D
evel
op
men
t E
xpen
dit
ure
Nu
trit
ion
-S
ensi
tive
vs
Sp
ecif
icN
PAN
2
65Pr
ogra
mm
e fo
r E
nhan
cem
ent
of
Cro
p Pr
oduc
tion
Thro
ugh
Farm
M
echa
niza
tion
Prog
ram
0.00
%0
Non
-D
evel
opm
ent
Sen
sitiv
eA
gric
ultu
re
66S
afe
Cro
p Pr
oduc
tion
Proj
ect
Thro
ugh
Inte
grat
ed P
est
Man
agem
ent
(IPM
) App
roac
h)0.
00%
0N
on-
Dev
elop
men
tS
ensi
tive
Agr
icul
ture
67
Env
ivon
men
t Fr
iend
ly P
oiso
n Fr
ee S
afe
Cro
p Pr
oduc
tion
for
Food
Sec
urity
Thr
ough
Goo
d A
gric
ultu
ral M
anag
emen
t Pr
ogra
m
0.00
%0
Dev
elop
men
tS
ensi
tive
Agr
icul
ture
68
Orie
ntin
g A
gric
ultu
re t
owar
d Im
prov
ed N
utrit
ion
and
Wom
en
Em
pow
erm
ent
(01/
07/2
015-
30/0
6/20
18)
0.00
%0
Dev
elop
men
tS
ensi
tive
Agr
icul
ture
69
Rai
n w
ater
Har
vest
ing
in H
illy
Cre
eks/
Cha
ras
to R
esto
re
Sus
tain
able
Agr
icul
ture
-Bas
ed
Live
lihoo
ds in
Hill
y A
reas
of
Chi
ttag
ong
Hill
Trac
ts.
(01/
01/2
015-
30/0
6/20
16)
appr
oved
0.00
%0
Dev
elop
men
tS
ensi
tive
Agr
icul
ture
70
Ada
ptat
ion
to C
limat
e C
hang
e an
d R
ehab
ilita
tion
of L
ivel
ihoo
ds
in S
elec
ted
Dis
tric
ts o
f S
outh
B
angl
ades
h
0.00
%0
Dev
elop
men
tS
ensi
tive
Agr
icul
ture
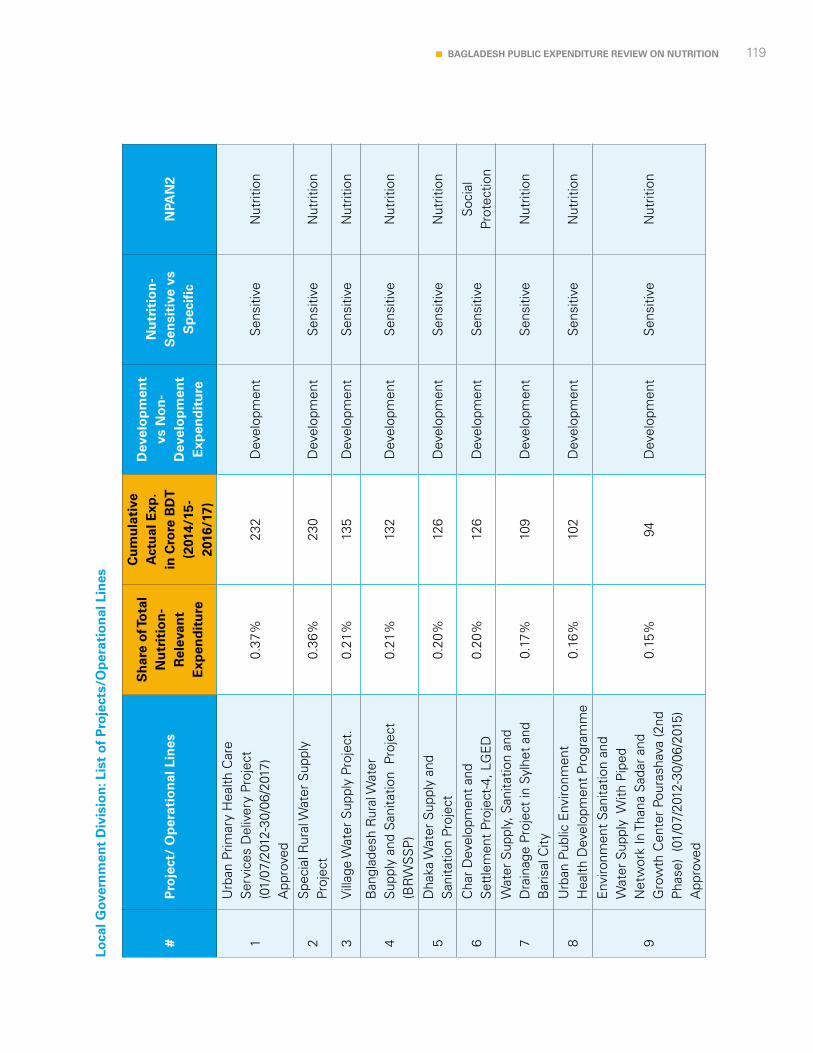
119BAGLADESH PUBLIC EXPENDITURE REVIEW ON NUTRITION
Loca
l Gov
ern
men
t D
ivis
ion
: Lis
t o
f P
roje
cts/
Op
erat
ion
al L
ines
#P
roje
ct/
Op
erat
ion
al L
ines
Sh
are
of T
ota
l N
utr
itio
n-
Rel
evan
t E
xpen
dit
ure
Cu
mu
lati
ve
Act
ual
Exp
. in
Cro
re B
DT
(2
014/
15-
2016
/17)
Dev
elo
pm
ent
vs N
on
-D
evel
op
men
t E
xpen
dit
ure
Nu
trit
ion
-S
ensi
tive
vs
Sp
ecif
icN
PAN
2
1
Urb
an P
rimar
y H
ealth
Car
e S
ervi
ces
Del
iver
y Pr
ojec
t (0
1/07
/201
2-30
/06/
2017
) A
ppro
ved
0.37
%23
2D
evel
opm
ent
Sen
sitiv
eN
utrit
ion
2S
peci
al R
ural
Wat
er S
uppl
y Pr
ojec
t0.
36%
230
Dev
elop
men
tS
ensi
tive
Nut
ritio
n
3Vi
llage
Wat
er S
uppl
y Pr
ojec
t.0.
21%
135
Dev
elop
men
tS
ensi
tive
Nut
ritio
n
4B
angl
ades
h R
ural
Wat
er
Sup
ply
and
San
itatio
n P
roje
ct
(BR
WS
SP
)0.
21%
132
Dev
elop
men
tS
ensi
tive
Nut
ritio
n
5D
haka
Wat
er S
uppl
y an
d S
anita
tion
Proj
ect
0.20
%12
6D
evel
opm
ent
Sen
sitiv
eN
utrit
ion
6C
har
Dev
elop
men
t an
d S
ettle
men
t Pr
ojec
t-4,
LG
ED
0.20
%12
6D
evel
opm
ent
Sen
sitiv
eS
ocia
l Pr
otec
tion
7W
ater
Sup
ply,
San
itatio
n an
d D
rain
age
Proj
ect
in S
ylhe
t an
d B
aris
al C
ity0.
17%
109
Dev
elop
men
tS
ensi
tive
Nut
ritio
n
8U
rban
Pub
lic E
nviro
nmen
t H
ealth
Dev
elop
men
t Pr
ogra
mm
e0.
16%
102
Dev
elop
men
tS
ensi
tive
Nut
ritio
n
9
Env
ironm
ent
San
itatio
n an
d W
ater
Sup
ply
With
Pip
ed
Net
wor
k In
Tha
na S
adar
and
G
row
th C
ente
r Po
uras
hava
(2nd
P
hase
) (0
1/07
/201
2-30
/06/
2015
) A
ppro
ved
0.15
%94
Dev
elop
men
tS
ensi
tive
Nut
ritio
n
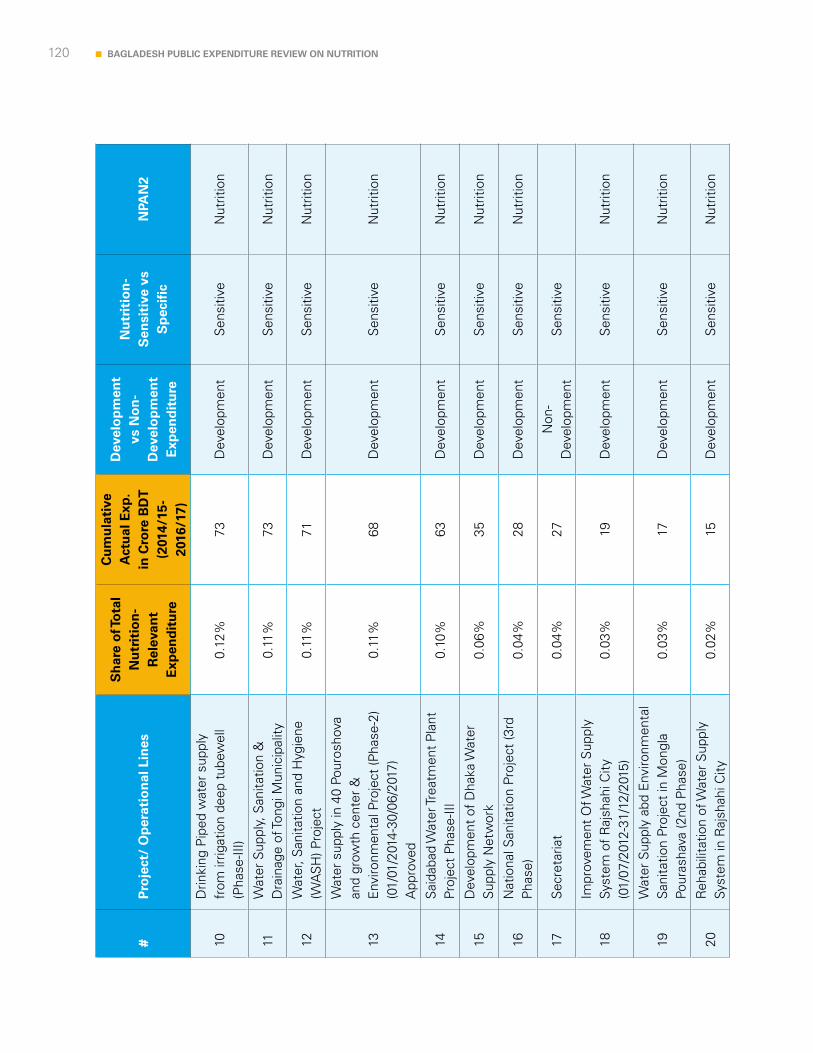
120 BAGLADESH PUBLIC EXPENDITURE REVIEW ON NUTRITION
#P
roje
ct/
Op
erat
ion
al L
ines
Sh
are
of T
ota
l N
utr
itio
n-
Rel
evan
t E
xpen
dit
ure
Cu
mu
lati
ve
Act
ual
Exp
. in
Cro
re B
DT
(2
014/
15-
2016
/17)
Dev
elo
pm
ent
vs N
on
-D
evel
op
men
t E
xpen
dit
ure
Nu
trit
ion
-S
ensi
tive
vs
Sp
ecif
icN
PAN
2
10D
rinki
ng P
iped
wat
er s
uppl
y fr
om ir
rigat
ion
deep
tube
wel
l (P
hase
-III)
0.12
%73
Dev
elop
men
tS
ensi
tive
Nut
ritio
n
11W
ater
Sup
ply,
San
itatio
n &
D
rain
age
of To
ngi M
unic
ipal
ity0.
11%
73D
evel
opm
ent
Sen
sitiv
eN
utrit
ion
12W
ater
, San
itatio
n an
d H
ygie
ne
(WA
SH
) Pro
ject
0.11
%71
Dev
elop
men
tS
ensi
tive
Nut
ritio
n
13
Wat
er s
uppl
y in
40
Pour
osho
va
and
grow
th c
ente
r &
E
nviro
nmen
tal P
roje
ct (P
hase
-2)
(01/
01/2
014-
30/0
6/20
17)
App
rove
d
0.11
%68
Dev
elop
men
tS
ensi
tive
Nut
ritio
n
14S
aida
bad
Wat
er Tr
eatm
ent
Pla
nt
Proj
ect
Pha
se-II
I0.
10%
63D
evel
opm
ent
Sen
sitiv
eN
utrit
ion
15D
evel
opm
ent
of D
haka
Wat
er
Sup
ply
Net
wor
k0.
06%
35D
evel
opm
ent
Sen
sitiv
eN
utrit
ion
16N
atio
nal S
anita
tion
Proj
ect
(3rd
P
hase
)0.
04%
28D
evel
opm
ent
Sen
sitiv
eN
utrit
ion
17S
ecre
taria
t0.
04%
27N
on-
Dev
elop
men
tS
ensi
tive
18Im
prov
emen
t O
f Wat
er S
uppl
y Sy
stem
of
Raj
shah
i City
(0
1/07
/201
2-31
/12/
2015
)0.
03%
19D
evel
opm
ent
Sen
sitiv
eN
utrit
ion
19W
ater
Sup
ply
abd
Env
ironm
enta
l S
anita
tion
Proj
ect
in M
ongl
a Po
uras
hava
(2nd
Pha
se)
0.03
%17
Dev
elop
men
tS
ensi
tive
Nut
ritio
n
20R
ehab
ilita
tion
of W
ater
Sup
ply
Syst
em in
Raj
shah
i City
0.02
%15
Dev
elop
men
tS
ensi
tive
Nut
ritio
n
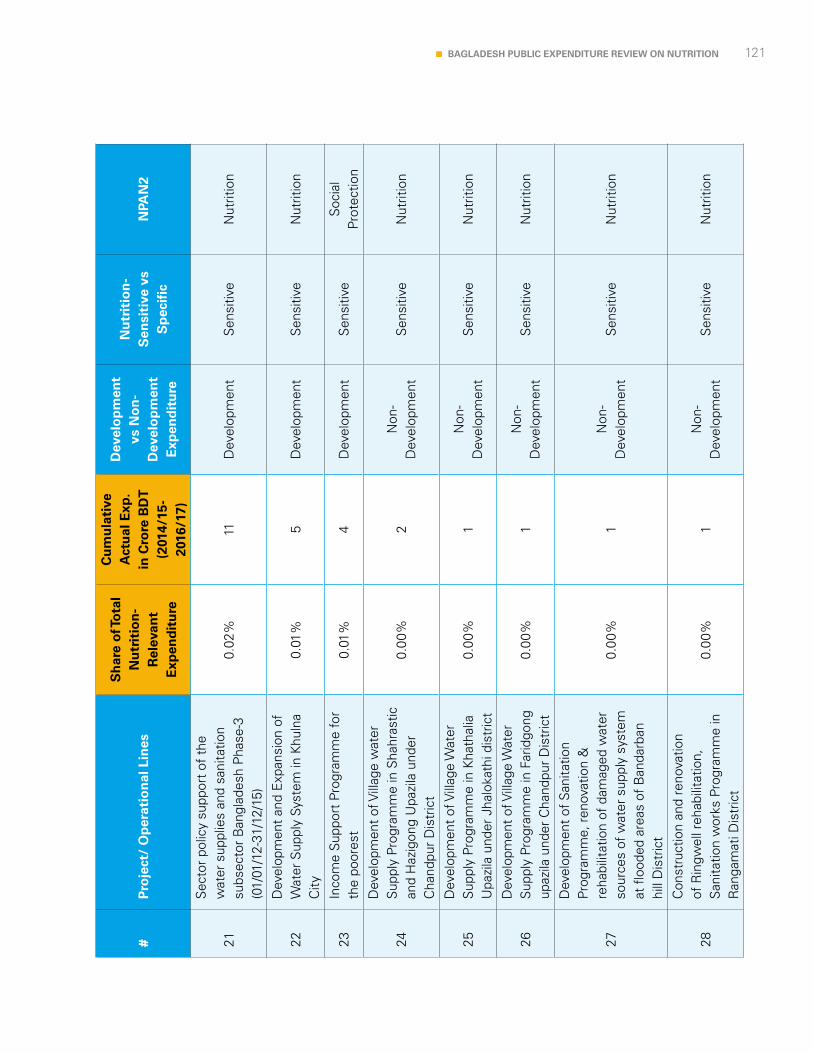
121BAGLADESH PUBLIC EXPENDITURE REVIEW ON NUTRITION
#P
roje
ct/
Op
erat
ion
al L
ines
Sh
are
of T
ota
l N
utr
itio
n-
Rel
evan
t E
xpen
dit
ure
Cu
mu
lati
ve
Act
ual
Exp
. in
Cro
re B
DT
(2
014/
15-
2016
/17)
Dev
elo
pm
ent
vs N
on
-D
evel
op
men
t E
xpen
dit
ure
Nu
trit
ion
-S
ensi
tive
vs
Sp
ecif
icN
PAN
2
21
Sec
tor
polic
y su
ppor
t of
the
w
ater
sup
plie
s an
d sa
nita
tion
subs
ecto
r B
angl
ades
h P
hase
-3
(01/
01/1
2-31
/12/
15)
0.02
%11
Dev
elop
men
tS
ensi
tive
Nut
ritio
n
22D
evel
opm
ent
and
Exp
ansi
on o
f W
ater
Sup
ply
Syst
em in
Khu
lna
City
0.01
%5
Dev
elop
men
tS
ensi
tive
Nut
ritio
n
23In
com
e S
uppo
rt P
rogr
amm
e fo
r th
e po
ores
t0.
01%
4D
evel
opm
ent
Sen
sitiv
eS
ocia
l Pr
otec
tion
24
Dev
elop
men
t of
Vill
age
wat
er
Sup
ply
Prog
ram
me
in S
hahr
astic
an
d H
azig
ong
Upa
zila
und
er
Cha
ndpu
r D
istr
ict
0.00
%2
Non
-D
evel
opm
ent
Sen
sitiv
eN
utrit
ion
25D
evel
opm
ent
of V
illag
e W
ater
S
uppl
y Pr
ogra
mm
e in
Kha
thal
ia
Upa
zila
und
er J
halo
kath
i dis
tric
t0.
00%
1N
on-
Dev
elop
men
tS
ensi
tive
Nut
ritio
n
26D
evel
opm
ent
of V
illag
e W
ater
S
uppl
y Pr
ogra
mm
e in
Far
idgo
ng
upaz
ila u
nder
Cha
ndpu
r D
istr
ict
0.00
%1
Non
-D
evel
opm
ent
Sen
sitiv
eN
utrit
ion
27
Dev
elop
men
t of
San
itatio
n Pr
ogra
mm
e, r
enov
atio
n &
re
habi
litat
ion
of d
amag
ed w
ater
so
urce
s of
wat
er s
uppl
y sy
stem
at
flo
oded
are
as o
f B
anda
rban
hi
ll D
istr
ict
0.00
%1
Non
-D
evel
opm
ent
Sen
sitiv
eN
utrit
ion
28
Con
stru
ctio
n an
d re
nova
tion
of R
ingw
ell r
ehab
ilita
tion,
S
anita
tion
wor
ks P
rogr
amm
e in
R
anga
mat
i Dis
tric
t
0.00
%1
Non
-D
evel
opm
ent
Sen
sitiv
eN
utrit
ion

122 BAGLADESH PUBLIC EXPENDITURE REVIEW ON NUTRITION
#P
roje
ct/
Op
erat
ion
al L
ines
Sh
are
of T
ota
l N
utr
itio
n-
Rel
evan
t E
xpen
dit
ure
Cu
mu
lati
ve
Act
ual
Exp
. in
Cro
re B
DT
(2
014/
15-
2016
/17)
Dev
elo
pm
ent
vs N
on
-D
evel
op
men
t E
xpen
dit
ure
Nu
trit
ion
-S
ensi
tive
vs
Sp
ecif
icN
PAN
2
29
Dev
elop
men
t of
San
itatio
n &
W
ater
Sup
ply
Syst
em t
hrou
gh
Pip
e lin
es a
t E
naye
t pu
r D
arba
r S
harif
Com
plex
, Cho
uhal
i U
pazi
la, S
hira
jhon
g
0.00
%1
Non
-D
evel
opm
ent
Sen
sitiv
eN
utrit
ion
30S
afe
wat
er s
uppl
y in
sev
eral
di
stric
ts o
f B
anda
rban
dis
tric
t0.
00%
1D
evel
opm
ent
Sen
sitiv
eN
utrit
ion
31
Sec
tor
polic
y su
ppor
t of
the
w
ater
sup
plie
s an
d sa
nita
tion
subs
ecto
r B
angl
ades
h P
hase
-3
(01/
01/1
2-31
/12/
15)
0.00
%0
Non
-D
evel
opm
ent
Sen
sitiv
eN
utrit
ion
32D
evel
opm
ent
of s
afe
wat
er
supp
ly P
rogr
amm
e at
Mat
hbar
ia
Mun
icip
ality
.0.
00%
0N
on-
Dev
elop
men
tS
ensi
tive
Nut
ritio
n
33W
ater
Sup
ply
and
San
itatio
n at
diff
eren
t m
unic
ipal
ities
and
U
pazi
las
of T
angi
al D
istr
ict.
0.00
%0
Non
-D
evel
opm
ent
Sen
sitiv
eN
utrit
ion
34D
evel
opm
ent
of W
ater
Sup
ply
Syst
em in
Nar
ayan
ganj
City
0.00
%0
Dev
elop
men
tS
ensi
tive
Nut
ritio
n
35S
uppo
rt t
o th
e U
rban
Urb
an
Hea
lth a
nd N
utrit
ion
to
Ban
glad
esh
0.00
%0
Dev
elop
men
tS
ensi
tive
Nut
ritio
n
36
Cox
’s B
azar
tow
n w
ater
su
pply
and
san
itatio
n an
d on
th
e fe
asib
ility
stu
dy fo
r th
e fo
rmul
atio
n of
dev
elop
men
t pr
ojec
ts
0.00
%0
Dev
elop
men
tS
ensi
tive
Nut
ritio
n
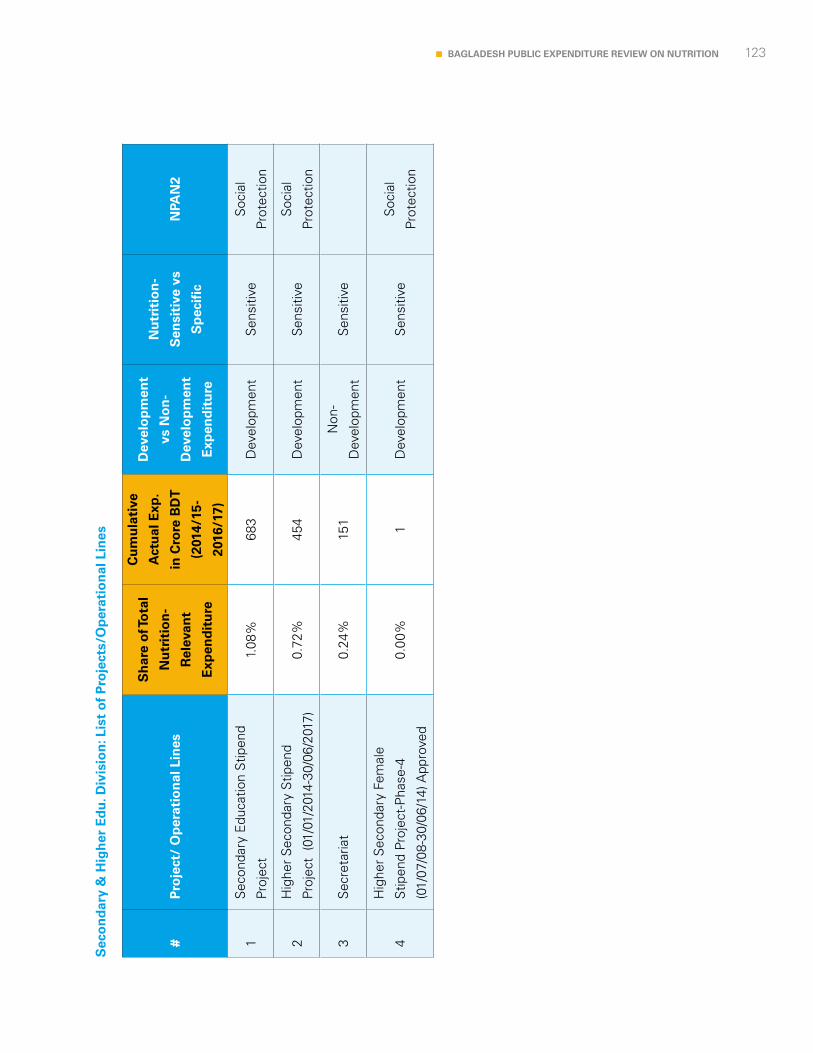
123BAGLADESH PUBLIC EXPENDITURE REVIEW ON NUTRITION
Sec
on
dar
y &
Hig
her
Ed
u. D
ivis
ion
: Lis
t o
f P
roje
cts/
Op
erat
ion
al L
ines
#P
roje
ct/
Op
erat
ion
al L
ines
Sh
are
of T
ota
l
Nu
trit
ion
-
Rel
evan
t
Exp
end
itu
re
Cu
mu
lati
ve
Act
ual
Exp
.
in C
rore
BD
T
(201
4/15
-
2016
/17)
Dev
elo
pm
ent
vs N
on
-
Dev
elo
pm
ent
Exp
end
itu
re
Nu
trit
ion
-
Sen
siti
ve v
s
Sp
ecif
ic
NPA
N2
1S
econ
dary
Edu
catio
n S
tipen
d
Proj
ect
1.08
%68
3D
evel
opm
ent
Sen
sitiv
eS
ocia
l
Prot
ectio
n
2H
ighe
r S
econ
dary
Stip
end
Proj
ect
(01/
01/2
014-
30/0
6/20
17)
0.72
%45
4D
evel
opm
ent
Sen
sitiv
eS
ocia
l
Prot
ectio
n
3S
ecre
taria
t0.
24%
151
Non
-
Dev
elop
men
tS
ensi
tive
4
Hig
her
Sec
onda
ry F
emal
e
Stip
end
Proj
ect-
Pha
se-4
(01/
07/0
8-30
/06/
14) A
ppro
ved
0.00
%1
Dev
elop
men
tS
ensi
tive
Soc
ial
Prot
ectio
n
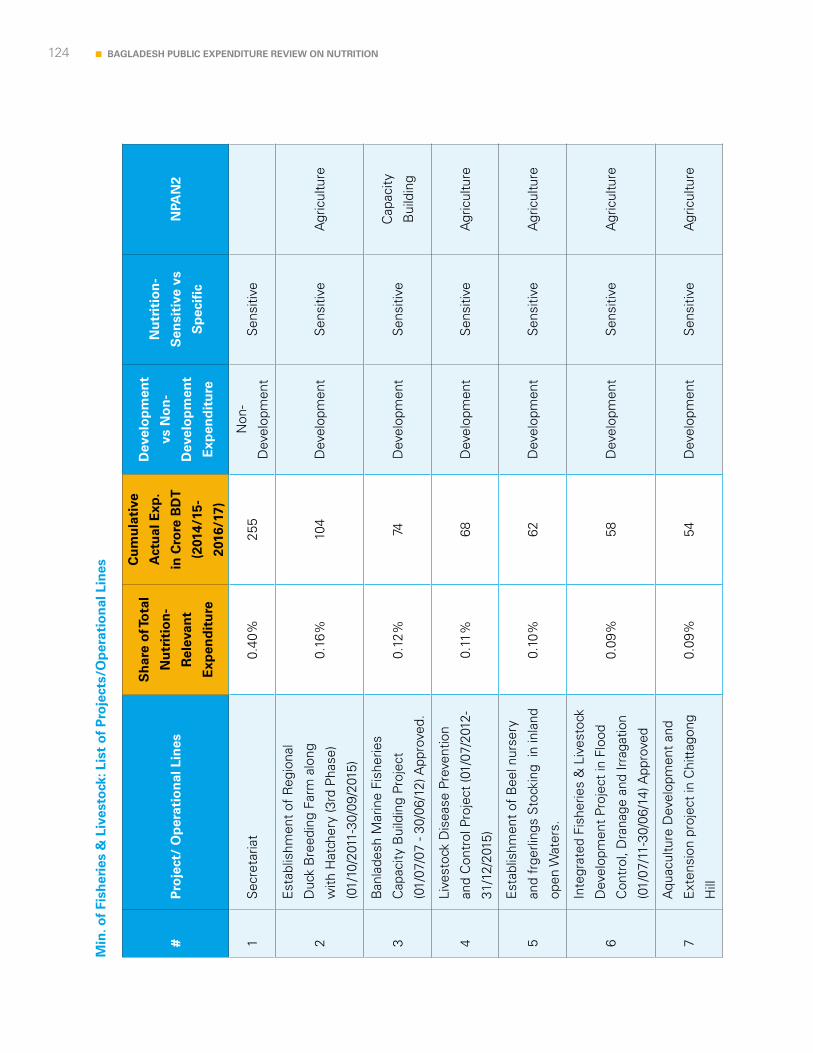
124 BAGLADESH PUBLIC EXPENDITURE REVIEW ON NUTRITION
Min
. of
Fish
erie
s &
Liv
esto
ck: L
ist
of
Pro
ject
s/O
per
atio
nal
Lin
es
#P
roje
ct/
Op
erat
ion
al L
ines
Sh
are
of T
ota
l
Nu
trit
ion
-
Rel
evan
t
Exp
end
itu
re
Cu
mu
lati
ve
Act
ual
Exp
.
in C
rore
BD
T
(201
4/15
-
2016
/17)
Dev
elo
pm
ent
vs N
on
-
Dev
elo
pm
ent
Exp
end
itu
re
Nu
trit
ion
-
Sen
siti
ve v
s
Sp
ecif
ic
NPA
N2
1S
ecre
taria
t0.
40%
255
Non
-
Dev
elop
men
tS
ensi
tive
2
Est
ablis
hmen
t of
Reg
iona
l
Duc
k B
reed
ing
Farm
alo
ng
with
Hat
cher
y (3
rd P
hase
)
(01/
10/2
011-
30/0
9/20
15)
0.16
%10
4D
evel
opm
ent
Sen
sitiv
eA
gric
ultu
re
3
Ban
lade
sh M
arin
e Fi
sher
ies
Cap
acity
Bui
ldin
g Pr
ojec
t
(01/
07/0
7 - 3
0/06
/12)
App
rove
d.
0.12
%74
Dev
elop
men
tS
ensi
tive
Cap
acity
Bui
ldin
g
4
Live
stoc
k D
isea
se P
reve
ntio
n
and
Con
trol
Pro
ject
(01/
07/2
012-
31/1
2/20
15)
0.11
%68
Dev
elop
men
tS
ensi
tive
Agr
icul
ture
5
Est
ablis
hmen
t of
Bee
l nur
sery
and
frge
rling
s S
tock
ing
in in
land
open
Wat
ers.
0.10
%62
Dev
elop
men
tS
ensi
tive
Agr
icul
ture
6
Inte
grat
ed F
ishe
ries
& L
ives
tock
Dev
elop
men
t Pr
ojec
t in
Flo
od
Con
trol
, Dra
nage
and
Irra
gatio
n
(01/
07/1
1-30
/06/
14) A
ppro
ved
0.09
%58
Dev
elop
men
tS
ensi
tive
Agr
icul
ture
7
Aqu
acul
ture
Dev
elop
men
t an
d
Ext
ensi
on p
roje
ct in
Chi
ttag
ong
Hill
0.09
%54
Dev
elop
men
tS
ensi
tive
Agr
icul
ture
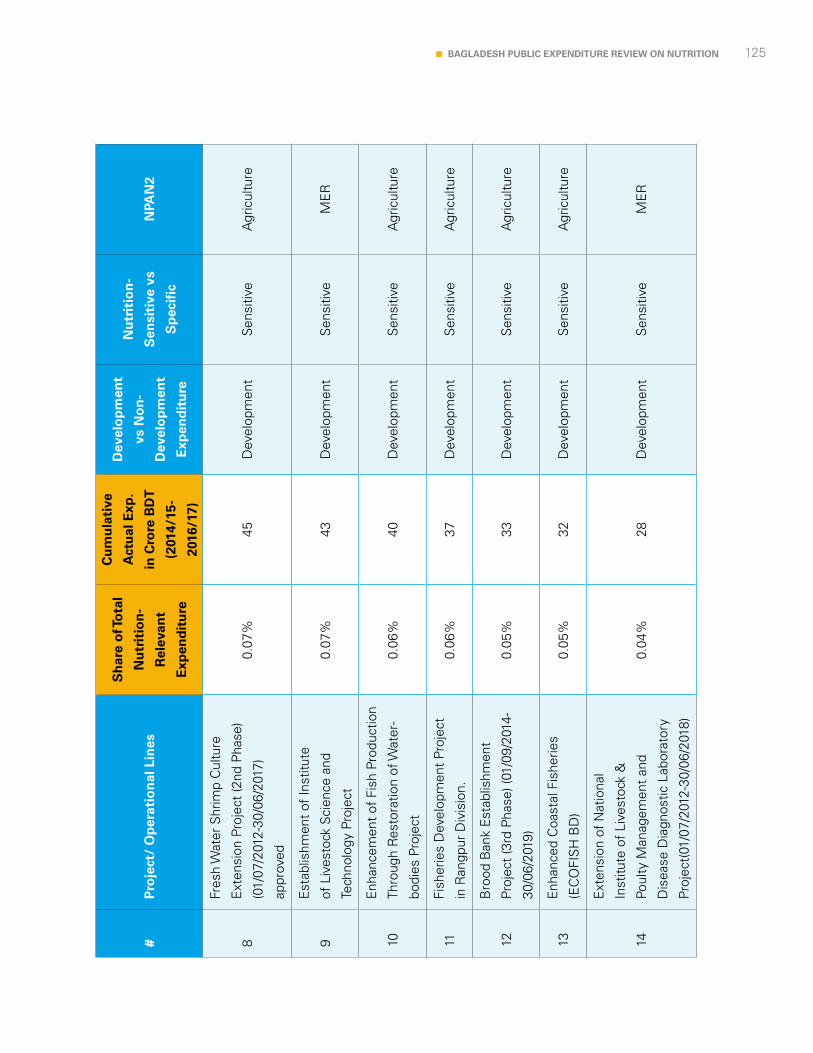
125BAGLADESH PUBLIC EXPENDITURE REVIEW ON NUTRITION
#P
roje
ct/
Op
erat
ion
al L
ines
Sh
are
of T
ota
l
Nu
trit
ion
-
Rel
evan
t
Exp
end
itu
re
Cu
mu
lati
ve
Act
ual
Exp
.
in C
rore
BD
T
(201
4/15
-
2016
/17)
Dev
elo
pm
ent
vs N
on
-
Dev
elo
pm
ent
Exp
end
itu
re
Nu
trit
ion
-
Sen
siti
ve v
s
Sp
ecif
ic
NPA
N2
8
Fres
h W
ater
Shr
imp
Cul
ture
Ext
ensi
on P
roje
ct (2
nd P
hase
)
(01/
07/2
012-
30/0
6/20
17)
appr
oved
0.07
%45
Dev
elop
men
tS
ensi
tive
Agr
icul
ture
9
Est
ablis
hmen
t of
Inst
itute
of L
ives
tock
Sci
ence
and
Tech
nolo
gy P
roje
ct
0.07
%43
Dev
elop
men
tS
ensi
tive
ME
R
10
Enh
ance
men
t of
Fis
h Pr
oduc
tion
Thro
ugh
Res
tora
tion
of W
ater
-
bodi
es P
roje
ct
0.06
%40
Dev
elop
men
tS
ensi
tive
Agr
icul
ture
11Fi
sher
ies
Dev
elop
men
t Pr
ojec
t
in R
angp
ur D
ivis
ion.
0.06
%37
Dev
elop
men
tS
ensi
tive
Agr
icul
ture
12
Bro
od B
ank
Est
ablis
hmen
t
Proj
ect
(3rd
Pha
se) (
01/0
9/20
14-
30/0
6/20
19)
0.05
%33
Dev
elop
men
tS
ensi
tive
Agr
icul
ture
13E
nhan
ced
Coa
stal
Fis
herie
s
(EC
OFI
SH
BD
)0.
05%
32D
evel
opm
ent
Sen
sitiv
eA
gric
ultu
re
14
Ext
ensi
on o
f N
atio
nal
Inst
itute
of
Live
stoc
k &
Poul
ty M
anag
emen
t an
d
Dis
ease
Dia
gnos
tic L
abor
ator
y
Proj
ect(
01/0
7/20
12-3
0/06
/201
8)
0.04
%28
Dev
elop
men
tS
ensi
tive
ME
R
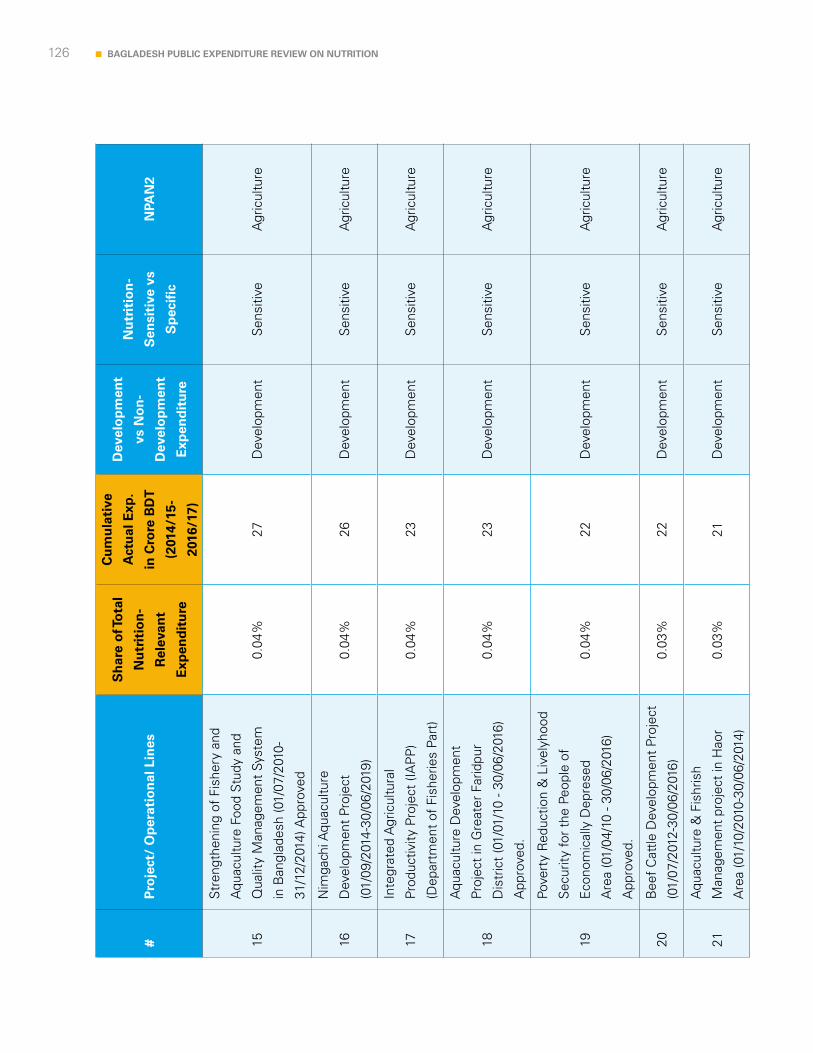
126 BAGLADESH PUBLIC EXPENDITURE REVIEW ON NUTRITION
#P
roje
ct/
Op
erat
ion
al L
ines
Sh
are
of T
ota
l
Nu
trit
ion
-
Rel
evan
t
Exp
end
itu
re
Cu
mu
lati
ve
Act
ual
Exp
.
in C
rore
BD
T
(201
4/15
-
2016
/17)
Dev
elo
pm
ent
vs N
on
-
Dev
elo
pm
ent
Exp
end
itu
re
Nu
trit
ion
-
Sen
siti
ve v
s
Sp
ecif
ic
NPA
N2
15
Str
engt
heni
ng o
f Fi
sher
y an
d
Aqu
acul
ture
Foo
d S
tudy
and
Qua
lity
Man
agem
ent
Syst
em
in B
angl
ades
h (0
1/07
/201
0-
31/1
2/20
14) A
ppro
ved
0.04
%27
Dev
elop
men
tS
ensi
tive
Agr
icul
ture
16
Nim
gach
i Aqu
acul
ture
Dev
elop
men
t Pr
ojec
t
(01/
09/2
014-
30/0
6/20
19)
0.04
%26
Dev
elop
men
tS
ensi
tive
Agr
icul
ture
17
Inte
grat
ed A
gric
ultu
ral
Prod
uctiv
ity P
roje
ct (I
AP
P)
(Dep
artm
ent
of F
ishe
ries
Part
)
0.04
%23
Dev
elop
men
tS
ensi
tive
Agr
icul
ture
18
Aqu
acul
ture
Dev
elop
men
t
Proj
ect
in G
reat
er F
arid
pur
Dis
tric
t (0
1/01
/10
- 30/
06/2
016)
App
rove
d.
0.04
%23
Dev
elop
men
tS
ensi
tive
Agr
icul
ture
19
Pove
rty
Red
uctio
n &
Liv
elyh
ood
Sec
urity
for
the
Peop
le o
f
Eco
nom
ical
ly D
epre
sed
Are
a (0
1/04
/10
- 30/
06/2
016)
App
rove
d.
0.04
%22
Dev
elop
men
tS
ensi
tive
Agr
icul
ture
20B
eef
Cat
tle D
evel
opm
ent
Proj
ect
(01/
07/2
012-
30/0
6/20
16)
0.03
%22
Dev
elop
men
tS
ensi
tive
Agr
icul
ture
21
Aqu
acul
ture
& F
ishr
ish
Man
agem
ent
proj
ect
in H
aor
Are
a (0
1/10
/201
0-30
/06/
2014
)
0.03
%21
Dev
elop
men
tS
ensi
tive
Agr
icul
ture

127BAGLADESH PUBLIC EXPENDITURE REVIEW ON NUTRITION
#P
roje
ct/
Op
erat
ion
al L
ines
Sh
are
of T
ota
l
Nu
trit
ion
-
Rel
evan
t
Exp
end
itu
re
Cu
mu
lati
ve
Act
ual
Exp
.
in C
rore
BD
T
(201
4/15
-
2016
/17)
Dev
elo
pm
ent
vs N
on
-
Dev
elo
pm
ent
Exp
end
itu
re
Nu
trit
ion
-
Sen
siti
ve v
s
Sp
ecif
ic
NPA
N2
22S
outh
Wes
t R
egio
n Li
vest
ock
Dev
elop
men
t Pr
ojec
t0.
03%
20D
evel
opm
ent
Sen
sitiv
eA
gric
ultu
re
23
Inte
grat
ed A
gric
ultu
ral
Prod
uctiv
ity P
roje
ct (I
AP
P)
(Dep
artm
ent
of L
ives
tock
Par
t)
(01/
07/1
1-31
/12/
16)
0.03
%19
Dev
elop
men
tS
ensi
tive
Agr
icul
ture
24
Cul
ture
of
Cuc
hia
(Mud
Eel
)
and
Cra
b in
sel
ecte
d ar
eas
of B
angl
ades
h an
d R
esea
rch
proj
ect
0.03
%18
Dev
elop
men
tS
ensi
tive
ME
R
25
Jatk
a Pr
otec
tion
Alte
rnat
ive
Livl
ihoo
ds a
nd R
esea
rch
Proj
ect
(DO
F Pa
rt) (
01/0
7/20
08-
30/0
6/20
13) A
ppro
ved.
0.03
%18
Dev
elop
men
tS
ensi
tive
Agr
icul
ture
26
Nat
iona
l Agr
icul
tura
Tech
nolo
gy
Prog
ram
Pha
se-2
Pro
ject
(NAT
P-2
) (D
OF
part
) 01/
10/2
015-
30/0
9/20
21
0.03
%17
Dev
elop
men
tS
ensi
tive
Agr
icul
ture
27
Est
ablis
hmen
t of
Fis
h La
ndin
g
Cen
ters
with
Art
iller
y Fa
cilit
ies
in
3 C
osta
l Dis
tric
ts a
t 4
Sel
ecte
d
Are
a
0.03
%16
Dev
elop
men
tS
ensi
tive
Agr
icul
ture

128 BAGLADESH PUBLIC EXPENDITURE REVIEW ON NUTRITION
#P
roje
ct/
Op
erat
ion
al L
ines
Sh
are
of T
ota
l
Nu
trit
ion
-
Rel
evan
t
Exp
end
itu
re
Cu
mu
lati
ve
Act
ual
Exp
.
in C
rore
BD
T
(201
4/15
-
2016
/17)
Dev
elo
pm
ent
vs N
on
-
Dev
elo
pm
ent
Exp
end
itu
re
Nu
trit
ion
-
Sen
siti
ve v
s
Sp
ecif
ic
NPA
N2
28
Nat
iona
l Agr
icul
tura
Tech
nolo
gy
Prog
ram
Pha
se-2
Pro
ject
(DLS
part
) (N
ATP
-2) 0
1/10
/201
5-
30/0
9/20
21
0.02
%15
Dev
elop
men
tS
ensi
tive
Agr
icul
ture
29
Ani
mal
Nut
ritio
n D
evel
opm
ent
and
Tech
nolo
gy Tr
ansf
er P
roje
ct
(2nd
Pha
se) (
01/0
7/20
15 -
31/1
2/20
17)
0.02
%14
Dev
elop
men
tS
ensi
tive
Agr
icul
ture
30
Inte
grat
ed A
gric
ultu
re
Inte
rven
tion
for
Food
and
Nut
ritut
ion
in S
elec
ted
Dis
tric
t of
Sou
ther
n B
angl
ades
h
0.02
%13
Dev
elop
men
tS
ensi
tive
Agr
icul
ture
31
Con
serv
atio
n an
d Im
prov
emen
t
of N
ativ
e S
heep
Thr
ough
Com
mun
ity F
arm
ing
and
Com
mer
cial
Far
min
g
(Com
pone
nt-A
)
0.02
%11
Dev
elop
men
tS
ensi
tive
Agr
icul
ture
32H
ura
Sag
ar A
quac
ultu
re a
nd
Fish
erie
s M
anag
emen
t Pr
ojec
t0.
02%
10D
evel
opm
ent
Sen
sitiv
eA
gric
ultu
re
33
Infr
astr
uctio
n D
evel
opm
ent
and
Res
earc
h S
tren
gthe
ning
of
the
fishe
ries
Res
earc
h In
stitu
te
(01/
07/2
010
-30/
06/2
013)
0.01
%9
Dev
elop
men
tS
ensi
tive
ME
R
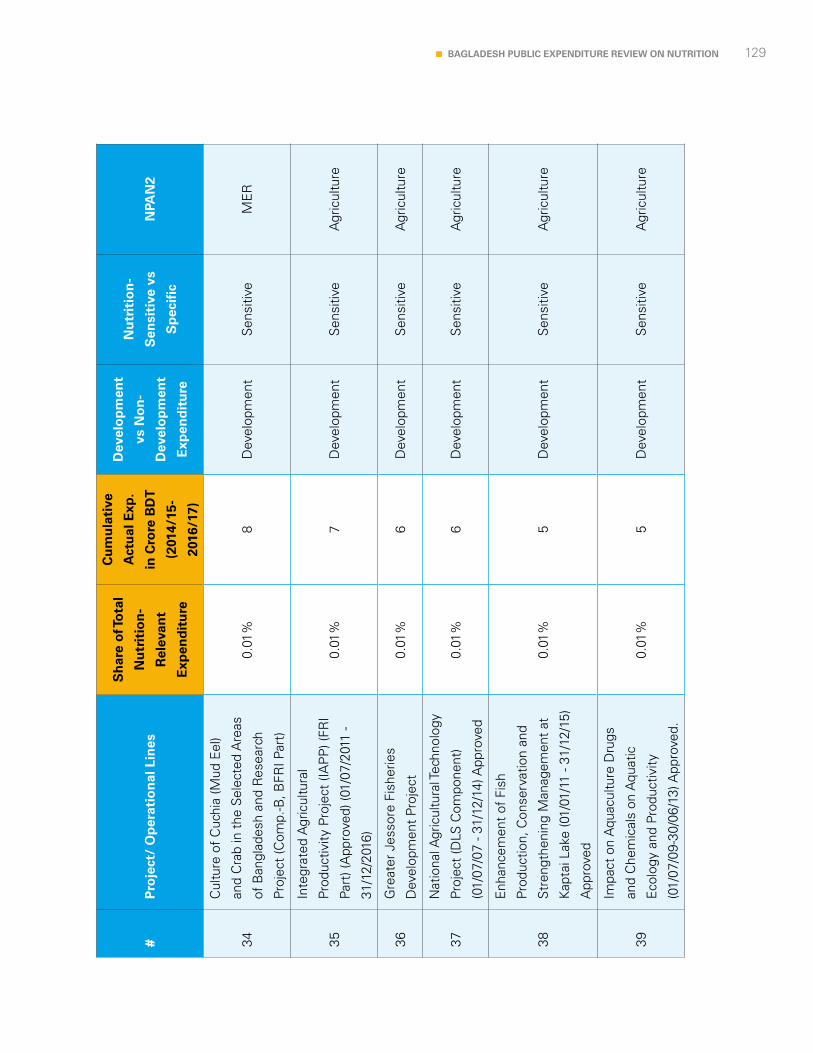
129BAGLADESH PUBLIC EXPENDITURE REVIEW ON NUTRITION
#P
roje
ct/
Op
erat
ion
al L
ines
Sh
are
of T
ota
l
Nu
trit
ion
-
Rel
evan
t
Exp
end
itu
re
Cu
mu
lati
ve
Act
ual
Exp
.
in C
rore
BD
T
(201
4/15
-
2016
/17)
Dev
elo
pm
ent
vs N
on
-
Dev
elo
pm
ent
Exp
end
itu
re
Nu
trit
ion
-
Sen
siti
ve v
s
Sp
ecif
ic
NPA
N2
34
Cul
ture
of
Cuc
hia
(Mud
Eel
)
and
Cra
b in
the
Sel
ecte
d A
reas
of B
angl
ades
h an
d R
esea
rch
Proj
ect
(Com
p.-B
, BFR
I Par
t)
0.01
%8
Dev
elop
men
tS
ensi
tive
ME
R
35
Inte
grat
ed A
gric
ultu
ral
Prod
uctiv
ity P
roje
ct (I
AP
P) (
FRI
Part
) (A
ppro
ved)
(01/
07/2
011
-
31/1
2/20
16)
0.01
%7
Dev
elop
men
tS
ensi
tive
Agr
icul
ture
36G
reat
er J
esso
re F
ishe
ries
Dev
elop
men
t Pr
ojec
t0.
01%
6D
evel
opm
ent
Sen
sitiv
eA
gric
ultu
re
37
Nat
iona
l Agr
icul
tura
l Tec
hnol
ogy
Proj
ect
(DLS
Com
pone
nt)
(01/
07/0
7 - 3
1/12
/14)
App
rove
d
0.01
%6
Dev
elop
men
tS
ensi
tive
Agr
icul
ture
38
Enh
ance
men
t of
Fis
h
Prod
uctio
n, C
onse
rvat
ion
and
Str
engt
heni
ng M
anag
emen
t at
Kap
tai L
ake
(01/
01/1
1 - 3
1/12
/15)
App
rove
d
0.01
%5
Dev
elop
men
tS
ensi
tive
Agr
icul
ture
39
Impa
ct o
n A
quac
ultu
re D
rugs
and
Che
mic
als
on A
quat
ic
Eco
logy
and
Pro
duct
ivity
(01/
07/0
9-30
/06/
13) A
ppro
ved.
0.01
%5
Dev
elop
men
tS
ensi
tive
Agr
icul
ture
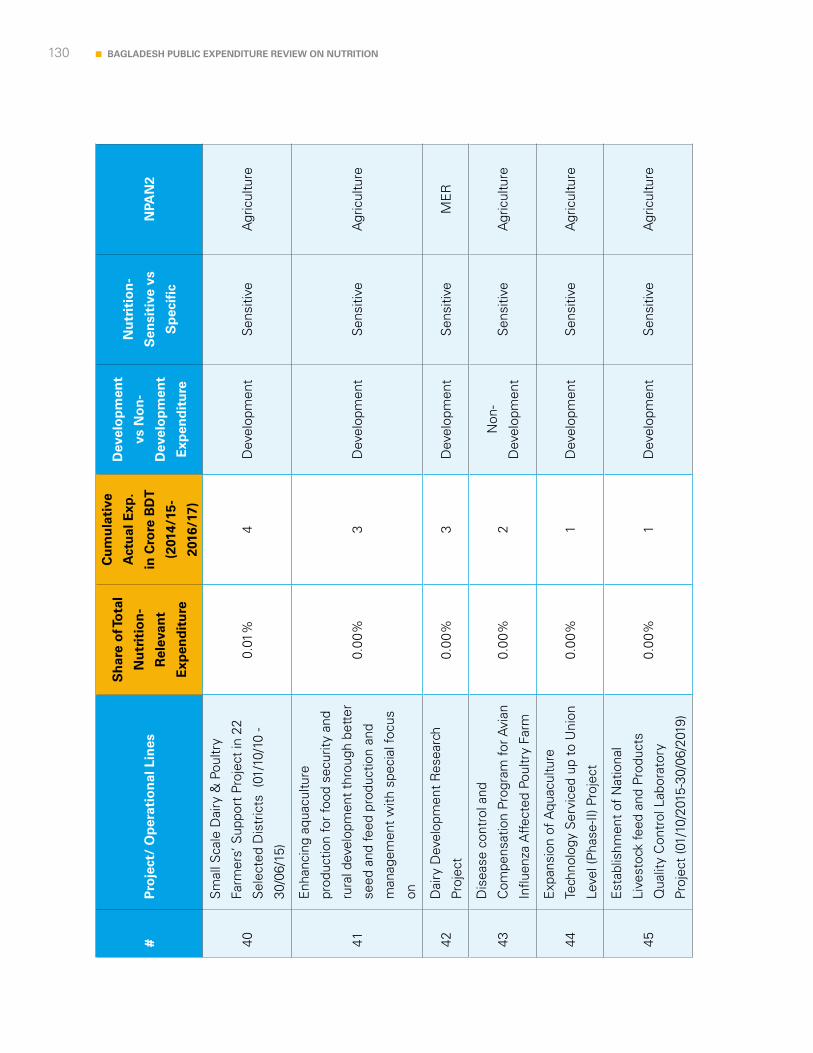
130 BAGLADESH PUBLIC EXPENDITURE REVIEW ON NUTRITION
#P
roje
ct/
Op
erat
ion
al L
ines
Sh
are
of T
ota
l
Nu
trit
ion
-
Rel
evan
t
Exp
end
itu
re
Cu
mu
lati
ve
Act
ual
Exp
.
in C
rore
BD
T
(201
4/15
-
2016
/17)
Dev
elo
pm
ent
vs N
on
-
Dev
elo
pm
ent
Exp
end
itu
re
Nu
trit
ion
-
Sen
siti
ve v
s
Sp
ecif
ic
NPA
N2
40
Sm
all S
cale
Dai
ry &
Pou
ltry
Farm
ers’
Sup
port
Pro
ject
in 2
2
Sel
ecte
d D
istr
icts
(01
/10/
10 -
30/0
6/15
)
0.01
%4
Dev
elop
men
tS
ensi
tive
Agr
icul
ture
41
Enh
anci
ng a
quac
ultu
re
prod
uctio
n fo
r fo
od s
ecur
ity a
nd
rura
l dev
elop
men
t th
roug
h be
tter
seed
and
feed
pro
duct
ion
and
man
agem
ent
with
spe
cial
focu
s
on
0.00
%3
Dev
elop
men
tS
ensi
tive
Agr
icul
ture
42D
airy
Dev
elop
men
t R
esea
rch
Proj
ect
0.00
%3
Dev
elop
men
tS
ensi
tive
ME
R
43
Dis
ease
con
trol
and
Com
pens
atio
n Pr
ogra
m fo
r Avi
an
Influ
enza
Affe
cted
Pou
ltry
Farm
0.00
%2
Non
-
Dev
elop
men
tS
ensi
tive
Agr
icul
ture
44
Exp
ansi
on o
f Aqu
acul
ture
Tech
nolo
gy S
ervi
ced
up t
o U
nion
Leve
l (P
hase
-II) P
roje
ct
0.00
%1
Dev
elop
men
tS
ensi
tive
Agr
icul
ture
45
Est
ablis
hmen
t of
Nat
iona
l
Live
stoc
k fe
ed a
nd P
rodu
cts
Qua
lity
Con
trol
Lab
orat
ory
Proj
ect
(01/
10/2
015-
30/0
6/20
19)
0.00
%1
Dev
elop
men
tS
ensi
tive
Agr
icul
ture
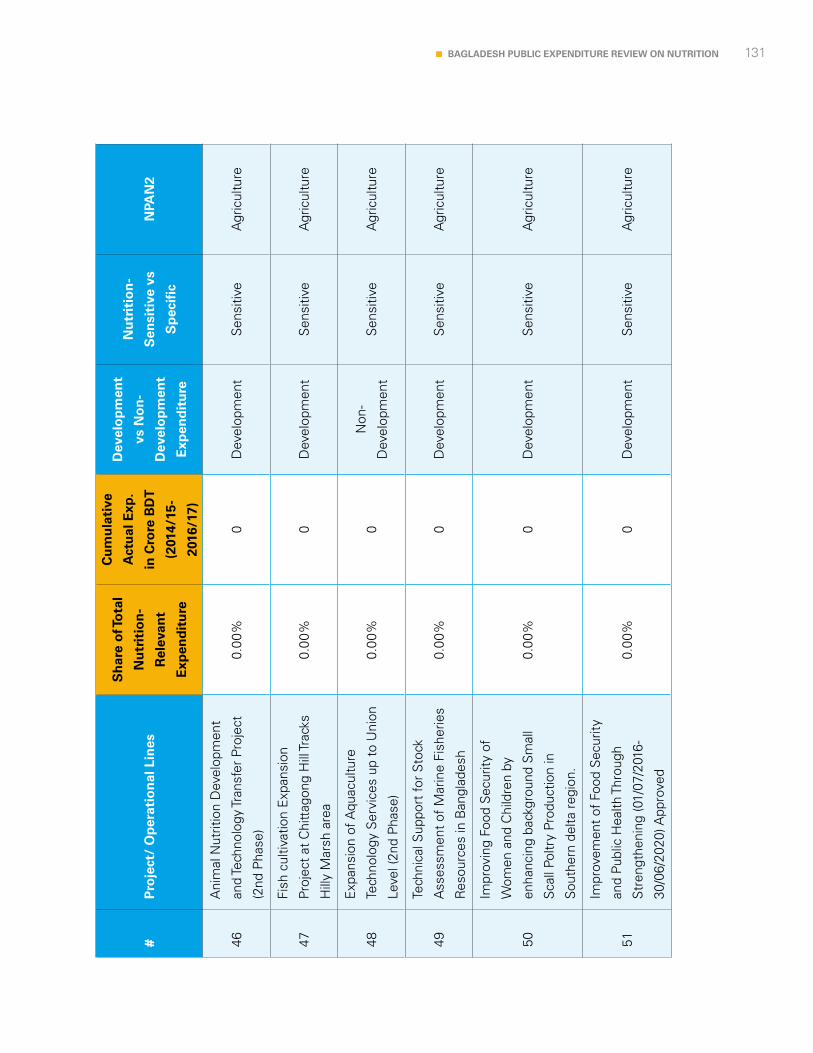
131BAGLADESH PUBLIC EXPENDITURE REVIEW ON NUTRITION
#P
roje
ct/
Op
erat
ion
al L
ines
Sh
are
of T
ota
l
Nu
trit
ion
-
Rel
evan
t
Exp
end
itu
re
Cu
mu
lati
ve
Act
ual
Exp
.
in C
rore
BD
T
(201
4/15
-
2016
/17)
Dev
elo
pm
ent
vs N
on
-
Dev
elo
pm
ent
Exp
end
itu
re
Nu
trit
ion
-
Sen
siti
ve v
s
Sp
ecif
ic
NPA
N2
46
Ani
mal
Nut
ritio
n D
evel
opm
ent
and
Tech
nolo
gy Tr
ansf
er P
roje
ct
(2nd
Pha
se)
0.00
%0
Dev
elop
men
tS
ensi
tive
Agr
icul
ture
47
Fish
cul
tivat
ion
Exp
ansi
on
Proj
ect
at C
hitt
agon
g H
ill Tr
acks
Hill
y M
arsh
are
a
0.00
%0
Dev
elop
men
tS
ensi
tive
Agr
icul
ture
48
Exp
ansi
on o
f Aqu
acul
ture
Tech
nolo
gy S
ervi
ces
up t
o U
nion
Leve
l (2n
d P
hase
)
0.00
%0
Non
-
Dev
elop
men
tS
ensi
tive
Agr
icul
ture
49
Tech
nica
l Sup
port
for
Sto
ck
Ass
essm
ent
of M
arin
e Fi
sher
ies
Res
ourc
es in
Ban
glad
esh
0.00
%0
Dev
elop
men
tS
ensi
tive
Agr
icul
ture
50
Impr
ovin
g Fo
od S
ecur
ity o
f
Wom
en a
nd C
hild
ren
by
enha
ncin
g ba
ckgr
ound
Sm
all
Sca
ll Po
ltry
Prod
uctio
n in
Sou
ther
n de
lta r
egio
n.
0.00
%0
Dev
elop
men
tS
ensi
tive
Agr
icul
ture
51
Impr
ovem
ent
of F
ood
Sec
urity
and
Publ
ic H
ealth
Thr
ough
Str
engt
heni
ng (0
1/07
/201
6-
30/0
6/20
20) A
ppro
ved
0.00
%0
Dev
elop
men
tS
ensi
tive
Agr
icul
ture
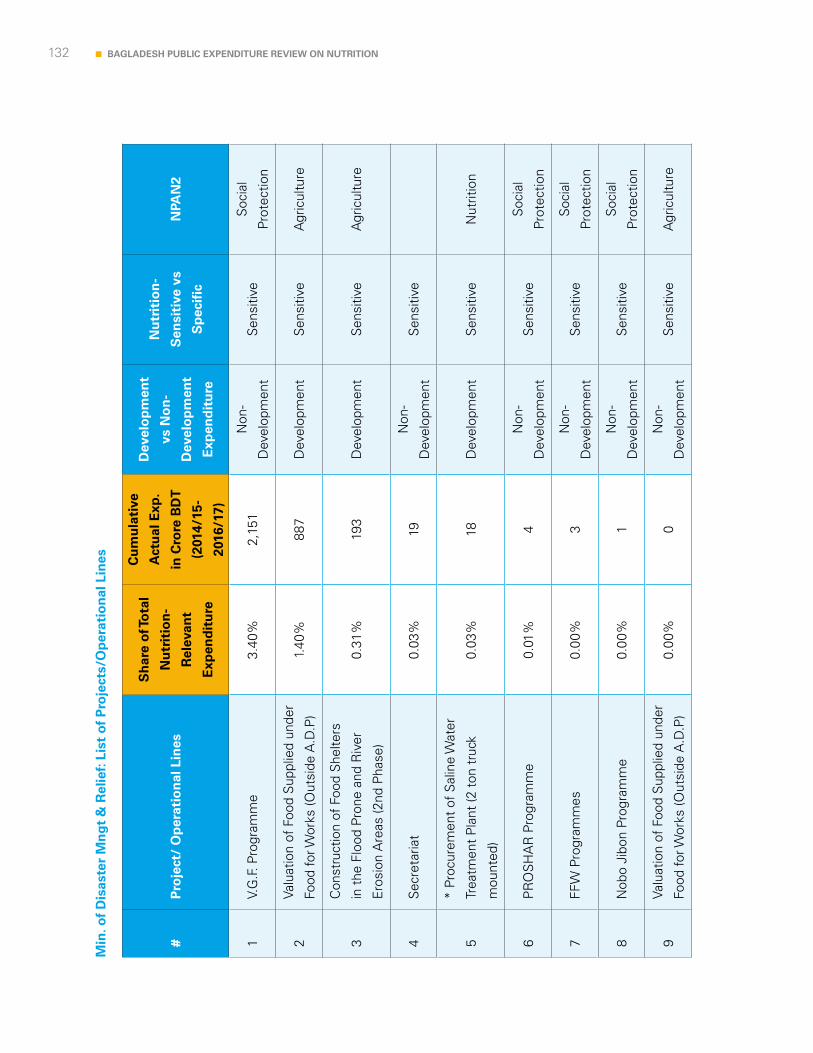
132 BAGLADESH PUBLIC EXPENDITURE REVIEW ON NUTRITION
Min
. of
Dis
aste
r M
ng
t &
Rel
ief:
List
of
Pro
ject
s/O
per
atio
nal
Lin
es
#P
roje
ct/
Op
erat
ion
al L
ines
Sh
are
of T
ota
l
Nu
trit
ion
-
Rel
evan
t
Exp
end
itu
re
Cu
mu
lati
ve
Act
ual
Exp
.
in C
rore
BD
T
(201
4/15
-
2016
/17)
Dev
elo
pm
ent
vs N
on
-
Dev
elo
pm
ent
Exp
end
itu
re
Nu
trit
ion
-
Sen
siti
ve v
s
Sp
ecif
ic
NPA
N2
1V.
G.F
. Pro
gram
me
3.40
%2,
151
Non
-
Dev
elop
men
tS
ensi
tive
Soc
ial
Prot
ectio
n
2Va
luat
ion
of F
ood
Sup
plie
d un
der
Food
for W
orks
(Out
side
A.D
.P)
1.40
%88
7D
evel
opm
ent
Sen
sitiv
eA
gric
ultu
re
3
Con
stru
ctio
n of
Foo
d S
helte
rs
in t
he F
lood
Pro
ne a
nd R
iver
Ero
sion
Are
as (2
nd P
hase
)
0.31
%19
3D
evel
opm
ent
Sen
sitiv
eA
gric
ultu
re
4S
ecre
taria
t0.
03%
19N
on-
Dev
elop
men
tS
ensi
tive
5
* Pr
ocur
emen
t of
Sal
ine
Wat
er
Trea
tmen
t P
lant
(2 t
on t
ruck
mou
nted
)
0.03
%18
Dev
elop
men
tS
ensi
tive
Nut
ritio
n
6P
RO
SH
AR
Pro
gram
me
0.01
%4
Non
-
Dev
elop
men
tS
ensi
tive
Soc
ial
Prot
ectio
n
7FF
W P
rogr
amm
es0.
00%
3N
on-
Dev
elop
men
tS
ensi
tive
Soc
ial
Prot
ectio
n
8N
obo
Jibo
n Pr
ogra
mm
e0.
00%
1N
on-
Dev
elop
men
tS
ensi
tive
Soc
ial
Prot
ectio
n
9Va
luat
ion
of F
ood
Sup
plie
d un
der
Food
for W
orks
(Out
side
A.D
.P)
0.00
%0
Non
-
Dev
elop
men
tS
ensi
tive
Agr
icul
ture

133BAGLADESH PUBLIC EXPENDITURE REVIEW ON NUTRITION
Min
. of
So
cial
Wel
fare
: Lis
t o
f P
roje
cts/
Op
erat
ion
al L
ines
#P
roje
ct/
Op
erat
ion
al L
ines
Sh
are
of T
ota
l
Nu
trit
ion
-
Rel
evan
t
Exp
end
itu
re
Cu
mu
lati
ve
Act
ual
Exp
.
in C
rore
BD
T
(201
4/15
-
2016
/17)
Dev
elo
pm
ent
vs N
on
-
Dev
elo
pm
ent
Exp
end
itu
re
Nu
trit
ion
-
Sen
siti
ve v
s
Sp
ecif
ic
NPA
N2
1D
epar
tmen
t of
Soc
ial S
ervi
ces
0.47
%29
5N
on-
Dev
elop
men
tS
ensi
tive
Soc
ial
Prot
ectio
n
2
She
ikh
Rus
sel T
rain
ing
and
Reh
abili
tatio
n C
entr
e fo
r
Chi
ldre
n
0.47
%29
5N
on-
Dev
elop
men
tS
ensi
tive
Soc
ial
Prot
ectio
n
3
Chi
ld S
ensi
tive
Soc
ial P
rote
ctio
n
in B
angl
ades
h (C
SP
B)
(01/
01/2
012
- 31/
12/2
016)
0.05
%34
Dev
elop
men
tS
ensi
tive
Soc
ial
Prot
ectio
n
4S
ecre
taria
t0.
05%
32N
on-
Dev
elop
men
tS
ensi
tive
5
Saf
e M
othe
rhoo
d A
ctiv
ities
in
Four
Upa
zilla
s of
Com
illa
Dis
tric
t
(Jan
uary
201
5-D
ecem
ber
2016
)
0.01
%4
Dev
elop
men
tS
ensi
tive
Nut
ritio
n
6S
afe
Mot
herh
ood
Act
iviti
es in
4
Upa
zille
s of
Com
illa
Dis
tric
t.0.
00%
0D
evel
opm
ent
Sen
sitiv
eN
utrit
ion
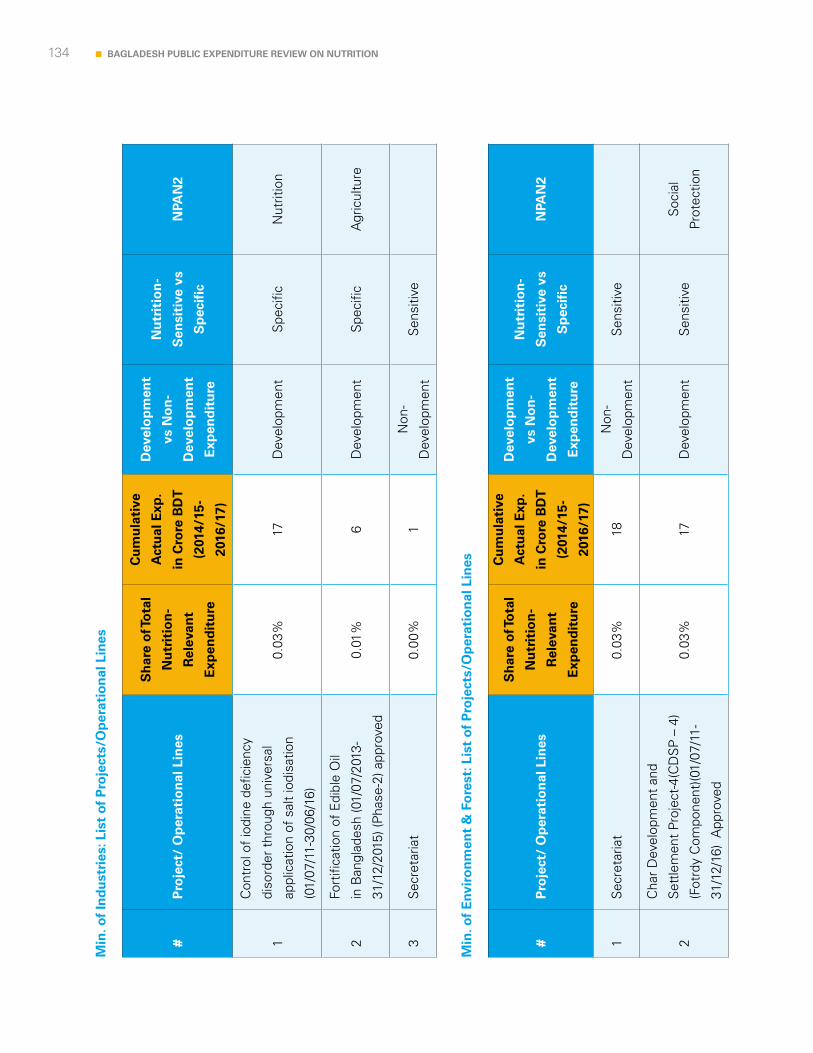
134 BAGLADESH PUBLIC EXPENDITURE REVIEW ON NUTRITION
Min
. of
Ind
ust
ries
: Lis
t o
f P
roje
cts/
Op
erat
ion
al L
ines
Min
. of
Env
iro
nm
ent
& F
ore
st: L
ist
of
Pro
ject
s/O
per
atio
nal
Lin
es
#P
roje
ct/
Op
erat
ion
al L
ines
Sh
are
of T
ota
l
Nu
trit
ion
-
Rel
evan
t
Exp
end
itu
re
Cu
mu
lati
ve
Act
ual
Exp
.
in C
rore
BD
T
(201
4/15
-
2016
/17)
Dev
elo
pm
ent
vs N
on
-
Dev
elo
pm
ent
Exp
end
itu
re
Nu
trit
ion
-
Sen
siti
ve v
s
Sp
ecif
ic
NPA
N2
1
Con
trol
of
iodi
ne d
efic
ienc
y
diso
rder
thr
ough
uni
vers
al
appl
icat
ion
of s
alt
iodi
satio
n
(01/
07/1
1-30
/06/
16)
0.03
%17
Dev
elop
men
tS
peci
ficN
utrit
ion
2
Fort
ifica
tion
of E
dibl
e O
il
in B
angl
ades
h (0
1/07
/201
3-
31/1
2/20
15) (
Pha
se-2
) app
rove
d
0.01
%6
Dev
elop
men
tS
peci
ficA
gric
ultu
re
3S
ecre
taria
t0.
00%
1N
on-
Dev
elop
men
tS
ensi
tive
#P
roje
ct/
Op
erat
ion
al L
ines
Sh
are
of T
ota
l
Nu
trit
ion
-
Rel
evan
t
Exp
end
itu
re
Cu
mu
lati
ve
Act
ual
Exp
.
in C
rore
BD
T
(201
4/15
-
2016
/17)
Dev
elo
pm
ent
vs N
on
-
Dev
elo
pm
ent
Exp
end
itu
re
Nu
trit
ion
-
Sen
siti
ve v
s
Sp
ecif
ic
NPA
N2
1S
ecre
taria
t0.
03%
18N
on-
Dev
elop
men
tS
ensi
tive
2
Cha
r D
evel
opm
ent
and
Set
tlem
ent
Proj
ect-
4(C
DS
P –
4)
(Fot
rdy
Com
pone
nt)(0
1/07
/11-
31/1
2/16
) A
ppro
ved
0.03
%17
Dev
elop
men
tS
ensi
tive
Soc
ial
Prot
ectio
n
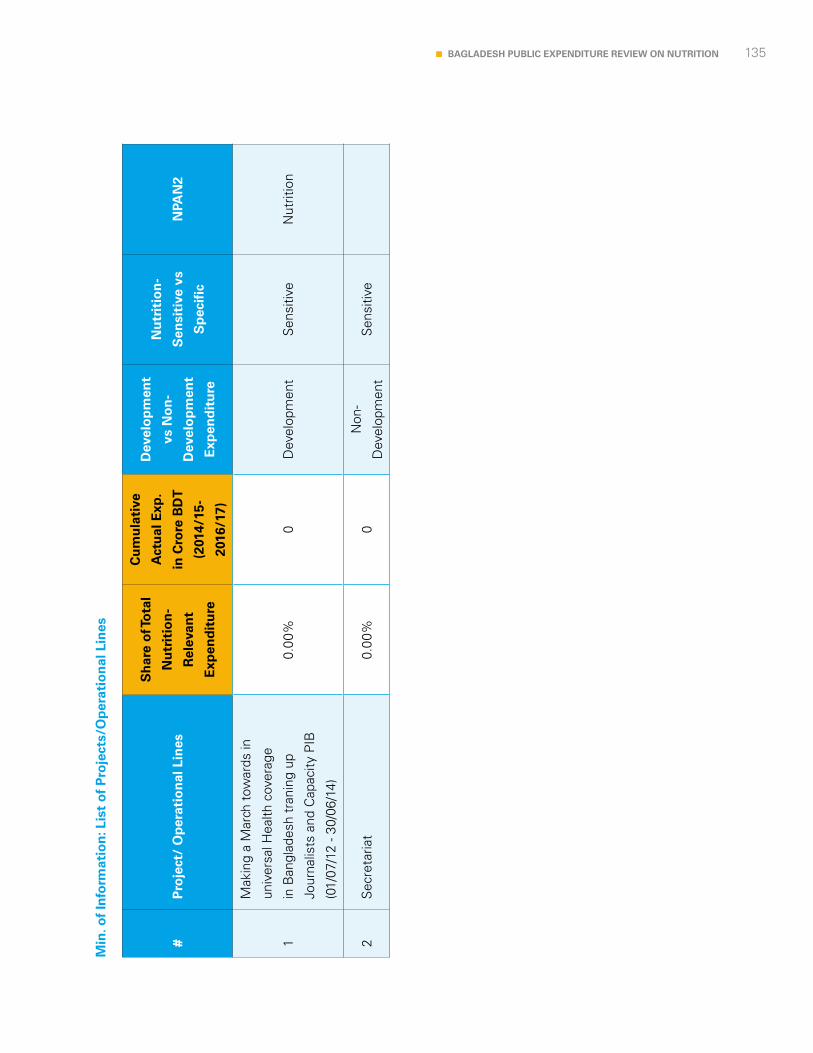
135BAGLADESH PUBLIC EXPENDITURE REVIEW ON NUTRITION
Min
. of
Info
rmat
ion
: Lis
t o
f P
roje
cts/
Op
erat
ion
al L
ines
#P
roje
ct/
Op
erat
ion
al L
ines
Sh
are
of T
ota
l
Nu
trit
ion
-
Rel
evan
t
Exp
end
itu
re
Cu
mu
lati
ve
Act
ual
Exp
.
in C
rore
BD
T
(201
4/15
-
2016
/17)
Dev
elo
pm
ent
vs N
on
-
Dev
elo
pm
ent
Exp
end
itu
re
Nu
trit
ion
-
Sen
siti
ve v
s
Sp
ecif
ic
NPA
N2
1
Mak
ing
a M
arch
tow
ards
in
univ
ersa
l Hea
lth c
over
age
in B
angl
ades
h tr
anin
g up
Jour
nalis
ts a
nd C
apac
ity P
IB
(01/
07/1
2 - 3
0/06
/14)
0.00
%0
Dev
elop
men
tS
ensi
tive
Nut
ritio
n
2S
ecre
taria
t0.
00%
0N
on-
Dev
elop
men
tS
ensi
tive
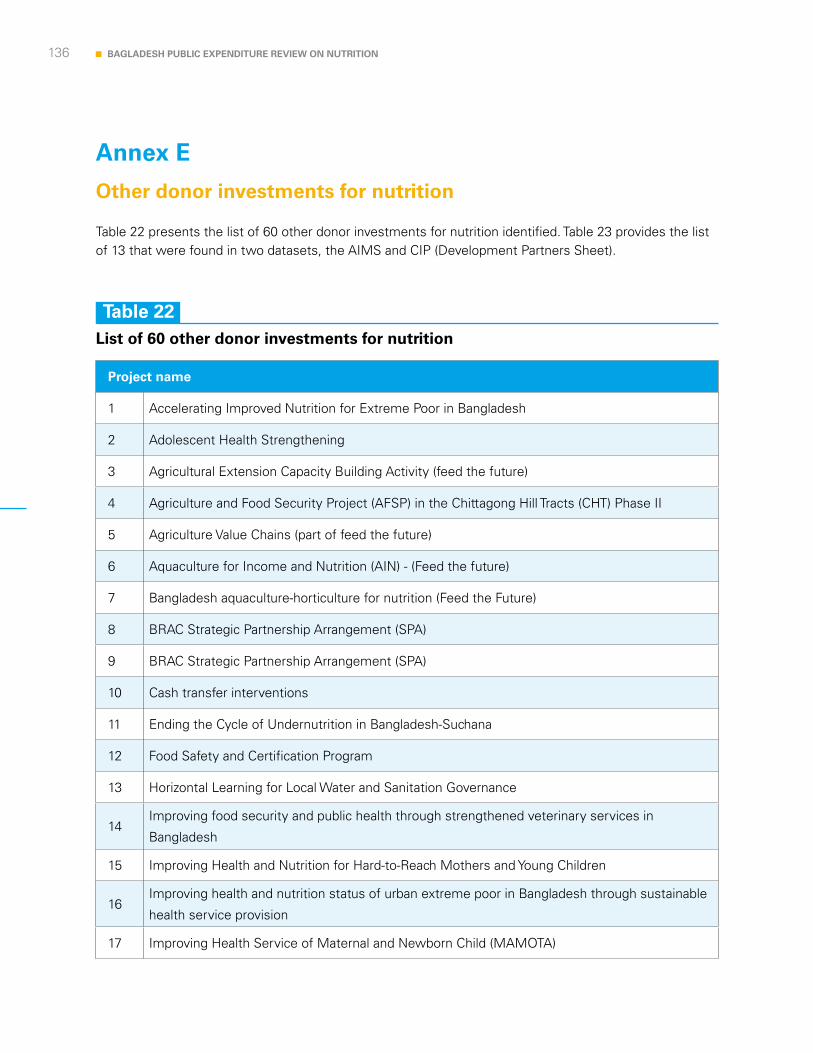
136 BAGLADESH PUBLIC EXPENDITURE REVIEW ON NUTRITION
Annex E
Other donor investments for nutrition
Table 22 presents the list of 60 other donor investments for nutrition identified. Table 23 provides the list of 13 that were found in two datasets, the AIMS and CIP (Development Partners Sheet).
Table 11
Table 22List of 60 other donor investments for nutrition
Project name
1 Accelerating Improved Nutrition for Extreme Poor in Bangladesh
2 Adolescent Health Strengthening
3 Agricultural Extension Capacity Building Activity (feed the future)
4 Agriculture and Food Security Project (AFSP) in the Chittagong Hill Tracts (CHT) Phase II
5 Agriculture Value Chains (part of feed the future)
6 Aquaculture for Income and Nutrition (AIN) - (Feed the future)
7 Bangladesh aquaculture-horticulture for nutrition (Feed the Future)
8 BRAC Strategic Partnership Arrangement (SPA)
9 BRAC Strategic Partnership Arrangement (SPA)
10 Cash transfer interventions
11 Ending the Cycle of Undernutrition in Bangladesh-Suchana
12 Food Safety and Certification Program
13 Horizontal Learning for Local Water and Sanitation Governance
14Improving food security and public health through strengthened veterinary services in
Bangladesh
15 Improving Health and Nutrition for Hard-to-Reach Mothers and Young Children
16Improving health and nutrition status of urban extreme poor in Bangladesh through sustainable
health service provision
17 Improving Health Service of Maternal and Newborn Child (MAMOTA)
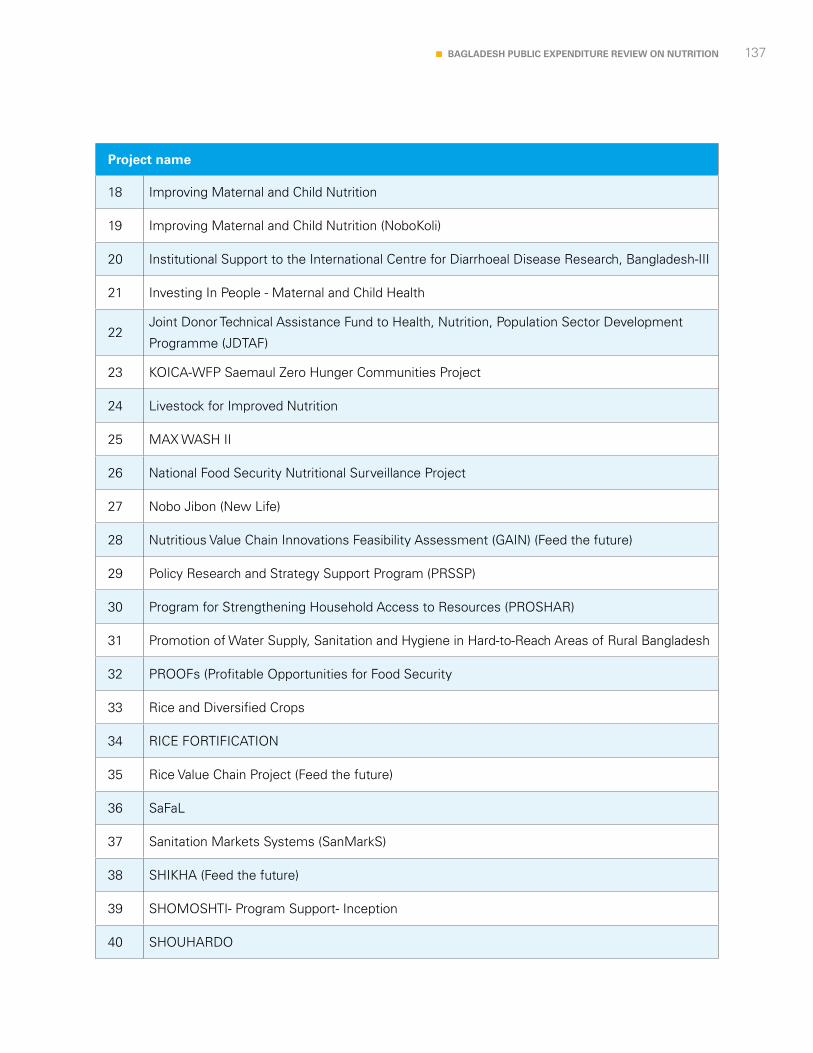
137BAGLADESH PUBLIC EXPENDITURE REVIEW ON NUTRITION
Project name
18 Improving Maternal and Child Nutrition
19 Improving Maternal and Child Nutrition (NoboKoli)
20 Institutional Support to the International Centre for Diarrhoeal Disease Research, Bangladesh-III
21 Investing In People - Maternal and Child Health
22Joint Donor Technical Assistance Fund to Health, Nutrition, Population Sector Development
Programme (JDTAF)
23 KOICA-WFP Saemaul Zero Hunger Communities Project
24 Livestock for Improved Nutrition
25 MAX WASH II
26 National Food Security Nutritional Surveillance Project
27 Nobo Jibon (New Life)
28 Nutritious Value Chain Innovations Feasibility Assessment (GAIN) (Feed the future)
29 Policy Research and Strategy Support Program (PRSSP)
30 Program for Strengthening Household Access to Resources (PROSHAR)
31 Promotion of Water Supply, Sanitation and Hygiene in Hard-to-Reach Areas of Rural Bangladesh
32 PROOFs (Profitable Opportunities for Food Security
33 Rice and Diversified Crops
34 RICE FORTIFICATION
35 Rice Value Chain Project (Feed the future)
36 SaFaL
37 Sanitation Markets Systems (SanMarkS)
38 SHIKHA (Feed the future)
39 SHOMOSHTI- Program Support- Inception
40 SHOUHARDO
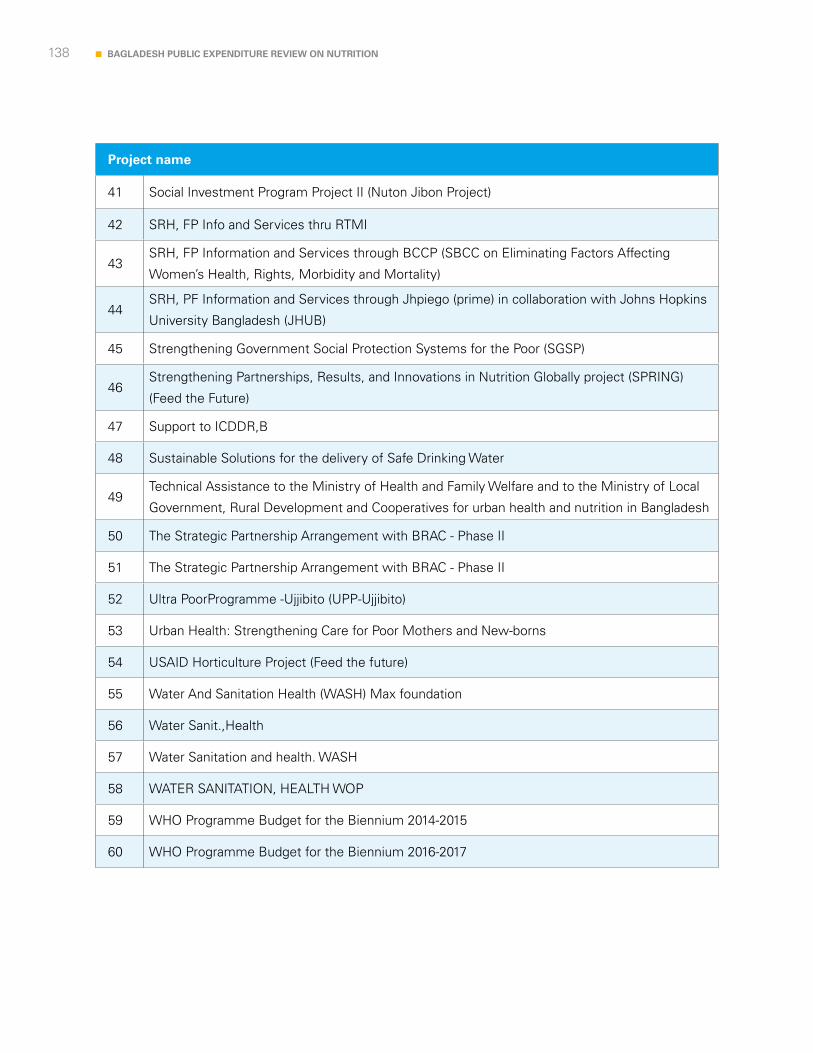
138 BAGLADESH PUBLIC EXPENDITURE REVIEW ON NUTRITION
Project name
41 Social Investment Program Project II (Nuton Jibon Project)
42 SRH, FP Info and Services thru RTMI
43SRH, FP Information and Services through BCCP (SBCC on Eliminating Factors Affecting
Women’s Health, Rights, Morbidity and Mortality)
44SRH, PF Information and Services through Jhpiego (prime) in collaboration with Johns Hopkins
University Bangladesh (JHUB)
45 Strengthening Government Social Protection Systems for the Poor (SGSP)
46Strengthening Partnerships, Results, and Innovations in Nutrition Globally project (SPRING)
(Feed the Future)
47 Support to ICDDR,B
48 Sustainable Solutions for the delivery of Safe Drinking Water
49Technical Assistance to the Ministry of Health and Family Welfare and to the Ministry of Local
Government, Rural Development and Cooperatives for urban health and nutrition in Bangladesh
50 The Strategic Partnership Arrangement with BRAC - Phase II
51 The Strategic Partnership Arrangement with BRAC - Phase II
52 Ultra PoorProgramme -Ujjibito (UPP-Ujjibito)
53 Urban Health: Strengthening Care for Poor Mothers and New-borns
54 USAID Horticulture Project (Feed the future)
55 Water And Sanitation Health (WASH) Max foundation
56 Water Sanit.,Health
57 Water Sanitation and health. WASH
58 WATER SANITATION, HEALTH WOP
59 WHO Programme Budget for the Biennium 2014-2015
60 WHO Programme Budget for the Biennium 2016-2017
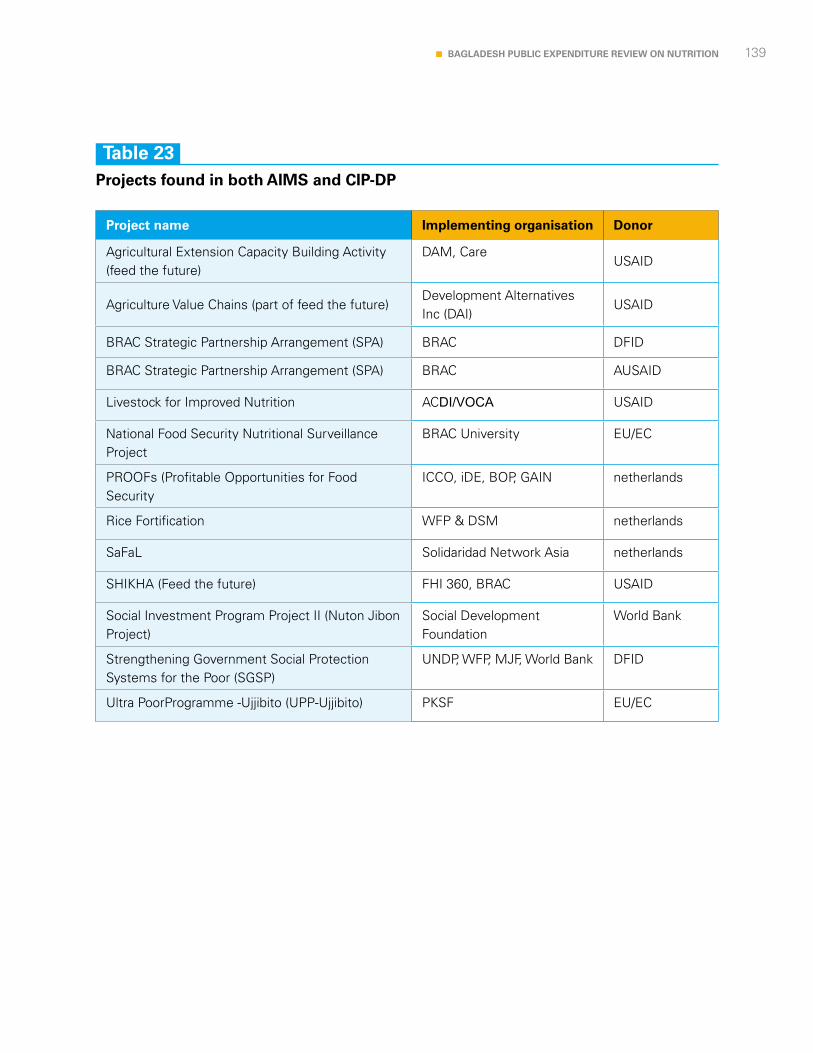
139BAGLADESH PUBLIC EXPENDITURE REVIEW ON NUTRITION
Table 23Projects found in both AIMS and CIP-DP
Project name Implementing organisation Donor
Agricultural Extension Capacity Building Activity (feed the future)
DAM, CareUSAID
Agriculture Value Chains (part of feed the future)Development Alternatives Inc (DAI)
USAID
BRAC Strategic Partnership Arrangement (SPA) BRAC DFID
BRAC Strategic Partnership Arrangement (SPA) BRAC AUSAID
Livestock for Improved Nutrition ACDI/VOCA USAID
National Food Security Nutritional Surveillance Project
BRAC University EU/EC
PROOFs (Profitable Opportunities for Food Security
ICCO, iDE, BOP, GAIN netherlands
Rice Fortification WFP & DSM netherlands
SaFaL Solidaridad Network Asia netherlands
SHIKHA (Feed the future) FHI 360, BRAC USAID
Social Investment Program Project II (Nuton Jibon Project)
Social Development Foundation
World Bank
Strengthening Government Social Protection Systems for the Poor (SGSP)
UNDP, WFP, MJF, World Bank DFID
Ultra PoorProgramme -Ujjibito (UPP-Ujjibito) PKSF EU/EC

140 BAGLADESH PUBLIC EXPENDITURE REVIEW ON NUTRITION
Annex F
Validation Workshop
F.1 Agenda
Table 22 presents the list of 60 other donor investments for nutrition identified. Table 23 provides the list of 13 that were found in two datasets, the AIMS and CIP (Development Partners Sheet).
Time Agenda item Responsible
9:00-
9:30
Arrival and Registration MoF
9:30-
10:00
Introductions and opening speeches MoF, BNNC, UNICEF
10:00-
10:30
NPAN2 and the importance of the PER-N
Presentation on the NPAN2, frame the workshop and place the
importance of the PER-N
BNNC
10:30-
11:00
The PER-N in Bangladesh – Methodology
Participants will be introduced to the specific objectives and
scope of the PER, as well as the methodology
OPM
11:00-
11:15Break
11:15-
12:00
The PER-N in Bangladesh – Key findings presentation
Participants are requested to allow the presenters to run through
the whole presentation before raising questions.
OPM
12:00-
12:45
Comments and reactions to the findings
This will be a Q&A session to allow participants to react to the
findings and provide further clarification where requested.
OPM
12:45-
13:45LUNCH
13:45-
14:00
Introduction to Breakout session
This will present the group work planned to discuss
the key topics emerging from the findings and develop
recommendations.
OPM
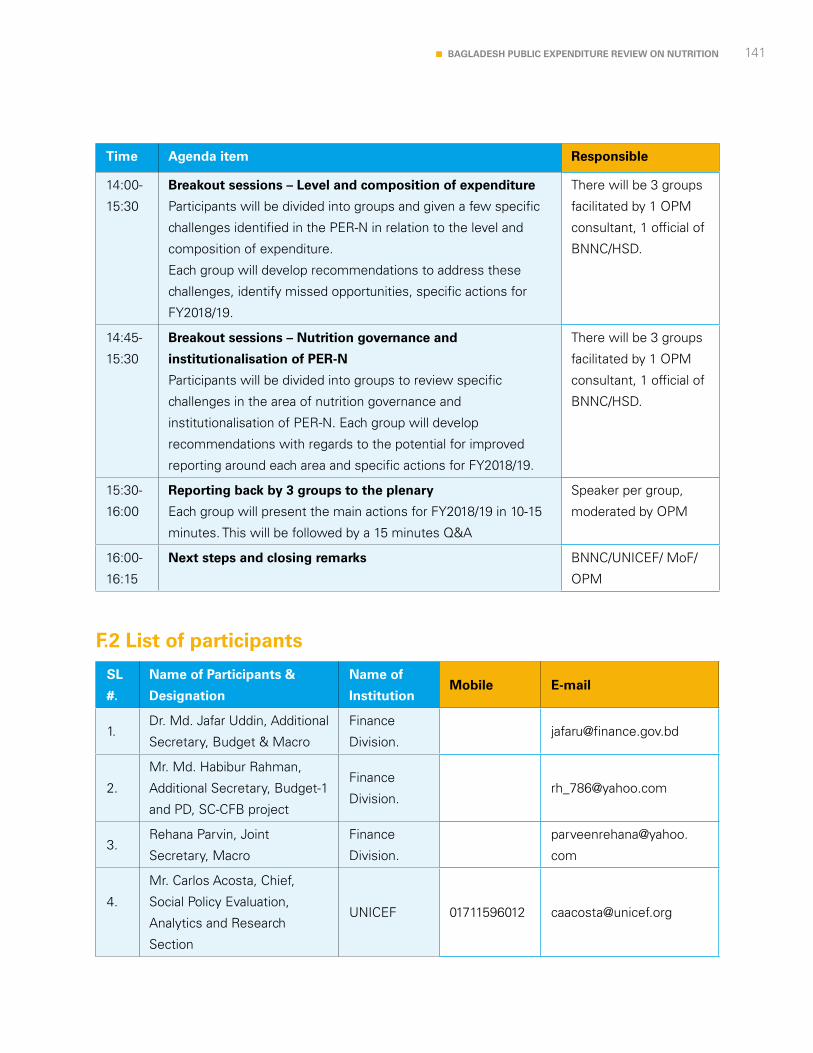
141BAGLADESH PUBLIC EXPENDITURE REVIEW ON NUTRITION
F.2 List of participants
Time Agenda item Responsible
14:00-
15:30
Breakout sessions – Level and composition of expenditure
Participants will be divided into groups and given a few specific
challenges identified in the PER-N in relation to the level and
composition of expenditure.
Each group will develop recommendations to address these
challenges, identify missed opportunities, specific actions for
FY2018/19.
There will be 3 groups
facilitated by 1 OPM
consultant, 1 official of
BNNC/HSD.
14:45-
15:30
Breakout sessions – Nutrition governance and
institutionalisation of PER-N
Participants will be divided into groups to review specific
challenges in the area of nutrition governance and
institutionalisation of PER-N. Each group will develop
recommendations with regards to the potential for improved
reporting around each area and specific actions for FY2018/19.
There will be 3 groups
facilitated by 1 OPM
consultant, 1 official of
BNNC/HSD.
15:30-
16:00
Reporting back by 3 groups to the plenary
Each group will present the main actions for FY2018/19 in 10-15
minutes. This will be followed by a 15 minutes Q&A
Speaker per group,
moderated by OPM
16:00-
16:15
Next steps and closing remarks BNNC/UNICEF/ MoF/
OPM
SL
#.
Name of Participants &
Designation
Name of
InstitutionMobile E-mail
1.Dr. Md. Jafar Uddin, Additional
Secretary, Budget & Macro
Finance
2.
Mr. Md. Habibur Rahman,
Additional Secretary, Budget-1
and PD, SC-CFB project
Finance
3.Rehana Parvin, Joint
Secretary, Macro
Finance
Division.
parveenrehana@yahoo.
com
4.
Mr. Carlos Acosta, Chief,
Social Policy Evaluation,
Analytics and Research
Section
UNICEF 01711596012 [email protected]
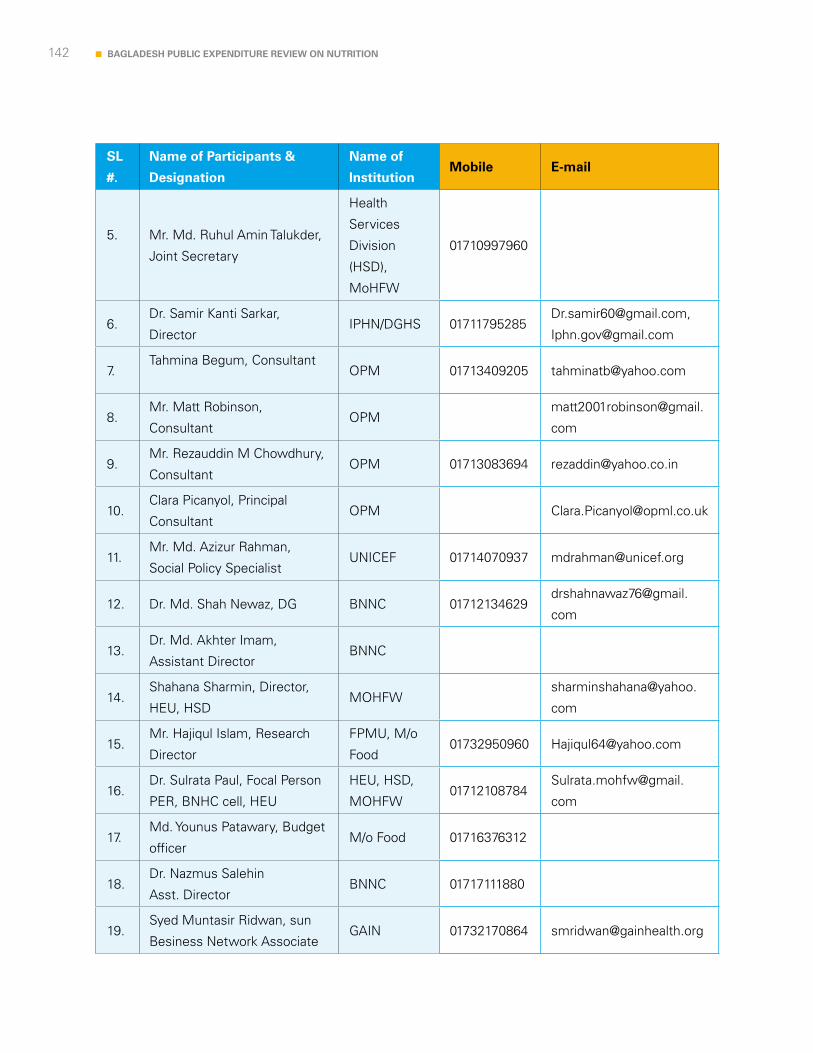
142 BAGLADESH PUBLIC EXPENDITURE REVIEW ON NUTRITION
SL
#.
Name of Participants &
Designation
Name of
InstitutionMobile E-mail
5. Mr. Md. Ruhul Amin Talukder,
Joint Secretary
Health
Services
Division
(HSD),
MoHFW
01710997960
6.Dr. Samir Kanti Sarkar,
DirectorIPHN/DGHS 01711795285
7.Tahmina Begum, Consultant
OPM 01713409205 [email protected]
8.Mr. Matt Robinson,
ConsultantOPM
matt2001robinson@gmail.
com
9.Mr. Rezauddin M Chowdhury,
ConsultantOPM 01713083694 [email protected]
10.Clara Picanyol, Principal
ConsultantOPM [email protected]
11.Mr. Md. Azizur Rahman,
Social Policy SpecialistUNICEF 01714070937 [email protected]
12. Dr. Md. Shah Newaz, DG BNNC 01712134629drshahnawaz76@gmail.
com
13.Dr. Md. Akhter Imam,
Assistant DirectorBNNC
14.Shahana Sharmin, Director,
HEU, HSDMOHFW
sharminshahana@yahoo.
com
15.Mr. Hajiqul Islam, Research
Director
FPMU, M/o
Food01732950960 [email protected]
16.Dr. Sulrata Paul, Focal Person
PER, BNHC cell, HEU
HEU, HSD,
MOHFW01712108784
Sulrata.mohfw@gmail.
com
17.Md. Younus Patawary, Budget
officerM/o Food 01716376312
18.Dr. Nazmus Salehin
Asst. DirectorBNNC 01717111880
19.Syed Muntasir Ridwan, sun
Besiness Network AssociateGAIN 01732170864 [email protected]

143BAGLADESH PUBLIC EXPENDITURE REVIEW ON NUTRITION
SL
#.
Name of Participants &
Designation
Name of
InstitutionMobile E-mail
20.Dr. Sabiha Sultana Technical
SpecialistGAIN 01818756212 [email protected]
21. Md. Mostafizur Rahman, SAC
Programing
Division, M
of Planning
01914878320 [email protected]
22.Mr. Mustafa Faruq Al Banna,
Associate Research DirectorFPMU 01716080759
Mustafa.banna@gmail.
com
23.Mr. Shakil Ahmed, Senior
Economist (Health) World
Bank
World Bank,019114008 [email protected]
24.Dr. Md. Enamul Haque, D S,
HSD,MOHFW 01552204208 [email protected]
25. Shikha Sarker
Deputy Secretary
M/o
Environment,
Forest &
Climate
Change
01791712540 [email protected]
26. Dr. Mohsin Ali, Consultant, UNICEF 01819242007 [email protected]
27. Piyali Mustaphi UNICEF 01711-882521 [email protected]
28. Golam Mohiuddin Khan Sadi UNICEF 01963-500500 [email protected]
29. Mr Md. Sazzadul Islam, D D MOSW [email protected]
30.Mr.Md. Nazrul Islam, Asst.
Chief,TMED, MOE 01558501240 [email protected]
31.Mr. Md. Nurun Nabi , Asst.
ChiefMoPME 01717272191
32. Dr. Md. Sarwar Bari, D S ME & FWD 01710957229 [email protected]
33.Mr. Md. Jahangir Hossain
Bapare, SAS
M/o
Industries01714643236 [email protected]
34.Mr. Md. Habibur Rahman,
Program Officer
M/o
information01711787085 [email protected]
35. Mehroosh Tak OPM [email protected]
36.Papia Sultana, Program
Officer, MCNHNational [email protected]

144 BAGLADESH PUBLIC EXPENDITURE REVIEW ON NUTRITION
SL
#.
Name of Participants &
Designation
Name of
InstitutionMobile E-mail
37. Josh Chipman, CM OPM [email protected]
38.Pragya Mathema, Nutrition
SpecialistUNICEF 01787285694 [email protected]
39. Muhammad Ziaul Hoque UNICEF 01721573333 [email protected]
40. Kismot Jahan Ferdousi, SAC MOWCA 01556343003planningonemowca@
gmail.com
41. Bikash Chandra Barmon, AC MoA 01723398090Planning2.moa@gmail.
com
42. Rahima Akhter, SAS
M/o
Religious
Affairs
01784196662
43.Nurun Nahar
SAC
Health
Services
Division
01550153612 [email protected]
44.Mr. Md. Harun-Ar-Rashid,
Hardware EngineerFD/FSMU 01711547692, [email protected]
45.Md. Abu Bakar Siddike, Asst.
Eng.M/o Food 01552348447
46. Pulakesh Mondal, SAC
M/o
Fishering and
livestock
01711047068 [email protected]
47.Abdullah Al Arif, Deputy
SecretaryM/DMR 01819257586 [email protected]
48. Molla Md. Anisuzzaman, SAC SHED, MOE 01918958563 [email protected]
49.Md. Nurul Amin, Deputy
SecretaryMOPME 01711231818 [email protected]
50.Md. Saifur Rahman, Sr. Asst
Chief
Local
Government
Division
01712009821 [email protected]
51. Dr. Shahed RahmanSave the
Children01731566111
Shahed.rahman@
savethechildren.org
52. Md. Shah Alam Miah, A o FD 01552335323Saadsourav.2015@gmail.
com
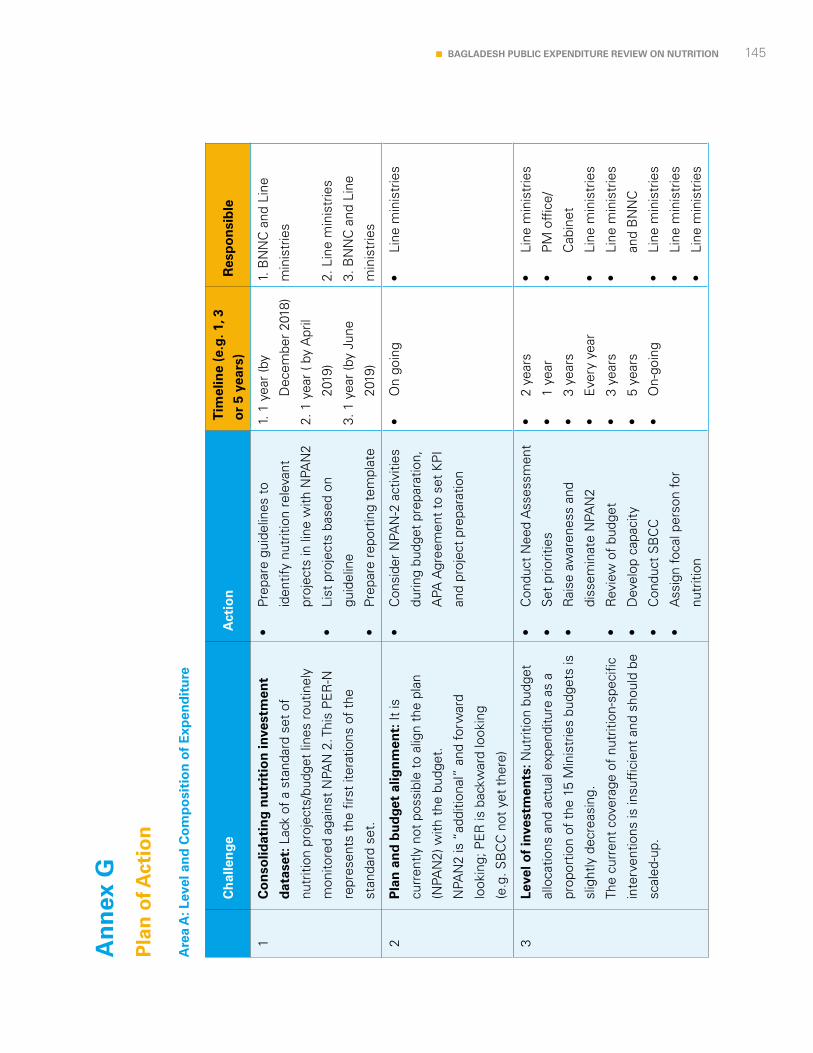
145BAGLADESH PUBLIC EXPENDITURE REVIEW ON NUTRITION
An
nex
G
Pla
n o
f Act
ion
Are
a A
: Lev
el a
nd
Co
mp
osi
tio
n o
f E
xpen
dit
ure
Ch
alle
nge
Act
ion
T
imel
ine
(e.g
. 1, 3
or
5 ye
ars)
Res
po
nsi
ble
1C
on
solid
atin
g n
utr
itio
n in
vest
men
t
dat
aset
: Lac
k of
a s
tand
ard
set
of
nutr
ition
pro
ject
s/bu
dget
line
s ro
utin
ely
mon
itore
d ag
ains
t N
PAN
2. T
his
PE
R-N
repr
esen
ts t
he f
irst
itera
tions
of
the
stan
dard
set
.
•Prepareguidelinesto
iden
tify
nutr
ition
rel
evan
t
proj
ects
in li
ne w
ith N
PAN
2
•Listprojectsbasedon
guid
elin
e
•Preparereportingtemplate
1. 1
yea
r (b
y
Dec
embe
r 20
18)
2. 1
yea
r ( b
y A
pril
2019
)
3. 1
yea
r (b
y Ju
ne
2019
)
1. B
NN
C a
nd L
ine
min
istr
ies
2. L
ine
min
istr
ies
3. B
NN
C a
nd L
ine
min
istr
ies
2P
lan
an
d b
ud
get
alig
nm
ent:
It is
curr
ently
not
pos
sibl
e to
alig
n th
e pl
an
(NPA
N2)
with
the
bud
get.
NPA
N2
is “
addi
tiona
l” a
nd fo
rwar
d
look
ing;
PE
R is
bac
kwar
d lo
okin
g
(e.g
. SB
CC
not
yet
the
re)
•ConsiderNPAN-2activities
durin
g bu
dget
pre
para
tion,
APA
Agr
eem
ent
to s
et K
PI
and
proj
ect
prep
arat
ion
•Ongoing
•Lineministries
3Le
vel o
f in
vest
men
ts: N
utrit
ion
budg
et
allo
catio
ns a
nd a
ctua
l exp
endi
ture
as
a
prop
ortio
n of
the
15
Min
istr
ies
budg
ets
is
slig
htly
dec
reas
ing.
The
curr
ent
cove
rage
of
nutr
ition
-spe
cific
inte
rven
tions
is in
suff
icie
nt a
nd s
houl
d be
scal
ed-u
p.
•ConductNeedAssessm
ent
•Setpriorities
•Raiseawarenessand
diss
emin
ate
NPA
N2
•Reviewofbudget
•Developcapacity
•ConductSBCC
•Assignfocalpersonfor
nutr
ition
•2years
•1year
•3years
•Everyyear
•3years
•5years
•On-going
•Lineministries
•PMoffice/
Cab
inet
•Lineministries
•Lineministries
and
BN
NC
•Lineministries
•Lineministries
•Lineministries
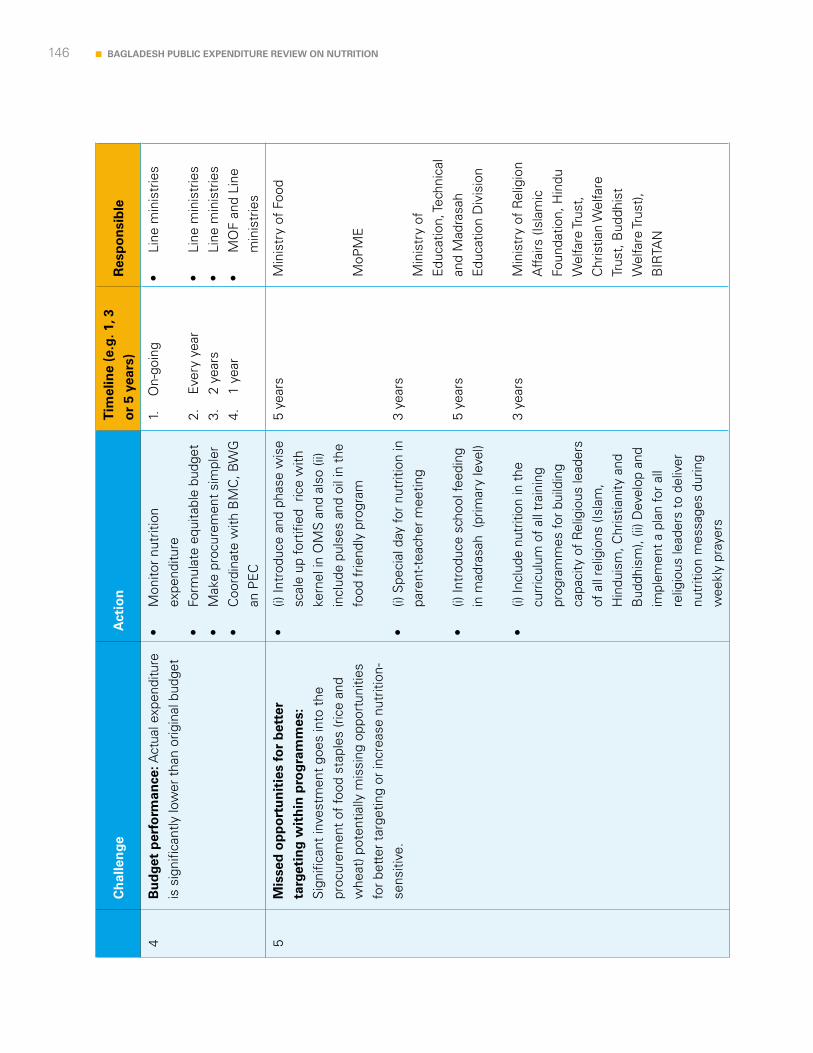
146 BAGLADESH PUBLIC EXPENDITURE REVIEW ON NUTRITION
Ch
alle
nge
Act
ion
T
imel
ine
(e.g
. 1, 3
or
5 ye
ars)
Res
po
nsi
ble
4B
ud
get
per
form
ance
: Act
ual e
xpen
ditu
re
is s
igni
fican
tly lo
wer
tha
n or
igin
al b
udge
t•
Monitornutrition
expe
nditu
re•
Formulateequitablebudget
•Makeprocurem
entsimpler
•CoordinatewithBMC,BWG
an P
EC
1.
On-
goin
g
2.
Eve
ry y
ear
3.
2 y
ears
4.
1 y
ear
•Lineministries
•Lineministries
•Lineministries
•MOFandLine
min
istr
ies
5M
isse
d o
pp
ort
un
itie
s fo
r b
ette
r
targ
etin
g w
ith
in p
rog
ram
mes
: S
igni
fican
t in
vest
men
t go
es in
to t
he
proc
urem
ent
of fo
od s
tapl
es (r
ice
and
whe
at) p
oten
tially
mis
sing
opp
ortu
nitie
s fo
r be
tter
tar
getin
g or
incr
ease
nut
ritio
n-se
nsiti
ve.
•(i)Introduceandphasewise
scal
e up
fort
ified
ric
e w
ith
kern
el in
OM
S a
nd a
lso
(ii)
incl
ude
puls
es a
nd o
il in
the
fo
od f
riend
ly p
rogr
am
•(i)Specialdayfornutritionin
pare
nt-t
each
er m
eetin
g
•(i)Introduceschoolfeeding
in m
adra
sah
(prim
ary
leve
l)
• (i)
Incl
ude
nutr
ition
in t
he
curr
icul
um o
f al
l tra
inin
g pr
ogra
mm
es fo
r bu
ildin
g ca
paci
ty o
f R
elig
ious
lead
ers
of a
ll re
ligio
ns (I
slam
, H
indu
ism
, Chr
istia
nity
and
B
uddh
ism
), (ii
) Dev
elop
and
im
plem
ent
a pl
an fo
r al
l re
ligio
us le
ader
s to
del
iver
nu
triti
on m
essa
ges
durin
g w
eekl
y pr
ayer
s
5 ye
ars
3 ye
ars
5 ye
ars
3 ye
ars
Min
istr
y of
Foo
d
MoP
ME
Min
istr
y of
E
duca
tion,
Tech
nica
l an
d M
adra
sah
Edu
catio
n D
ivis
ion
Min
istr
y of
Rel
igio
n A
ffairs
(Isl
amic
Fo
unda
tion,
Hin
du
Wel
fare
Trus
t,
Chr
istia
n W
elfa
re
Trus
t, B
uddh
ist
Wel
fare
Trus
t),
BIR
TAN
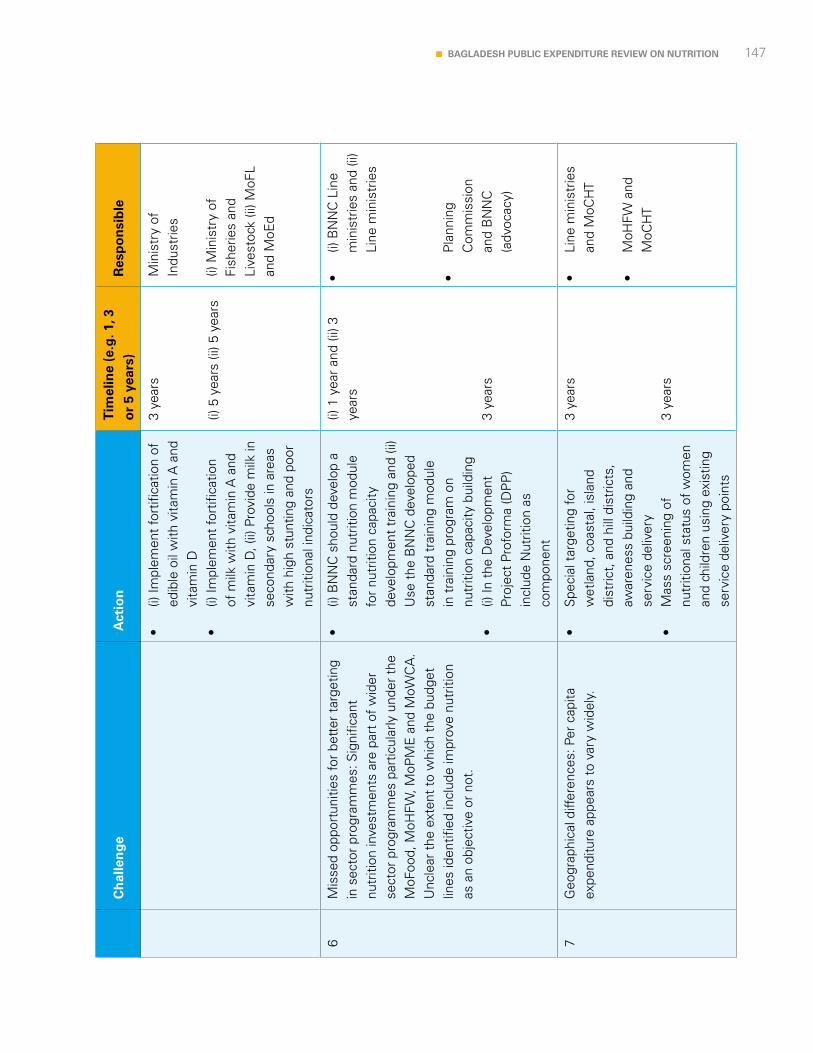
147BAGLADESH PUBLIC EXPENDITURE REVIEW ON NUTRITION
Ch
alle
nge
Act
ion
T
imel
ine
(e.g
. 1, 3
or
5 ye
ars)
Res
po
nsi
ble
•(i)Im
plem
entfortificationof
edib
le o
il w
ith v
itam
in A
and
vi
tam
in D
•
(i)Im
plem
entfortification
of m
ilk w
ith v
itam
in A
and
vi
tam
in D
, (ii)
Pro
vide
milk
in
seco
ndar
y sc
hool
s in
are
as
with
hig
h st
untin
g an
d po
or
nutr
ition
al in
dica
tors
3 ye
ars
(i) 5
yea
rs (i
i) 5
year
s
Min
istr
y of
In
dust
ries
(i) M
inis
try
of
Fish
erie
s an
d Li
vest
ock
(ii) M
oFL
and
MoE
d
6M
isse
d op
port
uniti
es fo
r be
tter
tar
getin
g in
sec
tor
prog
ram
mes
: Sig
nific
ant
nutr
ition
inve
stm
ents
are
par
t of
wid
er
sect
or p
rogr
amm
es p
artic
ular
ly u
nder
the
M
oFoo
d, M
oHFW
, MoP
ME
and
MoW
CA
. U
ncle
ar t
he e
xten
t to
whi
ch t
he b
udge
t lin
es id
entif
ied
incl
ude
impr
ove
nutr
ition
as
an
obje
ctiv
e or
not
.
•(i)BNNCshoulddevelopa
stan
dard
nut
ritio
n m
odul
e fo
r nu
triti
on c
apac
ity
deve
lopm
ent
trai
ning
and
(ii)
Use
the
BN
NC
dev
elop
ed
stan
dard
tra
inin
g m
odul
e in
tra
inin
g pr
ogra
m o
n nu
triti
on c
apac
ity b
uild
ing
•(i)IntheDevelopment
Proj
ect
Prof
orm
a (D
PP
) in
clud
e N
utrit
ion
as
com
pone
nt
(i) 1
yea
r an
d (ii
) 3
year
s
3 ye
ars
•(i)BNNCLine
min
istr
ies
and
(ii)
Line
min
istr
ies
•Planning
Com
mis
sion
an
d B
NN
C
(adv
ocac
y)
7G
eogr
aphi
cal d
iffer
ence
s: P
er c
apita
ex
pend
iture
app
ears
to
vary
wid
ely.
•
Specialtargetingfor
wet
land
, coa
stal
, isl
and
dist
rict,
and
hill
dis
tric
ts,
awar
enes
s bu
ildin
g an
d se
rvic
e de
liver
y
•Massscreeningof
nutr
ition
al s
tatu
s of
wom
en
and
child
ren
usin
g ex
istin
g se
rvic
e de
liver
y po
ints
3 ye
ars
3 ye
ars
•Lineministries
and
MoC
HT
•MoHFW
and
MoC
HT
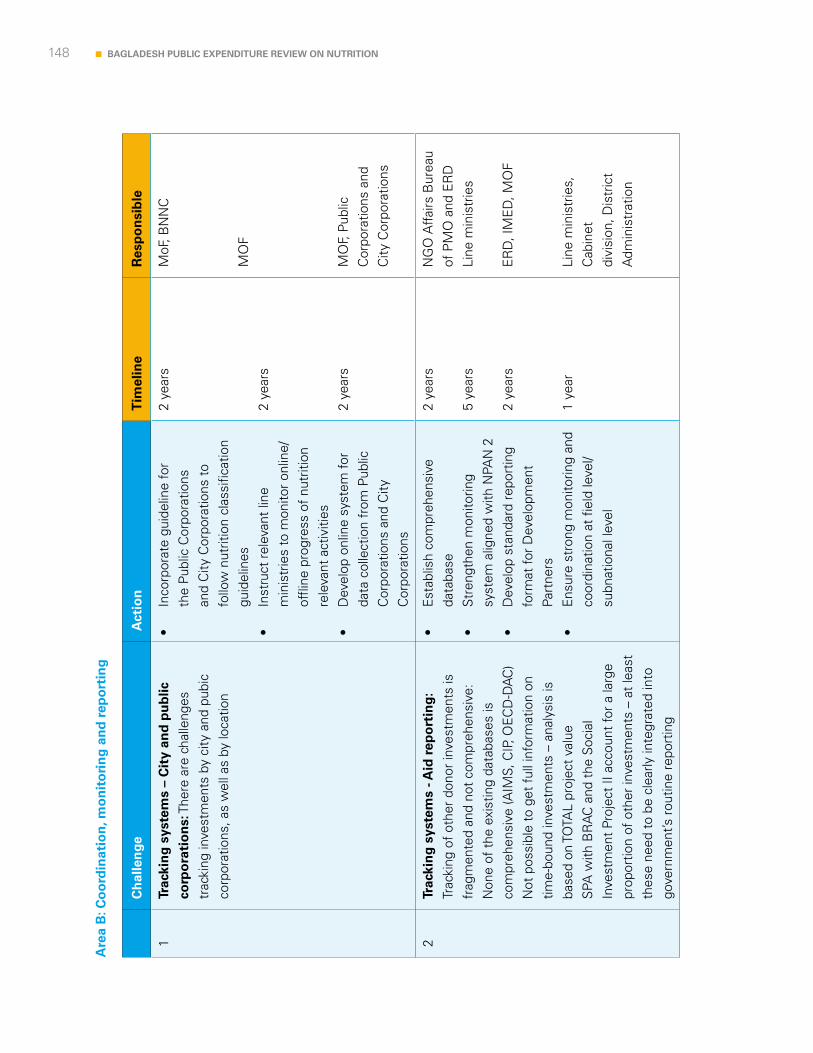
148 BAGLADESH PUBLIC EXPENDITURE REVIEW ON NUTRITION
Are
a B
: Co
ord
inat
ion
, mo
nit
ori
ng
an
d r
epo
rtin
g
Ch
alle
nge
Act
ion
Tim
elin
eR
esp
on
sib
le
1Tr
acki
ng
sys
tem
s –
Cit
y an
d p
ub
lic
corp
ora
tio
ns:
The
re a
re c
halle
nges
tr
acki
ng in
vest
men
ts b
y ci
ty a
nd p
ubic
co
rpor
atio
ns, a
s w
ell a
s by
loca
tion
•Incorporateguidelinefor
the
Publ
ic C
orpo
ratio
ns
and
City
Cor
pora
tions
to
follo
w n
utrit
ion
clas
sific
atio
n gu
idel
ines
•Instructrelevantline
min
istr
ies
to m
onito
r on
line/
offli
ne p
rogr
ess
of n
utrit
ion
rele
vant
act
iviti
es•
Developonlinesystem
for
data
col
lect
ion
from
Pub
lic
Cor
pora
tions
and
City
C
orpo
ratio
ns
2 ye
ars
2 ye
ars
2 ye
ars
MoF
, BN
NC
MO
F
MO
F, P
ublic
C
orpo
ratio
ns a
nd
City
Cor
pora
tions
2Tr
acki
ng
sys
tem
s - A
id r
epo
rtin
g:
Trac
king
of
othe
r do
nor
inve
stm
ents
is
frag
men
ted
and
not
com
preh
ensi
ve:
Non
e of
the
exi
stin
g da
taba
ses
is
com
preh
ensi
ve (A
IMS,
CIP
, OE
CD
-DA
C)
Not
pos
sibl
e to
get
ful
l inf
orm
atio
n on
tim
e-bo
und
inve
stm
ents
– a
naly
sis
is
base
d on
TO
TAL
proj
ect
valu
e S
PA w
ith B
RA
C a
nd t
he S
ocia
l In
vest
men
t Pr
ojec
t II
acco
unt
for
a la
rge
prop
ortio
n of
oth
er in
vest
men
ts –
at
leas
t th
ese
need
to
be c
lear
ly in
tegr
ated
into
go
vern
men
t’s r
outin
e re
port
ing
•Establishcomprehensive
data
base
•Strengthenmonitoring
syst
em a
ligne
d w
ith N
PAN
2•
Developstandardreporting
form
at fo
r D
evel
opm
ent
Part
ners
•Ensurestrongmonitoringand
coor
dina
tion
at f
ield
leve
l/su
bnat
iona
l lev
el
2 ye
ars
5 ye
ars
2 ye
ars
1 ye
ar
NG
O A
ffairs
Bur
eau
of P
MO
and
ER
DLi
ne m
inis
trie
s
ER
D, I
ME
D, M
OF
Line
min
istr
ies,
C
abin
et
divi
sion
, Dis
tric
t A
dmin
istr
atio
n
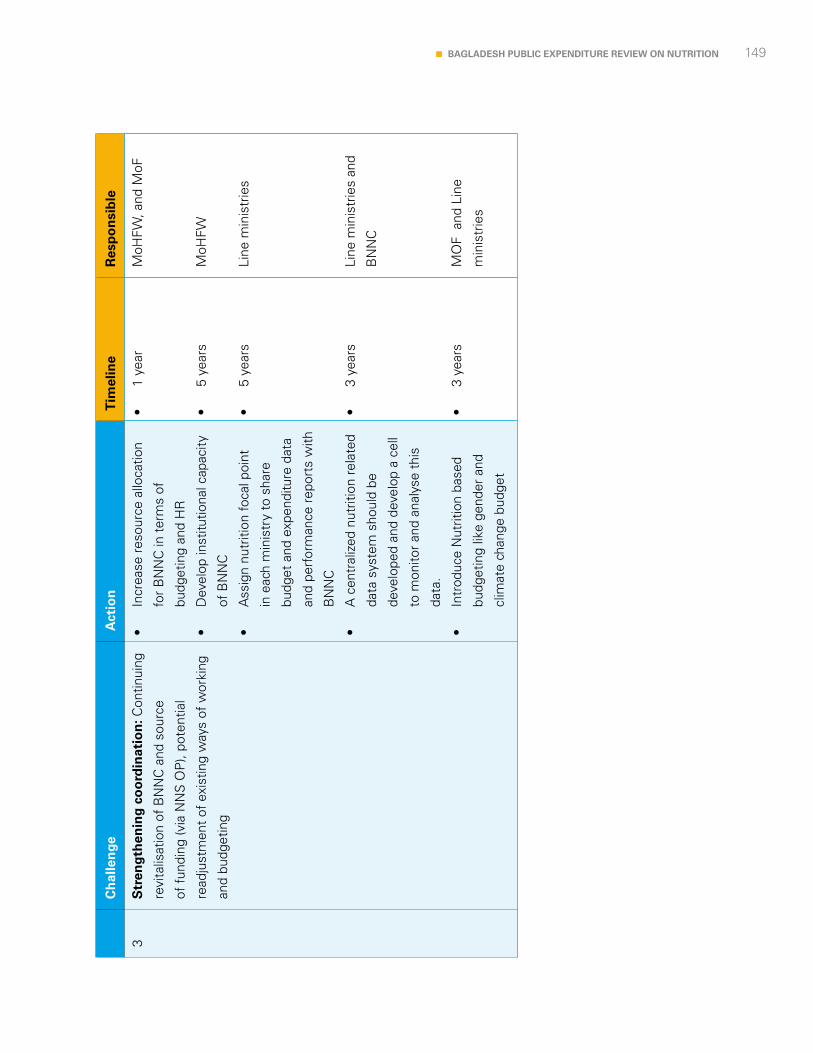
149BAGLADESH PUBLIC EXPENDITURE REVIEW ON NUTRITION
Ch
alle
nge
Act
ion
Tim
elin
eR
esp
on
sib
le
3S
tren
gth
enin
g c
oo
rdin
atio
n: C
ontin
uing
revi
talis
atio
n of
BN
NC
and
sou
rce
of f
undi
ng (v
ia N
NS
OP
), po
tent
ial
read
just
men
t of
exi
stin
g w
ays
of w
orki
ng
and
budg
etin
g
•Increaseresourceallocation
for
BN
NC
in t
erm
s of
budg
etin
g an
d H
R
•Developinstitutionalcapacity
of B
NN
C
•Assignnutritionfocalpoint
in e
ach
min
istr
y to
sha
re
budg
et a
nd e
xpen
ditu
re d
ata
and
perf
orm
ance
rep
orts
with
BN
NC
•Acentralizednutritionrelated
data
sys
tem
sho
uld
be
deve
lope
d an
d de
velo
p a
cell
to m
onito
r an
d an
alys
e th
is
data
.
•IntroduceNutritionbased
budg
etin
g lik
e ge
nder
and
clim
ate
chan
ge b
udge
t
•1year
•5years
•5years
•3years
•3years
MoH
FW, a
nd M
oF
MoH
FW
Line
min
istr
ies
Line
min
istr
ies
and
BN
NC
MO
F a
nd L
ine
min
istr
ies

150 BAGLADESH PUBLIC EXPENDITURE REVIEW ON NUTRITION
Oxford Policy Management is committed to helping low- and middle-income countries achieve growth and reduce poverty and disadvantage through public policy reform.
We seek to bring about lasting positive change using analytical and practical policy expertise. Through our global network of offices, we work in partnership with national decision makers to research, design, implement, and evaluate impactful public policy.
We work in all areas of social and economic policy and governance, including health, finance, education, climate change, and public sector management. We draw on our local and international sector experts to provide the very best evidence-based support.
Annex H
About Oxford Policy Management


UNICEF BangladeshBSL Office Complex1, Minto Road, Dhaka 1000Bangladesh
Telephone: (880-2) 55668088Email: [email protected]
www.unicef.org
Related Documents